Attached files
| file | filename |
|---|---|
| 8-K - FORM 8-K - REGIONS FINANCIAL CORP | d8k.htm |
| EX-99.2 - SUPPLEMENTAL FINANCIAL INFORMATION - REGIONS FINANCIAL CORP | dex992.htm |
| EX-99.1 - PRESS RELEASE - REGIONS FINANCIAL CORP | dex991.htm |
 Regions Financial
1st
Quarter Earnings Conference Call
April 19, 2011
›Exhibit 99.3 |
 Continued Progress
1
›
2
consecutive quarter of profitability
›
Credit related costs fell to lowest level in almost 2 years
›
Credit costs* negatively impacted EPS ($0.26) per share
›
Security gains positively impacted EPS $0.04 per share
›
Continued solid core business performance
›
Profitably gaining market share, growing customer base and expanding existing
relationships
›
Improving productivity and efficiencies
($ in millions)
1Q10
4Q10
1Q11
Net Income (Loss)
($255)
$36
$17
EPS
($0.21)
$0.03
$0.01
Net Interest Margin
2.77%
3.00%
3.07%
Loan Loss Provision
$770
$682
$482
Earnings
Highlights
* Includes loan loss provision, HFS, other real estate expense and net loss /
(gain) on HFS sales nd |
 Solid
Core Performance 2
Credit Quality
Improves
›
Net charge-offs declined $201MM or 29%
›
Inflow of non-performing loans down 23% and delinquencies improved 2%
›
Non-performing
loans
declined
for
the
4
th
consecutive
quarter
›
Criticized and classified loans continue to decline
Balance Sheet
Highlights
›
3rd
consecutive
quarter
growth
in
commercial
loans*
up
$936MM
or
2.7%
›
Average low cost deposits grew $1.0B or 1.4%
›
Deposit costs improved another 5 bps
›
Loan to deposit ratio of 84.4%
Business
Performance
Improvement
›
Solid fee based revenue growth
›
As of March 1, all of our checking accounts are fee eligible
›
Delivering value to our customers with new and expanded products
›
Full year 2011 expenses expected to be flat to 2010**
*Average Balances
** Excludes 2010 debt extinguishment losses |
  Improvement in Quality Loan Demand
3
62%
38%
Portfolio Mix
Consumer Services
›
Loan production of $2.2 billion
›
Growing consumer loans to
achieve a more balanced
portfolio
›
Indirect auto lending
production increased from
$143 million in 4Q10 to $255
million in 1Q11
Business Services
›
Loan production of $11.1 billion
›
Strong middle-market
commercial loan production
virtually throughout our
footprint
›
C&I line utilization rates
improved
140
bps
linked
quarter
›
Investor real estate as a % of
total loans* declined to 18.2%
from 23.1% a year ago
*Ending Balances |
 1Q11
Earnings Highlights 4
›
Improvement in adjusted PPNR versus prior year driven by increased
revenues
›
Credit losses improved dramatically, thus loan loss provision declined 29%
linked quarter, and essentially matched charge offs
* See appendix for non-GAAP reconciliation
($ in millions, except EPS)
1Q10
4Q10
1Q11
$
%
$
%
Net Interest Income
$ 831
$ 877
$ 863
$ (14)
-2%
$ 32
4%
Adjusted Non-Interest Revenue*
734
795
764
(31)
-4%
30
4%
Adjusted Non-Interest Expense*
1,168
1,211
1,167
44
4%
1
0%
Adjusted PPNR*
397
461
460
(1)
0%
63
16%
Loan Loss Provision
770
682
482
200
29%
288
37%
Net Income (Loss) Available to
Common Shareholders
(255)
36
17
(19)
-53%
272
107%
EPS
($0.21)
$0.03
$0.01
($0.02)
-67%
$0.22
105%
VS. Prior QTR
Better / (Worse)
VS. Prior YR
Better / (Worse) |
 Non-Performing Loan Inflows Decline
5 |
 Non-performing Loans Decline
›
Non-performing loans, excluding loans held for sale, declined $73 million
›
Non-performing assets relatively flat, reflecting an increase in loans held
for sale ›
Delinquencies continue to improve
›
Business Services criticized and classified problem loans declined approximately
$700 million 6 |
 Substantial Decline in Net Charge-offs; Coverage
Ratio remains strong
(1) Loan charge-offs related to Sales and Transfer to Held for Sale
(2) Excludes loans held for sale
7 |
 Loan
Balances Reflect Commercial Growth offset by Continued De-Risking Efforts
in Investor Real Estate ›
Average Commercial and Industrial
loan balances increased $933MM
reflecting strength in our middle
market segment
›
C&I commitments increased $700
million or 2.7%
›
C&I line utilization increased 140
bps
›
Investor Real Estate declined $1.1
billion; down $5.6 billion year-over-
year on ending balances
›
Loan yield negatively impacted by
maturing loan hedges, somewhat
offset by improved spreads on new
and existing loans
8
* Average Balances |
 Decline in Deposit Costs Driven by Changing Deposit
Mix
›
Our improved deposit mix is
resulting in lower deposit
costs
›
Low cost deposits as a % of
total deposits increased to
76% in 1Q11 from 70% in
1Q10
›
Deposit costs declined 5
bps linked quarter; down 41
bps year-over-year
9
* Average Balances |
 Net
interest margin continued to improve ›
Net
interest
margin
climbed
7
bps
linked quarter; up 30 bps vs. 1Q10
›
Repricing opportunities remain with
over $9.4 billion of CD’s maturing in
the next 9 months at an average rate
of 1.80%
›
Slower pre-payments resulting in
lower premium amortization in the
investment portfolio positively
impacted NIM
›
Net interest income negatively
impacted by lower earning asset
levels, investment portfolio
repositioning in 4Q10 and by fewer
number of business days
›
Excess liquidity negatively impacted
margin 10 bps compared to 11 bps in
Q4
10 |
 Non-Interest Revenues Remain Relatively Steady
›
Adjusted non-interest
revenue* 4% higher versus
prior year
›
Service charges declined
slightly due to pressure on
NSF/OD income; offset by
change in fee based
account structure
›
Morgan Keegan’s revenues
down due to lower
investment banking revenue
in 1Q11
›
Mortgage revenue down
due to linked quarter decline
in origination volume
11
*
Non
–
GAAP;
Refer
to
Appendix |
 Focused Expense Management
›
Adjusted non-interest
expenses* 4% lower
versus prior quarter and
flat versus prior year
›
Credit-related expenses,
declined $34 million,
primarily driven by lower
other real estate expense
›
Professional and legal fees
declined $11 million
›
Headcount down over
3,000 positions in 2 years
12
*
Non
–
GAAP;
Refer
to
Appendix |
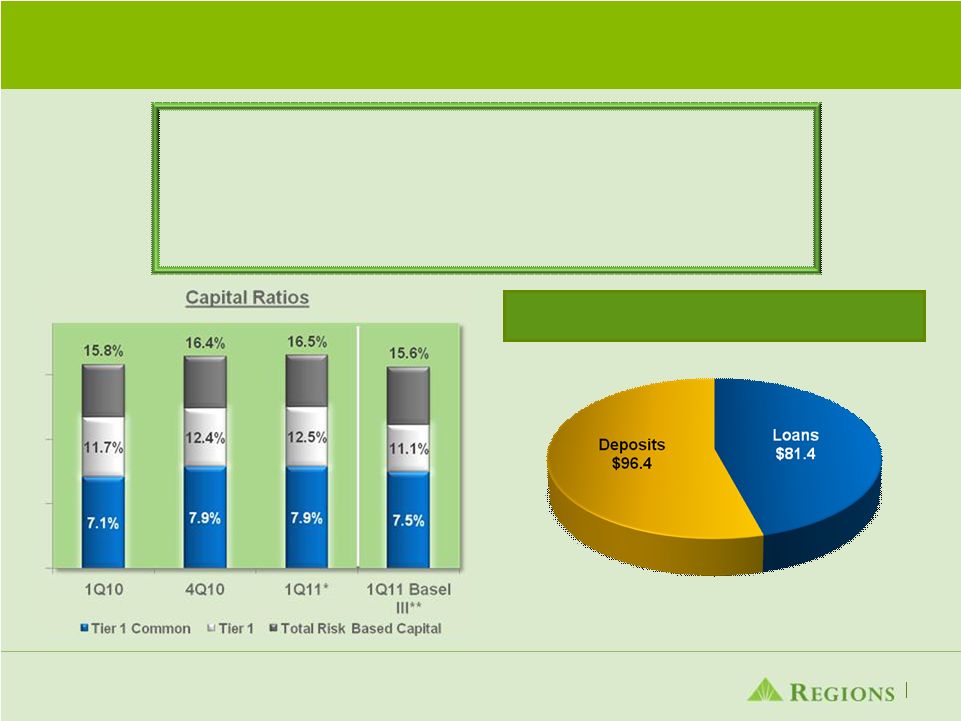 Capital Ratios Remain Strong;
Liquidity Profile Solid
* Current Quarter ratios are estimated
** Subject to change as interpretation of Basel III rules is ongoing and dependent
on guidance from Basel and regulators.
›
Well-positioned with respect to the Liquidity Coverage Ratio
prescribed under Basel III
›
Solid liquidity at both the bank and holding company
›
Loan-to-deposit ratio of 84.4%
13
Favorable Liquidity Position |
 |
 ›Forward-
Looking Statements ›This presentation
may
include
forward-looking
statements
which
reflect
Regions’
current
views
with
respect
to
future
events
and
financial
performance.
The
Private
Securities
Litigation
Reform
Act
of
1995
(“the
Act”)
provides
a
“safe
harbor”
for
forward-looking
statements
which
are
identified
as
such
and
are
accompanied
by
the
identification
of
important
factors
that
could
cause
actual
results
to
differ
materially
from
the
forward-
looking
statements.
For
these
statements,
we,
together
with
our
subsidiaries,
claim
the
protection
afforded
by
the
safe
harbor
in
the
Act.
Forward-looking
statements
are
not
based
on
historical
information,
but
rather
are
related
to
future
operations,
strategies,
financial
results
or
other
developments.
Forward-looking
statements
are
based
on
management’s
expectations
as
well
as
certain
assumptions
and
estimates
made
by,
and
information
available
to,
management
at
the
time
the
statements
are
made.
Those
statements
are
based
on
general
assumptions
and
are
subject
to
various
risks,
uncertainties
and
other
factors
that
may
cause
actual
results
to
differ
materially
from
the
views,
beliefs
and
projections
expressed
in
such
statements.
These
risks,
uncertainties
and
other
factors
include,
but
are
not
limited
to,
those
described
below:
›
The
Dodd-Frank
Wall
Street
Reform
and
Consumer
Protection
Act
became
law
on
July
21,
2010,
and
a
number
of
legislative,
regulatory
and
tax
proposals
remain
pending.
Additionally,
the
U.S.
Treasury
and
federal
banking
regulators
continue
to
implement,
but
are
also
beginning
to
wind
down,
a
number
of
programs
to
address
capital
and
liquidity
in
the
banking
system.
Proposed
rules,
including
those
that
are
part
of
the
Basel
III
process,
could
require
banking
institutions
to
increase
levels
of
capital.
All
of
the
foregoing
may
have
significant
effects
on
Regions
and
the
financial
services
industry,
the
exact
nature
of
which
cannot
be
determined
at
this
time.
›
The
impact
of
compensation
and
other
restrictions
imposed
under
the
Troubled
Asset
Relief
Program
(“TARP”)
until
Regions
repays
the
outstanding
preferred
stock
and
warrant
issued
under
the
TARP,
including
restrictions
on
Regions’
ability
to
attract
and
retain
talented
executives
and
associates.
›
Possible
additional
loan
losses,
impairment
of
goodwill
and
other
intangibles,
and
adjustment
of
valuation
allowances
on
deferred
tax
assets
and
the
impact
on
earnings
and
capital.
›
Possible
changes
in
interest
rates
may
increase
funding
costs
and
reduce
earning
asset
yields,
thus
reducing
margins.
Increases
in
benchmark
interest
rates
would
also
increase
debt
service
requirements
for
customers
whose
terms
include
a
variable
interest
rate,
which
may
negatively
impact
the
ability
of
borrowers
to
pay
as
contractually
obligated.
›
Possible
changes
in
general
economic
and
business
conditions
in
the
United
States
in
general
and
in
the
communities
Regions
serves
in
particular,
including
any
prolonging
or
worsening
of
the
current
unfavorable
economic
conditions
including
unemployment
levels.
›
Possible
changes
in
the
creditworthiness
of
customers
and
the
possible
impairment
of
the
collectability
of
loans.
›
Possible
changes
in
trade,
monetary
and
fiscal
policies,
laws
and
regulations
and
other
activities
of
governments,
agencies,
and
similar
organizations,
may
have
an
adverse
effect
on
business.
›
The
current
stresses
in
the
financial
and
real
estate
markets,
including
possible
continued
deterioration
in
property
values.
›
Regions'
ability
to
manage
fluctuations
in
the
value
of
assets
and
liabilities
and
off-balance
sheet
exposure
so
as
to
maintain
sufficient
capital
and
liquidity
to
support
Regions'
business.
›
Regions'
ability
to
expand
into
new
markets
and
to
maintain
profit
margins
in
the
face
of
competitive
pressures.
›
Regions'
ability
to
develop
competitive
new
products
and
services
in
a
timely
manner
and
the
acceptance
of
such
products
and
services
by
Regions'
customers
and
potential
customers.
›
Regions'
ability
to
keep
pace
with
technological
changes.
›
Regions'
ability
to
effectively
manage
credit
risk,
interest
rate
risk,
market
risk,
operational
risk,
legal
risk,
liquidity
risk,
and
regulatory
and
compliance
risk.
›
Regions’
ability
to
ensure
adequate
capitalization
which
is
impacted
by
inherent
uncertainties
in
forecasting
credit
losses.
›
The
cost
and
other
effects
of
material
contingencies,
including
litigation
contingencies,
and
any
adverse
judicial,
administrative
or
arbitral
rulings
or
proceedings.
›
The
effects
of
increased
competition
from
both
banks
and
non-banks.
›
The
effects
of
geopolitical
instability
and
risks
such
as
terrorist
attacks.
›
Possible
changes
in
consumer
and
business
spending
and
saving
habits
could
affect
Regions'
ability
to
increase
assets
and
to
attract
deposits.
›
The
effects
of
weather
and
natural
disasters
such
as
floods,
droughts
and
hurricanes,
and
the
effects
of
man-made
disasters
such
as
the
Gulf
of
Mexico
oil
spill.
›
Possible
downgrades
in
ratings
issued
by
rating
agencies.
›
Potential
dilution
of
holders
of
shares
of
Regions’
common
stock
resulting
from
the
U.S.
Treasury’s
investment
in
TARP.
›
Possible
changes
in
the
speed
of
loan
prepayments
by
Regions’
customers
and
loan
origination
or
sales
volumes.
›
Possible
acceleration
of
prepayments
on
mortgage-backed
securities
due
to
low
interest
rates
and
the
related
acceleration
of
premium
amortization
on
those
securities.
›
The
effects
of
problems
encountered
by
larger
or
similar
financial
institutions
that
adversely
affect
Regions
or
the
banking
industry
generally.
›
Regions’
ability
to
receive
dividends
from
its
subsidiaries.
›
The
effects
of
the
failure
of
any
component
of
Regions’
business
infrastructure
which
is
provided
by
a
third
party.
›
Changes
in
accounting
policies
or
procedures
as
may
be
required
by
the
Financial
Accounting
Standards
Board
or
other
regulatory
agencies.
›
The
effects
of
any
damage
to
Regions’
reputation
resulting
from
developments
related
to
any
of
the
items
identified
above.
›The
foregoing
list
of
factors
is
not
exhaustive.
For
discussion
of
these
and
other
factors
that
may
cause
actual
results
to
differ
from
expectations,
look
under
the
captions
“Forward-Looking
Statements”
and
“Risk
Factors”
in
Regions’
Annual
Report
on
Form
10-K
for
the
year
ended
December
31,
2010,
as
on
file
with
the
Securities
and
Exchange
Commission.
›The
words
"believe,"
"expect,"
"anticipate,"
"project,"
and
similar
expressions
often
signify
forward-looking
statements.
You
should
not
place
undue
reliance
on
any
forward-looking
statements,
which
speak
only
as
of
the
date
made.
We
assume
no
obligation
to
update
or
revise
any
forward-looking
statements
that
are
made
from
time
to
time.
15 |
 Non-GAAP Reconciliation
16
1Q10
4Q10
1Q11
($ in millions)
Net interest income (GAAP)
831
$
877
$
863
$
Non-interest income (GAAP)
812
1,213
843
Adjustments:
Securities (gains) losses, net
(59)
(333)
(82)
Leveraged lease termination gains
(19)
(59)
-
Loss (gain) on sale of mortgage loans
-
(26)
3
Adjusted non-interest income (non-GAAP)
734
795
764
Adjusted total revenue (non-GAAP)
1,565
$
1,672
$
1,627
$
Non-interest expense (GAAP)
1,230
$
1,266
$
1,167
$
Adjustments:
Loss on extinguishment of debt
(53)
(55)
-
Securities impairment, net
(1)
-
-
Branch consolidation costs
(8)
-
-
Adjusted non-interest expense (non-GAAP)
1,168
$
1,211
$
1,167
$
Adjusted pre-tax pre-provision net revenue
397
$
461
$
460
$ |