Attached files
| file | filename |
|---|---|
| 8-K - CURRENT REPORT ON FORM 8-K - PACCAR INC | d8k.htm |
Exhibit 99.1

|
PACCAR Inc Public Affairs Department P.O. Box 1518 Bellevue, WA 98009 |
| Contact: | Robin Easton (425) 468-7676
|
FOR IMMEDIATE RELEASE
PACCAR Announces Improved First Quarter Revenues and Earnings
April 19, 2011, Bellevue, Washington – “PACCAR reported improved revenues and net income for the first quarter of 2011,” said Mark Pigott, chairman and chief executive officer. “PACCAR’s results reflect the benefits of stronger truck sales in Europe and North America and an improvement in financial services profit and parts revenues worldwide. The higher utilization of PACCAR’s truck facilities contributed to increased gross margins. North American and European economies are recovering, with the exception of the residential and commercial construction markets in the United States. Our on-highway customers are benefiting from increased freight tonnage and freight rates which are driving improved fleet productivity. I am very proud of our 19,000 employees who have delivered excellent results to our shareholders and customers.”
“PACCAR’s strong balance sheet and positive cash flow have enabled the company to increase capital investments to enhance manufacturing operating efficiency and product development programs. These investments will contribute to the company’s long-term growth,” added Pigott.
PACCAR earned $193.3 million ($.53 per diluted share) for the first quarter of 2011 compared to $68.3 million ($.19 per diluted share) in the first quarter last year. First quarter 2011 net sales and financial services revenues increased 47 percent to $3.28 billion from $2.23 billion reported for the first quarter of 2010.
Global Truck Markets
“DAF’s 15+ tonne market share in Europe continues to grow, reaching 16 percent in early 2011. Industry retail sales in the 15+ tonne truck market in Europe are estimated to be in a range of 220,000-240,000 units this year,” said Harrie Schippers, DAF president. “DAF is the leader in the 15+ tonne market in the United Kingdom, Netherlands, Belgium and Central Europe. DAF is making good progress towards its medium-term goal of 20 percent market share.”
“Class 8 industry retail sales in the U.S. and Canada in 2011 are improving steadily,” said Dan Sobic, PACCAR executive vice president. The industry retail sales forecast has been increased to a range of 200,000-220,000 vehicles – the best year since 2006. “There are industry concerns about suppliers being able to increase their production capacity to meet global demand,” added Sobic.
Highlights – First Quarter 2011
Highlights of PACCAR’s results during the first quarter of 2011 include:
| • | Consolidated sales and revenues of $3.28 billion. |
| • | Net income of $193.3 million. |
| • | Manufacturing cash and marketable securities of $2.64 billion. |
| • | Financial Services pretax income of $50.3 million. |
| • | Research and development expenses of $68.4 million. |
| • | Operating cash flow of $459.3 million. |
| • | Capital expenditures of $62.2 million. |
| • | Record stockholders’ equity of $5.65 billion. |
South American Business Opportunities
For over 40 years, Kenworth trucks have been sold in South American Andean countries. “To complement Kenworth’s success, we introduced DAF vehicles in the Andean region of South America, where the 15+ tonne market is expected to be 30,000-35,000 units in 2011,” said Bob Christensen, PACCAR executive vice president. PACCAR launched the DAF CF range in Chile, Ecuador and Peru in March 2011. “In addition, we are progressing with the evaluation of potential factory sites in Brazil for a DAF assembly facility. Brazil is a major truck market, with retail sales of 10+ tonne vehicles of 125,000 units in 2010. This growing market provides excellent long-term opportunities for DAF,” added Christensen.
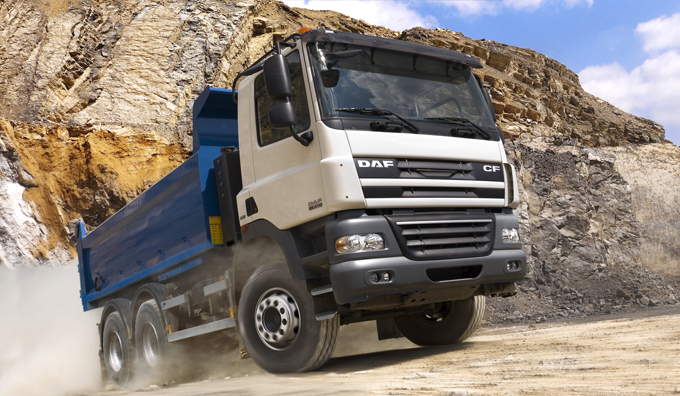
DAF CF85 in South America
Increased Capital Investments and Industry Awards
PACCAR’s excellent long-term profits, strong balance sheet, and intense focus on quality, technology and productivity have enabled the company to invest $3.9 billion since 2001 in capital projects, new products and processes. Productivity improvements of 5-7 percent annually and capacity improvements of over 40 percent in the last five years have enhanced the capability of the company’s manufacturing and parts facilities. PACCAR is increasing capital investments in 2011 to accelerate comprehensive product development programs. “Capital expenditures are projected to be $400-$500 million and research and development expenses are estimated at $275-$300 million this year as Kenworth, Peterbilt and DAF invest in industry-leading products and services to enable our customers to continue to deliver profitable results in their businesses,” said Tom Plimpton, PACCAR vice chairman.
At the recent Bus World Asia exhibition in Shanghai, China, PACCAR was honored for the fifth consecutive year as the “Best Coach Engine Manufacturer.” PACCAR earned this accolade as a result of PACCAR’s 12.9-liter and 9.2-liter engines’ industry-leading reliability, durability and fuel efficiency. “The Chinese premium bus market recognizes the advantages of PACCAR’s high-quality engines,” said Craig Brewster, PACCAR vice president.
PACCAR Celebrates 40 years as a NASDAQ Company
In February 1971, PACCAR, a leading technology company, and 2,500 other companies were founding members of the NASDAQ stock exchange. Forty years later, only two of the original companies, PACCAR and Intel, are members of the NASDAQ-100 Index. This index includes 100 of the largest non-financial companies listed on The NASDAQ Stock Market, based on market capitalization.
Kenworth Australia Celebrates 40 Years of Industry-Leading Performance
PACCAR Australia, encompassing the Kenworth and DAF brands, reinforced its industry leadership by earning a record combined heavy-duty truck market share of 25.7 percent last year. In March 1971, the first Australian manufactured Kenworth truck was produced at the new Bayswater truck plant, near Melbourne, Australia. Since that time, Kenworth has established itself as the Australian innovation leader in commercial vehicle manufacturing, selling 40,000 Kenworth trucks through its network of 49 dealership locations in Australia, Papua New Guinea and New Zealand. PACCAR expanded its product range in Australia by introducing DAF vehicles in 1998. “PACCAR’s commitment to quality products and services, facilitated by our dedicated employees and dealers, has ensured that Kenworth and DAF have consistently led the Australian market,” said Joe Rizzo, PACCAR Australia managing director.
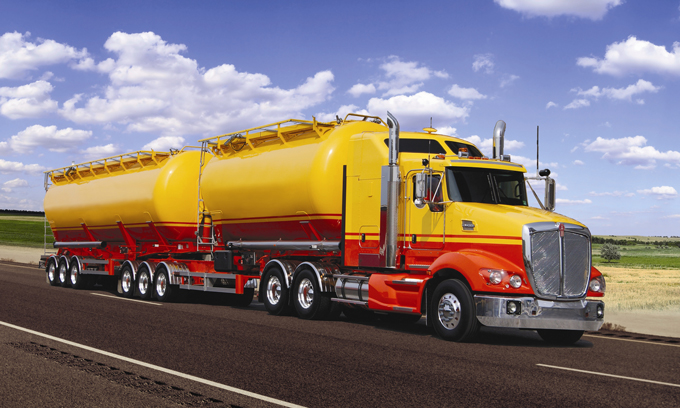
The Aerodynamic Kenworth T609 in Australia
PACCAR Financial Celebrates 50 Years
In 1961, PACCAR founded PACCAR Financial Corporation to facilitate the sale of premium Kenworth and Peterbilt trucks. “Fifty years later, PACCAR Financial is financing 66 percent of Kenworth and Peterbilt dealer truck inventories and over 30 percent of Kenworth and Peterbilt trucks sold or leased in the U.S. and Canada,” said Todd Hubbard, PACCAR Financial president. “We have developed a strong partnership between PACCAR Financial, Kenworth and Peterbilt that has benefitted our customers and dealers through all phases of the business cycle.”
Financial Services Companies Achieve Good Results
PACCAR Financial Services (PFS) has a portfolio of 134,000 trucks and trailers, with total assets of $8.15 billion. PACCAR Leasing, a major full-service truck leasing company in North America with a fleet of over 30,000 vehicles, is included in this segment. First quarter 2011 pretax income was $50.3 million compared to the $28.1 million earned in the first quarter of 2010. First quarter 2011 revenues were $241.0 million compared to $246.4 million in 2010. “During the first quarter of 2011, profit increased due to better finance margins and an improved provision for credit losses,” said Bob Bengston, PACCAR vice president. The provision for credit losses was $10.5 million in the first quarter of 2011 versus $18.4 million in the same period in 2010.
“PACCAR’s excellent balance sheet, complemented by its A+/A1 credit ratings, enables PFS to offer competitive retail financing to Kenworth, Peterbilt and DAF dealers and customers in 20 countries on three continents,” said Ken Roemer, PACCAR Financial sales manager. “Higher freight volumes and increasing freight rates have improved our customers’ profitability leading to lower past dues and provisions for credit losses. In addition, we are benefiting from higher used truck prices, which continue to improve from prior year levels by 15-20 percent.”
PACCAR is a global technology leader in the design, manufacture and customer support of high-quality light- medium- and heavy-duty trucks under the Kenworth, Peterbilt and DAF nameplates. PACCAR also designs and manufactures advanced diesel engines and provides financial services and information technology and distributes truck parts related to its principal business. PACCAR shares are traded on the NASDAQ Global Select Market, symbol PCAR. Its homepage is www.paccar.com.
PACCAR will hold a conference call with securities analysts to discuss first quarter earnings on April 19, 2011, at 8:30 a.m. Pacific time. Interested parties may listen to the call by selecting “Live Webcast” at PACCAR’s homepage. The Webcast will be available on a recorded basis through April 30, 2011.
This release contains “forward-looking statements” within the meaning of the Private Securities Litigation Reform Act. These statements are based on management’s current expectations and are subject to uncertainty and changes in circumstances. Actual results may differ materially from those included in these statements due to a variety of factors. More information about these factors is contained in PACCAR’s filings with the Securities and Exchange Commission.
# # #
PACCAR Inc
SUMMARY INCOME STATEMENTS
(in millions except per share amounts)
| Three Months Ended March 31 |
||||||||
| 2011 | 2010 | |||||||
| Truck and Other: |
||||||||
| Net sales and revenues |
$ | 3,042.6 | $ | 1,984.3 | ||||
| Cost of sales and revenues |
2,632.3 | 1,767.8 | ||||||
| Research and development |
68.4 | 54.8 | ||||||
| Selling, general and administrative |
109.9 | 94.1 | ||||||
| Interest and other expense, net |
4.0 | 4.2 | ||||||
| Truck and Other Income Before Income Taxes |
228.0 | 63.4 | ||||||
| Financial Services: |
||||||||
| Revenues |
241.0 | 246.4 | ||||||
| Interest and other |
157.0 | 178.4 | ||||||
| Selling, general and administrative |
23.2 | 21.5 | ||||||
| Provision for losses on receivables |
10.5 | 18.4 | ||||||
| Financial Services Income Before Income Taxes |
50.3 | 28.1 | ||||||
| Investment income |
8.0 | 4.5 | ||||||
| Total Income Before Income Taxes |
286.3 | 96.0 | ||||||
| Income taxes |
93.0 | 27.7 | ||||||
| Net Income |
$ | 193.3 | $ | 68.3 | ||||
| Net Income Per Share: |
||||||||
| Basic |
$ | .53 | $ | .19 | ||||
| Diluted |
$ | .53 | $ | .19 | ||||
| Weighted Average Shares Outstanding: |
||||||||
| Basic |
365.8 | 364.6 | ||||||
| Diluted |
367.2 | 365.7 | ||||||
| Dividends declared per share |
$ | .12 | $ | .09 | ||||
PACCAR Inc
CONDENSED BALANCE SHEETS
(in millions)
| March 31 2011 |
December 31 2010 |
|||||||
| ASSETS |
||||||||
| Truck and Other: |
||||||||
| Cash and marketable debt securities |
$ | 2,644.5 | $ | 2,432.5 | ||||
| Trade and other receivables, net |
865.4 | 610.4 | ||||||
| Inventories |
590.3 | 534.0 | ||||||
| Property, plant, and equipment, net |
1,724.0 | 1,673.7 | ||||||
| Equipment on operating lease and other |
1,154.9 | 1,105.3 | ||||||
| Financial Services Assets |
8,154.6 | 7,878.2 | ||||||
| $ | 15,133.7 | $ | 14,234.1 | |||||
| LIABILITIES AND STOCKHOLDERS’ EQUITY |
||||||||
| Truck and Other: |
||||||||
| Accounts payable, deferred revenues and other |
$ | 3,093.0 | $ | 2,634.1 | ||||
| Long-term debt |
150.0 | 150.0 | ||||||
| Financial Services Liabilities |
6,241.8 | 6,092.2 | ||||||
| STOCKHOLDERS’ EQUITY |
5,648.9 | 5,357.8 | ||||||
| $ | 15,133.7 | $ | 14,234.1 | |||||
| Common Shares Outstanding |
365.4 | 365.3 | ||||||
GEOGRAPHIC REVENUE DATA
| Three Months Ended March 31 |
||||||||
| 2011 | 2010 | |||||||
| United States and Canada |
$ | 1,588.7 | $ | 1,151.4 | ||||
| Europe |
1,179.0 | 768.1 | ||||||
| Other |
515.9 | 311.2 | ||||||
| $ | 3,283.6 | $ | 2,230.7 | |||||
PACCAR Inc
CONDENSED CASH FLOW STATEMENTS
(in millions of dollars)
| Three Months Ended March 31 |
2011 | 2010 | ||||||
| OPERATING ACTIVITIES: |
||||||||
| Net income |
$ | 193.3 | $ | 68.3 | ||||
| Depreciation and amortization: |
||||||||
| Property, plant and equipment |
47.1 | 48.1 | ||||||
| Equipment on operating leases and other |
115.3 | 117.3 | ||||||
| Net increase in wholesale receivables on new trucks |
(75.8 | ) | (.5 | ) | ||||
| Net decrease in sales-type finance leases and dealer direct loans on new trucks |
32.4 | 57.3 | ||||||
| All other operating activities |
147.0 | (5.1 | ) | |||||
| Net Cash Provided by Operating Activities |
459.3 | 285.4 | ||||||
| INVESTING ACTIVITIES: |
||||||||
| Acquisition of property, plant and equipment |
(62.2 | ) | (26.1 | ) | ||||
| Acquisition of equipment for operating leases |
(295.3 | ) | (163.0 | ) | ||||
| Net (increase) decrease in financial services receivables |
(43.2 | ) | 176.7 | |||||
| Net increase in marketable securities |
(525.8 | ) | (26.9 | ) | ||||
| All other investing activities |
75.8 | 79.8 | ||||||
| Net Cash (Used in) Provided by Investing Activities |
(850.7 | ) | 40.5 | |||||
| FINANCING ACTIVITIES: |
||||||||
| Cash dividends paid |
(43.8 | ) | (32.8 | ) | ||||
| Stock compensation transactions |
1.6 | 3.6 | ||||||
| Net increase (decrease) in debt |
31.8 | (321.6 | ) | |||||
| Net Cash Used in Financing Activities |
(10.4 | ) | (350.8 | ) | ||||
| Effect of exchange rate changes on cash |
50.7 | (32.4 | ) | |||||
| Net Decrease in Cash and Cash Equivalents |
(351.1 | ) | (57.3 | ) | ||||
| Cash and cash equivalents at beginning of period |
2,040.8 | 1,912.0 | ||||||
| Cash and cash equivalents at end of period |
$ | 1,689.7 | $ | 1,854.7 | ||||