Attached files
| file | filename |
|---|---|
| 8-K - FORM 8-K - HUDSON CITY BANCORP INC | y90904e8vk.htm |
Exhibit 99.1

| 2011 ANNUAL SHAREHOLDERS MEETING C H A N G I N G T I M E S R E Q U I R E B O L D L E A D E R S H I P |

| 2 FORWARD-LOOKING STATEMENT This presentation may contain forward-looking statements within the meaning of the Private Securities Litigation Reform Act of 1995. These forward-looking statements include, but are not limited to, statements about (i) Hudson City Bancorp, Inc.'s "Hudson City" or "HCBK") plans, objectives, expectations and intentions and other statements contained in this presentation that are not historical facts; and (ii) other statements identified by words such as "may", "believe", "expect", "anticipate", "should", "plan", "estimate", "predict", "continue", "potential", or words of similar meaning. Factors that could cause actual results to differ materially from those expressed in the forward-looking statements are discussed in Hudson City's 2010 Annual Report on Form 10-K filed with the Securities and Exchange Commission and is available at the SEC's Internet site (http://www.sec.gov) or through our Internet site (http://www.hcbk.com). Any or all of the forward- looking statements in this presentation and in any other public statements made by Hudson City may turn out to be wrong. They can be affected by inaccurate assumptions Hudson City might make or by known or unknown risks and uncertainties. Consequently, no forward-looking statement can be guaranteed, Hudson City does not intend to update any of the forward-looking statements after the date of this presentation or to conform these statements to actual events. |

| 3 WHO WE ARE... AND WHAT WE DO |

| 4 BACKGROUND Market Cap over $5.1 billion Ranked in the top twenty-five U.S. financial institutions by asset size One of the largest thrift institutions 135 branch offices in New York, New Jersey and Connecticut |

| 5 SIMPLE, CONSISTENT OPERATING MODEL We make single family mortgage loans A jumbo originator and purchaser Retain all loans High credit quality Multiple mortgage loan distribution channels Retail (our own agents and extensive branch network) Retail (mortgage brokers and bankers) Wholesale (geographic diversity) Funded our 2010 lending and investing activities with retail deposits Industry-leading operating efficiency ratio of 22.10% (4Q 2010) Effective customer service and attractive pricing |

| 6 MORTGAGE LOANS Require a minimum of 20% down payment on all mortgages Historically the average down payment on the portfolio at time of origination was 40% |

| 7 NJ NY CT VA IL MD MA Other 0.44 0.2 0.14 0.03 0.03 0.03 0.02 0.11 LOAN GEOGRAPHIC EXPOSURE AS OF DECEMBER 31, 2010 TOTAL NY METRO AREA EQUALS 78% |

| 8 hudsoncitysavingsbank.com DEPOSITS Funded asset growth exclusively since January 2009 $10.02 billion added since January 2008 Internet deposits of $262 million |

| 9 ATTRACTIVE BRANCH NETWORK Our branches have an average of $186 million in deposits per branch We have approximately 720,000 customer deposit accounts, for an average of $34,900 per account 135 total branches, 97 in New Jersey, 29 in New York and 9 in Connecticut We have branches located in 10 of the Top 50 Counties in the U.S. in terms of Median Household Income |
| 10 EXPENSE DISCIPLINE Hudson City's efficiency ratio was 19.68% for 2010 The annualized ratio of non-interest expense to average assets was 0.44% for 2010 Hudson City is an industry leader for both of these ratios Efficient operations means we need to pay only $0.20 in overhead to generate $1.00 of earnings This type of efficiency allows us to offer competitive rates on both deposits and loans |

| 11 WHAT WE HAVEN'T DONE... Subprime Mortgages Option ARM Loans Brokered Deposits Participate in TARP (Troubled Asset Relief Program) |
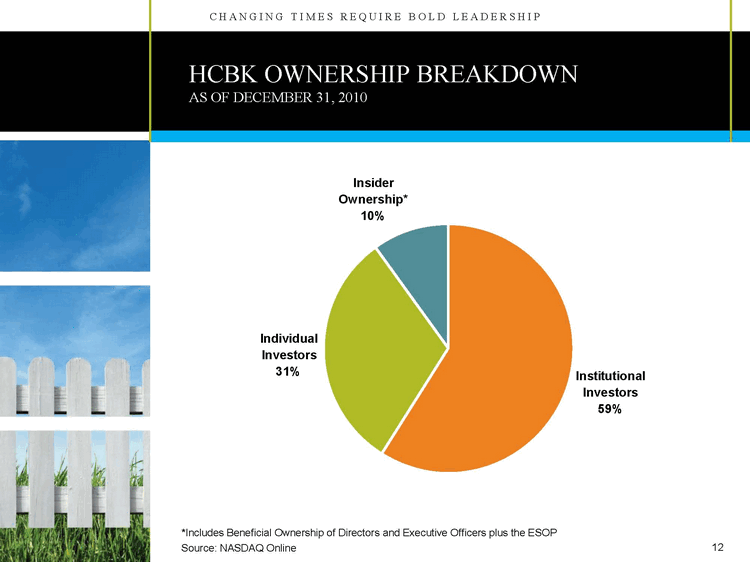
| 12 Institutional Investors Individual Investors Insider Ownership* 0.59 0.31 0.1 HCBK OWNERSHIP BREAKDOWN AS OF DECEMBER 31, 2010 *Includes Beneficial Ownership of Directors and Executive Officers plus the ESOP Source: NASDAQ Online |

| 13 2010: GOOD RESULTS BUT INTEREST RATES MOVED EVEN LOWER |

| 14 OVERVIEW OF 2010 Annual earnings of $537.2 million or $1.09 diluted earnings per share Mortgage loan production of $5.83 billion Mortgage repayments of $7.26 billion Deposits increased 2.4% to $25.17 billion Equity to assets ratio of 9.01% Low efficiency ratio of 19.68%. (Average of the top 50 banks and thrifts as ranked by assets is 59.82%*) * Source: SNL Financial Data |

| 15 Diluted Earnings per Share Dividends per Share 1999 0.075 0.008 2000 0.162 0.045 2001 0.212 0.073 2002 0.315 0.108 2003 0.34 0.162 2004 0.402 0.218 2005 0.48 0.268 2006 0.53 0.3 2007 0.58 0.33 2008 0.9 0.45 2009 1.07 0.59 2010 1.09 0.6 Split adjusted (2:1 June 2002 and 3.206:1 June 2005) (CAGR) Compounded Annual Growth Rate EARNINGS AND DIVIDENDS GROWTH EPS CAGR of 27.55% Dividend CAGR of 48.09% Year Ended December 31, |

| 16 Stock Repurchased Stockholder Dividends 1999 - 2717585 2717585 2000 65456281 16949978 82406259 2001 343914660 34686477 378601137 2002 484087909 56901550 540989459 2003 585145110 88788718 673933828 2004 746807170 129270718 876077888 2005 854306200 231373718 1085679918 2006 1303000000 392000000 1695000000 2007 1853000000 558000000 2411000000 2008 1869000000 776000000 2645000000 2009 1913000000 1064000000 2010 1913000000 1360000000 CUMULATIVE CASH RETURNED TO SHAREHOLDERS (IN MILLIONS) Dividends do not include dividend paid to MHC at December 31 $2,411 $1,695 $1,085 $379 $674 $876 $82 $3 $541 245,770,853 Shares Repurchased at a Weighted Average Price of $7.78 Cumulative Net Income $3,366 $2,645 $3,273 $2,978 |

| 17 + Initial (7/99) split adjusted stock price $1.56 - Total cumulative dividend paid $3.15 = Net cost of shares purchased in IPO $ -1.59 DECEMBER 31, 2010 |

| 18 RADICALLY CHANGED ECONOMIC ENVIRONMENT |

| 19 In the Past 30 Months We Have Experienced... The most significant recession since Great Depression Historically low mortgage rates (low point August 2010) US Government takeover of Fannie Mae & Freddie Mac and placing them into Conservatorship (Q42008) US Government purchase of mortgage-backed securities (MBS) driving down long-term rates (mortgages) |
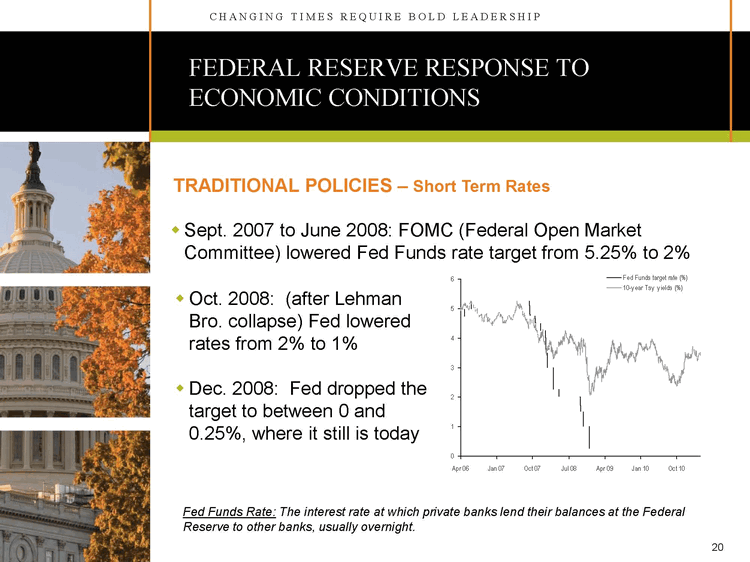
| 20 FEDERAL RESERVE RESPONSE TO ECONOMIC CONDITIONS Sept. 2007 to June 2008: FOMC (Federal Open Market Committee) lowered Fed Funds rate target from 5.25% to 2% TRADITIONAL POLICIES - Short Term Rates Oct. 2008: (after Lehman Bro. collapse) Fed lowered rates from 2% to 1% Dec. 2008: Fed dropped the target to between 0 and 0.25%, where it still is today Fed Funds Rate: The interest rate at which private banks lend their balances at the Federal Reserve to other banks, usually overnight. |

| 21 FEDERAL RESERVE RESPONSE TO ECONOMIC CONDITIONS Fed then turned to a nontraditional policy called Quantitative Easing* to revitalize mortgage lending and support housing market. Basically consisting of large scale asset purchases. Mar.'09 - Mar.'10: (now know as QE1) when the Fed purchased... $1.25 trillion in Mortgage Backed Securities (MBS) $200 billion in Fed Agency Debt (issued by Government Sponsored Enterprises (GSEs) to fund purchase of mortgage loans) $300 billion in long-term Treasury Securities (specifically to lower rates) The increase in demand raised prices causing rates to fall NONTRADITIONAL POLICIES - Long Term & Mortgage Rates * Quantitative Easing: The Federal Reserve Bank buys US Govt. Bonds with new money that the Federal Reserve Banks create electronically driving bond prices higher and yields lower. |

| 22 FEDERAL RESERVE RESPONSE TO ECONOMIC CONDITIONS November 2010: Fed again turned to Quantitative Easing (referred to as QE2) to fight deflation by revitalizing mortgage lending and to support housing market. Fed announced it would purchase... Another $600 billion in long-term Treasury securities. QE1 and QE2 totaled $2.35 trillion (of MBS, Fed Agency Debt and Long term Treasury Securities) asset purchases. NONTRADITIONAL POLICIES - Long Term & Mortgage Rates |
| 23 FANNIE MAE AND FREDDIE MAC Sept. '08 - Dec. '09: Congress granted Treasury authority(1) to purchased securities guaranteed by Fannie Mae and Freddie Mac to provide stability to financial markets. - The Treasury purchased $220 billion of MBS Government sponsored enterprises have made up 90% of recent mortgage production In the Housing and Economic Recovery Act of 2008 |
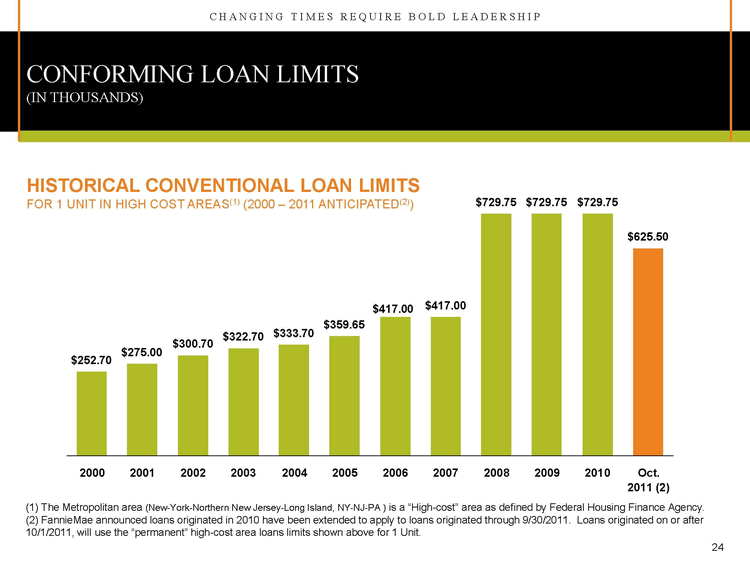
| 24 CONFORMING LOAN LIMITS (IN THOUSANDS) Single Family High-Cost Areas 2000 252.7 2001 275 2002 300.7 2003 322.7 2004 333.7 2005 359.65 2006 417 2007 417 2008 729.75 2009 729.75 2010 729.75 Oct. 2011 (2) 625.5 HISTORICAL CONVENTIONAL LOAN LIMITS FOR 1 UNIT IN HIGH COST AREAS(1) (2000 - 2011 ANTICIPATED(2)) (1) The Metropolitan area (New-York-Northern New Jersey-Long Island, NY-NJ-PA ) is a "High-cost" area as defined by Federal Housing Finance Agency. (2) FannieMae announced loans originated in 2010 have been extended to apply to loans originated through 9/30/2011. Loans originated on or after 10/1/2011, will use the "permanent" high-cost area loans limits shown above for 1 Unit. |

| 25 IMPACT ON HUDSON CITY |

| 26 IMPACT ON HUDSON CITY Eleventh straight record year for earnings "Conditions in the mortgage market continued to produce substantial headwinds..." "Going forward we expect these conditions will significantly hinder our ability to continue earnings at recent historical levels..." "We expect that this will result in a further restructuring in our funding mix" Press Release Dated January 19, 2011... |
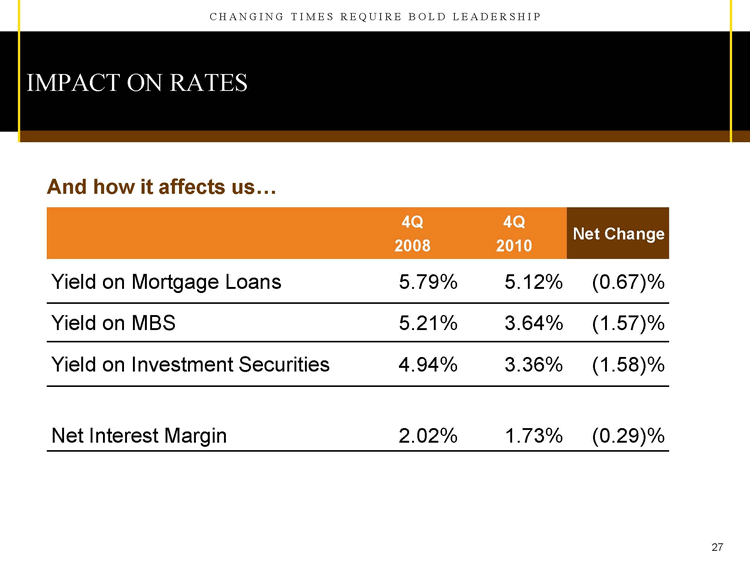
| 27 IMPACT ON RATES 4Q2008 4Q2010 Net Change Yield on Mortgage Loans 5.79% 5.12% (0.67)% Yield on MBS 5.21% 3.64% (1.57)% Yield on Investment Securities 4.94% 3.36% (1.58)% Net Interest Margin 2.02% 1.73% (0.29)% And how it affects us... |

| 28 IMPACT ON RATES 4Q2008 4Q2010 Net Change Cost of Deposits 3.39% 1.41% (1.98)% And how it affects you... |

| 29 2000 2001 2002 2003 2004 2005 2006 2007 2008 2009 2010 Income Taxes 62590 73517 109382 119801 143145 166318 171990 185885 287328 346722 355227 Non-Interest Expense 78997 81824 93541 102527 118348 127703 158955 167913 198076 265596 266388 OPERATING EXPENSES vs. INCOME TAXES Comp., Leases, FDIC Cost, etc. Year Ended December 31 |
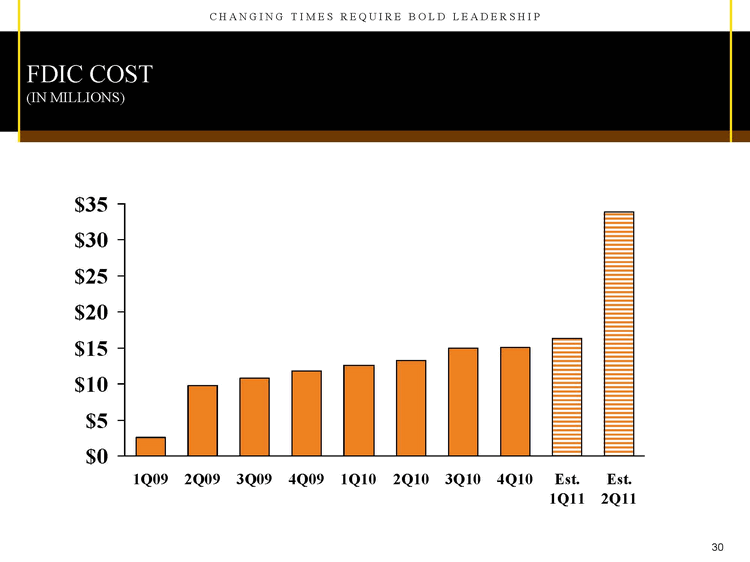
| 30 1Q09 2Q09 3Q09 4Q09 1Q10 2Q10 3Q10 4Q10 Est. 1Q11 Est. 2Q11 FDIC Assessment 2616 9741 10830 11800 12627 13300 15000 15030 16330 33880 FDIC COST (IN MILLIONS) |

| 31 PREPAYMENTS AND RECASTS (modifications) (IN MILLIONS) 2008 2009 2010 Mortgages: Prepayments $2,820 $6,768 $7,261 Recasts 89 2,250 2,750 MBS 2,305 4,733 8,366 Investments $2,808 $4,022 $7,074 Total $8,022 $17,773 $25,451 |

| 32 IMPACT ON HUDSON CITY Repayment of mortgage-backed securities amounted to $8.4 billion re-invested at much lower rates Repayment of mortgage loans of $7.3 billion and recasts of $2.8 billion re-invested at much lower rates Repayment of investments securities of $7.1 billion re- invested at much lower rates Borrowing costs declined slightly Low yielding assets with higher cost funding results in decrease in net interest margin In 2010... |

| 33 IMPACT ON HUDSON CITY Due to the Federal Reserve's actions in acquiring MBS and Investment securities directly, the rate on these instruments were driven down. The yield on our MBS and Investments Security portfolios which are needed to balance our primary product line of long term mortgages, has been driven down from a combined 5.16% to 3.5%. The result was a mismatch between an asset category - our securities portfolio at 3.5% and a source of funding, our borrowed funds at 4.0%. This meant that if action weren't taken our net interest margin would continue to decline affecting profits. SIMPLY STATED... |

| 34 THE WAY FORWARD |
| 35 THE WAY FORWARD Balance sheet restructure (March 2011) Positioned the company for better net interest margin going forward |

| 36 BALANCE SHEET RESTRUCTURE Total of a series of transactions executed in March 2011: Summary of Transaction Extinguishment of Structured Quarterly Putable Borrowings $12.50 billion Funded by: Sale of Securities $8.66 billion Shorter-term Fixed Maturity Borrowings $5.00 billion *Approximate After-tax Charge $649.3 million * Net income (core earnings) for the year will reduce this after-tax charge. |
| 37 BALANCE SHEET RESTRUCTURE Increase in net interest margin of up to 40 basis points Reduction of interest rate risk Reduction of liquidity risk Reduction of low-yielding investments Realignment of the overall funding mix Allowing for future growth potential Effect of Restructuring |

| 2011 ANNUAL SHAREHOLDERS MEETING C H A N G I N G T I M E S R E Q U I R E B O L D L E A D E R S H I P |
