Attached files
| file | filename |
|---|---|
| EX-32.1 - CERTIFICATION - Crownbutte Wind Power, Inc. | ex32-1.htm |
| EX-31.1 - CERTIFICATION - Crownbutte Wind Power, Inc. | ex31-1.htm |
| EX-10.20 - PROMISSORY NOTE - Crownbutte Wind Power, Inc. | ex10-20.htm |
| EX-10.21 - PROMISSORY NOTE - Crownbutte Wind Power, Inc. | ex10-21.htm |
UNITED STATES
SECURITIES AND EXCHANGE COMMISSION
Washington, D.C. 20549
FORM 10-K
(Mark One)
|
þ
|
ANNUAL REPORT PURSUANT TO SECTION 13 OR 15(d) OF THE SECURITIES EXCHANGE ACT OF 1934
|
For the fiscal year ended: December 31, 2010
or
|
o
|
TRANSITION REPORT PURSUANT TO SECTION 13 OR 15(d) OF THE SECURITIES EXCHANGE ACT OF 1934
|
For the transition period from _______________ to _______________
Commission file number: 333-156467
|
Crownbutte Wind Power, Inc.
|
|
(Exact name of registrant as specified in its charter)
|
|
Nevada
|
20-0844584
|
|
|
(State or other jurisdiction of
incorporation or organization)
|
(IRS Employer Identification No.)
|
|
111 5th Avenue NE, Mandan, ND
|
58554
|
|
|
(Address of principal executive offices)
|
(Zip Code)
|
Registrant’s telephone number, including area code: (701) 667-2073
Securities registered under Section 12(b) of the Act: None
Securities registered under Section 12(g) of the Act: None
Indicate by check mark if the registrant is a well-known seasoned issuer, as defined in Rule 405 of the Securities Act.
Indicate by check mark if the registrant is not required to file reports pursuant to Section 13 or 15(d) of the Exchange Act.
Yes o No þ
Indicate by check mark whether the registrant (1) has filed all reports required to be filed by Section 13 or 15(d) of the Exchange Act during the preceding 12 months (or for such shorter period that the registrant was required to file such reports), and (2) has been subject to such filing requirements for the past 90 days. Yes þ No o
Indicate by check mark whether the registrant has submitted electronically and posted on its corporate Web site, if any, every Interactive Data File required to be submitted and posted pursuant to Rule 405 of Regulation S-T during the preceding 12 months (or for such shorter period that the registrant was required to submit and post such files). Yes o No þ
Indicate by check mark if disclosure of delinquent filers pursuant to Item 405 of Regulation S-K is not contained herein, and will not be contained, to the best of registrant’s knowledge, in definitive proxy or information statements incorporated by reference in Part III of this Form 10-K or any amendment to this Form 10-K. þ
Indicate by check mark whether the registrant is a large accelerated filer, an accelerated filer, or a smaller reporting company. See the definitions of the “large accelerated filer,” “accelerated filer” and “smaller reporting company” in Rule 12b-2 of the Exchange Act.
|
Accelerated Filer o
|
|
|
Non-Accelerated Filer o (Do not check if a smaller reporting company)
|
Smaller reporting company þ
|
Indicate by check mark whether the registrant is a shell company (as defined in Rule 12b-2 of the Exchange Act). Yes o No þ
State issuer's revenues for its most recent fiscal year. $0
State the aggregate market value of the voting and non-voting common equity held by non-affiliates computed by reference to the price at which the common equity was sold, or the average bid and asked prices of such common equity, as of the last business day of the registrant’s most recently completed second fiscal quarter.
Approximately $4,896,121, as of June 30, 2010
(APPLICABLE ONLY TO CORPORATE REGISTRANTS)
State the number of shares outstanding of each of the issuer's classes of equity stock, as of the latest practicable date.
37,044,138 common shares issued and outstanding as April 13, 2011
2
TABLE OF CONTENTS
|
Item Number and Caption
|
Page
|
||
|
Forward-Looking Statements
|
|||
|
PART I
|
|||
|
1.
|
Business
|
5 | |
|
2.
|
Properties
|
28 | |
|
3.
|
Legal Proceedings
|
30 | |
|
4.
|
(Removed and Reserved)
|
31 | |
|
PART II
|
|||
|
5.
|
Market for Registrant’s Common Equity, Related Stockholder Matters and Issuer Purchases of Equity Securities
|
31 | |
|
6.
|
Selected Financial Data
|
33 | |
|
7.
|
Management’s Discussion and Analysis of Financial Condition and Results of Operations
|
33 | |
|
8.
|
Financial Statements and Supplemental Data
|
36 | |
|
9.
|
Changes in and Disagreements with Accountants on Accounting, and Financial Disclosure
|
54 | |
|
9A.[T]
|
Controls and Procedures
|
54 | |
|
9B.
|
Other Information
|
55 | |
|
PART III
|
|||
|
10.
|
Directors, Executive Officers, and Corporate Governance
|
55 | |
|
11.
|
Executive Compensation
|
58 | |
|
12.
|
Security Ownership of Certain Beneficial Owners and Management and Related Stockholder Matters
|
61 | |
|
13.
|
Certain Relationships and Related Transactions
|
62 | |
|
14.
|
Principal Accountant Fees and Services
|
63 | |
|
PART IV
|
|||
| 15. | Exhibits, Financial Statement Schedules | 64 | |
| Signatures | 67 | ||
3
FORWARD-LOOKING STATEMENTS
Various statements in this Annual Report, including those that express a belief, expectation or intention, as well as those that are not statements of historical fact, are “forward-looking statements” within the meaning of the United States Private Securities Litigation Reform Act of 1995. The forward-looking statements may include projections and estimates concerning the timing and success of specific projects, revenues, income and capital spending. We generally identify forward-looking statements with the words “believe,” “intend,” “expect,” “seek,” “may,” “should,” “anticipate,” “could,” “estimate,” “plan,” “predict,” “project” or their negatives, and other similar expressions. These statements are likely to address our growth strategy, financial results and exploration and development programs, among other things.
Forward-looking statements are subject to risks and uncertainties that may change at any time, and, therefore, our actual results may differ materially from those that we expected. The forward-looking statements contained in this Annual Report are largely based on our expectations, which reflect many estimates and assumptions made by our management. These estimates and assumptions reflect our best judgment based on currently known market conditions and other factors. Although we believe such estimates and assumptions are reasonable, we caution that it is very difficult to predict the impact of known factors and it is impossible for us to anticipate all factors that could affect our actual results. In addition, management’s assumptions about future events may prove to be inaccurate. Management cautions all readers that the forward-looking statements contained in this Annual Report are not guarantees of future performance, and we cannot assure any reader that such statements will be realized or the forward looking events and circumstances will occur. Actual results may differ materially from those anticipated or implied in the forward-looking statements due to the factors described in the “Risk Factors” section and elsewhere in this Annual Report. All forward-looking statements are based upon information available to us on the date of this Annual Report. We undertake no obligation to update or revise any forward-looking statements as a result of new information, future events or otherwise, except as otherwise required by law.
In this Annual Report, unless the context requires otherwise, references to the “Company,” “Crownbutte,” “we,” “our” and “us” refer to Crownbutte Wind Power, Inc., a publicly traded Nevada corporation formerly known as ProMana Solutions, Inc., together with its subsidiaries, including Crownbutte Wind Power, Inc., a North Dakota corporation (“Crownbutte ND”).
4
PART I
Overview of Our Business
Crownbutte ND was founded in 1999 by former Chief Executive Officer, Timothy H. Simons, with the goal of addressing the requirements of regional utility companies to satisfy increasing renewable energy demands. We develop wind parks from green field to operation, which we have sold to regional utilities. One park developed by us was purchased directly by Basin Electric Power Cooperative (2.6 megawatts (MW) near Chamberlain, South Dakota). We also developed a 20 MW, expandable to 50 MW, project in Baker, MT, which was sold at late brownfield stage to Montana-Dakota Utilities. It was since expanded to 30 MW and is now called the Diamond Willow Wind Farm. In addition to these two operating parks, we have completed various consulting activities with regional utilities and international energy companies. Our ultimate goal is to develop, own and operate merchant wind parks in the 20 to 60 MW capacity range. Currently, we have 12 projects totaling approximately 638 MW (0 MW currently in operation) of prospective capacity in various phases of development primarily in North Dakota, South Dakota and Montana, with a total of over 40,000 acres under lease option. See “Properties.” Our project management team is also exploring other opportunities in this region.
Our principal executive offices are located at 111 5th Avenue NE, Mandan, ND 58554, and our telephone number is (701) 667-2073. Our website address is www.crownbutte.com .
We were incorporated in the State of Nevada on March 9, 2004, under the name ProMana Solutions, Inc. As ProMana Solutions, our business was to provide web-based, fully integrated solutions for managing payroll, benefits, human resource management and business processing outsourcing to small and medium sized businesses. Following the merger described below, we are no longer in that web services business.
On July 2, 2008, we amended our Articles of Incorporation to change our name to Crownbutte Wind Power, Inc.
Crownbutte ND was formed as a North Dakota limited liability company on May 11, 1999. On May 19, 2008, Crownbutte ND was converted to a North Dakota corporation.
On July 2, 2008, a special purpose acquisition subsidiary formed by us merged with and into Crownbutte ND, with Crownbutte ND surviving the merger, thereby becoming our wholly-owned subsidiary. Following the merger, we continued Crownbutte ND’s business operations. In connection with the merger, we changed our name to Crownbutte Wind Power, Inc. Upon the closing of the merger, the holders of all of the issued and outstanding shares of Crownbutte ND surrendered all of their shares and received shares of our common stock on a one-to-one basis. Also on the closing date, holders of issued and outstanding warrants to purchase shares of Crownbutte common stock received new warrants to purchase shares of our common stock, also on a one-to-one basis.
Pursuant to the merger, we ceased operating as a provider of web-based, fully integrated solutions for managing payroll, benefits, human resource management and business processing outsourcing, and acquired the business of Crownbutte ND to develop wind parks from green field to operation and has continued Crownbutte ND’s business operations as a publicly-traded company.
At the closing of the merger, each share of Crownbutte ND’s common stock outstanding was converted into one share of our Common Stock. As a result, an aggregate of 18,100,000 shares of our Common Stock were issued to the holders of Crownbutte ND’s common stock. In addition, warrants to purchase an aggregate of 10,600,000 shares of Crownbutte ND’s outstanding at the time of the merger became warrants to purchase an equivalent number of shares of our Common Stock.
5
The merger agreement contains a provision for a post-closing adjustment to the number of shares of our Common Stock issued to the former Crownbutte ND stockholders, in an amount up to 2,000,000 shares of our Common Stock, to be issued on a pro rata basis for any breach of the Merger Agreement by us, discovered during the one-year period following the closing. In order to secure the indemnification obligations of Crownbutte ND under the merger agreement, 5% of the shares of our Common Stock to which the former Crownbutte ND stockholders were entitled in exchange for their shares of Crownbutte ND in connection with the Merger were held in escrow for a period of one year.
The merger agreement contained customary representations and warranties and pre- and post-closing covenants of each party and customary closing conditions. Breaches of the representations and warranties will be subject to customary indemnification provisions.
The merger was treated as a recapitalization of the Company for financial accounting purposes. Crownbutte ND is considered the acquirer for accounting purposes, and our historical financial statements before the merger have been replaced with the historical financial statements of Crownbutte ND before the merger in all subsequent filings with the Securities and Exchange Commission.
The parties have taken all actions necessary to ensure that the merger is treated as a tax-free exchange under Section 368(a) of the Internal Revenue Code of 1986, as amended.
Contemporaneously with the merger, the then-existing assets and liabilities of the Company were transferred to Pro Mana Technologies, Inc., a New Jersey corporation, which at that time was a wholly-owned subsidiary of the Company. Contemporaneously with the merger, we transferred all of the outstanding capital stock of Pro Mana Technologies to certain pre-merger shareholders of the Company in exchange for the surrender and cancellation of an aggregate of 144,702 shares of our common stock and warrants to purchase 19,062 shares of our common stock held by those stockholders and certain covenants and indemnities. We no longer own Pro Mana Technologies.
On July 31, 2008, we effected a reverse stock split, as a result of which each 65.723 shares of our common stock (including those issued in connection with the merger) then issued and outstanding were converted into one share of our common stock. Unless otherwise stated herein or the context clearly indicates otherwise, all share and per share numbers in this Annual Report relating to our common stock have been adjusted to give effect to the reverse stock split.
General Philosophy
We have developed what we believe is a unique process for bringing viable wind parks to market. While most developers have focused on large projects of 100 MW or more, we have found a niche in the 20-60 MW range. Our focus will be to bring these smaller parks from concept to operation. The project sites currently in development by us are located directly on some of the most ideal wind regimes in the country, with net capacity factors of up to forty-six percent (46%). These above-average net capacity factors have a significant impact on the amount of electricity that can be generated and therefore on future revenues.
Net capacity factor is one element used in measuring the productivity of a wind turbine, wind energy project or any other power production facility. It compares the turbine’s production over a given period of time with the amount of power the turbine could have produced if it had run at full capacity for the same amount of time.
|
Amount of power produced over time (usually measured annually)
|
|
|
Net Capacity Factor =
|
|
|
Power that would have been produced if turbine operated at full capacity 100% of the time over the same period of time
|
Net capacity factors are calculated using the following inputs:
6
|
1)
|
The power curve for the specific turbine that is being used at a given project site. This comes from the turbine manufacturer and varies between turbine types.
|
|
2)
|
The wind velocity distribution (Weibull Distribution) at the site of a given project. This comes from a statistical analysis of the meteorological data gathered from our proprietary meteorological towers erected at the site over the course of several years and confirmed with existing meteorological information from very long term weather stations and airport and other meteorological towers near the site.
|
|
3)
|
A mathematical model of the wind shear which allows us to extrapolate the wind speed data gathered from our meteorological towers at three different heights up to the specific hub-height of the wind turbine generator.
|
|
4)
|
Estimates of a number of known losses that are incurred during wind turbine operations. In particular, these are:
|
|
|
Topographic efficiency
|
|
|
|
Electrical efficiencies
|
|
|
Availability
|
|
|
|
Array losses
|
|
|
Icing and blade degradation
|
|
|
|
Substation maintenance
|
|
|
Utility downtime
|
|
|
|
Power curve turbulence variation
|
|
|
Sector management
|
We utilize proprietary computer software which incorporates each of these inputs for a given project site and returns the net capacity factor as its output.
This capacity factor is then verified against the net capacity factor calculated by an independent Certified Consulting Meteorologist (CCM) who is contracted for each project so that the net capacity factors are certified as correct and thus can be used in our interconnection requests and financing negotiations.
When our results differ from those of the Certified Consulting Meteorologist, it is due to different estimates in the above list of inputs. For example, the CCM may use a different Hellman exponent in the wind shear model than we do, or they may use different estimates of the loss factors. In these cases, the CCM net capacity factor is assumed to be correct, and we adjust our input assumptions to conform with those of the CCM.
Our net capacity factor projections are subject to change and are not intended to predict the wind at any specific time over the turbine’s 20-year useful life. Even if our predictions of a wind energy project’s net capacity factor become validated over time, the energy projects may experience hours, days, months, and even years that are below our wind resource projections.
Our focus on smaller projects allows us to install parks where developers of larger projects would be at a disadvantage, because smaller projects more easily fit into the current transmission grid, which decreases the costs of upgrading downstream components. While small projects are the focus of our strategy, we have not ruled out the possibility of larger projects.
Our business model focuses on the development of merchant parks. We do not plan to enter into power purchase agreements (PPAs) unless they are offered on favorable terms. Currently in the upper Midwest, with the exception of Minnesota, power purchase agreements tend to be difficult to obtain. When power purchase agreements are available, they tend to be at a price per kilowatt hour (kWh) that is less than the market price of electricity. Merchant parks sell electricity on the open market. Based on spot prices for electricity over the past five years, our merchant parks would have received on average $0.042 per kWh. Selling power on the open market increases the risk of the projects. However, based on U.S. Department of Energy forecasts and our own analysis, we believe that over the next decade the market price of electricity will continue to increase and that this merchant model will allow us to capture that upside potential.
7
In the past, we have been developing and then selling wind parks, in some cases remaining as a consultant for the party that purchased the park. We plan to continue to sell developments as a part of our ongoing business, but we intend to shift the focus of our business towards ownership and operation of merchant wind parks that we develop. We believe that this will allow us to grow our balance sheet and increase cash flow.
We intend to develop sites from “green field” (or blank slate) at a rate of approximately two to three additions to our pipeline per year, with each site likely to reach operation in approximately three years.
The first wind park that we plan to build, own and operate is a 20 MW project called Gascoyne I located south of Dickinson, North Dakota. As stated elsewhere in this Annual Report and the accompanying notes to audited consolidated financial statements, financing efforts for the Gascoyne I park are ongoing. Our goal is to have approximately 20 MW of owned operating capacity by the end 2011, subject to financing, and we target the construction and commissioning of approximately 40 MW of owned operating capacity annually thereafter. We do not currently and do not plan to act as an operator of wind parks we do not own.
To successfully develop, build and own wind parks, and to acquire other developments or make business acquisitions, we will need to raise additional capital.
We anticipate that we will need to arrange turbine supply loans to finance approximately 60 to 90% of the cost of a project’s turbines. After we have developed a wind energy project that we intend to own to the point where we are prepared to commence construction, we will need to raise construction financing to retire turbine indebtedness and to pay construction costs. Construction loans are generally secured by the project’s assets and our equity interests in the project companies. In certain instances we may enter into a construction loan for a single project, while in other instances we may be able to finance multiple projects through a single credit facility. We will also use equity capital contributions (our own and potentially from other investors as described above) to fund a portion of each project’s construction costs.
It is important to note that we do not plan to enter into PPAs, unless they are offered at a favorable rate. Instead, we will be selling our electricity on the open market. This is a deviation from the standard business model of wind parks, where a PPA is entered into to guarantee a price for a period of time. In our geographic areas, utilities generally have not been interested in PPA agreements, except at unattractive rates. We believe we will benefit from the sale of electricity in the merchant model because of the higher average price relative to what would be offered by a utility.
Our growth strategy is focused on developing parks from green field to operation. Our project management team is constantly exploring new opportunities in the North Dakota, South Dakota and Montana area that appear to be optimal sites. For our business strategy to work, new locations with excellent potential must continually be found and developed. In addition to green field developments, we are constantly analyzing the late stage developments of other wind developers. If a project appears to be feasible, we will pursue the purchase of the park. The value of a wind project and the expected level of returns are a function of the electricity that can be produced and its expected sales value over the lifetime of a wind farm. As the probability of a viable project reaching operation increases the market value also increases for that project. Key parts of the development stage, such as acceptable wind data, an interconnection agreement and a power off take solution, add the most value to the development process.
Each project has a value as it progresses, and projects can be sold at any stage of development. In our experience, prices for projects under development can range from $10,000 a MW for an early development stage project to $75,000 a MW for a project ready to begin construction. Developers looking to sell development stage projects will usually receive a higher price per MW for the sale of an entire pipeline of projects.
8
We are proceeding with development of our project portfolio. These projects are in various stages of development with the most advanced project ready to begin construction. We have focused on siting projects to fit the existing transmission grid so that our projects will not be subject to major upgrade costs or delayed because the need for additional transmission lines. As a result of our “size to fit” emphasis we have a number of small to mid size projects spaced out across North Dakota, South Dakota and Montana. Another key aspect of the Crownbutte development process is our emphasis on obtaining land control and wind data prior to starting the interconnection studies. Completing this work prior to the interconnection studies increases the probability that a project will be successful if an interconnection agreement is secured.
Development carries significant risk. In total, the process of site development can take up to five years and cost $200,000 to $300,000. Every step in the development process must be met precisely to prevent project failure. As the project completes each step in the development process the risk of the project decreases.
Our development strategy has several phases, and each phase adds value as a site is developed. The development phase involves all the preparation for park installation, up to but not including construction. The steps of wind park development, construction and operation are listed below:
|
1.
|
Identify the transmission capacity suitable for a specific-sized park within the large but widely scattered transmission system. By starting with the available transmission capacity we decrease the risk of adverse transmission system upgrade costs.
|
|
2.
|
Conduct topographical studies to determine the most promising locations by using the available meteorological data. We use this information to determine the anticipated energy production and associated project economics.
|
|
3.
|
Configure an initial park array to determine the parameters of the park with regard to transmission capability.
|
|
4.
|
Procure the necessary land lease options under the park’s footprint.
|
|
5.
|
Install site-specific meteorological instrumentation, which is always necessary to obtain site specific meteorological data. In some cases a meteorological tower is already on site, and historic data is therefore available. In most cases we will erect a meteorological tower for meteorological observation.
|
|
6.
|
Accumulate sufficient meteorological data.
|
|
7.
|
Select turbine type based on performance factors, availability and financeability.
|
|
8.
|
Prepare a wind report.. Once sufficient meteorological data has been accumulated we will retain a certified consulting meteorologist to prepare a financeable wind report by a certified consulting meteorologist, which validates that the wind regime will support the project cash flow model.
|
|
9.
|
Apply for local, state and federal permitting and transmission queue position. The permitting requirements for a project depend to a large extent on the location of the project. However, there are normally permitting considerations for zoning laws, wildlife protection, historical sites and use of air space.
|
|
10.
|
Secure interconnect agreements with utility and systems operator. Upon completion of the necessary system studies that follow an interconnection application we will know the upgrades necessary to tie into the transmission grid. Upon signing of an interconnection agreement we will be allowed to use the transmission grid to sell or wheel electricity.
|
|
11.
|
Prepare site design. Prior to construction, we will prepare the site design, which includes the geotechnical studies for the foundations.
|
|
12.
|
Execute turbine supply agreement. The turbine supply agreement dictates the relationship between the developer and a turbine manufacturer. It includes the turbine delivery time lines and the warranties on the turbines the manufacturer will provide.
|
9
|
13.
|
Retain construction subcontractors for each piece of the construction . These include high voltage work, crane use, access road construction, pouring of foundations, and all other necessary steps to complete the park.
|
|
14.
|
Prepare final site designs , including design of the high voltage systems, service roads, junction boxes, etc.
|
|
15.
|
Finalize project financing. Prior to construction the necessary arrangements for both construction financing and financing for the operational project must be secured. The financing normally includes some mix of developer equity, production tax credit (PTC), equity, and debt.
|
|
16.
|
Order long lead-time items such as the main step-up transformer and substation steel.
|
|
17.
|
Construction . Subcontractors will undertake all construction activities with oversight by us and the turbine manufacturer’s engineers. Construction on a 20 MW park generally takes 6-12 months. The majority of costs in developing a park are recognized during the construction phase.
|
|
18.
|
Turbine Commissioning. Once the turbines are erected, they will be tested for performance in line within the manufacturer’s specification. It the tests show the turbine is operation properly is will be commissioned and begin commercial operation.
|
|
19.
|
Operation & Maintenance . We will manage the operation of the project upon its commercial operation.
|
Our current pipeline of projects includes 12 projects totaling 638 MW (0 MW currently in operation) of potential capacity.
Buyers of Wind Parks
The mix of potential buyers changes as the size of wind projects increases. Different players in the market place only become interested when capital requirements for a project reach a certain level. Larger players need size to justify the time and expense required to construct or acquire projects. Smaller projects in the single to high teens of total megawatt output are usually owned by several different types of parties for specific reasons. Municipalities will purchase two to ten MW to generate some of their electricity needs from a renewable energy source. Utilities can also own small projects, usually as a result of a state mandate which requires the utility to generate a percentage of their electricity from renewable energy. In other cases a municipality may have a mandate to support community wind projects.
The midsize projects have the largest spectrum of potential buyers. These projects can range from 20 to 200 MW in size. Midsize projects benefit from economies of scale, and the projects become economically viable without the assistance of state mandates. Midsize projects are also more likely to fit into the existing transmission grid. As the projects get larger, the likelihood of needing substantial system upgrades increases. Midsize projects have a number of possible investors, ranging from utilities to financial institutions. Utilities generally prefer the midsize projects because they provide the generation necessary to address renewable energy portfolio standards, without buying more generation than is required. Financial institutions are attracted to the midsize projects because they are the right size for an efficient capital campaign. The projects are big enough that raising capital is worth their time and expense, but also the projects are small enough that an institution will not be over-exposed to the risks of one project. When a company is looking to create a portfolio of renewable energy assets, the midsize projects are most ideally suited to allow for diversification across geographic area, transmission systems and technology. According to the American Wind Energy Association, the average utility-scale wind project size in America is 60 MW. We are focusing on projects in the 20 to 60 MW range.
10
Wind Turbine and Construction Materials Supply
The growth of our business is dependent on the availability of turbines and turbine financing. Wind energy projects require delivery and assembly of turbines. Supply and logistical issues are of the utmost importance when developing a wind park. Over the past couple of years, demand for turbines has softened due to the 2008 financial market crisis. The industry is beginning to turn around and the rate of construction of projects has increased since the implementation of the U.S. Treasury Department renewable energy grant program as part of the American Recovery and Reinvestment Act of 2009. We have been contacted by various developers who have excess turbines at discounted prices and are evaluating the feasibility of purchasing some of these turbines with limited or no warranty. We have seen some evidence of softening turbine prices and shorter delivery lead times as the financial market turmoil during the autumn of 2008 has slowed the installation of new wind capacity. We expect that the turbines we require for our project development schedule will be available on a timely basis provided that we are able obtain turbine financing. We may work with several turbine suppliers to meet our turbine needs.
In addition, spare parts for wind turbines and key pieces of electrical equipment will need to be available for the turbines we have in operation. When we purchase our turbines, we also enter into warranty agreements with the manufacturer. Along with turbines and electrical equipment, other construction materials, such as gravel, cement, and rebar are necessary for the construction of roads and foundations. The combination of all these issues makes it essential for us to maintain working relationships with all of our suppliers.
Industry Overview
Renewable energy is produced using resources that are naturally replenished, such as wind, sunlight, geothermal heat, tides and biofuels. Technologies that produce energy from these renewable sources (other than biofuels) are often referred to as “clean” or “green” as they produce few, if any, pollutants that negatively impact the environment. Comparatively, fossil fuels such as coal, natural gas and oil are exhaustible and release greenhouse gases such as carbon dioxide or other pollutants into the atmosphere during energy production. As a result of increased environmental awareness, the deployment of renewable energy technologies has grown rapidly during the past several years. According to the Energy Information Administration, 37% of new U.S. power generation capacity in 2007 consisted of renewable technologies, compared with only 2% in 2003. This increase is expected to continue, with the American Council on Renewable Energy forecasting renewable energy capacity to grow by a compounded annual growth rate between 9% and 11% through 2025, yielding a potential 550,000-700,000 MW of additional renewable capacity. At this rate, the United States could supply 25% of its electrical energy requirements with renewable energy by 2025.
According to the U.S. Department of State, wind energy is the fastest-growing renewable energy generation technology worldwide due to its cost efficiency, technological maturity and the wide availability of wind resources. We believe that it has the greatest potential among all renewable energy technologies for further growth in the United States. Although the United States has hydroelectric and geothermal resources, many potential hydroelectric sites have already been developed and geothermal production is confined by geographical limitations to only certain areas of the United States. In contrast, according to the American Wind Energy Association, or AWEA, the available untapped wind resources across the United States remain vast. Additionally, other renewable energy technologies, such as solar power, are currently less economically attractive than wind energy, and others, such as biofuels, emit particulates which have a greater negative impact on the environment than wind energy.
Growth in U.S. Wind Energy
We believe that the growth in U.S. wind energy will continue due to a number of key factors, including:
|
●
|
Increases in electricity demand coupled with the rising cost of fossil fuels used for conventional energy generation resulting in increases in electricity prices;
|
|
|
●
|
Heightened environmental concerns, creating legislative and popular support to reduce carbon dioxide and other greenhouse gases;
|
|
●
|
Regulatory mandates, such as state renewable portfolio standard programs, as well as federal tax incentives including production tax credits and accelerated tax depreciation;
|
|
|
●
|
Improvements in wind energy technology;
|
11
|
●
|
Increasing obstacles for the construction of conventional fuel plants; and
|
|
|
●
|
Abundant wind resources in attractive energy markets within the United States.
|
From its beginnings in California, wind energy in the United States has expanded steadily to 36 of the 50 states. As depicted on the maps below, the total installed capacity of U.S. wind parks increased by over 680% from 2,500 MW to over 19,500 MW between December 1999 and June 2008.
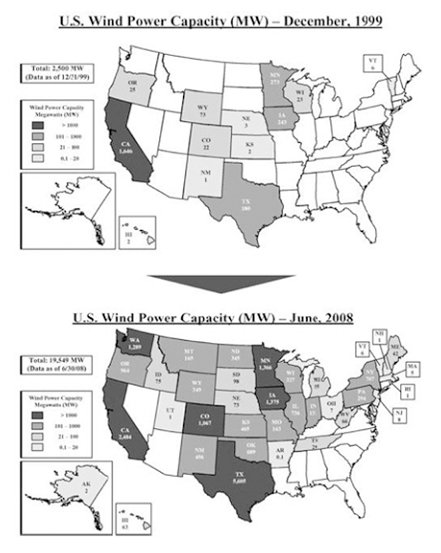
Source for December, 1999: U.S. Department of Energy.
Source for June, 2008: American Wind Energy Association.
12
According to the American Wind Energy (AWEA) 2009 Annual Wind Report, installed U.S. wind capacity increased by 8,545 MW (50.8%) in 2008 and by 5,249 MW (45.3%) in 2007. Despite this growth, wind energy generation still only represented just 1.26% of U.S. electricity supply in 2008, and we believe that the prospects for further growth are very favorable. Additionally, in May 2008, the U.S. Department of Energy published a feasibility report discussing the potential for wind power to provide up to 20% of U.S. electricity needs by 2030, which would require over 300,000 MW of cumulative installed wind capacity to meet this target.
Increases in Electricity Demand Coupled with the Rising Cost of Fossil Fuels Used for Conventional Energy Result in Increases in Electricity Prices
The demand for electricity has historically exhibited steady growth and has increased by a cumulative amount of 23% or 728 billion kWh from 1995 through 2007. According to the Energy Information Administration, electricity demand in the United States is forecasted to continue to grow at a steady long-term rate with a cumulative increase from 2007 through 2030 of 32%. Most of this demand has historically been supplied by coal- or natural gas-fired power plants, which accounted for 49% and 21%, respectively, of U.S. electrical power generation in 2007. In New York, New England, Texas and California, natural gas accounts for a significant portion of the electricity production, and this high usage, combined with the increased presence of natural gas-fired power plants, has made it the fuel that determines the price of power in these markets.
Price of Crude Oil and Natural Gas
Comparative Cost of Electric Power Generation
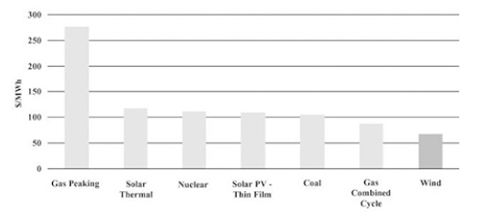
Source: National Association of Regulatory Utility Commissioners. For each generation source, cost is calculated by taking the mid-point of the range described in the report by Lazard — “Levelized Cost of Energy Analysis — Version 2.0,” June 2008
13
United States Wind Generation Growth
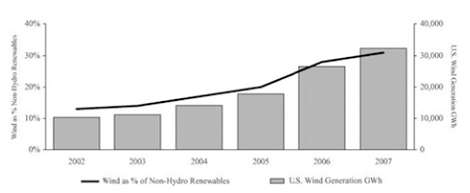
Source: Energy Information Administration
Non-hydro renewables consist of wind, solar, geothermal and biomass.
Wind energy also offers an attractive method of managing commodity price risk while maintaining strict environmental standards, as it provides a stable, affordable hedge against the risk of increases in the price of coal, natural gas and other fuels over time. Increasing the use of wind energy also has the implied benefit of lowering overall demand for natural gas, particularly during winter peak demand.
We believe that concern over the recent volatility in fuel prices in the United States, coupled with the country’s significant dependence on fossil fuels, has been and will continue to be a factor in the political and social movement towards greater use of clean energy.
Heightened Environmental Concerns, Creating Legislative and Popular Support to Reduce Carbon Dioxide and Other Greenhouse Gases
The growing concern over global warming caused by greenhouse gas emissions has also contributed to the growth in the wind energy industry. According to the Intergovernmental Panel on Climate Change Fourth Assessment Report, experts have noted that eleven of the last twelve years (1995-2006) rank among the warmest years since 1850. Additionally, the global average sea level has risen at an average rate of 1.8 millimeters per year since 1961 and at 3.1 millimeters per year since 1993, due to the melting of glaciers, ice caps and polar ice sheets, coupled with thermal expansion of the oceans. The importance of reducing greenhouse gases has been recognized by the international community, as demonstrated by the signing and ratification of the Kyoto Protocol, which requires reductions in greenhouse gases by the 177 (as of March 2008) signatory nations. While the United States did not ratify the Kyoto Protocol, state-level initiatives have been undertaken to reduce greenhouse gas emissions. California was the first state to pass global warming legislation, and ten states on the east coast have signed the Regional Greenhouse Gas Initiative, which proposes to require a 10% reduction in power plant carbon dioxide emissions by 2019.
Substituting wind energy for traditional fossil fuel-fired generation would help reduce CO2 emissions due to the environmentally-friendly attributes of wind energy. According to the Energy Information Administration, the United States had the highest CO2 emissions of all countries in the world in 2005, contributing approximately 20% of the world’s CO2 emissions. Since 1990, CO2 emissions from the United States’ electric power industry have increased by a cumulative amount of 27%, from 1.9 billion metric tons to 2.5 billion metric tons.
14
Indexed Electric Power Industry CO 2 Emissions: 1990–2006
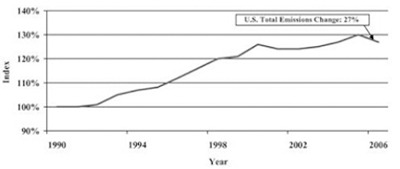
Source: Energy Information Administration
1990: 100% = 1.9 Billion Metric Tons of CO2
Environmental legislation and regulations provide additional incentives for the development of wind energy by increasing the marginal cost of energy generated through fossil-fuel technologies. Such legislation and regulations have been designed to, for example, reduce ozone concentrations, particulate emissions, haze and mercury emissions and can require conventional energy generators to make significant expenditures, implement pollution control measures or purchase emissions credits to meet compliance requirements. These measures have increased fossil fuel-fired generators’ capital and operating costs and put upward pressure on the market price of energy. Because wind energy producers are price takers in energy markets, these legislative measures effectively serve to make the return on wind energy more attractive relative to other sources of generation.
We believe there is significant support in the United States to enact legislation that will attempt to reduce the amount of carbon produced by electrical generators. Although the ultimate form of legislation is still being debated, the two most likely alternatives are (i) a direct emissions tax or (ii) a cap-and-trade regime. We believe either of these alternatives would likely result in higher overall power prices, as the marginal cost of electricity in the United States is generally set by carbon intensive generation assets which burn fossil fuels such as oil, natural gas and coal. As a non-carbon emitter and a market price taker, we are positioned to benefit from these higher power prices.
Regulatory Mandates, Such as State Renewable Portfolio Standard Programs, as Well as Federal Tax Incentives Including Production Tax Credits and Accelerated Tax Depreciation
Growth in the U.S. wind energy market has also been driven by state and federal legislation designed to encourage the development and deployment of renewable energy technologies. This support includes:
|
●
|
Renewable Portfolio Standards. In response to the push for cleaner power generation and more secure energy supplies, many states have enacted renewable portfolio standard programs. These programs either require electric utilities and other retail energy suppliers to produce or acquire a certain percentage of their annual electricity consumption from renewable power generation resources, or, as the case in New York, designate an entity to administer the central procurement of renewable energy certificates for the state. Wind energy producers generate renewable energy certificates due to the environmentally beneficial attributes associated with their production of electricity.
|
The number of states with renewable portfolio standard programs has doubled in the last six years and as of August 2008, 32 states and the District of Columbia had adopted some form of renewable portfolio standard program. The District of Columbia and 26 of the 32 states have mandatory renewable portfolio standard requirements and combined, these 26 states represent over 50% of total U.S. electrical load. A number of states, including Arizona, California, Colorado, Massachusetts, Nevada, New Jersey, New Mexico and Texas have been so successful in meeting their original renewable portfolio standard targets that they have revised their programs to include higher targets. Among the states in which we currently have projects, Texas and Montana have renewable portfolio standards. Other states such as Missouri, North Dakota, South Dakota, Utah, Vermont and Virginia have adopted state goals, which set targets, not requirements, for certain percentages of total energy to be generated from renewable resources. The states that have adopted renewable portfolio standard programs or set state goals, as well as the related requirements or targets, are set forth in the following map.
15
U.S. Renewable Portfolio Standard Programs and Goals for Renewable Energy Generation
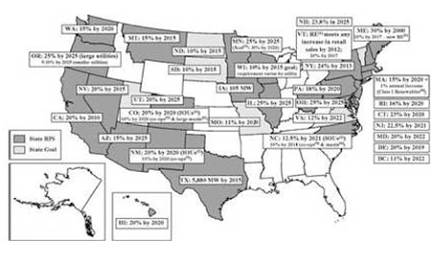
Source: Database of State Incentives for Renewables & Efficiency, August 2008.
|
1.
|
RE – Renewable Energy.
|
|
|
2.
|
IOUs – Investor-Owned Utilities.
|
|
3.
|
Xcel – Xcel Energy, an electric and gas company that operates in the Midwest.
|
|
|
4.
|
Class I Renewables – Electricity derived from solar, wind, wave or tidal action, geothermal, landfill gas, anaerobic digestion, fuel cells using renewable fuels, and certain other forms of sustainable biomass.
|
|
5.
|
Co-op – Customer-owned electric utility that distributes electricity to its members.
|
|
|
6.
|
Munis – Municipalities.
|
|
●
|
Almost every state that has implemented a renewable portfolio standard program will need considerable additional renewable energy capacity to meet its renewable portfolio standard requirements. Much of Emerging Energy Research’s forecasted 50,000 MW of installed wind capacity by 2015 will be driven by current and proposed renewable portfolio standard targets, along with additional demand from states without renewable standards.
|
|
●
|
Renewable Energy Certificates (“RECs”). A renewable energy certificate is a stand-alone tradable instrument representing the attributes associated with one MWh of energy produced from a renewable energy source. These attributes typically include reduced air and water pollution, reduced greenhouse gas emissions and increased use of domestic energy sources. Many states use renewable energy certificates to track and verify compliance with their renewable portfolio standard programs. Retail energy suppliers can meet the requirements by purchasing renewable energy certificates from renewable energy generators, in addition to producing or acquiring the electricity from renewable sources. Under many renewable portfolio standard programs, energy providers that fail to meet renewable portfolio standard requirements are assessed a penalty for the shortfall, usually known as an alternative compliance payment. Because renewable energy certificates can be purchased to satisfy the renewable portfolio standard requirements and avoid an alternative compliance payment, the amount of the alternative compliance payment effectively sets a cap on renewable energy certificate prices. In situations where renewable energy certificate supply is short, renewable energy certificate prices approach the alternative compliance payment, which in several states is in the $50-$59/MWh range. As a result, renewable energy certificate prices can rival the price of energy and renewable energy certificates can represent a significant additional revenue stream for wind energy generators.
|
16
|
●
|
Production Tax Credits. The production tax credit provides wind energy generators with a credit against federal income taxes, annually adjusted for inflation, for a duration of ten years from the date that the wind turbine is placed into service. In 2008, the production tax credit was $20.78/MWh. Wind energy generators with insufficient taxable income to benefit from the production tax credit may take advantage of a variety of investment structures to monetize the tax benefits.
|
The production tax credit was originally enacted in 1992 for wind parks placed into service after December 31, 1993 and before July 1, 1999. The production tax credit subsequently has been extended five times, but has been allowed to lapse three times (for periods of three, six and nine months) prior to retroactive extension. Currently, the production tax credit is scheduled to expire on December 31, 2012, unless an extension or renewal is enacted into law.
|
●
|
Accelerated Tax Depreciation. Tax depreciation is a non-cash expense meant to approximate the loss of an asset’s value over time and is generally the portion of an investment in an asset that can be deducted from taxable income in any given tax period. Current federal income tax law requires taxpayers to depreciate most tangible personal property placed in service after 1986 using the modified accelerated cost recovery system under which taxpayers are entitled to use the 200% or 150% declining balance method depending on the class of property, rather than the straight line method. In addition, under the modified accelerated cost recovery system, a significant portion of wind park assets is deemed to have depreciable life of five years which is substantially shorter than the 15 to 20 year depreciable lives of many non-renewable power supply assets. This shorter depreciable life and the accelerated depreciation method results in a significantly accelerated realization of tax depreciation for wind parks compared to other types of power projects. Wind energy generators with insufficient taxable income to benefit from this accelerated depreciation often monetize the accelerated depreciation, along with the production tax credits, through forming a limited liability company with third parties.
|
Improvements in Wind Energy Technology
Wind turbine technology has improved considerably in recent years with significant increases in capacity and efficiency. Multiple types and sizes of turbines are now available to suit a wide range of wind resource characteristics and landscapes. Modern wind turbines are capable of generating electricity for 20 to 30 years.
There have been two major trends in the development of wind turbines in recent years:
|
●
|
According to the Danish Wind Industry Association and the U.S. Department of Energy, individual turbine capacity has increased dramatically over the last 25 years, with 30 kW machines that operated in 1980 giving way to the 1.5 MW machines that are standard today; and
|
|
●
|
Wind park performance has improved significantly, according to the U.S. Department of Energy, as turbines installed in 2004 through 2006 averaged a 33%-35% net capacity factor (the ratio of the actual output over a period of time and the output if the wind park had operated at full capacity over that time period) as compared to the 22% net capacity factor realized by turbines installed prior to 1998.
|
Additionally, as wind energy technology has continued to improve, according to AWEA, the capital cost of wind energy generation has fallen by approximately 80% over the past 20 years.
17
Increasing Obstacles for the Construction of Conventional Fuel Plants
In addition to the impediments presented by the extensive and growing environmental legislation, new power plants that use conventional fuels, such as coal and nuclear technologies, face a difficult, lengthy and expensive permitting process. Furthermore, increasing opposition from public environmental groups towards coal-fired power plants, coupled with rising construction costs, contributed to the cancellation of many planned coal plants in 2007. According to Resource Media, a public relations firm representing environmental groups in the western United States, the construction of 31 coal-fired plants totaling 24,250 MW was canceled or delayed in 2007. As a result, despite increasing gross margins, only about 2,000 MW of net new capacity from coal and nuclear plants was brought online between 2003 and 2006. Additionally, in October 2007, the Kansas Department of Health and Environment became the first government agency in the United States to cite carbon dioxide emissions as the reason for rejecting an air permit for a proposed coal-fired electricity generating plant, saying that the greenhouse gas threatens public health and the environment. Traditional energy developers and utilities are likely to face similar permitting and restricted supply issues in the future. As a result, alternative energy sources such as wind will need to be developed to meet increasing electricity demand and will be able to capitalize on the resulting higher energy prices.
Abundant Wind Resources in Attractive Energy Markets within the United States
The potential for future growth in the U.S. wind energy market is supported by the large land area available for turbine installations and the availability of significant wind resources. According to AWEA, annual average wind speeds of 11 miles per hour or greater are required for grid-connected wind parks. As shown in the map below, a large portion of the United States exhibits wind speeds sufficient for wind park development.
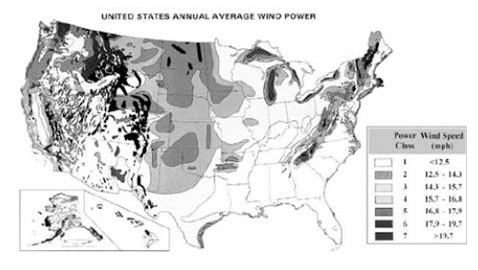
Source: United States Department of Energy—National Renewable Energy Laboratory.
A chart describing the potential for wind power in billions of kWh is included below. Note that according to this source, North Dakota offers the best wind resource in the United States. The wind is exceptional in the Great Plains (and North Dakota especially), the actual installed capacity is minimal. Assuming a net capacity factor of 35%, current North Dakota wind parks only generate a small fraction of the state’s potential output. In fact, even with the projects planned for construction in the next year, less than 1% of potential will be realized.
18
THE TOP TWENTY STATES
for Wind Energy Potential
as measured by annual energy potential in the billions of kWh, factoring in environmental and land use exclusions for wind class of 3 and higher.
|
B kWh/Yr
|
B kWh/Yr
|
|||||||||
|
1.
|
North Dakota
|
1,210
|
11.
|
Colorado
|
481
|
|||||
|
2.
|
Texas
|
1,190
|
12.
|
New Mexico
|
435
|
|||||
|
3.
|
Kansas
|
1,070
|
13.
|
Idaho
|
73
|
|||||
|
4.
|
South Dakota
|
1,030
|
14.
|
Michigan
|
65
|
|||||
|
5.
|
Montana
|
1,020
|
15.
|
New York
|
62
|
|||||
|
6.
|
Nebraska
|
868
|
16.
|
Illinois
|
61
|
|||||
|
7.
|
Wyoming
|
747
|
17.
|
California
|
59
|
|||||
|
8.
|
Oklahoma
|
725
|
18.
|
Wisconsin
|
58
|
|||||
|
9.
|
Minnesota
|
657
|
19.
|
Maine
|
56
|
|||||
|
10.
|
|
Iowa
|
|
551
|
|
20.
|
|
Missouri
|
|
52
|
Source: An Assessment of the Available Windy Land Area and Wind Energy Potential in the Contiguous United States, Pacific Northwest Laboratory, August 1991. PNL-7789
Wind Energy Fundamentals
The term “wind energy” refers to the process used to generate electricity through wind turbines. The turbines convert wind’s kinetic energy into electrical power by capturing it with a three blade rotor mounted on a nacelle that houses a gearbox and generator. When the wind blows, the combination of the lift and drag of the air pressure on the blades spins the blades and rotor, which turns a shaft through the gearbox and generator to create electricity.
Wind turbines are typically grouped together in what are often referred to as “wind parks.” Electricity from each wind turbine travels down a cable inside its tower to a collection point in the wind park and is then transmitted to a substation for voltage step-up and delivery into the electric utility transmission network, or “grid.” Today’s wind turbines can efficiently generate electricity when the wind speed is between 11 and 55 miles per hour.
A key factor in the success of any wind park is the profile and predictability of the wind resources at the site. Extensive studies of historical weather and wind patterns have been performed across North America and many resources, in the forms of charts, graphs and maps, are available to wind energy developers. The most attractive wind park sites offer a combination of land accessibility, power transmission, proximity to construction resources and strong and dependable winds.
When wind energy developers identify promising sites, they perform detailed studies to provide greater certainty with respect to the long-term wind characteristics at the site and to identify the most effective turbine sitting strategy. The long-term annual output of a wind park is assessed through the use of on-site wind data, publicly available reference data and sophisticated software. Wind speeds are estimated in great detail for specific months, days or even hours, and are then correlated to turbine manufacturers’ specifications to identify the most efficient turbine for the site. Additional calculations and adjustments for turbine availability (which is principally affected by planned and unplanned maintenance events), wake effects (wind depletion caused by turbines sited upwind), blade soiling and icing and other factors are made to arrive at an estimate of net expected annual kilowatt hour electricity production at the site.
19
Sources of Revenue for Wind Generators
Wind energy generators primarily derive revenue from three sources:
|
|
Energy sales. Energy sales are derived from the sale of energy into a wholesale market or to a specific customer, such as a utility or power marketer;
|
|
|
Renewable energy certificate sales. In many states, conventional energy producers are required either to produce a certain percentage of their energy from renewable sources or to purchase renewable energy certificates from renewable energy producers. Renewable energy certificates represent the environmental attributes associated with electricity from renewable sources. Renewable energy certificates are a tradable instrument that can be sold separately from the electricity produced by a renewable generation source, thereby providing an additional revenue stream; and
|
|
|
Capacity sales. In some states, but not the states in which we are developing wind parks, payments are made to energy generators, including wind parks, as a market incentive to promote the development and continued operation of capacity sufficient to meet regional load and reserve requirements. Market systems have been established to ensure that generators receive these payments based on their availability to generate electricity. Payments are generally allocated to wind parks based on the previous year’s capacity for the super-peak hours during winter and summer qualifying periods.
|
Crownbutte’s Portfolio Management
We have been involved with all stages of the development process for wind energy projects. We believe this experience has given us knowledge to develop wind energy projects efficiently and effectively. We seek to develop well sited and well planned wind energy projects. Revenues generated in the past from the sale of brown-field and completed projects have been reinvested into our project portfolio by continuing to develop additional projects. Selling developed projects prior to construction provides returns for the capital invested in the development process. However, the sale is a onetime occurrence from the developer’s standpoint, and developing projects just to sell them is a relatively high risk business strategy.
Operating wind projects allows the project owner to receive revenues over the life of a project. We view ownership and operation of wind energy projects as the next step in our expansion strategy. We believe that operational projects will provide the Company with better risk adjusted returns on capital. Ownership may also give us upside potential if electricity prices continue to rise or if the value of an operational wind energy project increases. We anticipate that both of these values will continue to increase over the long term, as they have in the past several years.
The upside potential for ownership in wind energy projects is driven mainly by the price of electricity. A wind energy project receives payment for the power it generates in one of two ways: either through a power purchase agreement (PPA) or selling into an open market for electricity. The PPA is the most common method of power off-take for wind energy projects. The agreements are almost always with a utility and normally require the utility to buy all electricity a project may generate at a set rate. The agreements normally have a price increase every year and can run for up to 20 years. The PPA rates are usually below the market rate for electricity. The guaranteed price that a PPA offers reduces the risk of a project. Additionally projects with PPAs will usually be able to secure higher levels of debt financing and/or lower interest rates on the debt.
In many areas of the country another viable strategy for power off-take is to sell the electricity into a power spot market. Projects that sell electricity in this manner are referred to as “merchant” projects. There are several systems that provide real time and day-ahead spot markets for electricity such as Midwest ISO, PJM, ERCOT and Cal ISO. To decrease risk and increase financing options, some projects will sell into the spot markets but hedge their exposure with electricity futures contracts that trade on exchanges like the NYMEX.
20
Our portfolio of projects is located in the Midwest, and therefore our merchant projects would sell into the Midwest ISO’s spot market. We view selling power from our projects into the MISO market as a better off-take strategy than a PPA. This view is based on the fact that we believe the price of electricity will continue to rise and that a merchant project model will allow us to most effectively participate in upward price movement. The historically increasing costs are reflected in the year-over-year rise in the spot price on the MISO market. As the U.S. continues in recession, all prices in the economy, including the price of electricity, will experience downward pressure. To the extent that Crownbutte intends to use open market venues ( i.e. , the “merchant” markets) to sell power, variability of electricity prices are a risk to profitability in the short term. Over the long term, the demand for electricity is driven by the number of consumers, the numbers of electricity-powered devices employed and the efficiency of those devices.
We continue to identify new green-field sites to build our pipeline of projects. Upon successfully reaching commercial operation with a project, we will continually evaluate the most ideal mix of projects in the portfolio. In the event a buyer is identified and the sale of a project would, in our judgment, provide better returns than operation, the project may be sold off after it is in commercial operation. The sale of projects could be used to assist in the financing of additional projects that may provide higher returns for the Company.
Current Wind Development Projects
We are currently involved in the development of 12 separate wind projects having approximately 638 MW, or more (0 MW currently in operation), of total potential generating capacity. Pertinent information concerning each of the three (3) most advanced wind projects is summarized in greater detail below.
Gascoyne I Wind Park. The Gascoyne I Wind Park project site is an estimated 19.2 MW wind energy project located midway between the larger towns of Bowman and Hettinger, North Dakota, along the Adams and Bowman County line. This project is envisioned to would entail a total of 12 GE type 1.6MW turbines and is scheduled to begin construction in Fall, 2011, subject to project financing and other considerations.
Project Site and Wind Regime. As previously indicated, the Gascoyne I Wind Park project site is located between the towns of Bowman and Hettinger, North Dakota and covers 1,733 acres of contiguous land along a ridge line that has elevations averaging 3000 ft. ASL. The wind resource at the Gascoyne I site is one of the best in the United States with high mean wind speeds, low seasonal variations and low turbulence intensity. Site specific data has been recorded from two towers in the project area, with data beginning in November 2002. This data has been used to calculate the capacity factors based on GE 1.6 SLE turbine’s power curve, and have resulted in a projected approximate 50%+ net capacity factor after subtracting all loss components.
Electric Interconnection and Transmission. It is anticipated that the Gascoyne I Wind Park project will connect to a substation at the south end of the project site feeding into a 115 kV transmission line belonging to Montana-Dakota Utility Company, and which serviced a now closed lignite coal mine, still owned by Westmoreland Coal Company. The interconnection is facilitated by an Interconnection and Operating Agreement under an MISO (Midwest Independent System’s Operator) market.
Electricity Market. The Gacoyne I Wind Park project should be able to sell electricity into the wholesale market as established under PURPA (Public Utility Regulatory Policy Act) requiring system’s owners and system’s operators to create an OATT (open access transmission tariffs). The OATT was established in April 2005 within the MISO (Midwest Independent Systems Operator) footprint. MISO has published that the average wholesale price of electricity (called the LMP = Locational Marginal Price) within their system was at an all time low of $0.035 per KWH in 2010 because of the economic downturn. They have indicated that this price is recovering to an anticipated average of approximately $0.05 per KWH. A further advantage of selling electricity into the LMP is that the power producer maintains control of the Renewable Energy Credits (REC’s). REC’s can be sold even internationally. However, because of the lack of US regulation presently, REC’s have slightly more value than $0.01 per KWH. In areas where there are renewable portfolio standards (California) prices of up to $0.04 per KWH have been discussed. The Company anticipates a low per KW (Kilowatt Hour) combined price (LMP + REC) of $0.45 per KWH.
21
Project Costs and Summary. The Gascoyne project became shovel ready during the period when the major problem within the wind industry was turbine availability. The price of turbines more than doubled within 5 years. However, currently the major setbacks for wind power development are transmission constraints, lack of Power Purchase Agreements (PPAs) and political/regulatory uncertainties.
At the peak of the turbine bottleneck, the installed costs of Gascoyne I was $42 million with a project financial package roughly 1/3 from a tax equity investor using the Production Tax Credit, 1.3 from a private equity investor who would remain long term for a majority of project ownership and 1/3 debt. Presently, in lieu of the Production Tax Credit (PTC), there is a Treasury Grant available which would cover 30% of the installed price. There would be a bridging loan required for the installation of the park. The bridging loan often comes from the BOP (Balance of Plant) contractor who constructs the park based on the engineered specifications and cost analysis from the developer, and whois then compensated from the Treasury Grant once the park is completed. The Company currently has two BOP contractors who have made verbal commitments to provide bridging loan, guarantee the install price and bond their performance at our proforma prices in exchange for a no-bid contract.
Because of the large amount of new turbines literally sitting in the grass without interconnect capability, the cost of Gascoyne is now projected to be approximately $32 million. With 1/3 going to BOP contractor from the Treasury Grant and the remaining funds from debt. The remaining $15 million covers the cost of the turbines, transformers, pad mount transformers, sub-station and HV (hgh voltage) work, sysem’s upgrades, asset assignment, SCADA (systems control and data acquisition) and dVAR (dynamic Volt/Amp regulation).
Project Economics. Confirmed through CCM (Certified Consulting Meterorologist) reports, 12 GE type 1.6 ME SLE turbines will produce nearly 80,500,000 kilowatt hours per year for total revenues of approximately $3.62 million. It is anticipated that the Operations, Maintenance, Park Management, as well as Power Dispatch and Scheduling, will cost $1 million per year. Based on the foregoing, it is anticipated that the Gascoyne I Wind Park project should be able to easily service debt over 15 years at 7.5% interest.
Elgin Wind Project. The Elgin project is a 19.5 MW wind energy project near Elgin, North Dakota and is scheduled to begin construction in Fall, 2011, subject to project financing and other considerations. The Company has structured the project utilizing any of a number of different wind turbines types depending on which provides the most favorable agreement in terms of price, options and delivery schedule.
The project currently includes meteorological data since June of 2002, full land control, and an interconnection queue position with the transmission system operator (MISO) in the final Facility Study. We anticipate completing a turbine supply agreement, power dispatch and scheduling services agreement with Montana-Dakota Utilities and permitting upon finalizing project financing.
Project Site and Wind Regime. The project site is located south of the town of Elgin, North Dakota and consists of 800 acres of contiguous land under lease along a Montana-Dakota Utilities 69 kV transmission line. The wind resource at the Elgin site is one of the best in the United States with high mean wind speeds, low seasonal variations and low turbulence intensity. Site specific data have been recorded from a meteorological towers in the project area since 2002 and have been used to calculate the capacity factors based on a GE 1.5 MW turbine power curve (used as a standard benchmark) and have resulted in a net capacity factor over 40%.
Meteorological towers on the site of the Elgin project are collecting wind speed, direction, and temperature data at three different heights continuously and averaging over 10 minute intervals. These data are then transmitted via the cellular network to a central server where the information is combined with the turbine power curve and the real time (LMP) market price of electricity allowing us to continuously calculate the profit that would be made by a turbine at that location. We have written software which automates this procedure and have analyzed the site since 2005.
22
Electrical Interconnection and Transmission The Elgin project will tap into a new substation on an existing MDU 69 kV transmission line at the site. The interconnection will be facilitated by an Interconnection and Operating Agreement (MISO project G981, Queue 39517-02) and this agreement includes access to MISO's LMP market which establishes the price for generated electricity sold into the grid. The sale of the electricity will be facilitated by an Electricity Dispatch and Scheduling Services Agreement signed between Montana-Dakota Utilities and the Company.
Electricity Market. Elgin is structured as a merchant wind energy project where the generated electricity will be sold into the Midwest ISO (MISO)LMP market via the Open Access Transmission Tariff (OATT) established in response to a Federal Energy Regulatory Commission (FERC) order. Thus, the Company does not require a Power Purchase Agreement (PPA) for the Elgin project.
Zoning and Permitting Permits have been received from the Public Service Commission. Permits from the North Dakota Game and Fish and the State Historical Society are not needed and the FAA permitting is completed with a determination of No Hazzard to air navigation. A building permit from the County Planning and Zoning Commission will be obtained before construction begins.
Cost Summary. The total cost of development for the Elgin park is estimated at $32 million with an expected construction time line spanning five to ten months from ground-breaking. After completion of the construction phase, Crownbutte will be responsible for the management and maintenance of the park with contracted assistance from the turbine supplier as a consequence of their turbine warranty.
Wibaux Wind Project. The Wibaux wind project is a 19.5 MW wind energy project near Wibaux, Montana, and is scheduled to begin construction in Fall, 2011, subject to project financing and other considerations. The Company has structured the project utilizing any of a number of different wind turbines types depending on which provides the most favorable agreement in terms of price, options and delivery schedule.
The project currently includes meteorological data since August of 2007, full land control, and a interconnection queue position with the transmission system operator (MISO) in the final Facility Study. We anticipate completing a turbine supply agreement, power dispatch and scheduling services agreement with Montana-Dakota Utilities and permitting upon finalizing project financing.
Project Site and Wind Regime. The project site is located northwest of the town of Wibaux, Montana and consists of 1190 acres of contiguous land under lease along a Montana-Dakota Utilities 57KV transmission line. The wind resource at the Wibaux site is one of the best in the United States with high mean wind speeds, low seasonal variations and low turbulence intensity. Site specific data have been recorded from a meteorological tower in the project area since 2007 and have been used to calculate the capacity factors based on GE 1.5 MW turbine power curves (used as a standard benchmark) and have resulted in a projected 43% net capacity factor.
Meteorological towers on the site of the park are collecting wind speed, direction, and temperature data at three different heights continuously and averaging over 10 minute intervals. These data are then transmitted via the cellular network to a central server where the information is combined with the turbine power curve and the real time (LMP) market price of electricity allowing us to continuously calculate the profit that would be made by a turbine at that location. We have written software which automates this procedure and have analyzed the site since 2007.
Electrical Interconnection and Transmission. The Wibaux project will tap into a new substation on an existing MDU 57 kV transmission line at the site. The interconnection will be facilitated by an Interconnection and Operating Agreement (MISO project G994, Queue 39538-02) and this agreement includes access to MISO's LMP market which establishes the price for generated electricity sold into the grid. The sale of the electricity will be facilitated by an Electricity Dispatch and Scheduling Services Agreement signed between Montana-Dakota Utilities and the Company.
Electricity Market. Wibaux is structured as a merchant wind energy project where the generated electricity will be sold into the Midwest ISO (MISO) LMP market via the Open Access Transmission Tariff (OATT) established in response to a Federal Energy Regulatory Commission (FERC) order. Thus, we do not require a Power Purchase Agreement (PPA) for this project.
23
Zoning and Permitting. Permitting has been received for County zoning, ND State Historical Society, MT Game and Fish Department, and U.S. Fish and Wildlife Services, as well as the FAA which has given a determination of No Hazard to air navigation.
Cost Summary. The total cost of development for the Wibaux park is estimated at $32 million with an expected construction time line spanning five to ten months from ground-breaking. After completion of the construction phase, the Company will be responsible for the management and maintenance of the park with contracted assistance from the turbine supplier as a consequence of their turbine warranty.
Additional Projects. Notwithstanding the descriptions of the three (3) wind energy projects above, the Company is also involved in the development of an additional nine (9) separate wind projects. For general information concerning all 12 wind projects, see table at the end of section entitled “Environmental Regulation” set forth below.
Recent Developments
Earlier this year, the Company was notified by the Midwest Independent Systems Operator (MISO) that two of our projects, the Elgin, ND project and the Wibaux, MT project, have entered the final facility study stage of the interconnection queue and will obtain interconnection agreements this year. With the Company receiving an interconnection agreement, it should be positioned to obtain financing and begin construction of those projects by the end of 2011, subject to financing. Both of these 20 MW projects qualify for the U.S. Treasury Department renewable energy grant program created by the American Recovery and Reinvestment Act of 2009 (discussed elsewhere in this report), when an interconnection agreement is received, financing obtained, and at least 5% of construction begins before December 31, 2010. The grant amount for most wind projects is equal to 30% of the authorized capital costs of the project.
Regulation
The following is a summary overview of certain applicable regulations in the United States and should not be considered a full statement of the law or all related issues.
Energy Regulation
FPA
Under the Federal Power Act, or “FPA”, the Federal Energy Regulatory Commission (“FERC”) has exclusive rate-making jurisdiction over wholesale sales of electricity and transmission in interstate commerce. The FPA subjects “public utilities” within the meaning of the FPA, among other things, to rate and corporate regulation by FERC. In particular, sellers of electricity at wholesale in interstate commerce and transmitters of electricity in interstate commerce are regulated by FERC with respect to: the review of the terms and conditions of wholesale electricity sales and transmission of electricity; the need to obtain advance approval of certain dispositions of public utility facilities, mergers, purchases of securities of other public utilities, acquisitions of existing generation facilities and changes in upstream ownership interests; the regulation of their borrowing and securities issuances and assumption of liabilities; and the review of interlocking directorates. Future issuances of our equity securities may be subject to FERC approval under Section 203 of the FPA. FERC has authority under Section 206 of the FPA in certain circumstances to order refunds and, under FPA amendments pursuant to the Energy Policy Act of 2005, FERC has expanded authority to assess civil penalties of up to $1 million per day for violations of the FPA. We can offer no assurance that, at some future time, the U.S. Congress will not change the relevant provisions of the FPA, or that FERC will not change its regulations implementing the requirements of the FPA.
24
Wholesale electricity sellers authorized by FERC to sell at market-based rates may obtain waivers or blanket pre-approvals as to certain of the regulatory requirements of the FPA, including waiver of FERC’s accounting regulations and blanket pre-authorization with respect to its regulation of issuances of securities and assumption of liabilities. We can offer no assurance that FERC will not revisit its policies at some future time with the effect of limiting market-based rate authority, regulatory waivers and blanket authorizations. We have been granted market-based rate authority for one project to date and are familiar with the legal procedures and requirements to be granted market-based rate authority. Therefore, we expect our wind parks to be granted market-based rate authority, and as a result, to be permitted to sell electric energy and capacity at market or otherwise negotiated rates. Wind parks with market-based rate authorization are subject to regulation by FERC as a “public utility” pursuant to the FPA. FERC’s orders that grant market-based rate authority reserve the right to revoke or revise that authority if FERC subsequently determines that the market-based rate seller can exercise market power in transmission or generation, create barriers to entry or engage in abusive affiliate transactions. FERC may impose various forms of market mitigation measures, including price caps and operating restrictions, where it determines market power may exist and that the public interest requires such potential market power to be mitigated. Such wind parks are also required to report to FERC any material changes in status that would reflect a departure from the characteristics that FERC relied upon when granting market-based rate authority, make quarterly electronic filings with FERC providing information on sales of electricity and comply with market behavior and manipulation rules. If any of our wind parks were to be unable to obtain, or were to lose once obtained, its market-based rate authority, it would be required to obtain FERC’s acceptance of cost-of-service rate schedules and would become subject to the accounting, record-keeping and reporting requirements that are imposed on utilities with cost-based rate schedules.
In addition to direct regulation by FERC, our wind parks will be subject to rules and terms of participation imposed and administered by regional transmission operators and independent system operators, in particular MISO for our current projects. Although these entities are themselves ultimately regulated by FERC, they can impose rules, restrictions and terms of service on market participants, like our wind parks, that can have a material impact on our business. For example, independent system operators and regional transmission operators may impose bidding and scheduling rules, both to curb market power and to ensure functioning markets. The act of obtaining an Interconnect Agreement with MISO is coincident with obtaining FERC “Notice of Filing” that acknowledges the Interconnect Agreement (see Table below).
FERC rules for the establishment, approval and enforcement of Electric Reliability Standards will require each of our wind parks to register with the North American Electric Reliability Council and the regional Electric Reliability Organization. We are also required to comply with applicable Reliability Standards approved by FERC.
PUHCA and PURPA
The Public Utility Holding Company Act of 2005, or “PUHCA,” in relevant part, provides that any entity that owns, controls or holds power to vote 10% or more of the outstanding voting securities of a “public utility company” (which is defined to include an “electric utility company”) or a company that is a “holding company” of a public utility company or public utility holding company, is subject to certain regulations granting FERC access to books and records and oversight over certain affiliate transactions. State regulatory commissions may in some instances also have access to books and records of holding companies. Entities that are holding companies solely by virtue of their ownership of “qualifying facilities” (or QF) pursuant to the Public Utility Regulatory Policies Act, or PURPA, and “exempt wholesale generators” are exempt from FERC access to books and records under PUHCA.
In order to obtain exempt wholesale generator status pursuant to PUHCA, the owner of a generating facility must demonstrate that it is engaged directly, or indirectly through one or more affiliates, and exclusively in the business of owning and/or operating facilities used exclusively for the generation of electricity for sale at wholesale.
25
In order to obtain qualifying facility status, a generating facility must qualify as a small power production facility or cogeneration facility that has either filed a self-certification of qualifying facility status with, or has received a qualifying facility certification order from, FERC. A wind generation facility may qualify as small power production qualifying facility if it is less than 80 MW. Certain QFs, including renewable energy facilities with a generating capacity of 30 MW or less, are exempt from certain provisions of the FPA, including the accounting and reporting requirements, and mergers and acquisitions oversight, facility disposition regulations and several other provisions of the FPA. Additionally, renewable energy facilities with a generating capacity of 30 MW or less are exempt from FERC’s ratemaking authority under the FPA. A QF has the right to require an electric utility to interconnect it to the utility’s electric system, and to purchase firm power service, back-up power and supplementary power from that interconnected electric utility at reasonable and non-discriminatory rates. Finally, a QF is exempt from the laws of the states, which otherwise regulate the ownership, rates and terms of sales, corporate governance and financing of electric utilities.
We intend that each of our wind parks will file a self-certification with the FERC that it is an exempt wholesale generator. As a result, under current federal law, we would not be subject to regulation as a holding company under PUHCA and would not be subject to this regulation as long as each “public utility company” in which we have an interest is (i) a QF, (ii) an exempt wholesale generator (“EWG”) or (iii) subject to another exemption or waiver. However, there can be no assurance that applicable law will not change.
State Regulation
Some of our wind parks will be subject to varying degrees of regulation by state public utility commissions. State public utility commissions have historically had broad authority to regulate both the rates charged by, and the financial activities of, electric utilities that sell electricity at retail, and a number of other matters relating to electric utilities, as described below. State laws may also impose certain regulatory and reporting requirements on other owners and operators of generation facilities. Independent power producers are considered to be public utilities in some states and are subject to varying degrees of regulation by state public utility commissions, ranging from a requirement to obtain a “certificate of public convenience and necessity” in order to construct and operate a generating facility, to regulation of organizational, accounting, financial and other corporate matters. While FERC has exclusive jurisdiction over the rates for wholesale sales of electric energy, states may assert jurisdiction over the location and construction of electric generating facilities, and in certain situations, over the issuance of securities and the sale or other transfer of assets by these facilities.
County Regulation
All projects in our development pipeline will, before construction can begin, require approval from the zoning boards of the relevant county governments in which the parks are located. When appropriate in the development timeline ( i.e. , before construction is to begin), we obtain the necessary zoning/conditional use permits (see Table below).
Historical Societies
Permits or licenses are not required for construction of wind parks, but if items of archaeological interest are discovered during construction, then there is a risk of delays or outright stoppages while the findings are investigated. To reduce or eliminate the risk of such findings, it is appropriate to conduct literature searches regarding the history of the specific sites under development. Crownbutte makes it a practice to conduct such literature surveys and to obtain letters certifying that such due diligence had been conducted (see Table below).
Federal Aviation Administration and North Dakota Aeronautics Commission
This regulatory dimension focuses on the potential safety-related impact of wind park development on regional and local air traffic, whether commercial, military, or private, regarding the projected siting of wind parks in relation to their proximity to airports and air traffic corridors. Based on the latitude and longitude of each park, the FAA or NDAC may make a “Determination of No Hazard” on flight paths for wind towers erected at that location. Crownbutte endeavors to secure such letters for all of its sites (see Table below).
26
Environmental Regulation
Our wind park development activities are not at this time subject to specific environmental laws or regulations in the State of North Dakota, including environmental impact review requirements and regulations governing the discharge of fill materials into protected wetlands. Occasionally, letters certifying “no impact” may be obtained as a show of good faith on the part of developers that appropriate due diligence was performed at the time of site selection (see Table below). Where possible, Crownbutte seeks to obtain such letters to certify “no impact.” However, there can be no assurances that there will not be new regulations passed in the future. In the State of New York, for example, the State Environmental Quality Review Act requires a wind developer to evaluate the potential environmental impacts caused by wind parks, including assessments of visual and noise impacts, effects on wildlife (primarily birds and bats) and impacts to historical and cultural resources, and to implement measures to mitigate those impacts to the extent practicable.
Local laws may in the future also regulate other aspects of our wind park development and operation, by setting limits on the use of local roads, setback requirements and noise standards. If we fail to comply with these possible future requirements, or with other regulatory standards, we may be denied permits that are required for construction or operation or become subject to regulatory enforcement actions. Project opponents frequently use environmental impact review statutes as a basis for mounting legal challenges to the issuance of permits and approvals. Legal challenges or enforcement actions, even if ultimately defeated, can result in substantial delays in the completion of a wind park and may have a material adverse effect on our business, results of operations and financial condition.
Our wind parks are designed to have minimal operational impact on the environment. Operation of a wind park does not produce significant wastes, generate air emissions or result in wastewater discharges. While most environmental regulatory obligations arise during or prior to the construction stage for some wind parks, significant environmental obligations may still exist even after construction is complete. For example, wind parks in New York are obligated to monitor impacts on avian species and to adopt mitigating measures if we detect substantial impacts. In most cases, the precise nature of this potential mitigation is not specified in the wind parks’ permits. While we do not currently anticipate that such regulation will be adopted in the State of North Dakota, we cannot offer any assurance that they will not, or that the mitigation will not have an adverse effect on our business, results of operations or financial condition.
|
LETTERS OF ”NO HAZARD” or ”NO IMPACT”
|
||||||||||||||||
|
Project
|
County
|
State
|
Zoning/
Cond Use
|
FERC Notice of
Filing
|
FAA/ NDAC
|
State Hist Society
|
State Game &
Fish
|
Fed. Fish &
Wildlife
|
||||||||
|
Gascoyne I
|
Bowman
|
ND
|
Complete
|
Complete
|
Complete
|
Complete
|
Complete
|
Complete
|
||||||||
|
Gascoyne II
|
Bowman/Adams
|
ND
|
Not yet applied
|
Not yet applied
|
Pending
|
Pending
|
Pending
|
Pending
|
||||||||
|
New England
|
Hettinger
|
ND
|
Not yet applied
|
Not yet applied
|
Pending
|
Complete
|
Pending
|
Pending
|
||||||||
|
Elgin
|
Grant
|
ND
|
Complete
|
Not yet applied
|
Complete
|
Complete
|
Complete
|
Complete
|
||||||||
|
Wibaux
|
Wibaux
|
MT
|
n/a
|
Not yet applied
|
Complete
|
n/a
|
Complete
|
Complete
|
||||||||
|
Berthold
|
Ward
|
ND
|
Not yet applied
|
Not yet applied
|
Pending
|
Complete
|
Pending
|
Pending
|
||||||||
|
Carson
|
Grant
|
ND
|
Not yet applied
|
Not yet applied
|
Pending
|
Complete
|
Pending
|
Pending
|
||||||||
|
Monarch
|
Fallon
|
MT
|
n/a
|
Not yet applied
|
Pending
|
n/a
|
Pending
|
Pending
|
||||||||
|
Tappen
|
Kidder
|
ND
|
Not yet applied
|
Not yet applied
|
Pending
|
Complete
|
Pending
|
Pending
|
||||||||
|
Mobridge
|
Campbell
|
SD
|
Not yet applied
|
Not yet applied
|
Pending
|
Not yet applied
|
Pending
|
Pending
|
||||||||
|
Scobey
|
|
Daniels
|
|
MT
|
|
Not yet applied
|
|
Not yet applied
|
|
Pending
|
|
Not yet applied
|
|
Pending
|
|
Pending
|
|
Big Sandy
|
Chouteau
|
MT
|
Not yet applied
|
Not yet applied
|
Pending
|
Not yet applied
|
Pending
|
Pending
|
||||||||
27
Competition
In the United States, large utility companies dominate the energy production industry and coal continues to be the primary resource for electricity production. Electricity generated from wind energy faces competition from other traditional resources such as coal, hydro, natural gas and nuclear power. We expect that the primary competition for the wind power industry will continue to come from utility company producers of electricity generated from coal and other non-renewable energy sources. Also, as the relative advantages or disadvantages of wind over fossil fuel-based generation are resolved over time, and potential legislation regimes arise, it is likely that the utilities themselves will elect to develop wind power assets themselves.
Non-utility entrants in the wind power development market, however, face certain barriers to entry. The capital cost of buying and maintaining turbines are high. Other significant factors include the cost of land control and/or acquisition, the availability of transmission lines and the cost to tie into those lines, land use considerations and the environmental impact of construction and operations. Finally, another critical barrier to entry into the wind power development business is the necessary experience required to bring project to the point where they are able to secure interconnection agreements, power purchase agreements and project financing for construction.
While we are aware of several other companies that are working to develop medium size wind energy projects, none of these companies are currently directly competing with us in the geographic areas in which we are active.
Employees
We currently have no employees and have four consultants managing the business. We do not have any collective bargaining agreements with our employees and consider our employee relations to be good.
Patents and Trademarks
We have no trademarks or other proprietary rights registered with the United States Patent and Trademark Office.
Item 2: Description of Property
We generally do not own the property underlying our wind parks. Instead, we usually obtain easements from the landowners that give us the right to install our meteorological equipment, turbines, transmission lines and related equipment and prohibit the landowners from building other structures that would interfere with the operation or maintenance of the wind park. The terms of the easement agreements vary, but usually cover a development period, a construction period and a 20-year operational period, with our option to extend the operational period for an additional 30 years. Our easement agreements generally obligate us to make payments to the landowner based on revenues to be generated from assets located on the landowner’s property. During the construction phase of a particular wind park, we may acquire land for the siting of facilities needed by the transmission system operator to accommodate the wind park; we typically transfer these real estate interests to the transmission system operator once construction of the wind park is complete.
The land control agreements for our projects in development start as a lease option. The provisions of our land leases are substantially similar for all of our land-control contracts—both Lease Option Agreements and Lease Agreements. We will trigger the shift from lease option agreement to lease agreement when construction on a project begins. We have no leases currently, only lease options. Specific terms for individual landowners may differ occasionally, but none of our current leases options differs significantly from the general structure, which is summarized here:
28
|
Option Agreement
|
Lease Agreement
|
|||
|
Term:
|
5 years
|
40 years
|
||
|
Annual Payment:
|
$400/section
|
$2,500 per turbine plus
|
||
|
(640 acres)
|
$1,000 per MW nameplate capacity
|
The lease option agreement provides us with the right to conduct wind studies, access the land, install meteorological towers and begin the permitting process with the landowners’ cooperation. The term of the option agreement is five years. We have a right of first refusal on other land owned by the landowner within one half mile of the proposed site. We pay the landowner at a rate of $100 per quarter-section of land (160 acres) annually, as well as a one-time payment for any crop loss.
Once the option to lease the land is exercised, the lease lays out the permitted uses of the property, which include wind resource evaluations, wind energy conversion systems, transmission facilities, waiver of setback and meeting with the owner. It also gives us the right to travel across the land, as well as to use access routes available. The lease prohibits the landowner from constructing any building on the land without prior approval, to prevent the obstruction of the wind.
The term of the lease is forty years from the date it is the lease option exercised, and we have the right to terminate the lease with 30 days notice, as can the landowner, but only if there are no improvements built for the wind park.
We pay the landowner annually $2,500 per turbine plus $1,000 per megawatt of nameplate capacity. If there are no turbines on the land, but there are improvements made, such as underground lines or roads, the landowner will receive a one-time payment of $2 per foot of underground improvement and $3 per foot of above ground improvement. The increase in real estate taxes caused by the increased value of the land due to turbines will be paid by us, while the original value of the real estate taxes will be paid by the landowner. Conservation Reserve Program (CRP) lands will be released from the CRP program if necessary, and we will pay any applicable fees/fines and will compensate the landowner for the loss of income through a one-time payment. Crop loss is also covered by using a calculation of current market price, number of acres damaged and average yield on the land. In addition, Crownbutte is required to maintain $1,000,000 in liability insurance.
Crownbutte may elect to make debt payments on behalf of the landowner in order to preserve its rights in the land by preventing foreclosure by a lender. The Company’s lease payment obligations would be offset by the amount of any such debt payment.
We also have the right to encumber our interests with debt to finance the wind park. We have the obligation to return the land to its original condition at the end of the lease term by removing all turbines and removing concrete down to four feet below the surface of the soil.
Description of Corporate Offices
We lease our corporate offices (approximately 3,000 square feet) at 111 5th Avenue NE, Mandan, ND 58554. The current lease for our office space is month-to-month, with a monthly rent of $1,500. We believe that our current facilities are adequate for our operations as currently conducted and if additional facilities are required, that we could obtain them at commercially reasonable prices. Once we have owned projects in operation, we will also require on-site project office space, which we intend to lease in the form of office trailers or existing built out space.
29
Item 3: Legal Proceedings
From time to time, we may become involved in various lawsuits and legal proceedings which arise in the ordinary course of business. However, litigation is subject to inherent uncertainties, and an adverse result in these or other matters that may arise from time to time that may harm business.
Except for the matter described below, other than routine litigation arising in the ordinary course of business that we do not expect, individually or in the aggregate, to have a material adverse effect on us, there is no currently pending legal proceeding and, as far as we are aware, no governmental authority is contemplating any proceeding to which we are a party or to which any of our properties is subject.
Settlement)
Centre Square Capital Arbitration Matter.
On August 19, 2008, Centre Square Capital, LLC filed a claim with the American Arbitration Association in the amount of $3,000,000 plus attorneys’ fees, interest, and arbitration costs in a demand for arbitration, claiming that the Company has not compensated it for introducing the Company to the firm that identified the Company’s private placement investors in March 2008 and thereafter. The Company maintained that the agreement pertained only to funds raised as a result of business with the People’s Republic of China. On March 16, 2009, the arbiters dismissed the plaintiff’s claim and awarded the Company reimbursement of all attorney fees and costs related to the claim. A reimbursement of approximately $129,227 is payable to the Company.
As of the date of this report and as disclosed in the accompanying notes to consolidated financial statements as of December 31, 2010 and 2009, the Company has received $0 of the damages awarded on March 16, 2009. We believe there will be no recovery of this award.
StradleyLitigation Matter.
Subsequent to the damages award, the Company was threatened with litigation over non-payment of attorney fees related to the defense asserted on the Company’s behalf in the Centre Square Capital arbitration matter. On November 3, 2009, the Company was served with a lawsuit filed in the Philadelphia County Court of Common Pleas by the law firm of Stradley, Ronon, Stevens & Young, LLP (“Stradley”), seeking to recover $93,526 plus interest, attorneys’ fees, and costs. On December 14, 2009, the Company received a Notice of Intent to Take Default Judgment for the unpaid balance of $93,526.
As a result of certain payments, the amount owed to Stradley was reduced to $73,526. On March 9, 2011, a Consent Judgment was filed in the pending litigation providing for entry of judgment against the Company in the amount of $73,526. Thereafter, on March 23, 2011, a Forbearance Agreement was entered into between the Company and Stradley pursuant to which the Company agreed to make monthly payments to Stradley of $3,500 commencing on the execution of the Forbearance Agreement and the 30th day of each month thereafter in exchange for Stradley’s forbearance from executing on the Consent Judgment. In addition, the Company agreed to (a) increase the payments to $7,000 per month commencing on the next payment date after the Company is successful in receiving any funds in excess of $500,000 for project development, and (b) the issuance of 500,000 shares of the Company’s common stock which, upon being registered, could be sold by Stradley with the net sales proceeds being applied to reduce the amount due from the Company. If any payments or the shares are not timely delivered, Stradley may immediately, without notice or demand, institute and otherwise pursue any and all actions, rights and remedies arising from, or related to, the Consent Judgment.
If the Company should default and be unable to make scheduled payments under the terms of the Forbearance Agreement, Stradley will have the right and ability to execute on the Consent Judgment entered against the Company. Should Stadley do so, the only liquid assets currently available to satisfy the judgment are the Company’s interconnect application deposits for Wibaux and Elgin. Forfeiture of the deposits would significantly impair the status of our project queue positions. Loss of queue position may require new applications, additional deposits and development costs, and several years to obtain shovel-ready status for these two projects.
30
Item 4: (Removed and Reserved)
Market Information and Holders
Since December 2, 2009, our common stock has been quoted on the OTCBB under the trading symbol “CBWP.OB.” Through December 1, 2010, trades of our common stock were reported on the Pink Sheets (www.pinksheets.com) under the symbol “CBWP.PK.” The last reported sale price of our common stock on the OTCBB on April 14, 2010 was $0.29.
The following table sets forth, for each of the periods indicated below, the range of high and low bid prices for our common stock, as reported by the OTCBB and/or the range of high and low closing quotations for our common stock, as reported by Pink OTC Markets Inc. on its web site located at www.pinksheets.com. The quotations reflect inter-dealer prices, without retail mark-up, mark-down or commission and may not represent actual transactions. Our common stock is thinly traded and, thus, pricing of our common stock as reported by Pink OTC Markets, Inc. not necessarily represent its fair market value. The closing bid price on April 13, 2011 was $0.14.
|
High
|
Low
|
|||||||
|
Year Ended December 31, 2009
|
||||||||
|
First Quarter
|
$
|
4.40
|
$
|
0.50
|
||||
|
Second Quarter
|
0.55
|
0.05
|
||||||
|
Third Quarter
|
0.55
|
0.06
|
||||||
|
Fourth Quarter
|
0.36
|
0.11
|
||||||
|
Year Ended December 31, 2010
|
||||||||
|
First Quarter
|
$
|
0.98
|
$
|
0.15
|
||||
|
Second Quarter
|
0.29
|
0.08
|
||||||
|
Third Quarter
|
0.29
|
0.03
|
||||||
|
Fourth Quarter
|
0.07
|
0.02
|
||||||
As of April 13, 2011, there were approximately 74 holders of record of shares of our common stock. There are no outstanding shares of our preferred stock.
Dividends
During the last two fiscal years, we have not declared or paid cash dividends on our equity securities. We do not intend to pay cash dividends on our common stock for the foreseeable future, but currently intend to retain any future earnings to fund the development and growth of our business. The payment of dividends, if any, on the common stock will rest solely within the discretion of our Board of Directors and will depend, among other things, upon our earnings, capital requirements, financial condition, and other relevant factors.
31
Recent Sales of Unregistered Securities
On February 22, 2010, we closed a private placement offering involving an aggregate of 499,999 units of our securities at a purchase price of $0.35 per unit, for an aggregate cash consideration of $175,000, before deducting offering costs. Each unit consisted of (i) one share of our common stock, (ii) a warrant to purchase one share of our common stock, exercisable for a period of four years at an exercise price of $1.50 per share, and (iii) a warrant to purchase one share of our common stock, exercisable for a period of four years at an exercise price of $2.50 per share.
The private placement offering was conducted pursuant to an exemption from the registration requirements of the federal securities laws provided by Regulation D and Regulation S promulgated under the Securities Act and Section 4(2) of the Securities Act. The common stock was offered and sold only to “accredited investors,” as that term is defined by Rule 501 of Regulation D, and/or to persons who were neither resident in, nor citizens of, the United States. No commissions were paid in connection with the offering.
On March 29, 2010, the Company issued a total of 400,000 shares of common stock in exchange for short-term loans from two of the Company’s stockholders. Terms of the loans are $100,000 payable in 60 days for 150,000 shares of common stock in lieu of interest, and $100,000 payable in 60 days for 250,000 shares of common stock in lieu of interest. Principal payments on both loans were due June 7, 2010. Our issuance of the shares in connection with the promissory notes was not registered under the Securities Act in reliance upon the exemption from registration provided by Section 4(2) of the Securities Act, which exempts transactions by an issuer not involving any public offering.
Securities Authorized for Issuance under Equity Compensation Plans
The following table contains information with respect to equity compensation as of the end of our fiscal year ended December 31, 2010.
Equity Compensation Plan Information
|
Plan Category
|
Number of securities to be issued upon exercise of outstanding options, warrants and rights
|
Weighted-average exercise price of outstanding options, warrants and rights
|
Number of securities remaining available for future issuance under equity compensation plans
|
|||||||||
|
Equity compensation plans approved by security holders
|
― | N/A | ― | |||||||||
|
Equity compensation plans not approved by security holders
|
12,000,000 | 0.02 | --- | |||||||||
|
Total
|
― | N/A | --- | |||||||||
On December 9, 2010, the Company’s Board of Directors authorized the issued of warrants to three Company employees and executives. The warrants consist of options to purchase 12,000,000 shares of the Company’s common stock at $0.02 per share exercisable for a period of five years. The warrants vested immediately. See “Executive Compensation” for further information regarding individual equity compensation arrangements received by our executive officers.
32
Purchases of Equity Securities
Not applicable.
Item 6: Selected Financial Data
We are not required to provide any selected financial data since we qualify as a “smaller reporting company.”
Plan of Operation
We have had limited revenues since our inception, and, accordingly, have incurred losses from our operations. For the year ended December 31, 2010, we incurred net losses of $(2,279,911) and have an accumulated deficit since inception of $(7,818,986). We currently have no revenues. The potential future revenues we expect from our wind power generation projects, will not be generated until sometime after the end of our current year, December 31, 2011, perhaps longer, and will require the expenditure of additional capital, obtaining of construction and project debt financing and establishing turbine supply relationships.
For the foreseeable future, our operating plan is dependent upon both the ability to conserve existing cash resources and the ability to obtain additional capital through equity financing and/or debt financing in an effort to provide the necessary funds and cash flow to meet our obligations on a timely basis and to support our wind power project development activities. In the event that we are unable to conserve existing cash resources and/or obtain the additional and necessary capital, we may have to cease or significantly curtail our operations. This could materially impact our ability to continue operations.
Liquidity and Capital Resources
The accompanying financial statements have been prepared on a going concern basis, which contemplates the realization of assets and satisfaction of liabilities in the normal course of business. Since our inception, we have had limited revenues, and, accordingly, have incurred losses from our operations. For the year ended December 31, 2010, we incurred net losses of $(2,279,911) and have an accumulated deficit since inception of $(7,818,986). We currently have no revenues. The potential future revenues we expect from our wind power generation projects, will not be generated until sometime after the end of our current year, December 31, 2011, and will require the expenditure of additional capital, obtaining of construction and project debt financing and establishing turbine supply relationships. These factors, among others, indicate that we may be unable to continue as a going concern for a reasonable period of time
As of December 31, 2010, we had current assets of $668 and working capital deficit of $1,254,334. This compares to cash of $17,322 and a working capital deficit of $652,292 at December 31, 2009. Based on commitments arising from our consulting agreements and other general and administrative expenses, we anticipate that operating expenses during each succeeding quarter will be, at a minimum, approximately $75,000. This amount does not include any capital requirements for our wind energy projects or project development costs which may be incurred. Based on the foregoing, we will not have sufficient cash resources to finance our operations except for several months unless we are able to raise additional equity financing and/or debt financing in the immediate future. We have commenced, and will continue to pursue, efforts to raise additional equity financing and/or debt financing from a variety of sources and means. There are no assurances that we will be able to obtain any additional financing and/or equity and, even if obtained, that such financing will be in a sufficient amount to be able to continue operations for a sufficient period until one or more of our wind power generation facilities become operational or until we can generate sufficient revenues to be profitable.
33
Additional Financings
We completed the following financings during the fiscal year ended at December 31, 2010.
Private Placement of Common Stock. On February 22, 2010, the Company proceeded with a private placement transaction to offer investors a minimum of $150,000 (428,571 shares) and a maximum of $700,000 (2,000,000 shares) of our common stock at $0.35 per share. Each share sold included one warrant to purchase one share of the Company’s common stock, exercisable for a period of four years, at an exercise price of $1.50 per share, and one warrant to purchase one share of common stock, exercisable for four years, at an exercise price of $2.50 per share. The Company issued 499,999 shares and 999,998 warrants in exchange for sale proceeds of $175,000.
On February 24, 2010, a $20,000 short-tem note payable to StarInvest Group, Inc.was converted to common stock under the private placement. A total of 57,142 shares and 114,284 warrants were issued.
Shareholder and Other Loans. In late March, 2010, the Company issued a total of 400,000 shares of common stock in exchange for short-term loans from two of the Company’s shareholders. Terms of the loans were $100,000 payable in 60 days for 150,000 shares of stock in lieu of interest and $100,000 payable in 60 days for 250,000 shares of stock in lieu of interest. Principal payments on both loans were due on June 7, 2010. As of December 31, 2010, these loans were outstanding and are now past due.
In June, 2010, the Company issued 250,000 shares of common stock to Gottbetter Capital Group, Inc. in exchange for a $25,000 short-term loan. Interest expense totaling $35,000 was recorded for the shares issued. For further information on this loan, see Note 7 to the financial statements dated December 31, 2010 included in this Annual Report.
Warrants Exercised. On July 14, 2010, the Cmpany issued 20,000 shares of common stock for a warrant exercised at $0.24 per shares pursuant to a warrant modification offer made in June, 2010. Proceeds received by the Company totaled $4,800.
On July 29, 2010, the Company issued 2,000,000 shares of common stock for a warrant exercised at $0.001 per share. Proceeds received by the Company totaled $2,000.
Results of Operations for the year ended December 31, 2010 compared to December 31, 2009
We generated no revenues frm our operations for the twelve months ended December 31, 2010 and for the twelve months ended December 31, 2009.
Our total operating expenses increased $107,852 (5.7%)from $1,880,785 in the year ended December 31, 2009 (2009) to $1,998,637 in the year ended December 31, 2010 (2010). Our operating expenses included $1,204,169 in wind project development expenses, an increase of $517,401 (75.3%), when compared to $686,768 reported in 2009. This increase in operating expense was offset by an increase of $143,519 (7.9%) from $1,828,235 in general and administrative expense for 2009 as compared to $1,971,754 reported in 2010. Our general and administrative expenses included a decrease in executive compensation of $709,250 (69.7%) from $1,018,000 in 2009 as compared to $308,750 reported in 2010; a decrease in marketing expenses of 29,548 (40.9%) from $72,319 in 2009 as compared to $42,771 reported in 2010; and an increase in legal and professional fees of $168,722 (44.6%) to $378,700 in 2010 as compared to $209,928 reported in 2009.
Our net other expenses/income for 2010 were ($291,274) compared to ($57,613) reported for 2009, an increase of $233,661. Our other expenses included an increase in interest expense of $287,680 to $291,774 for 2010 as compared to $4,094 reported in 2009; bad debt expense of $0 for 2010 as compared to $1,722 for 2009; and a loss on the sale of assets in the amount of $0 for 2010 and $18,369 for 2009. Our other income consists of interest income of $0 for 2010 compared to interest income of $935 for 2009; other income of $500 for 2010 compared to $60,772 for 2009; and a gain on the sale of assets in the amount of $8,882 for 2010 compared to $0 for 2009.
34
Capital Structure and Resources
The Company has accrued significant liabilities and had a working capital deficit of $1,254,334 as of December 31, 2010. In 2010, cash in operations decreased $132,872 (23.7%) to $428,003 compared to $560,875 for 2009. The decrease in cash used for 2010 is mainly due to large increases in accounts payable and accrued liabilities for 2010.
Future efforts to generate positive cash flow depend on Crownbutte’s success in selling development rights to parks in the short term, and constructing wind parks to generate electricity sales in the long term. Cash flows from investing activities for 2010 totaled $32,288 compared to $169,471 of cash used in investing activities in 2009. The decrease in cash from investing from 2010 to 2009 is related to redemption of certificates of deposit totaling $152,030 and sales of fixed assets compared to receipts of $32,288 from the sale of fixed assets in 2009.
Cash flows from financing activities increased $274,388 (264%) to $378,411 for 2010 as compared to $104,023 in 2009. Sources of cash for 2010 included proceeds from the sale of stock in the amount of $179,754, $2,000 from the exercise of warrants, $205,000 from stockholder loans and repayments of $8,389 on an officer loan. Sources of cash for 2009 included officer loan proceeds of $44,380, stockholder loans of $20,000 and proceeds from the exercise of warrants totaling approximately $40,000.
Off Balance Sheet Arrangements
We have no significant off balance sheet transactions, arrangements or obligations.
Some of the statements in this report are “forward-looking statements.” These forward-looking statements involve certain known and unknown risks, uncertainties and other factors which may cause our actual results, performance or achievements to be materially different from any future results, performance or achievements expressed or implied by these forward-looking statements. These factors include, among others, the factors set forth above under “Risk Factors.” The words “believe,” “expect,” “anticipate,” “intend,” “plan,” and similar expressions identify forward-looking statements. We caution you not to place undue reliance on these forward-looking statements. We undertake no obligation to update and revise any forward-looking statements or to publicly announce the result of any revisions to any of the forward-looking statements in this document to reflect any future or developments. However, the Private Securities Litigation Reform Act of 1995 is not available to us as a penny stock issuer and thus we may not rely on the statutory safe harbor from liability for forward-looking statements. Further, Section 27A(b)(2)(D) of the Securities Act and Section 21E(b)(2)(D) of the Securities Exchange Act expressly state that the safe harbor for forward looking statements does not apply to statements made in connection with this offering.
35
Item 8: Financial Statements
Our financial statements are stated in United States dollars (US$) and are prepared in accordance with United States Generally Accepted Accounting Principles.
The following consolidated financial statements are filed as part of this annual report:
INDEX TO FINANCIAL STATEMENTS
|
Page
|
||
|
Report of Independent Registered Public Accounting Firm – MaloneBailey LLP
|
F-2
|
|
|
Report of Independent Registered Public Accounting Firm – Sherb & Co., LLP
|
F-3
|
|
|
Consolidated Balance Sheets as of December 31, 2010 and 2009
|
F-4
|
|
|
Consolidated Statements of Operations for the years ended December 31, 2010 and 2009
|
F-5
|
|
|
Consolidated Statement of Changes in Stockholders’ Deficit for the years ended December 31, 2010 and 2009
|
F-6
|
|
|
Consolidated Statements of Cash Flows for the years ended December 31, 2010 and 2009
|
F-7
|
|
|
Notes to Consolidated Financial Statements
|
F-8
|
F-1
REPORTS OF INDEPENDENT REGISTERED PUBLIC ACCOUNTING FIRM
To the Stockholders and Board of Directors
Crownbutte Wind Power, Inc.
Mandan, ND
We have audited the accompanying consolidated balance sheets of Crownbutte Wind Power, Inc. as of December 31, 2010 and the related consolidated statements of operations, stockholders’ deficit and cash flows for the year then ended. These consolidated financial statements are the responsibility of the Company’s management. Our responsibility is to express an opinion on these financial statements based on our audit.
We conducted our audit in accordance with the standards of the Public Company Accounting Oversight Board (United States). Those standards require that we plan and perform the audit to obtain reasonable assurance about whether the financial statements are free of material misstatement. The Company is not required to have, nor were we engaged to perform, an audit of its internal control over financial reporting. Accordingly we express no such opinion. An audit includes examining, on a test basis, evidence supporting the amounts and disclosures in the financial statements. An audit also includes assessing the accounting principles used and significant estimates made by management, as well as evaluating the overall financial statement presentation. We believe that our audits provide a reasonable basis for our opinion.
In our opinion, the financial statements referred to above present fairly, in all material respects, the financial position of Crownbutte Wind Power, Inc. as of December 31, 2010 and the results of their operations and their cash flows for the year then ended, in conformity with accounting principles generally accepted in the United States of America.
The accompanying consolidated financial statements have been prepared assuming that the Company will continue as a going concern. The Company has incurred significant losses as more fully described in Note 2. These issues raise substantial doubt about the Company’s ability to continue as a going concern. Management’s plans in regard to these matters are also described in Note 2. The consolidated financial statements do not include any adjustments that might result from the outcome of this uncertainty.
|
MALONE & BAILEY, LLP
|
|
|
www.malone-bailey.com
|
|
|
Houston, Texas
|
|
|
April 15, 2011
|
|
F-2
REPORT OF INDEPENDENT REGISTERED PUBLIC ACCOUNTING FIRM
To the Stockholders and Board of Directors
Crownbutte Wind Power, Inc.
Mandan, ND
We have audited the accompanying consolidated balance sheet of Crownbutte Wind Power, Inc. as of December 31, 2009 and the related consolidated statements of operations, stockholders’ equity and cash flows for the year then ended. The consolidated financial statements are the responsibility of the Company’s management. Our responsibility is to express an opinion on the financial statements based on our audit.
We conducted our audit in accordance with the standards of the Public Company Accounting Oversight Board (United States). Those standards require that we plan and perform the audit to obtain reasonable assurance about whether the financial statements are free of material misstatement. The Company is not required to have, nor were we engaged to perform, an audit of its internal control over financial reporting. Accordingly we express no such opinion. An audit includes examining, on a test basis, evidence supporting the amounts and disclosures in the financial statements. An audit also includes assessing the accounting principles used and significant estimates made by management, as well as evaluating the overall financial statement presentation. We believe that our audit provides a reasonable basis for our opinion.
In our opinion, the financial statements referred to above present fairly, in all material respects, the financial position of Crownbutte Wind Power, Inc. as of December 31, 2009 and the results of their operations and their cash flows for the year then ended, in conformity with accounting principles generally accepted in the United States of America.
The accompanying consolidated financial statements have been prepared assuming that the Company will continue as a going concern. The Company has incurred significant losses as more fully described in Note 2. These issues raise substantial doubt about the Company’s ability to continue as a going concern. Management’s plans in regard to these matters are also described in Note 2. The consolidated financial statements do not include any adjustments that might result from the outcome of this uncertainty.
|
/s/ Sherb & Co., LLP
|
|
|
Certified Public Accountants
|
|
|
New York, New York
|
|
|
April 15, 2010
|
|
F-3
CROWNBUTTE WIND POWER, INC.
Consolidated Balance Sheets
For the years ended December 31,
|
2010
|
2009
|
|||||||
|
ASSETS
|
||||||||
|
Current Assets:
|
||||||||
|
Cash and cash equivalents
|
$
|
18
|
$
|
17,322
|
||||
|
Other current assets
|
650
|
3,949
|
||||||
|
Total current assets
|
668
|
21,271
|
||||||
|
Other assets:
|
||||||||
|
Interconnect application deposits
|
191,953
|
91,638
|
||||||
|
Property and equipment, net
|
116,917
|
166,088
|
||||||
|
Total other assets
|
308,870
|
257,726
|
||||||
|
$
|
309,538
|
$
|
278,997
|
|||||
|
LIABILITIES AND STOCKHOLDERS’ DEFICIT
|
||||||||
|
Current liabilities:
|
||||||||
|
Accounts payable
|
$
|
476,151
|
$
|
371,297
|
||||
|
Accrued expenses0
|
539,860
|
239,886
|
||||||
|
Stockholder loan payable
|
205,000
|
20,000
|
||||||
|
Due to officer
|
33,991
|
42,380
|
||||||
|
Total current liabilities
|
1,255,002
|
673,563
|
||||||
|
Total liabilities
|
1,255,002
|
673,563
|
||||||
|
Stockholders’ deficit:
|
||||||||
|
PrPreferred stock, $0.001 par value, 25,000,000 shares authorized none and issued and outstanding
|
-
|
-
|
||||||
|
C Common stock, $0.001 par value, 300,000,000 shares authorized 34,660,805 and 31,300,331 issued and outstanding
|
34,660
|
31,300
|
||||||
|
A Additional paid-in capital
|
6,838,862
|
5,113,209
|
||||||
|
R Retained earnings deficit
|
(7,818,986
|
)
|
(5,539,075
|
)
|
||||
|
Total stockholders’ deficit
|
(945,464
|
)
|
(394,566
|
)
|
||||
|
Total liabilities and stockholders’ deficit
|
$
|
309,538
|
$
|
278,997
|
||||
See accompanying notes to audited consolidated financial statements.
F-4
CROWNBUTTE WIND POWER, INC.
Consolidated Statements of Operations
|
For the years ended December 31,
|
||||||||
|
2010
|
2009
|
|||||||
|
Operating expenses:
|
||||||||
|
General and administrative
|
1,971,754
|
1,828,235
|
||||||
|
Depreciation expense
|
25,765
|
32,459
|
||||||
|
(Gain) Loss on sale of fixed assets
|
(8,882)
|
18,369
|
||||||
|
Bad Debt expense
|
-
|
1,722
|
||||||
|
Total operating expenses
|
1,988,637
|
1,880,785
|
||||||
|
Net operating loss
|
(1,988,637
|
)
|
(1,880,785
|
)
|
||||
|
Other income (expenses):
|
||||||||
|
Interest income
|
-
|
935
|
||||||
|
Other income
|
500
|
60,772
|
||||||
|
Interest expense
|
(291,774
|
)
|
(4,094
|
)
|
||||
|
Total other income (expenses)
|
(291,274
|
)
|
57,613
|
|||||
|
Net loss
|
$
|
(2,279,911
|
)
|
$
|
(1,823,172
|
)
|
||
|
Basic and diluted - net loss per common share
|
$
|
(0.07
|
)
|
$
|
(0.07
|
)
|
||
|
Basic and diluted - weighted average common shares outstanding
|
31,898,158
|
26,595,947
|
||||||
See accompanying notes to audited consolidated financial statements.
F-5
CROWNBUTTE WIND POWER, INC.
Consolidated Statement of Changes in Stockholders’ Equity (Deficit)
For the years ended December 31, 2010 and 2009
|
Common Stock
|
Additional
|
Accumulated
|
Total
Stockholders’
|
|||||||||||||||||
|
($.001 par value)
|
Paid-In
|
Deficit
|
Equity
|
|||||||||||||||||
|
Shares
|
Amount
|
Capital
|
|
(Deficit)
|
||||||||||||||||
|
Balance, December 31, 2008
|
26,200,331
|
$
|
26,200
|
$
|
4,336,607
|
$
|
(3,715,903
|
)
|
$
|
646,904
|
||||||||||
|
Issuance of common stock for services
|
100,000
|
100
|
28,900
|
-
|
29,000
|
|||||||||||||||
|
Exercise of warrants
|
5,000,000
|
5,000
|
45,000
|
-
|
50,000
|
|||||||||||||||
|
Stock-based compensation
|
-
|
-
|
702,702
|
-
|
702,702
|
|||||||||||||||
|
Net loss
|
-
|
-
|
-
|
(1,823,172
|
)
|
(1,823,172
|
)
|
|||||||||||||
|
Balance, December 31, 2009
|
31,300,331
|
$
|
31,300
|
$
|
5,113,209
|
$
|
(5,539,075
|
)
|
$
|
(394,566
|
)
|
|||||||||
|
Issuance of common stock for cash
|
529,999
|
530
|
174,470
|
-
|
175,000
|
|||||||||||||||
|
Issuance of common stock for services
|
103,333
|
103
|
22,397
|
-
|
22,500
|
|||||||||||||||
|
Issuance of commons stock and warrants for interest
|
650,000
|
650
|
182,350
|
-
|
183,000
|
|||||||||||||||
|
Stock-based compensation
|
-
|
-
|
1,232,001
|
-
|
1,232,001
|
|||||||||||||||
|
Issuance of common stock and warrants for settlement of debt
|
57,142
|
57
|
109,655
|
-
|
109,712
|
|||||||||||||||
|
Exercise of warrants
|
2,020,000
|
2,020
|
4,780
|
-
|
6,800
|
|||||||||||||||
|
Net loss
|
-
|
-
|
-
|
(2,279,911
|
)
|
(2,279,911
|
)
|
|||||||||||||
|
Balance, December 31, 2010
|
34,660,805
|
$
|
34,660
|
$
|
6,838,862
|
$
|
(7,818,986
|
)
|
$
|
(945,464
|
)
|
|||||||||
See accompanying notes to audited consolidated financial statements.
F-6
CROWNBUTTE WIND POWER, INC.
Consolidated Statements of Cash Flows
|
For the years ended December 31,
|
||||||||
|
2010
|
2009
|
|||||||
|
Cash flows from operating activities:
|
||||||||
|
Net loss
|
$
|
(2,279,911
|
)
|
$
|
(1,823,172
|
)
|
||
|
Adjustments to reconcile net loss to net cash used in operating activities:
|
||||||||
|
Depreciation
|
25,765
|
32,459
|
||||||
|
Bad debt
|
-
|
1,722
|
||||||
|
Stock issued for services
|
22,500
|
29,000
|
||||||
|
Stock issued for interest
|
183,000
|
-
|
||||||
|
Stock and warrants issued for debt
|
89,712
|
-
|
||||||
|
Warrants exercised for services
|
-
|
8,357
|
||||||
|
Stock-based compensation
|
1,232,001
|
702,702
|
||||||
|
(Gain) Loss on sale of fixed assets
|
(8,882
|
)
|
18,369
|
|||||
|
Changes in operating assets and liabilities:
|
||||||||
|
Decrease (increase) in:
|
||||||||
|
Other current assets
|
3,299
|
-
|
||||||
|
Other assets
|
(100,315
|
)
|
38,147
|
)
|
||||
|
Increase in:
|
||||||||
|
Accounts payable
|
104,854
|
245,467
|
||||||
|
Accrued expenses
|
299,974
|
186,074
|
||||||
|
Net cash used in operating activities
|
(428,003
|
)
|
(560,875
|
)
|
||||
|
Cash flows from investing activities:
|
||||||||
|
Certificates of deposit redeemed
|
-
|
152,030
|
||||||
|
Purchase of fixed assets
|
(5,259
|
)
|
||||||
|
Proceeds from sale of fixed assets
|
32,288
|
22,700
|
||||||
|
Net cash provided by investing activities
|
32,288
|
169,471
|
)
|
|||||
|
Cash flows from financing activities:
|
||||||||
|
Proceeds from exercise of warrants
|
6,800
|
41,643
|
||||||
|
Proceeds from the sale of stock
|
175,000
|
-
|
|
|||||
|
Proceeds from stockholder loans
|
230,000
|
20,000
|
||||||
|
Proceeds from officer loan
|
6,111
|
44,380
|
||||||
|
Payments on officer loan
|
(14,500
|
)
|
(2,000
|
) | ||||
| Principal payment on long term debt | (25,000 | ) | - | |||||
|
Net cash provided by financing activities
|
378,411
|
104,023
|
||||||
|
Net (decrease) in cash and cash equivalents
|
(17,304
|
)
|
(287,381
|
|||||
|
Cash and cash equivalents, beginning of period
|
17,322
|
304,703
|
||||||
|
Cash and cash equivalents, end of period
|
$
|
18
|
$
|
17,322
|
||||
|
Supplemental disclosures of cash flow information:
|
||||||||
|
Cash paid during the year for:
|
||||||||
|
Interest paid
|
$
|
5,516
|
$
|
4,094
|
||||
|
Taxes paid
|
$
|
-
|
$
|
119
|
||||
|
Non-cash investing and financing activities
|
||||||||
|
Stock and warrants issued for debt
|
$
|
20,000
|
$
|
-
|
||||
See accompanying notes to audited consolidated financial statements.
F-7
CROWNBUTTE WIND POWER, INC.
For the years ended December 31, 2010 and 2009
NOTE 1 – SUMMARY OF SIGNIFICANT ACCOUNTING POLICIES
Nature of organization & business
i) Organization
Crownbutte Wind Power LLC (“Crownbutte ND”) was founded on May 11, 1999 with the strategy of addressing the requirements of regional utility companies to satisfy increasing renewable energy demands. Crownbutte ND was formed as a limited liability company (LLC) in the State of North Dakota and elected to be taxed as an S corporation effective January 1, 2001. On March 11, 2008, Crownbutte ND no longer met the requirements to be treated as an S corporation. As a result, effective March 11, 2008, Crownbutte ND has been taxed like a C corporation. On May 19, 2008, Crownbutte ND filed with the Secretary of State of North Dakota to convert from an LLC to a C corporation becoming “Crownbutte Wind Power, Inc.” On July 2, 2008, Crownbutte ND became a wholly owned subsidiary of Crownbutte Wind Power, Inc., a Nevada corporation, formerly ProMana Solutions, Inc. as described below.
In cooperation with a local utility, Crownbutte developed and constructed the first utility-scale wind facility in either of the Dakotas in 2001, consisting of two turbines near Chamberlain, South Dakota.
The Company currently functions as a wind park developer as well as a consulting and advisory service to power utilities.
ProMana Solutions, Inc. (or “ProMana”)
ProMana was incorporated in the State of Nevada on March 9, 2004, under the name ProMana Solutions, Inc. ProMana’s business was to provide web-based, fully integrated solutions for managing payroll, benefits, human resource management and business processing outsourcing to small and medium sized businesses. Following the merger described below, ProMana is no longer in that web services business. On July 2, 2008, ProMana amended its Articles of Incorporation to change its name to Crownbutte Wind Power, Inc.
Merger
On July 2, 2008, pursuant to a Merger Agreement entered into on the same date, Crownbutte Acquisition Sub Inc., a North Dakota corporation formed on June 6, 2008, and a wholly owned subsidiary (“Acquisition Sub”), merged with and into Crownbutte ND, with Crownbutte ND being the surviving corporation (the “Merger”). As a result of the Merger, Crownbutte ND became a wholly-owned subsidiary of the Company.
Pursuant to the Merger, ProMana ceased operating as a provider of web-based, fully integrated solutions for managing payroll, benefits, human resource management and business processing outsourcing, and acquired the business of Crownbutte ND to develop wind parks from green field to operation and has continued Crownbutte ND’s business operations as a publicly-traded company. See “Split-Off Agreement” below.
At the closing of the Merger, each share of Crownbutte ND’s common stock issued and outstanding immediately prior to the closing of the Merger was converted into one share of the Company’s common stock. As a result, an aggregate of 18,100,000 shares of common stock were issued to the holders of Crownbutte ND’s common stock, 17,000,000 of which were issued to the original members of Crownbutte Wind Power LLC and 1,100,000 to investors in Crownbutte ND who purchased shares in a private placement prior to the merger. In addition, warrants to purchase an aggregate of 10,600,000 shares of Crownbutte ND’s outstanding at the time of the Merger became warrants to purchase an equivalent number of shares of the Company’s common stock.
F-8
Split-Off Agreement
Upon the closing of the Merger, under the terms of a Split-Off Agreement, ProMana transferred all of its pre-Merger operating assets and liabilities to its wholly-owned subsidiary, ProMana Technologies, Inc., a New Jersey corporation (“ProMana NJ”). Simultaneously, pursuant to the Split-Off Agreement, ProMana transferred all of the outstanding shares of capital stock of ProMana NJ to two stockholders prior to the Merger (the “Split-Off”), in consideration of and in exchange for (i) the surrender and cancellation of an aggregate of 144,702 shares of the common stock and warrants to purchase 19,062 shares of common stock held by those stockholders and (ii) certain representations, covenants and indemnities.
Stock Split
The Board of Directors authorized a one-for-65.723 reverse split of the Company’s common stock (the “Stock Split”), which was effective on July 31, 2008, for holders of record on July 14, 2008. After giving effect to the Stock Split, there were outstanding 19,582,249 shares of common stock. All share and per share numbers in this Report relating to the Common Stock prior to the Stock Split have been adjusted to give effect to the Stock Split retroactively unless otherwise stated.
For accounting purposes, the Merger was treated as a recapitalization of the Company. Crownbutte ND formerly Crownbutte Wind Power LLC is considered the acquirer for accounting purposes, and the Company’s historical financial statements before the Merger have been replaced with the historical financial statements of Crownbutte ND before the Merger in all subsequent filings with the Securities and Exchange Commission (the “SEC”).
As used herein, unless the context otherwise requires, the “Company” and “Crownbutte” refer to Crownbutte ND for periods prior to the merger and to Crownbutte Wind Power, Inc., a Nevada corporation, formerly ProMana Solutions, Inc., and its wholly-owned subsidiary, Crownbutte ND, for periods after the Merger.
ii) Business
We intend to become a wind power generation and wind project development, company. We intend to identify and evaluate the economic feasibility and resource potential of wind development properties, domestically and internationally, for the purposes of developing utility scale wind turbine projects. We may participate in these projects with development partners and receive revenue from the sale of electric energy through our working interests in the partnerships or through the sale of our interests in the development projects.
Since our inception, we have been engaged in business planning activities, including researching wind energy technologies, developing our economic models and financial forecasts, performing due-diligence regarding potential development partners, investigating wind electric energy properties and project opportunities, and raising capital. We have entered into agreements and various operations in furtherance of our wind power generation business.
Basis of Presentation
The financial statements of the Company have been prepared in accordance with generally accepted accounting principles in the United States of America.
Use of Estimates
In preparing financial statements, management makes estimates and assumptions that affect the reported amounts of assets and liabilities in the balance sheet and revenue and expenses in the statement of expenses. Actual results could differ from those estimates.
F-9
Cash and Cash Equivalents
For purposes of the statement of cash flows, the Company considers all highly liquid investments purchased with an original maturity of three months or less to be cash equivalents.
Property and equipment
Property and equipment is recorded at cost and depreciated on the straight-line method over the estimated useful lives. Expenditures for normal repairs and maintenance are charged to expense as incurred. The cost and related accumulated depreciation of assets sold or otherwise disposed of are removed from the accounts, and any gain or loss is included in operations.
Fair Value Measurements
In September 2006, the FASB issued ASC 820 (previously SFAS 157) which defines fair value, establishes a framework for measuring fair value, and expands disclosures about fair value measurements. The provisions of ASC 820 were effective January 1, 2008. The FASB has also issued Staff Position (FSP) SFAS 157-2 (FSP No. 157-2), which delays the effective date of SFAS 157 for nonfinancial assets and liabilities, except for items that are recognized or disclosed at fair value in the financial statements on a recurring basis (at least annually), until fiscal years beginning after November 15, 2008.
As defined in ASC 820, fair value is the price that would be received to sell an asset or paid to transfer a liability in an orderly transaction between market participants at the measurement date (exit price). The Company utilizes market data or assumptions that market participants would use in pricing the asset or liability, including assumptions about risk and the risks inherent in the inputs to the valuation technique. These inputs can be readily observable, market corroborated, or generally unobservable. The Company classifies fair value balances based on the observations of those inputs. ASC 820 establishes a fair value hierarchy that prioritizes the inputs used to measure fair value. The hierarchy gives the highest priority to unadjusted quoted prices in active markets for identical assets or liabilities (level 1 measurement) and the lowest priority to unobservable inputs (level 3 measurement).
The three levels of the fair value hierarchy defined by ASC 820 are as follows:
Level 1 – Quoted prices are available in active markets for identical assets or liabilities as of the reporting date. Active markets are those in which transactions for the asset or liability occur in sufficient frequency and volume to provide pricing information on an ongoing basis. Level 1 primarily consists of financial instruments such as exchange-traded derivatives, marketable securities and listed equities.
Level 2 – Pricing inputs are other than quoted prices in active markets included in level 1, which are either directly or indirectly observable as of the reported date. Level 2 includes those financial instruments that are valued using models or other valuation methodologies. These models are primarily industry-standard models that consider various assumptions, including quoted forward prices for commodities, time value, volatility factors, and current market and contractual prices for the underlying instruments, as well as other relevant economic measures. Substantially all of these assumptions are observable in the marketplace throughout the full term of the instrument, can be derived from observable data or are supported by observable levels at which transactions are executed in the marketplace. Instruments in this category generally include non-exchange-traded derivatives such as commodity swaps, interest rate swaps, options and collars.
Level 3 – Pricing inputs include significant inputs that are generally less observable from objective sources. These inputs may be used with internally developed methodologies that result in management’s best estimate of fair value.
The Company did not have any Level 2 or Level 3 assets or liabilities as of December 31, 2010 and December 31, 2009. The Company discloses the estimated fair values for all financial instruments for which it is practicable to estimate fair value. As of December 31, 2010 and December 31, 2009, the fair value short-term financial instruments including cash, certificates of deposit, other current assets, accounts payable, accrued expenses and due to officer, approximates book value due to their short-term duration.
F-10
Cash and cash equivalents include money market securities and commercial paper that are considered to be highly liquid and easily tradable. These securities are valued using inputs observable in active markets for identical securities and are therefore classified as Level 1 within the fair value hierarchy.
In addition, the Financial Accounting Standards Board (“FASB”) issued, “The Fair Value Option for Financial Assets and Financial Liabilities,” effective for January 1, 2008. This guidance expands opportunities to use fair value measurements in financial reporting and permits entities to choose to measure many financial instruments and certain other items at fair value. The Company did not elect the fair value option for any of its qualifying financial instruments.
Reclassifications
Certain prior year amounts have been reclassified to conform with the current year presentation.
Wind Project Development Costs
Wind project development costs are charged to expense as incurred. These costs consist of such costs as contracted operations and maintenance fees, turbine and related equipment warranty fees, land rent, insurance, professional fees, operating personnel and permit compliance.
Leases
The Company has entered into several Wind Project Agreements granting the right to install equipment and restricting use of the property by the landowner. Fees paid in conjunction with these agreements are expensed as incurred.
Income taxes
The Company was organized as a limited liability company for the year ended December 31, 2007 and the Company’s members elected to be taxed as an S corporation. An S corporation is not a taxpaying entity for federal and state income tax purposes; thus, no income tax expenses have been recorded in the financial statements. It is the responsibility of the members to report their proportionate share of the Company’s income or loss on the members’ individual income tax returns.
Since March 11, 2008, the Company is being taxed as a C corporation. A short year S corporation tax return and a short year C corporation tax return was filed. Income tax liability for the years ended December 31, 2010 and 2009 is $0.
The Company has adopted the provisions of FASB ASC Topic 740, “Income Taxes ” (“ASC 740”). As required under ASC 740, the Company accounts for income taxes using an asset and liability approach, which requires the recognition of deferred tax assets and liabilities for the expected future tax consequences of temporary differences between the financial statements and tax bases of assets and liabilities at the applicable tax rates. A valuation allowance is utilized when it is more likely than not, that some portion of, or all of the deferred tax assets will not be realized. Deferred tax assets and liabilities are adjusted for the effects of changes in tax laws and rates on the date of enactment.
ASC 740 prescribes a recognition threshold and measurement attribute for the financial statement recognition and measurement of a tax position taken or expected to be taken in a tax return. Under ASC 740, the Company recognizes tax benefits only for tax positions that are more likely than not to be sustained upon examination by tax authorities. The amount recognized is measured as the largest amount of benefit that is greater than 50 percent likely to be realized upon settlement. A liability for “unrecognized tax benefits” is recorded for any tax benefits claimed in our tax returns that do not meet these recognition and measurement standards.
F-11
Basic and diluted net loss per share
The Company computes loss per share in accordance with ASC 260, ‘‘Earnings per Share’’ which requires presentation of both basic and diluted earnings per share on the face of the statement of operations. Basic loss per share is computed by dividing net loss available to common shareholders by the weighted average number of outstanding common shares during the period. Diluted loss per share gives effect to all dilutive potential common shares outstanding during the period including stock options and warrants using the treasury method. Dilutive loss per share excludes all potential common shares if their effect is anti-dilutive.
Stock Compensation
The Company follows Financial Accounting Standard No. 123R (ASC 718), “Share-Based Payment” as interpreted by SEC Staff Accounting Bulletin No. 107 for financial accounting and reporting standards for stock-based employee compensation plans. It defines a fair value based method of accounting for an employee stock option or similar equity instrument.
The Company uses the Black-Scholes option valuation model for estimating the fair value of traded options. This option valuation model requires the input of highly subjective assumptions including the expected stock price volatility.
For the years ended December 31, 2010 and 2009, the Company recorded stock-based compensation of $1,232,001 and $702,702, respectively.
NOTE 2 - GOING CONCERN
The accompanying consolidated financial statements have been prepared on a going concern basis, which contemplates the realization of assets and satisfaction of liabilities in the normal course of business. The Company has incurred material recurring losses from operations. Since inception, the Company has incurred losses of approximately $7.8 million. In addition, the Company is experiencing a continuing operating cash flow deficiency. These factors, among others, raise substantial doubt about the Company’s ability to continue as a going concern for a reasonable period of time.
The Company is pursuing, and will continue to pursue, additional equity financing and/or debt financing while managing cash flow in an effort to provide funds and cash flow to meet its obligations on a timely basis and to support wind project development activities.
The consolidated financial statements do not contain any adjustments to reflect the possible future effects on the classification of assets or the amounts and classification of liability that may result should the Company be unable to continue as a going concern.
NOTE 3 – PROPERTY, EQUIPMENT AND LEASEHOLD IMPROVEMENTS
Property and equipment and related accumulated depreciation consists of the following:
|
December 31, 2010
|
December 31, 2009
|
|||||||
|
Equipment and Vehicles
|
$
|
147,832
|
$
|
179,370
|
||||
|
Software
|
39,289
|
39,289
|
||||||
|
Leasehold Improvements
|
938
|
938
|
||||||
|
Total Cost
|
188,059
|
219,597
|
||||||
|
Accumulated Depreciation
|
(71,142
|
)
|
(53,509
|
)
|
||||
|
Net Property and Equipment
|
$
|
116,917
|
$
|
166,088
|
||||
Equipment and vehicles are depreciated with an estimated useful life of 5 to 10 years and software has an estimated useful life of 5 years. Depreciation expense was $25,765 and $32,459 for the years ended December 31, 2010 and 2009, respectively.
F-12
Accrued expenses consist of the following:
|
December 31, 2010
|
December 31, 2009
|
|||||||
|
Accrued Payroll
|
$
|
491,494
|
$
|
216,254
|
||||
|
Credit Cards Payable
|
35,021
|
23,262
|
||||||
|
Accrued Vacation
|
-
|
324
|
||||||
|
Accrued Interest
|
13,345
|
46
|
||||||
|
$
|
539,860
|
$
|
239,886
|
|||||
NOTE 5 – STOCKHOLDERS’ DEFICIT
During the years ended December 31, 2009, the Company issued 5,000,000 shares of common stock for the exercise of 5,000,000 warrants.
During the year ended December 31, 2009, the Company issued 100,000 shares of common stock for legal services. These shares were valued at $0.29 per share, the fair market value at the date of issuance. Accordingly, the Company recorded legal expense of $29,000.
The Company valued these warrants utilizing the Black-Scholes options pricing model and the following assumption terms: 3 to 5 years; interest rate: 4%; volatility: 100%. The 2,000,000 warrants granted to the CFO were valued at approximately $1,000,000. This amount was expensed over the vesting period. For the year ended December 31, 2009, the Company recorded compensation expense of $702,702 related to the warrants, respectively.
On February 22, 2010, the Company’s Board of Directors executed a Unanimous Written Consent approving a private placement transaction to offer investors a minimum of $150,000 (428,571 shares) and a maximum of $700,000 (2,000,000 shares) of the Company’s common stock at $0.35 per share. Each share sold included one warrant to purchase one share of the Company’s common stock, exercisable for a period of four years, at an exercise price of $1.50 per share, and one warrant to purchase one share of common stock, exercisable for four years, at an exercise price of $2.50 per share. The Company issued 499,999 shares and 999,998 warrants for proceeds of $175,000.
On February 24, 2010 the $20,000 short-term note payable to StarInvest Group, Inc. was settled with common stock and warrants. A total of 57,142 shares and 114,284 warrants were issued with a fair value of $109,712. The excess fair value of $89,712 was recorded as a loss on settlement of debt.
On March 29, 2010 the Company issued a total of 400,000 shares of common stock in exchange for short-term loans from two of the Company’s stockholders. Terms of the loans were $100,000 payable in 60 days for 150,000 shares of stock in lieu of interest, and $100,000 payable in 60 days for 250,000 shares of stock in lieu of interest. Principal payments on both loans were due June 7, 2010. The fair value of the shares was $148,000 and was recorded to interest expense. As of December 31, 2010, these loans are outstanding and are now past due.
On March 31, 2010 the Company made an adjustment to increase common stock issued for 30,000 shares sold in 2009 in a transaction that was to be unwound by December 31, 2009. During 2010, the Company and the stockholders decided not to unwind the transaction.
F-13
On April 27, 2010 the Company issued 100,000 shares of common stock in exchange for consulting services with a fair value of $22,000. The entire fair value was recorded to expense in 2010.
On April 29, 2010, the Company’s Board of Directors executed a Unanimous Written Consent approving the issuance of warrants to four Company employees and executives. The warrants consist of options to purchase 9,010,000 shares of the Company’s common stock at $0.1101 per share exercisable for a period of five years. The warrants vested immediately. The fair value of the warrants of $992,001 was immediately expensed. The Company valued these warrants utilizing the Black-Scholes pricing model and the following assumption terms: 5 years, interest rate: 1%, volatility: 388%.
On June 2, 2010 the Company issued 250,000 shares of common stock to Gottbetter Capital Group, Inc. in exchange for a $25,000 short-term loan dated June 3, 2010. Interest expense totaling $35,000 was recorded for the fair value of the shares issued. See Note 7.
On June 2, 2010 the Company’s Board of Directors executed a Unanimous Written Consent to reduce the exercise price on 3,118,000 warrants expiring July 2, 2010 through September 8, 2010 from $2.50 to $0.24 per share if exercised by July 1, 2010. . Warrant holders electing to accept this offer would also receive one warrant with an exercise price of $1.00 per share exercisable for one year. Only one warrant holder accepted the offer. As the modification involved warrants originally issued to equity investors, there was no financial statement impact from the warrant modification.
On June 29, 2010 the Company issued 3,333 shares common stock to Director Ross Mushik for director fees totaling $500.
On July 14, 2010, the Company issued 20,000 shares of common stock for a warrant exercised at $0.24 per share pursuant to the Company’s warrant modification offer dated June 2, 2010. Proceeds totaled $4,800.
On July 29, 2010 the Company issued 2,000,000 shares common stock for a warrant exercised at $0.001 per share for proceeds totaling $2,000.
On December 9, 2010, the Company’s Board of Directors executed a Unanimous Written Consent approving the issuance of warrants to three Company employees and executives. The warrants consist of options to purchase 12,000,000 shares of the Company’s common stock at $0.02 per share exercisable for a period of five years. The warrants vested immediately. The fair value of the warrants of $240,000 was immediately expensed. The Company valued these warrants utilizing the Black-Scholes pricing model and the following assumption terms: 5 years, interest rate: 1.9%, volatility: 455%.
NOTE 6 – WARRANTS
During the year ended December 31, 2010 and 2009, the Company issued 22,144,282 and 0 warrants, respectively (see Note 5).
On July 29, 2010 the Company issued 2,000,000 shares common stock for a warrant exercised at $0.001 per share for proceeds totaling $2,000.
During the year ended December 31, 2010, 3,118,000 warrants expired.
F-14
A reconciliation of warrant activity is as follows:
|
Warrants
|
Weighted-
Average Exercise
Price
|
Weighted-
Average
Remaining
Contracted Life
(Years)
|
Aggregate
Intrinsic
Value
|
|||||||||||||
|
Balance at January 1, 2009
|
12,235,752 | $ | 0.87 | 2.26 | $ | 3,848,000 | ||||||||||
|
Granted
|
- | - | - | - | ||||||||||||
|
Exercised
|
(5,000,000 | ) | 0.01 | - | - | |||||||||||
|
Expired
|
- | - | - | - | ||||||||||||
|
Balance at December 31, 2009
|
7,235,752 | $ | 1.17 | 1.78 | $ | 738,000 | ||||||||||
|
Balance at January 1, 2010
|
7,235,752 | $ | 1.17 | 1.78 | $ | 738,000 | ||||||||||
|
Granted
|
22,144,282 | - | - | - | ||||||||||||
|
Exercised
|
(2,020,000 | - | - | - | ||||||||||||
|
Expired
|
(3,098,000 | - | - | - | ||||||||||||
|
Balance at December 31, 2010
|
24,262,034 | $ | 0.17 | 4.31 | $ | 60,000 | ||||||||||
NOTE 7 – INCOME TAXES
Deferred tax assets and liabilities are provided for significant income and expense items recognized in different years for tax and financial reporting purposes. Temporary differences, which give rise to a net deferred tax asset is as follows:
|
Schedule of deferred tax assets
|
December 31, 2010
|
December 31, 2009
|
||||||
|
Net operating loss
|
$
|
591,000
|
$
|
366,466
|
||||
|
Temporary differences:
|
||||||||
|
Warrant expense
|
-
|
267,140
|
||||||
|
Other
|
-
|
79,040
|
||||||
|
Valuation allowance
|
(591,000
|
)
|
(712,646
|
)
|
||||
|
Net deferred tax asset
|
$
|
-
|
$
|
-
|
||||
The Company has a net operating loss carry forward for tax purposes totaling approximately $1,690,000 and $964,000 at December 31, 2010 and 2009, respectively. The net operating loss carries forward for income taxes, which may be available to reduce future years’ taxable income. These carry forwards will expire, if not utilized, through 2029 and are subject to the Internal Revenue Code Section 382, which places a limitation on the amount of taxable income that can be offset by net operating losses after a change in ownership. Management believes that the realization of the benefits from these losses appears uncertain due to the Company’s continuing losses for income tax purposes. Accordingly, the Company has provided a 100% valuation allowance on the deferred tax asset benefit to reduce the asset to zero. Management will review this valuation allowance periodically and make adjustments as warranted
NOTE 8 – RELATED PARTY TRANSACTIONS
The Company borrowed funds from Timothy Simons, one of the Company’s stockholders and its CEO. The terms of the loans are non-interest bearing and payable upon demand. Amounts owed totaled $33,991 and $42,380 as of December 31, 2010 and 2009, respectively.
The Company borrowed funds from StarInvest Group, Inc., one of the Company’s stockholders. Terms of the loan are $20,000 at 6% annual interest, due within one year. The date of the loan is December 18, 2009. As of December 31, 2009, the Company owed $20,000. On February 24, 2010, the note was converted to common stock and warrants through the private placement. The principal balance as of September 30, 2010 is $0. See Note 6.
F-15
On March 29, 2010 the Company borrowed a total of $200,000 from two of its stockholders. Terms of the loans are $100,000 each payable on June 7, 2010. The Company issued 400,000 shares of common stock in lieu of interest. The loans were not repaid upon maturity, therefore in default. They now bear an interest rate of 12%. As of December 31, 2010, the principal balance due on both loans was $200,000. Accrued interest on each loan as of December 31, 2010 was $6,773, totaling $13,546.
On May 21, 2010 the Company borrowed $5,000 from StarInvest Group, Inc., one of the Company’s stockholders. Terms of the loan are non-interest bearing and payable upon demand. The principal balance as of December 31, 2010 is $5,000.
On June 3, 2010 the Company borrowed $25,000 from Gottbetter Capital Group, Inc., one of the Company’s stockholders. The short-term loan matured July 2, 2010 and accrues interest at 10% annually. The lender required issuance of 250,000 shares of common stock as an inducement to lend. See Note 6. Gottbetter Capital Group, Inc., is an affiliate of Gottbetter & Partners, LLP, which has provided and continues to provide legal services to the Company. Conditions of the note included commitment of 100% of the Company’s future receipts until the Company’s receivable balance for legal services had been paid in full. The note was personally guaranteed by another Company stockholder. On June 25, 2010 the Company repaid the note plus accrued interest.
F-16
NOTE 9 – OFFICE AND SHOP LEASE
Since May 1, 2009, the Company rents its office and shop space on a month-to-month lease at $1,500 per month. The Company is responsible for paying all utilities and janitorial expenses.
NOTE 10 – RETIREMENT PLAN
In August 2007, the Company established a SIMPLE retirement plan. The Company matches employee contributions up to 3% of gross wages. The Company’s contributions to the plan were $1,450 and $5,141 for the years ended December 31, 2010 and 2009, respectively.
NOTE 11 – CONCENTRATION OF RISK
Cash and cash equivalents deposited with financial institutions are insured by the Federal Deposit Insurance Corporation (“FDIC”). The Company did not hold cash in excess of FDIC insurance coverage at a financial institution as of December 31, 2010 and 2009.
NOTE 12 – PROJECT RESEARCH AND DEVELOPMENT COSTS AND INTERCONNECT APPLICATION DEPOSITS
Project Research and Development Costs
Wind project development costs are charged to expense as incurred. These costs consist of such costs as contracted operations and maintenance fees, turbine and related equipment warranty fees, land rent, insurance, professional fees, operating personnel and permit compliance. The Company expensed $142,019 and $147,151 in research and development costs for the years ending December 31, 2010 and 2009, respectively which are included in general and administrative expenses in the consolidated statements of operations.
Interconnect Application Deposits
The Company pays in advance for electrical interconnect studies. As the studies are performed, the portions of the advances that are used are expensed. These costs are incurred as part of the process to obtain an interconnect agreement. Interconnect deposits are classified as non-current assets as studies generally exceed one year in length. If a study is complete, any unused deposits are refunded to the Company. At December 31, 2010 and December 31, 2009, the Company had $191,952 and $91,638, respectively, of unused deposits on its balance sheet.
NOTE 13 – COMMITMENTS AND CONTINGENCIES
On August 19, 2008, Centre Square Capital, LLC filed a claim in the amount of $3,000,000 plus attorneys fees, interest, and arbitration costs in a demand for arbitration, claiming that the Company has not compensated it for introducing the Company to the firm that raised the private placement capital in March, 2008 and thereafter. On March 16, 2009 a judge dismissed Centre Square Capital LLC’s claim and awarded the Company reimbursement of all attorney fees and costs related to the claim. A reimbursement of approximately $129,227 is payable to the Company. No receivables have been recorded for this amount in the consolidated financial statements.
The Company accounts for awards of attorney fees and costs resulting from judgments in its favor on a case-by-case basis. Factors affecting the accounting treatment include timing of expenses incurred and date of award, likelihood of collection, and additional costs incurred in the collection process. Judgments awarded that management deems collectible are recorded as a receivable. Award amounts for expenses incurred in the same accounting period are recorded as reductions in the corresponding expense line item. Reimbursements of prior period expenses are recorded as other income. Collection of the Centre Square Capital judgment is uncertain and accordingly, no receivable has been recorded. For the year ended December 31, 2010 the Company collected $0 of this award.
F-17
On November 3, 2009, the Company was served with a lawsuit filed against us in the Philadelphia County Court of Common Pleas under Case ID: 091100318. Stradley, Ronon, Stevens & Young, LLP (the plaintiffs) filed a claim against the Company for nonpayment of legal fees and are seeking to recover $93,526 plus interest, attorneys’ fees and costs. This claim arose as a result of legal services provided in the Centre Square Capital, LLC arbitration claim filed August 19, 2008.
On December 14, 2009, the Company received a Notice of Intent to Take Default Judgment from Stradley, Ronon, Stevens & Young, LLP for the unpaid balance of $93,526. The Company has been working with the plaintiff to make payments on the debt. In exchange, the plaintiffs have agreed to postpone execution of the judgment. The Company owed $73,526 as of December 31, 2010 which is included in accounts payable.
On June 3, 2010 the Company executed a short-term note payable with Gottbetter Capital Group, Inc.. Terms of the note include a stipulation the Company must remit 10% of future receipts from all sources until the Company’s account is paid in full. See Note 8. As of December 31, 2010 the Company owed Gottbetter Capital Group, Inc. $246,458 for legal services. This amount is included in accounts payable.
On February 1, 2011, Nacel Energy Corporation acquired ownership of an aggregate of 10,500,000 shares of the Company’s common stock from Timothy Simons, an officer and director of the Company, and another shareholder. In exchange, Mr. Simons and the other person received 3,250,000 shares and 2,000,000 shares, respectively, of Nacel’s restricted common stock.
On February 1, 2011, the Company entered into four (4) separate Consulting Agreements with Messrs. Simons, Schaftlein, Fleming and Pilling, each being an officer of the Company. Each Consulting Agreement is for a 12 month term, subject to earlier termination. As compensation for services performed under the Consulting Agreement, the Company pays an aggregate amount of $20,000 per month, with $11,500 being paid in cash and the remaining $8,500 being accrued. Any accrued compensation will be paid in the future, subject to discretion of the Company based on cash flow and other financial considerations.
On February 3, 2011, the Company compromised and settled $108,000 of indebtedness due to Terry Pilling, the Company’s former director and officer, in exchange for the issuance of 900,000 shares of restricted common stock.
On March 3, 2011, the Company compromised and settled $40,000 of indebtedness due to a former law firm in exchange for the issuance of 300,000 shares of restricted common stock.
Om March 9, 2011, a Consent Judgment in the amount of $73,526 was entered against the Company in favor of Stradley Ronon Stevens & Young, LLP (“Stradley”)
On March 24, 2011, the Company executed and entered into a Forbearance Agreement with Stradley whereby Stradley agreed to forbear and not execute upon the Consent Judgment provided the Company timely pay $3,500 upon execution of the Forbearance Agreement and on the 30th day of each month thereafter. In addition, the Company agreed to (a) increase the payments to $7,000 per month commencing on the next payment date after the Company is successful in receiving funds in excess of $500,000 for project development, and (b) issue 500,000 shares of its common stock which, upon being registered, could be sold with any net sales proceeds being applied by Stradley to reduce the judgment amount due from the Company.
On April 4, 2011, the Company settled and satisfied $125,000 of a $246,460 indebtedness due to Gottbetter and Partners, LLP with the issuance of 2,083,333 shares of restricted common stock.
On April 8, 2011, the Company settled and satisfied $10,665 of indebtedness due to a creditor with the issuance of 166,667 shares of restricted common stock.
F-18
Item 9: Disagreements with Accountants on Accounting and Financial Disclosure
We have no disagreement with our auditors.
Item 9A: Controls and Procedures
Our Chief Executive Officer and Chief Financial Officer evaluated the effectiveness of our disclosure controls and procedures (as defined in Exchange Act Rules 13a-15(e) and 15d-15(e)) as of December 31, 2010, the end of the period covered by this report. Based on that evaluation, our Chief Executive Officer and Chief Financial Officer concluded that our disclosure controls and procedures as of December 31, 2010 were not effective to ensure that the information required to be disclosed by us in reports filed under the Securities Exchange Act of 1934 is (i) recorded, processed, summarized and reported within the time periods specified in the SEC’s rules and forms and (ii) accumulated and communicated to registrant’s management, including the Chief Executive Officer and Chief Financial Officer, as appropriate to allow timely decisions regarding disclosure. A controls system cannot provide absolute assurance that the objectives of the controls system are met, and no evaluation of controls can provide absolute assurance that all control issues and instances of fraud, if any, within a company have been detected.
Our Chief Executive Officer and Chief Financial Officer are responsible for establishing and maintaining adequate internal control over financial reporting (as defined in Rule 13a-15(f) under the Exchange Act). Our internal control over financial reporting is a process designed to provide reasonable assurance regarding the reliability of financial reporting and the preparation of financial statements for external purposes in accordance with accounting principles generally accepted in the United States.
Because of its inherent limitations, internal control over financial reporting may not prevent or detect misstatements. Therefore, even those systems determined to be effective can provide only reasonable assurance of achieving their control objectives. Furthermore, smaller reporting companies face additional limitations. Smaller reporting companies employ fewer individuals and find it difficult to properly segregate duties. Often, one or two individuals control every aspect of the Company’s operation and are in a position to override any system of internal control. Additionally, smaller reporting companies tend to utilize general accounting software packages that lack a rigorous set of software controls.
We have identified the following material weaknesses in our internal control over financial reporting:
Lack of Independent Board of Directors and Audit Committee
Management is aware that an audit committee composed of the requisite number of independent members along with a qualified financial expert has not yet been established. Considering the costs associated with procuring and providing the infrastructure to support an independent audit committee and the limited number of transactions, management has concluded that the risks associated with the lack of an independent audit committee are not sufficient to justify the creation of such a committee at this time. Management will periodically reevaluate this situation.
Lack of Segregation of Duties
Management is aware that there is a lack of segregation of duties at the Company due to the small number of employees dealing with general administrative and financial matters. However, at this time management has decided that considering the abilities of the employees now involved and the control procedures in place, the risks associated with such lack of segregation are low and the potential benefits of adding employees to clearly segregate duties do not justify the substantial expenses associated with such increases. Management will periodically reevaluate this situation.
This annual report does not include an attestation report of the Company’s registered public accounting firm regarding internal control over financial reporting. Management’s report was not subject to attestation by our registered public accounting firm pursuant to temporary rules of the SEC that permit us to provide only management’s report in this Annual Report on Form 10-K.
54
Changes in Internal Control Over Financial Reporting
We continue to monitor and evaluate the effectiveness of our internal controls and procedures and our internal controls over financial reporting on an ongoing basis. We are committed to taking further action and implementing additional enhancements or improvements, as necessary, and as funds allow.
There have been no changes in our internal control over financial reporting that occurred during the year ended December 31, 2010 that have materially affected, or are reasonably likely to materially affect, our internal control over financial reporting.
None.
Our executive officers and directors are as follows:
|
Name
|
Age
|
Position
|
||
|
Timothy H. Simons
|
64
|
Chief Operating Officer, and Director
|
||
|
Mark Schaftlein
|
53
|
Chief Executive Officer, Chief Financial Officer and Director
|
||
|
Murray Fleming
|
47
|
Director
|
||
|
Terry Pilling
|
39
|
Executive Vice President
|
Background of Executive Officers and Directors
Timothy H. Simons, Chief Operating Officer and Director. Mr. Simons, founded Crownbutte ND in 1999 and has been involved in the wind power industry since 1996. Following the merger in July 2008, Mr. Simons became our Chief Executive Officer and President and a member of the Board of Directors. From 1991 through 2002, he was a teacher in the public school systems of Bismarck and Mandan, North Dakota. After founding Crownbutte ND in 1999, he taught part time, devoting over 40 hours per week to the Company.
In 2002 Mr. Simons was asked to join the newly established Upper Great Plains Transmission Coalition (the “UGPTC”). The UGPTC was formed by the Governor of North Dakota in cooperation with Minnesota and South Dakota in order to address electrical transmission problems, so that the coal, hydro and wind resources in the area could be better utilized. In addition to membership in the UGPTC, Mr. Simons is on the Steering Committee and is co-chairman of the Transmission Bottleneck Committee of the UGPTC.
Mr. Simons experience and knowledge of the wind power business brings important and unique perspectives on the issues, requirements and needs facing Crownbutte. Finally, Mr. Simons service as director and his extensive period as an officer of Crownbutte creates a critical link between management and the Board, enabling the Board to perform its oversight functions with the benefit of management’s perspective on the business of Crownbutte.
55
Murray Fleming, Director; Mr. Fleming joined Crownbutte in January, 2011 and is currently a Director. From February, 2006 to the current date, Mr. Felming has been a Director of Nacel Energy Corporation, a small public wind energy company and, since February, 2011, a large shareholder of Crownbutte. From February 2005 to present, he has been a principal of Before the Bell Publishing LLC, an organization which provides investor relations services. From May 2005 to July 2005, he was president and chief executive officer of Iguana Ventures an exploration stage company engaged in the acquisition and exploration of resource properties. In 1986, he earned a Bachelor of Arts degree in Economics & Environmental Studies from the University of Victoria.
Mr. Fleming brings knowledge and experience in public companies, capital markets and general business matters, all of which impact Crownbutte and its business and financial affairs.
Mark Schaftlein, Chief Executive Officer, Chief Financial Officer and Director; Mark Schaftlein, joined the company in January, 2011. Mr. Schaftlein is the founder and Chief Executive Officer of Capital Consulting, Inc., an advisory firm which for the past 8 years has assisted smaller public companies in the areas of capital sourcing, debt restructuring and business strategy. In addition, over the last several years, Mr. Schaftlein has been the Chief Executive Officer, the Chief Financial Officer and/or a Director of Nacel Energy Corporation, a small public wind energy company and, since Feburary, 2011, a large shareholder of Crownbutte.. Mr. Schaftlein has also previously served in officer and director capacities with other public companies including Far East Energy Corporation, SP Holdings (later Organic to Go) and Ortec International. From 1982 to 2000, Mr. Schaftlein held a number of management positions in the banking industry, initially with Citicorp through 1992, then Fleet Financial, National Lending Center and Westmark Group Holdings from 1995 to 2000. During his tenure at Westmark, Mr. Schaftlein served as CEO and helped it achieve $100M in corporate financing. Mr. Schaftlein earned a degree in Business Administration from Western Kentucky University in 1980.
Mr. Schaftlein brings financial expertise to the Board and Crownbutte based on his extensive experience and knowledge in banking, corporate finance, capital markets and through his experiences serving as chief financial officer of another public company.
Terry Pilling, Executive Vice President; Terry Pilling is a former member of the Board of Directors from September 2008 until February, 2011 and has been Executive Vice President since February 2010. From September 2008 to February 2010, Mr. Pilling served as our Vice President of Operations and Technology. Mr. Pilling was an assistant professor of the Physics Department at the North Dakota State University from August 2004 to August 2008. His professional experience includes Visiting Researcher, Joint Astronomy Centre and the James Clerk Maxwell radio telescope on Mauna Kea, Hilo, Hawaii from May 2006 to August 2006; Postdoctoral Research Associate, Institute of Theoretical and Experimental Physics, Moscow from September 2003 to June 2004 and Postdoctoral Research Associate, Joint Institute for Nuclear Research, Dubna from September 2003 to June 2004. Prior to that, Mr. Pilling worked as Science Editor for the House of Knowledge Publishing Company in London, England from September 2002 to August 2003, as a teaching assistant for the North Dakota State University from September 1998 to August 2002 and as its physics department Network Systems Administrator and Webmaster September 1999 to August 2002. Mr. Pilling obtained his Ph.D. in High Energy Particle Physics and Gravitation from North Dakota State University in 2002. He achieved a M.Sc. in Theoretical and Experimental Nuclear Physics from Saskatchewan Accelerator Laboratory in 1998 and a B.Sc. in Physics and Engineering Physics from the University of Saskatchewan in 1996. Mr. Pilling has received professional recognition from the North Dakota State University as an Odney Award nominee in 2008 and a Gunkelman Award nominee in 2006. He was a National Science Foundation EPSCoR Research Fellow in 2001 and received the Physics and Engineering Physics Convocation Award in 1996 from the University of Saskatchewan.
Mr. Pilling brings extensive scientific and engineering knowledge and experience which is invaluable to Crownbutte and its business affairs.
56
There are no family relationships between any director or officer.
Involvement in Certain Legal Proceedings
During the last ten years, no director or executive officer of Crownbutte has been involved in any of the following legal proceedings:
|
·
|
Any judicial or administrative proceedings resulting from involvement in mail or wire fraud, or fraud in connection with any business entity;
|
|
·
|
Any judicial or administrative proceedings based on violations of federal or state securities, commodities, banking or insurance laws and regulations, or any settlement to such actions (excluding settlements between private parties);
|
|
·
|
Any disciplinary sanctions or orders imposed by a stock, commodities or derivatives exchange or other self-regulatory organization:
|
|
·
|
Any bankruptcy petition filed by or against, or a receiver, fiscal agent or similar officer appointed by a court for, any business of which such person was a general partner or executive officer either at the time of the bankruptcy or within two years prior to that time;
|
|
·
|
Any conviction in a criminal proceeding or being subject to a pending criminal proceeding (excluding traffic violations and other minor offences);
|
|
·
|
Any order, judgment, or decree, not subsequently reversed, suspended or vacated, of any court of competent jurisdiction, permanently or temporarily enjoining, barring, suspending or otherwise limiting his involvement in any type of business, securities or banking activities; or
|
|
·
|
Any finding by a court of competent jurisdiction (in a civil action), the Commission or the Commodity Futures Trading Commission to have violated a federal or state securities or commodities law, and the judgment has not been subsequently reversed, suspended, or vacated.
|
Audit Committee Financial Expert
We do not have a separately designated audit committee, but rather the entire Board of Directors serves as its audit committee. None of the current board members have been designated as the equivalent of the “audit committee financial expert” as no member is considered independent and no member would otherwise satisfy the criteria adopted under the Securities Exchange Act for financial accounting expertise. During the ensuing fiscal year, we expect to consider whether we should expand our Board of Directors to be able to appoint an independent director, whether to establish a formal audit committee and the appointment of an audit committee member who meets the criteria adopted under the Securities Exchange Act for financial accounting expertise and independence. However, we caution, given the risk and exposure associated with board participation, recruiting independent directors, especially those that qualify as a financial expert, may prove difficult. Furthermore, director compensation and insurance premiums could prove costly. Accordingly, we may alter or vary our plans based upon these concerns in addition to changes in circumstances, lack of funds, and/or other events which we are not able to anticipate.
Changes to Nominating Process.
Given our small size and the small size of our Board, we do not currently have a Nominating Committee and no formal procedures have been established concerning the selection and nomination of directors. The Board will evaluate potential candidates to serve as a director by considering a candidate’s background and accomplishments, skills, expertise, character and to insure that the board reflects a range of talents, ages, skills, diversity and expertise. The Board seeks to maintain a diverse membership, but there is no separate policy on diversity. The Board is open to receiving recommendations from shareholders as to potential candidates it might consider.
57
Section 16(a) Beneficial Ownership Compliance
Section 16(a) of the Securities Exchange Act requires executive officers and directors, and persons who own more than 10% of our common stock, to file reports regarding ownership of, and transactions in, our securities with the Securities and Exchange Commission and to provide us with copies of those filings. Based solely on the review of the copies of such forms received by us, or written representations from certain reporting persons, we believe that during fiscal year ended December 31, 2010, all filing requirements applicable to officers, directors and greater than ten percent beneficial owners were complied with.
Code of Ethics.
Due to our small size and continuing efforts to establish our business, we have not yet adopted a Code of Ethics which applies to executive officers and employees, including our Chief Executive Officer and Chief Financial Officer. However, the Board does intend to consider adopting a Code of Ethics in the ensuing months and, if adopted, will be disclosed in a Current Report on Form 8-K. Once adopted, we will provide a copy of the Code of Ethics to any person without charge, upon request. The request for a copy can be made in writing to Crownbutte Wind Power, Inc., 111 5th Avenue NE, Mandan, N”D 58554.
Item 11: Executive Compensation
Summary Compensation Table
The following table sets forth the total compensation of the principal executive officers and principal accounting officer paid or accrued during the two years ended December 31, 2010, and December 31, 2009. No other executive officer of Crownbutte received total compensation in excess of $100,000 during that period. In accordance with the rules of the SEC, the compensation described in this table does not include (i) medical, group life insurance or other benefits received by any of the named executive officers that are available generally to all of our salaried employees or (ii) perquisites and other personal benefits received by the named executive officers that in the aggregate do not exceed $10,000.
|
Principal
Position(s)
(a)
|
Year
(b)
|
|
Salary
($)
(c)
|
|
Bonus
($)
(d)
|
Stock
Awards
($)
(e)
|
|
Option
Awards
($)
(f)
|
|
Non-Equity
Incentive
Plan
Compensation
($)
(g)
|
Change in
Pension Value
and Nonqualified
Deferred
Compensation
Earnings
($)
(h)
|
All Other
Annual
Compensation
($)
(i)
|
Total
($)
(j)
|
||||||||||
|
Timothy H. Simons
|
2010
|
$
|
108,000
|
(1)
|
-
|
-
|
-
|
-
|
$
|
--
|
$
|
108,000
|
|||||||||||
|
President & COO
|
2009
|
$
|
105,600
|
-
|
-
|
-
|
-
|
-
|
$
|
1,080
|
$
|
106,680
|
|||||||||||
|
Manu Kalia
|
2010
|
$
|
100,000
|
-
|
-
|
$
|
702,702
|
-
|
-
|
$
|
-
|
$
|
802,702
|
||||||||||
|
CFO
|
2009
|
$
|
100,000
|
-
|
-
|
$
|
702,702
|
-
|
-
|
$
|
-
|
$
|
802,702
|
||||||||||
|
Terry Pilling
|
2010
|
$
|
100,000
|
-
|
-
|
$
|
-
|
-
|
-
|
$
|
2,250
|
$
|
102,250
|
||||||||||
|
Executive Vice President (2)
|
2009
|
$
|
100,000
|
-
|
-
|
$
|
-
|
-
|
-
|
$
|
2,250
|
102,250
|
|||||||||||
________________
58
(1) Represents accrued amount due to Mr. Simons for salary of the 12 month period ending December 31, 2010.
(2) From September 17, 2008 to February 15, 2010, Mr. Pilling was Vice President of Operations and Technology.
Each of Messrs. Kalia and Pilling is party to an employment agreement with the Company governing his compensation. See “Employment Agreements with Executive Officers” below. There are no other written or unwritten agreements with other executive officers, other than Messrs. Kalia and Pilling. Mr. Simons’ compensation is determined annually by the Board of Directors.
Chronology of Stock and Option Awards
In June 2008, Timothy Simons was granted warrants to purchase 1,000,000 shares of restricted common stock at an exercise price of $0.10 per share, vesting immediately and with a term of five years. These warrants were granted to Mr. Simons as part of a negotiated transaction and were not issued as compensation.
In June 2008, Ryan Fegley was granted warrants to purchase 5,000,000 shares of restricted common stock at an exercise price of $0.01 per share, vesting immediately and with a term of three years.
In September 2008, Manu Kalia entered into an employment agreement with Crownbutte wherein he was to be granted 1,000,000 shares of restricted common stock, vesting quarterly in four equal portions beginning January 1, 2009. The employment agreement has since been amended (on January 1, 2009) to change the grant of shares into a grant of warrants to purchase the same number of shares (1,000,000) at an exercise price of $0.001 per share, vesting on the same four-quarter schedule. Manu Kalia was also granted warrants to purchase 1,000,000 shares at an exercise price of $0.001 per share, vesting 100% on September 15, 2009.
On December 9, 2010, the Company’s Board of Directors authorized the issued of warrants to three Company employees and executives. The warrants consist of options to purchase 12,000,000 shares of the Company’s common stock at $0.02 per share exercisable for a period of five years. The warrants vested immediately
In each accounting period, the value of each stock or option award that vests shall be expensed according to the principles of FAS123(R).
|
OPTION AWARDS
|
STOCK AWARDS
|
||||||||||||||||||||
|
Name
(a)
|
Number of
Securities
Underlying
Unexercised
Options (#)
Exercisable
(b)
|
Number of
Securities
Underlying
Unexercised
Options (#)
Unexercisable
(c)
|
Equity
Incentive
Plan Awards:
Number of
Securities
Underlying
Unexercised
Unearned
Options (#)
(d)
|
Option
Exercise
Price ($)
(e)
|
Option
Expiration
Date
(f)
|
Number of
Shares or Units
of Stock That
Have Not
Vested (#)
(g)
|
Market Value
of Shares or
Units of Stock
That Have Not
Vested ($)
(h)
|
Equity Incentive
Plan Awards:
Number of
Unearned
Shares, Units or
Other Rights
That Have
Not Vested (#)
(i)
|
Equity Incentive
Plan Awards:
Market or
Payout Value of
Unearned Shares,
Units or Other
Rights That Have
Not Vested (#)
(j)
|
||||||||||||
|
Timothy H. Simons
|
1,000,000
|
(1)
|
-
|
-
|
$
|
0.10
|
July 2, 2013
|
-
|
-
|
-
|
-
|
||||||||||
|
Timothy H. Simons
|
4,000,000
|
(2)
|
-
|
-
|
0.02
|
Dec. 9, 2015
|
-
|
-
|
-
|
-
|
|||||||||||
|
Manu Kalia
|
-
|
1,000,000
|
-
|
$
|
0.001
|
Sept. 15, 2013
|
1,000,000
|
$
|
500,000
|
-
|
-
|
||||||||||
|
Terry Spilling
|
4,000,000
|
(3)
|
--
|
-
|
0.02
|
Dec. 9, 2009
|
-
|
-
|
-
|
-
|
|||||||||||
__________________
59
|
(1)
|
Mr. Simons received these warrants as part of a negotiated transaction and not as compensation.
|
|
(2)
|
Mr. Simons received these warrants as part of a compensation award from the Board.
|
|
(3)
|
Mr. Pilling received these warrants as part of a compensation award from the Board.
|
Employment Agreements with Executive Officers
On September 17, 2008, the Company entered into an employment agreement with Terry Pilling to serve as its Chief of Operations and Technology. Pursuant to the Agreement, Mr. Pilling receives annual compensation of $100,000. He has the opportunity to acquire stock options through a Company plan if and when the Company adopts an equity incentive plan, and the Company will contribute one-half of the value of the stock as part of his compensation, not to exceed 15% of the his gross annual salary. No equity incentive plan had been adopted by the Company as of December 31, 2010. Mr. Pilling is entitled to participate in the benefits from time to time in effect for the Company’s employees holding similar positions, along with vacation, sick and holiday pay in accordance with policies established and in effect from time to time. The Company may terminate the employment agreement with notice if (i) the Company discontinues operation of its business or is forced to reduce its personnel due to lack of work or (ii) Mr. Pilling becomes “permanently disabled” (as defined in the agreement). If Mr. Pilling breaches any of the terms of the agreement or if there is just cause for termination, the Company may terminate Mr. Pilling without notice. Mr. Pilling may terminate his employment with one month’s notice. On February 15, 2010, Mr. Pilling was promoted to Executive Vice President.
Subsequent to December 31, 2010, the following actions were taken with respect to agreements with various executive officers of the Company:
|
·
|
On February 1, 2011, the Company and Mr. Pilling voluntarily terminated the existing employment agreement;
|
|
·
|
On February 1, 2011, the Company and Timothy Simons entered into a Consulting Agreement concerning Mr. Simons services and actions performed in the capacity as the Chief Operations Officer of the Company for the ensuing 12 months. Under the Consulting Agreement, Mr. Simons is paid $5,000 per month, with $2,500 being paid in cash and the remaining $2,500 being accrued for each month in which services are performed. The accrued amount is paid in the future, subject to Company discretion based on cash flows and other financial consideration. In the event of termination by the Company, Mr. Schaftlein is entitled his pro-rata share of compensation for the remaining balance of the 12 month term;
|
|
·
|
On February 1, 2011, the Company and Mark Schaftlein entered into a Consulting Agreement concerning Mr. Schaftlein’s services and actions performed in the capacity as Controller of the Company for the ensuing 12 months. Under the Consulting Agreement, Mr. Schaftlein is paid $5,000 per month, with $2,500 being paid in cash and the remaining $2,500 being accrued for each month in which services are performed. The accrued amount is paid in the future, subject to Company discretion based on cash flows and other financial consideration. In the event of termination by the Company, Mr. Schaftlein is entitled his pro-rata share of compensation for the remaining balance of the 12 month term;
|
|
·
|
On February 1, 2011, the Company and Murray Fleming entered into a Consulting Agreement concerning Mr. Fleming’s services and actions performed in the capacity as capacity of the Chief Operations Officer of the Company for the ensuing 12 months. Under the Consulting Agreement, Mr. Fleming would be paid $5,000 per month, with $2,500 being paid in cash and the remaining $2,500 being accrued for each month in which services are performed. The accrued amount is paid in the future, subject to Company discretion based on cash flows and other financial consideration. In the event of termination by the Company, Mr. Fleming is entitled his pro-rata share of compensation for the remaining balance of the 12 month term; and
|
|
·
|
On February 1, 2011, the Company and Terry Pilling entered into a Consulting Agreement concerning Mr. Pilling’s services as the Executive Vice President of Operations of the Company for the ensuing 12 months. Under the Consulting Agreement, Mr. Pilling would be paid $5,000 per month, with $4,000 being paid in cash and the remaining $1,000 being accrued for each month in which services are performed. The accrued amount is paid in the future, subject to Company discretion based on cash flows and other financial consideration. In the event of termination by the Company, Mr. Simons is entitled his pro-rata share of compensation for the remaining balance of the 12 month term
|
60
SIMPLE Retirement Plan
In August 2007, the Company established a SIMPLE retirement plan. Employees are required to be employed by the Company for one year before they become eligible to participate in thie plan. The Company matches employee contributions made to the plan up to 3% of the employee’s gross wages. Contributions are vested when made. The Company’s contributions to the plan were $1,450 for the year ended December 31, 2010 and $5,141 for the year ended December 31, 2009. Contributions to the plan on behalf of Terry Pilling in 2010 and 2009 and on behalf of Mr. Simons in 2009 are also included in the All Other Compensation column in the Summary Compensation Table above.
Potential Payments upon Termination or Change in Control
We have no contract with any officer that would give rise to any cash or non-cash compensation resulting from the resignation, retirement or any other termination of such officer’s employment with Crownbutte or from a change in control of Crownbutte or a change in any officer’s responsibilities following a change in control. Currently, all of our executive officers serve at the pleasure of the Board.
Director Compensation
We do not grant stock awards to our directors for their services as directors. Our non-employee directors are generally paid $500 per year and reimbursed for reasonable and necessary out of pocket expenses incurred in connection with their service to us, including travel expenses.
The following table sets forth information concerning the compensation of our sole non-employee director during the fiscal year ended December 31, 2010.
|
Fees Earned or
|
||||||||||||
|
Paid in Cash
|
Stock Awards
|
Total
|
||||||||||
|
Name
|
($)
|
($)
|
($)
|
|||||||||
|
Ross Mushik
|
500 | (1) | N/A | 500 | ||||||||
|
Total
|
500 | N/A | 500 | |||||||||
|
(1)
|
A total of 3,333 shares were issued, valued at $500, for directors fees for the year period ended December 31, 2010.
|
The following tables set forth certain information regarding the beneficial ownership of our common stock as of April 13, 2010, by (i) each person who, to our knowledge, owns more than 5% of the common stock; (ii) each of our directors and executive officers; and (iii) all of our executive officers and directors as a group. Unless otherwise indicated in the footnotes to the following tables, each person named in the table has sole voting and investment power, except to the extent such power may be shared with a spouse.. Shares of common stock subject to options or warrants currently exercisable or exercisable within 60 days of that date are deemed outstanding for computing the share ownership and percentage of the person holding such options and warrants, but are not deemed outstanding for computing the percentage of any other person.
61
|
Amount and
Nature of
Beneficial
Ownership
|
Percent of
Class +
|
|||||||
|
Timothy H. Simons (1) (3)
|
10,500,000
|
25.0
|
%
|
|||||
|
Mark Schaeftlein) (5)
|
0
|
*
|
||||||
|
Murray Fleming(5)
|
0
|
*
|
|
|||||
|
Terry Pilling (3) (4)
|
4,000,000
|
9.7
|
%
|
|||||
|
Directors and executive officers as a group (4 persons) (1)(3)
|
14,500,000
|
31.5
|
%
|
|||||
|
Manu Kalia (2) (4)
|
2,082,164
|
5.3
|
%
|
|||||
|
Nacel Energy Corporation
1700 Glenarm Street, Suite 2800S
Denver, Colorado 80202
|
10,500,000
|
28.3
|
%
|
|||||
________________
* Less than one percent
+ Based on 37,044,138 shares of common stock issued and outstanding as of April 13, 2011, before consideration of options and warrants deemed to be outstanding.
|
(1)
|
Includes an aggregate total of 5,000,000 shares of common stock issuable upon exercise of warrants currently exercisable or exercisable within 60 days.
|
|
(2)
|
Includes warrants to purchase 2,000,000 shares of restricted stock that are currently exercisable or exercisable within 60 days.
|
|
(3)
|
Includes an aggregate total of 5,000,000 shares of common stock issuable upon exercise of warrants currently exercisable or excercisable within 60 days.
|
|
(4)
|
Person’s address is c/o Crownbutte Wind Power, Inc., 111 5th Avenue NE, Mandan, ND 58554.
|
|
(5)
|
Person’s or address is c/o Nacel Energy Corporation, 1700 Glenarm Street, Suite 2800S, Denver, Colorado 80202.
|
Other than as disclosed below and in the “Executive Compensation” section above, there have been no transactions, or currently proposed transactions, in which we were or are to be a participant and the amount involved exceeds the lesser of $120,000 or 1% of the average of our total assets at year end for the last two fiscal years ended at December 31, 2010 and December 31, 2009 and in which any of our directors, executive officers or beneficial holders of more than 5% of our outstanding common stock, or any of their respective immediate family members, has had or will have any direct or material indirect interest.
Between May 21, 2009 and September 29, 2009, the Company borrowed at total of $44,3000 from Timothy Simons, one of the Company’s stockholders and its then CEO. The terms of the loans are non-interest bearing and payable upon demand. Amounts owed totaled $33,991 and $42,380 as of December 31, 2010 and 2009, respectively.
Subsequent to December 31, 2010, the Company and Mr. Simons have agreed to a repayment schedule of the outstanding loan which would result in the unpaid balance being paid in full by December 31, 2011, if all payments are made as currently scheduled.
62
The aggregate fees billed to us by our principal accountant for services rendered during the fiscal years ended December 31, 2010 and 2009 are set forth in the table below:
|
Fee Category
|
Fiscal year ended
December 31,
2010
|
Fiscal year ended
December 31,
2009
|
||||||
|
Audit fees (1)
|
$
|
40,510
|
$
|
44,500
|
||||
|
Audit-related fees (2)
|
$
|
0
|
$
|
30,000
|
||||
|
Tax fees (3)
|
$
|
0
|
$
|
0
|
||||
|
All other fees (4)
|
$
|
0
|
$
|
0
|
||||
|
Total fees
|
$
|
0
|
$
|
0
|
||||
|
(1)
|
“Audit fees” consists of fees billed for professional services rendered for the audit of consolidated financial statements, for reviews of our interim consolidated financial statements included in our quarterly reports on Forms 10-Q and for services that are normally provided in connection with statutory or regulatory filings or engagements.
|
|
(2)
|
“Audit-related fees” consists of fees billed for assurance and related services that are reasonably related to the performance of the audit or review of our consolidated financial statements, but are not reported under “Audit fees.”.
|
|
(3)
|
“Tax fees” consists of fees billed for professional services relating to tax compliance, tax planning, and tax advice.
|
|
(4)
|
“All other fees” consists of fees billed for all other services.
|
Audit Committee’s Pre-Approval Practice
Our Board currently has no separate Audit Committee. Accordingly, the entire Board of Directors functions as our audit committee. Our Board is directly responsible for the appointment, compensation, retention and oversight of the work of any registered public accounting firm engaged by us for the purpose of preparing or issuing an audit report or performing other audit, review or attest services for us, and each such registered public accounting firm must report directly to the Board. It is our Board’s policy to approve in advance all audit, review and attest services and all non-audit services (including, in each case, the engagement fees therefor and terms thereof) to be performed by our independent auditors, in accordance with applicable laws, rules and regulations. During fiscal 2010 and 2009, all such services were pre-approved by the Board in accordance with this policy.
Our Board engaged Sherb & Co., LLP as our independent registered public accounting firm for purposes of auditing our financial statements for the year ended December 31, 2009. In accordance with Board’s practice, Sherb & Co., LLP was pre-approved by the Board to perform these audit services for us prior to its engagement.
In February, 2011, our Board engaged MaloneBailey LLP as our independent registered public accounting firm for purposes of auditing our financial statements for the year ended December 31, 2010.
63
PART IV
Item 15: Exhibits, Financial Statement Schedules
(a) List of documents filed as part of this Report:
None
(b) Exhibits:
The following exhibits listed are filed as part of this Report:
EXHIBIT NO. DESCRIPTION OF EXHIBIT
|
No.
|
Description
|
|||
|
2.1
|
(1)
|
Agreement and Plan of Merger and Reorganization, dated as of July 2, 2008, by and among Crownbutte Wind Power, Inc. (f/k/a ProMana Solutions, Inc.), a Nevada corporation (the “Registrant” or the “Company”), Crownbutte Acquisition Sub Inc., a North Dakota corporation, and Crownbutte Wind Power, Inc., a North Dakota corporation
|
||
|
2.2
|
(1)
|
Articles of Merger of Crownbutte Acquisition Sub Inc. with and into Crownbutte Wind Power, Inc., a North Dakota corporation, filed as of July 2, 2008
|
||
|
3.1
|
(1)
|
Restated Articles of Incorporation of the Registrant, filed as of July 2, 2008
|
||
|
3.2
|
(1)
|
Amended and Restated Bylaws of the Registrant, adopted as of June 2008
|
||
|
4.1
|
(1)
|
Form of the certificate representing the Registrant’s common stock, par value $0.001 per share
|
||
|
4.2
|
(1)
|
Form of Warrant of the Registrant issued to former holders of warrants of Crownbutte Wind Power, Inc., a North Dakota corporation, issued in connection with a private placement offering by Crownbutte Wind Power, Inc., a North Dakota corporation, completed in April 2008
|
64
|
No.
|
Description
|
|||
|
4.3
|
(1)
|
Form of Investor Warrant of the Registrant, issued in connection with a private placement offering by the Registrant completed in September 2008
|
||
|
4.4
|
(1)
|
Form of Lock-Up Agreement between the Registrant and Timothy H. Simons and Dan Gefroh
|
||
|
10.1
|
(1)
|
Split-Off Agreement, dated as of July 2, 2008, by and among the Registrant, Pro Mana Technologies, Inc., Crownbutte Wind Power, Inc., a North Dakota corporation, Robert A. Basso and Lawrence J. Kass
|
||
|
10.2
|
(1)
|
General Release Agreement, dated as of July 2, 2008, by and among the Registrant, Pro Mana Technologies, Inc., Crownbutte Wind Power, Inc., a North Dakota corporation, Robert A. Basso and Lawrence J. Kass
|
||
|
10.3
|
(1)
|
Escrow Agreement, dated as of July 2, 2008, by and among the Registrant, Timothy H. Simons and Gottbetter & Partners, LLP
|
||
|
10.4
|
(1)
|
Form of Subscription Agreement by and between Crownbutte Wind Power LLC and certain investors
|
||
|
10.5
|
(1)
|
Form of Subscription Agreement by and between the Registrant and certain investors
|
||
|
10.6
|
(1)
|
Form of Registration Rights Agreement by and between the Registrant and the selling stockholders
|
||
|
10.7
|
(1)
|
Escrow Agreement, dated as of July 2, 2008, by and among the Registrant, Strasbourger Pearson Tulcin Wolff, Inc. and Gottbetter & Partners, LLP
|
||
|
10.8
|
(1)
|
Placement Agency Agreement, dated as of November 15, 2007, by and between Crownbutte Wind Power LLC and Strasbourger Pearson Tulcin Wolff, Inc.
|
||
|
10.9
|
(1)
|
Memorandum of Understanding, dated as of July 15, 2006, by and between the Registrant and Manu Kalia
|
||
|
10.10
|
(1)
|
Employment Contract, dated as of September 15, 2008, by and between the Registrant and Manu Kalia
|
||
|
10.11
|
(1)
|
Employment Contract, dated as of November 27, 2007, by and between the Registrant and Ryan Fegley
|
||
|
10.12
|
(1)
|
Asset Purchase and Development Agreement, effective December 27, 2006, between Crownbutte Wind Power LLC and Gascoyne Wind LLC
|
||
|
10.13
|
(2)
|
Asset Purchase Agreement, effective September 30, 2008, between Crownbutte Wind Power LLC and Gascoyne Wind LLC
|
||
|
10.14
|
(1)
|
General Consulting Services Agreement, dated July 31, 2007, between Crownbutte Wind Power LLC and Montana-Dakota Utilities Co.
|
||
|
10.15
|
(1)
|
Wind Development Agreement, dated January 14, 2008, between Crownbutte Wind Power LLC and EverGreen Energy
|
65
|
No.
|
Description
|
|||
|
10.16
|
(1)
|
Gascoyne Wind Park Joint Venture Agreement, dated May 27, 2008, between Crownbutte Wind Power LLC and Westmoreland Power, Inc.
|
||
|
10.17
|
(1)
|
Asset Purchase Agreement, dated September 25, 2008, between Crownbutte Wind Power, Inc., a North Dakota corporation, and American Seawind Energy LLC
|
||
|
10.18
|
(1)
|
Form of Lease Option Agreement & Wind Energy Lease between the Registrant and a landowner
|
||
|
10.19
|
(2)
|
Employment Contract, dated as of September 17, 2008, by and between the Registrant and Terry Pilling
|
||
|
10.20
|
*
|
Promissory Note, dated as of March 29, 2010, in the principal amount of $100,000, issued by the Registrant to Catherine C. Coleman
|
||
|
10.21
|
*
|
Promissory Note, dated as of March 29, 2010, in the principal amount of $100,000, issued by the Registrant to David L. Cohen
|
||
|
21
|
(1)
|
Subsidiaries of the Registrant
|
||
|
31.1
|
*
|
Certification pursuant to SEC Rules 13a-14(a) and 15d-14(a), adopted pursuant to Section 302 of the Sarbanes-Oxley Act of 2002 (Mark Schaftlein, Chief Executive Officer and Principal Accounting Officer)
|
||
|
32.1
|
*
|
Certification of Chief Executive Officer, pursuant to 18 U.S.C. Section 1350, adopted pursuant to Section 906 of the Sarbanes-Oxley Act of 2002 (Mark Schaftlein, Chief Executive Officer and Principal Accounting Officer) †
|
________________
|
(1)
|
Incorporated by reference to the like numbered Exhibit to the Registrant’s Amendment No. 1 to Registration Statement on Form S-1 (File No. 333-156467), filed with the SEC on April 24, 2009.
|
|
(2)
|
Incorporated by reference to the like numbered Exhibit to the Registrant’s Amendment No. 2 to Registration Statement on Form S-1 (File No. 333-156467), filed with the SEC on June 19, 2009.
|
* Filed herewith.
† This certification is being furnished and shall not be deemed “filed” with the SEC for purposes of Section 18 of the Exchange Act, or otherwise subject to the liability of that section, and shall not be deemed to be incorporated by reference into any filing under the Securities Act or the Exchange Act, except if and to the extent that the Registrant specifically incorporates it by reference.
66
Pursuant to the requirements of Section 13 or 15(d) of the Securities Exchange Act of 1934, as amended, the Registrant has duly caused this report to be signed on its behalf by the undersigned, thereunto duly authorized.
|
CROWNBUTTE WIND POWER, INC.
|
||
|
Dated: April 15, 2011
|
By:
|
/s/ Timothy H. Simons
|
|
Timothy H. Simons, Chief Operating Officer
|
||
|
By:
|
/s/ Mark Schaftlein
|
|
|
Mark Schaftlein, Chief Executive Officer and Chief Financial Officer
|
||
In accordance with the Exchange Act, this report has been signed below by the following persons on behalf of the registrant and in the capacities and on the dates indicated.
|
SIGNATURE
|
TITLE
|
DATE
|
||
|
/s/ Timothy H. Simons
|
Director and Chief Operating
|
April 15, 2011
|
||
|
Timothy H. Simons
|
Officer (principal executive officer)
|
|||
|
/s/ Mark Schaftlein
|
Director, Chief Executive Officer and Chief Financial Officer
|
April 15, 2011
|
||
|
Mark Schaftlein
|
|
|||
|
/s/ Murray Fleming
|
Director
|
April 15, 2011
|
||
|
Murray Fleming
|
67