Attached files
| file | filename |
|---|---|
| EX-32.2 - Vyteris Holdings (Nevada), Inc. | v218510_ex32-2.htm |
| EX-31.1 - Vyteris Holdings (Nevada), Inc. | v218510_ex31-1.htm |
| EX-32.1 - Vyteris Holdings (Nevada), Inc. | v218510_ex32-1.htm |
| EX-31.2 - Vyteris Holdings (Nevada), Inc. | v218510_ex31-2.htm |
UNITED STATES
SECURITIES AND EXCHANGE COMMISSION
WASHINGTON, D.C. 20549
FORM 10-K
x ANNUAL REPORT PURSUANT TO SECTION 13 OR 15(d)
OF THE SECURITIES EXCHANGE ACT OF 1934
For the fiscal year ended December 31, 2010
¨ TRANSITION REPORT PURSUANT TO SECTION 13 OR 15(d)
OF THE SECURITIES EXCHANGE ACT OF 1934
Commission file number 000-32741
Vyteris, Inc.
(Exact Name of Registrant as Specified in Charter)
|
NEVADA
|
84-1394211
|
|
|
(State or Other Jurisdiction
|
(I.R.S. Employer
|
|
|
Of Incorporation or Organization)
|
Identification No.)
|
|
13-01 Pollitt Drive
|
||
|
Fair Lawn, New Jersey
|
07410
|
|
|
(Address of Principal Executive Office)
|
(Zip Code)
|
(201) 703-2299
(Registrant’s Telephone Number, Including Area Code)
Securities registered pursuant to Section 12(b) of the Exchange Act:
None
Securities registered pursuant to Section 12(g) of the Exchange Act:
Common stock, par value $0.015 per share
(Title of class)
Indicate by check mark if the registrant is a well-known seasoned issuer, as defined in Rule 405 of the Securities Act. Yes ¨ No x
Indicate by check mark if the registrant is not required to file reports pursuant to Section 13 or Section 15(d) of the Act. Yes ¨ No x
Check whether the issuer (1) filed all reports to be filed by Section 13 or 15(d) of the Exchange Act during the past twelve months (or for such shorter period that the registrant was required to file such reports), and (2) has been subject to such filing requirements for the past 90 days. Yes x No ¨
Check if there is no disclosure of delinquent filers in response to Item 405 of Regulation S-K contained in this form, and no disclosure will be contained, to the best of the registrant’s knowledge, in definitive proxy or information statements incorporated by reference in Part III of this Form 10-K or any amendment to this Form 10-K. x
Indicate by check mark whether the registrant is a large accelerated filer, an accelerated filer, a non-accelerated filer, or a smaller reporting company. See the definitions of “large accelerated filer,” “accelerated filer,” and “smaller reporting company” in Rule 12b-2 of the Exchange Act.
|
Large accelerated filer ¨
|
Accelerated filer ¨
|
|
Non-accelerated filer ¨
|
Smaller Reporting Company x
|
Indicate by check mark whether the registrant is a shel1 company (as defined in Rule 12b-2 of the Exchange Act).
Yes ¨ No x
State issuer’s revenues for its most recent fiscal year. $117,792
State the aggregate market value of the voting and non-voting common equity held by non-affiliates computed by reference to the price at which the common equity was sold, or the average bid and asked price of such common equity, as of a specified date within the past 60 days. (See definition of affiliate in Rule 12b-2 of the Exchange Act.) The aggregate market value of voting and non-voting common equity held by non-affiliates as of June 30, 2010, based upon the price at which such common equity was sold, was approximately $5,666,889. The number of shares outstanding of the registrant’s Common Stock, as of March 31, 2011, was 69,175,223 shares.
Documents Incorporated by Reference
Portions of the Definitive Proxy Statement for the 2011 Annual Meeting of Stockholders are incorporated by reference in Part III hereof.
VYTERIS , INC.
ANNUAL REPORT ON FORM 10-K
FOR THE YEAR ENDED DECEMBER 31, 2010
TABLE OF CONTENTS
|
Form 10-K
Item Number:
|
Page
No.
|
|||
|
PART I
|
||||
|
Cautionary Statement Regarding Forward-Looking Statements
|
3 | |||
|
Item 1.
|
Business
|
4 | ||
|
Item 1A.
|
Risk Factors
|
15 | ||
|
Item 1B.
|
Unresolved Staff Comments
|
|||
|
Item 2.
|
Properties
|
27 | ||
|
Item 3.
|
Legal Proceedings
|
27 | ||
|
Item 4.
|
Submission of Matters to a Vote of Security Holders
|
27 | ||
|
PART II
|
||||
|
Item 5.
|
Market for Registrant’s Common Equity, Related Stockholder Matters and Issuer Purchases of Equity Securities
|
28 | ||
|
Item 7.
|
Management’s Discussion and Analysis of Financial Condition and Results of Operations
|
29 | ||
|
Item 8.
|
Financial Statements and Supplementary Data
|
41 | ||
|
Item 9.
|
Changes in and Disagreements With Accountants on Accounting and Financial Disclosure
|
73 | ||
|
Item 9A.
|
Controls and Procedures
|
73 | ||
|
Item 9B.
|
Other Information
|
74 | ||
|
PART III
|
||||
|
Item 10.
|
Directors, Executive Officers and Corporate Governance
|
74 | ||
|
Item 11.
|
Executive Compensation
|
74 | ||
|
Item 12.
|
Security Ownership of Certain Beneficial Owners and Management and Related Stockholder Matters
|
74 | ||
|
Item 13.
|
Certain Relationships and Related Transactions, and Director Independence
|
75 | ||
|
Item 14.
|
Principal Accounting Fees and Services
|
75 | ||
|
PART IV
|
||||
|
Item 15.
|
Exhibits
|
75 | ||
|
Signatures
|
79 |
Vyteris® and LidoSite® are our trademarks. All other trademarks or servicemarks referred to in this Annual Report on Form 10-K are the property of their respective owners.
2
CAUTIONARY STATEMENT REGARDING FORWARD-LOOKING STATEMENTS
Certain information included in or incorporated by reference in this report, in press releases, written statements or other documents filed with or furnished to the Securities and Exchange Commission, or in our communications and discussions through webcasts, phone calls, conference calls and other presentations and meetings, other than purely historical information, including estimates, projections, statements relating to our business plans, objectives and expected operating results, and the assumptions upon which those statements are based, are “forward-looking statements” within the meaning of the Private Securities Litigation Reform Act of 1995. These forward-looking statements generally are identified by the words “believe,” “project,” “expect,” “anticipate,” “estimate,” “intend,” “strategy,” “plan,” “future” “may,” “should,” “will,” “would,” “will be,” “will continue,” “will likely result,” and similar expressions.
Reference is made to forward-looking statements, including, but not limited to, those regarding:
|
|
·
|
the anticipated amount, mix and timing of future product sales, revenues from services provided for our Contract Research Organization (“CRO”), business, royalty revenues or obligations, milestone payments, expenses, liabilities, charges, contractual obligations, cash expenditures, share-based compensation, currency hedges, ax benefits and effective tax rate, and amortization of intangible assets;
|
|
|
·
|
our ability to integrate our CRO business with our drug delivery business in a cost and operationally efficient manner;
|
|
|
·
|
growth trends for our CRO business and any products developed with our drug delivery technology;
|
|
|
·
|
the incidence, timing, outcome and impact of litigation, proceedings related to patents and other intellectual property rights, tax audits and assessments and other legal proceedings;
|
|
|
·
|
the timing and impact of accounting standards;
|
|
|
·
|
the design, costs, development and timing of, and therapeutic area and indications targeted by, programs in our technology pipeline;
|
|
|
·
|
the timing and outcome of regulatory filings and communications with regulatory authorities;
|
|
|
·
|
the impact of the global macroeconomic environment and the deterioration of the credit and economic conditions internationally;
|
|
|
·
|
our ability to finance our operations and business initiatives and obtain funding for such activities;
|
|
|
·
|
our reliance on third-parties for certain aspects of our business;
|
|
|
·
|
the structure, strategy, financial and operational impact, and timing of our framework for growth; and
|
|
|
·
|
the drivers for growing our business, including our plans to pursue external business development and research opportunities, and the impact of competition.
|
Any such forward-looking statements are not guarantees of future performance and actual results, developments and business decisions may differ materially from those envisaged by such forward-looking statements. These forward-looking statements speak only as of the date of the report, press release, statement, document, webcast, or oral discussion in which they were made. We undertake no obligation to update or revise publicly any forward-looking statements, whether as a result of new information, future events or otherwise. A detailed discussion of these and other risks and uncertainties that could cause actual results and events to differ materially from such forward-looking statements is included in the section entitled “Risk Factors” (refer to Part I, Item 1A).
3
PART I
|
ITEM 1.
|
BUSINESS
|
Introduction
Vyteris, Inc. (the terms “Vyteris”, “we”, “our”, “us” and the “Company” refer to each of Vyteris, Inc. incorporated in the State of Nevada, its subsidiary, Vyteris, Inc. (incorporated in the State of Delaware), its subsidiary, MediSync BioServices, Inc. (“MediSync”) (incorporated in the State of Delaware) and the consolidated company) has developed and produced the first FDA-approved, electronically controlled transdermal drug delivery system that transports drugs through the skin comfortably, without needles. We believe that this platform technology can be used to administer a wide variety of therapeutics either directly into the skin or into the bloodstream.
On April 6, 2011, we completed a merger (the “Merger”) pursuant to which MediSync BioServices, Inc. became our wholly owned subsidiary. On April 1, 2011, the Company executed the Agreement and Plan of Merger with MediSync BioServices, Inc. and on April 6, 2011, the Company, and MediSync consummated the Merger by filing a Certificate of merger with the Secretary of State of the State of Delaware. MediSync’s business plan contemplates the acquisition and operation of contract research organizations (“CROs”) and related businesses. MediSync acquired one CRO in 2009, and is currently negotiating with several other acquisition targets. As a result of the Merger, we will operate in two business segments: a CRO business and a drug delivery technology business.
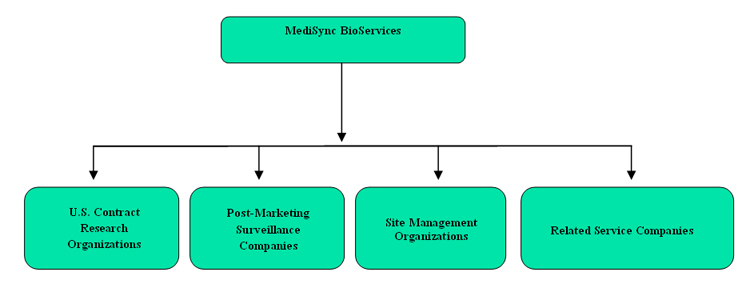
MediSync was formed in 2006 for the purpose of acquiring and consolidating CROs and related businesses, including but not limited to (i) SMOs, which sub-contract clinical trial-related responsibilities from CROs and pharmaceutical/biotechnology companies, (ii) post marketing surveillance companies, which monitor pharmaceutical drugs or devices after release into the market and (iii) clinical, regulatory and litigation consulting companies. We believe that MediSync’s current and future operations serve a growing demand for outsourced clinical research and related services in the pharmaceutical and biomedical industries. We further believe that each CRO and related business that MediSync acquires (each, an “Acquired Business”) may benefit from (a) potential cost savings and efficiencies proposed by the consolidation model, (b) the sharing of, and collaboration on, clinical research studies among the Acquired Businesses, (c) new services offered by other Acquired Businesses, and (d) synergistic efficiencies caused by MediSync’s consolidation with the existing Vyteris infrastructure.
The CRO Industry
CROs provide a wide range of pharmaceutical research and device-development services to the pharmaceutical, biotechnology, and medical device industries, including, but not limited to, product development and formulation, clinical trial management, and data management services to conform to Food and Drug Administration (FDA) regulations. The CRO industry revenue was predicted to approach $20 billion in 2010, or approximately one-third of research and development spending for the pharmaceutical and biotechnology sectors.1 Several analyst reports and studies have demonstrated a growing trend in pharmaceutical and biotechnology companies’ reliance on the outsourcing of clinical research and related services to CROs and similar organizations. For example, in mid-2009, it was estimated that approximately 25% of all biopharmaceutical drug development was being outsourced, representing a CRO market greater than $22 billion.2 Some industry analysts anticipate that the rate of outsourcing to CROs will accelerate, approaching 40% over the next several years.3
In addition, approximately $125 billion of revenue from patent-protected drugs may no longer be available in the next few years, due to recent and upcoming patent expirations.4 As a result, pressure on pharmaceutical companies to revive drug development pipelines has intensified.5 We believe that this pressure will lead to new drug development opportunities for CROs and related businesses.
1 CRO Market, www.acrohealth.org/cro-market1.html, as of March 6, 2011.
2 J.P. Morgan, CRO Report, July 16, 2009.
3 Goldman Sachs, Americas: Healthcare Services: Pharmaceutical Services, October 20, 2009.
4 Washington Drug Letter, FDA News, Vol. 42 No. 42, October 25, 2010.
5 J.P. Morgan, CRO Report, July 16, 2009.
4
Acquisition Strategy
We anticipate that MediSync’s Acquired Businesses will consist of companies that play an integral role in assisting pharmaceutical and biotechnology companies with the development of, and strategies relating to, drugs, biologics and medical devices. With respect to MediSync’s acquisition targets, we intend to focus on privately owned and operated companies that are profitable (after making certain pro-forma acquisition adjustments), have at least five years of operating history, and have built a good reputation through working with numerous well-known pharmaceutical and/or biotechnology customers. We plan to build value (i) through programs designed to drive incremental new revenues, (ii) by benefiting from economies of scale, proactive business development and marketing initiatives, centralized management and information systems, and “brand name” identification, and (iii) by broadening the scope of services offered by each of the Acquired Businesses.
With respect to the Acquired Businesses, we plan to strategically:
|
|
·
|
contribute expansion capital as appropriate and available;
|
|
|
·
|
increase operational efficiencies;
|
|
|
·
|
leverage the unique specialties and areas of expertise of each Acquired Business;
|
|
|
·
|
create new revenue streams through new service offerings;
|
|
|
·
|
leverage cost savings through economies of scale;
|
|
|
·
|
operate throughout the U.S. and subsequently embark upon a global expansion; and
|
|
|
·
|
carefully monitor the synergies among the Acquired Businesses to effectively nurture organic growth of their businesses.
|
We intend to cause each Acquired Business to maintain its own identity and specialty skills while at the same time benefiting from operating efficiencies and lower overhead costs. Because we plan to target small- to mid-size companies, we believe that a consolidation of resources of such companies could significantly contribute to the expansion of operations, resulting in increased revenues. We believe that our acquisition of carefully selected companies with complementary attributes and expertise will contribute to an inherent synergy, thereby allowing the Acquired Businesses to source, and collaborate on, clinical research studies among one another. Through this cross pollenization, MediSync can expand its operations by offering a larger range of services provided by each of its unique Acquired Businesses to potential customers.
We anticipate MediSync’s organizational structure to be as follows:
5
MediSync is pursuing acquisition targets with respect to its pipeline, which we intend to pursue for closing by the end of the first quarter of 2012. These include the following:
|
|
·
|
Potential extension of agreement with scientific consulting firm across a variety of business applications to industry and counsel in (i) assisting clients with the navigation of clinical and regulatory requirements, and (ii) supporting clients in defending their products in a variety of legal actions. Transaction terms include a total purchase price up to $7.3 million consisting of (i) $4.3 million in cash; (ii) $1.0 million in purchase money promissory note; (iii) 3.75 million shares of Company common stock valued at $0.8 million; and (iv) earn outs of up to $1.2 million over three years.
|
|
|
·
|
Signed letter of intent with a service management organization specializing in trials requiring a controlled environment. Transaction terms include a total purchase price of $10.0 million consisting of (i) $8.0 million in cash; and (ii) $0.6 million in Vyteris common stock, along with a $1.2 million earn out. Due diligence, as well as an audit of the targets financial statements, is underway.
|
|
|
·
|
Negotiations underway with a CRO with a 50 bed research unit. Transaction terms anticipated to include a total purchase price of $12.5 million, with $10.0 million in cash and $1.0 million in equity, with a $1.5 million three-year earn out.
|
|
|
·
|
Negotiations underway with an international CRO. Transaction terms anticipated to include a total purchase price of $7.5 million, with $1.0 million in cash and $4.0 million in equity, with $2.5 million in a combination of purchase money notes and/or earn outs.
|
|
|
·
|
Negotiations underway with a research company which specializes in post-marketing surveillance. Transaction terms anticipated to include a total purchase price of $7.5 million, with $4.0 million in cash, $1.8 million in earn out and $0.9 million in each of a purchase money note and equity.
|
There can be no assurances whether any or all of the above described acquisitions will be consummated or if financing can be secured for any acquisition, and if so, on what terms.
Our Drug Delivery Business
Technology
Our drug delivery business is technology driven. Our active transdermal drug delivery technology is based upon a process known as electrotransport, or more specifically iontophoresis, which is the ability to transport drugs, including peptides, through the skin by applying a low-level electrical current. Our active patch patented technology works by applying a charge to the drug-holding reservoir of the patch. This process differs significantly from passive transdermal drug delivery which relies on the slow, steady diffusion of drugs through the skin. A significantly greater number of drugs can be delivered through active transdermal delivery than is possible with passive transdermal delivery. Our technology can also be used in conjunction with complementary technologies to further enhance the ability to deliver drugs transdermally.
Market Opportunity
We believe there are a significant number of pharmaceutical drugs with substantial annual sales for which the patent is due to expire by 2012. Based on our analysis, there are currently a significant number of these and other FDA-approved drugs that may be relatively easily formulated for transdermal delivery and thus made eligible for new patent protection.
6
Business Model
Business Strategy and Initiatives
Our commercialization strategy is to develop near-term and future market opportunities utilizing FDA-approved and marketed drugs (primarily peptides and small molecule drugs) with our proprietary delivery technology. By targeting compounds that may qualify for accelerated development and regulatory pathways such as those implemented under Section 505(b)(2) of the Federal Food, Drug and Cosmetic Act, we strive to develop and commercialize products that can reach the market faster and at a reduced cost as compared to the traditional development and regulatory approval processes for new drugs. Additionally, we are exploring various strategies to derive revenue from our FDA approved LidoSite product, and our phase II infertility and phase I migraine projects. These strategies include sale or licensing of these products to third parties and pursuit of partnership opportunities with other companies in the pharmaceutical and biotechnology industries.
Technology initiatives are also under way to expand our drug delivery capabilities so that we are able to utilize our technology for a wider variety of pharmaceutical applications. We are looking to improve our existing patch and controller technology, as well as to implement innovative product manufacturing methods to reduce materials costs. We have been actively pursuing opportunities that combine our technology with complementary technologies such as ultrasound, chemical enhancers, in order to further increase transdermal drug penetration that may lead to successful delivery of higher molecular weight drugs. We are not currently manufacturing any products and if we are able to move toward commercial viability of products we will look for alternative production strategies, which may include outsourcing.
Market Opportunity
We have identified key areas of market opportunity in the areas of therapeutic peptides and small molecules which we intend to pursue:
|
|
·
|
Women’s health, such as infertility,
|
|
|
·
|
Migraine treatment,
|
|
|
·
|
Pain management, and
|
|
|
·
|
Metabolic diseases, such as diabetes and osteoporosis.
|
Our focus on these core market areas represents our belief in their relatively near-term commercialization and revenue-generating potential.
Female Infertility Treatment
One of our development opportunities is in the peptide delivery market. Pursuant to the termination provisions of our former Development Agreement with Ferring Pharmaceuticals, Inc. (“Ferring”), we believe we now own the rights for the development of an innovative product to treat female infertility using our smart patch technology. The product under development is designed to mimic the female body's natural rhythms of hormonal secretions, a characteristic important in the delivery of therapeutics for the treatment of infertility. To be effective, many patients currently need to undergo multiple injection-based protocols for ovulation inducement, sometimes as many as eight daily injections for up to three weeks. Our product would make it possible to administer the peptide without needles in a painless, convenient and cost-effective manner.
Migraine Treatment
Another key area where we are seeking to apply our smart patch technology is the treatment of migraines. This may be a highly attractive market segment, estimated at over $3 billion per year (“Migraine Market: Trexima Approval Delays Benefits Generic Triptan”, RedOrbit NEWS, published March 29, 2007), where major market leaders face imminent patent expirations. The treatment of migraine requires rapid onset of medication. A class of compounds known as “triptans” is currently considered an effective treatment. We believe a significant market opportunity exists to improve the efficacy of triptan therapy for migraines by changing the method by which triptans are administered. Taken orally, triptans often fail to deliver sufficient quantities of medication in the short time frame required to optimally treat migraine onset. Further, they often fail to prevent the second episode, known as recurrence, which many migraine patients suffer within 12 to 18 hours after a first attack.
7
Our active patch technology can be pre-programmed for rapid delivery — as little as 15 minutes to achieve therapeutic levels — followed by a sustained maintenance dose that may prevent headache recurrence. If our smart patch is applied in this area, this customizable drug delivery could offer advantages in the treatment of migraine, and could improve patient satisfaction and patient compliance. We believe that this could be a unique and significantly improved therapy and that it could be a potentially effective way to significantly improve treating and preventing recurring migraine headaches.
Pain Management
Another key area of potential partnership with pharmaceutical companies is in pain management, specifically, the non-steroidal anti-inflammatory drug (“NSAID”) sector, which falls in line with our strategy of pursuing high probability, low risk opportunities leading to better patient care. Some of the well-known NSAIDs that are or have been on the market are Vioxx, Celebrex, Naproxen and Daypro.
NSAIDs have made a dramatic contribution to pain management, but their extensive use has also documented a problematic safety profile, due to gastrointestinal (“GI”) side effects associated with extended use or over dosing of the drugs. In the United States alone, more than 107,000 hospitalizations are attributed to NSAID use, and more than 16,000 deaths a year are attributed to NSAID use (“Horizon Therapeutics Announces Two Pivotal HZT-501 Phase 3 Trials Meet Primary Endpoints,” Horizon Therapeutics, Inc., December 2, 2008).
Our active delivery system bypasses the gastrointestinal tract, minimizing the GI side effects associated with oral NSAIDs, and circumvents a major disadvantage of these commonly used medications. We believe that if our smart patch technology is applied to NSAIDs, the controlled drug delivery profile from our active patch could also curtail overdosing of the drugs.
Metabolic Diseases
We are also exploring the possible opportunities to use our technology to combat certain metabolic diseases, such as diabetes and osteoporosis.
Diabetes
Diabetes mellitus is a common metabolic disease. It is characterized by a lack of insulin secretion and/or increased cellular resistance to insulin, resulting in hyperglycemia and other metabolic disturbances. People with diabetes suffer from increased morbidity and premature mortality related to cardiovascular, microvascular and neuropathic complications. The delivery of peptides (insulin or GLP-1) through the skin drugs may be accomplished by iontophoresis alone or by a combination of physical or chemical enhancement technologies with iontophoresis to result in delivery of these therapies.
Osteoporosis
Osteoporosis is a metabolic skeletal disorder wherein bone strength decreases and risk of bone fracture increases. Bone strength is maintained by a continual process of bone resorption and bone regeneration. Osteoporosis results when bone resorption occurs at a faster rate than bone regeneration. We believe iontophoresis can be used to transdermally deliver calcium-regulating hormones such as salmon calcitonin and parathyroid hormone (1-34). Such delivery could be useful for chronic treatment of post-menopausal osteoporosis and other clinical indications as a superior alternative to injection.
Technology
Overview of Electrotransport, or Active Transdermal Drug Delivery
Our active transdermal drug delivery technology (also referred to as our smart patch technology) is based on a process known as electrotransport, or more specifically, iontophoresis, a process that transports drugs through the skin by applying a low-level electrical current. Our patented technology works by applying a charge to the drug-holding reservoir of the patch. A positive charge is applied to a reservoir where a positively charged drug molecule is held. Because like-charges repel, the drug molecules are forced out of the reservoir and into the skin (the same process can occur when a negative charge is applied to a reservoir containing a negatively charged drug molecule).
8
This process differs significantly from passive transdermal drug delivery, which relies on the slow, steady diffusion of drugs through the skin. Passive drug delivery patches have a limited number of applications including: smoking cessation, birth control, hormone replacement therapy, angina and motion sickness.
By contrast, using iontophoresis, certain drugs can be delivered through the skin and deeper into the bloodstream faster and in larger quantities than by passive transdermal patches. Because of the application of an external form of energy (electrical energy in the form of a charge), this mode of delivery is also called “active transdermal delivery”. Initial research indicates that a significantly greater number of drugs can be delivered through active transdermal delivery than through passive transdermal delivery. Based on our analysis, we estimate that there are currently in excess of 180 FDA-approved drugs that can be delivered through our active transdermal delivery platform.
Furthermore, because the drug is only delivered when current is being administered, our delivery system is precise, controllable and electronically programmable, thereby enabling active transdermal delivery technology to duplicate the steady or periodic delivery patterns of intravenous infusion. By controlling the intensity and duration of the charge applied, the smart patch controls whether the drug delivery is topical, or whether the delivery is systemic, in which case the drug molecules are pushed deeper into the skin, where they enter the body’s circulatory system directly. The technology also aids speed of absorption.
Our Approach to Iontophoresis
We have developed a proprietary technology encompassing a series of significant improvements to drug formulation and commercial manufacturing. We used this technology with our first FDA-approved product, LidoSite, and are currently using this technology to deliver peptides and small molecules in a research and development setting. Many of our innovations center on the way we approach designing and formulating electronically controlled drug delivery patches. Our patches are pre-filled with the proper dosage of drug during the manufacturing process. They are designed to be disposable after a single application and are discreet in appearance. Further, we designed our patches so that they can be quickly and cost-effectively mass-produced using automated manufacturing processes.
To complement our patch design, we approached the design of electronic controllers with the goal of being small, wearable, easy to operate and programmable to handle simple, as well as complex, drug delivery profiles. The dose controller contains a miniature battery and circuitry, controlling delivery rate, and is capable of recording information on the amount and time of drug delivered. We believe the controllability and programmability offered by our technology are distinct competitive advantages that will enable our products to deliver more consistent and predictable results for a broad range of existing and new drugs.
Clinical Studies
Infertility/Peptide Application
We assisted Ferring in completing a Phase I clinical trial demonstrating that our patented smart patch transdermal technology successfully delivered a peptide molecule in humans (multiple pulse) without the use of needles (noninvasively) in therapeutic levels aimed at the treatment of female infertility. The study results showed that therapeutic levels of the peptide in humans are achievable without the use of injections or infusion pumps. The clinical trial was conducted in the U.S. with 30 patients under an investigational new drug application. Specific technical data will undergo peer review for future disclosure.
In the Phase I clinical trial, a pulse profile controlled the transdermal delivery of the peptide from patches loaded with different concentrations of the peptide. The amounts of peptide delivered using the patch were comparable or higher than with subcutaneous (subQ) injection. The study used different formulations within our patch that were compared with subQ delivery of the peptide.
9
Ferring also conducted a Phase II clinical trial of the infertility product. The Phase II trial was a multi-center clinical trial conducted at approximately 35 centers throughout the U.S. and enrolled approximately 350 female patients between the ages of 18 and 38 years with anovulatory / oligoovulatory infertility. In this clinical trial, the safety, tolerability, and effectiveness of our transdermal delivery system was evaluated. We are currently reviewing the results of this trial to determine what degree of success was achieved based on the goals of the trial; whether an additional Phase II trial may be needed; and the feasibility of moving on to Phase III trials. We anticipate that any such additional trials would be conducted by a strategic partner pursuant to a development and marketing agreement.
LidoSite
We received FDA approval for the sale of our LidoSite product in the United States in 2004. Our LidoSite product is currently dormant, and there are no plans to engage in further development, marketing or licensing of this product.
Competition
Any existing or future products which we may develop will likely compete with both conventional drug delivery methods and advanced drug delivery methods.
Conventional Drug Delivery Methods
Traditionally, the pharmaceutical industry has relied on oral delivery and injection as the primary methods of administering drugs:
|
|
·
|
Conventional Oral Method. Conventional, oral drug dosage forms, such as pills and capsules, are the most common types of drug delivery. Oral drug delivery methods are easy to administer, but their efficacy can be limited because drugs must first pass through the digestive system and liver before being absorbed into the bloodstream. Therefore, orally delivered drug dosages must be large to overcome the degradation that occurs in the gastrointestinal tract and liver. As a result, conventional oral dosage forms often produce higher initial drug levels than are required to achieve the desired therapeutic effects, thereby increasing the risk of side effects, some of which can be serious. Also, it is difficult to maintain therapeutically optimal drug levels using oral drug delivery methods. Further, oral drug delivery methods can require patients to follow inconvenient dosing routines, which may diminish patient compliance with self-medication schedules.
|
|
|
·
|
Injection Methods. Injectable drug dosage forms generally provide rapid onset of therapeutic action and offer many of the same advantages as conventional oral drug dosage methods. Injectable drug delivery methods use needles, raising the possibility of needle-stick injuries, as well as the risk of infection to the caregiver and the patient. The use of needles also increases patient anxiety due to the pain of injection.
|
Advanced Drug Delivery Technologies
The limitations of conventional forms of drug delivery have driven demand for advanced drug delivery alternatives that are safer, more effective and more convenient. Advanced drug delivery technologies have improved oral and injection methods as well as offering new means of administering drugs, such as through the skin and the respiratory system. Advanced drug delivery technologies include sustained release pills and injectables, passive transdermal patches and infusion pumps, as well as pulmonary, nasal, intravaginal and opththalmic methods. In some cases, these technologies offer better control over the release of drugs into the bloodstream, thereby improving therapeutic efficacy and reducing side effects and risks. In other cases, advanced drug delivery technologies make therapies easier to administer and support more complex therapeutic regimens. Innovative drug delivery technologies can offer many advantages over traditional methods, including ease of use and administration, greater control of drug concentration in the blood, improved safety and efficacy, improved patient compliance, expanded indications for certain therapies, and totally new therapies using drugs that cannot be delivered otherwise.
10
The following is an overview of advanced drug delivery technologies and other alternative methods that could be direct or indirect competitors of our potential future products:
|
|
·
|
Sustained release oral dosage forms are designed to release the active ingredients of the drug into the body at either a predetermined point in time or at a predetermined rate over an extended period of time, generally do not work fast and may be partially destroyed by the liver and stomach before they get into the blood stream.
|
|
|
·
|
Passive transdermal patches allow absorption of drugs through the skin and generally provide a convenient method of administering drugs at a steady rate over an extended period of time, but onset of action may take hours after application, and absorption of the drug may continue for hours after the patch is removed, which can increase side effects. Additionally, because human skin is an effective barrier, most drug formulations will not passively permeate the skin in therapeutic quantities.
|
|
|
·
|
Sustained release injectable preparations allow conventional injectable drugs to be incorporated into a biodegradable material that is then injected and absorbed slowly into the surrounding tissue. These preparations reduce the frequency of injections by creating a small “depot” of the drug beneath the skin that is slowly absorbed by the body, thus increasing the interval between injections. They can turn a conventional once-a-day injection into a once weekly or even longer regimen.
|
|
|
·
|
Continuous infusion pumps are small implantable or externally-worn battery-powered pumps that introduce drugs directly into the body, using a needle or catheter inserted into tissue just below the skin or directly into the blood stream or spinal space. They use conventional drugs, and provide rapid onset of action as well as sustained or programmed delivery of medication. These are costly, complex electromechanical devices reserved mostly for treatment of chronic conditions such as the delivery of insulin for certain diabetes patients and for chronic intractable pain management for the treatment of certain forms of spasticity.
|
|
|
·
|
Pulmonary, nasal and transmucosal methods are designed to provide fast action or to deliver drugs that are destroyed by the gastro-intestinal tract. Variations in a user's respiratory tract, often brought on by everyday occurrences such as a cold, infection or even changes in climate, can markedly affect the amount of drug inhaled from each spray.
|
|
|
·
|
Jet injection drug delivery technology uses stored mechanical energy from either a spring or compressed gas cylinder to ballistically deliver a liquid or powder through the skin without a needle. Liquid jet injection has been used for many years with minimal success. A new technology allows the administration of small amounts of drugs in dry powder form through the skin using a specially engineered device, which propels the drug using a high-powered jet of helium gas. The gas accelerates the dry drug particles, enabling penetration of the skin.
|
Competition for our drug delivery products may come from any of the above technologies or new, yet-to-be-developed technologies.
Current and Potential Iontophoresis Competition
NuPathe Inc. is a privately-held specialty pharmaceutical company specializing in the development of therapeutic products based on iontophoresis for neurological and psychiatric diseases. NuPathe’s lead compound, Zelix™, combines sumatriptan with NuPathe’s proprietary Iontophoretic System. NuPathe completed its pivotal Phase III study and is believed to be planning an NDA filing in 2011.
Dharma Therapeutics, Inc. is a subsidiary of Transcu Group Limited. Dharma is an early stage drug delivery company based in Seattle, Washington which develops transdermal delivery systems with a focus on iontophoretic transdermal drug delivery technology. Dharma is currently developing products in the areas related to pain, inflammation, and nausea. Recently, Dharma completed Phase II clinical trials for its Lidocaine iontophoresis patch drug delivery system.
11
EyeGate Pharma is a specialty pharmaceutical company centered in ophthalmics and focused on developing and commercializing its EyeGate® II Delivery System and formulation technologies to deliver therapeutics to the eye. Eyegate uses iontophoresis technology to deliver drugs to both the anterior and posterior tissues of the eye. EyeGate Pharma’s initial focus is on treating inflammatory conditions like uveitis, which is responsible for an estimated 10 to 15 percent of all cases of blindness in the Unites States. The company recently completed a Phase II study of its lead product candidate, EGP-437, for the treatment of anterior uveitis, a proprietary formulation of a well-studied corticosteroid, for treating severe uveitis and dry eye.
Alza Corporation, formerly a Johnson & Johnson subsidiary, with its E-TRANS® system, is the only other company known to have developed pre-filled iontophoresis technology. Alza has chosen a very different application, delivery of an opiate-based product for systemic pain management, for its first product. Alza received approval of its IONSYSTM NDA in the summer of 2006 from the FDA. This approval further validates the potential value and utility of iontophoretic drug delivery, making this class of technology more attractive to the pharmaceutical and health-care industries. The Alza system was developed to treat pain associated with major surgery and cannot be used as a dermal anesthetic. We also believe that because Alza has incorporated the electronics into each patch, the added complexity of the product necessitates product development cycles for new applications that are significantly longer than those required by our system.
Travanti Pharma, Inc., formerly Birch Point Medical, Inc., a development stage company, developed a single use iontophoretic system called IontoPatch™, aimed at the physical therapy market. We believe that the IontoPatch product is not FDA-approved for any specific therapeutic indication and is not pre-filled with medication.
Becton Dickinson is engaged in developing alternative drug delivery technologies, and we may compete in the future with alternative technologies developed or acquired by Becton Dickinson. Becton Dickinson has developed drug delivery technology employing “micro-needles,” tiny needles that deliver compounds into the first few hundred microns of the skin. This technology, which has not yet been commercialized, may compete directly with our current technology.
Patents, Intellectual Property and Proprietary Technology
We protect our technological and marketing position in advanced transdermal drug delivery technology by filing U.S. patent applications and, where appropriate, corresponding foreign patent applications. Our success will depend in part upon our ability to protect our proprietary technology from infringement, misappropriation, duplication and discovery. Our policy is to apply for patent protection for inventions and improvements deemed important to the success of our business. We have a portfolio of approximately 50 U.S. patents and 70 foreign patents. We have approached the design and development of our active transdermal drug delivery systems with the objective of maximizing overall delivery system efficiency while addressing commercial requirements for reproducibility, formulation stability, safety, convenience and cost. To achieve this goal, our delivery systems integrate proprietary and patented technology with commercially available, off-the-shelf components.
Iontophoresis, as a way of delivering drugs, has been well known for many years. Our patent portfolio consists of innovations that advance basic iontophoresis technology through:
|
|
·
|
enabling more efficient electrode designs;
|
|
|
·
|
drug formulations that enhance iontophoresis;
|
|
|
·
|
specific transdermal patch features allowing convenient use and low manufacturing cost;
|
|
|
·
|
electronic circuitry and program algorithms improving the safety and control of medication delivery; and
|
|
|
·
|
ability to deliver specific classes of molecules not previously possible.
|
12
The issuance of a patent is not conclusive as to its validity or as to the enforceable scope of the claims of the patent. The patent positions of pharmaceutical, biotechnology and drug delivery companies, including our company, are uncertain and involve complex legal and factual issues. Accordingly, we cannot assure investors that our patents will prevent other companies from developing similar products or products which produce benefits substantially the same as our products, or that other companies will not be issued patents that may prevent the sale of our products or require us to pay significant licensing fees in order to market our products. If our patent applications are not approved or, even if approved, if such patents are circumvented or not upheld in a court of law, our ability to competitively exploit our patented products and technologies may be significantly reduced. Additionally, the coverage claimed in a patent application can be significantly reduced before the patent is issued. As a consequence, we do not know whether any of our patent applications will be granted with broad coverage or whether the claims that eventually issue or that relate to our current patents will be circumvented. Since patent applications in the United States can be maintained in secrecy until patents issue, and since publication of discoveries in scientific or patent literature often lag behind actual discoveries, we cannot be certain that we were the first inventor of inventions covered by our issued patents or pending patent applications or that we were the first to file patent applications or such inventions. Moreover, we may have to participate in interference proceedings declared by the United States Patent and Trademark Office to determine priority of invention, which could result in substantial cost to us, even if the eventual outcome is favorable. An adverse outcome could subject us to significant liabilities to third parties, require disputed rights to be licensed from or to third parties or require us to cease using the technology in dispute.
Also, patents may or may not provide competitive advantages for their respective products or they may be challenged or circumvented by competitors, in which case our ability to commercially exploit these products may be diminished.
From time to time, we may need to obtain licenses to patents and other proprietary rights held by third parties in order to develop, manufacture and market our products. If we are unable to timely obtain these licenses on commercially reasonable terms, our ability to commercially exploit such products may be inhibited or prevented. Additionally, we cannot be assured that any of our products or technology will be patentable or that any future patents we obtain will give us an exclusive position in the subject matter claimed by those patents. Furthermore, we cannot be assured that our pending patent applications will result in issued patents, that patent protection will be secured for any particular technology, or that our issued patents will be valid, enforceable and provide us with meaningful protection.
Although we have entered into invention assignment agreements with our employees and with certain advisors, if those employees or advisors develop inventions or processes independently which may relate to products or technology under development by us, disputes may arise about the ownership of those inventions or processes. Time-consuming and costly litigation could be necessary to enforce and determine the scope of our rights.
We also rely on trade secrets and proprietary know-how that we seek to protect, in part, through confidentiality agreements with our strategic partners, customers, suppliers, employees and consultants. It is possible that these agreements will be breached or will not be enforceable in every instance, and that we will not have adequate remedies for any such breach. It is also possible that our trade secrets will otherwise become known or independently developed by competitors.
Suppliers
Some of our principal suppliers of components, and other of our suppliers, are single-source. Although we have not experienced significant production delays attributable to supply changes, we believe that, for the electrode subcomponent and hydrogel in particular, alternative sources of supply would be difficult to develop over a short period of time. Because we do not have supply agreements and direct control over our third-party suppliers, interruptions or delays in the products and services provided by these third parties may be difficult to remedy in a timely fashion. In addition, if such suppliers are unable or unwilling to deliver the necessary parts or products or if we are unable to make full payments to these suppliers on a current basis, we may be unable to redesign or adapt our technology to work without such parts or find alternative suppliers or manufacturers. In such events, we could experience interruptions, delays, increased costs, or quality control problems.
Research and Development
We spent approximately 8,916 hours engaged in R&D in 2010. Most R&D was internally generated and not attributable to any customers.
13
Governmental Regulation
Under the United States Food, Drug and Cosmetic Act, "new drugs" must obtain clearance from the Food and Drug Administration, or FDA before they can be marketed lawfully in the United States. Applications for marketing clearance must be based on extensive clinical and other testing, the cost of which is very substantial. Approvals – sometimes including pricing approvals — are required from health regulatory authorities in foreign countries before marketing of pharmaceutical products may commence in those countries. Requirements for approval may differ from country to country, and can involve additional testing. There can be substantial delays in obtaining required clearances from both the FDA and foreign regulatory authorities after applications are filed. Even after clearances are obtained, further delays may be encountered before the products become commercially available in countries requiring pricing approvals.
Product development generally involves the following steps which are required by the regulatory process:
|
|
·
|
preclinical development, during which initial laboratory development and in vitro and in vivo testing takes place;
|
|
|
·
|
submission to the FDA of an investigational new drug application (IND) for the commencement of clinical studies;
|
|
|
·
|
adequate and well-controlled human clinical trials — Phase I, II and III studies —to establish the safety and efficacy of the product;
|
|
|
·
|
submission of an NDA to the FDA requesting clearance to market the product and comparable filings to regulatory agencies outside the United States if the product is to be marketed outside of the United States; and
|
|
|
·
|
clearance from the FDA — and foreign regulatory authorities, if applicable — must be obtained before the product can be marketed.
|
Medical devices are subject to comparable regulatory requirements.
Each of these steps can take several years and can cost tens of millions of dollars. Failure to obtain, or delays in obtaining, regulatory clearance to market new products, as well as other regulatory actions and recalls, could adversely affect our financial results.
The packaging, labeling and advertising of pharmaceutical products are also subject to government regulation. The FDA recommends preclearing advertising materials prior to the launch of a product, and the launch materials for products receiving an accelerated FDA clearance must be precleared by the FDA. With an accelerated FDA clearance, all labeling and advertising must be submitted to the FDA 30 days prior to use, unless the FDA determines otherwise. In addition, the FDA may require that additional clinical studies - Phase IV studies - be completed after it grants clearance to market a product.
Our research and development, manufacturing and distribution operations involve the use of hazardous substances and are regulated under international, federal, state and local laws governing health and safety and the environment. We believe that our operations comply in all material respects with applicable environmental laws and worker health and safety laws; however, the risk of environmental liabilities cannot be eliminated and we cannot be assured that the application of environmental and health and safety laws to us will not require us to incur significant expenditures.
Employees
At December 31, 2010, Vyteris had a staff of 15 employees, of which 2 are part-time employees and 13 are full-time employees. Of those 15 employees, 3 are in process development, 2 in regulatory, quality and analytical services, 3 in research and development and 7 in administration and management. None of our employees are represented by a labor union or covered by a collective bargaining agreement, nor have we experienced any work stoppage.
14
Investor Information
Our Internet website address is www.vyteris.com. The information on our website is not a part of this annual report. We make available, free of charge on our website, by clicking on the “SEC filings” link on our home page, our annual report on Form 10-K, quarterly reports on Form 10-Q, current reports on Form 8-K, and amendments to those reports filed or furnished pursuant to Section 13(a) or 15(d) of the Securities Exchange Act of 1934, as amended (the “Exchange Act”), as soon as reasonably practicable after electronically filing such material with, or furnishing it to, the Securities and Exchange Commission (the “ SEC”).
|
ITEM 1A.
|
RISK FACTORS
|
You should carefully consider the risks described below together with all of the other information included in this report, as well as all other information included in all other filings, incorporated herein by reference, when evaluating us and our business. If any of the following risks actually occurs, our business, financial condition, and results of operations could suffer. In that case, the price of our common stock could decline and our stockholders may lose all or part of their investment. The risks set forth below are not the only ones facing our Company. Additional risks and uncertainties may exist that could also adversely affect our business, operations and prospects. If any of the following risks actually materialize, our business, financial condition, prospects and/or operations could suffer. No inference should be drawn as to the magnitude of any particular risk from its position in
the list of risk factors.
RISKS RELATED TO OUR BUSINESS
General Business Risks
We continue to experience a severe, continuing cash shortage and without sufficient additional financing we may not be able to execute our MediSync business strategy and may be required to cease operations, and this demonstrates uncertainty as to our ability to continue as a going concern.
As of December 31, 2010, our cash and cash equivalents amounted to $0.4 million. Our revenue in 2010 was de minimis, and we have been dependent upon proceeds from various fundraising activities to fund our operations. As of December 31, 2010, our current liabilities exceeded our current assets by approximately $14.4 million, and we have approximately $1.9 million in outstanding accounts payable which are over 60 days past due. If we do not continue to raise capital until we generate sufficient cash flow from operations to cover this working capital deficit, we may be required to discontinue or further substantially modify our business, as well as not being able to finance the acquisitions that are the core of our MediSync business strategy. We cannot be certain that additional financing will be available to us on favorable terms when required, if at all. The failure to raise needed funds could have a material adverse effect on our business, financial condition, operating results and prospects. Additionally, we face claims and litigation from our vendors and other parties to which we owe money, and we do not have sufficient funds to pay such payables and/or to defend litigation which may arise from nonpayment. These factors raise substantial doubt about our ability to continue as a going concern. The report of the independent registered public accounting firm relating to the audit of our consolidated financial statements for the year ended December 31, 2010 contains an explanatory paragraph expressing uncertainty regarding our ability to continue as a going concern because of our operating losses and our need for additional capital. Such explanatory paragraph could make it more difficult for us to raise additional capital and may materially and adversely affect the terms of any future financing that we may obtain.
As of April 11, 2011, we have commitments from our Board of Directors and other insiders to fund at least $0.1 million no later than April 21, 2011 ("Initial Bridge Funding"). This Initial Bridge Funding is insufficient to fund our operations for more than three weeks, and during that time, we will not pay for any nonessential services, including salaries for our management team, and we will continue to incur payables, as well as be unable to pay other payables which are already in arrears.
We are currently in negotiations with an investment banking firm with respect its acting as a selling agent for a longer term bridge financing of up to $2.0 million, to be comprised of convertible notes and warrants. Our objective is to launch this bridge financing before April 30, 2011.
Additionally, the Company engaged two other investment bankers in the first quarter of 2011 to assist in raising equity capital needed to complete its business plan. While no specific dollar amounts or terms have been agreed to as yet, our discussions with these firms relate to their raising approximately $10.0 to $15.0 million, to fund CRO’s acquisitions, and for working capital and general corporate purposes.
Even if we are successful in raising the bridge capital set forth above, no inference can be made that this is an indication of potential success in raising equity capital needed to complete its business plan The bridge capital is intended as short term, interim finances, and without successful completion of the larger financing by our investment bankers, management will, more likely than not, be required to substantially curtail, if not cease, operations, which will result in a material adverse effect on the financial position and results of operations of the Company. These conditions raise substantial doubt about the Company’s ability to continue as a going concern.
We have never been profitable, we may never be profitable, and, if we become profitable, we may be unable to sustain profitability.
From November 2000 through December 31, 2010, we incurred net losses in excess of $224.9 million, as we have been engaged primarily in clinical testing and development activities. In 2011, we will also be required to fund the activities of our MediSync business until or unless we acquire businesses with sufficient cash flow to fund those operations. We have never been profitable, we may never be profitable, and, if we become profitable, we may be unable to sustain profitability. We expect to continue to incur significant losses for the foreseeable future and will endeavor to finance our operations through sales of securities and incurrence of indebtedness, of which there can be no assurance.
15
We may be unable to hire and retain the key management necessary to develop and grow our business.
We rely on the continued service of our senior management, our chief technical staff, and other key employees as well as the hiring of new qualified employees. Due to the Merger, we have recently embarked on a business plan which includes acquisition of various CRO businesses which rely heavily upon the continued services of their incumbent management. In the pharmaceutical and biotechnology industries, there is substantial and continuous competition for highly skilled business, product development, technical and other personnel. Given the concern over our long-term financial strength and current general economic conditions, we may not be successful in recruiting new personnel and retaining and motivating existing personnel, which could lead to increased turnover and reduce our ability to meet the needs of our current and future customers. If we are unable to retain qualified personnel, we could face disruptions to operations, loss of key information, expertise or know-how, and unanticipated additional recruitment and training costs. If employee turnover increases, our ability to execute our strategy would be negatively affected.
As a small company with limited financial resources, we have not proven that we will be capable to meet the many challenges that we face, including successfully bringing product to market.
You should consider the risks and uncertainties that a company with limited financial resources, such as Vyteris, faces in the rapidly evolving markets for CROs and for drug delivery technologies, especially given the challenges of general economic conditions, which have materially limited the ability of small companies to raise capital and generate revenues. In particular, you should consider that we have not proven that we will be able to:
|
|
·
|
raise significant additional capital in the public or private markets;
|
|
|
·
|
be able to acquire CROs on favorable terms and pricing;
|
|
|
·
|
obtain the regulatory approvals necessary to commence selling drug delivery systems that we may develop in the future;
|
|
|
·
|
manufacture products in a manner that enables us to be profitable or meets regulatory, strategic partner or customer requirements;
|
|
|
·
|
attract, retain and manage a qualified, diverse staff of engineers and scientists;
|
|
|
·
|
develop the relationships with strategic partners and key vendors that are necessary to our ability to exploit the processes and technologies that we develop;
|
|
|
·
|
effectively manage our operations;
|
|
|
·
|
develop new products and drug delivery processes and new applications for our drug delivery technology; and
|
|
|
·
|
respond effectively to competitive pressures.
|
If we cannot accomplish all or even some of these goals, our business is not likely to succeed.
Current economic conditions may adversely affect our ability to continue operations.
Current economic conditions may cause a decline in business and consumer spending and capital market performance, which could adversely affect our business and financial performance. Our ability to raise funds, upon which we are fully dependent to continue operations, may be adversely affected by current and future economic conditions, such as a reduction in the availability of credit, financial market volatility, lessened liquidity in the capital markets, lessened availability of investment funds in the capital markets and recession.
Risks from the CRO business as well as the nature of our drug delivery business may result in our being subject to liability claims by employees, customers and third parties, and we may not be able to obtain adequate insurance to cover these risks.
The nature of our business may result in our being subject to liability claims by employees, customers and third parties, including breach of contract claims, worker compensation claims and personal injury suits. Our liability insurance, but such insurance may not be adequate to cover claims asserted against us. In addition, we may be unable to maintain or purchase such insurance in the future. Any of these events could have a material adverse affect on our financial condition.
16
Our integration of the traditional Vyteris drug delivery business with our new MediSync CRO business poses integrational as well as operational risks.
As a result of the Merger, we will evolve from a business plan originally based on product development to a business plan which includes the acquisition and operation of a CRO business with a robust acquisition strategy.The integration and then operation of the combined businesses poses several unique risks.
|
|
·
|
Due to the Merger, we will be required to combine many aspects of two businesses, including accounting, information systems and other functions. We have limited experience in combining business operations of this nature, and there can be no assurance that we will be successful in our efforts, or as to what the cost of the combination will be. If we are unable to combine operations in a timely or cost effective manner, we may incur additional costs to combine and/or be required to obtain additional experienced personnel with the costs associated therewith.
|
|
|
·
|
We will be required to integrate new personnel and businesses, which have traditionally operated as distinct businesses, into Vyteris. The cost and time of integrating these businesses could have a material adverse impact on our cash flow and our ability to effectively manage our business given our limited staffing resources.
|
|
|
·
|
Once integrated, we will be required to manage operations at various locations across the U.S. rather than from one location in New Jersey, as was the case with our drug delivery business. We have limited experience in and resources with respect to operating a multi site business and we may be unsuccessful in managing our expanding sites without incrementally increased cost, including the need to hire qualified operations personnel, including a chief operations manager.
|
|
|
·
|
In order to manage our increased business operations, we will be required to increase our administrative and IT personnel and functions. We have limited resources with which to so increase our administrative capacities which could have a material adverse impact in our ability to effectively administer our combined businesses without incurrence of additional costs, above the anticipated budgeted costs.
|
Risks Related to our CRO Business
The outsourcing trend in the preclinical and clinical stages of drug discovery and development may decrease.
Industry analysts have identified a trend among pharmaceutical and biotechnology companies of outsourcing drug development, research and clinical trial management, thereby enabling such companies to focus on their core competencies. While industry analysts expect the outsourcing trend to continue for the immediate future, a decrease in preclinical and/or clinical outsourcing activity could adversely affect MediSync’s prospects, financial condition and results of operations. Furthermore, MediSync’s future customer contracts will likely be terminable on little or no notice. Termination of a large contract or multiple contracts could adversely affect MediSync’s sales and revenue.
Pharmaceutical and biotechnology companies may reduce their research and development budgets.
MediSync’s customers mainly consist of pharmaceutical and biotechnology companies. MediSync’s ability to maintain and grow its customer base is dependent in large part upon the ability and willingness of the pharmaceutical and biotechnology industries to continue to expend financial resources on research and development and to outsource the services MediSync will provide. Fluctuations in the research and development budgets of these organizations could have a significant effect on the demand for MediSync’s services and/or the fees MediSync can charge for services provided. Research and development budgets fluctuate due to changes in available resources, mergers of pharmaceutical and biotechnology companies, spending priorities and institutional budgetary policies. MediSync’s business could be adversely affected by any significant decrease in research and development expenditures by pharmaceutical and biotechnology companies, as well as by academic institutions, government laboratories, or private foundations.
17
Customers may experience a reduction or loss of government funding.
MediSync’s customer base may include academic institutions and research laboratories whose funding is partially dependent on both the level and timing of funding from government sources, such as the U.S. National Institutes of Health (NIH) and similar domestic and international agencies. Government funding of research and development is inherently unpredictable. MediSync’s sales may be adversely affected if its customers delay purchases of services as a result of uncertainties surrounding the approval of government budget proposals.
Government regulation of the pharmaceutical or biotechnological industries could change substantially.
MediSync operates in a heavily regulated industry. To effectively manage and operate its business, MediSync will be impacted by, and need to respond to changes in, applicable regulations and requirements governing its operations. These regulations include those relating to licensure, conduct of operations and accreditation. The future course of federal, state and local regulations or legislation cannot be predicted. Failure of MediSync to monitor and respond to changes in such requirements could cause MediSync to incur criminal or civil penalties and expend substantial resources responding to an investigation or other enforcement action under these laws or regulations. In addition, some changes in regulations, such as an increase in regulatory requirements that MediSync may have difficulty satisfying or that make MediSync’s services less competitive, could eliminate or substantially reduce the demand for MediSync’s future services.
Recently, the U.S. Congress and state legislatures have considered and enacted various types of health care reform intended to control growing health care costs. MediSync is unable to predict what legislative proposals will be adopted in the future, if any. Implementation of health care reform legislation that place additional cost pressure on drug development and research could adversely affect research and development expenditures by pharmaceutical and biotechnology companies, which could in turn decrease the business opportunities available to MediSync. Furthermore, if health insurers were to change their practices with respect to reimbursements for pharmaceutical products, MediSync’s customers may spend less on outsourcing, or reduce their growth in spending on research and development.
Failure to comply with applicable regulations and related guidance could harm MediSync’s reputation and operating results.
Any failure on the part of MediSync to comply with applicable regulations could result in the termination of ongoing research or the disqualification of data for submission to regulatory authorities. This could harm MediSync’s reputation, prospects for future work and operating results. For example, the issuance of a notice of observations or a warning from the Food and Drug Administration based on a finding of a material violation by MediSync of good clinical practice, good laboratory practice or good manufacturing practice requirements could materially and adversely affect MediSync.
The CRO industry is highly competitive.
The CRO industry is highly competitive. MediSync competes for business not only with other companies in the industry, but also with internal discovery and development departments within larger biotech and pharmaceutical companies, each of which may have greater resources than MediSync. MediSync also competes with universities and teaching hospitals. MediSync competes based on a variety of factors, including:
|
|
·
|
reputation for on-time quality performance;
|
|
|
·
|
reputation for regulatory compliance;
|
|
|
·
|
expertise and experience in specific areas;
|
|
|
·
|
scope and breadth of service offerings;
|
|
|
·
|
broad geographic availability;
|
|
|
·
|
price/value;
|
|
|
·
|
technological expertise and efficient development processes;
|
|
|
·
|
quality of services and facilities;
|
|
|
·
|
financial stability;
|
|
|
·
|
size;
|
|
|
·
|
ability to acquire, process, analyze and report data in an effective manner; and
|
|
|
·
|
ability to manage clinical trials both domestically and internationally.
|
18
If MediSync does not compete successfully, its business will suffer. Increased competition might lead to price and other concessions that might adversely affect MediSync’s operating results and could lead to significant losses. The CRO industry has continued to see a trend towards consolidation. If this trend continues, it is likely to produce more competition among the larger companies and CROs generally, with respect to both clients and acquisition candidates. In addition, private equity firms may determine that there are opportunities in acquiring companies that we would like to acquire, thus further increasing possible competition and affecting acquisition prices. These competitive pressures may adversely affect MediSync’s growth and financial results.
Contract research services create a risk of liability.
By competing in the CRO industry, MediSync faces a range of potential liabilities, including:
|
|
·
|
errors or omissions in the reporting of study detail that may lead to inaccurate reports, which may potentially advance studies absent the necessary support or inhibit studies from proceeding to the next level of testing;
|
|
|
·
|
litigation risk, including potential litigation resulting from MediSync’s errors or omissions, or from MediSync’s association with clinical studies that are directly or indirectly related to death, illness, personal injury or other negative side effects to clinical study participants or other persons;
|
|
|
·
|
risks associated with possible failure of MediSync to properly care for customers’ property, such as research models and samples, study compounds, records, work in progress, or goods and materials in transit, while in MediSync’s possession; and
|
|
|
·
|
errors and omissions during a trial that may undermine the usefulness of a trial or data from the trial.
|
MediSync will attempt to mitigate these risks through a variety of control procedures and methods. Nonetheless, it is impossible to completely eradicate such risks. Contractual indemnifications may not adequately protect MediSync against any such liabilities. MediSync could be materially and adversely affected if it were required to pay damages or bear the costs of defending any claim which is not covered by a contractual indemnification provision or insurance.
Actions or inspections by regulatory authorities may cause clients not to award future contracts to MediSync or to cancel existing contracts, which may have a material and adverse effect on MediSync’s results of operations.
MediSync may be subject to continuing inspections of its facilities and documentation in connection with studies it has conducted, or routine inspections of its facilities that have yet to be inspected by regulatory authorities. Regulatory authorities can have significant impact over the conduct of clinical trials, and they have the power to take regulatory and legal action in response to violations of clinical standards, subject protection and regulatory requirements in the form of civil and criminal fines, injunctions and other measures. Additionally, there is a risk that actions by regulatory authorities, if they result in significant inspectional observations or other measures, could cause clients not to award MediSync future contracts or to cancel existing contracts. Depending upon the amount of revenue lost, the results could have a material and adverse affect on MediSync’s results of operations.
MediSync risks potential liability when conducting clinical trials, which could cost be expensive.
Some of MediSync’s clinical trials may involve administering drugs to humans in order to determine the effects of the drugs. By doing so, MediSync will be subject to the general risks of liability to these persons, which include those relating to:
|
·
|
adverse side effects and reactions resulting from administering these drugs to a clinical trial participant,
|
|
·
|
unintended consequences resulting from the procedures or changes in medical practice to which a study participant may be subject as part of a clinical trial,
|
|
|
·
|
improper administration of these drugs, or
|
|
|
·
|
potential professional malpractice of MediSync’s employees or contractors, including physicians.
|
MediSync’s contracts may not have adequate indemnification agreements requiring their clients to indemnify MediSync in the event of adverse consequences to trial participants caused by specifically given drugs or participation in their trials. There is no certainty as to the adequacy or the continued availability to MediSync of liability insurance, at rates acceptable to MediSync. MediSync could also be held liable for other errors or omissions in connection with its services. For example, MediSync could be held liable for errors or omissions or breach of contract if MediSync inaccurately reports or fails to report various results. If MediSync does not perform its services to contractual or regulatory standards, the clinical trial process could be adversely affected. Additionally, if clinical trial services do not conform to contractual or regulatory standards, trial participants could be affected. If there is a damage claim not covered by insurance, the indemnification agreement is not enforceable or broad enough, or our client is insolvent, any resulting suit against MediSync could result in a material loss to MediSync.
19
If MediSync is unable to attract suitable volunteers for its clinical trials, MediSync’s clinical development business might suffer.
The clinical research studies operated by MediSync will frequently rely upon the ready accessibility and willing participation of volunteer subjects. Volunteer subjects generally include people from the communities in which the studies are conducted. MediSync’s clinical research development business could be adversely affected if it is unable to attract suitable and willing clinical study volunteers on a consistent basis.
The acquisition of future acquisition targets may not produce the anticipated benefits.
MediSync may not be able to realize all or any of the benefits that it expects to result from the acquisition of future acquisition targets, either in monetary terms or in a time and other synerginistic efficiencies. Failure to obtain these benefits could have a material adverse effect on MediSync’s business model.
MediSync’s contracts may be delayed, terminated or reduced in scope with little or no notice.
Many of MediSync’s contracts provide for services on a fixed-price basis and may be terminated or reduced in scope with little or no notice. The loss, reduction in scope or delay of a large contract or the delay of multiple contracts could have a material adverse effect on MediSync’s results of operations. Cancellation or delay of a large contract or multiple contracts could leave MediSync with under-utilized resources and thereby negatively affect such entity’s net service revenues and results of operations.
Risks Related to our Drug Delivery Business
Ferring’s termination of its License and Development Agreement with us has had and continues to have a material adverse effect on us.
Ferring’s recent termination of its License and Development Agreement with us presents several risks.
|
|
(i)
|
Unless we are able to secure an alternative development partner for our drug delivery product for female infertility or are otherwise able to continue development of this product on our own, we will in all likelihood have to abandon or defer development of this product line, which would likely have a material adverse effect on us both with respect to our ability to derive a stream of revenues and our ability to bring a product to market within the time frames previously anticipated by us.
|
|
|
(ii)
|
We are currently evaluating the License and Development Agreement and other agreements that we have with Ferring to determine amounts owed to Ferring, which we believe to be approximately $1.4 million. We intend to negotiate with Ferring to repay such amounts over a period of time so as to lessen the immediate burden on our cash flow, with a further goal of terminating the senior lien and security interest that Ferring maintains on our assets. In the event that we are unable to come to an amicable resolution of these obligations, Ferring could, among other remedies, foreclose on our assets which would have a material adverse effect on us. In addition, a failure to come to a satisfactory resolution with Ferring could result in litigation, which may be costly, regardless of the outcome, and which could result in a substantial diversion of our financial and management resources.
|
|
|
(iii)
|
In the litigation which we commenced against Ferring in July 2010, Ferring has counterclaimed that its termination was really under a “for cause” termination provision rather than the “not for cause” termination provision, for which received the formal termination notice in December 2010. If a court or arbitrator were to find this “for cause” termination argument to have merit, we could risk losing exclusive rights to our infertility product under the terms of the License and Development Agreement which govern disposition of rights upon a termination by Ferring under the “for cause” provisions of the License and Development Agreement.
|
20
We cannot expect that we will be able to derive material revenues from the sale of products in the near future.
While we have commenced development of products with respect to our drug delivery business and believe that our technology can and should be pursued with respect to several applications that could result in commercially viable products, the process of developing drug delivery products to the point of commercial sales takes significant time and requires a substantial commitment of financial and other resources that may not be available to us for regulatory approval. We cannot assure that we will have the financial resources necessary to bring future products to market or that developments in our industry will not preclude us from expanding our commercial product line beyond LidoSite, a product that has been discontinued. If we are unable to bring additional products to market, our entire business would be at risk, thereby increasing the risk of a business interruption or discontinuation.
We and our strategic partners may not be able to obtain FDA or foreign regulatory approval for our products in a timely manner, or at all, which could have a material adverse effect on our ability to sell and market our products.
Drug formulations and related delivery systems that we may develop in the future cannot be sold in the United States until the FDA approves such products for medical use. Similar foreign regulatory approvals will be needed in order to sell any new drug formulations and related drug delivery systems outside of the U.S. We and our strategic partners may not be able to obtain FDA or foreign regulatory approval for our products in a timely manner, or at all. Delays in obtaining FDA or foreign approvals for our products could result in substantial additional costs to us, and, therefore, could adversely affect our ability to compete with other drug delivery companies. If we and our strategic partners do not obtain such approvals at all, our revenues may be insufficient to support continuing operations. In addition, any failure to pay fees imposed by the FDA or foreign regulatory agencies may hinder or prevent our ability to obtain future approvals from those agencies.
We rely on single suppliers for certain key materials and components used in our smart patch delivery system, which makes us dependent on persons or events that we cannot control.
Certain raw materials and components used in the manufacture of our smart patch delivery system are available only from single suppliers. Some of those materials or components are custom-made for us and are the result of long periods of collaboration with our suppliers. The hydrogel that we use to hold the drugs in the patch and the electrode subcomponents that we use to carry current through our delivery system, for example, are both provided by single suppliers. There are no written contracts with these suppliers. Any curtailment of the availability of such raw materials or components could be accompanied by production or other delays and could result in a material loss of sales, with resulting adverse effects on our business and operating results. In addition, because raw material sources for pharmaceutical products must generally be approved by regulatory authorities, changes in raw material suppliers may result in production delays, higher raw material costs and loss of sales, customers and market share.
The development or identification of alternative sources, or redesigning products, could be time-consuming and expensive. We cannot assure you that price increases or interruptions in the supply of raw materials and components will not occur in the future or that we will not have to seek alternate suppliers or obtain substitute raw materials or components, which may require additional product validations and regulatory approvals. Further, our suppliers could experience price increases or interruptions in the supply of materials from their suppliers, or could fail to meet our or governmental manufacturing standards.
Any significant price increase, interruption of supply, our inability to secure an alternate source or our inability to qualify a substitute material could have a material adverse effect on our ability to manufacture our products or maintain regulatory approval.
We have limited experience in manufacturing drug delivery systems for commercial resale and may be unable to manufacture our products for commercial sale on a profitable or reliable basis.
As an organization we have had limited experience in manufacturing drug delivery systems for commercial sale. We must increase our production capabilities significantly beyond our present manufacturing capacity, which has been focused on producing small quantities of our products for clinical trial purposes, and incur significant capital expense in order to be able to produce our products in commercial volumes in a cost effective manner. The equipment and machinery that we use to manufacture the drugs and patches for our products are expensive and custom-built, and have never been used in the large-scale production of pre-filled drug delivery patches. Additionally, our PMK 150 machine is leased from Ferring Pharmaceuticals and due to the current litigation, it is not entirely clear as to the long term viability of this lease.
21
We cannot assure you that we can:
|
|
·
|
successfully increase our manufacturing capabilities and develop large-scale manufacturing processes on a profitable basis;
|
|
|
·
|
hire and retain skilled personnel to oversee our manufacturing operations;
|
|
|
·
|
avoid design and manufacturing defects and correct or redesign components once they are in production; or
|
|
|
·
|
develop and maintain our manufacturing facility in compliance with governmental regulations, including the FDA's good manufacturing practices.
|
We may not be able to manufacture our products in a manner that ensures that the systems provide reproducible dosages of stable formulations of drugs for sufficient periods after manufacture. If we cannot ensure that our products have sufficient post-production shelf-life, we may be unable to produce our products in sufficient quantities to develop an economical supply chain. Accordingly, we may not be able to manage our inventory successfully. Currently, we are not conducting any manufacturing operations, and we are unable to predict if we shall be able to successfully do so should the need arise in the future.
The failure of any of our products to achieve market acceptance could materially and adversely impact our future success.
Our future success depends upon the acceptance of any of our potential future products by health care providers and patients. In addition, our future success may be dependent upon acceptance by third-party payors — including, without limitation, health insurance companies, Medicaid and Medicare — of products that we may develop in the future. Such market acceptance may depend on numerous factors, many of which may not be under our control, including:
|
|
·
|
the safety and efficacy of our products;
|
|
|
·
|
regulatory approval and product labeling;
|
|
|
·
|
the availability, safety, efficacy and ease of use of alternative technologies;
|
|
|
·
|
the price of our products relative to alternative technologies; and
|
|
|
·
|
for future products, the availability of third-party reimbursement.
|
We cannot assure you that any future product will ever gain broad market acceptance.
In addition, the adoption of new pharmaceutical products is greatly influenced by health care providers and administrators, inclusion in hospital formularies, and reimbursement by third party payors. Because our existing and proposed drug delivery systems encompass both a device and a drug and may be used by many different departments within a hospital or health care facility, buying decisions in these settings require more departmental approvals than are required for either a stand-alone drug or a stand-alone device. As a result, it may be more difficult and more time consuming to achieve market penetration with our products. We cannot assure investors that health care providers and administrators, hospitals or third party payors will accept our products on a large scale or on a timely basis, if at all, or that we will be able to obtain approvals for additional indications and labeling for our products which facilitate or expand their market acceptance or use. In addition, unanticipated side effects, patient discomfort, defects or unfavorable publicity concerns about any of our products, or any other product incorporating technology similar to that used by our products, could have a material adverse effect on our ability to commercialize our products or achieve market acceptance.
We may be unable to secure strategic partnering relationships, which could limit our ability to effectively market, sell or distribute certain products.
In order for us to develop, market, sell and distribute certain future products, we will be dependent on entering into satisfactory arrangements with strategic partners. We cannot assure investors that we will be able to negotiate such agreements on terms that are acceptable to us, or at all. In addition, we cannot assure any investor that any strategic partner will not also engage in independent development of competitive delivery technologies.
22
If we are unable to protect our proprietary technology and preserve our trade secrets, we will increase our vulnerability to competitors which could materially adversely impact our ability to remain in business.
Our ability to commercialize successfully our products will depend, in large measure, on our ability to protect those products and our technology with domestic and foreign patents. We will also need to continue to preserve our trade secrets. The issuance of a patent is not conclusive as to its validity or as to the enforceable scope of the claims of the patent. The patent positions of pharmaceutical, biotechnology and drug delivery companies, including our Company, are uncertain and involve complex legal and factual issues.
We cannot assure you that our patents will prevent other companies from developing similar products or products which produce benefits substantially the same as our products, or that other companies will not be issued patents that may prevent the sale of our products or require us to pay significant licensing fees in order to market our products. Accordingly, if our patent applications are not approved or, even if approved, if such patents are circumvented or not upheld in a court of law, our ability to competitively exploit our patented products and technologies may be significantly reduced. Additionally, the coverage claimed in a patent application can be significantly reduced before the patent is issued.
From time to time, we may need to obtain licenses to patents and other proprietary rights held by third parties in order to develop, manufacture and market our products. If we are unable to timely obtain these licenses on commercially reasonable terms, our ability to commercially exploit such products may be inhibited or prevented. Additionally, we cannot assure investors that any of our products or technology will be patentable or that any future patents we obtain will give us an exclusive position in the subject matter claimed by those patents. Furthermore, we cannot assure investors that our pending patent applications will result in issued patents, that patent protection will be secured for any particular technology, or that our issued patents will be valid or enforceable or provide us with meaningful protection.
If we are required to engage in expensive and lengthy litigation to enforce our intellectual property rights, the costs of such litigation could be material to our results of operations, financial condition and liquidity and, if we are unsuccessful, the results of such litigation could materially adversely impact our entire business.
We may find it necessary to initiate litigation to enforce our patent rights, to protect our trade secrets or know-how or to determine the scope and validity of the proprietary rights of others. We plan to aggressively defend our proprietary technology and any issued patents, if funding is available to do so. Litigation concerning patents, trademarks, copyrights and proprietary technologies can often be time-consuming and expensive and, as with litigation generally, the outcome is inherently uncertain.
Although we have entered into invention assignment agreements with our employees and with certain advisors, if those employees or advisors develop inventions or processes independently which may relate to products or technology under development by us, disputes may also arise about the ownership of those inventions or processes. Time-consuming and costly litigation could be necessary to enforce and determine the scope of our rights under these agreements.
We also rely on confidentiality agreements with our strategic partners, customers, suppliers, employees and consultants to protect our trade secrets and proprietary know-how. We may be required to commence litigation to enforce such agreements and it is certainly possible that we will not have adequate remedies for breaches of our confidentiality agreements.
Other companies may claim that our technology infringes on their intellectual property or proprietary rights and commence legal proceedings against us which could be time-consuming and expensive and could result in our being prohibited from developing, marketing, selling or distributing our products.
Because of the complex and difficult legal and factual questions that relate to patent positions in our industry, we cannot assure you that our products or technology will not be found to infringe upon the intellectual property or proprietary rights of others. Third parties may claim that our products or technology infringe on their patents, copyrights, trademarks or other proprietary rights and demand that we cease development or marketing of those products or technology or pay license fees. We may not be able to avoid costly patent infringement litigation, which will divert the attention of management away from the development of new products and the operation of our business, and which would materially and adversely affect our cash flow. We cannot assure investors that we would prevail in any such litigation. If we are found to have infringed on a third party's intellectual property rights, we may be liable for money damages, encounter significant delays in bringing products to market or be precluded from manufacturing particular products or using particular technology.
23
Other parties have challenged certain of our foreign patent applications. If such parties are successful in opposing our foreign patent applications, we may not gain the protection afforded by those patent applications in particular jurisdictions and may face additional proceedings with respect to similar patents in other jurisdictions, as well as related patents. The loss of patent protection in one jurisdiction may influence our ability to maintain patent protection for the same technology in another jurisdiction.
If we do not accurately predict demand for our products when deciding to invest in the development of new products, we will likely incur substantial expenditures that will not benefit our business.
Research and development, clinical testing and obtaining regulatory approvals for new drug delivery systems takes a significant amount of time and requires significant investment in skilled engineering and scientific personnel and in expensive equipment. Furthermore, manufacturing our products requires expensive, custom-built machinery. We have made these investments, and intend to continue to make such investments, for our products based on internal projections of the potential market for that system and of our potential profit margins on sales of that system. If those projections are inaccurate, we may not be able to obtain an acceptable return on our investment in the development of our products. If our projections of the prospects of new products are inaccurate, we may make investments in the development, testing and approval of those products that may result in unsatisfactory returns.
We face substantial competition for any future products that we may develop, as well as for strategic partner transactions. Our failure to adequately compete could have a material adverse effect on our ability to develop, market and sell our products and meet our financial projections.
There is substantial competition to develop alternative drug delivery solutions from both drug delivery technology and pharmaceutical companies, most of which are much larger and have far greater resources than we do. Further, the drug delivery, pharmaceutical and biotechnology industries are highly competitive and rapidly evolving. We expect that significant developments in those industries will continue at a rapid pace. Our success will depend on our ability to establish and maintain a strong competitive position for our products while developing new products that are effective and safe. We cannot assure you that any of our products will have advantages over alternative products and technologies that may be developed later and that may be significant enough to cause health care providers to prefer those products or technologies over ours.
In our drug delivery segment, which is focused on the process of actively delivering drugs through the skin, we are aware of several companies that are also developing or marketing products based on this process. We face indirect competition from companies that are actively involved in the development and commercialization of modified drug delivery technologies, including oral, pulmonary, bucal, nasal and needle-less injections, as well as companies working on processes that passively deliver drugs through the skin. We also expect to compete with other drug delivery companies and technologies in the establishment of strategic partnering arrangements with large pharmaceutical companies to assist in the development or marketing of products. Competition is expected to intensify as more companies enter the field.
Most of our competitors have substantially greater financial, technical, research and other resources, are more experienced in research and development, manufacturing, pre-clinical and clinical testing, and obtaining regulatory approvals, and are larger, more established and have more collaborative partners than we do. Some of these companies have competing products that have already been approved by the FDA and foreign authorities. In addition, those other entities may offer broader product lines and have greater name recognition than we do. Those other entities may succeed in developing competing technologies and obtaining regulatory approvals and market share more rapidly than we can. We cannot assure you that those competitors will not succeed in developing or marketing products that are more effective or more commercially acceptable than any of our future products. We cannot assure you that we will have the financial resources, technical or management expertise or manufacturing and sales capability to compete in the future. Increased competition may result in price cuts, reduced gross margins and loss of market share, any of which could have a material adverse effect on our business, financial condition, results of operations and future prospects.
24
We may not be able to license complementary drug technologies or drug reformulations to expand our product offerings, in which case we will be significantly limited in our product offerings.
In order to enhance our platform technology, strengthen our intellectual property portfolio and expand our overall market opportunity, we may seek to acquire or license rights to additional drug delivery technologies or reformulations of FDA-approved drugs that complement our core drug delivery platform. We may not be able to acquire or license such other technologies or drug reformulations on terms that are acceptable to us, if at all. Further, efforts to identify such technologies and attempts to negotiate the terms of such acquisitions or licenses may divert the attention of our management away from the internal development of new applications for our existing technologies and from the operation of our business.
We do not expect to commercialize any products for the next 24 months or significantly longer.
Our future efforts will be dependent upon the successful development of new products with new partners. There are no assurances that we will be successful in continuing the development of new products or entering into strategic partnership agreements for product development. In addition, if any of these new products is not approved in a timely manner or does not gain market acceptance, it will adversely affect our business, financial condition, results of operations and future prospects.
RISKS RELATED TO OUR COMMON STOCK
Our sale of a significant number of shares of our common stock, convertible securities or warrants or the issuance or exercise of stock options could depress the market price of our stock.
The market price of our common stock could decline as a result of sales of substantial amounts of our common stock in the public market or the perception that substantial sales could occur because of our sale of common stock, convertible securities or warrants, or the issuance or exercise of stock options. These sales also might make it difficult for us to sell equity securities in the future at a time when, and at a price which, we deem appropriate. As of December 31, 2010, we had stock options to purchase 16,727,510 shares of our common stock outstanding, of which options to purchase 9,169,975 shares were exercisable. Also outstanding as of the same date were warrants exercisable for 33,639,513 shares of our common stock and senior secured debentures that can convert into 9,620,185 shares of our common stock. Exercise of any current or future outstanding stock options or warrants could harm the market price of our common stock.
We are a controlled company and our majority shareholder may take actions adverse to the interests of other shareholders
As of December 31, 2010, Spencer Trask Specialty Group, LLC or STSG, owned approximately 73% of our issued and outstanding common stock on a fully diluted basis, and as of March 31, 2011, it owned 73% on a fully diluted basis. Due to this stock ownership, we are controlled by STSG and deemed a “controlled corporation”. This control occurred as a result of the December 22, 2009 restructuring of over $20.3 million of preferred stock and senior secured debt that we owed to STSG. STSG may take actions that conflict with the interests of other shareholders. Due to STSG’s voting control of our common stock, STSG has substantial control over us and has substantial power to elect directors and to generally approve all actions requiring the approval of the holders of our voting stock. The closing of the Merger with MediSync would impact the stock ownership percentage of STSG; however, even after giving effect to the Merger, we would anticipate that we would remain a controlled company.
We may be unable to list our Common Stock on the NASDAQ or any other securities exchange, in which case an investor may find it difficult to dispose of shares or obtain accurate quotations as to the market value of our Common Stock.
Although we may apply to list our common stock on NASDAQ or the NYSE Amex Equities in the future when and if we have stabilized our liquidity concerns, we may not be able to meet the initial listing standards, including the minimum per share price and minimum capitalization requirements, of either of those or any other stock exchange, and we may not be able to maintain a listing of our common stock on either of those or any other stock exchange. If we are unable to list our common stock on NASDAQ, the NYSE Amex Equities or another stock exchange, or to maintain that listing, we expect that our common stock will continue to trade on the OTC Bulletin Board maintained by NASDAQ, or possibly another over-the-counter quotation system or on the "pink sheets," where an investor may find it difficult to dispose of shares or obtain accurate quotations as to the market value of our common stock.
25
Our common stock is considered a “penny stock” and may be difficult to sell.
Our common stock is considered to be a “penny stock” since it meets one or more of the definitions in Rule 3a51-1 under the Securities Exchange Act of 1934, as amended (the “Exchange Act”). These include but are not limited to the following: (i) the stock trades at a price less than $5.00 per share; (ii) it is not traded on a “recognized” national exchange; (iii) it is not quoted on the NASDAQ Stock Market, or even if so, has a price less than $5.00 per share; or (iv) is issued by a company with net tangible assets less than $2.0 million, if in business more than a continuous three years, or with average revenues of less than $6.0 million for the past three years. The principal result or effect of being designated a “penny stock” is that securities broker-dealers cannot recommend the stock but must trade in it on an unsolicited basis. Section 15(g) of the Exchange Act and Rule 15g-2 promulgated thereunder require broker-dealers dealing in penny stocks to provide potential investors with a document disclosing the risks of penny stocks and to obtain a manually signed and dated written receipt of the document before effecting any transaction in a penny stock for the investor’s account.
Historically, the market for our Common Stock has been very limited and our Common Stock may continue to be difficult to sell, as well as exhibit increased price volatility, as a result of this limited market.
We have a low trading volume for our common stock which limits the trading market for our common stock, thus making it more difficult to sell our common stock on the open market. Our stock price is fairly volatile and often we see a wide spread between our bid and sale price increases stock price volatility which may present further barriers to the ability to sell our common stock.
We may not be able to attract the attention of brokerage firms, which could have a material adverse impact on the market value of our Common Stock
Security analysts of brokerage firms have not provided, and may not provide in the future, coverage of our company since there is limited incentive to brokerage firms to produce research reports and recommend the purchase or sale of our common stock. To date, we have not been able to attract the attention of brokerage firms and securities analysts. The absence of such attention limits the likelihood that an active market will develop for our common stock. It also will likely make it more difficult to attract new investors at times when we require additional capital.
The trading price of our Common Stock is volatile, which could cause the value of an investment in the Company’s securities to decline.
The market price of shares of our Common Stock has been volatile. See “Market Information.” The price of our Common Stock may continue to fluctuate in response to a number of factors, such as;
|
|
·
|
our cash resources and our ability to obtain additional funding;
|
|
|
·
|
announcements by us or a competitor of business developments;
|
|
|
·
|
our entry into or termination of strategic business relationships;
|
|
|
·
|
changes in government regulations; and
|
|
|
·
|
changes in our revenue or expense levels.
|
The occurrence of any of these events may cause the price of our common stock to fall. In addition, the stock market in general has experienced volatility that often has been unrelated to the operating performance or financial condition of individual companies. Any broad market or industry fluctuations may adversely affect the trading price of our Common Stock, regardless of operating performance or prospects.
26
|
ITEM 2.
|
PROPERTIES
|
We lease approximately 26,000 square feet of manufacturing, warehouse, laboratory, and office space located at 13-01 Pollitt Drive in Fair Lawn, New Jersey. This lease expires in September 2011. This facility includes manufacturing space sufficient to house our current patch manufacturing and packaging equipment, and a second manufacturing line built to our specifications. Our facility also contains prototype labs for simultaneous production of clinical supplies of multiple products, and nine additional labs for research and development and quality control purposes. For the years ended December 31, 2010, 2009 and 2008, rent expense for the 13-01 lease was $0.4 million, $0.4 million and $0.3 million, respectively.
|
ITEM 3.
|
LEGAL PROCEEDINGS
|
From time to time, we are involved in lawsuits, claims, investigations and proceedings, including pending opposition proceedings involving patents that arise in the ordinary course of business. Except (i) as set forth below and (ii) for approximately $0.7 million in accounts payable collection claims and litigation, there are no matters pending that we expect to have a material adverse impact on our business, results of operations, financial condition or cash flows. Unless we are able to obtain sufficient funds to commence settlement of outstanding accounts payable, these numbers of claims and litigation are likely to increase.
On December 21, 2009, the Company received notice from Ferring of its termination without cause of the License and Development Agreement, dated September 30, 2004, by and between the Company and Ferring (the “LDA”), effective 30 days from the date of the notice. Pursuant to the terms of the LDA, following its termination without cause of the LDA, Ferring is required to, among other things, convert all licenses and other rights granted to the Company to develop, make, have made, use, sell, offer to sell, lease, distribute, import and export the product to exclusive, worldwide, irrevocable, perpetual, sub-licensable licenses and the Company is entitled to terminate all licenses and other rights granted to Ferring under the LDA, with limited exclusions not pertaining to the practice by Ferring of such rights in the field of the iontophoretic administration of the infertility hormone.
To date, however, Ferring has not complied with its contractual obligations to dispose of the intellectual property under the LDA. On or about July 1, 2010, the Company commenced litigation in the Superior Court of New Jersey against Ferring. Through the litigation, the Company sought an order requiring Ferring to abide by the terms of the LDA and dispose of the intellectual property as required. The Company also sought the recovery of damages from Ferring. Ferring filed a motion to compel arbitration, which was granted by the court on November 19, 2010. The Company is pursuing negotiations with Ferring aimed at resolving all issues in dispute between the Company and Ferring, including resolution of amounts owed by the Company to Ferring under a March 2009 financing arrangement. Should a negotiated resolution not be reached, the Company intends to pursue its claims against Ferring in arbitration, as required by the court’s November 19, 2010 order.
|
ITEM 4.
|
SUBMISSION OF MATTERS TO A VOTE OF SECURITY HOLDERS
|
As of November 3, 2010, we obtained the approval of the holders of approximately 51.3% of the outstanding shares of common stock not owned by Spencer Trask Specialty Group and affiliates, including, but not limited to, Kevin Kimberlin (collectively, “STSG”), as required by NRS Section 78.439(3), with respect to the Merger Agreement entered into as of September 2010. This Merger Agreement expired by its terms and by a consensus of the parties, and an extension was not entered into despite discussions between the parties through February 2011.
27
PART II
|
ITEM 5.
|
MARKET FOR REGISTRANT’S COMMON EQUITY, RELATED STOCKHOLDER MATTERS AND ISSUER PURCHASES OF EQUITY SECURITIES
|
Our common stock became quoted on the Over the Counter Bulletin Board on May 18, 2005. The ticker symbol for our common stock is "VYTR.OB". As of March 31, 2011, there were 1,732 stockholders of record of our common stock. The following table shows the range of high and low bid prices for our common stock as reported by the OTC Pink Sheets and the OTC Bulletin Board, as the case may be, for each quarter since the beginning of 2009. The quotations reflect inter-dealer prices, without retail markup, markdown or commission and may not represent actual transactions.
|
High
|
Low
|
|||||||
|
Year Ended December 31, 2010:
|
||||||||
|
First Quarter
|
$ | 0.79 | $ | 0.25 | ||||
|
Second Quarter
|
0.75 | 0.25 | ||||||
|
Third Quarter
|
0.75 | 0.25 | ||||||
|
Fourth Quarter
|
0.79 | 0.17 | ||||||
|
Year Ended December 31, 2009:
|
||||||||
|
First Quarter
|
$ | 0.28 | $ | 0.10 | ||||
|
Second Quarter
|
0.28 | 0.10 | ||||||
|
Third Quarter
|
0.75 | 0.11 | ||||||
|
Fourth Quarter
|
1.40 | 0.26 | ||||||
Equity Compensation Plan Information
The following table provides information regarding options outstanding as of December 31, 2010.
|
Plan Category
|
(a)
Number of Securities to
be Issued Upon Exercise
of Outstanding Options,
Warrants and Rights
|
(b)
Weighted-Average
Exercise Price of
Outstanding Options,
Warrants
and Rights
|
(c)
Number of Securities Remaining
Available for Future Issuance
Under Equity Compensation Plans
(Excluding Securities
Reflected in Column (a))
|
|||||||||
|
Equity Compensation Plans Approved by Stockholders:
|
||||||||||||
|
Vyteris Holdings 2005 Stock Option Plan
|
193,460 | $ | 0.61 | - | ||||||||
|
Equity Compensation Plans Not Approved by Stockholders:
|
||||||||||||
|
Vyteris Holdings 2005 Stock Option Plan (1)
|
4,551,877 | $ | 0.61 | 7,995,814 | ||||||||
|
Outside Director Stock Incentive Plan (1)
|
11,982,173 | $ | 0.89 | 5,254,751 | ||||||||
|
Total
|
16,727,510 | $ | 0.81 | 13,250,565 | ||||||||
|
(1)
|
For further information regarding the Vyteris Stock Option Plan and the Outside Director Stock Incentive Plan, see Note 14 to the consolidated financial statements in Item 8 of this Annual Report on Form 10-K.
|
Dividend Policy
We have never declared or paid any dividends on our common stock. We do not anticipate paying any cash dividends on our common stock in the foreseeable future. We currently intend to retain future earnings, if any, to finance operations and the expansion of our business. Any future determination to pay cash dividends will be at the discretion of the board of directors and will depend upon our financial condition, operating results, capital requirements and other factors the board of directors deems relevant, including the provisions of any applicable credit agreements. We are currently restricted from declaring dividends under the terms of various outstanding debentures.
28
|
ITEM 7.
|
MANAGEMENT’S DISCUSSION AND ANALYSIS OF FINANCIAL CONDITION AND RESULTS OF OPERATIONS
|
The following discussion and analysis should be read in conjunction with the other financial information and consolidated financial statements and related notes appearing elsewhere in this Form 10-K. This discussion contains forward-looking statements that involve risks and uncertainties. Our actual results could differ materially from those anticipated in the forward-looking statements as a result of a variety of factors, including those discussed in “Risk Factors” and elsewhere in this Form 10-K.
Introduction
Vyteris, Inc. (the terms “Vyteris”, “we”, “our”, “us” and the “Company” refer to each of Vyteris, Inc. incorporated in the State of Nevada, its subsidiary, Vyteris, Inc. (incorporated in the State of Delaware), its subsidiary, MediSync BioServices, Inc. (“MediSync”) (incorporated in the State of Delaware) and the consolidated company) developed and produced the first FDA-approved, electronically controlled transdermal drug delivery system that transports drugs through the skin comfortably, without needles. We believe that this platform technology can be used to administer a wide variety of therapeutics either directly into the skin or into the bloodstream although we are not currently manufacturing or marketing any iontophoretic products. We hold approximately 50 U.S. and 70 foreign patents relating to the delivery of drugs across the skin using an electronically controlled “smart patch” device. This Management’s Discussion and Analysis contains information as of December 31, 2010 and as of the date of filing of this Form 10-K.
On April 6, 2011, MediSync was merged into us (“Merger”), and is now our wholly owned subsidiary. MediSync’s business plan contemplates the acquisition and operation of CRO and related service businesses, and through the Merger, we have embarked upon our initial venture into the CRO space. Thereafter, we will have two segments – the CRO business and our drug delivery business. Through MediSync, we engaged in one acquisition of a CRO in 2009, and have entered into preliminary agreements with and/or are negotiating arrangements with several other target businesses.
Our CRO Business
MediSync is a Delaware corporation formed in 2006 for the purpose of consolidating preclinical and contract research organizations (CROs) and related businesses, including site management organizations (SMOs), which sub-contract clinical trial-related responsibilities from a CRO or pharmaceutical/biotechnology company, and post marketing surveillance companies, which monitors pharmaceutical drugs or devices after release into the market. MediSync believes that its future operations may provide added value to the pharmaceutical and biomedical industries, resulting in increased value to its shareholders. MediSync further believes that each CRO and related business that it acquires (each, an “Acquired Business”) may benefit from (a) potential cost savings and efficiencies proposed by its consolidation model, (b) the sharing of, and collaboration on, clinical research studies among the Acquired Businesses and (c) new services offered by other Acquired Businesses through the building of relationships between the employees and consultants of the various businesses.
Our Drug Delivery Technology
Our active transdermal drug delivery technology is based upon a process known as electrotransport, or more specifically iontophoresis, the ability to transport drugs, including peptides, through the skin by applying a low-level electrical current. Our active patch patented technology works by applying a charge to the drug-holding reservoir of the patch. This process differs significantly from passive transdermal drug delivery which relies on the slow, steady diffusion of drugs through the skin. A significantly greater number of drugs can be delivered through active transdermal delivery than is possible with passive transdermal delivery. Our technology can also be used in conjunction with complementary technologies to further enhance the ability to deliver drugs transdermally.
29
Liquidity
On December 31, 2010, our cash position was $0.4 million, and we had a working capital deficit of $14.4 million. There is substantial doubt about our ability to continue as a going concern. We continued in 2010 to implement cost cutting measures, including headcount and salary reductions, reducing the level of effort spent on research and development programs, general decrease in overhead costs and renegotiation of our cost structures with our vendors; however, due to the increased costs incurred with respect to the Ferring litigation and the Merger, our capital resources are becoming increasingly strained. In December 2009, Ferring discontinued its collaborative effort with us for our joint infertility project, and we are currently in litigation regarding our ownership rights in and feasibility of continuing this project on our own.
In November 2010, we were awarded two equal grants totaling $0.5 million under the IRS Qualifying Therapeutic Discovery Project (QTDP) program. The grants will be used to advance our smart patch technology for the delivery of therapeutic medicines planned for use to treat female infertility and diabetes. The QTDP program was created by the U.S. Congress as part of the Patient Protection and Affordable Care Act passed on March 23, 2010. Eligibility for the grant requires that a project have the potential to develop new treatments that address "unmet medical needs" or chronic and acute diseases; reduce long-term health care costs; or represent a significant advance in finding a cure for cancer. In January 2011, we also received $0.4 million from the sale of State of New Jersey income tax net operating losses. We also raised $2.9 million from various private placement activities in 2010.
As of April 11, 2011, we have commitments from our Board of Directors and other insiders to fund at least $0.1 million no later than April 21, 2011 ("Initial Bridge Funding"). This Initial Bridge Funding is insufficient to fund our operations for more than three weeks, and during that time, we will not pay for any nonessential services, including salaries for our management team, and we will continue to incur payables, as well as be unable to pay other payables which are already in arrears.
We are currently in negotiations with an investment banking firm with respect its acting as a selling agent for a longer term bridge financing of up to $2.0 million, to be comprised of convertible notes and warrants. Our objective is to launch this bridge financing before April 30, 2011.
Additionally, the Company engaged two other investment bankers in the first quarter of 2011 to assist in raising equity capital needed to complete its business plan. While no specific dollar amounts or terms have been agreed to as yet, our discussions with these firms relate to their raising approximately $10.0 to $15.0 million, to fund CRO’s acquisitions, and for working capital and general corporate purposes.
Even if we are successful in raising the bridge capital set forth above, no inference can be made that this is an indication of potential success in raising equity capital needed to complete its business plan The bridge capital is intended as short term, interim finances, and without successful completion of the larger financing by our investment bankers, management will, more likely than not, be required to substantially curtail, if not cease, operations, which will result in a material adverse effect on the financial position and results of operations of the Company. These conditions raise substantial doubt about the Company’s ability to continue as a going concern.
However, unless we are able to raise additional funding, we may be unable to continue operations, including the need to raise $4.0 million to acquire the MediSync first acquisition target and/or other acquisition targets. Especially in the current economic climate, additional funding may not be available on favorable terms or at all. Failure to obtain such financing will require management to substantially curtail operations, which will result in a material adverse effect on our cash flows, financial position, and results of operations.
Significant Accounting Policies
Our discussion and analysis of our financial position and results of operations are based upon our consolidated financial statements, which have been prepared in accordance with U.S. generally accepted accounting principles. Our significant accounting policies are described in Note 2 to the consolidated financial statements which form a part of this Form 10-K. The preparation of these consolidated financial statements requires us to make estimates and assumptions that affect the reported amounts of assets and liabilities, the disclosure of contingent assets and liabilities at the date of the consolidated financial statements and the reported revenues and expenses during the period. Actual results could differ from these estimates.
We consider certain accounting policies related to revenue recognition, allowance for excess and obsolete inventory, accrued expenses, stock-based compensation and deferred issuance and other debt-related costs to be significant to our business operations and the understanding of our results of operations.
Revenue
Product development revenue: In accordance with ASC 605, the Company recognizes revenues for the reimbursement of development costs when it bears all the risk for selection of and payment to vendors and employees. Costs associated with such activities are included in research and development expenses on the consolidated statements of operations.
Licensing revenue: The Company uses revenue recognition criteria outlined in ASC 605-25 (formerly SAB No. 104, Revenue Recognition in Financial Statements, and Emerging Issues Task Force, EITF, Issue 00-21 Revenue Arrangements with Multiple Deliverables). Accordingly, revenues from licensing agreements are recognized based on the performance requirements of the agreement. Non-refundable up-front fees, where the Company has an ongoing involvement or performance obligation, are generally recorded as deferred revenue in the balance sheet and amortized into license fees in the consolidated statement of operations over the term of the performance obligation.
30
Stock-based Compensation
We account for our stock based employee compensation plans under ASC 718 and ASC 505. ASC 718 and ASC 505 address the accounting for share based payment transactions in which an enterprise receives employee services for equity instruments of the enterprise or liabilities that are based on the fair value of the enterprise's equity instruments or that may be settled by the issuance of such equity instruments. ASC 718 and ASC 505 require that such transactions be accounted for using a fair value based method.
In considering the fair value of the underlying stock when we grant options or restricted stock, we consider several factors, including third party valuations and the fair values established by market transactions. Stock-based compensation includes estimates of when stock options might be exercised, forfeiture rates and stock price volatility. The timing for exercise of options is out of our control and will depend, among other things, upon a variety of factors, including our market value and the financial objectives of the holders of the options. We have limited historical data to determine volatility in accordance with Black-Scholes-Merton modeling or other acceptable valuation models under ASC 718 and ASC 505. In addition, future volatility is inherently uncertain and the valuation models have its limitations. These estimates can have a material impact on stock-based compensation expense in our consolidated statements of operations but will have no impact on our cash flows. Therefore determining the fair value of our common stock involves significant estimates and judgments.
Deferred Issuance and Other Debt-Related Costs
Deferred issuance costs are amortized over the term of its associated debt instrument. We evaluate the terms of the debt instruments to determine if any embedded derivatives or beneficial conversion features exist. We allocate the aggregate proceeds of the notes payable between the warrants and the notes based on their relative fair values in accordance with ASC 470. The fair value of the warrants issued to note holders or placement agents are calculated utilizing the weighted average probability option-pricing model or probability weighted outcomes using a binomial model, depending on the terms of the instruments. We amortize the resultant discount or other features over the terms of the notes through its earliest maturity date using the effective interest method. Under this method, interest expense recognized each period will increase significantly as the instrument approaches its maturity date. If the maturity of the debt is accelerated because of defaults or conversions, then the amortization is accelerated.
Fair Value of Liabilities for Warrant and Embedded Conversion Option Derivative Instruments
Under applicable accounting guidance, an evaluation of outstanding warrants is made to determine whether warrants issued are required to be classified as either equity or a liability. Because certain warrants we have issued in connection with past financings contain certain provisions that may result in an adjustment to their exercise price, we classify them as derivative liabilities, and accordingly, we are then required to estimate the fair value of such warrants, at the end of each quarter. We use the weighted average probabilities of potential down-round scenarios and other assumptions utilizing an unmodified binomial model to estimate such fair value, which requires the use of numerous assumptions, including, among others, expected life, volatility of the underlying equity security, fair value of the underlying common stock, expectations of pricing of the future financing rounds, a risk-free interest rate and expected dividends. The use of different values by management in connection with these assumptions in the weighted average probabilities of potential down-round scenarios and other assumptions utilizing a unmodified binomial model could produce substantially different results. Because we record changes in the fair value of warrants or other features classified as liabilities as either a charge or credit in our consolidated statement of operations, significant changes in the underlying assumptions could have a material effect on our results of operations.
Recently Issued Accounting Standards
In January 2010, the FASB issued guidance to amend the disclosure requirements related to recurring and nonrecurring fair value measurements. The guidance requires new disclosures on the transfers of assets and liabilities between Level 1 (quoted prices in active market for identical assets or liabilities) and Level 2 (significant other observable inputs) of the fair value measurement hierarchy, including the reasons and the timing of the transfers. Additionally, the guidance requires a roll forward of activities on purchases, sales, issuance, and settlements of the assets and liabilities measured using significant unobservable inputs (Level 3 fair value measurements). The guidance became effective for us with the reporting period beginning January 1, 2010, except for the disclosure on the roll forward activities for Level 3 fair value measurements, which will become effective for us with the reporting period beginning January 1, 2011. Other than requiring additional disclosures, adoption of this new guidance did not have a material impact our consolidated financial statements.
31
In February 2010, the FASB issued ASU 2010-09 “Subsequent Event (Topic 855) Amendments to Certain Recognition and Disclosure Requirements”. ASU 2010-09 removes the requirement for an SEC filer to disclose a date in both issued and revised financial statements. Revised financial statements include financial statements revised as a result of either correction of an error or retrospective application of generally accepted accounting principles. All of the amendments in ASU 2010-09 are effective upon issuance of the final ASU, except for the use of the issued date for conduit debt obligors, which is effective for interim or annual periods ending after June 15, 2010. The Company adopted ASU 2010-09 in February 2010 and therefore omitted the disclosure previously required as referenced above.
In April 2010, the FASB issued ASU No. 2010-17, Revenue Recognition — Milestone Method. This ASU provides guidance on the criteria that should be met for determining whether the milestone method of revenue recognition is appropriate. Under the milestone method of revenue recognition, consideration that is contingent upon achievement of a milestone in its entirety can be recognized as revenue in the period in which the milestone is achieved only if the milestone meets all criteria to be considered substantive. This standard provides the criteria to be met for a milestone to be considered substantive which includes that: a) performance consideration earned by achieving the milestone be commensurate with either performance to achieve the milestone or the enhancement of the value of the item delivered as a result of a specific outcome resulting from performance to achieve the milestone; and b) it relates to past performance and be reasonable relative to all deliverables and payment terms in the arrangement. This standard is effective on a prospective basis for milestones achieved in fiscal years beginning on or after June 15, 2010. Although we are still evaluating the impact of this standard, we do not expect its adoption to have a material impact on our financial position or the results of our operations.
Changes in Consolidated Results of Operations
|
Years Ended December 31,
|
||||||||
|
2010 vs. 2009
|
2009 vs. 2008
|
|||||||
|
Increase / (decrease)
|
||||||||
|
Revenues
|
$ | (4,442,917 | ) | $ | 1,410,313 | |||
|
Cost of sales
|
- | (103,490 | ) | |||||
|
Research and development
|
(280,517 | ) | (3,373,945 | ) | ||||
|
General and administrative
|
1,997,372 | 2,664,819 | ||||||
|
Facility realignment and impairment of fixed assets
|
(177,831 | ) | (2,387,603 | ) | ||||
|
Registration rights penalty
|
(215,988 | ) | (44,909 | ) | ||||
|
Loss from operations
|
5,765,953 | 4,655,441 | ||||||
|
Non cash debt extinguishment
|
(35,909,507 | ) | 35,909,507 | |||||
|
Interest expense, net
|
$ | 2,272,438 | $ | (284,226 | ) | |||
Comparison of the Years Ended December 31, 2010 and 2009
Revenues
Revenues were $0.1 million for the year ended December 31, 2010, compared to $4.5 million for the comparable period in 2009, a decrease of 97.4% or $4.4 million. This decrease for the year ended December 31, 2010 is entirely attributable to the termination by Ferring of its License Agreement with us in December 2009. Our revenue for the year ended December 31, 2010 was mainly attributable to feasibility studies, of which will more likely than not, cease in 2011, with the Company focusing on the CRO segment. Our revenue for the year ended December 31, 2009 was primarily derived from reimbursement of product development costs from Ferring. We continue to seek other revenue sources; however, we cannot predict when and if we will be able derive new revenue sources in the near future or at all.
Research and development
Research and development expenses were $2.6 million for the year ended December 31, 2010, compared to $2.9 million for the comparable period in 2009, a decrease of 9.7% or $0.3 million. In 2009 our primary research and development project was our infertility project with Ferring. However, in 2010, due to the termination of the Ferring project, we have instead allocated our research and development resources to internal development projects in the areas of therapeutic peptides and small molecules which we intend to pursue. We expect these costs to decrease in 2011 as compared to 2010 unless we find a partner with which to further develop these products.
32
General and administrative
General and administrative expenses totaled $4.8 million for the year ended December 31, 2010, as compared to $2.8 million for the comparable period in 2009, an increase of 71.4%, or $2.0 million. General and administrative expense for the for the year ended December 31, 2010, included a non-cash charge of $2.3 million for the fair value of employee and director share-based payments as compared to approximately $0.6 million for the comparative period in the prior year. Including the non-cash charge for share-based payments, the remaining general and administrative expenses was $2.5 million for the year ended December 31, 2010, as compared to $2.2 million for the comparable period in 2009, an increase of 9.1%, or $0.2 million. The increase in general and administrative expenses is primarily attributable to an increase in investor relations costs, legal fees, and consulting arrangements, stemming primarily from the Ferring litigation, changes in our business strategy and our attempts to consummate the Merger.
Registration rights penalty
The registration rights penalty for failure to register common stock issued totaled $0.2 million for the year ended December 31, 2009. We did not incur registration rights penalty in the year ended December 31, 2010. On October 30, 2009, we entered into an Amendment and Waiver (“Amendment”) to the Registration Rights Agreement dated September 29, 2004 among the Company, Spencer Trask Ventures, Inc., a related party, Rodman & Renshaw, LLC, and various shareholders. The Amendment required us to compensate investors for registration rights penalties incurred of approximately $2.6 million. We issued 1,250,000 restricted shares of our common stock with a fair value of $0.8 million and warrants to purchase up to 1,250,000 restricted shares of our common stock at an exercise price of $0.75 per share with an expiration date of October 30, 2012 in order to settle the accrued liquidated damages. Accordingly we did not incur registration right penalty expense in the year ended December 31, 2010.
Interest expense, net
Interest expense, net totaled $3.9 million for the year ended December 31, 2010, as compared to $1.6 million for the comparable period in 2009, an increase of $2.3 million or 140.2%. The increase in interest expense, net, for the year ended December 31, 2010 is primarily attributable to the non-cash warrant expense issued to investors of $0.5 million and the non-cash interest expense charge of $3.2 million for the fair value of 6,986,250 warrants issued to noteholders to induce conversion of the June 30, 2010 convertible notes into common stock.
Increase in fair value of derivative financial instruments
We performed an evaluation to determine whether our equity-linked financial instruments (or embedded features) are indexed to our stock, including evaluating the instruments contingent exercise and settlement provisions in accordance with ASC Topic 815. This requirement affects the accounting for our warrants that protect holders from a decline in the stock price (or “down-round” provisions). This also affects the beneficial conversion feature of the 2010 Notes, which have an initial conversion price of $0.20 per share (but such price decreases by 1.5% each 90 day period that the instrument is outstanding, and contains a reset provision in the event subsequent equity raises are at a lower value). For the year ended December 31, 2010, we recorded an a credit of $(0.3) million in the consolidated statement of operations due to the changes in the fair value of our issued warrants that contain such down-round provisions and the variable beneficial conversion feature, using the weighted average probabilities of potential down-round scenarios and other assumptions utilizing a unmodified binomial model.
33
Non-cash debt extinguishment
In connection with the December 24, 2009 restructuring agreement with STSG and affiliated entities, we performed an evaluation of the conversion of approximately $20.3 million of convertible debt and Series B Convertible Mandatorily Redeemable Preferred stock, including accrued and unpaid interest and dividends, into our common stock, pursuant to rules governing accounting for induced conversions of debt, (ASC 470-20). We determined that as a result of a change in the conversion price of convertible debt and preferred stock from $22.50 per share to $0.40 per share, STSG received an incentive to induce conversion of these instruments into our common stock. Accordingly, as of the year ended December 31, 2009, we have recorded a non-cash charge of approximately $35.9 million related to the difference in fair value (based on quoted market prices at the date of the conversion) of the incremental shares received by STSG as a result of the restructuring.
Comparison of the Years Ended December 31, 2009 and 2008
Revenues
Revenues were $4.6 million for the year ended December 31, 2009, compared to $3.2 million for the comparable period in 2008, an increase of 44.8% or $1.4 million. Our revenues for the years ended December 31, 2009 and 2008 were primarily derived from reimbursement of product development costs by Ferring.
Revenues from the development and marketing agreement with Ferring (which was terminated in late December 2009) were $1.9 million for the year ended December 31, 2009, compared to $2.8 million for the comparable period in 2008, a decrease of 32.2% or $0.9 million. This decrease is primarily attributable to reduced patch development and wear studies cost reimbursements upon the initiation of a Phase II clinical trial in the second quarter of 2009.
Other revenue was $2.6 million for the year ended December 31, 2009, compared to $0.3 million for the comparable period in 2008, an increase of 704.0 % or $2.3 million. Upon Ferring’s termination, we recognized previously deferred revenue of $2.6 million resulting from milestone payments. Ferring was our sole source of revenues in 2009 and 2008. We continue to seek other revenue sources; however, we cannot predict when and if we will be able derive new revenue sources in the near future or at all.
Cost of Sales
We did not incur costs of sales for the year ended December 31, 2009; however, we did incur cost of sales of $0.1 million for the comparable period in 2008.
Research and development
Research and development expenses were $2.9 million for the year ended December 31, 2009, compared to $6.3 million for the comparable period in 2008, a decrease of 53.8% or $3.4 million. The decrease is primarily attributable to cost reduction initiatives implemented in 2009 consistent with our management’s strategy to reduce operating expenses and a decrease in patch development and wear studies for our infertility project upon the initiation of a Phase II clinical trial in the second quarter of 2009.
General and administrative
General and administrative expenses totaled $2.8 million for the year ended December 31, 2009, compared to $(0.1) million for the comparable period in 2008, an increase of 2334.6% or $2.9 million. The primary reason for the increase is due to the 2008 impact of ASC 718-10 and ASC 505-50 (formerly SFAS No. 123 (revised 2004), "Shared-Based Payment"), which requires us to measure the fair value of all employee performance share-based payments that vest as an operating expense. General and administrative expenses, for the year ended December 31, 2008 includes a non-cash (credit) of $(7.2) million, related to the issuance of stock options to employees. The credit in stock option expenses resulted from the forfeiture of unvested performance based stock options, previously granted to Tim McIntyre, our former CEO, upon his resignation on March 21, 2008 and Anthony Cherichella, our former CFO, upon his resignation on April 18, 2008, which resulted in the reversal of previously recognized expenses related to such options. Without giving effect to the non-cash (credit) general and administrative expenses would have totaled $7.1 million for the year ended December 31, 2008, which would have yielded a decrease of 60.5% or $4.3 million for 2009 over 2008. The decrease in general and administrative expenses as compared to the comparable period in the prior year is primarily attributable to a decrease in overhead, legal, consulting costs and personnel costs, which include salary, benefits and severance, consistent with management’s strategy to reduce operating expenses.
34
Facilities realignment and impairment of fixed assets
Expenses for facilities realignment and impairment of fixed assets were $0.2 million for the year ended December 31, 2009, compared to $2.6 million for the year ended December 31, 2008. In the first quarter of 2008, we consolidated all of our operations (including offices) into the 13-01 Pollitt Drive facility and recorded a facilities realignment impairment expense of $2.5 million. On September 30, 2009, we entered into a Settlement and Release Agreement with the landlord of the 17-01 Pollitt Drive facility. For discussion of the disposition of this lease, refer to gain on settlement of lease obligations below.
Registration Rights Penalty and Gain on Settlement of Registration Rights Penalty
The registration rights penalty for failure to register common stock totaled $0.2 million for the year ended December 31, 2009 and $0.3 million for the year ended December 31, 2008. In connection with our private placement transactions in September 2004, we filed a registration statement with the SEC relating to the resale of shares of our common stock. Since the SEC did not declare that registration statement effective by February 25, 2005, we became obligated to pay a registration rights penalty to certain stockholders. The registration statement was declared effective on May 12, 2005, resulting in a cumulative obligation to pay liquidated damages of approximately $1.4 million, payment of which would have materially adversely affected our financial condition and ability to remain in business. In addition, we were obligated to pay interest at a rate of 18% per annum, accruing daily, for any liquidated damages not paid in full within 7 days of the date payable, and there was no cap on the amount of interest to be so accrued.
On October 30, 2009, we entered into an Amendment and Waiver (“Amendment”) to the Registration Rights Agreement dated September 29, 2004 among the Company, Spencer Trask Ventures, Inc., a related party, Rodman & Renshaw, LLC, and various shareholders. The Amendment required us to compensate investors for registration rights penalties incurred of approximately $2.6 million. We issued 1,250,000 restricted shares of our common stock with a fair value of $0.8 million and warrants to purchase up to 1,250,000 restricted shares of our common stock at an exercise price of $0.75 per share with an expiration date of October 30, 2012 in order to settle the accrued liquidated damages. The fair value of warrants issued to purchase our common stock was estimated to be $0.4 million using the Black-Scholes-Merton pricing model. We recorded a non-cash gain on settlement of registration rights penalty of $1.4 million in the consolidated statement of operations for the year ended December 31, 2009.
Interest (income) expense, net
Interest (income) expense, net, was $1.6 million for the year ended December 31, 2009, compared to $1.9 million in 2008 a decrease of 14.9% or $0.3 million. This decrease is primarily attributable to non-cash interest expense. Non-cash interest expense totaled $1.5 million for the year ended December 31, 2009 as compared to $0.2 million for the year ended December 31, 2008. Coupon and other interest expense totaled $0.1 million for the year ended December 31, 2009 as compared to $1.7 million for the year ended December 31, 2008.
Gain on settlement of lease obligations
On September 30, 2009, we entered into a Settlement and Release Agreement with 17-01 Pollitt Drive, L.L.C. with respect to our former leasehold at 17-01 Pollitt Drive. The settlement calls for us to pay the Landlord $0.5 million, which is evidenced by the issuance of a five year interest only balloon note with interest accruing at the rate of 6% per year. In exchange the landlord released us from our obligations under the lease (for which we recorded a liability of $2.5 million upon abandonment of the lease facility in 2007) resulting in a gain of $2.0 million for the year ended December 31, 2009 in the consolidated statement of operations.
Non-cash debt extinguishment
In connection with the December 24, 2009 restructuring agreement with STSG and affiliated entities, we performed an evaluation of the conversion of approximately $20.3 million of convertible debt and Series B Convertible Mandatorily Redeemable Preferred stock, including accrued and unpaid interest and dividends, into our common stock, pursuant to rules governing accounting for induced conversions of debt, (ASC 470-20). We determined that as a result of a change in the conversion price of convertible debt and preferred stock from $22.50 per share to $0.40 per share, STSG received an incentive to induce conversion of these instruments into our common stock. Accordingly, as of the year ended December 31, 2009, we have recorded a non-cash charge of approximately $35.9 million related to the difference in fair value (based on quoted market prices at the date of the conversion) of the incremental shares received by STSG as a result of the restructuring.
35
Revaluation of warrant liability
As of December 31, 2009, we performed an evaluation to determine whether our equity-linked financial instruments (or embedded features) are indexed to our stock, including evaluating the instruments contingent exercise and settlement provisions in accordance with ASC Topic 815-10. This requirement affects the accounting for our warrants that protect holders from a decline in the stock price (or “down-round” provisions). As of December 31, 2009, we recorded a $0.3 million loss in the consolidated statement of operations due to the increase in the fair value of 5,080,160 of our issued warrants that contain such anti-dilution provisions using the Black-Scholes-Merton option-pricing model.
Liquidity and Capital Resources
The consolidated financial statements have been prepared assuming that we will continue as a going concern; however, we had cash and cash equivalents of $0.4 million and a working capital deficit of $14.4 million, as of December 31, 2010, which are not sufficient to allow us to continue operations without additional funding, especially given the fact that the Company has approximately $1.9 million in accounts payable which are more than 60 days past due, with increasing numbers of creditors either making claims and/or commencing litigation against us. Our need for liquidity and capital resources is greatly augmented in conjunction with the Merger. We need to raise capital to fund acquisitions of CROs as part of the MediSync business plan. We also require additional funding to support our integration efforts and increased business operations.
No assurance can be given that we will be successful in arranging additional financing needed to continue the execution of our business plan, which includes the integration of MediSync and funding of MediSync’s acquisition activities and the development of new products. Failure to obtain such financing may require management to substantially curtail operations, cease operating our business or file for bankruptcy, which would result in a material adverse effect on our financial position and results of operations. Since January 2009, our primary source of financing has been sales of our common stock, loans, development fees and milestone payments from our collaborative partner, Ferring. In December 2009, Ferring terminated its License Agreement with us and thus we are no longer receiving any payments from Ferring. These factors raise substantial doubt about our ability to continue as a going concern. The consolidated financial statements do not include any adjustments to reflect the possible future effects on the recoverability and classification of assets or the amounts and classification of liabilities that might occur if we are unable to continue in business as a going concern.
As of April 11, 2011, we have commitments from our Board of Directors and other insiders to fund at least $0.1 million no later than April 21, 2011 ("Initial Bridge Funding"). This Initial Bridge Funding is insufficient to fund our operations for more than three weeks, and during that time, we will not pay for any nonessential services, including salaries for our management team, and we will continue to incur payables, as well as be unable to pay other payables which are already in arrears.
We are currently in negotiations with an investment banking firm with respect its acting as a selling agent for a longer term bridge financing of up to $2.0 million, to be comprised of convertible notes and warrants. Our objective is to launch this bridge financing before April 30, 2011.
Additionally, the Company engaged two other investment bankers in the first quarter of 2011 to assist in raising equity capital needed to complete its business plan. While no specific dollar amounts or terms have been agreed to as yet, our discussions with these firms relate to their raising approximately $10.0 to $15.0 million, to fund CRO’s acquisitions, and for working capital and general corporate purposes.
Even if we are successful in raising the bridge capital set forth above, no inference can be made that this is an indication of potential success in raising equity capital needed to complete its business plan The bridge capital is intended as short term, interim finances, and without successful completion of the larger financing by our investment bankers, management will, more likely than not, be required to substantially curtail, if not cease, operations, which will result in a material adverse effect on the financial position and results of operations of the Company. These conditions raise substantial doubt about the Company’s ability to continue as a going concern.
In November 2010, we were awarded two equal grants totaling $0.5 million under the IRS Qualifying Therapeutic Discovery Project (QTDP) program. The grants will be used to advance our smart patch technology for the delivery of therapeutic medicines planned for use to treat female infertility and diabetes. The QTDP program was created by the U.S. Congress as part of the Patient Protection and Affordable Care Act passed on March 23, 2010. Eligibility for the grant requires that a project have the potential to develop new treatments that address "unmet medical needs" or chronic and acute diseases; reduce long-term health care costs; or represent a significant advance in finding a cure for cancer.
In 2011 our plans for cash flows from operating activities will stem from revenues obtained from proposed acquisitions of businesses deriving from the acquisitions of businesses by MediSync. We would plan on consummating at least one cash flow generating business in 2011; however, the identity and materiality of the cash flows to be generated may vary greatly depending on the identity and timing of such acquisitions.
36
Comparison of 2010 to 2009 and 2009 to 2008
Cash flows from operating activities
For the year ended December 31, 2010, we had $4.7 million of net cash used by operating activities, as compared to $1.0 million of net cash provided by operating activities during 2009, a decrease in net cash provided of $5.7 million, or 50.7%. The principal factors in both years were our net loss and non-cash items. During 2010, we had a net loss of $10.5 million partially offset by $6.5 million of non-cash items and $0.65 million of other items resulting in net cash used in operating activities of $4.7 million.
For the year ended December 31, 2009, we had $1.0 million of net cash provided by operating activities, as compared to using $7.6 million of net cash used in operating activities during 2008, a decrease in net cash used of $8.5 million, or 112.5%. The principal factors in both years were our net loss and non-cash items. During 2009, we had a net loss of $33.9 million partially offset by $31.5 million of non-cash items and $3.4 million of other items resulting in net cash provided by operating activities of $1.0 million.
Cash flows from investing activities
For the year ended December 31, 2010, net cash provided by investing activities was de minimis, as compared to net cash provided by investing activities during 2009 of $0.7 million.
For the year ended December 31, 2009 net cash provided by investing activities was $0.7 million, as compared to net cash provided by investing activities during 2008 of $0.2 million, a increase of approximately $0.5 million, or 150.0%. During 2009, the cash provided by investing activities is primarily related to the sale of manufacturing equipment of approximately $0.6 million.
Cash flows from financing activities
For the year ended December 31, 2010, our financing activities provided us $2.5 million, as compared to $0.8 million of net cash provided by financing activities in the comparable period in the prior year. During the year ended December 31, 2010, we sold to accredited investors $1.8 million principal amount of senior subordinated convertible promissory notes due 2013 and $1.2 million of subordinated convertible promissory notes which was partially offset by $0.4 million in related debt issuance costs.
For the year ended December 31, 2009, our financing activities provided us with $0.8 million of net cash, as compared to $5.9 million of net cash during 2008, a decrease of $5.0 million or 85.6%. During the year ended December 31, 2009, we raised $0.6 million in net proceeds from private placements of common stock, $0.5 million in net proceeds from purchase of equipment by Ferring and repaid $0.3 million of the 2009 Promissory Note due to STSG.
Financing Events in 2008, 2009 and 2010
February 2008 Private Placement
In February of 2008, we raised a total of $1.8 million in a private placement pursuant to which we issued to investors a total of 600,000 shares of common stock at a purchase price of $3.00 per share (“February 2008 Financing”). The investors were issued warrants to purchase our common stock in an amount equal to two times the number of shares purchased, or 1,200,000 total warrants. Those investor warrants bear a five year term and have an exercise price of $3.00 per share, and contain a mandatory exercise provision at our election should the market price of our common stock be at least $4.50 for 20 consecutive trading days. In connection with the February 2008 Financing, we paid a finders fee to Ramp Partners in the amount of $0.2 million, representing 10% of the gross proceeds raised. Ramp reinvested its cash fee in the February 2008 Financing and received 60,000 shares of common stock and 120,000 warrants. Net proceeds (after reinvestment of the cash finder’s fee) were $1.8 million, with no legal or other professional fees attributed thereto as offering costs.
37
Funds Raised Pursuant to Temporary Reduction in Exercise Price of Warrants
On February 1, 2008, we temporarily reduced the exercise price of all of our issued and outstanding warrants to $3.00. As of February 1, 2008, we had 3,864,944 warrants issued and outstanding. On February 28, 2008, the total number of warrants exercised under this temporary reduction in exercise price was 611,895 resulting in net proceeds to us of $1.8 million. All shares issued as a result of these warrant exercises are unregistered, restricted shares of our common stock.
Milestone Advance from Ferring
Effective July 9, 2008, Ferring advanced a $2.5 million payment which would otherwise be due to us from Ferring should they elect to proceed with Phase II Clinical Trials (“Phase II”) as described in the License and Development Agreement dated as of September 27, 2004 (as heretofore amended, the “License Agreement”.) The $2.5 million was advanced in the form of a loan, and we issued a $2.5 million principal amount secured note (“Note”) to Ferring. The Note was satisfied in March 2009.
On December 16, 2008, Ferring loaned us an additional $0.2 million in the form of a promissory note issued by us to Ferring which was satisfied in March 2009.
Transaction Agreement with Ferring March 2009
In March 2009, we entered into a transaction with Ferring whereby they agreed to fund the first half of the 2009 development budget up to $3.3 million, in exchange for which we granted Ferring a senior security interest in our assets (which Ferring has agreed to subordinate to the security interest of new third party lenders for a value of over $3.3 million).
Ferring also agreed to buy our PMK 150 machine for $1.0 million, of which $0.5 million was paid at closing (half to satisfy outstanding senior secured convertible debentures due to Ferring) and $0.3 million was paid on May 14, 2009 (part to satisfy accrued and unpaid interest on loans from Ferring) and which has been leased back to us at a rental amount of $1,000 per month. We account for the lease of the PMK 150 machine as an operating lease and are recognizing the deferred gain on the sale of the machine over the 10 year lease.
Termination of Ferring Agreement
On December 21, 2009, we received notice from Ferring of its termination of the License and Development Agreement, dated September 27, 2004, by and between us and Ferring (“Agreement”) under Section 9.04 of the Agreement, effective January 21, 2010.
In July 2010, we filed a complaint against Ferring entitled “Vyteris, Inc. v. Ferring Pharmaceuticals, Inc.” in the Superior Court of New Jersey, Chancery Division – Essex County to resolve outstanding issues with respect to this termination.
October 30, 2009 Private Placement
On October 30, 2009, we issued 3,000,000 shares of our common stock and 3,000,000 warrants to purchase its common stock to an investor for a purchase price of $0.6 million in a transaction exempt from registration under Section 4(2) of the Securities Act of 1933. The warrants are exercisable into shares of our common stock at an exercise price of $0.20 per share, and bear a term of five years from the date of closing. The warrants contain a cashless exercise provision and “full ratchet” anti-dilution provisions. We paid fees in the amount of $0.1 million and issued a total of 1,200,000 warrants allocated as follows: (i) 600,000 warrants representing 20% of the common stock issued to investors and (ii) 600,000 warrants representing 20% of the warrants issued to investors in connection with this private placement recorded as a reduction of equity as a cost of the transaction. All warrants issued contain terms identical to the terms of the warrants issued to the investors.
Proceeds from previously approved sale of State of New Jersey net operating tax losses
On December 23, 2009, we consummated a non-dilutive capital raise in the net amount of $2.1 million. The State of New Jersey approved the sale of our prior year’s state net operating tax losses and research tax credits through the New Jersey Economic Development Authority (NJEDA). The funding will be used for operations and capital expenditures in accordance with rules, regulations and stipulations set forth by the New Jersey program.
38
Senior subordinated convertible promissory notes, net of discount
In February 2010 and May 2010, we sold to accredited investors (“Investors”) in a private placement $1.1 million and $0.7 million, respectively, principal amount of Senior Subordinated Convertible Promissory Notes due 2013 (the “2010 Notes”). The 2010 Notes bear no interest and are convertible into our common stock at the option of the Investors anytime at an initial conversion price of $0.20 per share. The conversion price automatically reduces by 1.5% of the conversion price after each 90 day period that 2010 Notes are outstanding, and additionally, the conversion price resets in the event of a subsequent issuance of stock at a lower price than the then effective conversion price. In addition, the 2010 Notes automatically convert into our common stock if the closing bid price of our common stock equals or exceeds 300% of the conversion price for a period of twenty consecutive trading days.
In connection with the sale of the 2010 Notes, we also issued five-year warrants to purchase an aggregate of 5,300,000 shares with an exercise price of $0.20 per share and 3,625,000 shares of our common stock with an exercise price of $0.25 per share, respectively. In conjunction therewith, we provided customary “piggyback” registration rights for a 24-month period to the Investors with respect to the shares of common stock underlying the notes and warrants.
Subordinated convertible promissory notes, net of discount
On June 30, 2010, we consummated a private placement to accredited investors (“June Investors”) of $1.2 million principal amount of Subordinated Convertible Promissory Notes due September 30, 2010 (the “June 2010 Notes”). The sale of the June 2010 Notes also included issuance to Investors of five-year warrants to purchase an aggregate of 2,300,000 shares of our common stock with an exercise price of $0.25 per share. As of September 30, 2010, the Investors converted the June 2010 Notes into 5,836,250 shares of our common stock and 5,836,250 warrants to purchase our common stock with an exercise price of $0.25 per share.
Qualifying Therapeutic Discovery Project (QTDP) program
In November 2010, we were awarded two equal grants totaling $0.5 million under the IRS QTDP program. The grants will be used to advance our smart patch technology for the delivery of therapeutic medicines planned for use to treat female infertility and diabetes. The QTDP program was created by the U.S. Congress as part of the Patient Protection and Affordable Care Act passed on March 23, 2010. Eligibility for the grant requires that a project have the potential to develop new treatments that address "unmet medical needs" or chronic and acute diseases; reduce long-term health care costs; or represent a significant advance in finding a cure for cancer.
Cash Position
See “Liquidity and Capital Resources” under “Management’s Discussion and Analysis of Financial Condition and Results of Operations” for information on our cash position.
Contractual Obligations and Other Commitments
Our contractual obligations and commitments at December 31, 2010 include obligations associated with capital and operating leases, manufacturing equipment, and employee agreements as set forth in the table below:
|
At December 31, 2010
|
||||||||||||||||||||
|
Total
|
Less than
1 year
|
1-3 Years
|
3-5 Years
|
Greater than
5 years
|
||||||||||||||||
|
Operating lease obligations
|
$ | 402,580 | $ | 321,379 | $ | 81,201 | $ | - | $ | - | ||||||||||
|
PMK 150 lease agreement
|
98,000 | 12,000 | 24,000 | 24,000 | 38,000 | |||||||||||||||
|
Insurance financing obligation
|
103,518 | 103,518 | - | - | - | |||||||||||||||
|
Debt obligations (1)
|
4,010,000 | - | 3,510,000 | 500,000 | - | |||||||||||||||
|
Total
|
$ | 4,614,098 | $ | 436,897 | $ | 3,615,201 | $ | 524,000 | $ | 38,000 | ||||||||||
39
(1) Debt obligations are summarized as follows:
|
Lender
|
Face Amount
|
Due Date
|
Interest
Rate
|
Description
On Balance Sheet
|
|||||||
|
Senior subordinated convertible promissory notes
|
$ | 1,035,000 |
February 2013
|
— |
Senior subordinated convertible promissory notes, net of discount (see Note 7)
|
||||||
|
Promissory note due to a related party
|
1,750,000 |
February 2013
|
6 | % |
Promissory note due to a related party (see Note 6)
|
||||||
|
Senior subordinated convertible promissory notes
|
725,000 |
May 2013
|
— |
Senior subordinated convertible promissory notes, net of discount (see Note 7)
|
|||||||
|
Convertible notes payable
|
500,000 |
August 2014
|
6 | % |
Convertible note payable
(see Note 13)
|
||||||
|
Total
|
$ | 4,010,000 | |||||||||
40
|
ITEM 8.
|
FINANCIAL STATEMENTS AND SUPPLEMENTARY DATA
|
VYTERIS, INC.
INDEX TO CONSOLIDATED FINANCIAL STATEMENTS
|
Reports of Independent Registered Public Accounting Firms
|
42 - 43
|
|
|
Consolidated Balance Sheets as of December 31, 2010 and 2009
|
44
|
|
|
Consolidated Statements of Operations for the years ended December 31, 2010, 2009 and 2008
|
45
|
|
|
Consolidated Statements of Stockholders’ Equity (Deficit) for the years ended December 31, 2010, 2009 and 2008
|
46
|
|
|
Consolidated Statements of Cash Flows for the years ended December 31, 2010, 2009 and 2008
|
47 - 48
|
|
|
Notes to Consolidated Financial Statements
|
49 - 72
|
41
Report of Independent Registered Public Accounting Firm
We have audited the accompanying consolidated balance sheet of Vyteris, Inc. and Subsidiary as of December 31, 2010, and the related consolidated statement of operations, stockholders’ deficit, and cash flows for the year then ended. These financial statements are the responsibility of the Company’s management. Our responsibility is to express an opinion on these financial statements based on our audit.
We conducted our audit in accordance with the standards of the Public Company Accounting Oversight Board (United States). Those standards require that we plan and perform the audit to obtain reasonable assurance about whether the financial statements are free of material misstatement. The Company is not required to have, nor were we engaged to perform, an audit of its internal control over financial reporting. Our audit included consideration of internal control over financial reporting as a basis for designing audit procedures that are appropriate in the circumstances, but not for the purpose of expressing an opinion on the effectiveness of the Company’s internal control over financial reporting. Accordingly we express no such opinion. Our audit of the financial statements included examining, on a test basis, evidence supporting the amounts and disclosures in the financial statements, assessing the accounting principles used and significant estimates made by management, and evaluating the overall financial statement presentation. We believe that our audit provides a reasonable basis for our opinion.
In our opinion, the consolidated financial statements referred to above present fairly, in all material respects, the financial position of Vyteris, Inc. and Subsidiary at December 31, 2010, and the consolidated results of its operations and its cash flows for the year ended December 31, 2010, in conformity with accounting principles generally accepted in the United States of America.
As more fully described in Note 1, the Company has incurred recurring losses and is dependent upon obtaining sufficient additional financing to fund operations and has not been able to meet all of its obligations as they become due. These conditions raise substantial doubt about the Company’s ability to continue as a going concern. Management’s plans regarding those matters also are described in Note 1. The accompanying financial statements do not include any adjustments to reflect the possible future effects of the recoverability of assets or the amounts and classification of liabilities that may result from the outcome of this uncertainty.
|
/s/ EisnerAmper LLP
|
||
|
Edison, New Jersey
|
||
|
April 15, 2011
|
42
Report of Independent Registered Public Accounting Firm
We have audited the accompanying consolidated balance sheet of Vyteris, Inc. and Subsidiary as of December 31, 2009, and the related consolidated statements of operations, stockholders’ deficit, and cash flows for the years ended December 31, 2009 and 2008. These financial statements are the responsibility of the Company’s management. Our responsibility is to express an opinion on these financial statements based on our audits.
We conducted our audits in accordance with the standards of the Public Company Accounting Oversight Board (United States). Those standards require that we plan and perform the audits to obtain reasonable assurance about whether the financial statements are free of material misstatement. The Company is not required to have, nor were we engaged to perform, an audit of its internal control over financial reporting. Our audits included consideration of internal control over financial reporting as a basis for designing audit procedures that are appropriate in the circumstances, but not for the purpose of expressing an opinion on the effectiveness of the Company’s internal control over financial reporting. Accordingly we express no such opinion. Our audits of the financial statements included examining, on a test basis, evidence supporting the amounts and disclosures in the financial statements, assessing the accounting principles used and significant estimates made by management, and evaluating the overall financial statement presentation. We believe that our audits provide a reasonable basis for our opinion.
In our opinion, the consolidated financial statements referred to above present fairly, in all material respects, the financial position of Vyteris, Inc. and Subsidiary at December 31, 2009, and the consolidated results of its operations and its cash flows for each of the years in the two year period ended December 31, 2009, in conformity with accounting principles generally accepted in the United States of America.
The accompanying consolidated financial statements have been prepared assuming the Company will continue as a going concern. As more fully described in Note 1, the Company has incurred recurring losses and is dependent upon obtaining sufficient additional financing to fund operations and has not been able to meet all of its obligations as they become due. These conditions raise substantial doubt about the Company’s ability to continue as a going concern. Management’s plans regarding those matters also are described in Note 1. These financial statements do not include any adjustments to reflect the possible future effects of the recoverability of assets or the amounts and classification of liabilities that may result from the outcome of this uncertainty.
|
/s/ Amper, Politziner & Mattia, LLP
|
||
|
Edison, New Jersey
|
||
|
March 24, 2010
|
43
VYTERIS, INC.
CONSOLIDATED BALANCE SHEETS
|
December 31,
2010
|
December 31,
2009
|
|||||||
|
ASSETS
|
||||||||
|
Current assets:
|
||||||||
|
Cash and cash equivalents
|
$ | 402,845 | $ | 2,173,039 | ||||
|
Other receivables
|
945,930 | 1,575 | ||||||
|
Other current assets
|
123,831 | 118,952 | ||||||
|
Total current assets
|
1,472,606 | 2,293,566 | ||||||
|
Debt issuance costs, net
|
1,989,275 | — | ||||||
|
Property and equipment, net
|
25,497 | 114,024 | ||||||
|
Other assets
|
287,702 | 225,356 | ||||||
|
TOTAL ASSETS
|
$ | 3,775,080 | $ | 2,632,946 | ||||
|
LIABILITIES AND STOCKHOLDERS’ (DEFICIT)
|
||||||||
|
Current liabilities:
|
||||||||
|
Accounts payable
|
$ | 2,188,012 | $ | 2,432,976 | ||||
|
Fair value of derivative financial instruments
|
9,835,764 | 2,634,487 | ||||||
|
Accrued expenses and other
|
3,632,308 | 3,135,013 | ||||||
|
Interest payable, deferred revenue, and accrued expenses due to a related party
|
216,559 | 111,560 | ||||||
|
Total current liabilities
|
15,872,643 | 8,314,036 | ||||||
|
Promissory note due to a related party
|
1,750,000 | 1,750,000 | ||||||
|
Senior subordinated convertible promissory notes, net of discount of $1,711,707
|
48,293 | — | ||||||
|
Deferred revenue
|
721,237 | 821,237 | ||||||
|
Convertible note payable
|
500,000 | 500,000 | ||||||
|
Total liabilities
|
18,892,173 | 11,385,273 | ||||||
|
Commitments and contingencies
|
||||||||
|
Stockholders’ (deficit):
|
||||||||
|
Common stock, par value $0.015 per share; 400,000,000 shares authorized, at December 31, 2010 and December 31, 2009; 68,983,557 and 62,398,817 shares issued and outstanding at December 31, 2010 and December 31, 2009, respectively
|
1,034,753 | 935,982 | ||||||
|
Additional paid-in capital
|
208,726,752 | 204,642,912 | ||||||
|
Accumulated deficit
|
(224,878,598 | ) | (214,331,221 | ) | ||||
|
Total stockholders’ (deficit)
|
(15,117,093 | ) | (8,752,327 | ) | ||||
|
TOTAL LIABILITIES AND STOCKHOLDERS’ (DEFICIT)
|
$ | 3,775,080 | $ | 2,632,946 | ||||
The accompanying notes are an integral part of these consolidated financial statements.
44
VYTERIS, INC.
CONSOLIDATED STATEMENTS OF OPERATIONS
|
Years Ended December 31,
|
||||||||||||
|
2010
|
2009
|
2008
|
||||||||||
|
Revenues:
|
||||||||||||
|
Product development revenue
|
$ | 102,325 | $ | 1,913,080 | $ | 2,821,098 | ||||||
|
Licensing, product sales, and other revenue
|
15,467 | 2,647,629 | 329,298 | |||||||||
|
Total revenues
|
117,792 | 4,560,709 | 3,150,396 | |||||||||
|
Costs and expenses:
|
||||||||||||
|
Cost of sales
|
— | — | 103,490 | |||||||||
|
Research and development
|
2,615,174 | 2,895,691 | 6,269,636 | |||||||||
|
General and administrative including (credit) for reversal of performance – based stock option grants of ($6.1) million in 2008
|
4,794,135 | 2,796,763 | 50,352 | |||||||||
|
Facility realignment and impairment of fixed assets
|
— | 177,831 | 2,565,434 | |||||||||
|
Non-cash warrant expense – financial consultants
|
— | — | 81,592 | |||||||||
|
Registration rights penalty
|
— | 215,988 | 260,897 | |||||||||
|
Total costs and expenses
|
7,409,309 | 6,086,273 | 9,331,401 | |||||||||
|
Loss from operations
|
(7,291,517 | ) | (1,525,564 | ) | (6,181,005 | ) | ||||||
|
Interest (income) expense:
|
||||||||||||
|
Interest income
|
(1,623 | ) | (552 | ) | (42,984 | ) | ||||||
|
Interest expense
|
169,085 | 1,621,338 | 1,947,996 | |||||||||
|
Non-cash interest expense for warrants issued
|
3,725,762 | — | — | |||||||||
|
Interest expense, net
|
3,893,224 | 1,620,786 | 1,905,012 | |||||||||
|
Other (income) expenses:
|
||||||||||||
|
Gain on settlement of lease obligations
|
— | (1,953,977 | ) | — | ||||||||
|
Gain on settlement of registration rights penalty
|
— | (1,385,017 | ) | — | ||||||||
|
Non-cash debt extinguishment
|
— | 35,909,507 | — | |||||||||
|
Qualified therapeutic research and development grant
|
(488,959 | ) | — | — | ||||||||
|
Increase in fair values of derivative financial instruments
|
273,567 | 294,668 | — | |||||||||
|
Total other (income) expenses
|
(215,392 | ) | 32,865,181 | — | ||||||||
|
Loss before benefit from income taxes
|
(10,969,349 | ) | (36,011,531 | ) | (8,086,017 | ) | ||||||
|
Sale of State of New Jersey net operating losses
|
421,972 | 2,071,168 | 61,777 | |||||||||
|
Net loss
|
$ | (10,547,377 | ) | $ | (33,940,363 | ) | $ | (8,024,240 | ) | |||
|
Net loss per common share:
|
||||||||||||
|
Basic and diluted
|
$ | (0.16 | ) | $ | (3.77 | ) | $ | (1.14 | ) | |||
|
Weighted average number of common shares:
|
||||||||||||
|
Basic and diluted
|
64,392,135 | 9,002,816 | 7,032,288 | |||||||||
The accompanying notes are an integral part of these consolidated financial statements.
45
VYTERIS, INC.
CONSOLIDATED STATEMENTS OF STOCKHOLDERS’ EQUITY (DEFICIT)
|
Common Stock
|
||||||||||||||||||||
|
Shares
|
Amount
|
Additional
Paid-in
Capital
|
Accumulated
Deficit
|
Total
Stockholders’
Equity (Deficit)
|
||||||||||||||||
|
Balance at January 1, 2008
|
5,925,393 | $ | 88,881 | $ | 149,152,702 | $ | (172,366,618 | ) | $ | (23,125,035 | ) | |||||||||
|
Non-cash stock based compensation expense (credits)
|
– | – | (4,051,359 | ) | – | (4,051,359 | ) | |||||||||||||
|
Issuance of common stock for capital raised, net
|
660,000 | 9,900 | 1,790,100 | – | 1,800,000 | |||||||||||||||
|
Exercise of warrants
|
611,895 | 9,178 | 1,826,505 | – | 1,835,683 | |||||||||||||||
|
Non-cash warrant expense – financial consultants
|
– | – | 81,592 | – | 81,592 | |||||||||||||||
|
Issuance of warrants for services rendered
|
– | – | 184,000 | – | 184,000 | |||||||||||||||
|
Issuance of common stock for services rendered
|
85,000 | 1,275 | 48,025 | – | 49,300 | |||||||||||||||
|
Adjustment to common stock related to reverse stock split
|
514 | 8 | (8 | ) | – | – | ||||||||||||||
|
Net loss
|
– | – | – | (8,024,240 | ) | (8,024,240 | ) | |||||||||||||
|
Balance at December 31, 2008
|
7,282,802 | 109,242 | 149,031,557 | (180,390,858 | ) | (31,250,059 | ) | |||||||||||||
|
Non-cash stock based compensation expense, net
|
– | – | 639,007 | – | 639,007 | |||||||||||||||
|
Issuance of common stock for services rendered
|
9,000 | 135 | 1,260 | – | 1,395 | |||||||||||||||
|
Issuance of common stock upon exercise of warrants issued for settlement with landlord
|
80,000 | 1,200 | 6,800 | – | 8,000 | |||||||||||||||
|
Issuance of warrants
|
– | – | 154,200 | – | 154,200 | |||||||||||||||
|
Issuance of common stock for capital raised, net
|
3,000,000 | 45,000 | 477,000 | – | 522,000 | |||||||||||||||
|
Issuance of common stock and warrants upon settlement of registration rights penalty
|
1,250,000 | 18,750 | 1,214,250 | – | 1,233,000 | |||||||||||||||
|
Issuance of common stock pursuant to conversion of senior secured convertible debentures and preferred stock due to a related party
|
50,777,015 | 761,655 | 19,549,151 | – | 20,310,806 | |||||||||||||||
|
Fair value of warrants upon classification from an equity instrument to a liability instrument issued in 2009
|
– | – | (2,339,820 | ) | – | (2,339,820 | ) | |||||||||||||
|
Charge resulting from non-cash debt extinguishment
|
– | – | 35,909,507 | – | 35,909,507 | |||||||||||||||
|
Net loss
|
– | – | – | (33,940,363 | ) | (33,940,363 | ) | |||||||||||||
|
Balance at December 31, 2009
|
62,398,817 | 935,982 | 204,642,912 | (214,331,221 | ) | (8,752,327 | ) | |||||||||||||
|
Non-cash stock based compensation expense
|
– | – | 2,303,700 | – | 2,303,700 | |||||||||||||||
|
Issuance of common stock for services rendered
|
619,654 | 9,295 | 316,315 | – | 325,610 | |||||||||||||||
|
Issuance of common stock upon conversion of convertible debt
|
5,965,086 | 89,476 | 1,102,915 | – | 1,192,391 | |||||||||||||||
|
Issuance of warrants for services rendered
|
– | – | 342,400 | – | 342,400 | |||||||||||||||
|
Other issuance of warrants
|
– | – | 18,510 | – | 18,510 | |||||||||||||||
|
Net loss
|
– | – | – | (10,547,377 | ) | (10,547,377 | ) | |||||||||||||
|
Balance at December 31, 2010
|
68,983,557 | $ | 1,034,753 | $ | 208,726,752 | $ | (224,878,598 | ) | $ | (15,117,093 | ) | |||||||||
The accompanying notes are an integral part of these consolidated financial statements.
46
VYTERIS, INC.
CONSOLIDATED STATEMENTS OF CASH FLOWS
|
Years Ended December 31,
|
||||||||||||
|
2010
|
2009
|
2008
|
||||||||||
|
CASH FLOWS FROM OPERATING ACTIVITIES:
|
||||||||||||
|
Net loss
|
$ | (10,547,377 | ) | $ | (33,940,363 | ) | $ | (8,024,240 | ) | |||
|
Adjustments to reconcile net loss to net cash used in operating activities:
|
||||||||||||
|
Depreciation and amortization
|
88,526 | 175,421 | 286,300 | |||||||||
|
Gain on settlement of lease obligations
|
- | (1,953,977 | ) | - | ||||||||
|
Non-cash debt extinguishment
|
- | 35,909,507 | - | |||||||||
|
Inventory reserves
|
- | - | 94,890 | |||||||||
|
Impairment of fixed assets and accrued facilities realignment costs
|
- | - | 2,565,434 | |||||||||
|
Gain on settlement of registration rights penalty
|
- | (1,385,017 | ) | - | ||||||||
|
Accrued registration rights penalty
|
- | 215,988 | 260,897 | |||||||||
|
Amortization of long term gain on sale of manufacturing machine
|
(100,000 | ) | - | - | ||||||||
|
Stock based compensation
|
2,303,700 | 639,007 | (4,051,359 | ) | ||||||||
|
Issuance of common stock for services rendered
|
325,610 | - | - | |||||||||
|
Issuance of common stock warrants for services rendered
|
342,400 | - | 184,000 | |||||||||
|
Non-cash warrant expense
|
- | - | 81,592 | |||||||||
|
Issuance of warrants related to promissory notes
|
(27,865 | ) | - | - | ||||||||
|
Amortization of discount on promissory notes
|
48,293 | - | 231,403 | |||||||||
|
Amortization of deferred offering related to promissory notes
|
51,429 | - | - | |||||||||
|
Write-off of deferred offering costs upon conversion of promissory notes
|
3,590,139 | - | - | |||||||||
|
Increase (decrease) in fair value of derivative financial instruments
|
273,567 | 294,668 | - | |||||||||
|
Other
|
35,901 | 227,689 | (209,851 | ) | ||||||||
|
Change in operating assets and liabilities:
|
||||||||||||
|
Accounts receivable
|
(944,355 | ) | 2,559 | 4,698 | ||||||||
|
Inventory and other
|
- | - | (94,890 | ) | ||||||||
|
Prepaid expenses and other assets
|
(67,225 | ) | 59,320 | 117,341 | ||||||||
|
Accounts payable
|
(244,964 | ) | (225,964 | ) | 901,564 | |||||||
|
Accrued expenses and other liabilities
|
439,991 | 2,008,587 | (1,257,940 | ) | ||||||||
|
Recognition of deferred revenue
|
(32,352 | ) | (2,625,783 | ) | - | |||||||
|
Interest payable and accrued expenses
|
194,655 | 1,577,534 | 1,356,763 | |||||||||
|
Net cash (used in) provided by operating activities
|
$ | (4,269,927 | ) | $ | 979,176 | $ | (7,553,398 | ) | ||||
|
CASH FLOWS FROM INVESTING ACTIVITIES:
|
||||||||||||
|
Changes in restricted cash
|
- | - | 166,182 | |||||||||
|
Proceeds from the sale of property and equipment
|
- | 124,245 | 9,800 | |||||||||
|
Purchase of equipment
|
- | (1,926 | ) | (4,695 | ) | |||||||
|
Net proceeds from sale of manufacturing equipment
|
- | 568,723 | - | |||||||||
|
Net cash provided by investing activities
|
$ | - | $ | 691,042 | $ | 171,287 | ||||||
|
CASH FLOWS FROM FINANCING ACTIVITIES:
|
||||||||||||
|
Net proceeds from placement of common stock and warrants
|
- | 522,000 | 1,800,000 | |||||||||
|
Proceeds from exercise of options and warrants
|
- | 8,000 | 1,835,683 | |||||||||
|
Net proceeds from convertible promissory notes
|
- | - | 2,750,000 | |||||||||
|
Issuance of Senior subordinated convertible promissory note
|
1,785,000 | - | - | |||||||||
|
Issuance of subordinated convertible promissory note
|
1,150,000 | - | - | |||||||||
|
Repayment of senior secured convertible promissory note
|
- | (250,000 | ) | (475,000 | ) | |||||||
|
Fees related to the issuance of promissory notes
|
(435,267 | ) | - | - | ||||||||
|
Other
|
- | - | (22,422 | ) | ||||||||
|
Net cash provided by financing activities
|
$ | 2,499,733 | $ | 280,000 | $ | 5,888,261 | ||||||
|
Net (decrease) increase in cash and cash equivalents
|
(1,770,194 | ) | 1,950,218 | (1,493,850 | ) | |||||||
|
Cash and cash equivalents at beginning of the year
|
2,173,039 | 222,821 | 1,716,671 | |||||||||
|
Cash and cash equivalents at end of the year
|
$ | 402,845 | $ | 2,173,039 | $ | 222,821 | ||||||
47
VYTERIS, INC.
CONSOLIDATED STATEMENTS OF CASH FLOWS (CONTINUED)
|
Years Ended December 31,
|
||||||||||||
|
|
2010
|
2009
|
2008
|
|||||||||
|
SUPPLEMENTAL DISCLOSURE OF CASH FLOW INFORMATION:
|
||||||||||||
|
Interest paid
|
$ | 2,291 | $ | 181,559 | $ | 51,859 | ||||||
|
Issuance of warrants in connection with private placements of common stock
|
— | — | 4,761,000 | |||||||||
|
Reclassification of the fair value of warrants from an equity instrument to a liability instrument
|
— | 2,339,820 | — | |||||||||
|
Issuance of warrants
|
— | 154,200 | — | |||||||||
|
Settlement of registration rights penalty upon issuance of common stock and warrants to shareholders
|
— | 1,233,000 | — | |||||||||
|
Issuance of common stock upon conversion of interest on convertible debt
|
17,392 | — | — | |||||||||
|
Issuance of common stock upon conversion of convertible debt
|
1,192,392 | — | — | |||||||||
|
Warrants issued to investment finders included in debt issuance costs
|
1,954,831 | — | — | |||||||||
|
Conversion of senior secured convertible debentures and preferred stock due to a related party
|
$ | — | $ | 20,310,806 | $ | — | ||||||
The accompanying notes are an integral part of these consolidated financial statements.
48
VYTERIS, INC.
NOTES TO CONSOLIDATED FINANCIAL STATEMENTS (CONTINUED)
1. Business, Basis of Presentation, and Going Concern
Basis of presentation
The accompanying consolidated financial statements have been prepared assuming that Vyteris, Inc. (the terms “Vyteris” and the “Company” refer to each of Vyteris, Inc. (incorporated in the State of Nevada), its subsidiary, Vyteris, Inc. (incorporated in the State of Delaware) and the consolidated entity) will continue as a going concern (see discussion below).
Spencer Trask Specialty Group and affiliates (collectively, “STSG”) owns approximately 73.4% of the issued and outstanding common stock of the Company as of December 31, 2010. Due to this majority level of stock ownership, the Company is controlled by STSG and is deemed a “controlled corporation”. STSG may influence the Company to take actions that conflict with the interests of other shareholders.
Intercompany balances and transactions have been eliminated in consolidation.
Business
The Company developed and produced the first FDA-approved electronically controlled transdermal drug delivery system that delivers drugs through the skin comfortably, without needles. This platform technology can potentially be used to administer a wide variety of therapeutics either directly into the skin or into the bloodstream. There are no products being currently sold using this iontophoretic technology. The Company holds U.S. and foreign patents relating to the delivery of drugs across the skin using an electronically controlled “smart patch” device with electric current. The Company is currently seeking collaborative partners for several of its projects.
Merger Agreement
In September 2010 our Board of Directors approved an Agreement and Plan of Merger (the “Merger Agreement”) by and among MediSync BioServices, Inc., a Delaware corporation (“MediSync”), Vyteris and a newly created, wholly owned, subsidiary of the Company (“Merger Sub“), pursuant to which the Merger Sub will be merged with and into MediSync, with MediSync continuing as the surviving corporation and a wholly-owned subsidiary of Vyteris (the “Merger”). As of November 2010, the Company had received requisite shareholder approval to consummate the Merger, subsequently the Merger Agreement expired by its terms in January 2011. A new Merger Agreement has been entered into as of April 1, 2011, with terms substantially similar to the expired agreement. The terms of the Merger Agreement are set forth in Note 16. MediSync is in the business of consolidating preclinical and contract research organizations (“CROs”) and related businesses, including site management organizations (“SMOs”), which sub-contract clinical trial-related responsibilities from a CRO or pharmaceutical/biotechnology company, and post marketing surveillance companies, which monitor pharmaceutical drugs and devices after release into the market. MediSync believes that its future operations may provide added value to the pharmaceutical and biotechnology industries as a valuable outsource service to them. The CRO business model is expected to provide cash flow which can assist in funding operations while the Company continues to develop its drug delivery technologies. It will also provide operational synergies as two business operations are combined in one infrastructure creating efficiencies in administrative functions as well as other areas. There can be no assurance that this transaction will be completed or that the Company will be able to execute the business plan.
After the merger, the Company will have two operating business segments – CRO business and transdermal drug delivery technology.
Liquidity and Going Concern
In February and May 2010, the Company raised $1.8 million through the sale of senior subordinated convertible promissory notes (see Note 7), and in June 2010 the Company raised $1.2 million through the sale of short term subordinated convertible promissory notes (see Note 8). Conversely, the Company owes or third parties claim it owes approximately $6.0 million in liabilities which are due in the 2011 calendar year, as well as the alleged approximate $1.4 million to Ferring. Additionally, subsequent financings will be required to fund the Company’s operations, fund research and development for new products, repay past due payables and pay debt service requirements.
49
VYTERIS, INC.
NOTES TO CONSOLIDATED FINANCIAL STATEMENTS (CONTINUED)
The Company does not currently have sufficient funds to operate its business and this raises substantial doubt as to its ability to continue as a going concern. No assurance can be given that the Company will be successful in procuring the further financing needed to continue the execution of its business plan, which includes the acquisition of target companies for its CRO business and development of new products. The Company engaged two investment bankers in the first quarter of 2011 to assist in raising capital needed to complete its business plan (see Bridge Financing in NOTE 19 - Subsequent Events). Failure to obtain such financing will require management to substantially curtail, if not cease, operations, which will result in a material adverse effect on the financial position and results of operations of the Company. These conditions raise substantial doubt about the Company’s ability to continue as a going concern. The consolidated financial statements do not include any adjustments to reflect the possible future effects on the recoverability and classification of assets or the amounts and classification of liabilities that might occur if the Company is unable to continue in business as a going concern.
|
2.
|
Significant Accounting Policies
|
The Financial Accounting Standards Board (FASB) made the Accounting Standards Codification (ASC) effective for financial statements issued for interim and annual periods ended after September 15, 2009. The ASC combines all previously issued authoritative generally accepted accounting principles (“GAAP”) into one set of guidance codified by subject area. Subsequent revisions to GAAP by the FASB are incorporated into the ASC through issuance of Accounting Standards Updates (ASU).
Cash equivalents
The Company considers all highly liquid instruments with original maturities of three months or less at the date of purchase to be cash equivalents.
Other receivables
Other receivables are non-trade monies owed to the Company which are unsecured and non-interest bearing, and are recorded at net realizable value. The Company establishes an allowance for doubtful accounts based upon factors pertaining to the credit risk of specific customers, historical trends and other information. Delinquent accounts are written-off when it is determined that the amounts are uncollectible.
Fair value of financial instruments
Cash and cash equivalents, other receivables, accounts payable, accrued expenses and other liabilities reported in the consolidated balance sheets equal or approximate their fair value due to their short term to maturity.
Property and equipment, net
Property and equipment, net is stated at cost. Depreciation and amortization of property and equipment is provided on a straight-line basis over the asset’s estimated useful life or related lease term as follows:
|
Manufacturing and laboratory equipment
|
5 years
|
|
Furniture and fixtures
|
5 years
|
|
Office equipment
|
3 years
|
|
Leasehold improvements
|
4 – 10 years
|
|
Software
|
3 years
|
Equipment held under capital leases is recorded at the present value of the minimum lease payments at the inception of the lease and is amortized on the straight-line method over the shorter of the lease term or the estimated useful life of the equipment. Amortization of equipment held under capital leases is included in depreciation and amortization expense in the accompanying consolidated financial statements. Leasehold improvements are amortized over the estimated useful life or over the term of the lease, whichever is shorter. Replacements, maintenance and repairs that do not improve or extend the life of the respective asset are expensed as incurred.
50
VYTERIS, INC.
NOTES TO CONSOLIDATED FINANCIAL STATEMENTS (CONTINUED)
Revenue
Product development revenue: In accordance with ASC 605, the Company recognizes revenues for the reimbursement of development costs when it bears all the risk for selection of and payment to vendors and employees. Costs associated with such activities are included in research and development expenses on the consolidated statements of operations.
Licensing revenue: The Company uses revenue recognition criteria outlined in ASC 605-25 (formerly SAB No. 104, Revenue Recognition in Financial Statements, and Emerging Issues Task Force, EITF, Issue 00-21 Revenue Arrangements with Multiple Deliverables). Accordingly, revenues from licensing agreements are recognized based on the performance requirements of the agreement. Non-refundable up-front fees, where the Company has an ongoing involvement or performance obligation, are generally recorded as deferred revenue in the balance sheet and amortized into license fees in the consolidated statement of operations over the term of the performance obligation.
Stock Based Compensation
The Company accounts for its stock based employee compensation plans under ASC 718 and ASC 505-50. ASC 718-10 and ASC 505-50 address the accounting for shared based payment transactions in which an enterprise receives employee services for equity instruments of the enterprise or liabilities that are based on the fair value of the enterprise's equity instruments or that may be settled by the issuance of such equity instruments. ASC 718-10 and ASC 505-50 require that such transactions be accounted for using a fair value based method.
In considering the fair value of the underlying stock when the Company grants options or restricted stock, the Company considers several factors including the fair values established by market transactions. Stock-based compensation includes significant estimates and judgments of when stock options might be exercised, forfeiture rates and stock price volatility. The timing of option exercises is out of the Company’s control and depends upon a number of factors including the Company’s market value and the financial objectives of the holders of the options. These estimates can have a material impact on the Company’s stock compensation expense but will have no impact on the Company’s cash flows.
The Company accounts for equity awards issued to non-employees in accordance with ASC Topic 505-50 (formerly EITF No. 96-18 “Accounting for Equity Instruments that are Issued to Other Than Employees for Acquiring, or in Conjunction with, Selling Goods or Services.”) ASC 505-50requires the Company to measure the fair value of the equity instrument using the stock prices and other measurement assumptions as of the earlier of either the date at which a performance commitment by the counterparty is reached or the date at which the counterparty's performance is complete.
Income taxes
The Company records deferred tax assets and liabilities based on the differences between the book and tax bases of assets and liabilities and on operating loss carryforwards using enacted tax rates in effect for the year in which the differences are expected to reverse. A valuation allowance is provided when it is more likely than not that some portion or all of a deferred tax asset will not be realized. These amounts are adjusted, as appropriate, to reflect enacted changes in tax rates expected to be in effect when the temporary differences reverse.
The Company follows ASC 740 when accounting for tax contingencies. The guidance prescribes a comprehensive model for how companies should recognize, measure, present, and disclose in their financial statements uncertain tax positions taken or expected to be taken on a tax return. Under GAAP, tax benefits are initially recognized in the consolidated financial statements when it is more likely than not the position will be sustained upon examination by the tax authorities. Such tax positions must initially and subsequently be measured as the largest amount of tax benefit that is greater than 50 percent likely of being realized upon ultimate settlement with the tax authority assuming full knowledge of the position and relevant facts.
Research and Development
Research and development costs are charged to expense as incurred.
51
VYTERIS, INC.
NOTES TO CONSOLIDATED FINANCIAL STATEMENTS (CONTINUED)
Use of Estimates
The Company’s consolidated financial statements have been prepared in accordance with accounting principles generally accepted in the United States of America, which require management to make estimates and assumptions. These estimates and assumptions affect the reported amounts of assets and liabilities and disclosure of contingent assets and liabilities at the date of the consolidated financial statements and the revenues and expenses reported during the period. These estimates and assumptions are based on management’s judgment and available information and, consequently, actual results could differ from these estimates.
Net loss per share
The Company computes net loss per share in accordance with ASC 26-10. Under the provisions of ASC 26-10, basic net loss per common share, or basic EPS, is computed by dividing net loss by the weighted-average number of common shares outstanding. Diluted net loss per common share, or diluted EPS, is computed by dividing net loss by the weighted average number of shares and net of dilutive common share equivalents then outstanding. Common equivalent shares consist of the incremental common shares issuable upon the exercise of stock options and warrants and the conversion of preferred stock and debentures. For all years presented on the consolidated statement of operations, diluted EPS is identical to basic EPS since common equivalent shares are excluded from the calculation, as their effect is anti-dilutive due to net losses for the years ended December 31, 2010, 2009, and 2008. For the years ended December 31, 2010, 2009 and 2008, respectively, common stock equivalents of 59,987,208, 13,580,978 and 7,353,348 were excluded from the net loss per common share calculation because the effect of their inclusion would be anti-dilutive (see Note 17).
Long-lived assets
The Company reviews long-lived assets, including fixed assets, for impairment whenever events or changes in business circumstances indicate that the carrying amount of the assets may not be fully recoverable. An impairment loss would be recognized when the estimated undiscounted future cash flows expected to result from the use of the asset and its eventual disposition is less than its carrying amount. Impairment, if any, is assessed using discounted cash flows.
Concentrations of credit risk
Financial instruments that potentially subject the Company to significant concentrations of credit risk consist principally of cash and cash equivalents and receivables. The Company deposits its cash and cash equivalents with major financial institutions. Management believes that credit risk related to these deposits is minimal. Concentrations of credit risk are substantially mitigated by the Company’s credit evaluation process. The Company analyzes the customer’s credit worthiness and current economic trends when evaluating a customer’s credit risk.
Risk and uncertainties
The Company is embarking on a new business plan resulting from the impending MediSync merger. The Company has no experience in consolidating businesses or in the contract research organization space. The Company may be unable to successfully combine the businesses or obtain the necessary experience to compete effectively in the contract research organization industry. The Company currently has no partnering arrangements with its transdermal technologies which are generating material revenues.
No assurance can be given that the Company will be successful in procuring the further financing and collaborative partners needed to continue the execution of its business plan, which includes the acquisition of target companies for its CRO business and development of new products. The CRO business model is expected to provide cash flow which can assist in funding operations for the Company while it continues to develop our drug delivery technologies, of which operations were reduced due to our lack of funding and other factors. Failure to obtain such financing will require management to substantially curtail, if not cease, operations, which will result in a material adverse effect on the financial position and results of operations of the Company.
52
VYTERIS, INC.
NOTES TO CONSOLIDATED FINANCIAL STATEMENTS (CONTINUED)
Debt instruments, offering costs and the associated features and instruments contained therein
Deferred issuance costs are amortized over the term of their associated debt instruments.
The Company evaluates the terms of the debt instruments to determine if any embedded derivatives or beneficial conversion features exist. The Company allocated the aggregate proceeds of the debt instrument between the warrants and the debt based on their relative fair values as codified in ASC 470. The fair value of the warrants issued to debt holders or placement agents are calculated utilizing the Black-Scholes-Merton or probability weighted binomial method depending on the terms of the warrant agreements. The Company amortizes the resultant discount or other features over the terms of the debt through its earliest maturity date using the effective interest method. Under this method, the interest expense recognized each period will increase significantly as the instrument approaches its maturity date. If the maturity of the debt is accelerated because of defaults or conversions, then the amortization is accelerated.
Fair Value Measurements
The Company measures fair value in accordance with Statement ASC 820, Fair Value Measurements (“ASC 820”). ASC 820 defines fair value, establishes a framework and gives guidance regarding the methods used for measuring fair value, and expands disclosures about fair value measurements. ASC 820 clarifies that fair value is an exit price, representing the amount that would be received to sell an asset or paid to transfer a liability in an orderly transaction between market participants. As such, fair value is a market-based measurement that should be determined based on assumptions that market participants would use in pricing an asset or liability. As a basis for considering such assumptions, there exists a three-tier fair value hierarchy, which prioritizes the inputs used in measuring fair value as follows:
• Level 1 - unadjusted quoted prices in active markets for identical assets or liabilities that the Company has the ability to access as of the measurement date.
• Level 2 - inputs other than quoted prices included within Level 1 that are directly observable for the asset or liability or indirectly observable through corroboration with observable market data.
• Level 3 - unobservable inputs for the asset or liability only used when there is little, if any, market activity for the asset or liability at the measurement date.
This hierarchy requires the Company to use observable market data, when available, and to minimize the use of unobservable inputs when determining fair value
Derivative Financial Instruments
Derivatives are recognized at fair value as required by ASC 815 “Derivatives and Hedging” (“ASC 815”). ASC 815 affects the accounting for warrants and many convertible instruments with provisions that protect holders from a decline in the stock price (or “down-round” provisions). For example, warrants with such provisions will no longer be recorded in equity. Down-round provisions reduce the exercise price of a warrant or convertible instrument if a company either issues equity shares for a price that is lower than the exercise price of those instruments or issues new warrants or convertible instruments that have a lower exercise price. The Company evaluated whether its warrants contain provisions that protect holders from declines in its stock price or otherwise could result in modification of either the exercise price or the shares to be issued under the respective warrant agreements. The Company determined that a portion of its outstanding warrants contained such provisions thereby concluding they were not indexed to the Company’s own stock.
At December 31, 2010, the Company has recorded the fair value (Level 3) of the derivative liabilities of $9.8 million, which consists of two components (see Note 18):
• the fair value of the warrant liability amounted to $6.5 million based on a binomial pricing model of weighted average probabilities of potential down-round scenarios for our securities using similar assumptions as noted in Note 14 of the Company’s consolidated financial statements for the year ended December 31, 2010 for the valuation of stock options, except that the value of the underlying common stock has been reduced by 20% to reflect a “lack of marketability” discount arising since the underlying shares issuable upon exercise of the warrant are restricted from resale under Section 5 of the Securities Act of 1933 and subject to legend removal under Rule 144 promulgated under the Securities Act of 1933; and
53
VYTERIS, INC.
NOTES TO CONSOLIDATED FINANCIAL STATEMENTS (CONTINUED)
• the fair value of the convertible debt conversion feature amounted to $3.3 million utilizing a level 3 market value based on pricing methodologies used to determine conversion features, which includes determining the fair value of the Company’s stock as of December 31, 2010. Since the shares underlying the convertible debt may be subject to legend removal under Rule 144 by “tacking back” to the date of the original note issuance, it is not appropriate to apply a “lack of marketability” discount to the quoted stock price at the end of the measurement period.
Recently issued accounting standards
In January 2010, the FASB issued guidance to amend the disclosure requirements related to recurring and nonrecurring fair value measurements. The guidance requires new disclosures on the transfers of assets and liabilities between Level 1 (quoted prices in active market for identical assets or liabilities) and Level 2 (significant other observable inputs) of the fair value measurement hierarchy, including the reasons and the timing of the transfers. Additionally, the guidance requires a roll forward of activities on purchases, sales, issuance, and settlements of the assets and liabilities measured using significant unobservable inputs (Level 3 fair value measurements). The guidance became effective for us with the reporting period beginning January 1, 2010, except for the disclosure on the roll forward activities for Level 3 fair value measurements, which will become effective for us with the reporting period beginning January 1, 2011. Other than requiring additional disclosures, adoption of this new guidance did not have a material impact on the Company’s consolidated financial statements.
In February 2010, the FASB issued ASU 2010-09 “Subsequent Event (Topic 855) Amendments to Certain Recognition and Disclosure Requirements”. ASU 2010-09 removes the requirement for an SEC filer to disclose a date in both issued and revised financial statements. Revised financial statements include financial statements revised as a result of either correction of an error or retrospective application of generally accepted accounting principles. All of the amendments in ASU 2010-09 are effective upon issuance of the final ASU, except for the use of the issued date for conduit debt obligors, which is effective for interim or annual periods ending after June 15, 2010. The Company adopted ASU 2010-09 in February 2010 and therefore omitted the disclosure previously required as referenced above.
In April 2010, the FASB issued ASU No. 2010-17, Revenue Recognition — Milestone Method. This ASU provides guidance on the criteria that should be met for determining whether the milestone method of revenue recognition is appropriate. Under the milestone method of revenue recognition, consideration that is contingent upon achievement of a milestone in its entirety can be recognized as revenue in the period in which the milestone is achieved only if the milestone meets all criteria to be considered substantive. This standard provides the criteria to be met for a milestone to be considered substantive which includes that: a) performance consideration earned by achieving the milestone be commensurate with either performance to achieve the milestone or the enhancement of the value of the item delivered as a result of a specific outcome resulting from performance to achieve the milestone; and b) it relates to past performance and be reasonable relative to all deliverables and payment terms in the arrangement. This standard is effective on a prospective basis for milestones achieved in fiscal years beginning on or after June 15, 2010. Although we are still evaluating the impact of this standard, we do not expect its adoption to have a material impact on our financial position or the results of our operations.
54
VYTERIS, INC.
NOTES TO CONSOLIDATED FINANCIAL STATEMENTS (CONTINUED)
|
3.
|
Property and Equipment, net
|
Property and equipment, net, consist of the following:
|
December 31,
|
||||||||
|
2010
|
2009
|
|||||||
|
Manufacturing and laboratory equipment
|
$ | 1,875,930 | $ | 1,875,930 | ||||
|
Furniture and fixtures........
|
156,543 | 156,543 | ||||||
|
Office equipment
|
334,065 | 345,424 | ||||||
|
Leasehold improvements
|
367,818 | 367,818 | ||||||
|
Software
|
205,210 | 205,210 | ||||||
|
Property and equipment
|
2,939,566 | 2,950,925 | ||||||
|
Less: Accumulated depreciation and amortization
|
(2,914,069 | ) | (2,836,901 | ) | ||||
|
Property and equipment, net
|
$ | 25,497 | $ | 114,024 | ||||
Depreciation and amortization expense, included in costs and expenses in the accompanying consolidated statements of operations, was approximately $0.1 million, $0.2 million and $0.3 million for each of the years ended December 31, 2010, 2009 and 2008, respectively.
In March 2008, the Company recorded an impairment charge of approximately $0.1 million on furniture and fixtures due to the consolidation of office space (see Note 13), which is included in facilities realignment and impairment of fixed assets expense in the consolidated statement of operations for the year ended December 31, 2008.
4. Accrued Expenses, Deferred Revenue, and Other
Accrued expenses, deferred revenue and other consist of the following:
|
December 31,
|
||||||||
|
2010
|
2009
|
|||||||
|
Compensation, accrued bonuses and benefits payable
|
$ | 439,745 | $ | 413,743 | ||||
|
Continuous motion patch machine costs and delivery
|
169,619 | 183,452 | ||||||
|
Reimbursement of development costs to Ferring (1)
|
1,354,566 | 1,386,919 | ||||||
|
Accrued insurance costs
|
103,518 | 101,224 | ||||||
|
Accounting, legal and consulting fees
|
671,124 | 334,095 | ||||||
|
Outside services
|
330,027 | 371,243 | ||||||
|
Food and drug administration fees
|
279,013 | 193,521 | ||||||
|
Deferred revenue and other
|
284,696 | 150,816 | ||||||
|
Accrued expenses, deferred revenue and other
|
$ | 3,632,308 | $ | 3,135,013 | ||||
(1) Represents liability for advances in 2009 of research and development costs under the License and Development Agreement with Ferring (see Note 9).
5. Accrued Registration Rights Penalty
In connection with the delayed filing of a registration statement for securities sold pursuant to a $15.1 million private placement in 2004, the Company incurred approximately $1.4 million of liquidated damages in 2005. In addition, the Company was obligated to pay interest at a rate of 18% per annum, accruing daily, for any liquidated damages not paid in full within 7 days of the date payable. Interest expense, included in registration rights penalty in the accompanying consolidated statements of operations, was $0.2 million and $0.3 million for each the years ended December 31, 2009 and 2008, respectively.
On October 30, 2009, the Company entered into an Amendment and Waiver (“Amendment”) to the Registration Rights Agreement dated September 29, 2004 among the Company, Spencer Trask Ventures, Inc., a related party, Rodman & Renshaw, LLC, and various shareholders. The October 30, 2009Amendment required the Company to compensate investors for registration rights penalties incurred of approximately $2.6 million, in lieu of all liquidated damages, and related interest, related to the delayed filing of a registration statement for securities sold pursuant to a $15.1 million private placement in 2004. The Company issued 1,250,000 restricted shares of its common stock vested immediately with a fair value of $0.8 million and warrants for the purchase of up to 1,250,000 restricted shares of its common stock at an exercise price of $0.75 per share with an expiration date of October 30, 2012 in order to settle the accrued liquidated damages. The fair value of warrants issued to purchase the Company’s common stock was estimated to be $0.4 million using the Black-Scholes-Merton pricing model. The Company recorded a non-cash gain on settlement of registration rights penalty of $1.4 million in the consolidated statement of operations for the year ended December 31, 2009.
55
VYTERIS, INC.
NOTES TO CONSOLIDATED FINANCIAL STATEMENTS (CONTINUED)
See rollforward of fair value of derivative instruments table in Note 18 Warrants and Derivative Instruments.
6. Related Party Indebtedness
Restructuring Agreement with STSG
On December 24, 2009, the Company entered into an agreement to Restructure (“Restructuring Transaction”) of all the liability and equity instruments issued to STSG. The principal amount of all indebtedness and accrued and unpaid interest thereon and stated value of the Series B Preferred Stock owed by the Company to STSG in excess of $2.0 million ($2.0 million amount is defined as the “Remaining Debt”) which includes the January 2006 Promissory Note, the 2006 Promissory Notes, and $0.9 million of Working Capital Facility were satisfied in full on December 24, 2009. STSG converted $20.3 million of indebtedness and accrued and unpaid interest and all issued and outstanding shares of Series B Preferred Stock into 50,777,015 shares of the Company’s common stock at a conversion price of $0.40 per share.
In connection with the December 24, 2009 restructuring agreement with STSG, the Company performed a valuation of the conversion of approximately $20.3 million owed to STSG (the January 2006 Promissory Notes, the 2006 Promissory Notes and the Series B Preferred Stock, including accrued and unpaid interest and dividends), into its common stock, pursuant to rules governing accounting for induced conversions of debt. The Company determined that as a result of a change in the conversion price from $22.50 per share to $0.40 per share, STSG received an incentive to induce conversion of these instruments into the Company’s common stock. Accordingly, the Company recorded a non-cash charge of approximately $35.9 million related to the fair value (based on quoted market prices at the date of the agreement) of the incremental shares received by STSG as a result of the restructuring in its consolidated statement of operations for the year ended December 31, 2009.
Promissory Note Due to a Related Party
In December 2009, the Company issued to STSG a promissory note (“2009 Promissory Note”) with a principal amount of approximately $2.0 million, with interest accruing at the rate of 6% per year and a maturity date of February 2, 2013. The 2009 Promissory Note is secured by a lien on the Company’s assets, subordinate to the lien of any existing creditors that have a lien senior to that of STSG and to any liens resulting from a prospective equity or debt financing within certain parameters set forth (“Qualified Financing”).
On December 28, 2009, the Company paid STSG $0.2 million to reduce the principal amount of the 2009 Promissory Note to $1.8 million. The balance of the principal amount of the 2009 Promissory Note and all accrued and unpaid interest thereon is to be repaid upon consummation of certain Qualified Financing. This is still outstanding at December 31, 2010.
7. Senior Subordinated Convertible Promissory Notes, Net of Discount
In February 2010 and May 2010, the Company sold to accredited investors (“Investors”) in a private placement $1.8 million principal amount of Senior Subordinated Convertible Promissory Notes due 2013 (the “2010 Notes”). These notes bear no interest and are convertible into the Company’s common stock at the option of the Investors at any time. The initial conversion price was $0.20, and automatically reduces by 1.5% after each 90 day period that they are outstanding, and additionally, the conversion price resets in the event of a subsequent issuance of stock at a lower price than the then effective conversion price. In addition, the 2010 Notes automatically convert into the Company’s common stock, if the closing bid price of the Company’s common stock equals or exceeds 300% of the conversion price for a period of twenty consecutive trading days. The warrants contain a cashless exercise provision and “full ratchet” anti-dilution provisions. In conjunction therewith, the Company provided customary “piggyback” registration rights for a 24-month period to the Investors with respect to the shares of common stock underlying the 2010 Notes and related warrants.
56
VYTERIS, INC.
NOTES TO CONSOLIDATED FINANCIAL STATEMENTS (CONTINUED)
The principal amounts of 2010 Notes sold and the number of warrants issued in conjunction therewith and the exercise price thereof for the year ended December 31, 2010 are set forth below:
|
Offering
Date
|
Original
Note Amount
|
Less
Converted
Amount
|
Note Amount
as of December
31, 2010
|
Interest
Rate
|
Note
Conversion
Price (1)
|
Warrants
Issued to
Investors
|
Initial
Exercise
Price per
Share
|
|||||||||||||||||||||
|
February 2010
|
$ | 1,060,000 | $ | 25,000 | $ | 1,035,000 | 0.00 | % | $ | 0.191 | 5,300,000 | $ | 0.20 | |||||||||||||||
|
May 2010
|
725,000 | - | 725,000 | 0.00 | % | $ | 0.194 | 3,625,000 | $ | 0.25 | ||||||||||||||||||
| $ | 1,785,000 | $ | 25,000 | $ | 1,760,000 | 8,925,000 | ||||||||||||||||||||||
|
|
(1)
|
Initial note conversion price was $0.20 and the rate decreases 1.5% every 90 days.
|
The Company received net proceeds of $0.8 million and $0.6 million from the 2010 Notes, after payment of commissions and expense allowances to Spencer Trask Ventures, Inc. (“STVI”), a related party to STSG, a principal stockholder of the Company, to other finders and other offering related costs. STVI and other finders also received in the aggregate warrants to purchase 3,570,000 shares of the Company’s common stock bearing substantially the same terms as the Investor warrants. The Company incurred total debt issuance costs of $2.1 million, representing the fair value of warrants issued to finders of $1.8 million at issuance and other costs totaling $0.3 million. Such costs have been classified as deferred costs in accordance with accounting for debt issue costs (ASC 835) and are being amortized over the life of the corresponding debt, using the effective interest method.
The following is a summary of Debt issuance costs for the February 2010 and May 2010 financings:
|
Offering Date
|
Value of Finder
Warrants Issued
|
Cash
Commission
|
Total Debt
Issuance Costs
|
2010
Amortization of
Debt Issuance
Costs
|
Net Debt
Issuance Costs
at December
31, 2010
|
|||||||||||||||
|
February 2010
|
$ | 1,181,476 | $ | 180,917 | $ | 1,362,393 | $ | 66,641 | $ | 1,295,752 | ||||||||||
|
May 2010
|
605,593 | 104,850 | 710,443 | 16,920 | 693,523 | |||||||||||||||
| $ | 1,787,069 | $ | 285,767 | $ | 2,072,836 | $ | 83,561 | $ | 1,989,275 | |||||||||||
Upon consummation of the sale of the 2010 Notes, the Company determined the fair value of the aforementioned instruments and recorded debt discount in accordance with accounting for convertible instruments issued with detachable warrants (ASC 470). The following is a summary of the debt discount for the February 2010 and May 2010 financings recorded on the consolidated balance sheet as of December 31, 2010:
|
Offering Date
|
Face
Amount
|
Less: Notes Debt
Discount
|
Plus: Current Year
Amortization of Note
Debt Discount
|
Carrying Value
|
||||||||||||
|
February 2010
|
$ | 1,035,000 | $ | 1,035,000 | $ | 31,247 | $ | 31,247 | ||||||||
|
May 2010
|
725,000 | 725,000 | 17,046 | 17,046 | ||||||||||||
| $ | 1,760,000 | $ | 1,760,000 | $ | 48,293 | $ | 48,293 | |||||||||
57
VYTERIS, INC.
NOTES TO CONSOLIDATED FINANCIAL STATEMENTS (CONTINUED)
In addition, the Company determined the aforementioned instruments also contain features that require derivative liability accounting treatment. At December 31, 2010, the Company remeasured the fair value of these derivative liabilities and determined the fair value of the warrant liability. See Note 2 for description of the Company’s accounting policies on valuing such instruments. As a result of this remeasurement, the Company recognized the following expense on these derivative financial instruments for the year ended December 31, 2010 on the consolidated statement of operations:
|
Beneficial Conversion Feature
|
Warrants With Anti-Dilution Clause
|
||||||||||||||||||||||||
|
Offering Date
|
Fair
Value of
Derivative
at
Issuance
|
Fair
Value of
Derivative
as of December
31, 2010
|
Gain
(Loss) on
Fair
Valuation of Derivative
as of
December
31, 2010
|
Fair Value
at
Issuance
|
Fair Value
as of
December
31, 2010
|
Gain
(Loss) on
Fair
Valuation
as of
December
31, 2010
|
|||||||||||||||||||
|
February-2010
|
(a)
|
$ | 254,942 | $ | 1,944,776 | $ | 1,689,834 | $ | 780,058 | $ | 1,221,138 | $ | 441,080 | ||||||||||||
|
May-2010
|
237,083 | 1,364,241 | 1,127,158 | 487,917 | 864,745 | 376,828 | |||||||||||||||||||
|
Finders Warrants
|
|||||||||||||||||||||||||
|
February-2010
|
- | - | - | 1,153,611 | 488,455 | (665,156 | ) | ||||||||||||||||||
|
May-2010
|
- | - | - | 605,593 | 342,644 | (262,949 | ) | ||||||||||||||||||
| $ | 492,025 | $ | 3,309,017 | $ | 2,816,992 | $ | 3,027,179 | $ | 2,916,982 | $ | (110,197 | ) | |||||||||||||
(a) Original amount was $279,942, subsequently converted $25,000 (see Note 18).
See rollforward of fair value of derivative instruments table in Note 18 Warrants and Derivative Instruments.
|
8.
|
June 2010 Subordinated Convertible Promissory Notes and Conversion into Common Stock
|
On June 30, 2010, the Company consummated a private placement to accredited investors (“June Investors”) of $1.2 million principal amount of Subordinated Convertible Promissory Notes due September 30, 2010 (the “June 2010 Notes”). The sale of the June 2010 Notes also included issuance to June Investors of five-year warrants to purchase an aggregate of 2,300,000 shares of the Company’s common stock with an exercise price of $0.25 per share. The warrants contain a cashless exercise provision and “full ratchet” anti-dilution provisions. STVI acted as finder in connection with the private placement. At date of issuance, the fair value of the warrants was approximately $0.8 million. The June 2010 Notes bore interest at the rate of 6% per annum. In connection with the closing, the Company received net proceeds of $1.2 million, as the payment of cash finder fees were deferred until the next offering of equity instruments by the Company. The Company incurred debt issuance costs with STVI, in its capacity as a finder for this transaction, in the amount of $0.3 million, which is included in deferred offering cost on the consolidated balance sheets. Such costs represent the fair value of the initial 460,000 warrants issued to STVI of $0.2 million and accrued finders fees of approximately $0.1 million, representing cash commission of up to 10% and a 3% expense allowance and warrants. The Company issued additional warrants to investors and STVI, based on the conversion on September 30, 2010. The Company determined that the warrants contain features which require liability accounting treatment.
On September 30, 2010, the June Investors elected to convert the principal amount of the June 2010 Notes, and $17,392 of accrued and previously unpaid interest, into the Company’s common stock. For each $0.20 of principal and interest converted, the June Investors received both a share of the Company’s common stock and a warrant to purchase one share of common stock at an exercise price of $0.25 per share with a term of five years. Based on the conversion of the June 2010 Notes, the company issued additional warrants to STVI for conversion consideration. The conversion consideration to STVI consists of 1,150,000 warrants to purchase shares of common stock at an exercise price of $0.20 per share and 1,150,000 warrants to purchase shares of common stock at an exercise price of $0.25 per share, with all 2,300,000 warrants expiring in 5 years.
58
VYTERIS, INC.
NOTES TO CONSOLIDATED FINANCIAL STATEMENTS (CONTINUED)
In the aggregate, the Company issued 5,836,250 shares of its common stock to investors, 8,136,250 warrants to investors to purchase its common stock, and 2,300,000 warrants to STVI to purchase its common stock, in connection with the conversion of the June 2010 Notes. The fair value of the warrants upon conversion was approximately $2.6 million. Upon conversion of the June 2010 Notes, the Company recorded $0.3 million in interest expense on the consolidated statement of operations from the write-off of the remaining deferred offering costs. The fair value of the 10,096,250 warrants (which include 460,000 warrants issued to finders from initial June Note offering date) was $2.7 million, as of December 31, 2010. As a result, the Company recognized a loss on derivative financial instruments of $0.8 million for the year ended December 31, 2010 (using the weighted average probabilities of potential down-round scenarios and other assumptions utilizing a unmodified binomial model), on the consolidated statement of operations. This private placement to accredited investors is exempt from registration under the Securities Act of 1933, as amended, pursuant to Section 4(2) thereof and Regulation D, promulgated thereunder.
See rollforward of fair value of derivative instruments table in Note 18 Warrants and Derivative Instruments.
|
9.
|
Agreements with Ferring
|
The Company entered into a license and development agreement with Ferring in 2004 for the development of an infertility application for its iontophoretic technology. This agreement provided for a 50%/50% cost share arrangement between the Company and Ferring for certain development costs associated with the project. The outside development cost of the product licensing and development agreements with Ferring was approximately $0.2 million and $1.1 million, for the years ended December 31, 2009 and 2008, respectively, and is included in research and development expense in the accompanying consolidated statements of operations.
Transaction Agreement with Ferring March 2009
In March 2009, the Company entered into a transaction with Ferring whereby Ferring agreed to fund the first half of the 2009 development budget up to $3.3 million, in exchange for which the Company granted Ferring a senior security interest in its assets. Ferring also agreed to buy the Company’s PMK 150 machine for $1.0 million, of which $0.5 million was paid at closing (half to satisfy outstanding senior secured convertible debentures due to Ferring) and $0.3 million was paid on May 14, 2009 (part to satisfy accrued and unpaid interest on loans from Ferring) and which has been leased back to the Company at a rental amount of $1,000 per month. The Company accounts for the lease of the PMK 150 machine as an operating lease and is amortizing the deferred gain on the sale of the machine, which recorded as deferred revenue on the consolidated balance sheet, over the 10 year lease.
Termination of the Ferring Agreement
On December 21, 2009, the Company received notice from Ferring of its termination of the License and Development Agreement, dated September 27, 2004, by and between the Company and Ferring (“Agreement”) under Section 9.04 of the Agreement, effective January 21, 2010. Pursuant to the Agreement, upon a termination by Ferring under Section 9.04 after December 31, 2004, the following disposition of intellectual property associated with the Agreement shall occur under Section 9.05 of the Agreement:
a) all licenses and other rights granted to the Company shall, subject to the continued payment to Ferring of certain royalty payments under the Agreement, be converted to and continue as exclusive, worldwide irrevocable, perpetual, sub-licensable licenses to develop, make, have made, use, sell, offer to sell, lease, distribute, import and export the Product;
b) all licenses and other rights granted to Ferring under the Agreement shall be terminated as of the effective date of the termination;
c) Ferring shall grant to the Company an irrevocable, perpetual, exclusive, royalty-free, sub-licensable license to practice certain intellectual property jointly developed under the Agreement with respect to the iontophoretic administration of infertility hormone;
59
VYTERIS, INC.
NOTES TO CONSOLIDATED FINANCIAL STATEMENTS (CONTINUED)
d) Ferring shall cease to use and shall assign to the Company all of its rights, title and interest in and to all clinical, technical and other relevant reports, records, data, information and materials relating exclusively to the Product and all regulatory filings (including any NDA, 510(k) or similar regulatory filing) relating exclusively to the Product and provide the Company one copy of each physical embodiment of the aforementioned items within thirty (30) days after such termination;
e) Ferring shall cease to use any Know-How, Information or Materials arising under this Agreement to the extent such Know-How, Information or Materials is owned by Ferring and shall promptly return to the Company all such materials; and
f) Ferring is required to return to the Company all information knowhow and other materials and records in their possession or control relating exclusively to the Product (as such term is defined in the Agreement).
In July 2010, the Company filed a complaint against Ferring entitled “Vyteris, Inc. v. Ferring Pharmaceuticals, Inc.” (the “Lawsuit”) in the Superior Court of New Jersey, Chancery Division – Essex County to resolve outstanding issues with respect to this termination. Ferring filed a motion to compel arbitration in the case which was granted, and the parties are now embarking on arbitration. As of December 31, 2010 and 2009, the Company recorded $1.4 million in accrued expenses and other in the consolidated balance sheet for the estimated amounts due to Ferring. (See Note 13)
|
10.
|
Private Placements of Common Stock and Warrants
|
On October 30, 2009, the Company issued 3,000,000 shares of its common stock and 3,000,000 warrants to purchase its common stock to an investor for a purchase price of $0.6 million in a transaction exempt from registration under Section 4(2) of the Securities Act of 1933. The warrants are exercisable into shares of the Company’s common stock at an exercise price of $0.20 per share, and bear a term of five years from the date of closing. The warrants contain a cashless exercise provision and contain “full ratchet” anti-dilution provisions. The Company paid the following fees to finders in conjunction therewith: cash in the amount of $0.1 million and issuance of a total of 1,200,000 warrants. All warrants issued contain terms identical to the terms of the warrants issued to the investors.
The Company determined that the warrants contain features which require liability accounting treatment. In accordance with ASC Topic 815-10, the Company recorded a warrant liability of $2.3 million at date of issuance, in the consolidated balance sheets as derivative financial instruments, for the fair value of the warrants issued to the investors and finders. Management estimated the fair value of the 3,200,000 warrants issued, using the Black-Scholes-Merton option-pricing model with the weighted average assumptions. (See Note 2 - Debt instruments, issuance costs and the associated features and instruments contained therein). At December 31, 2010, the warrants had a fair value of approximately $1.0 million.
See rollforward of fair value of derivative instruments table in Note 18 Warrants and Derivative Instruments.
|
11.
|
Related Party Transactions
|
In addition to the indebtedness described in Notes 6, 7 and 8 and the private placements of common stock and the warrants described in Note 10 and the MediSync transaction described in Note 16, the Company had the following related party transactions:
|
|
·
|
At December 31, 2010 and 2009, approximately $0.2 million is included in interest payable and accrued expenses due to related party in the accompanying consolidated balance sheets for amounts owed to STSG.
|
|
|
·
|
On April 26, 2005, the Company announced the appointment of Russell O. Potts, Ph.D. to its Board of Directors. Dr. Potts has served the Company as a consultant in drug delivery, glucose monitoring and medical devices since April 2003. The Company paid Dr. Potts approximately $9,000, $5,000, and $21,000 for consulting services for the years ended December 31, 2010, 2009 and 2008, respectively.
|
60
VYTERIS, INC.
NOTES TO CONSOLIDATED FINANCIAL STATEMENTS (CONTINUED)
|
12.
|
Income Taxes
|
The Company has available for federal and New Jersey income tax purposes net operating loss carryforwards (“NOLs”), subject to review by the authorities, aggregating approximately $112.3 million and $107.8 million, respectively. NOLs for federal purposes expire from 2022 to 2029 and New Jersey from 2011 to 2016. The difference between the deficit accumulated for financial reporting purposes and the net operating loss carryforwards for income tax purposes is primarily due to differences in accounting and tax bases of certain assets resulting from the Transaction Agreement.
Utilization of net operating loss carryforwards and credits may be subject to a substantial annual limitation due to the ownership limitations provided by the Internal Revenue Code of 1986, as amended and similar state provisions. The Company has not performed a detailed analysis to determine whether an ownership change under Section 382 of the Internal Revenue Code occurred as a result of the Merger, or the Restructuring Transaction, as the ultimate realization of such net operating losses is uncertain. The effect of the ownership change could create an imposition of an annual limitation on the use of net operating loss carryforwards attributable to periods before the change.
Except as described below, the Company has not recorded a provision for, or benefit from, income taxes in the accompanying consolidated financial statements due to recurring losses and the uncertainty of the future realization of its deferred tax assets. Accordingly, the Company has provided a full valuation allowance against its deferred tax assets. The valuation allowance for the years ended December 31, 2010 and 2009 increased by approximately $5.8 million and decreased by approximately $9.6 million, respectively.
Significant components of the Company’s deferred tax assets at December 31, 2010 and 2009 are as follows:
|
December 31,
|
||||||||
|
|
2010
|
2009
|
||||||
|
Deferred tax assets:
|
||||||||
|
Net operating tax loss carryforwards
|
$ | 42,374,000 | $ | 38,781,000 | ||||
|
Research and development tax credits
|
2,083,000 | 2,113,000 | ||||||
|
Amortization of loan discount and accrued interest, related party
|
194,000 | - | ||||||
|
Stock warrants - beneficial warrant conversion and revaluation
|
1,063,000 | - | ||||||
|
Fixed asset depreciation
|
736,000 | 758,000 | ||||||
|
Inventory reserves
|
453,000 | 453,000 | ||||||
|
Deferred offering costs
|
149,000 | - | ||||||
|
Stock based compensation
|
3,394,000 | 2,474,000 | ||||||
|
Registration rights penalties
|
- | 86,000 | ||||||
|
Non-cash warrants – consultants
|
6,762,000 | 6,762,000 | ||||||
|
Revenue deferral
|
541,000 | 554,000 | ||||||
|
Issuance of warrants to advisors
|
217,000 | 217,000 | ||||||
|
Issuance of warrants on settlement of registration rights penalty
|
168,000 | 168,000 | ||||||
|
Other
|
271,800 | 255,000 | ||||||
|
Total deferred tax asset
|
$ | 58,405,800 | $ | 52,621,000 | ||||
|
Less valuation allowance
|
(58,405,800 | ) | (52,621,000 | ) | ||||
|
Net deferred tax asset
|
$ | — | $ | — | ||||
In July 2006, the FASB, issued FASB Interpretation No. 48, “Accounting for Uncertainty in Income Taxes, an Interpretation of FASB Statement No. 109,” (“FIN 48”). FIN 48 is an interpretation of FASB Statement No. 109, “Accounting for Income Taxes”. FIN 48 seeks to reduce the diversity in practice associated with certain aspects of measurement and recognition in accounting for income taxes. In addition, FIN 48 provides guidance on de-recognition, classification, interest and penalties, and accounting in interim periods and requires expanded disclosure with respect to any uncertainty in income taxes. The Company adopted the provisions of FIN 48 as of January 1, 2007. The Company believes that its income tax filing positions and deductions will be sustained on audit and does not anticipate any adjustments that will result in a material change to its financial position. As a result, no reserves or liabilities for uncertain income tax positions, interest or penalties have been recorded pursuant to FIN 48. As of December 31, 2010 and December 31, 2009, there were no unrecognized tax benefits that, if recognized, would affect the Company’s effective tax rate in any future periods. In addition, the Company did not record a cumulative effect adjustment related to the adoption of FIN 48. Tax returns for years beginning after December 31, 2003 remain subject to examination by major tax jurisdictions as of December 31, 2009.
61
VYTERIS, INC.
NOTES TO CONSOLIDATED FINANCIAL STATEMENTS (CONTINUED)
In 2010, 2009, and 2008 the Company sold approximately $3.4 million, $5.4 million and $0.8 million, respectively, of its State Net Operating Loss carryforwards under the State of New Jersey’s Technology Business Tax Certificate Transfer Program (the “Program”). The Program allows qualified technology and biotechnology businesses in New Jersey to sell unused amounts of net operating loss carryforwards and defined research and development tax credits for cash. The proceeds from the sale in 2010, 2009, and 2008, net of commissions, were $0.4 million, $2.1 million and $0.1 million, respectively, and such amounts were recorded as a tax benefit in the accompanying consolidated statements of operations. The State of New Jersey renews the Program annually and currently limits the aggregate proceeds to $60 million. The Company cannot be certain if it will be able to sell any of its remaining or future New Jersey loss carryforwards or tax credits under the Program. The Company generated net proceeds of $0.4 million and $2.1 million in 2010 and 2009 as a result of the sale of the tax credits, which has been recognized as received as an income tax benefit in the consolidated statements of operations.
A reconciliation of the statutory tax rates for the years ended December 31, 2010, 2009 and 2008 is as follows:
|
December 31,
|
||||||||||||
|
2010
|
2009
|
2008
|
||||||||||
|
Statutory rate
|
(34)% | (34)% | (34)% | |||||||||
|
State income tax – sale of net operating losses
|
(4)% | (6)% | (1)% | |||||||||
|
Research and development credits
|
(0)% | (0)% | (2)% | |||||||||
|
Change in valuation allowance and other items
|
35% | 35% | 36% | |||||||||
|
Benefit for income tax
|
(3)% | (5)% | (1)% | |||||||||
|
13.
|
Commitments and Contingencies
|
Legal
From time to time, the Company is involved in other lawsuits, claims, investigations and proceedings, including pending opposition proceedings involving patents that arise in the ordinary course of business. As of December 31, 2010, there were no matters pending that the Company expects to have a material adverse impact on the Company’s business, results of operations, financial condition or cash flows except for several accounts payable collection claims and litigation, which amounts are unknown and will not be determined until future events occur. There are also pending claims for past due accounts payable some of which are in active litigation, which amounts are unknown and will not be determined until future events occur. The original amounts of these payables were accrued for at December 31, 2010 on the consolidated balance sheet.
In July 2010, the Company filed a complaint against Ferring entitled “Vyteris, Inc. v. Ferring Pharmaceuticals, Inc.” (the “Lawsuit”) in the Superior Court of New Jersey, Chancery Division – Essex County to resolve outstanding issues with respect to this termination. Ferring filed a motion to compel arbitration in the case which was granted in November 2010. The Lawsuit has been converted to arbitration and is in its initial stages, and we cannot predict the outcome of the Lawsuit, or what relief we may receive, if we do prevail on the merits. As of December 31, 2010 and 2009, the Company recorded $1.4 million in accrued expenses and other in the consolidated balance sheet for the estimated amounts due to Ferring. (See Note 9 Agreements with Ferring)
Leases
In August 2006, the Company entered into a five year lease agreement for its principal facility which houses its FDA approved manufacturing operations. As part of the agreement, the Company paid $0.3 million for a security deposit.
At December 31, 2010, the minimum lease payments under non-cancelable operating leases are as follows (which includes the PMK 150 lease as set forth in the Transaction Agreement with Ferring March 2009 section of Item 7 - Management’s discussion and analysis of financial condition and results of operations, of this 10K from) :
62
VYTERIS, INC.
NOTES TO CONSOLIDATED FINANCIAL STATEMENTS (CONTINUED)
|
Operating
Leases
|
||||
|
Years ended December 31,
|
||||
|
2011
|
$ | 333,379 | ||
|
2012
|
93,201 | |||
|
2013
|
12,000 | |||
|
2014
|
12,000 | |||
|
2015
|
12,000 | |||
|
Thereafter
|
38,000 | |||
|
Total minimum lease payments
|
$ | 500,580 | ||
Settlement and Release Agreement with 17-01 Pollitt Drive
In May 2005, the Company entered into a ten year lease for an additional 26,255 square feet of space with 17-01 Pollitt Drive, L.L.C. in a new expansion facility, approximately 200 yards from the above facility. Given the de-emphasis of LidoSite, the Company did not anticipate a current or short term need for this manufacturing facility. Therefore, during the first quarter of 2008 the Company consolidated all operations (including offices) into its main operating facility at 13-01 Pollitt Drive and approached the landlord to seek an early lease termination. The Company recognized the present value of future remaining lease costs of $2.6 million in facilities realignment and fixed asset impairment costs in the accompanying consolidated statement of operations for the year ended December 31, 2008.
As of December 31, 2008, the balance of the recorded facility realignment plan was as follows:
|
Totals
|
||||
|
Balance as of December 31, 2007
|
$ | - | ||
|
Facilities realignment charge
|
2,350,600 | |||
|
Deferred rent adjustment
|
179,067 | |||
|
Accretion
|
132,606 | |||
|
Payments
|
(311,104 | ) | ||
|
Balance as of December 31, 2008
|
2,351,169 | |||
|
Less current portion included in accrued expenses, deferred revenue and other
|
(251,411 | ) | ||
|
Present value of abandoned operating lease payments
|
$ | 2,099,758 | ||
On September 30, 2009, the Company entered into a Settlement and Release Agreement with 17-01 Pollitt Drive, L.L.C. (“Landlord”) with respect to this lease. Under the settlement agreement the Company is to pay Landlord $0.5 million, which is evidenced by the issuance of a five year interest only balloon note with principal of $0.5 and interest accruing at the rate of 6% per year. Upon a default by the Company under this promissory note, the principal amount is increased to $0.6 million. The note is convertible at the Landlord’s sole discretion into unregistered common stock of the Company at the conversion price of $1.50 per share. In exchange for the note, Landlord released the Company from its obligations under the Company’s lease between Landlord and the Company. The Company recognized a gain of $2.0 million for the settlement of the lease obligation in the accompanying consolidated statements of operations for the year ended December 31, 2009. Due to this settlement agreement, the Company previously reduced its accrued restructuring liability by approximately $2.1 million and accounts payable by approximately $0.4 million in the accompanying consolidated balance sheet as of December 31, 2009.
Rent expense recorded in the accompanying consolidated statements of operations was approximately $0.4 million for each of the years ended December 31, 2010, 2009 and 2008.
63
VYTERIS, INC.
NOTES TO CONSOLIDATED FINANCIAL STATEMENTS (CONTINUED)
|
14.
|
Stock Based Compensation Plans and Employment Agreements
|
2005 Stock Option Plans
In April 2005, the Board of Directors and stockholders of the Company approved the 2005 Stock Option Plan (the “2005 Stock Option Plan”). Under the 2005 Stock Option Plan, incentive stock options and non-qualified stock options to purchase shares of the Company’s common stock may be granted to directors, officers, employees and consultants Effective as of March 31, 2010, the Company amended its 2005 Stock Option Plan to increase the number of options available for grant under the plan pursuant to authorization provided by the unanimous consent of its Board of Directors. Specifically, the number of options available in its 2005 Stock Option Plan was increased to 20,000,000 options available to grant.
Options granted under the 2005 Stock Option Plan vest as determined by the Compensation Committee of the Board of Directors (the “Compensation Committee”) and terminate after the earliest of the following events: expiration of the option as provided in the option agreement, termination of the employee, or ten years from the date of grant (five years from the date of grant for incentive options granted to an employee who owns more than 10% of the total combined voting power of all classes of the Company stock at the date of grant). In some instances, granted stock options are immediately exercisable into restricted shares of common stock, which vest in accordance with the original terms of the related options. If an optionee’s status as an employee or consultant changes due to termination, the Company has the right, but not the obligation, to purchase from the optionee all unvested shares at the original option exercise price. The Company recognizes compensation expense ratably over the requisite service period.
The option price of each share of common stock shall be determined by the Compensation Committee, provided that with respect to incentive stock options, the option price per share shall in all cases be equal to or greater than 100% of the fair value of a share of common stock on the date of the grant, except an incentive option granted under the 2005 Stock Option Plan to a shareholder that owns more than 10% of the total combined voting power of all classes of the Company stock, shall have an exercise price of not less than 110% of the fair value of a share of common stock on the date of grant. No participant may be granted incentive stock options, which would result in shares with an aggregate fair value of more than $100,000 first becoming exercisable in one calendar year.
2010 Directors’ Incentive Plan
In March 2010, the Company’s Board of Directors unanimously approved the Company’s 2010 Outside Director Cash Compensation and Stock Incentive Plan (the “2010 Directors’ Incentive Plan”). The 2010 Directors’ Incentive Plan, which replaces the 2007 Directors’ Incentive Plan, increases the number of authorized options under the Directors’ Incentive Plan from 2,583,333 options to 10,000,000 options. As of December 31, 2010, the Company issued 4,745,249 options to purchase shares of the Company’s common stock under the 2010 Directors’ Incentive Plan.
Stock option transactions for the years ended December 31, 2010, 2009 and 2008 under all plans are as follows:
|
Number of
Shares
|
Exercise Price
Per Share
|
Weighted
Average
Exercise
Price
|
Intrinsic
Value
|
|||||||||||||
|
Outstanding at December 31, 2007
|
701,666 | $ | 4.20 - $45.60 | $ | 31.35 | $ | 44,600 | |||||||||
|
Granted
|
2,103,238 | 0.25 - 5.25 | 0.44 | |||||||||||||
|
Exercised
|
- | - | - | |||||||||||||
|
Forfeited
|
(451,780 | ) | 0.50 - 45.60 | 34.88 | ||||||||||||
|
Outstanding at December 31, 2008
|
2,353,124 | 0.25 - 45.60 | 3.02 | - | ||||||||||||
|
Granted
|
2,022,005 | 0.25 - 0.72 | 0.33 | |||||||||||||
|
Exercised
|
- | - | - | |||||||||||||
|
Forfeited
|
(81,687 | ) | 0.29 - 45.60 | 2.66 | ||||||||||||
|
Outstanding at December 31, 2009
|
4,293,442 | 0.25 - 45.60 | 1.76 | $ | 1,531,693 | |||||||||||
|
Granted
|
12,594,723 | 0.30 – 0.65 | 0.50 | |||||||||||||
|
Exercised
|
- | - | - | |||||||||||||
|
Forfeited
|
(160,655 | ) | 0.29 - 45.60 | 1.25 | ||||||||||||
|
Outstanding at December 31, 2010
|
16,727,510 | 0.25 - 45.60 | 0.81 | $ | 598,772 | |||||||||||
|
Exercisable at December 31, 2010
|
9,169,975 | $ | 0.25 - $45.60 | $ | 1.09 | $ | 380,116 | |||||||||
64
VYTERIS, INC.
NOTES TO CONSOLIDATED FINANCIAL STATEMENTS (CONTINUED)
The following table summarizes information about stock options outstanding and exercisable under all plans at December 31, 2010:
|
|
Options Outstanding at
December 31, 2010
|
Options Exercisable at
December 31, 2010
|
|||||||||||||||||||||
|
Exercise Price
|
Number of
Shares
|
Weighted
Average
Exercise Price
|
Weighted
Average
Remaining
Contractual
Life (years)
|
Number of
Shares
|
Weighted
Average
Exercise Price
|
||||||||||||||||||
| $ | 0.25-0.30 | 3,169,466 | $ | 0.27 | 8.41 | 2,309,966 | $ | 0.27 | |||||||||||||||
| $ | 0.31-0.35 | 5,747,639 | 0.35 | 9.08 | 2,726,997 | 0.35 | |||||||||||||||||
| $ | 0.36-0.55 | 1,608,846 | 0.51 | 8.13 | 952,055 | 0.52 | |||||||||||||||||
| $ | 0.56-0.65 | 5,747,639 | 0.65 | 9.09 | 2,726,997 | 0.65 | |||||||||||||||||
| $ | 0.66-45.60 | 453,920 | 13.62 | 4.72 | 453,960 | 13.62 | |||||||||||||||||
| 16,727,510 | $ | 0.81 | 8.81 | 9,169,975 | $ | 1.09 | |||||||||||||||||
The following table summarizes the Company’s unvested stock awards (see Note 15 – employment agreements for discussion of awards to certain officers) under all plans as of December 31, 2010 and 2009:
|
As of December 31, 2010
|
As of December 31, 2009
|
|||||||||||||||
|
Unvested Stock Option
Awards
|
Shares
|
Weighted Average
Grant Date Fair Value
|
Shares
|
Weighted Average
Grant Date Fair Value
|
||||||||||||
|
Unvested at January 1,
|
1,757,308 | $ | 0.69 | 1,240,036 | $ | 0.69 | ||||||||||
|
Awards
|
12,594,724 | $ | 1.00 | 1,847,000 | $ | 0.29 | ||||||||||
|
Forfeitures
|
- | - | (57,437 | ) | $ | 1.03 | ||||||||||
|
Vestings
|
(6,794,497 | ) | $ | 0.49 | (1,272,291 | ) | $ | 0.56 | ||||||||
|
Unvested at December 31,
|
7,557,535 | $ | 0.57 | 1,757,308 | $ | 0.57 | ||||||||||
Stock options available for grant under all stock option plans covered a total of 13,250,565 shares of common stock at December 31, 2010. Stock options available for grant under the 2005 Stock Option Plan covered 7,995,814 shares of stock, and the 2010 Outside Director Stock Incentive Plans covered 5,254,751 shares of stock at December 31, 2010.
The fair value of stock-based awards was estimated using the Black-Scholes-Merton option-pricing model, or in the case of awards with market or performance based conditions, the binomial model with the following weighted-average assumptions for stock options granted in years ended December 31, 2010, 2009 and 2008:
|
Years Ended December 31,
|
||||||||||||
|
2010
|
2009
|
2008
|
||||||||||
|
Expected holding period (years)
|
5.0 | 5.0 | 5.0 | |||||||||
|
Risk-free interest rate
|
2.35 | % | 2.72 | % | 2.28 | % | ||||||
|
Dividend yield
|
0 | % | 0 | % | 0 | % | ||||||
|
Fair value of options granted
|
$ | 0.35 | $ | 0.23 | $ | 0.19 | ||||||
|
Expected volatility
|
91.86 | % | 91.86 | % | 91.86 | % | ||||||
|
Forfeiture rate
|
14.17 | % | 15.38 | % | 15.21 | % | ||||||
The Company’s computation of expected life is based on historical exercise and forfeiture patterns. The interest rate for periods within the contractual life of the award is based on the U.S. Treasury yield curve in effect at the time of grant. The key factors in the Company’s determination of expected volatility are historical and market-based implied volatility, comparable companies with longer stock trading periods than the Company and industry benchmarks.
65
VYTERIS, INC.
NOTES TO CONSOLIDATED FINANCIAL STATEMENTS (CONTINUED)
The following table sets forth the total stock-based compensation expense resulting from stock options in the Company’s consolidated statements of operations for the years ended December 31, 2010, 2009 and 2008:
|
Years Ended December 31,
|
|||||||||||||
|
2010
|
2009
|
2008
|
|||||||||||
|
Research and development
|
$ | 422,970 | $ | 107,046 | $ | 528,419 | |||||||
|
General and administrative
|
1,860,825 | 502,236 | (4,548,759 | ) | |||||||||
|
Sales and marketing
|
19,905 | 29,725 | (31,019 | ) | |||||||||
|
Stock-based compensation expense before income taxes
|
2,303,700 | 639,007 | (4,051,359 | ) | |||||||||
|
Income tax benefit
|
- | - | - | ||||||||||
|
Total stock-based compensation expense after income taxes
|
$ | 2,303,700 | $ | 639,007 | $ | (4,051,359 | ) | ||||||
As of December 31, 2010, $1.1 million of total unrecognized compensation cost related to stock options is expected to be recognized over a weighted-average period of 0.8 years.
In March 2008, the Company recognized a credit of $6.2 million due to the forfeiture of unvested performance based stock options, previously granted to former Chief Executive Officer, Timothy McIntyre, upon his resignation which resulted in the reversal of previously recognized expense related to such options. In April 2008, the Company recognized a credit of $1.0 million due to the forfeiture of unvested performance based stock options, previously granted to the former Chief Financial Officer, Anthony Cherichella, upon his resignation which resulted in the reversal of previously recognized expense related to such options.
|
15.
|
Material Agreements
|
Senior Executive Employment Agreements
On November 21, 2008, the Company entered into an employment agreement with Dr. Hartounian effective as of May 1, 2008, which was renewed and is currently set to expire on November 30, 2011. Dr. Hartounian’s base salary is $0.3 million per year and he is eligible for a bonus of up to 40% of his salary payable in cash. In connection with the extension of the term of the employment agreement, Dr. Hartounian is to be granted up to 7,423,970 options to purchase Company common stock, with the initial 5,196,780 options having been granted and 2,227,190 options to be granted upon raising of $7.0 million by the Company. All options granted shall vest as follows: 35% immediately upon issuance and 65% quarterly over three years from date of grant.
On November 21, 2008, the Company entered into an employment agreement with Joseph N. Himy effective as of May 1, 2008, which was renewed and is currently set to expire on November 30, 2011. Mr. Himy’s base salary is $0.2 million per year and he is eligible for a bonus of up to 25% of his salary payable in cash or stock. Mr. Himy is to be granted up to 2,227,191 options, with the initial 1,559,034 options having been granted and 668,157 options to be granted upon raising of $7.0 million by the Company. All options granted shall vest as follows: 35% immediately upon issuance and 65% quarterly over three years from date of grant.
Other
Pursuant to a Settlement and Mutual Release Agreement, dated October 27, 2008, between the Company and Monumed, LLC, Monumed forgave the approximately $0.2 million in outstanding invoices owed to it for services rendered, and the parties exchanged mutual releases. In addition, in lieu of the remaining $0.2 million payment which was due Mr. McIntyre, the Company paid $75,000 on October 27, 2008, and agreed to pay an additional $25,000 on each of November 26, 2008 and December 24, 2008. The Company recorded $50,000 outstanding under this agreement in accrued expenses in the consolidated balance sheet as of December 31, 2010 and 2009.
66
VYTERIS, INC.
NOTES TO CONSOLIDATED FINANCIAL STATEMENTS (CONTINUED)
|
16.
|
Earnings (Loss) Per Share
|
The following table sets forth the computation of basic and diluted net income (loss) attributable to common stockholders per share for the years ended December 31, 2010, 2009 and 2008.
|
Years Ended December 31,
|
||||||||||||
|
2010
|
2009
|
2008
|
||||||||||
|
Numerator:
|
||||||||||||
|
Net loss
|
$ | (10,547,377 | ) | $ | (33,940,363 | ) | $ | (8,024,240 | ) | |||
|
Denominator:
|
||||||||||||
|
Weighted average shares
|
64,392,135 | 9,002,816 | 7,032,288 | |||||||||
|
Basic and diluted net loss per share
|
$ | (0.16 | ) | $ | (3.77 | ) | $ | (1.14 | ) | |||
The following table shows dilutive common share equivalents outstanding, which are not included in the above historical calculations, as the effect of their inclusion is anti-dilutive during each period.
|
December 31,
|
||||||||||||
|
2010
|
2009
|
2008
|
||||||||||
|
Convertible preferred stock
|
- | - | 500,000 | |||||||||
|
Convertible debt
|
9,620,185 | 333,333 | 491,847 | |||||||||
|
Warrants
|
33,639,513 | 8,954,203 | 4,008,377 | |||||||||
|
Options
|
16,727,510 | 4,293,442 | 2,353,124 | |||||||||
|
Total
|
59,987,208 | 13,580,978 | 7,353,348 | |||||||||
|
17.
|
Warrants and Derivative Instruments
|
Warrant transactions for the years ended December 31, 2010, 2009 and 2008 are as follows:
|
Number of
Shares
|
Exercise Price
Per Share
|
Weighted
Average
Exercise Price
|
||||||||||
|
Outstanding at December 31, 2007
|
3,864,921 | $3.75 – $143.25 | $ | 7.50 | ||||||||
|
Granted
|
1,433,357 | 3.00 – 24.75 | 2.97 | |||||||||
|
Exercised
|
(611,895 | ) | 3.75 – 67.05 | 3.00 | ||||||||
|
Forfeited
|
(678,006 | ) | 6.75 – 6.75 | 6.75 | ||||||||
|
Outstanding at December 31, 2008
|
4,008,377 | 1.65 –143.25 | 11.00 | |||||||||
|
Granted
|
5,904,487 | 0.10 – 15.41 | 6.44 | |||||||||
|
Exercised
|
(80,000 | ) | 0.10 - 0.10 | 0.10 | ||||||||
|
Forfeited
|
(878,661 | ) | 3.00 – 67.05 | 38.58 | ||||||||
|
Outstanding at December 31, 2009
|
8,954,203 | 0.10–143.25 | 2.98 | |||||||||
|
Granted
|
24,935,310 | 0.20 – 13.49 | 2.60 | |||||||||
|
Exercised
|
- | - | - | |||||||||
|
Forfeited
|
(250,000 | ) | 0.50 - 0.50 | 0.50 | ||||||||
|
Outstanding at December 31, 2010
|
33,639,513 | $0.20–$143.25 | $ | 1.17 | ||||||||
The following table summarizes information about warrants outstanding of which 28,765,469 are classified as liability instruments and exercisable at December 31, 2010:
67
VYTERIS, INC.
NOTES TO CONSOLIDATED FINANCIAL STATEMENTS (CONTINUED)
|
Warrants Outstanding and Exercisable
At December 31, 2010
|
|||||||||||||||||||
|
Exercise Price
|
Number of
Shares
|
Weighted
Average
Exercise Price
|
Expiration Dates
|
Fair Value of
Warrants Classified
As Derivative
Liabilities
|
|||||||||||||||
| $ | 0.10-0.20 | 13,495,000 | $ | 0.20 | 2012 -2015 | $ | 3,095,871 | ||||||||||||
| $ | 0.21-0.25 | 14,177,390 | 0.25 | 2014- 2015 | 3,412,190 | ||||||||||||||
| $ | 0.26-3.75 | 3,915,992 | 2.50 | 2011- 2015 | - | ||||||||||||||
| $ | 3.76-143.25 | 2,051,131 | 18.72 | 2010- 2014 | 18,686 | ||||||||||||||
| $ | 0.10-143.25 | 33,639,513 | $ | 1.17 | 2010-2015 | $ | 6,526,747 | ||||||||||||
The following table summarizes the major 2010 warrant issuances, net of forfeitures, as follows:
|
2010
Transactions
|
||||
|
Issued in connection with the 2010 Notes (see Note 7)
|
12,495,000 | |||
|
Issued in connection with the June 2010 Notes (see Note 8)
|
2,760,000 | |||
|
Issued upon conversion of the June 2010 Notes (see Note 8)
|
8,136,250 | |||
|
Issued to vendors and others
|
1,294,060 | |||
|
Total
|
24,685,310 | |||
The fair value of warrants and derivative instruments was estimated using the binomial model with some using the down round anti dilution option. The following assumptions were used in the calculation of the fair valuation of warrants and derivative instruments as of December 31, 2010:
|
Expected holding period (years)
|
3.83 - 4.50 | |||
|
Risk-free interest rate
|
2.01 | % | ||
|
Dividend yield
|
0 | % | ||
|
Expected volatility
|
91.86 | % | ||
|
Down round probability at $0.15
|
5 | % | ||
|
Down round probability at $0.20
|
15 | % | ||
|
No down round probability
|
80 | % |
The interest rate for periods within the contractual life of the award is based on the U.S. Treasury yield curve currently in effect. The key factors in the Company’s determination of expected volatility are historical and market-based implied volatility, comparable companies with longer stock trading periods than the Company and industry benchmarks.
The following table summarizes the fair value of warrants classified as liability instruments and beneficial conversion features classified as liability instruments, recorded on the consolidated balance sheet as of December 31, 2010 and December 31, 2009 (all of which are calculated using level 3 fair value measurements):
|
Offering Date
|
Total Fair Value of
Derivative as of
December 31, 2010
|
Total Fair Value of
Derivative as of December
31, 2009
|
||||||
|
October 2009 (Note 10)
|
$ | 951,644 | $ | 2,339,820 | ||||
|
February 2010 (Note 7)
|
3,654,369 | - | ||||||
|
May 2010 (Note 7)
|
2,571,631 | - | ||||||
|
June 2010 (Note 8)
|
2,639,434 | - | ||||||
|
Other
|
18,686 | 294,667 | ||||||
| $ | 9,835,764 | $ | 2,634,487 | |||||
The following table summarizes the changes in fair value of derivative instruments, recorded on the consolidated balance sheet during 2010 and 2009:
68
VYTERIS, INC.
NOTES TO CONSOLIDATED FINANCIAL STATEMENTS (CONTINUED)
|
Fair value of
warrants
|
Fair value of
beneficial
conversion
features
|
Total
|
||||||||||
|
Balance January 1, 2009
|
$ | - | $ | - | $ | - | ||||||
|
Fair value at date of issuance:
|
||||||||||||
|
October 2009 stock and warrant issuance (Note 10)
|
2,339,820 | - | 2,339,820 | |||||||||
|
(Increase) decrease in fair value of derivative instruments included in net loss in 2009:
|
||||||||||||
|
2008 and prior warrants
|
9,067 | - | 9,067 | |||||||||
|
October 2009 stock and warrant issuance
|
285,600 | - | 285,600 | |||||||||
| $ | 294,667 | $ | - | $ | 294,667 | |||||||
|
Balance December 31, 2009
|
$ | 2,634,487 | $ | - | $ | 2,634,487 | ||||||
|
Fair value at date of issuance:
|
||||||||||||
|
February and May 2010 Notes (Note 7)
|
3,027,179 | 517,025 | 3,544,204 | |||||||||
|
June 2010 Notes (Note 8)
|
3,408,507 | - | 3,408,507 | |||||||||
| $ | 6,435,685 | $ | 517,025 | $ | 6,952,710 | |||||||
|
Conversion of derivative instruments:
|
||||||||||||
|
February 2010 Notes (partial conversion)
|
$ | - | $ | (25,000 | ) | $ | (25,000 | ) | ||||
|
(Increase) decrease in fair value of derivative instruments included in net loss in 2010:
|
||||||||||||
|
2008 and prior warrants
|
$ | (275,981 | ) | $ | - | $ | (275,981 | ) | ||||
|
October 2009 stock and warrant issuance
|
(1,388,176 | ) | - | (1,388,176 | ) | |||||||
|
February and May 2010 Notes (Note 7)
|
(110,196 | ) | 2,816,992 | 2,706,796 | ||||||||
|
June 2010 Notes (Note 8)
|
(769,073 | ) | - | (769,073 | ) | |||||||
| $ | (2,543,425 | ) | $ | 2,816,992 | $ | 273,567 | ||||||
|
Balance December 31, 2010
|
$ | 6,526,747 | $ | 3,309,017 | $ | 9,835,764 | ||||||
69
VYTERIS, INC.
NOTES TO CONSOLIDATED FINANCIAL STATEMENTS (CONTINUED)
|
18.
|
Unaudited Quarterly Results of Operations
|
Summarized unaudited quarterly operating results for years ended December 31, 2010 and 2009 are as follows:
|
Quarters Ended
|
||||||||||||||||
|
Dec. 31,
2010
|
Sept. 30,
2010
|
June 30,
2010
|
March. 31,
2010
|
|||||||||||||
|
Revenues:
|
||||||||||||||||
|
Product development revenue
|
$ | (24,885 | ) | $ | 3,956 | $ | 123,254 | $ | - | |||||||
|
Licensing and other revenue
|
1,144 | - | - | 14,323 | ||||||||||||
|
Total revenue
|
(23,741 | ) | 3,956 | 123,254 | 14,323 | |||||||||||
|
Cost and expenses:
|
||||||||||||||||
|
Research and development
|
532,088 | 604,651 | 684,394 | 794,041 | ||||||||||||
|
General and administrative
|
510,891 | 966,907 | 1,611,569 | 1,704,768 | ||||||||||||
|
Total costs and expenses
|
1,042,979 | 1,571,558 | 2,295,963 | 2,498,809 | ||||||||||||
|
Loss from operations
|
(1,066,720 | ) | (1,567,602 | ) | (2,172,709 | ) | (2,484,486 | ) | ||||||||
|
Interest (income) expense:
|
||||||||||||||||
|
Interest income
|
(442 | ) | (750 | ) | (229 | ) | (202 | ) | ||||||||
|
Interest expense
|
65,342 | 34,132 | 34,587 | 35,023 | ||||||||||||
|
Non-cash interest expense for warrants issued
|
(605,589 | ) | 4,115,022 | 251,399 | (35,070 | ) | ||||||||||
|
Interest expense, net
|
(540,689 | ) | 4,148,404 | 285,756 | (250 | ) | ||||||||||
|
Other (income) expenses:
|
||||||||||||||||
|
Increase in fair value of derivative financial instruments
|
(4,401,132 | ) | 125,107 | 3,827,536 | 722,056 | |||||||||||
|
Qualified therapeutic research and development grant
|
(488,959 | ) | - | - | - | |||||||||||
|
Total other expense (credit), net
|
(4,890,090 | ) | 125,107 | 3,827,536 | 722,056 | |||||||||||
|
Income (loss) before benefit from income taxes
|
4,364,059 | 125,107 | (6,286,001 | ) | (3,206,293 | ) | ||||||||||
|
Benefit from the Sale of State of New Jersey net operating losses
|
421,972 | - | - | - | ||||||||||||
|
Net income (loss)
|
$ | 4,786,031 | $ | (5,841,114 | ) | $ | (6,286,001 | ) | $ | (3,206,293 | ) | |||||
|
Net loss per common share:
|
||||||||||||||||
|
Basic
|
$ | 0.07 | $ | (0.09 | ) | $ | (0.10 | ) | $ | (0.05 | ) | |||||
|
Diluted
|
$ | 0.06 | $ | (0.09 | ) | $ | (0.10 | ) | $ | (0.05 | ) | |||||
|
Weighted average number of shares:
|
||||||||||||||||
|
Basic
|
68,933,773 | 62,685,276 | 62,919,928 | 62,640,753 | ||||||||||||
|
Diluted
|
79,553,823 | 62,685,276 | 62,919,928 | 62,640,753 | ||||||||||||
|
Quarters Ended
|
||||||||||||||||
|
Dec. 31,
2009
|
Sept. 30,
2009
|
June 30,
2009
|
March. 31
2009
|
|||||||||||||
|
Revenues:
|
||||||||||||||||
|
Product development revenue
|
$ | 355,511 | $ | 476,928 | $ | 453,710 | $ | 626,931 | ||||||||
|
Licensing and other revenue
|
2,074,854 | 197,466 | 187,753 | 187,556 | ||||||||||||
|
Total revenue
|
2,430,365 | 674,394 | 641,463 | 814,487 | ||||||||||||
|
Cost and expenses:
|
||||||||||||||||
|
Research and development
|
656,177 | 605,821 | 872,189 | 761,504 | ||||||||||||
|
General and administrative
|
495,402 | 548,202 | 675,941 | 1,077,218 | ||||||||||||
|
Facilities realignment and impairment of fixed assets
|
- | - | 51,222 | 126,609 | ||||||||||||
|
Registration rights penalty
|
21,384 | 65,581 | 64,868 | 64,155 | ||||||||||||
|
Total costs and expenses
|
1,172,963 | 1,219,604 | 1,664,220 | 2,029,486 | ||||||||||||
|
Income (loss) from operations
|
1,257,402 | (545,210 | ) | (1,022,757 | ) | (1,214,999 | ) | |||||||||
|
Interest (income) expense:
|
||||||||||||||||
|
Interest income
|
(126 | ) | (24 | ) | (72 | ) | (330 | ) | ||||||||
|
Interest expense to related parties
|
278,163 | 393,839 | 391,188 | 388,538 | ||||||||||||
|
Interest expense
|
86,319 | 5,002 | 9,095 | 59,194 | ||||||||||||
|
Interest expense, net
|
364,356 | 408,817 | 400,211 | 447,402 | ||||||||||||
|
Other (income) expenses:
|
||||||||||||||||
|
Non-cash debt extinguishment
|
35,909,507 | - | - | - | ||||||||||||
|
Gain on settlement of lease obligations
|
- | (1,953,977 | ) | - | - | |||||||||||
|
Revaluation of warrant liability
|
294,668 | - | - | - | ||||||||||||
|
Gain on settlement of registration rights penalty
|
(1,385,017 | ) | - | - | - | |||||||||||
|
Total other expense (credit), net
|
34,819,150 | (1,953,977 | ) | - | - | |||||||||||
|
Income (loss) before benefit from income taxes
|
(33,926,104 | ) | 999,950 | (1,422,968 | ) | (1,662,401 | ) | |||||||||
|
Benefit from the Sale of State of New Jersey net operating losses
|
2,071,168 | - | - | - | ||||||||||||
|
Net (loss) income
|
$ | (31,854,944 | ) | $ | 999,950 | $ | (1,422,968 | ) | $ | (1,662,401 | ) | |||||
|
Net (loss) income per common share:
|
||||||||||||||||
|
Basic
|
$ | (2.26 | ) | $ | 0.14 | $ | (0.20 | ) | $ | (0.23 | ) | |||||
|
Diluted
|
$ | (2.26 | ) | $ | 0.14 | $ | (0.20 | ) | $ | (0.23 | ) | |||||
|
Weighted average number of shares:
|
||||||||||||||||
|
Basic
|
14,088,966 | 7,291,703 | 7,291,703 | 7,282,802 | ||||||||||||
|
Diluted
|
14,088,966 | 7,398,739 | 7,291,703 | 7,282,802 | ||||||||||||
70
VYTERIS, INC.
NOTES TO CONSOLIDATED FINANCIAL STATEMENTS (CONTINUED)
|
19.
|
Subsequent Events
|
Merger with MediSync
On April 1, 2011, Vyteris, Inc. (the “Company” or the “Registrant”) executed an Agreement and Plan of Merger (the “Merger Agreement”) with MediSync BioServices, Inc. (“MediSync”), the Company and VYHNSUB, Inc. (the “Merger Sub”), pursuant to which the Merger Sub will be merged with and into MediSync, with MediSync continuing as the surviving corporation and a wholly-owned subsidiary of Company (the “Merger”). MediSync is the business of consolidating preclinical and contract research organization “CRO” and related businesses, including site management organizations (“SMO”), which sub-contract clinical trial-related responsibilities from a CRO or pharmaceutical/biotechnology company, and post marketing surveillance companies, which monitor pharmaceutical drugs and devices after release into the market.
On April 6, 2011, the Company, Merger Sub and MediSync consummated the Merger by filing a Certificate of merger with the Secretary of State of the State of Delaware. As a result of the Merger, the business of MediSync will be wholly owned and operated by Company. The following is a summary of certain terms and conditions set forth in the Merger Agreement.
Purchase Price
The Company has agreed to pay the following consideration, consisting of common stock and warrants and options to purchase common stock of Vyteris, to the holders of debt and equity securities of MediSync in connection with the Merger:
|
|
·
|
To the holders of MediSync common stock, five shares of the Company’s common stock for each share of MediSync’s common stock.
|
|
|
·
|
To the holders of convertible notes and other indebtedness of MediSync, five shares of the Company’s common stock for each $1.00 of MediSync debt.
|
|
|
·
|
To the holders of MediSync warrants, warrants to purchase five shares of the Company’s common stock, at a $0.20 exercise price and with a five year term, for each MediSync warrant to purchase (i) a share of MediSync common stock and (ii) $1 of convertible note to be issued by MediSync.
|
|
|
·
|
To the holders of MediSync options, options to purchase five shares of the Company’s common stock, at a $.20 exercise price and with a 10 year term, for each option to purchase a share of MediSync common stock.
|
In total, (i) 25,816,283 shares of Company common stock shall be issued to holders of MediSync common stock, convertible notes and other indebtedness, (ii) warrants to purchase 2,090,000 shares of Company common stock shall be issued to holders of MediSync warrants and (iii) options to purchase 1,683,750 shares of Company common stock shall be issued to holders of MediSync options.
By agreement of the Boards of Directors of the parties, each share of MediSync common stock, and all warrants, options and convertible indebtedness of MediSync, were valued at $1.00 per share of MediSync common stock, and each share of Registrant common stock was valued at $0.20 (which was the per share conversion price in the June 2010 convertible note financing transaction consummated by the Registrant and the most recent private placement transaction by the Registrant prior to the August 2010 negotiations regarding the purchase price for the acquisition of MediSync). The transaction was approved by both Boards of Directors in March 2011.
71
VYTERIS, INC.
NOTES TO CONSOLIDATED FINANCIAL STATEMENTS (CONTINUED)
Bridge Financing
As of April 11, 2011, we have commitments from our Board of Directors and other insiders to fund at least $0.1 million no later than April 21, 2011 ("Initial Bridge Funding"). This Initial Bridge Funding is insufficient to fund our operations for more than three weeks, and during that time, we will not pay for any nonessential services, including salaries for our management team, and we will continue to incur payables, as well as be unable to pay other payables which are already in arrears.
We are currently in negotiations with an investment banking firm with respect its acting as a selling agent for a longer term bridge financing of up to $2.0 million, to be comprised of convertible notes and warrants. Our objective is to launch this bridge financing before April 30, 2011.
Additionally, the Company engaged two other investment bankers in the first quarter of 2011 to assist in raising equity capital needed to complete its business plan. While no specific dollar amounts or terms have been agreed to as yet, our discussions with these firms relate to their raising approximately $10.0 to $15.0 million, to fund CRO’s acquisitions, and for working capital and general corporate purposes.
Even if we are successful in raising the bridge capital set forth above, no inference can be made that this is an indication of potential success in raising equity capital needed to complete our business plan The bridge capital is intended as short term, interim finances, and without successful completion of the larger financing by our investment bankers, management will, more likely than not, be required to substantially curtail, if not cease, operations, which will result in a material adverse effect on the financial position and results of operations of the Company. These conditions raise substantial doubt about the Company’s ability to continue as a going concern.
Other
Effective April 1, 2011, Gary Burkhardt has joined our Board of Directors and will serve on its Nominating Committee.
72
|
ITEM 9.
|
CHANGES IN AND DISAGREEMENTS WITH ACCOUNTANTS ON ACCOUNTING AND FINANCIAL DISCLOSURE
|
A description of our changes in and disagreements with accountants on accounting and financial disclosure will be contained in the section captioned “Changes in and Disagreements with Accountants” of the 2011 Proxy Statement.
|
ITEM 9A.
|
CONTROLS AND PROCEDURES
|
|
A.
|
Disclosure
|
As of the end of the period covered by this Annual Report on Form 10-K, management performed, with the participation of our Principal Executive Officer and Principal Accounting Officer, an evaluation of the effectiveness of our disclosure controls and procedures as defined in Rules 13a-15(e) and 15d-15(e) of the Exchange Act. Our disclosure controls and procedures are designed to ensure that information required to be disclosed in the report we file or submit under the Exchange Act is recorded, processed, summarized, and reported within the time periods specified in the SEC’s forms, and that such information is accumulated and communicated to our management including our Principal Executive Officer and our Principal Accounting Officer, to allow timely decisions regarding required disclosures. Our Principal Executive Officer and our Principal Accounting Officer concluded that, as of December 31, 2010, our disclosure controls and procedures were not effective.
|
B.
|
Internal Control over Financial Reporting
|
Our certifying officers (principal executive and accounting officers) are responsible for establishing and maintaining disclosure controls and procedures (as defined in Exchange Act Rules 13a-14 and 15d-14). Our Principal Executive Officer and Principal Accounting Officer have:
|
|
a)
|
Designed a framework to evaluate the effectiveness of our internal control over our financial reporting as required by paragraph (c) of Rule 13a-15 or Rule 15d-15 through the use of ongoing review and checks and balances for all transactions and decisions; we have designed disclosure controls and procedures to ensure that material information relating to our affairs, including our consolidated subsidiaries, is made known to us by others within those entities, particularly during the period in which this quarterly report is being prepared;
|
|
|
b)
|
evaluated the effectiveness of our disclosure controls and procedures as of the filing date of this quarterly report (the "Evaluation Date"); and
|
|
|
c)
|
presented in this annual report our conclusions about the effectiveness of the disclosure controls and procedures based on our evaluation as of the Evaluation Date.
|
Management's Annual Report on Internal Control over Financial Reporting
Our management is responsible for establishing and maintaining adequate internal control over financial reporting as defined in Rules 13a-15(f) and 15d-15(f) under the Securities Exchange Act of 1934. Our internal control over financial reporting is a process designed by, or under the supervision of, our principal executive officer and principal financial officer, and effected by our Board of Directors, management, and other personnel, to provide reasonable assurance regarding the reliability of financial reporting and the preparation of financial statements for external purposes in accordance with general accepting accounting principles.
Because of its inherent limitations, internal control over financial reporting may not prevent or detect misstatements. Also, projections of any evaluation of effectiveness to future periods are subject to the risk that controls may become inadequate because of changes in conditions, or that the degree of compliance with policies and procedures may deteriorate.
Management has evaluated the effectiveness of the Company's internal control over financial reporting as of December 31, 2010. Management based its assessment on the framework set forth in COSO’s Internal Control – Integrated Framework (1992) in conjunction with Securities and Exchange Commission Release No. 33-8820 entitled "Commission Guidance Regarding Management’s Report on Internal Control Over Financial Reporting Under Section 13(a) or 15(d) of the Securities and Exchange Commission". Based on its assessment, management concluded that the Company did not maintain effective internal control over financial reporting as of December 31, 2010, because of the certain material weakness addressed below.
73
Segregation of Duties
As of December 31, 2010 we had an accounting staff limited to our Chief Financial Officer and two support staff members. Limited resources in this area do not provide sufficient staffing for internal control purposes. We monitor this situation closely and have ongoing plans to add support as needed in this area and as resources permit. In the first quarter of 2011, we eliminated one support staff position and engaged an experienced consultant. Due to the consummation of the Merger, we will need additional technical resources and support staff to integrate the two businesses and provide accounting and financial services for the combined entities.
This annual report does not include an attestation report of the Company's registered public accounting firm regarding internal control over financial reporting. Management's report was not subject to attestation by the Company's registered public accounting firm pursuant to rules of the SEC that permit the Company to provide only management's report in this annual report.
|
ITEM 9B.
|
OTHER INFORMATION
|
None.
|
ITEM 10.
|
DIRECTORS, EXECUTIVE OFFICERS AND CORPORATE GOVERNANCE
|
Information with respect to our directors will be contained in the section captioned “Structure of the Board of Directors” and “Compensation of Non-Named Executive Officer Directors” of the Definitive Proxy Statement, expected to be filed on or about April 28, 2011 with the Commission, relating to our 2011 Annual Meeting of Stockholders (“2011 Proxy Statement”), which is scheduled to be held on June 15, 2011. Information with respect to Item 405 disclosure of delinquent Form 3, 4 or 5 filers will be contained in the section captioned “Section 16(A) Beneficial Ownership Reporting Compliance” in the 2011 Proxy Statement. Those portions of the 2011 Proxy Statement are incorporated herein by reference.
The Company has adopted a code of ethics entitled “Code of Ethics for the Senior Financial Officers, Executive Officers and Directors of Vyteris, Inc.” A copy is available to any person without charge upon written request to:
Vyteris, Inc.
Attention: Investor Relations
13-01 Pollitt Drive
Fair Lawn, New Jersey 07410
|
ITEM 11.
|
EXECUTIVE COMPENSATION
|
A description of the compensation of our executive officers will be contained in the section captioned “Executive Officer Compensation” and “Compensation Committee Interlocks and Insider Participation” of the 2011 Proxy Statement. That portion of the 2011 Proxy Statement is incorporated herein by reference.
|
ITEM 12.
|
SECURITY OWNERSHIP OF CERTAIN BENEFICIAL OWNERS AND MANAGEMENT AND RELATED STOCKHOLDER MATTERS
|
A description of the security ownership of certain beneficial owners and management will be contained in the section captioned “Security Ownership of Certain Beneficial Owners and Management” of the 2011 Proxy Statement. That portion of the 2011 Proxy Statement is incorporated herein by reference.
74
EQUITY COMPENSATION PLAN INFORMATION
A description of our equity compensation plans will be contained in the section captioned “Executive Officer Compensation” of the 2011 Proxy Statement. That portion of the 2011 Proxy Statement is incorporated herein by reference.
|
ITEM 13.
|
CERTAIN RELATIONSHIPS AND RELATED TRANSACTIONS, AND DIRECTOR INDEPENDENCE
|
Certain relationships and related transactions with management will be contained in the section captioned “Certain Relationships and Related Transactions” in the 2011 Proxy Statement. That portion of the 2011 Proxy Statement is incorporated herein by reference.
|
ITEM 14.
|
PRINCIPAL ACCOUNTING FEES AND SERVICES
|
A description of the principal accounting fees and services will be contained in the section captioned “Principal Accounting Fees and Services” in the 2011 Proxy Statement. That portion of the 2011 Proxy Statement is incorporated herein by reference.
|
ITEM 15.
|
EXHIBITS AND FINANCIAL STATEMENT SCHEDULES
|
The following documents are filed as part of this report:
|
(a) (1)
|
Financial Statements — See Index to Consolidated Financial Statements at Part II, Item 8 of this report.
|
Schedules not listed above have been omitted because the information required to be set forth therein is not applicable, not required or is included elsewhere in the financial statements or notes thereto.
|
(a) (3)
|
Exhibits — The following exhibits are filed with this report:
|
|
|
2.1
|
Merger Agreement and Plan of Reorganization, dated as of July 8, 2004, by and among Treasure Mountain Holdings, Inc.(“Treasure Mountain Holdings”), TMH Acquisition Corp. and Vyteris (“Vyteris”) is incorporated by reference to Exhibit 2.1 to Treasure Mountain Holdings’ Registration Statement on Form SB-2 (333-120411) filed November 12, 2004.
|
|
|
2.2
|
Amendment No. 1, dated as of September 29, 2004, to the Merger Agreement and Plan of Reorganization, dated as of July 8, 2004, by and among Treasure Mountain Holdings, TMH Acquisition Corp. and Vyteris is incorporated by reference to Exhibit 2.2 to Treasure Mountain Holdings’ Registration Statement on Form SB-2 (333-120411) filed November 12, 2004.
|
|
|
3.1
|
Articles of Incorporation, as amended, of Treasure Mountain Holdings is incorporated by reference to Exhibit 3.1 to Treasure Mountain Holdings’ Registration Statement on Form SB-2 (333-120411) filed November 12, 2004.
|
|
|
3.2
|
By-laws, as amended, of Treasure Mountain Holdings is incorporated by reference to Exhibit 3.2 to Treasure Mountain Holdings’ Registration Statement on Form SB-2 (333-120411) filed November 12, 2004.
|
|
|
3.3
|
Proposed amendments to the articles of incorporation of Treasure Mountain Holdings are incorporated by reference to Exhibit 3.3 of Amendment No. 2 to Treasure Mountain Holdings’ Registration Statement on Form SB-2 (333-120411) filed January 3, 2005.
|
|
|
3.4
|
Articles of Incorporation, as amended, is incorporated by reference to Exhibit 99.1 to Form 8-K filed on May 7, 2009.
|
75
|
|
10.6
|
License and Development Agreement, dated as of September 27, 2004 is incorporated by reference to Exhibit 10.6 to Amendment No. 1 to Treasure Mountain Holdings’ Registration Statement on Form SB-2 (333-120411) filed November 30, 2004.
|
|
|
10.7
|
Supply Agreement, dated as of September 27, 2004 is incorporated by reference to Exhibit 10.7 to Amendment No. 1 to Treasure Mountain Holdings’ Registration Statement on Form SB-2 (333-120411) filed November 30, 2004.
|
|
|
10.19
|
Vyteris (Holdings) Nevada, Inc. 2005 Stock Options Plan is incorporated by reference to Exhibit 10.1 of the Registrant’s Current Report on Form 8-K dated April 26, 2005.
|
|
|
10.36
|
Warrant Agreement issued to Spencer Trask Specialty Group, LLC on May 27, 2005 is incorporated by reference to Exhibit 10.36 to the Registrant’s Quarterly Report on Form 10-QSB for the quarterly period ended June 30, 2005.
|
|
|
10.37
|
Warrant Agreement issued to Spencer Trask Private Equity Fund I, LP on May 27, 2005. is incorporated by reference to Exhibit 10.37 to the Registrant’s Quarterly Report on Form 10-QSB for the quarterly period ended June 30, 2005.
|
|
|
10.38
|
Warrant Agreement issued to Spencer Trask Private Equity Fund II, LP on May 27, 2005. is incorporated by reference to Exhibit 10.38 to the Registrant’s Quarterly Report on Form 10-QSB for the quarterly period ended June 30, 2005.
|
|
|
10.39
|
Warrant Agreement issued to Spencer Trask Private Accredited Equity Fund III, LLC on May 27, 2005 is incorporated by reference to Exhibit 10.39 to the Registrant’s Quarterly Report on Form 10-QSB for the quarterly period ended June 30, 2005.
|
|
|
10.40
|
Warrant Agreement issued to Spencer Trask Illumination Fund LLC on May 27, 2005 is incorporated by reference to Exhibit 10.40 to the Registrant’s Quarterly Report on Form 10-QSB for the quarterly period ended June 30, 2005.
|
|
|
10.41
|
Warrant Agreement issued to Spencer Trask Specialty Group, LLC on June 2, 2005 is incorporated by reference to Exhibit 10.41 to the Registrant’s Quarterly Report on Form 10-QSB for the quarterly period ended June 30, 2005.
|
|
|
10.42
|
Warrant Agreement issued to Spencer Trask Private Equity Fund I, LP on June 2, 2005. is incorporated by reference to Exhibit 10.42 to the Registrant’s Quarterly Report on Form 10-QSB for the quarterly period ended June 30, 2005.
|
|
|
10.43
|
Warrant Agreement issued to Spencer Trask Private Equity Fund II, LP on June 2, 2005. is incorporated by reference to Exhibit 10.43 to the Registrant’s Quarterly Report on Form 10-QSB for the quarterly period ended June 30, 2005.
|
|
|
10.44
|
Warrant Agreement issued to Spencer Trask Private Accredited Equity Fund III LLC on June 2, 2005. is incorporated by reference to Exhibit 10.44 to the Registrant’s Quarterly Report on Form 10-QSB for the quarterly period ended June 30, 2005.
|
|
|
10.45
|
Warrant Agreement issued to Spencer Trask Illumination Fund LLC on June 2, 2005. is incorporated by reference to Exhibit 10.45 to the Registrant’s Quarterly Report on Form 10-QSB for the quarterly period ended June 30, 2005.
|
|
|
10.46
|
Warrant Agreement issued to Spencer Trask Specialty Group, LLC on June 21, 2005. is incorporated by reference to Exhibit 10.46 to the Registrant’s Quarterly Report on Form 10-QSB for the quarterly period ended June 30, 2005.
|
|
|
10.47
|
Warrant Agreement issued to Spencer Trask Specialty Group, LLC on July 13, 2005. is incorporated by reference to Exhibit 10.47 to the Registrant’s Quarterly Report on Form 10-QSB for the quarterly period ended June 30, 2005.
|
76
|
|
10.48
|
Warrant Agreement issued to Spencer Trask Specialty Group, LLC on July 18, 2005. is incorporated by reference to Exhibit 10.48 to the Registrant’s Quarterly Report on Form 10-QSB for the quarterly period ended June 30, 2005.
|
|
10.121
|
Lease Agreement between Lincoln Fair Lawn Associates and the Registrant dated August 29, 2006 is incorporated by reference to Exhibit 10.121 to the Registrant’s Quarterly Report on Form 10-QSB for the quarterly period ended September 30, 2006.
|
|
10.131
|
Subscription Agreement, dated July 2007.
|
|
10.132
|
Form of Investor Warrant, dated July 2007.
|
|
10.134
|
2007 Outside Director Cash Compensation and Stock Incentive Plan.
|
|
10.135
|
2007 Stock Option Plan.
|
|
10.141
|
Separation and General Release Agreement between Vyteris, Inc. and Timothy J. McIntyre, dated as of March 21, 2008.
|
|
10.142
|
Letter Agreement between Ferring Pharmaceuticals, Inc. and Vyteris, Inc., dated July 8, 2008.
|
|
10.143
|
$2,500,000 Principal Amount Secured Note, executed by Vyteris, Inc. in favor of Ferring Pharmaceuticals, Inc., dated July 8, 2008.
|
|
10.144
|
$50,000 Principal Amount Secured Note, executed by Vyteris, Inc. in favor of Ferring Pharmaceuticals, Inc., dated July 8, 2008.
|
|
10.145
|
Security Agreement, between Vyteris, Inc. and Ferring Pharmaceuticals, Inc., dated July 8, 2008.
|
|
10.146
|
Certificate of Change of Vyteris, Inc., filed with the Nevada Secretary of State on May 6, 2008.
|
|
10.147
|
Employment Agreement between the Company and Haro Hartounian, dated November 21, 2008
|
|
10.148
|
Employment Agreement between the Company and Joseph Himy, dated November 21, 2008
|
|
10.149
|
$200,000 Principal amount note, executed by Vyteris, Inc., in favor of Ferring Pharmaceuticals, Inc., dated December 2008.
|
|
10.150
|
Letter Agreement, executed by Vyteris, Inc., Vyteris, Inc. and Ferring Pharmaceuticals, Inc., dated March 2009.
|
|
10.151
|
Equipment Lease, executed by Vyteris, Inc. and Ferring Pharmaceuticals, Inc., dated March 2009
|
|
10.152
|
Security Agreements, executed by Vyteris, Inc. and Ferring Pharmaceuticals, Inc., dated March 2009.
|
|
10.153
|
Restructuring Agreement, dated as of October 1, 2009, by Vyteris, Inc. and Spencer Trask Specialty Group, is incorporated by reference to Exhibit 99.1 to the Form 8-K filed October 5, 2009.
|
|
10.154
|
Amendment to Restructuring Agreement, dated as of December 24, 2009, in incorporated by reference to Exhibit 99.1 to Form 8-K filed December 29, 2009.
|
|
10.155
|
Form of Note, dated February 2010.
|
|
10.156
|
Amendment to Employment Agreement with Haro Hartounian, dated April 8, 2010
|
77
|
10.157
|
Amendment to Employment Agreement with Joseph Himy, dated April 8, 2010
|
|
10.158
|
2010 Outside Directors Cash Compensation and Stock Incentive Plan
|
|
10.159
|
Form of Subscription Agreement for 0% Senior Subordinated Convertible Promissory Notes
|
|
10.160
|
Form of 0% Senior Subordinated Convertible Promissory Note
|
|
10.161
|
Form of Warrant issued in connection with Form of 0% Senior Subordinated Convertible Promissory Notes
|
|
10.162
|
Form of Security Agreement for 0% Senior Subordinated Convertible Promissory Notes
|
|
10.163
|
Amendment No. 1 to Promissory Note with Spencer Trask Specialty Group
|
|
10.164
|
Merger Agreement with MediSync BioServices, Inc., dated April 1, 2011
|
|
|
16.1
|
Letter from Madsen & Associates, CPA's, Inc. dated November 5, 2004 is incorporated by reference to Exhibit 16.1 to Treasure Mountain Holdings’ Current Report on Form 8-K filed November 5, 2004.
|
|
|
21.1
|
Subsidiaries of Treasure Mountain is incorporated by reference to Exhibit 21.1 to Treasure Mountain Holdings’ Registration Statement on Form SB-2 (333-120411) filed November 12, 2004.
|
|
|
31.1
|
Certification of the Chief Executive Officer pursuant to Section 302 of the Sarbanes-Oxley Act of 2002.
|
|
|
31.2
|
Certification of the Principal Accounting Officer pursuant to Section 302 of the Sarbanes-Oxley Act of 2002.
|
|
|
32.1
|
Certification of the Chief Executive Officer pursuant to Section 906 of the Sarbanes-Oxley Act of 2002.
|
|
|
32.2
|
Certification of the Principal Accounting Officer pursuant to Section 906 of the Sarbanes-Oxley Act of 2002.
|
78
SIGNATURES
Pursuant to the requirements of Section 13 or 15(d) of the Securities Exchange Act of 1934, the registrant has duly caused this report to be signed on its behalf by the undersigned, thereunto duly authorized.
|
Vyteris , Inc.
|
||
|
April 15, 2011
|
By:
|
/s/ Haro Hartounian
|
|
Haro Hartounian
|
||
|
Chief Executive Officer
|
||
Pursuant to the requirements of the Securities Exchange Act of 1934, this report has been signed below by the following persons on behalf of the registrant and in the capacities and on the dates indicated..
|
Signature
|
Title
|
Date
|
||
|
/s/ EUGENE BAUER
|
Chairman of the Board of Directors
|
April 15, 2011
|
||
|
Eugene Bauer
|
||||
|
/s/ HARO HARTOUNIAN
|
President, Chief Executive Officer
|
April 15, 2011
|
||
|
Haro Hartounian
|
and Director (Principal Executive Officer)
|
|||
|
/s/ JOSEPH N. HIMY
|
Chief Financial Officer
|
April 15, 2011
|
||
|
Joseph N. Himy
|
(Principal Accounting Officer)
|
|||
|
/s/ GENE E. BURLESON
|
Director
|
April 15, 2011
|
||
|
Gene E. Burleson
|
||||
|
/s/ JOHN BURROWS
|
Director
|
April 15, 2011
|
||
|
John Burrows
|
||||
|
/s/ ARTHUR COURBANOU
|
Director
|
April 15, 2011
|
||
|
Arthur Courbanou
|
||||
|
/s/ SUSAN GUERIN
|
Director
|
April 15, 2011
|
||
|
Susan Guerin
|
||||
|
/s/ JOEL KANTER
|
Director
|
April 15, 2011
|
||
|
Joel Kanter
|
||||
|
/s/ RUSSELL O. POTTS
|
Director
|
April 15, 2011
|
||
|
Russell O. Potts
|
79