Attached files
| file | filename |
|---|---|
| EX-23.(A) - REX AMERICAN RESOURCES Corp | c65168_ex-23a.htm |
| EX-21.(A) - REX AMERICAN RESOURCES Corp | c65168_ex-21a.htm |
| EX-23.(B) - REX AMERICAN RESOURCES Corp | c65168_ex-23b.htm |
| EX-23.(D) - REX AMERICAN RESOURCES Corp | c65168_ex-23d.htm |
| EX-23.(C) - REX AMERICAN RESOURCES Corp | c65168_ex-23c.htm |
| EX-23.(E) - REX AMERICAN RESOURCES Corp | c65168_ex-23e.htm |
| EX-32 - REX AMERICAN RESOURCES Corp | c65168_ex32.htm |
| EX-99.(A) - REX AMERICAN RESOURCES Corp | c65168_ex-99a.htm |
| EX-99.(C) - REX AMERICAN RESOURCES Corp | c65168_ex-99c.htm |
| EX-99.(B) - REX AMERICAN RESOURCES Corp | c65168_ex-99b.htm |
| EX-99.(B)(1) - REX AMERICAN RESOURCES Corp | c65168_ex-99b1.htm |
| EX-31 - REX AMERICAN RESOURCES Corp | c65168_ex31.htm |
| EX-4.(O) - REX AMERICAN RESOURCES Corp | c65168_ex-4o.htm |
| EX-4.(P) - REX AMERICAN RESOURCES Corp | c65168_ex-4p.htm |
|
|
|
|
UNITED STATES |
|
|
SECURITIES AND EXCHANGE COMMISSION |
|
|
WASHINGTON, D.C. 20549 |
|
|
FORM 10-K |
|
|
ANNUAL REPORT PURSUANT TO SECTION 13 OR 15(d) OF |
|
|
THE SECURITIES EXCHANGE ACT OF 1934 |
|
|
FOR THE FISCAL YEAR ENDED JANUARY 31, 2011 |
COMMISSION FILE NO. 001-09097 |
|
|
|
REX AMERICAN RESOURCES CORPORATION |
|
(Exact name of registrant as specified in its charter) |
|
|
|
|
|
Delaware |
|
31-1095548 |
|
(State or other jurisdiction of |
|
(I.R.S. Employer Identification No.) |
|
|
|
|
|
2875 Needmore Road, Dayton, Ohio |
|
45414 |
|
(Address of principal executive offices) |
|
(Zip Code) |
|
|
|
|
|
Registrant’s telephone number, including area code (937) 276-3931 |
|
|
|
|
|
Securities registered pursuant to Section 12(b) of the Act: |
|
|
|
|
|
Title of each class |
|
Name of each exchange |
|
|
|
|
|
Common Stock, $.01 par value |
|
New York Stock Exchange |
Indicate by check mark if the registrant is a well-known seasoned issuer, as defined in Rule 405 of the Securities Act. Yes o No þ
Indicate by check mark if the registrant is not required to file reports pursuant to Section 13 or Section 15(d) of the Act. Yes o No þ
Indicate by check mark whether the registrant (1) has filed all reports required to be filed by Section 13 or 15(d) of the Securities Exchange Act of 1934 during the preceding 12 months (or for such shorter period that the registrant was required to file such reports), and (2) has been subject to such filing requirements for the past 90 days. Yes þ No o
Indicate by check mark whether the registrant has submitted electronically and posted on its corporate Web site, if any, every Interactive Data File required to be submitted and posted pursuant to Rule 405 of Regulation S-T during the preceding 12 months (or for such shorter period that the registrant was required to submit and post such files). Yes o No o
Indicate by check mark if disclosure of delinquent filers pursuant to Item 405 of Regulation S-K is not contained herein, and will not be contained, to the best of registrant’s knowledge, in definitive proxy or information statements incorporated by reference in Part III of this Form 10-K or any amendment to this Form 10-K. þ
Indicate by check mark whether the registrant is a large accelerated filer, an accelerated filer, a non-accelerated filer, or a smaller reporting company. See definition of “large accelerated filer”, “accelerated filer” and “smaller reporting company” in Rule 12b-2 of the Exchange Act. (check one):
|
|
|
|
|
|
Large accelerated filer o |
Accelerated filer þ |
Non-accelerated filer o |
Smaller reporting company o |
|
(Do not check if a smaller reporting company) |
|||
|
|
|
There were 9,600,056 shares of the registrant’s Common Stock outstanding as of April 14, 2011. |
|
Documents Incorporated by Reference |
|
Portions of REX American Resources Corporation’s definitive Proxy Statement for its Annual Meeting of Shareholders on June 7, 2011 are incorporated by reference into Part III of this Form 10-K. |
FORWARD-LOOKING STATEMENTS
This Form 10-K contains or may contain forward-looking statements as defined in the Private Securities Litigation Reform Act of 1995. Such statements can be identified by use of forward-looking terminology such as “may,” “expect,” “believe,” “estimate,” “anticipate” or “continue” or the negative thereof or other variations thereon or comparable terminology. Readers are cautioned that there are risks and uncertainties that could cause actual events or results to differ materially from those referred to in such forward-looking statements. These risks and uncertainties include the risk factors set forth from time to time in the Company’s filings with the Securities and Exchange Commission and include among other things: the impact of legislative changes, the price volatility and availability of corn, sorghum, distillers grains, ethanol, gasoline and natural gas, ethanol plants operating efficiently and according to forecasts and projections, changes in the national or regional economies, weather, the effects of terrorism or acts of war and changes in real estate market conditions. The Company does not intend to update publicly any forward-looking statements except as required by law. Other factors that could cause actual results to differ materially from those in the forward-looking statements are set forth in Item 1A.
AVAILABLE INFORMATION
REX makes available free of charge on its Internet website its annual report on Form 10-K, quarterly reports on Form 10-Q, current reports on Form 8-K, and amendments to those reports as soon as reasonably practicable after such material is electronically filed with or furnished to the SEC. REX’s Internet website address is www.rexamerican.com. The contents of the Company’s website are not a part of this report.
PART I
|
|
|
|
Item 1. |
Business |
Overview
REX was incorporated in Delaware in 1984 as a holding company to succeed to the entire ownership of three affiliated corporations, Rex Radio and Television, Inc., Stereo Town, Inc. and Kelly & Cohen Appliances, Inc., which were formed in 1980, 1981 and 1983, respectively. Our principal offices are located at 2875 Needmore Road, Dayton, Ohio 45414. Our telephone number is (937) 276-3931. Historically, we were a specialty retailer in the consumer electronics and appliance industry serving small to medium-sized towns and communities. In addition, we have been an investor in various alternative energy entities beginning with synthetic fuel partnerships in 1998 and later ethanol production facilities beginning in 2006. Recognizing the change in our business, we changed our corporate name from REX Stores Corporation to REX American Resources Corporation in 2010.
In fiscal year 2007, we began to evaluate strategic alternatives for our retail segment with a focus on closing unprofitable or marginally profitable retail stores and monetizing our retail-related real estate assets. We did not believe that we were generating an adequate return from our retail business due to the competitive nature of the consumer electronics and appliance industry and the overall economic conditions in the United States. Reflecting this focus, we sold approximately 60% of our owned retail and vacant stores in fiscal year 2007 and leased back a portion of the stores which had been operating as electronics and appliance retail stores. In fiscal year 2008, we commenced an evaluation of a broad range of alternatives intended to derive value from the remaining retail operations and our remaining real estate portfolio. We engaged an investment banking firm to assist us in analyzing and ultimately marketing our retail operations. As part of those marketing efforts, late in fiscal year 2008, we initially leased 37 owned store locations to an unrelated third party. During fiscal year 2009, the lease agreements were terminated. At January 31, 2011, we had lease agreements for all or parts of eight former retail properties and had 22 vacant former retail properties. We
2
also own one former distribution center, which is partially leased, partially occupied by our corporate office personnel and partially vacant. We are marketing these vacant properties to lease or sell. Should our marketing efforts result in additional tenants to whom we lease property, we would expect to execute leases with terms of five to twenty years.
We completed our exit of the retail business as of July 31, 2009. Going forward, our only retail related activities will consist of the administration of extended service plans we previously sold and the payment of related claims. Net sales and expenses related to extended service plans are classified as discontinued operations.
We are currently invested in five ethanol production entities, one of which we have a majority ownership interest in. We may make additional investments in the alternative energy segment during fiscal year 2011.
Our ethanol operations are highly dependent on commodity prices, especially prices for corn, sorghum, ethanol, distillers grains and natural gas. As a result of price volatility for these commodities, our operating results can fluctuate substantially. The price and availability of corn and sorghum are subject to significant fluctuations depending upon a number of factors that affect commodity prices in general, including crop conditions, weather, federal policy and foreign trade. Because the market price of ethanol is not always directly related to corn and sorghum prices, at times ethanol prices may lag movements in corn prices and, in an environment of higher prices, reduce the overall margin structure at the plants. As a result, at times, we may operate our plants at negative or marginally positive operating margins.
We expect our ethanol plants to produce approximately 2.8 gallons of ethanol for each bushel of grain processed in the production cycle. We refer to the difference between the price per gallon of ethanol and the price per bushel of grain (divided by 2.8) as the “crush spread.” Should the crush spread decline, it is possible that our ethanol plants will generate operating results that do not provide adequate cash flows for sustained periods of time. In such cases, production at the ethanol plants may be reduced or stopped altogether in order to minimize variable costs at individual plants. This was the case for Levelland Hockley County Ethanol, LLC (“Levelland Hockley”) during fiscal year 2010. This plant was unable to source affordable grain supplies, and combined with the lower than normal industry crush spreads that existed in the latter portions of fiscal year 2010, the plant ceased production operations in January 2011. We expect decisions to be made on an individual plant basis, as there are different market conditions at each of our ethanol plants.
We attempt to manage the risk related to the volatility of grain and ethanol prices by utilizing forward grain purchase and forward ethanol and distillers grain sale contracts. We attempt to match quantities of ethanol and distillers grains sale contracts with an appropriate quantity of grain purchase contracts over a given period of time when we can obtain an adequate gross margin resulting from the crush spread inherent in the contracts we have executed. However, the market for future ethanol sales contracts is not a mature market. Consequently, we generally execute contracts for no more than three months into the future at any given time. As a result of the relatively short period of time our contracts cover, we generally cannot predict the future movements in the crush spread for more than three months; thus, we are unable to predict the likelihood or amounts of future income or loss from the operations of our ethanol facilities.
The crush spread realized in 2010 was subject to significant volatility. For calendar year 2010, the average Chicago Board of Trade (“CBOT”) near-month corn price was approximately $4.30 per bushel, with highs reaching approximately $6.25 per bushel in December 2010. We believe corn prices were affected late in the year by global weather conditions, export demand, speculation, currency valuation and global economic conditions. Ethanol prices also had significant fluctuations ranging from approximately $1.50 per gallon in June to approximately $2.38 per gallon in December. Ethanol and corn prices have tended to trade in the same direction but with narrowing spreads, particularly late in the year. In 2010, the CBOT crush spread ranged
3
from a low of approximately $0.05 per gallon in December to a high of approximately $0.55 per gallon in February. We believe ethanol demand late in 2010 was also impacted by the uncertainty of the extension of the Volumetric Ethanol Tax Credit Blender Credit. Crush spreads have continued to decline in 2011 and have at times, become negative (absent the consideration of distillers grains). Prices for distillers grains we sell generally trend with grain prices. These prices have partially offset the decline in the crush spread.
We reported segment profit (before income taxes and noncontrolling interests) from our alternative energy segment of approximately $13.4 million in fiscal year 2010 compared to approximately $17.8 million in fiscal year 2009. The decline in profitability primarily resulted from impairment charges and loss on deconsolidation of Levelland Hockley. Levelland Hockley reported a loss from operations during fiscal year 2010, and ceased production in January 2011. These losses were partially offset as One Earth Energy, LLC (“One Earth”) was in production for a full year during fiscal year 2010. We expect that future operating results will be based upon annual production of between 100 and 115 million gallons of ethanol, which assumes that One Earth will operate at or near nameplate capacity. However, due to the inherent volatility of the crush spread, we cannot predict the likelihood of future operating results being similar to the fiscal year 2010 results.
We plan to seek and evaluate various investment opportunities including energy related, agricultural or other ventures we believe fit our investment criteria. We can make no assurances that we will be successful in our efforts to find such opportunities.
Additional information regarding our business segments is presented below and in Management’s Discussion and Analysis of Financial Condition and Results of Operations (“MD&A”) in this Form 10-K. See Note 18 of the Notes to the Consolidated Financial Statements for information regarding the net sales and revenues and operating results for each of our business segments for the fiscal years ended January 31, 2011, 2010 and 2009.
Fiscal Year
All references in this report to a particular fiscal year are to REX’s fiscal year ended January 31. For example, “fiscal year 2010” means the period February 1, 2010 to January 31, 2011. We refer to our fiscal year by reference to the year immediately preceding the January 31 fiscal year end date.
Alternative Energy Overview
As part of our ongoing efforts to diversify and increase our earnings, we began investing in the ethanol industry during fiscal year 2006. Our business strategy focuses on partnering with farmer groups, local groups, or farmer-controlled cooperatives to develop and operate ethanol production plants. We seek to identify quality ethanol plant opportunities characterized by strong plant construction partners and plant management, located near adequate feedstock supply with good transportation capabilities or other economically beneficial attributes, and that utilize leading ethanol production technology. Our partnership model generally enables farmer groups to retain local management of the project, while we provide capital and additional business administration experience.
We follow a flexible model for our investments in ethanol plants, taking both minority and majority ownership positions. The form and structure of our investments is tailored to the specific needs and goals of each project and the local farmer group or investor with whom we are partnering. We generally participate in the management of our projects through our membership on the board of managers of the limited liability companies that own the plants.
4
Ethanol Investments
We have invested in five entities as of January 31, 2011, utilizing both equity and debt investments. As of January 31, 2011, all of the entities we are invested in are operating except for Levelland Hockley. The following table is a summary of our ethanol investments at January 31, 2011:
|
|
|
|
|
|
|
|
|
|
|
|
|
Entity |
|
Nameplate |
|
Effective |
|
Effective |
|
|||
|
|
|
|
|
|
|
|
|
|||
|
One Earth Energy, LLC |
|
|
100 |
|
|
74 |
% |
|
74.0 |
|
|
NuGen Energy, LLC |
|
|
100 |
|
|
48 |
% |
|
48.0 |
|
|
Patriot Renewable Fuels, LLC |
|
|
100 |
|
|
23 |
% |
|
23.0 |
|
|
Big River Resources, LLC-W Burlington |
|
|
92 |
|
|
10 |
% |
|
9.2 |
|
|
Big River Resources, LLC-Galva |
|
|
100 |
|
|
10 |
% |
|
10.0 |
|
|
Big River United Energy, LLC |
|
|
100 |
|
|
5 |
% |
|
5.0 |
|
|
Levelland Hockley County Ethanol, LLC |
|
|
40 |
|
|
49 |
% |
|
19.6 |
|
|
|
|
|
|
|
|
|
|
|
|
|
|
Total |
|
|
632 |
|
|
|
|
|
188.8 |
|
One Earth Energy, LLC
On October 30, 2007, we acquired 74% of the outstanding membership units of One Earth Energy, LLC, or One Earth, for $50.8 million. We consolidate One Earth with our financial results and include them in our alternative energy segment. One Earth completed construction in the second quarter of fiscal year 2009 of its ethanol production facility in Gibson City, Illinois. The plant has a nameplate capacity of 100 million gallons of ethanol and 320,000 tons of dried distillers grains (“DDG”) per year.
One Earth commenced production operations late in the second quarter of fiscal year 2009 and began generating revenue in the third quarter of fiscal year 2009.
NuGen Energy, LLC
Effective July 1, 2010, we acquired a 48% equity interest in NuGen Energy, LLC, or NuGen, which operates an ethanol producing facility in Marion, South Dakota with an annual nameplate capacity of 100 million gallons of ethanol and 320,000 tons of DDG. Our investment included $2,410,000 paid at closing to the then sole shareholder of NuGen and $6,805,000 contributed directly to NuGen. An additional $6,451,000 is due based upon cash distributions from NuGen that we are entitled to until such balance is paid (“Contingent Consideration”). We determined that the fair value of the Contingent Consideration, at the acquisition date, was $4,611,000.
We have an option to purchase for $1,138,000, (which is payable in cash, partially based upon cash distributions from NuGen that we are entitled to) additional ownership units from NuGen’s majority shareholder, which, if exercised, would result in us owning 51% of the total outstanding voting and economic interests of NuGen on a fully diluted basis.
Patriot Renewable Fuels, LLC
5
On December 4, 2006, we acquired a 23% ownership interest in Patriot Renewable Fuels, LLC, or Patriot, for $16 million. Patriot commenced production operations in the second quarter of fiscal year 2008. The plant is located in Annawan, Illinois and has a nameplate capacity of 100 million gallons of ethanol and 320,000 tons of DDG per year.
Big River Resources, LLC
We have invested $20 million in Big River Resources, LLC, or Big River, for a 10% ownership interest. Big River is a holding company for several entities including Big River Resources West Burlington, LLC which operates an ethanol plant with a nameplate capacity of 92 million gallons of ethanol and 294,000 tons of DDG per year. This plant is located in West Burlington, Iowa. The facility has been in operation since 2004.
Big River completed construction in the second quarter of fiscal year 2009 of its second plant which has a nameplate capacity of 100 million gallons of ethanol and 320,000 tons of DDG per year. This plant is located in Galva, Illinois.
In August 2009, Big River acquired a 50.5% interest in an ethanol production facility which has a nameplate capacity of 100 million gallons of ethanol and 320,000 tons of DDG per year. The plant is located in Dyersville, Iowa. Reflecting REX’s 10% ownership interest in Big River, REX has an effective 5% ownership interest in this entity.
Big River also operates five agricultural elevators with a storage capacity of 10 million bushels.
Levelland Hockley County Ethanol, LLC
On September 30, 2006, we acquired 47% of the outstanding membership units of Levelland Hockley for $11.5 million. On December 29, 2006, we purchased a $5.0 million convertible secured promissory note from Levelland Hockley. On July 1, 2007, we converted the note into equity and increased our ownership percentage to approximately 56%. On February 20, 2008, we purchased an additional $5.0 million convertible secured promissory note from Levelland Hockley. The balance of this note at January 31, 2011 was $5.2 million, including accrued interest. On January 29, 2009, we agreed to fund up to $2.0 million in the form of a subordinated revolving line of credit with Levelland Hockley and to issue a $1.0 million letter of credit for the benefit of Levelland Hockley. On September 1, 2010, we agreed to increase our line of credit to $4.0 million, inclusive of the $1.0 million letter of credit. We were issued warrants in the amount of 1,298,700 at $3.08 per share in conjunction with the issuance of the line of credit. At January 31, 2011, there was $3.8 million outstanding under the subordinated revolving line of credit.
Levelland Hockley, which is located in Levelland, Texas, commenced production operations in the first quarter of fiscal year 2008. The plant has a nameplate capacity of 40 million gallons of ethanol and 135,000 tons of dried distillers grains (“DDG”) per year.
The plant was shut down in early January 2011 as a result of industry wide low crush margins and the plant’s inability to source grain at affordable prices. On January 31, 2011 we sold 814,000 of our membership units to Levelland Hockley for $1, reducing our ownership interest in Levelland Hockley to 49%. As a result, we no longer have a controlling financial interest in Levelland Hockley, and, therefore, effective January 31, 2011, we deconsolidated Levelland Hockley and began using the equity method of accounting to account for the results of Levelland Hockley. In connection with the deconsolidation, we recorded our remaining non controlling equity interest and our debt investments at fair value. Our estimate of fair value for all of our investments in Levelland Hockley was $0 at January 31, 2011. We recorded a pretax charge of
6
approximately $18.4 million as a result of deconsolidating Levelland Hockley and writing our remaining investments in Levelland Hockley to $0 at January 31, 2011.
Ethanol Industry
Ethanol is a renewable fuel source produced by processing corn and other biomass through a fermentation process that creates combustible alcohol that can be used as an additive or replacement to fossil fuel based gasoline. The majority of ethanol produced in the United States is made from corn because of its wide availability and ease of convertibility from large amounts of carbohydrates into glucose, the key ingredient in producing alcohol that is used in the fermentation process. Ethanol production can also use feedstocks such as grain sorghum, switchgrass, wheat, barley, potatoes and sugarcane as carbohydrate sources. Most ethanol plants have been located near large corn production areas, such as Illinois, Indiana, Iowa, Minnesota, Nebraska, Ohio and South Dakota. Railway access and interstate access are vital for ethanol facilities due to the large amount of demand in the east- and west-coast markets, primarily as a result of the stricter air quality requirements in large parts of those markets, and the limited ethanol production facilities.
According to the Renewable Fuels Association, or RFA, the United States fuel ethanol industry experienced record production of an estimated 13 billion gallons in 2010. As of January 2011, the number of operating ethanol plants increased to 204, up from 54 in 2000 and are located in 29 states with a total capacity of 13.5 billion gallons annually.
On December 19, 2007, the Energy Independence and Security Act of 2007 (the “Energy Act of 2007”) was enacted. The Energy Act of 2007 established new levels of renewable fuel mandates, including two different categories of renewable fuels: conventional biofuels and advanced biofuels. Corn-based ethanol is considered conventional biofuels which was subject to a renewable fuel standard (“RFS”) of at least 12.0 billion gallons per year in 2010, with an expected increase to at least 15.0 billion gallons per year by 2015. Advanced biofuels include ethanol derived from cellulose, hemicellulose or other non-corn starch sources; biodiesel; and other fuels derived from non-corn starch sources. Advanced biofuels RFS levels are set to reach at least 21.0 billion gallons per year, resulting in a total RFS from conventional and advanced biofuels of at least 36.0 billion gallons per year by 2022.
Ethanol Production
The plants we have invested in are designed to use the dry milling method of producing ethanol. In the dry milling process, the entire corn kernel is first ground into flour, which is referred to as “meal,” and processed without separating out the various component parts of the grain. The meal is processed with enzymes, ammonia and water, and then placed in a high-temperature cooker. It is then transferred to fermenters where yeast is added and the conversion of sugar to ethanol begins. After fermentation, the resulting liquid is transferred to distillation columns where the ethanol is separated from the remaining “stillage” for fuel uses. The anhydrous ethanol is then blended with denaturant, such as natural gasoline, to render it undrinkable and thus not subject to beverage alcohol tax. With the starch elements of the corn consumed in the above described process, the principal co-product produced by the dry milling process is dry distillers grains with solubles, or DDGS. DDGS is sold as a protein used in animal feed and recovers a significant portion of the total corn cost.
The Primary Uses of Ethanol
Blend component. Today, much of the ethanol blending in the U.S. is done for the purpose of extending the volume of fuel sold at the gas pump. Blending ethanol allows refiners to produce more fuel from a given
7
barrel of oil. Currently, ethanol is blended into approximately 90% of the gasoline sold in the United States, the majority as E10 (a blend of 10% ethanol and 90% gasoline), according to the RFA. Going forward, the industry is attempting to expand the E-85 market, as well as to raise the federal cap on ethanol blend above the current 10% for most vehicles in use. The U.S. Environmental Protection Agency approved the use of 15% ethanol in gasoline for cars and light duty trucks made in 2007 and later. In January 2011, the EPA expanded this to include cars, pickups and SUV’s made in model years 2001 through 2006. This covers approximately 62% of light duty vehicles on the road. Despite this, it will take time for this measure to be implemented and currently several lawsuits have been filed to stop the expanded measure from moving forward.
Clean air additive. Ethanol is employed by the refining industry as a fuel oxygenate, which when blended with gasoline, allows engines to combust fuel more completely and reduce emissions from motor vehicles. Ethanol contains 35% oxygen, approximately twice that of Methyl Tertiary Butyl Ether, or MTBE, an alternative oxygenate to ethanol, the use of which is being phased out because of environmental and health concerns. The additional oxygen in ethanol results in more complete combustion of the fuel in the engine cylinder. Ethanol is non-toxic, water soluble and quickly biodegradable.
Octane enhancer. Ethanol increases the octane rating of gasoline with which it is blended. As such, ethanol is used by gasoline suppliers as an octane enhancer both for producing regular grade gasoline from lower octane blending stocks and for upgrading regular gasoline to premium grades.
Legislation
The United States ethanol industry is highly dependent upon federal and state legislation. See Item 1A. Risk Factors for a discussion of legislation affecting the U.S. ethanol industry.
Synthetic Fuel Partnerships
We had invested in three limited partnerships which owned facilities producing synthetic fuel. The partnerships earned federal income tax credits under Section 29/45K of the Internal Revenue Code based upon the tonnage and content of solid synthetic fuel produced and sold to unrelated parties. The Section 29/45K tax credit program expired on December 31, 2007. As such, we do not expect to receive additional income from these investments except for the possibility of an additional payment on a facility formerly located in Gillette, Wyoming. Based upon the modified terms of a sales agreement we are currently not able to predict the likelihood and timing of payments for production from September 30, 2006 to December 31, 2007 for this facility. We expect the payments, if any, to be made within the next year. We have not recognized this income and will recognize income, if any, upon receipt of payment or upon our ability to reasonably assure ourselves of the timing and collectability of payment.
See Item 7, Management’s Discussion and Analysis of Financial Condition and Results of Operations and Notes 4 and 17 of the Notes to the Consolidated Financial Statements for further discussions.
Real Estate Operations
At January 31, 2011, we had lease agreements, as landlord, for all or parts of eight owned former retail stores (88,000 square feet leased and 10,000 square feet vacant). We have 22 owned former retail stores (281,000 square feet), that are vacant at January 31, 2011. We are marketing these vacant properties to lease or sell. In addition, one former distribution center is partially leased (266,000 square feet), partially occupied by our corporate office personnel (10,000 square feet) and partially vacant (190,000 square feet).
8
A typical lease agreement has an initial term of five to twenty years with renewal options. Most of our lessees are responsible for a portion of maintenance, taxes and other executory costs. We require our lessees to maintain adequate levels of insurance. We recognized lease revenue of approximately $1,285,000 and $913,000 during fiscal years 2010 and 2009, respectively.
Retail
When we operated retail stores, we offered extended service contracts to our customers which typically provided, inclusive of manufacturers’ warranties, one to five years of warranty coverage. We plan to manage and administer these contracts and to recognize the associated income and expenses, including the cost to repair or replace covered products, over the remaining life of the contracts. We have classified as discontinued operations all retail related activities, including those activities associated with extended service plans, in the Consolidated Statements of Operations for all periods presented.
Facilities
At January 31, 2011, we owned eight former retail store properties that were leased to outside, unrelated parties. Of the eight leased properties, one of the properties is only partially leased. There were also 22 vacant former retail store properties that we were attempting to either lease or sell. In addition, we have one former distribution center that is partially leased, partially occupied by our corporate office and partially vacant.
Employees
At January 31, 2011, we had eight employees supporting our corporate functions. None of our employees are represented by a labor union. We expect this employment to remain relatively stable at its current level as we have completed our exit from the retail business.
At January 31, 2011, One Earth had 50 employees.
We consider our relationship with our employees to be good.
Service Marks
We have registered our service mark “REX”, and we own an application to register the mark “Farmers Energy”, with the United States Patent and Trademark Office. We are not aware of any adverse claims concerning our service marks.
|
|
|
|
Item 1A. |
Risk Factors |
We encourage you to carefully consider the risks described below and other information contained in this report when considering an investment decision in REX common stock. Any of the events discussed in the risk factors below may occur. If one or more of these events do occur, our results of operations, financial condition or cash flows could be materially adversely affected. In this instance, the trading price of REX stock could decline, and investors might lose all or part of their investment.
We have concentrations of cash deposits at financial institutions that exceed federal insurance limits.
We generally have cash deposits that exceed federal insurance limits. Should the financial institutions we deposit our cash at experience insolvency or other financial difficulty, our access to cash deposits could be limited. In extreme cases, we could lose our cash deposits entirely. This would negatively impact our liquidity and results of operations.
9
The current interest rate environment has resulted in lower yields on our excess cash.
We have experienced lower yields on our excess cash compared to historical yields. Should the present economic conditions result in a sustained period of historically low interest rates, our interest income would be negatively impacted.
Risks Related to our Synthetic Fuel Investments and Income Tax Benefits
We face synthetic fuel risks as future IRS audits may result in the disallowance of previously recognized tax credits.
We have recognized investment income of approximately $53.9 million from the sales of our partnership interests from years that the partnerships have not been audited by the Internal Revenue Service (IRS). Should the tax credits be denied on any future audit and we fail to prevail through the IRS or the legal process, there could be significant refunds of previously recognized income with a significant adverse impact on earnings and cash flows.
The production and sale of synthetic fuel qualified for Section 29/45K tax credits if certain requirements were satisfied, including a requirement that the synthetic fuel differs significantly in chemical composition from the coal used to produce the synthetic fuel and that the fuel was produced from a facility placed in service before July 1, 1998.
We may not be able to generate sufficient taxable income to realize our deferred tax assets.
We have approximately $11.0 million of net deferred tax assets recorded on our consolidated financial statements. Should future results of operations or other factors cause us to determine that it is unlikely that we will generate sufficient taxable income to fully utilize our deferred tax assets; we would then be required to establish a valuation allowance against such deferred tax assets. We would increase our income tax expense by the amount of the tax benefit we do not expect to realize. This would reduce our net income and could have a material adverse effect on our results of operations and our financial position.
Risks Related to our Alternative Energy Business
Certain of our ethanol investments are subject to the risks of a development stage business which could adversely affect returns on our ethanol investment and our results of operations.
We do not have long term experience investing in the ethanol industry. We entered into our first agreement to invest in an ethanol plant in November 2005. At January 31, 2011, we were invested in five entities that own and operate seven ethanol production facilities. One facility has been in production since 2004, but the remaining facilities all became operational or were acquired in fiscal year 2008 or later. Our ethanol investments have been managed by our Chief Executive Officer, our Chief Operating Officer and our Chief Financial Officer. We do not otherwise have a dedicated ethanol development or management staff. As a consequence, our ethanol investments are subject to many of the risks associated with a development stage company, including an unproven business model, a lack of operating history and an undeveloped operating structure. These development stage risks could result in our making investments in ethanol plants that perform substantially below our expectations, which would adversely affect our results of operations and financial condition.
10
If cash flow from operations of our ethanol plants is not sufficient to service debt, the plants could fail and we could lose our entire investment.
Our ethanol plants financed approximately 60% of plant construction cost with debt. The debt typically has a balloon payment due after five years. The ability of each company owning the plant to repay borrowings incurred will depend upon the plant’s financial and operating performance. The cash flows and capital resources of an ethanol plant may be insufficient to repay its debt obligations. If a plant cannot service its debt, it may be forced to reduce or delay capital expenditures, sell assets, restructure its indebtedness or seek additional capital. If unable to do so, the value of our investment could decline significantly.
The institutional senior lenders to the companies which own and operate our ethanol plants hold liens on the plant’s assets. If a company fails to make its debt service payments, the senior lender will have the right to repossess the plant’s assets in addition to other remedies, which are superior to our rights as an equity investor or subordinated lender. Such action could have a material adverse impact on our investment in the ethanol plant.
We operate in a capital intensive industry. Limitations to external financing could adversely affect our financial performance.
In general, continued volatility in the capital markets has resulted in reduced availability of capital for the ethanol industry. We may need to incur additional financing to fund growth of our business or in times of increasing liquidity requirements (such as increases in raw material costs). Any delays to obtain additional financing, or our inability to do so, could have a material adverse impact on our financial results.
The financial returns on our ethanol investments are highly dependent on commodity prices, which are subject to significant volatility and uncertainty, and the availability of supplies, so our results could fluctuate substantially.
The financial returns on our ethanol investments are substantially dependent on commodity prices, especially prices for corn or other feedstock, natural gas, ethanol and unleaded gasoline. As a result of the volatility of the prices for these items, the returns may fluctuate substantially and our investments could experience periods of declining prices for their products and increasing costs for their raw materials, which could result in operating losses at our ethanol plants.
Our returns on ethanol investments are highly sensitive to grain prices. Corn or sorghum are the principal raw materials our ethanol plants use to produce ethanol and co-products. As a result, changes in the price of corn or sorghum can significantly affect their businesses. Rising corn or sorghum prices result in higher costs of ethanol and co-products. Because ethanol competes with non-corn-based fuels, our ethanol plants generally will be unable to pass along increased grain costs to their customers. At certain levels, grain prices may make ethanol uneconomical to produce.
The price of corn and sorghum is influenced by weather conditions and other factors affecting crop yields, transportation costs, farmer planting decisions, exports, the value of the U.S. dollar and general economic, market and regulatory factors. These factors include government policies and subsidies with respect to agriculture and international trade, and global and local demand and supply. The significance and relative effect of these factors on the price of corn and sorghum is difficult to predict. Any event that tends to negatively affect the supply of corn or sorghum, such as adverse weather or crop disease, could increase corn and sorghum prices and potentially harm the business of our ethanol plants. Increasing domestic ethanol capacity could boost the demand for corn and sorghum and result in increased corn or sorghum prices. Our ethanol plants may also have difficulty, from time to time, in physically sourcing corn or sorghum on
11
economical terms due to supply shortages. Such a shortage could require our ethanol plants to suspend operations which would have a material adverse effect on the financial returns on our ethanol investments.
The spread between ethanol and corn and sorghum prices can vary significantly. The gross margin at our ethanol plants depends principally on the spread between ethanol and corn or sorghum prices. Fluctuations in the spread are likely to continue to occur. A sustained narrow spread or any further reduction in the spread between ethanol and corn prices, whether as a result of sustained high or increased corn prices or sustained low or decreased ethanol prices, would adversely affect the results of operations at our ethanol plants.
The market for natural gas is subject to market conditions that create uncertainty in the price and availability of the natural gas that our ethanol plants use in their manufacturing process. Our ethanol plants rely upon third parties for their supply of natural gas, which is consumed as fuel in the manufacture of ethanol. The prices for and availability of natural gas are subject to volatile market conditions. These market conditions often are affected by factors beyond the ethanol plants’ control, such as weather conditions, overall economic conditions and foreign and domestic governmental regulation and relations. Significant disruptions in the supply of natural gas could impair the ethanol plants’ ability to economically manufacture ethanol for their customers. Furthermore, increases in natural gas prices or changes in our natural gas costs relative to natural gas costs paid by competitors may adversely affect results of operations and financial position at our ethanol plants.
Fluctuations in the selling price and production costs of gasoline may reduce profit margins at our ethanol plants. Ethanol is marketed as a fuel additive to reduce vehicle emissions from gasoline, as an octane enhancer to improve the octane rating of gasoline with which it is blended and, to a lesser extent, as a gasoline substitute. As a result, ethanol prices are influenced by the supply and demand for gasoline and our ethanol plants’ results of operations and financial position may be materially adversely affected if gasoline demand or price decreases.
New plants under construction or decreases in demand for ethanol may result in excess production capacity in the ethanol industry, which may cause the price of ethanol and/or distillers grains to decrease.
According to the Renewable Fuels Association, or RFA, domestic ethanol production nameplate capacity has increased to approximately 14.1 billion gallons per year at January 2011. The RFA estimates that, as of January 2011, approximately 560 million gallons per year of additional production capacity is under construction. Excess capacity in the ethanol industry would have an adverse effect on the results of our ethanol investments. In a manufacturing industry with excess capacity, producers have an incentive to manufacture additional products for so long as the price exceeds the marginal cost of production (i.e., the cost of producing only the next unit, without regard for interest, overhead or fixed costs). This incentive could result in the reduction of the market price of ethanol to a level that is inadequate to generate sufficient cash flow to cover costs.
Excess capacity may also result from decreases in the demand for ethanol, which could result from a number of factors, including, but not limited to, regulatory developments and reduced U.S. gasoline consumption. Reduced gasoline consumption could occur as a result of increased prices for gasoline or crude oil, which could cause businesses and consumers to reduce driving or acquire vehicles with more favorable gasoline mileage or acquire hybrid vehicles.
In addition, because ethanol production produces distillers grains as a co-product, increased ethanol production will also lead to increased supplies of distillers grains. An increase in the supply of distillers
12
grains, without corresponding increases in demand, could lead to lower prices or an inability to sell our ethanol plants’ distillers grains production. A decline in the price of distillers grains or the distillers grains market generally could have a material adverse effect on the results of our ethanol investments.
We depend on our partners to operate our ethanol investments.
Our investments currently represent both majority and minority equity positions, and day-to-day operating control of each plant generally remains with the local farmers’ cooperative or investor group that has promoted the plant. We may not have the ability to directly modify the operations of the plants in response to changes in the business environment or in response to any deficiencies in local operations of the plants. In addition, local plant operators, who also represent the primary suppliers of corn and other crops to the plants, may have interests, such as the price and sourcing of corn and other crops, that may differ from our interest, which is based solely on the operating profit of the plant. The limitations on our ability to control day-to-day plant operations could adversely affect plant results of operations.
We may not successfully acquire or develop additional ethanol investments.
The growth of our ethanol business depends on our ability to identify and develop new ethanol investments. Our ethanol development strategy depends on referrals, and introductions, to new investment opportunities from industry participants, such as ethanol plant builders, financial institutions, marketing agents and others. We must continue to maintain favorable relationships with these industry participants, and a material disruption in these sources of referrals would adversely affect our ability to expand our ethanol investments.
Any expansion strategy will depend on prevailing market conditions for the price of ethanol and the costs of corn and natural gas and the expectations of future market conditions. There is increasing competition for suitable sites for ethanol plants. Even if suitable sites or opportunities are identified, we may not be able to secure the services and products from contractors, engineering firms, construction firms and equipment suppliers necessary to build or expand ethanol plants on a timely basis or on acceptable economic terms. Construction costs associated with expansion may increase to levels that would make a new plant too expensive to complete or unprofitable to operate. Additional financing may also be necessary to implement any expansion strategy, which may not be accessible or available on acceptable terms.
Our ethanol plants may be adversely affected by technological advances and efforts to anticipate and employ such technological advances may prove unsuccessful.
The development and implementation of new technologies may result in a significant reduction in the costs of ethanol production. For instance, any technological advances in the efficiency or cost to produce ethanol from inexpensive, cellulosic sources such as wheat, oat or barley straw could have an adverse effect on our ethanol plants, because those facilities are designed to produce ethanol from corn, which is, by comparison, a raw material with other high value uses. We cannot predict when new technologies may become available, the rate of acceptance of new technologies by competitors or the costs associated with new technologies. In addition, advances in the development of alternatives to ethanol could significantly reduce demand for or eliminate the need for ethanol.
Any advances in technology which require significant unanticipated capital expenditures to remain competitive or which reduce demand or prices for ethanol would have a material adverse effect on the results of our ethanol investments.
In addition, alternative fuels, additives and oxygenates are continually under development. Alternative fuel additives that can replace ethanol may be developed, which may decrease the demand for ethanol. It is also
13
possible that technological advances in engine and exhaust system design and performance could reduce the use of oxygenates, which would lower the demand for ethanol, and the results of our ethanol investments may be materially adversely affected.
The U.S. ethanol industry is highly dependent upon a myriad of federal and state legislation and regulation and any changes in legislation or regulation could materially and adversely affect our results of operations and financial position.
The elimination or significant reduction of the blender’s credit could have a material adverse effect on the results of our ethanol investments. The cost of production of ethanol is made significantly more competitive with regular gasoline by federal tax incentives. The American Jobs Creation Act of 2004 created the Volumetric Ethanol Tax Credit, referred to as the “blender’s credit.” This credit currently allows gasoline distributors who blend ethanol with gasoline to receive a federal excise tax credit of $0.45 per gallon of pure ethanol, or $0.045 per gallon if blended with 10% ethanol (E10), and $0.3825 per gallon if blended with 85% ethanol (E85). The $0.45 per gallon incentive for ethanol was scheduled to expire on December 31, 2010 but was extended to December 31, 2011. The blender’s credit could be eliminated or reduced at any time through an act of Congress and may not be renewed in 2011 or may be renewed on different terms. In addition, the blender’s credit, as well as other federal and state programs benefiting ethanol (such as tariffs), generally are subject to U.S. government obligations under international trade agreements, including those under the World Trade Organization Agreement on Subsidies and Countervailing Measures, and might be the subject of challenges thereunder, in whole or in part.
Ethanol can be imported into the U.S. duty-free from some countries, which may undermine the ethanol industry in the U.S. Imported ethanol is generally subject to a $0.54 per gallon tariff that was designed to offset the $0.45 per gallon ethanol incentive that is available under the federal excise tax incentive program for refineries that blend ethanol in their fuel. A special exemption from the tariff, known as the Caribbean Basin Initiative, exists for ethanol imported from 24 countries in Central America and the Caribbean Islands, which is limited to a total of 7% of U.S. production per year. Imports from the exempted countries may increase as a result of new plants under development. Since production costs for ethanol in these countries are estimated to be significantly less than what they are in the U.S., the duty-free import of ethanol through the countries exempted from the tariff may negatively affect the demand for domestic ethanol and the price at which our ethanol plants sell ethanol. Any changes in the tariff or exemption from the tariff could have a material adverse effect on the results of our ethanol investments. In addition, the North America Free Trade Agreement, or NAFTA, allows Canada and Mexico to export ethanol to the United States duty-free.
The effect of the renewable fuel standard (“RFS”) program in the Energy Independence and Security Act of 2007 (the “2007 Act”) is uncertain. The mandated minimum level of use of renewable fuels in the RFS under the 2007 Act will increase from 12.95 billion gallons per year in 2010 to 36 billion gallons per year in 2022. The RFS mandate level for conventional biofuels, which includes corn-based ethanol, for 2011 is 12.6 billion gallons. This requirement progressively increases to 15 billion gallons by 2015 and remains at that level through 2022. The 2007 Act also requires the increased use of “advanced” biofuels, which are alternative biofuels produced without using corn starch such as cellulosic ethanol and biomass-based diesel, with 21 billion gallons of the mandated 36 billion gallons of renewable fuel required to come from advanced biofuels by 2022. Required RFS volumes for both general and advanced renewable fuels in years to follow 2022 will be determined by a governmental administrator, in coordination with the U.S. Department of Energy and U.S. Department of Agriculture. Increased competition from other types of biofuels could have a material adverse effect on the results of our ethanol investments.
The RFS program and the 2007 Act also include provisions allowing “credits” to be granted to fuel producers who blend in their fuel more than the required percentage of renewable fuels in a given year.
14
These credits may be used in subsequent years to satisfy RFS production percentage and volume standards and may be traded to other parties. The accumulation of excess credits could further reduce the impact of the RFS mandate schedule and result in a lower ethanol price or could result in greater fluctuations in demand for ethanol from year to year, both of which could have a material adverse effect on the results of our ethanol investments.
Waivers of the RFS minimum levels of renewable fuels included in gasoline could have a material adverse effect on the results of our ethanol investments. Under the RFS as passed as part of the Energy Policy Act of 2005, the U.S. Environmental Protection Agency, in consultation with the Secretary of Agriculture and the Secretary of Energy, may waive the renewable fuels mandate with respect to one or more states if the Administrator of the U.S. Environmental Protection Agency, or EPA, determines upon the petition of one or more states that implementing the requirements would severely harm the economy or the environment of a state, a region or the U.S., or that there is inadequate supply to meet the requirement. In addition, the 2007 Act allows any other person subject to the requirements of the RFS or the EPA Administrator to file a petition for such a waiver. Any waiver of the RFS with respect to one or more states could adversely offset demand for ethanol and could have a material adverse effect on the results of our ethanol investments.
Changes in corporate average fuel economy standards could adversely impact ethanol prices. Flexible fuel vehicles receive preferential treatment in meeting federally mandated corporate average fuel economy (“CAFE”) standards for automobiles manufactured by car makers. High blend ethanol fuels such as E85 result in lower fuel efficiencies. Absent the CAFE preferences, car makers would not likely build flexible-fuel vehicles. Any change in CAFE preferences could reduce the growth of E85 markets and result in lower ethanol prices.
Various studies have criticized the efficiency of ethanol, in general, and corn-based ethanol in particular, which could lead to the reduction or repeal of incentives and tariffs that promote the use and domestic production of ethanol or otherwise negatively impact public perception and acceptance of ethanol as an alternative fuel.
Although many trade groups, academics and governmental agencies have supported ethanol as a fuel additive that promotes a cleaner environment, others have criticized ethanol production as consuming considerably more energy and emitting more greenhouse gases than other biofuels and as potentially depleting water resources. Other studies have suggested that corn-based ethanol is less efficient than ethanol produced from switchgrass or wheat grain and that it negatively impacts consumers by causing prices for dairy, meat and other foodstuffs from livestock that consume corn to increase. If these views gain acceptance, support for existing measures promoting use and domestic production of corn-based ethanol could decline, leading to reduction or repeal of these measures. These views could also negatively impact public perception of the ethanol industry and acceptance of ethanol as an alternative fuel.
Federal support of cellulosic ethanol may result in reduced incentives to corn-derived ethanol producers.
The American Recovery and Reinvestment Act of 2009 and the Energy Independence and Security Act of 2007 provide funding opportunities in support of cellulosic ethanol obtained from biomass sources such as switchgrass and poplar trees. The amended RFS mandates an increasing level of production of non-corn derived biofuels. These federal policies may suggest a long-term political preference for cellulosic processes using alternative feedstocks such as switchgrass, silage or wood chips. Cellulosic ethanol has a smaller carbon footprint and is unlikely to divert foodstuff from the market. Several cellulosic ethanol plants are under development and there is a risk that cellulosic ethanol could displace corn ethanol. Our plants are
15
designed as single-feedstock facilities, located in corn production areas with limited alternative feedstock nearby, and would require significant additional investment to convert to the production of cellulosic ethanol. The adoption of cellulosic ethanol as the preferred form of ethanol could have a significant adverse effect on our ethanol business.
Our ethanol business is affected by environmental and other regulations which could impede or prohibit our ability to successfully operate our plants.
Our ethanol production facilities are subject to extensive air, water and other environmental regulations. We have had to obtain numerous permits to construct and operate our plants. Regulatory agencies could impose conditions or other restrictions in the permits that are detrimental or which increase our costs. More stringent federal or state environmental regulations could be adopted which could significantly increase our operating costs or require us to expend considerable resources.
Our ethanol plants emit various airborne pollutants as by-products of the ethanol production process, including carbon dioxide. In 2007, the U.S. Supreme Court classified carbon dioxide as an air pollutant under the Clean Air Act in a case seeking to require the EPA to regulate carbon dioxide in vehicle emissions. In February 2010, the EPA released its final regulations on the Renewable Fuel Standard program (RFS2). We believe our plants are grandfathered at their current operating capacity, but plant expansion will need to meet a 20% threshold reduction in greenhouse gas (GHG) emissions from a 2005 baseline measurement to produce ethanol eligible for the RFS2 mandate. Additionally, legislation is pending in Congress on a comprehensive carbon dioxide regulatory scheme, such as a carbon tax or cap-and-trade system. To expand our plant capacity, we may be required to obtain additional permits, install advanced technology such as corn oil extraction, or reduce drying of certain amounts of distillers grains.
The California Air Resources Board has adopted a Low Carbon Fuel Standard requiring a 10% reduction in GHG emissions from transportation fuels by 2020. An Indirect Land Use Charge is included in this lifecycle GHG emission calculation. While this standard is being challenged by lawsuits, implementation of such a standard could have an adverse impact on our market for corn-based ethanol if determined that in California corn-based ethanol fails to achieve lifecycle GHG emission reductions.
Our revenue from the sale of distillers grains depends upon its continued market acceptance as an animal feed.
Distillers grains is a co-product from the fermentation of corn to produce ethanol. Antibiotics may be used during the fermentation process to control bacterial contamination; therefore antibiotics may be present in small quantities in distillers grains marketed as animal feed. The U. S. Food and Drug Administration’s, or FDA’s, Center for Veterinary Medicine has expressed concern about potential animal and human health hazards from the use of distillers grains as an animal feed due to the possibility of antibiotic residues. If the public became concerned about the impact of distillers grains in the food supply or as an acceptable animal feed, the market for distillers grains could be negatively impacted, which would have a negative impact on our results of operations.
The price of distillers grains may decline as a result of China’s antidumping investigation of distillers grains originating in the United Sates.
Estimates indicate that as much as 10 to 15 percent of the distiller grains produced in the United States will be exported to China in the coming year. However, this export market may be jeopardized if the Chinese government imposes trade barriers in response to the outcome of an antidumping investigation currently being conducted by the Chinese Ministry of Commerce. If producers and exporters of distiller grains are
16
subjected to trade barriers when selling distiller grains to Chinese customers, there may be a reduction in the price of distillers grains in the United States. Declines in the price we receive for our distillers grains could lead to decreased revenues and may result in our inability to operate the ethanol plant profitably.
We face significant competition in the ethanol industry.
We face significant competition for new ethanol investment opportunities. There are varied enterprises seeking to participate in the ethanol industry. Some enterprises provide financial and management support similar to our business model. Other enterprises seek to acquire or develop plants which they will directly own and operate. Many of our competitors are larger and have greater financial resources and name recognition than we do. We must compete for investment opportunities based on our strategy of supporting and enhancing local development of ethanol plant opportunities. We may not be successful in competing for investment opportunities based on our strategy.
The ethanol industry is primarily comprised of smaller entities that engage exclusively in ethanol production and large integrated grain companies that produce ethanol along with their base grain business. Recently, several large oil companies have entered the ethanol production market. If these companies increase their ethanol plant ownership or other oil companies seek to engage in direct ethanol production, there would be less of a need to purchase ethanol from independent producers like our ethanol plants.
There is a consolidation trend in the ethanol industry, partly a result of companies recently seeking protection under the United States Bankruptcy Code. As a result, firms are growing in size and scope. Larger firms offer efficiencies and economies of scale, resulting in lower costs of production. In addition, plants currently being or recently sold as part of a bankruptcy proceeding may have significantly lower costs than our ethanol plants. Absent significant growth and diversification, our ethanol plants may not be able to operate profitably in a more competitive environment. No assurance can be given that our ethanol plants will be able to compete successfully or that competition from larger companies with greater financial resources will not have a materially adverse affect on the results of our ethanol investments.
We are exposed to credit risk from our sales of ethanol and distillers grains to customers.
The inability of a customer to make payments to us for our accounts receivable may cause us to experience losses and may adversely impact our liquidity and our ability to make our payments when due.
We may not be able to hire and retain qualified personnel to operate our ethanol plants.
Our ability to attract and retain competent personnel has a significant impact on operating efficiencies and plant profitability. Competition for key plant employees in the ethanol industry can be intense, and we may not be able to attract and retain qualified employees. Failure to do so could have a negative impact on our financial results at individual plants.
Our plants depend on an uninterrupted supply of energy and water to operate. Unforeseen plant shutdowns could harm our business.
Our plants require a significant and uninterrupted supply of natural gas, electricity and water to operate. We generally rely on third parties to provide these resources. If there is an interruption in the supply of energy or water for any reason, such as supply, delivery or mechanical problems and we are unable to secure an adequate alternative supply to sustain plant operations, we may be required to stop production. A production halt for an extended period of time could result in material losses.
17
Potential business disruption from factors outside our control, including natural disasters, severe weather conditions, accidents, strikes, unexpected equipment failures and unforeseen plant shutdowns, could adversely affect our cash flow and operating results.
The debt agreements for the ethanol plants contain restrictive financial and performance covenants.
Our subsidiaries that operate ethanol plants (“Ethanol subsidiaries”) have debt agreements that contain covenants with several financial and performance restrictions. A breach of any of these covenants could result in a default under the applicable agreement. If a default were to occur, the Ethanol subsidiary would likely seek a waiver of that default, attempt to reset the covenant, or refinance the instrument and accompanying obligations. If the Ethanol subsidiary was unable to obtain this relief, the default could result in the acceleration of the total due related to that debt obligation. If a default were to occur, the Ethanol subsidiary may not be able to pay its debts or borrow sufficient funds to refinance them. In addition, certain lease agreements could also be in default if a default of the debt agreement occurs. Any of these events, if they occur, could materially adversely affect our results of operations, financial condition, and cash flows.
The debt agreements for the ethanol plants limit, or otherwise restrict the amount of dividends and other payments the ethanol operating subsidiaries can transfer to their members.
We are dependent on dividends from our ethanol subsidiaries to generate cash flow. Presently, all of our ethanol subsidiaries have debt agreements that limit payments to members. Therefore, these companies cannot distribute all of the cash they generate to their members. Furthermore, we may not be able to use the excess cash flow from one subsidiary to fund corporate needs or needs of another operating ethanol subsidiary.
Changes in interest rates could have a material adverse effect on the results of our ethanol investments.
One Earth and Patriot have interest rate swaps at January 31, 2011 that, in essence, fix the interest rate on a portion of their variable rate debt. During fiscal years 2010, 2009 and 2008, we recognized losses on these swaps. Further reductions in interest rates could increase the liability position of the interest rate swaps, requiring us to record additional expense which could be material. The liability for these interest rate swaps could also result in a default of the term loan agreements’ restrictive financial covenants.
In addition, increases in interest rates could have a negative impact on results of operations as all of the debt our ethanol plants have is variable rate debt. Furthermore, the interest rate swaps do not fix the interest rate on the entire portion of the related debt.
Risks Related to the Wind Down and Exit of our Retail business and Risks Related to our Real Estate Segment.
Our future costs associated with administering extended product service contracts may result in higher than expected costs.
We will continue to administer extended product service contracts that have contractual maturities over the next three years. To the extent we do not have products or an adequate repair service network to satisfy warranty claims, we may incur material costs as we would be required to refund cash to customers for warranted products.
We have a significant amount of vacant warehouse and retail space after the completion of the wind down of our retail business.
18
At January 31, 2011, we own one distribution facility and 23 former retail store properties comprising approximately 492,000 square feet that are completely or partially vacant. We are currently marketing these facilities for lease or sale. We may not be able to successfully lease or sell these properties which could result in lost opportunities for revenue or future impairment charges related to the carrying value of the associated assets. We also have costs related to the vacant properties such as property taxes and utilities that we would have to bear without any revenue from such properties.
|
|
|
|
Item 1B. |
Unresolved Staff Comments |
None.
|
|
|
|
Item 2. |
Properties |
The information required by this Item 2 is set forth in Item 1 of this report under “Ethanol Investments”, “Real Estate Operations” and “Facilities” and is incorporated herein by reference.
|
|
|
|
Item 3. |
Legal Proceedings |
We are involved in various legal proceedings incidental to the conduct of our business. We believe that these proceedings will not have a material adverse effect on our financial condition or results of operations.
Executive Officers of the Company
Set forth below is certain information about each of our executive officers.
|
|
|
|
|
|
|
Name |
|
Age |
|
Position |
|
|
|
|
|
|
|
|
|
|
|
|
|
Stuart Rose |
|
56 |
|
Chairman of the Board and Chief Executive Officer* |
|
Douglas Bruggeman |
|
50 |
|
Vice President-Finance, Chief Financial Officer and Treasurer |
|
Edward Kress |
|
61 |
|
Secretary* |
|
Zafar Rizvi |
|
61 |
|
President and Chief Operating Officer |
*Also serves as a director.
Stuart Rose has been our Chairman of the Board and Chief Executive Officer since our incorporation in 1984 as a holding company to succeed to the ownership of Rex Radio and Television, Inc., Kelly & Cohen Appliances, Inc. and Stereo Town, Inc. Prior to 1984, Mr. Rose was Chairman of the Board and Chief Executive Officer of Rex Radio and Television, Inc., which he founded in 1980 to acquire the stock of a corporation which operated four retail stores.
Douglas Bruggeman has been our Vice President–Finance and Treasurer since 1989 and was elected Chief Financial Officer in 2003. From 1987 to 1989, Mr. Bruggeman was our Manager of Corporate Accounting. Mr. Bruggeman was employed with the accounting firm of Ernst & Young prior to joining us in 1986.
Edward Kress has been our Secretary since 1984 and a director since 1985. Mr. Kress has been a partner of the law firm of Dinsmore & Shohl LLP (formerly Chernesky, Heyman & Kress P.L.L.), our legal counsel, since 1988. Mr. Kress has practiced law in Dayton, Ohio since 1974.
Zafar Rizvi was elected President and Chief Operating Officer in 2010. Previously, he had been our Vice President, and has been President of Farmers Energy Incorporated, our alternative energy investment
19
subsidiary, since 2006. From 1991 to 2006, Mr. Rizvi was our Vice President – Loss Prevention. From 1986 to 1991, Mr. Rizvi was employed in the video retailing industry in a variety of management positions.
|
|
|
|
Item 4. |
Removed and Reserved |
PART II
Item 5. Market for Registrant’s Common Equity, Related Stockholder Matters and Issuer Purchases of Equity Securities
SHAREHOLDER INFORMATION
Common Share Information and Quarterly Share Prices
Our common stock is traded on the New York Stock Exchange under the symbol REX.
|
|
|
|
|
|
|
|
|
|
Fiscal Quarter ended |
|
High |
|
Low |
|
||
|
|
|
|
|
|
|
||
|
April 30, 2009 |
|
$ |
13.50 |
|
$ |
5.52 |
|
|
July 31, 2009 |
|
|
12.99 |
|
|
9.36 |
|
|
October 31, 2009 |
|
|
13.02 |
|
|
9.75 |
|
|
January 31, 2010 |
|
|
15.41 |
|
|
11.89 |
|
|
|
|
|
|
|
|
|
|
|
April 30, 2010 |
|
$ |
18.40 |
|
$ |
14.87 |
|
|
July 31, 2010 |
|
|
19.30 |
|
|
15.19 |
|
|
October 31, 2010 |
|
|
16.83 |
|
|
12.96 |
|
|
January 31, 2011 |
|
|
17.23 |
|
|
14.84 |
|
As of April 14, 2011, there were 119 holders of record of our common stock, including shares held in nominee or street name by brokers.
Dividend Policy
We did not pay dividends in the current or prior years. We currently have no restrictions on the payment of dividends. Our ethanol subsidiaries have certain restrictions on their ability to pay us dividends.
Issuer Purchases of Equity Securities
|
|
|
|
|
|
|
|
|
|
|
|
|
Period |
|
Total Number |
|
Average Price |
|
Total Number of |
|
Maximum Number |
|
|
|
|
|
|
|
|
|
|
|
|
|
|
|
November 1-30, 2010 |
|
— |
|
$ |
— |
|
— |
|
568,044 |
|
|
December 1-31, 2010 |
|
100,000 |
|
$ |
15.63 |
|
100,000 |
|
468,044 |
|
|
January 1-31, 2011 |
|
— |
|
$ |
— |
|
— |
|
468,044 |
|
|
|
|
|
|
|
|
|
|
|
|
|
|
Total |
|
100,000 |
|
$ |
15.63 |
|
100,000 |
|
468,044 |
|
|
|
|
|
|
|
|
|
|
|
|
|
20
|
|
|
|
|
|
(1) |
On October 7, 2010, our Board of Directors increased our share repurchase authorization by an additional 500,000 shares. At January 31, 2011, a total of 468,044 shares remained available to purchase under this authorization. |
Performance Graph
The following graph compares the yearly percentage change in the cumulative total shareholder return on our Common Stock against the cumulative total return of the S&P 500 Stock Index and a peer group comprised of selected publicly traded consumer ethanol producers (*) for the period commencing January 31, 2006 and ended January 31, 2011. The graph assumes an investment of $100 in our Common Stock and each index on January 31, 2006 and reinvestment of all dividends.
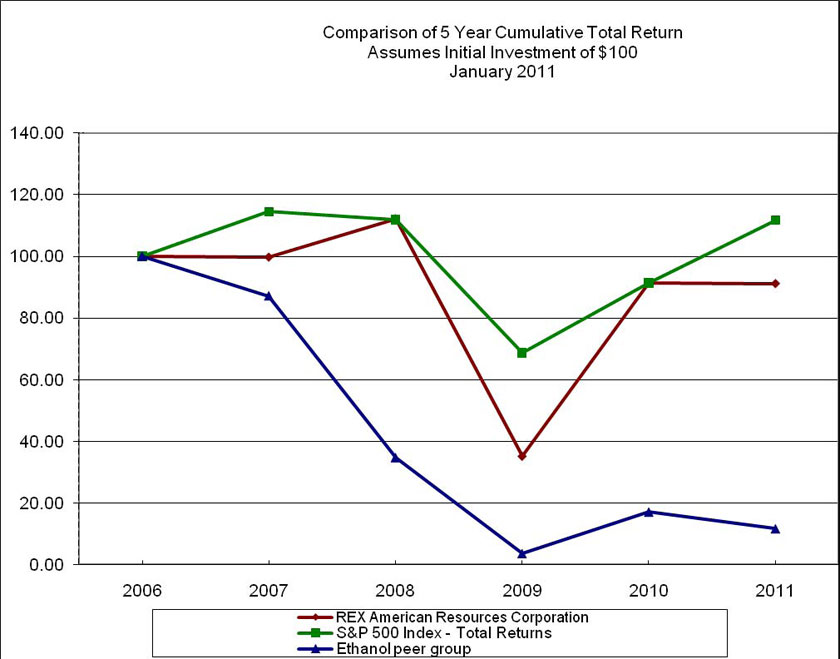
* The peer group (and the month the companies went public) is comprised of Pacific Ethanol, Inc. (March 2005), BioFuel Energy Corp. (June 2007) and Green Plains Renewable Energy, Inc. (March 2006). Returns for the peer group are included upon a full year’s return being available as of January 31.
|
|
|
|
Item 6. |
Selected Financial Data |
The following statements of operations and balance sheet data have been derived from our consolidated financial statements and should be read in conjunction with Management’s Discussion and Analysis of
21
Financial Condition and Results of Operations and the Consolidated Financial Statements and related Notes. Prior period amounts applicable to the statement of operations have been adjusted to recognize the reclassification of the results of our former retail segment and certain real estate assets to discontinued operations as a result of our exit of the retail business and real estate sales. See Item 7. Management’s Discussion and Analysis of Financial Condition and Results of Operations for a discussion of income from ethanol investments, derivative financial instruments, gain on sale of real estate, loss and impairment charges related to deconsolidation and long-term debt. These items have fluctuated significantly in recent years and may affect comparability of years.
Five Year Financial Summary
(In Thousands, Except Per Share Amounts)
|
|
|
|
|
|
|
|
|
|
|
|
|
|
|
|
|
|
|
Years Ended January 31, |
|
2011 |
|
2010 |
|
2009 |
|
2008 |
|
2007 |
|
|||||
|
|
|
|
|
|
|
|
|
|
|
|
|
|||||
|
Net sales and revenue |
|
$ |
301,674 |
|
$ |
170,088 |
|
$ |
68,587 |
|
$ |
322 |
|
$ |
257 |
|
|
Net (income) loss attributable to noncontrolling interests |
|
$ |
(3,673 |
) |
$ |
(3,900 |
) |
$ |
3,156 |
|
$ |
841 |
|
$ |
— |
|
|
Income (loss) from continuing operations attributable to REX common shareholders (a) (b) |
|
$ |
3,097 |
|
$ |
6,051 |
|
$ |
(2,861 |
) |
$ |
20,032 |
|
$ |
6,778 |
|
|
Net income (loss) attributable to REX common shareholders (b) |
|
$ |
5,069 |
|
$ |
8,652 |
|
$ |
(3,297 |
) |
$ |
33,867 |
|
$ |
11,351 |
|
|
Basic income (loss) per share from continuing operations attributable to REX common shareholders (a) |
|
$ |
0.32 |
|
$ |
0.65 |
|
$ |
(0.28 |
) |
$ |
1.92 |
|
$ |
0.66 |
|
|
Diluted income (loss) per share from continuing operations attributable to REX common shareholders (a) |
|
$ |
0.32 |
|
$ |
0.63 |
|
$ |
(0.28 |
) |
$ |
1.71 |
|
$ |
0.59 |
|
|
Basic net income (loss) per share |
|
$ |
0.53 |
|
$ |
0.93 |
|
$ |
(0.32 |
) |
$ |
3.25 |
|
$ |
1.10 |
|
|
Diluted net income (loss) per share |
|
$ |
0.52 |
|
$ |
0.91 |
|
$ |
(0.32 |
) |
$ |
2.89 |
|
$ |
0.98 |
|
|
Total assets |
|
$ |
375,722 |
|
$ |
451,505 |
|
$ |
451,288 |
|
$ |
408,978 |
|
$ |
345,442 |
|
|
Long-term debt and capital lease obligations, net of current maturities |
|
$ |
70,973 |
|
$ |
126,689 |
|
$ |
103,939 |
|
$ |
35,224 |
|
$ |
31,236 |
|
|
Long-term derivative financial instrument liability |
|
$ |
3,688 |
|
$ |
4,055 |
|
$ |
4,032 |
|
$ |
2,308 |
|
$ |
— |
|
|
|
|
|
|
|
a) |
Amounts differ from those previously reported as the results of our former retail segment and certain real estate assets have been reclassified into discontinued operations. See Note 16 of the Notes to the Consolidated Financial Statements for further discussion and analysis of discontinued operations. |
|
|
|
|
|
|
b) |
The results for the years ended January 31, 2008 and 2007 include significant amounts of income from synthetic fuel investments. The results for the year ended January 31, 2008 also includes a realized gain from the sale of our interest in Millennium Ethanol, LLC. |
22
Quarterly Financial Data
(Unaudited)
|
|
|
|
|
|
|
|
|
|
|
|
|
|
|
|
|
|
Quarters Ended |
|
||||||||||
|
|
|
|
|
||||||||||
|
|
|
April 30, |
|
July 31, |
|
October 31, |
|
January 31, |
|
||||
|
|
|
|
|
|
|
|
|
|
|
||||
|
Net sales and revenue (a) |
|
$ |
71,554 |
|
$ |
65,516 |
|
$ |
70,718 |
|
$ |
93,886 |
|
|
Gross profit (a) |
|
|
8,405 |
|
|
5,962 |
|
|
7,198 |
|
|
8,809 |
|
|
Net income (loss) |
|
|
4,188 |
|
|
1,234 |
|
|
4,250 |
|
|
(4,603 |
) |
|
Basic net income (loss) per share attributable to REX common shareholders (b) |
|
$ |
0.43 |
|
$ |
0.13 |
|
$ |
0.45 |
|
$ |
(0.49 |
) |
|
Diluted net income (loss) per share attributable to REX common shareholders (b) |
|
$ |
0.42 |
|
$ |
0.12 |
|
$ |
0.44 |
|
$ |
(0.49 |
) |
|
|
|
|
|
|
|
|
|
|
|
|
|
|
|
|
|
|
Quarters Ended |
|
||||||||||
|
|
|
|
|
||||||||||
|
|
|
April 30, |
|
July 31, |
|
October 31, |
|
January 31, |
|
||||
|
|
|
|
|
|
|
|
|
|
|
||||
|
|
|
|
|
|
|
|
|
|
|
|
|
|
|
|
Net sales and revenue (a) |
|
$ |
14,324 |
|
$ |
17,076 |
|
$ |
61,613 |
|
$ |
77,075 |
|
|
Gross profit (a) |
|
|
325 |
|
|
1,189 |
|
|
5,799 |
|
|
13,395 |
|
|
Net (loss) income |
|
|
(1,731 |
) |
|
837 |
|
|
2,273 |
|
|
7,273 |
|
|
Basic net (loss) income per share attributable to REX common shareholders (b) |
|
$ |
(0.19 |
) |
$ |
0.09 |
|
$ |
0.25 |
|
$ |
0.78 |
|
|
Diluted net (loss) income per share attributable to REX common shareholders (b) |
|
$ |
(0.19 |
) |
$ |
0.09 |
|
$ |
0.24 |
|
$ |
0.75 |
|
|
|
|
|
|
|
a) |
Amounts differ from those previously reported as the results of our former retail segment and certain real estate assets have been reclassified as discontinued operations and certain other reclassifications. See Note 16 of the Notes to the Consolidated Financial Statements for further discussion and analysis of discontinued operations. |
|
|
|
|
|
|
b) |
The total of the quarterly net income (loss) per share amounts do not equal the annual net loss or income per share amount due to the impact of varying amounts of shares and options outstanding during the year. In addition, basic net loss per share equals diluted net loss per share in periods where a net loss is reported. |
|
|
|
|
Item 7. |
Management’s Discussion and Analysis of Financial Condition and Results of Operations |
Overview
Historically, we were a specialty retailer in the consumer electronics and appliance industry serving small to medium-sized towns and communities. In addition, we have been an investor in various alternative energy entities beginning with synthetic fuel partnerships in 1998 and later ethanol production facilities beginning in 2006.
In fiscal year 2007, we began to evaluate strategic alternatives for our retail segment with a focus on closing unprofitable or marginally profitable retail stores and monetizing our retail-related real estate assets. We did not believe that we were generating an adequate return from our retail business due to the competitive nature of the consumer electronics and appliance industry and the overall economic conditions in the United States. Reflecting this focus, we sold approximately 60% of our owned retail and vacant stores in fiscal year 2007 and leased back a portion of the stores which had been operating as electronics and appliance retail stores. In fiscal year 2008, we commenced an evaluation of a broad range of alternatives intended to derive value from the remaining retail operations and our remaining real estate portfolio. We engaged an investment banking
23
firm to assist us in analyzing and ultimately marketing our retail operations. As part of those marketing efforts, late in fiscal year 2008, we initially leased 37 owned store locations to an unrelated third party. During fiscal year 2009, the lease agreements were terminated. At January 31, 2011, we had lease agreements for all or parts of eight former retail properties and had 22 vacant former retail properties. We also own one former distribution center, which is partially leased, partially occupied by our corporate office personnel and partially vacant. We are marketing the vacant properties to lease or sell. Should our marketing efforts result in additional tenants to whom we lease property, we would expect to execute leases with a term of five to twenty years.
We completed our exit of the retail business as of July 31, 2009. Going forward, our only retail related activities will consist of the administration of extended service plans we previously sold and the payment of related claims. All activities related to extended service plans will be classified as discontinued operations.
We currently have equity and debt investments in five ethanol production entities, one of which we have a majority ownership interest in. We may make additional investments in the alternative energy segment during fiscal year 2011.
Our ethanol operations are highly dependent on commodity prices, especially prices for corn, sorghum, ethanol, distillers grains and natural gas. As a result of price volatility for these commodities, our operating results can fluctuate substantially. The price and availability of corn and sorghum are subject to significant fluctuations depending upon a number of factors that affect commodity prices in general, including crop conditions, weather, federal policy and foreign trade. Because the market price of ethanol is not always directly related to corn and sorghum prices, at times ethanol prices may lag movements in corn prices and, in an environment of higher prices, reduce the overall margin structure at the plants. As a result, at times, we may operate our plants at negative or marginally positive operating margins.
We expect our ethanol plants to produce approximately 2.8 gallons of ethanol for each bushel of grain processed in the production cycle. We refer to the difference between the price per gallon of ethanol and the price per bushel of grain (divided by 2.8) as the “crush spread.” Should the crush spread decline, our ethanol plants are likely to generate operating results that do not provide adequate cash flows for sustained periods of time. In such cases, production at the ethanol plants may be reduced or stopped altogether in order to minimize variable costs at individual plants. We expect these decisions to be made on an individual plant basis, as there are different market conditions at each of our ethanol plants.
We attempt to manage the risk related to the volatility of grain and ethanol prices by utilizing forward grain purchase and forward ethanol and distillers grain sale contracts. We attempt to match quantities of ethanol and distillers grains sale contracts with an appropriate quantity of grain purchase contracts over a given period of time when we can obtain an adequate gross margin resulting from the crush spread inherent in the contracts we have executed. However, the market for future ethanol sales contracts is not a mature market. Consequently, we generally execute contracts for no more than three months into the future at any given time. As a result of the relatively short period of time our contracts cover, we generally cannot predict the future movements in the crush spread for more than three months; we are unable to predict the likelihood or amounts of future income or loss from the operations of our ethanol facilities.
The crush spread realized in 2010 was subject to significant volatility. For calendar year 2010, the average Chicago Board of Trade (“CBOT”) near-month corn price was approximately $4.30 per bushel, with highs reaching approximately $6.25 per bushel in December 2010. We believe corn prices were affected late in the year by global weather conditions, export demand, speculation, currency valuation and global economic conditions. Ethanol prices also had significant fluctuations ranging from approximately $1.50 per gallon in June to approximately $2.38 per gallon in December. Ethanol and corn prices have tended to trade in the same direction but with narrowing spreads, particularly late in the year. In 2010, the CBOT crush spread ranged
24
from a low of approximately $0.05 per gallon in December to a high of approximately $0.55 per gallon in February. We believe ethanol demand late in 2010 was also impacted by the uncertainty of the extension of the VEETC Blender Credit. Crush spreads have continued to decline in 2011 and have at times, become negative (absent the consideration of distillers grains). Prices for distillers grains we sell have generally trended with grain prices. These prices have partially offset the decline in the crush spread.
We reported segment profit (before income taxes and noncontrolling interests) from our alternative energy segment of approximately $13.4 million in fiscal year 2010 compared to approximately $17.8 million in fiscal year 2009. The decline in profitability primarily resulted from impairment charges and loss on deconsolidation of Levelland Hockley. Levelland Hockley reported a loss from operations and as a result of narrowing crush spreads was shut down in January 2011. These losses were partially offset as One Earth was in production for a full year during fiscal year 2010 and operated profitably.
We expect that future operating results will be based upon annual production of between 100 and 115 million gallons of ethanol, which assumes that One Earth will operate at or near nameplate capacity. However, due to the inherent volatility of the crush spread, we cannot predict the likelihood of future operating results being similar to the 2010 results.
Ethanol Investments
In fiscal year 2006, we entered the alternative energy industry by investing in several entities organized to construct and, subsequently operate, ethanol producing plants. We have invested in six entities, five of which we remain invested in as of January 31, 2011, utilizing both equity and debt investments. We sold our investment in Millennium during fiscal year 2007.
The following table is a summary of our ethanol investments at January 31, 2011:
|
|
|
|
|
|
|
|
|
|
|
|
|
Entity |
|
Nameplate |
|
Effective |
|
Effective |
|
|||
|
|
|
|
|
|
|
|
|
|||
|
One Earth Energy, LLC |
|
|
100 |
|
|
74 |
% |
|
74.0 |
|
|
NuGen Energy, LLC |
|
|
100 |
|
|
48 |
% |
|
48.0 |
|
|
Patriot Renewable Fuels, LLC |
|
|
100 |
|
|
23 |
% |
|
23.0 |
|
|
Big River Resources, LLC-W Burlington |
|
|
92 |
|
|
10 |
% |
|
9.2 |
|
|
Big River Resources, LLC-Galva |
|
|
100 |
|
|
10 |
% |
|
10.0 |
|
|
Big River United Energy, LLC |
|
|
100 |
|
|
5 |
% |
|
5.0 |
|
|
Levelland Hockley County Ethanol, LLC |
|
|
40 |
|
|
49 |
% |
|
19.6 |
|
|
|
|
|
|
|
|
|
|
|
|
|
|
Total |
|
|
632 |
|
|
|
|
|
188.8 |
|
One Earth commenced production operations late in the second quarter of fiscal year 2009 and began generating revenue in the third quarter of fiscal year 2009.
Effective July 1, 2010, we acquired a 48% equity interest in NuGen which operates an ethanol producing facility in Marion, South Dakota with a nameplate capacity of 100 million gallons of ethanol and 320,000 tons of DDG per year.
Patriot commenced production operations in the second quarter of fiscal year 2008.
25
Big River completed construction in the second quarter of fiscal year 2009 of its second plant which has a nameplate capacity of 100 million gallons of ethanol and 320,000 tons of DDG per year. The plant is located in Galva, Illinois.
In August 2009, Big River acquired a 50.5% interest in an ethanol production facility which has a nameplate capacity of 100 million gallons of ethanol and 320,000 tons of DDG per year. The plant is located in Dyersville, Iowa.
The Levelland Hockley plant was shut down in early January 2011 as a result of industry wide low crush spread margins and the plant’s inability to source grain at affordable prices. On January 31, 2011 we sold 814,000 of our membership units to Levelland Hockley for $1, reducing our ownership interest in Levelland Hockley to 49%. As a result, we no longer have a controlling financial interest in Levelland Hockley, and, therefore, effective January 31, 2011, we deconsolidated Levelland Hockley and began using the equity method of accounting to account for the results of Levelland Hockley. In connection with the deconsolidation, we recorded our remaining non controlling equity interest and our debt investments at fair value. Our estimate of fair value for all of our investments in Levelland Hockley was $0 at January 31, 2011. We recorded a pretax charge of approximately $18.4 million as a result of deconsolidating Levelland Hockley and writing our remaining investments in Levelland Hockley to $0 at January 31, 2011.
Investment in Synthetic Fuel Partnerships
We had invested in three limited partnerships which owned facilities producing synthetic fuel. The partnerships earned federal income tax credits under Section 29/45K of the Internal Revenue Code based upon the tonnage and content of solid synthetic fuel produced and sold to unrelated parties. The Section 29/45K tax credit program expired on December 31, 2007. As such we do not expect to receive additional income from these investments except for the possibility of an additional payment on a facility formerly located in Gillette, Wyoming. Based upon the modified terms of a sales agreement, we are currently not able to predict the likelihood and timing of payments for production from September 30, 2006 to December 31, 2007 for this facility. We expect the payments, if any, to be made within the next year. We have not recognized this income and will recognize income, if any, upon receipt of payment or upon our ability to reasonably assure ourselves of the timing and collectability of payment.
See Notes 4 and 17 of the Notes to the Consolidated Financial Statements for further discussions.
See Item 1A Risk Factors for further discussion of the risks involved with our synthetic fuel investments.
Real Estate Operations
At January 31, 2011, we had lease agreements, as landlord, for all or parts of eight owned former retail stores (88,000 square feet leased and 10,000 square feet vacant). We have 22 owned former retail stores (281,000 square feet) that are vacant at January 31, 2011. We are marketing these vacant properties to lease or sell. In addition, one former distribution center is partially leased (266,000 square feet), partially occupied by our corporate office personnel (10,000 square feet) and partially vacant (190,000 square feet).
Retail
We completed the exit of our retail business during the second quarter of fiscal year 2009. We offered extended service contracts to our customers which typically provide, inclusive of manufacturers’ warranties, one to five years of warranty coverage. We plan to manage and administer these contracts over the life of the contracts. Service contract repair costs are charged to operations as incurred. We expect to continue recognizing extended service contract revenues and expenses (as discontinued operations) through January
26
2014, although the revenues will decline annually as we are no longer selling new contracts. We typically service a warranty claim through a network of third party repair and service providers. Warranty repair costs have been in the range of 17% to 25% of extended service contract revenue over the last three years; we expect these costs to average approximately 20% of extended service contract revenue in future years. Future expected amortization of deferred revenue and commission expense are as follows (amounts in thousands):
|
|
|
|
|
|
|
|
|
|
Years
Ended |
|
Deferred |
|
Deferred |
|
||
|
|
|
|
|
|
|
||
|
|
|||||||
|
2012 |
|
|
3,982 |
|
|
1,195 |
|
|
2013 |
|
|
1,864 |
|
|
565 |
|
|
2014 |
|
|
552 |
|
|
164 |
|
|
|
|
|
|
|
|
|
|
|
Total |
|
$ |
6,398 |
|
$ |
1,924 |
|
|
|
|
|
|
|
|
|
|
Results of Operations
For a detailed analysis of period to period changes, see the segment discussion that follows this section as this is how management views and monitors our business.
Comparison of Fiscal Years Ended January 31, 2011 and 2010
Net Sales and Revenue – Net sales and revenue in fiscal year 2010 were $301.7 million, a 77.4% increase from $170.1 million in fiscal year 2009. Net sales and revenue do not include sales from retail and real estate operations classified in discontinued operations. The increase was primarily caused by higher sales in our alternative energy segment of $131.2 million and a full year of production at our consolidated subsidiary, One Earth. Net sales and revenue from our real estate segment increased $0.4 million over the prior year to $1.3 million.
The following table reflects the approximate percent of net sales and revenue for each product and service group for the periods presented:
|
|
|
|
|
|
|
|
|
|
|
|
|
|
Fiscal Year |
|
||||||
|
|
|
|
|
||||||
|
|
|||||||||
|
Product or Service Category |
|
2010 |
|
|
2009 |
|
|
2008 |
|
|
|
|
|
|
|
|
|
|
|
|
|
|
|||||||||
|
Ethanol |
|
83 |
% |
|
82 |
% |
|
82 |
% |
|
Distiller grains |
|
16 |
|
|
17 |
|
|
17 |
|
|
Leasing |
|
1 |
|
|
1 |
|
|
1 |
|
|
|
|
|
|
|
|
|
|
|
|
|
Total |
|
100 |
% |
|
100 |
% |
|
100 |
% |
|
|
|
|
|
|
|
|
|
|
|
Gross Profit – Gross profit was $30.4 million in fiscal year 2010, or 10.1% of net sales and revenue, versus $20.7 million in fiscal year 2009 or 12.2% of net sales and revenue. This represents an increase of $9.7 million. Gross profit for fiscal year 2010 increased by $9.3 million over the prior year as a result of operations in the alternative energy segment. Gross loss for fiscal year 2010 decreased by $0.4 million compared to the prior year from our real estate segment.
Selling, General and Administrative Expenses – Selling, general and administrative expenses for fiscal year 2010 were $9.7 million (3.2% of net sales and revenue), an increase of $3.5 million or 56.5% from $6.2
27
million (3.6% of net sales and revenue) for fiscal year 2009. Compared to the prior year, these expenses increased approximately $2.6 million and $0.9 million in the alternative energy segment and the corporate and other category, respectively.
Impairment Charges and Loss on Deconsolidation– During fiscal year 2010, we recognized losses totaling approximately $18.4 million related to the impairment of notes receivable from Levelland Hockley and the deconsolidation of Levelland Hockley. Effective January 31, 2011, we sold a portion of our equity interest in Levelland Hockley. As a result we no longer have a controlling financial interest in Levelland Hockley, and, therefore, effective January 31, 2011, we deconsolidated Levelland Hockley and recorded our retained investment in Levelland Hockley at fair value as of January 31, 2011. We recognized an impairment loss related to the notes receivable of approximately $8.9 million during fiscal year 2010. We also recognized a loss on deconsolidation of approximately $9.5 million during fiscal year 2010.
Interest Income – Interest income of $0.4 million for fiscal year 2010 was consistent with fiscal year 2009.
Interest Expense – Interest expense increased to $5.6 million for fiscal year 2010 from $4.7 million for fiscal year 2009. The increase in interest expense was primarily attributable to the alternative energy segment as we had higher amounts of average debt outstanding upon the completion of One Earth’s ethanol plant and that we are no longer capitalizing interest costs.
Loss on Early Termination of Debt – During fiscal years 2010 and 2009, we completed the early payoff of $0.4 million and $8.0 million, respectively, of mortgage debt prior to maturity. As a result, we expensed certain unamortized financing costs and prepayment penalties of approximately $48,000 and $89,000 during fiscal years 2010 and 2009, respectively, as loss on early termination of debt.
Equity in Income of Unconsolidated Ethanol Affiliates – During fiscal years 2010 and 2009, we recognized income of approximately $14.6 million and $6.0 million, respectively from our equity investments in Big River, Patriot and NuGen. Big River has a 92 million gallon plant which has been in operation since 2004. Big River opened an additional 100 million gallon plant during the second quarter of fiscal year 2009 and acquired a 50.5% ownership in a 100 million gallon plant in August 2009. Patriot has an ethanol facility with a nameplate capacity of 100 million gallons which has been in operation since the second quarter of fiscal year 2008. Effective July 1, 2010, we acquired a 48% equity interest in NuGen which operates an ethanol producing facility in Marion, South Dakota with an annual nameplate capacity of 100 million gallons.
Income from Big River was approximately $5.4 million and $2.5 million in fiscal years 2010 and 2009, respectively. Although our proportionate 10% share of income from Big River has been consistent over the prior two years, Big River benefited in the current year from a full year of production at its Big River Galva and Big River United Energy facilities during fiscal year 2010.
We recorded income of approximately $5.2 million and $3.5 million from Patriot in fiscal years 2010 and 2009, respectively. Patriot experienced a decline in interest expense of approximately $2.2 million, as its term debt is variable rate debt, and interest rates declined in fiscal year 2010. Patriot also recognized a gain on the early extinguishment of debt of approximately $1.9 million.
We recognized approximately $4.0 million of income from NuGen in the current year. This was the first year we reported income from NuGen given that the acquisition of our interest in NuGen was effective July 1, 2010.
28
Overall, we expect the trends in crush spread margins described in the “Overview” section to be generally consistent with the operating experience of Big River, Patriot and NuGen as their results are dependent on the same key drivers (corn and natural gas pricing as well ethanol pricing, all of which are commodities).
Due to the inherent volatility of the crush spread, we cannot predict the likelihood of future operating results from Big River, Patriot and NuGen being similar to the fiscal year 2010 results.
Other Income – During fiscal year 2009, Levelland Hockley received notification from the United States Department of Agriculture that they had been approved to receive funds under the Advanced Biofuel Producer Program. As a result, approximately $0.3 million was recognized as other income during fiscal year 2010. We recognized approximately $0.5 million of other income from this grant during fiscal year 2009.
During fiscal year 2009, Levelland Hockley entered into an agreement to settle litigation and received $1.5 million as a condition of the settlement. Of the proceeds received, approximately $0.3 million was recognized as other income during fiscal year 2009.
We do not expect other income to be significant in future periods.
Losses on Derivative Financial Instruments – We recognized losses of approximately $2.1 million and $2.5 million during fiscal years 2010 and 2009, respectively, related to forward interest rate swaps that Levelland Hockley and One Earth entered into during fiscal year 2007. During fiscal year 2010, Levelland Hockley’s loss was insignificant and One Earth’s loss was $2.1 million. Levelland Hockley’s swap expired in April 2010 while One Earth’s swaps expire in July 2011 and July 2014. In general, declining interest rates have a negative effect on our interest rate swaps as our swaps fixed the interest rate of variable rate debt. As interest rates declined during fiscal years 2010 and 2009, we incurred large losses on the interest rate swaps. Should interest rates continue to decline, we would expect to experience continued losses on the interest rate swaps. We would expect to incur gains on the interest rate swaps should interest rates increase. We cannot predict the future movements in interest rates; thus, we are unable to predict the likelihood or amounts of future gains or losses related to interest rate swaps.
Income Taxes – Our effective tax rate was 30.8% and 31.1% for fiscal years 2010 and 2009, respectively. Our effective rate is impacted by the non controlling interests of the companies we consolidate, as we recognize 100% of their income or loss in continuing operations before income taxes and non controlling interests. However, we only provide an income tax provision or benefit for our portion of subsidiaries’ income or loss with a non controlling interest.
Income from Continuing Operations Including Noncontrolling Interests – As a result of the foregoing, income from continuing operations including noncontrolling interests was $6.8 million for fiscal year 2010 versus $10.0 million for fiscal year 2009.
Discontinued Operations – During fiscal year 2009, we closed our remaining retail store and warehouse operations and reclassified all retail related results as discontinued operations. As a result of these closings and certain other retail store and real estate property closings from prior years, we had income from discontinued operations, net of taxes, of $1.8 million in fiscal year 2010 compared to $1.4 million in fiscal year 2009. Ten properties classified as discontinued operations were sold during fiscal year 2010, resulting in a gain, net of taxes, of $0.2 million. We sold or disposed of five former retail store locations classified as discontinued operations in fiscal year 2009; as a result, we had a gain from disposal of discontinued operations, net of taxes, of $1.2 million in fiscal year 2009. We expect income from discontinued operations to decline in future periods as our extended service plan activities wind down.
29
Noncontrolling Interests– Income or (loss) related to noncontrolling interests was $3.7 million and $3.9 million during fiscal years 2010 and 2009, respectively, and represents the owners’ (other than us) share of the income or loss of Levelland Hockley and One Earth. Noncontrolling interests of Levelland Hockley and One Earth was $(3.2) million and $6.9 million, respectively during fiscal year 2010 and $1.4 million and $2.5 million, respectively during fiscal year 2009.
Net Income Attributable to REX Common Shareholders – As a result of the foregoing, net income attributable to REX common shareholders was $5.1 million for fiscal year 2010 compared to $8.7 million for fiscal year 2009.
Business Segment Results
During fiscal year 2009, we realigned our reportable business segments to be consistent with changes to our management structure and reporting. We now have two segments: alternative energy and real estate. The real estate segment was formerly included in the retail segment. For former retail stores and warehouses closed which we have a retained interest in the related real estate, operations are now presented in the real estate segment based upon when retail operations ceased. Historical results from retail store operations have been reclassified as discontinued operations for all periods presented.
The following sections discuss the results of operations for each of our business segments and corporate and other. As discussed in Note 18, our chief operating decision maker (as defined by Accounting Standards Codification (“ASC”) 280 “Segment Reporting”) evaluates the operating performance of our business segments using a measure we call segment profit. Segment profit excludes income taxes, interest expense, discontinued operations, indirect interest income and certain other items that are included in net income determined in accordance with accounting principles generally accepted in the United States of America. Management believes these are useful financial measures; however, they should not be construed as being more important than other comparable GAAP measures.
Items excluded from segment profit generally result from decisions made by corporate executives. Financing, divestiture and tax structure decisions are generally made by corporate executives. Excluding these items from our business segment performance measure enables us to evaluate business segment operating performance based upon current economic conditions. Amounts in the corporate category below include business activities that are not separately reportable and income from synthetic fuel investments.
30
(amounts in thousands):
|
|
|
|
|
|
|
|
|
|
|
|
|
|
|
Years Ended January 31, |
|
|||||||
|
|
|
|
|
|||||||
|
|
|
2011 |
|
2010 |
|
2009 |
|
|||
|
|
|
|
|
|
|
|
|
|||
|
Net sales and revenues: |
|
|
|
|
|
|
|
|
|
|
|
Alternative energy |
|
$ |
300,389 |
|
$ |
169,175 |
|
$ |
68,223 |
|
|
Real estate |
|
|
1,285 |
|
|
913 |
|
|
364 |
|
|
|
|
|
|
|
|
|
|
|
|
|
|
Total net sales and revenues |
|
$ |
301,674 |
|
$ |
170,088 |
|
$ |
68,587 |
|
|
|
|
|
|
|
|
|
|
|
|
|
|
|
|
|
|
|
|
|
|
|
|
|
|
Segment gross profit (loss): |
|
|
|
|
|
|
|
|
|
|
|
Alternative energy |
|
$ |
31,173 |
|
$ |
21,923 |
|
$ |
807 |
|
|
Real estate |
|
|
(799 |
) |
|
(1,215 |
) |
|
228 |
|
|
|
|
|
|
|
|
|
|
|
|
|
|
Total gross profit |
|
$ |
30,374 |
|
$ |
20,708 |
|
$ |
1,035 |
|
|
|
|
|
|
|
|
|
|
|
|
|
|
|
|
|
|
|
|
|
|
|
|
|
|
Segment profit (loss): |
|
|
|
|
|
|
|
|
|
|
|
Alternative energy segment |
|
$ |
13,403 |
|
$ |
17,811 |
|
$ |
(8,992 |
) |
|
Real estate |
|
|
(1,022 |
) |
|
(1,398 |
) |
|
228 |
|
|
Corporate expenses |
|
|
(2,724 |
) |
|
(1,870 |
) |
|
(2,020 |
) |
|
Interest expense |
|
|
(240 |
) |
|
(358 |
) |
|
(428 |
) |
|
Interest income |
|
|
372 |
|
|
263 |
|
|
1,788 |
|
|
Income from synthetic fuel investments |
|
|
— |
|
|
— |
|
|
691 |
|
|
|
|
|
|
|
|
|
|
|
|
|
|
Income (loss) from continuing operations before income taxes and noncontrolling interests |
|
$ |
9,789 |
|
$ |
14,448 |
|
$ |
(8,733 |
) |
|
|
|
|
|
|
|
|
|
|
|
|
Alternative Energy
The alternative energy segment includes the consolidated financial results of Levelland Hockley and One Earth, our other investments in ethanol facilities, the income or loss related to those investments and certain administrative expenses. One Earth began limited production operations late in the second quarter of fiscal year 2009 and became fully operational during the third quarter of fiscal year 2009. Effective January 31, 2011, we sold a portion of our ownership interest in Levelland Hockley. As a result, we no longer have a controlling financial interest in Levelland Hockley, and therefore, we deconsolidated Levelland Hockley effective January 31, 2011 and we will use the equity method of accounting on a prospective basis. The results of Levelland Hockley are consolidated in the accompanying Consolidated Statements of Operations and Consolidated Statements of Cash Flows during fiscal years 2010, 2009 and 2008. However, the assets, liabilities and equity of Levelland Hockley are deconsolidated in the accompanying Consolidated Balance Sheet as of January 31, 2011.
31
The following table summarizes sales from Levelland Hockley and One Earth by product group (amounts in thousands):
|
|
|
|
|
|
|
|
|
|
|
|
Years Ended January 31, |
|
||||
|
|
|
2011 |
|
2010 |
|
||
|
|
|
|
|
|
|
||
|
Ethanol |
|
$ |
250,818 |
|
$ |
140,443 |
|
|
Dried distiller grains |
|
|
41,625 |
|
|
20,223 |
|
|
Wet distiller grains |
|
|
7,514 |
|
|
7,953 |
|
|
Other |
|
|
432 |
|
|
556 |
|
|
|
|
|
|
|
|
|
|
|
Total |
|
$ |
300,389 |
|
$ |
169,175 |
|
|
|
|
|
|
|
|
|
|
The following table summarizes selected operating data from Levelland Hockley and One Earth:
|
|
|
|
|
|
|
|
|
|
|
|
Years Ended January 31, |
|
||||
|
|
|
2011 |
|
2010 |
|
||
|
|
|
|
|
|
|
||
|
Average selling price per gallon of ethanol |
|
$ |
1.81 |
|
$ |
1.68 |
|
|
Average selling price per ton of dried distiller grains |
|
$ |
126.25 |
|
$ |
112.29 |
|
|
Average selling price per ton of wet distiller grains |
|
$ |
35.08 |
|
$ |
41.53 |
|
|
Average cost per bushel of grain |
|
$ |
4.10 |
|
$ |
3.58 |
|
|
Average cost of natural gas (per mmbtu) |
|
$ |
4.80 |
|
$ |
4.28 |
|
Net sales and revenue for the current year increased approximately $131.2 million over the prior year to approximately $300.4 million, primarily as a result of One Earth becoming fully operational during the third quarter of fiscal year 2009. Ethanol sales increased from approximately $140.4 million in the prior year to approximately $250.8 million in the current year. The average selling price per gallon of ethanol increased from $1.68 in the prior year to $1.81 in the current year. Our ethanol sales were based upon approximately 138.3 million gallons in the current year compared to approximately 83.6 million gallons in the prior year. Dried distiller grains sales increased from approximately $20.2 million in the prior year to approximately $41.6 million in the current year. The average selling price per ton of dried distiller grains increased from $112.29 in the prior year to $126.25 in the current year. Our dried distiller grains sales were based upon approximately 327,000 tons in the current year compared to approximately 180,000 tons in the prior year. Wet distiller grains sales decreased from approximately $8.0 million in the prior year to approximately $7.5 million in the current year. The average selling price per ton of wet distiller grains decreased from $41.53 in the prior year to $35.08 in the current year. Our wet distiller grains sales were based upon approximately 214,000 tons in the current year compared to approximately 192,000 tons in the prior year.
We expect that sales in future periods will be based upon the following (One Earth Energy only):
|
|
|
|
|
|
|
|
Product |
|
Annual Sales Quantity |
|
|
|
|
|
|
|
|
|
Ethanol |
|
100 million to 115 million gallons |
|
Dried distiller grains |
|
300,000 to 320,000 tons |
|
Wet distiller grains |
|
5,000 to 10,000 tons |
32
This expectation assumes that One Earth will continue to operate at or near nameplate capacity, which is dependent upon the crush spread realized. This expectation also assumes that we will not consolidate any other ethanol plants.
Gross profit from alternative energy segment sales was approximately $31.2 million during the current year compared to approximately $21.9 million during the prior year. Gross profit improved primarily because of the volume increases in ethanol and distillers grains sold discussed above which was offset slightly by a less favorable spread between ethanol and grain prices in the current year compared to the prior year. Grain accounted for approximately 76.8% ($206.9 million) of our cost of sales during the current year compared to 74.4% ($109.6 million) during the prior year. Natural gas accounted for approximately 7.0% ($19.0 million) of our cost of sales during the current year compared to 7.1% ($10.4 million) during the prior year. Given the inherent volatility in ethanol and grain prices, we cannot predict the trend of the spread between ethanol and grain prices in future periods compared to historical periods.
We attempt to match quantities of ethanol and distillers grains sale contracts with an appropriate quantity of grain purchase contracts over a given period of time when we can obtain an adequate gross margin resulting from the crush spread inherent in the contracts we have executed. However, the market for future ethanol sales contracts is not a mature market. Consequently, we generally execute contracts for no more than three months into the future at any given time. As a result of the relatively short period of time our contracts cover, we generally cannot predict the future movements in the crush spread for more than three months. Approximately 1% of our forecasted ethanol and distillers grain production during the next 12 months has been sold under fixed-price contracts. As a result of these positions, the effect of a 10% adverse change in the price of ethanol from the current pricing would result in a decrease in revenues of approximately $23.9 million. Similarly, approximately 1% of our estimated corn usage for the next 12 months was subject to fixed-price contracts. As a result of these positions, the effect of a 10% adverse change in the price of corn from current pricing would result in an increase in cost of goods of approximately $21.6 million.
Selling, general and administrative expenses were approximately $6.8 million in fiscal year 2010, a $2.7 million increase from approximately $4.1 million in fiscal year 2009. We recognized higher selling expenses of approximately $1.5 million at One Earth as One Earth was in production for the full year in fiscal year 2010. We also recognized a charge of approximately $0.7 million related to adjusting the estimated fair value of the contingent consideration liability associated with the NuGen acquisition. We expect selling, general and administrative expenses in future periods to remain consistent with comparable historical periods.
Interest expense increased approximately $0.9 million in the current year over the prior year to approximately $5.4 million, as we no longer capitalize interest on the One Earth credit facility subsequent to the completion of construction and commencement of operations at the plant. In addition, One Earth borrowed approximately $49.0 million during fiscal year 2009; the resulting higher outstanding debt amount also contributed to the increase in interest expense. Based on current interest rates, we expect interest expense to be in the range of $2.0 million to $2.5 million in fiscal year 2011 based on current debt levels and that we do not anticipate capitalizing significant amounts of interest now that all facilities are in operation.
Income from equity method investments in Big River, Patriot and NuGen increased from approximately $6.0 million in the prior year to approximately $14.6 million in the current year.
We recognized approximately $5.4 million of income from Big River in fiscal year 2010 which is approximately $2.9 million above the prior year amount of approximately $2.5 million. Big River benefited in the current year from a full year of production at its Big River Galva and Big River United Energy facilities during fiscal year 2010.
33
We recognized approximately $5.2 million of income from Patriot in fiscal year 2010, which is approximately $1.7 million higher than the approximately $3.5 million in the prior year. Patriot experienced a decline in interest expense of approximately $2.2 million, as its term debt is variable rate debt, and interest rates declined in fiscal year 2010. Patriot also recognized a gain on the early extinguishment of debt of approximately $1.9 million.
We recognized approximately $4.0 million of income from NuGen in the current year. This was the first year we reported income from NuGen given that the acquisition of our interest in NuGen was effective July 1, 2010.
Given the inherent volatility in the factors that affect the crush spread, we cannot predict the likelihood that the trend with respect to income from equity method investments will continue in future periods.
Losses on derivative financial instruments held by One Earth and Levelland were approximately $2.1 million in the current year compared to approximately $2.5 million in the prior year. Since the gains or losses on these derivative financial instruments are primarily a function of the movement in interest rates, we cannot predict the likelihood that such gains or losses in future periods will be consistent with current year results.
As a result of the factors discussed above, segment profit decreased to $13.4 million in the current year from $17.8 million in the prior year.
Real Estate
The real estate segment includes all owned and sub-leased real estate including those previously used as retail store and distribution center operations, our real estate leasing activities and certain administrative expenses. It excludes results from discontinued operations.
At January 31, 2011, we had lease agreements, as landlord, for all or parts of eight owned former retail stores (88,000 square feet leased and 10,000 square feet vacant). We have 22 owned former retail stores (281,000 square feet), that are vacant at January 31, 2011. We are marketing these vacant properties to lease or sell. In addition, one former distribution center is partially leased (266,000 square feet), partially occupied by our corporate office personnel (10,000 square feet) and partially vacant (190,000 square feet).
Net sales and revenue for the current year increased approximately $0.4 million over the prior year to approximately $1.3 million. The increase in revenue is primarily a result of a lease for a portion of a distribution center that was executed during the fourth quarter of fiscal year 2009. Gross loss from this segment was approximately $0.8 million during the current year compared to approximately $1.2 million during the prior year. Gross loss improved as a result of the increase in revenue discussed above. We expect lease revenue in fiscal year 2011 to be consistent with fiscal year 2010 based upon leases currently executed.
Selling, general and administrative expenses were approximately $229,000 in fiscal year 2010, consistent with the $183,000 in fiscal year 2009. We expect selling, general and administrative expenses in future periods to remain consistent with comparable historical periods.
As a result of the factors discussed above, segment loss was approximately $1.0 million in the current year compared to approximately $1.4 million in the prior year. Excluding any property sales that may occur in fiscal year 2011, we expect to generate another segment loss in fiscal year 2011 based upon the current number of vacant properties.
34
Corporate and Other
Corporate and other includes certain administrative expenses of the corporate headquarters, interest expense and interest income not directly allocated to the alternative energy or real estate segments and income from synthetic fuel investments.
Selling, general and administrative expenses were approximately $2.7 million in the current year compared to approximately $1.9 million in the prior year. Professional fees increased approximately $0.3 million over the prior year. The remainder of the fluctuation results from increases in most general and administrative categories. We expect selling, general and administrative expenses in future periods to be consistent with current year levels.
Interest expense of approximately $0.2 million in the current year is consistent with prior year expense.
Interest income of approximately $0.4 million in the current year is consistent with prior year income.
Comparison of Fiscal Years Ended January 31, 2010 and 2009
Net Sales and Revenue – Net sales and revenue in fiscal year 2009 were approximately $170.1 million, a $101.5 million increase from approximately $68.6 million in fiscal year 2008. Net sales and revenue do not include sales from retail and real estate operations classified in discontinued operations. The increase was primarily caused by higher sales in our alternative energy segment of approximately $101.0 million. Net sales and revenue from our real estate segment of approximately $913,000 were consistent with the prior year amount of approximately $364,000.
Gross Profit – Gross profit was approximately $20.7 million in fiscal year 2009 versus approximately $1.0 million for fiscal year 2008. This represents an increase of approximately $19.7 million. Gross profit for fiscal year 2009 increased by approximately $21.1 million over the prior year as a result of operations in the alternative energy segment. Our real estate segment had gross loss for fiscal year 2009 of approximately $1.2 million compared to gross profit of approximately $0.2 million in the prior year.
Selling, General and Administrative Expenses– Selling, general and administrative expenses for fiscal year 2009 were approximately $6.2 million, consistent with the approximately $6.4 million for fiscal year 2008.
Interest Income – Interest income decreased to approximately $0.4 million for fiscal year 2009 from approximately $2.0 million for fiscal year 2008. The decline generally results from lower yields earned on our excess cash in the current year compared to the prior year. The lower yields are a result of the overall macroeconomic environment and not a result of a shift to investments with less risk.
Interest Expense – Interest expense increased to approximately $4.7 million for fiscal year 2009 from approximately $3.2 million for fiscal year 2008. The increase in interest expense was primarily attributable to the alternative energy segment as we had higher amounts of average debt outstanding upon the completion of One Earth’s ethanol plant.
Loss on Early Termination of Debt –During fiscal year 2009, we completed the early payoff of approximately $8.0 million of mortgage debt prior to maturity. As a result, we expensed certain unamortized financing costs and prepayment penalties of approximately $89,000 as loss on early termination of debt.
Equity in Income of Unconsolidated Ethanol Affiliates – During fiscal years 2009 and 2008, we recognized income of approximately $6.0 million and approximately $0.8 million, respectively from our equity
35
investments in Big River and Patriot. Big River operates an ethanol facility with a nameplate capacity of 92 million gallons. Patriot completed construction of its ethanol facility with a nameplate capacity of 100 million gallons during the second quarter of fiscal year 2008. Income from Big River was approximately $2.5 million and approximately $2.4 million in fiscal years 2009 and 2008, respectively. We recorded income of approximately $3.5 million and a loss of approximately $1.5 million from Patriot in fiscal years 2009 and 2008, respectively. Patriot benefited in fiscal year 2009 from a full year of production and favorable crush spreads, particularly during the latter half of calendar year 2009.
Income from Synthetic Fuel Investments – Results for fiscal year 2008 reflect the impact of our equity investment in two limited partnerships, Colona and Somerset, which produced synthetic fuels. We recognized income from the sales of our interests in Colona and Somerset subject to certain annual limitations and production levels. The Section 29/45K tax credit program expired on December 31, 2007. The income recognized in fiscal year 2008 represents the final settlements related to Colona and Somerset as all synthetic fuel production ceased during fiscal year 2007. We do not anticipate additional income or loss from the sales of our Colona and Somerset partnership interests.
We also sold our membership interest in the limited liability company that owned a synthetic fuel facility in Gillette, Wyoming. The plant was subsequently sold and during the third quarter of fiscal year 2006, we modified our agreement with the owners and operators of the synthetic fuel facility. Based on the terms of the modified agreement, we currently are not able to predict the likelihood and timing of collecting payments related to production occurring after September 30, 2006. Thus, we cannot currently predict the timing of income recognition, if any, related to production occurring subsequent to September 30, 2006.
Other Income – During fiscal year 2009, Levelland Hockley entered into an agreement to settle litigation and received $1.5 million as a condition of the settlement. Of the proceeds received, approximately $0.3 million was recognized as other income during fiscal year 2009.
During fiscal year 2009, Levelland Hockley received notification from the United States Department of Agriculture that Levelland Hockley had been approved to receive funds under the Advanced Biofuel Producer Program. As a result, approximately $0.5 million was recognized as other income during fiscal year 2009.
Losses on Derivative Financial Instruments – We recognized losses of $2.5 million and $3.8 million during fiscal years 2009 and 2008, respectively, related to forward interest rate swaps that Levelland Hockley and One Earth entered into during fiscal year 2007. During fiscal year 2009, Levelland Hockley’s loss was $0.5 million and One Earth’s loss was $2.0 million. During fiscal year 2008, Levelland Hockley’s loss was $0.8 million and One Earth’s loss was $3.0 million.
Income Taxes– Our effective tax rate was a provision of 31.1% and a benefit of 31.1% for fiscal years 2009 and 2008, respectively. Our effective tax rate was lower than the statutory rate in fiscal years 2009 and 2008, as the noncontrolling interests in the income or loss of consolidated subsidiaries is presented in the statement of operations after income tax benefit or provision.
Loss/Income from Continuing Operations Including Noncontrolling Interests– As a result of the foregoing, income from continuing operations including noncontrolling interests was approximately $10.0 million for fiscal year 2009 versus a loss of approximately $6.0 million for fiscal year 2008.
Discontinued Operations –During fiscal year 2009, we closed our remaining retail store and warehouse operations and reclassified them as discontinued operations. As a result of these closings and certain other retail store and real estate property closings from prior years, we had income from discontinued operations, net of tax benefit, of approximately $1.4 million in fiscal year 2009 compared to a loss of approximately
36
$2.2 million in fiscal year 2008. We sold or abandoned five properties classified as discontinued operations in fiscal year 2009 compared to selling 6 properties in fiscal year 2008. As a result, we had a gain from disposal of discontinued operations, net of a tax provision, of approximately $1.2 million in fiscal year 2009 compared to approximately $1.8 million in fiscal year 2008.
Noncontrolling Interests – (Income) loss related to noncontrolling interests of approximately $(3.9) million and approximately $3.2 million for fiscal years 2009 and 2008, respectively, represents the owners’ (other than us) share of the income or loss of Levelland Hockley and One Earth. Noncontrolling interests of Levelland Hockley and One Earth was approximately $(1.4) million and approximately $(2.5) million, respectively during fiscal year 2009 and approximately $2.4 million and approximately $0.8 million, respectively during fiscal year 2008.
Net Loss/Income Attributable to REX Common Shareholders– As a result of the foregoing, net income attributable to REX common shareholders was approximately $8.7 million for fiscal year 2009 versus net loss of approximately $3.3 million for fiscal year 2008.
In addition to the information discussed above, the following sections discuss the results of operations for each of our business segments and corporate and other.
Alternative Energy
The alternative energy segment includes the consolidated financial statements of Levelland Hockley and One Earth, our other investments in ethanol facilities, the income related to those investments and certain administrative expenses. Fiscal year 2008 was the first year that this segment had sales as Levelland Hockley commenced production operations during the second quarter of fiscal year 2008. One Earth began limited production operations late in the second quarter of fiscal year 2009 and became fully operational during the third quarter of fiscal year 2009.
|
|
|
|
|
|
|
|
|
|
|
|
Years Ended January 31, |
|
||||
|
|
|
2010 |
|
2009 |
|
||
|
|
|
|
|
|
|
||
|
|
|||||||
|
Ethanol |
|
$ |
140,443 |
|
$ |
55,989 |
|
|
Dried distiller grains |
|
|
20,223 |
|
|
6,478 |
|
|
Wet distiller grains |
|
|
7,953 |
|
|
5,449 |
|
|
Other |
|
|
556 |
|
|
307 |
|
|
|
|
|
|
|
|
|
|
|
Total |
|
$ |
169,175 |
|
$ |
68,223 |
|
|
|
|
|
|
|
|
|
|
The following table summarizes selected operating data from Levelland Hockley and One Earth:
|
|
|
|
|
|
|
|
|
|
|
|
Years Ended January 31, |
|
||||
|
|
|
2010 |
|
2009 |
|
||
|
|
|
|
|
|
|
||
|
Average selling price per gallon of ethanol |
|
$ |
1.68 |
|
$ |
2.14 |
|
|
Average selling price per ton of dried distiller grains |
|
$ |
112.29 |
|
$ |
180.42 |
|
|
Average selling price per ton of wet distiller grains |
|
$ |
41.53 |
|
$ |
51.74 |
|
|
Average cost per bushel of grain |
|
$ |
3.58 |
|
$ |
4.82 |
|
|
Average cost of natural gas (per mmbtu) |
|
$ |
4.28 |
|
$ |
9.01 |
|
37
Net sales and revenue for the current year increased by $101.0 million over the prior year to $169.2 million, primarily a result of One Earth becoming fully operational during the third quarter of fiscal year 2009. The average selling price per gallon of ethanol declined from $2.14 in the prior year to $1.68 in the current year. Our sales were based upon 83.6 million gallons of ethanol in the current year compared to 26.2 million gallons in the prior year.
Gross profit from these sales was approximately $21.9 million during fiscal year 2009 compared to approximately $0.8 million during the fiscal year 2008. Gross profit improved primarily as a result of One Earth beginning operations in fiscal year 2009. The crush spread realized improved during the third and fourth quarters of fiscal year 2009, which is when One Earth began operations.
Selling, general and administrative expenses were approximately $4.1 million in fiscal year 2009, a $0.2 million decrease from approximately $4.3 million in fiscal year 2008. We incurred a non cash impairment charge of $1.3 million in fiscal year 2008 related to the write off of goodwill associated with Levelland Hockley. We also incurred approximately $0.7 million in increased expenses during fiscal year 2009 related to the start of operations at One Earth.
Interest expense increased approximately $1.7 million in fiscal year 2009 compared to fiscal year 2008 to approximately $4.5 million, as we no longer capitalize interest on the One Earth credit facility subsequent to the commencement of operations at the plant. In addition, One Earth borrowed approximately $49.0 million during fiscal year 2009; the resulting higher outstanding debt amount also contributed to the increase in interest expense.
Other income increased approximately $0.8 million in fiscal year 2009 compared to fiscal year 2008. The increase is a result of Levelland Hockley recognizing a legal settlement of approximately $0.3 million and grant income of approximately $0.5 million in fiscal year 2009.
Income from equity method investments in Big River and Patriot increased from approximately $0.8 million in fiscal year 2008 to approximately $6.0 million in fiscal year 2009. We recognized approximately $2.5 million of income from our investment in Big River in fiscal year 2009 which is consistent with the fiscal year 2008 amount of approximately $2.4 million. We recognized approximately $3.5 million of income from our investment in Patriot in fiscal year 2009, which is approximately $5.0 million higher than the loss of approximately $1.5 million in fiscal year 2008. The fluctuation related to income from Patriot is primarily a result of the start up of production in fiscal year 2008. Patriot was in production for approximately four months during fiscal year 2008.
Losses on derivative financial instruments held by One Earth and Levelland were $2.5 million in fiscal year 2009 compared to $3.8 million in fiscal year 2008.
As a result of the factors discussed above, segment profit increased to approximately $17.8 million in fiscal year 2009 from a loss of approximately $9.0 million in fiscal year 2008.
Real Estate
The real estate segment includes all owned and sub-leased real estate including those previously used as retail store and distribution center operations, our real estate leasing activities and certain administrative expenses. It excludes results from discontinued operations.
At January 31, 2010, we had lease or sub-lease agreements, as landlord, for all or parts of ten former retail stores (108,000 square feet leased and 35,000 square feet vacant). We own nine of these properties and are the tenant/sub landlord for one of the properties. We have 31 owned former retail stores (385,000 square
38
feet), and one former distribution center (180,000 square feet), that are vacant at January 31, 2010. We are marketing these vacant properties to lease or sell. In addition, one former distribution center is partially leased (156,000 square feet), partially occupied by our corporate office personnel (10,000 square feet) and partially vacant (300,000 square feet).
Net sales and revenue for fiscal year 2009 of approximately $0.9 million increased approximately $0.5 million over the fiscal year 2008 amount of approximately $0.4 million. The increase in revenue is primarily a result of 15 properties leased to Appliance Direct for a portion of fiscal year 2009.
Gross loss from this segment was approximately $1.2 million during fiscal year 2009 compared to gross profit of approximately $0.2 million during fiscal year 2008. Gross loss increased as a result of the higher levels of vacant properties.
Selling, general and administrative expenses were approximately $183,000 in fiscal year 2009, consistent with the approximately $289,000 in fiscal year 2008.
As a result of the factors discussed above, segment loss increased to a loss of approximately $1.4 million in fiscal year 2009 from segment profit of approximately $0.2 million in fiscal year 2008.
Corporate and Other
There was no income from synthetic fuel investments in fiscal year 2009, compared to approximately $0.7 million in fiscal year 2008. The income recognized in fiscal year 2008 represents the estimated final settlements related to Colona and Somerset as all synthetic fuel production ceased during fiscal year 2007. We do not expect additional income or loss from the Colona and Somerset partnership sales.
Selling, general and administrative expenses were approximately $1.9 million in fiscal year 2009, consistent with the approximately $2.0 million of expenses in fiscal year 2008.
Interest expense of approximately $0.4 million in fiscal year 2009 is consistent with the expense in fiscal year 2008.
Interest income was approximately $0.3 million in fiscal year 2009 compared to approximately $1.8 million in fiscal year 2008. The decrease generally results from lower yields earned on our excess cash. The lower yields are a result of the overall macroeconomic environment and not a result of shift to investments with less risk.
39
Liquidity and Capital Resources
Our primary sources of financing have been income from operations, sales of real estate and debt financing. Our primary uses of cash have been equity and debt investments in ethanol entities, construction of ethanol plants, long term debt repayments and stock repurchases.
Outlook–Our cash balance of approximately $91.0 million includes approximately $18.4 million held by One Earth. Pursuant to its debt agreement, One Earth is limited with respect to paying dividends. Thus, we expect that One Earth will use a majority of its cash for working capital needs. All of our ethanol investments have significant amounts of long term debt and we expect these organizations to limit the payment of dividends based upon working capital needs, debt service requirements and the requirements of their respective loan agreements.
We continue to investigate investment opportunities in various companies and industries. Other possible uses of our excess cash are to pay down long term mortgage debt and repurchase our common stock. In general, we will pay down long term debt when the interest rate environment is unfavorable as it relates to the type of debt (fixed rate versus variable rate) and if the specific debt does not contain significant prepayment penalties. Such pay downs are carried out at levels that do not impede on other cash requirements we may have, such as investments in prospective entities we are investigating. We typically repurchase our common stock when our stock price is trading at prices we deem to be a discount to the underlying value of our net assets. Such purchases are carried out at levels that do not impede on other cash requirements we may have, such as prospective investments in entities we are investigating. Historically, we have not incurred additional borrowings under our debt agreements to fund repurchases of our common stock. We also plan to seek and evaluate other various investment opportunities including energy related, agricultural or other ventures we believe fit our investment criteria. We can make no assurances that we will be successful in our efforts to find such opportunities.
During the first quarter of fiscal year 2011, we are expecting our financial performance from our ethanol plants to decline compared to the fourth quarter of fiscal year 2010 (excluding the impairment charges and loss on deconsolidation related to Levelland Hockley) as the crush spread has decreased from 2010 levels. The near month crush spread (determined by information on CBOT) averaged approximately $0.02 per gallon of ethanol during the first quarter of fiscal year 2011 compared to approximately $0.29 per gallon of ethanol during calendar year 2010. However, this trend has been partially offset by increases in the selling price of distillers grains.
Operating Activities – Net cash provided by operating activities was approximately $27.9 million for fiscal year 2010 compared to $11.0 million in fiscal year 2009. For fiscal year 2010, operating cash flow was provided by net income of approximately $8.7 million including the impact of Levelland Hockley related impairment charges and the loss on deconsolidation of approximately $16.1 million, real estate impairment charges of approximately $1.0 million and non-cash items of approximately $(0.9) million, which consist of deferred income, the deferred income tax provision, gain on disposal of real estate and property and equipment, income from ethanol investments, and depreciation and amortization. Cash was provided by dividends received from our equity method investees (as returns on investment) of approximately $5.0 million, primarily a result of increased profitability at these entities. Additionally, cash was provided by a refund on income taxes of approximately $4.3 million resulting from net operating losses carried back to prior years. Accounts receivable increased approximately $2.5 million, primarily a result of the timing of products shipped and the receipt of customer payments at One Earth. Prepaid expense and other assets increased approximately $1.1 million, primarily as a result of an increase in property taxes receivable that One Earth pays and then receives a partial rebate from various taxing authorities in connection with a tax increment financing district. Other liabilities decreased approximately $1.7 million, primarily a result of payments we made related to our contingent consideration liability associated with the NuGen acquisition.
40
Other long term assets increased approximately $0.9 million, primarily a result of an increase in property taxes receivable that One Earth pays and then receives a partial rebate from various taxing authorities in connection with a tax increment financing district and an increase in various deposits One Earth is required to maintain with utility vendors.
Net cash provided by operating activities was approximately $11.0 million for fiscal year 2009. For fiscal year 2009, operating cash flow was provided by net income of approximately $12.6 million adjusted for the impact of impairment charges of $1.5 million and non-cash items of $(0.9) million, which consist of deferred income, the deferred income tax provision, gain on disposal of real estate and property and equipment, income from ethanol investments, and depreciation and amortization. Cash was provided by a decrease in inventory of approximately $15.7 million, primarily due to our exit of the retail business. Additionally, cash was provided by a decrease in other assets of approximately $1.9 million, primarily a result of prepaid commissions related to extended service contracts decreasing, reflecting our lower sales of this service. Accounts payable decreased approximately $8.5 million, primarily a result of our exit of the retail business. Income taxes refundable increased approximately $4.9 million as a result of an income tax loss carryback created during fiscal year 2009. Other liabilities decreased approximately $2.1 million, as accruals for costs associated with our exit of the retail business were paid in fiscal year 2009. Accounts receivable increased approximately $4.9 million; this was primarily a result of One Earth commencing production operations in fiscal year 2009.
Investing Activities – Net cash used in investing activities was approximately $5.8 million for fiscal year 2010 compared to approximately $30.7 million for fiscal year 2009. Capital expenditures in fiscal year 2010 totaled approximately $6.0 million, the majority of which was for the construction of additional corn storage at One Earth’s ethanol plant. We used cash of approximately $9.2 million for our acquisition of NuGen. Cash of approximately $8.0 million was provided by proceeds from the sale of real estate and property and equipment. We received cash of approximately $1.0 million as Patriot repaid the remaining balance on their note payable to us.
Net cash used in investing activities was $30.7 million for fiscal year 2009. Capital expenditures in fiscal year 2009 totaled $35.7 million, the majority of which was for the construction of One Earth’s ethanol plant. Cash of $4.8 million was provided by proceeds from the sale of real estate and property and equipment.
Financing Activities – Net cash used in financing activities was approximately $31.5 million for fiscal year 2010 compared to cash provided of approximately $28.2 million for fiscal year 2009. During fiscal year 2010, repayments of debt totaled approximately $24.8 million. Stock option exercises in fiscal year 2010 generated cash of approximately $1.5 million. During fiscal year 2010, we purchased approximately 0.5 million shares of our common stock for approximately $8.2 million in open market transactions.
Cash provided by financing activities was $28.2 million for fiscal year 2009. During fiscal year 2009, we borrowed $49.0 million in long term debt. One Earth accounted for all of the borrowing as One Earth used loan proceeds to complete construction of its ethanol plant. Repayments of debt totaled $20.4 million during fiscal year 2009. Stock option exercises in fiscal year 2009 generated cash of $6.0 million. During fiscal year 2009, we purchased approximately 0.6 million shares of our common stock for $6.5 million in open market transactions.
At January 31, 2011, we had a remaining authorization from our Board of Directors to purchase 468,044 shares of our common stock. We plan to hold all acquired shares in treasury for possible future use.
At January 31, 2011, we had approximately $81.0 million of debt outstanding at a weighted average interest rate of 3.38%, with maturities from August 2011 to November 2015. During fiscal year 2010, we paid off approximately $24.8 million of long-term mortgage debt from scheduled repayments and early payoffs.
41
During fiscal year 2009, we paid off approximately $20.4 million of long-term mortgage debt from scheduled repayments and early payoffs.
One Earth Subsidiary Level Debt
In September 2007, One Earth entered into a $111,000,000 financing agreement consisting of a construction loan agreement for $100,000,000 together with a $10,000,000 revolving loan and a $1,000,000 letter of credit with First National Bank of Omaha. The construction loan was converted into a term loan on July 31, 2009. The term loan bears interest at variable interest rates ranging from LIBOR plus 300 basis points to LIBOR plus 310 basis points (3.1% to 3.3% at January 31, 2011). Beginning with the first quarterly payment on October 8, 2009, payments are due in 20 quarterly payments of principal plus accrued interest with the principal portion calculated based on a 120 month amortization schedule. One final installment will be required on the maturity date (July 31, 2014) for the remaining unpaid principal balance with accrued interest. This debt is recourse only to One Earth and not to REX American Resources Corporation or any of its other subsidiaries.
Borrowings are secured by all property of One Earth. As of January 31, 2011, approximately $78.7 million was outstanding on the term loan. One Earth is also subject to certain financial covenants under the loan agreement, including required levels of EBITDA, debt service coverage ratio requirements, net worth requirements and other common covenants. One Earth was in compliance with all covenants at January 31, 2011. One Earth paid approximately $1,364,000 in costs related to obtaining its financing arrangement. These costs are recorded as prepaid loan fees and are being amortized over the loan term. At January 31, 2011, our proportionate share of restricted assets related to One Earth was approximately $59.8 million. One Earth’s restricted assets total approximately $81.2 million. Such assets may not be paid in the form of dividends or advances to the parent company or other members of One Earth per the terms of the loan agreement with First National Bank of Omaha.
One Earth has no outstanding borrowings on the $10,000,000 revolving loan as of January 31, 2011. One Earth also has access to a secondary line of credit of up to $10,000,000 with First National Bank of Omaha, established as part of the original $100,000,000 term loan and made accessible as a revolving line of credit as term loan payments were made. The amount available is reduced by $250,000 on a quarterly basis. At January 31, 2011 and 2010, One Earth had $8,750,000 and $10,000,000, respectively, on the secondary line of credit available on this revolving line of credit. One Earth does not have any borrowings on the secondary line of credit at January 31, 2011 or 2010.
One Earth has issued letters of credit that total approximately $0.3 million at January 31, 2011.
On a consolidated basis, approximately 45.8% of our net assets (including equity method investees) are restricted as of January 31, 2011. Including only our consolidated subsidiaries, approximately 24.4% of our net assets are restricted as of January 31, 2011.
Tabular Disclosure of Contractual Obligations
In the ordinary course of business, we enter into agreements under which we are obligated to make legally enforceable future cash payments. These agreements include obligations related to purchasing inventory, long term debt and interest rate management.
The following table summarizes by category expected future cash outflows associated with contractual
42
obligations in effect as of January 31, 2011 (amounts in thousands):
|
|
|
|
|
|
|
|
|
|
|
|
|
|
|
|
|
|
|
|
|
Payment due by period |
|
|||||||||||||
|
|
|
|
|
|||||||||||||
|
Contractual Obligations |
|
Total |
|
Less |
|
1-3 |
|
3-5 |
|
More than |
|
|||||
|
|
|
|
|
|
|
|
|
|
|
|
|
|||||
|
|
|
|
|
|
|
|
|
|
|
|
|
|||||
|
Lease obligations |
|
$ |
172 |
|
$ |
172 |
|
$ |
— |
|
$ |
— |
|
$ |
— |
|
|
Long-term debt obligations |
|
|
80,987 |
|
|
10,014 |
|
|
22,835 |
|
|
48,138 |
|
|
— |
|
|
Interest on variable rate debt (a) |
|
|
8,049 |
|
|
2,549 |
|
|
4,239 |
|
|
1,261 |
|
|
— |
|
|
Interest on fixed rate debt |
|
|
366 |
|
|
129 |
|
|
180 |
|
|
57 |
|
|
— |
|
|
Other (b) |
|
|
4,298 |
|
|
1,186 |
|
|
3,112 |
|
|
— |
|
|
— |
|
|
|
|
|
|
|
|
|
|
|
|
|
|
|
|
|
|
|
|
Total (c) |
|
$ |
93,872 |
|
$ |
14,050 |
|
$ |
30,366 |
|
$ |
49,456 |
|
$ |
— |
|
|
|
|
|
|
|
|
|
|
|
|
|
|
|
|
|
|
|
|
|
|
|
|
|
(a) |
The interest rates effective as of January 31, 2011 for variable rate loans were used to calculate future payments of interest on variable rate debt. |
|
|
|
|
|
|
(b) |
Amounts represent primarily payment due for rail car usage contracts at One Earth Energy. |
|
|
|
|
|
|
(c) |
We are not able to determine the likely settlement period for uncertain tax positions, accordingly approximately $3.0 million of uncertain tax positions and related interest and penalties have been excluded from the table above. We are not able to determine the likely settlement period, if any, for interest rate swaps, accordingly approximately $5.5 million of liabilities for derivative financial instruments have been excluded from the table above. |
Seasonality and Quarterly Fluctuations
The impact of seasonal and quarterly fluctuations has not been material to our results of operations for the past three fiscal years.
Impact of Inflation
The impact of inflation has not been material to our results of operations for the past three fiscal years.
Critical Accounting Policies
We believe the application of the following accounting policies, which are important to our financial position and results of operations, require significant assumptions, judgments and estimates on the part of management. We base our assumptions, judgments, and estimates on historical experience, current trends and other factors that management believes to be relevant at the time our consolidated financial statements are prepared. On a regular basis, management reviews the accounting policies, assumptions, estimates and judgments to ensure that our financial statements are presented in accordance with generally accepted accounting principles (GAAP). However, because future events and their effects cannot be determined with certainty, actual results could differ from our assumptions and estimates, and such differences could be material. Further, if different assumptions, judgments and estimates had been used, the results could have been different and such differences could be material. For a summary of all of our accounting policies, including the accounting policies discussed below, see Note 1 of the Notes to the Consolidated Financial Statements. Management believes that the following accounting policies are the most critical to aid in fully understanding and evaluating our reported financial results, and they require management’s most difficult,
43
subjective or complex judgments, resulting from the need to make estimates about the effect of matters that are inherently uncertain.
Revenue Recognition – We recognize sales from ethanol and distillers grains when title transfers to customers, upon shipment from our plant. Shipping and handling charges to ethanol customers are included in net sales and revenue.
We include income from our real estate leasing activities in net sales and revenue. We account for these leases as operating leases. Accordingly, minimum rental revenue is recognized on a straight-line basis over the term of the lease.
We sold retail product service contracts covering periods beyond the normal manufacturers’ warranty periods, usually with terms of coverage (including manufacturers’ warranty periods) of between 12 to 60 months. Contract revenues and sales commissions are deferred and amortized on a straight-line basis over the life of the contracts after the expiration of applicable manufacturers’ warranty periods. We retain the obligation to perform warranty service and such costs are charged to operations as incurred. All related revenue and expense is classified in discontinued operations.
We recognized income from synthetic fuel partnership sales as the synthetic fuel was produced and sold except for operations at the Gillette facility as we do not believe that collection of our proceeds for production occurring subsequent to September 30, 2006 is reasonably assured from that plant. See Note 4 of the Notes to the Consolidated Financial Statements for a further discussion of synthetic fuel partnership sales.
Investments –The method of accounting applied to long-term investments, whether consolidated, equity or cost, involves an evaluation of the significant terms of each investment that explicitly grant or suggest evidence of control or influence over the operations of the investee and also includes the identification of any variable interests in which we are the primary beneficiary. The evaluation of consolidation under ASC 810 “Consolidation” is complex and requires judgments to be made. We consolidated the results of two majority owned subsidiaries, Levelland Hockley and One Earth, on a one month lag during fiscal year 2010. As a result of losing control of Levelland Hockley at the end of fiscal year 2010, we deconsolidated the subsidiary’s balance sheet and will apply the equity method of accounting prospectively. Investments in businesses that we do not control, or maintain a majority voting interest or maintain a primary beneficial interest, but for which we have the ability to exercise significant influence over operating and financial matters, are accounted for using the equity method. Investments in which we do not have the ability to exercise significant influence over operating and financial matters are accounted for using the cost method.
Investments in debt securities are considered “held to maturity”, “available for sale”, or “trading securities” under ASC 320, “Investments-Debt and Equity Securities”. Under ASC 320, held to maturity securities are required to be carried at their cost; while available-for-sale securities are required to be carried at their fair value, with unrealized gains and losses, net of income taxes, that are considered temporary in nature recorded in accumulated other comprehensive income (loss) in the accompanying Consolidated Balance Sheets. The fair values of our investments in debt securities are determined based upon market quotations and various valuation techniques, including discounted cash flow analysis.
We periodically evaluate our investments for impairment due to declines in market value considered to be other than temporary. Such impairment evaluations include, in addition to persistent, declining market prices, general economic and company-specific evaluations. If we determine that a decline in market value is other than temporary, then a charge to earnings is recorded in the accompanying Consolidated Statements of Operations for all or a portion of the unrealized loss, and a new cost basis in the investment is established.
44
Inventory Reserves – Inventory is recorded at the lower of cost or market. The market value of inventory is often dependent upon fluctuating commodity prices. If these estimates are inaccurate, we may be exposed to market conditions that require an additional reduction in the value of certain inventories affected. We provide an inventory reserve, which is treated as a permanent write down of inventory, for inventory items that have a cost greater than net realizable value. No inventory reserve was recorded at January 31, 2011 and approximately $0.6 million was recorded at January 31, 2010. Fluctuations in the inventory reserve generally relate to the levels and composition of such inventory at a given point in time. Assumptions we use to estimate the necessary reserve have not significantly changed over the last three fiscal years other than we no longer provide a reserve for obsolete retail inventory as this inventory was liquidated during fiscal year 2009. The assumptions we currently use include our estimates of the selling prices of ethanol and distillers grains.
Financial Instruments – Forward grain purchase and ethanol sale contracts are accounted for under the “normal purchases and normal sales” scope exemption of ASC 815, “Derivatives and Hedging” because these arrangements are for purchases of grain and sales of ethanol that will be delivered in quantities expected to be used by us over a reasonable period of time in the normal course of business. We use derivative financial instruments to manage our balance of fixed and variable rate debt. We do not hold or issue derivative financial instruments for trading or speculative purposes. Interest rate swap agreements involve the exchange of fixed and variable rate interest payments and do not represent an actual exchange of the notional amounts between the parties. Our swap agreements were not designated for hedge accounting pursuant to ASC 815. The interest rate swaps are recorded at their fair values and the changes in fair values are recorded as gain or loss on derivative financial instruments in the accompanying Consolidated Statements of Operations.
Income Taxes – Income taxes are recorded based on the current year amounts payable or refundable, as well as the consequences of events that give rise to deferred tax assets and liabilities based on differences in how those events are treated for tax purposes, net of valuation allowances. We base our estimate of deferred tax assets and liabilities on current tax laws and rates and other expectations about future outcomes. Changes in existing regulatory tax laws and rates and future business results may affect the amount of deferred tax liabilities or the valuation of deferred tax assets over time. We have established valuation allowances for certain state net operating loss carryforwards and other deferred tax assets. We determined that it is more likely than not that we will be able to generate sufficient taxable income in future years to allow for the full utilization of the federal AMT credit carryforward and other deferred tax assets other than those reserved. In determining the need for a valuation allowance, we have assumed that our ethanol plants and real estate assets will begin generating taxable income by fiscal year 2012. We are projecting that the operations of One Earth that began in fiscal year 2009 will continue to be profitable. We are assuming that we will be relatively successful in our real estate marketing efforts. In addition, we have considered the fact that our AMT credit carryforward has an indefinite life. In general, we have used approximately $14.0 million as the assumed average of future years’ pre-tax income. We believe our assumed target level of earnings is reasonable based upon expectations of real estate rental income and ethanol plant operating income. In addition, we considered other positive factors in our assessment. Although during fiscal years 2008, 2009 and 2010 we realized a taxable loss, historically, we have generated cumulative profitability over the past several years and expect to begin producing taxable income by fiscal year 2012 through our ethanol and real estate operations. Furthermore, the taxable loss is attributable, in large part, to accelerated depreciation deductions for income tax purposes. Such deductions are not expected to continue at levels we have seen in the last three years. In addition, we have significant financial resources to deploy in future income producing activities.
The valuation allowance was approximately $1.2 million and approximately $0.6 million at January 31, 2011 and January 31, 2010, respectively. Should estimates of future income differ significantly from our prior estimates, we could be required to make a material change to our deferred tax valuation allowance. The
45
primary assumption used to estimate the valuation allowance has been estimates of future state taxable income. Such estimates can have material variations from year to year based upon expected levels of income from our ethanol plants, leasing income and gains on real estate sales. Factors that could negatively affect future taxable income include adverse changes in the commercial real estate market and the ethanol crush spread. Our accounting for deferred tax consequences represents management’s best estimate of future events that can be appropriately reflected in the accounting estimates.
We adopted the provisions of ASC 740-10-25-5 for uncertain tax positions on February 1, 2007. As a result of the adoption of this accounting standard, we recorded a $0.3 million decrease to retained earnings. As of January 31, 2011, total unrecognized tax benefits were approximately $2.7 million, and accrued penalties and interest were approximately $0.2 million. If we were to prevail on all unrecognized tax benefits recorded, approximately $0.1 million of the reserve would benefit the effective tax rate. In addition, the impact of penalties and interest would also benefit the effective tax rate. Interest and penalties associated with unrecognized tax benefits are recorded within income tax expense.
It is reasonably possible that the amount of the unrecognized tax benefit with respect to certain unrecognized tax positions will increase or decrease during the next 12 months; however, we do not expect the change to have a material effect on results of operations or financial position.
On a quarterly and annual basis, we accrue for the effects of open uncertain tax positions and the related potential penalties and interest. Should future estimates of open uncertain tax positions differ from our current estimates, we could be required to make a material change to our accrual for uncertain tax positions. In addition, new income tax audit findings could also require us to make a material change to our accrual for uncertain tax positions.
Recoverability of Long-Lived Assets – Given the nature of our business, each income producing property must be evaluated separately when events and circumstances indicate that the value of that asset may not be recoverable. We recognize an impairment loss when the fair value of the asset is less than its carrying amount. We generally use expected future cash flows on a discounted basis and appraisals of specific properties to estimate fair value. Changes in the real estate market for particular locations could result in changes to our estimates of the property’s value upon disposal. In addition, changes in expected future cash flows from our ethanol plants could result in additional impairment charges. Any adverse change in the spread between ethanol and grain prices could result in additional impairment charges.
Costs Associated with Exit Activities and Restructuring Costs– Restructuring charges included severance and associated employee termination costs, lease termination fees and other costs associated with the exit of our retail business. We recorded severance and associated employee termination costs pursuant to ASC 712, ASC 715 and ASC 420. ASC 420 requires that lease termination fees, net of expected sublease rental income, be recorded once the leased facility is no longer actively used in a revenue producing manner. Future changes to our estimates of employee layoffs or leased stores abandoned are unlikely to have a material impact on our restructuring accrual.
At January 31, 2011, we have an accrual of approximately $0.1 million for costs related to restructuring.
New Accounting Pronouncements
Effective February 1, 2011, we will be required to adopt the second phase of the amended guidance in ASC Topic 820, “Fair Value Measurements and Disclosures”, which will require us to disclose information in the reconciliation of recurring Level 3 measurements about purchases, sales, issuances and settlements on a gross basis, separately for assets and liabilities. The adoption of this amended guidance will require expanded disclosure in the consolidated financial statements but will not impact financial results.
46
There were no other new accounting standards issued during fiscal year 2010 that had or are expected to have a material impact on our financial position, results of operations, or cash flows.
|
|
|
|
Item 7A. |
Quantitative and Qualitative Disclosures About Market Risk |
We are exposed to the impact of market fluctuations associated with interest rates and commodity prices as discussed below.
Interest Rate Risk
We are exposed to market risk from changes in interest rates. Exposure to interest rate risk results primarily from holding term and revolving loans that bear variable interest rates. Specifically, we have approximately $79 million in variable-rate debt as of January 31, 2011. Interest rates on our variable-rate debt are determined based upon the market interest rate of LIBOR plus 300 to 400 basis points. A 10% adverse change (for example from 4.0% to 4.4%) in market interest rates would affect our interest cost on such debt by approximately $0.3 million per year in the aggregate.
One Earth entered into two forward interest rate swaps in the notional amounts of $50.0 million and $25.0 million with the First National Bank of Omaha during fiscal years 2008 and 2007. The $50.0 million swap fixed the variable interest rate of a portion of One Earth’s term loan at 7.9%, while the $25.0 million swap fixed the variable interest rate of a portion of One Earth’s term loan at 5.49%. The swap settlements commenced on July 31, 2009; the $50.0 million swap terminates on July 8, 2014 and the $25.0 million swap terminates on July 31, 2011. A hypothetical 10% change (for example, from 4.0% to 3.6%) in market interest rates at January 31, 2011 would change the fair value of the interest rate swaps by approximately $0.6 million.
Commodity Price Risk
We manage a portion of our risk with respect to the volatility of commodity prices inherent in the ethanol industry by using forward purchase and sale contracts. One Earth has purchase commitments for approximately 4.9 million bushels of corn, the principal raw material for its ethanol plant. One Earth expects to take delivery of the corn by April 2011. One Earth has sales commitments for approximately 6.3 million gallons of ethanol and 29,200 tons of distillers grains. One Earth expects to deliver the ethanol and distillers grains by April 2011. Approximately 1% of our forecasted ethanol production during the next 12 months has been sold under fixed-price contracts. As a result, the effect of a 10% adverse move in the price of ethanol from the current pricing would result in a decrease in annual revenues of approximately $23.9 million for the remaining 99% of forecasted ethanol production. Similarly, approximately 1% of our estimated corn usage for the next 12 month was subject to fixed-price contracts. As a result, the effect of a 10% adverse move in the price of corn for current pricing would result in an increase in annual cost of goods sold of approximately $21.6 million for the remaining 99% of forecasted corn usage.
47
|
|
|
Item 8. Financial Statements and Supplementary Data |
|
REX AMERICAN RESOURCES CORPORATION AND SUBSIDIARIES |
|
CONSOLIDATED BALANCE SHEETS |
|
(Amounts in Thousands) |
|
|
|
|
|
|
|
|
|
|
|
|
January 31, |
|
||||
|
|
|
|
|
||||
|
|
|
2011 |
|
2010 |
|
||
|
|
|
|
|
|
|
||
|
ASSETS |
|
|
|
|
|
||
|
CURRENT ASSETS: |
|
|
|
|
|
|
|
|
Cash and cash equivalents |
|
$ |
91,019 |
|
$ |
100,398 |
|
|
Accounts receivable-net |
|
|
9,619 |
|
|
9,123 |
|
|
Inventory- net |
|
|
7,819 |
|
|
8,698 |
|
|
Refundable income taxes |
|
|
8,503 |
|
|
12,813 |
|
|
Prepaid expenses and other |
|
|
3,055 |
|
|
2,691 |
|
|
Deferred taxes-net |
|
|
5,834 |
|
|
6,375 |
|
|
|
|
|
|
|
|
|
|
|
Total current assets |
|
|
125,849 |
|
|
140,098 |
|
|
Property and equipment-net |
|
|
169,811 |
|
|
246,874 |
|
|
Other assets |
|
|
5,907 |
|
|
8,880 |
|
|
Deferred taxes-net |
|
|
5,206 |
|
|
8,468 |
|
|
Equity method investments |
|
|
67,349 |
|
|
44,071 |
|
|
Investments in debt instruments |
|
|
— |
|
|
1,014 |
|
|
Restricted investments and deposits |
|
|
1,600 |
|
|
2,100 |
|
|
|
|
|
|
|
|
|
|
|
TOTAL ASSETS |
|
$ |
375,722 |
|
$ |
451,505 |
|
|
|
|
|
|
|
|
|
|
See notes to consolidated financial statements.
48
|
|
|
REX AMERICAN RESOURCES CORPORATION AND SUBSIDIARIES |
|
CONSOLIDATED BALANCE SHEETS (continued) |
|
(Amounts in Thousands) |
|
|
|
|
|
|
|
|
|
|
|
|
January 31, |
|
||||
|
|
|
|
|
||||
|
|
|
2011 |
|
2010 |
|
||
|
|
|
|
|
|
|
||
|
LIABILITIES AND SHAREHOLDERS’ EQUITY |
|
|
|
|
|
||
|
CURRENT LIABILITIES: |
|
|
|
|
|
|
|
|
Current portion of long term debt and capital lease obligations – alternative energy |
|
$ |
9,672 |
|
$ |
12,935 |
|
|
Current portion of long term debt – other |
|
|
342 |
|
|
371 |
|
|
Accounts payable –trade |
|
|
2,557 |
|
|
6,976 |
|
|
Deferred income |
|
|
3,982 |
|
|
7,818 |
|
|
Accrued restructuring charges |
|
|
146 |
|
|
511 |
|
|
Accrued real estate taxes |
|
|
2,393 |
|
|
2,968 |
|
|
Derivative financial instruments |
|
|
1,835 |
|
|
1,829 |
|
|
Other current liabilities |
|
|
3,640 |
|
|
5,442 |
|
|
|
|
|
|
|
|
|
|
|
Total current liabilities |
|
|
24,567 |
|
|
38,850 |
|
|
|
|
|
|
|
|
|
|
|
LONG TERM LIABILITIES: |
|
|
|
|
|
|
|
|
Long term debt and capital lease obligations – alternative energy |
|
|
69,049 |
|
|
124,093 |
|
|
Long term debt – other |
|
|
1,924 |
|
|
2,596 |
|
|
Deferred income |
|
|
2,416 |
|
|
6,396 |
|
|
Derivative financial instruments |
|
|
3,688 |
|
|
4,055 |
|
|
Other long term liabilities |
|
|
4,114 |
|
|
419 |
|
|
|
|
|
|
|
|
|
|
|
Total long term liabilities |
|
|
81,191 |
|
|
137,559 |
|
|
|
|
|
|
|
|
|
|
|
COMMITMENTS AND CONTINGENCIES |
|
|
|
|
|
|
|
|
EQUITY: |
|
|
|
|
|
|
|
|
REX shareholders’ equity: |
|
|
|
|
|
|
|
|
Common stock, 45,000 shares authorized, 29,853 shares issued at par |
|
|
299 |
|
|
299 |
|
|
Paid in capital |
|
|
142,293 |
|
|
141,698 |
|
|
Retained earnings |
|
|
296,053 |
|
|
290,984 |
|
|
Treasury stock, 20,461 and 20,045 shares |
|
|
(193,713 |
) |
|
(186,407 |
) |
|
Accumulated other comprehensive income, net of tax |
|
|
— |
|
|
49 |
|
|
|
|
|
|
|
|
|
|
|
Total REX shareholders’ equity |
|
|
244,932 |
|
|
246,623 |
|
|
Noncontrolling interests |
|
|
25,032 |
|
|
28,473 |
|
|
|
|
|
|
|
|
|
|
|
Total equity |
|
|
269,964 |
|
|
275,096 |
|
|
|
|
|
|
|
|
|
|
|
TOTAL LIABILITIES AND SHAREHOLDERS’ EQUITY |
|
$ |
375,722 |
|
$ |
451,505 |
|
|
|
|
|
|
|
|
|
|
See notes to consolidated financial statements.
49
|
|
|
REX AMERICAN RESOURCES CORPORATION AND SUBSIDIARIES |
|
|
|
CONSOLIDATED STATEMENTS OF OPERATIONS |
|
(Amounts in Thousands, Except Per Share Amounts) |
|
|
|
|
|
|
|
|
|
|
|
|
|
|
|
Years Ended January 31, |
|
|||||||
|
|
|
|
|
|||||||
|
|
|
2011 |
|
2010 |
|
2009 |
|
|||
|
|
|
|
|
|
|
|
|
|||
|
|
|
|
|
|
|
|
|
|
|
|
|
Net sales and revenue |
|
$ |
301,674 |
|
$ |
170,088 |
|
$ |
68,587 |
|
|
Cost of sales |
|
|
271,300 |
|
|
149,380 |
|
|
67,552 |
|
|
|
|
|
|
|
|
|
|
|
|
|
|
Gross profit |
|
|
30,374 |
|
|
20,708 |
|
|
1,035 |
|
|
Selling, general and administrative expenses |
|
|
(9,719 |
) |
|
(6,163 |
) |
|
(6,363 |
) |
|
Impairment charges and loss on deconsolidation |
|
|
(18,424 |
) |
|
— |
|
|
— |
|
|
Interest income |
|
|
447 |
|
|
445 |
|
|
2,044 |
|
|
Interest expense |
|
|
(5,593 |
) |
|
(4,741 |
) |
|
(3,183 |
) |
|
Loss on early termination of debt |
|
|
(48 |
) |
|
(89 |
) |
|
(9 |
) |
|
Equity in income of unconsolidated ethanol affiliates |
|
|
14,558 |
|
|
6,027 |
|
|
849 |
|
|
Income from synthetic fuel investments |
|
|
— |
|
|
— |
|
|
691 |
|
|
Other income |
|
|
310 |
|
|
748 |
|
|
— |
|
|
Losses on derivative financial instruments |
|
|
(2,116 |
) |
|
(2,487 |
) |
|
(3,797 |
) |
|
|
|
|
|
|
|
|
|
|
|
|
|
Income (loss) from continuing operations before income taxes and noncontrolling interests |
|
|
9,789 |
|
|
14,448 |
|
|
(8,733 |
) |
|
(Provision) benefit for income taxes |
|
|
(3,019 |
) |
|
(4,497 |
) |
|
2,716 |
|
|
|
|
|
|
|
|
|
|
|
|
|
|
Income (loss) from continuing operations including noncontrolling interests |
|
|
6,770 |
|
|
9,951 |
|
|
(6,017 |
) |
|
Income (loss) from discontinued operations, net of tax |
|
|
1,800 |
|
|
1,389 |
|
|
(2,241 |
) |
|
Gain on disposal of discontinued operations, net of tax |
|
|
172 |
|
|
1,212 |
|
|
1,805 |
|
|
|
|
|
|
|
|
|
|
|
|
|
|
Net income (loss) including noncontrolling interests |
|
|
8,742 |
|
|
12,552 |
|
|
(6,453 |
) |
|
Net (income) loss attributable to noncontrolling interests |
|
|
(3,673 |
) |
|
(3,900 |
) |
|
3,156 |
|
|
|
|
|
|
|
|
|
|
|
|
|
|
Net income (loss) attributable to REX common shareholders |
|
$ |
5,069 |
|
$ |
8,652 |
|
$ |
(3,297 |
) |
|
|
|
|
|
|
|
|
|
|
|
|
|
Weighted average shares outstanding – basic |
|
|
9,651 |
|
|
9,254 |
|
|
10,170 |
|
|
|
|
|
|
|
|
|
|
|
|
|
|
Basic income (loss) per share from continuing operations attributable to REX common shareholders |
|
$ |
0.32 |
|
$ |
0.65 |
|
$ |
(0.28 |
) |
|
Basic income (loss) per share from discontinued operations attributable to REX common shareholders |
|
|
0.19 |
|
|
0.15 |
|
|
(0.22 |
) |
|
Basic income per share on disposal of discontinued operations attributable to REX |
|
|
0.02 |
|
|
0.13 |
|
|
0.18 |
|
|
|
|
|
|
|
|
|
|
|
|
|
|
Basic net income (loss) per share attributable to REX common shareholders |
|
$ |
0.53 |
|
$ |
0.93 |
|
$ |
(0.32 |
) |
|
|
|
|
|
|
|
|
|
|
|
|
|
|
|
|
|
|
|
|
|
|
|
|
|
Weighted average shares outstanding – diluted |
|
|
9,825 |
|
|
9,551 |
|
|
10,170 |
|
|
|
|
|
|
|
|
|
|
|
|
|
|
Diluted income (loss) per share from continuing operations attributable to REX common shareholders |
|
$ |
0.32 |
|
$ |
0.63 |
|
$ |
(0.28 |
) |
|
Diluted income (loss) per share from discontinued operations attributable to REX common shareholders |
|
|
0.18 |
|
|
0.15 |
|
|
(0.22 |
) |
|
Diluted gain per share on disposal of discontinued operations attributable to REX common shareholders |
|
|
0.02 |
|
|
0.13 |
|
|
0.18 |
|
|
|
|
|
|
|
|
|
|
|
|
|
|
Diluted net income (loss) per share attributable to REX common shareholders |
|
$ |
0.52 |
|
$ |
0.91 |
|
$ |
(0.32 |
) |
|
|
|
|
|
|
|
|
|
|
|
|
|
Amounts attributable to REX common shareholders: |
|
|
|
|
|
|
|
|
|
|
|
Income (loss) from continuing operations, net of tax |
|
$ |
3,097 |
|
$ |
6,051 |
|
$ |
(2,861 |
) |
|
Income (loss) from discontinued operations, net of tax |
|
|
1,972 |
|
|
2,601 |
|
|
(436 |
) |
|
|
|
|
|
|
|
|
|
|
|
|
|
Net income (loss) |
|
$ |
5,069 |
|
$ |
8,652 |
|
$ |
(3,297 |
) |
|
|
|
|
|
|
|
|
|
|
|
|
See notes to consolidated financial statements.
50
|
|
|
REX AMERICAN RESOURCES CORPORATION AND SUBSIDIARIES |
|
|
|
CONSOLIDATED STATEMENTS OF SHAREHOLDERS’ EQUITY |
|
FOR THE YEARS ENDED JANUARY 31, 2011, 2010 AND 2009 |
|
|
|
(Amounts in Thousands) |
|
|
|
|
|
|
|
|
|
|
|
|
|
|
|
|
|
|
|
|
|
|
|
|
|
|
|
|
|
|
|
|
|
|
|
REX Shareholders |
|
|
|
|
|
|
|
|||||||||||||||||||
|
|
|
|
|
|
|
|
|
|
|
|||||||||||||||||||
|
|
|
Common Shares |
|
|
|
|
|
|
|
|
|
Accumulated |
|
|
|
|
|
|||||||||||
|
|
|
Issued |
|
Treasury |
|
Paid-in |
|
Retained |
|
|
Noncontrolling |
|
Total |
|
||||||||||||||
|
|
|
|
|
|
|
|
|
|
|
|
||||||||||||||||||
|
|
|
Shares |
|
Amount |
|
Shares |
|
Amount |
|
|
|
|
|
|
||||||||||||||
|
|
|
|
|
|
|
|
|
|
|
|
|
|
|
|
|
|
|
|
|
|||||||||
|
|
||||||||||||||||||||||||||||
|
Balance at January 31, 2008 |
|
|
29,813 |
|
$ |
298 |
|
|
19,094 |
|
$ |
(170,693 |
) |
$ |
141,357 |
|
$ |
285,629 |
|
$ |
— |
|
$ |
27,729 |
|
$ |
284,320 |
|
|
|
|
|
|
|
|
|
|
|
|
|
|
|
|
|
|
|
|
|
|
|
|
|
|
|
|
|
|
|
|
Net loss |
|
|
|
|
|
|
|
|
|
|
|
|
|
|
|
|
|
(3,297 |
) |
|
|
|
|
(3,156 |
) |
|
(6,453 |
) |
|
|
|
|
|
|
|
|
|
|
|
|
|
|
|
|
|
|
|
|
|
|
|
|
|
|
|
|
|
|
|
Treasury stock acquired |
|
|
|
|
|
|
|
|
1,636 |
|
|
(17,708 |
) |
|
|
|
|
|
|
|
|
|
|
|
|
|
(17,708 |
) |
|
|
|
|
|
|
|
|
|
|
|
|
|
|
|
|
|
|
|
|
|
|
|
|
|
|
|
|
|
|
|
Stock based compensation |
|
|
|
|
|
|
|
|
|
|
|
|
|
|
1,143 |
|
|
|
|
|
|
|
|
|
|
|
1,143 |
|
|
|
|
|
|
|
|
|
|
|
|
|
|
|
|
|
|
|
|
|
|
|
|
|
|
|
|
|
|
|
|
Stock options and related tax effects |
|
|
40 |
|
|
1 |
|
|
(259 |
) |
|
2,344 |
|
|
(14 |
) |
|
— |
|
|
— |
|
|
— |
|
|
2,331 |
|
|
|
|
|
|
|
|
|
|
|
|
|
|
|
|
|
|
|
|
|
|
|
|
|
|
|
|
|
|
|
|
|
|
|
|
|
|
|
|
|
|
|
|
|
|
|
|
|
|
|
|
|
|
|
|
|
|
|
|
|
|
Balance at January 31, 2009 |
|
|
29,853 |
|
|
299 |
|
|
20,471 |
|
|
(186,057 |
) |
|
142,486 |
|
|
282,332 |
|
|
— |
|
|
24,573 |
|
|
263,633 |
|
|
|
|
|
|
|
|
|
|
|
|
|
|
|
|
|
|
|
|
|
|
|
|
|
|
|
|
|
|
|
|
Net income |
|
|
|
|
|
|
|
|
|
|
|
|
|
|
|
|
|
8,652 |
|
|
|
|
|
3,900 |
|
|
12,552 |
|
|
|
|
|
|
|
|
|
|
|
|
|
|
|
|
|
|
|
|
|
|
|
|
|
|
|
|
|
|
|
|
Treasury stock acquired |
|
|
|
|
|
|
|
|
1,257 |
|
|
(15,694 |
) |
|
|
|
|
|
|
|
|
|
|
|
|
|
(15,694 |
) |
|
|
|
|
|
|
|
|
|
|
|
|
|
|
|
|
|
|
|
|
|
|
|
|
|
|
|
|
|
|
|
Stock based compensation |
|
|
|
|
|
|
|
|
|
|
|
|
|
|
234 |
|
|
|
|
|
|
|
|
|
|
|
234 |
|
|
|
|
|
|
|
|
|
|
|
|
|
|
|
|
|
|
|
|
|
|
|
|
|
|
|
|
|
|
|
|
Stock options and related tax effects |
|
|
|
|
|
|
|
|
(1,683 |
) |
|
15,344 |
|
|
(1,022 |
) |
|
|
|
|
|
|
|
|
|
|
14,322 |
|
|
|
|
|
|
|
|
|
|
|
|
|
|
|
|
|
|
|
|
|
|
|
|
|
|
|
|
|
|
|
|
Unrealized holding gains, net of tax |
|
|
— |
|
|
— |
|
|
— |
|
|
— |
|
|
— |
|
|
— |
|
|
49 |
|
|
— |
|
|
49 |
|
|
|
|
|
|
|
|
|
|
|
|
|
|
|
|
|
|
|
|
|
|
|
|
|
|
|
|
|
|
|
|
|
|
|
|
|
|
|
|
|
|
|
|
|
|
|
|
|
|
|
|
|
|
|
|
|
|
|
|
|
|
Balance at January 31, 2010 |
|
|
29,853 |
|
$ |
299 |
|
|
20,045 |
|
$ |
(186,407 |
) |
$ |
141,698 |
|
$ |
290,984 |
|
$ |
49 |
|
$ |
28,473 |
|
$ |
275,096 |
|
|
|
|
|
|
|
|
|
|
|
|
|
|
|
|
|
|
|
|
|
|
|
|
|
|
|
|
|
|
|
|
Net income |
|
|
|
|
|
|
|
|
|
|
|
|
|
|
|
|
|
5,069 |
|
|
|
|
|
3,673 |
|
|
8,742 |
|
|
|
|
|
|
|
|
|
|
|
|
|
|
|
|
|
|
|
|
|
|
|
|
|
|
|
|
|
|
|
|
Treasury stock acquired |
|
|
|
|
|
|
|
|
515 |
|
|
(8,229 |
) |
|
|
|
|
|
|
|
|
|
|
|
|
|
(8,229 |
) |
|
|
|
|
|
|
|
|
|
|
|
|
|
|
|
|
|
|
|
|
|
|
|
|
|
|
|
|
|
|
|
Reclassification adjustment for net gains included in net income, net of tax |
|
|
|
|
|
|
|
|
|
|
|
|
|
|
|
|
|
|
|
|
(49 |
) |
|
|
|
|
(49 |
) |
|
|
|
|
|
|
|
|
|
|
|
|
|
|
|
|
|
|
|
|
|
|
|
|
|
|
|
|
|
|
|
Deconsolidation of subsidiary |
|
|
|
|
|
|
|
|
|
|
|
|
|
|
|
|
|
|
|
|
|
|
|
(7,114 |
) |
|
(7,114 |
) |
|
|
||||||||||||||||||||||||||||
|
Stock options and related tax effects |
|
|
— |
|
|
— |
|
|
(99 |
) |
|
923 |
|
|
595 |
|
|
— |
|
|
— |
|
|
— |
|
|
1,518 |
|
|
|
|
|
|
|
|
|
|
|
|
|
|
|
|
|
|
|
|
|
|
|
|
|
|
|
|
|
|
|
|
|
|
|
|
|
|
|
|
|
|
|
|
|
|
|
|
|
|
|
|
|
|
|
|
|
|
|
|
|
|
Balance at January 31, 2011 |
|
|
29,853 |
|
$ |
299 |
|
|
20,461 |
|
$ |
(193,713 |
) |
$ |
142,293 |
|
$ |
296,053 |
|
$ |
— |
|
$ |
25,032 |
|
$ |
269,964 |
|
|
|
|
|
|
|
|
|
|
|
|
|
|
|
|
|
|
|
|
|
|
|
|
|
|
|
|
|
|
|
See notes to consolidated financial statements.
51
|
|
|
REX AMERICAN RESOURCES CORPORATION AND SUBSIDIARIES |
|
|
|
CONSOLIDATED STATEMENTS OF CASH FLOWS |
|
(Amounts in Thousands) |
|
|
|
|
|
|
|
|
|
|
|
|
|
|
|
Years Ended January 31, |
|
|||||||
|
|
|
|
|
|||||||
|
|
|
2011 |
|
2010 |
|
2009 |
|
|||
|
|
|
|
|
|
|
|
|
|||
|
CASH FLOWS FROM OPERATING ACTIVITIES: |
|
|
|
|
|
|
|
|
|
|
|
Net income (loss) including noncontrolling interests |
|
$ |
8,742 |
|
$ |
12,552 |
|
$ |
(6,453 |
) |
|
Adjustments to reconcile net income (loss) to net cash provided by operating activities: |
|
|
|
|
|
|
|
|
|
|
|
Depreciation and amortization |
|
|
17,943 |
|
|
10,603 |
|
|
5,061 |
|
|
Impairment charges and loss on deconsolidation, net of cash divested of $2,304 |
|
|
16,120 |
|
|
— |
|
|
— |
|
|
Stock based compensation expense |
|
|
— |
|
|
234 |
|
|
1,143 |
|
|
Impairment charges on real estate |
|
|
1,021 |
|
|
1,533 |
|
|
1,961 |
|
|
Income from equity method investments |
|
|
(14,558 |
) |
|
(6,027 |
) |
|
(849 |
) |
|
Dividends received from equity method investments |
|
|
4,965 |
|
|
702 |
|
|
900 |
|
|
Income from synthetic fuel investments |
|
|
— |
|
|
— |
|
|
(691 |
) |
|
Derivative financial instruments |
|
|
(361 |
) |
|
(144 |
) |
|
3,427 |
|
|
Gain on disposal of real estate and property and equipment |
|
|
(293 |
) |
|
(2,003 |
) |
|
(3,410 |
) |
|
Deferred income |
|
|
(7,816 |
) |
|
(16,559 |
) |
|
(6,776 |
) |
|
Excess tax benefits from stock option exercises |
|
|
— |
|
|
— |
|
|
(12 |
) |
|
Deferred income tax |
|
|
3,803 |
|
|
12,958 |
|
|
601 |
|
|
Changes in assets and liabilities, net of deconsolidation: |
|
|
|
|
|
|
|
|
|
|
|
Accounts receivable |
|
|
(2,472 |
) |
|
(4,926 |
) |
|
(2,320 |
) |
|
Inventory |
|
|
(554 |
) |
|
15,676 |
|
|
25,559 |
|
|
Prepaid expenses and other current assets |
|
|
(1,124 |
) |
|
(1,628 |
) |
|
(93 |
) |
|
Income taxes refundable |
|
|
4,310 |
|
|
(4,924 |
) |
|
(5,390 |
) |
|
Other long term assets |
|
|
(898 |
) |
|
3,534 |
|
|
2,481 |
|
|
Accounts payable-trade |
|
|
761 |
|
|
(8,457 |
) |
|
(8,560 |
) |
|
Other liabilities |
|
|
(1,668 |
) |
|
(2,146 |
) |
|
(3,656 |
) |
|
|
|
|
|
|
|
|
|
|
|
|
|
Net cash provided by operating activities |
|
|
27,921 |
|
|
10,978 |
|
|
2,923 |
|
|
|
|
|
|
|
|
|
|
|
|
|
|
CASH FLOWS FROM INVESTING ACTIVITIES: |
|
|
|
|
|
|
|
|
|
|
|
Capital expenditures |
|
|
(6,033 |
) |
|
(35,652 |
) |
|
(101,271 |
) |
|
Proceeds from sale of synthetic fuel investments |
|
|
— |
|
|
— |
|
|
1,264 |
|
|
Purchase of investments |
|
|
(9,214 |
) |
|
(25 |
) |
|
(933 |
) |
|
Proceeds of note receivable |
|
|
965 |
|
|
— |
|
|
— |
|
|
Proceeds from sale of real estate and property and equipment |
|
|
7,986 |
|
|
4,756 |
|
|
9,172 |
|
|
Restricted investments |
|
|
500 |
|
|
184 |
|
|
197 |
|
|
|
|
|
|
|
|
|
|
|
|
|
|
Net cash used in investing activities |
|
|
(5,796 |
) |
|
(30,737 |
) |
|
(91,571 |
) |
|
|
|
|
|
|
|
|
|
|
|
|
|
CASH FLOWS FROM FINANCING ACTIVITIES: |
|
|
|
|
|
|
|
|
|
|
|
Proceeds from long term debt |
|
|
— |
|
|
48,958 |
|
|
75,890 |
|
|
Payments of long term debt |
|
|
(24,793 |
) |
|
(20,376 |
) |
|
(6,724 |
) |
|
Stock options exercised |
|
|
1,518 |
|
|
6,038 |
|
|
1,453 |
|
|
Excess tax benefits from stock option exercises |
|
|
— |
|
|
— |
|
|
12 |
|
|
Treasury stock acquired |
|
|
(8,229 |
) |
|
(6,454 |
) |
|
(17,708 |
) |
|
|
|
|
|
|
|
|
|
|
|
|
|
Net cash (used in) provided by financing activities |
|
|
(31,504 |
) |
|
28,166 |
|
|
52,923 |
|
|
|
|
|
|
|
|
|
|
|
|
|
|
NET (DECREASE) INCREASE IN CASH AND CASH EQUIVALENTS |
|
|
(9,379 |
) |
|
8,407 |
|
|
(35,725 |
) |
|
CASH AND CASH EQUIVALENTS-Beginning of year |
|
|
100,398 |
|
|
91,991 |
|
|
127,716 |
|
|
|
|
|
|
|
|
|
|
|
|
|
|
CASH AND CASH EQUIVALENTS-End of year |
|
$ |
91,019 |
|
$ |
100,398 |
|
$ |
91,991 |
|
|
|
|
|
|
|
|
|
|
|
|
|
|
Non cash activities–Accrued capital expenditures |
|
$ |
102 |
|
$ |
265 |
|
$ |
6,474 |
|
|
Non cash activities–Assets acquired by capital leases |
|
$ |
— |
|
$ |
— |
|
$ |
2,922 |
|
|
Non cash activities-Payable related to plant construction refinanced to long term debt |
|
$ |
— |
|
$ |
9,749 |
|
$ |
— |
|
See notes to consolidated financial statements.
52
|
|
|
REX AMERICAN RESOURCES CORPORATION AND SUBSIDIARIES |
|
NOTES TO CONSOLIDATED FINANCIAL STATEMENTS |
|
|
|
|
|
|
|
|
1. |
SUMMARY OF SIGNIFICANT ACCOUNTING POLICIES |
|
|
|
|
|
Principles of Consolidation – The accompanying financial statements consolidate the operating results and financial position of Rex American Resources Corporation and its wholly-owned and majority owned subsidiaries (the “Company” or “REX”). All intercompany balances and transactions have been eliminated. As of January 31, 2011, the Company maintains ownership interests in five ethanol entities and manages a portfolio of real estate located in 15 states. The Company operates in two reportable segments, alternative energy and real estate. The Company completed the exit of its retail business during fiscal year 2009 although it will continue to recognize, in discontinued operations, revenue and expense associated with administering extended service policies. |
|
|
|
|
|
Fiscal Year – All references in these consolidated financial statements to a particular fiscal year are to the Company’s fiscal year ended January 31. For example, “fiscal year 2010” means the period February 1, 2010 to January 31, 2011. |
|
|
|
|
|
Use of Estimates – The preparation of consolidated financial statements in conformity with accounting principles generally accepted in the United States of America requires management to make estimates and assumptions that affect the reported amounts of assets and liabilities and disclosure of contingent assets and liabilities at the date of the consolidated financial statements and the reported amounts of revenues and expenses during the reporting period. Actual results could differ from those estimates. |
|
|
|
|
|
Cash Equivalents – Cash equivalents are principally short-term investments with original maturities of less than three months. The carrying amount of cash equivalents approximates fair value. |
|
|
|
|
|
Concentrations of Risk –The Company maintains cash and cash equivalents in accounts with financial institutions which, at times, exceed federally insured limits. The Company has not experienced any losses in such accounts. The Company does not believe there is significant credit risk on its cash and cash equivalents. During fiscal years 2010 and 2009, two customers accounted for approximately 45% and 64%, respectively of the Company’s net sales and revenue. At January 31, 2011, these customers represented approximately 68% of the Company’s accounts receivable balance. |
|
|
|
|
|
Inventory – Inventories are carried at the lower of cost or market on a first-in, first-out basis. Alternative energy segment inventory includes direct production costs and certain overhead costs such as depreciation, property taxes and utilities related to producing ethanol and related by products. Reserves are established for estimated net realizable value based primarily upon commodity prices. The market value of inventory is often dependent upon changes in commodity prices. These reserves totaled $0 and $591,000 at January 31, 2011 and 2010, respectively. |
53
|
|
|
|
|
The components of inventory at January 31, 2011, and January 31, 2010 are as follows (amounts in thousands): |
|
|
|
|
|
|
|
|
|
|
|
|
2011 |
|
2010 |
|
||
|
|
|
|
|
|
|
||
|
|
|
|
|
|
|
|
|
|
Retail merchandise, net |
|
$ |
— |
|
$ |
190 |
|
|
Ethanol and other finished goods, net |
|
|
2,347 |
|
|
1,784 |
|
|
Work in process, net |
|
|
1,705 |
|
|
1,577 |
|
|
Grain and other raw materials |
|
|
3,767 |
|
|
5,147 |
|
|
|
|
|
|
|
|
|
|
|
|
|
|
|
|
|
|
|
|
Total |
|
$ |
7,819 |
|
$ |
8,698 |
|
|
|
|
|
|
|
|
|
|
|
|
|
|
|
Property and Equipment – Property and equipment is recorded at cost. Assets under capital leases are capitalized at the lower of the net present value of minimum lease payments or the fair market value of the leased asset. Depreciation is computed using the straight-line method. Estimated useful lives are 15 to 40 years for buildings and improvements, and 3 to 20 years for fixtures and equipment. The components of property and equipment at January 31, 2011 and 2010 are as follows (amounts in thousands): |
|
|
|
|
|
|
|
|
|
|
|
|
2011 |
|
2010 |
|
||
|
|
|
|
|
|
|
||
|
|
|
|
|
|
|
|
|
|
Land and improvements |
|
$ |
21,899 |
|
$ |
26,405 |
|
|
Buildings and improvements |
|
|
44,297 |
|
|
59,024 |
|
|
Machinery, equipment and fixtures |
|
|
124,439 |
|
|
187,526 |
|
|
Leasehold improvements |
|
|
440 |
|
|
569 |
|
|
Construction in progress |
|
|
4,578 |
|
|
127 |
|
|
|
|
|
|
|
|
|
|
|
|
|
|
|
|
|
|
|
|
|
|
|
195,653 |
|
|
273,651 |
|
|
Less: accumulated depreciation |
|
|
(25,842 |
) |
|
(26,777 |
) |
|
|
|
|
|
|
|
|
|
|
|
|
|
|
|
|
|
|
|
|
|
$ |
169,811 |
|
$ |
246,874 |
|
|
|
|
|
|
|
|
|
|
|
|
|
|
|
In accordance with ASC 360-05 “Impairment or Disposal of Long-Lived Assets”, the carrying value of long-lived assets is assessed for recoverability by management when changes in circumstances indicate that the carrying amount may not be recoverable, based on an analysis of undiscounted future expected cash flows from the use and ultimate disposition of the asset. The Company recorded an impairment charge of $1,021,000 in fiscal year 2010, of which $424,000 is included in selling, general and administrative expenses and $597,000 is classified as discontinued operations in the consolidated statements of operations. The Company recorded an impairment charge of $1,533,000 in fiscal year 2009, of which $1,039,000 is included in selling, general and administrative expenses and $494,000 is classified as discontinued operations in the consolidated statements of operations. The Company recorded an impairment charge classified as discontinued operations of $639,000 in fiscal year 2008. The impairment charges classified as selling, general and administrative expenses in fiscal years 2010 and 2009 relate to individual properties in the Company’s real estate segment. The impairment charges in fiscal year 2008 classified as discontinued operations relate to individual stores in the Company’s former retail segment or individual properties that have been sold that were previously included in the Company’s real estate segment. These impairment charges are primarily related to increased competition and/or unfavorable changes in real estate conditions in local markets. Impairment charges result from the Company’s management performing cash flow analysis and represent management’s estimate of the excess of net book value over fair value. Fair value is estimated using expected future cash flows on a discounted basis or appraisals of specific properties as appropriate. Long-lived assets |
54
|
|
|
|
|
are tested for recoverability whenever events or changes in circumstances indicate that its carrying amount may not be recoverable. Generally, declining cash flows from an ethanol plant or deterioration in local real estate market conditions are indicators of possible impairment. |
|
|
|
|
|
Investments and Deposits– Restricted investments, which are principally money market mutual funds and cash deposits, are stated at cost plus accrued interest, which approximates market. Restricted investments at January 31, 2011 and 2010 are required by two states to cover possible future claims under extended service policies over the remaining live of the service policy contract. In accordance with ASC 320, “Investments-Debt and Equity Securities” the Company has classified these investments as held-to-maturity. The investments had maturity dates of less than one year at January 31, 2011 and 2010. The Company has the intent and ability to hold these securities to maturity. |
|
|
|
|
|
The method of accounting applied to long-term investments, whether consolidated, equity or cost, involves an evaluation of the significant terms of each investment that explicitly grant or suggest evidence of control or influence over the operations of the investee and also includes the identification of any variable interests in which the Company is the primary beneficiary. The Company consolidates the results of one majority owned subsidiary, One Earth, with a one month lag. The Company accounts for investments in limited liability companies in which it may have a less than 20% ownership interest, using the equity method of accounting when the factors discussed in ASC 323 “Investments-Equity Method and Joint Ventures” are met. The excess of the carrying value over the underlying equity in the net assets of equity method investees is allocated to specific assets and liabilities. Any unallocated excess is treated as goodwill and is recorded as a component of the carrying value of the equity method investee. Investments in businesses that the Company does not control but for which it has the ability to exercise significant influence over operating and financial matters are accounted for using the equity method. Investments in which the Company does not have the ability to exercise significant influence over operating and financial matters are accounted for using the cost method. |
|
|
|
|
|
Investments in debt securities are considered “held to maturity”, “available for sale”, or “trading securities” under ASC 320, “Investments-Debt and Equity Securities”. Under ASC 320, held to maturity securities are required to be carried at their cost; while available-for-sale securities are required to be carried at their fair value, with unrealized gains and losses, net of income taxes, that are considered temporary in nature recorded in accumulated other comprehensive income (loss) in the Consolidated Balance Sheets. The fair values of investments in debt securities are determined based upon market quotations and various valuation techniques, including discounted cash flow analysis. |
|
|
|
|
|
The Company periodically evaluates its investments for impairment due to declines in market value considered to be other than temporary. Such impairment evaluations include, in addition to persistent, declining market prices, general economic and company-specific evaluations. If the Company determines that a decline in market value is other than temporary, then a charge to earnings is recorded in the Consolidated Statements of Operations and a new cost basis in the investment is established. |
|
|
|
|
|
Revenue Recognition – The Company recognizes sales from the production of ethanol and distillers grains when title transfers to customers, upon shipment from the ethanol plant. Shipping and handling charges to ethanol customers are included in net sales and revenue. |
|
|
|
|
|
The Company includes income from its real estate leasing activities in net sales and revenue. The Company accounts for these leases as operating leases. Accordingly, minimum rental revenue is recognized on a straight-line basis over the term of the lease. |
|
|
|
|
|
The Company sold, prior to its exit of the retail business, extended service policies covering periods beyond the normal manufacturers’ warranty periods, usually with terms of coverage (including |
55
|
|
|
|
|
manufacturers’ warranty periods) of between 12 to 60 months. Contract revenues and sales commissions are deferred and amortized on a straight-line basis over the life of the contracts after the expiration of applicable manufacturers’ warranty periods. The Company retains the obligation to perform warranty service and such costs are charged to operations as incurred. All related revenue and expense is classified as discontinued operations. |
|
|
|
|
|
The Company recognized income from synthetic fuel partnership sales as production was completed and collectability of receipts was reasonably assured. The Company was paid for actual tax credits earned as the synthetic fuel was produced with the exception of production at the Pine Mountain (Gillette) facility. See Note 4 for a further discussion of synthetic fuel partnership sales. |
|
|
|
|
|
Costs of Sales –Ethanol cost of sales includes depreciation, costs of raw materials, inbound freight charges, purchasing and receiving costs, inspection costs, shipping costs, other distribution expenses, warehousing costs, plant management, certain compensation costs, and general facility overhead charges. |
|
|
|
|
|
Real estate cost of sales includes depreciation, real estate taxes, insurance, repairs and maintenance and other costs directly associated with operating the Company’s portfolio of real property. |
|
|
|
|
|
Selling, General and Administrative Expenses –The Company includes non-production related costs from its alternative energy segment such as utilities, property taxes, professional fees and certain payroll in selling, general and administrative expenses. |
|
|
|
|
|
The Company includes costs not directly related to operating its portfolio of real property from its real estate segment such as certain payroll and related costs, professional fees and other general expenses in selling, general and administrative expenses. |
|
|
|
|
|
Interest Cost – Interest expense of approximately $5,593,000, $4,741,000 and $3,183,000 for fiscal years 2010, 2009 and 2008, respectively, is net of approximately $0, $1,651,000 and $3,167,000 of interest capitalized related to equity investments, real estate improvements, ethanol plant or warehouse construction. Cash paid for interest in fiscal years 2010, 2009 and 2008 was approximately $4,701,000, $2,886,000 and $2,592,000, respectively. |
|
|
|
|
|
Deferred Financing Costs – Direct expenses and fees associated with obtaining long-term debt are capitalized and amortized to interest expense over the life of the loan using the effective interest method. |
|
|
|
|
|
Financial Instruments – The Company uses derivative financial instruments to manage its balance of fixed and variable rate debt. The Company does not hold or issue derivative financial instruments for trading or speculative purposes. Interest rate swap agreements involve the exchange of fixed and variable rate interest payments and do not represent an actual exchange of the notional amounts between the parties. The swap agreements were not designated for hedge accounting pursuant to ASC 815. The interest rate swaps are recorded at their fair values and the changes in fair values are recorded as gain or loss on derivative financial instruments in the statements of consolidated operations. The Company paid settlements of interest rate swaps of approximately $2,477,000, $2,510,000 and $369,000 in fiscal years 2010, 2009 and 2008, respectively. |
|
|
|
|
|
Forward grain purchase and ethanol and distillers grain sale contracts are accounted for under the “normal purchases and normal sales” scope exemption of ASC 815, “Derivatives and Hedging” because these arrangements are for purchases of grain that will be delivered in quantities expected to be |
56
|
|
|
|
|
used and sales of ethanol quantities expected to be produced over a reasonable period of time in the normal course of business. |
|
|
|
|
|
Restructuring Costs – Restructuring charges include severance and associated employee termination costs, lease termination fees and other costs associated with the exit of the Company’s retail business. The Company recorded severance and associated employee termination costs pursuant to ASC 712, ASC 715 and ASC 420. ASC 420 requires that lease termination fees, net of expected sublease rental income, be recorded once the leased facility is no longer actively used in a revenue producing manner. Future changes to the Company’s estimates of employee layoffs or leased stores abandoned are unlikely to have a material impact on the Company’s restructuring accrual. |
|
|
|
|
|
Stock Compensation – The Company has stock-based compensation plans under which stock options have been granted to directors, officers and key employees at the market price on the date of the grant. The Company adopted ASC 718 “Compensation-Stock Compensation”, on February 1, 2006. The Company chose the Modified Prospective Application (“MPA”) method for implementing this accounting standard. Under the MPA method, new awards, if any, are valued and accounted for prospectively upon adoption. Outstanding prior awards that were unvested as of February 1, 2006 are recognized as compensation cost over the remaining requisite service period. ASC 718 also required the Company to establish the beginning balance of the additional paid in capital pool (“APIC pool”) related to actual tax deductions from the exercise of stock options. This APIC pool is available to absorb tax shortfalls (actual tax deductions less than recognized compensation expense) recognized subsequent to the adoption of ASC 718. On November 10, 2005, the FASB issued FASB Staff Position No. FAS 123R-3, “Transition Election Related to Accounting for Tax Effects of Share-Based Payment Awards.” This FASB Staff Position provided companies with the option to use either the transition method prescribed by ASC 718 or a simplified alternative method described in the staff position. The Company chose to utilize the transition method prescribed by ASC 718, which requires the calculation of the APIC pool as if the Company had adopted ASC 718 for fiscal years beginning after December 15, 1994. |
|
|
|
|
|
No options were granted in the fiscal years ended January 31, 2011, January 31, 2010 or January 31, 2009. The following table summarizes options granted, exercised and canceled or expired during the fiscal year ended January 31, 2011: |
|
|
|
|
|
|
|
|
|
|
|
|
|
|
|
|
|
|
Shares |
|
Weighted |
|
Weighted Average |
|
Aggregate |
|
||||
|
|
|
|
|
|
|
|
|
|
|
||||
|
|
|
|
|
|
|
|
|
|
|
|
|
|
|
|
Outstanding—Beginning of year |
|
|
824 |
|
$ |
10.14 |
|
|
|
|
|
|
|
|
Granted |
|
|
— |
|
|
— |
|
|
|
|
|
|
|
|
Exercised |
|
|
(98 |
) |
|
10.00 |
|
|
|
|
|
|
|
|
Canceled or expired |
|
|
— |
|
|
— |
|
|
|
|
|
|
|
|
|
|
|
|
|
|
|
|
|
|
|
|
|
|
|
|
|
|
|
|
|
|
|
|
|
|
|
|
|
|
Outstanding and exercisable—End of year |
|
|
726 |
|
$ |
10.16 |
|
|
1.1 |
|
$ |
3,566 |
|
|
|
|
|
|
|
|
|
|
|
|
|
|
|
|
|
|
|
|
|
The total intrinsic value of options exercised in the fiscal years ended January 31, 2011, 2010 and 2009, was approximately $0.7 million, $7.2 million and $2.2 million, respectively, resulting in tax deductions to realize benefits of approximately $0.3 million, $0.5 million and $0.9 million, respectively. At January 31, 2011, there was no unrecognized compensation cost related to nonvested stock options. See Note 11 for a further discussion of stock options. |
57
|
|
|
|
|
Income Taxes – The Company provides for deferred tax liabilities and assets for the future tax consequences attributable to differences between the financial statement carrying amounts of existing assets and liabilities and their respective tax bases and operating loss and tax credit carryforwards. The Company provides for a valuation allowance if, based on the weight of available evidence, it is more likely than not that some or all of the deferred tax assets will not be realized. |
|
|
|
|
|
Discontinued Operations– The Company classifies sold real estate assets and operations from its former retail segment in discontinued operations when the operations and cash flows of the store or real estate assets have been (or will be) eliminated from ongoing operations and when the Company will not have any significant continuing involvement in the operation of the store or real estate assets after disposal. To determine if cash flows had been or would be eliminated from ongoing operations, the Company evaluates a number of qualitative and quantitative factors. For purposes of reporting the operations of stores or real estate assets meeting the criteria for discontinued operations, the Company reports net sales and revenue, gross profit and related selling, general and administrative expenses that are specifically identifiable to those stores operations or real estate assets as discontinued operations. For stores and warehouses closed for which the Company has a retained interest in the related real estate, operations are presented in the real estate segment when retail operations cease. Certain corporate level charges, such as general office expense, certain interest expense, and other “fixed” expenses are not allocated to discontinued operations because the Company believes that these expenses were not specific to components’ operations. |
|
|
|
|
|
New Accounting Pronouncements –Effective February 1, 2011, the Company will be required to adopt the second phase of the amended guidance in ASC Topic 820, “Fair Value Measurements and Disclosures”, which will require the Company to disclose information in the reconciliation of recurring Level 3 measurements about purchases, sales, issuances and settlements on a gross basis, separately for assets and liabilities. The adoption of this amended guidance will require expanded disclosure in the consolidated financial statements but will not impact financial results. |
|
|
|
|
|
There were no other new accounting standards issued during fiscal year 2010 that had or are expected to have a material impact on the Company’s consolidated financial statements. |
|
|
|
|
2. |
INVESTMENTS AND DEPOSITS |
|
|
|
|
|
The Company has debt and equity investments. The debt investments are accounted for under ASC 320, “Investments-Debt and Equity Securities”, while the equity investments are accounted for under ASC 323 “Investments-Equity Method and Joint Ventures”. The following table summarizes |
58
|
|
|
|
|
investments at January 31, 2010 (amounts in thousands): |
|
|
|
|
|
Debt Securities January 31, 2010 |
|
|
|
|
|
|
|
|
|
|
|
|
|
|
|
|
|
|
|
Investment |
|
Coupon |
|
Maturity |
|
Classification |
|
Fair |
|
Initial |
|
|||||
|
|
|
|
|
|
|
|
|
|
|
|
|
|||||
|
Patriot Renewable Fuels, LLC |
|
|
|
|
|
|
|
|
|
|
|
|
|
|
|
|
|
Convertible Note |
|
|
16.00 |
% |
11/25/2011 |
|
Available for Sale |
|
$ |
1,014 |
|
$ |
933 |
|
||
|
|
|
|
|
|
|
|
|
|
|
|
|
|
|
|
|
|
|
|
|
|
|
Unrealized holding gains were $81,000 ($49,000 net of income taxes) at January 31, 2010. There were no unrealized holding gains at January 31, 2011. Patriot repaid the outstanding principal balance on the convertible note to the Company during fiscal year 2010. |
|
|
|
|
|
The Company has $743,000 at January 31, 2011 and 2010 on deposit with the Florida Department of Financial Services to secure its obligation to fulfill future obligations related to extended warranty contracts sold in the state of Florida. The deposits earned 2.3% and 2.7% at January 31, 2011 and 2010, respectively. |
|
|
|
|
|
In addition to the deposit with the Florida Department of Financial Services, the Company has $857,000 and $1,357,000 at January 31, 2011 and 2010, respectively, invested in a money market mutual fund to satisfy Florida Department of Financial Services regulations. This investment earned 0.1% at January 31, 2011 and 2010. |
|
|
|
|
|
Equity Method Investments January 31, 2011 and 2010 |
|
|
|
|
|
|
|
|
|
|
|
|
|
Entity |
|
Ownership |
|
Carrying |
|
Carrying |
|
|||
|
|
|
|
|
|
|
|
|
|||
|
|
|
|
|
|
|
|
|
|
|
|
|
Big River Resources, LLC |
|
|
10 |
% |
$ |
29,443 |
|
$ |
25,660 |
|
|
|
|
|
|
|
|
|
|
|
|
|
|
Patriot Renewable Fuels, LLC |
|
|
23 |
% |
|
21,829 |
|
|
18,411 |
|
|
|
|
|
|
|
|
|
|
|
|
|
|
Levelland Hockley County Ethanol, LLC |
|
|
49 |
% |
|
— |
|
|
— |
|
|
|
|
|
|
|
|
|
|
|
|
|
|
NuGen Energy, LLC |
|
|
48 |
% |
|
16,077 |
|
|
— |
|
|
|
|
|
|
|
|
|
|
|
|
|
|
|
|
|
|
|
|
|
|
|
|
|
|
Total Equity Securities |
|
|
|
|
$ |
67,349 |
|
$ |
44,071 |
|
|
|
|
|
|
|
|
|
|
|
|
|
59
|
|
|
|
|
On October 1, 2006, the Company entered into an agreement to invest $20 million in Big River, an Iowa limited liability company and holding company for several entities. The Company funded this investment in exchange for a 10% ownership interest. Big River Resources West Burlington, LLC, a wholly owned subsidiary of Big River, presently operates a 92 million gallon ethanol manufacturing facility. Big River Resources Galva, LLC, a wholly owned subsidiary of Big River, presently operates a 100 million gallon ethanol manufacturing facility. Big River Resources United Energy, LLC, a 50.5% owned subsidiary of Big River, presently operates a 100 million gallon ethanol manufacturing facility. The Company recorded income of approximately $5,387,000, $2,487,000 and $2,397,000 as its share of earnings from Big River during fiscal years 2010, 2009 and 2008, respectively. At January 31, 2011, the carrying value of the investment in Big River is approximately $29.4 million; the amount of underlying equity in the net assets of Big River is approximately $27.8 million. The excess of the carrying value of the investment over the underlying equity in the net assets is accounted for as goodwill and is recorded within equity method investments on the accompanying Consolidated Balance Sheets. |
|
|
|
|
|
On June 8, 2006, the Company entered into an agreement to invest approximately $16 million in Patriot which commenced production operations during fiscal year 2008. The Company funded this investment on December 4, 2006 in exchange for a 23% ownership interest. The facility has a nameplate capacity of 100 million gallons annually and began operations during the second quarter of fiscal year 2008. The Company recorded income of approximately $5,159,000, $3,540,000 and a loss of $1,548,000 as its share of earnings or loss from Patriot during fiscal years 2010, 2009 and 2008, respectively. At January 31, 2011, the carrying value of the investment in Patriot is approximately $21.8 million; the amount of underlying equity in the net assets of Patriot is approximately $18.6 million. The excess of the carrying value of the investment over the underlying equity in the net assets is accounted for as goodwill and capitalized interest and is recorded within equity method investments on the accompanying Consolidated Balance Sheets. |
|
|
|
|
|
Effective July 1, 2010, the Company purchased a 48% equity interest in NuGen Energy, LLC (“NuGen”) which operates an ethanol producing facility in Marion, South Dakota with an annual nameplate capacity of 100 million gallons. The Company’s investment included approximately $2,410,000 paid at closing to the then sole shareholder of NuGen and $6,805,000 contributed directly to NuGen. An additional $6,451,000 is due based upon cash distributions from NuGen that REX is entitled to until such balance is paid (“Contingent Consideration”). The Company determined that the fair value of the Contingent Consideration, at January 31, 2011, was approximately $3,578,000, of which $62,000 is included in other current liabilities and $3,516,000 is included in other long-term liabilities on the Consolidated Balance Sheet. During fiscal year 2010, the Company recorded income of approximately $4,011,000 as its share of earnings from NuGen. At January 31, 2011, the carrying value of the investment in NuGen is approximately $16.1 million; the amount of underlying equity in the net assets of NuGen is approximately $10.4 million. The excess of the carrying value of the investment over the underlying equity in the net assets is accounted for as a basis difference in long lived assets and is recorded within equity method investments on the accompanying Consolidated Balance Sheets. |
|
|
|
|
|
The Company has an option to acquire for a purchase price of $1,138,000, (which is payable in cash, partially based upon cash distributions from NuGen that the Company is entitled to) additional ownership units from NuGen’s majority shareholder, which, if exercised, would result in the Company owning 51% of the total outstanding voting and economic interests of NuGen on a fully diluted basis. |
|
|
|
|
|
On September 30, 2006, the Company acquired 47% of the outstanding membership units of Levelland Hockley County Ethanol, LLC, or Levelland Hockley, for $11.5 million. On December 29, 2006, the |
60
|
|
|
|
|
Company purchased a $5.0 million convertible secured promissory note from Levelland Hockley. On July 1, 2007, the Company converted the note into equity and increased its ownership percentage to approximately 56%. On February 20, 2008, the Company purchased an additional $5.0 million convertible secured promissory note from Levelland Hockley. The balance of this note at January 31, 2011 was $5.2 million, including accrued interest. On January 29, 2009, the Company agreed to fund up to $2.0 million in the form of a subordinated revolving line of credit with Levelland Hockley and to issue a $1.0 million letter of credit for the benefit of Levelland Hockley. On September 1, 2010, the Company agreed to increase the line of credit to $4.0 million, inclusive of the $1.0 million letter of credit. The Company was issued warrants in the amount of 1,298,700 at $3.08 per share in conjunction with the issuance of the line of credit. At January 31, 2011, there was approximately $3.8 million outstanding under the subordinated revolving line of credit. |
|
|
|
|
|
Levelland Hockley, which is located in Levelland, Texas, commenced production operations in the first quarter of fiscal year 2008. The plant has a nameplate capacity of 40 million gallons of ethanol and 135,000 tons of dried distillers grains (“DDG”) per year. |
|
|
|
|
|
The plant was shut down in early January 2011 as a result of industry wide low crush spread margins and the plant’s inability to source grain at affordable prices. On January 31, 2011, the Company sold 814,000 of its membership units to Levelland Hockley for $1, reducing the ownership interest in Levelland Hockley to 49%. As a result, the Company no longer has a controlling financial interest in Levelland Hockley, and, therefore, effective January 31, 2011, the Company deconsolidated Levelland Hockley and began using the equity method of accounting. In connection with the deconsolidation, the Company recorded its remaining non controlling equity interest and debt investments at fair value. The Company’s estimate of fair value for all of its investments in Levelland Hockley was $0 at January 31, 2011. The Company recorded a pretax charge of approximately $18.4 million as a result of deconsolidating Levelland Hockley and writing its remaining investments in Levelland Hockley to $0 at January 31, 2011. The deconsolidation loss was computed as the difference between the sales proceeds and fair value of the retained investment and the Company’s carrying value of the investment prior to the transaction. The Company’s continuing involvement as an equity method investor precludes classification of this transaction as discontinued operations. The Company also recorded a pretax loss from the operating results of Levelland Hockley (prior to deconsolidation) of approximately $5.9 million. At January 31, 2011, the carrying value of the investment in Levelland Hockley is $0; the amount of underlying equity in the net assets of Levelland Hockley is approximately $8.6 million. The excess of the underlying equity in the net assets over the carrying value of the investment results from the Company recording the non controlling investment in Levelland Hockley at fair value upon deconsolidation. |
|
|
|
|
|
Undistributed earnings of equity method investees totaled approximately $18.4 million and $6.8 million at January 31, 2011 and 2010, respectively. |
61
|
|
|
|
Summarized financial information for each of the Company’s equity method investees, as of their fiscal year end (except for NuGen) is presented in the following table. NuGen’s fiscal year end is July 31 (amounts in thousands): |
|
|
|
|
|
|
As of December 31, 2010 |
|
|
|
|
|
|
|
|
|
|
|
|
|
|
|
|
|
|
Patriot |
|
Big River |
|
NuGen |
|
Levelland |
|
||||
|
|
|
|
|
|
|
|
|
|
|
||||
|
|
|
|
|
|
|
|
|
|
|
|
|
|
|
|
Current assets |
|
$ |
20,648 |
|
$ |
149,690 |
|
$ |
35,521 |
|
$ |
6,473 |
|
|
|
|
|
|
|
|
|
|
|
|
|
|
|
|
|
Non current assets |
|
|
174,087 |
|
|
358,155 |
|
|
87,487 |
|
|
60,829 |
|
|
|
|
|
|
|
|
|
|
|
|
|
|
|
|
|
|
|
|
|
|
|
|
|
|
|
|
|
|
|
|
Total assets |
|
$ |
194,735 |
|
$ |
507,845 |
|
$ |
123,008 |
|
$ |
67,302 |
|
|
|
|
|
|
|
|
|
|
|
|
|
|
|
|
|
|
|
|
|
|
|
|
|
|
|
|
|
|
|
|
Current liabilities |
|
$ |
19,105 |
|
$ |
78,694 |
|
$ |
14,720 |
|
$ |
16,413 |
|
|
|
|
|
|
|
|
|
|
|
|
|
|
|
|
|
Long-term liabilities |
|
|
94,963 |
|
|
129,936 |
|
|
86,563 |
|
|
33,400 |
|
|
|
|
|
|
|
|
|
|
|
|
|
|
|
|
|
|
|
|
|
|
|
|
|
|
|
|
|
|
|
|
Total liabilities |
|
$ |
114,068 |
|
$ |
208,630 |
|
$ |
101,283 |
|
$ |
49,813 |
|
|
|
|
|
|
|
|
|
|
|
|
|
|
|
|
|
|
|
|
|
|
|
|
|
|
|
|
|
|
|
|
Noncontrolling interests |
|
$ |
— |
|
$ |
21,515 |
|
$ |
— |
|
$ |
— |
|
|
|
|
|
|
|
|
|
|
|
|
|
|
|
|
|
|
|
|
|
|
|
|
|
|
|
|
|
|
|
|
As of December 31, 2009 |
|
|
|
|
|
|
|
|
|
|
|
|
|
|
|
|
|
|
|
|
|
|
|
|
|
|
|
|
|
|
|
Patriot |
|
Big River |
|
|
|
|
|
|
|
||
|
|
|
|
|
|
|
|
|
|
|
|
|
||
|
|
|
|
|
|
|
|
|
|
|
|
|
|
|
|
Current assets |
|
$ |
24,767 |
|
$ |
101,710 |
|
|
|
|
|
|
|
|
|
|
|
|
|
|
|
|
|
|
|
|
|
|
|
Non current assets |
|
|
179,954 |
|
|
371,669 |
|
|
|
|
|
|
|
|
|
|
|
|
|
|
|
|
|
|
|
|
|
|
|
|
|
|
|
|
|
|
|
|
|
|
|
|
|
|
Total assets |
|
$ |
204,721 |
|
$ |
473,379 |
|
|
|
|
|
|
|
|
|
|
|
|
|
|
|
|
|
|
|
|
|
|
|
|
|
|
|
|
|
|
|
|
|
|
|
|
|
|
Current liabilities |
|
$ |
13,941 |
|
$ |
46,162 |
|
|
|
|
|
|
|
|
|
|
|
|
|
|
|
|
|
|
|
|
|
|
|
Long-term liabilities |
|
|
120,636 |
|
|
176,755 |
|
|
|
|
|
|
|
|
|
|
|
|
|
|
|
|
|
|
|
|
|
|
|
|
|
|
|
|
|
|
|
|
|
|
|
|
|
|
Total liabilities |
|
$ |
134,577 |
|
$ |
222,917 |
|
|
|
|
|
|
|
|
|
|
|
|
|
|
|
|
|
|
|
|
|
|
|
|
|
|
|
|
|
|
|
|
|
|
|
|
|
|
Noncontrolling interests |
|
$ |
— |
|
$ |
11,530 |
|
|
|
|
|
|
|
|
|
|
|
|
|
|
|
|
|
|
|
|
|
|
|
|
|
|
|
Summarized financial information for each of the Company’s equity method investees except for NuGen is presented in the following table for the years ended December 31, 2010, 2009 and 2008. The |
62
|
|
|
|
|
summarized financial information for NuGen is presented for the five months ended December 31, 2010 (amounts in thousands): |
|
|
|
|
|
Period Ended December 31, 2010 |
|
|
|
|
|
|
|
|
|
|
|
|
|
|
|
Patriot |
|
Big River |
|
NuGen |
|
|||
|
|
|
|
|
|
|
|
|
|||
|
|
|
|
|
|
|
|
|
|
|
|
|
Net sales and revenue |
|
$ |
261,117 |
|
$ |
742,163 |
|
$ |
121,871 |
|
|
|
|
|
|
|
|
|
|
|
|
|
|
Gross profit |
|
$ |
26,936 |
|
$ |
83,671 |
|
$ |
12,977 |
|
|
|
|
|
|
|
|
|
|
|
|
|
|
Income from continuing operations |
|
$ |
21,385 |
|
$ |
52,478 |
|
$ |
9,772 |
|
|
|
|
|
|
|
|
|
|
|
|
|
|
Net income |
|
$ |
21,385 |
|
$ |
52,478 |
|
$ |
9,772 |
|
|
|
|
|
|
|
|
|
|
|
|
|
|
Period Ended December 31, 2009 |
|
|
|
|
|
|
|
|
|
|
|
|
|
|
|
|
|
|
|
|
|
|
|
|
|
Patriot |
|
Big River |
|
|
|
|
||
|
|
|
|
|
|
|
|
|
|
||
|
|
|
|
|
|
|
|
|
|
|
|
|
Net sales and revenue |
|
$ |
231,077 |
|
$ |
448,145 |
|
|
|
|
|
|
|
|
|
|
|
|
|
|
|
|
|
Gross profit |
|
$ |
25,711 |
|
$ |
43,317 |
|
|
|
|
|
|
|
|
|
|
|
|
|
|
|
|
|
Income from continuing operations |
|
$ |
17,288 |
|
$ |
25,225 |
|
|
|
|
|
|
|
|
|
|
|
|
|
|
|
|
|
Net income |
|
$ |
17,288 |
|
$ |
25,225 |
|
|
|
|
|
|
|
|
|
|
|
|
|
|
|
|
|
Period Ended December 31, 2008 |
|
|
|
|
|
|
|
|
|
|
|
|
|
|
|
|
|
|
|
|
|
|
|
|
|
Patriot |
|
Big River |
|
|
|
|
||
|
|
|
|
|
|
|
|
|
|
||
|
|
|
|
|
|
|
|
|
|
|
|
|
Net sales and revenue |
|
$ |
63,534 |
|
$ |
343,698 |
|
|
|
|
|
|
|
|
|
|
|
|
|
|
|
|
|
Gross (loss) profit |
|
$ |
(2,029 |
) |
$ |
34,735 |
|
|
|
|
|
|
|
|
|
|
|
|
|
|
|
|
|
(Loss) income from continuing operations |
|
$ |
(9,103 |
) |
$ |
24,540 |
|
|
|
|
|
|
|
|
|
|
|
|
|
|
|
|
|
Net (loss) income |
|
$ |
(9,103 |
) |
$ |
24,540 |
|
|
|
|
|
|
|
|
|
Patriot, Big River, NuGen and Levelland Hockley have debt agreements that limit and restrict amounts the entities can pay in the form of dividends or advances to owners. The restricted net assets of Patriot, Big River, NuGen and Levelland Hockley combined at January 31, 2011 are approximately $436.2 million. At January 31, 2011, the Company’s proportionate share of restricted net assets of Patriot, Big River, NuGen and Levelland Hockley combined is approximately $112.2 million. |
63
|
|
|
|
3. |
FAIR VALUE |
|
|
|
|
|
The Company applies ASC 820 “Fair Value Measurements and Disclosures”, which defines fair value as the exchange price that would be received for an asset or paid to transfer a liability (an exit price) in the principal or most advantageous market for the asset or liability in an orderly transaction between market participants on the measurement date. |
|
|
|
|
|
Effective February 1, 2008, the Company determined the fair market values of its financial instruments based on the fair value hierarchy established by ASC 820, which requires an entity to maximize the use of observable inputs and minimize the use of unobservable inputs when measuring fair value. The standard describes three levels of inputs that may be used to measure fair values which are provided below. The Company carries certain cash equivalents, restricted investments, derivative and contingent consideration liabilities at fair value. |
|
|
|
|
|
Level 1 – Quoted prices in active markets for identical assets or liabilities. Level 1 assets and liabilities include debt and equity securities and derivative contracts that are traded in an active exchange market, as well as certain U.S. Treasury securities that are highly liquid and are actively traded in over-the-counter markets. |
|
|
|
|
|
Level 2 – Observable inputs other than Level 1 prices such as quoted prices for similar assets or liabilities; quoted prices in markets that are not active; or other inputs that are observable or can be corroborated by observable market data for substantially the full term of the assets or liabilities. Level 2 assets and liabilities include derivative contracts whose value is determined using a pricing model with inputs that are observable in the market or can be derived principally or corroborated by observable market data. |
|
|
|
|
|
Level 3 – Unobservable inputs that are supported by little or no market activity and that are significant to the fair value of the assets or liabilities. Level 3 assets and liabilities include financial instruments whose value is determined using pricing models, discounted cash flow methods, or similar techniques, as well as instruments for which the determination of fair value requires significant management judgment or estimation. Unobservable inputs shall be developed based on the best information available, which may include the Company’s own data. |
|
|
|
|
|
The fair values of derivative assets and liabilities traded in the over-the-counter market are determined using quantitative models that require the use of multiple market inputs including interest rates, prices and indices to generate pricing and volatility factors, which are used to value the position. The predominance of market inputs are actively quoted and can be validated through external sources, including brokers, market transactions and third-party pricing services. Estimation risk is greater for derivative asset and liability positions that are either option-based or have longer maturity dates where observable market inputs are less readily available or are unobservable, in which case interest rate, price or index scenarios are extrapolated in order to determine the fair value. The fair values of derivative assets and liabilities include adjustments for market liquidity, counterparty credit quality, the Company’s own credit standing and other specific factors, where appropriate. To ensure the prudent application of estimates and management judgment in determining the fair value of derivative assets and liabilities, various processes and controls have been adopted, which include: model validation that requires a review and approval for pricing, financial statement fair value determination and risk quantification; periodic review and substantiation of profit and loss reporting for all derivative instruments. Financial assets and liabilities measured at fair value at January 31, 2011 on a recurring |
64
basis are summarized below (amounts in thousands):
|
|
|
|
|
|
|
|
|
|
|
|
|
|
|
|
|
|
Level 1 |
|
Level 2 |
|
Level 3 |
|
Total Fair |
|
||||
|
|
|
|
|
|
|
|
|
|
|
||||
|
|
|||||||||||||
|
Cash Equivalents |
|
$ |
2 |
|
$ |
— |
|
$ |
— |
|
$ |
2 |
|
|
Restricted Investments |
|
|
857 |
|
|
— |
|
|
— |
|
|
857 |
|
|
|
|
|
|
|
|
|
|
|
|
|
|
|
|
|
Total Assets |
|
$ |
859 |
|
$ |
— |
|
$ |
— |
|
$ |
859 |
|
|
|
|
|
|
|
|
|
|
|
|
|
|
|
|
|
|
|
|
|
|
|
|
|
|
|
|
|
|
|
|
Derivative Liabilities |
|
$ |
— |
|
$ |
5,523 |
|
$ |
— |
|
$ |
5,523 |
|
|
Contingent Consideration |
|
|
— |
|
|
— |
|
|
3,578 |
|
|
3,578 |
|
|
|
|
|
|
|
|
|
|
|
|
|
|
|
|
|
Total Liabilities |
|
$ |
— |
|
$ |
5,523 |
|
$ |
3,578 |
|
$ |
9,101 |
|
|
|
|
|
|
|
|
|
|
|
|
|
|
|
|
Financial assets and liabilities measured at fair value at January 31, 2010 on a recurring basis are summarized below (amounts in thousands):
|
|
|
|
|
|
|
|
|
|
|
|
|
|
|
|
|
|
Level 1 |
|
Level 2 |
|
Level 3 |
|
Total Fair |
|
||||
|
|
|
|
|
|
|
|
|
|
|
||||
|
|
|||||||||||||
|
Cash Equivalents |
|
$ |
81,625 |
|
$ |
— |
|
$ |
— |
|
$ |
81,625 |
|
|
Investments in Debt Securities |
|
|
— |
|
|
1,014 |
|
|
— |
|
|
1,014 |
|
|
Restricted Investments |
|
|
1,357 |
|
|
— |
|
|
— |
|
|
1,357 |
|
|
|
|
|
|
|
|
|
|
|
|
|
|
|
|
|
Total Assets |
|
$ |
82,982 |
|
$ |
1,014 |
|
$ |
— |
|
$ |
83,996 |
|
|
|
|
|
|
|
|
|
|
|
|
|
|
|
|
|
|
|
|
|
|
|
|
|
|
|
|
|
|
|
|
Derivative Liabilities |
|
$ |
— |
|
$ |
5,884 |
|
$ |
— |
|
$ |
5,884 |
|
|
|
|
|
|
|
|
|
|
|
|
|
|
|
|
|
Total Liabilities |
|
$ |
— |
|
$ |
5,884 |
|
$ |
— |
|
$ |
5,884 |
|
|
|
|
|
|
|
|
|
|
|
|
|
|
|
|
No financial instruments were elected to be measured at fair value in accordance with ASC 470-20-25-21.
The Company reviews its long-lived assets for impairment on at least an annual basis based on the carrying value of these assets. As a result of vacancies at owned real estate locations, the Company tested certain long-lived assets for impairment using a fair value measurement approach. The fair value measurement approach utilizes a number of significant unobservable inputs or Level 3 assumptions. These assumptions include, among others, the implied fair value of these assets using an income approach by preparing a discounted cash flow analysis and the implied fair value of these assets using recent sales data of comparable properties, and other subjective assumptions. Upon completion of its impairment analysis, which was performed at various times throughout fiscal year 2010, the Company determined that the carrying value of certain long-lived assets exceeded the fair value of these assets. Accordingly, the Company recorded long-lived asset impairment charges of approximately $1,021,000 to properly reflect the carrying value of these assets.
On January 31, 2011 the Company sold 814,000 of its membership units to Levelland Hockley for $1, reducing the ownership interest in Levelland Hockley to 49%. As a result, the Company no longer has a controlling financial interest in Levelland Hockley, and, therefore, effective January 31, 2011, the Company deconsolidated Levelland Hockley and began using the equity method of accounting. In connection with the deconsolidation process, the Company recorded its remaining non controlling equity interest and debt investments at fair value. The Company’s estimate of fair value for all of its investments in Levelland Hockley was $0 at January 31, 2011. The Company recorded a pretax charge of approximately $18.4 million.
65
Assets measured at fair value at January 31, 2011 on a non-recurring basis are summarized below (amounts in thousands):
|
|
|
|
|
|
|
|
|
|
|
|
|
|
|
|
|
|
|
|
|
Year Ended |
|
Level 1 |
|
Level 2 |
|
Level 3 |
|
Total |
|
|||||
|
|
|
|
|
|
|
|
|
|
|
|
|
|||||
|
|
|
|
|
|
|
|
|
|
|
|
|
|
|
|
|
|
|
Property and equipment, net |
|
$ |
4,568 |
|
$ |
— |
|
$ |
— |
|
$ |
4,568 |
|
$ |
424 |
|
|
Non controlling equity investment in Levelland Hockley |
|
$ |
— |
|
$ |
— |
|
$ |
— |
|
$ |
— |
|
$ |
9,487 |
|
|
Notes receivable from Levelland Hockley |
|
$ |
— |
|
$ |
— |
|
$ |
— |
|
$ |
— |
|
$ |
8,937 |
|
|
|
|
|
|
|
|
|
|
|
|
|
|
|
|
|
|
|
|
Excluded from the table is information for losses on property and equipment, net that are now classified as discontinuing operations. Such losses totaled $597,000 in fiscal year 2010. |
||||||||||||||||
|
|
||||||||||||||||
|
Assets measured at fair value at January 31, 2010 on a non-recurring basis are summarized below (amounts in thousands): |
||||||||||||||||
|
|
|
|
|
|
|
|
|
|
|
|
|
|
|
|
|
|
|
|
|
Year Ended |
|
Level 1 |
|
Level 2 |
|
Level 3 |
|
Total |
|
|||||
|
|
|
|
|
|
|
|
|
|
|
|
|
|||||
|
|
|
|
|
|
|
|
|
|
|
|
|
|
|
|
|
|
|
Property and equipment, net |
|
$ |
5,821 |
|
$ |
— |
|
$ |
— |
|
$ |
5,821 |
|
$ |
1,039 |
|
|
|
|
|
|
Excluded from the table is information for losses on property and equipment, net that are now classified as discontinuing operations. Such losses totaled $494,000 in fiscal year 2009. |
|
|
|
|
4. |
SYNTHETIC FUEL LIMITED PARTNERSHIPS |
|
|
|
|
|
During fiscal year 1998, the Company invested in two limited partnerships that produced synthetic fuels. The limited partnerships earned federal income tax credits under Section 29/45K of the Internal Revenue Code based upon the quantity and content of synthetic fuel production and sales. Credits under Section 29/45K are available for qualified fuels sold before January 1, 2008 (see Note 17). |
|
|
|
|
|
Through a series of sales, the Company sold its ownership interest in Colona Synfuel Limited Partnership L.L.L.P (Colona), a limited partnership that owned a synthetic fuel facility, and generally received cash payments from the sales on a quarterly basis through fiscal year 2007. The Company earned and reported as income approximately $0.5 million for fiscal year 2008. No income was reported for fiscal years 2010 or 2009. |
|
|
|
|
|
The Company sold its entire ownership interest in Somerset Synfuel, L.P., (Somerset), a limited partnership that owned two synthetic fuel facilities, and generally received cash payments from the sales on a quarterly basis through fiscal year 2007. The Company earned and reported as income approximately $0.2 million for fiscal year 2008. No income was reported for fiscal years 2010 or 2009. |
66
|
|
|
|
|
The Section 29/45K tax credit program expired, under current law, at the end of 2007. Thus, the Company does not expect to recognize any income or loss from the Colona and Somerset sales beyond fiscal year 2008. |
|
|
|
|
|
The Company also sold its membership interest in the limited liability company that owned a synthetic fuel facility in Gillette, Wyoming. In addition to certain other payments, the Company was eligible to receive $1.50 per ton of “qualified production” produced by the facility and sold through 2007. The plant was subsequently sold and during the third quarter of fiscal year 2006, the Company modified its agreement with the owners and operators of the synthetic fuel facility. Based on the terms of the modified agreement, the Company currently is not able to determine the likelihood and timing of collecting payments related to production occurring after September 30, 2006. Thus, the Company cannot currently determine the timing of income recognition, if any, related to production occurring subsequent to September 30, 2006. The Company did not recognize any income from this sale during fiscal years 2010, 2009 or 2008. |
|
|
|
|
5. |
OTHER ASSETS |
|
|
|
|
|
The components of other noncurrent assets at January 31, 2011 and 2010 are as follows (amounts in thousands): |
|
|
|
|
|
|
|
|
|
|
|
|
January 31, |
|
||||
|
|
|
|
|
||||
|
|
|
2011 |
|
2010 |
|
||
|
|
|
|
|
|
|
||
|
|
|
|
|
|
|
|
|
|
Deferred financing costs, net |
|
$ |
1,006 |
|
$ |
3,633 |
|
|
Prepaid commissions |
|
|
1,924 |
|
|
4,320 |
|
|
Real estate taxes refundable |
|
|
682 |
|
|
— |
|
|
Other |
|
|
2,295 |
|
|
927 |
|
|
|
|
|
|
|
|
|
|
|
|
|
|
|
|
|
|
|
|
Total |
|
$ |
5,907 |
|
$ |
8,880 |
|
|
|
|
|
|
|
|
|
|
Deferred financing costs represent amounts paid to obtain both mortgage debt and borrowings under One Earth’s debt arrangements. Such amounts are amortized as interest expense. Future amortization expense is as follows (amounts in thousands):
|
|
|
|
|
|
|
Years Ended January 31, |
|
Amortization |
|
|
|
|
|
|
|
|
|
|
|
|
|
|
|
2012 |
|
$ |
317 |
|
|
2013 |
|
|
283 |
|
|
2014 |
|
|
245 |
|
|
2015 |
|
|
161 |
|
|
|
|
|
|
|
|
Total |
|
$ |
1,006 |
|
|
|
|
|
|
|
Prepaid commissions represent sales commissions paid in connection with extended warranties sold by the Company’s former retail sales staff. Such amounts are capitalized and amortized ratably over the
67
life of the extended warranty plan sold. Future amortization of prepaid commissions is as follows (amounts in thousands):
|
|
|
|
|
|
|
Years Ended January 31, |
|
Amortization |
|
|
|
|
|
|
|
|
|
|
|
|
|
|
|
2012 |
|
$ |
1,195 |
|
|
2013 |
|
|
565 |
|
|
2014 |
|
|
164 |
|
|
|
|
|
|
|
|
Total |
|
$ |
1,924 |
|
|
|
|
|
|
|
Real estate taxes refundable represent amounts due One Earth associated with refunds of previously paid taxes in connection with a tax increment financing arrangement with local taxing authorities.
|
|
|
|
6. |
NET INCOME PER SHARE FROM CONTINUING OPERATIONS |
|
|
|
|
|
The Company reports net income per share in accordance with ASC 260, “Earnings per Share”. Basic net income per share is computed by dividing net income available to common shareholders by the weighted average number of common shares outstanding during the year. Diluted net income per share is computed by dividing net income available to common shareholders by the weighted average number of shares outstanding and dilutive common share equivalents during the year. Common share equivalents for each year include the number of shares issuable upon the exercise of outstanding options, less the shares that could be purchased under the treasury stock method. The following table reconciles the basic and diluted net income per share from continuing operations computations for each year presented for fiscal years 2010, 2009 and 2008 (amounts in thousands, except per-share amounts): |
|
|
|
|
|
|
|
|
|
|
|
|
|
|
|
2010 |
|
|||||||
|
|
|
|
|
|||||||
|
|
|
|
|
|||||||
|
|
|
Income |
|
Shares |
|
Per Share |
|
|||
|
|
|
|
|
|
|
|
|
|||
|
|
|
|
|
|
|
|
|
|||
|
Basic net income per share from continuing operations attributable to REX common shareholders |
|
$ |
3,097 |
|
|
9,651 |
|
$ |
0.32 |
|
|
Effect of stock options |
|
|
|
|
|
174 |
|
|
|
|
|
|
|
|
|
|
|
|
|
|
|
|
|
Diluted net income per share from continuing operations attributable to REX common shareholders |
|
$ |
3,097 |
|
$ |
9,825 |
|
$ |
0.32 |
|
|
|
|
|
|
|
|
|
|
|
|
|
|
|
|
|
|
|
|
|
|
|
|
|
|
|
|
2009 |
|
|||||||
|
|
|
|
|
|||||||
|
|
|
|
|
|
|
|
|
|
|
|
|
|
|
Income |
|
Shares |
|
Per Share |
|
|||
|
|
|
|
|
|
|
|
|
|||
|
|
|
|
|
|
|
|
|
|
|
|
|
Basic net income per share from continuing operations attributable to REX common shareholders |
|
$ |
6,051 |
|
|
9,254 |
|
$ |
0.65 |
|
|
Effect of stock options |
|
|
|
|
|
297 |
|
|
|
|
|
|
|
|
|
|
|
|
|
|
|
|
|
Diluted net income per share from continuing operations attributable to REX common shareholders |
|
$ |
6,051 |
|
|
9,551 |
|
$ |
0.63 |
|
|
|
|
|
|
|
|
|
|
|
|
|
As there was a loss from continuing operations in fiscal year 2008, basic loss per share from continuing operations equals diluted loss per share from continuing operations. For fiscal years 2010, 2009 and 2008, a total of 0, 310,723 and 2,715,001 shares, respectively, subject to outstanding options were not
68
|
|
|
|
|
included in the common equivalent shares outstanding calculation as the effect from these shares is antidilutive. |
|
|
|
|
7. |
SALE AND LEASEBACK TRANSACTIONS AND OTHER LEASES |
On September 16, 2008, the Company completed a transaction for the sale and partial leaseback of its Cheyenne, Wyoming distribution center under a three year lease term. A pre-tax gain, classified as discontinued operations, of approximately $2.4 million (net of expenses) resulted from this sale. The Company recognized approximately $0.8 million and $1.6 million of the gain in fiscal years 2009 and 2008, respectively. None of the gain was recognized in fiscal year 2010. The lease has been accounted for as an operating lease.
On April 30, 2007, the Company completed a transaction for the sale of 86 of its current and former store locations to KLAC REX, LLC (“Klac”) for $74.5 million in cash, before selling expenses. The Company also entered into leases to leaseback 40 of the properties from Klac for initial lease terms expiring January 31, 2010. All of the leases with Klac were terminated by January 31, 2010.
This transaction resulted in a gain (realized and deferred) of $14.8 million. Of this gain, $3.9 million and $1.5 million was recognized, in fiscal years 2009 and 2008, respectively. None of the gain was recognized in fiscal year 2010. The gain recognized in fiscal years 2009 and 2008 was classified in discontinued operations. As a result of the wind down of the Company’s retail business, the term over which the deferred gain was being amortized had been shortened and is based upon the Company abandoning, or otherwise ceasing use of the leased property. See Note 12 for a discussion of restructuring related charges. The leases were accounted for as operating leases.
At January 31, 2011, the Company has lease agreements, as landlord, for all or portions of nine owned properties. All of the leases are accounted for as operating leases. The Company recognized lease revenue of approximately $1,285,000, $913,000 and $364,000 in fiscal years 2010, 2009 and 2008, respectively.
As of January 31, 2011, future minimum annual rentals on such leases are as follows (amounts in thousands):
|
|
|
|
|
|
|
Years Ended |
|
Minimum |
|
|
|
|
|
|
|
|
|
|
|
|
|
|
|
2012 |
|
$ |
1,303 |
|
|
2013 |
|
|
1,254 |
|
|
2014 |
|
|
1,161 |
|
|
2015 |
|
|
920 |
|
|
2016 |
|
|
350 |
|
|
Thereafter |
|
|
1,613 |
|
|
|
|
|
|
|
|
|
|
|
|
|
|
|
|
$ |
6,601 |
|
|
|
|
|
|
|
|
|
|
|
8. |
COMMON STOCK |
|
|
|
|
|
During fiscal years 2010, 2009 and 2008, the Company purchased 514,657 shares, 1,256,604 shares and 1,636,252 shares, respectively, of its common stock for $8,229,000, $15,694,000 and $17,708,000, respectively. Included in these amounts are shares the Company received totaling 659,957 for the year ended January 31, 2010 as tenders of the exercise price of stock options exercised by the Company’s |
69
Chief Executive Officer. The cost of these shares, determined as the fair market value on the date they were tendered, was approximately $9,239,000 for the year ended January 31, 2010. At January 31, 2011, the Company had prior authorization by its Board of Directors to purchase, in open market transactions, an additional 468,044 shares of its common stock. Information regarding the Company’s common stock is as follows (amounts in thousands):
|
|
|
|
|
|
|
|
|
|
|
|
January 31, |
|
January 31, |
|
||
|
|
|
|
|
|
|
||
|
|
|||||||
|
Authorized shares |
|
|
45,000 |
|
|
45,000 |
|
|
Issued shares |
|
|
29,853 |
|
|
29,853 |
|
|
Outstanding shares |
|
|
9,392 |
|
|
9,808 |
|
|
|
|
|
9. |
LONG-TERM DEBT AND INTEREST RATE SWAPS |
|
|
|
|
|
Long-term debt consists of notes payable secured by certain land, buildings and equipment. Interest rates ranged from 2.3% to 8.4% in fiscal years 2010 and 2009. Principal and interest are payable periodically over terms that generally range from 5 to 10 years. The following provides information on rates segregated as fixed or variable and by term for fiscal years 2010 and 2009: |
|
|
|
|
|
|
|
|
|
|
|
January 31, 2011 |
|
|
|
|
|
|
|
|
|
|
|
|
|
Interest Rates |
|
Maturity |
|
Balance |
|
|
|
|
|
|
|
|
|
|
|
|
|
|
|
|
|
|
|
|
|
Variable |
|
|
|
|
|
3.27% - 3.75% |
|
Within five years |
|
$ |
79,313 |
|
|
|
|
|
|
|
|
|
|
|
|
|
|
|
|
|
|
|
|
Fixed |
|
|
|
|
|
8.40% |
|
Within five years |
|
$ |
1,674 |
|
|
|
|
|
|
|
|
|
|
|
|
|
|
|
|
|
|
|
|
January 31, 2010 |
|
|
|
|
|
|
|
|
|
|
|
|
|
Interest Rates |
|
Maturity |
|
Balance |
|
|
|
|
|
|
|
|
|
|
|
|
|
|
|
|
|
|
|
|
|
Variable |
|
|
|
|
|
3.38% - 4.25% |
|
Within five years |
|
$ |
135,790 |
|
|
|
|
|
|
|
|
|
|
|
|
|
|
|
|
|
|
|
|
Fixed |
|
|
|
|
|
8.40% |
|
Five to six years |
|
$ |
2,330 |
|
|
|
|
|
|
|
|
|
70
Annual expected maturities of long-term debt are as follows (amounts in thousands):
|
|
|
|
|
|
|
|
Year
Ending |
|
|
|
|
|
|
|
|
|
|
|
|
|
|
|
|
|
|
|
|
2012 |
|
$ |
10,014 |
|
|
|
2013 |
|
|
11,174 |
|
|
|
2014 |
|
|
11,661 |
|
|
|
2015 |
|
|
47,810 |
|
|
|
2016 |
|
|
328 |
|
|
|
|
|
|
|
|
|
|
|
|
$ |
80,987 |
|
|
|
|
|
|
|
|
|
In fiscal year 2010, the Company paid off approximately $0.4 million in mortgage debt prior to maturity. As a result, the Company expensed unamortized deferred financing cost and prepayment penalties of approximately $48,000 as loss on early termination of debt.
The fair value of the Company’s long-term debt at January 31, 2011 and 2010 was approximately $81.2 million and $138.4 million, respectively.
One Earth Energy Subsidiary Level Debt
During the third quarter of fiscal year 2009, pursuant to the terms of the loan agreement, One Earth converted their construction loan into a term loan. Beginning with the first quarterly payment on October 8, 2009, payments are due in 20 quarterly payments of principal plus accrued interest with the principal portion calculated based on a 120 month amortization schedule. One final installment will be required on the maturity date (July 31, 2014) for the remaining unpaid principal balance with accrued interest. The term loan bears interest at rates ranging from LIBOR plus 300 basis points to LIBOR plus 310 basis points (3.1% to 3.3% at January 31, 2011). Borrowings are secured by all property of One Earth. This debt is recourse only to One Earth and not to REX American Resources Corporation or any of its other subsidiaries. As of January 31, 2011, approximately $78.7 million was outstanding on the term loan. One Earth is also subject to certain financial covenants under the loan agreement, including required levels of EBITDA, working capital, debt service coverage ratio requirements, net worth requirements and other common covenants. One Earth was in compliance with all applicable covenants at January 31, 2011.
One Earth has a $10.0 million revolving loan facility that matures May 31, 2011. Borrowings under this facility bear interest at the greater of 5.1% or LIBOR plus 310 basis points. One Earth has no outstanding borrowings on the revolving loan as of January 31, 2011.
One Earth has issued letters of credit that total approximately $0.3 million at January 31, 2011. One Earth also has access to a secondary line of credit of up to $10,000,000 with First National Bank of Omaha (the “Bank”), established as part of the original $100,000,000 term loan and made accessible as a revolving line of credit as term loan payments were made. The amount available is reduced by $250,000 on a quarterly basis. At January 31, 2011 and 2010, One Earth had $8,750,000 and $10,000,000, respectively, on the secondary line of credit available on this revolving line of credit. One Earth did not have any borrowings on the secondary line of credit at January 31, 2011 or 2010.
One Earth has paid approximately $1.4 million in financing costs. These costs are recorded as deferred financing costs and are being amortized ratably over the term of the loan. At January 31, 2011, the Company’s proportionate share of restricted assets related to One Earth was approximately $59.8
71
|
|
|
|
|
million. One Earth’s restricted assets total approximately $81.2 million. Such assets may not be paid in the form of dividends or advances to the parent company or other members of One Earth per the terms of the loan agreement with First National Bank of Omaha. |
|
|
|
|
|
One Earth entered into two forward interest rate swaps in the notional amounts of $50.0 million and $25.0 million with the Bank. The swap settlements commenced as of July 31, 2009; the $50.0 million swap terminates on July 8, 2014 and the $25.0 million swap terminates on July 31, 2011. The $50.0 million swap fixed a portion of the variable interest rate of the term loan subsequent to the plant completion date at 7.9% while the $25.0 million swap fixed the rate at 5.49%. At January 31, 2011 and 2010, One Earth recorded a liability of approximately $5.5 million and $5.6 million, respectively related to the fair value of the swaps. The change in fair value was recorded in the Consolidated Statements of Operations. |
|
|
|
|
10. |
FINANCIAL INSTRUMENTS |
|
|
|
|
|
The Company uses interest rate swaps to manage its interest rate exposure at One Earth by fixing the interest rate on a portion of the variable rate debt. The Company does not engage in trading activities involving derivative contracts for which a lack of marketplace quotations would necessitate the use of fair value estimation techniques. As of January 31, 2011, the notional value of the interest rate swaps was approximately $68.1 million. At January 31, 2011, the Company has recorded a liability of approximately $5.5 million related to the fair value of the swaps. The change in fair value was recorded in the Consolidated Statements of Operations. The notional amounts and fair values of derivatives, all of which are not designated as cash flow hedges at January 31, 2011 are summarized in the table below (amounts in thousands): |
|
|
|
|
|
|
|
|
|
|
|
|
Notional |
|
Fair Value |
|
||
|
|
|
|
|
|
|
||
|
Interest rate swaps |
|
$ |
68,138 |
|
$ |
5,523 |
|
|
|
|
|
|
The notional amounts and fair values of derivatives, all of which are not designated as cash flow hedges at January 31, 2010 are summarized in the table below (amounts in thousands): |
|
|
|
|
|
|
|
|
|
|
|
|
Notional |
|
Fair Value |
|
||
|
|
|
|
|
|
|
|
|
|
Interest rate swaps |
|
$ |
108,238 |
|
$ |
5,884 |
|
|
|
|
|
|
As the interest rate swaps are not designated as cash flow hedges, the unrealized gain and loss on the derivatives is reported in current earnings. The Company reported losses of approximately $2,116,000 $2,487,000 and $3,797,000, in fiscal years 2010, 2009 and 2008, respectively. |
|
|
|
|
|
Swap settlement payments to the counterparty totaled approximately $2,477,000, $2,510,000 and $369,000 in fiscal years 2010, 2009 and 2008, respectively. |
|
|
|
|
11. |
EMPLOYEE BENEFITS |
|
|
|
|
|
Stock Option Plans – The Company maintains the REX American Resources Corporation 1995 Omnibus Stock Incentive Plan and the REX American Resources Corporation 1999 Omnibus Stock Incentive Plan (the “Omnibus Plans”). Under the Omnibus Plans, the Company may grant to officers |
72
|
|
|
|
|
and key employees awards in the form of non-qualified stock options, stock appreciation rights, restricted stock, other stock-based awards and cash incentive awards. The Omnibus Plans also provide for yearly grants of non-qualified stock options to directors who are not employees of the Company. The exercise price of each option must be at least 100% of the fair market value of the Company’s common stock on the date of grant. A maximum of 4,500,000 shares of common stock are authorized for issuance under each of the Omnibus Plans. On January 31, 2011, 108,011 and 2,302,425 shares remain available for issuance under the 1995 and 1999 Plans, respectively. |
|
|
|
|
|
On April 17, 2001, the Company’s Board of Directors approved a grant of non-qualified stock options to two key executives for 1,462,500 shares at an exercise price of $8.01, which represented the market price on the date of grant. These became fully vested as of December 31, 2005. As of January 31, 2011, 337,500 of these options remained outstanding. |
|
|
|
|
|
The following summarizes stock option activity for fiscal years 2010, 2009 and 2008 (amounts in thousands, except per-share amounts): |
|
|
|
|
|
|
|
|
|
|
|
|
|
|
|
|
|
|
|
|
|
|
|
|
2010 |
|
2009 |
|
2008 |
|
||||||||||||
|
|
|
|
|
|
|
|
|
||||||||||||
|
|
|
Shares |
|
Weighted |
|
Shares |
|
Weighted |
|
Shares |
|
Weighted |
|
||||||
|
|
|
|
|
|
|
|
|
|
|
|
|
|
|
||||||
|
|
|
|
|
|
|
|
|
|
|
|
|
|
|
|
|
|
|
|
|
|
Outstanding—Beginning of year |
|
|
824 |
|
$ |
10.14 |
|
|
2,715 |
|
$ |
9.63 |
|
|
3,016 |
|
$ |
9.16 |
|
|
Exercised |
|
|
(98 |
) |
|
10.00 |
|
|
(1,683 |
) |
|
8.87 |
|
|
(299 |
) |
|
4.86 |
|
|
Canceled or expired |
|
|
— |
|
|
— |
|
|
(208 |
) |
|
13.75 |
|
|
(2 |
) |
|
12.64 |
|
|
|
|
|
|
|
|
|
|
|
|
|
|
|
|
|
|
|
|
|
|
|
|
|
|
|
|
|
|
|
|
|
|
|
|
|
|
|
|
|
|
|
|
Outstanding—End of year |
|
|
726 |
|
$ |
10.16 |
|
|
824 |
|
$ |
10.14 |
|
|
2,715 |
|
$ |
9.63 |
|
|
|
|
|
|
|
|
|
|
|
|
|
|
|
|
|
|
|
|
|
|
|
|
|
|
|
|
|
|
|
|
|
|
|
|
|
|
|
|
|
|
|
|
Exercisable—End of year |
|
|
726 |
|
$ |
10.16 |
|
|
824 |
|
$ |
10.14 |
|
|
2,661 |
|
$ |
9.57 |
|
|
|
|
|
|
|
|
|
|
|
|
|
|
|
|
|
|
|
|
|
|
|
|
|
|
|
Price ranges and other information for stock options outstanding as of January 31, 2011 were as follows (amounts in thousands, except per share amounts): |
|
|
|
|
|
|
|
|
|
|
|
|
|
|
|
Outstanding and Exercisable |
|
|||||||
|
|
|
|
|
|||||||
|
Range of |
|
Shares |
|
Weighted |
|
Weighted |
|
|||
|
|
|
|
|
|
|
|
|
|||
|
|
||||||||||
|
$8.01 to $10.37 |
|
|
437 |
|
$ |
8.11 |
|
|
0.21 |
|
|
$12.04 to $16.04 |
|
|
289 |
|
|
13.26 |
|
|
2.46 |
|
|
|
|
|
|
|
|
|
|
|
|
|
|
|
|
|
|
|
|
|
|
|
|
|
|
|
|
|
726 |
|
$ |
10.16 |
|
|
1.11 |
|
|
|
|
|
|
|
|
|
|
|
|
|
|
|
|
|
|
Profit Sharing Plan – The Company has a qualified, noncontributory profit sharing plan (the “Plan”) covering full-time employees who meet certain eligibility requirements. The Plan also allows for additional 401(k) saving contributions by participants, along with certain company matching contributions. Aggregate contributions to the Plan are determined annually by the Board of Directors |
73
|
|
|
|
|
and are not to exceed 15% of total compensation paid to all participants during such year. The Company contributed approximately $1,000, $1,800 and $15,000 for fiscal years 2010, 2009 and 2008, respectively, under the Plan. |
|
|
|
|
12. |
RESTRUCTURING AND OTHER |
|
|
|
|
|
During the fourth quarter of fiscal year 2008, the Company entered into an agreement with Appliance Direct, Inc. (“Appliance Direct”) pursuant to which (i) the Company agreed to sell certain appliance inventory, furniture, fixtures and equipment at the store locations to be taken over by Appliance Direct and (ii) subsidiaries of Appliance Direct leased 37 retail store locations owned by the Company. |
|
|
|
|
|
The Company agreed to pay Appliance Direct, as of the implementation date defined in the agreement, an amount equal to the adjusted book value liability of the Company’s customer extended service plans for certain appliances previously sold at locations that Appliance Direct took over from the Company (the “ESP Credit”). |
|
|
|
|
|
During the fourth quarter of fiscal year 2008, the Company recorded a restructuring charge of approximately $4.2 million related to (i) a workforce reduction of a majority of employees located at its corporate headquarters, retail stores and distribution facilities and (ii) certain costs associated with the transition of the Company’s retail business to Appliance Direct. |
|
|
|
|
|
On July 31, 2009, the Company entered into a Third Amendment to Agreement and a Second Global Amendment to Multiple Leases (together, the “Amendments”) with Appliance Direct. The Amendments (i) eliminated the right of Appliance Direct to purchase stores it leased from the Company (ii) eliminated the right of Appliance Direct to terminate certain leases in the future and (iii) eliminated the obligation of Appliance Direct to lease 22 properties from the Company. The terms of the 15 leases and one sub-lease under which the Company leased property to Appliance Direct remained in full force except as modified by the Amendments. As a result of these Amendments, the Company reduced the accruals for employee severance and bonus costs by approximately $0.7 million, for investment banker fees by approximately $0.3 million and for the ESP Credit by approximately $0.3 million during the second quarter of fiscal year 2009. |
|
|
|
|
|
On September 30, 2009, the Company entered into a letter agreement with Appliance Direct pursuant to which (i) Appliance Direct agreed to vacate all properties leased from the Company and turn over possession of the leased premises to the Company and (ii) the Company and Appliance Direct agreed to release and discharge each other from all claims or causes of action whatsoever. |
|
|
|
|
|
The Company completed its exit of the retail business as of July 31, 2009. The following is a summary |
74
|
|
|
|
|
of restructuring charges and payments (in thousands): |
|
|
|
|
|
|
|
|
|
|
|
|
|
|
|
|
|
|
|
|
|
Employee |
|
Lease |
|
Investment |
|
ESP |
|
Total |
|
|||||
|
|
|
|
|
|
|
|
|
|
|
|
|
|||||
|
|
|
|
|
|
|
|
|
|
|
|
|
|
|
|
|
|
|
Balance, January 31, 2008 |
|
$ |
— |
|
$ |
— |
|
$ |
— |
|
$ |
— |
|
$ |
— |
|
|
Restructuring charges |
|
|
2,839 |
|
|
— |
|
|
834 |
|
|
498 |
|
|
4,171 |
|
|
|
|
|
|
|
|
|
|
|
|
|
|
|
|
|
|
|
|
Balance, January 31, 2009 |
|
|
2,839 |
|
|
— |
|
|
834 |
|
|
498 |
|
|
4,171 |
|
|
Restructuring charges |
|
|
85 |
|
|
2,951 |
|
|
— |
|
|
— |
|
|
3,036 |
|
|
Reversal of restructuring charges |
|
|
(706 |
) |
|
(41 |
) |
|
(325 |
) |
|
(287 |
) |
|
(1,359 |
) |
|
Payments of restructuring liabilities |
|
|
(1,999 |
) |
|
(2,471 |
) |
|
(509 |
) |
|
(211 |
) |
|
(5,190 |
) |
|
|
|
|
|
|
|
|
|
|
|
|
|
|
|
|
|
|
|
Balance, January 31, 2010 |
|
|
219 |
|
|
439 |
|
|
— |
|
|
— |
|
|
658 |
|
|
Restructuring charges |
|
|
63 |
|
|
— |
|
|
— |
|
|
— |
|
|
63 |
|
|
Payments of restructuring liabilities |
|
|
(282 |
) |
|
(293 |
) |
|
— |
|
|
— |
|
|
(575 |
) |
|
|
|
|
|
|
|
|
|
|
|
|
|
|
|
|
|
|
|
Balance, January 31, 2011 |
|
$ |
— |
|
$ |
146 |
|
$ |
— |
|
$ |
— |
|
$ |
146 |
|
|
|
|
|
|
|
|
|
|
|
|
|
|
|
|
|
|
|
|
|
|
|
|
All of the accrual balance of $146,000 is classified within current liabilities. The restructuring charges are all classified as discontinued operations. The accrued balance at January 31, 2011 is management’s best estimate of the amount to be incurred for the related categories. |
|
|
|
|
13. |
COMMITMENTS |
|
|
|
|
|
One Earth has forward purchase contracts for 4.9 million bushels of corn, the principal raw material for its ethanol plant. The Company expects to take delivery of the corn by April 2011. |
|
|
|
|
|
One Earth has sales commitments for 6,282,000 gallons of ethanol and 29,200 tons of distillers grains. One Earth expects to deliver the ethanol and the distillers grains by April 2011. |
|
|
|
|
|
Forward grain purchase, ethanol and distillers grains sale contracts are accounted for under the “normal purchases and normal sales” scope exemption of the accounting standards because these arrangements are for purchases of grain and sales of ethanol and distillers grains that will be delivered in quantities expected to be used by One Earth over a reasonable period of time in the normal course of business. |
|
|
|
|
|
One Earth has entered into an agreement with an unrelated party for the use of a portion of the party’s natural gas pipeline. The term of the agreement is 10 years, and the amount is $4,380,000, which is spread over 120 equal payments of $36,500. Payments began in February 2009. |
|
|
|
|
|
One Earth has entered into an agreement with an unrelated party for the lease of railcars that will be used to ship ethanol. The lease is set to expire on May 31, 2012, with an automatic 36-month extension, unless either party notifies the other in writing 60 days prior to the initial expiration date. One Earth pays a monthly lease amount per railcar. One Earth paid approximately $662,000 and $344,000 pursuant to the lease in fiscal years 2010 and 2009, respectively. |
75
|
|
|
|
|
One Earth has a nonexclusive contract with an unrelated party (“Ethanol Marketer”) for ethanol marketing services. Under the terms of the contract, the Ethanol Marketer will purchase some of the Company’s ethanol production during the term of the contract. Additionally, One Earth is also required to share with the Ethanol Marketer the additional profits derived from the Ethanol Marketer’s gains on swaps and exchanges. The contract matures December 1, 2012, with automatic renewals for one year, unless One Earth provides written notice of at least 90 days prior to the end of the initial term. |
|
|
|
|
|
One Earth has a contract with an unrelated party (“Distillers Grains Marketer”) for distillers grains marketing services. Under the terms of the contract, the Distillers Grains Marketer will purchase all of One Earth’s distillers grains production during the term of the contract. The contract called for One Earth to pay a fee per ton of distillers grains for the Distillers Grains Marketer’s services. The contract was amended on December 6, 2010, to reduce the fee for DDGS, and the termination date was extended to July 1, 2014. One Earth paid approximately $905,000 and $408,000 in fiscal years 2010 and 2009, respectively, for these marketing services. |
|
|
|
|
|
One Earth has a grain origination agreement with Alliance Grain, under which it purchased 100% of its grain during 2010. One Earth pays to Alliance Grain a certain amount per bushel for procurement fees. The term of the agreement is for two years from the first grind date, and shall renew automatically for additional one year terms, unless either party sends notice to the other party of its intent to terminate the agreement at least sixty days prior to the expiration of the then current term of the agreement. |
|
|
|
|
14. |
INCOME TAXES |
|
|
|
|
|
The provision (benefit) for income taxes from continuing operations for fiscal years 2010, 2009 and 2008 consists of the following (amounts in thousands): |
|
|
|
|
|
|
|
|
|
|
|
|
|
|
|
2010 |
|
2009 |
|
2008 |
|
|||
|
|
|
|
|
|
|
|
|
|||
|
Federal: |
|
|
|
|
|
|
|
|
|
|
|
Current |
|
$ |
— |
|
$ |
(7,552 |
) |
$ |
(3,386 |
) |
|
Deferred |
|
|
2,881 |
|
|
11,296 |
|
|
489 |
|
|
|
|
|
|
|
|
|
|
|
|
|
|
|
||||||||||
|
|
|
|
2,881 |
|
|
3,744 |
|
|
(2,897 |
) |
|
|
|
|
|
|
|
|
|
|
|
|
|
|
|
|
|
|
|
|
|
|
|
|
|
State and Local: |
|
|
|
|
|
|
|
|
|
|
|
Current |
|
|
— |
|
|
426 |
|
|
69 |
|
|
Deferred |
|
|
138 |
|
|
327 |
|
|
112 |
|
|
|
|
|
|
|
|
|
|
|
|
|
|
|
||||||||||
|
|
|
|
138 |
|
|
753 |
|
|
181 |
|
|
|
|
|
|
|
|
|
|
|
|
|
|
|
||||||||||
|
|
|
$ |
3,019 |
|
$ |
4,497 |
|
$ |
(2,716 |
) |
|
|
|
|
|
|
|
|
|
|
|
|
76
|
|
|
|
|
The tax effects of significant temporary differences representing deferred tax assets and liabilities are as follows as of January 31, 2011 and 2010 (amounts in thousands): |
|
|
|
|
|
|
|
|
|
|
|
|
2011 |
|
2010 |
|
||
|
|
|
|
|
|
|
||
|
|
|||||||
|
Assets: |
|
|
|
|
|
|
|
|
Deferral of service contract income |
|
$ |
1,566 |
|
$ |
3,463 |
|
|
Accrued liabilities |
|
|
249 |
|
|
504 |
|
|
Inventory accounting |
|
|
— |
|
|
215 |
|
|
Installment sales of limited partnerships |
|
|
1,297 |
|
|
1,297 |
|
|
Derivative accounting |
|
|
1,259 |
|
|
1,729 |
|
|
Stock based compensation |
|
|
406 |
|
|
464 |
|
|
Federal net operating loss carryforward |
|
|
2,192 |
|
|
156 |
|
|
AMT credit carryforward |
|
|
23,373 |
|
|
23,449 |
|
|
State net operating loss carryforward |
|
|
2,407 |
|
|
1,473 |
|
|
Valuation allowance |
|
|
(1,242 |
) |
|
(578 |
) |
|
Other items |
|
|
1,246 |
|
|
2,358 |
|
|
|
|
|
|
|
|
|
|
|
|
|
|
|
|
|
|
|
|
Total |
|
|
32,753 |
|
|
34,530 |
|
|
|
|
|
|
|
|
|
|
|
Liabilities: |
|
|
|
|
|
|
|
|
Basis in pass through entities |
|
|
(4,314 |
) |
|
(6,201 |
) |
|
Depreciation |
|
|
(17,399 |
) |
|
(12,106 |
) |
|
Other |
|
|
— |
|
|
(1,380 |
) |
|
|
|
|
|
|
|
|
|
|
|
|
|
|
|
|
|
|
|
Total |
|
|
(21,713 |
) |
|
(19,687 |
) |
|
|
|
|
|
|
|
|
|
|
Net deferred tax asset |
|
$ |
11,040 |
|
$ |
14,843 |
|
|
|
|
|
|
|
|
|
|
|
|
|
|
|
The Company has approximately $23.4 million of alternative minimum tax (“AMT”) credit carryforwards as of January 31, 2011 and 2010. The AMT credit carryforwards can be used to offset future regular income tax liabilities subject to certain limitations. The AMT credit carryforwards have no expiration date. The Company must generate approximately $156 million in future taxable income to fully utilize the AMT credit carryforward. If the Company is not able to generate sufficient taxable income in subsequent years to allow for the utilization of the deferred tax assets, the Company would need to provide a valuation allowance for such deferred tax assets, thus increasing income tax expense. |
|
|
|
|
|
The Company has federal net operating loss carryforwards of approximately $13.7 million, which will begin to expire in fiscal year 2019. |
|
|
|
|
|
The Company has state net operating loss carryforwards of approximately $32.7 million, net of the federal benefit, which will begin to expire in fiscal year 2011. |
|
|
|
|
|
The Company has a valuation allowance of approximately $1,242,000 at January 31, 2011. The Company increased the valuation allowance by $664,000 in fiscal year 2010. The Company reduced the valuation allowance by $231,000 in fiscal year 2008. These adjustments to the valuation allowance are a result of estimates of realizing certain future state tax benefits. No adjustment was made in fiscal year 2009. |
77
|
|
|
|
|
The Company paid income taxes of $1,310,000, $14,000 and $732,000 in fiscal years 2010, 2009 and 2008, respectively. The Company received refunds of income taxes of $5,691,000, $1,105,000 and $1,280,000 in fiscal years 2010, 2009 and 2008, respectively. |
|
|
|
|
|
The effective income tax rate on consolidated pre-tax loss or income differs from the federal income tax statutory rate for fiscal years 2010, 2009 and 2008 as follows: |
|
|
|
|
|
|
|
|
|
|
|
|
|
|
|
2010 |
|
2009 |
|
2008 |
|
|||
|
|
|
|
|
|
|
|
|
|||
|
|
|
|
|
|
|
|
|
|
|
|
|
Federal income tax at statutory rate |
|
|
35.0 |
% |
|
35.0 |
% |
|
(35.0 |
)% |
|
Ethanol small producer credit |
|
|
— |
|
|
— |
|
|
(14.7 |
) |
|
State and local taxes, net of federal tax benefit |
|
|
4.1 |
|
|
3.9 |
|
|
6.5 |
|
|
Net provision (reduction) in valuation allowance |
|
|
9.8 |
|
|
— |
|
|
(6.3 |
) |
|
Uncertain tax positions |
|
|
1.5 |
|
|
(0.3 |
) |
|
(9.0 |
) |
|
Noncontrolling interest |
|
|
(17.7 |
) |
|
(8.0 |
) |
|
29.2 |
|
|
Other |
|
|
(1.9 |
) |
|
0.5 |
|
|
(1.8 |
) |
|
|
|
|
|
|
|
|
|
|
|
|
|
|
||||||||||
|
Total |
|
|
30.8 |
% |
|
31.1 |
% |
|
(31.1 |
)% |
|
|
|
|
|
|
|
|
|
|
|
|
|
|
|
|
|
The Company files a U.S. federal income tax return and income tax returns in various states. In general, the Company is no longer subject to U.S. federal, state or local income tax examinations by tax authorities for fiscal years ended January 31, 2007 and prior. |
|
|
|
|
|
The Company adopted the provisions of ASC 740-10-25-5 on February 1, 2007. As a result of the adoption of this accounting standard, the Company recorded a $287,000 decrease to retained earnings. As of January 31, 2011, total unrecognized tax benefits were $2,733,000, and accrued penalties and interest were $243,000. If the Company were to prevail on all unrecognized tax benefits recorded, approximately $129,000 of the reserve would benefit the effective tax rate. In addition, the impact of penalties and interest would also benefit the effective tax rate. Interest and penalties associated with unrecognized tax benefits are recorded within income tax expense. |
|
|
|
|
|
On a quarterly and annual basis, the Company accrues for the effects of open uncertain tax positions and the related potential penalties and interest. The Company increased the liability for uncertain tax positions by $534,000 during fiscal year 2010 related to current year uncertain tax positions. |
|
|
|
|
|
It is reasonably possible that the amount of the unrecognized tax benefit with respect to certain unrecognized tax positions will increase or decrease during the next 12 months; however, the Company does not expect the change to have a material effect on results of operations or financial position. A reconciliation of the beginning and ending amount of unrecognized tax benefits, including interest and penalties, is as follows (dollars in thousands): |
78
|
|
|
|
|
|
|
|
|
|
|
|
Years Ended |
|
||||
|
|
|
2011 |
|
2010 |
|
||
|
|
|
|
|
|
|
||
|
|
|
|
|
|
|
|
|
|
Unrecognized tax benefits, beginning of year |
|
$ |
2,338 |
|
$ |
4,160 |
|
|
Changes for tax positions for prior years |
|
|
104 |
|
|
(2,978 |
) |
|
Changes for tax positions for current year |
|
|
534 |
|
|
1,156 |
|
|
|
|
|
|
|
|
|
|
|
|
|
|
|
|
|
|
|
|
Unrecognized tax benefits, end of year |
|
$ |
2,976 |
|
$ |
2,338 |
|
|
|
|
|
|
|
|
|
|
|
|
|
|
15. |
COMPREHENSIVE INCOME (LOSS) |
|
|
|
|
|
Comprehensive income includes net income (loss) and unrealized gains on securities classified as available for sale (net of the related tax effects), and are reported separately in shareholders’ equity. The components of comprehensive income (loss) in fiscal years 2010, 2009 and 2008 are as follows (amounts in thousands): |
|
|
|
|
|
|
|
|
|
|
|
|
|
|
|
2010 |
|
2009 |
|
2008 |
|
|||
|
|
|
|
|
|
|
|
|
|||
|
|
|
|
|
|
|
|
|
|
|
|
|
Net income (loss) attributable to REX common shareholders |
|
$ |
5,069 |
|
$ |
8,652 |
|
$ |
(3,297 |
) |
|
Reclassification adjustment for net gains included in net income |
|
|
(49 |
) |
|
— |
|
|
— |
|
|
Unrealized holding gains on available for sale securities, net |
|
|
— |
|
|
49 |
|
|
— |
|
|
|
|
|
|
|
|
|
|
|
|
|
|
Total comprehensive income (loss) |
|
$ |
5,020 |
|
$ |
8,701 |
|
$ |
(3,297 |
) |
|
|
|
|
|
|
|
|
|
|
|
|
|
|
|
|
16. |
DISCONTINUED OPERATIONS |
|
|
|
|
|
During fiscal year 2009, the Company completed the exit of its retail business. Accordingly, all operations of the Company’s former retail segment and certain sold properties have been classified as discontinued operations for all periods presented. Once real estate property has been sold, and no continuing involvement is expected, the Company classifies the results of the operations as discontinued operations. The results of operations were previously reported in the Company’s retail or real estate segment, depending on when the store ceased operations. Below is a table reflecting certain items of the Consolidated Statements of Operations that were reclassified as |
79
|
|
|
|
|
discontinued operations for fiscal years 2010, 2009 and 2008 (amounts in thousands): |
|
|
|
|
|
|
|
|
|
|
|
|
|
|
|
2010 |
|
2009 |
|
2008 |
|
|||
|
|
|
|
|
|
|
|
|
|||
|
|
|
|
|
|
|
|
|
|
|
|
|
Net sales and revenue |
|
$ |
7,869 |
|
$ |
35,192 |
|
$ |
185,159 |
|
|
|
|
|
|
|
|
|
|
|
|
|
|
|
||||||||||
|
Cost of merchandise sold |
|
$ |
1,573 |
|
$ |
23,243 |
|
$ |
134,542 |
|
|
|
|
|
|
|
|
|
|
|
|
|
|
|
||||||||||
|
Income (loss) before income taxes |
|
$ |
3,018 |
|
$ |
2,446 |
|
$ |
(3,474 |
) |
|
(Provision) benefit for income taxes |
|
|
(1,218 |
) |
|
(1,057 |
) |
|
1,233 |
|
|
|
|
|
|
|
|
|
|
|
|
|
|
Income (loss) from discontinued operations, net of tax |
|
$ |
1,800 |
|
$ |
1,389 |
|
$ |
(2,241 |
) |
|
|
|
|
|
|
|
|
|
|
|
|
|
|
||||||||||
|
Gain on disposal before provision for income taxes |
|
$ |
288 |
|
$ |
2,131 |
|
$ |
2,797 |
|
|
Provision for income taxes |
|
|
(116 |
) |
|
(919 |
) |
|
(992 |
) |
|
|
|
|
|
|
|
|
|
|
|
|
|
Gain on disposal of discontinued operations, net of tax |
|
$ |
172 |
|
$ |
1,212 |
|
$ |
1,805 |
|
|
|
|
|
|
|
|
|
|
|
|
|
|
|
|
|
17. |
CONTINGENCIES |
|
|
|
|
|
The Company sold its entire interest, through a series of transactions, in three partnerships (Colona, Somerset and Gillette) that owned synthetic fuel facilities. As such, the Company was no longer allocated Section 29/45K tax credits after fiscal year 2005. In connection with the Colona and Somerset sales, the Company received contingent payments based upon percentages of qualified Section 29/45K credits generated. In connection with the sale of the Gillette partnership, the Company was eligible to receive contingent payments based upon the amount of “qualified production.” The Company has recognized $53.9 million of income from these sales from years the partnerships have open tax years with the IRS. In the event that the synthetic fuel tax credits are reduced as a result of IRS audits, the amount of proceeds realized from the sales could be significantly impacted. |
|
|
|
|
|
The Company is involved in various legal actions arising in the normal course of business. After taking into consideration legal counsels’ evaluation of such actions, management is of the opinion that their outcome will not have a material effect on the Company’s consolidated financial statements. |
|
|
|
|
18. |
SEGMENT REPORTING |
|
|
|
|
|
Beginning in the second quarter of fiscal year 2009, the Company realigned its reportable business segments to be consistent with changes to its management structure and reporting. The Company has two segments: alternative energy and real estate. In prior years, the real estate segment was formerly included in the retail segment and historical amounts have been reclassified to conform to the current year segment reporting presentation. For stores and warehouses closed for which the Company has a retained interest in the related real estate, operations are presented in the real estate segment when retail operations cease. The Company evaluates the performance of each reportable segment based on segment profit. Segment profit excludes income taxes, indirect interest expense, discontinued operations, indirect interest income and certain other items that are included in net income determined in accordance with accounting principles generally accepted in the United States of America. Amounts below include corporate activities that are not separately reportable and income from synthetic fuel |
80
|
|
|
|
|
investments (amounts in thousands): |
|
|
|
|
|
|
|
|
|
|
|
|
|
|
|
Years Ended January 31, |
|
|||||||
|
|
|
|
|
|||||||
|
|
|
2011 |
|
2010 |
|
2009 |
|
|||
|
|
|
|
|
|
|
|
|
|||
|
Net sales and revenues: |
|
|
|
|
|
|
|
|
|
|
|
Alternative energy |
|
$ |
300,389 |
|
$ |
169,175 |
|
$ |
68,223 |
|
|
Real estate |
|
|
1,285 |
|
|
913 |
|
|
364 |
|
|
|
|
|
|
|
|
|
|
|
|
|
|
Total net sales and revenues |
|
$ |
301,674 |
|
$ |
170,088 |
|
$ |
68,587 |
|
|
|
|
|
|
|
|
|
|
|
|
|
|
|
|
|
|
|
|
|
|
|
|
|
|
Segment gross profit (loss): |
|
|
|
|
|
|
|
|
|
|
|
Alternative energy |
|
$ |
31,173 |
|
$ |
21,923 |
|
$ |
807 |
|
|
Real estate |
|
|
(799 |
) |
|
(1,215 |
) |
|
228 |
|
|
|
|
|
|
|
|
|
|
|
|
|
|
Total gross profit |
|
$ |
30,374 |
|
$ |
20,708 |
|
$ |
1,035 |
|
|
|
|
|
|
|
|
|
|
|
|
|
|
|
|
|
|
|
|
|
|
|
|
|
|
|
|
Years Ended January 31, |
|
|||||||
|
|
|
|
|
|||||||
|
|
|
2011 |
|
2010 |
|
2009 |
|
|||
|
|
|
|
|
|
|
|
|
|||
|
Segment profit (loss): |
|
|
|
|
|
|
|
|
|
|
|
|
|
|
|
|
|
|
|
|
|
|
|
Alternative energy segment profit (loss) |
|
$ |
13,403 |
|
$ |
17,811 |
|
$ |
(8,992 |
) |
|
Real estate segment (loss) profit |
|
|
(1,022 |
) |
|
(1,398 |
) |
|
228 |
|
|
Corporate expenses |
|
|
(2,724 |
) |
|
(1,870 |
) |
|
(2,020 |
) |
|
Interest expense |
|
|
(240 |
) |
|
(358 |
) |
|
(428 |
) |
|
Interest income |
|
|
372 |
|
|
263 |
|
|
1,788 |
|
|
Income from synthetic fuel investments |
|
|
— |
|
|
— |
|
|
691 |
|
|
|
|
|
|
|
|
|
|
|
|
|
|
Income (loss) from continuing operations before income taxes and noncontrolling interests |
|
$ |
9,789 |
|
$ |
14,448 |
|
$ |
(8,733 |
) |
|
|
|
|
|
|
|
|
|
|
|
|
81
|
|
|
|
|
|
|
|
|
|
|
|
|
|
|
Years Ended January 31, |
|
|||||||
|
|
|
|
|
|||||||
|
|
|
2011 |
|
2010 |
|
2009 |
|
|||
|
|
|
|
|
|
|
|
|
|||
|
Sales of products alternative energy segment: |
|
|
|
|
|
|
|
|
|
|
|
Ethanol |
|
|
84 |
% |
|
83 |
% |
|
82 |
% |
|
Distillers grains |
|
|
16 |
% |
|
17 |
% |
|
18 |
% |
|
|
|
|
|
|
|
|
|
|
|
|
|
Total |
|
|
100 |
% |
|
100 |
% |
|
100 |
% |
|
|
|
|
|
|
|
|
|
|
|
|
|
Sales of services real estate segment: |
|
|
|
|
|
|
|
|
|
|
|
Leasing |
|
|
100 |
% |
|
100 |
% |
|
100 |
% |
|
|
|
|
|
|
|
|
|
|
|
|
|
Interest income: |
|
|
|
|
|
|
|
|
|
|
|
Alternative energy |
|
$ |
75 |
|
$ |
182 |
|
$ |
256 |
|
|
Real estate |
|
|
— |
|
|
— |
|
|
— |
|
|
Unallocated |
|
|
372 |
|
|
263 |
|
|
1,788 |
|
|
|
|
|
|
|
|
|
|
|
|
|
|
Total interest income |
|
$ |
447 |
|
$ |
445 |
|
$ |
2,044 |
|
|
|
|
|
|
|
|
|
|
|
|
|
|
Depreciation and amortization expense: |
|
|
|
|
|
|
|
|
|
|
|
Alternative energy |
|
$ |
17,354 |
|
$ |
9,643 |
|
$ |
3,543 |
|
|
Real estate |
|
|
407 |
|
|
195 |
|
|
49 |
|
|
Unallocated |
|
|
182 |
|
|
— |
|
|
— |
|
|
|
|
|
|
|
|
|
|
|
|
|
|
Total depreciation and amortization expense |
|
$ |
17,943 |
|
$ |
9,838 |
|
$ |
3,592 |
|
|
|
|
|
|
|
|
|
|
|
|
|
|
Equity in income of unconsolidated affiliates: |
|
|
|
|
|
|
|
|
|
|
|
Alternative energy |
|
$ |
14,558 |
|
$ |
6,027 |
|
$ |
849 |
|
|
Real estate |
|
|
— |
|
|
— |
|
|
— |
|
|
|
|
|
|
|
|
|
|
|
|
|
|
Total equity in income of unconsolidated affiliates: |
|
$ |
14,558 |
|
$ |
6,027 |
|
$ |
849 |
|
|
|
|
|
|
|
|
|
|
|
|
|
82
|
|
|
|
|
|
|
|
|
|
|
|
|
|
|
Years Ended January 31, |
|
|||||||
|
|
|
|
|
|||||||
|
|
|
2011 |
|
2010 |
|
2009 |
|
|||
|
|
|
|
|
|
|
|
|
|||
|
|
|
|
|
|
|
|
|
|||
|
Additions to property and equipment: |
|
|
|
|
|
|
|
|
|
|
|
Alternative energy |
|
$ |
5,677 |
|
$ |
35,320 |
|
$ |
107,575 |
|
|
Real estate |
|
|
356 |
|
|
332 |
|
|
— |
|
|
|
|
|
|
|
|
|
|
|
|
|
|
Total additions to property and equipment |
|
$ |
6,033 |
|
$ |
35,652 |
|
$ |
107,575 |
|
|
|
|
|
|
|
|
|
|
|
|
|
|
|
|
|
|
|
|
|
|
|
|
|
|
Assets: |
|
|
|
|
|
|
|
|
|
|
|
Alternative energy |
|
$ |
257,202 |
|
$ |
302,228 |
|
$ |
249,422 |
|
|
Real estate |
|
|
22,235 |
|
|
31,796 |
|
|
3,149 |
|
|
Corporate and other |
|
|
96,285 |
|
|
117,481 |
|
|
198,717 |
|
|
|
|
|
|
|
|
|
|
|
|
|
|
Total assets |
|
$ |
375,722 |
|
$ |
451,505 |
|
$ |
451,288 |
|
|
|
|
|
|
|
|
|
|
|
|
|
|
|
|
|
|
|
|
|
|
|
|
|
|
Additions to other long lived assets: |
|
|
|
|
|
|
|
|
|
|
|
Alternative energy |
|
$ |
10,112 |
|
$ |
25 |
|
$ |
284 |
|
|
Real estate |
|
|
— |
|
|
— |
|
|
— |
|
|
|
|
|
|
|
|
|
|
|
|
|
|
Total additions to other long lived assets |
|
$ |
10,112 |
|
$ |
25 |
|
$ |
284 |
|
|
|
|
|
|
|
|
|
|
|
|
|
|
|
|
|
|
|
|
|
|
|
|
|
|
Long term debt and capital lease obligations |
|
|
|
|
|
|
|
|
|
|
|
Alternative energy |
|
$ |
69,049 |
|
$ |
124,093 |
|
$ |
94,003 |
|
|
Real estate |
|
|
— |
|
|
— |
|
|
— |
|
|
Corporate and other |
|
|
1,924 |
|
|
2,596 |
|
|
9,936 |
|
|
|
|
|
|
|
|
|
|
|
|
|
|
Total long term debt and capital lease obligations |
|
$ |
70,973 |
|
$ |
126,689 |
|
$ |
103,939 |
|
|
|
|
|
|
|
|
|
|
|
|
|
|
|
|
|
|
Additions to other long lived assets represent primarily equity method investments and long term refundable real estate taxes. |
|
|
|
|
|
Certain corporate costs and expenses, including information technology, employee benefits, and other shared services, are allocated to the business segments. The allocations are generally amounts agreed upon by management, which may differ from amounts that would be incurred if such services were purchased separately by the business segment. Corporate assets are primarily cash and equivalents, and deferred income tax benefits. |
|
|
|
|
|
Cash, except for cash held by One Earth, is considered to be fungible and available for both corporate and segment use depending on liquidity requirements. Cash of approximately $18.4 million held by One Earth will be used primarily to fund working capital needs for the subsidiary. |
83
|
|
|
|
19. |
QUARTERLY UNAUDITED INFORMATION |
|
|
|
|
|
The following tables set forth the Company’s net sales and revenue, gross profit, net income (loss) and net income (loss) per share (basic and diluted) for each quarter during the last two fiscal years. The unaudited financial information has been prepared in accordance with accounting principles generally accepted in the United States of America for interim financial information and with the instructions to Form 10-Q and Article 10 of Regulation S-X. In the opinion of management, all adjustments (consisting of normal recurring accruals) considered necessary for a fair presentation have been included. |
|
|
|
|
|
|
|
|
|
|
|
|
|
|
|
|
|
|
Quarters Ended |
|
||||||||||
|
|
|
|
|
||||||||||
|
|
|
April 30, |
|
July 31, |
|
October 31, |
|
January 31, |
|
||||
|
|
|
|
|
|
|
|
|
|
|
||||
|
|
|||||||||||||
|
Net sales and revenue (a) |
|
$ |
71,554 |
|
$ |
65,516 |
|
$ |
70,718 |
|
$ |
93,886 |
|
|
Gross profit (a) |
|
|
8,405 |
|
|
5,962 |
|
|
7,198 |
|
|
8,809 |
|
|
Net income (loss) attributable to REX common shareholders |
|
|
4,188 |
|
|
1,234 |
|
|
4,250 |
|
|
(4,603 |
) |
|
Basic net income (loss) per share attributable to REX common shareholders (b) |
|
$ |
0.43 |
|
$ |
0.13 |
|
$ |
0.45 |
|
$ |
(0.49 |
) |
|
Diluted net income (loss) per share attributable to REX common shareholders (b) |
|
$ |
0.42 |
|
$ |
0.12 |
|
$ |
0.44 |
|
$ |
(0.49 |
) |
|
|
|
|
|
|
|
|
|
|
|
|
|
|
|
|
|
|
Quarters Ended |
|
||||||||||
|
|
|
|
|
||||||||||
|
|
|
April 30, |
|
July 31, |
|
October 31, |
|
January 31, |
|
||||
|
|
|
|
|
|
|
|
|
|
|
||||
|
|
|||||||||||||
|
Net sales and revenue (a) |
|
$ |
14,324 |
|
$ |
17,076 |
|
$ |
61,613 |
|
$ |
77,075 |
|
|
Gross profit (a) |
|
|
325 |
|
|
1,189 |
|
|
5,799 |
|
|
13,395 |
|
|
Net (loss) income attributable to REX common shareholders |
|
|
(1,731 |
) |
|
837 |
|
|
2,273 |
|
|
7,273 |
|
|
Basic net (loss) income per share attributable to REX common shareholders (b) |
|
$ |
(0.19 |
) |
$ |
0.09 |
|
$ |
0.25 |
|
$ |
0.78 |
|
|
Diluted net (loss) income per share attributable to REX common shareholders (b) |
|
$ |
(0.19 |
) |
$ |
0.09 |
|
$ |
0.24 |
|
$ |
0.75 |
|
|
|
|
|
|
|
a) |
Amounts differ from those previously reported as a result of retail operations and certain real estate assets sold being reclassified as discontinued operations and other reclassifications. |
|
|
b) |
The total of the quarterly net income (loss) per share amounts do not equal the annual net loss or income per share amount due to the impact of varying amounts of shares and options outstanding during the year. In addition, basic net loss per share equals diluted net loss per share in periods where a net loss is reported. |
|
|
|
|
20. |
RELATED PARTIES |
|
|
|
|
|
One Earth entered into a design-build contract with Fagen, an equity investor in One Earth, for the design and construction of the ethanol plant. One Earth paid approximately $120.2 million through January 31, 2010 to Fagen for the design-build contract. Additionally, One Earth paid Fagen |
84
approximately $7.9 million for the year ended January 31, 2010 for additional projects related to the construction of the plant.
During fiscal years 2010 and 2009, One Earth purchased approximately $157.4 million and $69.2 million, respectively, of corn from the Alliance Grain Elevator, an equity investor.
During fiscal years 2010 and 2009, One Earth used the services of the Bloomer Line to move railcars to ship ethanol. An officer of the One Earth is the acting general manager of the Bloomer Line. One Earth paid the Bloomer Line approximately $340,000 and approximately $104,000 for such services in fiscal years 2010, and 2009, respectively.
* * * * * *
85
REPORT OF INDEPENDENT REGISTERED PUBLIC ACCOUNTING FIRM
To the Shareholders and Board of Directors of
Rex American Resources Corporation
We have audited the accompanying consolidated balance sheets of Rex American Resources Corporation and subsidiaries (the “Company”) as of January 31, 2011 and 2010, and the related consolidated statements of operations, shareholders’ equity, and cash flows for each of the three years in the period ended January 31, 2011. Our audits also included the consolidated financial statement schedule listed in the Index at Item 15. These consolidated financial statements and consolidated financial statement schedule are the responsibility of the Company’s management. Our responsibility is to express an opinion on the consolidated financial statements and consolidated financial statement schedule based on our audits. We did not audit the financial statements of Patriot Renewable Fuels, LLC, an equity method investment. The Company’s equity method investment of $21,829,000 and $18,411,000 as of January 31, 2011 and 2010, respectively, and equity in income (loss) of unconsolidated affiliates of $5,159,000, $3,540,000 and ($1,548,000) for the years ended January 31, 2011, 2010, and 2009, respectively, are included in the accompanying consolidated financial statements. Those statements were audited by other auditors whose report has been furnished to us, and our opinion, insofar as it relates to the amounts included for Patriot Renewable Fuels, LLC, is based solely on the report of the other auditors.
We conducted our audits in accordance with the standards of the Public Company Accounting Oversight Board (United States). Those standards require that we plan and perform the audit to obtain reasonable assurance about whether the financial statements are free of material misstatement. An audit includes examining, on a test basis, evidence supporting the amounts and disclosures in the financial statements. An audit also includes assessing the accounting principles used and significant estimates made by management, as well as evaluating the overall financial statement presentation. We believe that our audits and the report of other auditors provide a reasonable basis for our opinion.
In our opinion, based on our audits and the report of other auditors, such consolidated financial statements present fairly, in all material respects, the financial position of Rex American Resources Corporation and subsidiaries as of January 31, 2011 and 2010, and the results of their operations and their cash flows for each of the three years in the period ended January 31, 2011, in conformity with accounting principles generally accepted in the United States of America. Also, in our opinion, such consolidated financial statement schedule, when considered in relation to the basic consolidated financial statements taken as a whole, presents fairly, in all material respects, the information set forth therein.
As disclosed in Note 1 and Note 16, the consolidated financial statements have been adjusted for the retrospective application of Accounting Standards Codification (ASC) 810, Consolidation, for non-controlling interests, which became effective February 1, 2009, and the retrospective presentation of the Company’s retail business as discontinued operations. Additionally, as discussed in Note 2 to the consolidated financial statements, the Company deconsolidated the assets and liabilities of a significant subsidiary as of January 31, 2011.
86
We have also audited, in accordance with the standards of the Public Company Accounting Oversight Board (United States), the Company’s internal control over financial reporting as of January 31, 2011, based on the criteria established in Internal Control—Integrated Framework issued by the Committee of Sponsoring Organizations of the Treadway Commission and our report dated April 15, 2011 expressed an unqualified opinion on the Company’s internal control over financial reporting.
/s/ Deloitte & Touche LLP
Cincinnati, Ohio
April 15, 2011
87
|
|
|
REX AMERICAN RESOURCES CORPORATION AND SUBSIDIARIES |
|
|
|
Schedule II -
VALUATION AND QUALIFYING ACCOUNTS |
|
|
|
|
|
|
|
|
|
|
|
|
|
|
|
|
|
|
|
|
|
|
Additions |
|
Deductions |
|
|
|
||||
|
|
|
|
|
|
|
|
|
|
|
||||
|
|
|
Balance |
|
Charged to |
|
Charges for |
|
Balance |
|
||||
|
|
|
|
|
|
|
|
|
|
|
|
|
|
|
|
2011: |
|
|
|
|
|
|
|
|
|
|
|
|
|
|
Allowance for doubtful accounts |
|
$ |
168 |
|
$ |
— |
|
$ |
158 |
|
$ |
10 |
|
|
|
|
|
|
|
|
|
|
|
|
|
|
|
|
|
|
|
|
|
|
|
|
|
|
|
|
|
|
|
|
2010: |
|
|
|
|
|
|
|
|
|
|
|
|
|
|
Allowance for doubtful accounts |
|
$ |
447 |
|
$ |
— |
|
$ |
279 |
|
$ |
168 |
|
|
|
|
|
|
|
|
|
|
|
|
|
|
|
|
|
|
|
|
|
|
|
|
|
|
|
|
|
|
|
|
2009: |
|
|
|
|
|
|
|
|
|
|
|
|
|
|
Allowance for doubtful accounts |
|
$ |
84 |
|
$ |
499 |
|
$ |
136 |
|
$ |
447 |
|
|
|
|
|
|
|
|
|
|
|
|
|
|
|
|
|
|
|
|
|
|
|
|
|
|
|
|
|
|
|
|
2011: |
|
|
|
|
|
|
|
|
|
|
|
|
|
|
Deferred tax valuation allowance |
|
$ |
578 |
|
$ |
664 |
|
$ |
— |
|
$ |
1,242 |
|
|
|
|
|
|
|
|
|
|
|
|
|
|
|
|
|
|
|
|
|
|
|
|
|
|
|
|
|
|
|
|
2010: |
|
|
|
|
|
|
|
|
|
|
|
|
|
|
Deferred tax valuation allowance |
|
$ |
578 |
|
$ |
— |
|
$ |
— |
|
$ |
578 |
|
|
|
|
|
|
|
|
|
|
|
|
|
|
|
|
|
|
|
|
|
|
|
|
|
|
|
|
|
|
|
|
2009: |
|
|
|
|
|
|
|
|
|
|
|
|
|
|
Deferred tax valuation allowance |
|
$ |
809 |
|
$ |
— |
|
$ |
231 |
|
$ |
578 |
|
|
|
|
|
|
|
|
|
|
|
|
|
|
|
|
|
|
|
|
Item 9. |
Changes in and Disagreements with Accountants on Accounting and Financial Disclosure |
None
|
|
|
|
Item 9A. |
Controls and Procedures |
Evaluation of Disclosure Controls and Procedures
|
|
|
|
|
Our management evaluated, with the participation of our Chief Executive Officer and Chief Financial Officer, the effectiveness of our disclosure controls and procedures (as defined in Rules 13a–15(e) and 15d–15(e) under the Securities Exchange Act of 1934) as of the end of the period covered by this report. Based on that evaluation, our Chief Executive Officer and Chief Financial Officer concluded that our disclosure controls and procedures are effective to ensure that information required to be disclosed by us in the reports that we file or submit under the Securities Exchange Act of 1934 is recorded, processed, summarized and reported within the time periods specified in the Securities and Exchange Commission’s rules and forms. Our officers concluded that our disclosure controls and procedures are also effective to ensure that information required to be disclosed in the reports that we file or submit under the Exchange Act is accumulated and communicated to our management, including our Chief Executive Officer and Chief Financial Officer, to allow timely decisions regarding required disclosure. |
88
|
|
|
|
|
Material Changes to Internal Control Over Financial Reporting |
|
|
|
|
|
There were no changes in our internal control over financial reporting that occurred during our last fiscal quarter that have materially affected, or are reasonably likely to materially affect, our internal control over financial reporting. |
|
|
|
|
Management’s Annual Report on Internal Control Over Financial Reporting |
|
|
|
|
|
|
Our management is responsible for establishing and maintaining adequate internal control over financial reporting, as defined in Exchange Act Rule 13a-15(f). Our internal control over financial reporting is designed to provide reasonable assurance regarding the reliability of financial reporting and the preparation of financial statements in accordance with accounting principles generally accepted in the United States of America. |
|
|
|
|
|
All internal control systems, no matter how well designed, have inherent limitations. Therefore, even those systems deemed to be effective can provide only reasonable assurance with respect to financial statement preparation and presentation. |
|
|
|
|
|
Under the supervision and with the participation of our senior management, including our Chief Executive Officer and Chief Financial Officer, we assessed the effectiveness of our internal control over financial reporting as of January 31, 2011 based on the Internal Control-Integrated Framework issued by the Committee of Sponsoring Organizations of the Treadway Commission (“COSO”). Based upon this assessment, our management concluded that our internal control over financial reporting was effective as of January 31, 2011 based on those criteria. |
|
|
|
|
|
The effectiveness of our internal control over financial reporting as of January 31, 2011 has been audited by Deloitte & Touche LLP, an independent registered public accounting firm, as stated in their report which is included herein. |
|
|
|
|
|
|
|
STUART A. ROSE |
Chairman of the Board and Chief Executive |
|
|
|
Stuart A. Rose |
Officer (principal executive officer) |
April 15, 2011 |
|
|
|
|
|
|
|
DOUGLAS L. BRUGGEMAN |
Vice President-Finance, Chief Financial Officer and Treasurer |
|
|
|
Douglas L. Bruggeman |
(principal financial and accounting officer) |
April 15, 2011 |
89
REPORT OF INDEPENDENT REGISTERED PUBLIC ACCOUNTING FIRM
To the
Shareholders and Board of Directors of
Rex American Resources Corporation
We have audited the internal control over financial reporting of Rex American Resources Corporation and subsidiaries (the “Company”) as of January 31, 2011, based on criteria established in Internal Control — Integrated Framework issued by the Committee of Sponsoring Organizations of the Treadway Commission. The Company’s management is responsible for maintaining effective internal control over financial reporting and for its assessment of the effectiveness of internal control over financial reporting, included in the accompanying Management’s Annual Report on Internal Control over Financial Reporting. Our responsibility is to express an opinion on the Company’s internal control over financial reporting based on our audit.
We conducted our audit in accordance with the standards of the Public Company Accounting Oversight Board (United States). Those standards require that we plan and perform the audit to obtain reasonable assurance about whether effective internal control over financial reporting was maintained in all material respects. Our audit included obtaining an understanding of internal control over financial reporting, assessing the risk that a material weakness exists, testing and evaluating the design and operating effectiveness of internal control based on the assessed risk, and performing such other procedures as we considered necessary in the circumstances. We believe that our audit provides a reasonable basis for our opinion.
A company’s internal control over financial reporting is a process designed by, or under the supervision of, the company’s principal executive and principal financial officers, or persons performing similar functions, and effected by the company’s board of directors, management, and other personnel to provide reasonable assurance regarding the reliability of financial reporting and the preparation of financial statements for external purposes in accordance with generally accepted accounting principles. A company’s internal control over financial reporting includes those policies and procedures that (1) pertain to the maintenance of records that, in reasonable detail, accurately and fairly reflect the transactions and dispositions of the assets of the company; (2) provide reasonable assurance that transactions are recorded as necessary to permit preparation of financial statements in accordance with generally accepted accounting principles, and that receipts and expenditures of the company are being made only in accordance with authorizations of management and directors of the company; and (3) provide reasonable assurance regarding prevention or timely detection of unauthorized acquisition, use, or disposition of the company’s assets that could have a material effect on the financial statements.
Because of the inherent limitations of internal control over financial reporting, including the possibility of collusion or improper management override of controls, material misstatements due to error or fraud may not be prevented or detected on a timely basis. Also, projections of any evaluation of the effectiveness of the internal control over financial reporting to future periods are subject to the risk that the controls may become inadequate because of changes in conditions, or that the degree of compliance with the policies or procedures may deteriorate.
90
In our opinion, the Company maintained, in all material respects, effective internal control over financial reporting as of January 31, 2011, based on the criteria established in Internal Control — Integrated Framework issued by the Committee of Sponsoring Organizations of the Treadway Commission.
We have also audited, in accordance with the standards of the Public Company Accounting Oversight Board (United States), the consolidated financial statements and consolidated financial statement schedule as of and for the year ended January 31, 2011 of the Company and our report dated April 15, 2011 expressed an unqualified opinion on those consolidated financial statements and consolidated financial statement schedule and included an explanatory paragraph regarding the Company’s retrospective application of Accounting Standards Codification (ASC) 810, Consolidation, for non-controlling interests, which became effective February 1, 2009, the retrospective presentation of the Company’s retail business as discontinued operations, and the deconsolidation of the assets and liabilities of a significant subsidiary as of January 31, 2011.
/s/ Deloitte & Touche LLP
Cincinnati, Ohio
April 15, 2011
91
|
|
|
|
Item 9B. |
Other Information |
None
PART III
|
|
|
|
Item 10. |
Directors, Executive Officers and Corporate Governance |
The information required by this Item 10 is incorporated herein by reference to the Proxy Statement for our Annual Meeting of Shareholders on June 7, 2011, except for certain information concerning our executive officers which is set forth in Part I of this report.
|
|
|
|
Item 11. |
Executive Compensation |
The information required by this Item 11 is set forth in the Proxy Statement for our Annual Meeting of Shareholders on June 7, 2011 and is incorporated herein by reference.
|
|
|
|
Item 12. |
Security Ownership of Certain Beneficial Owners and Management and Related Stockholder Matters |
The information required by this Item 12 is set forth in the Proxy Statement for our Annual Meeting of Shareholders on June 7, 2011 and is incorporated herein by reference.
|
|
|
|
Item 13. |
Certain Relationships and Related Transactions and Director Independence |
The information required by this Item 13 is set forth in the Proxy Statement for our Annual Meeting of Shareholders on June 7, 2011 and is incorporated herein by reference.
|
|
|
|
Item 14. |
Principal Accountant Fees and Services |
The information required by this Item 14 is set forth in the Proxy Statement for our Annual Meeting of Shareholders on June 7, 2011 and is incorporated herein by reference.
PART IV
|
|
|
|
Item 15. |
Exhibits and Financial Statement Schedules |
|
|
|
|
|
|
(a)(1) Financial Statements |
|
|
|
||
|
The following consolidated financial statements of REX American Resources Corporation and subsidiaries are filed as a part of this report at Item 8 hereof. |
||
|
|
||
|
|
Consolidated Balance Sheets as of January 31, 2011 and 2010 |
|
|
|
|
|
|
|
Consolidated Statements of Operations for the years ended January 31, 2011, 2010 and 2009 |
|
|
|
|
|
|
|
Consolidated Statements of Cash Flows for the years ended January 31, 2011, 2010 and 2009 |
|
|
|
|
|
|
|
Consolidated Statements of Shareholders’ Equity for the years ended January 31, 2011, 2010 and 2009 |
|
|
|
|
|
|
|
Notes to Consolidated Financial Statements |
|
92
|
|
|
|
|
|
Report of Independent Registered Public Accounting Firm |
|
|
|
|
|
|
|
(a)(2)(i) Financial Statement Schedules |
|
|
|
|
|
|
|
The following financial statement schedule is filed as a part of this report at Item 8 hereof. |
|
Schedule II -Valuation and Qualifying Accounts
All other schedules are omitted because they are not applicable or not required, or because the required information is included in the consolidated financial statements or notes thereto.
|
|
|
|
|
a)(2)(ii) Separate Financial Statements of Subsidiaries Not Consolidated and 50 Percent or Less Owned Persons |
|
|
|
|
|
Separate consolidated financial statements of Big River Resources, LLC, Patriot Renewable Fuels, LLC and NuGen Energy, LLC required pursuant to Rule 3-09 of Regulation S-X are filed as Exhibits 99(a), 99(b) and 99(c) to this report. |
|
|
|
|
|
(a)(3) Exhibits |
|
|
|
|
|
See Exhibit Index at page 95 of this report. |
|
|
|
|
|
Management contracts and compensatory plans and arrangements filed as exhibits to this report are identified by an asterisk in the exhibit index. |
93
SIGNATURES
Pursuant to the requirements of Section 13 or 15(d) of the Securities Exchange Act of 1934, the registrant has duly caused this report to be signed on its behalf by the undersigned, thereunto duly authorized.
|
|
|
|
|
REX AMERICAN RESOURCES CORPORATION |
|
|
|
|
|
By: STUART A. ROSE |
|
|
Stuart A. Rose |
|
|
Chairman of the Board and |
|
|
Chief Executive Officer |
|
|
|
|
Date: April 15, 2011 |
|
Pursuant to the requirements of the Securities Exchange Act of 1934, this report has been signed below by the following persons on behalf of the registrant and in the capacities and on the dates indicated.
|
|
|
|
|
|
|
|
|
|
Signature |
|
|
Capacity |
|
|
Date |
|
|
|
|
|
|
|
|
|
|
|
|
|
|
|
|
|||
|
STUART A.
ROSE |
|
Chairman of
the Board |
|
April 15, 2011 |
|||
|
|
|
|
|
|
|||
|
DOUGLAS L.
BRUGGEMAN |
|
Vice
President-Finance, Chief |
|
April 15, 2011 |
|||
|
|
|
|
|
|
|||
|
LAWRENCE
TOMCHIN |
|
Director |
|
April 15, 2011 |
|||
|
|
|
|
|
|
|||
|
EDWARD M.
KRESS |
|
Director |
|
April 15, 2011 |
|||
|
|
|
|
|
|
|||
|
ROBERT
DAVIDOFF |
|
Director |
|
April 15, 2011 |
|||
|
|
|
|
|
|
|||
|
CHARLES A.
ELCAN |
|
Director |
|
April 15, 2011 |
|||
|
|
|
|
|
|
|||
|
DAVID S.
HARRIS |
|
Director |
|
April 15, 2011 |
|||
|
|
|
|
|
|
|||
|
MERVYN L.
ALPHONSO |
|
Director |
|
April 15, 2011 |
|||
94
EXHIBIT INDEX
|
|
|
|
|
(3) |
Articles of incorporation and by-laws: |
|
|
|
|
|
|
|
3(a) |
Certificate of Incorporation, as amended (incorporated by reference to Exhibit 3(a) to Form 10-Q for quarter ended July 31, 2010, File No. 001- 09097) |
|
|
|
|
|
|
3(b)(1) |
By-Laws, as amended (incorporated by reference to Registration Statement No. 2-95738, Exhibit 3(b), filed February 8, 1985) |
|
|
|
|
|
|
3(b)(2) |
Amendment to By-Laws adopted June 29, 1987 (incorporated by reference to Exhibit 4.5 to Form 10-Q for quarter ended July 31, 1987, File No. 0-13283) |
|
|
|
|
|
(4) |
Instruments defining the rights of security holders, including indentures: |
|
|
|
|
|
|
|
4(a) |
Construction and Term Loan Agreement dated as of September 27, 2006 among Merrill Lynch Capital, a division of Merrill Lynch Business Financial Services Inc., as Administrative Agent, the Lenders party thereto and Levelland Hockley County Ethanol, LLC (incorporated by reference to Exhibit 4(f) to Form 10-K for fiscal year ended January 31, 2007, File No. 001-09097) |
|
|
|
|
|
|
4(b) |
First Amendment to Construction and Term Loan Agreement and Other Loan Documents dated as of August 10, 2007 among Levelland Hockley County Ethanol, LLC, the Lenders party thereto, and Merrill Lynch Capital, a division of Merrill Lynch Business Financial Services Inc., as Administrative Agent (incorporated by reference to Exhibit 4(i) to Form 10-K for fiscal year ended January 31, 2008, File No. 001-09097) |
|
|
|
|
|
|
4(c) |
Second Amendment to Construction and Term Loan Agreement and Other Loan Documents dated as of February 15, 2008 among Levelland Hockley County Ethanol, LLC, the Lenders party thereto, and Merrill Lynch Capital, a division of Merrill Lynch Business Financial Services Inc., as Administrative Agent (incorporated by reference to Exhibit 4(j) to Form 10-K for fiscal year ended January 31, 2008, File No. 001-09097) |
|
|
|
|
|
|
4(d) |
Third Amendment to Construction and Term Loan Agreement and Other Loan Documents dated as of February 19, 2008 among Levelland Hockley County Ethanol, LLC, the Lenders party thereto, and Merrill Lynch Capital, a division of Merrill Lynch Business Financial Services Inc., as Administrative Agent (incorporated by reference to Exhibit 4(k) to Form 10-K for fiscal year ended January 31, 2008, File No. 001-09097) |
95
|
|
|
|
|
|
4(e) |
Fourth Amendment to Construction and Term Loan Agreement dated as of May 31, 2008 among Levelland/Hockley County Ethanol, LLC, the Lenders party thereto, and GE Business Financial Services Inc. (f/k/a Merrill Lynch Business Financial Services Inc.), as Administrative Agent (incorporated by reference to Exhibit 4(m) to Form 10-K for fiscal year ended January 31, 2009, File No. 001-09097) |
|
|
|
|
|
|
4(f) |
Fifth Amendment to Construction and Term Loan Agreement dated as of May 31, 2008 among Levelland/Hockley County Ethanol, LLC, the Lenders party thereto, and GE Business Financial Services Inc. (f/k/a Merrill Lynch Business Financial Services Inc.), as Administrative Agent (incorporated by reference to Exhibit 4(n) to Form 10-K for fiscal year ended January 31, 2009, File No. 001-09097) |
|
|
|
|
|
|
4(g) |
Sixth Amendment to Construction and Term Loan Agreement dated as of January 29, 2009 among Levelland/Hockley County Ethanol, LLC, the Lenders party thereto, and GE Business Financial Services Inc. (f/k/a Merrill Lynch Business Financial Services Inc.), as Administrative Agent (incorporated by reference to Exhibit 4(o) to Form 10-K for fiscal year ended January 31, 2009, File No. 001-09097) |
|
|
|
|
|
|
4 (h) |
Seventh Amendment to Construction and Term Loan Agreement dated as of September 4, 2009 among Levelland/Hockley County Ethanol, LLC, the Lenders party thereto, and GE Business Financial Services Inc., as Administrative Agent (incorporated by reference to Exhibit 4(a) to Form 10-Q for quarter ended July 31, 2009, File No. 001-09097) |
|
|
|
|
|
|
4 (i) |
Eighth Amendment to Construction and Term Loan Agreement dated as of September 1, 2010 among Levelland/Hockley County Ethanol, LLC, the Lenders party thereto, and GE Business Financial Services Inc., as Administrative Agent (incorporated by reference to Exhibit 4(a) to Form 10-Q for quarter ended July 31, 2010, File No. 001-09097) |
|
|
|
|
|
|
4 (j) |
Construction Loan Agreement dated as of September 20, 2007 among One Earth Energy, LLC, First National Bank of Omaha, as a Bank and as Administrative Agent, Accounts Bank and Collateral Agent, and the other Banks party thereto (incorporated by reference to Exhibit 4(l) to Form 10-K for fiscal year ended January 31, 2008, File No. 001-09097) |
|
|
|
|
|
|
4 (k) |
First Amendment of Construction Loan Agreement dated September 19, 2008 among One Earth Energy, LLC, First National Bank of Omaha, as a Bank and as Administrative Agent, Accounts Bank and Collateral Agent, and the other Banks party thereto (incorporated by reference to Exhibit 4(j) to Form 10-K for fiscal year ended January 31, 2010, File No. 001-09097) |
|
|
|
|
|
|
4(l) |
Second Amendment of Construction Loan Agreement dated January 30, 2009 among One Earth Energy, LLC, First National Bank of Omaha, as a Bank and as Administrative Agent, Accounts Bank and Collateral Agent, and the other Banks party thereto (incorporated by reference to Exhibit 4(k) to Form 10-K for fiscal year ended January 31, 2010, File No. 001-09097) |
96
|
|
|
|
|
|
4(m) |
Third Amendment of Construction Loan Agreement dated September 18, 2009 among One Earth Energy, LLC, First National Bank of Omaha, as a Bank and as Administrative Agent, Accounts Bank and Collateral Agent, and the other Banks party thereto (incorporated by reference to Exhibit 4(l) to Form 10-K for fiscal year ended January 31, 2010, File No. 001-09097) |
|
|
|
|
|
|
4(n) |
Fourth Amendment of Construction Loan Agreement dated June 1, 2010 among One Earth Energy, LLC, First National Bank of Omaha, as a Bank and as Administrative Agent, Accounts Bank and Collateral Agent, and the other Banks party thereto (incorporated by reference to Exhibit 4(a) to Form 10-Q for quarter ended October 31, 2010, File No. 001-09097) |
|
|
|
|
|
|
4(o) |
Loan and Security Agreement dated as of July 23, 2009 between NuGen Energy, LLC and Dougherty Funding LLC |
|
|
|
|
|
|
4(p) |
Revolving Credit and Security Agreement dated as of July 23, 2009 between NuGen Energy, LLC and Dougherty Funding LLC |
|
|
|
|
|
|
|
Pursuant to Item 601(b)(4)(iii)(A) of Regulation S-K, the registrant has not filed as an exhibit to this Form 10-K certain instruments with respect to long-term debt where the total amount of securities authorized thereunder does not exceed 10% of the total assets of the registrant and its subsidiaries on a consolidated basis. The registrant agrees to furnish a copy of such instruments to the Commission upon request. |
|
|
|
|
|
(10) |
Material contracts: |
|
|
|
|
|
|
|
10(a)* |
Employment Agreement dated November 29, 2005 between Rex Radio and Television, Inc. and Stuart Rose (incorporated by reference to Exhibit 10(a) to Form 8-K filed November 30, 2005, File No. 001-09097) |
|
|
|
|
|
|
10(b)* |
Amended and Restated Amendment No. 1 to Employment Agreement dated December 10, 2007 between Rex Radio and Television, Inc. and Stuart A. Rose (incorporated by reference to Exhibit 10(b) to Form 8-K filed November 30, 2008, File No. 001-09097) |
|
|
|
|
|
|
10(c)* |
Amendment No. 2 to Employment Agreement dated December 10, 2007 between Rex Radio and Television, Inc. and Stuart A. Rose (incorporated by reference to Exhibit 10(c) to Form 8-K filed November 30, 2005, File No. 001-09097) |
|
|
|
|
|
|
10(d)* |
Employment Agreement dated October 11, 2005 between Rex Radio and Television, Inc. and David L. Bearden (incorporated by reference to Exhibit 10(a) to Form 8-K filed October 12, 2005, File No. 001-09097) |
|
|
|
|
|
|
10(e)* |
Amendment No. 1 to Employment Agreement dated December 10, 2007 between Rex Radio and Television, Inc. and David L. Bearden (incorporated by reference to Exhibit 10(e) to Form 8-K filed November 30, 2005, File No. 001-09097) |
97
|
|
|
|
|
|
10(f)* |
Amendment No. 2 to Employment Agreement dated March 6, 2008 between Rex Radio and Television, Inc. and David L. Bearden (incorporated by reference to Exhibit 10(f) to Form 8-K filed November 30, 2005, File No. 001-09097) |
|
|
|
|
|
|
10(g)* |
Amendment No. 3 to Employment Agreement dated February 19, 2009 between Rex Radio and Television, Inc. and David L. Bearden (incorporated by reference to Exhibit 10(a) to Form 8-K filed February 20, 2009, File No. 001-09097) |
|
|
|
|
|
|
10(h)* |
Amendment No. 4 to Employment Agreement dated September 30, 2009 between Rex Radio and Television, Inc. and David L. Bearden (incorporated by reference to Exhibit 10(b) to Form 8-K filed October 6, 2009, File No. 001-09097) |
|
|
|
|
|
|
10(i)* |
Executive Stock Option dated April 17, 2001 granting Lawrence Tomchin an option to purchase 150,000 shares of registrant’s Common Stock (incorporated by reference to Exhibit 10(h) to Form 10-K for fiscal year ended January 31, 2002, File No. 001-09097) |
|
|
|
|
|
|
10(j)* |
Subscription Agreement dated December 1, 1989 from Stuart Rose to purchase 300,000 shares of registrant’s Common Stock (incorporated by reference to Exhibit 6.5 to Form 10-Q for quarter ended October 31, 1989, File No. 0-13283) |
|
|
|
|
|
|
10(k)* |
Subscription Agreement dated December 1, 1989 from Lawrence Tomchin to purchase 140,308 shares of registrant’s Common Stock (incorporated by reference to Exhibit 6.6 to Form 10-Q for quarter ended October 31, 1989, File No. 0-13283) |
|
|
|
|
|
|
10(l)* |
1995 Omnibus Stock Incentive Plan, as amended and restated effective June 2, 1995 (incorporated by reference to Exhibit 4(c) to Post-Effective Amendment No. 1 to Form S-8 Registration Statement No. 33-81706) |
|
|
|
|
|
|
10(m)* |
1999 Omnibus Stock Incentive Plan (incorporated by reference to Exhibit 10(a) to Form 10-Q for quarter ended April 30, 2000, File No. 001-09097) |
|
|
|
|
|
|
10(n)* |
Form of Stock Option Agreement under 1999 Omnibus Stock Incentive Plan (Nonqualified Stock Option) (incorporated by reference to Exhibit 10(a) to Form 10-Q for quarter ended October 31, 2004, File No. 001-09097) |
|
|
|
|
|
|
10(o)* |
Form of Stock Option Agreement under 1999 Omnibus Stock Incentive Plan (Nonemployee Director Stock Option) (incorporated by reference to Exhibit 10(b) to Form 10-Q for quarter ended October 31, 2004, File No. 001-09097) |
|
|
|
|
|
|
10(p) |
Lease dated December 12, 1994 between Stuart Rose/Beavercreek, Inc. and Rex Radio and Television, Inc. (incorporated by reference to Exhibit 10(q) to Form 10-K for fiscal year ended January 31, 1995, File No. 0-13283) |
|
|
|
|
|
|
10(q) |
Purchase and Sale Agreement dated February 8, 2007 among Rex Radio and Television, Inc., Kelly & Cohen Appliances, Inc., Stereo Town, Inc., REX Stores Corporation and Coventry Real Estate Investments, LLC (incorporated by reference to Exhibit 10(o) to Form 10-K for fiscal year ended January 31, 2007, File No. 001-09097) |
98
|
|
|
|
|
|
10(r) |
Agreement dated January 29, 2009 between Rex Radio and Television, Inc., Kelly & Cohen Appliances, Inc., Stereo Town, Inc., Rex Alabama, Inc., REX Stores Corporation and Appliance Direct, Inc. (incorporated by reference to Exhibit 10(a) to Form 8-K filed February 2, 2009, File No. 001-09097) |
|
|
|
|
|
|
10 (s) |
Third Amendment to Agreement dated July 31, 2009 between Rex Radio and Television, Inc., Kelly & Cohen Appliances, Inc., Stereo Town, Inc., Rex Alabama, Inc., REX Stores Corporation and Appliance Direct, Inc. (incorporated by reference to Exhibit 10(a) to Form 8-K filed July 31, 2009, File No. 001-09097) |
|
|
|
|
|
|
10(t) |
Second Global Amendment to Multiple Leases dated July 31, 2009 between Rex Radio and Television, Inc., Kelly & Cohen Appliances, Inc., Stereo Town, Inc., Appliance Direct, Inc. and the Tenants (incorporated by reference to Exhibit 10(b) to Form 8-K filed July 31, 2009, File No. 001- 09097) |
|
|
|
|
|
|
10 (u) |
Letter Agreement dated September 30, 2009 between Rex Radio and Television, Inc., Kelly & Cohen Appliances, Inc., Stereo Town, Inc. and Appliance Direct, Inc. (incorporated by reference to Exhibit 10(a) to Form 8-K filed October 6, 2009, File No. 001-09097) |
|
|
|
|
|
|
10 (v) |
Unit Purchase and Option Agreement dated June 30, 2010 among REX NuGen, LLC and Central Farmers Cooperative (incorporated by reference to Exhibit 10(a) to Form 8-K filed July 16, 2010, File No. 001-09097) |
|
|
|
|
|
(14) |
Code of Ethics: |
|
|
|
|
|
|
|
14(a) |
Code of Business Conduct and Ethics (incorporated by reference to Exhibit 14 (a) to Form 10-K for fiscal year ended January 31, 2004, File No. 001-09097) |
|
|
|
|
|
(21) |
Subsidiaries of the registrant: |
|
|
|
|
|
|
|
21(a) |
Subsidiaries of registrant |
|
|
|
|
|
(23) |
Consents of experts and counsel: |
|
|
|
|
|
|
|
23(a) |
Consent of Deloitte & Touche LLP to use its reports dated April 15, 2011 included in this annual report on Form 10-K into registrant’s Registration Statements on Form S-8 (Registration Nos. 33-81706, 33-62645, 333-35118 and 333-69690) |
|
|
|
|
|
|
23(b) |
Consent of Christianson & Associates, PLLP to use its reports dated February 8, 2011 and February 18, 2010, relating to the financial statements of Big River Resources, LLC included in this annual report on Form 10-K into the Registration Statements |
99
|
|
|
|
|
|
23(c) |
Consent of Christianson & Associates, PLLP to use its report dated September 22, 2010 relating to the financial statements of NuGen Energy, LLC included in this annual report on Form 10-K into the Registration Statements |
|
|
|
|
|
|
23(d) |
Consent of Boulay, Heutmaker, Zibell & Co, P.L.L.P. to use its reports dated March 14, 2011 and April 12, 2010 relating to the financial statements of Patriot Renewable Fuels, LLC included in this annual report on Form 10-K into the Registration Statements |
|
|
|
|
|
|
23(e) |
Consent of Deloitte & Touche LLP to use its report dated November 24, 2009 relating to the financial statements of Patriot Renewable Fuels, LLC included in this annual report on Form 10-K into the Registration Statements |
|
|
|
|
|
(31) |
Rule 13a-14(a)/15d-14(a) Certifications: |
|
|
|
|
|
|
|
31 |
Certifications |
|
|
|
|
|
(32) |
Section 1350 Certifications: |
|
|
|
|
|
|
|
32 |
Certifications |
|
|
|
|
|
(99) |
Additional Exhibits |
|
|
|
|
|
|
|
99(a) |
Consolidated financial statements of Big River Resources, LLC for the years ended December 31, 2010, 2009 and 2008 |
|
|
|
|
|
|
99(b) and (b)1 |
Financial statements of Patriot Renewable Fuels, LLC for the years ended December 31, 2010, 2009, 2008 and 2007 |
|
|
|
|
|
|
99(c) |
Financial statements of NuGen Energy, LLC for the year ended July 31, 2010 |
|
|
|
|
|
|
|
Copies of the Exhibits not contained herein may be obtained by writing to Edward M. Kress, Secretary, REX American Resources Corporation, 2875 Needmore Road, Dayton, Ohio 45414. |
|
|
|
|
|
|
100