Attached files
| file | filename |
|---|---|
| 8-K - MARTIN MIDSTREAM PARTNERS L.P. | form8-k.htm |
Exhibit 99

High Yield
Conference
May 2011
Martin Midstream Partners, LP
Presentation to

Forward-Looking Statements
Statements included that are not historical facts (including any statements concerning plans and objectives
of management for future operations or economic performance, or assumptions or forecasts related
thereto), are forward-looking statements. These statements can be identified by the use of forward-
looking terminology including “forecast,” “may,” “believe,” “will,” “expect,” “anticipate,” “estimate,”
“continue,” or other similar words. These statements discuss future expectations, contain projections of
results of operations or of financial condition or state other “forward-looking” information. We and our
representatives may from time to time make other oral or written statements that are also forward-looking
statements.
These forward-looking statements are based upon management’s current plans, expectations, estimates,
assumptions and beliefs concerning future events impacting us and therefore involve a number of risks and
uncertainties. We caution that forward-looking statements are not guarantees and that actual results could
differ materially from those expressed or implied in the forward-looking statements.
assumptions and beliefs concerning future events impacting us and therefore involve a number of risks and
uncertainties. We caution that forward-looking statements are not guarantees and that actual results could
differ materially from those expressed or implied in the forward-looking statements.
Because these forward-looking statements involve risks and uncertainties, actual results could differ
materially from those expressed or implied by these forward-looking statements for a number of important
reasons. A discussion of these factors, including risks and uncertainties, is set forth in Martin Midstream’s
annual and quarterly reports filed from time to time with the Securities and Exchange Commission. Martin
Midstream expressly disclaims any intention or obligation to revise or update any forward-looking
statements whether as a result of new information, future events, or otherwise.
2

Management Team
3
• Ruben Martin
Chief Executive Officer, General Partner
– Has served as Chief Executive Officer and a member of the Board of Directors since June 2002
– President of Martin Resource Management Corporation (“MRMC” or the “Parent”) since 1981 and
joined MRMC in 1974
joined MRMC in 1974
• Bob Bondurant
Executive Vice President and Chief Financial Officer, General Partner
– Joined MRMC in 1983 as Controller and became CFO and a member of the Board of Directors in 1990
– Previously served in the audit department at Peat Marwick, Mitchell and Co.
• Wes Martin
Vice President of Business Development, General Partner
– Joined MRMC in 2005
– Previously served as an analyst in Energy Investment Banking at Raymond James
• Joe McCreery
Vice President of Finance and Head of Investor Relations, General Partner
– Joined MRMC in 2009
– Previously served as a Director in the Corporate Energy Department of SunTrust Robinson
Humphrey specializing in midstream/MLP finance
Humphrey specializing in midstream/MLP finance

Partnership Overview

Terminalling and Storage
Started in early 1990s
Natural Gas Services
Started in 1950s
32%
Marine Transportation
Started in 1980s
22%
Sulfur Services
Started in 1960s
22%
Differentiated by Diversity
5
24%
NASDAQ: MMLP
Unit price: $39.08
Market Cap: $800 million
Distribution / Yield: $3.04 / 7.8%
(as of April 12, 2011 close)
2010 EBITDA of $102.7
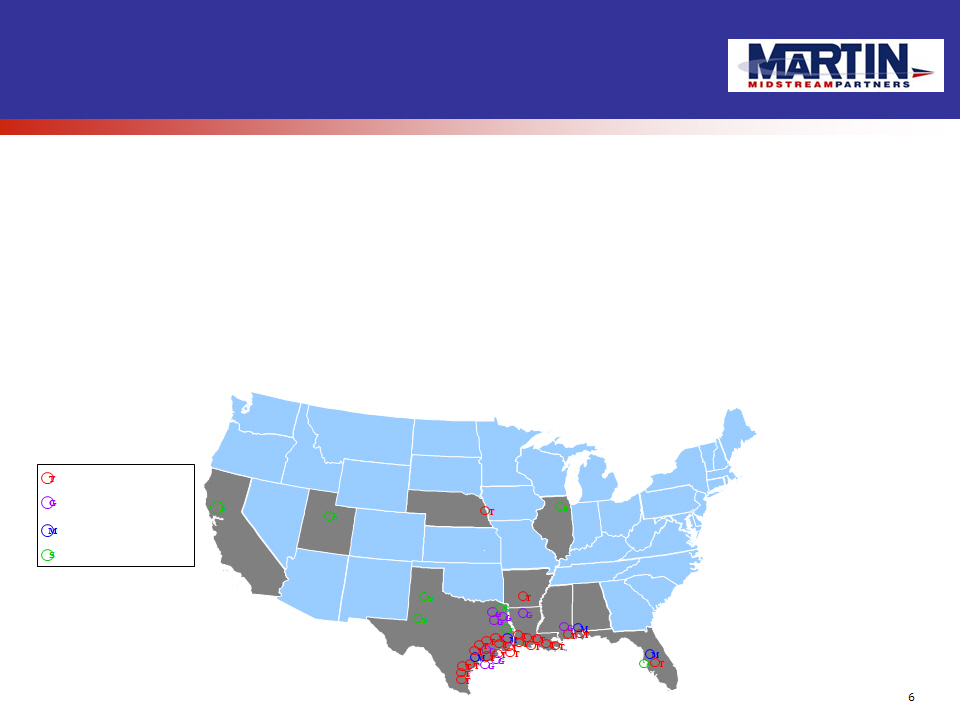
• Strategic operations across ~50 locations in 10 states, primarily in the Gulf Coast Region of the U.S., provide
cost-efficient operations in areas of high customer activity
cost-efficient operations in areas of high customer activity
– Shore bases acr0ss the Gulf Coast
– Favorable proximity to major refining regions
of the U.S.
of the U.S.
– Coast-to-coast integrated sulfur infrastructure,
including access to export markets from
Stockton, CA and Beaumont, TX and storage
at main domestic pricing point in Tampa, FL
including access to export markets from
Stockton, CA and Beaumont, TX and storage
at main domestic pricing point in Tampa, FL
Attractive Operating Footprint
Terminalling and Storage
Natural Gas Services
Marine Transportation
Sulfur Services
T
G
M
S
S
S
S
S
S
S
S
G
G
G
G
G
G
G
T
T
T
T
T
T
M
M
M
T
T
T
T
T
T
T
T
T
T
T
T
T
T
T
T
– Lubricant distributors and marketers
– Marine service terminals providing broad
geographic coverage and distribution
capabilities
geographic coverage and distribution
capabilities
– Natural gas assets strategically located in
Haynesville Shale, featuring only full
fractionation capabilities within ~ 200 miles
Haynesville Shale, featuring only full
fractionation capabilities within ~ 200 miles
T
T

• Crosstex - In January 2010, Waskom JV (with CenterPoint) acquired the East Texas natural gas and processing assets of Crosstex for $40
million ($20 million for Martin’s 50% share) with 60 miles of natural gas gathering pipelines, 2 compressor stations and 3 natural gas processing
refrigeration plants
million ($20 million for Martin’s 50% share) with 60 miles of natural gas gathering pipelines, 2 compressor stations and 3 natural gas processing
refrigeration plants
• Terminalling Facilities & Marine Asset Drop-down - In August 2010, acquired 2 marine terminals, 1 in Mississippi and 1 in Alabama, from MRMC
for $11.7 million. In December 2010, acquired a 60,000 bbl barge from MRMC for $17 million
for $11.7 million. In December 2010, acquired a 60,000 bbl barge from MRMC for $17 million
• Velocity Midstream - In November 2010, Prism acquired the East Texas natural gas gathering assets of Velocity Midstream for $25 million with
20 miles of natural gas gathering pipelines and various equipment
20 miles of natural gas gathering pipelines and various equipment
• Terminalling Facilities Drop-down - In January 2011, acquired 13 marine and 1 inland terminalling facilities located across the Louisiana Gulf
Coast from MRMC for $36.5 million
Coast from MRMC for $36.5 million
7
2010 2011
$20MM Acquisition of
Gas Gathering Assets
from Crosstex
from Crosstex
Acquisitions + Equity - A Pattern Repeated
Public Equity
Offering: $50.6MM
Offering: $50.6MM
$36.5MM Drop-down
of Shore-based Marine
Terminal Assets
Terminal Assets
Public Equity
Offering: $70.7MM
Offering: $70.7MM
Public Equity
Offering: $28.1MM (1)
Offering: $28.1MM (1)
$28.7MM Drop-downs
of Shore-based
Terminals and Marine
Assets
Terminals and Marine
Assets
$25MM Acquisition of
Gas Gathering Assets
from Velocity Midstream
from Velocity Midstream
(1) - August 2010 offering proceeds used solely to redeem MRMC owned MMLP units
Modest sized acquisitions of familiar assets with conservative financing mix
High Yield Offering:
$200.0MM
$200.0MM

8
• MRMC developed the infrastructure and brand
reputation for the Partnership’s business segments over
the past 50 years
reputation for the Partnership’s business segments over
the past 50 years
• MRMC directs the Partnership’s business operations
through its control of the GP
through its control of the GP
• The Partnership has commercial arrangements (as
customer and supplier) with MRMC that enhance its
ability to efficiently serve its third party customers
customer and supplier) with MRMC that enhance its
ability to efficiently serve its third party customers
• MRMC has invested ~$150 million in the Partnership over
the last 9 years (including drop-down support)
the last 9 years (including drop-down support)
• Strong, independent governance with four outside GP
directors plus Ruben Martin
directors plus Ruben Martin
Wholly-owned Subsidiaries
MRMC Affiliates
Non-Affiliates
Martin Resource
Management
Corporation
Martin Midstream
Partners L.P.
Partners L.P.
66.4%
LP Interest
2%
GP Interest
Martin
Resources`
LLC
Resources`
LLC
100%
Martin
Midstream
GP LLC
Midstream
GP LLC
100%
Public
Unitholders
6.6 million LP
Units
31.6% LP
Interest
MRMC is fully committed to the success of the Partnership
Strong General Partner Support
Private Company:
28.5% Owned by
Management /
ESOP*
Management /
ESOP*
*Excludes shares owned by Ruben Martin

9
• Integrated and complementary business segments uniquely position Martin and are a key driver of long-term
customer relationships
customer relationships
– Aligned with customers to address logistical and transportation issues and/or achieve operational synergies
through strategic alliances and partnerships
through strategic alliances and partnerships
• Breadth, scale and brand recognition developed over several decades make Martin a premier supplier
• Customers include some of the largest, most profitable businesses in the energy industry
– Major oil and gas companies, independent refiners, large chemical companies, fertilizer manufacturers
– Unique assets and capabilities and outstanding customer service (particularly for hard-to-handle products)
provide high barriers to entry and consistent contract renewals
provide high barriers to entry and consistent contract renewals
• Relationships with several of the majors span more than 10 years, with additional services added in recent years
Marquee Customer Base
High Quality, Stable Customer Base

Business Segment Overviews
Terminalling & Storage

Terminalling & Storage:
Asset Overview
• Partnership’s largest segment by cash flow
• Stable fee-based contracts
• Business driven by 3 types of terminals
– Full Service Marine Terminals
– Fuel and Lubricant Marine Terminals
– Specialty Petroleum Terminals
Marine Terminals
• One of the largest operators of marine service terminals in the Gulf
Coast region
Coast region
– 27 terminals with ~750,000 barrels of storage capacity
– Primarily fee-based contracts with ancillary products and services
Specialty Terminals
• Allow for the processing of crude oil into finished products, the
blending and storage of lubricants and asphalt storage
blending and storage of lubricants and asphalt storage
• Revenue driven by minimum fee contracts and take-or-pay agreements
– 12 terminals with ~ 2.6 million barrels of storage capacity
12

Shore-based Terminalling Asset
Drop-down Acquisitions
• In August 2010, acquisition of two shore-based marine terminals in Mississippi and Alabama from MRMC for $11.7 million
– Theodore, AL terminal has approximately 20,000 barrels of storage capacity and Pascagoula, MS terminal has
approximately 12,000 barrels of storage capacity
approximately 12,000 barrels of storage capacity
– Additional annual throughput of ~20 to 22 million gallons of diesel and other fuels and ~150,000 gallons of lubricants
– Long-term, fee-based cash flow with minimum throughput volume commitments guaranteed by MRMC
– Combined incremental cash flow of ~$1.7 million annually
13
• In January 2011, MRMC purchased all membership interests in L&L Holdings, LLC;
simultaneously, MMLP acquired various terminalling facilities located across the
Louisiana Gulf Coast from MRMC for $36.5 million
simultaneously, MMLP acquired various terminalling facilities located across the
Louisiana Gulf Coast from MRMC for $36.5 million
– 13 marine terminals located across the Louisiana Gulf Coast with approximately
340,000 barrels of storage capacity and 1 inland terminal in Lake Charles, LA
with approximately 9,000 barrels of storage capacity
340,000 barrels of storage capacity and 1 inland terminal in Lake Charles, LA
with approximately 9,000 barrels of storage capacity
– Additional annual throughput of ~120 million gallons of diesel and other fuels
and ~5 million gallons of lubricants
and ~5 million gallons of lubricants
– Acquisition eliminated one of the lowest margin fuel suppliers in the Gulf Coast
region
region
– Synergies exist across the Martin system with fuel purchasing, marine
equipment optimization, terminal consolidation and workforce reduction
equipment optimization, terminal consolidation and workforce reduction
– Long-term, fee-based cash flow with minimum throughput volume
commitments guaranteed by MRMC
commitments guaranteed by MRMC
– Incremental cash flow of ~$5.0 million annually
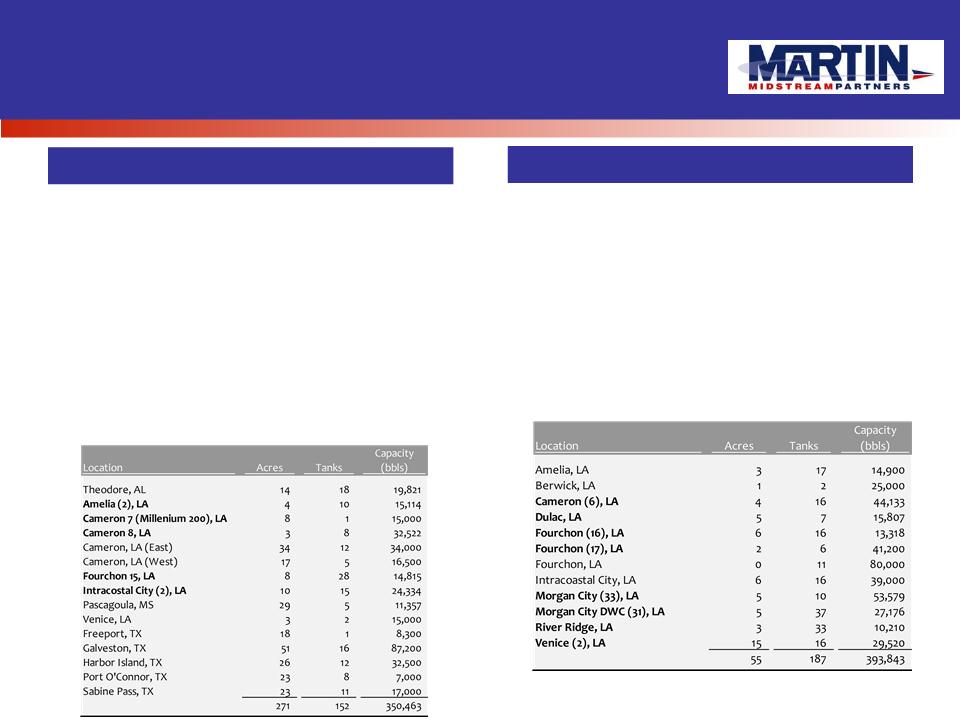
Terminalling & Storage:
Significantly Expanded Marine Terminal Assets
• Shore bases offering services including logistical
support, lubricant distribution and marketing and fuel
oil storage and handling
support, lubricant distribution and marketing and fuel
oil storage and handling
– Generate additional revenue by providing shore
bases to support customer operating activities
related to offshore exploration
bases to support customer operating activities
related to offshore exploration
• 15 terminals providing ~350,500 barrels of aggregate
capacity
capacity
• Customers primarily include oil and gas exploration
and production companies and oilfield service
companies
and production companies and oilfield service
companies
14
• Terminals dedicated to providing storage,
handling, distribution and marketing services for
lubricants and fuel oil
handling, distribution and marketing services for
lubricants and fuel oil
• Provide support primarily to MRMC
• 12 terminals providing ~394,000 barrels of
aggregate capacity
aggregate capacity
Full Service Terminals
Fuel & Lubricant Terminals
Recently acquired terminals from L&L in bold

Our Proven Performer - Specialty Terminals
• Highest margin business (40 - 50%) given unique products and lack of
competition equipped to provide specialty services
competition equipped to provide specialty services
– Requisite equipment and experience necessary to handle difficult
materials (e.g. molten sulfur, sulfuric acid, ammonia)
materials (e.g. molten sulfur, sulfuric acid, ammonia)
• Large barriers to entry drive key industry relationships and multi-year
(typically 3 - 5 years), minimum fee contracts with consistent renewals
(typically 3 - 5 years), minimum fee contracts with consistent renewals
• Customers are primarily large oil refining and natural gas processing
companies
companies
• Segment includes Cross Refinery assets and associated long-term tolling
agreement
agreement
• 12 terminals with ~2.6 million barrels of storage capacity
15
Specialty Petroleum Terminals
Recently acquired terminal from L&L in bold

Business Overview:
• 7,500 bpd naphthenic lube refinery in Smackover, AR
• Approximately 10% of total U.S. market share in specialized refining capacity
• Profitability drivers include:
– Refinery efficiency (utilization / lube yield maximization)
– Crude feedstock costs and availability
– Alternative lubricant prices (paraffinic vs. naphthenic)
– Industrial demand (utility maintenance, metalworking, etc.)
– Environmental regulation (driving switch to naphthenic lubes for tire industry)
• Naphthenic crude yields of ~65% for lubes, 20% for distillates and 12% for asphalt flux
• Cross contributes $10 - 12 million of EBITDA before $1 - 2 million of annual maintenance
CapEx
CapEx
• The Partnership has entered into a long-term, fee based agreement with MRMC,
securing stable cash flow
securing stable cash flow
• 12-year Tolling Agreement
• Fees generated via formulaic “Aggregate Quarterly Tolling Fee”
• Minimum tolling fee requires MRMC to make minimum volume purchases
• Includes additional volume and commodity price surcharges, ensuring baseline
profitability
profitability
16
Terminalling & Storage:
Cross Refinery Asset Detail
Note: Martin 10-K filings reflect Cross assets assuming 2009 full year ownership given “common control” accounting standards.

Terminalling & Storage:
Continued Performance
Adjusted EBITDA
Revenue
17
• Business Outlook
– Our largest and fastest growing segment
producing nearly 100% fee-based cash flows
producing nearly 100% fee-based cash flows
– Expanded shore base market penetration
through recent L&L acquisition
through recent L&L acquisition
– Continued strength in specialty terminalling
businesses including Cross. Naphthenic lube
demand remains strong
businesses including Cross. Naphthenic lube
demand remains strong
– Increasing revenue across each of the terminal
assets
assets
1 Reflects Revenue pro forma for Cross acquisition

Natural Gas Services

Natural Gas Services:
Snapshot
19
• Samson (% of Liquids)
• CenterPoint Energy Gas Transmission (Fee)
• Devon Energy (% of Proceeds)
• GMX Resources (Fee)
• Shelby Operating (% of Proceeds)
• Talco Midstream (% of Proceeds)
• Prism’s key assets include:
– 706 miles of gathering and transmission
pipelines
pipelines
§ Woodlawn - ~142 miles of gathering pipe,
~33 miles of transport pipe
~33 miles of transport pipe
– Solid processing capabilities
§ Waskom - 285 MMcf/d natural gas
processing plant
processing plant
§ Woodlawn - 30 MMcf/d processing plant
– Over 2.1 million barrels of combined NGL
storage capacity
storage capacity
– 200 mile NGL pipeline from Longview, TX to
Beaumont, TX
Beaumont, TX
• Fractionator at Waskom provides key competitive
advantage
advantage
– Only gas plant in East Texas that has full
fractionation capability (14,500 bpd)
fractionation capability (14,500 bpd)
Breakdown of 2010 EBITDA Contribution

Velocity Midstream Acquisition
• In November 2010, Prism acquired certain East Texas natural gas
gathering assets from Velocity Midstream for $25 million, the
“Darko Acquisition”
gathering assets from Velocity Midstream for $25 million, the
“Darko Acquisition”
Gas Gathering Assets
• Approximately 20 miles of natural gas gathering pipelines that are
connected to Harrison County Gas Gathering System acquired from
Crosstex in January 2010
connected to Harrison County Gas Gathering System acquired from
Crosstex in January 2010
• Provides opportunity to direct gas to Prism / Waskom assets
• Life of lease dedication from Berry Petroleum ensures long-term
competitive position
competitive position
• Extends Prism's footprint in East Texas with potential to extend
system further
system further
• Incremental cash flow of ~$3.0 million annually
20

Natural Gas Services: Integrated Solutions
with Attractive Contract Mix
• The Natural Gas Services segment provides an integrated distribution channel for gas producers
– Gathering and processing facilities collect the wet gas and separate liquids under fee-based, percent of proceeds or
percent of liquids pricing arrangements
percent of liquids pricing arrangements
– Pipelines and trucks distribute extracted or purchased NGLs for a fixed margin based on Mt. Belvieu indexed pricing
– Large storage capacity allows Martin to re-sell NGLs during higher-priced winter seasons, locking in margins via
hedging
hedging
– Wholesale propane business sells NGLs to propane retailers for a fixed-fee margin based on Mt. Belvieu indexed
pricing or through pre-bought and pre-sold arrangements (based on the same index)
pricing or through pre-bought and pre-sold arrangements (based on the same index)
– Wholesale distribution of NGLs provides smoothing effect to natural gas processing for MMLP
• Competitive Advantages
– Martin’s NGL business has 50+ years of performance and name recognition
– Long-term fee contracts, pricing arrangements and effective hedging (45% of commodity price risk for 2011) create
relative cash flow stability
relative cash flow stability
– Limited geographic alternatives (Waskom / Arcadia) and a large number of customers lower competitive pressures
– Strategically located Waskom Processing Plant remains the only full fractionation facility in East Texas production
area
area
– Existing infrastructure prime for expansion to provide full midstream services for both rich and lean gas
– Joint venture strategy with strong partner allows Martin to fully capitalize upon growth opportunities
21

Locked-in, higher
Natural Gas Services - Integrated Solutions
Wet Gas
Liquids
separated under
fee-based POP or
POL pricing
arrangements
separated under
fee-based POP or
POL pricing
arrangements
Third party purchasers
(Pipelines, trucks)
Martin storage facilities
Third party purchasers
NGLs
Martin wholesale
propane business
propane business
MTI. Belvieu
Propane retailers
615 miles of
gathering and
transmission
pipelines
gathering and
transmission
pipelines
200 miles NGL
pipeline
pipeline
285 MMcf/d
natural gas
processing plant
with 14,500 bbld
fractionation
capacity
natural gas
processing plant
with 14,500 bbld
fractionation
capacity
> 2.1MM bbl NGL
storage facilities
storage facilities
Third party suppliers
indexed pricing
priced winter sales
MTI. Belvieu
indexed pricing
22

Natural Gas Liquids
Value Chain
23
NATURAL GAS
GATHERING PIPELINES
GATHERING PIPELINES
Mixed NGLS
To fractionators for separation into
NGL purity products
NGL purity products
NGL PIPELINE
NGL STORAGE
Dry Natural Gas
(principally methane with ethane)
(principally methane with ethane)
NATURAL GAS
PIPELINES
PIPELINES
NATURAL GAS
STORAGE
STORAGE
Power Generation
Industrial Fuel
Residential Fuel
Petrochemicals
Petrochemicals and
Industrial/Residential Fuel
Industrial/Residential Fuel
Gasoline Additives and
Petrochemicals
Petrochemicals
Gasoline Additives and
Petrochemicals
Petrochemicals
Motor Gasoline
NGL Fractionation
ETHANE
PROPANE
ISOBUTANE
MIXED BUTANES
NORMAL BUTANE
NATURAL GASOLINE
WASKOM PROCESSING
PLANT
PLANT
END USERS:
EAST TEXAS PRODUCTION
COTTON VALLEY AND
HAYNESVILLE SHALE

Natural Gas Services:
Growth in 2010 = Increased Performance
24
• Business Outlook
– Multi-year dedicated acreage contracts (up to
life of reserves) provide access to Cotton Valley
and Haynesville gas
life of reserves) provide access to Cotton Valley
and Haynesville gas
– Cold winter season and signs of improving
economy support a stronger outlook for 2011
economy support a stronger outlook for 2011
– Waskom processing plant capacity expansion
will bring capacity from current 285 MMcf/d
level to 320 MMcf/d
will bring capacity from current 285 MMcf/d
level to 320 MMcf/d
– Waskom rail rack project will give expanded
market access for liquids - beyond regional
petrochem buyers
market access for liquids - beyond regional
petrochem buyers
Adjusted EBITDA
Revenue
1 Reflects EBITDA pro forma for Crosstex acquisitions
Volume

Sulfur Services

Sulfur Services:
Snapshot
• Engaged in the gathering of molten sulfur (270o F) from refiners and natural gas processing plants
• Integrated suite of specialized assets designed to gather, transport, store and process sulfur
• In addition to fees generated from gathering and storing, Martin is strategically structured to generate
revenue via multiple avenues
revenue via multiple avenues
– Sulfuric Acid Production
– Fertilizer Manufacturing
– Prilling - transformation of molten sulfur to sulfur pellets
• Invested in the essential assets and expertise to handle the unique requirements for transportation and
storage of molten sulfur
storage of molten sulfur
– 1 offshore tow, 1 inland tow, 165 railcars and several trucks owned and operated by MRMC
• Key assets
– 3 sulfur prillers (2 in Texas, 1 in California) with a combined
prilling capacity of 5,000 tons per day
– 6 sulfur-based fertilizer production plants
– 1 sulfuric acid plant
– 1 emulsified sulfur blending plant
26

Sulfur Services:
Intermodal Logistics
27
Refinery
Gas
Fertilizer
Production
Production
Industrial Uses
International
Demand
Demand
Beaumont, TX
Stockton, CA
Tampa, FL
Truck, Barge, Rail
Truck, Barge, Rail
Prilling
* Martin takes on
pricing at this point
Molten Form
China, Brazil,
Morocco
* Martin can take physical
delivery at this point
delivery at this point
($ Fee)
($ Fee)
($ Fee)
• Martin is able to capture fees at five points along the integrated system, which the Partnership
has developed over 30 years
has developed over 30 years
($ Fee)
Beaumont,
TX
TX
(Neches and
Stanolind)
Stanolind)
($ Fee)
($ Fee)
MMLP purchases
sulfur
sulfur
Source: Partnership

Full Service Logistical Provider
& Consistent Fertilizer Results
Molten Sulfur Overview
• Sales contracts typically last 1 to 5 years
• Contracts priced as a margin over a published market indicator
– Both sales and purchase prices are tied to a market published index (products/commodities are simultaneously purchased
and sold)
and sold)
• Prilling capability provides logistical services on a reservation fee basis; customers pay cost plus if prilling capacity is used
• Cash flow generation for 2010 equally split among traditional sulfur services, including prilling and our fertilizer production
Fertilizer Overview
• Dedicated offtake from MMLP owned sulfuric acid production facility
• Produces 4 primary sulfur and sulfur-based niche fertilizer products
– Plant nutrient sulfur products - agricultural ground sulfur products produced in Odessa, TX and Seneca, IL
– Ammonium sulfate products - includes nitrogen-phosphorus-potassium products and custom grades of lawn and garden
fertilizer produced in Plainview, TX and Salt Lake City, UT
fertilizer produced in Plainview, TX and Salt Lake City, UT
– Industrial sulfur - produced in Texarkana, TX for paper manufacturing processes, rubber manufacturing, etc.
– Ammonium thiosulfate - a liquid nutrient sprayed directly on plants and manufactured in Beaumont, TX
• Low competition levels in primary areas of operation (Texas and the Midwest)
• Competitive Advantages
– Proximity of manufacturing plants to customer base
– Reduced freight costs and enhance ability to respond to customer requests
– Regional market dynamics captured through multiple production facilities
– Product offering provides optionality to maximize profits with shifts in demand/supply dynamics
28

Sulfur Services:
Performance
Adjusted EBITDA
Revenue
29
• Business Outlook
– Additional prilling capacity and new reservation fee
contracts added for 2011
contracts added for 2011
– Expected demand in 2011 fueled by emerging
markets, particularly as China continues to require
mass quantities
markets, particularly as China continues to require
mass quantities
– Consistent performance from fertilizer expected
with increased product offering for 2011 (from 2010
CapEx initiatives) and strong demand given current
high agricultural pricing
with increased product offering for 2011 (from 2010
CapEx initiatives) and strong demand given current
high agricultural pricing
– Full profit upside as sulfur inventory essentially
carried at no cost due to current stockpile
carried at no cost due to current stockpile
– Re-negotiated molten sulfur sales contract
eliminates commodity price exposure
eliminates commodity price exposure
Volume

Marine Transportation

Marine Transportation:
Asset Base Well Positioned
• Martin remains a “term market player” for inland transportation services
– Goal is to keep fleet 100% contracted on a long-term basis, as historically achieved
– Contract tenor has shortened, however, strengthening economy will improve contract structure and
pricing
pricing
• Inland utilization forecasted to be > 90% for 2011
– Pressure towards shorter-term contracting or spot pricing not expected to affect utilization levels
– Current spot rates not materially lower than term contract rates
31
• Fleet modernization provides competitive advantage for the Partnership
– Newer and safer equipment is more desirable for clients
– Cost efficiencies (lower maintenance CapEx enables higher profitability for inland fleet)

Marine Asset
Drop-down Acquisition
• In December 2010, acquisition of a 60,000 barrel
offshore barge from MRMC for $17 million
offshore barge from MRMC for $17 million
– The M6000, a 60,000 barrel barge carrying
clean product (diesel fuel) for MFS, servicing the
shore-based terminals owned by MMLP and
currently paired with the MMLP tug LaForce
clean product (diesel fuel) for MFS, servicing the
shore-based terminals owned by MMLP and
currently paired with the MMLP tug LaForce
– Vessel placed under fully-found charter to MFS
increasing cash flow by approximately $5,000
per day
increasing cash flow by approximately $5,000
per day
– Incremental cash flow of approximately $1.8
million annually
million annually
32

Marine Transportation:
Solid Performance
33
• Business Outlook
– Maintain high utilization rates, with a goal
of restoring longer term contracts
of restoring longer term contracts
– Rates have reached market bottom,
providing significant upside as demand
rebounds
providing significant upside as demand
rebounds
– Continued industry capacity reduction as
older fleets are retired
older fleets are retired
– Expected normalization from heightened
activity surrounding BP/Macondo tragedy
activity surrounding BP/Macondo tragedy
Adjusted EBITDA
Revenue

Financial Overview
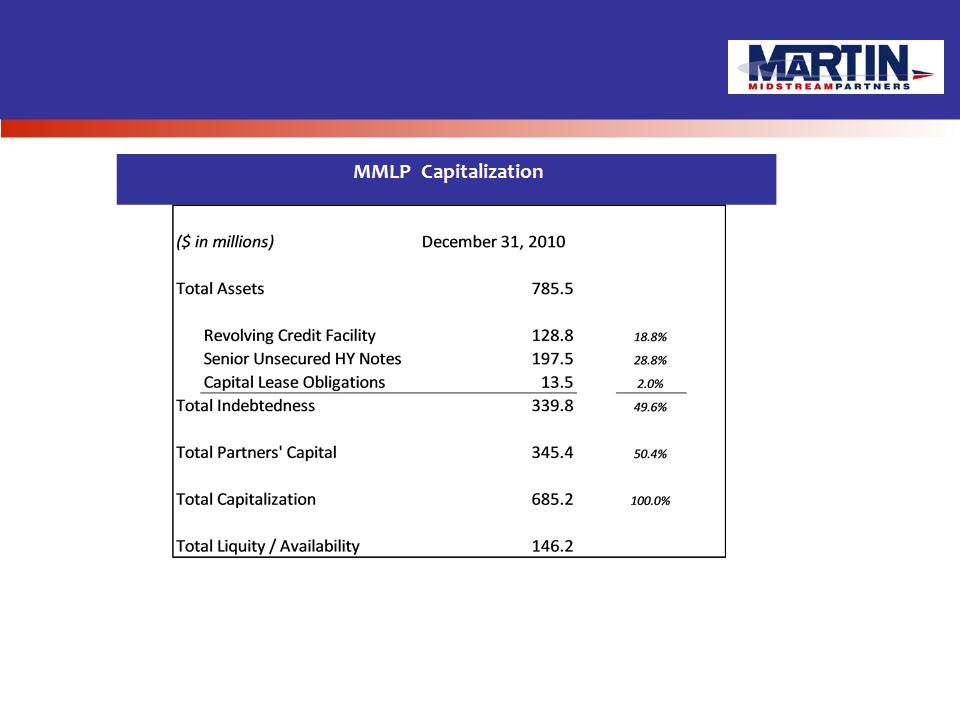
Current Capitalization
35
• MMLP issued $70.7 million in common equity units in February 2011
• MMLP is currently in the process of upsizing and extending its revolving credit facility from $275MM to
$350MM- expected closing 4/15/2011
$350MM- expected closing 4/15/2011

36
Financial Strategy:
No Change in our Discipline
• Target Leverage:
• Distribution Policy:
• Risk Management:
• Growth Opportunities:
– 3.0x - 3.5x
– Conservative approach to LP distributions
– The Partnership and BoD will consider distribution increases once a
comfortable DCR has been achieved (target of 1.15x)
comfortable DCR has been achieved (target of 1.15x)
– Hedging policies in place regarding type, transactor and counter-party
thresholds for both interest rate and commodity activity
thresholds for both interest rate and commodity activity
– The Partnership maintains the following insurance coverage:
§ Full umbrella coverage of $100 million laying over several layers of
GL, workers’ comp and asset-specific liability lien
GL, workers’ comp and asset-specific liability lien
§ Marine carries $1 billion of pollution coverage and hull value liability
– Predominantly geared for organic growth in 2011. Approved expansion for
both the natural gas services & terminalling and storage segments
both the natural gas services & terminalling and storage segments
– Opportunistic acquisitions will continue to be financed using the
Partnership’s Revolver followed by deleveraging through follow-on equity
issuances to maintain target leverage
Partnership’s Revolver followed by deleveraging through follow-on equity
issuances to maintain target leverage

37
• Terminalling and Storage:
– Cornerstone of the Partnership’s stable, fee-based cash flows as the largest segment by cash flow contribution
– Strength in tenor (1 - 12 years), product and geographic diversity; specialized products in niche markets
allowing for minimum fee/minimum volume mechanisms
allowing for minimum fee/minimum volume mechanisms
• Natural Gas Services:
– Wholesale NGL distribution provides stable margin-based cash flow for Partnership
– Multi-year up to life of reserve contracts for dedicated gathering and processing volumes
– Waskom JV contract mix: 50% Percent of Liquids, 35% Fee, 15% Percent of Proceeds, <1% Keep Whole
• Sulfur Services:
– 1-5 year, fee-based “take or pay” prilling agreements with majors (ExxonMobil, Shell, ConocoPhillips, Valero,
Total); majors pay under a cost plus scenario if capacity is used
Total); majors pay under a cost plus scenario if capacity is used
– 1-2 year supply agreements with oil refiners and natural gas producers; products then sold to phosphate
producers and other industrial customers
producers and other industrial customers
– Largest molten sulfur sales contract renegotiated to a cost plus structure in January 2011, reducing commodity
exposure
exposure
– Manufacturing process of sulfur-based fertilizer provides stable margin-based cash flow for Partnership
• Marine Transportation:
– 100% fee-based, primarily term contracts, with temporarily increased spot market activity when rates are
unfavorable for term contract renewals
unfavorable for term contract renewals
– Hard-to-handle product infrastructure provides substantial barriers to entry, even for spot market business
Heavily Weighted Fee-Based Contract Mix
Note: “margin-based” contracts represent i) buy/sell contracts which are priced off of same benchmark simultaneously, and ii) effectively eliminate pricing risk

Active Commodity Risk Management
38
• Established hedging policy to manage commodity risk exposure
– Swaps for crude oil, natural gas, natural gasoline
– Careful monitoring of counterparty risk
• Hedging focused in the Natural Gas Services segment
– 45% of volumes hedged for 2011 and 20% for 2012
– A $1 change in natural gas pricing affects cash flow by $32,670 per month in 2011
– A $10 change in oil pricing affects cash flow by $57,670 per month in 2011
• Hedging policy supplements Martin’s predominately fee-based cash flows
– Approximately 63% of the Partnership’s 2011 projected EBITDA consists of fee-based or take-or-pay
mechanisms, given the specialized assets and unique capabilities
mechanisms, given the specialized assets and unique capabilities
2010 Adjusted EBITDA

39
• Multiple lines of business provide the opportunity to direct capital strategically to multiple segments
– Focus on highest value projects
• Cross Refinery growth opportunities with tire industry demand
– $50 million of investment over 2 years at 4x - 7x EBITDA multiple
– New vacuum tower to increase yield of high viscosity lubes
§ $17 million capital investment with increased EBITDA of $4.5 million annually
§ Anticipated completion Spring 2012
– New hydrogen plant (Pending Investment)
§ $14 million to vertically integrate part of business, allowing Martin to produce ultra-low sulfur diesel for direct
sale and could also nearly double Cross capacity to 13,500 bbl/d
sale and could also nearly double Cross capacity to 13,500 bbl/d
§ Not yet approved by MMLP BoD
– New high pressure hydrotreater (2,600 psi vs. current 1,300 psi) (Pending Investment)
§ $19 million to facilitate increased non-carcinogenic lube production for tires
§ Not yet approved by MMLP BoD
• Completion of marine transportation fleet modernization (approximately $6 million of remaining expenditures) with new
inland barges will achieve greater cost efficiencies and provide Martin with a competitive advantage
inland barges will achieve greater cost efficiencies and provide Martin with a competitive advantage
• Waskom plant capacity will be increased to 320 MMcf/d from current 285 MMcf/d by the end of 2011 and natural gas liquids
rail loading facility added to take advantage of increased Haynesville drilling activity (cost of $25.5 million total; $12.75 million
Prism’s share)
rail loading facility added to take advantage of increased Haynesville drilling activity (cost of $25.5 million total; $12.75 million
Prism’s share)
• Ability to double or triple capacity at sulfur prilling plants with minimal CapEx requirements
• Overall EBITDA multiple of ~5x for all organic growth projects
Attractive Growth Opportunities
Across Business Segments

40
Closing Key Investment Considerations
à Four fully integrated and complementary business units spanning the midstream
value chain
value chain
Proven
Management
Management
à Demonstrated maintenance of conservative leverage profile through follow-on
equity offerings
equity offerings
Focus on EBITDA growth with base of stable, fee-based cash flows (some featuring
minimum fee/take-or-pay) and carefully managed commodity exposure
minimum fee/take-or-pay) and carefully managed commodity exposure
Stable base of leading industry players, largely under multi-year contracts with
consistent renewals
consistent renewals
Strong historical and continued support through several decades of infrastructure
and reputation development, drop-down and equity contributions
and reputation development, drop-down and equity contributions
à Experienced management team with independent GP directors
High Quality, Stable
Customer Base
Customer Base
Strong General
Partner Support
Partner Support
Fully Integrated
Service Provider
Service Provider
Strong Credit
Profile
Profile
Solid Growth
Diversified Business
Mix
Mix
à
Strategically located assets to provide cost-efficient operations in areas of high
customer activity
customer activity
Attractive
Operating Footprint
Operating Footprint
Diverse products and services, with specialized equipment and assets to process,
transport and store hard-to-handle products
transport and store hard-to-handle products
à
à
à
à

Question & Answer

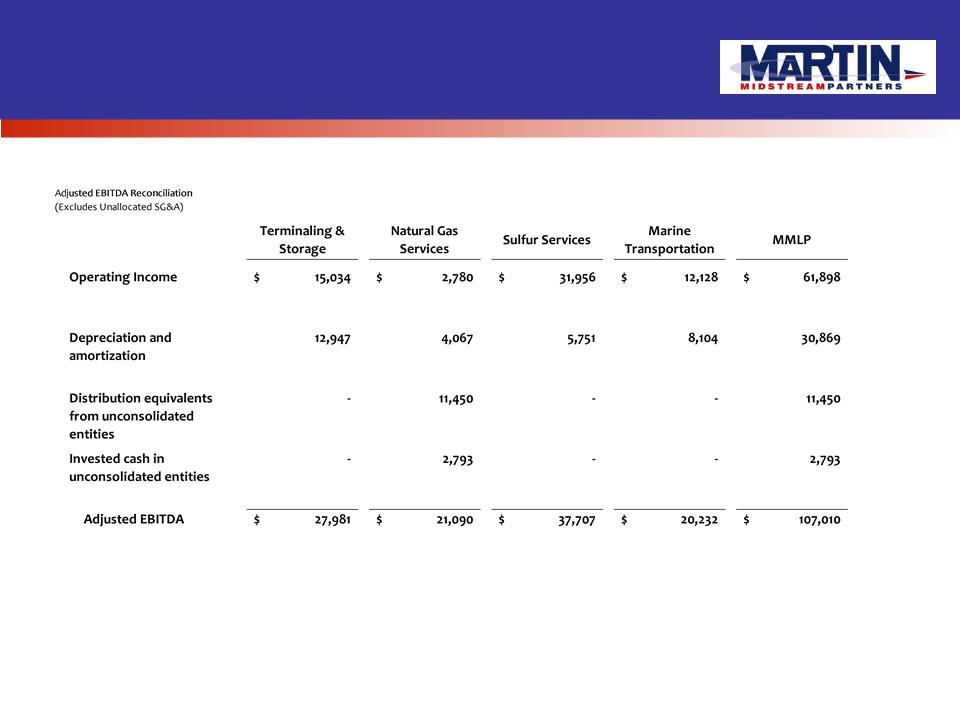
Non-GAAP Reconciliation

Adjusted EBITDA Reconciliation - 2010
43

Adjusted EBITDA Reconciliation - 2009
44
Adjusted EBITDA Reconciliation - 2008
45

Adjusted EBITDA Reconciliation - 2007
46

High Yield
Conference
May 2011
Martin Midstream Partners, LP
Presentation to