Attached files
| file | filename |
|---|---|
| 8-K - FORM 8-K - EXELON GENERATION CO LLC | d8k.htm |
EXHIBIT 99.1

Smart Investment
Exelon Corporation 2010 Fact Book

|
Table of Contents |
||||||||
|
Introduction |
1 | |||||||
|
Exelon at a Glance |
||||||||
| Profile, Vision and Quick Facts |
2 | |||||||
|
Company Overview |
||||||||
| Corporate Structure and Operating Company Summary |
3 | |||||||
|
State Regulation |
||||||||
| Illinois Commerce Commission, Commonwealth Edison Company |
||||||||
| Electric Distribution Rate Cases and Average Residential Rate |
4 | |||||||
| Pennsylvania Public Utility Commission, PECO Energy Company |
||||||||
| Electric and Gas Rate Cases and Average Residential Rate |
||||||||
|
Federal Regulation |
||||||||
| Federal Energy Regulatory Commission and ComEd Electric |
||||||||
| Transmission Rate Cases |
6 | |||||||
|
Exelon – Financial and Operating Highlights |
7 | |||||||
|
Reconciliation of Adjusted (non-GAAP) Operating Earnings to GAAP |
||||||||
| Consolidated Statements of Operations |
||||||||
| Exelon Corporation |
8 | |||||||
| Exelon Generation Company |
9 | |||||||
| Commonwealth Edison Company |
10 | |||||||
| PECO Energy Company |
11 | |||||||
|
Exelon and Operating Companies |
||||||||
| Capital Structure, Capitalization Ratios and Credit Ratings |
12 | |||||||
|
Long-Term Debt Outstanding |
||||||||
| Exelon Corporate |
13 | |||||||
| Exelon Generation |
13 | |||||||
| Commonwealth Edison |
14 | |||||||
| PECO Energy |
15 | |||||||
| Exelon and Operating Companies – Credit Facilities and Commercial Paper |
15 | |||||||
|
Map of Exelon Service Area and Selected Generating Assets |
16 | |||||||
|
Exelon Generation |
||||||||
| Generating Resources – Sources of Electric Supply, Type of Capacity and Long-Term Contracts |
17 | |||||||
| Nuclear Generating Capacity |
18 | |||||||
| Total Electric Generating Capacity |
20 | |||||||
| Fossil Emissions and Reduction Technology Summary |
22 | |||||||
| Annual Electric Supply and Sales Statistics and |
||||||||
| ComEd Financial Swap Agreement |
24 | |||||||
| Electric Supply and Sales Statistics by Quarter |
25 | |||||||
|
Electric Sales Statistics, Revenue and Customer Detail |
||||||||
| Commonwealth Edison |
26 | |||||||
| PECO Energy |
27 | |||||||
|
Gas Sales Statistics, Revenue and Customer Detail – PECO Energy
On the cover: Upper left – a view through the Quad Cities Unit 2 generator during that nuclear power station’s low pressure turbine replacement and refueling outage. Upper right – Exelon Power’s Handley Station in Ft. Worth, Texas, with three natural gas-burning generating units totaling 1,265 megawatts. Lower right – Exelon Wind project site in Tiskilwa, Illinois. Lower left – a ComEd underground cable splicer.
|
|
28 |
|
To the Financial Community,
The Exelon Fact Book is intended to provide historical financial and operating information to assist in the analysis of Exelon and its operating companies. Please refer to the SEC filings of Exelon and its subsidiaries, including the annual Form 10-K and quarterly Forms 10-Q, for more comprehensive and current financial statements and information.
For more information about Exelon and to send e-mail inquiries, visit our website at www.exeloncorp.com.
| Investor Information | Stock Symbol: EXC | |||
| Exelon Corporation | Common stock is listed on the | |||
| Investor Relations | New York and Chicago stock exchanges. | |||
| 10 South Dearborn Street | ||||
| Chicago, IL 60603 | ||||
| 312.394.2345 | ||||
| 312.394.8941 (fax) | ||||
Information in this Fact Book is current as of March 31, 2011 unless otherwise noted.
This publication includes forward-looking statements within the meaning of the Private Securities Litigation Reform Act of 1995, that are subject to risks and uncertainties. The factors that could cause actual results to differ materially from these forward-looking statements include those discussed herein as well as those discussed in (1) Exelon’s 2010 Annual Report on Form 10-K in (a) ITEM 1A. Risk Factors, (b) ITEM 7. Management’s Discussion and Analysis of Financial Condition and Results of Operations and (c) ITEM 8. Financial Statements and Supplementary Data: Note 18; and (2) other factors discussed in filings with the Securities and Exchange Commission (SEC) by Exelon Corporation, Commonwealth Edison Company, PECO Energy Company and Exelon Generation Company, LLC (Companies). Readers are cautioned not to place undue reliance on these forward-looking statements, which apply only as of the date of this publication. None of the Companies undertakes any obligation to publicly release any revision to its forward-looking statements to reflect events or circumstances after the date of this publication.
Exelon at a Glance
Company Profile
Exelon Corporation, headquartered in Chicago, Illinois, is one of the largest electric utilities in the U.S. with approximately 5.4 million customers and more than $18 billion in annual revenues. The company has one of the largest portfolios of electricity generation capacity, with a nationwide reach and strong positions in the Midwest and Mid-Atlantic.
Our Vision
Exelon will be the best group of electric generation and electric and gas delivery companies in the United States – providing superior value for our customers, employees, investors and the communities we serve.
Our Goals
| > | Keep the lights on and the gas flowing | |
| > | Run the nuclear fleet at world-class levels | |
| > | Capitalize on environmental leadership and clean nuclear energy | |
| > | Create a challenging and rewarding workplace | |
| > | Enhance the value of our generation | |
| > | Build value through disciplined financial management |
Our Values
Safety – for our employees, our customers and our communities
Integrity – the highest ethical standards in what we say and what we do
Diversity – in ethnicity, gender, experience and thought
Respect – trust and teamwork through open and honest communication
Accountability – for our commitments, actions and results
Continuous improvement – stretch goals and measured results
| Exelon Quick Facts at year-end 2010 | Market Highlights |
| $18.6 | 6,050 | 662 million | ||
| billion in revenues | circuit miles of electric transmission lines |
common shares outstanding | ||
| $52.2 | ||||
| billion in assets | 12,548 | $2.10 | ||
| 5.4 | miles of gas pipelines | current annual dividend rate per share(a)
| ||
| million electric customers |
31,758 | 54% | ||
| 0.5 | MWs total U.S. generating resources |
2010 dividend payout ratio(b) | ||
| million gas customers |
19,214 employees |
5.0% | ||
| dividend yield(c) | ||||
| 94,663 | ||||
| circuit miles of electric distribution lines |
(a) Dividends are subject to declaration by the board of directors each quarter.
(b) Based on GAAP earnings per share of $3.87.
(c) Based on common stock price of $41.64 on December 31, 2010.
2
Company Overview
| Nuclear Generation Fossil Generation Renewable/Hydro Generation Power Marketing |
Illinois Utility | Pennsylvania Utility | ||||
|
2010 |
2010 | |||||
| (in millions) | (in millions) | |||||
| Revenues: $6,204 | Revenues: $5,519 | |||||
| 2010 | Assets: $21,652 | Assets: $8,985 | ||||
| (in millions) | ||||||
| Revenues: $10,025 | ||||||
| Assets: $24,534 |
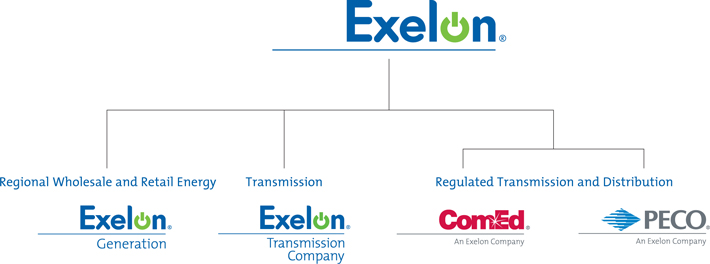
Operating Companies
| Exelon Generation Company | Exelon Transmission Company | Commonwealth Edison Company | PECO Energy Company | |||
| Exelon Generation (Generation) engages in competitive electric generation operations, including owned and contracted-for generating facilities, power marketing activities through Power Team, and competitive retail energy sales through Exelon Energy. Exelon Nuclear Partners offers Exelon’s industry-leading nuclear generation experience to other nuclear operators and those looking to develop new nuclear capabilities. | Exelon Transmission Company was formed in October 2009 as a national venture seeking to capitalize on the growing market for new transmission lines. | Commonwealth Edison (ComEd) is a regulated electricity transmission and distribution company with a service area in northern Illinois, including the City of Chicago, of approximately 11,300 square miles and an estimated population of 9 million. ComEd has approximately 3.8 million customers. | PECO Energy (PECO) is a regulated electricity transmission and distribution company and natural gas distribution company with a combined service area in southeastern Pennsylvania, including the City of Philadelphia, of approximately 2,100 square miles and an estimated population of 3.8 million. PECO has approximately 1.6 million electric customers and 490,000 natural gas customers. | |||
Our Strategic Direction
| Protect today’s value | + | Grow long-term value | ||||||||||
| > | Deliver superior operating performance | > | Drive the organization to the next level of performance | |||||||||
| > | Advance competitive markets | > | Adapt and advance Exelon 2020 | |||||||||
| > | Exercise financial discipline and maintain financial flexibility | > | Rigorously evaluate and pursue new growth opportunities in clean technologies and transmission |
|||||||||
| > | Build healthy, self-sustaining delivery companies |
|||||||||||
| > | Build the premier, enduring competitive generation company | |||||||||||
3
State Regulation
Illinois Commerce Commission (ICC)
(www.icc.illinois.gov)
The ICC has five full-time members, each appointed by the Governor (currently Pat Quinn, Democrat; term began in January 2009 and ends in January 2015) and confirmed by the Illinois State Senate. The Commissioners serve for five-year, staggered terms. Under Illinois law, no more than three Commissioners may belong to the same political party. The Chairman is designated by the Governor.
| Commissioner | Party Affiliation | Service Began | Term Ends | Professional Experience | ||||
| Douglas P. Scott (Acting Chairman)(a) | Democrat | 3/11 | 1/14 | Attorney; director of the Illinois Environmental | ||||
| Protection Agency; mayor of Rockford, IL; | ||||||||
| IL state representative
| ||||||||
| Sherman J. Elliott | Republican | 1/08 | 1/12 | Manager of State Regulatory Affairs for | ||||
| MISO; policy advisor to ICC Commissioners; | ||||||||
| ICC senior economist
| ||||||||
| Lula M. Ford | Democrat | 1/03 | 1/13 | Assistant superintendent, Chicago Public | ||||
| Schools; teacher; assistant director, | ||||||||
| Central Management Service
| ||||||||
| Erin O’Connell-Diaz | Republican | 4/03 | 1/13 | Attorney; ICC Administrative Law Judge; | ||||
| assistant attorney general
| ||||||||
| John T. Colgan (Acting)(b) | Democrat | 11/09 | 1/15 | Member of Illinois Association of Community | ||||
| Action Agencies; executive director of the | ||||||||
| Illinois Hunger Coalition
|
(a) Approved by Senate Executive Committee but no action taken yet by full Senate.
(b) No action has been taken on this appointment.
ComEd Electric Distribution Rate Cases
| ($ in millions) | Date | Revenue Increase |
Test Year | Rate Base | Overall Rate of Return |
Return on Equity |
Equity Ratio | |||||||
| ComEd Request |
6/30/10 | $343(a) | 2009 | $7,349(a) | 8.98%(a) | 11.50% | 47.28%(a) | |||||||
| ComEd Request |
10/17/07 | $345(b) | 2006 | $6,753(b) | 8.57%(b) | 10.75% | 45.04%(b) | |||||||
| ICC Order(c) |
9/10/08 | $274 | 2006 | $6,694 | 8.36% | 10.30% | 45.04% | |||||||
| ComEd Request |
8/31/05 | $317 | 2004 | $6,187 | 8.94% | 11.00% | 54.20% | |||||||
| ICC Order |
12/20/06 | $83 | 2004 | $5,521 | 8.01% | 10.045% | 42.86% | |||||||
| (a) | Reflects ComEd reply brief filed on February 23, 2011. Original rate request included a $396 million revenue increase. ComEd request does not reflect Appellate Court decision relating to depreciation reserve, which ComEd estimates would reduce the revenue requirement by $85 million. ICC decision is expected in May 2011. | |
| (b) | Reflects ComEd surrebuttal testimony filed on April 21, 2008. Original rate request included a $361 million revenue increase. | |
| (c) | On September 30, 2010, the Illinois Appellate Court issued a decision in the appeals related to the ICC’s order in ComEd’s 2007 electric distribution rate case. That decision ruled against ComEd on the treatment of post-test year accumulated depreciation. On November 18, 2010, the Court denied ComEd’s petition for rehearing, and on January 25, 2011, ComEd filed a Petition for Leave to Appeal to the Illinois Supreme Court. |
| ComEd – Average Total Residential Rate | ||||||||||||||||||||
| ($/MWh) | ||||||||||||||||||||
| Year
|
Transmission
|
Distribution
|
Energy
|
Other(a)
|
Total
|
|||||||||||||||
| 2006 |
$ – | $ – | $ | – | $ | – | $ | 86.59(b) | ||||||||||||
| 2007 |
3.47 | 30.40 | 71.76 | 1.98 | 107.61 | |||||||||||||||
| 2008 |
6.90 | 33.77 | 72.55 | 2.46 | 115.68 | |||||||||||||||
| 2009 |
6.94 | 39.29 | 67.77 | 3.02 | 117.02 | |||||||||||||||
| 2010 |
6.80 | 38.71 | 72.81 | 3.34 | 121.66 | |||||||||||||||
(a) Primarily includes taxes and environmental cost recovery and energy efficiency riders.
(b) Rates for services were bundled prior to 2007.
4
State Regulation
Pennsylvania Public Utility Commission (PUC)
(www.puc.state.pa.us)
The PUC has five full-time members, each appointed by the Governor (currently Tom Corbett, Republican; term began in January 2011 and ends in January 2015) and confirmed by the Pennsylvania State Senate. The Commissioners serve for five-year, staggered terms. Under Pennsylvania law, no more than three Commissioners may belong to the same political party as the Governor. The Chairman is designated by the Governor, and the Vice Chairman is selected by the PUC commissioners.
| Commissioner | Party Affiliation | Service Began | Term Ends | Professional Experience | ||||
| Robert F. Powelson (Chairman) | Republican | 6/08 | 4/14 | President/CEO of Chester County Chamber of Business and Industry; staff assistant to former U.S. Representative Curt Weldon (PA) | ||||
| John F. Coleman Jr. (Vice Chairman) | Republican | 6/10 | 4/12 | President/CEO of Centre County Chamber of Business and Industry; Executive Director of the Jefferson County Department of Development | ||||
| Tyrone J. Christy | Democrat | 6/07 | 4/11 | Executive at Americas Power Partners/ Armstrong Services; board member of Pennsylvania Energy Development Authority; vice chairman of PUC’s Independent Power Committee | ||||
| Wayne E. Gardner | Democrat | 6/08 | 4/13 | Consultant in power generation technologies; executive at Franklin Fuel Cells, Inc.; executive at PECO Energy | ||||
| James H. Cawley | Democrat | 6/05 | 4/15 | Attorney; majority counsel to the Pennsylvania Senate Consumer Affairs Committee |
PECO Electric Distribution Rate Case
| ($ in millions) | Date | Revenue Increase |
Test Year | Rate Base | Overall Rate of Return |
Return on Equity |
Equity Ratio | |||||||||||||||||||||
| PECO Request(a) |
3/31/10 | $316 | 2010 | $3,236 | 8.95% | 11.75% | 53.18% | |||||||||||||||||||||
| PUC Order(b) |
12/16/10 | $225 | 2010 | n/a | n/a | n/a | n/a | |||||||||||||||||||||
| PECO Gas Delivery Rate Cases | ||||||||||||||||||||||||||||
| ($ in millions) | Date | Revenue Increase |
Test Year | Rate Base | Overall Rate of Return |
Return on Equity |
Equity Ratio | |||||||||||||||||||||
| PECO Request(a) |
3/31/10 | $44 | 2010 | $1,100 | 8.95% | 11.75% | 53.18% | |||||||||||||||||||||
| PUC Order(b) |
12/16/10 | $20 | 2010 | n/a | n/a | n/a | n/a | |||||||||||||||||||||
| PECO Request |
3/31/08 | $98 | 2008 | $1,104 | 8.87% | 11.50% | 54.34% | |||||||||||||||||||||
| PUC Order(b) |
10/23/08 | $77 | 2008 | n/a | n/a | n/a | n/a | |||||||||||||||||||||
(a) Per original filing.
(b) PUC approved a joint settlement; no allowed return was specified. Increase related to December 2010 order was effective January 1, 2011.
PECO Energy – Average Total Residential Rate
| ($/MWh) Year |
Transmission | Distribution | Energy Efficiency Surcharge |
CTC(c) | Energy and Capacity |
Total | ||||||||||||||||||
| 2010 |
$5.10 | $50.30 | $2.90 | $25.70 | $62.60 | $146.60 | ||||||||||||||||||
| 2011 |
6.90 | 58.40 | 4.70 | – | 84.00 | 154.00 | ||||||||||||||||||
(c) The PUC authorized recovery in PECO’s 1998 settlement of competitive transition charges (CTC) through 2010.
5
Federal Regulation
Federal Energy Regulatory Commission (FERC)
(www.ferc.gov)
The FERC has five full-time members, each appointed by the President of the United States and confirmed by the U.S. Senate. The Commissioners serve for five-year, staggered terms. No more than three Commissioners may belong to the same political party. The Chairman is designated by the President.
| Commissioner | Party Affiliation | Service Began | Term Ends | Professional Experience | ||||
| Jon Wellinghoff (Chairman) | Democrat | 7/06 | 6/13 | Attorney, practice focused on energy law and utility regulation; staff advisor to several state utility commissions; Nevada State Consumer Advocate | ||||
| Philip D. Moeller | Republican | 7/06 | 6/15 | Energy policy advisor to former U.S. Senator Slade Gorton (WA); staff coordinator for the WA State Senate Committee on Energy, Utilities and Telecommunications; Alliant Energy Corporation | ||||
| Marc Spitzer | Republican | 7/06 | 6/11 | Attorney; Chair of the Arizona Corporation Commission; Arizona State Senator and Chair of the Judiciary and Finance Committees | ||||
| John R. Norris | Democrat | 1/10 | 6/12 | Attorney; Chief of Staff to Secretary Tom Vilsack of the U.S. Department of Agriculture; Chairman of the Iowa Utilities Board; President of the Organization of MISO States | ||||
| Cheryl A. LaFleur | Democrat | 7/10 | 6/14 | Attorney; executive vice president and acting CEO of National Grid USA; member of the NARUC Committees on Electricity and Critical Infrastructure |
ComEd Electric Transmission Rate Cases
| ($ in millions) | Date | Revenue Adjustment |
Test Year | Rate Base | Overall Rate of Return |
Return on Equity |
Equity Ratio | |||||||
| ComEd Update(a) | 5/16/10 | $(24) | 2009 | $1,949 | 9.27% | 11.50% | 56% | |||||||
| pro forma | ||||||||||||||
| ComEd Update(b) | 5/15/09 | $(16) | 2008 | $1,986 | 9.43% | 11.50% | 57% | |||||||
| pro forma | ||||||||||||||
| ComEd Update(c) | 5/15/08 | $65 | 2007 | $1,980 | 9.37% | 11.50% | 58% | |||||||
| pro forma | ||||||||||||||
| FERC Order(d) | 1/08 | $120(e) | 2005 | $1,847 | 9.40% | 11.50%(f) | 58%(g) | |||||||
| pro forma | ||||||||||||||
| ComEd Request | 3/1/07 | $147(e) | 2005 | $1,898 | 9.87% | 12.20%(h) | 58% | |||||||
| pro forma |
| (a) | Annual update filing based on the formula rate; rate effective June 1, 2010 through May 31, 2011. The revenue requirement decrease primarily reflects lower O&M expenses and an increased true-up credit to the formula. |
| (b) | Annual update filing based on the formula rate; rate effective June 1, 2009 through May 31, 2010. |
| (c) | Annual update filing based on the formula rate; rate effective June 1, 2008 through May 31, 2009. |
| (d) | On January 16, 2008, FERC issued an order that approved ComEd’s proposal to implement a formula-based transmission rate, effective May 1, 2007. |
| On January 18, 2008, FERC issued an order on rehearing that approved incentive rate treatment for West Loop Phase II project, including a 1.50% ROE adder. |
| (e) | Year 1 increase. |
| (f) | FERC approved the 0.50% RTO adder. ROE is fixed and not subject to annual updating. |
| (g) | Equity cap of 58% for 2 years, declining to 55% by June 2011. |
| (h) | Reflects base ROE of 11.70% plus requested 0.50% adder for participation in a Regional Transmission Organization (RTO). Additionally, an incentive adder of 1.50% on major new projects was requested. |
6
Exelon Corporation – Financial and Operating Highlights
For the Years ended December 31,
| (in millions, except per share data and where indicated) | 2010 | 2009 | 2008 | |||||||||
| Operating revenues |
$18,644 | $17,318 | $18,859 | |||||||||
| Net income |
$2,563 | $2,707 | $2,737 | |||||||||
| Electric deliveries (in GWhs)(a) |
130,778 | 124,828 | 131,282 | |||||||||
| Gas deliveries (in million cubic feet (mmcf)) |
87,744 | 84,309 | 83,734 | |||||||||
| Total available electric supply resources (MWs) |
31,758 | 31,003 | 31,292 | |||||||||
| Cash flows from operating activities |
$5,244 | $6,094 | $6,551 | |||||||||
| Capital expenditures |
$3,326 | $3,273 | $3,117 | |||||||||
| Common Stock Data |
||||||||||||
| Average common shares outstanding – diluted (in millions) |
663 | 662 | 662 | |||||||||
| GAAP earnings per share (diluted) |
$3.87 | $4.09 | $4.13 | |||||||||
| Adjusted (non-GAAP) operating earnings per share (diluted) |
$4.06 | $4.12 | $4.20 | |||||||||
| Dividends paid per common share |
$2.10 | $2.10 | $2.03 | |||||||||
| New York Stock Exchange common stock price (per share) |
||||||||||||
| High |
$49.88 | $58.98 | $92.13 | |||||||||
| Low |
$37.24 | $38.41 | $41.23 | |||||||||
| Year end |
$41.64 | $48.87 | $55.61 | |||||||||
| Book value per share |
$20.49 | $19.16 | $16.78 | |||||||||
| Total market capitalization (year end) |
$27,557 | $32,244 | $36,603 | |||||||||
| Common shares outstanding (year end) |
661.8 | 659.8 | 658.2 | |||||||||
| (a) | One GWh is the equivalent of one million kilowatt hours (kWh). |
Reconciliation of Adjusted (non-GAAP) Operating Earnings Per Share to GAAP
| 2010 | 2009 | 2008 | ||||||||||
| GAAP Earnings per Diluted Share |
$3.87 | $4.09 | $4.13 | |||||||||
| Mark-to-market impact of economic hedging activities |
(0.08 | ) | (0.16 | ) | (0.41 | ) | ||||||
| Asset retirement obligation reduction |
(0.01 | ) | (0.05 | ) | (0.02 | ) | ||||||
| Impact of the 2007 Illinois electric rate settlement |
0.02 | 0.10 | 0.22 | |||||||||
| Costs associated with ComEd’s City of Chicago settlement |
– | 0.01 | 0.02 | |||||||||
| Resolution of tax matters at Generation related to Sithe Energies, Inc. (Sithe) |
– | – | (0.03 | ) | ||||||||
| External costs associated with the proposed aquisition of NRG Energy, Inc. (NRG) |
– | 0.03 | 0.02 | |||||||||
| Unrealized (gains) losses related to nuclear decommissioning trust (NDT) fund investments |
(0.08 | ) | (0.19 | ) | 0.27 | |||||||
| Impairment of certain generating assets |
– | 0.20 | – | |||||||||
| 2009 restructuring charges |
– | 0.03 | – | |||||||||
| Non-cash remeasurement of income tax uncertainties and reassessment of state deferred income taxes |
0.10 | (0.10 | ) | – | ||||||||
| Costs associated with early debt retirements |
– | 0.11 | – | |||||||||
| Retirement of fossil generating units |
0.08 | 0.05 | – | |||||||||
| Impairment of certain emissions allowances |
0.05 | – | – | |||||||||
| John Deere Renewables, LLC (JDR) acquisition costs |
0.01 | – | – | |||||||||
| Non-cash charge resulting from health care legistration |
0.10 | – | – | |||||||||
| Adjusted (non-GAAP) Operating Earnings per Diluted Share |
$4.06 | $4.12 | $4.20 | |||||||||
7
Exelon Corporation – Reconciliation of Adjusted (non-GAAP) Operating Earnings
to GAAP Consolidated Statements of Operations (unaudited)
| Twelve Months Ended December 31, 2010 | Twelve Months Ended December 31, 2009 | |||||||||||||||||||||||||||
| (in millions, except per share data) |
GAAP(a) | Adjustments | Adjusted Non-GAAP |
GAAP(a) | Adjustments | Adjusted Non-GAAP |
||||||||||||||||||||||
| Operating revenues |
$18,644 | $25 | (c),(d) | $18,669 | $17,318 | $114 | (c),(d) | $17,432 | ||||||||||||||||||||
| Operating expenses |
||||||||||||||||||||||||||||
| Purchased power |
4,425 | (3 | )(e) | 4,422 | 3,215 | 94 | (e) | 3,309 | ||||||||||||||||||||
| Fuel |
2,010 | 32 | (e)(f) | 2,042 | 2,066 | 87 | (e) | 2,153 | ||||||||||||||||||||
| Operating and maintenance |
4,453 | (4 | )(g),(h),(i),(j) | 4,449 | 4,612 | (265 | )(c),(h),(i),(j),(m),(n) | 4,347 | ||||||||||||||||||||
| Operating and maintenance for regulatory required programs(b) |
147 | – | 147 | 63 | – | 63 | ||||||||||||||||||||||
| Depreciation and amortization |
2,075 | (80 | )(h) | 1,995 | 1,834 | (32 | )(h) | 1,802 | ||||||||||||||||||||
| Taxes other than income |
808 | – | 808 | 778 | – | 778 | ||||||||||||||||||||||
| Total operating expenses |
13,918 | (55 | ) | 13,863 | 12,568 | (116 | ) | 12,452 | ||||||||||||||||||||
| Operating income |
4,726 | 80 | 4,806 | 4,750 | 230 | 4,980 | ||||||||||||||||||||||
| Other income and deductions |
||||||||||||||||||||||||||||
| Interest expense, net |
(817 | ) | 103 | (k) | (714 | ) | (731 | ) | 12 | (k),(o) | (719 | ) | ||||||||||||||||
| Loss in equity method investments |
– | – | – | (27 | ) | – | (27 | ) | ||||||||||||||||||||
| Other, net |
312 | (153 | )(k),(l) | 159 | 427 | (324 | )(k),(l),(o) | 103 | ||||||||||||||||||||
| Total other income and deductions |
(505 | ) | (50 | ) | (555 | ) | (331 | ) | (312 | ) | (643 | ) | ||||||||||||||||
| Income before income taxes |
4,221 | 30 | 4,251 | 4,419 | (82 | ) | 4,337 | |||||||||||||||||||||
| Income taxes |
1,658 | (96 | )(c),(d),(e),(f),(g) | 1,562 | 1,712 | (98 | )(c),(d),(e),(h),(i),(j), | 1,614 | ||||||||||||||||||||
| (h),(i),(j),(k),(l) | (k),(l),(m),(n),(o) | |||||||||||||||||||||||||||
| Net income |
$2,563 | $126 | $2,689 | $2,707 | 16 | $2,723 | ||||||||||||||||||||||
| Effective tax rate |
39.3 | % | 36.7 | % | 38.7 | % | 37.2 | % | ||||||||||||||||||||
| Earnings per average common share |
||||||||||||||||||||||||||||
| Basic |
$3.88 | $0.19 | $4.07 | $4.10 | $0.03 | $4.13 | ||||||||||||||||||||||
| Diluted |
$3.87 | $0.19 | $4.06 | $4.09 | $0.03 | $4.12 | ||||||||||||||||||||||
| Average common shares outstanding |
||||||||||||||||||||||||||||
| Basic |
661 | 661 | 659 | 659 | ||||||||||||||||||||||||
| Diluted |
663 | 663 | 662 | 662 | ||||||||||||||||||||||||
| (a) | Results reported in accordance with accounting principles generally accepted in the United States (GAAP). | |
| (b) | Includes amounts for various legislative and/or regulatory programs that are recoverable from customers on a full and current basis through a reconcilable automatic adjustment clause. An equal and offsetting amount has been reflected in operating revenues during the period. | |
| (c) | Adjustment to exclude the impact of the 2007 Illinois electric rate settlement. | |
| (d) | Adjustment to exclude the costs associated with ComEd’s 2007 settlement agreement with the City of Chicago. | |
| (e) | Adjustment to exclude the mark-to-market impact of Exelon’s economic hedging activities. | |
| (f) | Adjustment to exclude a non-cash charge for the impairment of certain SO2 emission allowances as a result of declining market prices since the release of the EPA’s proposed Transport Rule in the third quarter of 2010. | |
| (g) | Adjustment to exclude a non-cash charge related to the passage of Federal health care legislation that reduces the deductibility of retiree prescription drug benefits for Federal income tax purposes to the extent they are reimbursed under Medicare Part D. | |
| (h) | Adjustment to exclude costs associated with the planned retirement of fossil generating units. | |
| (i) | Adjustment to exclude external costs associated with Exelon’s acquisition of JDR (now known as Exelon Wind) and the proposed acquisition of NRG, which was terminated in July 2009. | |
| (j) | Adjustment to exclude a decrease in 2010 in ComEd and PECO’s asset retirement obligations and a decrease in 2009 in Generation’s decomissioning obligation. | |
| (k) | Adjustment to exclude 2010 and 2009 remeasurements of income tax uncertainties and a 2009 change in state deferred income taxes. | |
| (l) | Adjustment to exclude unrealized gains in 2010 and 2009 associated with Generation’s NDT fund investments and the associated contractual accounting relating to income taxes. | |
| (m) | Adjustment to exclude 2009 charges associated with the elimination of management and staff positions. | |
| (n) | Adjustment to exclude a non-cash charge for the impairment of certain of Generation’s Texas plants. | |
| (o) | Adjustment to exclude costs associated with early debt retirements. |
8
Exelon Generation Company – Reconciliation of Adjusted (non-GAAP) Operating Earnings
to GAAP Consolidated Statements of Operations (unaudited)
| Twelve Months Ended December 31, 2010 | Twelve Months Ended December 31, 2009 | |||||||||||||||||||||||||||
| (in millions) | GAAP(a) | Adjustments | Adjusted Non-GAAP |
GAAP(a) | Adjustments | Adjusted Non-GAAP |
||||||||||||||||||||||
| Operating revenues |
$10,025 | $21 | (b) | $10,046 | $9,703 | $98 | (b) | $9,801 | ||||||||||||||||||||
| Operating expenses |
||||||||||||||||||||||||||||
| Purchased power |
1,853 | (3 | )(c) | 1,850 | 1,338 | 94 | (c) | 1,432 | ||||||||||||||||||||
| Fuel |
1,610 | 32 | (c),(d) | 1,642 | 1,594 | 87 | (c) | 1,681 | ||||||||||||||||||||
| Operating and maintenance |
2,812 | (18 | )(e),(f),(g) | 2,794 | 2,938 | (207 | )(f),(j),(k),(l) | 2,731 | ||||||||||||||||||||
| Depreciation and amortization |
474 | (80 | )(f) | 394 | 333 | (32 | )(f) | 301 | ||||||||||||||||||||
| Taxes other than income |
230 | – | 230 | 205 | – | 205 | ||||||||||||||||||||||
| Total operating expenses |
6,979 | (69 | ) | 6,910 | 6,408 | (58 | ) | 6,350 | ||||||||||||||||||||
| Operating income |
3,046 | 90 | 3,136 | 3,295 | 156 | 3,451 | ||||||||||||||||||||||
| Other income and deductions |
||||||||||||||||||||||||||||
| Interest expense, net |
(153 | ) | – | (153 | ) | (113 | ) | 2 | (m) | (111 | ) | |||||||||||||||||
| Loss in equity method investments |
– | – | – | (3 | ) | – | (3 | ) | ||||||||||||||||||||
| Other, net |
257 | (155 | )(h) | 102 | 376 | (320 | )(h),(m),(n) | 56 | ||||||||||||||||||||
| Total other income and deductions |
104 | (155 | ) | (51 | ) | 260 | (318 | ) | (58 | ) | ||||||||||||||||||
| Income before income taxes |
3,150 | (65 | ) | 3,085 | 3,555 | (162 | ) | 3,393 | ||||||||||||||||||||
| Income taxes |
1,178 | (21 | )(b),(c),(d),(e), | 1,157 | 1,433 | (132 | )(b),(c),(f),(h),(j), | 1,301 | ||||||||||||||||||||
| (f),(g),(h),(i) | (k),(l),(m),(n) | |||||||||||||||||||||||||||
| Net income |
$1,972 | $(44 | ) | $1,928 | $2,122 | (30 | ) | $2,092 | ||||||||||||||||||||
| (a) | Results reported in accordance with GAAP. | |
| (b) | Adjustment to exclude the impact of the 2007 Illinois electric rate settlement. | |
| (c) | Adjustment to exclude the mark-to-market impact of Generation’s economic hedging activities. | |
| (d) | Adjustment to exclude a non-cash charge for the impairment of certain SO2 emission allowances as a result of declining market prices since the release of the EPA’s proposed Transport Rule in the third quarter of 2010. | |
| (e) | Adjustment to exclude costs associated with Exelon’s acquisition of JDR (now known as Exelon Wind). | |
| (f) | Adjustment to exclude costs associated with the planned retirement of fossil generating units. | |
| (g) | Adjustment to exclude a non-cash charge related to the passage of Federal health care legislation that reduces the deductibility of retiree prescription drug benefits for Federal income tax purposes to the extent they are reimbursed under Medicare Part D. | |
| (h) | Adjustment to exclude unrealized gains in 2010 and 2009 associated with Generation’s NDT fund investments and the associated contractual accounting relating to income taxes. | |
| (i) | Adjustment to exclude a 2010 remeasurement of income tax uncertainties. | |
| (j) | Adjustment to exclude a decrease in 2009 in Generation’s decommissioning obligation. | |
| (k) | Adjustment to exclude 2009 charges associated with the elimination of management and staff positions. | |
| (l) | Adjustment to exclude a non-cash charge for the impairment of certain of Generation’s Texas plants. | |
| (m) | Adjustment to exclude costs associated with early debt retirements. | |
| (n) | Adjustment to exclude a change in state deferred income taxes. |
9
Commonwealth Edison Company – Reconciliation of Adjusted (non-GAAP) Operating Earnings
to GAAP Consolidated Statements of Operations (unaudited)
| Twelve Months Ended December 31, 2010 | Twelve Months Ended December 31, 2009 | |||||||||||||||||||||||||||
| (in millions) | GAAP(a) | Adjustments | Adjusted Non-GAAP |
GAAP(a) | Adjustments | Adjusted Non-GAAP |
||||||||||||||||||||||
| Operating revenues |
$6,204 | $4 | (c),(d) | $6,208 | $5,774 | $16 | (c),(d) | $5,790 | ||||||||||||||||||||
| Operating expenses |
||||||||||||||||||||||||||||
| Purchased power |
3,307 | – | 3,307 | 3,065 | – | 3,065 | ||||||||||||||||||||||
| Operating and maintenance |
975 | 7 | (e),(f) | 982 | 1,028 | (20 | )(c),(h) | 1,008 | ||||||||||||||||||||
| Operating and maintenance for regulatory
required |
94 | 94 | 63 | – | 63 | |||||||||||||||||||||||
| Depreciation and amortization |
516 | – | 516 | 494 | – | 494 | ||||||||||||||||||||||
| Taxes other than income |
256 | – | 256 | 281 | – | 281 | ||||||||||||||||||||||
| Total operating expenses |
5,148 | 7 | 5,155 | 4,931 | (20 | ) | 4,911 | |||||||||||||||||||||
| Operating income |
1,056 | (3 | ) | 1,053 | 843 | 36 | 879 | |||||||||||||||||||||
| Other income and deductions |
||||||||||||||||||||||||||||
| Interest expense, net |
(386 | ) | 59 | (g) | (327 | ) | (319 | ) | (6 | )(g) | (325 | ) | ||||||||||||||||
| Other, net |
24 | – | 24 | 79 | (60 | )(g) | 19 | |||||||||||||||||||||
| Total other income and deductions |
(362 | ) | 59 | (303 | ) | (240 | ) | (66 | ) | (306 | ) | |||||||||||||||||
| Income before income taxes |
694 | 56 | 750 | 603 | (30 | ) | 573 | |||||||||||||||||||||
| Income taxes |
357 | (59 | )(c),(d),(e),(f),(g) | 298 | 229 | (12 | )(c),(d),(g),(h) | 217 | ||||||||||||||||||||
| Net income |
$337 | $115 | $452 | $374 | $(18 | ) | $356 | |||||||||||||||||||||
| (a) | Results reported in accordance with GAAP. | |
| (b) | Includes amounts for various legislative and/or regulatory programs that are recoverable from customers on a full and current basis through a reconcilable automatic adjustment clause. An equal and offsetting amount has been reflected in operating revenues. | |
| (c) | Adjustment to exclude the impact of the 2007 Illinois electric rate settlement. | |
| (d) | Adjustment to exclude the costs associated with ComEd’s 2007 settlement agreement with the City of Chicago. | |
| (e) | Adjustment to exclude a decrease in 2010 in ComEd’s asset retirement obligation. | |
| (f) | Adjustment to exclude a non-cash charge related to the passage of Federal health care legislation that reduces the deductibility of retiree prescription drug benefits for Federal income tax purposes to the extent they are reimbursed under Medicare Part D. | |
| (g) | Adjustment to exclude 2010 and 2009 remeasurements of income tax uncertainties. | |
| (h) | Adjustment to exclude 2009 charges associated with the elimination of management and staff positions. |
10
PECO Energy Company – Reconciliation of Adjusted (non-GAAP) Operating Earnings
to GAAP Consolidated Statements of Operations (unaudited)
| Twelve Months Ended December 31, 2010 | Twelve Months Ended December 31, 2009 | |||||||||||||||||||||||
| (in millions) | GAAP(a) | Adjustments | Adjusted Non-GAAP |
GAAP(a) | Adjustments | Adjusted Non-GAAP |
||||||||||||||||||
| Operating revenues |
$5,519 | $– | $5,519 | $5,311 | $– | $5,311 | ||||||||||||||||||
| Operating expenses |
||||||||||||||||||||||||
| Purchased power |
2,361 | – | 2,361 | 2,274 | – | 2,274 | ||||||||||||||||||
| Fuel |
401 | – | 401 | 472 | – | 472 | ||||||||||||||||||
| Operating and maintenance |
680 | (1 | )(c),(d) | 679 | 640 | (3 | )(f) | 637 | ||||||||||||||||
| Operating and maintenance for regulatory required programs(b) |
53 | – | 53 | – | – | – | ||||||||||||||||||
| Depreciation and amortization |
1,060 | – | 1,060 | 952 | – | 952 | ||||||||||||||||||
| Taxes other than income |
303 | – | 303 | 276 | – | 276 | ||||||||||||||||||
| Total operating expenses |
4,858 | (1 | ) | 4,857 | 4,614 | (3 | ) | 4,611 | ||||||||||||||||
| Operating income |
661 | 1 | 662 | 697 | 3 | 700 | ||||||||||||||||||
| Other income and deductions |
||||||||||||||||||||||||
| Interest expense, net |
(193 | ) | 36 | (e) | (157 | ) | (187 | ) | – | (187 | ) | |||||||||||||
| Equity in losses of unconsolidated affiliates |
– | – | – | (24 | ) | – | (24 | ) | ||||||||||||||||
| Other, net |
8 | 2 | (e) | 10 | 13 | – | 13 | |||||||||||||||||
| Total other income and deductions |
(185 | ) | 38 | (147 | ) | (198 | ) | – | (198 | ) | ||||||||||||||
| Income before income taxes |
476 | 39 | 515 | 499 | 3 | 502 | ||||||||||||||||||
| Income taxes |
152 | 8 | (c),(d),(e) | 160 | 146 | 2 | (f) | 148 | ||||||||||||||||
| Net income |
$324 | $31 | $355 | $353 | $1 | $354 | ||||||||||||||||||
| (a) | Results reported in accordance with GAAP. | |
| (b) | Includes amounts for various legislative and/or regulatory programs that are recoverable from customers on a full and current basis through a reconcilable automatic adjustment clause. An equal and offsetting amount has been reflected in operating revenues. | |
| (c) | Adjustment to exclude a decrease in 2010 in PECO’s asset retirement obligation. | |
| (d) | Adjustment to exclude a non-cash charge related to the passage of Federal health care legislation that reduces the deductibility of retiree prescription drug benefits for Federal income tax purposes to the extent they are reimbursed under Medicare Part D. | |
| (e) | Adjustment to exclude a 2010 remeasurement of income tax uncertainties. | |
| (f) | Adjustment to exclude 2009 charges associated with the elimination of management and staff positions. |
11
Exelon and Operating Companies – Capital Structure and Capitalization Ratios
| (at December 31) | 2010 | 2009 | 2008 | |||||||||||||||||||||||||||||
| Exelon (consolidated) |
(in millions | ) | (in percent | ) | (in millions | ) | (in percent | ) | (in percent | )(a) | (in millions | ) | (in percent | ) | (in percent | )(a) | ||||||||||||||||
| Total Debt |
$12,828 | 48.4 | $12,594 | 49.7 | 48.9 | $13,151 | 54.1 | 51.9 | ||||||||||||||||||||||||
| Preferred Securities of Subsidiaries |
87 | 0.3 | 87 | 0.3 | 0.3 | 87 | 0.4 | 0.4 | ||||||||||||||||||||||||
| Total Equity |
13,563 | 51.2 | 12,640 | 49.9 | 50.8 | 11,047 | 45.5 | 47.7 | ||||||||||||||||||||||||
| Total Capitalization |
$26,478 | $25,321 | $24,285 | |||||||||||||||||||||||||||||
| Transition Debt |
$– | $415 | $1,124 | |||||||||||||||||||||||||||||
| Exelon Generation |
||||||||||||||||||||||||||||||||
| Total Debt |
$3,679 | 33.9 | $2,993 | 30.6 | $2,514 | 27.7 | ||||||||||||||||||||||||||
| Total Equity |
7,177 | 66.1 | 6,792 | 69.4 | 6,566 | 72.3 | ||||||||||||||||||||||||||
| Total Capitalization |
$10,856 | $9,785 | $9,080 | |||||||||||||||||||||||||||||
| ComEd |
||||||||||||||||||||||||||||||||
| Total Debt |
$5,207 | 43.0 | $5,072 | 42.4 | $4,992 | 42.6 | ||||||||||||||||||||||||||
| Total Shareholders’ Equity |
6,910 | 57.0 | 6,882 | 57.6 | 6,735 | 57.4 | ||||||||||||||||||||||||||
| Total Capitalization |
$12,117 | $11,954 | $11,727 | |||||||||||||||||||||||||||||
| PECO Energy |
||||||||||||||||||||||||||||||||
| Total Debt(b) |
$2,631 | 47.0 | $2,820 | 51.5 | 47.6 | $3,374 | 59.8 | 49.8 | ||||||||||||||||||||||||
| Preferred Securities |
87 | 1.6 | 87 | 1.6 | 1.7 | 87 | 1.5 | 1.9 | ||||||||||||||||||||||||
| Total Shareholders’ Equity |
2,883 | 51.5 | 2,565 | 46.9 | 50.7 | 2,182 | 38.7 | 48.3 | ||||||||||||||||||||||||
| Total Capitalization |
$5,601 | $5,472 | $5,643 | |||||||||||||||||||||||||||||
| Transition Debt |
$– | $415 | $1,124 | |||||||||||||||||||||||||||||
| (a) Excluding PECO transition debt. (b) Includes PECO’s accounts receivable agreement at December 31, 2010 of $225 million, which is classified as a short-term note payable. Note: Numbers may not add due to rounding.
Credit Ratings as of March 31, 2011
| ||||||||||||||||||
| |
Moody’s Investors Service |
(a) |
|
Standard & Poor’s Corporation |
(a) |
Fitch Ratings | (a) | |||||||||||||||||
| Exelon Corporation |
||||||||||||||||||||||||
| Senior Unsecured Debt |
Baa1 | BBB- | BBB+ | |||||||||||||||||||||
| Commercial Paper |
P2 | A2 | F2 | |||||||||||||||||||||
|
Exelon Generation |
||||||||||||||||||||||||
| Senior Unsecured Debt |
A3 | BBB | BBB+ | |||||||||||||||||||||
| Commercial Paper |
P2 | A2 | F2 | |||||||||||||||||||||
|
ComEd |
||||||||||||||||||||||||
| Senior Secured Debt |
Baa1 | A- | BBB+ | |||||||||||||||||||||
| Senior Unsecured Debt |
Baa3 | BBB | BBB | |||||||||||||||||||||
| Commercial Paper |
P3 | A2 | F3 | |||||||||||||||||||||
|
PECO Energy |
||||||||||||||||||||||||
| Senior Secured Debt |
A1 | A- | A | |||||||||||||||||||||
| Senior Unsecured Debt |
A3 | not rated | A- | |||||||||||||||||||||
| Commercial Paper |
P2 | A2 | F2 | |||||||||||||||||||||
(a) Rating outlook for all entities is stable.
12
Exelon Corporate – Long-Term Debt Outstanding as of December 31, 2010
| Series | Interest Rate |
Date Issued |
Maturity Date |
Total Debt Outstanding |
Current Portion |
Long-Term Debt |
||||||||||||||||||
| (in millions) |
||||||||||||||||||||||||
| Senior Notes |
||||||||||||||||||||||||
| 2005 Senior Notes |
4.90 | % | 6/9/05 | 6/15/15 | $800 | $– | $800 | |||||||||||||||||
| 2005 Senior Notes |
5.625 | % | 6/9/05 | 6/15/35 | 500 | – | 500 | |||||||||||||||||
| Total Senior Notes |
$1,300 | $– | $1,300 | |||||||||||||||||||||
| Unamortized Debt Disc. & Prem. & Fair Value Hedge Carrying Value Adj., Net |
13 | – | 13 | |||||||||||||||||||||
| Total Long-Term Debt |
$1,313 | $– | $1,313 | |||||||||||||||||||||
| Maturities |
| |||||||||||
| 2011 | $ | – | 2014 | – | ||||||||
| 2012 | – | 2015 | $ | 800 | ||||||||
| 2013 | – | |||||||||||
Exelon Generation – Long-Term Debt Outstanding as of December 31, 2010
| Series | Interest Rate |
Date Issued |
Maturity Date |
Total Debt Outstanding |
Current Portion |
Long-Term Debt |
||||||||||||||||||
| (in millions) |
||||||||||||||||||||||||
| Senior Notes |
||||||||||||||||||||||||
| 2003 Senior Unsecured Notes |
5.35 | % | 12/19/03 | 1/15/14 | $500 | $– | $500 | |||||||||||||||||
| 2007 Senior Unsecured Notes |
6.20 | % | 9/28/07 | 10/1/17 | 700 | – | 700 | |||||||||||||||||
| 2009 Senior Unsecured Notes |
5.20 | % | 9/23/09 | 10/1/19 | 600 | – | 600 | |||||||||||||||||
| 2010 Senior Unsecured Notes |
4.00 | % | 9/30/10 | 10/1/20 | 550 | – | 550 | |||||||||||||||||
| 2009 Senior Unsecured Notes |
6.25 | % | 9/23/09 | 10/1/39 | 900 | – | 900 | |||||||||||||||||
| 2010 Senior Unsecured Notes |
5.75 | % | 9/30/10 | 10/1/41 | 350 | – | 350 | |||||||||||||||||
| Exelon Wind |
2.00 | % | 12/10/10 | 7/31/17 | 0 | 0 | 0 | |||||||||||||||||
| Exelon Wind |
2.00 | % | 12/10/10 | 7/31/17 | 1 | 0 | 1 | |||||||||||||||||
| Total Senior Notes |
$3,602 | $0 | $3,602 | |||||||||||||||||||||
| Unsecured Pollution Control Notes |
||||||||||||||||||||||||
| Armstrong Co. 2009 A |
5.00 | % | 6/3/09 | 12/1/42 | 46 | – | 46 | |||||||||||||||||
| Total Unsec. Pollution Control Notes |
$46 | $– | $46 | |||||||||||||||||||||
| Notes Payable |
||||||||||||||||||||||||
| Capital Leases |
$36 | $3 | $33 | |||||||||||||||||||||
| Unamortized Debt Discount & Premium, Net |
(5 | ) | – | (5 | ) | |||||||||||||||||||
| Total Long-Term Debt |
$3,679 | $3 | $3,676 | |||||||||||||||||||||
| Maturities |
| |||||||||||
| 2011 | $ | 3 | 2014 | 503 | ||||||||
| 2012 | 3 | 2015 | $ | 3 | ||||||||
| 2013 | 3 | |||||||||||
Note: Amounts may not add due to rounding.
13
ComEd – Long-Term Debt Outstanding as of December 31, 2010
| Series | Interest Rate |
Date Issued |
Maturity Date |
Total Debt Outstanding |
Current Portion |
Long-Term Debt |
||||||||||||||||||
| (in millions) |
||||||||||||||||||||||||
| First Mortgage Bonds |
||||||||||||||||||||||||
| 105 |
5.40% | 12/19/06 | 12/15/11 | $345 | $345 | $– | ||||||||||||||||||
| 98 |
6.15% | 3/13/02 | 3/15/12 | 450 | – | 450 | ||||||||||||||||||
| 92 |
7.625% | 4/15/93 | 4/15/13 | 125 | – | 125 | ||||||||||||||||||
| 94 |
7.50% | 7/1/93 | 7/1/13 | 127 | – | 127 | ||||||||||||||||||
| Pollution Control-1994C |
5.85% | 1/15/94 | 1/15/14 | 17 | – | 17 | ||||||||||||||||||
| 101 |
4.70% | 4/7/03 | 4/15/15 | 260 | – | 260 | ||||||||||||||||||
| 104 |
5.95% | 8/28/06 | 8/15/16 | 415 | – | 415 | ||||||||||||||||||
| IL Fin. Authority Series 2008 F |
var. rate | 5/9/08 | 3/1/17 | 91 | – | 91 | ||||||||||||||||||
| 106 |
6.15% | 9/10/07 | 9/15/17 | 425 | – | 425 | ||||||||||||||||||
| 108 |
5.80% | 3/27/08 | 3/15/18 | 700 | – | 700 | ||||||||||||||||||
| IL Fin. Authority Series 2008 D |
var. rate | 5/9/08 | 3/1/20 | 50 | – | 50 | ||||||||||||||||||
| 109 |
4.00% | 8/2/10 | 8/1/20 | 500 | – | 500 | ||||||||||||||||||
| IL Fin. Authority Series 2008 E |
var. rate | 6/27/08 | 5/1/21 | 50 | – | 50 | ||||||||||||||||||
| 100 |
5.875% | 1/22/03 | 2/1/33 | 254 | – | 254 | ||||||||||||||||||
| 103 |
5.90% | 3/6/06 | 3/15/36 | 625 | – | 625 | ||||||||||||||||||
| 107 |
6.45% | 1/16/08 | 1/15/38 | 450 | – | 450 | ||||||||||||||||||
| Total First Mortgage Bonds |
$4,883 | $345 | $4,538 | |||||||||||||||||||||
| Sinking Fund Debentures |
||||||||||||||||||||||||
| Sinking Fund Debenture |
4.75% | 12/1/61 | 12/1/11 | 2 | 2 | – | ||||||||||||||||||
| Total Sinking Fund Debentures |
$2 | $2 | $– | |||||||||||||||||||||
| Notes Payable |
||||||||||||||||||||||||
| Notes Payable |
6.95% | 7/16/98 | 7/15/18 | 140 | – | 140 | ||||||||||||||||||
| Total Notes Payable |
$140 | $– | $140 | |||||||||||||||||||||
| Long-Term Debt To Financing Trusts |
||||||||||||||||||||||||
| Subordinated Debentures to ComEd Financing III |
6.35% | 3/17/03 | 3/15/33 | 206 | – | 206 | ||||||||||||||||||
| Total Long-Term Debt to Financing Trusts |
$206 | $– | $206 | |||||||||||||||||||||
| Unamortized Debt Disc. & Prem., Net |
(24 | ) | – | (24 | ) | |||||||||||||||||||
| Total Long-Term Debt |
$5,207 | $347 | $4,860 | |||||||||||||||||||||
| Maturities | ||||
| 2011 | $ | 347 | ||
| 2012 | 450 | |||
| 2013 | 252 | |||
| 2014 | 17 | |||
| 2015 | $ | 260 |
Note: Amounts may not add due to rounding.
14
PECO Energy – Long-Term Debt Outstanding as of December 31, 2010
| Series | Interest Rate |
Date Issued |
Maturity Date |
Total Debt Outstanding |
Current Portion |
Long-Term Debt |
||||||||||||||||||
| (in millions) |
||||||||||||||||||||||||
| First Mortgage Bonds |
||||||||||||||||||||||||
| FMB |
5.95% | 11/1/01 | 11/1/11 | $250 | $250 | $– | ||||||||||||||||||
| FMB |
4.75% | 9/23/02 | 10/1/12 | 225 | – | 225 | ||||||||||||||||||
| FMB |
5.60% | 10/2/08 | 10/15/13 | 300 | – | 300 | ||||||||||||||||||
| FMB |
5.00% | 3/26/09 | 10/1/14 | 250 | – | 250 | ||||||||||||||||||
| FMB |
5.35% | 3/3/08 | 3/1/18 | 500 | – | 500 | ||||||||||||||||||
| FMB |
5.90% | 4/23/04 | 5/1/34 | 75 | – | 75 | ||||||||||||||||||
| FMB |
5.95% | 9/25/06 | 10/1/36 | 300 | – | 300 | ||||||||||||||||||
| FMB |
5.70% | 3/19/07 | 3/15/37 | 175 | – | 175 | ||||||||||||||||||
| Total First Mortgage Bonds |
$2,075 | $250 | $1,825 | |||||||||||||||||||||
| Mortgage-Backed Pollution Control Notes |
| |||||||||||||||||||||||
| Delaware Co. 2008 Ser. A |
4.00% | 3/5/08 | 12/1/12 | 150 | – | 150 | ||||||||||||||||||
| Total Mortgage-Backed Pollution Control Notes |
$150 | $– | $150 | |||||||||||||||||||||
| Long-Term Debt to Financing Trusts |
| |||||||||||||||||||||||
| PECO Energy Capital Trust III |
7.38% | 4/6/98 | 4/6/28 | 81 | – | 81 | ||||||||||||||||||
| PECO Energy Capital Trust IV |
5.75% | 6/24/03 | 6/15/33 | 103 | – | 103 | ||||||||||||||||||
| Total Long-Term Debt to Financing Trusts |
$184 | $– | $184 | |||||||||||||||||||||
| Unamortized Debt Discount & Premium, Net |
(3 | ) | – | (3 | ) | |||||||||||||||||||
| Total Long-Term Debt |
$2,406 | $250 | $2,156 | |||||||||||||||||||||
(a) PETT = PECO Energy Transition Trust
| Maturities | ||||
| 2011 | $250 | |||
| 2012 | 375 | |||
| 2013 | 300 | |||
| 2014 | 250 | |||
| 2015 | $– |
Exelon and Operating Companies – Credit Facilities and Commercial Paper as of December 31, 2010
| Generation | ComEd | PECO | Exelon Corporate |
Total | ||||||||||||||||
| (in millions) |
||||||||||||||||||||
| Unsecured Revolving Credit Facilities(a),(b) |
$4,834 | $1,000 | $574 | $957 | $7,365 | |||||||||||||||
| Outstanding Facility Draws |
– | – | – | – | – | |||||||||||||||
| Outstanding Letters of Credit |
(214 | ) | (196 | ) | (1 | ) | (7 | ) | (418 | ) | ||||||||||
| Available Capacity under Facilities(c) |
4,620 | 804 | 573 | 950 | 6,947 | |||||||||||||||
| Outstanding Commercial Paper |
– | – | – | – | – | |||||||||||||||
| Available Capacity less Outstanding Comm. Paper |
$4,620 | $804 | $573 | $950 | $6,947 | |||||||||||||||
| (a) | Equals aggregate bank commitments under revolving credit agreements. On March 23, 2011, Exelon Corporate, Generation and PECO replaced their unsecured revolving credit facilities with new facilities with aggregate bank commitments of $500 million, $5.3 billion and $600 million, respectively. These credit facilities expire on March 23, 2016, unless extended. ComEd’s facility extends to March 25, 2013. |
| (b) | Excludes additional credit facility agreements for Generation, ComEd and PECO with aggregate commitments of $30 million, $32 million and $32 million, respectively, arranged with minority and community banks. These facilities expire on October 21, 2011 and are solely for issuing letters of credit, which totaled $11 million, $26 million and $20 million for Generation, ComEd and PECO, respectively, as of December 31, 2010. |
| (c) | Represents unused bank commitments under the borrower’s credit agreements net of outstanding letters of credit and credit facility draws. The amount of commercial paper outstanding does not reduce the available capacity under the credit agreements. |
15
Exelon Service Area and Selected Generating Assets(a)
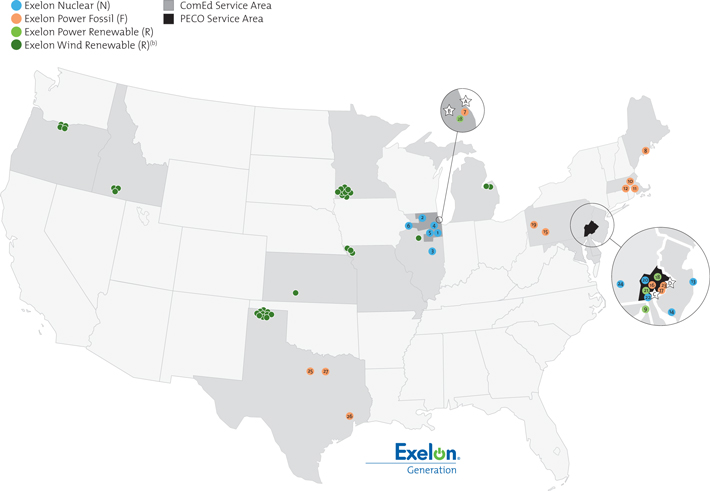
| Illinois |
Pennsylvania |
2010 Exelon Generation – Ownership Equity | ||||||||||
| A |
Exelon Corporate HQ |
C |
Exelon Power Team HQ | |||||||||
| A |
ComEd HQ |
C |
Exelon Power HQ | Output in | Capacity in | |||||||
| B |
Exelon Nuclear HQ |
C |
Exelon Generation HQ | Megawatt Hours (MWh) | Megawatts (MW) | |||||||
| 1 |
Braidwood (N) |
D |
PECO HQ | Nuclear | 92.9% | 66.5% | ||||||
| 2 |
Byron (N) |
15 |
Conemaugh (F) | Coal | 5.1% | 5.6% | ||||||
| 3 |
Clinton (N) |
16 |
Cromby (F) | Oil | 0.1% | 7.7% | ||||||
| 4 |
Dresden (N) |
17 |
Eddystone (F) | Gas | 0.9% | 10.6% | ||||||
| 5 |
LaSalle (N) |
18 |
Fairless Hills (R) | Hydro/Renewables | 1.0% | 9.6% | ||||||
| 6 |
Quad Cities (N) |
19 |
Keystone (F) | |||||||||
| 7 |
Southeast Chicago (F) |
20 |
Limerick (N) | |||||||||
| 28 |
City Solar (R) |
21 |
Muddy Run (R) | |||||||||
| 22 |
Peach Bottom (N) | |||||||||||
| Maine |
23 |
Schuylkill (F) | (a) Owned generating capacity in service at December 31, 2010, excluding long-term contracts. Map does not show 8 sites in the Philadelphia area where Exelon has peaking combustion turbines. (b) Refer to page 21 for a detailed list of Exelon Wind facilities and locations. | |||||||||
| 8 |
Wyman (F) |
24 |
Three Mile Island (N) | |||||||||
| Texas |
||||||||||||
| Maryland |
||||||||||||
| 9 |
Conowingo (R) |
25 |
Handley (F) |
|||||||||
| 26 |
LaPorte (F) | |||||||||||
| Massachusetts |
27 | Mountain Creek (F) | ||||||||||
| 10 |
Framingham (F) |
|||||||||||
| 11 |
New Boston (F) |
|||||||||||
| 12 |
West Medway (F) |
|||||||||||
| New Jersey |
||||||||||||
| 13 |
Oyster Creek (N) |
|||||||||||
| 14 |
Salem (N) |
|||||||||||
16
Exelon Generation – Generating Resources
Sources of Electric Supply(a)
| (GWhs) | 2010 | 2009 | 2008 | |||||||||
| Nuclear units |
140,010 | 139,670 | 139,342 | |||||||||
| Purchases – non-trading portfolio(b) |
21,062 | 23,206 | 26,263 | |||||||||
| Fossil, renewable and hydroelectric units |
10,717 | 10,189 | 10,569 | |||||||||
| Total supply |
171,789 | 173,065 | 176,174 | |||||||||
| Type of Capacity |
||||||||||||
| (MWs) At December 31, |
2010 | 2009 | 2008 | |||||||||
| Owned generation assets |
||||||||||||
| Nuclear |
17,047 | 17,009 | 16,983 | |||||||||
| Fossil |
6,189 | 6,189 | 6,184 | |||||||||
| Hydroelectric and renewable |
2,383 | 1,652 | 1,642 | |||||||||
| Owned generation assets |
25,619 | 24,850 | 24,809 | |||||||||
| Long-term contracts |
6,139 | 6,153 | 6,483 | |||||||||
| Total generating resources |
31,758 | 31,003 | 31,292 | |||||||||
(a) Represents Generation’s proportionate share of the output of its generating plants.
(b) Reflects all power purchased under long-term contracts.
Long-Term Contracts
(At December 31, 2010)
| ISO Region | Dispatch Type | Location | Seller | Fuel Type | Delivery Term | Capacity (MW) | ||||||||
| PJM | Base-load | Kincaid, IL | Kincaid Generation, LLC | Coal | 1998 – 2013 | 1,108 | ||||||||
| SERC | Peaking | Franklin, GA | Tenaska Georgia Partners, LP(a) | Oil/Gas | 2001 – 2030 | 945 | ||||||||
| ERCOT | Intermediate | Shiro, TX | Tenaska Frontier Partners, Ltd. | Oil/Gas | 2000 – 2020 | 830 | ||||||||
| SPP | Intermediate | Jenks, OK | Green Country Energy, LLC(b) | Oil/Gas | 2002 – 2022 | 778 | ||||||||
| PJM | Peaking | Elwood, IL | Elwood Energy, LLC | Oil/Gas | 2001 – 2012 | 775 | ||||||||
| PJM | Peaking | Manhattan, IL | Lincoln Generating Facility, LLC | Oil/Gas | 2003 – 2011 | 664 | ||||||||
| ERCOT | Intermediate | Granbury, TX | Wolf Hollow 1, LP | Oil/Gas | 2003 – 2023 | 350 | ||||||||
| PJM | Base-load | McLean, IL | Old Trail Windfarm, LLC | Wind | 2008 – 2026 | 198 | ||||||||
| PJM | Intermediate | Philadelphia, PA | Trigen-Philadelphia Energy Corp. | Oil/Gas | 1997 – 2017 | 150 | ||||||||
| PJM | Peaking | Morris, IL | Morris Cogeneration, LLC | Oil/Gas | 2001 – 2011 | 100 | ||||||||
| PJM | Base-load | Thomas, WV | NextEra Energy Resources, LLC | Wind | 2002 – 2022 | 66 | ||||||||
| PJM | Base-load | Wayne County, PA | NextEra Energy Resources, LLC | Wind | 2003 – 2023 | 64 | ||||||||
| PJM | Peaking | Kincaid, IL | Kincaid Generation, LLC | Coal | 2001 – 2013 | 50 | ||||||||
| PJM | NUG | W. Conshohocken, PA | Montenay Montgomery, LP | Municipal waste | 1991 – 2011 | 28 | ||||||||
| PJM | Base-load | Mill Run, PA | NextEra Energy Resources, LLC | Wind | 2001 – 2021 | 16 | ||||||||
| PJM | Base-load | Somerset, PA | NextEra Energy Resources, LLC | Wind | 2001 – 2021 | 9 | ||||||||
| PJM | Base-load | Bellefontaine, OH | Bellefontaine Gas Producers, LLC | Landfill gas | 2009 – 2018 | 5 | ||||||||
| PJM | Peaking | Morrisville, PA | Epuron LLC | Solar | 2008 – 2028 | 3 | ||||||||
| Total | 6,139 | |||||||||||||
ISO = Independent System Operator
NUG = Non-utility generator
| (a) | Generation has sold its rights to 945 MW of capacity, energy, and ancillary services supplied from its existing long-term contract with Tenaska Georgia Partners, LP through a PPA with Georgia Power, a subsidiary of Southern Company, for a 20-year period that began on June 1, 2010. |
| (b) | Commencing June 1, 2012 and lasting for 10 years, Generation has agreed to sell its rights to 520 MW, or approximately two-thirds, of capacity, energy, and ancillary services supplied from its existing long-term contract with Green Country Energy, LLC through a PPA with Public Service Company of Oklahoma, a subsidiary of American Electric Power Company, Inc. |
17
Exelon Generation – Nuclear Generating Capacity
Exelon Nuclear Fleet(a)
| (At December 31, 2010) | ||||||||||||
| Station | Net Annual of Units |
Location Water Body |
Plant Type |
NSSS Vendor |
Net Annual Mean Rating (MW) |
Ownership | ||||||
| Braidwood | 2 | Braidwood, IL Kankakee River |
PWR | W | 1,194/1,166 | 100% | ||||||
| Byron | 2 | Byron, IL Rock River |
PWR | W | 1,183/1,153 | 100% | ||||||
| Clinton | 1 | Clinton, IL Clinton Lake |
BWR | GE | 1,067 | 100% | ||||||
| Dresden | 2 | Morris, IL Kankakee River |
BWR | GE | 880/871 | 100% | ||||||
| LaSalle | 2 | Seneca, IL Illinois River |
BWR | GE | 1,136/1,150 | 100% | ||||||
| Limerick | 2 | Limerick Township, PA Schuylkill River(f) |
BWR | GE | 1,144/1,145 | 100% | ||||||
| Oyster Creek | 1 | Forked River, NJ Barnegat Bay |
BWR | GE | 625 | 100% | ||||||
| Peach Bottom | 2 | Peach Bottom Township, PA Susquehanna River | BWR | GE | 1,148/1,148 | 50% Exelon, 50% PSEG Nuclear | ||||||
| Quad Cities | 2 | Cordova, IL Mississippi River |
BWR | GE | 883/910 | 75% Exelon 25% Mid-American | ||||||
| Three Mile Island | 1 | Londonberry Township, PA Susquehanna River |
PWR | B&W | 837 | 100% | ||||||
| Total | 17 | 17,642 | 16,044 MW owned | |||||||||
Average in-service time = 30 years
Note: Fleet also includes 4 shutdown units: Peach Bottom 1, Dresden 1, Zion 1 and 2.
| (a) |
Does not include Exelon Generation’s 42.59%, 1,003 MW, interest in Salem Units 1 and 2 (PWRs). Last refueling outages: Salem Unit 1 completed April 2010 and Unit 2 completed November 2009 (18-month cycle). 2010 capacity and generation data is at ownership. Salem located in Hancock’s Bridge, NJ on the Delaware Estuary and has an open cooling water system. | |
| (b) |
Open — a system that circulates water withdrawn from the environment, returning it, albeit at a higher temperature, to its source. Closed — a system that recirculates cooling water with waste heat dissipated to the atmosphere through evaporation. | |
| (c) |
Dry cask storage will be in operation at all sites prior to the closing of on-site storage pools. | |
| (d) |
18-month refueling cycle. | |
| (e) |
24-month refueling cycle. | |
| (f) |
Supplemented with water from the Wadesville Mine Pool and the Still Creek Reservoir at Tamaqua via the Schuylkill River, and the Delaware River via the Bradshaw Reservoir and Perkiomen Creek. | |
| (g) |
On December 8, 2010, Generation announced that it will permanently cease generation operation at Oyster Creek by December 31, 2019. |
| Notes: |
PWR = pressurized water reactor; BWR = boiling water reactor | |
| NSSS Vendor = Nuclear Steam Supply System Vendor | ||
| Amounts may not add due to rounding. |
Nuclear Operating Data
| 2010 | 2009 | 2008 | ||||||||||
| Fleet capacity factor(a) |
93.9% | 93.6% | 93.9% | |||||||||
| Fleet production cost per MWh(a) |
$17.31 | $16.07 | $15.87 | |||||||||
Refueling Outages – 2010
– Conducted 9 refueling outages(a)
– Average refueling outage duration: 26 days(a)
Net Generation – 2010
– GWhs, excluding Salem 132,032
– GWhs, including Salem 140,010
Refueling Outages (including Salem)
2010: 10 actual
2011: 12 planned
2012: 10 planned
2013: 10 planned
2014: 11 planned
2015: 11 planned
(a) Excludes Salem; Salem Unit 1 and Unit 2 capacity factors in 2010 were 85.3% and 96.9%, respectively.
18
Exelon Generation – Nuclear Generating Capacity
| Station | Start Date |
License Expires |
Cooling Water System(b) |
Spent Fuel Pool Capacity Reached(c) |
Last Refueling by Unit |
2010 Generation (GWh) | ||||||
| Braidwood |
1988 | 2026/2027 | Closed | 2012 | Nov-10/Oct-09(d) | 19,200 | ||||||
| (dedicated pond) | ||||||||||||
| Byron |
1985/1987 | 2024/2026 | Closed | Dry cask storage | Oct-09/May-10(d) | 19,856 | ||||||
| Clinton |
1987 | 2026 | Closed | 2018 | Feb-10(e) | 8,614 | ||||||
| Dresden |
1970/1971 | 2029/2031 | Open | Dry cask storage | Dec-09/Nov-10(e) | 14,593 | ||||||
| LaSalle |
1984 | 2022/2023 | Closed | Dry cask storage | Mar-10/Mar-11(e) | 19,133 | ||||||
| Limerick |
1986/1990 | 2024/2029 | Closed | Dry cask storage | Apr-10/Apr-09(e) | 18,926 | ||||||
| Oyster Creek |
1969 | 2029(g) | Open | Dry cask storage | Dec-10(e) | 4,602 | ||||||
| Peach Bottom |
1974 | 2033/2034 | Open | Dry cask storage | Oct-10/Oct-09(e) | 9,378 | ||||||
| Quad Cities |
1973 | 2032/2032 | Open | Dry cask storage | May-09/Apr-10(e) | 11,097 | ||||||
| Three Mile Island |
1974 | 2034 | Closed | 2023 | Jan-10(e) | 6,634 | ||||||
| Total |
132,032 | |||||||||||
19
Exelon Generation – Total Electric Generating Capacity
Owned net electric generating capacity by station at December 31, 2010:
Base-load units are plants that normally operate to take all or part of the minimum continuous load of a system, and consequently produce electricity at an essentially constant rate. Intermediate units are plants that normally operate to take load of a system during the daytime higher load hours, and consequently produce electricity by cycling on and off daily. Peaking units consist of low-efficiency, quick response steam units, gas turbines, diesels, and pumped-storage hydroelectric equipment normally used during the maximum load periods.
| Station | Location |
|
Number of Units |
|
|
Percent Owned |
(a) |
|
Primary Fuel Type |
|
|
Primary Dispatch Type |
|
|
Net Generation (MW) |
| ||||||||
| Nuclear |
||||||||||||||||||||||||
| Braidwood |
Braidwood, IL | 2 | Uranium | Base-load | 2,360 | |||||||||||||||||||
| Byron |
Byron, IL | 2 | Uranium | Base-load | 2,336 | |||||||||||||||||||
| Clinton |
Clinton, IL | 1 | Uranium | Base-load | 1,067 | |||||||||||||||||||
| Dresden |
Morris, IL | 2 | Uranium | Base-load | 1,751 | |||||||||||||||||||
| LaSalle |
Seneca, IL | 2 | Uranium | Base-load | 2,286 | |||||||||||||||||||
| Limerick |
Limerick Twp., PA | 2 | Uranium | Base-load | 2,289 | |||||||||||||||||||
| Oyster Creek |
Forked River, NJ | 1 | Uranium | Base-load | 625 | (c) | ||||||||||||||||||
| Peach Bottom |
Peach Bottom Twp., PA | 2 | 50.00 | Uranium | Base-load | 1,148 | (d) | |||||||||||||||||
| Quad Cities |
Cordova, IL | 2 | 75.00 | Uranium | Base-load | 1,345 | (d) | |||||||||||||||||
| Salem |
Hancock’s Bridge, NJ | 2 | 42.59 | Uranium | Base-load | 1,003 | (d) | |||||||||||||||||
| Three Mile Island |
Londonderry Twp, PA | 1 | Uranium | Base-load | 837 | |||||||||||||||||||
| 17,047 | ||||||||||||||||||||||||
| Fossil (Steam Turbines) |
||||||||||||||||||||||||
| Conemaugh |
New Florence, PA | 2 | 20.72 | Coal | Base-load | 352 | (d) | |||||||||||||||||
| Cromby 1 |
Phoenixville, PA | 1 | Coal | Intermediate | 144 | (e) | ||||||||||||||||||
| Cromby 2 |
Phoenixville, PA | 1 | Oil/Gas | Intermediate | 201 | (e) | ||||||||||||||||||
| Eddystone 1, 2 |
Eddystone, PA | 2 | Coal | Intermediate | 588 | (e) | ||||||||||||||||||
| Eddystone 3, 4 |
Eddystone, PA | 2 | Oil/Gas | Intermediate | 760 | |||||||||||||||||||
| Fairless Hills |
Falls Twp, PA | 2 | Landfill Gas | Peaking | 60 | |||||||||||||||||||
| Handley 4, 5 |
Fort Worth, TX | 2 | Gas | Peaking | 870 | |||||||||||||||||||
| Handley 3 |
Fort Worth, TX | 1 | Gas | Intermediate | 395 | |||||||||||||||||||
| Keystone |
Shelocta, PA | 2 | 20.99 | Coal | Base-load | 357 | (d) | |||||||||||||||||
| Mountain Creek 6, 7 |
Dallas, TX | 2 | Gas | Peaking | 240 | |||||||||||||||||||
| Mountain Creek 8 |
Dallas, TX | 1 | Gas | Intermediate | 565 | |||||||||||||||||||
| Schuylkill |
Philadelphia, PA | 1 | Oil | Peaking | 166 | |||||||||||||||||||
| Wyman |
Yarmouth, ME | 1 | 5.89 | Oil | Intermediate | 36 | (d) | |||||||||||||||||
| 4,734 | ||||||||||||||||||||||||
| Fossil (Combustion Turbines) |
||||||||||||||||||||||||
| Chester |
Chester, PA | 3 | Oil | Peaking | 39 | |||||||||||||||||||
| Croydon |
Bristol Twp., PA | 8 | Oil | Peaking | 391 | |||||||||||||||||||
| Delaware |
Philadelphia, PA | 4 | Oil | Peaking | 56 | |||||||||||||||||||
| Eddystone |
Eddystone, PA | 4 | Oil | Peaking | 60 | |||||||||||||||||||
| Falls |
Falls Twp., PA | 3 | Oil | Peaking | 51 | |||||||||||||||||||
| Framingham |
Framingham, MA | 3 | Oil | Peaking | 29 | |||||||||||||||||||
| LaPorte |
Laporte, TX | 4 | Gas | Peaking | 152 | |||||||||||||||||||
| Medway |
West Medway, MA | 3 | Oil/Gas | Peaking | 105 | |||||||||||||||||||
| Moser |
Lower Pottsgrove Twp., PA | 3 | Oil | Peaking | 51 | |||||||||||||||||||
| New Boston |
South Boston, MA | 1 | Oil | Peaking | 12 | |||||||||||||||||||
| Pennsbury |
Falls Twp., PA | 2 | Landfill Gas | Peaking | 6 | |||||||||||||||||||
| Richmond |
Philadelphia, PA | 2 | Oil | Peaking | 96 | |||||||||||||||||||
| Salem |
Hancock’s Bridge, NJ | 1 | 42.59 | Oil | Peaking | 16 | (d) | |||||||||||||||||
| Schuylkill |
Philadelphia, PA | 2 | Oil | Peaking | 30 | |||||||||||||||||||
| Southeast Chicago |
Chicago, IL | 8 | Gas | Peaking | 296 | |||||||||||||||||||
| Southwark |
Philadelphia, PA | 4 | Oil | Peaking | 52 | |||||||||||||||||||
| 1,442 | ||||||||||||||||||||||||
20
Exelon Generation – Total Electric Generating Supply
(continued)
Owned net electric generating capacity by station at December 31, 2010:
| Station | Location |
|
Number of Units |
|
|
Percent Owned |
(a) |
|
Primary Fuel Type |
|
|
Primary Dispatch Type |
|
|
Net Generation (MW) |
| ||||||||
| Fossil (Internal Combustion/Diesel) |
|
|||||||||||||||||||||||
| Conemaugh |
New Florence, PA | 4 | 20.72 | Oil | Peaking | 2 | (d) | |||||||||||||||||
| Cromby |
Phoenixville, PA | 1 | Oil | Peaking | 3 | |||||||||||||||||||
| Delaware |
Philadelphia, PA | 1 | Oil | Peaking | 3 | |||||||||||||||||||
| Keystone |
Shelocta, PA | 4 | 20.99 | Oil | Peaking | 2 | (d) | |||||||||||||||||
| Schuylkill |
Philadelphia, PA | 1 | Oil | Peaking | 3 | |||||||||||||||||||
| 13 | ||||||||||||||||||||||||
| Hydroelectric and Renewable(f) |
|
|||||||||||||||||||||||
| AgriWind |
Bureau Co., IL | 4 | 99 | Wind | Base-load | 8 | (d) | |||||||||||||||||
| Blue Breezes |
Faribault Co., MN | 2 | Wind | Base-load | 3 | |||||||||||||||||||
| Bluegrass Ridge |
Gentry Co., MO | 27 | 99 | Wind | Base-load | 56 | (d) | |||||||||||||||||
| Brewster |
Jackson Co., MN | 6 | 94-99 | Wind | Base-load | 6 | (d) | |||||||||||||||||
| Cassia |
Twin Falls Co., ID | 14 | Wind | Base-load | 29 | |||||||||||||||||||
| Cisco |
Jackson Co., MN | 4 | 99 | Wind | Base-load | 8 | (d) | |||||||||||||||||
| City Solar |
Chicago, IL | n.a. | Solar | Base-load | 10 | |||||||||||||||||||
| Conception |
Nodaway Co., MO | 24 | Wind | Base-load | 50 | |||||||||||||||||||
| Conowingo |
Harford Co., MD | 11 | Hydroelectric | Base-load | 572 | |||||||||||||||||||
| Cow Branch |
Atchinson Co., MO | 24 | Wind | Base-load | 50 | |||||||||||||||||||
| Cowell |
Pipestone Co., MN | 1 | 99 | Wind | Base-load | 2 | (d) | |||||||||||||||||
| CP Windfarm |
Faribault Co., MN | 2 | Wind | Base-load | 4 | |||||||||||||||||||
| Echo 1 |
Umatilla Co., OR | 21 | 99 | Wind | Base-load | 34 | (d) | |||||||||||||||||
| Echo 2 |
Morrow Co., OR | 10 | Wind | Base-load | 20 | |||||||||||||||||||
| Echo 3 |
Morrow Co., OR | 6 | 99 | Wind | Base-load | 10 | (d) | |||||||||||||||||
| Ewington |
Jackson Co., MN | 10 | 99 | Wind | Base-load | 20 | (d) | |||||||||||||||||
| Greensburg |
Kiowa Co., KS | 10 | Wind | Base-load | 13 | |||||||||||||||||||
| Harvest |
Huron Co., MI | 32 | Wind | Base-load | 53 | |||||||||||||||||||
| High Plains |
Moore Co., TX | 8 | 99.5 | Wind | Base-load | 10 | (d) | |||||||||||||||||
| Exelon Wind 1 |
Hansford Co., TX | 8 | Wind | Base-load | 10 | |||||||||||||||||||
| Exelon Wind 2 |
Hansford Co., TX | 8 | Wind | Base-load | 10 | |||||||||||||||||||
| Exelon Wind 3 |
Hansford Co., TX | 8 | Wind | Base-load | 10 | |||||||||||||||||||
| Exelon Wind 4 |
Hansford Co., TX | 38 | Wind | Base-load | 80 | |||||||||||||||||||
| Exelon Wind 5 |
Sherman Co., TX | 8 | Wind | Base-load | 10 | |||||||||||||||||||
| Exelon Wind 6 |
Sherman Co., TX | 8 | Wind | Base-load | 10 | |||||||||||||||||||
| Exelon Wind 7 |
Moore Co., TX | 8 | Wind | Base-load | 10 | |||||||||||||||||||
| Exelon Wind 8 |
Moore Co., TX | 8 | Wind | Base-load | 10 | |||||||||||||||||||
| Exelon Wind 9 |
Moore Co., TX | 8 | Wind | Base-load | 10 | |||||||||||||||||||
| Exelon Wind 10 |
Moore Co., TX | 8 | Wind | Base-load | 10 | |||||||||||||||||||
| Exelon Wind 11 |
Moore Co., TX | 8 | Wind | Base-load | 10 | |||||||||||||||||||
| Loess Hills |
Atchinson Co., MO | 4 | Wind | Base-load | 5 | |||||||||||||||||||
| Marshall |
Lyon Co., MN | 9 | 98-99 | Wind | Base-load | 19 | (d) | |||||||||||||||||
| Michigan Wind |
Bingham Twp., MI | 46 | Wind | Base-load | 69 | |||||||||||||||||||
| Mountain Home |
Elmore Co., ID | 20 | Wind | Base-load | 40 | |||||||||||||||||||
| Muddy Run |
Lancaster, PA | 8 | Hydroelectric | Intermediate | 1,070 | |||||||||||||||||||
| Norgaard |
Lincoln Co., MN | 7 | 99 | Wind | Base-load | 9 | (d) | |||||||||||||||||
| Threemile Canyon |
Morrow Co., OR | 6 | Wind | Base-load | 10 | |||||||||||||||||||
| Tuana Springs |
Twin Falls Co., ID | 8 | Wind | Base-load | 17 | |||||||||||||||||||
| Wolf |
Nobles Co., MN | 5 | 99 | Wind | Base-load | 6 | (d) | |||||||||||||||||
| 2,383 | ||||||||||||||||||||||||
| Total |
25,619 | |||||||||||||||||||||||
| (a) |
100%, unless otherwise indicated. | |
| (b) |
For nuclear stations, capacity reflects the annual mean rating. All other stations reflect a summer rating. | |
| (c) |
On December 8, 2010, Generation announced that it will permanently cease generation operation at Oyster Creek by December 31, 2019. | |
| (d) |
Net generation capacity is stated at proportionate ownership share. | |
| (e) |
On December 2, 2009, Generation announced its intention to permanently retire four of its fossil-fired generating units. Cromby 1 and Eddystone 1 scheduled to retire effective May 31, 2011. Cromby 2 and Eddystone 2 scheduled to retire effective December 31, 2011 and June 1, 2012, respectively. | |
| (f) |
Includes Exelon Wind assets acquired on December 9, 2010. |
21
Fossil Emissions and Reduction Technology Summary
Owned generation as of December 31, 2010. Table does not include station auxiliary
equipment or peaking combustion turbines.
| Net Generation Available for Sale (GWh) | ||||||||||||||||||||
| Fossil Station (Location) / Water Body | Capacity (MW, Summer Rating) |
2010 | 2009 | 2008 | ||||||||||||||||
| Conemaugh (New Florence, PA) / Conemaugh River Units: 2 coal units (baseload) Data reflects Exelon Generation’s 20.72% plant ownership.
|
352 | 2,519 | 2,517 | 2,376 | ||||||||||||||||
| Cromby(a) (Phoenixville, PA) / Schuylkill River Units: 1 coal unit (intermediate), 1 oil/gas steam unit (intermediate)
|
345 | 564 | 524 | 679 | ||||||||||||||||
| Eddystone(a) (Eddystone, PA) / Delaware River Units: 2 coal units (intermediate), 2 oil/gas steam units (intermediate)
|
1,348 | 2,033 | 2,041 | 2,152 | ||||||||||||||||
| Fairless Hills (Falls Township, PA) / Delaware River Units: 2 landfill gas units (peaking)
|
60 | 239 | 237 | 227 | ||||||||||||||||
| Handley (Ft. Worth, TX) / Lake Arlington Units: 3 gas steam units (2 peaking/1 intermediate)
|
1,265 | 362 | 523 | 426 | ||||||||||||||||
| Keystone (Shelocta, PA) / Keystone Lake Units: 2 coal units (baseload) Data reflects Exelon Generation’s 20.99% plant ownership.
|
357 | 2,844 | 2,212 | 2,969 | ||||||||||||||||
| Mountain Creek (Dallas, TX) / Mountain Creek cooling pond Units: 3 gas steam units (2 peaking/1 intermediate)
|
805 | 726 | 689 | 246 | ||||||||||||||||
| Schuylkill (Philadelphia, PA) / Schuylkill River Units: 1 oil steam unit (peaking)
|
166 | 8 | 9 | 28 | ||||||||||||||||
| (a) | On December 2, 2009, Generation announced its intention to permanently retire four of its fossil-fired generating units. Cromby 1 and Eddystone 1 scheduled to retire effective May 31, 2011. Cromby 2 and Eddystone 2 scheduled to retire effective December 31, 2011 and June 1, 2012, respectively. |
22
Fossil Emissions and Reduction Technology Summary
| Emissions (thousand tons) |
Reduction Technology | |||||||||||||||||||||||||||||||||||
| Type | 2010 | 2009 | 2008 | SO2 Scrubber |
Post combustion NOx controls (SCR or SNCR) |
Low NOx burners with separated overfire air |
Induced flue gas |
Cooling Water System |
||||||||||||||||||||||||||||
| Conemaugh |
||||||||||||||||||||||||||||||||||||
| SO2 |
1.5 | 1.5 | 1.3 | X | ||||||||||||||||||||||||||||||||
| NOx |
4.0 | 3.9 | 3.6 | X | Closed | |||||||||||||||||||||||||||||||
| CO2
|
2,488.2 | 2,486.0 | 2,254.9 | |||||||||||||||||||||||||||||||||
| Cromby |
||||||||||||||||||||||||||||||||||||
| SO2 |
2.1 | 2.2 | 3.4 | X | ||||||||||||||||||||||||||||||||
| NOx |
1.3 | 1.1 | 1.9 | (Coal Unit | ) | X | X | |||||||||||||||||||||||||||||
| CO2
|
680.6 | 615.4 | 965.0 | (Coal Unit | ) | (Coal Unit | ) | Open | ||||||||||||||||||||||||||||
| Eddystone |
||||||||||||||||||||||||||||||||||||
| SO2 |
4.9 | 5.3 | 5.4 | X | ||||||||||||||||||||||||||||||||
| NOx |
3.8 | 3.8 | 4.1 | (Coal Units | ) | X | X | |||||||||||||||||||||||||||||
| CO2
|
2,748.0 | 2,754.5 | 2,827.0 | (Coal Units | ) | (Coal Units | ) | Open | ||||||||||||||||||||||||||||
| Fairless Hills |
||||||||||||||||||||||||||||||||||||
| SO2 |
0.1 | 0.1 | 0.1 | |||||||||||||||||||||||||||||||||
| NOx |
0.1 | 0.1 | 0.1 | |||||||||||||||||||||||||||||||||
| CO2
|
201.1 | 226.0 | 373.8 | Open | ||||||||||||||||||||||||||||||||
| Handley |
||||||||||||||||||||||||||||||||||||
| SO2 |
* | * | * | |||||||||||||||||||||||||||||||||
| NOx |
* | * | * | X | ||||||||||||||||||||||||||||||||
| CO2
|
263.8 | 377.0 | 319.6 | (Units 3, 4, 5 | ) | Open | ||||||||||||||||||||||||||||||
| Keystone |
||||||||||||||||||||||||||||||||||||
| SO2 |
8.2 | 23.7 | 39.9 | X | ||||||||||||||||||||||||||||||||
| NOx |
1.2 | 0.8 | 3.3 | X | X | |||||||||||||||||||||||||||||||
| CO2
|
2,803.3 | 2,146.2 | 2,867.1 | Closed | ||||||||||||||||||||||||||||||||
| Mountain Creek |
||||||||||||||||||||||||||||||||||||
| SO2 |
* | * | * | |||||||||||||||||||||||||||||||||
| NOx |
0.1 | 0.1 | * | X | X | |||||||||||||||||||||||||||||||
| CO2
|
488.6 | 470.5 | 170.0 | (Unit 8 | ) | (Units 6, 7 | ) | Open | ||||||||||||||||||||||||||||
| Schuylkill |
||||||||||||||||||||||||||||||||||||
| SO2 |
* | * | 0.4 | |||||||||||||||||||||||||||||||||
| NOx |
* | * | * | |||||||||||||||||||||||||||||||||
| CO2
|
14.9 | 14.1 | 28.9 | Open | ||||||||||||||||||||||||||||||||
*Indicates emissions less than 50 tons.
23
Exelon Generation – Annual Electric Supply and Sales Statistics
| Twelve Months Ended December 31,
|
||||||||
| (in GWhs) | 2010 | 2009 | ||||||
| Supply |
||||||||
| Nuclear Generation |
||||||||
| Mid-Atlantic(a) |
47,517 | 47,866 | ||||||
| Midwest |
92,493 | 91,804 | ||||||
| Total Nuclear Generation |
140,010 | 139,670 | ||||||
| Fossil and Renewables |
||||||||
| Mid-Atlantic(b) |
9,436 | 8,938 | ||||||
| Midwest |
68 | 4 | ||||||
| South and West |
1,213 | 1,247 | ||||||
| Total Fossil and Renewables |
10,717 | 10,189 | ||||||
| Purchased Power |
||||||||
| Mid-Atlantic |
1,918 | 1,747 | ||||||
| Midwest |
7,032 | 7,738 | ||||||
| South and West |
12,112 | 13,721 | ||||||
| Total Purchased Power |
21,062 | 23,206 | ||||||
| Total Supply by Region |
||||||||
| Mid-Atlantic |
58,871 | 58,551 | ||||||
| Midwest |
99,593 | 99,546 | ||||||
| South and West |
13,325 | 14,968 | ||||||
| Total Supply |
171,789 | 173,065 | ||||||
| Electric Sales |
||||||||
| ComEd (c) |
5,323 | 16,830 | ||||||
| PECO |
42,003 | 39,897 | ||||||
| Market and Retail(c) |
124,463 | 116,338 | ||||||
| Total Electric Sales(d),(e) |
171,789 | 173,065 | ||||||
|
Average Margin ($/MWh)(f),(g) |
||||||||
| Mid-Atlantic |
$42.67 | $44.03 | ||||||
| Midwest |
40.98 | 41.67 | ||||||
| South and West |
(9.83 | ) | (7.82 | ) | ||||
| Average Margin – Overall Portfolio |
37.62 | 38.20 | ||||||
| Around-the-clock (ATC) Market Prices ($/MWh)(h) |
||||||||
| PJM West Hub |
$45.93 | $38.30 | ||||||
| NIHUB |
33.09 | 28.85 | ||||||
| ERCOT North Spark Spread |
2.31 | 0.35 | ||||||
| (a) | Includes Generation’s proportionate share of the output of its nuclear generating plants, including Salem. |
| (b) | Includes New England generation. |
| (c) | ComEd line item represents sales under the 2006 ComEd Auction. Settlements of the ComEd swap and sales under the Request for Proposal (RFP) are included within Market and Retail sales. In addition, renewable energy credit sales to affiliates have been included within Market and Retail sales. |
| (d) | Excludes retail gas activity, trading portfolio and other operating revenue. |
| (e) | Total sales do not include trading volume of 3,625 GWhs and 7,578 GWhs for the years ended December 31, 2010 and 2009, respectively. |
| (f) | Excludes the mark-to-market impact of Generation’s economic hedging activities. |
| (g) | Results of transactions with PECO and ComEd are included in the Mid-Atlantic and Midwest regions, respectively. |
| (h) | Represents the average for the year. |
Financial Swap Agreement with ComEd
| Portion of Term | Fixed Price ($/MWh) | Notional Quantity (MW)(a) | ||||||
| January 1, 2011 – December 31, 2011 |
$51.26 | 3,000 | ||||||
| January 1, 2012 – December 31, 2012 |
$52.37 | 3,000 | ||||||
| January 1, 2013 – May 31, 2013 |
$53.48 | 3,000 | ||||||
| (a) | Market-based contract for ATC baseload energy only; does not include capacity, ancillary services or congestion. Agreement effective June 1, 2008. |
24
Exelon Generation – Electric Supply and Sales Statistics by Quarter
| Three Months Ended | ||||||||||||||||||||
| (in GWhs) |
December 31, |
September 30, |
June 30, |
March 31, |
December 31, |
|||||||||||||||
|
Supply |
||||||||||||||||||||
| Nuclear Generation |
||||||||||||||||||||
| Mid-Atlantic(a) |
11,974 | 12,076 | 11,691 | 11,776 | 11,137 | |||||||||||||||
| Midwest |
23,141 | 23,675 | 23,344 | 22,333 | 22,472 | |||||||||||||||
| Total Nuclear Generation |
35,115 | 35,751 | 35,035 | 34,109 | 33,609 | |||||||||||||||
| Fossil and Renewables |
||||||||||||||||||||
| Mid-Atlantic(b) |
2,115 | 2,582 | 2,175 | 2,564 | 1,986 | |||||||||||||||
| Midwest |
45 | 16 | 7 | – | – | |||||||||||||||
| South and West |
93 | 691 | 310 | 119 | 48 | |||||||||||||||
| Total Fossil and Renewables |
2,253 | 3,289 | 2,492 | 2,683 | 2,034 | |||||||||||||||
| Purchased Power |
||||||||||||||||||||
| Mid-Atlantic |
442 | 599 | 414 | 463 | 342 | |||||||||||||||
| Midwest |
1,776 | 1,774 | 1,568 | 1,914 | 1,991 | |||||||||||||||
| South and West |
2,632 | 4,084 | 2,695 | 2,701 | 2,851 | |||||||||||||||
| Total Purchased Power |
4,850 | 6,457 | 4,677 | 5,078 | 5,184 | |||||||||||||||
| Total Supply by Region |
||||||||||||||||||||
| Mid-Atlantic |
14,531 | 15,257 | 14,280 | 14,803 | 13,465 | |||||||||||||||
| Midwest |
24,962 | 25,465 | 24,919 | 24,247 | 24,463 | |||||||||||||||
| South and West |
2,725 | 4,775 | 3,005 | 2,820 | 2,899 | |||||||||||||||
| Total Supply |
42,218 | 45,497 | 42,204 | 41,870 | 40,827 | |||||||||||||||
| Three Months Ended | ||||||||||||||||||||
| (in GWhs) |
December 31, |
September 30, 2010 |
June 30, 2010 |
March 31, 2010 |
December 31, 2009 |
|||||||||||||||
| Electric Sales |
||||||||||||||||||||
| ComEd(c) |
– | – | 1,895 | 3,428 | 3,439 | |||||||||||||||
| PECO |
9,756 | 11,976 | 10,044 | 10,228 | 9,588 | |||||||||||||||
| Market and Retail(c) |
32,462 | 33,521 | 30,265 | 28,214 | 27,800 | |||||||||||||||
| Total Electric Sales(d),(e) |
42,218 | 45,497 | 42,204 | 41,870 | 40,827 | |||||||||||||||
|
Average Margin ($/MWh)(f),(g) |
||||||||||||||||||||
| Mid-Atlantic |
$51.75 | $36.97 | $40.83 | $41.41 | $43.15 | |||||||||||||||
| Midwest |
41.14 | 41.00 | 40.78 | 41.00 | 41.98 | |||||||||||||||
| South and West |
(10.64 | ) | (2.30 | ) | (14.31 | ) | (16.67 | ) | (14.49 | ) | ||||||||||
| Average Margin – Overall Portfolio |
41.45 | 35.11 | 36.87 | 37.26 | 38.36 | |||||||||||||||
| Around-the-clock Market Prices ($/MWh)(h) |
||||||||||||||||||||
| PJM West Hub |
$43.65 | $52.25 | $43.21 | $44.54 | $37.31 | |||||||||||||||
| NIHUB |
27.26 | 38.32 | 32.35 | 34.47 | 29.61 | |||||||||||||||
| ERCOT North Spark Spread |
(0.69 | ) | 8.25 | 1.52 | (0.02 | ) | (1.34 | ) | ||||||||||||
| (a) | Includes Generation’s proportionate share of the output of its nuclear generating plants, including Salem. |
| (b) | Includes New England generation. |
| (c) | ComEd line item represents sales under the 2006 ComEd Auction. Settlements of the ComEd swap and sales under the RFP are included within Market and Retail sales. In addition, renewable energy credit sales to affiliates have been included within Market and Retail sales. |
| (d) | Excludes retail gas activity, trading portfolio and other operating revenue. |
| (e) | Total sales do not include trading volume of 740 GWhs, 1,077 GWhs, 889 GWhs, 920 GWhs and 1,599 GWhs for the three months ended December 31, 2010, September 30, 2010, June 30, 2010, March 31, 2010 and December 31, 2009, respectively. |
| (f) | Excludes the mark-to-market impact of Generation’s economic hedging activities. |
| (g) | Results of transactions with PECO and ComEd are included in the Mid-Atlantic and Midwest regions, respectively. |
| (h) | Represents the average for the quarter. |
25
ComEd
Electric Sales Statistics, Revenue and Customer Detail
| 2010 | 2009 | |||||||
| Retail Deliveries(a) (in GWhs) |
||||||||
| Residential |
29,171 | 26,621 | ||||||
| Small Commercial & Industrial |
32,904 | 32,234 | ||||||
| Large Commercial & Industrial |
27,717 | 26,668 | ||||||
| Public Authorities & Electric Railroads |
1,273 | 1,237 | ||||||
| Total Retail Deliveries |
91,065 | 86,760 | ||||||
| Electric Revenue (in millions) |
||||||||
| Retail Revenues(a) |
||||||||
| Residential |
$ | 3,549 | $ | 3,115 | ||||
| Small Commercial & Industrial |
1,639 | 1,660 | ||||||
| Large Commercial & Industrial |
397 | 387 | ||||||
| Public Authorities & Electric Railroads |
62 | 57 | ||||||
| Total Retail Revenues |
5,647 | 5,219 | ||||||
| Other Revenues(b) |
557 | 555 | ||||||
| Total Electric Revenues |
$ | 6,204 | $ | 5,774 | ||||
| Customers at Year End |
||||||||
| 2010 | 2009 | |||||||
| Retail Deliveries Customers |
||||||||
| Residential |
3,438,677 | 3,425,570 | ||||||
| Small Commercial & Industrial |
363,393 | 360,779 | ||||||
| Large Commercial & Industrial |
2,005 | 1,985 | ||||||
| Public Authorities & Electric Railroads |
5,078 | 5,008 | ||||||
| Total Retail Deliveries Customers |
3,809,153 | 3,793,342 | ||||||
| Heating and Cooling Degree Days |
||||||||
| 2010 | 2009 | |||||||
| Heating Degree Days (normal=6,362) |
5,991 | 6,429 | ||||||
| Cooling Degree Days (normal=855) |
1,181 | 589 | ||||||
| Peak System Load |
||||||||
| 2010 | 2009 | |||||||
| Summer(c) |
||||||||
| Highest Peak Load (MW) |
21,914 | 21,218 | ||||||
| Winter(d) |
||||||||
| Highest Peak Load (MW) |
16,092 | 16,328 | ||||||
| (a) | Reflects delivery revenues and volumes from customers purchasing electricity directly from ComEd and customers purchasing electricity from a competitive electric generation supplier as all customers are assessed delivery charges. For customers purchasing electricity from ComEd, revenue also reflects the cost of energy. |
| (b) | Other revenue primarily includes transmission revenue from PJM Interconnection, LLC (PJM). |
| (c) | Summer is defined as June 1 to September 30 of the reporting year. |
| (d) | Winter is defined as November 1 of the previous year to March 31 of the reporting year. |
26
PECO
Electric Sales Statistics, Revenue and Customer Detail
| 2010 | 2009 | |||||||
| Retail Deliveries(a) (in GWhs) |
||||||||
| Residential |
13,913 | 12,893 | ||||||
| Small Commercial & Industrial |
8,503 | 8,397 | ||||||
| Large Commercial & Industrial |
16,372 | 15,848 | ||||||
| Public Authorities & Electric Railroads |
925 | 930 | ||||||
| Total Retail Deliveries |
39,713 | 38,068 | ||||||
| Electric Revenue (in millions) |
||||||||
| Retail Revenues(a) |
||||||||
| Residential |
$2,069 | $1,859 | ||||||
| Small Commercial & Industrial |
1,060 | 1,034 | ||||||
| Large Commercial & Industrial |
1,362 | 1,307 | ||||||
| Public Authorities & Electric Railroads |
89 | 90 | ||||||
| Total Retail Revenues |
4,580 | 4,290 | ||||||
| Other Revenues(b) |
255 | 259 | ||||||
| Total Electric Revenues |
$4,835 | $4,549 | ||||||
| Customers at Year End |
||||||||
| 2010 | 2009 | |||||||
| Retail Deliveries Customers |
||||||||
| Residential |
1,411,643 | 1,404,416 | ||||||
| Small Commercial & Industrial |
156,865 | 156,305 | ||||||
| Large Commercial & Industrial |
3,071 | 3,094 | ||||||
| Public Authorities & Electric Railroads |
1,102 | 1,085 | ||||||
| Total Retail Deliveries Customers |
1,572,681 | 1,564,900 | ||||||
| Heating and Cooling Degree Days |
||||||||
| 2010 | 2009 | |||||||
| Heating Degree Days (normal=4,638) |
4,396 | 4,534 | ||||||
| Cooling Degree Days (normal=1,292) |
1,817 | 1,246 | ||||||
| Peak System Load |
||||||||
| 2010 | 2009 | |||||||
| Summer(c) |
||||||||
| Highest Peak Load (MW) |
8,864 | 7,993 | ||||||
| Winter(d) |
||||||||
| Highest Peak Load (MW) |
6,333 | 6,728 | ||||||
| (a) | Reflects delivery revenues and volumes from customers purchasing electricity directly from PECO and customers purchasing electricity from a competitive electric generation supplier as all customers are assessed delivery charges and a CTC. For customers purchasing electricity from PECO, revenue also reflects the cost of energy. |
| (b) | Other revenue includes transmission revenue from PJM and wholesale revenues. |
| (c) | Summer is defined as June 1 to September 30 of the reporting year. |
| (d) | Winter is defined as November 1 of the previous year to March 31 of the reporting year. |
27
PECO
Gas Sales Statistics, Revenue and Customer Detail
| 2010 | 2009 | |||||||
| Deliveries to Customers (in mmcf) |
||||||||
| Retail Sales |
56,833 | 57,103 | ||||||
| Transportation |
30,911 | 27,206 | ||||||
| Total Gas Deliveries |
87,744 | 84,309 | ||||||
| Gas Revenue (in millions) |
||||||||
| Retail Sales |
$656 | $732 | ||||||
| Transportation and Other |
28 | 30 | ||||||
| Total Gas Revenue |
$684 | $762 | ||||||
| Gas Customers at Year End |
||||||||
| 2010 | 2009 | |||||||
| Customers |
||||||||
| Residential |
448,391 | 444,923 | ||||||
| Commercial & Industrial |
41,303 | 40,991 | ||||||
| Total Retail Customers |
489,694 | 485,914 | ||||||
| Transportation |
838 | 778 | ||||||
| Total Gas Customers |
490,532 | 486,692 | ||||||
| Gas Maximum Day Sendout |
||||||||
| 2010 | 2009 | |||||||
| Winter |
||||||||
| Maximum Day Sendout (in thousand cubic feet (mcf)) |
662,945 | 681,418 | ||||||
28