Attached files
| file | filename |
|---|---|
| 8-K - FORM 8-K - CVR ENERGY INC | y90841e8vk.htm |
Exhibit 99.1

| The following information contains forward-looking statements based on management’s current expectations and beliefs, as well as a number of assumptions concerning future events. These statements are subject to risks, uncertainties, assumptions and other important factors. You are cautioned not to put undue reliance on such forward-looking statements (including forecasts and projections regarding our future performance) because actual results may vary materially from those expressed or implied as a result of various factors, including, but not limited to (i) those set forth under “Risk Factors” in CVR Energy, Inc.’s Annual Report on Form 10-K, Quarterly Reports on Form 10-Q and any other filings CVR Energy, Inc. makes with the Securities and Exchange Commission, and (ii) those set forth under “Risk Factors” and “Cautionary Note Regarding Forward-Looking Statements” in the CVR Partners, LP Prospectus and any other filings CVR Partners, LP makes with the Securities and Exchange Commission. CVR Energy, Inc. assumes no obligation to, and expressly disclaims any obligation to, update or revise any forward-looking statements, whether as a result of new information, future events or otherwise. |
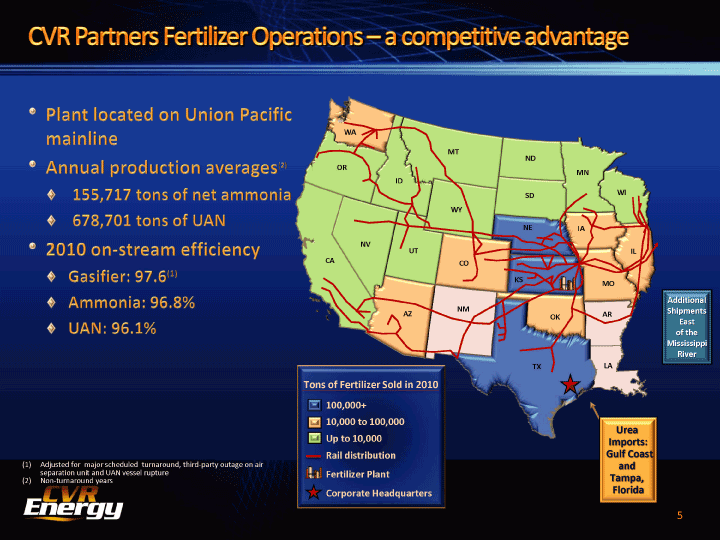
| WA MT ND OR MN ID WI SD WY NE IA NV UT IL CA CO KS MO Additional NM Shipments hipments ents AZ OK AR EastEasst of the Mississipp Mississippisipp River er TX LA Tons of Fertilizer Sold in 2010 100,000+ 10,000 to 100,000 Ureaa Up to 10,000 Im Imports:mporrts: mport : Rail distribution Gulf Gu ulf Coas Coaass Coast st (1) Adjusted for major scheduled turnaround, third-party outage on air andd separation unit and UAN vessel rupture Fertilizer Plant (2) Non-turnaround years Tampa Tampa, Tamppa a, Corporate Headquarters Florida daa 5 |
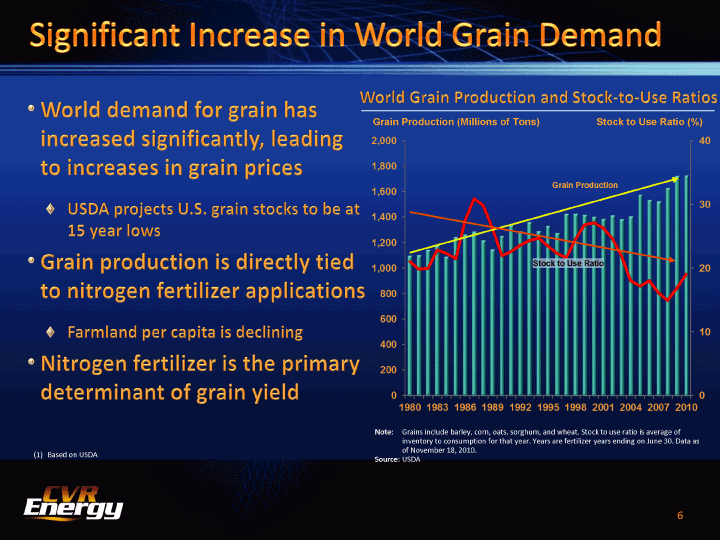
| Grain Production (Millions of Tons) ()Stock to Use Ratio (%) Grain Production Stock to Use Ratio Note: Grains include barley, corn, oats, sorghum, and wheat. Stock to use ratio is average of inventory to consumption for that year. Years are fertilizer years ending on June 30. Data as of November 18, 2010. (1) Based on USDA Source: USDA 6 |
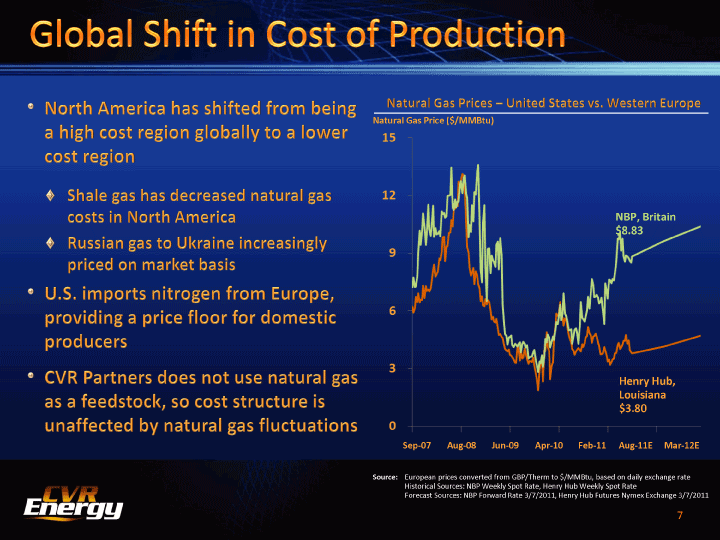
| Natural Gas Price ($/MMBtu) NBP, Britain $8.83 Henry Hub, Louisiana $3.80 Sep-07 Aug-08 Jun-09 Apr-10 Feb-11 Aug-11E Mar-12E Source: European prices converted from GBP/Therm to $/MMBtu, based on daily exchange rate Historical Sources: NBP Weekly Spot Rate, Henry Hub Weekly Spot Rate Forecast Sources: NBP Forward Rate 3/7/2011, Henry Hub Futures Nymex Exchange 3/7/2011 7 |
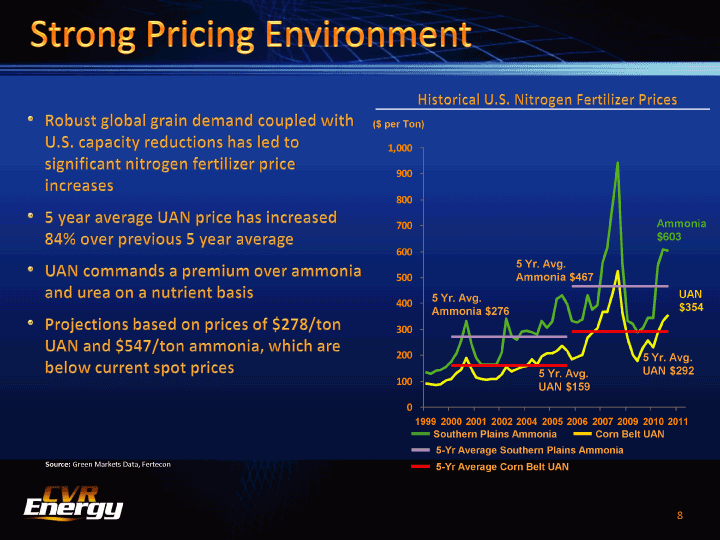
| ($ per Ton) 1,000 900 800 700Ammonia $603 600 5 Yr. Avg. 500Ammonia $467 5 Yr. Avg. UAN 400$354 Ammonia $276 300 2005 Yr. Avg. 5 Yr. Avg. UAN $292 100UAN $159 0 1999 2000 2001 2002 2004 2005 2006 2007 2009 2010 2011 Southern Plains Ammonia Corn Belt UAN 5-Yr Average Southern Plains Ammonia Source: Green Markets Data, Fertecon 5-Yr Average Corn Belt UAN 8 |
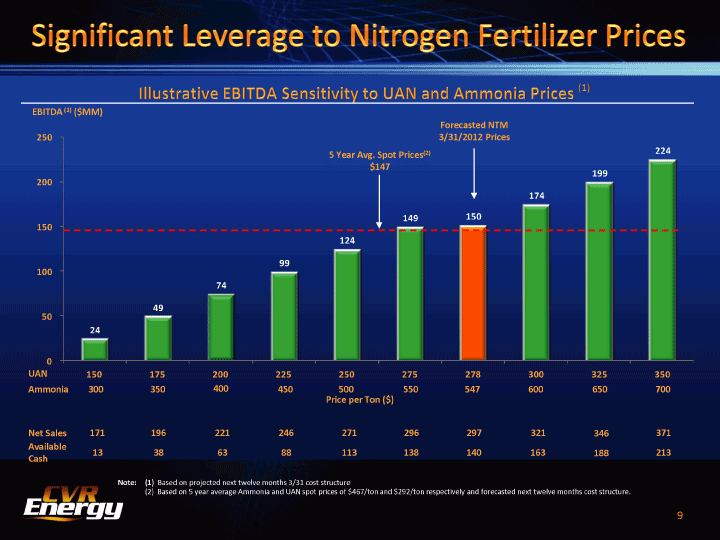
| EBITDA (1) ($MM) Forecasted NTM 2503/31/2012 Prices 224 5 Year Avg. Spot Prices(2) $147 199 200 174 149150 150 124 99 100 74 49 50 24 0 UAN 150 175 200 225 250 275 278 300 325 350 Ammonia 300 350 400 450 500 550 547 600 650 700 Price per Ton ($) Net Sales 171 196 221 246 271 296 297 321 346 371 Available 13 38 63 88 113 138 140 163 188 213 Cash Note: (1) Based on projected next twelve months 3/31 cost structure (2) Based on 5 year average Ammonia and UAN spot prices of $467/ton and $292/ton respectively and forecasted next twelve months cost structure. 9 |
| •Benefit from PADD II Group 3 location •WTI crude advantaged feedstocks •Feedstock supported by owned crude gathering and pipeline systems 10 |
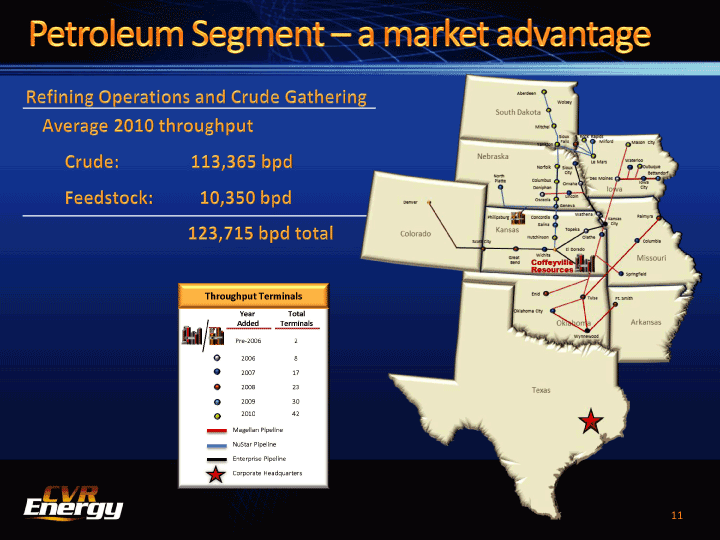
| Throughput Terminals YearTotal Added Terminals Pre-2006 2 2006 8 2007 17 2008 23 2009 30 2010 42 Magellan Pipeline NuStar Pipeline Enterprise Pipeline Corporate Headquarters 11 |
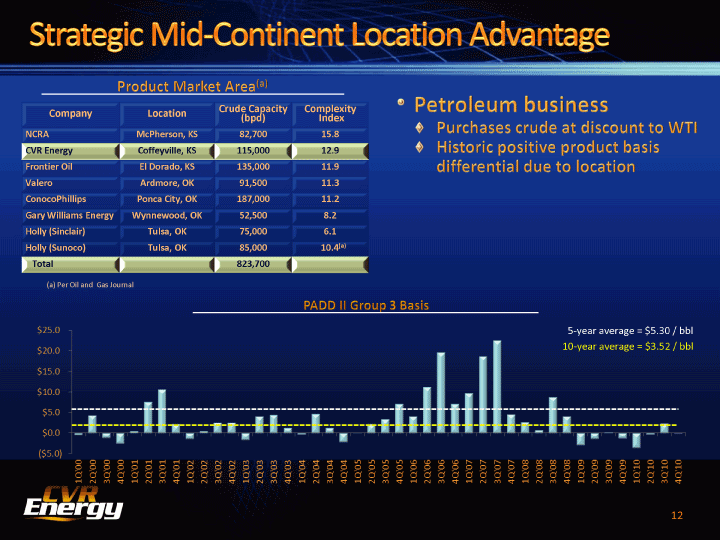
| Crude Capacity Complexity Company Location (bpd) Index NCRA McPherson, KS 82,700 15.8 CVR Energy Coffeyville, KS 115,000 12.9 Frontier Oil El Dorado, KS 135,000 11.9 Valero Ardmore, OK 91,500 11.3 ConocoPhillips Ponca City, OK 187,000 11.2 Gary Williams Energy Wynnewood, OK 52,500 8.2 Holly (Sinclair) Tulsa, OK 75,000 6.1 Holly (Sunoco) Tulsa, OK 85,000 10.4(a) Total823,700 (a) Per Oil and Gas Journal 5-year average = $5.30 / bbl 10-year average = $3.52 / bbl 12 |
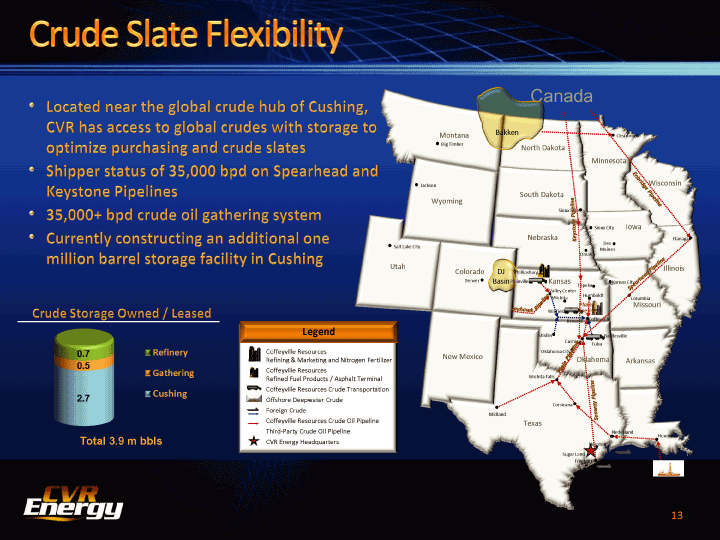
| CanadaCa Bakken Montana Clearbrook Big Timber North DakotaD Minnesota Jackson Wisconsin South Dakota Wyoming Sioux Falls Sioux City Iowa Nebraska Flanagan Des Salt Lake City Moines Omaha Utah Illinois Colorado DJ PhillipsburgP Denver Basin Pllaa PlainvilleiKansas Kansas City Topeka Valley Center Humboldt Wichita Columbia Plains Missourisouri Winfield Pipeline Broome Coffeyville Legend Shidler Bartlesville Cushing Tulsa Coffeyville Resources Oklahoma City New Mexico Oklahoma Refining & Marketing and Nitrogen Fertilizer Arkansas Coffeyville Resources Refined Fuel Products / Asphalt Terminal Wichita Falls Coffeyville Resources Crude Transportation Offshore Deepwater Crude Corsicana LouisianaLo Louisianna Foreign Crude Midland Coffeyville Resources Crude Oil Pipeline Texas Third-Party Crude Oil Pipeline Nederland Houma Total Total 3.9 m bbls bbls CVR Energy HeadquartersHouston Sugar Land Freeport 13 |
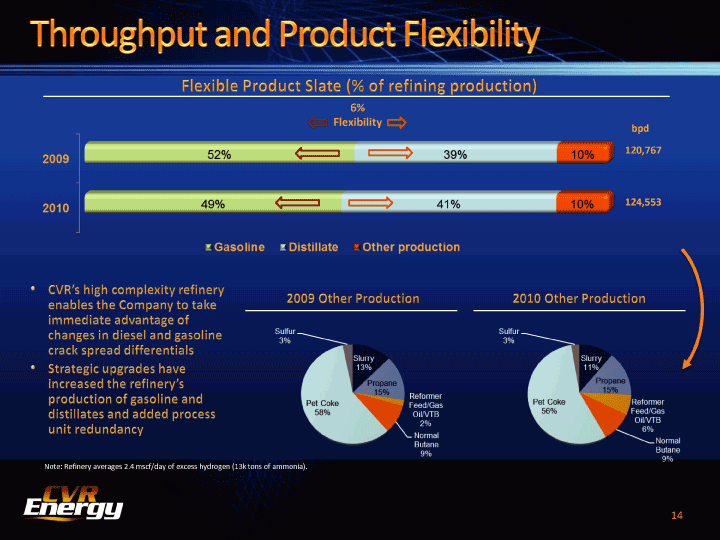
| 6% Flexibility bpd 120,767 124,553 Note: Refinery averages 2.4 mscf/day of excess hydrogen (13k k tons of ammonia). 14 |
| 15 |
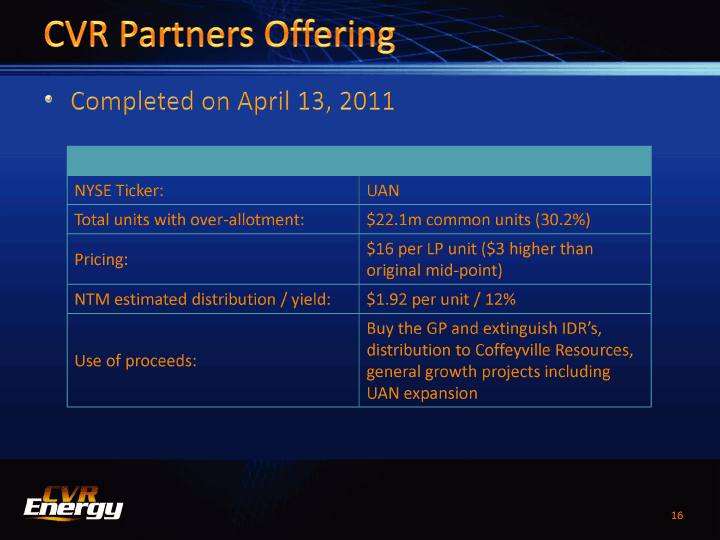
| NYSE Ticker: UAN Total units with over-allotment: $22.1m common units (30.2%) $16 per LP unit ($3 higher than Pricing: original mid-point) NTM estimated distribution / yield: $1.92 per unit / 12% Buy the GP and extinguish IDR’s, distribution to Coffeyville Resources, Use of proceeds: general growth projects including UAN expansion 16 |
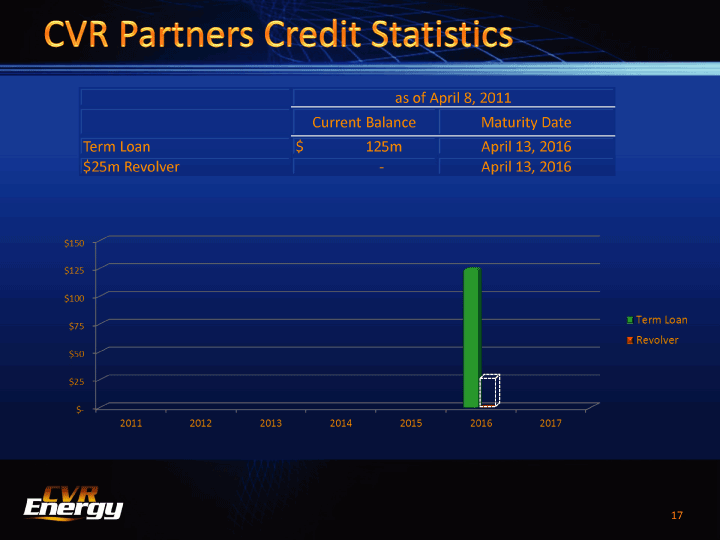
| as of April 8, 2011 Current Balance Maturity Date Term Loan $125m April 13, 2016 $25m Revolver -April 13, 2016 17 |
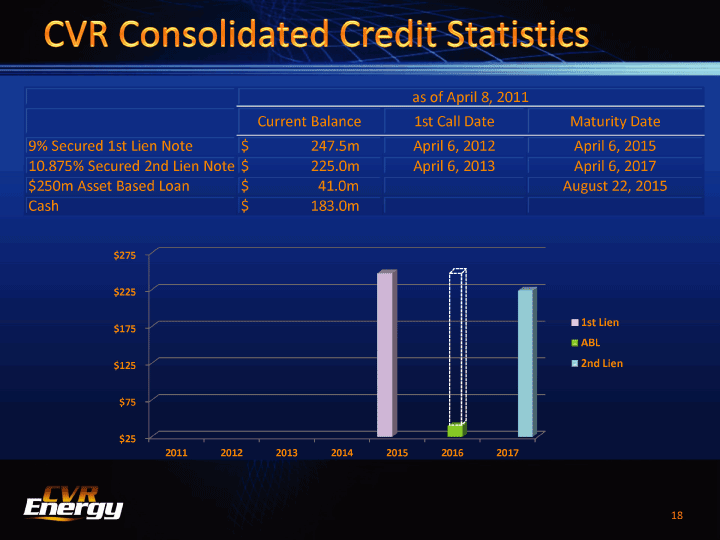
| as of April 8, 2011 Current Balance 1st Call Date Maturity Date 9% Secured 1st Lien Note $247.5m April 6, 2012 April 6, 2015 10.875% Secured 2nd Lien Note $225.0m April 6, 2013 April 6, 2017 $250m Asset Based Loan $41.0m August 22, 2015 Cash $183.0m$275 $225 1st Lien $175 ABL $1252nd Lien $75 $25 2011201220132014201520162017 18 |
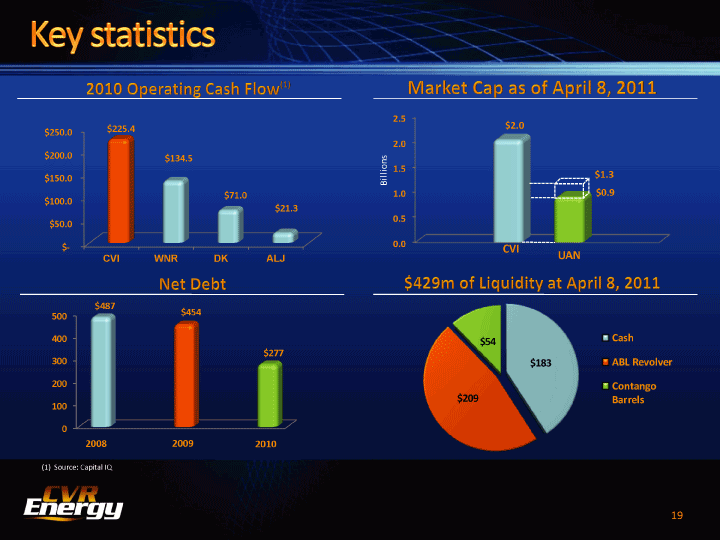
| 2.5 $225.4$2.0 $250.0 2.0 $200.0 $134.5 Billions 1.5 $150.0$1.3 $71.01.0$0.9 $100.0 $21.3 0.5 $50.0 $-0.0 CVI CVI WNR DK ALJUAN $487 $454 500 400$54Cash $277 300$183ABL Revolver 200Contango $209Barrels 100 0 2008 2009 2010 (1) Source: Capital IQ 19 |

| 20 |
