Attached files
| file | filename |
|---|---|
| 8-K - FORM 8-K - JPMORGAN CHASE & CO | y90818e8vk.htm |
Exhibit 99.1
| Exhibit99.11Q11April13,2011 |
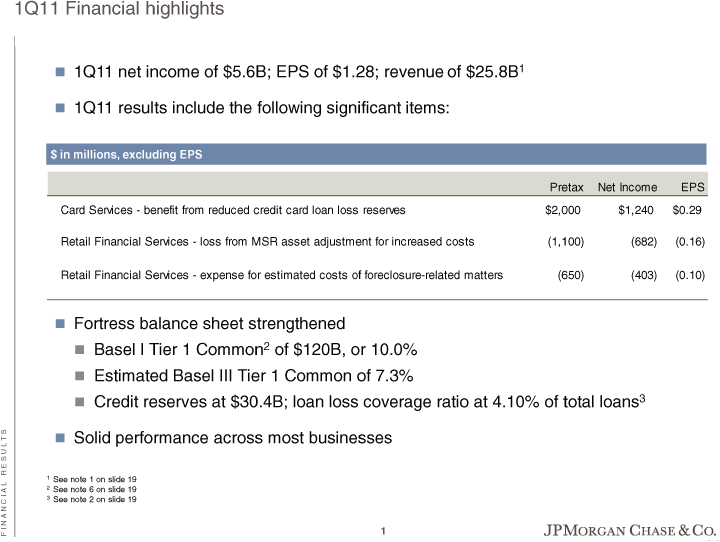
| 1Q11Financialhighlights 1Q11netincomeof$5.6B;EPSof$1.28;revenueof$25.8B1 1Q11resultsincludethefollowingsignificantitems:$inmillions,excludingEPSPretaxNetIncomeEPSCardService s-benefitfromreducedcreditcardloanlossreserves$2,000$1,240$0.29RetailFinancialServices-lossfromMSRas setadjustmentforincreasedcosts(1,100)(682)(0.16)RetailFinancialServices-expenseforestimatedcostsoffo reclosure-relatedmatters(650)(403)(0.10) Fortressbalancesheetstrengthened BaselITier1Common2of$120B,or10.0% EstimatedBaselIIITier1Commonof7.3% Creditreservesat$30.4B;loanlosscoverageratioat4.10%oftotalloans3RESULTS Solidperformanceacrossmostbusinesses1Seenote1onslide192Seenote6onslide19 3Seenote2onslide19FINANCIAL1 |
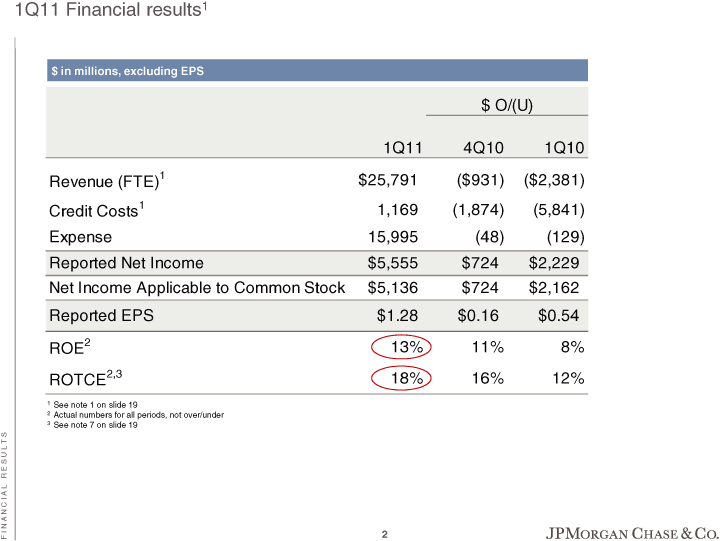
| 1Q11Financialresults1$inmillions,excludingEPS$O/(U)1Q114Q101Q10Revenue(FTE)1 $25,791($931)($2,381)CreditCosts1 1,169(1,874)(5,841)Expense15,995(48)(129)ReportedNetIncome$5,555$724$2,229NetIncomeApplicabletoCommo nStock$5,136$724$2,162ReportedEPS$1.28$0.16$0.54ROE213%11%8%ROTCE2,3 18%16%12%1Seenote1onslide192Actualnumbersforallperiods,notover/under 3Seenote7onslide19RESULTSFINANCIAL2 |
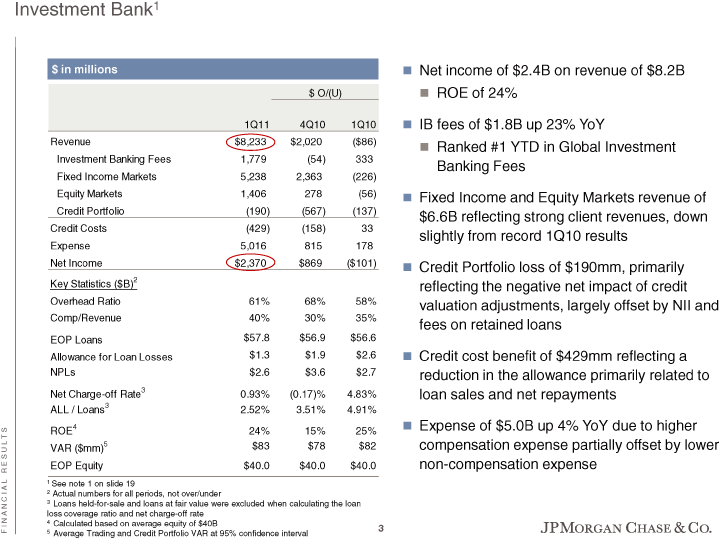
| Investment Bank1$ in millions 3 Net income of $2.4B on revenue of $8.2B $ O/(U) 3 ROE of 24%1Q11 4Q10 1Q10 3 IB fees of $1.8B up 23% YoY Revenue $8,233 $2,020 ($86)3 Ranked #1 YTD in Global Investment Investment Banking Fees 1,779 (54) 333Banking FeesFixed Income Markets 5,238 2,363 (226)Equity Markets 1,406 278 (56) 3 Fixed Income and Equity Markets revenue of Credit Portfolio (190) (567) (137)$6.6B reflecting strong client revenues, down Credit Costs (429) (158) 33slightly from record 1Q10 resultsExpense 5,016 815 178Net Income $2,370 $869 ($101) 3 Credit Portfolio loss of $190mm, primarily Key Statistics ($B)2 reflecting the negative net impact of credit Overhead Ratio 61% 68% 58% valuation adjustments, largely offset by NII and Comp/Revenue 40% 30% 35%fees on retained loansEOP Loans $57.8 $56.9 $56.6 Allowance for Loan Losses $1.3 $1.9 $2.6 3 Credit cost benefit of $429mm reflecting a NPLs $2.6 $3.6 $2.7 reduction in the allowance primarily related to Net Charge-off Rate3 0.93% (0.17)% 4.83% loan sales and net repayments ALL / Loans3 2.52% 3.51% 4.91%3 Expense of $5.0B up 4% YoY due to higher ROE4 24% 15% 25%VAR ($mm)5 $83 $78 $82 compensation expense partially offset by lower R E S U L T S EOP Equity $40.0 $40.0 $40.0 non-compensation expense1 See note 1 on slide 192 Actual numbers for all periods, not over/under3Loans held-for-sale and loans at fair value were excluded when calculating the loan loss coverage ratio and net charge-off rate4 Calculated based on average equity of $40B F I N A N C I A L 35 Average Trading and Credit Portfolio VAR at 95% confidence interval |
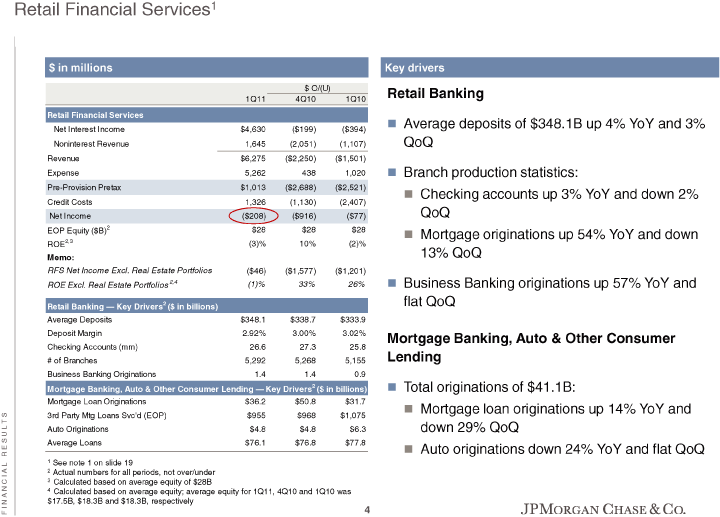
| RetailFinancialServices1 $inmillionsKeydrivers$O/(U)RetailBanking1Q114Q101Q10RetailFinancialServices Averagedepositsof$348.1Bup4%YoYand3%NetInterestIncome$4,630($199)($394)NoninterestRevenue1,645(2,051 )(1,107)QoQRevenue$6,275($2,250)($1,501)Expense5,2624381,020 Branchproductionstatistics:Pre-ProvisionPretax$1,013($2,688)($2,521) Checkingaccountsup3%YoYanddown2%CreditCosts1,326(1,130)(2,407)NetIncome($208)($916)($77)QoQEOPEquity ($B)2$28$28$28 Mortgageoriginationsup54%YoYanddownROE2,3 (3)%10%(2)%Memo:13%QoQRFSNetIncomeExcl.RealEstatePortfolios($46)($1,577)($1,201)ROEExcl.RealEstatePo rtfolios2,4(1)%33%26% BusinessBankingoriginationsup57%YoYandflatQoQRetailBanking—KeyDrivers2 ($inbillions)AverageDeposits$348.1$338.7$333.9DepositMargin2.92%3.00%3.02%MortgageBanking,Auto&Other ConsumerCheckingAccounts(mm)26.627.325.8#ofBranches5,2925,2685,155LendingBusinessBankingOriginations 1.41.40.9MortgageBanking,Auto&OtherConsumerLending—KeyDrivers2($inbillions) Totaloriginationsof$41.1B:MortgageLoanOriginations$36.2$50.8$31.7 Mortgageloanoriginationsup14%YoYand3rdPartyMtgLoansSvc’d(EOP)$955$968$1,075AutoOriginations$4.8$4.8$ 6.3down29%QoQAverageLoans$76.1$76.8$77.8RESULTS Autooriginationsdown24%YoYandflatQoQ1Seenote1onslide192 Actualnumbersforallperiods,notover/under3Calculatedbasedonaverageequityof$28B4 Calculatedbasedonaverageequity;averageequityfor1Q11,4Q10and1Q10was$17.5B,$18.3Band$18.3B,respectivel yFINANCIAL4 |
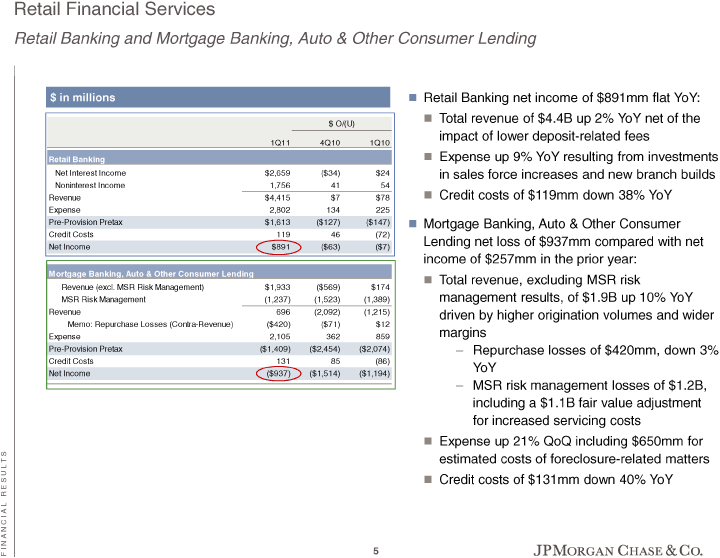
| RetailFinancialServicesRetailBankingandMortgageBanking,Auto&OtherConsumerLending$inmillions RetailBankingnetincomeof$891mmflatYoY: Totalrevenueof$4.4Bup2%YoYnetofthe$O/(U)impactoflowerdeposit-relatedfees1Q114Q101Q10RetailBanking Expenseup9%YoYresultingfrominvestmentsNetInterestIncome$2,659($34)$24insalesforceincreasesandnewbran chbuildsNoninterestIncome1,7564154Revenue$4,415$7$78 Creditcostsof$119mmdown38%YoYExpense2,802134225Pre-ProvisionPretax$1,613($127)($147) MortgageBanking,Auto&OtherConsumerCreditCosts11946(72)Lendingnetlossof$937mmcomparedwithnetNetIncome $891($63)($7)incomeof$257mmintheprioryear:MortgageBanking,Auto&OtherConsumerLending Totalrevenue,excludingMSRriskRevenue(excl.MSRRiskManagement)$1,933($569)$174MSRRiskManagement(1,237) (1,523)(1,389)managementresults,of$1.9Bup10%YoYRevenue696(2,092)(1,215)drivenbyhigheroriginationvolu mesandwiderMemo:RepurchaseLosses(Contra-Revenue)($420)($71)$12Expense2,105362859marginsPre-Provision Pretax($1,409)($2,454)($2,074)—Repurchaselossesof$420mm,down3%CreditCosts13185(86)YoYNetIncome($937 )($1,514)($1,194)—MSRriskmanagementlossesof$1.2B,includinga$1.1Bfairvalueadjustmentforincreasedserv icingcosts Expenseup21%QoQincluding$650mmforestimatedcostsofforeclosure-relatedmattersRESULTS Creditcostsof$131mmdown40%YoYFINANCIAL5 |
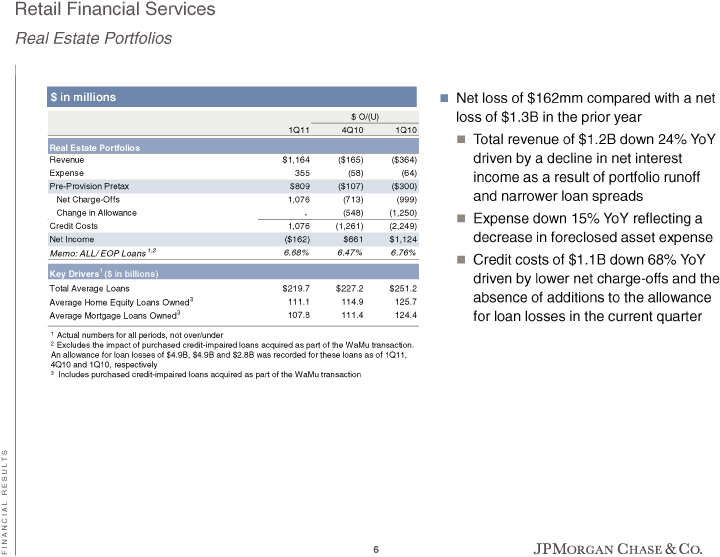
| RetailFinancialServicesRealEstatePortfolios$inmillions Netlossof$162mmcomparedwithanet$O/(U)lossof$1.3Bintheprioryear1Q114Q101Q10 Totalrevenueof$1.2Bdown24%YoYRealEstatePortfoliosRevenue$1,164($165)($364)drivenbyadeclineinnetinter estExpense355(58)(64)incomeasaresultofportfoliorunoffPre-ProvisionPretax$809($107)($300)NetCharge-Of fs1,076(713)(999)andnarrowerloanspreadsChangeinAllowance-(548)(1,250) Expensedown15%YoYreflectingaCreditCosts1,076(1,261)(2,249)NetIncome($162)$661$1,124decreaseinforeclo sedassetexpenseMemo:ALL/EOPLoans1,26.68%6.47%6.76% Creditcostsof$1.1Bdown68%YoY1KeyDrivers($inbillions)drivenbylowernetcharge-offsandtheTotalAverageLoa ns$219.7$227.2$251.2111.1114.9125.7absenceofadditionstotheallowanceAverageHomeEquityLoansOwned 3AverageMortgageLoansOwned3107.8111.4124.4forloanlossesinthecurrentquarter 1Actualnumbersforallperiods,notover/under2 Excludestheimpactofpurchasedcredit-impairedloansacquiredaspartoftheWaMutransaction.Anallowanceforloa nlossesof$4.9B,$4.9Band$2.8Bwasrecordedfortheseloansasof1Q11,4Q10and1Q10,respectively3 Includespurchasedcredit-impairedloansacquiredaspartoftheWaMutransactionRESULTSFINANCIAL6 |
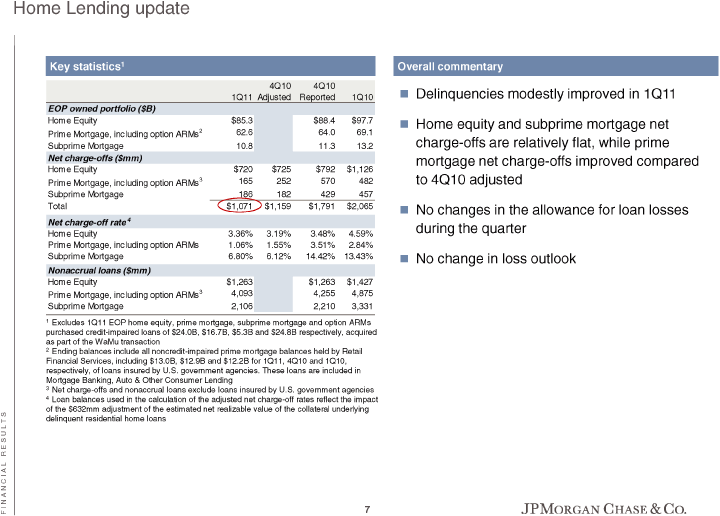
| HomeLendingupdateKeystatistics1Overallcommentary4Q104Q101Q11AdjustedReported1Q10 Delinquenciesmodestlyimprovedin1Q11EOPownedportfolio($B)HomeEquity$85.3$88.4$97.7 HomeequityandsubprimemortgagenetPrimeMortgage,includingoptionARMs2 62.664.069.1SubprimeMortgage10.811.313.2charge-offsarerelativelyflat,whileprimeNetcharge-offs($mm)mo rtgagenetcharge-offsimprovedcomparedHomeEquity$720$725$792$1,126PrimeMortgage,includingoptionARMs3165252570482to4Q10adjustedSubprimeMortgage186182429457Total$1,071$1,159$1,791$2,065 NochangesintheallowanceforloanlossesNetcharge-offrate4 duringthequarterHomeEquity3.36%3.19%3.48%4.59%PrimeMortgage,includingoptionARMs1.06%1.55%3.51%2.84%S ubprimeMortgage6.80%6.12%14.42%13.43% NochangeinlossoutlookNonaccrualloans($mm)HomeEquity$1,263$1,263$1,427PrimeMortgage,includingoptionAR Ms34,0934,2554,875SubprimeMortgage2,1062,2103,3311 Excludes1Q11EOPhomeequity,primemortgage,subprimemortgageandoptionARMspurchasedcredit-impairedloansof $24.0B,$16.7B,$5.3Band$24.8Brespectively,acquiredaspartoftheWaMutransaction2 Endingbalancesincludeallnoncredit-impairedprimemortgagebalancesheldbyRetailFinancialServices,includi ng$13.0B,$12.9Band$12.2Bfor1Q11,4Q10and1Q10,respectively,ofloansinsuredbyU.S.governmentagencies.Thes eloansareincludedinMortgageBanking,Auto&OtherConsumerLending3 Netcharge-offsandnonaccrualloansexcludeloansinsuredbyU.S.governmentagencies4 Loanbalancesusedinthecalculationoftheadjustednetcharge-offratesreflecttheimpactofthe$632mmadjustment oftheestimatednetrealizablevalueofthecollateralunderlyingRESULTSdelinquentresidentialhomeloansFINANC IAL7 |
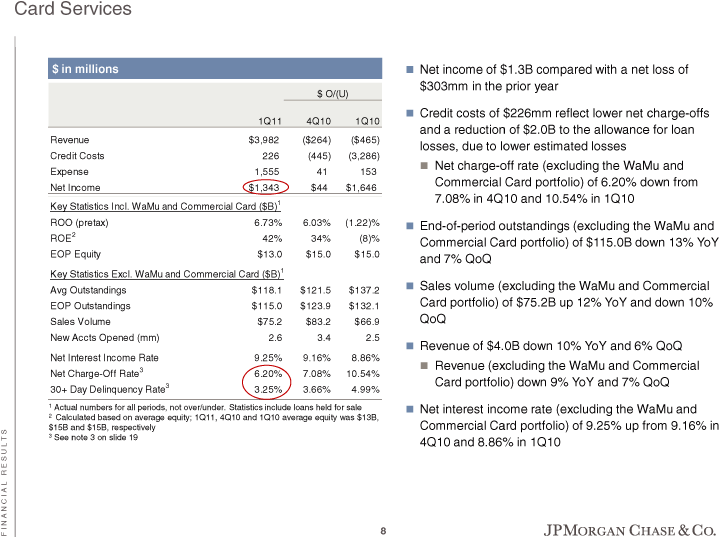
| CardServices$inmillions Netincomeof$1.3Bcomparedwithanetlossof$303mmintheprioryear$O/(U) Creditcostsof$226mmreflectlowernetcharge-offs1Q114Q101Q10andareductionof$2.0BtotheallowanceforloanRe venue$3,982($264)($465)losses,duetolowerestimatedlossesCreditCosts226(445)(3,286) Netcharge-offrate(excludingtheWaMuandExpense1,55541153CommercialCardportfolio)of6.20%downfromNetInco me$1,343$44$1,6467.08%in4Q10and10.54%in1Q10KeyStatisticsIncl.WaMuandCommercialCard($B)1 ROO(pretax)6.73%6.03%(1.22)% End-of-periodoutstandings(excludingtheWaMuandROE 2 42%34%(8)%CommercialCardportfolio)of$115.0Bdown13%YoYEOPEquity$13.0$15.0$15.0and7%QoQKeyStatisticsEx cl.WaMuandCommercialCard($B)1 Salesvolume(excludingtheWaMuandCommercialAvgOutstandings$118.1$121.5$137.2EOPOutstandings$115.0$123. 9$132.1Cardportfolio)of$75.2Bup12%YoYanddown10%SalesVolume$75.2$83.2$66.9QoQNewAcctsOpened(mm)2.63.4 2.5 Revenueof$4.0Bdown10%YoYand6%QoQNetInterestIncomeRate9.25%9.16%8.86% Revenue(excludingtheWaMuandCommercialNetCharge-OffRate3 6.20%7.08%10.54%Cardportfolio)down9%YoYand7%QoQ30+DayDelinquencyRate33.25%3.66%4.99% 1Actualnumbersforallperiods,notover/under.Statisticsincludeloansheldforsale Netinterestincomerate(excludingtheWaMuand2 Calculatedbasedonaverageequity;1Q11,4Q10and1Q10averageequitywas$13B,$15Band$15B,respectivelyCommerci alCardportfolio)of9.25%upfrom9.16%in3 Seenote3onslide19RESULTS4Q10and8.86%in1Q10FINANCIAL8 |
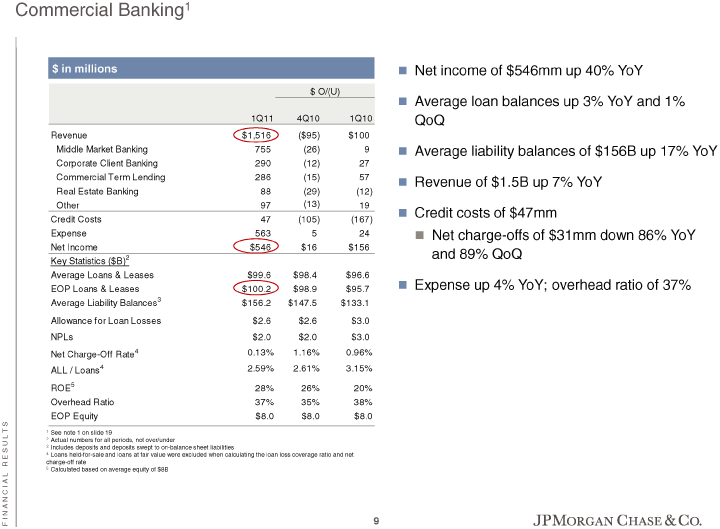
| CommercialBanking1$inmillions Netincomeof$546mmup40%YoY$O/(U) Averageloanbalancesup3%YoYand1%1Q114Q101Q10QoQRevenue$1,516($95)$100MiddleMarketBanking755(26)9 Averageliabilitybalancesof$156Bup17%YoYCorporateClientBanking290(12)27CommercialTermLending286(15)57 Revenueof$1.5Bup7%YoY RealEstateBanking88(29)(12)Other97(13)19 Creditcostsof$47mmCreditCosts47(105)(167)Expense563524 Netcharge-offsof$31mmdown86%YoYNetIncome$546$16$156and89%QoQKeyStatistics($B)2 AverageLoans&Leases$99.6$98.4$96.6EOPLoans&Leases$100.2$98.9$95.7 Expenseup4%YoY;overheadratioof37%AverageLiabilityBalances3 $156.2$147.5$133.1AllowanceforLoanLosses$2.6$2.6$3.0NPLs$2.0$2.0$3.0NetCharge-OffRate4 0.13%1.16%0.96%ALL/Loans42.59%2.61%3.15%ROE5 28%26%20%OverheadRatio37%35%38%EOPEquity$8.0$8.0$8.01Seenote1onslide192 Actualnumbersforallperiods,notover/under3 Includesdepositsanddepositsswepttoon-balancesheetliabilities4 Loansheld-for-saleandloansatfairvaluewereexcludedwhencalculatingtheloanlosscoverageratioandnetRESULT Scharge-offrate5Calculatedbasedonaverageequityof$8BFINANCIAL9 |
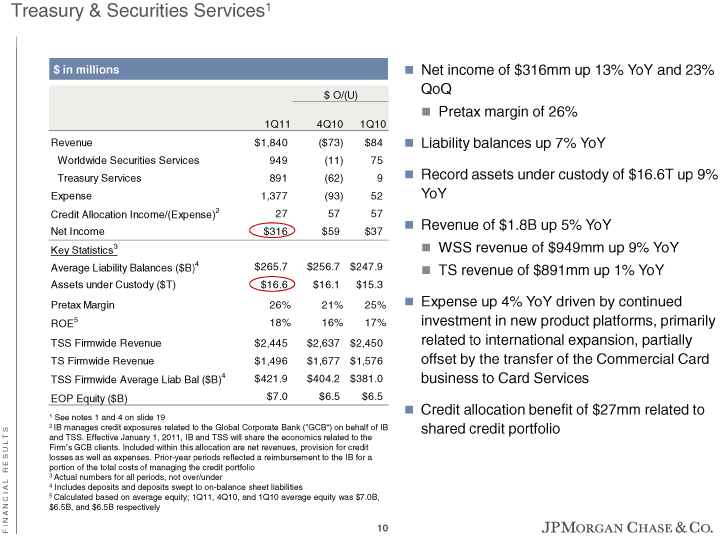
| Treasury&SecuritiesServices1$inmillions Netincomeof$316mmup13%YoYand23%QoQ$O/(U) Pretaxmarginof26%1Q114Q101Q10Revenue$1,840($73)$84 Liabilitybalancesup7%YoYWorldwideSecuritiesServices949(11)75TreasuryServices891(62)9 Recordassetsundercustodyof$16.6Tup9%Expense1,377(93)52YoYCreditAllocationIncome/(Expense) 2275757 Revenueof$1.8Bup5%YoYNetIncome$316$59$373 WSSrevenueof$949mmup9%YoYKeyStatisticsAverageLiabilityBalances($B)4 $265.7$256.7$247.9 TSrevenueof$891mmup1%YoYAssetsunderCustody($T)$16.6$16.1$15.3PretaxMargin26%21%25% Expenseup4%YoYdrivenbycontinuedROE5 18%16%17%investmentinnewproductplatforms,primarilyTSSFirmwideRevenue$2,445$2,637$2,450relatedtointer nationalexpansion,partiallyTSFirmwideRevenue$1,496$1,677$1,576offsetbythetransferoftheCommercialCard TSSFirmwideAverageLiabBal($B)4 $421.9$404.2$381.0businesstoCardServicesEOPEquity($B)$7.0$6.5$6.5 Creditallocationbenefitof$27mmrelatedto1Seenotes1and4onslide192 IBmanagescreditexposuresrelatedtotheGlobalCorporateBank(“GCB”)onbehalfofIBsharedcreditportfolioandTS S.EffectiveJanuary1,2011,IBandTSSwillsharetheeconomicsrelatedtotheFirm’sGCBclients.Includedwithinthi sallocationarenetrevenues,provisionforcreditlossesaswellasexpenses.Prior-yearperiodsreflectedareimbu rsementtotheIBforaRESULTSportionofthetotalcostsofmanagingthecreditportfolio3 Actualnumbersforallperiods,notover/under4 Includesdepositsanddepositsswepttoon-balancesheetliabilities5 Calculatedbasedonaverageequity;1Q11,4Q10,and1Q10averageequitywas$7.0B,$6.5B,and$6.5BrespectivelyFINA NCIAL10 |
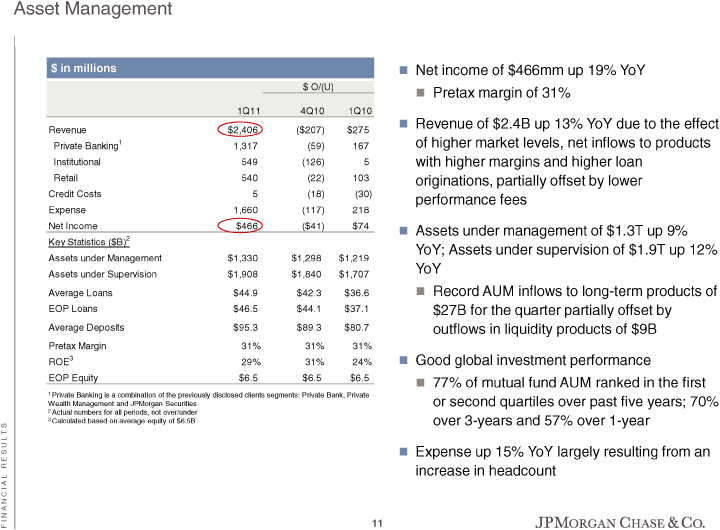
| AssetManagement$inmillions Netincomeof$466mmup19%YoY$O/(U) Pretaxmarginof31%1Q114Q101Q10 Revenueof$2.4Bup13%YoYduetotheeffectRevenue$2,406($207)$275PrivateBanking1 1,317(59)167ofhighermarketlevels,netinflowstoproductsInstitutional549(126)5withhighermarginsandhighe rloanRetail540(22)103originations,partiallyoffsetbylowerCreditCosts5(18)(30)performancefeesExpense1, 660(117)218NetIncome$466($41)$74Assetsundermanagementof$ 1.3Tup9%KeyStatistics($B)2 YoY;Assetsundersupervisionof$1.9Tup12%AssetsunderManagement$1,330$1,298$1,219YoYAssetsunderSupervisi on$1,908$1,840$1,707AverageLoans$44.9$42.3$36.6 RecordAUMinflowstolong-termproductsofEOPLoans$46.5$44.1$37.1$27BforthequarterpartiallyoffsetbyAverag eDeposits$95.3$89.3$80.7outflowsinliquidityproductsof$9BPretaxMargin31%31%31%ROE3 29%31%24% GoodglobalinvestmentperformanceEOPEquity$6.5$6.5$6.577%ofmutualfundAUMrankedinthefirst 1 PrivateBankingisacombinationofthepreviouslydisclosedclientssegments:PrivateBank,PrivateWealthManagem entandJPMorganSecuritiesorsecondquartilesoverpastfiveyears;70%2 Actualnumbersforallperiods,notover/under3 Calculatedbasedonaverageequityof$6.5Bover3-yearsand57%over1-yearSTLUS Expenseup15%YoYlargelyresultingfromanERincreaseinheadcountLAICNANI11F |
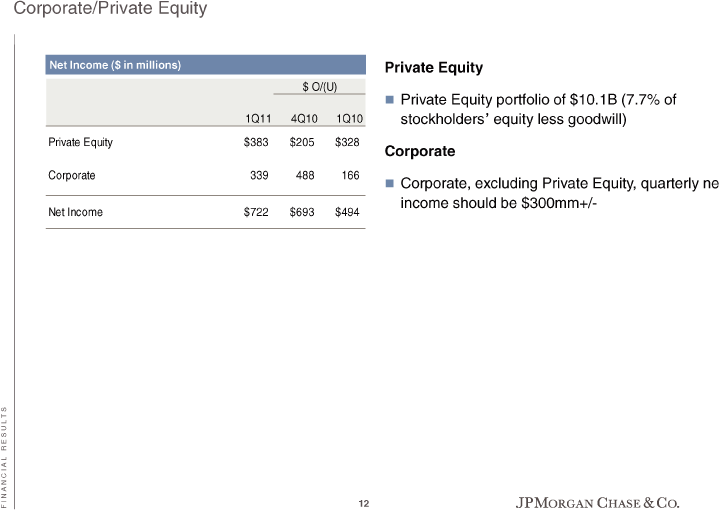
| Corporate/PrivateEquityNetIncome($inmillions)PrivateEquity$O/(U) PrivateEquityportfolioof$10.1B(7.7%of1Q114Q101Q10stockholders’equitylessgoodwill)PrivateEquity$383$2 05$328CorporateCorporate339488166 Corporate,excludingPrivateEquity,quarterlynetincomeshouldbe$300mm+/-NetIncome$722$693$494RESULTSFINA NCIAL12 |
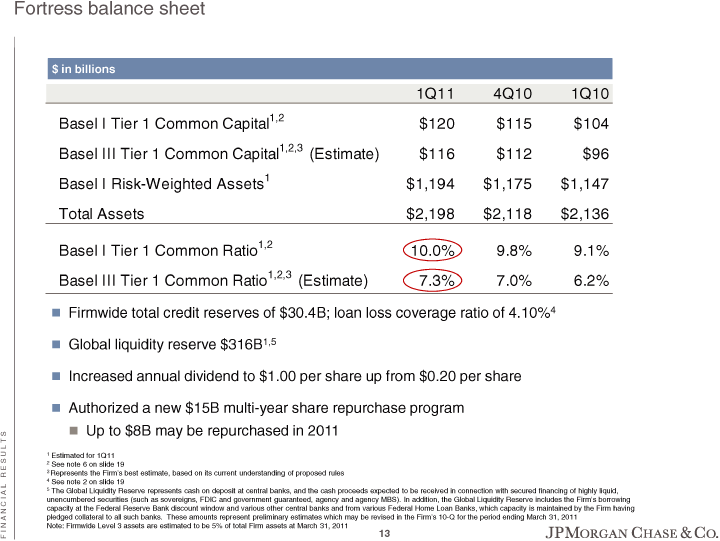
| Fortressbalancesheet$,2$120$115$104BaselIIITier1CommonCapital1,2,3 (Estimate)$116$112$96BaselIRisk-$1,194$1,175$1,147TotalAssets$2,198$2,118$2,1361,2BaselITier1CommonR atio10.0%9.8%9.1%BaselIIITier1CommonRatio1,2,3(Estimate)7.3%7.0%6.2% Firmwidetotalcreditreservesof$30.4B;loanlosscoverageratioof4.10%4 Globalliquidityreserve$316B1,5 Increasedannualdividendto$1.00pershareupfrom$0.20pershare Authorizedanew$15Bmulti-yearsharerepurchaseprogramS Upto$8Bmayberepurchasedin2011TLU1Estimatedfor1Q11S2Seenote6onslide19ER 3RepresentstheFirm’sbestestimate,basedonitscurrentunderstandingofproposedrules4 Seenote2onslide19LA5 TheGlobalLiquidityReserverepresentscashondepositatcentralbanks,andthecashproceedsexpectedtobereceive dinconnectionwithsecuredfinancingofhighlyliquid,Iunencumberedsecurities(suchassovereigns,FDICandgove rnmentguaranteed,agencyandagencyMBS).Inaddition,theGlobalLiquidityReserveincludestheFirm’sborrowingC capacityattheFederalReserveBankdiscountwindowandvariousothercentralbanksandfromvariousFederalHomeLoa nBanks,whichcapacityismaintainedbytheFirmhavingNApledgedcollateraltoallsuchbanks.Theseamountsreprese ntpreliminaryestimateswhichmayberevisedintheFirm’s10-QfortheperiodendingMarch31,2011NNote:FirmwideLe vel3assetsareestimatedtobe5%oftotalFirmassetsatMarch31,2011I13F |
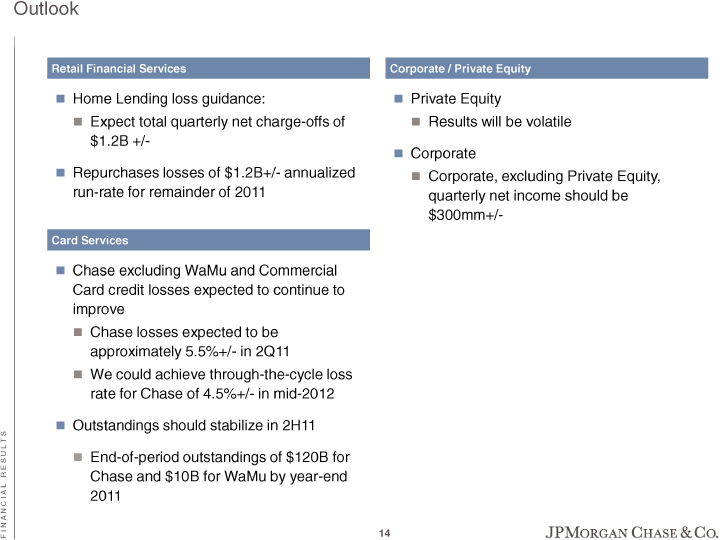
| OutlookRetailFinancialServicesCorporate/PrivateEquity HomeLendinglossguidance: PrivateEquity Expecttotalquarterlynetcharge-offsof Resultswillbevolatile$1.2B+/- Corporate Repurchaseslossesof$1.2B+/-annualized Corporate,excludingPrivateEquity,run-rateforremainderof2011quarterlynetincomeshouldbe$300mm+/-CardSe rvices ChaseexcludingWaMuandCommercialCardcreditlossesexpectedtocontinuetoimprove Chaselossesexpectedtobeapproximately5.5%+/-in2Q11 Wecouldachievethrough-the-cyclelossrateforChaseof4.5%+/-inmid-2012 Outstandingsshouldstabilizein2H11RESULTS End-of-periodoutstandingsof$120BforChaseand$10BforWaMubyyear-end2011FINANCIAL14 |
| FINANCIALRESULTSAgendaAppendix1515Page |
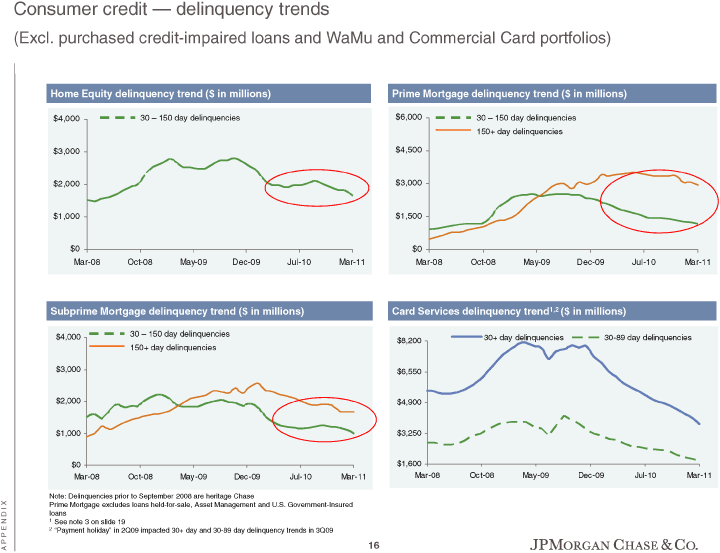
| Consumercredit—delinquencytrends(Excl.purchasedcredit-impairedloansandWaMuandCommercialCardportfoli os)Note:DelinquenciespriortoSeptember2008areheritageChaseXPrimeMortgageexcludesloansheld-for-sale,As setManagementandU.S.Government-InsuredIDloansN1Seenote3onslide19E2 “Paymentholiday“in2Q09impacted30+dayand30-89daydelinquencytrendsin3Q09PP16A |
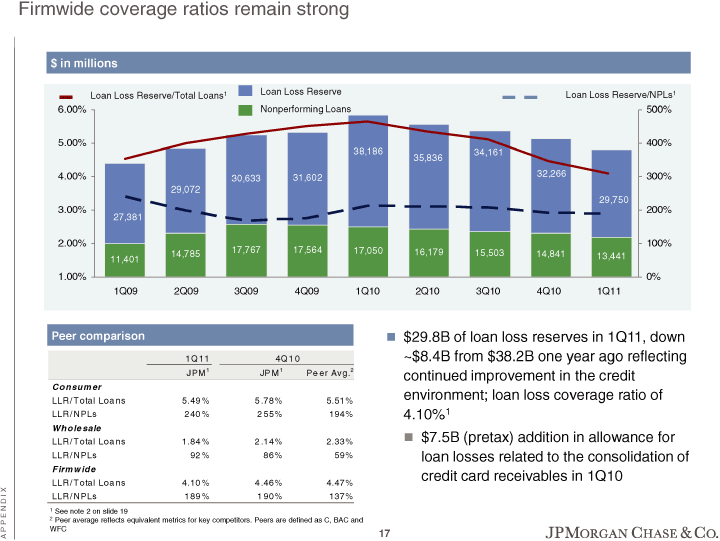
| Firmwidecoverageratiosremainstrong$inmillionsLoanLossReserveLoanLossReserve/NPLs1 LoanLossReserve/TotalLoans1 6.00%NonperformingLoans500%5.00%400%38,18634,16135,8364.00%32,266300%30,63331,60229,07229,7503.00%20 0%27,3812.00%100%17,76717,56417,05016,17915,50314,78514,84113,44111,4011.00%0%1Q092Q093Q094Q091Q102Q 103Q104Q101Q11Peercomparison $29.8Bofloanlossreservesin1Q11,down1Q114Q10~$8.4Bfrom$38.2BoneyearagoreflectingJPM1 JPM1PeerAvg.2 continuedimprovementinthecreditConsumerenvironment;loanlosscoverageratioofLLR/TotalLoans5.49%5.78%5. 51%LLR/NPLs240%255%194%4.10%1WholesaleLLR/TotalLoans1.84%2.14%2.33% $7.5B(pretax)additioninallowanceforLLR/NPLs92%86%59%loanlossesrelatedtotheconsolidationofFirmwidecre ditcardreceivablesin1Q10LLR/TotalLoans4.10%4.46%4.47%XILLR/NPLs189%190%137%DN1 Seenote2onslide19EP2 Peeraveragereflectsequivalentmetricsforkeycompetitors.PeersaredefinedasC,BACandPWFCA17 |
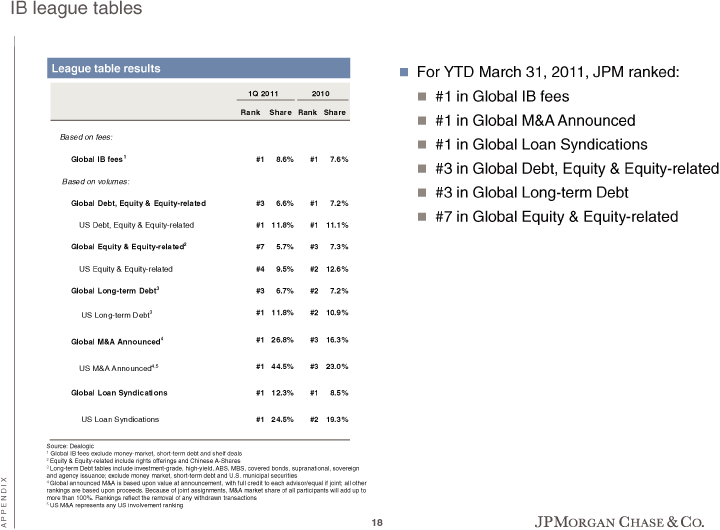
| IBleaguetablesLeaguetableresults ForYTDMarch31,2011,JPMranked:1Q20112010 #1inGlobalIBfeesRankShareRankShare #1inGlobalM&AAnnouncedBasedonfees: #1inGlobalLoanSyndicationsGlobalIBfees1#18.6%#17.6% #3inGlobalDebt,Equity&Equity-relatedBasedonvolumes: #3inGlobalLong-termDebtGlobalDebt,Equity&Equity-related#36.6%#17.2% #7inGlobalEquity&Equity-relatedUSDebt,Equity&Equity-related#111.8%#111.1%GlobalEquity&Equity-related 2#75.7%#37.3%USEquity&Equity-related#49.5%#212.6%GlobalLong-termDebt3 #36.7%#27.2%USLong-termDebt3#111.8%#210.9%GlobalM&AAnnounced4 #126.8%#316.3%USM&AAnnounced4,5 #144.5%#323.0%GlobalLoanSyndications#112.3%#18.5%USLoanSyndications#124.5%#219.3%Source:Dealogic1GlobalIBfeesexcludemoney-market,short-termdebtandshelfdeals2 Equity&Equity-relatedincluderightsofferingsandChineseA-Shares3 Long-termDebttablesincludeinvestment-grade,high-yield,ABS,MBS,coveredbonds,supranational,sovereignan dagencyissuance;excludemoneymarket,short-termdebtandU.S.municipalsecurities4 GlobalannouncedM&Aisbaseduponvalueatannouncement,withfullcredittoeachadvisor/equalifjoint;allotherra nkingsarebaseduponproceeds.Becauseofjointassignments,M&Amarketshareofallparticipantswilladduptomoret han100%.Rankingsreflecttheremovalofanywithdrawntransactions5 USM&ArepresentsanyUSinvolvementrankingAPPENDIX18 |
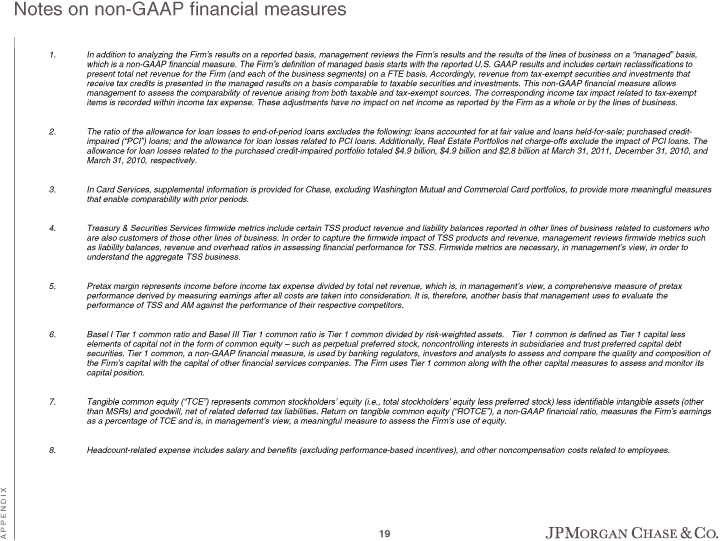
| Notesonnon-GAAPfinancialmeasures1.InadditiontoanalyzingtheFirm’sresultsonareportedbasis,managementre viewstheFirm’sresultsandtheresultsofthelinesofbusinessona“managed“basis,whichisanon-GAAPfinancialmea sure.TheFirm’sdefinitionofmanagedbasisstartswiththereportedU.S.GAAPresultsandincludescertainreclassi ficationstopresenttotalnetrevenuefortheFirm(andeachofthebusinesssegments)onaFTEbasis.Accordingly,rev enuefromtax-exemptsecuritiesandinvestmentsthatreceivetaxcreditsispresentedinthemanagedresultsonabasi scomparabletotaxablesecuritiesandinvestments.Thisnon-GAAPfinancialmeasureallowsmanagementtoassessthe comparabilityofrevenuearisingfrombothtaxableandtax-exemptsources.Thecorrespondingincometaximpactrela tedtotax-exemptitemsisrecordedwithinincometaxexpense.Theseadjustmentshavenoimpactonnetincomeasreport edbytheFirmasawholeorbythelinesofbusiness.2.Theratiooftheallowanceforloanlossestoend-of-periodloanse xcludesthefollowing:loansaccountedforatfairvalueandloansheld-for-sale;purchasedcredit-impaired(“PCI” )loans;andtheallowanceforloanlossesrelatedtoPCIloans.Additionally,RealEstatePortfoliosnetcharge-offs excludetheimpactofPCIloans.Theallowanceforloanlossesrelatedtothepurchasedcredit-impairedportfoliotot aled$4.9billion,$4.9billionand$2.8billionatMarch31,2011,December31,2010,andMarch31,2010,respectively .3.InCardServices,supplementalinformationisprovidedforChase,excludingWashingtonMutualandCommercialCa rdportfolios,toprovidemoremeaningfulmeasuresthatenablecomparabilitywithpriorperiods.4.Treasury&Secur itiesServicesfirmwidemetricsincludecertainTSSproductrevenueandliabilitybalancesreportedinotherlineso fbusinessrelatedtocustomerswhoarealsocustomersofthoseotherlinesofbusiness.Inordertocapturethefirmwid eimpactofTSSproductsandrevenue,managementreviewsfirmwidemetricssuchasliabilitybalances,revenueandove rheadratiosinassessingfinancialperformanceforTSS.Firmwidemetricsarenecessary,inmanagement’sview,inor dertounderstandtheaggregateTSSbusiness.5.Pretaxmarginrepresentsincomebeforeincometaxexpensedividedby totalnetrevenue,whichis,inmanagement’sview,acomprehensivemeasureofpretaxperformancederivedbymeasurin gearningsafterallcostsaretakenintoconsideration.Itis,therefore,anotherbasisthatmanagementusestoevalu atetheperformanceofTSSandAMagainsttheperformanceoftheirrespectivecompetitors.6.BaselITier1commonrati oandBaselIIITier1commonratioisTier1commondividedbyrisk-weightedassets.Tier1commonisdefinedasTier1cap itallesselementsofcapitalnotintheformofcommonequity—suchasperpetualpreferredstock,noncontrollingint erestsinsubsidiariesandtrustpreferredcapitaldebtsecurities.Tier1common,anon-GAAPfinancialmeasure,isu sedbybankingregulators,investorsandanalyststoassessandcomparethequalityandcompositionoftheFirm’scapi talwiththecapitalofotherfinancialservicescompanies.TheFirmusesTier1commonalongwiththeothercapitalmea surestoassessandmonitoritscapitalposition.7.Tangiblecommonequity(“TCE”)representscommonstockholders’ equity(i.e.,totalstockholders’equitylesspreferredstock)lessidentifiableintangibleassets(otherthanMSR s)andgoodwill,netofrelateddeferredtaxliabilities.Returnontangiblecommonequity(“ROTCE”),anon-GAAPfina ncialratio,measurestheFirm’searningsasapercentageofTCEandis,inmanagement’sview,ameaningfulmeasuretoa ssesstheFirm’suseofequity.8.Headcount-relatedexpenseincludessalaryandbenefits(excludingperformance-b asedincentives),andothernoncompensationcostsrelatedtoemployees.APPENDIX19 |

| Forward-lookingstatementsThispresentationcontainsforward-lookingstatementswithinthemeaningofthePriva teSecuritiesLitigationReformActof1995.SuchstatementsarebaseduponthecurrentbeliefsandexpectationsofJP MorganChase&Co.’smanagementandaresubjecttosignificantrisksanduncertainties.Actualresultsmaydifferfro mthosesetforthintheforward-lookingstatements.FactorsthatcouldcauseJPMorganChase&Co.’sactualresultsto differmateriallyfromthosedescribedintheforward-lookingstatementscanbefoundinJPMorganChase&Co.’sAnnua lReportonForm10-KfortheyearendedDecember31,2010,whichhasbeenfiledwiththeSecuritiesandExchangeCommiss ionandisavailableonJPMorganChase&Co.’swebsite(www.jpmorganchase.com)andontheSecuritiesandExchangeCom mission’swebsite(www.sec.gov).JPMorganChase&Co.doesnotundertaketoupdatetheforward-lookingstatementst oreflecttheimpactofcircumstancesoreventsthatmayariseafterthedateoftheforward-lookingstatements.APPEN DIX20 |
