Attached files
| file | filename |
|---|---|
| EX-10.9 - EX-10.9 - Wesco Aircraft Holdings, Inc | a2203263zex-10_9.htm |
| EX-10.8 - EX-10.8 - Wesco Aircraft Holdings, Inc | a2203263zex-10_8.htm |
| EX-21.1 - EX-21.1 - Wesco Aircraft Holdings, Inc | a2203263zex-21_1.htm |
| EX-10.3 - EX-10.3 - Wesco Aircraft Holdings, Inc | a2203263zex-10_3.htm |
| EX-23.2 - EX-23.2 - Wesco Aircraft Holdings, Inc | a2203263zex-23_2.htm |
| EX-10.4 - EX-10.4 - Wesco Aircraft Holdings, Inc | a2203263zex-10_4.htm |
| EX-10.7 - EX-10.7 - Wesco Aircraft Holdings, Inc | a2203263zex-10_7.htm |
| EX-10.5 - EX-10.5 - Wesco Aircraft Holdings, Inc | a2203263zex-10_5.htm |
| EX-10.6 - EX-10.6 - Wesco Aircraft Holdings, Inc | a2203263zex-10_6.htm |
| EX-23.3 - EX-23.3 - Wesco Aircraft Holdings, Inc | a2203263zex-23_3.htm |
Use these links to rapidly review the document
TABLE OF CONTENTS
INDEX TO CONSOLIDATED FINANCIAL STATEMENTS
As filed with the Securities and Exchange Commission on April 8, 2011
Registration No. 333-
UNITED STATES
SECURITIES AND EXCHANGE COMMISSION
Washington, D.C. 20549
Form S-1
REGISTRATION STATEMENT
UNDER
THE SECURITIES ACT OF 1933
Wesco Aircraft Holdings, Inc.
(Exact name of registrant as specified in its charter)
| Delaware (State or other jurisdiction of incorporation or organization) |
3720 (Primary Standard Industrial Classification Code Number) |
20-5441563 (I.R.S. Employer Identification No.) |
27727 Avenue Scott
Valencia, CA 91355
(661) 775-7200
(Address, including zip code, and telephone number, including area code, of the registrant's principal executive offices)
John G. Holland
General Counsel
27727 Avenue Scott
Valencia, CA 91355
(661) 775-7200
(Name, address, including zip code, and telephone number, including area code, of agent for service)
Copies to: |
||
Rachel W. Sheridan |
Michael Kaplan |
|
Approximate date of commencement of proposed sale to the public:
As soon as practicable after the effective date of this registration statement.
If any of the securities being registered on this form are to be offered on a delayed or continuous basis pursuant to Rule 415 under the Securities Act of 1933, check the following box. o
If this Form is filed to register additional securities for an offering pursuant to Rule 462(b) under the Securities Act, check the following box and list the Securities Act registration statement number of the earlier effective registration statement for the same offering. o
If this Form is a post-effective amendment filed pursuant to Rule 462(c) under the Securities Act, check the following box and list the Securities Act registration statement number of the earlier effective registration statement for the same offering. o
If this Form is a post-effective amendment filed pursuant to Rule 462(d) under the Securities Act, check the following box and list the Securities Act registration statement number of the earlier effective registration statement for the same offering. o
Indicate by check mark whether the registrant is a large accelerated filer, an accelerated filer, a non-accelerated filer, or a smaller reporting company. See definitions of "large accelerated filer," "accelerated filer," and "smaller reporting company" in Rule 12b-2 of the Exchange Act. (Check one):
| Large accelerated filer o | Accelerated filer o | Non-accelerated filer ý | Smaller reporting company o |
CALCULATION OF REGISTRATION FEE
| Title of Securities to be Registered |
Proposed maximum aggregate offering price(a)(b) |
Amount of registration fee |
||
|---|---|---|---|---|
| Common stock, $0.001 par value per share | $300,000,000 | $34,830 | ||
- (a)
- Estimated
solely for the purpose of calculating the registration fee in accordance with Rule 457(o) promulgated under the Securities Act of 1933, as
amended.
- (b)
- Including additional shares of common stock that may be purchased by the underwriters.
The registrant hereby amends this registration statement on such date or dates as may be necessary to delay its effective date until the registrant shall file a further amendment which specifically states that this registration statement shall thereafter become effective in accordance with Section 8(a) of the Securities Act of 1933 or until this registration statement shall become effective on such date as the Commission acting pursuant to said Section 8(a), may determine.
The information in this prospectus is not complete and may be changed. These securities may not be sold until the registration statement filed with the Securities and Exchange Commission is effective. This prospectus is not an offer to sell these securities and it is not soliciting an offer to buy these securities in any state or jurisdiction where the offer or sale is not permitted.
SUBJECT TO COMPLETION, DATED APRIL 8, 2011
PROSPECTUS
Shares

Wesco Aircraft Holdings, Inc.
Common Stock
This is an initial public offering of the common stock of Wesco Aircraft Holdings, Inc. The selling stockholders are offering shares of our common stock in this offering. We will not receive any proceeds from the sale of shares held by the selling stockholders. The selling stockholders in this offering include .
We expect the public offering price to be between $ and $ per share. Currently, no public market exists for the shares. We will apply to list our common stock on under the symbol "WAIR."
Investing in our common stock involves risks. See "Risk Factors" beginning on page 10 of this prospectus.
|
||||
| |
Per Share |
Total |
||
|---|---|---|---|---|
Public offering price |
$ | $ | ||
Underwriting discounts and commissions |
$ | $ | ||
Proceeds, before expenses, to the selling stockholders |
$ | $ | ||
|
||||
The selling stockholders have granted the underwriters a 30-day option to purchase up to an additional shares from the selling stockholders on the same terms and conditions as set forth above if the underwriters sell more than shares of common stock in this offering. Neither the Securities and Exchange Commission nor any state securities commission has approved or disapproved of these securities or determined if this prospectus is truthful or complete. Any representation to the contrary is a criminal offense.
The underwriters expect to deliver the shares to purchasers on or about , 2011.
| Barclays Capital | Morgan Stanley |
| BofA Merrill Lynch | J.P. Morgan | William Blair & Company |
, 2011
We have not authorized anyone to provide any information other than that contained or incorporated by reference in this prospectus or in any free writing prospectus prepared by or on behalf of us or to which we have referred you. We take no responsibility for, and can provide no assurance as to the reliability of, any other information that others may give you. The selling stockholders are offering to sell, and seeking offers to buy, shares of our common stock only in jurisdictions where offers and sales are permitted. The information in this document may only be accurate on the date of this document, regardless of its time of delivery or of any sales of shares of our common stock. Our business, financial condition, results of operations or cash flows may have changed since such date.
i
We obtained the industry, market and competitive position data used throughout this prospectus from our own internal estimates and research as well as from industry publications, research, surveys and studies conducted by third parties, including the May 2010 and January 2011 publications of the Airline Monitor; the January 2011 report entitled "Business Jet Report" by the U.S. Federal Aviation Administration; the July 2010 report entitled "Business Aircraft Market Forecast 2010-2029" by Bombardier; the March 2011 report entitled "Lockheed Martin F-35 Joint Strike Fighter (JSF)" by Forecast International; the November 2011 report entitled "Boeing Current Market Outlook, 2010-2029" by Boeing; the 2009 and 2010 publications of the "Statistical Databook and Industry Outlook" by the General Aviation Manufacturers Association; the October 2010 report entitled "Business Aviation Outlook" by Honeywell; and an independent research report that was prepared by Stax Inc. for our use in connection with this offering. Industry publications, studies and surveys generally state that they have been obtained from sources believed to be reliable, although they do not guarantee the accuracy or completeness of such information. While we believe each of these studies and publications is reliable, we have not independently verified market and industry data from third-party sources. While we believe our internal company research is reliable and the market definitions are appropriate, neither such research nor these definitions have been verified by any independent source. Estimates of historical growth rates in the markets where we operate are not necessarily indicative of future growth rates in such markets.
This prospectus includes trademarks, such as Wesco Aircraft® and the Wesco logo, which are protected under applicable intellectual property laws and are our property and/or the property of our subsidiaries. This prospectus also contains trademarks, service marks, copyrights and trade names of other companies, which are the property of their respective owners. Solely for convenience, our trademarks and tradenames referred to in this prospectus may appear without the® or™ symbols, but such references are not intended to indicate, in any way, that we will not assert, to the fullest extent under applicable law, our rights or the right of the applicable licensor to these trademarks and tradenames.
ii
This summary highlights information contained elsewhere in this prospectus. Because this is only a summary, it does not contain all of the information that may be important to you. You should read this entire prospectus and should consider, among other things, the matters set forth under "Risk Factors," "Selected Consolidated Financial Data" and "Management's Discussion and Analysis of Financial Condition and Results of Operations," and our financial statements and related notes thereto appearing elsewhere in this prospectus before making your investment decision. Unless otherwise noted in this prospectus, the term "Wesco Aircraft" means Wesco Aircraft Holdings, Inc. and the terms "Wesco," "the Company," "we," "us," "our" and "our company" mean Wesco Aircraft and its subsidiaries. References to "fiscal year" mean the year ending or ended September 30. For example, "fiscal year 2010" or "fiscal 2010" means the period from October 1, 2009 to September 30, 2010.
Our Company
We are one of the world's largest distributors and providers of comprehensive supply chain management services to the global aerospace industry. Our services range from traditional distribution to the management of supplier relationships, quality assurance, kitting, just-in-time, or JIT, delivery and point-of-use inventory management. We supply approximately 450,000 different stock keeping units, or SKUs, including hardware, bearings, tools and more recently, electronic components and machined parts. In fiscal 2010, sales of hardware represented 80% of our net sales, with highly engineered fasteners constituting 83% of that amount. We serve our customers under three types of arrangements: JIT contracts, which govern comprehensive outsourced supply chain management services; long term agreements, or LTAs, which set prices for specific parts; and ad hoc sales. JIT contracts and LTAs, which together comprised approximately 63% of our fiscal 2010 net sales, are multi-year arrangements that provide us with significant visibility into our future sales.
Wesco was founded in 1953 by the father of our current chief executive officer and has a long history of consistent growth and profitability. We have grown our net sales at a 16% compound annual growth rate, or CAGR, over the past 10 years to $656.0 million in fiscal 2010. Our growth and profitability have been driven by our focus on customer service and our management's ability to make optimal inventory purchasing decisions through the use of our highly customized information technology, or IT, system. We believe that with more than 1,000 employees across 28 locations in 10 countries, we are well positioned to continue our track record of strong long-term growth and profitability.
We believe we offer a compelling value proposition to both our customers and suppliers. Customers that utilize our comprehensive JIT supply chain management services are frequently able to realize significant benefits including: reduced inventory levels, fewer disruptions of production schedules, improved quality assurance and reduced administrative and overhead costs. Our more than 1,100 suppliers also derive several benefits from our scale, global reach and unique business model, including: access to over 7,200 customer accounts, improved manufacturing efficiency, reduced inventory levels, improved performance in meeting on-time-delivery targets to end customers and reduced administrative and overhead costs.
Industry Overview
According to Stax, the global market for C class aerospace parts, which includes hardware, bearings, electronic components and machined parts for both commercial and military customers, was approximately $6.1 billion in 2009. Approximately $3.9 billion of this market flows through distributors.
1
The key trends and drivers of growth in our market include:
Increased Demand for New Aircraft Production. The original equipment manufacturer, or OEM, market for C class aerospace parts in 2009 was approximately $4.1 billion according to Stax, with approximately $2.5 billion of this total relating to sales to the commercial end market and $1.6 billion relating to the military end market. Increased passenger traffic volumes and the return to profitability of the global airline industry have renewed demand for commercial aircraft deliveries, which are forecasted by Airline Monitor to grow at a CAGR of approximately 4.5% over the next ten years. We also expect commercial aircraft production to be supplemented by increases in business and regional jet deliveries. Future military aerospace OEM demand is expected to be driven by increases in the production of the Lockheed Martin F-35 Joint Strike Fighter, or JSF. The JSF is a next-generation fighter that is designed for the U.S. Navy, Marines and Air Force, as well as key U.S. allies such as the United Kingdom, Italy and The Netherlands.
Increased Demand from the MRO Market. According to Stax, the combined commercial and military maintenance, repair and overhaul, or MRO, market represented approximately $2.0 billion of the total C class aerospace parts market in 2009. We expect commercial MRO providers to benefit from the same trends as those impacting the commercial OEM market, including increased revenue passenger miles, or RPMs, which will in turn drive growth in the commercial fleet and greater utilization of existing aircraft. We expect demand in the military MRO market to be driven by requirements to maintain aging military fleets, changes in the overall fleet size and the level of U.S. military activity overseas.
Industry Consolidation. We are one of the top two aerospace distribution companies by sales and, together with our largest competitor, accounted for approximately $1.4 billion, or 23%, of the approximately $6.1 billion C class aerospace parts market in 2009. The remainder of the market is highly fragmented, which creates significant opportunities for further consolidation. Several benefits typically accrue to distributors through consolidation, including efficiencies in leveraging costs over a larger revenue base, increased customer penetration facilitated by a larger product offering and a reduction in purchasing costs driven by larger volume-based discounts. We expect these benefits to support further consolidation in the industry.
Globalization. The manufacture of aircraft and aircraft structures is becoming more globalized, as nations such as China, India and the UAE invest heavily to develop their aerospace industries. In addition, many U.S. and European OEMs continue to expand their operations in international markets in order to benefit from labor cost savings as local businesses seek to partner with established global companies. These OEMs and subcontractors expect to receive the same quality parts and services in new markets that they receive in their home markets. We believe that these quality and service expectations and the overall growth rates in international aerospace markets present significant opportunities for global supply chain managers such as Wesco.
Our Competitive Strengths
We believe our key competitive strengths include the following:
Leader in Attractive Global Market. We are one of the world's largest distributors and providers of comprehensive supply chain management services to the global aerospace industry. We believe we offer the world's broadest inventory of aerospace parts comprised of approximately 450,000 SKUs. In addition, we fill approximately 8,000 orders per work day and manage approximately 350,000 stocking bins throughout our customers' facilities. We believe that the scale of our global distribution network, our value-added services and the depth, breadth and dollar investment in our inventory provide us with a significant competitive advantage in an attractive market.
2
Compelling Value Proposition. We offer a compelling value proposition to our customers by combining access to what we believe to be the world's broadest inventory of aerospace parts with our unique capabilities in comprehensive supply chain management. Our services can significantly improve on-time-delivery performance, enabling our customers to reduce their inventory while at the same time decreasing the frequency of production interruptions caused by part shortages. Aerospace companies that outsource to a supply chain manager like Wesco can reduce overhead and administrative costs relating to internal procurement, quality assurance, inventory stocking and other related personnel.
Diverse Customer and Program Base. We maintain strong relationships with over 7,200 active customers including major OEMs such as Airbus, Boeing, Bombardier, Embraer, Cessna, Gulfstream, BAE Systems, Bell Helicopter, Lockheed Martin, Northrop Grumman and Raytheon. We supply products to nearly every major Western aircraft in production, including the B-787, B-737, B-747, A-320, JSF and V-22. During fiscal 2010, no single customer or aircraft program represented more than 15% of our net sales. We have actively worked to transition our largest customers from ad hoc purchases to multi-year LTAs or comprehensive JIT supply chain management agreements, the latter two of which together represented approximately 63% of our fiscal 2010 net sales. By developing strong, long-term relationships with a diverse set of customers, we have significant visibility into our future sales.
Superior Purchasing Capabilities and Supplier Relationships. Our management is highly skilled in analyzing supply, demand, cost and pricing factors in order to make optimal inventory investment decisions, and we maintain close relationships with the leading suppliers in the industry. As a result of our scale and the strength of our relationships, many of our suppliers offer us attractive volume-based price discounts. Our success in making optimal inventory purchasing decisions is driven by our management's deep understanding of our industry and is further facilitated by our highly customized IT system. Our superior inventory purchasing capabilities and strength of our supplier relationships have contributed substantially to what we believe are our industry-leading operating margins.
Experienced Management Team with Significant Equity Ownership. Our management team has extensive industry experience and company tenure. Our Chief Executive Officer and other executive officers have an average of more than 20 years of experience with us and more than 30 years in our industry. In addition, our executive officers will own approximately % of the common stock of the Company following this offering. We believe that this significant equity ownership aligns the interests of our executive officers with our stockholders.
Our Strategy for Continued Growth
We intend to pursue the following strategies in order to continue to grow our business:
Continued Focus on Operational Excellence. We intend to further our existing customer relationships by continuing to invest in our highly customized IT system and providing best-in-class on-time delivery performance and quality assurance. We believe that by focusing on operational excellence, we will be able to maintain high customer satisfaction and industry-leading operating margins.
Win New Business from Existing Customers. We will continue our strategy of expanding our relationships with existing customers by transitioning them to our comprehensive JIT supply chain management services as well as expanding our programs to include additional customer sites and SKUs, and by introducing new supply chain solutions that minimize costs, improve productivity and lower inventory investment.
Expand Customer Base. We plan to expand our customer base and have had significant success in winning business when competing distributors have been unable to meet customer service level
3
requirements and in situations where customers have outsourced work that was previously performed internally. In addition, we will increase our focus on serving airlines and airline maintenance organizations.
Further Expand into International Markets. We have recently established a presence in international locations such as China, India and Saudi Arabia, and we intend to expand into other high growth regions such as Mexico to support new and existing customers. Our international expansion efforts will enable us to better reach new customers and more effectively serve our existing customer base as the manufacture of aircraft and aircraft structures continues to become more globalized.
Selectively Pursue Strategic Acquisitions. Our industry is highly fragmented and we believe that there are opportunities for continued consolidation. We believe that we are well positioned to expand our product offering and geographical footprint through strategic acquisitions.
Recent Developments
On April 7, 2011, Wesco Aircraft Hardware Corp., our wholly owned, primary domestic operating subsidiary, entered into a new $765.0 million senior secured credit facility with Barclays Bank PLC, as administrative agent and collateral agent, and Merrill Lynch, Pierce, Fenner & Smith, Incorporated, Key Bank, N.A. and Barclays Capital, as joint lead arrangers, which we refer to as our new senior secured credit facilities.
The purpose of the refinancing was to extend the maturity dates under the term loans of Wesco Aircraft Hardware Corp.'s existing senior secured credit facilities, which we refer to as our old senior secured credit facilities, increase the borrowing capacity under our revolver and pay related fees and expenses. The new senior secured credit facilities consist of a (i) $150.0 million revolving credit facility, which we refer to as the new revolving facility, (ii) $265.0 million term loan A facility, which we refer to as the new term loan A facility, and (iii) $350.0 million term loan B facility, which we refer to as the new term loan B facility. Wesco Aircraft is a guarantor of the new senior secured credit facilities.
Risks Related to Our Business
Investing in our common stock involves substantial risk. You should carefully consider all of the information in this prospectus prior to investing in our common stock. There are several risks related to our business that are described under "Risk Factors" elsewhere in this prospectus. Among these important risks are the following:
- •
- general economic and industry conditions;
- •
- changes to military spending;
- •
- risks unique to suppliers of equipment and services to the U.S. government;
- •
- risks associated with our long-term, fixed-price agreements that have no guarantee of future sales volumes;
- •
- risks associated with the loss of significant customers, a material reduction in purchase orders by significant customers
or the delay, scaling back or elimination of significant programs on which we rely;
- •
- our ability to effectively manage our inventory;
- •
- our suppliers' ability to provide us with the products we sell in a timely manner, in adequate quantities and/or at a
reasonable cost;
- •
- our ability to maintain an effective IT system;
- •
- our ability to retain key personnel;
4
- •
- risks associated with our international operations;
- •
- fluctuations in our financial results from period-to-period;
- •
- Carlyle's ability to control the majority of the voting power of our outstanding common stock; and
- •
- our ability to effectively compete in our industry.
Our Sponsor
The Carlyle Group, or Carlyle, is a global alternative asset manager with $106.7 billion of assets under management committed to 84 funds as of December 31, 2010. Carlyle invests across three asset classes—private equity, real estate and credit alternatives—in Africa, Asia, Australia, Europe, North America and South America, focusing on aerospace and defense, industrial and transportation, consumer and retail, energy and power, financial services, healthcare, infrastructure, technology and business services, and telecommunications and media. Since 1987, the firm has invested $68.7 billion of equity in 1,035 transactions. Carlyle employs more than 993 people in 19 countries. Representative Carlyle transactions include the acquisitions of The Hertz Corporation, the largest worldwide car rental brand, Booz Allen Hamilton, a provider of management and technology consulting services to the U.S. government in the defense, intelligence and civil markets, Kinder Morgan, an energy pipeline and storage company, and The Nielsen Company, an information and data measurement company.
As of December 31, 2010, Carlyle, through Falcon Aerospace Holdings, LLC, owned approximately 83.8% of our outstanding common stock. Following the completion of this offering and assuming that the underwriters do not exercise their option to purchase additional shares of common stock, Carlyle will continue to own approximately % of our outstanding common stock.
Company History
Wesco Aircraft was incorporated in Delaware on July 21, 2006, as a holding company for Wesco Aircraft Hardware Corp., our wholly owned, primary domestic operating subsidiary, Wesco Aircraft Europe, Ltd., our primary foreign operating subsidiary, and certain other foreign operating subsidiaries, in connection with the acquisition of 100% of the outstanding stock of Wesco Aircraft Hardware Corp., Wesco Aircraft Israel and the European entities of Flintbrook Ltd., Wesco Aircraft France and Wesco Aircraft Germany by Wesco Aircraft, which we refer to as the Carlyle Acquisition.
Our principal executive offices are located at 27727 Avenue Scott, Valencia, CA 91355 and our telephone number is (661) 775-7200. Our Internet address is www.wescoair.com. The contents of our website are not part of this prospectus.
5
Common stock offered by the selling stockholders |
shares. | |
Selling stockholders |
The selling stockholders in this offering include . See "Principal and Selling Stockholders." |
|
Common stock outstanding after this offering |
shares. |
|
Option to purchase additional shares of common stock |
The selling stockholders have granted the underwriters a 30-day option to purchase up to an additional shares of common stock at the initial public offering price to cover overallotments, if any. |
|
Use of proceeds |
We will not receive any net proceeds from the sale of shares by the selling stockholders, including with respect to the underwriters' overallotment option. See "Use of Proceeds." |
|
Proposed symbol |
"WAIR." |
|
Risk factors |
See "Risk Factors" beginning on page 10 of this prospectus for a discussion of factors you should carefully consider before deciding to invest in our common stock. |
The number of shares of our common stock to be outstanding after completion of this offering is based on shares outstanding as of December 31, 2010 and excludes:
- •
- shares of common stock issuable upon the exercise of options outstanding as of December 31, 2010 at
a weighted average exercise price of $ per share;
- •
- shares of common stock issuable pursuant to restricted stock units on the earlier of September 28,
2012 or the occurrence of a change in control, as defined in the applicable award agreement;
- •
- shares of restricted common stock that are scheduled to vest in equal installments at the close of each
calendar quarter remaining in 2011; and
- •
- shares of common stock reserved for issuance under our 2011 Equity Incentive Award Plan, which we plan to adopt in connection with this offering.
Unless we specifically state otherwise, all information in this prospectus assumes:
- •
- no exercise of the overallotment option by the underwriters;
- •
- an initial public offering price of $ per share, the midpoint of the estimated offering price range set
forth on the cover page of this prospectus; and
- •
- the conversion of all outstanding shares of our Class B convertible redeemable common stock, which we refer to as our Class B common stock, into shares of common stock, on a one-for-one basis, which conversion will occur immediately prior to the effectiveness of this registration statement. In order to effect this conversion, we will be amending and restating our certificate of incorporation, which will require stockholder approval.
Concurrently with the amending and restating of our certificate of incorporation, the number of shares of our authorized common stock will be increased to shares, and each share of common stock then outstanding, including the shares of our Class B common stock, that will have been converted, on a one-for-one basis, into shares of common stock, will be split into shares of common stock by way of a stock split. Unless we specifically state otherwise, the share information in this prospectus reflects the increase in the authorized number of our common stock and the stock split.
6
Summary Historical Financial Data
The following tables set forth our summary historical financial data for the years ended September 30, 2008, 2009 and 2010 and for the three month periods ended December 31, 2009 and 2010. Our summary historical income statement data for each of the years in the three-year period ended September 30, 2010 have been derived from our audited financial statements included elsewhere in this prospectus. Our summary historical income statement data for the three months ended December 31, 2009 and 2010 and our summary historical balance sheet data as of December 31, 2010 have been derived from our unaudited financial statements included elsewhere in this prospectus that, in the opinion of management, include all adjustments consisting only of normal, recurring adjustments necessary for a fair presentation of the results for the unaudited interim period. Results for the three months ended December 31, 2010 are not necessarily indicative of the results that may be expected for the year ending September 30, 2011 or for any other period. The financial data set forth below are not necessarily indicative of future results of operations. This data should be read in conjunction with, and is qualified in its entirety by reference to, the "Selected Consolidated Financial Data," "Management's Discussion and Analysis of Financial Condition and Results of Operations" and "Capitalization" sections and our financial statements and notes thereto included elsewhere in this prospectus.
| |
Year Ended September 30, | Three Months Ended December 31, |
||||||||||||||||
|---|---|---|---|---|---|---|---|---|---|---|---|---|---|---|---|---|---|---|
| (Dollars in thousands, except per share amounts) |
2008 | 2009 | 2010 | 2009 | 2010 | |||||||||||||
| |
|
|
|
(unaudited) |
||||||||||||||
Consolidated statements of income: |
||||||||||||||||||
Net sales: |
||||||||||||||||||
North America |
$ | 551,135 | $ | 557,874 | $ | 603,809 | $ | 132,490 | $ | 160,483 | ||||||||
Rest of the World |
112,623 | 102,796 | 95,342 | 23,296 | 26,071 | |||||||||||||
Intercompany eliminations |
(59,415 | ) | (47,983 | ) | (43,115 | ) | (8,980 | ) | (13,026 | ) | ||||||||
Net sales |
604,343 | 612,687 | 656,036 | 146,806 | 173,528 | |||||||||||||
Gross profit: |
||||||||||||||||||
North America |
221,898 | 204,296 | 226,497 | 47,659 | 59,477 | |||||||||||||
Rest of the World |
42,143 | 39,733 | 34,167 | 8,698 | 8,837 | |||||||||||||
Intercompany eliminations |
(7,433 | ) | (5,742 | ) | (6,434 | ) | (1,714 | ) | (1,615 | ) | ||||||||
Gross profit |
256,608 | 238,287 | 254,230 | 54,643 | 66,699 | |||||||||||||
Selling, general and administrative expenses: |
||||||||||||||||||
North America |
84,807 | 86,007 | 81,674 | 20,143 | 20,479 | |||||||||||||
Rest of the World |
20,951 | 17,888 | 18,241 | 4,615 | 4,909 | |||||||||||||
Selling, general and administrative expenses |
105,758 | 103,895 | 99,915 | 24,758 | 25,388 | |||||||||||||
Income from operations |
150,850 | 134,392 | 154,315 | 29,885 | 41,311 | |||||||||||||
Interest expense, net |
(48,743 | ) | (37,707 | ) | (36,270 | ) | (8,579 | ) | (6,277 | ) | ||||||||
Other income (expense), net |
746 | (376 | ) | (458 | ) | (41 | ) | 516 | ||||||||||
Income before provision for income taxes |
102,853 | 96,309 | 117,587 | 21,265 | 35,550 | |||||||||||||
Provision for income taxes |
44,251 | 37,862 | 43,913 | 7,194 | 13,880 | |||||||||||||
Net income |
$ | 58,602 | $ | 58,447 | $ | 73,674 | $ | 14,071 | $ | 21,670 | ||||||||
Earnings per share data: |
||||||||||||||||||
Net income per share: |
||||||||||||||||||
Basic |
$ | 6.22 | $ | 6.19 | $ | 7.32 | $ | 1.40 | $ | 2.15 | ||||||||
Diluted |
$ | 6.02 | $ | 5.87 | $ | 7.28 | $ | 1.40 | $ | 2.11 | ||||||||
Weighted average shares outstanding: |
||||||||||||||||||
Basic |
9,420,433 | 9,440,596 | 10,063,237 | 10,063,237 | 10,063,905 | |||||||||||||
Diluted |
9,740,158 | 9,964,748 | 10,118,648 | 10,063,487 | 10,284,934 | |||||||||||||
7
| |
Year Ended September 30, | Three Months Ended December 31, |
||||||||||||||||
|---|---|---|---|---|---|---|---|---|---|---|---|---|---|---|---|---|---|---|
| (Dollars in thousands) |
2008 | 2009 | 2010 | 2009 | 2010 | |||||||||||||
| |
|
|
|
(unaudited) |
||||||||||||||
Consolidated balance sheet data: |
||||||||||||||||||
Cash and cash equivalents |
$ | 15,998 | $ | 11,406 | $ | 39,463 | $ | 29,969 | $ | 27,266 | ||||||||
Working capital(1) |
438,863 | 526,375 | 565,126 | 541,720 | 581,684 | |||||||||||||
Total assets |
1,173,620 | 1,254,812 | 1,279,012 | 1,261,115 | 1,281,839 | |||||||||||||
Total liabilities |
763,847 | 780,872 | 733,273 | 775,178 | 714,396 | |||||||||||||
Total stockholders' equity |
409,773 | 473,940 | 545,739 | 485,937 | 567,443 | |||||||||||||
Statements of Cash Flows Data: |
||||||||||||||||||
Net cash provided by operating activities |
$ | 24,702 | $ | 1,266 | $ | 100,773 | $ | 21,434 | $ | 2,506 | ||||||||
Net cash used in investing activities |
(115,798 | ) | (4,135 | ) | (3,077 | ) | (362 | ) | (234 | ) | ||||||||
Net cash provided by (used in) financing activities |
94,114 | (1,720 | ) | (69,483 | ) | (2,495 | ) | (14,387 | ) | |||||||||
Other Financial and Operating Data: |
||||||||||||||||||
Capital expenditures |
$ | (6,769 | ) | $ | (4,135 | ) | $ | (3,077 | ) | $ | (362 | ) | $ | (234 | ) | |||
Adjusted EBITDA(2) |
184,060 | 156,985 | 166,467 | 32,966 | 44,111 | |||||||||||||
Adjusted Net Income(2) |
77,435 | 71,869 | 81,307 | 15,816 | 22,973 | |||||||||||||
- (1)
- Working
capital is defined as our current assets minus our current liabilities.
- (2)
- We disclose Adjusted EBITDA and Adjusted Net Income, which are non-GAAP measures our management uses to evaluate our business, because we believe they assist investors and analysts in comparing our performance across reporting periods on a consistent basis by excluding items that we do not believe are indicative of our core operating performance. We believe these metrics are used in the financial community, and we present these metrics to enhance investors, understanding of our operating performance and cash flow. You should not consider Adjusted EBITDA and Adjusted Net Income as an alternative to net income, determined in accordance with GAAP, as an indicator of operating performance, or as an alternative to net cash provided by operating activities, determined in accordance with GAAP, as an indicator of our cash flow.
We use Adjusted EBITDA and Adjusted Net Income to evaluate our performance relative to that of our peers. However, Adjusted EBITDA and Adjusted Net Income are not measurements of financial performance under GAAP, and these metrics may not be comparable to similarly titled measures of other companies.
"Adjusted EBITDA" represents net income before (i) income tax provision, (ii) net interest expense, (iii) depreciation and amortization, (iv) amortization of inventory step-up, (v) Carlyle Acquisition related non-cash stock-based compensation expense and (vi) any extraordinary, unusual or non-recurring items. The following table reconciles Net income to Adjusted EBITDA:
| |
Year Ended September 30, | Three Months Ended December 31, | ||||||||||||||
|---|---|---|---|---|---|---|---|---|---|---|---|---|---|---|---|---|
| (Dollars in thousands) |
2008 | 2009 | 2010 | 2009 | 2010 | |||||||||||
| |
|
|
|
(unaudited) |
||||||||||||
Net income |
$ | 58,602 | $ | 58,447 | $ | 73,674 | $ | 14,071 | $ | 21,670 | ||||||
Income tax provision |
44,251 | 37,862 | 43,913 | 7,194 | 13,880 | |||||||||||
Interest expense, net |
48,743 | 37,707 | 36,270 | 8,579 | 6,277 | |||||||||||
Depreciation and amortization |
7,846 | 10,065 | 8,821 | 2,209 | 2,108 | |||||||||||
Amortization of inventory step-up(a) |
11,418 | 3,861 | 2,200 | 516 | — | |||||||||||
Carlyle Acquisition related non-cash stock-based compensation expense(b) |
13,200 | 9,043 | 1,589 | 397 | 176 | |||||||||||
Adjusted EBITDA |
$ | 184,060 | $ | 156,985 | $ | 166,467 | $ | 32,966 | $ | 44,111 | ||||||
- (a)
- Represents
the amortization of the fair value step-up of inventory associated with the Carlyle Acquisition and the acquisition of Airtechnics, Inc. included
in cost of sales.
- (b)
- Reflects stock-based compensation expense for restricted stock awards, restricted stock units and stock options granted in connection with the Carlyle Acquisition. This adjustment excludes any remaining stock compensation expense unrelated to the Carlyle Acquisition of $500, $1,346, $921, $243 and $188 for the years ended September 30, 2008, 2009, 2010 and the three months ended December 31, 2009 and 2010, respectively. Stock compensation expense in future periods may vary depending on the number of awards granted.
8
"Adjusted Net Income" represents net income before: (i) amortization of intangible assets, (ii) amortization of inventory step-up, (iii) amortization or write-off of deferred financing costs and original issue discount, or OID, (iv) Carlyle Acquisition related non-cash stock-based compensation expense, (v) any extraordinary, unusual or non-recurring items and (vi) the tax effect of items (i) through (v) above calculated using an assumed effective tax rate. The following table reconciles Net income to Adjusted Net Income:
| |
Year Ended September 30, | Three Months Ended December 31, | ||||||||||||||
|---|---|---|---|---|---|---|---|---|---|---|---|---|---|---|---|---|
| (Dollars in thousands) |
2008 | 2009 | 2010 | 2009 | 2010 | |||||||||||
| |
|
|
|
(unaudited) |
||||||||||||
Net income |
$ | 58,602 | $ | 58,447 | $ | 73,674 | $ | 14,071 | $ | 21,670 | ||||||
Amortization of intangible assets |
3,391 | 5,763 | 4,119 | 1,070 | 923 | |||||||||||
Amortization of inventory step-up(a) |
11,418 | 3,861 | 2,200 | 516 | — | |||||||||||
Amortization of deferred financing costs(b) |
3,379 | 3,703 | 4,814 | 926 | 1,072 | |||||||||||
Carlyle Acquisition related non-cash stock-based compensation expense(c) |
13,200 | 9,043 | 1,589 | 397 | 176 | |||||||||||
Tax effect of above adjustments(d) |
(12,555 | ) | (8,948 | ) | (5,089 | ) | (1,164 | ) | (868 | ) | ||||||
Adjusted Net Income |
$ | 77,435 | $ | 71,869 | $ | 81,307 | $ | 15,816 | $ | 22,973 | ||||||
- (a)
- Represents
the amortization of the fair value step-up of inventory associated with the Carlyle Acquisition and the acquisition of Airtechnics, Inc. included
in cost of sales.
- (b)
- Represents
the amortization of deferred financing costs associated with our term loans and revolving line of credit. Amortization of OID associated with our
$765.0 million new senior secured credit facilities entered into on April 7, 2011 will be included in this adjustment in future periods.
- (c)
- Reflects
stock-based compensation expense for restricted stock awards, restricted stock units and stock options granted in connection with the Carlyle
Acquisition. This adjustment excludes any remaining stock compensation expense unrelated to the Carlyle Acquisition of $500, $1,346, $921, $243 and $188 for the years ended September 30, 2008,
2009, 2010 and the three months ended December 31, 2009 and 2010, respectively. Stock compensation expense in future periods may vary depending on the number of awards granted.
- (d)
- Reflects taxes on adjustments at an assumed marginal tax rate of 40%.
9
An investment in our common stock involves a high degree of risk. You should consider carefully the following risks and other information contained in this prospectus before you decide whether to buy our common stock. If any of the events contemplated by the following discussion of risks should occur, our business, results of operations and financial condition could suffer significantly. As a result, the market price of our common stock could decline, and you may lose all or part of the money you paid to buy our common stock. The following is a summary of all the material risks known to us; however, additional risks not known to us or that we believe to be immaterial could also impair our business.
Risks Related to Our Business and Industry
We are directly dependent upon the condition of the aerospace industry, which is closely tied to global economic conditions.
Demand for the products and services we offer is directly tied to the delivery of new aircraft and aircraft utilization, which, in turn, is impacted by global economic conditions. Although the economy has exhibited signs of recovery, global financial markets have experienced extreme volatility and disruption for more than two years, which, at times, reached unprecedented levels as a result of the financial crisis affecting the banking system and participants in the global financial markets. Concerns over the tightening of the corporate credit markets, inflation, energy costs and the dislocation of the real estate and mortgage markets have contributed to the volatility in the global financial markets and, together with the global financial crisis, have created uncertainties for global economic conditions in the future. The aerospace industry is particularly sensitive to changes in economic conditions. In 2009, RPMs on commercial aircraft declined due to the global recession. During the same period, the industry experienced declines in large commercial, regional jet and business jet deliveries. While demand for commercial and regional jets has recovered somewhat, business jet orders and deliveries have recovered more slowly. A slowdown in the current economic recovery or a return to a recession would negatively impact the aerospace industry, and could negatively impact our business, financial condition and results of operations.
Military spending, including spending on the products we sell, is dependent upon national defense budgets.
During the year ended September 30, 2010, approximately 53% of our net sales were related to military aircraft. The military market is significantly dependent upon government budget trends, particularly the U.S. Department of Defense, or DoD, budget. Future DoD budgets could be negatively impacted by several factors, including, but not limited to, a change in defense spending policy by the current and future presidential administrations and Congress, the U.S. Government's budget deficits, spending priorities, the cost of sustaining the U.S. military presence in overseas operations and possible political pressure to reduce U.S. Government military spending, each of which could cause the DoD budget to decline. A decline in U.S. military expenditures could result in a reduction in military aircraft production, which could have a material adverse effect on our business, financial condition and results of operations.
We are subject to unique business risks as a result of supplying equipment and services to the U.S. Government directly and as a subcontractor.
Companies engaged in supplying defense-related equipment and services to U.S. Government agencies are subject to business risks specific to the defense industry. We contract directly with the U.S. Government and as a subcontractor to customers contracting with the U.S. Government. These risks include the ability of the U.S. Government to unilaterally suspend us from receiving new contracts pending resolution of alleged violations of procurement laws or regulations, reduce the value of existing contracts and audit our contract-related costs and fees. In addition, most of our U.S. Government
10
contracts and subcontracts can be terminated by the U.S. Government or the contracting party, as applicable, at its convenience. Termination for convenience provisions provide only for our recovery of costs incurred or committed, settlement expenses and profit on the work completed prior to termination.
In addition, the U.S. Government may seek to review our costs to determine whether our pricing is "fair and reasonable." Such a review could be costly and time consuming for our management and could distract from our ability to effectively manage the business. As a result of such a review, we could be required to provide a refund to the U.S. Government or we could be asked to enter into an arrangement whereby our prices would be based on cost or the DoD could seek to pursue alternative sources of supply for our parts. Any of those occurrences could lead to a reduction in our net sales from, or the profitability of certain of our supply arrangements with, certain agencies and buying organizations of the U.S. Government.
We are also subject to the federal False Claims Act, which provides for substantial civil penalties and treble damages where a contractor presents a false or fraudulent claim to the government for payment. Actions under the False Claims Act may be brought by the government or by other persons on behalf of the government (who may then share in any recovery).
We do not have guaranteed future sales of the products we sell and when we enter into JIT contracts and LTAs with our customers we generally take the risk of cost overruns.
Our JIT contracts and LTAs are long-term, fixed-price agreements with no guarantee of future sales volumes, and they may be terminated for convenience on short notice by our customers, often without meaningful penalties, provided that we are reimbursed for the cost of any inventory specifically procured for the customer. In addition, we purchase inventory based on our forecasts of anticipated future customer demand. As a result, we may take the risk of having excess inventory in the event that our customers do not place orders consistent with our forecasts. We also run the risk of not being able to pass along or otherwise recover unexpected increases in our product costs, including as a result of commodity price increases, which may increase above our established prices at the time we entered into the customer contract and established prices for parts we provide. In the event that we purchase more products than our customers require, product costs increase unexpectedly or our contracts are terminated, our business, financial condition, results of operations and operating margins could be negatively affected.
We may lose significant customers, significant customers may materially reduce their purchase orders and significant programs on which we rely may be delayed, scaled back or eliminated.
Our top ten customers for the year ended September 30, 2010 accounted for approximately 48% of our net sales. Boeing was our largest customer during fiscal 2010, accounting for approximately 15% of our net sales through purchases by its various divisions and subsidiaries. A reduction in purchasing by or loss of one of our larger customers for any reason, such as a transfer of business to a competitor, an economic downturn, in-sourcing by customers, changes in manufacturing practices, failure to adequately service our clients, decreased production or a strike, could have a material adverse effect on our business, financial condition and results of operations.
As an example of changes that could impact us, OEMs such as Boeing and Airbus are currently incorporating an increasing amount of composite materials in the aircraft they manufacture. Aircraft utilizing composite materials generally require the use of significantly fewer C class aerospace parts than new aircraft made of more traditional non-composite materials, although the parts used are generally higher priced than C class aerospace parts used in non-composite aircraft structures. As Boeing, Airbus and other customers increase their reliance on composite materials, they may materially
11
reduce their purchase orders from us, which could have a material and adverse effect our business, financial condition and results of operations.
We also derive a substantial portion of our net sales from certain aerospace programs. In particular, our future growth will be dependent, in part, upon our sales to various OEMs and subcontractors related to the Boeing 787 and the Lockheed Martin JSF. For example, we estimate that 10% of our net sales during fiscal 2010 were derived from sales to a number of customers related to the Boeing 787 and that approximately 20% of the parts we held in inventory primarily pertained to the Boeing 787. We have recently been notified by Boeing of its intent to perform certain supply chain management functions in-house that we are currently providing at two Boeing facilities, under JIT contracts that were awarded to us when these particular facilities were under different ownership. In fiscal 2010, sales under these contracts accounted for approximately 5.8% of net sales. If production of any of the programs we support is terminated or delayed, or if our sales to customers affiliated with these programs are reduced or eliminated, our business, financial condition and results of operations could be adversely affected.
In addition, during the year ended September 30, 2010, approximately 37% of our net sales were derived from ad hoc sales. The prices we charge for ad hoc sales are typically higher than the prices under our JIT contracts or LTAs. However, ad hoc customers may not continue to purchase the same amount of products from us as they have in the past, so we cannot assure you that in any given year we will be able to generate similar net sales from our ad hoc customers as we did in the past. We are also actively working to transition customers from ad hoc purchases to multi-year LTAs or comprehensive JIT supply chain management agreements, which may also result in a reduction in ad hoc purchases. A significant diminution in our ad hoc sales in any given year could have a material adverse effect on our results of operations, including a reduction in our operating margins.
We operate in a highly competitive market.
We operate in a highly competitive global industry and compete against a number of companies, including divisions of larger companies, some of which may have significantly greater financial resources than we do, and therefore may be able to adapt more quickly to changes in customer requirements than we can. Our competitors consist of both U.S. and foreign companies and range in size from divisions of large public corporations to small privately held entities. We believe that our ability to compete depends on superior customer service and support, on-time delivery, sufficient inventory availability, competitive pricing and effective quality assurance programs. In order to remain competitive, we may have to adjust the prices of some of the products and services we sell and continue investing in our procurement, supply-chain management and sales and marketing functions, the costs of which could negatively impact our results of operations.
In addition, we face competition for our JIT and LTA customers from both competitors in our industry and the in-sourcing of supply-chain management by our customers themselves. Recently, Boeing began in-sourcing portions of its supply chain management system in an attempt to reduce its costs. If any of our JIT or LTA customers decides to in-source the services we provide or switch to one of our competitors, we would be adversely affected.
We may be unable to effectively manage our inventory as we grow.
We have experienced rapid growth in recent periods and intend to continue to grow our business by increasing our product offerings and expanding our customer base. Due to the lead times required by our suppliers, we order products in advance of expected sales, the volume of which orders may be significant as a result of our growth strategy. Lead times generally range from several weeks up to two years, depending on industry conditions, which make it difficult to successfully manage our inventory as we plan for expected growth. For example, in 2009, our cash flows were negatively impacted as our
12
suppliers continued filling orders that we had placed in anticipation of future sales, while orders from our customers slowed because the aerospace industry had entered a significant downturn. In the future, if we are unable to effectively manage our inventory as we attempt to grow our business, our cash flows may be negatively affected, which could have a material adverse effect on our business, financial condition and results of operations.
Our suppliers may be unable to supply us with the products we sell in a timely manner, in adequate quantities and/or at a reasonable cost.
Our inventory is primarily sourced directly from manufacturing firms, and we depend on the availability of large supplies of the products we sell. Our largest supplier for the year ended September 30, 2010 was Precision Castparts Corp., or Precision Castparts. During fiscal 2010, approximately 22% of the products we purchased were from Precision Castparts and 20% were purchased from Alcoa Fastening Systems. In addition, our ten largest suppliers during fiscal 2010 accounted for approximately 58% of our purchases. These manufacturers may experience capacity constraints that result in their being unable to supply us with products in a timely manner, in adequate quantities and/or at a reasonable cost. Contributing factors to manufacturer capacity constraints include, among other things, industry or customer demands in excess of machine capacity, labor shortages and changes in raw material flows. Any significant interruption in the supply of these products or termination of our relationship with any of our suppliers could result in us being unable to meet the demands of our customers, which would have a material adverse effect on our business, financial condition and results of operations.
Our business is highly dependent on complex information technology.
The provision and application of IT is an increasingly critical aspect of our business. Among other things, our IT system must frequently interact with those of our customers, suppliers and logistics providers. Our future success will depend on our continued ability to employ an IT system that meets our customers' demands. The failure of the hardware or software that supports our IT system, including redundancy systems, could significantly disrupt our ability to service our customers and cause economic losses for which we could be held liable and which could damage our reputation.
Our competitors may have or may develop IT systems that permit them to be more cost effective and otherwise better situated to meet customer demands than we are able to acquire or develop. Larger competitors may be able to develop or license IT systems more cost effectively than we can by spreading the cost across a larger revenue base, and competitors with greater financial resources may be able to acquire or develop IT systems that we cannot afford. If we fail to meet the demands of our customers or protect against disruptions of our IT system, we may lose customers, which could seriously harm our business and adversely affect our operating results and operating cash flow.
We may be unable to retain personnel who are key to our operations.
Our success, among other things, is dependent on our ability to attract, develop and retain highly qualified senior management and other key personnel. Competition for key personnel is intense, and our ability to attract and retain key personnel is dependent on a number of factors, including prevailing market conditions and compensation packages offered by companies competing for the same talent. The inability to hire, develop and retain these key employees may adversely affect our operations.
There are risks inherent in international operations that could have a material adverse effect on our business, financial condition and results of operations.
While the majority of our operations are based in the United States, we have significant international operations, with facilities in Canada, China, France, Germany, Israel, Italy, Saudi Arabia,
13
South Korea and the United Kingdom, and customers throughout North America, Latin America, Europe, Asia and the Middle East. For the years ended September 30, 2009 and 2010, 32% and 26%, respectively, of our net sales were derived from customers located outside the United States.
Our international operations are subject to, without limitation, the following risks:
- •
- the burden of complying with multiple and possibly conflicting laws and any unexpected changes in regulatory requirements;
- •
- political risks, including risks of loss due to civil disturbances, acts of terrorism, acts of war, guerilla activities
and insurrection;
- •
- unstable economic, financial and market conditions and increased expenses as a result of inflation, or higher interest
rates;
- •
- difficulties in enforcement of third-party contractual obligations and collecting receivables through foreign legal
systems;
- •
- difficulties in staffing and managing international operations and the application of foreign labor regulations;
- •
- differing local product preferences and product requirements; and
- •
- potentially adverse tax consequences from changes in tax laws, requirements relating to withholding taxes on remittances and other payments by subsidiaries and restrictions on our ability to repatriate dividends from our subsidiaries.
In addition, fluctuations in the value of foreign currencies affect the dollar value of our net investment in foreign subsidiaries, with these fluctuations being included in a separate component of stockholders' equity. At September 30, 2010, we reported a cumulative foreign currency translation adjustment of approximately $4.4 million in stockholders' equity as a result of foreign currency adjustments, and we may incur additional adjustments in future periods. In addition, operating results of foreign subsidiaries are translated into U.S. dollars for purposes of our statement of operations at average monthly exchange rates. Moreover, to the extent that our net sales are not denominated in the same currency as our expenses, our net earnings could be materially adversely affected. For example, a portion of labor, material and overhead costs for our facilities in the United Kingdom, Germany, France and Italy are incurred in British Pounds or Euros, but the related net sales are generally denominated in U.S. dollars. Changes in the value of the U.S. dollar or other currencies could result in material fluctuations in foreign currency translation amounts or the U.S. dollar value of transactions and, as a result, our net earnings could be materially adversely affected. For example, in fiscal 2009, the strengthening of the U.S. dollar relative to the British pound resulted in a negative impact of approximately $22.1 million. Although we at times engage in hedging transactions to manage or reduce our foreign exchange risk, our attempts to manage our foreign currency exchange risk may not be successful and, as a result, our business, financial condition and results of operations could be materially adversely affected.
Our international operations also cause our business to be subject to the U.S. Export Control regime and similar regulations in other countries, in particular in the United Kingdom. In the United States, items of a commercial nature are generally subject to regulatory control by the U.S. Department of Commerce's Bureau of Industry and Security and to Export Administration Regulations, and other international trade regulations may apply as well. Additionally, we are not permitted to export some of the products we sell. In the future, regulatory authorities may require us to obtain export licenses or other export authorizations to export the products we sell abroad, depending upon the nature of items being exported, as well as the country to which the export is to be made. We cannot assure you that any of our applications for export licenses or other authorizations will be granted or approved. Furthermore, the export license and export authorization process is often time-consuming. Violation of
14
export control regulations could subject us to fines and other penalties, such as losing the ability to export for a period of years, which would limit our sales and significantly hinder our attempts to expand our business internationally.
Our international operations require us to comply with anti-corruption laws and regulations of the U.S. government and various international jurisdictions.
Doing business on a worldwide basis requires us and our subsidiaries to comply with the laws and regulations of the U.S. government and various international jurisdictions, and our failure to successfully comply with these rules and regulations may expose us to liabilities. These laws and regulations apply to companies, individual directors, officers, employees and agents, and may restrict our operations, trade practices, investment decisions and partnering activities. In particular, our international operations are subject to U.S. and foreign anti-corruption laws and regulations, such as the U.S. Foreign Corrupt Practices Act, or FCPA. The FCPA prohibits us from providing anything of value to foreign officials for the purposes of influencing official decisions or obtaining or retaining business or otherwise obtaining favorable treatment, and requires companies to maintain adequate record-keeping and internal accounting practices to accurately reflect the transactions of the company. As part of our business, we deal with state-owned business enterprises, the employees and representatives of which may be considered foreign officials for purposes of the FCPA. In addition, some of the international locations in which we operate lack a developed legal system and have elevated levels of corruption. As a result of the above activities, we are exposed to the risk of violating anti-corruption laws.
We are also subject to International Traffic in Arms Regulation, or ITAR. ITAR requires export licenses from the U.S. Department of State for products shipped outside the U.S. that have military or strategic applications. Violations of these legal requirements are punishable by criminal fines and imprisonment, civil penalties, disgorgement of profits, injunctions, debarment from government contracts as well as other remedial measures. We have established policies and procedures designed to assist us and our personnel to comply with applicable U.S. and international laws and regulations. However, there can be no assurance that our policies and procedures will effectively prevent us from violating these regulations in every transaction in which we may engage, and such a violation could adversely affect our reputation, business, financial condition and results of operations.
If any of our customers were to become insolvent or experience substantial financial difficulties, our business, financial condition and results of operations may be adversely affected.
If any of the customers with whom we do business becomes insolvent or experiences substantial financial difficulties we may be unable to timely collect amounts owed to us by such customers and may not be able to sell the inventory we have purchased for such customers, which could have a material adverse effect on our business, financial condition and results of operations. For example, during the year ended September 30, 2009, we wrote off a receivable of $2.4 million and inventory of approximately $1.8 million after one of our customers filed for bankruptcy protection. The majority of these write-offs were recorded as a reduction to receivable and inventory reserves taken during prior fiscal years.
We, our suppliers or our customers may experience damage to or disruptions at our or their facilities caused by natural disasters and other factors.
Several of our facilities or those of our suppliers and customers could be subject to a catastrophic loss caused by earthquakes, tornadoes, floods, hurricanes, fire, power loss, telecommunication and information systems failure or other similar events. Should insurance be insufficient to recover all such losses or should we be unable to reestablish our operations, or if our customers or suppliers were to
15
experience material disruptions in their operations as a result of such events, our business, financial condition and results of operations could be adversely affected.
We are dependent on access to and the performance of third-party package delivery companies.
Our ability to provide efficient distribution of the products we sell to our customers is an integral component of our overall business strategy. We do not maintain our own delivery networks, and instead rely on third-party package delivery companies. We cannot assure you that we will always be able to ensure access to preferred delivery companies or that these companies will continue to meet our needs or provide reasonable pricing terms. In addition, if the package delivery companies on which we rely experience delays resulting from inclement weather or other disruptions, we may be unable to maintain products in inventory and deliver products to our customers on a timely basis, which may adversely affect our business, financial condition and results of operations.
A significant labor dispute involving us or one or more of our customers or suppliers, or a labor dispute that otherwise affects our operations, could reduce our net sales and harm our profitability.
Labor disputes involving us or one or more of our customers or suppliers could affect our operations. For example, a labor dispute affecting Boeing has contributed to delays in the Boeing 787 program and impacted the production of other aircraft platforms. If our customers or suppliers are unable to negotiate new labor agreements and our customers' or suppliers' plants experience slowdowns or closures as a result, our net sales and profitability could be negatively impacted.
While our employees are not currently unionized, they may attempt to form unions in the future, and the employees of our customers, suppliers and other service providers may be, or may in the future be, unionized. We cannot assure you that there will not be any strike, lock out or material labor dispute with respect to our business or those of our customers or suppliers in the future that materially affects our business, financial condition and results of operations.
We may be materially adversely affected by high fuel prices.
Fluctuations in the global supply of crude oil and the possibility of changes in government policies on the production, transportation and marketing of jet fuel make it impossible to predict the future availability and price of jet fuel. In the event there is an outbreak or escalation of hostilities or other conflicts or significant disruptions in oil production or delivery in oil-producing areas or elsewhere, there could be reductions in the production or importation of crude oil and significant increases in the cost of jet fuel. If there were major reductions in the availability of jet fuel or significant increases in its cost, commercial airlines would face increased operating costs. Due to the competitive nature of the airline industry, airlines are often unable to pass on increases in fuel prices to customers by increasing fares. As a result, an increase in jet fuel could result in a decrease in net income from either lower margins or, if airlines increase ticket fares, less net sales from reduced airline travel. Decreases in airline profitability could decrease the demand for new commercial aircraft, resulting in delays of or reductions in deliveries of commercial aircraft that utilize the products we sell, and, as a result, our business, financial condition and results of operations could be materially adversely affected.
Our financial results may fluctuate from period-to-period, making quarter-to-quarter comparisons of our business, financial condition and results of operations less reliable indicators of our future performance.
There are many factors, such as the cyclical nature of the aerospace industry, fluctuations in our ad hoc sales, delays in major aircraft programs, downward pressure on sales prices and changes in the volume of our customers' orders, that could cause our financial results to fluctuate from period-to-period. As a result of these factors, we believe that quarter-to-quarter comparisons of our
16
financial results are not necessarily meaningful and that these comparisons cannot be relied upon as indicators of future performance.
Upon completion of this offering, we will continue to be controlled by Carlyle and its affiliates, whose interests in our business may be different than yours.
The interests of Carlyle and its affiliates could conflict with yours. Upon completion of this offering, certain funds affiliated with Carlyle will own approximately % and % of our common stock, respectively, or approximately % and %, respectively, if the underwriters' overallotment option is exercised in full. As a result of this ownership, Carlyle will continue to have substantial influence over the outcome of votes on all matters requiring approval by our stockholders, including the election of directors, the adoption of amendments to our certificate of incorporation and bylaws and approval of significant corporate transactions. Carlyle will also be able to take actions that have the effect of delaying or preventing a change in control of the Company or discouraging others from making tender offers for our shares, which could prevent stockholders from receiving a premium for their shares. These actions may be taken even if other stockholders oppose them. Moreover, this concentration of stock ownership may make it difficult for stockholders to replace management and may also adversely affect the trading price for our common stock because investors often perceive disadvantages in owning stock in companies with controlling stockholders. In addition, pursuant to the Amended and Restated Stockholders Agreement, Carlyle will continue to have certain rights to appoint directors to our board of directors following the consummation of this offering. See "Certain Relationships and Related Party Transactions." In addition, Carlyle and its affiliates may also in the future own businesses that directly compete with ours.
We are a "controlled company" within the meaning of the rules of the stock exchange on which we will be listed and, as a result, expect to qualify for, and intend to rely on, exemptions from certain corporate governance requirements. You will not have the same protections afforded to stockholders of companies that are subject to such requirements.
Following the consummation of this offering, we expect that Carlyle will continue to control a majority of the voting power of our outstanding common stock. As a result, we expect to be a "controlled company" within the meaning of the corporate governance standards of the stock exchange on which we will be listed. Under these rules, a company of which more than 50% of the voting power is held by an individual, group or another company is a "controlled company" and may elect not to comply with certain corporate governance requirements, including:
- •
- the requirement that a majority of the board of directors consist of independent directors;
- •
- the requirement that we have a nominating and corporate governance committee that is composed entirely of independent
directors with a written charter addressing the committee's purpose and responsibilities;
- •
- the requirement that we have a compensation committee that is composed entirely of independent directors with a written
charter addressing the committee's purpose and responsibilities; and
- •
- the requirement for an annual performance evaluation of the nominating and corporate governance and compensation committees.
Following this offering, we intend to utilize these exemptions if we continue to qualify as a "controlled company." If we utilize these exemptions we will not have a majority of independent directors and our nominating and corporate governance and compensation committees will not consist entirely of independent directors and such committees will not be subject to annual performance evaluations. Accordingly, you will not have the same protections afforded to stockholders of companies that are subject to all of the corporate governance requirements of the listing exchange.
17
We will incur significant increased costs as a result of operating as a publicly traded company, and our management will be required to devote substantial time to new compliance requirements and investor needs.
As a publicly traded company, we will incur significant legal, accounting and other expenses that we did not previously incur. Although we are currently unable to estimate these costs with any degree of certainty, they are likely to be material in amount. In addition, the Sarbanes-Oxley Act of 2002, or the Sarbanes-Oxley Act, and the rules of the Securities and Exchange Commission, or the SEC, and the national securities exchange on which we will be listed have imposed various requirements on public companies. Our management and other personnel will need to devote a substantial amount of time to these compliance initiatives. Moreover, these rules and regulations will increase our legal and financial compliance costs and will make some activities more time-consuming and costly. For example, we expect these rules and regulations to make it more difficult and more expensive for us to obtain director and officer liability insurance, and we may be required to incur substantial costs to maintain appropriate levels of coverage.
If we fail to maintain proper and effective internal controls, our ability to produce accurate and timely financial statements could be impaired and investors' views of us could be harmed.
The Sarbanes-Oxley Act requires, among other things, that we maintain effective internal control over financial reporting and disclosure controls and procedures. In particular, we must perform system and process evaluation and testing of our internal control over financial reporting to allow management and our independent registered public accounting firm to report on the effectiveness of our internal control over financial reporting, as required by Section 404 of the Sarbanes-Oxley Act, with auditor attestation of the effectiveness of our internal controls, beginning with our annual report on Form 10-K for the fiscal year ending September 30, 2012. If we are not able to comply with the requirements of Section 404 in a timely manner, or if we or our independent registered public accounting firm identify deficiencies in our internal control over financial reporting that are deemed to be material weaknesses, the market price of shares of our common stock could decline and we could be subject to sanctions or investigations by the stock exchange on which we will be listed, the SEC or other regulatory authorities, which would require additional financial and management resources.
Our ability to successfully implement our business plan and comply with Section 404 requires us to be able to prepare timely and accurate financial statements. Any delay in the implementation of, or disruption in the transition to, new or enhanced systems, procedures or controls, may cause our operations to suffer and we may be unable to conclude that our internal control over financial reporting is effective and to obtain an unqualified report on internal controls from our auditors as required under Section 404 of the Sarbanes-Oxley Act. Moreover, we cannot be certain that these measures would ensure that we implement and maintain adequate controls over our financial processes and reporting in the future. Even if we were to conclude, and our auditors were to concur, that our internal control over financial reporting provided reasonable assurance regarding the reliability of financial reporting and the preparation of financial statements for external purposes in accordance with accounting principles generally accepted in the U.S., or GAAP, because of its inherent limitations, internal control over financial reporting may not prevent or detect fraud or misstatements. This, in turn, could have an adverse impact on the trading price of our shares of common stock, and could adversely affect our ability to access the capital markets.
We are subject to health, safety and environmental laws and regulations, any violation of which could subject us to significant liabilities and penalties.
We are subject to extensive and changing federal, state, local and foreign laws and regulations establishing health, safety and environmental quality standards and may be subject to liability or penalties for violations of those standards. We are also subject to laws and regulations governing remediation of contamination at facilities currently or formerly owned or operated by us or to which we
18
have sent hazardous substances or wastes for treatment, recycling or disposal. We may be subject to future liabilities or obligations as a result of new or more stringent interpretations of existing laws and regulations. In addition, we may have liabilities or obligations in the future if we discover any environmental contamination or liability at any of our facilities, or at facilities we may acquire.
We could be adversely affected if one of the products we sell causes an aircraft to crash.
We may be exposed to liabilities for personal injury, death or property damage as a result of the failure of a product we have sold. We typically agree to indemnify our customers against certain liabilities resulting from the products we sell. Although we may seek third party indemnification from our suppliers in the event of a product failure, we cannot guarantee that we will be successful in doing so and may ultimately be held liable. While we maintain liability insurance to protect us in these situations, our insurers may attempt to deny coverage or any coverage we have may not be adequate. We also may not be able to maintain insurance coverage in the future at an acceptable cost. Any liability for which third party indemnification is not available that is not covered by insurance could have a material adverse effect on our business, financial condition and results of operations.
In addition, a crash caused by one of the products we have sold could damage our reputation for selling quality products. We believe our customers consider safety and reliability as key criteria in selecting a provider of aircraft products and believe our reputation for quality assurance is a significant competitive strength. If a crash were to be caused by one of the products we sold, or if we were to otherwise fail to maintain a satisfactory record of safety and reliability, our ability to retain and attract customers may be materially adversely affected.
We sell products to a highly regulated industry and our business may be adversely affected if our suppliers or customers lose government approvals, if more stringent government regulations are enacted or if industry oversight is increased.
The aerospace industry is highly regulated in the United States and in other countries. The FAA prescribes standards and other requirements for aircraft components in the U.S. and comparable agencies, such as the European Aviation Safety Agency, the Civil Aviation Administration of China and the Japanese Civil Aviation Bureau, regulate these matters in other countries. Our suppliers and customers must generally be certified by the FAA, the DoD and similar agencies in foreign countries. If any of our suppliers' government certifications are revoked, we would be less likely to buy such supplier's products, and, as a result, would need to locate a suitable alternate supply of such products, which we may be unable to accomplish on commercially reasonable terms or at all. If any of our customers' government certifications are revoked, their demand for the products we sell would decline. In each case, our business, financial condition and results of operations may be adversely affected.
In addition, if new and more stringent government regulations are adopted or if industry oversight increases, our suppliers and customers may incur significant expenses to comply with such new regulations or heightened industry oversight. In the case of our suppliers, these expenses may be passed on to us in the form of price increases, which we may be unable to pass along to our customers. In the case of our customers, these expenses may limit their ability to purchase products from us. In each case, our business, financial condition and results of operations may be adversely affected.
We may be unable to successfully consummate or integrate future acquisitions.
We may consider future acquisitions, some of which could be material to us. Depending upon the acquisition opportunities available, we may need to raise additional funds through the capital markets or arrange for additional debt financing in order to consummate such acquisitions. We may be unable to raise the capital required for future acquisitions on satisfactory terms or at all, which could adversely affect our business, financial condition and results of operations. In addition, we may not be able to
19
successfully integrate acquired businesses into our operations and may be unable to realize any anticipated benefits from future acquisitions, which failure to do so could negatively impact our business, financial condition and results of operations.
Our total assets include substantial intangible assets, and the write-off of a significant portion of our intangible assets would negatively affect our financial results.
Our total assets reflect substantial intangible assets. At September 30, 2010, goodwill and intangible assets, net represented approximately 47% of our total assets. Goodwill represents the excess of the purchase price of acquired businesses over the fair value of the assets acquired and liabilities assumed resulting from acquisitions, including the Carlyle Acquisition. Intangible assets, net represents tradenames, customer backlogs, non-compete agreements and customer relationships. On at least an annual basis, we assess whether there has been an impairment in the value of goodwill and indefinite lived intangible assets. If our testing identifies an impairment under generally accepted accounting principles in the United States, the impairment charge we calculate would result in a charge to operating earnings. Any determination requiring the write-off of a significant portion of goodwill and unamortized identified intangible assets would negatively affect our results of operations and total capitalization, which could be material.
Our substantial indebtedness could adversely affect our financial health and could harm our ability to react to changes to our business.
We have a significant amount of indebtedness. As of December 31, 2010, our total long-term indebtedness outstanding under our old senior secured credit facilities was approximately $606.2 million, which was approximately 51.6% of our total capitalization.
In addition, we may be able to incur substantial additional indebtedness in the future. Although the new senior secured credit facilities contain restrictions on the incurrence of additional indebtedness, these restrictions are subject to a number of significant qualifications and exceptions, and the indebtedness incurred in compliance with these qualifications and exceptions could be substantial. If we incur additional debt, the risks associated with our substantial leverage would increase.
Our substantial indebtedness could have important consequences to investors. For example, it could:
- •
- increase our vulnerability to general economic downturns and industry conditions;
- •
- require us to dedicate a substantial portion of our cash flow from operations to payments on our indebtedness, thereby
reducing the availability of our cash flow to fund working capital, capital expenditures and other general corporate requirements;
- •
- limit our flexibility in planning for, or reacting to, changes in our business and the industry in which we operate;
- •
- place us at a competitive disadvantage compared to competitors that have less debt; and
- •
- limit, along with the financial and other restrictive covenants contained in the documents governing our indebtedness, among other things, our ability to borrow additional funds, make investments and incur liens.
In addition, all of our debt under the new senior secured credit facilities bears interest at floating rates. Accordingly, in the event that interest rates increase, our debt service expense will also increase.
Our substantial level of indebtedness increases the possibility that we may be unable to generate cash sufficient to pay, when due, the principal of, interest on or other amounts due in respect of our indebtedness. We cannot assure you that our business will generate sufficient cash flow from operations
20
or that future borrowings will be available to us under the new senior secured credit facilities or otherwise in amounts sufficient to enable us to service our indebtedness. If we cannot service our debt, we will have to take actions such as reducing or delaying capital investments, selling assets, restructuring or refinancing our debt or seeking additional equity capital and cannot assure you that we will be successful in implementing any such actions or that any actions we take will allow us to stay in compliance with the terms of our indebtedness.
The terms of the new senior secured credit facilities and other debt instruments may restrict our current and future operations, particularly our ability to respond to changes or to take certain actions.
The new senior secured credit facilities contain a number of restrictive covenants that impose significant operating and financial restrictions on us and may limit our ability to engage in acts that may be in our long-term best interests. The new senior secured credit facilities include covenants restricting, among other things, our ability to:
- •
- incur or guarantee additional indebtedness or issue preferred stock;
- •
- pay distributions on, redeem or repurchase our capital stock or redeem or repurchase our subordinated debt;
- •
- make investments;
- •
- sell assets;
- •
- enter into agreements that restrict distributions or other payments from our restricted subsidiaries to us;
- •
- incur or allow to exist liens;
- •
- consolidate, merge or transfer all or substantially all of our assets;
- •
- engage in transactions with affiliates;
- •
- enter into sale leaseback transactions;
- •
- change fiscal periods;
- •
- enter into agreements that restrict the granting of liens or the making of subsidiary distributions;
- •
- create unrestricted subsidiaries; and
- •
- engage in certain business activities.
In addition, the new senior secured credit facilities contain financial maintenance covenants, including a maximum leverage ratio covenant and a minimum interest coverage ratio covenant. A breach of any of these covenants could result in a default under the new senior secured credit facilities. If any such default occurs, the lenders under the new senior secured credit facilities may elect to declare all outstanding borrowings, together with accrued interest and other amounts payable thereunder, to be immediately due and payable. The lenders under the new first lien credit facility also have the right in these circumstances to terminate any commitments they have to provide further borrowings. In addition, following an event of default under the new senior secured credit facilities, the lenders under those facilities will have the right to proceed against the collateral granted to them to secure the debt, which includes our available cash. If the debt under the new senior secured credit facilities was to be accelerated, we cannot assure you that our assets would be sufficient to repay in full our debt.
21
Risks Related to our Common Stock
There is no existing market for our common stock, and we do not know if one will develop to provide you with adequate liquidity to sell our common stock at prices equal to or greater than the price you paid in this offering.
Prior to this offering, there has not been a public market for our common stock. We cannot predict the extent to which investor interest in our company will lead to the development of an active trading market on the stock exchange on which we will list or otherwise or how liquid that market might become. If an active trading market does not develop, you may have difficulty selling any of our common stock that you buy. The initial public offering price for the common stock will be determined by negotiations between us and the representatives of the underwriters and may not be indicative of prices that will prevail in the open market following this offering. Consequently, you may not be able to sell our common stock at prices equal to or greater than the price you paid in this offering, or at all.
The price of our common stock may fluctuate significantly, and you could lose all or part of your investment.
Volatility in the market price of our common stock may prevent you from being able to sell your common stock at or above the price you paid for your common stock. The market price of our common stock could fluctuate significantly for various reasons, including:
- •
- our operating and financial performance and prospects;
- •
- our quarterly or annual earnings or those of other companies in our industry;
- •
- the public's reaction to our press releases, our other public announcements and our filings with the SEC;
- •
- changes in, or failure to meet, earnings estimates or recommendations by research analysts who track our common stock or
the stock of other companies in our industry;
- •
- the failure of analysts to cover our common stock;
- •
- strategic actions by us or our competitors, such as acquisitions or restructurings;
- •
- new laws or regulations or new interpretations of existing laws or regulations applicable to our business;
- •
- changes in accounting standards, policies, guidance, interpretations or principles;
- •
- the impact on our profitability temporarily caused by the time lag between when we experience cost increases until these
increases flow through cost of sales because of our method of accounting for inventory;
- •
- material litigations or government investigations;
- •
- changes in general conditions in the United States and global economies or financial markets, including those resulting
from war, incidents of terrorism or responses to such events;
- •
- changes in key personnel;
- •
- sales of common stock by us or members of our management team;
- •
- termination of lock-up agreements with our management team;
- •
- the granting or exercise of employee stock options;
- •
- the volume of trading in our common stock; and
- •
- the realization of any risks described under "Risk Factors."
22
In addition, in the past two and a half years, the U.S. stock market has experienced significant price and volume fluctuations. This volatility has had a significant impact on the market price of securities issued by many companies, including companies in our industry. The changes frequently appear to occur without regard to the operating performance of the affected companies. Hence, the price of our common stock could fluctuate based upon factors that have little or nothing to do with our company, and these fluctuations could materially reduce our share price and cause you to lose all or part of your investment. Further, in the past, market fluctuations and price declines in a company's stock have led to securities class action litigations. If such a suit were to arise, it could have a substantial cost and divert our resources regardless of the outcome.
If securities analysts do not publish research or reports about our business or if they downgrade our stock, the price of our stock could decline.
The research and reports that industry or financial analysts publish about us or our business may vary widely and may not predict accurate results, but will likely have an effect on the trading price of our common stock. If an industry analyst decides not to cover our company, or if an industry analyst decides to cease covering our company at some point in the future, we could lose visibility in the market, which in turn could cause our stock price to decline. We may be subject to greater risk of losing analyst coverage as a result of the size of this offering and the relative number of shares that will be available for trading in the public market. If an industry analyst downgrades our stock, our stock price would likely decline rapidly in response.
We have no plans to pay regular dividends on our common stock, so you may not receive funds without selling your common stock.
We have no plans to pay regular dividends on our common stock. We generally intend to invest our future earnings, if any, to fund our growth. Any payment of future dividends will be at the discretion of our board of directors and will depend on, among other things, our earnings, financial condition, capital requirements, level of indebtedness, statutory and contractual restrictions applying to the payment of dividends and other considerations that our board of directors deems relevant. The new senior secured credit facilities also effectively limit our ability to pay dividends. Accordingly, you may have to sell some or all of your common stock in order to generate cash flow from your investment. You may not receive a gain on your investment when you sell your common stock and you may lose the entire amount of the investment.
Provisions of our amended and restated certificate of incorporation and amended and restated bylaws and Delaware law might discourage, delay or prevent a change of control of our company or changes in our management and, as a result, depress the trading price of our common stock.
Following this offering, we expect that our amended and restated certificate of incorporation and amended and restated bylaws will contain provisions that could discourage, delay or prevent a change in control of our company or changes in our management that the stockholders of our company may deem advantageous. These provisions will:
- •
- authorize the issuance of blank check preferred stock that our board of directors could issue to increase the number of
outstanding shares and to discourage a takeover attempt;
- •
- limit the ability of stockholders to remove directors if a "group," as defined under Section 13(d)(3) of the
Exchange Act, ceases to own more than 50% of our common stock;
- •
- prohibit our stockholders from calling a special meeting of stockholders;
23
- •
- prohibit stockholder action by written consent, which requires all stockholder actions to be taken at a meeting of our
stockholders, if a "group" ceases to own more than 50% of our common stock;
- •
- provide that our board of directors is expressly authorized to adopt, or to alter or repeal our bylaws; and
- •
- establish advance notice requirements for nominations for election to our board of directors or for proposing matters that can be acted upon by stockholders at stockholder meetings.
These anti-takeover defenses could discourage, delay or prevent a transaction involving a change in control of our company. These provisions could also discourage proxy contests and make it more difficult for you and other stockholders to elect directors of your choosing and cause us to take corporate actions other than those you desire.
Future sales of our common stock in the public market could lower our share price, and any additional capital raised by us through the sale of equity or convertible debt securities may dilute your ownership in us and may adversely affect the market price of our common stock.
We and our existing stockholders may sell additional shares of common stock in subsequent public offerings. We may also issue additional shares of common stock or convertible debt securities to finance future acquisitions. After the consummation of this offering, we will have shares of common stock authorized and shares of common stock outstanding. This number includes shares that the selling stockholders are selling in this offering, which may be resold immediately in the public market. Of the remaining shares, , or % of our total outstanding shares, are restricted from immediate resale under the lock-up agreements between us, all of our directors and executive officers, holders of more than % of our outstanding stock, the selling stockholders and the underwriters described in "Underwriting," but may be sold into the market in the near future. These shares will become available for sale following the expiration of the lock-up agreements, which, without the prior consent of the representatives of the underwriters, is 180 days after the date of this prospectus, subject to compliance with the applicable requirements under Rule 144 of the Securities Act of 1933, or the Securities Act.
We cannot predict the size of future issuances of our common stock or the effect, if any, that future issuances and sales of our common stock will have on the market price of our common stock. Sales of substantial amounts of our common stock (including sales pursuant to Carlyle's registration rights and shares issued in connection with an acquisition), or the perception that such sales could occur, may adversely affect prevailing market prices for our common stock. See "Certain Relationships and Related Party Transactions" and "Shares Eligible for Future Sale."
24
This prospectus contains forward-looking statements. The words "believe," "expect," "anticipate," "intend," "estimate" and other expressions that are predictions of or indicate future events and trends and that do not relate to historical matters identify forward-looking statements. You should not place undue reliance on these forward-looking statements. Although forward-looking statements reflect management's good faith beliefs, reliance should not be placed on forward-looking statements because they involve known and unknown risks, uncertainties and other factors, which may cause the actual results, performance or achievements to differ materially from anticipated future results, performance or achievements expressed or implied by such forward-looking statements. Forward-looking statements speak only as of the date the statements are made. We undertake no obligation to publicly update or revise any forward-looking statement, whether as a result of new information, future events, changed circumstances or otherwise. These forward-looking statements are subject to numerous risks and uncertainties, including, but not limited to:
- •
- general economic and industry conditions;
- •
- changes in military spending;
- •
- risks unique to suppliers of equipment and services to the U.S. government;
- •
- risks associated with our long-term, fixed-price agreements that have no guarantee of future sales volumes;
- •
- risks associated with the loss of significant customers, a material reduction in purchase orders by significant customers
or the delay, scaling back or elimination of significant programs on which we rely;
- •
- our ability to effectively manage our inventory;
- •
- our suppliers' ability to provide us with the products we sell in a timely manner, in adequate quantities and/or at a
reasonable cost;
- •
- our ability to maintain an effective IT system;
- •
- our ability to retain key personnel;
- •
- risks associated with our international operations;
- •
- fluctuations in our financial results from period-to-period;
- •
- Carlyle's ability to control the majority of the voting power of our outstanding common stock;
- •
- our ability to effectively compete in our industry;
- •
- risks related to our indebtedness; and
- •
- other risks and uncertainties, including those listed under the caption "Risk Factors."
We derive many of our forward-looking statements from our operating budgets and forecasts, which are based upon many detailed assumptions. While we believe that our assumptions are reasonable, we caution that it is very difficult to predict the impact of known factors, and it is impossible for us to anticipate all factors that could affect our actual results. Important factors that could cause actual results to differ materially from our expectations are disclosed under "Risk Factors" in this prospectus. All written and oral forward-looking statements attributable to us, or persons acting on our behalf, are expressly qualified in their entirety by the cautionary statements as well as other cautionary statements that are made from time to time in our public communications. You should evaluate all forward-looking statements made in this prospectus in the context of these risks and uncertainties.
25
All of the shares of common stock offered by this prospectus are being sold by the selling stockholders. The selling stockholders in this offering include . We will not receive any of the proceeds from the sale of shares in this offering, including from any exercise by the underwriters of their overallotment option. For information about the selling stockholders, see "Principal and Selling Stockholders."
26
We have not paid dividends in the past and we do not intend to pay any cash dividends for the foreseeable future. We intend to retain earnings, if any, for the future operation and expansion of our business and the repayment of debt. Any determination to pay dividends in the future will be at the discretion of our board of directors and will depend upon our results of operations, cash requirements, financial condition, contractual restrictions, restrictions imposed by applicable laws and other factors that our board of directors may deem relevant. Our existing indebtedness effectively limits our ability to pay dividends and make distributions to our stockholders. For additional information on these limitations see "Management's Discussion and Analysis of Financial Condition and Results of Operations—Liquidity and Capital Resources—Senior Secured Credit Facilities—New Senior Secured Credit Facilities."
27
The following table sets forth our consolidated cash and cash equivalents and capitalization as of December 31, 2010 on an actual basis and as adjusted basis giving effect to the following, each of which will occur immediately prior to the effectiveness of this registration statement: (i) the adoption of our amended and restated certificate of incorporation, which will provide for authorized capital stock consisting of (1) shares of common stock, $0.001 par value per share, and (2) shares of preferred stock, $0.001 par value per share, (ii) the conversion of shares of Class B common stock into shares of common stock, on a one-for-one basis, pursuant to our amended and restated certificate of incorporation, which will be effective prior to the consummation of this offering, and (iii) the effectuation of a for stock split with respect to our common stock, which will include the shares of Class B common stock that will have been converted, on a one-for-one basis, into shares of common stock.
The information in this table should be read in conjunction with "Selected Consolidated Financial Data," "Management's Discussion and Analysis of Financial Condition and Results of Operations" and our financial statements and related notes thereto included elsewhere in this prospectus.
| |
December 31, 2010 | ||||||||
|---|---|---|---|---|---|---|---|---|---|
| |
Actual | As Adjusted | |||||||
| |
(unaudited; in thousands, except share and per share data) |
||||||||
Cash and cash equivalents |
$ | 27,266 | $ | ||||||
Long-term debt, less current portion: |
|||||||||
First lien credit facility(1) |
$ | 477,243 | $ | ||||||
Second lien credit facility(1) |
129,000 | ||||||||
Total long-term debt, less current portion |
606,243 | ||||||||
Capital lease obligations, less current portion |
1,402 | ||||||||
Total stockholders' equity: |
|||||||||
Preferred stock, $0.001 par value per share: 1,000,000 shares authorized, no shares issued and outstanding, actual; shares authorized, no shares issued and outstanding, as adjusted |
— |
— |
|||||||
Common stock, $0.001 par value per share: 19,000,000 shares authorized; 9,319,450 shares issued and outstanding, actual; shares authorized, shares issued and outstanding, as adjusted |
9 | ||||||||
Class B common stock, $0.001 par value per share: 2,000,000 shares authorized; 125,327 shares issued and outstanding, actual; no shares authorized, no shares issued and outstanding, as adjusted |
1 | ||||||||
Additional paid-in capital |
329,619 | ||||||||
Retained earnings: |
|||||||||
Beginning of period |
223,761 | ||||||||
Current period earnings |
21,670 | ||||||||
Accumulated other comprehensive loss |
(7,617 | ) | |||||||
Total stockholders' equity |
567,443 | ||||||||
Total capitalization |
$ | 1,175,088 | $ | ||||||
- (1)
- On April 7, 2011, we entered into the new senior secured credit facilities. See "Prospectus Summary—Recent Developments." The proceeds of the new senior secured credit facilities were used to repay the old senior secured credit facilities and pay certain related fees and expenses. For a description of the new senior secured credit facilities and the old senior secured credit facilities,
28
see "Management's Discussion and Analysis of Financial Condition and Results of Operations—Liquidity and Capital Resources—Senior Secured Credit Facilities."
The table set forth above is based on the number of shares of our common stock outstanding as of December 31, 2010. The table does not reflect:
- •
- shares of common stock issuable upon the exercise of options outstanding as of December 31, 2010 at
a weighted average exercise price of $ per share;
- •
- shares of common stock issuable pursuant to restricted stock units on the earlier of September 28,
2012 or the occurrence of a change in control, as defined in the applicable award agreement;
- •
- shares of restricted common stock that are scheduled to vest in equal installments at the close of each
calendar quarter remaining in 2011; and
- •
- shares of common stock reserved for issuance under the 2011 Equity Incentive Award Plan, which we plan to adopt in connection with this offering.
29
If you invest in our common stock, your interest will be diluted to the extent of the difference between the initial public offering price per share and the net tangible book value per share after this offering.
As of December 31, 2010, we had a negative net tangible book value of approximately $ , or $ per share. Net tangible book value per share represents total tangible assets less total liabilities divided by the number of shares of common stock outstanding. After deducting estimated offering expenses payable by us in connection with this offering, our net tangible book value as of December 31, 2010 would have been approximately $ million, or $ per share. This represents an immediate in net tangible book value of $ per share to existing stockholders and an immediate dilution of $ per share to new investors purchasing common stock in this offering. The following table illustrates this dilution on a per share basis:
| |
Per Share | |
|---|---|---|
Assumed initial public offering price per share |
||
Net tangible book value per share as of December 31, 2010 |
||
in net tangible book value per share attributable to this offering |
||
Net tangible book value per share after this offering |
||
Dilution per share to new investors |
The following table sets forth, as of December 31, 2010, the total number of shares of common stock owned by existing stockholders and to be owned by new investors, the total consideration paid and the average price per share paid by our existing stockholders and to be paid by new investors purchasing shares of common stock in this offering. The calculation below is based on an assumed initial public offering price of $ per share, the midpoint of the price range set forth on the cover page of this prospectus, before deducting the underwriting discounts and commissions and estimated offering expenses payable by us.
| |
Shares Purchased | Total Consideration | |
||||||||||||||
|---|---|---|---|---|---|---|---|---|---|---|---|---|---|---|---|---|---|
| |
Average Price Per Share |
||||||||||||||||
| |
Number | Percent | Amount | Percent | |||||||||||||
| |
(In thousands, other than shares and percentages) |
||||||||||||||||
Existing stockholders |
% | $ | % | $ | |||||||||||||
New investors |
|||||||||||||||||
Total |
% | $ | % | $ | |||||||||||||
Each $1.00 increase (decrease) in the assumed initial public offering price of $ per share, the midpoint of the price range set forth on the cover page of this prospectus, would increase (decrease) total consideration paid by all investors in this offering by $ million, after deducting underwriting discounts and commissions and estimated offering expenses payable by us and assuming that the number of shares offered by the selling stockholders, as set forth on the cover page of this prospectus, remains the same. Each increase (decrease) of 1.0 million in the number of shares offered by the selling stockholders would increase (decrease) total consideration paid by all investors in this offering by $ million, at the assumed public offering price of $ per share, after deducting estimated underwriting discounts and commissions and estimated offering expenses payable by us, assuming the assumed public offering price of $ per share, which is the midpoint of the price range set forth on the cover page of this prospectus.
30
If the underwriters' overallotment option to purchase additional shares from the selling stockholders in this offering is exercised in full, the following will occur:
- •
- the number of shares of our common stock held by existing stockholders after the completion of this offering will be
, or approximately % of the total number of shares of our
common stock outstanding after this offering; and
- •
- the number of shares of our common stock held by new investors in this offering after the completion of this offering will be , or approximately % of the total number of shares of our common stock outstanding after this offering.
The tables and calculations above assume no exercise of outstanding options. As of , there were shares of common stock issuable upon exercise of outstanding options at a weighted average exercise price of approximately $ per share. To the extent that the outstanding options are exercised, there will be further dilution to new investors purchasing common stock in the offering. See "Description of Capital Stock."
31
SELECTED CONSOLIDATED FINANCIAL DATA
The selected income statement and other data for each of the years ended September 30, 2008, 2009 and 2010 and the selected balance sheet data as of September 30, 2009 and 2010 have been derived from our audited consolidated financial statements that are included in this prospectus. The selected income statement and other data for the years ended September 30, 2006 and 2007 and the selected balance sheet data as of September 30, 2006, 2007 and 2008 have been derived from audited consolidated financial statements that are not included in this prospectus. The table below presents separately the period prior to the Carlyle Acquisition, or the Predecessor, on September 29, 2006 and the periods after the Carlyle Acquisition, or the Successor, to recognize the application of a different basis of accounting. Our selected historical income statement data for the three months ended December 31, 2009 and December 31, 2010 and our selected historical balance sheet data as of December 31, 2010 have been derived from our unaudited financial statements included elsewhere in this prospectus that, in the opinion of management, include normal recurring adjustments necessary for a fair presentation of the results for the unaudited interim period. The selected historical balance sheet data as of December 31, 2009 have been derived from our unaudited financial statements not included in this prospectus. Results for the three months ended December 31, 2010 are not necessarily indicative of the results that may be expected for the year ending September 30, 2011 or for any other period.
The financial data set forth below are not necessarily indicative of future results of operations. This data should be read in conjunction with, and is qualified in its entirety by reference to, the "Management's Discussion and Analysis of Financial Condition and Results of Operations" and "Capitalization" sections and our financial statements and notes thereto included elsewhere in this prospectus.
32
| |
|
Successor | ||||||||||||||||||||||
|---|---|---|---|---|---|---|---|---|---|---|---|---|---|---|---|---|---|---|---|---|---|---|---|---|
| |
Predecessor | |
|
|
|
Three Months Ended December 31, |
||||||||||||||||||
| |
Year Ended September 30, | |||||||||||||||||||||||
| |
Year Ended September 30, 2006(1) |
|||||||||||||||||||||||
| (Dollars in thousands, except per share data) |
2007 | 2008 | 2009 | 2010 | 2009 | 2010 | ||||||||||||||||||
| |
|
|
|
|
|
(unaudited) |
||||||||||||||||||
Consolidated statements of income (loss): |
||||||||||||||||||||||||
Net sales: |
||||||||||||||||||||||||
North America |
$ | 336,670 | $ | 416,899 | $ | 551,135 | $ | 557,874 | $ | 603,809 | $ | 132,490 | $ | 160,483 | ||||||||||
Rest of the World |
68,033 | 89,888 | 112,623 | 102,796 | 95,342 | 23,296 | 26,071 | |||||||||||||||||
Intercompany elimination |
(27,071 | ) | (38,207 | ) | (59,415 | ) | (47,983 | ) | (43,115 | ) | (8,980 | ) | (13,026 | ) | ||||||||||
Net sales |
377,632 | 468,580 | 604,343 | 612,687 | 656,036 | 146,806 | 173,528 | |||||||||||||||||
Gross profit: |
||||||||||||||||||||||||
North America |
144,015 | 171,006 | 221,898 | 204,296 | 226,497 | 47,659 | 59,477 | |||||||||||||||||
Rest of the World |
22,412 | 36,698 | 42,143 | 39,733 | 34,167 | 8,698 | 8,837 | |||||||||||||||||
Intercompany elimination |
(2,746 | ) | (5,078 | ) | (7,433 | ) | (5,742 | ) | (6,434 | ) | (1,714 | ) | (1,615 | ) | ||||||||||
Gross profit |
163,681 | 202,626 | 256,608 | 238,287 | 254,230 | 54,643 | 66,699 | |||||||||||||||||
Selling, general and administrative expenses: |
||||||||||||||||||||||||
North America |
158,494 | 71,998 | 84,807 | 86,007 | 81,674 | 20,143 | 20,479 | |||||||||||||||||
Rest of the World |
16,599 | 18,320 | 20,951 | 17,888 | 18,241 | 4,615 | 4,909 | |||||||||||||||||
Selling, general and administrative expenses |
175,093 | (2) | 90,318 | 105,758 | 103,895 | 99,915 | 24,758 | 25,388 | ||||||||||||||||
Income (loss) from operations |
(11,412 | ) | 112,308 | 150,850 | 134,392 | 154,315 | 29,885 | 41,311 | ||||||||||||||||
Interest income (expense), net |
1,018 | (55,817 | ) | (48,743 | ) | (37,707 | ) | (36,270 | ) | (8,579 | ) | (6,277 | ) | |||||||||||
Other income (expense), net |
(11,318 | ) | (2,857 | ) | 746 | (376 | ) | (458 | ) | (41 | ) | 516 | ||||||||||||
Income (loss) before provision for income taxes |
(21,712 | ) | 53,634 | 102,853 | 96,309 | 117,587 | 21,265 | 35,550 | ||||||||||||||||
Provision for income taxes |
872 | 20,596 | 44,251 | 37,862 | 43,913 | 7,194 | 13,880 | |||||||||||||||||
Net income (loss) |
$ | (22,584 | ) | $ | 33,038 | $ | 58,602 | $ | 58,447 | $ | 73,674 | $ | 14,071 | $ | 21,670 | |||||||||
Earnings per share data: |
||||||||||||||||||||||||
Net income per share: |
||||||||||||||||||||||||
Basic |
$ | 3.52 | $ | 6.22 | $ | 6.19 | $ | 7.32 | $ | 1.40 | $ | 2.15 | ||||||||||||
Diluted |
$ | 3.48 | $ | 6.02 | $ | 5.87 | $ | 7.28 | $ | 1.40 | $ | 2.11 | ||||||||||||
Weighted average shares outstanding: |
||||||||||||||||||||||||
Basic |
9,384,384 | 9,420,433 | 9,440,596 | 10,063,237 | 10,063,237 | 10,063,905 | ||||||||||||||||||
Diluted |
9,487,710 | 9,740,158 | 9,964,748 | 10,118,648 | 10,063,487 | 10,284,934 | ||||||||||||||||||
| |
Successor | ||||||||||||||||||||||
|---|---|---|---|---|---|---|---|---|---|---|---|---|---|---|---|---|---|---|---|---|---|---|---|
| |
Year Ended September 30, | Three Months Ended December 31, |
|||||||||||||||||||||
| |
2006(3) | 2007 | 2008 | 2009 | 2010 | 2009 | 2010 | ||||||||||||||||
| |
|
|
|
|
|
(unaudited) |
|||||||||||||||||
Consolidated balance sheet data: |
|||||||||||||||||||||||
Cash and cash equivalents |
$ | 80,022 | $ | 12,863 | $ | 15,998 | $ | 11,406 | $ | 39,463 | $ | 29,969 | $ | 27,266 | |||||||||
Total assets |
1,017,416 | 987,228 | 1,173,620 | 1,254,812 | 1,279,012 | 1,261,115 | 1,281,839 | ||||||||||||||||
Total long-term debt and capital lease obligations(4) |
600,143 | 589,269 | 688,128 | 684,268 | 622,032 | 683,192 | 607,645 | ||||||||||||||||
Total stockholders' equity |
285,967 | 335,783 | 409,773 | 473,940 | 545,739 | 485,937 | 567,443 | ||||||||||||||||
- (1)
- The
effective date of the Carlyle Acquisition was at the close of business on September 29, 2006, the last business day of the Predecessor's 2006
fiscal year. September 30, 2006 was a weekend day and, as a result, the successor did not conduct any operations on that day. Due to the immateriality of the one day period ended
September 30, 2006, the successor has accounted for the commencement of its operations as of October 1, 2006.
- (2)
- Includes
$72.6 million of compensation costs related to the Carlyle Acquisition.
- (3)
- The
selected balance sheet data as of September 30, 2006 presents the financial position of the Successor after giving effect to the acquisition as a
business combination, which resulted in a new valuation for our assets and liabilities and our subsidiaries based upon fair value as of the date of the acquisition.
- (4)
- Total long-term debt and capital lease obligations excludes current portion.
33
MANAGEMENT'S DISCUSSION AND ANALYSIS OF
FINANCIAL CONDITION AND RESULTS OF OPERATIONS
The following discussion contains forward-looking statements that involve risks and uncertainties. Our actual results may differ materially from those discussed in the forward looking statements as a result of various factors, including, without limitation, those set forth in "Risk Factors," "Forward-Looking Statements" and other matters included elsewhere in this prospectus. The following discussion of our financial condition and results of operations should be read in conjunction with our financial statements and the notes thereto included elsewhere in this prospectus, as well as the information presented under "Selected Consolidated Financial Data."
Executive Overview
We are one of the world's largest distributors and providers of comprehensive supply chain management services to the global aerospace industry. Our services range from traditional distribution to the management of supplier relationships, quality assurance, kitting, JIT delivery and point-of-use inventory management. We supply approximately 450,000 different SKUs, including hardware, bearings, tools and more recently, electronic components and machined parts. In fiscal 2010, sales of hardware represented 80% of our net sales, with highly engineered fasteners constituting 83% of that amount. We serve our customers under three types of arrangements: JIT contracts, which govern comprehensive outsourced supply chain management services; LTAs, which set prices for specific parts; and ad hoc sales. JIT contracts and LTAs, which together comprised approximately 63% of our fiscal 2010 net sales, are multi-year arrangements that provide us with significant visibility into our future sales.
Founded in 1953 by the father of our current CEO, Wesco has grown to serve over 7,200 customers in the commercial, military and general aviation sectors, including the leading OEMs and their subcontractors, through which we support nearly all major Western aircraft programs. We have grown our net sales at a 16% CAGR over the past 10 years to $656.0 million in fiscal 2010. We serve a large and growing global market, and believe that with more than 1,000 employees across 28 locations in 10 countries, we are well positioned to continue our track record of strong long-term growth and profitability.
On September 29, 2006, 100% of the outstanding stock of Wesco Aircraft Hardware Corp., Wesco Aircraft Israel and the European entities of Flintbrook Ltd., Wesco Aircraft France and Wesco Aircraft Germany were acquired by Wesco Aircraft Holdings, Inc., which we refer to as the Carlyle Acquisition. The acquisition was completed in a leveraged transaction in which affiliates of Carlyle, the prior owner and certain employees of Wesco contributed the equity portion of the purchase price. The prior owner's and certain employees' investment represented a contribution of ownership in the predecessor company to the newly formed holding company. In accordance with Accounting Standards Codification, or ASC, 805, Business Combinations, the acquired assets and liabilities have been recorded at fair value for the interests acquired by new investors and at carryover basis for the continuing investors.
On June 30, 2008, Wesco Aircraft Hardware Corp. acquired 100% of the outstanding stock of Airtechnics Inc., or Airtechnics, a distributor of electronic components for the aerospace industry, which we refer to as the Airtechnics Acquisition. The acquisition was funded through a provision in the old senior secured credit facilities (as defined below) that provided for additional borrowing under existing credit terms. Operating cash was also used by us to pay a portion of the purchase price and cover transaction fees and expenses. The assets and liabilities have been recorded at fair value for the interests we acquired.
Recent Developments
On April 7, 2011, Wesco Aircraft Hardware Corp. entered into a new $765.0 million senior secured credit facility with Barclays Bank PLC, as administrative agent and collateral agent, and Merrill Lynch,
34
Pierce, Fenner & Smith, Incorporated, Key Bank, N.A. and Barclays Capital, as joint lead arrangers, which we refer to as the new senior secured credit facilities.
The purpose of the refinancing was to extend the maturity dates under the term loans of Wesco Aircraft Hardware Corp.'s existing senior secured credit facilities, which we refer to as the old senior secured credit facilities, increase the borrowing capacity under our revolver and pay related fees and expenses. The new senior secured credit facilities consist of a (i) $150.0 million revolving credit facility, which we refer to as the new revolving facility, (ii) $265.0 million term loan A facility, which we refer to as the new term loan A facility, and (iii) $350.0 million term loan B facility, which we refer to as the new term loan B facility. Wesco Aircraft is a guarantor of the new senior secured credit facilities.
Industry Trends Affecting Our Business
Commercial Aerospace Market
We rely on demand for new commercial aircraft for a significant portion of our sales. Commercial aircraft demand is driven by many factors, including airline passenger volumes, airline profitability, the introduction of new aircraft models, general economic conditions and the aging life cycle of current fleets.
During 2008 and 2009, our customers were impacted by the global recession and weak demand for air passenger travel, which resulted in significant losses for the global airline industry. According to Airline Monitor, during 2010, as the global economy began to recover, RPMs, a key measure of airline passenger volumes, grew approximately 5.5%. RPMs are expected to grow at approximately 5.9% annually, on average, from 2010 to 2020, due to the economic recovery in developed economies, continued growth in emerging markets, particularly in the Asia-Pacific region, and the secular trend towards increased air travel globally. Increased passenger traffic volumes and the return to profitability of the global airline industry have renewed demand for commercial aircraft, particularly for more fuel efficient models, such as the Boeing 787 and Airbus A350. According to Airline Monitor, annual deliveries of the Boeing 787 are projected to increase from 20 in 2011 to over 100 by 2014, and Airbus expects A350 deliveries to commence in 2013. Commercial MRO providers are expected to benefit from similar growth trends to those impacting the commercial OEM market, in particular, increased RPMs, which will in turn drive growth in the commercial fleet and greater utilization of existing aircraft.
Growth in the commercial aerospace market is also expected to be aided by a recovery in business jet and regional jet deliveries. According to the FAA, business jet activity increased by over 11% in 2010 compared to 2009, and Honeywell projects that deliveries of business jets will increase from approximately 675 in 2010 to in excess of 1,000 in 2015. According to Airline Monitor, regional jet deliveries are expected to increase from approximately 135 in 2010 to 270 in 2015.
Military Aerospace Market
A significant portion of our sales are also reliant on demand for new military aircraft, which is primarily driven by government spending, the timing of military aircraft orders and evolving DoD strategies and policies. We believe the diversity of the military aircraft programs we service can help us mitigate the impact of program delays, changes or cancellations, through increased sales to other active programs that directly benefit from such delays, changes or cancellations. For example, we believe the delay in production of the Lockheed Martin JSF has resulted in an increase in our sales to manufacturers of the F-18. Going forward, we believe that our military aerospace business will be driven by increases in the production of the JSF, a program on which we believe our business is well positioned. According to Forecast International, deliveries of the JSF are expected to increase from 20 in 2011 to 98 by 2016.
35
We also support customers in the military aerospace MRO market and believe that our presence in this market helps us mitigate the volatility of new military aircraft sales with sales to the aftermarket. We expect demand in the military MRO market to be driven by requirements to maintain aging military fleets, changes in the overall fleet size and the level of U.S. military activity overseas.
Other Factors Affecting Our Financial Results
Fluctuations in Revenue
There are many factors, such as fluctuations in ad hoc sales, timing of aircraft deliveries, changes in selling prices and the volume or timing of customer orders, that can cause fluctuations in our financial results from quarter-to-quarter. To normalize for short-term fluctuations, we tend to look at our performance over several quarters or years of activity rather than discrete short-term periods. As such, it can be difficult to determine longer-term trends in our business based on quarterly comparisons.
We will continue our strategy of seeking to expand our relationships with existing customers by transitioning them to our comprehensive JIT supply chain management services as well as expanding relationships with our existing JIT customers to include additional customer sites and additional SKUs. We believe this strategy serves to mitigate fluctuations in our net sales. However, we have recently been notified by Boeing of its intent to perform certain supply chain management functions in-house that we are currently providing at two Boeing facilities under JIT contracts that were awarded to us when these particular facilities were under different ownership. In fiscal 2010, sales under these contracts accounted for approximately 5.8% of our net sales. Additionally, although we derive a significant portion of our net sales from the building of new commercial and military aircraft, we have not typically experienced extreme fluctuations in our net sales when sales for an individual aircraft program decrease, which we believe is attributable to our diverse base of customers and programs. In addition, we believe our substantial sales under JIT contracts and LTAs help to mitigate fluctuations in our financial results, as JIT and LTA customers tend to have steadier purchasing patterns than ad hoc customers.
Fluctuations in Margins
We entered the electronic components business in 2008 after the Airtechnics Acquisition. As we continue to grow our electronics products group, or EPG, business, we expect that EPG sales as a percentage of our total net sales will increase. Gross profit margins on EPG products are lower than the gross profit margins on many of our other products, which we believe will result in a reduction in our overall gross profit margins as our EPG sales increase.
We believe that our strategy of growing our JIT and LTA sales and converting ad hoc customers into JIT and LTA customers will negatively affect our gross profit margins, as gross profit margins tend to be higher on ad hoc sales than they are in JIT and LTA-related sales. However, we believe any potential adverse impact on our gross profit margins is outweighed by the more stable long-term revenue stream attributable to JIT contracts and LTAs.
Our JIT contracts and LTAs generally provide for fixed prices, which can expose us to risks if prices we pay to our suppliers rise due to increased raw material or other costs. However, we believe our expansive product offerings and inventories, our ad hoc sales and, where possible, our longer-term agreements with suppliers have enabled us to mitigate this risk.
Fluctuations in Cash Flow
We believe our cash flows may be affected by fluctuations in our inventory that can occur over time. When we are awarded new programs, we generally increase our inventory to account for expected
36
sales related to the new program, which often take time to materialize. As a result, if certain programs for which we have procured inventory are delayed, we may experience a more sustained inventory increase. For example, we increased our inventory in anticipation of deliveries of the Boeing 787, which have been significantly delayed.
Inventory fluctuations may also be attributable to general industry trends. For example, as production in the global aerospace industry increases, we typically see an increase in demand from our customers and a delay in deliveries from our suppliers, which tends to result in a temporary inventory reduction and increased cash flow. However, when production in the aerospace industry decreases, our suppliers are able to catch up on our outstanding orders, while demand from our customers decreases, which tends to result in an increase in inventory levels and decreased cash flow. For example, in 2009, as a result of the global economic recession, production in the aerospace industry decreased, freeing up our suppliers to ship previously ordered products to us faster than expected. As a result, we experienced an inventory build of approximately $111.1 million during fiscal 2009. Although we have made, and continue to make, adjustments to our purchasing practices in order to mitigate the effect of inventory fluctuations on our cash flows, inventory fluctuations continue to occur and, as a result, will continue to impact our cash flows.
Segment Presentation
We conduct our business through two reportable segments: North America and Rest of the World. We evaluate segment performance based on segment operating earnings or loss. Each segment reports its results of operations and makes requests for capital expenditures and acquisition funding to our chief operating decision-maker, or CODM. Our Chief Executive Officer serves as our CODM. Each operating segment has separate management teams and infrastructures dedicated to providing a full range of products and services to their respective customers.
Key Components of Our Results of Operations
The following is a discussion of the key line items included in our financial statements for the periods presented below under the heading "Results of Operations." These are the measures that management utilizes to assess our results of operations, anticipate future trends and evaluate risks in our business.
Net Sales
Our net sales include sales of C class aerospace parts, including hardware, bearings, electronic components, machined parts and installation tooling, and eliminate all intercompany sales. We also provide certain services to our customers, including quality assurance, kitting and JIT supply chain management. However, these services are generally performed in connection with the sale of our products, and as such, the price of such services is included in the price of the products delivered to customers. We do not account for these services as a separate element, as the services do not generally have stand-alone value and typically cannot be separated from the product element of the arrangement. There are no significant post-delivery obligations associated with these services.
We sell products and services to our customers using three types of contractual arrangements: JIT supply chain management contracts, LTAs and individual ad hoc sales. In 2009 and 2010, we experienced a decrease in ad hoc sales due to a weakening aerospace market that resulted in customers reducing their on-hand inventory and our strategy of transitioning ad hoc sales to JIT contracts or LTAs in an effort to achieve a more predictable revenue stream. JIT contracts and LTAs typically run for three to five years. Under JIT contracts, customers commit to purchase specified parts from us at a fixed price, on an if-and-when needed basis, and we are responsible for maintaining high levels of stock availability of those parts. LTAs are essentially negotiated price lists for customers or individual
37
customer sites that cover a range of pre-determined parts, purchased on an as-needed basis. Ad hoc customers purchase parts from us on an as-needed basis and are generally supplied out of our existing inventory. In addition, JIT and LTA customers often purchase parts that are not captured under their contract on an ad hoc basis.
EPG was not fully integrated into our enterprise resource planning, or ERP, system until the middle of 2009. As a result, in the discussion of our results of operations, the discussion related to JIT, LTA and ad hoc sales as a percentage of net sales does not include EPG sales, other than for the comparison of the three months ended December 31, 2009 to the three months ended December 31, 2010. We expect that future discussions of our JIT, LTA and ad hoc sales will include EPG sales.
Cost of Sales
The principal components of our cost of sales are product costs, freight and expediting fees, import duties, tooling repair charges, amortization of inventory step-up, inventory excess and obsolescence write-down, packaging supplies and physical inventory adjustment charges. Product cost is determined by the current weighted average cost of each inventory item. Inventory write-down is calculated to estimate the amount of excess and obsolete inventory we currently have on-hand, based on historical and forecasted sell-through rates. We review inventory for excess and obsolescence write-down monthly and adjust the expense and future forecasted sell-through rates as necessary.
Cost of sales, as a percentage of net sales, trended up during fiscal 2009 and 2010, as our ad hoc sales, as a percentage of net sales declined. This occurred as a result of our strategy to transition more ad hoc sales to LTA and JIT sales, as well as the effect of the recession. Ad hoc sales typically have higher margins than LTA and JIT sales. Also, in 2009 we had the first full year impact of EPG sales after the Airtechnics Acquisition, which sales typically have lower margins than hardware sales.
Selling, General and Administrative Expenses
The principal components of our selling, general and administrative expenses are salaries, wages, benefits and bonuses paid to our employees; stock-based compensation; commissions paid to outside sales representatives, or OSRs; travel and other business expenses; training and recruitment costs; marketing, advertising and promotional event costs; rent; bad debt expense; professional services fees (including legal, audit and tax); and ordinary day-to-day business expenses. Depreciation and amortization expense is also included in selling, general and administrative expenses, and consists primarily of scheduled depreciation for leasehold improvements, machinery and equipment, vehicles, computers, software and furniture and fixtures. Depreciation and amortization also includes intangible amortization expense.
Selling, general and administrative expenses, as a percentage of net sales, have continued to decline as we have leveraged the fixed cost and labor component of our infrastructure while consolidated net sales have grown. We may experience an increase in selling, general and administrative expenses as a result of one-time costs associated with our initial public offering and ongoing costs associated with being a public company.
Other Expenses
Interest Expense, net. Interest expense, net consists of the interest we pay on our short-term and long-term debt, fees on our revolver and our line-of-credit, deferred financing costs and the costs of hedging agreements, net of interest income.
Other Income (Expense), net. Other income (expense), net is primarily comprised of unrealized foreign exchange gain or loss associated with transactions denominated in currencies other than the respective functional currency of the reporting subsidiary.
38
Critical Accounting Policies and Estimates
The methods, estimates and judgments we use in applying our most critical accounting policies have a significant impact on the results we report in our financial statements. We evaluate our estimates and judgments on an on-going basis. We base our estimates on historical experience and on assumptions that we believe to be reasonable under the circumstances. Our experience and assumptions form the basis for our judgments about the carrying value of assets and liabilities that are not readily apparent from other sources. Actual results may vary from what we anticipate, and different assumptions or estimates about the future could change our reported results. We believe the following accounting policies are the most critical in that they significantly affect our financial statements, and they require our most significant estimates and complex judgments.
Inventories
Our inventory is comprised solely of finished goods. Inventories are stated at the lower of weighted-average cost or market and in-bound freight-related costs are included as part of the cost of inventory held for resale. We record provisions, as appropriate, to write-down excess and obsolete inventory to estimated net realizable value. The process for evaluating excess and obsolete inventory often requires us to make subjective judgments and estimates concerning future sales levels, quantities and prices at which such inventories will be able to be sold in the normal course of business.
Demand for our products can fluctuate significantly. Our estimates of future product demand may prove to be inaccurate, in which case we may have understated or overstated the write-down required for excess and obsolete inventories. In the future, if our inventories are determined to be overvalued, we would be required to recognize such costs in our cost of goods sold at the time of such determination. Likewise, if our inventories are determined to be undervalued, we may have over-reported our costs of goods sold in previous periods and would be required to recognize such additional operating income at the time of the determination.
Goodwill and Indefinite-Lived Intangible Assets
Goodwill represents the excess of the aggregate purchase price over the fair value of the net assets acquired in a purchase business combination. In accordance with the provisions of ASC 350, Intangibles—Goodwill and Other, goodwill and indefinite-lived intangible assets acquired in a business combination are not amortized, but instead tested for impairment at least annually or more frequently should an event occur or circumstances indicate that the carrying amount may be impaired. Such events or circumstances may be a significant change in business climate, economic and industry trends, legal factors, negative operating performance indicators, significant competition, changes in strategy, or disposition of a reporting unit or a portion thereof. Goodwill impairment testing is performed at the reporting unit level on July 1 of each year.
Goodwill impairment testing is a two-step test. The first step identifies potential impairment by comparing the fair value of a reporting unit with its carrying amount, including goodwill. For all periods presented, our reporting units are consistent with our operating segments. The estimates of fair value of a reporting unit are determined based on a discounted cash flow analysis and market earnings multiples. A discounted cash flow analysis requires us to make various judgmental assumptions, including assumptions about future cash flows, growth rates and discount rates. These assumptions about future cash flows and growth rates are based on the forecast and long-term business plans of each operating segment. Discount rate assumptions are based on an assessment of the risk inherent in the future cash flows of the respective reporting units. If the fair value exceeds its carrying amount, goodwill is not considered impaired and the second step of the test is unnecessary. If the carrying amount of a reporting unit's goodwill exceeds its fair value, the second step measures the impairment loss, if any. The second step compares the implied fair value of goodwill with the carrying amount of
39
that goodwill. The implied fair value of goodwill is determined in the same manner as the amount of goodwill recognized in a business combination. If the carrying amount of goodwill exceeds the implied fair value of that goodwill, an impairment loss is recognized in an amount equal to that excess.
Application of the goodwill impairment test requires judgment, including the identification of reporting units, assignment of assets and liabilities to reporting units, assignment of goodwill to reporting units, and determination of the fair value of each reporting unit. Changes in these estimates and assumptions could materially affect the determination of fair value and/or goodwill impairment for each reporting unit.
We reviewed the carrying value of our indefinite lived intangible assets by comparing such amount to its fair value and determined that the carrying amount did not exceed its respective fair value. During the years ended September 30, 2008, 2009 and 2010 the fair value of our reporting units was substantially in excess of the reporting units' carrying values. Additionally, the fair value of our indefinite lived intangible assets was substantially in excess of its carrying value. Accordingly, management believes there are no impairments as of September 30, 2010 related to either goodwill or the indefinite-lived intangible asset.
Revenue Recognition
We recognize product and service revenue when (i) persuasive evidence of an arrangement exists, (ii) title transfers to the customer, (iii) the sales price charged is fixed or determinable and (iv) collection is reasonably assured. In instances where title does not pass to the customer upon shipment, we recognize revenue upon delivery or customer acceptance, depending on the terms of the sales contract.
In connection with the sale of our products, we often provide certain supply chain services. These services are provided exclusively in connection with the sale of products, and as such, the price of such services is generally included in the price of the products delivered to the customer. We do not account for these services as a separate element, as the services do not have stand-alone value and cannot be separated from the product element of the arrangement. There are no significant post-delivery obligations associated with these services.
We also enter into sales rebates and profit sharing arrangements. Such customer incentives are accounted for as a reduction to gross sales and recorded based upon estimates at the time products are sold. These estimates are based upon historical experience for similar programs and products. We review such rebates and profit sharing arrangements on an ongoing basis and accruals are adjusted, if necessary, as additional information becomes available.
Management provides allowances for credits and returns based on historic experience and adjusts such allowances as considered necessary. To date, such provisions have been within the range of management's expectations and the allowance established. Sales tax collected from customers is excluded from net sales in the accompanying consolidated statements of income.
Income Taxes
We account for income taxes in accordance with ASC 740, Income Taxes. ASC 740, which requires the recognition of deferred tax liabilities and assets for the expected future tax consequences of temporary differences between the carrying amounts and the tax bases of assets and liabilities. Deferred income tax assets and liabilities are measured using enacted tax rates expected to apply to taxable income in the years in which these temporary differences are expected to be recovered or settled. The effect on deferred tax assets and liabilities of a change in tax rates is recognized in income in the period that includes the enactment date. A valuation allowance is established, when necessary, to
40
reduce net deferred tax assets to the amount expected to be realized. Our foreign subsidiaries are taxed in local jurisdictions at local statutory rates.
Stock-Based Compensation
We account for all stock-based compensation awards to employees and members of our board of directors based upon their fair values as of the date of grant using a fair value method and recognize the fair value of each award as an expense over the requisite service period using the graded vesting method.
For purposes of calculating stock-based compensation, we estimate the fair value of stock options using a Black-Scholes-Merton valuation model, which requires the use of certain subjective assumptions including expected term, volatility, expected dividend, risk-free interest rate, forfeiture rate and the fair value of our common stock. These assumptions generally require significant judgment.
We estimate the expected term of employee options using the average of the time-to-vesting and the contractual term. We derive our expected volatility from the historical volatilities of several unrelated public companies within our industry because we have little information on the volatility of the price of our common stock since we have no trading history. When making the selections of our industry peer companies to be used in the volatility calculation, we also consider the size and financial leverage of potential comparable companies. These historical volatilities are weighted based on certain qualitative factors and combined to produce a single volatility factor. Our expected dividend rate is zero, as we have never paid any dividends on our common stock and do not anticipate any dividends in the foreseeable future. We base the risk-free interest rate on the U.S. Treasury yield in effect at the time of grant for zero coupon U.S. Treasury notes with maturities approximately equal to each grant's expected life.
We estimate our forfeiture rate based on an analysis of our actual forfeitures and will continue to evaluate the appropriateness of the forfeiture rate based on actual forfeiture experience, analysis of employee turnover behavior and other factors. Quarterly changes in the estimated forfeiture rate can have a significant effect on reported stock-based compensation expense, as the cumulative effect of adjusting the rate for all expense amortization is recognized in the period the forfeiture estimate is changed. If a revised forfeiture rate is higher than the previously estimated forfeiture rate, an adjustment is made that will result in a decrease to the stock-based compensation expense recognized in the consolidated financial statements. If a revised forfeiture rate is lower than the previously estimated forfeiture rate, an adjustment is made that will result in an increase to the stock-based compensation expense recognized in the consolidated financial statements.
The following table summarizes the amount of non-cash stock-based compensation expense recognized in our statements of operations:
| |
Year Ended September 30, | Three Months Ended December 31, |
||||||||||||||
|---|---|---|---|---|---|---|---|---|---|---|---|---|---|---|---|---|
| (Dollars in thousands) |
2008 | 2009 | 2010 | 2009 | 2010 | |||||||||||
Non-cash stock-based compensation |
$ | 13,700 | $ | 10,389 | $ | 2,510 | $ | 640 | $ | 364 | ||||||
If factors change and we employ different assumptions, stock-based compensation expense may differ significantly from what we have recorded in the past. If there is a difference between the assumptions used in determining stock-based compensation expense and the actual factors that become known over time, we may change the input factors used in determining stock-based compensation costs for future grants. These changes, if any, may materially impact our results of operations in the period such changes are made. We expect to continue to grant stock options in the future, and to the extent
41
that we do, our actual stock-based compensation expense recognized in future periods will likely increase.
Significant Factors Used in Determining Fair Value of Our Common Stock
The fair value of the common stock that underlies our stock options has historically been determined by management and approved by our board of directors based upon information available to it at the time of grant. The following table summarizes, by grant date, the number of stock options granted since October 1, 2009 and the associated per share exercise price, which was not less than the fair value of our common stock for each of these grants.
Grant Date
|
Number of Options Granted |
Exercise Price Per Share of Common Stock |
Estimated Fair Value Per Share of Common Stock |
|||||||
|---|---|---|---|---|---|---|---|---|---|---|
October 1, 2009 |
7,557 | $ | 56.64 | $ | 36.39 | |||||
December 2, 2010 |
30,500 | $ | 70.00 | $ | 55.00 | |||||
Because there has been no public market for our common stock, our management has determined the fair value of our common stock-based on an analysis of relevant factors, including the following:
- •
- our historical and projected operating and financial performance;
- •
- the uncertainty in our business associated with uncertain economic conditions;
- •
- the fact that the option grants involve illiquid securities in a private company;
- •
- the likelihood of achieving a liquidity event, such as an initial public offering or sale of our company; and
- •
- a discounted cash flow analysis.
In addition, we have obtained periodic valuation studies from an independent third-party valuation firm. In performing its valuation analysis, the valuation firm engaged in discussions with management, analyzed historical and forecasted financial statements and reviewed our corporate documents. In addition, these valuation studies were based on a number of assumptions, including industry, general economic, market and other conditions that could reasonably be evaluated at the time of the valuation. Third-party valuations were performed as of September 30, 2009 and June 30, 2010 using generally accepted valuation methodologies.
42
Results of Operations
| |
Year Ended September 30, | Three Months Ended December 31, |
||||||||||||||||
|---|---|---|---|---|---|---|---|---|---|---|---|---|---|---|---|---|---|---|
| (Dollars in thousands) |
2008 | 2009 | 2010 | 2009 | 2010 | |||||||||||||
Consolidated statements of income: |
||||||||||||||||||
Net sales: |
||||||||||||||||||
North America |
$ | 551,135 | $ | 557,874 | $ | 603,809 | $ | 132,490 | $ | 160,483 | ||||||||
Rest of the World |
112,623 | 102,796 | 95,342 | 23,296 | 26,071 | |||||||||||||
Intercompany elimination |
(59,415 | ) | (47,983 | ) | (43,115 | ) | (8,980 | ) | (13,026 | ) | ||||||||
Net sales |
604,343 | 612,687 | 656,036 | 146,806 | 173,528 | |||||||||||||
Gross profit: |
||||||||||||||||||
North America |
221,898 | 204,296 | 226,497 | 47,659 | 59,477 | |||||||||||||
Rest of the World |
42,143 | 39,733 | 34,167 | 8,698 | 8,837 | |||||||||||||
Intercompany elimination |
(7,433 | ) | (5,742 | ) | (6,434 | ) | (1,714 | ) | (1,615 | ) | ||||||||
Gross profit |
256,608 | 238,287 | 254,230 | 54,643 | 66,699 | |||||||||||||
Selling, general and administrative expenses: |
||||||||||||||||||
North America |
84,807 | 86,007 | 81,674 | 20,143 | 20,479 | |||||||||||||
Rest of the World |
20,951 | 17,888 | 18,241 | 4,615 | 4,909 | |||||||||||||
Selling, general and administrative expenses |
105,758 | 103,895 | 99,915 | 24,758 | 25,388 | |||||||||||||
Income from operations |
150,850 | 134,392 | 154,315 | 29,885 | 41,311 | |||||||||||||
Interest expense, net |
(48,743 |
) |
(37,707 |
) |
(36,270 |
) |
(8,579 |
) |
(6,277 |
) |
||||||||
Other income (expense), net |
746 | (376 | ) | (458 | ) | (41 | ) | 516 | ||||||||||
Income before provision for income taxes |
102,853 | 96,309 | 117,587 | 21,265 | 35,550 | |||||||||||||
Provision for income taxes |
44,251 | 37,862 | 43,913 | 7,194 | 13,880 | |||||||||||||
Net income |
$ | 58,602 | $ | 58,447 | $ | 73,674 | $ | 14,071 | $ | 21,670 | ||||||||
43
| |
Year Ended September 30, | Three Months Ended December 31, |
||||||||||||||||
|---|---|---|---|---|---|---|---|---|---|---|---|---|---|---|---|---|---|---|
| (as a % of total net sales; numbers have been rounded) |
2008 | 2009 | 2010 | 2009 | 2010 | |||||||||||||
Consolidated statements of income: |
||||||||||||||||||
Net sales: |
||||||||||||||||||
North America |
91.2 | % | 91.1 | % | 92.0 | % | 90.2 | % | 92.5 | % | ||||||||
Rest of the World |
18.6 | 16.8 | 14.5 | 15.9 | 15.0 | |||||||||||||
Intercompany elimination |
(9.8 | ) | (7.8 | ) | (6.6 | ) | (6.1 | ) | (7.5 | ) | ||||||||
Net sales |
100.0 | 100.0 | 100.0 | 100.0 | 100.0 | |||||||||||||
Gross profit: |
||||||||||||||||||
North America |
36.7 | 33.3 | 34.5 | 32.5 | 34.3 | |||||||||||||
Rest of the World |
7.0 | 6.5 | 5.2 | 5.9 | 5.1 | |||||||||||||
Intercompany elimination |
(1.2 | ) | (0.9 | ) | (1.0 | ) | (1.2 | ) | (0.9 | ) | ||||||||
Gross profit |
42.5 | 38.9 | 38.8 | 37.2 | 38.4 | |||||||||||||
Selling, general and administrative expenses: |
||||||||||||||||||
North America |
14.0 | 14.0 | 12.4 | 13.7 | 11.8 | |||||||||||||
Rest of the World |
3.5 | 2.9 | 2.8 | 3.1 | 2.8 | |||||||||||||
Selling, general and administrative expenses |
17.5 | 17.0 | 15.2 | 16.9 | 14.6 | |||||||||||||
Income from operations |
25.0 | 21.9 | 23.5 | 20.4 | 23.8 | |||||||||||||
Interest expense, net |
(8.1 |
) |
(6.2 |
) |
(5.5 |
) |
(5.8 |
) |
(3.6 |
) |
||||||||
Other income (expense), net |
0.1 | (0.1 | ) | (0.1 | ) | 0.0 | 0.3 | |||||||||||
Income before provision for income taxes |
17.0 | 15.7 | 17.9 | 14.5 | 20.5 | |||||||||||||
Provision for income taxes |
7.3 | 6.2 | 6.7 | 4.9 | 8.0 | |||||||||||||
Net income |
9.7 | % | 9.5 | % | 11.2 | % | 9.6 | % | 12.5 | % | ||||||||
Three Months Ended December 31, 2009 compared with the Three Months Ended December 31, 2010
Net Sales
Consolidated net sales of $173.5 million for the three months ended December 31, 2010 increased approximately $26.7 million, or 18.2%, compared to the three months ended December 31, 2009. JIT, LTA and ad hoc sales as a percentage of net sales represented 33%, 29% and 38%, respectively, for the three months ended December 31, 2010, as compared to 29%, 33% and 38%, respectively, for the three months ended December 31, 2009.
Net sales of $160.5 million in our North America segment for the three months ended December 31, 2010 increased $28.0 million, or 21.1%, compared to the three months ended December 31, 2009. JIT, LTA and ad hoc net sales increased by $12.7 million, $2.7 million and $9.3 million, respectively, quarter over quarter. The JIT and ad hoc increases were primarily due to general growth across our customer base as well as the accelerated sale of $6.4 million of inventory to one of our customers in connection with the completion of one of our contracts with that customer.
Net sales of $26.1 million in our Rest of the World segment for the three months ended December 31, 2010 increased $2.8 million, or 11.9%, compared to the three months ended December 31, 2009. JIT net sales increased by $2.6 million quarter over quarter while both ad hoc and LTA net sales decreased by $0.2 million. The JIT increase primarily resulted from new long-term contracts that we entered into in the latter half of fiscal 2010.
44
Gross Profit
Consolidated gross profit of $66.7 million for the three months ended December 31, 2010 increased $12.1 million, or 22.1%, compared to the three months ended December 31, 2009. Gross profit as a percentage of net sales was 38.4% for the quarter ended December 31, 2010 compared to 37.2% for the quarter ended December 31, 2009.
Gross profit of $59.5 million in our North America segment for the three months ended December 31, 2010 increased $11.8 million, or 24.8%, compared to the three months ended December 31, 2009. Gross profit as a percentage of net sales in our North America segment was 37.1% for the quarter ended December 31, 2010 compared to 36.0% for the quarter ended December 31, 2009. The increase in gross profit as a percentage of net sales was principally driven by higher ad hoc sales for the quarter ended December 31, 2010.
Gross profit of $8.8 million in our Rest of the World segment for the three months ended December 31, 2010 increased $0.1 million, or 1.6%, compared to the three months ended December 31, 2009. Gross profit as a percentage of net sales in our Rest of the World segment was 33.9% for the quarter ended December 31, 2010 compared to 37.3% for the quarter ended December 31, 2009. The decrease in gross profit as a percentage of net sales was primarily a result of a large one-time sale in the amount of $0.8 million.
Selling, General and Administrative Expenses
Total selling, general and administrative expenses of $25.4 million for the three months ended December 31, 2010 increased $0.6 million, or 2.5%, compared to the three months ended December 31, 2009. However, total selling, general and administrative expenses as a percentage of net sales during the three months ended December 31, 2010 decreased by 2.3% compared to the three months ended December 31, 2009, as we continued to leverage our existing infrastructure.
Selling, general and administrative expenses of $20.5 million in our North America segment for the three months ended December 31, 2010 increased $0.3 million, or 1.7%, compared to the three months ended December 31, 2009. This increase was primarily a result of higher costs associated with our group insurance plan.
Selling, general and administrative expenses of $4.9 million in our Rest of the World segment for the three months ended December 31, 2010 increased $0.3 million, or 6.4%, compared to the three months ended December 31, 2009. The increase was primarily due to increased payroll costs of $0.4 million driven by a 5% increase in headcount to support new contracts.
Other Expenses
Interest Expense, net
Interest expense, net of $6.3 million for the three months ended December 31, 2010 decreased $2.3 million, or 26.8%, compared to the three months ended December 31, 2009. This decrease was primarily a result of lower debt balances on the old senior secured credit facilities stemming from the repayment of principal under these facilities.
Other Income (Expense), net
Other income, net of $0.5 million for the three months ended December 31, 2010 increased $0.6 million as compared to the three months ended December 31, 2009. This change was primarily due to unrealized foreign exchange gains associated with transactions denominated in currencies other than the respective functional currency of the reporting subsidiary.
45
Provision for Income Taxes
Provision for income taxes of $13.9 million for the three months ended December 31, 2010, increased $6.7 million, or 92.9%, compared to the three months ended December 31, 2009. Our effective tax rate was 33.8% and 39.0% during the three months ended December 31, 2009 and 2010, respectively. The increase in provision for income taxes was primarily a result of an increase in pretax income from period to period. Other items impacting our overall tax provision included a decrease in our effective tax rate in the U.S. for the three months ended December 31, 2009 related to the filing of an amended 2008 California return, which resulted in a $1.4 million refund.
Net Income
Due to the factors described above, we reported a net income of $21.7 million for the three months ended December 31, 2010, compared to net income of $14.1 million for the three months ended December 31, 2009. Net income as a percent of net sales increased 2.9% for the three months ended December 31, 2010 primarily due to an increase in the gross profit as a percent of net sales and a decrease in selling, general and administrative expenses as a percent of net sales.
Year Ended September 30, 2009 compared with the Year Ended September 30, 2010
Net Sales
Consolidated net sales of $656.0 million for the year ended September 30, 2010 increased $43.3 million, or 7.1%, compared to the year ended September 30, 2009. Excluding EPG products, JIT, LTA and ad hoc sales as a percentage of net sales represented 34%, 34% and 32%, respectively, for the year ended September 30, 2010, as compared to 29%, 31% and 40%, respectively, for the year ended September 30, 2009.
Net sales of $603.8 million in our North America segment for the year ended September 30, 2010 increased $45.9 million, or 8.2%, compared to the year ended September 30, 2009. JIT and LTA net sales increased by $43.9 million and $42.0 million respectively while ad hoc and EPG net sales decreased by $9.6 million and $27.3 million, respectively, year over year. The decrease in EPG net sales was due to the decline in the general aviation markets. The JIT increase was primarily driven by the Boeing 787 program, the addition of new sites for one of our major customers and increases in military programs such as the Chinook and V-22. The LTA increase was primarily due to a new contract for the F-18 program.
Net sales of $95.3 million in our Rest of the World segment for the year ended September 30, 2010 decreased $7.5 million, or 7.3%, compared to the year ended September 30, 2009. JIT net sales increased by $4.4 million while ad hoc and LTA net sales decreased by $9.3 million and $1.7 million, respectively, year over year. The reduction in ad hoc sales was primarily attributed to a general market slowdown and increased local competition.
Gross Profit
Consolidated gross profit of $254.2 million for the year ended September 30, 2010 increased $15.9 million, or 6.7% compared to gross profit for the year ended September 30, 2009. Gross profit as a percentage of net sales was 38.8% for the year ended September 30, 2010 compared to 38.9% for the year ended September 30, 2009.
Gross profit of $226.5 million in our North America segment for the year ended September 30, 2010 increased $22.2 million, or 10.9%, compared to the year ended September 30, 2009. Gross profit as a percentage of net sales in our North America segment was 37.5% for the year ended September 30, 2010 compared to 36.6% for the year ended September 30, 2009. The increase in gross
46
profit as a percentage of net sales was primarily driven by lower EPG sales and a lower amortization of inventory step-up, partially offset by a negative change in hardware sales mix.
Gross profit of $34.2 million in our Rest of the World segment for the year ended September 30, 2010 decreased $5.6 million, or 14.0%, compared to the year ended September 30, 2009. Gross profit as a percentage of net sales in our Rest of the World segment was 35.8% for the year ended September 30, 2010 compared to 38.7% for the year ended September 30, 2009. The decrease in gross profit as a percentage of net sales was primarily a result of a change in the sales mix, consisting of a reduction in ad hoc sales and growth in JIT sales.
Selling, General and Administrative Expenses
Total selling, general and administrative expenses of $99.9 million for the year ended September 30, 2010 decreased $4.0 million, or 3.8%, compared to the year ended September 30, 2009, as we leveraged our infrastructure to support sales growth.
Selling, general and administrative expenses of $81.7 million in our North America segment for the year ended September 30, 2010 decreased $4.3 million, or 5.0%, compared to the year ended September 30, 2009. This decrease was primarily a result of a reduction in non-cash stock-based compensation expense of $7.9 million, which was predominantly associated with restricted stock units that became fully vested on September 30, 2009, and a $1.6 million decrease in amortization expense related to certain intangible assets becoming fully amortized. These deductions were partially offset by increases in payroll expenses of $4.3 million, which was primarily driven by a $3.5 million increase in bonus expense.
Selling, general and administrative expenses of $18.2 million in our Rest of the World segment for the year ended September 30, 2010 increased $0.4 million, or 2.0%, compared to the year ended September 30, 2009. This increase was primarily a result of increased payroll costs related to $0.4 million of additional bonus expense.
Other Expenses
Interest Expense, net
Interest expense, net of $36.3 million for the year ended September 30, 2010 decreased $1.4 million, or 3.8%, compared to the year ended September 30, 2009. This decrease was primarily a result of principal debt payments of $67.4 million and a decrease in the average London Inter-Bank Offer Rate, or LIBOR, of 0.7% during the year ended September 30, 2010 as compared the year ended September 30, 2009. This was partially offset by $9.0 million in interest rate swap expense for the year ended September 30, 2010, an increase of $3.3 million as compared to the year ended September 30, 2009. We entered into our interest rate swap agreements midway through the year ended September 30, 2009 to hedge against interest rate fluctuations.
Other (Expense), net
Other expense, net of $0.5 million for the year ended September 30, 2010 increased $0.1 million, compared to the year ended September 30, 2009. This change was primarily due to unrealized foreign exchange losses associated with transactions denominated in currencies other than the respective functional currency of the reporting subsidiary.
Provision for Income Taxes
Provision for income taxes of $43.9 million for the year ended September 30, 2010, increased $6.1 million, or 16.0%, compared to the year ended September 30, 2009. Our effective tax rate was 39.3% and 37.3% during the years ended September 30, 2009 and 2010, respectively. The increase in
47
the provision for income taxes was primarily a result of a 22.1% increase in pre-tax income for the year ended September 30, 2010. Other items impacting the overall tax provision included a decrease in our effective tax rate in the U.S. for the year ended September 30, 2009 related to the filing of an amended 2008 California return, which resulted in a $1.4 million refund.
Net Income
Due to the factors described above, we reported a net income of $73.7 million for the year ended September 30, 2010, compared to net income of $58.4 million for the year ended September 30, 2009. Net income as a percent of net sales increased 1.7% for the year ended September 30, 2010 primarily due to a decrease in operating expenses as a percent of net sales as we continued to leverage our infrastructure to support sales growth.
Year Ended September 30, 2008 Compared with the Year Ended September 30, 2009
Net Sales
Consolidated net sales of $612.7 million for the year ended September 30, 2009 increased $8.3 million, or 1.4%, compared to the year ended September 30, 2008. The U.S. dollar strengthened against the British pound from $0.51 to $0.65 from the year ended September 30, 2008 to the year ended September 30, 2009, impacting net sales negatively by $22.1 million on a consolidated basis. Without the negative foreign exchange impact, consolidated net sales would have increased by $30.4 million, or 5.0%, as compared to the year ended September 30, 2008. Excluding EPG products, JIT, LTA and ad hoc sales as a percentage of net sales represented 29%, 31% and 40%, respectively, for the year ended September 30, 2009, as compared to 26%, 27% and 47%, respectively, for the year ended September 30, 2008.
Net sales of $557.9 million in our North America segment for the year ended September 30, 2009 increased $6.7 million, or 1.2%, compared to the year ended September 30, 2008. EPG net sales increased by $60.2 million year over year as a result of the Airtechnics Acquisition. JIT and LTA net sales increased by $3.6 million and $10.2 million, respectively, while ad hoc and intercompany net sales decreased by $55.8 million and $12.8 million, respectively, year over year. The increase in LTA net sales was related to the military market, in part due to the start up of the JSF program. The decrease in ad hoc net sales was primarily due to the general economic decline during the period.
Net sales of $102.8 million in our Rest of the World segment for the year ended September 30, 2009 decreased $9.8 million, or 8.7%, compared to net sales for the year ended September 30, 2008. The strengthening of the U.S. dollar impacted net sales negatively by $26.9 million. Without the negative foreign exchange impact, net sales in our Rest of the World segment would have increased by $17.1 million, or 15.2%, as compared to the year ended September 30, 2008. This was primarily related to an increase in JIT net sales driven by a new contract in Italy.
Gross Profit
Consolidated gross profit of $238.3 million for the year ended September 30, 2009 decreased approximately $18.3 million, or 7.1% compared to the year ended September 30, 2008. Gross profit as a percentage of net sales was 38.9% for the year ended September 30, 2009, compared to 42.5% for the year ended September 30, 2008.
48
Gross profit of $204.3 million in our North America segment for the year ended September 30, 2009 decreased $17.6 million, or 7.9%, compared to the year ended September 30, 2008. Gross profit as a percentage of net sales in our North America segment was 36.6% for the year ended September 30, 2009 compared to 40.3% for the year ended September 30, 2008. The decrease was primarily driven by higher EPG sales and lower ad hoc sales.
Gross profit of $39.7 million in our Rest of the World segment for the year ended September 30, 2009 decreased $2.4 million, or 5.7%, compared to the year ended September 30, 2008. Gross profit as a percentage of net sales in our Rest of the World segment was 38.7% for the year ended September 30, 2009 compared to 37.4% for the year ended September 30, 2008. This increase was primarily a result of higher margins in JIT sales.
Selling, General and Administrative Expenses
Total selling, general and administrative expenses of $103.9 million for the year ended September 30, 2009 decreased $1.9 million, or 1.8%, compared to the year ended September 30, 2008, as we continued to leverage our infrastructure to support sales growth and implemented cost saving initiatives around our travel and entertainment policy.
Selling, general and administrative expenses of $86.0 million in our North America segment for the year ended September 30, 2009 increased $1.2 million, or 1.4%, compared to the year ended September 30, 2008. This increase was primarily a result of a $4.2 million increase in payroll costs and $1.2 million in insurance related costs during the year ended September 30, 2009. This increase was primarily due to a full year of increased headcount related to the Airtechnics Acquisition as compared to only three months of expense in the year ended September 30, 2008. Amortization expense increased by $2.8 million due to a full year of amortization expense related to the intangibles acquired during the Airtechnics Acquisition. Offsetting these increases was an $3.3 million decrease in non-cash stock compensation and a $3.4 million decrease in allowance for doubtful accounts for the year ended September 30, 2009 as compared to the year ended September 30, 2008. The decrease in the allowance for doubtful accounts was primarily due to a one-time charge taken in the year ended September 30, 2008 for two customers who filed for bankruptcy during the year.
Selling, general and administrative expenses of $17.9 million in our Rest of the World segment for the year ended September 30, 2009 decreased $3.1 million, or 14.6%, compared to the year ended September 30, 2008. This decrease was primarily a result of the exchange rate change during the periods. The foreign exchange impact to the year ended September 30, 2009 was a $5.5 million reduction to selling, general and administrative expenses as compared to September 30, 2008. Without the foreign exchange impact selling, general and administrative expenses would have increased $2.8 million over the prior year. This increase was primarily due to $1.2 million related to a full year of operational expenses of a new branch office.
Other Expenses
Interest Expense, net
Interest expense, net of $37.7 million for the year ended September 30, 2009 decreased $11.0 million, or 22.6%, compared to the year ended September 30, 2008. This decrease was primarily a result of a decrease in LIBOR rates during the year ended September 30, 2009 as compared to the year ended September 30, 2008. The average LIBOR rate for the year ended September 30, 2008 was 3.9%, which dropped to an average rate of 1.0% for the year ended September 30, 2009. This was offset by a $100.0 million increase to the first lien debt under the old senior secured credit facilities on June 30, 2008 in conjunction with the Airtechnics Acquisition as well as an increase in interest rate swap expense of $3.7 million for the year ended September 30, 2009. Upon the maturity of our
49
previous interest rate swaps, we entered into two interest rate swaps arrangements that expire in February and June 2012.
Other Income (Expense), net
Other expense, net was $0.4 million for the year ended September 30, 2009 compared to $0.7 million of income for the year ended September 30, 2008. This change was primarily due to unrealized foreign exchange losses associated with transactions denominated in currencies other than the respective functional currency of the reporting subsidiary.
Provision for Income Taxes
Provision for income taxes of $37.9 million for the year ended September 30, 2009 decreased $6.4 million, or 14.4%, compared to the year ended September 30, 2008. Our effective tax rate was 43.0% and 39.3% during the years ended September 30, 2008 and 2009, respectively. The decrease in provision for income taxes was primarily a result of a 6.4% decrease in pretax income. Additionally, for the year ended September 30, 2009, we recognized a larger foreign tax credit than the prior year, resulting in an additional benefit of $0.8 million, which reduced the effective tax rate by almost 1.0%.
Net Income
Due to the factors described above, we reported a net income of $58.5 million for the year ended September 30, 2009, compared to net income of $58.6 million for the year ended September 30, 2008. Net income as a percent of net sales decreased 0.2% for the year ended September 30, 2009, primarily as a result of a 3.6% decrease in gross profit as a percent of net sales.
Supplemental Quarterly Financial Information
The following table sets forth our historical unaudited quarterly consolidated statements of operations for each of the last eight quarters ended December 31, 2010. This unaudited quarterly information has been prepared on the same basis as our consolidated audited financial statements appearing elsewhere in this prospectus, and includes all adjustments, consisting only of normal and recurring adjustments, that we consider necessary to present fairly the financial information for the quarters presented. We have not historically experienced any significant seasonality with respect to our results of operations.
50
The quarterly data should be read in conjunction with our consolidated financial statements and the notes thereto included elsewhere in this prospectus.
| |
Three Months Ended | |||||||||||||||||||||||||
|---|---|---|---|---|---|---|---|---|---|---|---|---|---|---|---|---|---|---|---|---|---|---|---|---|---|---|
| (Dollars in thousands) |
March 31, 2009 |
June 30, 2009 |
September 30, 2009 |
December 31, 2009 |
March 31, 2010 |
June 30, 2010 |
September 30, 2010 |
December 31, 2010 |
||||||||||||||||||
| |
(unaudited) |
|||||||||||||||||||||||||
Consolidated statements of income: |
||||||||||||||||||||||||||
Net sales |
$ | 157,906 | $ | 150,715 | $ | 150,680 | $ | 146,806 | $ | 164,105 | $ | 171,116 | $ | 174,009 | $ | 173,528 | ||||||||||
Gross profit |
64,955 | 56,878 | 53,758 | 54,643 | 63,197 | 68,240 | 68,150 | 66,699 | ||||||||||||||||||
Selling, general and administrative expenses |
27,027 | 24,079 | 25,904 | 24,758 | 24,568 | 24,968 | 25,621 | 25,388 | ||||||||||||||||||
Income from operations |
37,928 | 32,799 | 27,854 | 29,885 | 38,629 | 43,272 | 42,529 | 41,311 | ||||||||||||||||||
Interest expense, net |
(7,094 | ) | (9,002 | ) | (10,628 | ) | (8,579 | ) | (9,635 | ) | (9,199 | ) | (8,857 | ) | (6,277 | ) | ||||||||||
Other income (expense), net |
(1,124 | ) | (985 | ) | 920 | (41 | ) | 1,098 | (495 | ) | (1,020 | ) | 516 | |||||||||||||
Income before provision for income taxes |
29,710 | 22,812 | 18,146 | 21,265 | 30,092 | 33,578 | 32,652 | 35,550 | ||||||||||||||||||
Provision for income taxes |
11,345 | 9,188 | 6,925 | 7,194 | 11,978 | 12,121 | 12,620 | 13,880 | ||||||||||||||||||
Net income |
$ | 18,365 | $ | 13,624 | $ | 11,221 | $ | 14,071 | $ | 18,114 | $ | 21,457 | $ | 20,032 | $ | 21,670 | ||||||||||
Liquidity and Capital Resources
Overview
We have historically funded our operations, debt payments, capital expenditures and discretionary funding needs from our cash from operations. We had total available cash and cash equivalents of approximately $30.0 million and $27.3 million for the three months ended December 31, 2009 and 2010, respectively, and approximately $16.0 million, $11.4 million and $39.5 million for the years ended September 30, 2008, 2009 and 2010, respectively. In addition, as of December 31, 2010, we had no amounts outstanding under the old revolving facility.
Following the completion of this offering, our primary sources of liquidity will continue to be cash flow from operations and available borrowings under our new revolving facility. Our primary uses of cash following this offering will be for:
- •
- operating expenses;
- •
- working capital requirements to fund the growth of our business;
- •
- capital expenditures that primarily relate to IT equipment and our warehouse operations; and
- •
- debt service requirements for borrowings under the new senior secured credit facilities.
Generally, cash provided by operating activities has been adequate to fund our operations. Due to fluctuations in our cash flows and the growth in our operations, it may be necessary from time to time in the future to borrow under our new revolving facility to meet cash demands. We anticipate that cash provided by operating activities, cash and cash equivalents and borrowing capacity under our new revolving facility will be sufficient to meet our cash requirements for the next twelve months.
51
Senior Secured Credit Facilities
Old Senior Secured Credit Facilities
As of December 31, 2010, our outstanding indebtedness under our old senior secured credit facilities was approximately $606.2 million. The old senior secured credit facilities consisted of a $625.0 million first lien credit facility, which we refer to as the old first lien credit facility, and a $150.0 million second lien credit facility, which we refer to as the old second lien credit facility. At the time of initial incurrence, the old first lien credit facility was comprised of a $450.0 million first lien term loan facility and a $75.0 million first lien revolving line of credit. On June 30, 2008, we modified the terms of the old first lien credit facility to include an additional $100.0 million of term loan borrowings thereunder to fund the Airtechnics Acquisition, bringing the old first lien term loan facility up to $550.0 million at such time. As of December 31, 2010, we had approximately $477.2 million outstanding under the old first lien credit facility.
The interest rate on term loans under the old first lien credit facility was calculated using either Alternate Base Rate, or ABR (which is defined as Prime Rate plus an applicable margin rate of 1.25%), or Eurocurrency rate (defined as LIBOR plus an applicable margin rate of 2.25%), at our option. The interest rate on the term loans under the old first lien credit facility was 2.52% as of December 31, 2010.
There were no outstanding borrowings under the old revolving facility as of December 31, 2010, or at any point during fiscal 2010. The annual commitment fees for the old revolving facility were approximately $0.3 million.
As of December 31, 2010, we had approximately $129.0 million outstanding under the old second lien credit facility. The interest rate on the old second lien credit facility was calculated using ABR (defined as Prime Rate plus the applicable margin rate of 4.75%) or Eurocurrency rate (defined as LIBOR plus an applicable margin rate of 5.75%), at our option. The interest rate on the old second lien credit facility was 6.02% as of December 31, 2010.
During the year ended September 30, 2010, we made repayments totaling approximately $60.4 million with respect to the term loans under the old first lien credit facility and $7.0 million with respect to the old second lien credit facility, inclusive of contractually scheduled payments.
Our subsidiary, Wesco Aircraft Europe Limited, has a £10.0 million (approximately $15.5 million based on the December 31, 2010 exchange rate) line of credit available that automatically renews annually on October 1, which we refer to as the UK Line of Credit. This line of credit bears interest based on the base rate plus an applicable margin of 1.15%. There were no outstanding borrowings under the UK Line of Credit as of December 31, 2010.
New Senior Secured Credit Facilities
Borrowings under the new revolving facility and new term loan A facility bear interest at the Eurocurrency rate plus the applicable margin or the ABR plus the applicable margin. Borrowings under the new term loan B facility bear interest at a rate equal to (A) the greater of (x) the Eurocurrency rate and (y) 1.25% or (B) the greater of (x) the ABR and (y) 1.25%, plus, in each case, the applicable margin.
The applicable margin for the new revolving facility and the new term loan A facility is 3.00% for Eurocurrency loans and 2.00% for ABR loans for the six-month period after the closing of the new senior secured credit facilities, and thereafter the applicable margin will be based on our total net leverage ratio as determined in the most recently delivered financial statements, with the respective margins ranging from 2.25% to 3.25% for Eurocurrency loans and 1.25% to 2.25% for ABR loans. The applicable margin for the new term loan B facility is 3.00% for Eurocurrency loans and 2.00% for ABR
52
loans for the period from the closing date of the new senior secured credit facilities until June 30, 2012, and thereafter the applicable margin will be based on our total net leverage ratio as determined in the most recently delivered financial statements, with the respective margins ranging from 2.75% to 3.00% for Eurocurrency loans and 1.75% to 2.00% for ABR loans.
The new revolving facility and new term loan A facility each mature on April 7, 2016 and the new term loan B facility matures on April 7, 2017.
The obligations under the new senior secured credit facilities are guaranteed by us and all of our direct and indirect, wholly owned, domestic restricted subsidiaries (subject to certain exceptions) and secured by a first lien on substantially all of our assets and the assets of our guarantor subsidiaries, including capital stock of subsidiaries (in each case, subject to certain exceptions).
The new senior secured credit facilities contain customary negative covenants, including restrictions on our and our restricted subsidiaries' ability to merge and consolidate with other companies, incur indebtedness, grant liens or security interests on assets, make acquisitions, loans, advances or investments, pay dividends, sell or otherwise transfer assets, optionally prepay or modify terms of any junior indebtedness or enter into transactions with affiliates. The new senior secured credit facilities also require the maintenance of a net debt-to-EBITDA ratio and an EBITDA-to-net interest expense ratio.
The new senior secured credit facilities contain customary affirmative covenants, including delivery of financial and other information to the administrative agent, notice to the administrative agent upon the occurrence of certain material events, preservation of existence, payment of material taxes and other claims, maintenance of properties and insurance, maintenance of books and records, access to properties and records for inspection by administrative agent and lenders, further assurances and provision of additional collateral and guarantees.
The new senior secured credit facilities provide that, upon the occurrence of certain events of default, the obligations thereunder may be accelerated and the lending commitments terminated. Such events of default include payment defaults to the lenders, material inaccuracies of representations and warranties, covenant defaults, cross-defaults to other material indebtedness, voluntary and involuntary bankruptcy proceedings, material money judgments, material ERISA events, certain change of control events and other customary events of default.
Cash Flows
A summary of our operating, investing and financing activities are shown in the following table:
| |
Year Ended September 30, | Three Months Ended December 31, |
||||||||||||||
|---|---|---|---|---|---|---|---|---|---|---|---|---|---|---|---|---|
| (In thousands) |
2008 | 2009 | 2010 | 2009 | 2010 | |||||||||||
Consolidated statements of cash flows data: |
||||||||||||||||
Net cash provided by operating activities |
$ | 24,702 | $ | 1,266 | $ | 100,773 | $ | 21,434 | $ | 2,506 | ||||||
Net cash used in investing activities |
(115,798 | ) | (4,135 | ) | (3,077 | ) | (362 | ) | (234 | ) | ||||||
Net cash provided by (used in) financing activities |
94,114 | (1,720 | ) | (69,483 | ) | (2,495 | ) | (14,387 | ) | |||||||
Operating Activities
Our operating activities generated $2.5 million of cash in the three months ended December 31, 2010, a decrease of $18.9 million, compared to the three months ended December 31, 2009. This was primarily the result of a $19.3 million increase in the change in accounts receivable for the three months ended December 31, 2010 as compared to the three months ended December 31, 2009. This
53
increase in accounts receivable was due to the increase in net sales between the two periods as well as the timing of customer payments at the end of both quarters.
Our operating activities generated $100.8 million of cash in the year ended September 30, 2010, an increase of $99.5 million compared to the year ended September 30, 2009. This increase was primarily the result of a $112.7 million net decrease in the change in inventory for the year ended September 30, 2010 as compared to the year ended September 30, 2009. Net income also increased $15.2 million during the year ended September 30, 2010. This was offset by a $12.2 million increase in the net change in accounts receivable for the year ended September 30, 2009 as compared to the year ended September 30, 2010. This increase was primarily driven by a $43.3 million, or 7.1%, increase in net sales for the year ended September 30, 2010.
Our operating activities generated $1.3 million of cash in the year ended September 30, 2009, a decrease of $23.4 million compared to the year ended September 30, 2008. This decrease was primarily the result of a $52.4 million increase in the net change in inventory for the year ended September 30, 2009 as compared to the year ended September 30, 2008. This significant inventory increase was caused by increased supplier capacity that resulted in shorter lead times and faster shipments of our pre-existing orders. This was offset by a decrease of $15.6 million in accounts receivable driven by a lower days sales outstanding ratio.
Investing Activities
Our investing activities used $0.4 million and $0.2 million of cash in the three months ended December 31, 2009 and 2010, respectively, and $115.8 million, $4.1 million and $3.1 million in cash during the years ended September 30, 2008, 2009 and 2010, respectively. These amounts were used for investments in various capital expenditures and to purchase property and equipment. In addition, during the year ended September 30, 2008, $109.0 million of cash was used in the Airtechnics Acquisition.
Our purchases of property and equipment may vary from period to period due to the timing of the expansion of our business and the investment requirements to provide us with technology that allows us to better serve our customers.
Financing Activities
Our financing activities used $14.4 million of cash in the three months ended December 31, 2010. This amount primarily consisted of $14.0 million used to repay principal against the old second lien credit facility, and the remaining amount was used to make repayments under our capital lease obligations.
Our financing activities used $2.5 million of cash in the three months ended December 31, 2009. This amount was used to pay off the UK Line of Credit, make a required quarterly debt payment of $1.4 million and to make repayments under our capital lease obligations.
Our financing activities used $69.5 million of cash in the year ended September 30, 2010. This amount consisted of $67.4 million used to make repayments under the old senior secured credit facilities, $1.3 million used to make repayments under our capital lease obligations and $0.8 million used to make repayments under our UK Line of Credit.
Our financing activities used $1.7 million of cash in the year ended September 30, 2009. This amount consisted of $0.7 million used to redeem vested stock options, $1.0 million used to make repayments under our capital lease obligations and less than $0.1 million used to make repayments under our UK Line of Credit, partially offset by less than $0.1 million in cash proceeds from the exercise of stock options.
54
Our financing activities generated $94.1 million of cash in the year ended September 30, 2008. This amount consisted of $100.0 million in borrowings under the old first lien credit facility and $1.0 million in cash proceeds from the issuance of common stock, which was partially offset by approximately $2.4 million used to make repayments under our UK Line of Credit, $3.0 million used to pay certain financing fees associated with the Airtechnics Acquisition and $1.5 million used to make repayments under our capital lease obligations.
Contractual Obligations
The following table is a summary of contractual cash obligations at September 30, 2010 (in thousands):
| |
Payments Due by Period | |||||||||||||||
|---|---|---|---|---|---|---|---|---|---|---|---|---|---|---|---|---|
| |
Less Than 1 Year |
1 - 3 Years |
3 - 5 Years |
More Than 5 Years |
Total | |||||||||||
Long-Term Debt Obligations(1) |
$ | — | $ | 477,243 | $ | 143,000 | $ | — | $ | 620,243 | ||||||
Capital Lease Obligations(2) |
1,577 | 1,676 | 99 | — | 3,352 | |||||||||||
Operating Lease Obligations(3) |
3,629 | 6,314 | 4,395 | 7,166 | 21,504 | |||||||||||
Purchase Obligations(4) |
193,696 | 2,565 | 110 | — | 196,371 | |||||||||||
Total |
$ | 198,902 | $ | 487,798 | $ | 147,604 | $ | 7,166 | $ | 841,470 | ||||||
- (1)
- This
line item includes our obligations under the old senior secured credit facilities. This line item does not reflect payment obligations for the new
senior secured credit facilities. The payment obligations for the new senior secured credit facilities assuming an outstanding principal amount of $615.0 million, the balance as of April 7,
2011, the closing date of the new senior secured credit facilities, are $4,188, $35,156, $58,343, and $517,313 for the periods Less Than 1 Year, 1-3 Years, 3-5 Years and More Than 5 Years,
respectively. These amounts assume no repayment of principal during such period and do not include interest payments required to be made under the old senior secured credit facilities and the new
senior secured credit facilities, which bear interest at a variable rate. See "—Liquidity and Capital Resources—Senior Secured Credit Facilities—New Senior
Secured Credit Facilities."
- (2)
- This
line item includes our payment obligations under leases classified as a capital lease.
- (3)
- This
line item includes any payment obligations under leases classified as an operating lease.
- (4)
- This line item includes our current open purchase orders with respect to the purchase of products and the estimated timing of the transaction.
Off-Balance Sheet Arrangements
We are not a party to any off-balance sheet arrangements.
Recently Adopted Accounting Pronouncements
Changes to GAAP are established by the Financial Accounting Standards Board, or the FASB, in the form of Accounting Standards Updates, or ASUs, to the FASB's ASC.
We consider the applicability and impact of all ASUs. ASUs not listed below were assessed and determined to be either not applicable or are expected to have minimal impact on our consolidated financial position and results of operations.
55
In January 2010, the FASB issued guidance that revised two disclosure requirements concerning fair value measurements and clarifies two others. It requires separate presentation of significant transfers into and out of Levels 1 and 2 of the fair value hierarchy and disclosure of the reasons for such transfers. It will also require the presentation of purchases, sales, issuances and settlements within Level 3 on a gross basis rather than a net basis. The amendments also clarify that disclosures should be disaggregated by class of asset or liability and that disclosures about inputs and valuation techniques should be provided for both recurring and non-recurring fair value measurements. These new disclosure requirements will become effective for our financial statements for the period ended September 30, 2011, except for the requirement concerning gross presentation of Level 3 activity, which will become effective for fiscal years beginning after December 15, 2010. Since we do not currently have any Level 3 fair value measurements, the adoption of this standard will not have an impact on our consolidated financial statements.
In October 2009, the FASB issued guidance on revenue arrangements with multiple deliverables effective for our 2012 fiscal year, although early adoption is permitted. The guidance revises the criteria for separating, measuring, and allocating arrangement consideration to each deliverable in a multiple element arrangement. The guidance requires companies to allocate revenue using the relative selling price of each deliverable, which must be estimated since we do not have a history of selling the deliverable on a stand-alone basis or third-party evidence of selling price. We do not believe that the adoption of this guidance will significantly change the timing in which revenue is recorded as the pricing of our service components are included in the per unit price of the products delivered to the customer, which is solely contingent on the number of units sold. As a result, the revenue earned on the service element does not become fixed or determinable until delivery of the product has taken place.
In June 2009, the FASB issued guidance to revise the approach to determine when a variable interest entity, or VIE, should be consolidated. The new consolidation model for VIEs considers whether we have the power to direct the activities that most significantly impact the VIEs' economic performance and shares in the significant risks and rewards of the entity. The guidance on VIEs requires companies to continually reassess VIEs to determine if consolidation is appropriate and provide additional disclosures. We adopted the provisions of this VIE guidance at the beginning of fiscal year 2011, and the adoption did not have a material impact on our financial statements.
Quantitative and Qualitative Disclosures about Market Risk
Our exposure to market risk consists of foreign currency exchange rate fluctuations and changes in interest rates.
Foreign Currency Exposure
Currency translation
In the year ended September 30, 2010, approximately 15% of our net sales were made by our foreign subsidiaries, and our total non-U.S. net sales represented approximately 26% of our total net sales. As a result of these international operating activities, we are exposed to risks associated with changes in foreign exchange rates, principally exchange rates between the U.S. dollar, British pound and the Euro.
The results of operations of our foreign subsidiaries are translated into U.S. dollars at the average exchange rate for each relevant period. This translation has no impact on our cash flow. However, as foreign exchange rates change, there are changes to the U.S. dollar equivalent of sales and expenses denominated in foreign currencies. Any adjustments resulting from the translation are recorded in accumulated other comprehensive income on our statements of changes in stockholders' equity. We do
56
not consider the risk associated with exchange rate fluctuations to be material to our financial condition or results of operations.
A hypothetical 5% increase in the value of the British pound and the Euro relative to the U.S. dollar would have resulted in an increase in our net income of approximately $0.3 million and less than $0.1 million, respectively, during fiscal 2010. A corresponding decrease would have resulted in a decrease in our net income of approximately $0.3 million and less than $0.1 million, respectively, during fiscal 2010.
Currency transactions
Currency transaction exposure arises where actual sales and purchases are made by a company in a currency other than its own functional currency. In the year ended September 30, 2010, our subsidiary in the United Kingdom had sales in U.S dollars and Euros of approximately $66.0 million and €11.2 million, respectively, and had purchases in U.S dollars and Euros of approximately $47.9 million and €11.8 million, respectively. To the extent possible, we structure arrangements where the purchase transactions are denominated in U.S. dollars in order to minimize near-term exposure to foreign currency fluctuations.
From fiscal 2008 to fiscal 2009, the average value of the U.S. dollar strengthened against the British pound by $0.42 (from $1.97 to $1.55). From fiscal 2009 through fiscal 2010, the pound stabilized against the dollar. A strengthening of the U.S. dollar means we realize a lesser amount of U.S. dollar revenue on sales that were denominated in British pounds. In fiscal 2009, the strengthening of the U.S. dollar relative to the British pound resulted in a negative impact of approximately $22.1 million in net sales as compared to the exchange rate during fiscal 2008 and resulted in a decrease of approximately $2.9 million in our net income in fiscal 2009. As a result of the stabilization of the value of the British pound against the U.S. dollar during fiscal 2010, currency transactions did not have a material impact on our financial results during that period. A hypothetical 5% increase in the value of the British pound relative to the U.S. dollar would have resulted in an increase in our net income of approximately $0.3 million during fiscal 2010, attributable to our foreign currency transactions. A corresponding decrease would have resulted in a decrease in our net income of approximately $0.3 million during fiscal 2010.
We have historically entered into currency forward and option contracts to limit exposure to currency rate changes and will continue to monitor our transaction exposure to currency rate changes. Gains and losses on these contracts are deferred until the transaction being hedged is finalized. As of September 30, 2010, we had no outstanding currency forward and option contracts.
Interest Rate Risk
Our principal interest rate exposure relates to the new senior secured credit facilities, which bear interest at a variable rate. See "—Liquidity and Capital Resources—Senior Secured Credit Facilities—New Senior Secured Credit Facilities." If there is a rise in interest rates, our debt service obligations on the borrowings under the new senior secured credit facilities would increase even though the amount borrowed remained the same, which would affect our results of operations, financial condition and liquidity. At our debt level and borrowing rates as of April 7, 2011, the closing date of the new senior secured credit facilities, annual cash interest expense, including fees under our new revolving facility, would have been approximately $24.4 million. If variable interest rates were to change by 1.0%, our interest expense would fluctuate approximately $6.2 million per year, without taking into account the effect of any hedging instruments or the minimum LIBOR requirement.
57
We periodically enter into interest rate swap agreements to manage interest rate risk on our borrowing activities. Upon the maturity of our previous interest rate swap agreements, we entered into two interest rate swap agreements that expire in February and June 2012, respectively, which we refer to collectively as the Swaps. Each Swap converts the interest rate on approximately $200.0 million (notional amount) of our outstanding indebtedness from variable rates to a fixed interest rate. During the year ended September 30, 2010, we recorded losses in the amount of approximately $2.6 million as a result of changes in fair value of derivative financial instruments. These losses are recorded as a component of interest expense.
We do not hold or issue derivative financial instruments for trading or speculative purposes.
58
According to Stax, the global market for C class aerospace parts, which includes hardware, bearings, electronic components and machined parts for both commercial and military customers, was approximately $6.1 billion in 2009. This market is generally segmented by end customer or sales channel. On a customer basis, OEMs and their subcontractors, which we refer to collectively as the OEM market, accounted for approximately $4.1 billion of sales and the remaining approximately $2.0 billion of sales was made to airlines and aftermarket MRO providers. On a sales channel basis, approximately $3.9 billion of all C class aerospace parts flow through distributors and approximately $2.0 billion of sales are made directly to end customers. The following charts provide additional information on the breakdown of the C class aerospace parts market as of 2009.
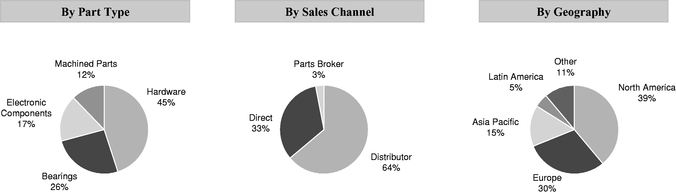
Source: Stax.
We believe that the key trends and drivers of growth in the aerospace parts distribution market include:
Increased Demand for New Aircraft Production
The OEM market for C class aerospace parts in 2009 was approximately $4.1 billion according to Stax, with approximately $2.5 billion of this total relating to sales of commercial aircraft and business jets. According to Airline Monitor, the global commercial aircraft fleet has grown approximately 4.5% per year over the last 20 years, exceeding global GDP growth of 3% per year over the same period. RPMs, a key measure of airline passenger volumes, grew approximately 5.5% in 2010 and are expected to grow at 5.9% annually, on average, from 2010 to 2020, due to the economic recovery in developed economies, continued growth in emerging markets, particularly in the Asia-Pacific region, and the secular trend towards increased air travel globally. Increased passenger traffic volumes and the return to profitability of the global airline industry have renewed demand for commercial aircraft, particularly for more fuel efficient models such as the Boeing 787 and Airbus A350. According to Airline Monitor, annual deliveries of the Boeing 787 are projected to increase from 20 in 2011 to over 100 by 2014, and Airbus expects A350 deliveries to commence in 2013. Airline Monitor forecasts that overall commercial aircraft deliveries will grow at a CAGR of 4.5% over the next ten years. It further estimates that there were approximately 8,100 planes in the commercial aircraft order backlog as of December 31, 2010, which represents over five years of projected commercial aircraft deliveries. According to the General Aviation Manufacturers Association, business jet deliveries, which are generally correlated with market indicators, including the earnings and price performance of the S&P 500, suffered a 24% decline on average from 2008 to 2010. According to the FAA, however, business jet activity increased by over 11% in 2010. We also expect commercial aircraft production to be supplemented by increases in business and regional jet deliveries.
According to Stax, the market for military C class aerospace parts was approximately $1.6 billion in 2009. Future military aerospace OEM demand is expected to be driven by increases in the production
59
of the Lockheed Martin JSF. The JSF is a next-generation fighter that is designed for the U.S. Navy, Marines and Air Force, along with key U.S. allies such as the United Kingdom, Italy and The Netherlands. According to Forecast International, production of the JSF is expected to increase from 20 in 2011 to 98 by 2016.
Increased Demand from the MRO Market
According to Stax, the combined commercial and military MRO market represented approximately $2.0 billion of the total C class aerospace parts market in 2009. We expect commercial MRO providers to benefit from the same trends as those impacting the commercial OEM market, including increased RPMs, which will in turn drive growth in the commercial fleet and greater utilization of existing aircraft. According to Boeing, RPM growth is forecasted to be particularly strong in the Asia Pacific and Middle East regions, with annual growth projected to be 7.6% in China, 7.4% in South Asia, including India, and 7.1% in the Middle East from 2010 to 2019. The commercial MRO market may also benefit from directives or notifications announced by international industry regulators and trade associations. Such directives or notifications can serve to bolster required maintenance, and thus the demand for new and existing C class aerospace parts. We expect demand in the military MRO market to be driven by requirements to maintain aging military fleets, changes in the overall fleet size and the level of U.S. military activity overseas.
Industry Consolidation
We are one of the top two aerospace distribution companies by sales and, together with our largest competitor, accounted for approximately $1.4 billion, or 23%, of the approximately $6.1 billion C class aerospace parts market in 2009. The remainder of the market is highly fragmented, which creates significant opportunities for further consolidation. Several benefits typically accrue to distributors through consolidation, including efficiencies in leveraging costs over a larger revenue base, increased customer penetration facilitated by a larger product offering and a reduction in purchasing costs driven by larger volume-based discounts. We expect these benefits to support further consolidation in the industry.
Globalization
The manufacture of aircraft and aircraft structures is becoming more globalized, as nations such as China, India and the UAE invest heavily to develop their aerospace industries. In addition, many U.S. and European OEMs continue to expand their operations in international markets in order to benefit from labor cost savings as local businesses seek to partner with established global companies. These OEMs and subcontractors expect to receive the same quality parts and services in new markets that they receive in their home markets. We believe that these quality and service expectations and the overall growth rates in international aerospace markets present significant opportunities for supply chain managers such as Wesco.
60
Company Overview
We are one of the world's largest distributors and providers of comprehensive supply chain management services to the global aerospace industry. Our services range from traditional distribution to the management of supplier relationships, quality assurance, kitting, JIT delivery and point-of-use inventory management. We supply approximately 450,000 different SKUs, including hardware, bearings, tools and more recently, electronic components and machined parts. In fiscal 2010, sales of hardware represented 80% of our net sales, with highly engineered fasteners constituting 83% of that amount. We serve our customers under three types of arrangements: JIT contracts, which govern comprehensive outsourced supply chain management services; LTAs, which set prices for specific parts; and ad hoc sales. JIT contracts and LTAs, which together comprised approximately 63% of our fiscal 2010 net sales, are multi-year arrangements that provide us with significant visibility into our future sales.
Founded in 1953 by the father of our current CEO, Wesco has grown to serve over 7,200 customers in the commercial, military and general aviation sectors, including the leading OEMs and their subcontractors, through which we support nearly all major Western aircraft programs. We have grown our net sales at a 16% CAGR over the past 10 years to $656.0 million in fiscal 2010. We serve a large and growing global market, and believe that with more than 1,000 employees across 28 locations in 10 countries, we are well positioned to continue our track record of strong long-term growth and profitability. The following charts illustrate the composition of our 2010 net sales based on our sales data or management estimates.
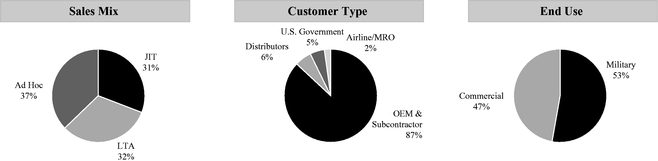
We have invested in building an integrated, highly customized IT system that enables our purchasing and sales organization to make more informed decisions and our inventory management system to operate at maximum efficiency. Specifically, our customized IT system provides us visibility into inventory quantities, stocking locations and purchases across our customer base by individual SKU, enabling us to accurately fill approximately 8,000 orders per day and provide an exceptional level of customer service. The scalable nature of our IT system helps us improve productivity and financial performance as sales volume increases. We believe our customized IT system is a key competitive advantage and critical element in our unique business model that creates significant value for our customers and our suppliers.
We believe that our success has been driven by our focus on customer service and our ability to offer tailored solutions to our customers. We believe customers that utilize our comprehensive JIT supply chain management services are frequently able to realize significant benefits including:
- •
- reduced inventory levels and inventory excess and obsolescence expense, in part because such customers only purchase what
they need, as well as more efficient use of floor space;
- •
- increased accuracy in forecasting and planning, resulting in substantially improved on-time delivery, reduced expediting costs and fewer disruptions of production schedules;
61
- •
- improved quality assurance resulting in a substantial reduction in customer parts rejection rates; and
- •
- reduced administrative and overhead costs relating to procurement, quality assurance, supplier management and stocking functions.
Our customers also benefit from the strong relationships we maintain with a diverse group of over 1,100 suppliers. We believe these suppliers in turn derive several benefits from our scale, global reach and unique business model, including:
- •
- access to over 7,200 customer accounts;
- •
- larger production runs that facilitate more efficient manufacturing processes;
- •
- a reduction of inventory levels and related obsolescence costs;
- •
- improved performance in meeting on-time-delivery targets to end customers; and
- •
- consolidation of customer accounts, resulting in a reduction in administrative and overhead costs relating to sales and marketing, customer service and other functions.
We believe we are well positioned to continue our track record of strong growth by partnering with our suppliers to provide a compelling combination of value-added services to our customers.
Competitive Strengths
We believe that our key competitive strengths include the following:
Leader in Attractive Global Market. We are one of the world's largest distributors and providers of comprehensive supply chain management services to the global aerospace industry. We believe we offer the world's broadest inventory of aerospace parts comprised of approximately 450,000 SKUs. In addition, we fill approximately 8,000 orders per work day and manage approximately 350,000 stocking bins throughout our customers' facilities. Stax estimates the market for the C class aerospace parts we offer at approximately $6.1 billion on an annual basis, and we expect that it will continue to grow, driven by a broad-based recovery in the delivery of new aircraft. This market is fragmented, and we estimate that we and our top competitor together account for approximately 23% of the market, with the balance served by smaller regional or local distributors, or directly by the parts manufacturers. We believe that the scale of our global distribution network, our value-added services and the depth, breadth and dollar investment in our inventory provide us with a significant competitive advantage in an attractive market.
Compelling Value Proposition. We offer a compelling value proposition to our customers by combining access to what we believe to be the world's broadest inventory of aerospace parts with our unique capabilities in comprehensive supply chain management. Our services can significantly improve on-time-delivery performance, enabling our customers to reduce their inventory while at the same time decreasing the frequency of production interruptions caused by part shortages. Due to the high levels of precision and engineering standards in the aerospace industry, our customers must ensure the highest levels of quality assurance. Many of our customers have chosen to outsource these critical quality assurance functions to us, relying on our rigorous inspection processes. Aerospace companies that do not outsource to a supply chain manager like Wesco can incur significant additional overhead and administrative costs relating to internal procurement, quality assurance, inventory stocking and other related personnel.
Diverse Customer and Program Base. We maintain strong relationships with over 7,200 active customers including major OEMs such as Airbus, Boeing, Bombardier, Embraer, Cessna, Gulfstream, BAE Systems, Bell Helicopter, Lockheed Martin, Northrop Grumman and Raytheon. We supply
62
products to nearly every major Western aircraft in production, including the B-787, B-737, B-747, A-320, JSF and V-22. During fiscal 2010, no single customer or aircraft program represented more than 15% of our net sales. We have actively worked to transition our largest customers from ad hoc purchases to multi-year LTAs or comprehensive JIT supply chain management agreements, the latter two of which together represented approximately 63% of our fiscal 2010 net sales. By developing strong, long-term relationships with a diverse set of customers, we have significant visibility into our future sales.
Superior Purchasing Capabilities and Supplier Relationships. Our management is highly skilled in analyzing supply, demand, cost and pricing factors in order to make optimal inventory investment decisions, and we maintain close relationships with the leading suppliers in the industry. Our top 10 suppliers have been doing business with us for an average of more than 10 years. We believe that our business model allows our suppliers to smooth out production, improve their cash flow and reduce administrative cost. As a result of our scale and the strength of our relationships, many of our suppliers offer us attractive volume-based price discounts. Our success in making optimal inventory purchasing decisions is driven by our management's deep understanding of our industry and their skill in analyzing fundamental supply, demand, cost and pricing data. These decisions are facilitated by our highly customized IT system. Our superior inventory purchasing capabilities and the strength of our supplier relationships have contributed substantially to what we believe are our industry-leading operating margins.
Experienced Management Team with Significant Equity Ownership. Our management team has extensive industry experience and company tenure. Our Chief Executive Officer and other executive officers have an average of more than 20 years of experience with us and more than 30 years in our industry. In addition, our executive officers will own approximately % of the common stock of the Company following this offering. We believe that this significant equity ownership aligns the interests of our executive officers with our stockholders.
Our Strategy for Continued Growth
We intend to pursue the following strategies in order to continue to grow our business:
Continued Focus on Operational Excellence. We have built strong relationships with our existing customers and suppliers through a relentless focus on operational excellence and improvement. We intend to continue providing our customers with best-in-class on-time delivery performance and quality assurance. We also intend to continue investing in our integrated, highly customized IT system and process automation technology. We believe that by focusing on operational excellence, we will be able to maintain high customer satisfaction and industry-leading operating margins.
Win New Business from Existing Customers. We will continue our strategy of expanding our relationships with existing customers by transitioning them to our comprehensive JIT supply chain management services as well as expanding our programs to include additional customer sites and SKUs. We are a key partner supplying fasteners and other C class parts to support the launch of new aircraft programs, such as the Boeing 787 and Lockheed Martin JSF. We will continue to support our customers in the launch of new aircraft programs by introducing new supply chain solutions that minimize costs, improve productivity, lower inventory investment and ensure a seamless supply of parts for new production and aftermarket support.
Expand Customer Base. We believe that our services and capabilities are attractive to potential new customers and plan to expand our customer base. We have had significant success in winning business when competing distributors have been unable to meet customer service level requirements and in situations where customers have outsourced work that was previously performed internally. Historically, we have focused our activities on the major OEMs and their subcontractors and less on
63
airlines and airline maintenance organizations due to their tendency to order parts in smaller quantities with greater frequency, which makes them more costly to serve. We are in the process of adding a significant number of SKUs to an airline industry automated quoting system that we believe will provide us with a cost-effective way to penetrate this commercial MRO market that Stax estimates is approximately $900 million in size.
Further Expand into International Markets. We have recently established a presence in international locations such as China, India and Saudi Arabia, and we intend to expand into other high growth regions such as Mexico to support new and existing customers. Our international expansion efforts will enable us to better reach new customers and more effectively serve our existing customer base as the manufacture of aircraft and aircraft structures continues to become more globalized. We believe that we mitigate many of the risks associated with international expansion by entering into customer contracts before we establish a new stocking facility. Our international expansion efforts will enable us to better reach new customers and more effectively serve our existing customer base as the manufacture of aircraft and aircraft structures continues to become more globalized.
Selectively Pursue Strategic Acquisitions. Our industry is highly fragmented and we believe that there are opportunities for continued consolidation. In 2008, we acquired Airtechnics, which enabled us to expand our product offering to include electronic components, as well as gain additional customers. We believe that we are well positioned to expand our product offering and geographical footprint through strategic acquisitions. Consistent with this strategy, we continue to evaluate potential acquisition opportunities.
Our Products and Services
Our Products
We offer more than 450,000 different SKUs, consisting of C class aerospace hardware, bearings, electronic components and machined parts, which are generally priced below $350 per part. Stax estimates that C class parts typically contribute between 2.0% and 4.0% of the total cost of a large commercial aircraft. Many of the products we sell are highly engineered, precision parts that are specified for use in particular aircraft programs.
64
Our product categories include the following:
| |
||||||||||||||||||||
|---|---|---|---|---|---|---|---|---|---|---|---|---|---|---|---|---|---|---|---|---|
|
|
|
|
Hardware |
|
Bearings |
|
Electronic Components |
|
Machined Parts and Other |
|
||||||||||
|
% of Total Market for C Class Aerospace Parts* | 45% | 26% | 17% | 12% | |||||||||||||||
|
Wesco Fiscal 2010 Net Product Sales (in millions) | $527 | $42 | $70 | $17 | |||||||||||||||
|
% of Wesco Fiscal 2010 Net Product Sales | 80% | 7% | 11% | 2% | |||||||||||||||
|
Types of Products Offered | • Blind fasteners |
• Airframe control bearings |
• Connectors |
• Brackets |
|||||||||||||||
* Source: Stax. |
||||||||||||||||||||
Hardware
Sales of C class aerospace hardware represented approximately 80% of our fiscal 2010 product sales. Fasteners are our largest product category, comprising approximately 83% of our hardware sales in fiscal 2010. Fasteners include a wide range of highly engineered aerospace parts that are designed to hold together two or more components, such as rivets (both blind and solid), bolts (including blind bolts), screws, nuts and washers. Many of these fasteners are designed for use in specific aircraft platforms and others can be used across multiple platforms. Materials used in the manufacture of these fasteners range from standard alloys, such as aluminum, steel or stainless steel, to more advanced materials, such as titanium, Inconel and Waspalloy.
Bearings
We began to offer aerospace bearings after acquiring the bearing distribution business of Kaman Industrial Technologies in 1999, which enabled us to support new customers and expand our product offering. Our product offering includes a variety of standard anti-friction products designed to both commercial and military aircraft specifications, such as airframe control bearings, rod ends, spherical bearings, ball bearing rod ends, roller bearings and bushings.
Electronic Components
In 2008, we acquired Wichita, Kansas-based Airtechnics, one of the largest distributors of aerospace electronic components in North America, which helped expand our product offering to our customer base. We offer highly reliable interconnect and electro-mechanical products, including connectors, relays, switches, circuit breakers and lighted products. We also offer value-added assembled products including mil-circular and rack and panel connectors and illuminated push button switches. We maintain large quantities of connector components in inventory, which allows us to respond quickly to customer orders. In addition, our lighted switch assembly operation affords customers same day service, including engraving capabilities in multiple languages.
65
Machined Parts and Other
Machined parts are designed for a specific customer and are assigned unique OEM-specific SKUs. The machined parts we distribute include laser cut or stamped brackets, milled parts, shims, stampings, turned parts and welded assemblies made of materials ranging from high-grade steel or titanium to nickel based alloys.
We stock a full range of tools needed for the installation of our products, including air and hydraulic tools as well as drill motors, and we also offer factory authorized maintenance and repair services for these tools. In addition to selling these tools, we also rent or lease these tools to our customers.
Our Services
In addition to our traditional distribution services, we have developed innovative value-added services, such as quality assurance, kitting and JIT supply chain management for our customers.
Quality Assurance
Our industry-leading quality assurance, or QA, function is a key component of our service offering, with approximately 10% of our employees dedicated to this area. Our QA department inspects the inventory we purchase to ensure the accuracy and completeness of documentation. We also maintain an electronic copy of the relevant certifications for the inventory, which can include a manufacturer certificate of conformance, test reports, process certifications, material distributor certifications and raw material mill certifications.
In addition, dimensional inspections are performed on all lots from suppliers that are not certified by our QA department, and all lots for our JIT customers undergo dimensional, and in some cases, structural inspections. For many of our customers, these inspections are conducted at our in-house laboratory, where we operate sophisticated testing equipment. Our industry-leading QA capabilities allow our JIT customers to reduce the number of personnel dedicated to the QA function and reduce the delays caused by the rejection of improperly inspected parts. During fiscal 2010, we rejected approximately 3.2% of all shipments we received, while only 0.03% of the products we delivered were rejected by our own customers.
Kitting
Kitting involves the packaging of an entire bill of materials or a complete "ship-set" of parts, which reduces the amount of time workers spend retrieving parts from storage locations. Kits can be customized in varying configurations and sizes and can contain up to several hundred different parts. All of our kits and components contain fully certified and traceable parts and are assembled by our full-service kitting department at our central stocking locations, or CSLs, or at our customer sites.
JIT Supply Chain Management
JIT supply chain management involves the delivery of parts on an as-needed basis to the point-of-use at a customer's manufacturing line. JIT programs are designed to prevent excess inventory build-up and shortages and improve manufacturing efficiency. Each JIT contract requires us to maintain an efficient inventory tracking, analysis and replenishment program and is designed to provide high levels of stock availability and on-time delivery. We began offering JIT supply chain management services in 1993 as some OEMs began outsourcing certain support functions in an effort to cut costs at a time when defense spending was declining and the commercial aerospace industry was entering a cyclical downturn. Since that time, the popularity of our JIT programs has grown and we now support over 125 customer locations, including approximately 350,000 bins serviced worldwide. During fiscal
66
2010, our on-time delivery rate for JIT customers was over 99%. We believe customers that utilize our comprehensive JIT supply chain management services are frequently able to realize significant benefits including:
- •
- reduced inventory levels, inventory excess and obsolescence expense, in part because such customers only purchase what
they need, and more efficient use of floor space;
- •
- increased accuracy in forecasting and planning, resulting in substantially improved on-time delivery, reduced
expediting costs and fewer disruptions of production schedules;
- •
- improved quality assurance resulting in a substantial reduction in customer parts rejection rates; and
- •
- reduced administrative and overhead costs relating to procurement, QA, supplier management and stocking functions.
Before signing a JIT contract, our customers typically experience outages of many SKUs and, in some cases, have up to a year's worth of inventory on hand. As part of our JIT programs, we generally assume the customer's existing inventory at the onset of the contract, immediately reducing their inventory on-hand and the associated management costs. Customer inventory is generally assumed on a consignment basis and is entered in our database in a distinct customer-specific "virtual warehouse." Software protocol in our IT system requires the system to first "look" to a customer's consigned inventory when parts replenishment is required. In many cases, we can sell this consigned inventory to our base of 7,200 active customers around the world, gradually drawing down the customer's inventory. As the consigned inventory for each SKU is exhausted, our stock of Wesco-sourced product is then used for replenishment. Due to the reliable nature of our services, our customers typically carry approximately 45 days worth of inventory in point-of-use bins instead of months or years worth of such products.
Another key strength of our JIT program is our ability to utilize highly scalable and customizable point-of-use systems to develop an efficient supply chain management system and automated replenishment solution for any number of SKUs. In order to minimize inventory on hand, certain indicators are used to trigger the replenishment of product from a supplying location to the location of consumption. Our "Twin-Bin" system is an example of such an indicator. A JIT program designed around a Twin-Bin system utilizes a specially manufactured unit composed of two bins stacked on top of one another. In this system, a clear plastic bag, typically containing a 30-day supply of parts, is loaded in each bin. Production workers use all of the parts within the bottom bin before drawing a pullout slide between the two bins that drops the full plastic bag of parts from the top bin into the bottom bin. An empty top bin indicates the need to initiate replenishment of the parts and provides a clear visual management process on the manufacturing floor. All replenishment activity is done via hand-held scanners that transmit orders to our stocking locations.
Customer Contracts
We sell parts to our customers under three types of arrangements: JIT supply chain management contracts, LTAs and ad hoc sales.
JIT Contracts
JIT contracts are typically three to five years in length and are structured to supply the parts requirement for specific SKUs, production lines or facilities. Given our direct involvement with JIT customers, volume requirements and purchasing frequency under these contracts is highly predictable. Under JIT contracts, customers commit to purchase specified parts from us at a fixed price, on an if-and-when needed basis, and we are responsible for maintaining high levels of stock availability of those parts. JIT contracts typically contain termination for convenience provisions, which
67
generally allow our customers to terminate their contracts on short notice without meaningful penalties, provided that we are reimbursed for the cost of any inventory specifically procured for the customer. JIT customers also often purchase parts from us that are not captured under their contracts on an ad hoc basis. Approximately 31% of our net sales during fiscal 2010 were generated from JIT contracts.
Long-Term Agreements
Like JIT contracts, LTAs also typically run for three to five years. LTAs are essentially negotiated price lists for customers or individual customer sites that cover a range of pre-determined parts, purchased on an as-needed basis. The negotiated prices are typically tiered based on order size. LTAs generally obligate the customer to buy contracted SKUs from us and may obligate us to maintain stock availability for those parts. Once an LTA is in place, the customer is then able to place individual purchase orders with us for any of the contractually specified parts. LTAs typically contain termination for convenience provisions, which generally allow for our customers to terminate their contracts on short notice without meaningful penalties, provided that we are reimbursed for the cost of any inventory specifically procured for the customer. LTA customers also frequently purchase parts from us that are not captured under the pricing arrangement on an ad hoc basis. Approximately 32% of our net sales during fiscal 2010 were derived from our LTAs.
Ad Hoc Sales
Ad hoc customers purchase parts from us on an as-needed basis and are generally supplied out of our existing inventory. Typically, ad hoc orders are for smaller quantities of parts than those ordered under either JIT contracts or LTAs, and are often urgent in nature. Given our breadth and volume of inventory, it is not uncommon for our competitors to purchase parts from us on an ad hoc basis. In an environment of increasing aircraft production, parts shortages can become increasingly common for OEMs, subcontractors, MROs and distributors with less sophisticated forecasting abilities and procurement organizations. Approximately 37% of our net sales during fiscal 2010 were generated from ad hoc sales.
Under each of the sales arrangements described above we typically warrant that the products we sell conform to the drawings and specifications that are in effect at the time of delivery in the applicable contract, and that we will replace defective or non-conforming products for a period of time that varies from contract to contract. The product manufacturer, in turn, typically indemnifies us for liabilities resulting from defective or non-conforming products.
Customers
We sell to over 7,200 active customers worldwide. Boeing was our largest customer during fiscal 2010 and accounted for approximately 15% of our net sales. No other customer accounted for more than 10% of our net sales during fiscal 2010, and only three customers accounted for over 5% of our net sales during the same period, with each consisting of multiple independent programs. Our top 10 customers collectively accounted for 48% of our net sales during fiscal 2010.
Approximately 87% of our fiscal 2010 net sales were derived from major OEMs, such as Airbus, Boeing, Bombardier, Embraer, Cessna, Gulfstream, BAE Systems, Bell Helicopter, Lockheed Martin, Northrop Grumman and Raytheon, and certain of their subcontractors. Government sales comprised roughly 5% of our net sales during fiscal 2010 and were derived from various military parts procurement agencies such as the U.S. Defense Logistics Agency, or from defense contractors buying on their behalf. Aftermarket sales to airline-affiliated or independent MROs made up roughly 2% of our fiscal 2010 net sales. Airlines and airline maintenance organizations traditionally order parts in smaller quantities with greater frequency, making them more costly to serve. However, we are in the process adding a significant number of products to an airline industry automated quoting system that
68
we believe will provide us with a cost-effective way to penetrate this commercial MRO market. We are currently targeting international airlines and aircraft maintenance centers that are assuming an expanded role within the MRO market. The balance of our net sales are to other distributors.
We estimate that during fiscal 2010, approximately 53% of our net sales were derived from customers supporting military programs and approximately 47% of our net sales were derived from customers supporting commercial programs. Our customers are principally located in the United States, comprising approximately 74% of our net sales during fiscal 2010. We also service international customers in markets that include Canada, the United Kingdom, Italy, France, Germany, China, South Korea and Australia.
Suppliers
We source our inventory from over 1,100 suppliers, including Precision Castparts, Alcoa Fastening Systems, Amphenol Corporation, Lisi Aerospace and Monogram Aerospace Fasteners. During fiscal 2010, we purchased approximately 42% of our inventory from Precision Castparts and Alcoa Fastening Systems. Suppliers typically prefer to deal with a relatively small number of large and sophisticated distributors in order to improve machine utilization, reduce finished goods inventory and maintain pricing discipline. As a result of the scale of our operations and our long-standing relationships with many of our suppliers, we are often able to take advantage of significant volume-based discounts when purchasing inventory. Given our industry position, financial strength and philosophy of cooperation with suppliers, we believe we are in an excellent position to become a distributor for new product lines as they become available.
Procurement
We consider our procurement expertise to be one of our principal competitive advantages. Our management is highly skilled in analyzing supply, demand, cost and pricing factors to make optimal inventory investment decisions and we maintain close relationships with the leading suppliers in the industry. Our strong understanding of the global aerospace industry is derived from our long-term relationships with major OEMs, subcontractors and suppliers. In addition, our direct insight into our customers' production rates often allows us to detect industry trends. Furthermore, our ability to forecast demand and place purchase orders with our suppliers well in advance of our customer requirements provides us with a distinct advantage in an industry where inventory availability is critical for customers that need specific parts within a stipulated timeframe to meet their own production and delivery commitments.
To maintain our industry-leading operating margins and parts availability, we have created a structured procurement process that focuses on return on invested capital, or ROIC, and minimization of excess inventory. Prior to placing a purchase order, members of our supply chain organization analyze a "buy requisition," which is generated by our IT system. Buy requisitions provide several key pieces of information, including the amount of that SKU currently on-hand, a listing of all active customers that use the specific SKU, the quantities and rates at which the part has been consumed by these customers in the past, tiered pricing for various quantities at which the supplier offers price breaks and recent selling prices of various order sizes. Using the information obtained from the buy requisition, a Wesco employee then conducts an ROIC analysis to determine the expected payback period and margin on the specified inventory investment before making the final procurement decision. This calculated approach to inventory investment, combined with our unique market insight, has enabled us to generate and sustain industry-leading operating margins.
69
Operations
We have developed a highly structured system in order to manage the receipt, processing and shipment of inventory. This system is based on an efficient warehouse layout, automated machinery, our customized IT system and hand-held scanners. The typical process that each lot of inventory undergoes is outlined below.
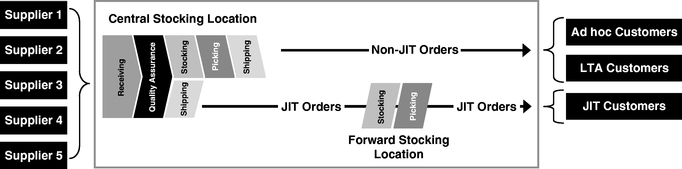
CSLs and FSLs
Our warehouse operations are divided between CSLs and forward stocking locations, or FSLs. Our primary CSL is located at our global headquarters in Valencia, California. We also operate a CSL in Wichita, Kansas, which primarily serves our global EPG business, and a CSL in Clayton West, U.K., which primarily serves Europe, India and the Middle East. Our CSLs serve as the primary supply warehouses for most of our net sales and also house our procurement, customer service, document control, IT, material support and quality assurance functions. Our CSLs are supported by sales offices throughout the U.S., Canada, Germany, France, Italy and China.
Complementing our CSLs and sales offices are FSLs. An FSL is a specialized stocking point for one or more JIT contracts located within a geographic region. FSLs are typically located either nearby or within a customer facility and are established to support large contracts. In certain instances, FSLs initially established to service a single customer are expanded to service other regional customers.
Receiving
All inventory enters our warehouses through a common receiving area. When shipments are received, each package is opened and the documentation is examined. If the documentation is missing or deficient, the shipment is either returned to the supplier or set aside in a designated holding area until accurate documentation is received. If the documentation is acceptable, a Wesco employee inputs the relevant information into our inventory management system, including the SKU, lot number, receipt date, quantity and unit cost.
Quality Assurance
After a shipment has gone through receiving, it is then processed by the QA department. This department inspects the inventory we purchase to ensure the accuracy and completeness of documentation. We also maintain an electronic copy of the relevant certifications for the inventory, which can include a manufacturer certificate of conformance, test reports, process certifications, material distributor certifications and raw material mill certifications. In addition, dimensional inspections are performed on all lots from suppliers that are not certified by our QA department, and all lots for our JIT customers undergo dimensional, and in some cases, structural inspections. For many of our customers, these inspections are conducted at our in-house laboratory, where we operate sophisticated testing equipment.
70
Stocking
Inventory that passes the quality assurance inspection is placed on a conveyor to a staging area, where warehouse employees assign stocking locations to the parts. Upon arrival at the designated stocking location, an employee scans the bar code affixed to the lot of inventory and the bar code corresponding to the specific shelf location where the lot is to be placed. This stocking information is then transmitted wirelessly to our inventory management system.
Picking
When we receive a purchase order from a customer, a notification is sent to the warehouse, where an employee uses a picker truck to retrieve the required part from its stocking location. Each picker truck is equipped with scales used to count the requested number of parts. Each different part type is then placed in a clear plastic bag and sealed. Labels are then generated using hand-held equipment and placed on the bags, and any required documentation is printed and placed along with the bags into color coded crates (crates are color coded based on order urgency so warehouse staff can effectively prioritize shipping requirements). The crates then travel on a conveyer system to the shipping area.
Shipping
Upon arriving in the shipping area, parts bags and related documentation are placed into boxes and sealed. The shipping clerk enters the order into a third-party shipping system, generating a label based on the shipping requirements for that customer (e.g., FedEx, UPS, DHL, etc.). Once processed, the system uploads tracking numbers and freight costs, if applicable, and can send an automatic notification to a customer that their order has shipped, or automatically send documentation via e-mail to a freight forwarder to prepare shipments for export. A variety of shipping options are available (same day, overnight, etc.) depending on customer requirements. The picking and shipping processes are organized such that, if necessary, we are able to ship product on the same day a purchase order is received in order to satisfy urgent customer requirements.
71
Properties
Our global headquarters is located at 27727 Avenue Scott, Valencia, California 91355. As of December 31, 2010, we have a total of 28 administrative, sales and/or stocking facilities located in 10 countries, all of which are either leased or located at a customer site. The following table sets forth certain information regarding these facilities:
Region
|
Location | Purpose | Facility Size (Sq. Feet) | |||
|---|---|---|---|---|---|---|
North America |
Valencia, CA (Wesco headquarters) | Sales, CSL and Administrative | 150,428 | |||
|
Wichita, KS (EPG headquarters) | Sales, CSL and Administrative | 67,500 | |||
|
Auburn, WA | Sales and FSL | 9,370 | |||
|
Charleston, SC | FSL | 22,159 | |||
|
Charleston, SC | FSL* | <500 | |||
|
Fort Worth, TX | Sales and FSL | 40,000 | |||
|
Glen Cove, NY | Sales | 3,700 | |||
|
Holbrook, NY | Sales | 1,050 | |||
|
Indianapolis, IN | FSL | 10,800 | |||
|
Mesa, AZ | Sales | 3,648 | |||
|
Nashville, TN | FSL* | 7,200 | |||
|
Orlando, FL | Sales | 4,636 | |||
|
West Chester, PA | FSL | 3,227 | |||
|
St. Louis, MO | FSL | 10,750 | |||
|
Mississauga, Ontario | Sales | 2,164 | |||
|
Lachine, Quebec | Sales and FSL | 31,037 | |||
Rest of the World |
Clayton West, UK | Sales, CSL and Administrative | 36,577 | |||
|
Filton, UK | FSL* | 2,200 | |||
|
Bremen, Germany | Sales | 2,508 | |||
|
Blagnac, France | Sales and FSL | 4,746 | |||
|
Marcon, Italy | Sales | 1,865 | |||
|
Grottaglie, Italy | FSL* | 10,500 | |||
|
Tessera, Italy | FSL* | 1,076 | |||
|
Holon, Israel | FSL | 5,381 | |||
|
Busan, South Korea | FSL* | <500 | |||
|
Shanghai, China | Sales | 1,222 | |||
|
Xi'An, China | FSL* | 2,000 | |||
|
Ta'if, Saudi Arabia | FSL* | 1,264 |
- *
- Located at customer site.
Information Technology System
Our scalable IT infrastructure is based on IBM servers and the Oracle JD Edwards EnterpriseOne, or JDE, ERP system. Our IT system provides a powerful, highly distributed computing environment that enables us to quickly scale on demand as business dictates. We also employ virtualization technology to increase system availability, reduce hardware and maintenance costs and respond efficiently to market dynamics. Our entire data services infrastructure runs 24/7 and is protected by network security technologies, an uninterrupted power supply and a backup diesel generator. Remote access to our systems is provided via separate, high speed connections. Our IT infrastructure supports our business critical applications, such as JDE, TRA/X Shipping, AIMS Warehouse Management, or AIMS, and Electronic Data Interchange, or EDI.
72
At the core of our IT system is our JDE ERP system. JDE covers the full lifecycle of our distribution process, including procurement, planning, supply chain management, sales and accounting. JDE is fully capable of interfacing to external business systems and we have developed additional functionality within JDE for JIT delivery and direct line feed of the products we sell. This functionality includes recognition of signals and actions to fill customer bins from hand-held scanners, min/max data or proprietary signals from a customer's ERP system. JDE also supports our EDI functionality, which allows our system to interface with customers and suppliers, regardless of technology, data format or connectivity.
For our shipping logistics and export compliance support, we employ Precision Software's TRA/X. TRA/X enables us to ship globally while maintaining tracking numbers and rating information for each customer shipment. In addition, at several of our distribution facilities, we use Minerva's AIMS inventory management system in order to provide the best possible warehouse flow and cycle times. AIMS is tailored to fit our global warehouse operational needs and allows us to provide an expandable warehouse management system that can also incorporate transaction processing, work-in-progress and other manufacturing operations. AIMS interfaces with a broad range of material handling equipment, including horizontal and vertical carousels, conveyors, sorting equipment, pick systems and cranes.
Competition
The industry in which we operate is highly competitive and fragmented. We believe the principal competitive factors in our industry include the ability to provide superior customer service and support, on-time delivery, sufficient inventory availability, competitive pricing and an effective quality assurance program. Our competitors include both U.S. and foreign companies, including divisions of larger companies, some of which have significantly greater financial resources than we do, and therefore may be able to adapt more quickly to changes in customer requirements than we can. We estimate that Wesco and BE Aerospace together comprised approximately 23% of the $6.1 billion global market for C class aerospace parts during 2009. Our next largest competitors include the Pentacon business of Anixter International and the Pattonair business of Umeco.
In addition to facing competition for JIT customers from our primary competitors, JIT customers or potential JIT customers may also determine that it is more cost effective to establish or re-establish an in-house supply chain management system. Under these circumstances, we may be unable to sufficiently reduce our costs in order to provide competitive pricing while also maintaining acceptable operating margins.
Sales and Marketing
As of December 31, 2010, we employed 222 sales personnel with an average of over 8 years of experience at Wesco. Our sales professionals as of that date were located in the following regions: 167 in the U.S., 41 in Europe and 14 in Canada. Our marketing efforts are continuing to expand into emerging markets, including a recent office opening in India. We believe that maintaining both inside and outside sales representatives who are extremely facile in the technical details of the products we sell provides a substantial competitive advantage over our smaller competitors. As of December 31, 2010, we had 202 inside sales representatives who provide access to our entire inventory, as well as technical expertise on the products we sell. In addition, as of December 31, 2010, we also had 20 OSRs worldwide who provide support at certain of our customer sites. The support provided by these OSRs includes making recommendations for the products best suited for specific applications, providing technical assistance with drilling and the installation of fasteners and troubleshooting issues relating to installation tooling. Our OSRs' hands-on expertise and access to the customer site allows them a unique opportunity to market additional products to our customers.
73
Employees
As of December 31, 2010, we employed 1,003 personnel worldwide, 96 of which were located at customer sites. We have 234 employees located outside of North America. We are not a party to any collective bargaining agreements with our employees.
Regulatory Matters
Governmental agencies throughout the world, including the FAA in the United States, prescribe standards for aircraft components, including virtually all commercial airline and general aviation products, as well as regulations regarding the repair and overhaul of airframes and engines. Specific regulations vary from country to country, although compliance with FAA requirements generally satisfies regulatory requirements in other countries. In addition, the products we distribute must also be certified by aircraft and engine OEMs. If any of the material authorizations or approvals that allow us to supply products is revoked or suspended, then the sale of the related products would be prohibited by law, which would have an adverse effect on our business, financial condition and results of operations.
From time to time, the FAA or equivalent regulatory agencies in other countries propose new regulations or changes to existing regulations, which are usually more stringent than existing regulations. If these proposed regulations are adopted and enacted, we could incur significant additional costs to achieve compliance, which could have a material adverse effect on our business, financial condition and results of operations.
We are also subject to government rules and regulations that include the FCPA, ITAR and the False Claims Act. See "Risk Factors—We are subject to unique business risks as a result of supplying equipment and services to the U.S. Government" and "—Our international operations require us to comply with anti-corruption laws and regulations of the U.S. government and various international jurisdictions."
Environmental Matters
Although we are subject to various environmental regulations, we are not aware of any environmental issues that would be likely to have a materially adverse impact upon our business or financial condition.
Legal Proceedings
We are involved in various legal matters that arise in the normal course of our business. We believe that the ultimate outcome of such matters will not have a material adverse effect on our financial position, results of operations or cash flows. There can be no assurance, however, that such actions will not be material or adversely affect our business, financial position, and results of operations or cash flows.
74
Directors and Executive Officers
The following table sets forth certain information regarding our executive officers and directors, as of the date of this prospectus:
Name
|
Age | Position | ||||
|---|---|---|---|---|---|---|
| Randy J. Snyder | 61 | Chairman of the Board of Directors, President and Chief Executive Officer | ||||
| Hal Weinstein | 57 | Executive Vice President of Sales and Marketing | ||||
| Tommy Lee | 63 | Executive Vice President | ||||
| Gregory A. Hann | 56 | Executive Vice President and Chief Financial Officer | ||||
| Alex Murray | 41 | Vice President of Global Operations | ||||
| Dayne A. Baird | 34 | Director | ||||
| Peter J. Clare | 45 | Director | ||||
| Paul E. Fulchino | 64 | Director | ||||
| John P. Jumper | 66 | Director | ||||
| Adam J. Palmer | 38 | Director | ||||
| Robert D. Paulson | 65 | Director | ||||
| David L. Squier | 65 | Director | ||||
Randy J. Snyder has served as our President and Chief Executive Officer since 1977 and has been the Chairman of the Board of Directors since 2006.
Our board of directors has concluded that Mr. Snyder should serve on our board of directors based upon his intimate knowledge of our operations and his role in leading our transition from a small niche distributor to the largest C class aerospace component distributor in the world and an authorized stocking distributor for all major aerospace hardware manufacturers worldwide. Mr. Snyder is a director nominee designated by the Wesco Stockholders, pursuant to the terms of the Stockholders Agreement described under "Certain Relationships and Related Party Transactions—Amended and Restated Stockholders Agreement."
Hal Weinstein joined Wesco in 1983 and has served as the head of sales and marketing for the Company since 1988. Mr. Weinstein oversees our worldwide sales and marketing operations and is responsible for global marketing strategy, inclusive of advertising and website development and maintenance. He previously served as our Regional Sales Manager from 1983 to 1988. Prior to joining Wesco, Mr. Weinstein served as Director of Sales for Asset Financing International, an equipment leasing company based in Ridgefield, Connecticut, from 1981 to 1983.
Tommy Lee joined Wesco in 1984 and has served as our Executive Vice President in charge of all of our operations, with special emphasis on procurement and supplier relations, since 1990. He previously served as our Vice President of Sales from 1984 to 1990. Mr. Lee has been actively involved in sales and management in the aerospace industry since 1967. Prior to joining Wesco, Mr. Lee worked for a Lockheed Martin Corporation-owned company from 1967 to 1971 and was the National Sales Manager for a major fastener distributor from 1971 to 1984.
Gregory A. Hann has served as our Executive Vice President and Chief Financial Officer since joining Wesco in 2009. Mr. Hann was previously the Chief Financial Officer of Transamerican Auto Parts, a privately held retailer and distributor of 4-wheel drive and off road vehicle parts, from 2007 to 2009, and the Chief Financial Officer of publicly traded Ducommun Incorporated, a manufacturer of aerospace structures, from 2006 to 2007. Mr. Hann is a certified public accountant.
75
Alex Murray joined Wesco in 2000 and has served as Vice President of Global Operations since 2010. He previously served as our Logistic Manager from 2000 to 2003, Director of Contract Business from 2003 to 2005, and EU Managing Director from 2005 to 2010. Prior to joining Wesco, Mr. Murray was employed by BAE Systems in various roles within the logistics, procurement, supply chain and quality organizations.
Dayne A. Baird has been a member of our board of directors since 2010. Mr. Baird is a Vice President at Carlyle where he focuses on U.S. buyout opportunities in the aerospace, defense and government services sectors. Mr. Baird has been with Carlyle since 2003. Prior to joining Carlyle, Mr. Baird worked in the mergers and acquisitions and global industrial groups of Lehman Brothers from 2000 to 2003, where he focused on transactions in the industrial, aerospace and defense sectors. Mr. Baird currently serves on the board of directors of ARINC Incorporated.
Our board of directors has concluded that Mr. Baird should serve as a director because in addition to his demonstrated leadership as a Vice President of Carlyle, he brings valuable insight to our board of directors about the global aerospace and defense industries. Mr. Baird is a director nominee designated by Carlyle pursuant to the terms of the Stockholders Agreement described under "Certain Relationships and Related Party Transactions—Amended and Restated Stockholders Agreement."
Peter J. Clare has been a member of our board of directors since 2006. Mr. Clare is a Managing Director of Carlyle and has served as Co-head of the U.S. Buyout group since 2011. He previously served as the Deputy Head of the U.S. Buyout group and as the Head of the Global Aerospace and Defense sector team. Mr. Clare has been with Carlyle since 1992. He currently serves on the boards of directors of ARINC Incorporated, Booz Allen Hamilton Holding Corporation, CommScope, Inc. and Sequa Corporation and previously served on the board of directors of Aviall, Inc., Avio SpA, Landmark Aviation, United Defense and Vought Aircraft Industries, Inc.
Our board of directors has concluded that Mr. Clare should serve as a director because in addition to his demonstrated leadership as a Managing Director of Carlyle and his extensive experience in private equity, he brings valuable insight to our board of directors about the global aerospace and defense industries. In addition, as a result of his current service as a director of ARINC Incorporated, Booz Allen Hamilton Holding Corporation, CommScope, Inc. and Sequa Corporation, Mr. Clare brings valuable knowledge to our board of directors about the operations, compensation programs and corporate governance of other companies. Mr. Clare is a director nominee designated by Carlyle pursuant to the terms of the Stockholders Agreement described under "Certain Relationships and Related Party Transactions—Amended and Restated Stockholders Agreement."
Paul E. Fulchino has been a member of our board of directors since 2008. From 2000 until his retirement in 2010, Mr. Fulchino served as Chairman, President and Chief Executive Officer of Aviall, Inc., which became a wholly-owned subsidiary of The Boeing Company on September 20, 2006. Mr. Fulchino had previously served as President and Chief Operating Officer of BE Aerospace, Inc. from 1996 to 1999 and President and Vice Chairman of Mercer Management Consulting, Inc. from 1990 to 1996. He currently serves on the boards of directors of Global Technologies and Spirit Aerosystems, Inc. and previously served on the board of directors of Aviall, Inc. and The Sports Authority, Inc.
Our board of directors has concluded that Mr. Fulchino should serve as a director because in addition to his extensive experience in the aerospace MRO industry, he brings a unique perspective to our board of directors regarding the global aerospace industry. In addition, as a result of his current service as a director of Global Technologies and Spirit Aerosystems, Inc., Mr. Fulchino brings valuable knowledge to our board of directors about the operations, compensation programs and corporate governance of other companies. Mr. Fulchino is a director nominee designated by Carlyle pursuant to the terms of the Stockholders Agreement described under "Certain Relationships and Related Party Transactions—Amended and Restated Stockholders Agreement."
76
John P. Jumper has been a member of our board of directors since 2007. Mr. Jumper retired from the United States Air Force in 2005 after a distinguished 39-year military career. In his last position as Chief of Staff, he served as the senior military officer in the Air Force leading more than 700,000 military, civilian, Air National Guard and Air Force Reserve men and women. As Chief of Staff, he was a member of the Joint Chiefs of Staff providing military advice to the Secretary of Defense, the National Security Council and the President. In earlier assignments he served on the Joint Staff and as Senior military Assistant to Secretary of Defense Dick Cheney and Secretary Les Aspin. He currently serves on the boards of directors of Goodrich Corporation, Jacobs Engineering, and SAIC, as well as on the non-profit board of directors of the Air Force Village Charitable Foundation, the American Air Museum at Duxford, England, the George C. Marshall Foundation and the VMT Board of Visitors. Mr. Jumper previously served on the board of directors of Tech Team Global and Somanetics Corporation.
Our board of directors has concluded that Mr. Jumper should serve as a director because in addition to his demonstrated leadership throughout his 39-year military career, he brings knowledge regarding the military aerospace industry. In addition, as a result of his current service as a director of Goodrich Corporation, TechTeam Global, Jacobs Engineering, SAIC and Somanetics, Mr. Jumper brings valuable knowledge to our board of directors about the operations, compensation programs and corporate governance of other companies. Mr. Jumper is a director nominee designated by Carlyle pursuant to the terms of the Stockholders Agreement described under "Certain Relationships and Related Party Transactions—Amended and Restated Stockholders Agreement."
Adam J. Palmer has been a member of our board of directors since 2006. Mr. Palmer is a Managing Director of Carlyle and has been the Head of the Global Aerospace and Defense sector team since 2011. Mr. Palmer joined Carlyle in 1996 as a member of the Aerospace, Defense and Government Services sector team. Prior to joining Carlyle, Mr. Palmer was with Lehman Brothers focusing on mergers, acquisitions and financings for defense electronics and information services companies. He currently serves on the boards of directors of RPK Capital Management Group, LLC, Sequa Corporation and Triumph Group, Inc. and previously served on the board of directors of Landmark Aviation, Standard Aero, Ltd., U.S. Investigations Services, Inc. and Vought Aircraft Industries, Inc.
Our board of directors has concluded that Mr. Palmer should serve as a director because in addition to his demonstrated leadership as a Managing Director of Carlyle and his extensive experience in private equity and investment banking, he brings additional perspectives to our board of directors about the global aerospace and defense industries. In addition, as a result of his current service as a director of RPK Capital Management Group, LLC, Sequa Corporation and Triumph Group, Inc., Mr. Palmer brings valuable knowledge to our board of directors about the operations, compensation programs and corporate governance of other companies. Mr. Palmer is a director nominee designated by Carlyle pursuant to the terms of the Stockholders Agreement described under "Certain Relationships and Related Party Transactions—Amended and Restated Stockholders Agreement."
Robert D. Paulson has been a member of our board of directors since 2006. Mr. Paulson has served as the Chief Executive Officer of Aerostar Capital LLC, a private equity investment firm, since he founded the firm in 1997. Prior to founding Aerostar Capital, Mr. Paulson retired from McKinsey & Company, Inc., an international management consulting firm, where he had served as the Los Angeles Office Manager from 1982 to 1989, led the Global Aerospace and Defense Practice from 1985 to 1997, and was twice elected to McKinsey's board of directors. He currently serves on the boards of directors of Ducommun Inc., Nationwide Health Properties, Inc. and the Grand Teton Music Festival, and previously served on the board of directors of US Rentals Inc. and Forgings International, L.P.
Our board of directors has concluded that Mr. Paulson should serve as a director because in addition to his extensive experience in the aerospace defense industry, corporate governance practices,
77
private equity and consulting, he brings unique insights to our board of directors regarding the global aerospace and defense industries. In addition, as a result of his current service as a director of Ducommun Inc. and Forgings International, LP, Mr. Paulson brings valuable knowledge to our board of directors about the operations, compensation programs and corporate governance of other companies. Mr. Paulson is a director nominee designated by Carlyle pursuant to the terms of the Stockholders Agreement described under "Certain Relationships and Related Party Transactions—Amended and Restated Stockholders Agreement."
David L. Squier has been a member of our board of directors since 2007. Mr. Squier retired from Howmet Corporation in October 2000, where he served as the President and Chief Executive Officer for over eight years. Prior to his tenure as CEO of Howmet, Mr. Squier served in a number of senior management assignments at Howmet, including Executive Vice President and Chief Operating Officer. Mr. Squier was also a member of the board of directors of Howmet from 1987 until his retirement. Mr. Squier currently serves as an adviser to Carlyle. Mr. Squier currently serves on the board of directors of Sequa Corporation and previously served on the boards of directors of UCI International, Inc., Forged Metal, Inc. and Vought Aircraft Industries from 2003 to 2010.
Our board of directors has concluded that Mr. Squier should serve as a director because in addition to his extensive industry experience and his current role as an advisor to Carlyle, he brings additional perspectives to our board of directors regarding the global aerospace and defense industries. In addition, as a result of his current service as a director of Sequa Corporation and prior experience with other companies, Mr. Squier brings valuable knowledge to our board of directors about the operations, compensation programs and corporate governance of other companies. Mr. Squier is a director nominee designated by Carlyle pursuant to the terms of the Stockholders Agreement described under "Certain Relationships and Related Party Transactions—Amended and Restated Stockholders Agreement."
Controlled Company
For purposes of the rules of the stock exchange on which we will be listed, we expect to be a "controlled company" upon completion of this offering. Controlled companies under those rules are companies of which more than 50% of the voting power for the election of directors is held by an individual, a group or another company. We expect that Carlyle will continue to control more than 50% of the combined voting power of our common stock upon completion of this offering and will continue to have the right to designate a majority of the members of our board of directors for nomination for election and the voting power to elect such directors following this offering. Accordingly, we expect to be eligible to, and we intend to, take advantage of certain exemptions from corporate governance requirements provided in rules of the stock exchange on which we will be listed. Specifically, as a controlled company, we would not be required to have (i) a majority of independent directors, (ii) a nominating and corporate governance committee composed entirely of independent directors, (iii) a compensation committee composed entirely of independent directors or (iv) an annual performance evaluation of the nominating and corporate governance and compensation committees. Accordingly, you will not have the same protections afforded to stockholders of companies that are subject to all of the applicable rules of the stock exchange on which we will be listed.
Board Composition
Our board of directors is currently composed of eight directors, including Mr. Snyder, our Chairman of the Board of Directors, President and Chief Executive Officer.
We entered into a stockholders agreement with Randy Snyder, Susan Snyder, certain affiliates of Mr. Snyder, certain of our employees (together with Randy Snyder, Susan Snyder and the affiliates of Mr. Snyder, the Wesco Stockholders) and certain affiliates of Carlyle, or the Carlyle Stockholders, on
78
September 29, 2006, which stockholders agreement was subsequently amended on November 30, 2007 and April 17, 2008, or as amended, the Stockholders Agreement. Pursuant to the Stockholders Agreement, the number of directors on the board of directors is set at eight. The Carlyle Stockholders have the right to appoint seven directors, three of whom are subject to the consent of the Wesco Stockholders. The Wesco Stockholders also have the right to appoint one director. The exact number of directors may be modified from time to time by resolution of our board of directors with the consent of the Carlyle Stockholders and the Wesco Stockholders.
Upon effectiveness of the registration statement of which this prospectus forms a part, the Stockholders Agreement will be amended and restated, which we refer to as the Amended and Restated Stockholders Agreement. Under the Amended and Restated Stockholders Agreement, Carlyle will continue to have certain rights to designate members of our board of directors.
Board Committees
Our board of directors directs the management of our business and affairs as provided by Delaware law and conducts its business through meetings of our board of directors and two standing committees: the audit committee and the compensation committee. Effective upon completion of this offering, our board of directors will also have a nominating and corporate governance committee.
Audit Committee
Our audit committee is responsible, among its other duties and responsibilities, for overseeing our accounting and financial reporting processes, the audits of our financial statements, the qualifications and independence of our independent registered public accounting firm, the performance of our internal audit function and independent registered public accounting firm. Our audit committee reviews and assesses the qualitative aspects of our financial reporting, our processes to manage business and financial risks and our compliance with significant applicable legal, ethical and regulatory requirements. Our audit committee is directly responsible for the appointment, compensation, retention and oversight of our independent registered public accounting firm. The charter of our audit committee will be available without charge on the investor relations portion of our website upon completion of this offering.
Upon completion of this offering, the audit committee will consist of Messrs. (chair), and . Our board of directors has determined that is independent within the meaning of the rules of the stock exchange on which we will be listed and Rule 10A-3 under the Exchange Act, and has also determined that Mr. is an "audit committee financial expert," as such term is defined under the applicable regulations of the SEC.
Compensation Committee
Our compensation committee is responsible, among its other duties and responsibilities, for reviewing and approving all forms of compensation to be provided to our executive officers and directors, establishing our general compensation policies and reviewing, approving and overseeing the administration of our employee benefits plans. Our compensation committee also periodically reviews management development and succession plans. The charter of our compensation committee will be available without charge on the investor relations portion of our website upon completion of this offering.
Upon completion of this offering, the compensation committee will consist of Messrs. (chair), and .
79
Nominating and Corporate Governance Committee
Our nominating and corporate governance committee will have responsibility for, among other things: (1) recommending persons to be selected by our board of directors as nominees for election as directors; (2) recommending persons to be selected by our board of directors as members and chairperson for each committee of the board of directors; (3) analyzing and proposing for decision of the board of directors the governance policies of the Company; (4) reviewing and making recommendations to the board of directors regarding compensation paid to the directors; and (5) monitoring our performance in meeting our obligations with respect to professional ethics and integrity in internal and external matters and our principles of corporate governance. The charter of our nominating and corporate governance committee will be available without charge on the investor relations portion of our website upon completion of this offering.
Upon completion of this offering, the nominating and corporate governance committee will consist of Messrs. (chair), and .
In addition, from time to time, other committees may be established under the direction of our board of directors when necessary to address specific issues.
Compensation Committee Interlocks and Insider Participation
During fiscal 2010, our compensation committee consisted of Messrs. Fulchino, Jumper, Palmer and Squier. None of the members of our compensation committee is currently one of our officers or employees. During fiscal 2010, none of our executive officers served as a member of the board of directors or compensation committee, or other committee serving an equivalent function, of any entity that has one or more executive officers who serve as members of our board of directors or our compensation committee.
Code of Ethics
We have adopted a code of ethics that applies to our executive officers. A copy of the code of ethics will be available on our website and will also be provided to any person without charge. Request should be made in writing to Director of Human Resources at 27727 Avenue Scott, Valencia, CA 91355.
80
COMPENSATION DISCUSSION AND ANALYSIS
Executive Summary
This Compensation Discussion and Analysis provides an overview and analysis of (i) the elements of our compensation program for our named executive officers, or NEOs, identified below, (ii) the material compensation decisions made under that program and reflected in the executive compensation tables that follow this Compensation Discussion and Analysis and (iii) the material factors considered in making those decisions. We intend to provide our NEOs with compensation that is significantly performance based. Our executive compensation program is designed to align executive pay with our performance on both short and long-term bases, link executive pay to specific, measurable results intended to create value for stockholders, and utilize compensation as a tool to assist us in attracting and retaining the high-caliber executives that we believe are critical to our long-term success.
The primary elements of our executive compensation program and their corresponding objectives are summarized in the following table:
Compensation Element
|
Objective | |
|---|---|---|
Base Salary |
To recognize performance of job responsibilities and as a necessary tool to attract and retain individuals with superior talent. | |
Annual performance-based compensation |
To promote our near-term performance objectives and reward individual contributions to the achievement of those objectives. | |
Discretionary long-term equity incentive awards |
To emphasize our long-term performance objectives, encourage the maximization of stockholder value and retain key executives by providing an opportunity to participate in the ownership of the Company. | |
Severance and change in control benefits |
To encourage the continued attention and dedication of key individuals and to focus the attention of key individuals when considering strategic alternatives. | |
Retirement savings (401(k)) |
To provide an opportunity for tax-efficient savings and long-term financial security. | |
Other elements of compensation and perquisites |
To attract and retain talented executives in a cost-efficient manner by providing benefits with high perceived values at relatively low cost to us. |
To serve the foregoing objectives, our overall executive compensation program is generally designed to be flexible rather than formulaic. The compensation committee of our board of directors, or the compensation committee, has primary authority to determine and approve compensation decisions with respect to our NEOs. In alignment with the objectives set forth above, the compensation committee determines overall compensation, and its allocation among the elements described above, in reliance upon the judgment and general industry knowledge of its members obtained through years of service with comparably sized companies in our and similar industries.
For the year ended September 30, 2010, our NEOs are Randy Snyder, our Chief Executive Officer, Greg Hann, our Executive Vice President and Chief Financial Officer, Hal Weinstein, our Executive Vice President, Sales and Marketing, Tommy Lee, our Executive Vice President, and Alex Murray, our Vice President, Global Operations. Our compensation decisions for the NEOs in fiscal 2010 are discussed below in relation to each of the above-described elements of our compensation program. The
81
below discussion is intended to be read in conjunction with the executive compensation tables and related disclosures that follow this Compensation Discussion and Analysis.
Compensation Overview
Our overall executive compensation program is structured to attract, motivate and retain highly qualified executive officers by paying them competitively, consistent with our success and their contribution to that success. We believe compensation should be structured to ensure that a significant portion of compensation opportunity will be related to factors that directly and indirectly influence stockholder value. Accordingly, we set goals designed to link each NEO's compensation to our performance. Consistent with our performance-based philosophy, we provide a base salary to our NEOs, significant incentive-based compensation, which includes variable cash awards under our annual incentive bonus program based on our financial and operational performance, as well as stock option and other equity and equity-based awards granted to our NEOs to align our NEOs' interests with our long-term performance.
Total compensation for our NEOs has been allocated between cash and equity compensation taking into consideration the balance between providing short-term incentives and long-term investment in our financial performance to align the interests of management with stockholders. The variable annual incentive award and the equity awards are designed to ensure that total compensation reflects our overall success or failure and to motivate the NEOs to meet appropriate performance measures, thereby maximizing total return to stockholders. In anticipation of our initial public offering, we intend to adopt a new equity incentive plan, which we refer to as the "2011 Equity Incentive Award Plan."
Determination of Compensation Awards
The compensation committee is provided with the primary authority to determine and approve the compensation awards available to our NEOs and is charged with reviewing our executive compensation policies and practices to ensure (i) adherence to our compensation philosophies and (ii) that the total compensation paid to our NEOs is fair, reasonable and competitive, taking into account our position within our industry and the level of expertise and experience of our NEOs in their positions. The compensation committee is primarily responsible for (i) determining each NEO's base salary and target bonus level (representing the bonus that may be awarded expressed as a percentage of base salary or as a dollar amount for the year), (ii) assessing the performance of the Chief Executive Officer and other NEOs for each applicable performance period and (iii) determining the amount of awards to be paid to our Chief Executive Officer and other NEOs under our annual incentive bonus program for each year, after taking into account any previously established target bonus levels and performance during the year, and the amount of any stock option or other equity or equity-based awards to be granted to our NEOs. To aid the compensation committee in making its determinations, our Chief Executive Officer provides recommendations annually to the compensation committee regarding the compensation of all officers, excluding himself. The performance of our senior executive management team is reviewed annually by the compensation committee and the compensation committee determines each NEO's compensation annually.
In determining compensation levels for our NEOs, the compensation committee considers each NEO's unique position and responsibility and relies upon the judgment and industry experience of its members, including their knowledge of competitive compensation levels in our industry. We believe that our NEOs' base salaries should be competitive with salaries for executive officers in similar positions and with similar responsibilities in our marketplace and adjusted for financial and operating performance and previous work experience. In this regard, each NEO's current and prior compensation, including compensation paid by our predecessor or the NEO's prior employer, is considered as a base against which determinations are made as to whether increases are appropriate to retain the NEO in light of competition or in order to provide continuing performance incentives.
82
In making compensation determinations, the compensation committee historically has not made regular use of benchmarking or compensation consultants and historically has not referred to specific compensation survey data. Rather, in alignment with the considerations described above, the compensation committee determines the total amount of compensation for our NEOs, and the allocation of total compensation among each of our three main components of compensation, in reliance upon the judgment and general industry knowledge of its members obtained through years of service with comparably sized companies in our industry and other similar industries to ensure the attraction, development and retention of superior talent.
We believe that direct ownership in our Company provides our NEOs with a strong incentive to increase the value of the Company and we therefore historically have encouraged equity ownership in the Company by NEOs and other employees through a variety of means, including direct stock ownership by NEOs and other employees, and the award of stock options and other equity-based interests that have been received by the NEOs. We believe that the equity ownership positions of our NEOs are substantial and therefore we have not implemented a formal policy with respect to requiring officers and directors to own our stock.
Base Compensation For 2010
We set base salaries for our NEOs generally at a level we deem necessary to attract and retain individuals with superior talent, using the methodologies described above. Each year we determine base salary increases based upon the performance of the NEOs as assessed by the compensation committee, and for NEOs other than the Chief Executive Officer, in conjunction with recommendations made by the Chief Executive Officer. The compensation committee reviews and evaluates base salaries for our NEOs annually, but formulaic base salary increases are not provided to the NEOs.
In fiscal 2009, the compensation committee determined to provide base salary increases to Messrs. Snyder, Weinstein, Lee and Murray to reward our continued superior performance through a period of economic uncertainty, to maintain their compensation at a fair, reasonable and competitive level and in recognition of the fact that they had not received base salary increases in several years. In addition, following the completion of the 2010 fiscal year, the compensation committee determined to adjust Mr. Hann's base salary, effective as of November 2, 2010, to reward Mr. Hann for our superior financial performance, to seek to ensure the retention of Mr. Hann as our Executive Vice President and Chief Financial Officer and in recognition of the fact that Mr. Hann had not received a base salary increase since commencing employment with us in February 2009. The base salaries for our NEOs before and after these increases are set forth in the following table:
Name and Principal Position
|
Base Salary Before Increase ($) |
Base Salary After Increase ($) |
|||||
|---|---|---|---|---|---|---|---|
Randy Snyder |
600,000 | 650,000 | |||||
Greg Hann |
300,000 | 325,000 | |||||
Hal Weinstein |
300,000 | 325,000 | |||||
Tommy Lee |
270,000 | 315,000 | |||||
Alex Murray(1) |
147,814 | 186,546 | |||||
- (1)
- Base salary amounts for Mr. Murray, who is employed in the United Kingdom, are presented based on an assumed conversion ratio of pounds to dollars of 1.5809, which was the exchange rate in effect on September 30, 2010.
Annual Performance-Based Compensation For 2010
We structure our compensation programs to reward NEOs based on our performance and the individual executive's contribution to that performance. NEOs are eligible to receive bonus
83
compensation under our Management Annual Incentive Plan in the event certain specified corporate performance measures are achieved.
This annual bonus program consists of cash awards based upon our achievement of performance goals determined by the compensation committee. Under the terms of the annual bonus plan, NEOs have target bonus amounts based upon a percentage of their base salaries as of the start of the applicable fiscal year, ranging from 35% to 100%. Our NEOs have the ability to earn more or less than their target bonus amounts for over performance or under performance, as determined with reference to the applicable performance goals. None of our NEOs has a guaranteed minimum annual performance bonus. The maximum and minimum portions of target awards, if any, payable under the plan may vary from year to year and are set at levels that we determine are necessary to maintain competitive compensation practices and properly motivate our NEOs by rewarding them for our annual performance and their contributions to that performance.
Awards paid under the plan are based upon the level of achievement in relation to two Company-wide performance metrics: Bonus EBITDA and Bonus Cash Flow. For this purpose, "Bonus EBITDA" is defined generally as our earnings before interest, taxes, depreciation expense and amortization expense, equity compensation expense, management and transaction fees and extraordinary and non-recurring items. "Bonus Cash Flow" is generally defined as our net cash from operating activities less capital expenditures. These terms may differ from Adjusted EBITDA and Adjusted Net Income presented elsewhere in this prospectus.
For each performance year, the compensation committee assigns a target, minimum and maximum value to each performance metric. Minimum threshold goals must be met for performance metrics before awards may become payable under the plan. The maximum award (200% of target amounts) is payable only upon achievement of maximum-level performance for both metrics. Award amounts for performance between the baseline and maximum levels are determined at the beginning of the applicable performance period and depend upon the level of achievement for each metric relative to its assigned target value, in accordance with a pre-determined payout matrix. The board of directors makes final determinations of the amounts payable under the plan, in consultation with the Chief Executive Officer, after receipt of the applicable financial information. In addition, we, in our sole discretion, may adjust targets or awards to account for unusual events such as extraordinary transactions, asset dispositions and purchases, and mergers and acquisitions.
The following chart sets forth the minimum, maximum and target values, and the performance achieved, for the performance metrics for the year ended September 30, 2010:
Performance Metric
|
2010 Actual ($ MM) |
Minimum ($ MM) |
Target ($ MM) |
Maximum ($ MM) |
|||||||||
|---|---|---|---|---|---|---|---|---|---|---|---|---|---|
Bonus EBITDA |
168.5 | 145.8 | 166.6 | 187.4 | |||||||||
Bonus Cash Flow From Operations |
97.7 | 59.6 | 79.5 | 109.3 | |||||||||
Based on the actual levels of achievement set forth above, in relation to the Bonus EBITDA and Bonus Cash Flow targets for 2010, Messrs. Snyder, Hann, Weinstein and Lee were entitled to bonus payments in amounts equal to 135% of their target bonus amounts. In making its bonus determination for Mr. Murray, whose scope of responsibility primarily included our European operations, the compensation committee also considered the performance of these operations for fiscal year 2010. Because our business outside of North America underperformed relative to overall Company performance for fiscal year 2010, the compensation committee exercised its discretion under our annual bonus program to reduce the bonus payouts provided to our employees outside of North America, and, as a result, Mr. Murray did not receive a bonus at the same level as our other NEOs. Mr. Murray's cash bonus for fiscal year 2010 was reduced to 100% of his target bonus amount, which the compensation committee determined to be the appropriate level as a result of overall corporate level performance having exceeded the target amounts set forth above, and in order to promote a "one-Wesco" culture in relation to this success. The actual award amounts earned by our NEOs for 2010 are included in the "Non-Equity Incentive Plan Compensation" column of our Summary Compensation Table for 2010.
84
Discretionary Long-Term Equity Incentive Awards
We believe that providing a portion of our NEOs' total compensation in the form of equity-based awards encourages responsible and profitable growth, encourages executive retention, promotes a long-term focus and aligns executive and stockholder interests. Historically, rather than provide our NEOs with annual equity awards based upon short-term performance horizons, the compensation committee has determined to make larger, less frequent equity grants to our NEOs, generally with five year performance horizons, to better align the long-term interests of our NEOs with those of stockholders. None of our NEOs were granted equity-based awards during fiscal year 2010. Currently, with the exception of Mr. Hann, our NEOs hold equity incentive awards that consist of restricted stock and restricted stock units granted in September 2006 and/or stock options granted in May 2007. Mr. Hann holds stock options that we granted to him in February 2009 upon his commencement of employment with us. All of the stock options held by our NEOs have exercise prices that were equal to the fair market value of our common stock on the date of grant or, with respect to Mr. Hann, the date the stock option was amended.
Generally, stock options granted under our equity incentive plan expire ten years from the date of the grant and have vesting provisions that are designed to encourage an optionee's continued employment and to reward an optionee for our performance. Twenty-five percent of each NEO's options are time vesting options that vest and become exercisable in five equal annual installments (three equal annual installments for Mr. Hann) beginning on the first September 30 following the date of grant, subject to the optionee's continued service with us through the applicable vesting date. The remaining 75% of the options for each NEO are eligible to vest in five annual installments (three annual installments for Mr. Hann), subject to the optionee's continued employment with us and attainment by us of financial performance targets as follows: one-half of each performance vesting installment is eligible to vest following the close of the applicable fiscal year if we attain a pre-determined Bonus EBITDA target for the year, and the remaining one-half of each performance vesting installment is eligible to vest following the close of the applicable fiscal year if we attain a pre-determined Cash Flow target for the year. If we do not attain the relevant Bonus EBITDA or Bonus Cash Flow targets for a given fiscal year, but we attain at least 90% of such targets, the applicable portion of the performance vesting options remains eligible to vest in future years if cumulative Bonus EBITDA and cumulative Bonus Cash Flow targets are attained in those years. The Bonus Cash Flow and Bonus EBITDA goals were established at the time the options were granted and were intended to be challenging but reasonably attainable. The Bonus EBITDA and Bonus Cash Flow targets for stock option vesting purposes differ from the Bonus EBITDA and Bonus Cash Flow targets levels that apply under our Management Annual Incentive Plan because the option vesting targets were generally set at the time of each grant with a five-year time horizon (three years for Mr. Hann) while the Management Annual Incentive Plan targets are short term goals set annually at the beginning of each applicable fiscal year.
For 2010, the Bonus Cash Flow and Bonus EBITDA targets for the NEOs' performance vesting options were $82.4 million and $180.3 million, respectively, and actual results with respect to Bonus Cash Flow and Bonus EBITDA for the year were $97.7 million and $168.5 million, respectively. As a result, the Bonus Cash Flow portion of the NEOs' performance vesting options vested, effective as of September 30, 2010. In addition, although we did not attain the Bonus EBITDA target that was previously established for performance option vesting for 2010, the compensation committee determined that the failure to attain the Bonus EBITDA target did not result from a lack of performance by our management team, but rather from a change in overall market conditions that were beyond management's control, and that due to the near achievement of the target in light of such factors, and our outperformance as compared to the Bonus Cash Flow target for the year, the Bonus EBITDA portion of the 2010 performance options would become vested, effective as of September 30, 2010.
85
Early in fiscal year 2010, the compensation committee determined that we had not attained the 2009 Bonus Cash Flow target of $63.2 million that had previously been established for purposes of performance option vesting and that actual results with respect to 2009 Bonus Cash Flow were less than 90% of the target. As a result, the 2009 Bonus Cash Flow portion of the performance options did not become vested at that time. However, in order to provide additional incentives for management to achieve strong company-wide financial performance in fiscal years 2010 and 2011, the compensation committee determined to provide an additional opportunity for the 2009 Bonus Cash Flow portion of the performance options to vest as follows: one-half of the 2009 Bonus Cash Flow portion of the performance options would vest following the end of fiscal year 2010 if we attained a supplemental Bonus Cash Flow target of $98.9 million for 2010 and the remaining one-half of the 2009 Bonus Cash Flow portion of the performance options would vest following the end of fiscal year 2011 if we attain a supplemental Bonus Cash Flow target for 2011 that is in excess of the Bonus Cash Flow target that applies to the regular 2011 Bonus Cash Flow portion of the performance options and that the compensation committee believes is a challenging supplemental Bonus Cash Flow goal for fiscal year 2011. Following the close of fiscal year 2010, the compensation committee determined that although the supplemental Bonus Cash Flow target for 2010 was not fully attained, the applicable portion of the performance options described above would become vested and exercisable effective as of September 30, 2010 due to the near achievement of such supplemental Bonus Cash Flow target. In addition, in October 2009, the compensation committee determined to amend the stock option that we granted to Mr. Hann upon his commencement of employment by decreasing the exercise price of such stock options to the then-current fair market value of our common stock and revising the applicable Bonus EBITDA and Bonus Cash Flow targets, in each case, to motivate and encourage Mr. Hann's strong performance, in consideration of the fact that the value of our stock and our performance projections were at an all-time high when Mr. Hann's options were originally granted and to make the exercise price of Mr. Hann's stock options consistent with the fair market value of our stock at the time of the amendment (and the same as the exercise price of options granted to other employees at such time) and to conform the performance targets applicable to Mr. Hann's options with those applicable to our other NEOs and other employees.
In addition, in connection with the Carlyle Acquisition in 2006, our NEOs, other than our CEO, who were with us at that time received awards of restricted stock and restricted stock units that relate to our common stock in recognition of their longstanding service to the company over a period of many years and as a means of seeking to retain these employees through the imposition of vesting requirements on the awards. All of these shares of restricted stock and restricted stock units have fully vested and the restricted stock units will be settled on the earlier of September 28, 2012 or the date we experience a change in control. Additional information regarding the restricted stock units held by our NEOs is set forth below in the non-qualified deferred compensation table that follows this Compensation Discussion and Analysis.
Defined Contribution Plans
We have a Section 401(k) Savings/Retirement Plan, or the 401(k) Plan, to cover our eligible employees. The 401(k) Plan permits eligible employees to defer a portion of their annual compensation, subject to certain limitations imposed by the Internal Revenue Code. The employees' elective deferrals are immediately vested and non-forfeitable upon contribution to the 401(k) Plan. We provide matching contributions to the 401(k) Plan in an amount equal to fifty cents for each dollar of participant contributions, up to a maximum matching contribution of three percent of the participant's annual salary and subject to certain other limits. After a full year of employment with us, plan participants vest in the amounts contributed by us pro rata over the following five years, subject to their continued employment with us. Employees are eligible to participate in the 401(k) Plan the first day of the first calendar quarter following their completion of six full calendar months of employment with us.
86
The 401(k) Plan is offered on a nondiscriminatory basis to all of our employees, including NEOs, who meet the eligibility requirements. The compensation committee believes that matching and other contributions provided by us to assist us in attracting and retaining talented employees and executives. The 401(k) Plan provides an opportunity for participants to save money for retirement on a tax-qualified basis and to achieve financial security, thereby promoting retention.
Employment and Severance Arrangements
The compensation committee considers the maintenance of a sound management team to be essential to protecting and enhancing our best interests. To that end, we recognize that the uncertainty that may exist among management with respect to their "at-will" employment with us may result in the departure or distraction of management personnel to our detriment. Accordingly, the compensation committee determined that severance arrangements are appropriate for certain of our NEOs to encourage the continued attention and dedication of these members of our management and to allow them to focus on the value to stockholders of strategic alternatives without concern for the impact on their continued employment. Mr. Snyder, Mr. Hann, Mr. Weinstein and Mr. Murray have each entered into an agreement with us providing for severance benefits upon termination of employment.
Mr. Snyder's employment agreement with us, dated July 23, 2006 and amended December 31, 2008, has an original three-year term and is extended automatically for successive one-year periods thereafter unless either party delivers notice within specified notice periods to terminate the agreement. Upon termination of Mr. Snyder's employment either by us without "cause," by Mr. Snyder for "good reason" or due to the non-extension of the employment term by us, subject to his timely executing a general release of claims against us, Mr. Snyder is entitled to receive thirty-six months of his base salary, payable in installments in accordance with our regular payroll practices, a prorated portion of his annual performance bonus for the year in which termination occurs, the accelerated vesting of any outstanding unvested options we granted to Mr. Synder pursuant to his employment agreement that are subject to time-based vesting conditions and reimbursement for the premium costs of continued medical, dental and vision coverages under COBRA for a period of eighteen months. Mr. Snyder's employment agreement prohibits him from competing with certain of our businesses or from soliciting our employees, customers or suppliers to terminate their employment or arrangements with us during the term of his employment and for 36 months following his termination. "Cause" is defined in Mr. Snyder's agreement to mean Mr. Snyder's (i) material failure to comply with a reasonable directive of the board of directors, (ii) willful misconduct, gross negligence or breach of a fiduciary duty that results in material harm to us or our affiliates, (iii) willful and material breach of his employment agreement, (iv) conviction, plea of no contest or imposition of unadjudicated probation for any felony or crime involving moral turpitude, (v) unlawful use or possession of illegal drugs on Company premises or while performing his duties or responsibilities to us or (vi) commission of an act of fraud, embezzlement or misappropriation against us or our affiliates. "Good reason" is defined in Mr. Snyder's employment agreement to mean (a) a material reduction in duties or responsibilities, (b) a material reduction in base salary or annual target bonus opportunity, (c) a relocation of Mr. Snyder's principle place of employment by more than 25 miles, (d) our material breach of the agreement or (e) the failure of the Company, or any successor, following a change in control to reaffirm its obligations under the agreement or assume and comply with the agreement.
Pursuant to an agreement between Mr. Hann and us, dated January 22, 2009, if we terminate Mr. Hann without "cause" or he resigns for "good reason," subject to his timely executing and not revoking a release of claims, Mr. Hann is entitled to payment of 12 months of his base salary, payable in installments in accordance with our regular payroll practices, and the right to continue his participation in one of our medical benefit plans for up to 12 months. For purposes of Mr. Hann's agreement, "cause" has substantially the same meaning as in Mr. Snyder's agreement, except that Mr. Hann's material breach of the agreement does not explicitly constitute cause. "Good reason" is
87
defined in Mr. Hann's agreement to mean a material reduction in duties or responsibilities or a material reduction in his base salary.
Mr. Weinstein's employment agreement with us, dated June 15, 2007 and amended December 31, 2008, has a perpetual term unless terminated by either party in accordance with the terms of the agreement. Upon termination of Mr. Weinstein's employment by us without "cause," subject to his timely executing a general release of claims against us, Mr. Weinstein is entitled to receive twelve months of his base salary, payable in installments in accordance with our regular payroll practices, and reimbursement for the premium costs of continued medical, dental and vision coverages under COBRA for a period of twelve months. Mr. Weinstein's employment agreement prohibits him from competing with certain of our businesses or from soliciting our employees, customers or suppliers to terminate their employment or arrangements with us during the term of his employment and for twelve months following his termination. "Cause" in Mr. Weinstein's agreement has the same meaning as in Mr. Snyder's agreement.
Mr. Murray will enter into an employment agreement with a subsidiary of the Company located in the United Kingdom. For simplicity, this subsidiary and its board of directors are referred to in this paragraph, respectively, as the company and the board. Mr. Murray's employment agreement, dated , has a perpetual term unless terminated by either party by giving not less than months' written notice. The company may elect, however, to terminate Mr. Murray's employment without notice by paying Mr. Murray the amounts that would otherwise be paid to him during the notice period provided in his employment agreement. In addition, the company may terminate Mr. Murray's employment without notice or payment in the event that (i) the board reasonably believes Mr. Murray has committed a serious breach of his employment agreement, (ii) the board reasonably believes Mr. Murray has committed an act of gross or serious misconduct or willful neglect in the discharge of his duties, (iii) the board reasonably believes Mr. Murray has committed an act of fraud, dishonesty or other conduct tending to bring himself or the company into disrepute, (iv) Mr. Murray becomes prohibited by law from being or acting as a director of the company, (v) Mr. Murray is offered and refuses or fails to accept employment with the surviving entity following a merger or reorganization of the company on terms no less favorable than those in his employment agreement or (vi) Mr. Murray resigns as a director of the company other than at the request of the board. During his employment and for months following his termination, Mr. Murray may not compete with certain businesses of the company or solicit certain employees, customers or potential customers of the company, in each case, without the company's consent, which may not be unreasonably withheld.
Other Elements of Compensation and Perquisites
Our NEOs are eligible under the same plans as all other employees for medical, dental, vision and short-term disability insurance. In addition, we provide our NEOs with the personal use of Company automobiles and, for our U.S. based NEOs, dues related to golf club memberships which our NEOs use for both personal and professional purposes. We provide these benefits due to their relatively low cost and the high value they provide in attracting and retaining talented executives. Our NEOs do not receive any tax gross up in connection with our provision of these benefits.
88
Summary Compensation Table for 2010
The following table sets forth certain information with respect to the compensation paid to our NEOs for the year ended September 30, 2010.
Name and Principal Position
|
Salary ($) | Non-Equity Incentive Plan Compensation ($)(1) |
Option Awards ($) |
Bonus ($) |
All Other Compensation ($) |
Total ($) | ||||||||||||||
|---|---|---|---|---|---|---|---|---|---|---|---|---|---|---|---|---|---|---|---|---|
Randy Snyder |
644,266 | 810,000 | — | 77,714 | (4) | 1,531,980 | ||||||||||||||
Chief Executive Officer |
||||||||||||||||||||
Greg Hann |
300,000 |
243,000 |
87,869 |
(2) |
44,775 |
(5) |
675,644 |
|||||||||||||
Executive Vice President and Chief Financial Officer |
||||||||||||||||||||
Hal Weinstein |
322,133 |
243,000 |
20,000 |
(3) |
51,793 |
(6) |
636,926 |
|||||||||||||
Executive Vice President, Sales and Marketing |
||||||||||||||||||||
Tommy Lee |
309,885 |
164,025 |
— |
46,511 |
(7) |
520,421 |
||||||||||||||
Executive Vice President |
||||||||||||||||||||
Alex Murray(8) |
157,497 |
59,126 |
— |
18,673 |
(9) |
235,386 |
||||||||||||||
Vice President, Global Operations |
||||||||||||||||||||
- (1)
- Represents
the bonus amounts earned under our annual bonus program for fiscal the year ended September 30, 2010. For a discussion of the
determination of these amounts, see "—Annual Performance-Based Compensation for 2010" above.
- (2)
- Amount
shown represents the incremental fair value attributable to an amendment to Mr. Hann's outstanding stock options, as described above in
"—Discretionary Long-Term Equity Incentive Awards." This amount has been calculated in accordance with FASB ASC Topic 718 as of the date of such amendment. For information
regarding the assumptions used when calculating this amount, refer to note 13 of our consolidated financial statements for the year ended September 30, 2010, which are included elsewhere
in this prospectus.
- (3)
- Amount
shown represents a discretionary bonus paid to Mr. Weinstein for his 2010 service, as determined by the compensation committee.
- (4)
- Includes
$22,433 for country club membership dues and fees, $47,931 for use of Company automobile and $7,350 for 401(k) matching contribution. The cost for
personal use of a company automoblile includes costs associated with the lease, gas, insurance and maintenance of such automobile.
- (5)
- Includes
$16,910 for country club membership dues and fees, $20,515 for use of Company automobile and $7,350 for 401(k) matching contribution.
- (6)
- Includes
$28,148 for country club membership dues and fees, $16,295 for use of Company automobile and $7,350 for 401(k) matching contribution.
- (7)
- Includes
$20,864 for country club membership dues and fees, $18,297 for use of Company automobile and $7,350 for 401(k) matching contribution.
- (8)
- Amounts
presented for Mr. Murray are based on an assumed conversion ratio of pounds to dollars of 1.5809, which was the exchange rate in effect on
September 30, 2010.
- (9)
- Includes automobile allowance of $15,809, and $2,864 for supplemental medical benefits.
89
Grants of Plan-Based Awards for 2010
| |
|
Estimated Possible Payouts Under Non-Equity Incentive Plan Awards(1) |
||||||||
|---|---|---|---|---|---|---|---|---|---|---|
Name
|
Grant Date | Target ($) | Maximum ($) | |||||||
Randy Snyder |
10/1/2009 | 600,000 | 1,200,000 | |||||||
Greg Hann |
10/1/2009 | 180,000 | 360,000 | |||||||
Hal Weinstein |
10/1/2009 | 180,000 | 360,000 | |||||||
Tommy Lee |
10/1/2009 | 121,500 | 243,000 | |||||||
Alex Murray |
10/1/2009 | 59,126 | 118,252 | |||||||
- (1)
- Amounts shown reflect the possible payment amounts to our NEOs under our Management Annual Incentive Plan for fiscal year 2010. There are no applicable threshold level performance metrics. Payments under the plan were made to the NEOs in December 2010. The amounts actually paid to each NEO are set forth under "Non-Equity Incentive Plan Compensation" in the "Summary Compensation Table for 2010" above.
Outstanding Equity Awards at Fiscal Year End
The following table provides information regarding the stock options held by our NEOs as of September 30, 2010.
Name
|
Number of Securities Underlying Unexercised Options— Exercisable (#) |
Number of Securities Underlying Unexercised Options— Unexercisable (#) |
Equity Incentive Plan Awards: Number of Securities Underlying Unexercised Unearned Options |
Option Exercise Price ($) |
Option Expiration Date |
|||||||||||
|---|---|---|---|---|---|---|---|---|---|---|---|---|---|---|---|---|
Randy Snyder |
166,666 | 10,929 | (1) | 40,984 | (2) | 37.12 | 5/17/2017 | |||||||||
Greg Hann |
39,618 | 5,465 | (1) | 20,491 | (2) | 56.64 | 1/29/2019 | |||||||||
Hal Weinstein |
83,334 | 5,465 | (1) | 20,491 | (2) | 37.12 | 5/17/2017 | |||||||||
Tommy Lee |
25,000 | 1,640 | (1) | 6,147 | (2) | 37.12 | 5/17/2017 | |||||||||
Alex Murray |
33,333 | 2,186 | (1) | 8,197 | (2) | 37.12 | 5/17/2017 | |||||||||
- (1)
- These
options will become exercisable on September 30, 2011, subject to the NEO's continued service with us on such date.
- (2)
- These options will become exercisable on September 30, 2011, subject to the NEO's continued service with us on such date and our attainment of EBITDA, Cash Flow and supplemental Cash Flow targets for such year, as described in more detail above under "Discretionary Long-Term Equity Incentive Awards."
Options Exercised and Stock Vested in 2010
None of our NEOs exercised options or became vested in shares of our common stock during the year ended September 30, 2010.
Nonqualified Deferred Compensation
The following table provides details with respect to the outstanding restricted stock units held by our NEOs. Mr. Weinstein holds 146,676.21 restricted stock units, Mr. Lee holds 90,972.21 restricted stock units and Mr. Murray holds 8,701.69 restricted stock units. The restricted stock units were
90
granted to each of the NEOs in September 2006 and became fully vested on September 29, 2009. Each restricted stock unit represents the right to receive one share of our common stock, which will be distributed to the NEOs in the form of shares of our common stock on the first to occur of a change in control or September 28, 2012.
Name
|
Plan Name | Executive Contributions in Last FY ($) |
Registrant Contributions in Last FY ($) |
Aggregate Earnings in Last FY ($)(1) |
Aggregate Withdrawals/ Distributions ($) |
Aggregate Balance at Last FYE ($)(2) |
||||||||||||
|---|---|---|---|---|---|---|---|---|---|---|---|---|---|---|---|---|---|---|
Hal Weinstein |
Restricted Stock Units | — | — | 1,959,594 | — | 10,267,334 | ||||||||||||
Tommy Lee |
Restricted Stock Units | — | — | 1,215,389 | — | 6,368,055 | ||||||||||||
Alex Murray |
Restricted Stock Units | — | — | 116,255 | — | 609,118 | ||||||||||||
- (1)
- Reflects
the change in value of the shares underlying the restricted stock units during fiscal year 2010.
- (2)
- Reflects the aggregate value of the shares underlying the restricted stock units as of September 30, 2010, based on a per share value of $70.00 as of such date.
Potential Payments upon Termination or Change-in-Control
Each of Messrs. Snyder, Hann, Weinstein and Murray has an agreement that provides for severance benefits upon a termination of employment. See "—Employment and Severance Arrangements" above for a description of the employment and severance agreements with our NEOs. Assuming a termination of employment effective as of September 30, 2010 (i) by us without cause, (ii) due to our nonextension of the executive's employment term or (iii) due to the executive's resignation for good reason, each of our NEOs would have received the following severance payments and benefits:
Name
|
Payment Type | Termination Without Cause ($) |
Resignation for Good Reason ($) |
Termination due to Non- Extension of Term ($) |
||||||||
|---|---|---|---|---|---|---|---|---|---|---|---|---|
Randy Snyder |
Salary | 1,950,000 | 1,950,000 | 1,950,000 | ||||||||
|
Bonus | 877,500 | 877,500 | 877,500 | ||||||||
|
Option vesting(1) | 359,346 | 359,346 | 359,346 | ||||||||
|
Benefit continuation(2) | 56,186 | 56,186 | 56,186 | ||||||||
|
Total | 3,243,032 | 3,243,032 | 3,243,032 | ||||||||
Greg Hann |
Salary |
325,000 |
325,000 |
— |
||||||||
Hal Weinstein |
Salary |
325,000 |
— |
— |
||||||||
|
Benefit continuation(2) | 27,011 | — | — | ||||||||
|
Total | 352,011 | — | — | ||||||||
Alex Murray |
Salary(3) |
— |
— |
|||||||||
- (1)
- Represents
accelerated vesting of time vesting options granted pursuant to Mr. Snyder's employment agreement. Value has been determined by
multiplying the number of options vesting by the difference between the exercise price of the option and $70.00, the fair market value of one share of our common stock as of September 30, 2010.
- (2)
- Consists
of continuation of group health benefits. The value of the health benefits was calculated using an estimate of the cost to us of such health
coverage based upon past experience.
- (3)
- Mr. Murray is entitled to receive the amounts that would otherwise be paid to him during the notice period provided in his employment agreement if we elect to terminate his employment without notice.
91
Pursuant to the stock option agreements covering each NEO's stock options, in the event of certain transactions, which could include a change in control of the Company, generally that result in Carlyle liquidating at least 70% of its equity investment in the Company, (i) the exercisability of all shares underlying the time vesting options would be accelerated and (ii) to the extent certain performance thresholds are achieved for the year in which the transaction occurs, the exercisability of all shares underlying the performance vesting options that have not previously become eligible to vest would be accelerated. Assuming such a transaction occurred on September 30, 2010, the following table sets forth the amounts the NEOs would have received from such accelerated vesting:
Name
|
Option Type | Number of Securities (#) | Value ($)(1) | ||||||
|---|---|---|---|---|---|---|---|---|---|
Randy Snyder |
Time Vesting | 10,929 | 359,346 | ||||||
|
Performance Vesting | 40,984 | 1,347,554 | ||||||
|
Total | 51,913 | 1,706,900 | ||||||
Greg Hann |
Time Vesting |
5,465 |
73,012 |
||||||
|
Performance Vesting | 20,491 | 273,760 | ||||||
|
Total | 25,956 | 346,772 | ||||||
Hal Weinstein |
Time Vesting |
5,465 |
179,689 |
||||||
|
Performance Vesting | 20,491 | 673,744 | ||||||
|
Total | 25,956 | 853,433 | ||||||
Alex Murray |
Time Vesting |
2,186 |
71,876 |
||||||
|
Performance Vesting | 8,197 | 269,517 | ||||||
|
Total | 10,383 | 341,393 | ||||||
Tommy Lee |
Time Vesting |
1,639 |
53,890 |
||||||
|
Performance Vesting | 6,148 | 212,146 | ||||||
|
Total | 7,787 | 256,036 | ||||||
- (1)
- Value has been determined by multiplying the number of options vesting by the difference between the exercise price of the option and $70.00, the fair market value of one share of our common stock as of September 30, 2010.
Compensation Risk
We have analyzed the potential risks arising from our compensation policies and practices, and have determined that there are no such risks that are reasonably likely to have a material adverse effect on us.
Director Compensation For 2010
Directors who are our employees or employees of Carlyle (Messrs. Clare, Palmer, Snyder and Baird) receive no additional compensation for serving on our board of directors or its committees. For their services as an independent member of our board of directors, each of our "non-employee" directors (Messrs. Paulson, Squier, Jumper and Fulchino) receives an annual retainer of $50,000, which amount is payable in either cash or shares of our restricted common stock. For 2010 the annual retainer was paid 100% in shares of our common stock, which were fully vested upon grant and were granted to the non-employee directors after the completion of our 2010 fiscal year on December 15, 2010. The number of shares for the 2010 retainer was determined based on the fair market value of the shares at the start of the year, resulting in an award of 883 shares of our common stock as payment of the 2010 annual retainer. In addition, each of our non-employee directors received an option to purchase 725 shares of our common stock upon their commencement of service with us in fiscal year 2007 (2008, with respect to Mr. Fulchino). The options vest in five equal annual installments, with the
92
first installment vesting on September 30, 2007 for Messrs. Paulson and Squier and September 30, 2008 for Messrs. Jumper and Fulchino.
In 2010, we provided the following compensation to our independent directors:
Name
|
Fees Earned or Paid in Cash ($) |
Stock Awards ($)(1) |
Total | |||||||
|---|---|---|---|---|---|---|---|---|---|---|
Robert D. Paulson |
— | 61,810 | — | |||||||
David L. Squier |
— | 61,810 | — | |||||||
John P. Jumper |
— | 61,810 | — | |||||||
Paul E. Fulchino |
— | 61,810 | — | |||||||
- (1)
- Stock awards intended as 2010 director compensation were granted to Messrs. Paulson, Squier, Jumper and Fulchino on December 15, 2010. As of September 30, 2010, Mr. Paulson held outstanding options to purchase 580 shares of our common stock and each of Messrs. Squier, Jumper and Fulchino held outstanding options to purchase 725 shares of our common stock. All such options were fully vested as of September 30, 2010, except for one installment of 145 options for Messrs. Paulson and Squier and two installments each of 145 options for Messrs. Jumper and Fulchino, which options will vest on September 30, 2011 and September 30, 2012, as applicable, subject to the non-employee director's continued service with us through the applicable date.
2011 Equity Incentive Plan
Our board of directors intends to adopt and submit to our stockholders for approval prior to the consummation of this offering a 2011 Equity Incentive Award Plan, or the 2011 Plan, which will be effective as of the day prior to the consummation of this offering. The principal purpose of the 2011 Plan is to attract, retain and engage selected employees, consultants and directors through the granting of stock-based compensation awards and cash-based performance bonus awards. The material terms of the 2011 Plan, as it is currently contemplated, are summarized below. We are still in the process of implementing the 2011 Plan and, accordingly, this summary is subject to change prior to the effectiveness of the registration statement of which this prospectus is a part.
Eligibility and Administration. Employees, consultants and directors of the Company and its subsidiaries will be eligible to receive awards under the 2011 Plan. Our compensation committee will administer the 2011 Plan unless our board of directors assumes authority for administration. The compensation committee may delegate its duties and responsibilities as plan administrator to subcommittees comprised of our directors and/or officers, subject to certain limitations. Our full board of directors will administer the 2011 Plan with respect to awards to non-employee directors.
Subject to the express terms and conditions of the 2011 Plan, the plan administrator has the authority to make all determinations and interpretations under the plan, prescribe all forms for use with the plan and adopt, amend and/or rescind rules for the administration of the plan. The plan administrator also sets the terms and conditions of all awards under the plan, including any vesting and vesting acceleration conditions.
Limitation on Awards and Shares Available. Initially, the aggregate number of shares of our common stock available for issuance pursuant to awards granted under the 2011 Plan will be . This number will be adjusted due to the following shares becoming eligible to be used or, as applicable, used again for grants under the 2011 Plan:
- •
- shares subject to awards or portions of awards granted under the 2011 Plan or our prior Equity Incentive Plan, which we refer to as the Prior Plan, which are forfeited, expire or lapse for any reason, or are settled for cash without the delivery of shares, to the extent of such forfeiture, expiration, lapse or cash settlement,
93
- •
- shares tendered or withheld to satisfy the grant or exercise price or tax withholding obligations associated with awards
granted under the 2011 Plan or the Prior Plan,
- •
- shares subject to a stock appreciation right, or SAR, that are not issued in connection with the stock settlement of the
SAR on its exercise, and
- •
- shares that we repurchase prior to vesting or that were granted under the Prior Plan so that such shares are returned to us.
From and after the effective date of the 2011 Plan, we will no longer issue awards under the Prior Plan.
Shares granted under the 2011 Plan may be treasury shares, authorized but unissued shares, or shares purchased in the open market. The payment of dividend equivalents in cash in conjunction with any outstanding awards will not be counted against the shares available for issuance under the 2011 Plan In addition, if we, or one of our subsidiaries, acquires or combines with another company that has shares available for grant pursuant to a qualifying equity plan, we may use those shares (until such date as they could not have been used under such company's plan) to grant awards pursuant to the 2011 Plan to individuals who were not providing services to us immediately prior to the acquisition or combination.
Awards. The 2011 Plan provides for the grant of stock options (including non-qualified stock options, or NQSOs, and incentive stock options, or ISOs), restricted stock, dividend equivalents, stock payments, restricted stock units, or RSUs, performance awards, SARs, and other equity-based and cash-based awards, or any combination thereof. Awards under the 2011 Plan will generally be set forth in award agreements, which will detail the terms and conditions of the awards, including any applicable vesting and payment terms and post-termination exercise limitations. Equity-based awards will generally be settled in shares of our common stock, but the plan administrator may provide for cash settlement of any award. A brief description of each award type follows.
- •
- Non-qualified Stock Options. NQSOs will
provide for the right to purchase shares of our common stock at a specified price that generally, except with respect to certain substitute options granted in connection with corporate transactions,
will not be less than fair market value on the date of grant. NQSOs may be granted for any term specified by the administrator that does not exceed ten years and will usually become exercisable in one
or more installments after the grant date, subject to vesting conditions that may include continued employment or service with us, satisfaction of performance targets and/or other conditions, as
determined by the plan administrator.
- •
- Incentive Stock Options. ISOs will be designed in a manner
intended to comply with the provisions of Section 422 of the Internal Revenue Code, or the Code, and will be subject to specified restrictions contained in the Code. ISOs will have an exercise
price of not less than 100% of the fair market value of the underlying share on the date of grant (or 110% in the case of ISOs granted to certain significant stockholders), except with respect to
certain substitute ISOs granted in connection with a corporate transaction. Only employees will be eligible to receive ISOs, and ISOs will not have a term of more than ten years (or five years in the
case of ISOs granted to certain significant stockholders). Vesting conditions may apply to ISOs as determined by the plan administrator and may include continued employment or service with us,
satisfaction of performance targets and/or other conditions.
- •
- Restricted Stock. Restricted Stock may be granted to any eligible individual and made subject to such restrictions as may be determined by the plan administrator. Unless the Administrator determines otherwise, restricted stock may be forfeited for no consideration or repurchased by us if the conditions or restrictions on vesting are not met. In general, restricted stock may not be sold or otherwise transferred until restrictions are removed or expire. Recipients of restricted stock, unlike recipients of options, will have voting rights and will have the right to receive
94
- •
- Restricted Stock Units. RSUs may be awarded to any
eligible individual, typically without payment of consideration but subject to vesting conditions based upon continued employment or service with us, satisfaction of performance criteria and/or other
conditions, all as determined by the administrator. Like restricted stock, RSUs generally may not be sold or otherwise transferred or hypothecated until the applicable vesting conditions are removed
or expire. Unlike restricted stock, shares of stock underlying RSUs will not be issued until the RSUs have vested, and recipients of RSUs generally will have no voting or dividend rights with respect
to such shares prior to the time when the applicable vesting conditions are satisfied.
- •
- Dividend Equivalents. Dividend equivalents represent the
per share value of the dividends, if any, paid by us, calculated with reference to the number of shares covered by an award. Dividend equivalents may be settled in cash or shares and at such times as
determined by the administrator.
- •
- Stock Payments. Stock Payments may be authorized by the
administrator in the form of common stock or an option or other right to purchase common stock as part of a deferred compensation or other arrangement in lieu of all or any part of compensation,
including bonuses, that would otherwise be payable in cash to an employee, consultant or non-employee director.
- •
- Stock Appreciation Rights. SARs may be granted in
connection with stock options or other awards or separately. SARs typically provide for payment to the holder based upon increases in the price of a share of our common stock over a set exercise
price. The exercise price of any SAR granted under the 2011 Plan generally, except with respect to certain substitute SARs granted in connection with a corporate transaction, will be at least 100% of
the fair market value of the underlying share on the date of grant. The term of a SAR may not be longer than ten years. There are no restrictions specified in the 2011 Plan on the exercise of SARs or
the amount of gain realizable therefrom, although restrictions may be imposed by the administrator in the SAR agreements. SARs granted under the 2011 Plan may be settled in cash or shares of our
common stock, or in a combination of both, at the election of the administrator. Vesting conditions may apply to SARs as determined by the plan administrator and may include continued employment or
service with us, satisfaction of performance goals and/or other conditions.
- •
- Performance Awards. Performance awards may be granted by the administrator on an individual or group basis. Generally, these awards will consist of bonuses based upon attainment of specific performance targets and may be paid in cash, common stock or a combination of both. Performance awards may also include "phantom" stock awards that provide for payments based upon the value of our common stock.
dividends, if any, prior to the time when the restrictions lapse, subject to the terms of an applicable award agreement, which may provide for dividends to be placed in escrow and not released until the restrictions are removed or expire.
Certain Transactions. The plan administrator has broad discretion to equitably adjust the provisions of the 2011 Plan and the terms and conditions of existing and future awards, including with respect to aggregate number and type of shares subject to the 2011 Plan and awards granted pursuant to the 2011 Plan, to prevent the dilution or enlargement of intended benefits and/or facilitate necessary or desirable changes in the event of certain transactions and events affecting our common stock, such as stock dividends, stock splits, mergers, acquisitions, consolidations and other corporate transactions. In the event of a change in control where the acquiror does not assume or replace awards granted under the 2011 Plan, such awards will be subject to accelerated vesting so that 100% of such awards will become vested and exercisable or payable, as applicable, prior to the consummation of the change in control transaction and, if not exercised or paid, will terminate upon consummation of the transaction. The administrator may also provide for the acceleration, cash-out, termination, assumption, substitution or conversion of awards in the event of a change in control or certain other unusual or
95
nonrecurring events or transactions. A change in control is defined in the 2011 Plan to mean (i) the acquisition by a person or group of more than 50% of the total combined voting power of our outstanding securities, (ii) during any consecutive two-year period, the replacement of a majority of our incumbent directors with directors whose election was not supported by at least two-thirds of our incumbent directors, (iii) a merger, consolidation, reorganization or business combination or the sale of substantially all of our assets, in each case, other than a transaction that results in our voting securities before such transaction continuing to represent or being converted into a majority of the voting securities of the surviving entity and after which no person or group owns a majority of the combined voting power of the surviving entity or (iv) our stockholders approve a liquidation or dissolution of the Company.
Foreign Participants, Transferability, Repricing and Participant Payments. The administrator may modify award terms, establish subplans and/or adjust other terms and conditions of awards, subject to the share limits described above, in order to facilitate grants of awards subject to the laws and/or stock exchange rules of countries outside of the United States. With limited exceptions for estate planning, domestic relations orders, certain beneficiary designations and the laws of descent and distribution, awards under the 2011 Plan are generally non-transferable prior to vesting and are exercisable only by the participant. Subject to applicable limitations of the Code, the administrator may increase or reduce the price per share of an award, or cancel and replace an award with another award, except that the price per share of a stock option or SAR may not be decreased and an underwater stock option or SAR may not be replaced or cashed out without stockholder approval. With regard to tax withholding, exercise price and purchase price obligations arising in connection with awards under the 2011 Plan, the plan administrator may, in its discretion, accept cash or check, shares of our common stock that meet specified conditions, a "market sell order" or such other consideration as it deems suitable.
Amendment and Termination. Our board of directors may terminate, amend or modify the 2011 Plan at any time and from time to time. However, we must generally obtain stockholder approval to increase the number of shares available under the 2011 Plan (other than in connection with certain corporate events, as described above) or to the extent required by applicable law, rule or regulation (including any applicable stock exchange rule).
Expiration Date. The 2011 Plan will expire on, and no option or other award may be granted pursuant to the 2011 Plan after, the tenth anniversary of the date the 2011 Plan was approved by our board of directors in , 2011. Any award that is outstanding on the expiration date of the 2011 Plan will remain in force according to the terms of the 2011 Plan and the applicable award agreement.
96
CERTAIN RELATIONSHIPS AND RELATED PARTY TRANSACTIONS
Management Agreement
On September 29, 2006, Wesco Aircraft entered into a management agreement, or the Management Agreement with TC Group, L.L.C., or TC Group, an affiliate of Carlyle, to provide certain financial, strategic advisory and consultancy services. Under the Management Agreement, we are obligated to pay TC Group an annual management fee of $1.0 million and to pay or reimburse TC Group for certain out-of-pocket expenses. We incurred expenses of approximately $1.2 million, $1.0 million, $1.1 million for the years ending September 30, 2008, 2009 and 2010, respectively, related to the Management Agreement. The Management Agreement will terminate at such time as TC Group or one or more of its affiliates no longer collectively control, in the aggregate, at least 15% of Wesco Aircraft, or such earlier date as Wesco Aircraft and TC Group may mutually agree.
Amended and Restated Stockholders Agreement
In connection with the Carlyle Acquisition, on September 29, 2006, we entered into a stockholders agreement with Falcon Aerospace Holdings, LLC, Randy Snyder, Susan Snyder, certain affiliates of the Snyder family and members of management who hold restricted shares of common stock or options to purchase common stock. We refer to Falcon Aerospace Holdings, LLC as the Carlyle Stockholders and Randy Snyder, Susan Snyder and the affiliates of the Snyder family collectively as the Wesco Stockholders. The stockholders agreement was amended on November 30, 2007 and further amended on April 17, 2008. Upon effectiveness of the registration statement of which this prospectus forms a part, the stockholders agreement will be amended and restated.
Pursuant to the Amended and Restated Stockholders Agreement, our board of directors will consist of members, with the Carlyle Stockholders having the right to designate of the members of the board of directors.
The Amended and Restated Stockholders Agreement will contain restrictions on the transfer of our equity securities by the stockholders, as well as drag-along rights. In the event that we register any of our common stock following our initial public offering, these stockholders will also have the right to require us to use our best efforts to include the securities held by them, subject to certain limitations, including as determined by the underwriters. The Amended and Restated Stockholders Agreement will also require us to indemnify the stockholders in connection with any such registration of our securities.
The Amended and Restated Stockholders Agreement will terminate upon a sale or change in control of the Company or the approval of the Company and its stockholders who are parties to the Amended and Restated Stockholders Agreement.
Operating Leases
We lease several office and warehouse facilities under operating lease agreements, or the Operating Lease Agreements, from entities affiliated with or controlled by Randy J. Snyder, who serves as our Chairman of the Board of Directors, President and Chief Executive Officer and is also a minority stockholder of Wesco Aircraft. Rent expense on these facilities was approximately $1.7 million, $1.7 million and $1.7 million for the years ended September 30, 2008, 2009 and 2010, respectively (see Note 4 to our condensed consolidated financial statements contained elsewhere in this prospectus). The Operating Lease Agreements expire by their terms between June 30, 2019 and December 31, 2020.
Purchase of Term Loan
On June 30, 2008, Merrill Lynch Asset Management, or Merrill Lynch, on behalf of entities controlled by Randy J. Snyder, who serves as our Chairman of the Board of Directors, President and Chief Executive Officer and is also a minority stockholder of Wesco Aircraft, purchased approximately $50.0 million of our outstanding indebtedness. For the years ending September 30, 2008, 2009 and
97
2010, total interest paid to the entities controlled by Mr. Snyder related to the debt was approximately $0.6 million, $1.6 million and $1.2 million, respectively. Mr. Snyder sold the outstanding indebtedness he held as of January 2011 and no longer has an ownership interest in any of our outstanding indebtedness.
Related Party Transaction Policy
Prior to the completion of this offering, we intend to adopt a written statement of policy for the evaluation of and the approval, disapproval and monitoring of transactions involving us and "related persons." For the purposes of the policy, "related persons" will include our executive officers, directors and director nominees or their immediate family members, or stockholders owning five percent or more of our outstanding common stock.
Our related person transactions policy will require:
- •
- that any transaction in which a related person has a material direct or indirect interest and that exceeds $120,000, such
transaction referred to as a "related person transaction," and any material amendment or modification to a related person transaction, be evaluated and approved or ratified by our audit committee or
by the disinterested members of the audit committee; and
- •
- that any employment relationship or transaction involving an executive officer and any related compensation solely resulting from that employment relationship or transaction must be approved by the compensation committee of our board of directors or recommended by the compensation committee to our board of directors for its approval.
In connection with the review and approval or ratification of a related person transaction:
- •
- management must disclose to the audit committee or the disinterested members of the audit committee, as applicable, the
material terms of the related person transaction, including the approximate dollar value of the amount involved in the transaction, and all the material facts as to the related person's direct or
indirect interest in, or relationship to, the related person transaction;
- •
- management must advise the audit committee or the disinterested members of the audit committee, as applicable, as to
whether the related person transaction complies with the terms of our agreements governing our material outstanding indebtedness;
- •
- management must advise the audit committee or the disinterested members of the audit committee, as applicable, as to
whether the related person transaction will be required to be disclosed in our SEC filings. To the extent it is required to be disclosed, management must ensure that the related person transaction is
disclosed in accordance with SEC rules; and
- •
- management must advise the audit committee or the disinterested members of the audit committee, as applicable, as to whether the related person transaction constitutes a "personal loan" for purposes of Section 402 of Sarbanes-Oxley.
In addition, the related person transaction policy provides that the audit committee, in connection with any approval or ratification of a related person transaction involving a non-employee director or director nominee, should consider whether such transaction would compromise the director or director nominee's status as an "independent," "outside," or "non-employee" director, as applicable, under the rules and regulations of the SEC, the applicable listing exchange and the Internal Revenue Code.
All related party transactions described in this section occurred prior to adoption of this policy, and as such, these transactions were not subject to the approval and review procedures described above.
98
PRINCIPAL AND SELLING STOCKHOLDERS
We had 9,445,489 shares of common stock outstanding as of March 31, 2011, assuming a one-to-one conversion of shares of Class B common stock to common stock and prior to the for stock split described elsewhere in this prospectus, which were owned by 35 stockholders. As of March 31, 2011, certain affiliates of Carlyle own approximately 83.8% of our common stock.
The following table sets forth information with respect to the beneficial ownership of our common stock as of March 31, 2011, and as adjusted to reflect the shares of our common stock offered hereby, by:
- •
- each person known to own beneficially more than 5% of the capital stock;
- •
- each of our directors;
- •
- each of our NEOs;
- •
- all of our directors and executive officers as a group; and
- •
- each of our other selling stockholders.
The amounts and percentages of shares beneficially owned are reported on the basis of SEC regulations governing the determination of beneficial ownership of securities. Under SEC rules, a person is deemed to be a "beneficial" owner of a security if that person has or shares voting power or investment power, which includes the power to dispose of or to direct the disposition of such security. A person is also deemed to be a beneficial owner of any securities of which that person has a right to acquire beneficial ownership within 60 days. Securities that can be so acquired are not deemed to be outstanding for purposes of computing any other person's percentage. Under these rules, more than one person may be deemed to be a beneficial owner of securities as to which such person has no economic interest.
The following table assumes a one-to-one conversion of shares of Class B common stock to common stock and does not give effect to the for stock split described elsewhere in this prospectus. Except as otherwise indicated in these footnotes, each of the beneficial owners listed has, to our knowledge, sole voting and investment power with respect to the shares of capital stock and the
99
business address of each such beneficial owner is c/o Wesco Aircraft Holdings, Inc., 27727 Avenue Scott, Valencia, CA 91355.
| |
|
|
|
Shares Beneficially Owned After this Offering |
|||||||||||||||||||
|---|---|---|---|---|---|---|---|---|---|---|---|---|---|---|---|---|---|---|---|---|---|---|---|
| |
Shares Beneficially Owned Prior to this Offering |
|
Excluding Exercise of Overallotment |
Including Exercise of Overallotment |
|||||||||||||||||||
| |
Shares to be Sold in this Offering |
||||||||||||||||||||||
Name of Beneficial Owner
|
Number | Percent | Number | Percent | Number | Percent | |||||||||||||||||
TCG Holdings, L.L.C.(1) |
7,914,983 | 83.8 | % | % | % | ||||||||||||||||||
Randy J. Snyder(2) |
1,571,133 | 16.3 | % | % | % | ||||||||||||||||||
Hal Weinstein(3) |
97,539 | 1.0 | * | * | |||||||||||||||||||
Tommy Lee(4) |
33,810 | * | * | * | |||||||||||||||||||
Gregory Hann(5) |
39,618 | * | * | * | |||||||||||||||||||
Alex Murray(6) |
34,175 | * | * | * | |||||||||||||||||||
Dayne A. Baird |
— | * | * | * | |||||||||||||||||||
Peter J. Clare |
— | * | * | * | |||||||||||||||||||
Paul E. Fulchino(7) |
9,575 | * | * | * | |||||||||||||||||||
John P. Jumper(8) |
5,688 | * | * | * | |||||||||||||||||||
Adam J. Palmer |
— | * | * | * | |||||||||||||||||||
Robert D. Paulson(9) |
5,680 | * | * | * | |||||||||||||||||||
David L. Squier(10) |
5,680 | * | * | * | |||||||||||||||||||
All executive officers and directors as a group (12 persons) |
1,802,898 | 18.4 | % | % | % | ||||||||||||||||||
- *
- Denotes
less than 1.0% of beneficial ownership.
- (1)
- Falcon
Aerospace Holdings, LLC is the record holder of 7,914,983 shares of our common stock. Carlyle Partners IV, L.P. is the managing member
of Falcon Aerospace Holdings, LLC. TC Group IV, L.P. is the sole general partner of Carlyle Partners IV, L.P. TC Group IV Managing GP, L.L.C. is the sole general partner of
TC Group IV, L.P. TC Group, L.L.C. is the sole managing member of TC Group IV Managing GP, L.L.C. TCG Holdings, L.L.C. is the managing member of TC Group, L.L.C. Accordingly,
Carlyle Partners IV, L.P., TC Group IV, L.P., TC Group IV Managing GP, L.L.C., TC Group, L.L.C. and TCG Holdings, L.L.C. each may be deemed to share beneficial ownership of
shares of our common stock owned of record by Falcon Aerospace Holdings, LLC. TCG Holdings, L.L.C. is managed by a three person managing board, and all board action relating to the voting or
disposition of these shares requires approval of a majority of the board. William E. Conway, Jr., Daniel A. D'Aniello and David M. Rubenstein are managing members of TCG Holdings, L.L.C. and, in such
capacity, may be deemed to share beneficial ownership of shares of our common stock beneficially owned by TCG Holdings, L.L.C. Such individuals expressly disclaim any such beneficial ownership. The
principal address and principal offices of TCG Holdings, L.L.C. is c/o The Carlyle Group, 1001 Pennsylvania Avenue, N.W., Suite 220 South, Washington, D.C. 20004-2505.
- (2)
- Includes
1,404,467 shares of our common stock beneficially owned by Mr. Snyder and the right to acquire up to 166,666 additional shares.
- (3)
- Includes
14,205 shares of our common stock beneficially owned by Mr. Weinstein and the right to acquire up to 83,334 additional shares.
- (4)
- Includes
8,810 shares of our common stock beneficially owned by Mr. Lee and the right to acquire up to 25,000 additional shares.
- (5)
- Consists of the right to acquire up to 39,618 additional shares.
100
- (6)
- Includes
842 shares of our common stock beneficially owned by Mr. Murray and the right to acquire up to 33,333 additional shares.
- (7)
- Includes
9,140 shares of our common stock beneficially owned by Mr. Fulchino and the right to acquire up to 435 additional shares.
- (8)
- Includes
5,253 shares of our common stock beneficially owned by Mr. Jumper and the right to acquire up to 435 additional shares.
- (9)
- Includes
5,245 shares of our common stock beneficially owned by Mr. Paulson and the right to acquire up to 435 additional shares.
- (10)
- Includes 5,100 shares of our common stock beneficially owned by Mr. Squier and the right to acquire up to 580 additional shares.
101
The following is a description of our capital stock and the material provisions of our amended and restated certificate of incorporation and amended and restated bylaws, as each is anticipated to be in effect upon the closing of this offering, and other agreements to which we and our stockholders are parties. The following is only a summary and is qualified by applicable law and by the provisions of the amended and restated certificate of incorporation and amended and restated bylaws and other agreements, copies of which are available as set forth under the caption entitled "Where You Can Find More Information."
General
Prior to the effectiveness of our amended and restated certificate of incorporation, our authorized capital stock includes the following: (i) 21,000,000 shares of common stock, par value $0.001 per share, which shares are divided into two classes, consisting of 19,000,000 shares of Class A common stock and 2,000,000 shares of Class B common stock, and (ii) 1,000,000 shares of preferred stock, par value $0.001 per share. Upon effectiveness of our amended and restated certificate of incorporation, our authorized capital stock will consist of the following: (i) shares of common stock, par value $0.001 per share, and (ii) shares of preferred stock, par value $0.001 per share. The rights and privileges of holders of our common stock are subject to any series of preferred stock that we may issue in the future.
As of March 31, 2011, 9,445,489 shares of our common stock were issued and outstanding and were owned by 35 stockholders.
Common Stock
Holders of common stock are entitled to one vote for each share held of record on all matters submitted to a vote of the stockholders, including the election of directors. There will be no cumulative voting in the election of directors, which means that holders of a majority of the outstanding shares of common stock will be able to elect all of the directors, and holders of less than a majority of such shares will be unable to elect any director. Under the amended and restated certificate of incorporation, subject to preferences that may be applicable to any outstanding shares of preferred stock, holders of common stock will be entitled to receive ratably such dividends, if any, as may be declared from time to time by our board of directors out of funds legally available for dividend payments. The new senior secured credit facilities impose restrictions on our ability to declare dividends on our common stock. All outstanding shares of common stock are fully paid and non-assessable, and the shares of common stock to be issued upon completion of this offering will be fully paid and non-assessable. The holders of common stock have no preferences or rights of conversion, exchange, pre-emption or other subscription rights. There are no redemption or sinking fund provisions applicable to the common stock. In the event of any liquidation, dissolution or winding-up of our affairs, holders of common stock will be entitled to share ratably in our assets that are remaining after payment or provision for payment of all of our debts and obligations and after liquidation payments to holders of outstanding shares of preferred stock, if any.
Preferred Stock
The preferred stock, if issued, would have priority over the common stock with respect to dividends and other distributions, including the distribution of our assets upon liquidation. Unless required by law or by any stock exchange on which our common stock may be listed, our board of directors will have the authority without further stockholder authorization to issue from time to time shares of preferred stock in one or more series and to determine the designations, rights, preferences, privileges, limitations or restrictions of each series. Although we have no present plans to issue any shares of preferred stock, the issuance of shares of preferred stock, or the issuance of rights to
102
purchase such shares, could decrease the amount of earnings and assets available for distribution to the holders of common stock, could adversely affect the rights and powers, including voting rights, of the common stock, and could have the effect of delaying, deterring or preventing a change in control of us or an unsolicited acquisition proposal.
Amended and Restated Stockholders Agreement
Pursuant to the Amended and Restated Stockholders Agreement, Carlyle will continue to have certain rights to appoint directors to our board of directors. See "Certain Relationships and Related Party Transactions."
Limitations on Directors' Liability
We expect that our amended and restated certificate of incorporation and amended and restated bylaws will contain provisions indemnifying our directors and officers to the fullest extent permitted by law. Prior to the completion of this offering, we intend to enter into indemnification agreements with each of our directors that may, in some cases, be broader than the specific indemnification provisions contained under Delaware law.
In addition, as permitted by Delaware law, we expect that our amended and restated certificate of incorporation will provide that no director will be liable to us or our stockholders for monetary damages for breach of fiduciary duty as a director. The effect of this provision is to restrict our rights and the rights of our stockholders in derivative suits to recover monetary damages against a director for breach of fiduciary duty as a director, except that a director will be personally liable for:
- •
- any breach of his or her duty of loyalty to us or our stockholders;
- •
- acts or omissions not in good faith that involve intentional misconduct or a knowing violation of law;
- •
- the payment of dividends or the redemption or purchase of stock in violation of Delaware law; or
- •
- any transaction from which the director derived an improper personal benefit.
This provision does not affect a director's liability under the federal securities laws.
To the extent that our directors, officers and controlling persons are indemnified under the provisions contained in our amended and restated certificate of incorporation, Delaware law or contractual arrangements against liabilities arising under the Securities Act, we have been advised that in the opinion of the SEC such indemnification is against public policy as expressed in the Securities Act and is therefore unenforceable.
Provisions of Our Amended and Restated Certificate of Incorporation, Amended and Restated Bylaws and Delaware Law that May Have an Anti-Takeover Effect
Amended and Restated Certificate of Incorporation and Amended and Restated Bylaws
Certain provisions that we expect will be contained our amended and restated certificate of incorporation and amended and restated bylaws that are summarized below may be deemed to have an anti-takeover effect and may delay, deter or prevent a tender offer or takeover attempt that a stockholder might consider to be in its best interests, including attempts that might result in a premium being paid over the market price for the shares held by stockholders.
103
Among other things, we expect that our amended and restated certificate of incorporation and amended and restated bylaws will:
- •
- authorize the issuance of blank check preferred stock that our board of directors could issue to increase the number of
outstanding shares and to discourage a takeover attempt;
- •
- limit the ability of stockholders to remove directors if a "group," as defined under Section 13(d)(3) of the
Exchange Act, ceases to own more than 50% of our common stock;
- •
- prohibit our stockholders from calling a special meeting of stockholders;
- •
- prohibit stockholder action by written consent, which requires all stockholder actions to be taken at a meeting of our
stockholders, if a "group" ceases to own more than 50% of our common stock;
- •
- provide that the board of directors is expressly authorized to adopt, alter or repeal our bylaws; and
- •
- establish advance notice requirements for nominations for election to our board of directors or for proposing matters that can be acted upon by stockholders at stockholder meetings.
The foregoing provisions of our amended and restated certificate of incorporation and amended and restated bylaws could discourage potential acquisition proposals and could delay or prevent a change in control. These provisions are intended to enhance the likelihood of continuity and stability in the composition of the board of directors and in the policies formulated by our board of directors and to discourage certain types of transactions that may involve an actual or threatened change of control. These provisions are designed to reduce our vulnerability to an unsolicited acquisition proposal. The provisions also are intended to discourage certain tactics that may be used in proxy fights. However, such provisions could have the effect of discouraging others from making tender offers for our shares and, as a consequence, they also may inhibit fluctuations in the market price of our common stock that could result from actual or rumored takeover attempts. Such provisions also may have the effect of preventing changes in our management.
Delaware Takeover Statute
Subject to certain exceptions, Section 203 prohibits a Delaware corporation from engaging in any "business combination" (as defined below) with any "interested stockholder" (as defined below) for a period of three years following the date that such stockholder became an interested stockholder, unless: (i) prior to such date, the board of directors of the corporation approved either the business combination or the transaction that resulted in the stockholder becoming an interested stockholder; (ii) on consummation of the transaction that resulted in the stockholder becoming an interested stockholder, the interested stockholder owned at least 85% of the voting stock of the corporation outstanding at the time the transaction commenced, excluding for purposes of determining the number of shares outstanding those shares owned (a) by persons who are directors and also officers and (b) by employee stock plans in which employee participants do not have the right to determine confidentially whether shares held subject to the plan will be tendered in a tender or exchange offer; or (iii) on or subsequent to such date, the business combination is approved by the board of directors and authorized at an annual or special meeting of stockholders, and not by written consent, by the affirmative vote of at least 662/3% of the outstanding voting stock that is not owned by the interested stockholder.
In our amended and restated certificate of incorporation, we expect that we will elect not to be governed by Section 203 of the Delaware General Corporation Law, or DGCL, as permitted under and pursuant to subsection (b)(3) of Section 203. Section 203 of the DGCL defines "business combination" to include: (i) any merger or consolidation involving the corporation and the interested stockholder; (ii) any sale, transfer, pledge or other disposition of 10% or more of the assets of the corporation
104
involving the interested stockholder; (iii) subject to certain exceptions, any transaction that results in the issuance or transfer by the corporation of any stock of the corporation to the interested stockholder; (iv) any transaction involving the corporation that has the effect of increasing the proportionate share of the stock of any class or series of the corporation beneficially owned by the interested stockholder; or (v) the receipt by the interested stockholder of the benefit of any loans, advances, guarantees, pledges or other financial benefits provided by or through the corporation. In general, Section 203 defines an "interested stockholder" as any entity or person beneficially owning 15% or more of the outstanding voting stock of the corporation and any entity or person affiliated with or controlling or controlled by such entity or person.
Listing
We will apply to list our common stock on under the symbol "WAIR."
Transfer Agent and Registrar
We have appointed as the transfer agent and registrar for our common stock.
105
SHARES ELIGIBLE FOR FUTURE SALE
Upon the completion of this offering, we will have outstanding shares of common stock, assuming the issuance of shares of common stock offered by the selling stockholders in this offering and no exercise of outstanding options, and assuming that the underwriters have not exercised their overallotment option. Of these shares, shares of common stock will be freely transferable without restriction or further registration under the Securities Act by persons other than "affiliates," as that term is defined in Rule 144 under the Securities Act. Generally, the balance of our outstanding common stock are "restricted securities" within the meaning of Rule 144 under the Securities Act, subject to the limitations and restrictions that are described below. common stock purchased by our affiliates will be "restricted securities" under Rule 144. Restricted securities may be sold in the public market only if registered or if they qualify for an exemption from registration under Rules 144 or 701 promulgated under the Securities Act.
Lock-Up Agreements
In connection with this offering, we, all of our directors and executive officers and certain holders of our common stock will agree with the underwriters to enter into lock-up agreements described in "Underwriting," pursuant to which shares of our common stock outstanding after this offering will be restricted from immediate resale in accordance with the terms of such lock-up agreements.
Rule 144
In general, under Rule 144 as in effect on the date of this prospectus, beginning 90 days after the consummation of this offering, a person (or persons whose common stock is required to be aggregated), who is an affiliate, and who has beneficially owned our common stock for at least six months is entitled to sell in any three-month period a number of shares that does not exceed the greater of:
- •
- 1% of the number of shares then outstanding, which will equal approximately shares immediately after
consummation of this offering; or
- •
- the average weekly trading volume in our shares on during the four calendar weeks preceding the filing of a notice on Form 144 with respect to such a sale.
Sales by our affiliates under Rule 144 are also subject to manner of sale provisions and notice requirements and to the availability of current public information about us. An "affiliate" is a person that directly, or indirectly through one or more intermediaries, controls or is controlled by, or is under common control with an issuer.
Under Rule 144, a person (or persons whose shares are aggregated) who is not deemed to have been an affiliate of ours at any time during the 90 days preceding a sale, and who has beneficially owned the shares proposed to be sold for at least six months (including the holding period of any prior owner other than an affiliate), would be entitled to sell those shares subject only to availability of current public information about us, and after beneficially owning such shares for at least 12 months, would be entitled to sell an unlimited number of shares without restriction. To the extent that our affiliates sell their common stock, other than pursuant to Rule 144 or a registration statement, the purchaser's holding period for the purpose of effecting a sale under Rule 144 commences on the date of transfer from the affiliate.
Rule 701
In general, under Rule 701 as in effect on the date of this prospectus, any of our employees, directors, officers, consultants or advisors who purchased shares from us in reliance on Rule 701 in connection with a compensatory stock or option plan or other written agreement before the effective
106
date of this offering, or who purchased shares from us after that date upon the exercise of options granted before that date, are eligible to resell such shares 90 days after the effective date of this offering in reliance upon Rule 144. If such person is not an affiliate, such sale may be made subject only to the manner of sale provisions of Rule 144. If such a person is an affiliate, such sale may be made under Rule 144 without compliance with the holding period requirement, but subject to the other Rule 144 restrictions described above.
S-8 Registration Statement
In conjunction with this offering, we are filing a registration statement on Form S-8 under the Securities Act, which will register up to shares of common stock underlying stock options or restricted stock awards or reserved for issuance under our equity incentive plans. That registration statement will become effective upon filing, and shares of common stock covered by such registration statement are eligible for sale in the public market immediately after the effective date of such registration statement, subject to the lock-up agreements described above.
Registration Rights
Pursuant to the Amended and Restated Stockholders Agreement, we have granted Carlyle the right to cause us, in certain instances, at our expense, to file registration statements under the Securities Act covering resales of our common stock held by them or to piggyback on such registration statements in certain circumstances. See "Certain Relationships and Related Party Transactions." These shares will represent approximately % of our outstanding common stock after this offering, or % if the underwriters exercise their overallotment option in full. These shares also may be sold under Rule 144 under the Securities Act, depending on their holding period and subject to restrictions in the case of shares held by persons deemed to be our affiliates.
107
MATERIAL U.S. FEDERAL TAX CONSIDERATIONS FOR
NON-U.S. HOLDERS OF OUR COMMON STOCK
The following is a summary of the material U.S. federal income tax consequences applicable to non-U.S. holders (as defined below) with respect to the acquisition, ownership and disposition of our common stock issued pursuant to this offering. This discussion is not a complete analysis of all the potential U.S. federal income tax consequences relating thereto, nor does it address any tax consequences arising under any state, local or non-U.S. tax laws or any other U.S. federal tax laws, including U.S. federal estate and gift tax laws. This discussion is based on the Internal Revenue Code of 1986, as amended, or the Code, Treasury regulations promulgated thereunder, judicial decisions, and published rulings and administrative pronouncements of the Internal Revenue Service, or IRS, all as in effect as of the date of this offering. These authorities may change, or be subject to differing interpretations, possibly with retroactive effect, resulting in U.S. federal income tax consequences different from those discussed below. No ruling has been or will be sought from the IRS with respect to the matters discussed below, and there can be no assurance that the IRS will not take a contrary position regarding the tax consequences of the acquisition, ownership or disposition of our common stock, or that any such contrary position would not be sustained by a court.
This summary is limited to non-U.S. holders that purchase our common stock issued pursuant to this offering and that hold our common stock as a "capital asset" within the meaning of Section 1221 of the Code (generally, property held for investment). This discussion does not address all U.S. federal income tax consequences that may be relevant to a particular non-U.S. holder in light of that holder's particular circumstances. This discussion also does not consider any specific facts or circumstances that may be relevant to non-U.S. holders subject to special rules under the U.S. federal income tax laws, including, without limitation:
- •
- U.S. expatriates and certain former citizens or long-term residents of the United States;
- •
- entities or arrangements treated as partnerships for U.S. federal income tax purposes;
- •
- controlled foreign corporations;
- •
- passive foreign investment companies;
- •
- corporations that accumulate earnings to avoid U.S. federal income tax;
- •
- banks, insurance companies, and other financial institutions;
- •
- brokers, dealers or traders in securities, commodities or currencies;
- •
- tax-exempt organizations;
- •
- tax-qualified retirement plans;
- •
- persons holding our common stock as part of a hedge, straddle or other risk reduction strategy or as part of a conversion
transaction or other integrated investment; and
- •
- persons deemed to sell the common stock under the constructive sale provisions of the Code.
THIS DISCUSSION IS FOR GENERAL INFORMATION ONLY AND IS NOT TAX ADVICE. PROSPECTIVE INVESTORS ARE URGED TO CONSULT THEIR TAX ADVISORS REGARDING THE PARTICULAR U.S. FEDERAL INCOME TAX CONSEQUENCES TO THEM OF ACQUIRING, OWNING AND DISPOSING OF OUR COMMON STOCK, AS WELL AS ANY TAX CONSEQUENCES ARISING UNDER THE LAWS OF ANY STATE, LOCAL OR NON-U.S. TAX LAWS AND ANY OTHER U.S. FEDERAL TAX LAWS (INCLUDING THE U.S. FEDERAL ESTATE AND GIFT TAX LAWS).
108
Definition of Non-U.S. Holder
For purposes of this discussion, a non-U.S. holder is any beneficial owner of our common stock that is not a "U.S. person" or a partnership for U.S. federal income tax purposes. A U.S. person is any of the following:
- •
- an individual citizen or resident of the United States;
- •
- a corporation (or other entity treated as a corporation for U.S. federal income tax purposes) created or organized under
the laws of the United States, any state thereof or the District of Columbia;
- •
- an estate the income of which is subject to U.S. federal income tax regardless of its source; or
- •
- a trust (1) whose administration is subject to the primary supervision of a U.S. court and that has one or more U.S. persons who have the authority to control all substantial decisions of the trust or (2) if it has validly elected to be treated as a U.S. person for U.S. federal income tax purposes.
If a partnership or other entity treated as a partnership for U.S. federal income tax purposes holds our common stock, the tax treatment of a partner in the partnership or member in such other entity generally will depend on the status of the partner or member, upon the activities of the partnership or such other entity, and upon certain determinations made at the partner or member level. Accordingly, partnerships and such other entities that hold our common stock and the partners in such partnerships and the members in such other entities are urged to consult their tax advisors regarding the specific U.S. federal income tax consequences to them.
Distributions on our Common Stock
As described in the section entitled "Dividend Policy," we have not paid a dividend on our common stock in the past and do not anticipate paying dividends on our common stock in the foreseeable future. If, however, we make cash or other property distributions on our common stock, such distributions generally will constitute dividends for U.S. federal income tax purposes to the extent paid from our current or accumulated earnings and profits, as determined under U.S. federal income tax principles. Amounts not treated as dividends for U.S. federal income tax purposes will constitute a return of capital and will first be applied against and reduce a holder's adjusted tax basis in the common stock, but not below zero. Any remaining amounts will be treated as gain realized on the sale or other disposition of the common stock and will be treated as described under the section entitled "—Dispositions of our Common Stock" below.
Dividends paid to a non-U.S. holder of our common stock generally will be subject to U.S. federal withholding tax at a rate of 30% (or such lower rate specified by an applicable tax treaty) of the gross amount of the dividends. To receive the benefit of a reduced treaty rate, a non-U.S. holder must furnish a valid IRS Form W-8BEN (or applicable successor form) certifying such holder's qualification for the reduced rate. This certification must be provided to us or our paying agent prior to the payment of dividends and must be updated periodically. Non-U.S. holders that do not timely provide us or our paying agent the required certification, but that qualify for a reduced treaty rate, may obtain a refund of any excess amounts withheld by timely filing an appropriate claim for refund with the IRS. Non-U.S. holders are urged to consult their tax advisors regarding their entitlement to benefits under a relevant income tax treaty.
If a non-U.S. holder holds our common stock in connection with the conduct of a trade or business in the United States, and dividends paid on the common stock are effectively connected with such holder's U.S. trade or business (and, if required by an applicable tax treaty, are attributable to a permanent establishment maintained by the non-U.S. holder in the United States), the non-U.S. holder
109
will generally be exempt from U.S. federal withholding tax. To claim the exemption, the non-U.S. holder must furnish a properly executed IRS Form W-8ECI (or applicable successor form) to us or our paying agent prior to the payment of such dividends.
Any dividends paid on our common stock that are effectively connected with a non-U.S. holder's U.S. trade or business (and, if required by an applicable tax treaty, are attributable to a permanent establishment maintained by the non-U.S. holder in the United States) generally will be subject to U.S. federal income tax on a net income basis at the regular graduated U.S. federal income tax rates in the same manner as if such holder were a resident of the United States. A non-U.S. holder that is a corporation also may be subject to a branch profits tax equal to 30% (or such lower rate specified by an applicable tax treaty) of its effectively connected earnings and profits for the taxable year, as adjusted for certain items. Non-U.S. holders should consult any applicable income tax treaties that may provide for different rules.
Dispositions of our Common Stock
Subject to the discussions below regarding backup withholding and foreign accounts, a non-U.S. holder generally will not be subject to U.S. federal income tax on any gain realized upon the sale or other disposition of our common stock unless:
- •
- the gain is effectively connected with the non-U.S. holder's conduct of a trade or business in the United
States, and if required by an applicable tax treaty, is attributable to a permanent establishment maintained by the non-U.S. holder in the United States;
- •
- the non-U.S. holder is a nonresident alien individual present in the United States for 183 days or more
during the taxable year of the disposition and certain other requirements are met; or
- •
- our common stock constitutes a "United States real property interest" by reason of our status as a "United States real property holding corporation," which we refer to as a USRPHC, at any time during the shorter of the five-year period preceding the date of disposition or the holder's holding period for our common stock, and certain other requirements are met.
Unless an applicable tax treaty provides otherwise, gain described in the first bullet point above will be subject to U.S. federal income tax on an net income basis at the regular graduated U.S. federal income tax rates in the same manner as if such holder were a resident of the United States. A non-U.S. holder that is a corporation also may be subject to a branch profits tax equal to 30% (or such lower rate specified by an applicable tax treaty) of its effectively connected earnings and profits for the taxable year, as adjusted for certain items. Non-U.S. holders should consult any applicable income tax treaties that may provide for different rules.
Gain described in the second bullet point above will be subject to U.S. federal income tax at a flat 30% rate (or such lower rate specified by an applicable income tax treaty) but may be offset by U.S. source capital losses (even though the individual is not considered a resident of the U.S.), provided that the non-U.S. holder has timely filed U.S. federal income tax returns with respect to such losses.
With respect to the third bullet point above, we believe we are not currently and do not anticipate becoming a USRPHC for United States federal income tax purposes. However, because the determination of whether we are a USRPHC depends on the fair market value of our United States real property interests relative to the fair market value of our other trade or business assets and our non-United States real property interests, there can be no assurance that we are not a USRPHC or will not become one in the future. Even if we are or were to become a USRPHC, gain arising from the sale or other taxable disposition by a non-U.S. holder of our common stock will not be subject to tax if such class of stock is "regularly traded," as defined by applicable Treasury Regulations, on an established securities market, and such non-U.S. holder owned, actually or constructively, five percent (5%) or less of such class of our stock throughout the shorter of the five-year period
110
ending on the date of the sale or exchange or the non-U.S. holder's holding period for such stock. We expect our common stock to be "regularly traded" on an established securities market. If gain on the sale or other taxable disposition of our stock were subject to taxation under the third bullet point above, the non-U.S. holder would be subject to regular United States federal income tax with respect to such gain in generally the same manner as a United States person.
Information Reporting and Backup Withholding
We must report annually to the IRS and to each non-U.S. holder the amount of dividends on our common stock paid to such holder, the name and address of the recipient, and the amount of any tax withheld with respect to those dividends. These information reporting requirements apply in certain circumstances even if no withholding was required, such as where the dividends were effectively connected with the holder's conduct of a U.S. trade or business or withholding was eliminated by an applicable tax treaty. This information also may be made available under a specific treaty or agreement with the tax authorities in the country in which the non-U.S. holder resides or is established. Backup withholding, however, generally will not apply to payments of dividends to a non-U.S. holder of our common stock provided the non-U.S. holder furnishes the required certification as to its non-U.S. status, such as by providing a valid IRS Form W-8BEN or W-8ECI, or certain other requirements are met. Notwithstanding the foregoing, backup withholding may apply if either we or our paying agent has actual knowledge, or reason to know, that the holder is a United States person that is not an exempt recipient.
Unless a non-U.S. holder complies with certification procedures to establish that it is not a United States person, information returns may be filed with the IRS in connection with, and the non-U.S. holder may be subject to backup withholding on the proceeds from, a sale or other disposition of our common stock. The certification procedures described in the previous paragraph will satisfy these certification requirements as well.
Backup withholding is not an additional tax. Any amounts withheld under the backup withholding rules may be allowed as a refund or a credit against a non-U.S. holder's U.S. federal income tax liability, provided the required information is timely furnished to the IRS.
Additional Withholding Tax Relating to Foreign Accounts
An additional withholding tax will apply to certain types of payments made after December 31, 2012 to "foreign financial institutions" (as specially defined under the applicable rules) and certain other non-U.S. entities. Specifically, a 30% withholding tax will be imposed on dividends on, or gross proceeds from the sale or other disposition of, our common stock paid to a foreign financial institution or to a foreign non-financial entity after such date, unless (i) the foreign financial institution undertakes certain diligence and reporting obligations or (ii) the foreign non-financial entity either certifies it does not have any substantial United States owners or furnishes identifying information regarding each substantial United States owner. If the payee is a foreign financial institution, it must enter into an agreement with the United States Department of the Treasury requiring, among other things, that it undertake to identify accounts held by certain United States persons or United States-owned foreign entities, annually report certain information about such accounts, and withhold 30% on payments to account holders whose actions prevent it from complying with these reporting and other requirements. Prospective investors should consult their tax advisors regarding these rules.
111
Barclays Capital Inc. and Morgan Stanley & Co. Incorporated are acting as representatives of the underwriters and joint book-running managers of this offering. Under the terms of an underwriting agreement, which will be filed as an exhibit to the registration statement, each of the underwriters named below has severally agreed to purchase from the selling stockholders the respective number of common stock shown opposite its name below:
Underwriter
|
Number of Shares | ||||
|---|---|---|---|---|---|
Barclays Capital Inc. |
|||||
Morgan Stanley & Co. Incorporated |
|||||
J.P. Morgan Securities LLC |
|||||
Merrill Lynch, Pierce, Fenner & Smith |
|||||
William Blair & Company, L.L.C. |
|||||
Total |
|||||
The underwriting agreement provides that the underwriters' obligation to purchase shares of common stock depends on the satisfaction of the conditions contained in the underwriting agreement including:
- •
- the obligation to purchase all of the shares of common stock offered hereby (other than those shares of common stock
covered by their option to purchase additional shares as described below), if any of the shares are purchased;
- •
- the representations and warranties made by us and the selling stockholders to the underwriters are true;
- •
- there is no material change in our business or the financial markets; and
- •
- we deliver customary closing documents to the underwriters.
Commissions and Expenses
The following table summarizes the underwriting discounts and commissions the selling stockholders will pay to the underwriters. These amounts are shown assuming both no exercise and full exercise of the underwriters' option to purchase additional shares. The underwriting fee is the difference between the initial price to the public and the amount the underwriters pay to the selling stockholders for the shares.
| |
No Exercise | Full Exercise | |||||
|---|---|---|---|---|---|---|---|
Per share |
$ | $ | |||||
Total |
$ | $ | |||||
The representatives of the underwriters have advised us that the underwriters propose to offer the shares of common stock directly to the public at the public offering price on the cover of this prospectus and to selected dealers, which may include the underwriters, at such offering price less a selling concession not in excess of $ per share. After the offering, the representatives may change the offering price and other selling terms. Sales of shares made outside of the United States may be made by affiliates of the underwriters.
The expenses of the offering that are payable by us and the selling stockholders are estimated to be $ (excluding underwriting discounts and commissions). We have agreed to pay expenses
112
incurred by the selling stockholders in connection with the offering, other than the underwriting discounts and commission.
Option to Purchase Additional Shares
The selling stockholders have granted the underwriters an option exercisable for 30 days after the date of this prospectus to purchase, from time to time, in whole or in part, up to an aggregate of shares at the public offering price less underwriting discounts and commissions. This option may be exercised if the underwriters sell more than shares in connection with this offering. To the extent that this option is exercised, each underwriter will be obligated, subject to certain conditions, to purchase its pro rata portion of these additional shares based on the underwriter's underwriting commitment in the offering as indicated in the table at the beginning of this Underwriting Section.
Lock-Up Agreements
We and all of our directors, executive officers and certain holders of our common stock have agreed that, subject to certain exceptions, without the prior written consent of , we and they will not, (1) offer, pledge, sell, contract to sell, sell any option or contract to purchase, purchase any option or contract to sell, grant any option, right or warrant to purchase, lend, or otherwise transfer or dispose of, directly or indirectly, any shares of common stock beneficially owned (including, without limitation, shares of common stock that may be deemed to be beneficially owned by us or them in accordance with the rules and regulations of the SEC and shares of common stock that may be issued upon exercise of any securities convertible into or exercisable or exchangeable for common stock) or (2) enter into any swap or other arrangement that transfers to another, in whole or in part, any of the economic consequences of ownership of the common stock, whether any such transaction described in clause (1) or (2) above is to be settled by delivery of common stock or such other securities, in cash or otherwise during the period ending 180 days after the date of this prospectus. In addition, we have agreed not to file any registration statement with the SEC relating to the offering of any shares of common stock or any securities convertible into or exercisable or exchangeable for common stock during the 180-day restricted period.
The 180-day restricted period described in the preceding paragraph will be extended if:
- •
- during the last 17 days of the 180-day restricted period we issue an earnings release or material news
or a material event relating to us occurs; or
- •
- prior to the expiration of the 180-day restricted period, we announce that we will release earnings results during the 16-day period beginning on the last day of the 180-day period,
in which case the restrictions described in the preceding paragraph will continue to apply until the expiration of the 18-day period beginning on the issuance of the earnings release or the announcement of the material news or occurrence of a material event, unless such extension is waived in writing by .
, in its sole discretion, may release the common stock and other securities subject to the lock-up agreements described above in whole or in part at any time with or without notice. When determining whether or not to release common stock and other securities from lock-up agreements, will consider, among other factors, the holder's reasons for requesting the release, the number of shares of common stock and other securities for which the release is being requested and market conditions at the time.
113
Offering Price Determination
Prior to this offering, there has been no public market for our common stock. The initial public offering price will be negotiated between the representatives and us. In determining the initial public offering price of our common stock, the representatives will consider:
- •
- the history and prospects for the industry in which we compete;
- •
- our financial information;
- •
- the ability of our management and our business potential and earning prospects;
- •
- the prevailing securities markets at the time of this offering; and
- •
- the recent market prices of, and the demand for, publicly traded shares of generally comparable companies.
An active trading market for the shares may not develop. It is also possible that after the offering the shares will not trade in the public market at or above the initial public offering price.
Indemnification
We and the selling stockholders have agreed to indemnify the underwriters against certain liabilities, including liabilities under the Securities Act, and to contribute to payments that the underwriters may be required to make for these liabilities.
Stabilization, Short Positions and Penalty Bids
The representatives may engage in stabilizing transactions, short sales and purchases to cover positions created by short sales, and penalty bids or purchases for the purpose of pegging, fixing or maintaining the price of the common stock, in accordance with Regulation M under the Securities Exchange Act of 1934:
- •
- Stabilizing transactions permit bids to purchase the underlying security so long as the stabilizing bids do not exceed a
specified maximum.
- •
- A short position involves a sale by the underwriters of shares in excess of the number of shares the underwriters are
obligated to purchase in the offering, which creates the syndicate short position. This short position may be either a covered short position or a naked short position. In a covered short position,
the number of shares involved in the sales made by the underwriters in excess of the number of shares they are obligated to purchase is not greater than the number of shares that they may purchase by
exercising their option to purchase additional shares. In a naked short position, the number of shares involved is greater than the number of shares in their option to purchase additional shares. The
underwriters may close out any short position by either exercising their option to purchase additional shares and/or purchasing shares in the open market. In determining the source of shares to close
out the short position, the underwriters will consider, among other things, the price of shares available for purchase in the open market as compared to the price at which they may purchase shares
through their option to purchase additional shares. A naked short position is more likely to be created if the underwriters are concerned that there could be downward pressure on the price of the
shares in the open market after pricing that could adversely affect investors who purchase in the offering.
- •
- Syndicate covering transactions involve purchases of the common stock in the open market after the distribution has been completed in order to cover syndicate short positions.
114
- •
- Penalty bids permit the representatives to reclaim a selling concession from a syndicate member when the common stock originally sold by the syndicate member is purchased in a stabilizing or syndicate covering transaction to cover syndicate short positions.
These stabilizing transactions, syndicate covering transactions and penalty bids may have the effect of raising or maintaining the market price of our common stock or preventing or retarding a decline in the market price of the common stock. As a result, the price of the common stock may be higher than the price that might otherwise exist in the open market. These transactions may be effected on or otherwise and, if commenced, may be discontinued at any time.
Neither we nor any of the underwriters make any representation or prediction as to the direction or magnitude of any effect that the transactions described above may have on the price of the common stock. In addition, neither we nor any of the underwriters make representation that the representatives will engage in these stabilizing transactions or that any transaction, once commenced, will not be discontinued without notice.
Electronic Distribution
A prospectus in electronic format may be made available on the Internet sites or through other online services maintained by one or more of the underwriters and/or selling group members participating in this offering, or by their affiliates. In those cases, prospective investors may view offering terms online and, depending upon the particular underwriter or selling group member, prospective investors may be allowed to place orders online. The underwriters may agree with us to allocate a specific number of shares for sale to online brokerage account holders. Any such allocation for online distributions will be made by the representatives on the same basis as other allocations.
Other than the prospectus in electronic format, the information on any underwriter's or selling group member's web site and any information contained in any other web site maintained by an underwriter or selling group member is not part of the prospectus or the registration statement of which this prospectus forms a part, has not been approved and/or endorsed by us or any underwriter or selling group member in its capacity as underwriter or selling group member and should not be relied upon by investors.
Exchange Listing
We will apply to list our shares of common stock for quotation on the under the symbol "WAIR."
Discretionary Sales
The underwriters have informed us that they do not intend to confirm sales to discretionary accounts that exceed 5% of the total number of shares offered by them.
Stamp Taxes
If you purchase shares of common stock offered in this prospectus, you may be required to pay stamp taxes and other charges under the laws and practices of the country of purchase, in addition to the offering price listed on the cover page of this prospectus.
Relationships
Certain of the underwriters and/or their affiliates have engaged, and may in the future engage, in commercial and investment banking transactions with us in the ordinary course of their business, including as our arrangers, lenders and agents under the old senior secured credit facilities and the new senior secured credit facilities for which they have received, and expect to receive, customary
115
compensation and expense reimbursement. For example, affiliates of Barclays Capital Inc., Merrill Lynch, Pierce, Fenner & Smith Incorporated, J.P. Morgan Securities LLC and Morgan Stanley & Co. Incorporated are acting as arrangers, lenders and, in the case of affiliates of Barclays Capital Inc. and Merrill Lynch, Pierce, Fenner & Smith Incorporated, agents, under the new senior secured credit facilities. In addition, affiliates of Barclays Capital Inc., Merrill Lynch, Pierce, Fenner & Smith Incorporated and Morgan Stanley & Co. Incorporated acted as lenders and, in the case of Barclays Capital Inc. and Merrill Lynch, Pierce, Fenner & Smith Incorporated, agents, under the old senior secured credit facilities. For a description of these facilities, see "Management's Discussion and Analysis of Financial Condition and Results of Operations—Liquidity of Capital Resources—Senior Secured Credit Facilities."
Selling Restrictions
European Economic Area
In relation to each Member State of the European Economic Area that has implemented the Prospectus Directive (each, referred to as a "Relevant Member State") an offer to the public of any shares of our common stock may not be made in that Relevant Member State, except that an offer to the public in that Relevant Member State of any shares of our common stock may be made at any time under the following exemptions under the Prospectus Directive, if they have been implemented in that Relevant Member State:
- (a)
- to
any legal entity that is a qualified investor as defined in the Prospectus Directive;
- (b)
- to
fewer than 100 or, if the Relevant Member State has implemented the relevant provision of the 2010 PD Amending Directive, 150, natural or legal persons
(other than qualified investors as defined in the Prospectus Directive), as permitted under the Prospectus Directive, subject to obtaining the prior consent of the representatives for any such offer;
or
- (c)
- in any other circumstances falling within Article 3(2) of the Prospectus Directive, provided that no such offer of shares of our common stock shall result in a requirement for the publication by us or any underwriter of a prospectus pursuant to Article 3 of the Prospectus Directive.
For the purposes of this provision, the expression an "offer to the public" in relation to any shares of our common stock in any Relevant Member State means the communication in any form and by any means of sufficient information on the terms of the offer and any shares of our common stock to be offered so as to enable an investor to decide to purchase any shares of our common stock, as the same may be varied in that Member State by any measure implementing the Prospectus Directive in that Member State, the expression "Prospectus Directive" means Directive 2003/71/EC (and amendments thereto, including the 2010 PD Amending Directive, to the extent implemented in the Relevant Member State), and includes any relevant implementing measure in the Relevant Member State, and the expression "2010 PD Amending Directive" means Directive 2010/73/EU.
United Kingdom
Each underwriter has represented and agreed that:
- (a)
- it has only communicated or caused to be communicated and will only communicate or cause to be communicated an invitation or inducement to engage in investment activity (within the meaning of Section 21 of the FSMA) received by it in connection with the issue or sale of the shares of our common stock in circumstances in which Section 21(1) of the FSMA does not apply to us; and
116
- (b)
- it has complied and will comply with all applicable provisions of the FSMA with respect to anything done by it in relation to the shares of our common stock in, from or otherwise involving the United Kingdom.
Notice to Prospective Investors in Switzerland
The shares of common stock may not be publicly offered in Switzerland and will not be listed on the SIX Swiss Exchange, or SIX, or on any other stock exchange or regulated trading facility in Switzerland. This document has been prepared without regard to the disclosure standards for issuance prospectuses under art. 652a or art. 1156 of the Swiss Code of Obligations or the disclosure standards for listing prospectuses under art. 27 ff. of the SIX Listing Rules or the listing rules of any other stock exchange or regulated trading facility in Switzerland. Neither this document nor any other offering or marketing material relating to the shares of common stock or the offering may be publicly distributed or otherwise made publicly available in Switzerland.
Neither this document nor any other offering or marketing material relating to the offering, the issuer or the shares of common stock has been or will be filed with or approved by any Swiss regulatory authority. In particular, this document will not be filed with, and the offer of the shares of common stock will not be supervised by, the Swiss Financial Market Supervisory Authority, and the offer of shares of common stock has not been and will not be authorized under the Swiss Federal Act on Collective Investment Schemes, or CISA. The investor protection afforded to acquirers of interests in collective investment schemes under the CISA does not extend to acquirers of shares of common stock.
Notice to Prospective Investors in the Dubai International Financial Centre
This offering memorandum relates to an exempt offer in accordance with the Offered Securities Rules of the Dubai Financial Services Authority, or DFSA. This offering memorandum is intended for distribution only to persons of a type specified in the Offered Securities Rules of the DFSA. It must not be delivered to, or relied on by, any other person. The DFSA has no responsibility for reviewing or verifying any documents in connection with exempt offers. The DFSA has not approved this offering memorandum nor taken steps to verify the information set forth herein and has no responsibility for the offering memorandum. The securities to which this offering memorandum relates may be illiquid and/or subject to restrictions on their resale. Prospective purchasers of the securities offered should conduct their own due diligence on the securities. If you do not understand the contents of this offering memorandum you should consult an authorized financial advisor.
Relationship with Solebury Capital LLC
Pursuant to an engagement agreement, we retained Solebury Capital LLC, or Solebury, a FINRA member, to provide certain financial consulting services (which do not include underwriting services) in connection with this offering. We agreed to pay Solebury, only upon successful completion of this offering, a fee of $400,000 and, at our sole discretion, an additional potential incentive fee of $200,000. We also agreed to reimburse Solebury for reasonable and documented out-of-pocket expenses up to a maximum of $50,000 without our prior written consent and have provided indemnification of Solebury pursuant to the engagement agreement. Solebury's services include advice with respect to selection of underwriters for this offering, deal structuring, fee and economics recommendations, distribution strategy recommendations and preparation of presentation materials. Solebury is not acting as an underwriter and has no contact with any public or institutional investor on behalf of the Company or the underwriters. In addition, Solebury will not underwrite or purchase any of our common stock in this offering or otherwise participate in any such undertaking.
117
The validity of the shares being sold in this offering will be passed upon for us by Latham & Watkins LLP, Washington, D.C. Certain legal matters relating to this offering will be passed upon for the underwriters by Davis Polk & Wardwell LLP, New York, New York.
The financial statements as of September 30, 2009 and 2010 and for each of the three years in the period ended September 30, 2010 included in this prospectus have been so included in reliance on the report of PricewaterhouseCoopers LLP, an independent registered public accounting firm, given on the authority of said firm as experts in auditing and accounting.
WHERE YOU CAN FIND MORE INFORMATION
We have filed with the SEC a registration statement on Form S-1 pursuant to the Securities Act, covering the common stock being offered hereby. This prospectus, which constitutes part of the registration statement, does not contain all the information set forth in the registration statement. For further information about us and the common stock we propose to sell in this offering, we refer you to the registration statement and the exhibits and schedules filed as a part of the registration statement. Statements contained in this prospectus as to the contents of any contract or other document filed as an exhibit to the registration statement are not necessarily complete. If a contract or document has been filed as an exhibit to the registration statement, we refer you to the copy of the contract or document that has been filed.
You may inspect a copy of the registration statement and the exhibits and schedules to the registration statement without charge at the Public Reference Room of the SEC at 100 F Street, NE, Washington, DC 20549. You may obtain information on the operation of the Public Reference Room by calling the SEC at 1-800-SEC-0330. You can receive copies of these documents upon payment of a duplicating fee by writing to the SEC. The SEC maintains a web site at www.sec.gov that contains reports, proxy and information statements and other information regarding registrants that file electronically with the SEC. You can also inspect our registration statement on this web site.
Upon completion of this offering, we will become subject to the information and reporting requirements of the Exchange Act pursuant to Section 13 thereof. Our filings with the SEC (other than those exhibits specifically incorporated by reference into the registration statement of which this prospectus forms a part) are not incorporated by reference into this prospectus.
118
INDEX TO CONSOLIDATED FINANCIAL STATEMENTS
F-1
Report of Independent Registered Public Accounting Firm
To
the Board of Directors and Stockholders of
Wesco Aircraft Holdings, Inc. (formerly known as Wesco Holdings, Inc.)
In our opinion, the accompanying consolidated balance sheets and the related consolidated statements of income, stockholders' equity and comprehensive income, and cash flows present fairly, in all material respects, the financial position of Wesco Aircraft Holdings, Inc. (formerly known as Wesco Holdings, Inc.) and its subsidiaries (the "Company") at September 30, 2009 and 2010, and the results of their operations and their cash flows for each of the three years in the period ended September 30, 2010 in conformity with accounting principles generally accepted in the United States of America. These financial statements are the responsibility of the Company's management. Our responsibility is to express an opinion on these financial statements based on our audits. We conducted our audits of these statements in accordance with the standards of the Public Company Accounting Oversight Board (United States). Those standards require that we plan and perform the audit to obtain reasonable assurance about whether the financial statements are free of material misstatement. An audit includes examining, on a test basis, evidence supporting the amounts and disclosures in the financial statements, assessing the accounting principles used and significant estimates made by management, and evaluating the overall financial statement presentation. We believe that our audits provide a reasonable basis for our opinion.
/s/
PricewaterhouseCoopers LLP
Los Angeles, California
December 22, 2010
F-2
Wesco Aircraft Holdings, Inc. and Subsidiaries
Consolidated Balance Sheets
September 30, 2009 and 2010
(In thousands, except
share and per share data)
| |
2009 | 2010 | |||||||
|---|---|---|---|---|---|---|---|---|---|
Assets |
|||||||||
Current assets |
|||||||||
Cash and cash equivalents |
$ | 11,406 | $ | 39,463 | |||||
Accounts receivable, net of allowance for doubtful accounts of $3,406 and $4,011 in 2009 and 2010 |
83,200 | 89,427 | |||||||
Inventories |
486,876 | 483,442 | |||||||
Prepaid expenses and other current assets |
9,176 | 6,581 | |||||||
Deferred income taxes |
23,558 | 33,138 | |||||||
Total current assets |
614,216 | 652,051 | |||||||
Property and equipment, net |
20,561 |
20,173 |
|||||||
Deferred financing costs, net |
15,144 | 10,329 | |||||||
Goodwill |
506,066 | 504,841 | |||||||
Intangible assets, net |
95,314 | 89,998 | |||||||
Other assets |
3,511 | 1,620 | |||||||
Total assets |
$ | 1,254,812 | $ | 1,279,012 | |||||
Liabilities and Stockholders' Equity |
|||||||||
Current liabilities |
|||||||||
Line of credit |
$ | 813 | $ | — | |||||
Accounts payable |
61,033 | 59,183 | |||||||
Accrued expenses and other current liabilities |
14,199 | 20,888 | |||||||
Income taxes payable |
5,262 | 5,500 | |||||||
Long-term debt—current portion |
5,528 | — | |||||||
Capital lease obligations—current portion |
1,006 | 1,354 | |||||||
Total current liabilities |
87,841 | 86,925 | |||||||
Long-term debt |
682,097 |
620,243 |
|||||||
Capital lease obligations |
2,171 | 1,789 | |||||||
Deferred income taxes |
7,605 | 23,927 | |||||||
Other liabilities |
1,158 | 389 | |||||||
Total liabilities |
780,872 | 733,273 | |||||||
Commitments and contingencies |
|||||||||
Stockholders' equity |
|||||||||
Preferred stock, $0.001 par value per share: 1,000,000 shares authorized; no shares issued and outstanding |
— | — | |||||||
Common stock, class A, $0.001 par value per share: 19,000,000 shares authorized; 9,319,450 shares issued and outstanding |
9 | 9 | |||||||
Class B convertible redeemable common stock, $0.001 par value per share: |
1 | 1 | |||||||
Additional paid-in capital |
326,746 | 329,256 | |||||||
Accumulated other comprehensive loss |
(2,903 | ) | (7,288 | ) | |||||
Retained earnings |
150,087 | 223,761 | |||||||
Total stockholders' equity |
473,940 | 545,739 | |||||||
Total liabilities and stockholders' equity |
$ | 1,254,812 | $ | 1,279,012 | |||||
See the accompanying notes to the consolidated financial statements.
F-3
Wesco Aircraft Holdings, Inc. and Subsidiaries
Consolidated Statements of Income
For the Years Ended September 30, 2008, 2009 and 2010
(In thousands, except share and per share data)
| |
2008 | 2009 | 2010 | ||||||||||
|---|---|---|---|---|---|---|---|---|---|---|---|---|---|
Net sales |
$ | 604,343 | $ | 612,687 | $ | 656,036 | |||||||
Cost of sales |
347,735 | 374,400 | 401,806 | ||||||||||
Gross profit |
256,608 | 238,287 | 254,230 | ||||||||||
Selling, general and administrative expenses |
105,758 | 103,895 | 99,915 | ||||||||||
Income from operations |
150,850 | 134,392 | 154,315 | ||||||||||
Interest expense, net |
(48,743 | ) | (37,707 | ) | (36,270 | ) | |||||||
Other income (expense), net |
746 | (376 | ) | (458 | ) | ||||||||
Income before provision for income taxes |
102,853 | 96,309 | 117,587 | ||||||||||
Provision for income taxes |
44,251 | 37,862 | 43,913 | ||||||||||
Net income |
$ | 58,602 | $ | 58,447 | $ | 73,674 | |||||||
Net income per share: |
|||||||||||||
Basic |
$ | 6.22 | $ | 6.19 | $ | 7.32 | |||||||
Diluted |
$ | 6.02 | $ | 5.87 | $ | 7.28 | |||||||
Weighted average shares outstanding: |
|||||||||||||
Basic |
9,420,433 | 9,440,596 | 10,063,237 | ||||||||||
Diluted |
9,740,158 | 9,964,748 | 10,118,648 | ||||||||||
See the accompanying notes to the consolidated financial statements.
F-4
Wesco Aircraft Holdings, Inc. and Subsidiaries
Consolidated Statements of Stockholders' Equity and Comprehensive Income
For the Years Ended September 30, 2008, 2009 and 2010
(In thousands, except share and per share data)
| |
|
|
Class B Convertible Redeemable Common Stock |
|
|
|
|
|
|||||||||||||||||||||
|---|---|---|---|---|---|---|---|---|---|---|---|---|---|---|---|---|---|---|---|---|---|---|---|---|---|---|---|---|---|
| |
Class A Common Stock |
|
|
|
|
|
|||||||||||||||||||||||
| |
|
Accumulated Other Comprehensive Income (Loss) |
|
|
|
||||||||||||||||||||||||
| |
Additional Paid-In Capital |
Retained Earnings |
Total Stockholders' Equity |
Comprehensive Income |
|||||||||||||||||||||||||
| |
Shares | Amount | Shares | Amount | |||||||||||||||||||||||||
Balance, October 1, 2007 |
9,319,450 | $ | 9 | 87,479 | $ | 1 | $ | 302,409 | $ | 325 | $ | 33,038 | $ | 335,782 | $ | 33,363 | |||||||||||||
Sale of common stock |
— | — | 6,887 | — | 306 | — | — | 306 | |||||||||||||||||||||
Exercise of stock options |
— | — | 17,656 | — | 655 | — | — | 655 | |||||||||||||||||||||
Stock-based compensation |
— | — | 4,312 | — | 13,700 | — | — | 13,700 | |||||||||||||||||||||
Net income |
— | — | — | — | — | — | 58,602 | 58,602 | 58,602 | ||||||||||||||||||||
Other comprehensive income |
|||||||||||||||||||||||||||||
Foreign currency translation adjustment |
— | — | — | — | — | 728 | — | 728 | 728 | ||||||||||||||||||||
Total comprehensive income |
$ | 59,330 | |||||||||||||||||||||||||||
Balance, September 30, 2008 |
9,319,450 | $ | 9 | 116,334 | $ | 1 | $ | 317,070 | $ | 1,053 | $ | 91,640 | $ | 409,773 | |||||||||||||||
Exercise of stock options |
— | — | 437 | — | 16 | — | — | 16 | |||||||||||||||||||||
Stock-based compensation |
— | — | 4,312 | — | 10,389 | — | — | 10,389 | |||||||||||||||||||||
Redemption of vested stock options |
— | — | — | — | (729 | ) | — | — | (729 | ) | |||||||||||||||||||
Net income |
— | — | — | — | — | — | 58,447 | 58,447 | 58,447 | ||||||||||||||||||||
Other comprehensive income |
|||||||||||||||||||||||||||||
Foreign currency translation adjustment, net of tax |
— | — | — | — | — | (3,956 | ) | — | (3,956 | ) | (3,956 | ) | |||||||||||||||||
Total comprehensive income |
$ | 54,491 | |||||||||||||||||||||||||||
Balance, September 30, 2009 |
9,319,450 | $ | 9 | 121,083 | $ | 1 | $ | 326,746 | $ | (2,903 | ) | $ | 150,087 | $ | 473,940 | ||||||||||||||
Stock-based compensation |
— | — | — | — | 2,510 | — | — | 2,510 | |||||||||||||||||||||
Net income |
— | — | — | — | — | — | 73,674 | 73,674 | 73,674 | ||||||||||||||||||||
Other comprehensive income |
|||||||||||||||||||||||||||||
Foreign currency translation adjustment, net of tax |
— | — | — | — | — | (4,385 | ) | — | (4,385 | ) | (4,385 | ) | |||||||||||||||||
Total comprehensive income |
$ | 69,289 | |||||||||||||||||||||||||||
Balance, September 30, 2010 |
9,319,450 | $ | 9 | 121,083 | $ | 1 | $ | 329,256 | $ | (7,288 | ) | $ | 223,761 | $ | 545,739 | ||||||||||||||
See the accompanying notes to the consolidated financial statements.
F-5
Wesco Aircraft Holdings, Inc. and Subsidiaries
Consolidated Statements of Cash Flows
For the Years Ended September 30, 2008, 2009 and 2010
(In thousands)
| |
2008 | 2009 | 2010 | ||||||||||
|---|---|---|---|---|---|---|---|---|---|---|---|---|---|
Cash flows from operating activities |
|||||||||||||
Net income |
$ | 58,602 | $ | 58,447 | $ | 73,674 | |||||||
Adjustments to reconcile net income to net cash provided by operating activities |
|||||||||||||
Amortization of intangible assets |
3,391 | 5,763 | 4,119 | ||||||||||
Depreciation |
4,455 | 4,302 | 4,702 | ||||||||||
Amortization of deferred financing costs |
3,379 | 3,703 | 4,814 | ||||||||||
Bad debt and sales return reserve |
4,561 | 254 | 607 | ||||||||||
Non-cash foreign currency exchange |
(600 | ) | 364 | 242 | |||||||||
Non-cash stock-based compensation |
13,700 | 10,389 | 2,510 | ||||||||||
Change in fair value of derivative |
— | 4,102 | 2,558 | ||||||||||
Deferred income tax provision |
3,836 | 14,024 | 6,741 | ||||||||||
Changes in assets and liabilities |
|||||||||||||
Accounts receivable |
(11,162 | ) | 4,429 | (7,795 | ) | ||||||||
Income taxes receivable |
(63 | ) | 7 | (45 | ) | ||||||||
Inventories |
(58,749 | ) | (111,136 | ) | 1,593 | ||||||||
Prepaid expenses and other assets |
(4,636 | ) | (959 | ) | 4,448 | ||||||||
Accounts payable |
11,011 | 9,073 | (1,099 | ) | |||||||||
Accrued expenses and other liabilities |
34 | (3,446 | ) | 3,423 | |||||||||
Income taxes payable |
(3,057 | ) | 1,950 | 281 | |||||||||
Net cash provided by operating activities |
24,702 | 1,266 | 100,773 | ||||||||||
Cash flows from investing activities |
|||||||||||||
Acquisition of business, net of cash acquired |
(109,029 | ) | — | — | |||||||||
Purchases of property and equipment |
(6,769 | ) | (4,135 | ) | (3,077 | ) | |||||||
Net cash used in investing activities |
(115,798 | ) | (4,135 | ) | (3,077 | ) | |||||||
Cash flows from financing activities |
|||||||||||||
Net repayments under line of credit |
(2,394 | ) | (23 | ) | (796 | ) | |||||||
Proceeds/(Repayments) of long-term debt |
100,000 | — | (67,382 | ) | |||||||||
Financing fees |
(3,024 | ) | — | — | |||||||||
Redemption of vested stock options |
— | (729 | ) | — | |||||||||
Repayment of capital lease obligations |
(1,445 | ) | (984 | ) | (1,305 | ) | |||||||
Proceeds from exercise of stock options |
977 | 16 | — | ||||||||||
Net cash provided by (used in) financing activities |
94,114 | (1,720 | ) | (69,483 | ) | ||||||||
Effect of foreign currency exchange rates on cash and cash equivalents |
118 | (3 | ) | (156 | ) | ||||||||
Net increase (decrease) in cash and cash equivalents |
3,136 | (4,592 | ) | 28,057 | |||||||||
Cash and cash equivalents, beginning of period |
12,862 | 15,998 | 11,406 | ||||||||||
Cash and cash equivalents, end of period |
$ | 15,998 | $ | 11,406 | $ | 39,463 | |||||||
Supplemental disclosure of cash flow information (see Note 16)
See the accompanying notes to the consolidated financial statements.
F-6
Wesco Aircraft Holdings, Inc. & Subsidiaries
Notes to the Consolidated Financial Statements
(In thousands, except share and per share data)
Note 1. Organization and Business
Wesco Aircraft Holdings, Inc. is a distributor and provider of comprehensive supply chain management services to the global aerospace industry. The Company's services range from traditional distribution to the management of supplier relationships, quality assurance, kitting, just-in-time, or JIT delivery, and point-of-use inventory management.
In addition to the central stocking facilities, the Company uses a network of forward-stocking locations to service its customers in a JIT and/or ad hoc manner. There are over 15 stocking locations around the world with concentrations in North America and Europe. In addition to product fulfillment, the Company also provides comprehensive supply chain management services for selected customers. These services include procurement and just-in-time inventory management and delivery services.
On September 29, 2006, 100% of the outstanding stock of Wesco Aircraft Hardware Corp., Wesco Aircraft Israel and the European entities of Flintbrook Ltd., Wesco Aircraft France and Wesco Aircraft Germany were acquired by the Company. The acquisition was completed in a leveraged transaction in which affiliates of The Carlyle Group invested approximately 85% of the total voting equity in the Company and the prior owner of the Company contributed the remaining 15% of the total voting equity invested. The prior owner's investment represented a contribution of ownership in the predecessor company to the newly formed holding company. In accordance with Accounting Standards Codification ("ASC") 805, Business Combinations, the acquired assets and liabilities have been recorded at fair value for the interests acquired by new investors and at carryover basis for the continuing investors.
Note 2. Summary of Significant Accounting Policies
Principles of Consolidation
The accompanying consolidated financial statements include the accounts of Wesco Aircraft Hardware Corp., Wesco Aircraft Europe Limited, Flintbrook Limited, Wesco Aircraft Germany GmbH, Wesco Aircraft France SAS, Wesco Aircraft Israel Ltd, and Wesco Aircraft Italy SRL. All intercompany accounts and transactions have been eliminated.
Use of Estimates in Preparation of Financial Statements
The preparation of financial statements, in conformity with accounting principles generally accepted in the United States of America, requires management to make estimates and assumptions that affect the reported amounts of assets and liabilities and the disclosure of contingent assets and liabilities at the date of the financial statements and the reported amounts of revenues and expenses during the reporting period. Estimates are used for, but not limited to, receivable valuations and sales returns, inventory valuations of excess and obsolete inventories, the useful lives of long-lived assets including property, equipment and intangible assets, annual goodwill impairment assessment, income taxes and contingencies. Actual results could differ from such estimates.
Cash and Cash Equivalents
The Company considers all highly liquid investments with original maturities from date of purchase by the Company of three months or less to be cash equivalents.
F-7
Wesco Aircraft Holdings, Inc. & Subsidiaries
Notes to the Consolidated Financial Statements (Continued)
(In thousands, except share and per share data)
Note 2. Summary of Significant Accounting Policies (Continued)
Accounts Receivable
Accounts receivable consist of amounts owed to the Company by customers. The Company performs periodic credit evaluations of the financial condition of its customers, monitors collections and payments from customers, and generally does not require collateral. Accounts receivable are generally due within 30 to 60 days. The Company provides for the possible inability to collect accounts receivable by recording an allowance for doubtful accounts. The Company reserves for an account when it is considered to be uncollectible. The Company estimates its allowance for doubtful accounts based on historical experience, aging of accounts receivable and information regarding the creditworthiness of its customers. To date, losses have been within the range of management's expectations. If the estimated allowance for doubtful accounts subsequently proves to be insufficient, additional allowances may be required.
The Company's allowance for doubtful accounts activity consists of the following:
| |
Balance at Beginning of Period |
Changes to Cost and Expense |
Write-offs | Balance at End of Period |
|||||||||
|---|---|---|---|---|---|---|---|---|---|---|---|---|---|
Allowance for doubtful accounts at September 30, 2008 |
$ | 1,108 | $ | 4,500 | $ | — | $ | 5,608 | |||||
Allowance for doubtful accounts at September 30, 2009 |
5,608 | 169 | (2,371 | ) | 3,406 | ||||||||
Allowance for doubtful accounts at September 30, 2010 |
3,406 | 605 | — | 4,011 | |||||||||
Inventories
The Company's inventory is comprised solely of finished goods. Inventories are stated at the lower of weighted-average cost or market. In-bound freight-related costs are included as part of the cost of inventory held for resale. The Company records provisions, as appropriate, to write-down excess and obsolete inventory to estimated net realizable value. The process for evaluating excess and obsolete inventory often requires the Company to make subjective judgments and estimates concerning future sales levels, quantities and prices at which such inventories will be able to be sold in the normal course of business.
Incorrect estimates of future sales may cause the actual results to differ from the estimates at the time such inventories are disposed or sold.
During the years ended September 30, 2009 and 2010, the Company maintained approximately 22% and 20%, respectively, of its inventory in parts that are primarily used in Boeing 787 aircraft. To date, Boeing has experienced a number of delays in completion of this aircraft. As such, there is a risk that the Company will not be able to realize some portion of this investment.
Property and Equipment
Property and equipment are stated at cost, less accumulated amortization and depreciation, computed using the straight-line method over the estimated useful life of each asset. Leasehold improvements are amortized over the lesser of the remaining lease term or the estimated useful life of
F-8
Wesco Aircraft Holdings, Inc. & Subsidiaries
Notes to the Consolidated Financial Statements (Continued)
(In thousands, except share and per share data)
Note 2. Summary of Significant Accounting Policies (Continued)
the assets. Expenditures for repair and maintenance costs are expensed as incurred, and expenditures for major renewals and improvements are capitalized. When assets are retired or otherwise disposed of, the cost and accumulated depreciation and amortization are removed from the accounts and any gain or loss is reflected in the Company's consolidated statements of operations. The useful lives and lease terms for depreciable assets are as follows:
| Leasehold improvements | 3 - 15 years | |
| Machinery and equipment | 5 - 7 years | |
| Furniture and fixtures | 7 years | |
| Vehicles | 5 years | |
| Computer & Software | 3 - 5 years |
Impairment of Long Lived Assets
The Company assesses potential impairments of its long-lived assets in accordance with the provisions of ASC 360, Property, Plant, and Equipment. An impairment review is performed whenever events or changes in circumstances indicate that the carrying value of the assets may not be recoverable. Factors considered by the Company include, but are not limited to: significant underperformance relative to expected historical or projected future operating results; significant changes in the manner of use of the acquired assets or the strategy for the overall business; and significant negative industry or economic trends. The Company has determined that its asset group for impairment testing is comprised of the assets and liabilities of each of its reporting units as this is the lowest level of identifiable cash flows. The Company has identified customer relationships as the primary asset because it is the principle asset from which the reporting units derive their cash flow generating capacity and has the longest remaining useful life. The recoverability is assessed by comparing the carrying value of the assets group to the undiscounted cash flows expected to be generated by these assets. Impairment losses are measured as the amount by which the carrying values of the primary assets exceed their fair values. To date, the Company has not recognized an impairment charge related to the write-down of long-lived assets.
Deferred Financing Costs
Deferred financing costs are amortized using the effective interest method over the term of the related credit arrangement and are included in interest expense in the consolidated statement of operations. Amortization of deferred financing costs was $3,379, $3,703 and $4,814, respectively, for the years ended September 30, 2008, 2009 and 2010. At September 30, 2009 and September 30, 2010, accumulated amortization of deferred financing cost amounted to $10,695 and $15,509, respectively.
Goodwill and Indefinite-Lived Intangible Assets
Goodwill represents the excess of the purchase price of the acquired businesses over the fair value of the assets acquired and liabilities assumed resulting from the acquisition. In accordance with the provisions of ASC 350, Intangibles—Goodwill and Other, goodwill and indefinitely lived intangible assets acquired in a purchase business combination are not amortized, but instead tested for impairment at least annually or more frequently should an event occur or circumstances indicate that the carrying amount may be impaired. Such events or circumstances may be a significant change in business climate,
F-9
Wesco Aircraft Holdings, Inc. & Subsidiaries
Notes to the Consolidated Financial Statements (Continued)
(In thousands, except share and per share data)
Note 2. Summary of Significant Accounting Policies (Continued)
economic and industry trends, legal factors, negative operating performance indicators, significant competition, changes in strategy or disposition of a reporting unit or a portion there of. Goodwill impairment testing is performed at the reporting unit level on July 1st of each year.
Goodwill impairment testing is a two-step test. The first step identifies potential impairment by comparing the fair value of a reporting unit with its carrying amount, including goodwill. If the fair value exceeds its carrying amount, goodwill is not considered impaired and the second step of the test is unnecessary. If the carrying amount of a reporting unit's goodwill exceeds its fair value, the second step measures the impairment loss, if any. The second step compares the implied fair value of goodwill with the carrying amount of that goodwill. The implied fair value of goodwill is determined in the same manner as the amount of goodwill recognized in a business combination. If the carrying amount of goodwill exceeds the implied fair value of that goodwill, an impairment loss is recognized in an amount equal to that excess.
Application of the goodwill impairment test requires judgment, including the identification of reporting units assignment of assets and liabilities to reporting units, assignment of goodwill to reporting units, and determination of the fair value of each reporting unit. The fair value of each reporting unit is estimated using a combination of market earnings multiples and discounted cash flow methodologies. This requires significant judgments including estimation of future cash flows, which is dependent on internal forecasts, estimation of the long-term rate of growth of the Company's business, the useful life over which cash flows will occur and determination of the Company's weighted average cost of capital. Changes in these estimates and assumptions could materially affect the determination of fair value and/or goodwill impairment for each reporting unit.
Intangible assets with indefinite useful lives are not amortized but tested annually on July 1st for impairment or more often if events or circumstances change that would create a triggering event. The Company has one indefinite-lived intangible asset, its trademark. The valuation of the trademark was derived from an income approach by which the relief from royalty method was applied valuing the savings as cash flow. The relief from royalty method requires assumptions to be made concerning forecasted net sales, a discount rate, and a royalty rate. The underlying concept of the relief from a royalty method is that the value of the trademark can be estimated by determining the cost savings the Company achieves by not having to license the trademark. Changes in projections or estimates, a deterioration of operating results and the related cash flow effect or a significant increase in the discount rate or decrease is the royalty rate could decrease the estimated fair value and result in impairments.
During the year ended September 30, 2009 and September 30, 2010, the decrease in goodwill was due to foreign currency translation effect of $1,178 and $1,225, respectively.
Lease Receivable
Lease receivable comprises direct-financing lease and maintenance arrangements for tools leased to various customers. These agreements typically have terms of five years and are generally collateralized by a security interest in the underlying assets. The current portion of lease receivables is approximately $2,047 and $1,631 at September 30, 2009 and 2010, respectively, and recorded in prepaid expenses and other current assets. The non-current portion is approximately $3,076 and $1,187 at
F-10
Wesco Aircraft Holdings, Inc. & Subsidiaries
Notes to the Consolidated Financial Statements (Continued)
(In thousands, except share and per share data)
Note 2. Summary of Significant Accounting Policies (Continued)
September 30, 2009 and 2010, respectively, and is recorded in other assets in the consolidated balance sheets.
Fair Value of Financial Instruments
The Company's financial instruments consist of cash and cash equivalents, accounts receivable and payable, accrued and other current liabilities and line of credit. The carrying amounts of these instruments approximate fair value because of their short-term maturities. The fair value of the long-term debt instruments are determined using current applicable rates for similar instruments as of the balance sheet date. The carrying amounts and fair value of the debt instruments as of September 30, 2010 were as follows:
| |
Carrying Value | Fair Value | |||||
|---|---|---|---|---|---|---|---|
$550,000 term loan |
$ | 477,243 | $ | 467,064 | |||
$150,000 term loan |
$ | 143,000 | $ | 139,924 | |||
Comprehensive Income
ASC 220, Comprehensive Income, establishes guidelines for the reporting and display of comprehensive income and its components in financial statements. Comprehensive income generally represents all changes in stockholders' equity, except those resulting from investments by or distributions to stockholders. The Company's comprehensive income includes foreign currency translation adjustments and is included in the consolidated statements of stockholders' equity and comprehensive income.
Revenue Recognition
The Company recognizes hardware and service revenue when (i) persuasive evidence of an arrangement exists, (ii) title transfers to the customer, (iii) the sales price charged is fixed or determinable and (iv) collection is reasonably assured.
In connection with the sales of its products, the Company often provides certain supply chain management programs. These services are provided exclusively in connection with the sales of products, and as such, the price of such services is generally included in the price of the products delivered to the customer. The Company does not account for these services as a separate element, as the services do not have stand-alone value and cannot be separated from the product element of the arrangement. Additionally, the Company does not present service revenues apart from product revenues, as the service fees represent less than 5% of the Company's consolidated net sales. There are no significant post-delivery obligations associated with these services.
The Company also enters into sales rebates and profit sharing arrangements. Such customer incentives are accounted for as a reduction to gross sales and recorded based upon estimates at the time products are sold. These estimates are based upon historical experience for similar programs and products. The Company reviews such rebates and profit sharing arrangements on an ongoing basis and accruals are adjusted, if necessary, as additional information becomes available.
F-11
Wesco Aircraft Holdings, Inc. & Subsidiaries
Notes to the Consolidated Financial Statements (Continued)
(In thousands, except share and per share data)
Note 2. Summary of Significant Accounting Policies (Continued)
Management provides allowances for credit losses and returns based on historic experience and adjusts such allowances as considered necessary. To date, such allowances have been within the range of management's expectations.
In connection with the Company's JIT supply chain management programs, the Company at times assumes customer inventory on a consignment basis. This consigned inventory remains the property of the customer but is managed and distributed by the Company. The Company earns a fixed fee per unit on each shipment of the consigned inventory; such amounts represent less than 1% of consolidated revenues.
The Company leases certain equipment under its tool leasing program. Such arrangements represent direct-financing leases under which the Company recognizes revenue over the lease term using consistent rates of return. Since the revenue earned under these leasing arrangements represents less than 1% of the Company's consolidated revenues, the sales earned from such arrangements are included in net sales within the consolidated statements of income and are not presented separately as financing income.
Shipping and Handling Costs
The Company records revenue for shipping and handling billed to its customers. Shipping and handling revenues were approximately $2,080, $1,418 and $1,031 for the years ended September 30, 2008, 2009 and 2010, respectively.
Shipping and handling costs are included in cost of sales. Total shipping and handling costs were approximately $3,752, $4,033 and $4,009 for the years ended September 30, 2008, 2009 and 2010, respectively.
Income Taxes
The Company accounts for income taxes in accordance with ASC 740, Income Taxes. ASC 740 requires the recognition of deferred tax liabilities and assets for the expected future tax consequences of temporary differences between the carrying amounts and the tax bases of assets and liabilities. Deferred income tax assets and liabilities are measured using enacted tax rates expected to apply to taxable income in the years in which these temporary differences are expected to be recovered or settled. The effect on deferred tax assets and liabilities of a change in tax rates is recognized in income in the period that includes the enactment date. A valuation allowance is established, when necessary, to reduce net deferred tax assets to the amount expected to be realized. The Company's foreign subsidiaries are taxed in local jurisdictions at local statutory rates. The Company intends to reinvest all earnings of foreign subsidiaries.
Concentration of Credit Risk and Significant Vendors
The Company maintains its cash and cash equivalents in bank deposit accounts which, at times, may exceed federally insured limits. The Company has not experienced any losses in such accounts and does not believe it is exposed to any significant credit risk from cash and cash equivalents.
F-12
Wesco Aircraft Holdings, Inc. & Subsidiaries
Notes to the Consolidated Financial Statements (Continued)
(In thousands, except share and per share data)
Note 2. Summary of Significant Accounting Policies (Continued)
The Company purchases its products on credit terms from vendors located throughout North America and Europe. For the years ended September 30, 2008, 2009 and 2010, the Company made approximately 12%, 13% and 22%, respectively, of its purchases from Precision Castparts Corporation and the amounts payable to this vendor was approximately 10% and 17% of accounts payable at September 30, 2009 and 2010, respectively. Additionally, for the years ended September 30, 2008, 2009 and 2010, the Company made approximately 18%, 19% and 20% respectively, of its purchases from Alcoa Fastening Systems and the amounts payable to this vendor were approximately 12% and 18% of amounts payable at September 30, 2009 and 2010, respectively. The majority of the products the Company sells are available through multiple channels and, therefore, the Company does not consider that its risk related to any vendor relationship is material.
For the years ending September 30, 2008, 2009 and 2010, the Company derived approximately 10%, 11% and 15%, respectively, of its recorded sales from The Boeing Company and the accounts receivable balance associated with this customer was approximately 6% and 11% at September 30, 2009 and 2010, respectively.
Foreign Currency Translation
The financial statements of the foreign subsidiaries are translated into U.S. Dollars in accordance with ASC 830, Foreign Currency Matters. The financial statements of foreign subsidiaries and affiliates where the local currency is the functional currency are translated into U.S. Dollars using exchange rates in effect at the year-end for assets and liabilities and average exchange rates during the year for results of operations. The adjustment resulting from translating the financial statements of such foreign subsidiaries is reflected as a separate component of stockholders' equity. Foreign currency transaction gains and losses are reported as other income (expense), net in the consolidated statements of income. For the years ended September 30, 2008, 2009 and 2010, foreign currency transaction gains and (losses) were approximately $610, $(486) and $(651), respectively.
Stock-Based Compensation
The Company accounts for stock-based compensation in accordance with ASC 718, Compensation—Stock Compensation. ASC 718 requires all stock-based awards to employees and directors to be recognized as stock-based compensation expense based upon their fair values on the date of grant. In March 2005, the Securities Exchange Commission ("SEC") issued Staff Accounting Bulletin ("SAB") No. 107, Share-Based Payment, which provides guidance regarding the interaction of ASC 718 and certain SEC rules and regulations. The Company has applied the provision of SAB No. 107 in its adoption of ASC 718.
ASC 718 requires companies to estimate the fair value of stock-based payment awards on the date of grant using an option-pricing model. The value of the portion of the award that is ultimately expected to vest is recognized as an expense during the requisite service periods. The Company has estimated the fair value for each award as of the date of grant using the Black-Scholes option pricing model. The Black-Scholes model considers, among other factors, the expected life of the award and the expected volatility of the Company's stock price. The Company recognizes the stock-based compensation expense using the graded vesting method over the requisite service periods, which is generally a vesting term of 5 years. Stock options typically have a term of 10 years. The stock options
F-13
Wesco Aircraft Holdings, Inc. & Subsidiaries
Notes to the Consolidated Financial Statements (Continued)
(In thousands, except share and per share data)
Note 2. Summary of Significant Accounting Policies (Continued)
granted had an exercise price equal to the estimated fair value of the Company's common stock on the grant date.
Net Income Per Share
Basic net income per share is computed by dividing net income available to common stockholders by the weighted average number of common shares outstanding during the period. At September 30, 2008, 2009 and 2010, 412,394, 595,051 and 219,107 shares, respectively, of restricted stock and stock options issued to employees were unvested and, therefore, excluded from the calculation of basic earnings per share for each of the fiscal years ended on those dates. Diluted net income per share includes the dilutive effect of both outstanding stock options and restricted shares, calculated using the treasury stock method. Assumed proceeds from the in-the-money options include the windfall tax benefits, net of shortfalls, calculated under the "as-if" method as prescribed by ASC 718.
| |
September 30, | |||||||||
|---|---|---|---|---|---|---|---|---|---|---|
| |
2008 | 2009 | 2010 | |||||||
| |
(In thousands, except share and per share data) |
|||||||||
Net income |
$ | 58,602 | $ | 58,447 | $ | 73,674 | ||||
Basic weighted average shares outstanding |
9,420,433 | 9,440,596 | 10,063,237 | |||||||
Dilutive effect of stock options and restricted stock awards/units |
319,725 | 524,152 | 55,411 | |||||||
Diluted weighted average shares outstanding |
9,740,158 | 9,964,748 | 10,118,648 | |||||||
Basic net income per share |
$ | 6.22 | $ | 6.19 | $ | 7.32 | ||||
Diluted net income per share |
$ | 6.02 | $ | 5.87 | $ | 7.28 | ||||
Shares of common stock equivalents of 18,489, 76,188 and 61,325 for fiscal 2008, 2009 and 2010, respectively, were excluded from the diluted calculation due to their anti-dilutive effect.
Note 3. Recent Accounting Pronouncements
Changes to accounting principles generally accepted in the United States of America ("U.S. GAAP") are established by the Financial Accounting Standards Board ("FASB") in the form of Accounting Standards Updates ("ASUs") to the FASB's ASC.
The Company considers the applicability and impact of all ASUs. ASUs not listed below were assessed and determined to be either not applicable or are expected to have minimal impact on the Company's consolidated financial position and results of operations.
In October 2009, the FASB issued guidance on revenue arrangements with multiple deliverables effective for the Company's 2012 fiscal year, although early adoption is permitted. The guidance revises the criteria for separating, measuring and allocating arrangement consideration to each deliverable in a multiple element arrangement. The guidance requires companies to allocate revenue using the relative selling price of each deliverable, which must be estimated if the Company does not have a history of
F-14
Wesco Aircraft Holdings, Inc. & Subsidiaries
Notes to the Consolidated Financial Statements (Continued)
(In thousands, except share and per share data)
Note 3. Recent Accounting Pronouncements (Continued)
selling the deliverable on a stand-alone basis or third-party evidence of selling price. The Company does not believe that the adoption of this guidance will significantly change the timing in which revenue is recorded as the pricing of its service components are included in the per unit price of the products delivered to the customer that is solely contingent on the number of units sold. As a result, the revenue earned on the service element does not become fixed or determinable until delivery of the product has taken place.
In June 2009, the FASB issued guidance to revise the approach to determine when a variable interest entity ("VIE") should be consolidated. The new consolidation model for VIEs considers whether the Company has the power to direct the activities that most significantly impact the VIE's economic performance and shares in the significant risks and rewards of the entity. The guidance on VIEs requires companies to continually reassess VIEs to determine if consolidation is appropriate and provide additional disclosures. The guidance is effective for the Company's 2011 fiscal year. The Company is assessing the potential effect of this guidance will have on its financial statements.
In January 2010, the FASB issued guidance that revised two disclosure requirements concerning fair value measurements and clarifies two others. It requires separate presentation of significant transfers into and out of Levels 1 and 2 of the fair value hierarchy and disclosure of the reasons for such transfers. It will also require the presentation of purchases, sales, issuances and settlements within Level 3 on a gross basis rather than a net basis. The guidance also clarifies that disclosures should be disaggregated by class of asset or liability and that disclosures about inputs and valuation techniques should be provided for both recurring and non-recurring fair value measurements. These new disclosure requirements will become effective for the Company's financial statements for the period ended September 30, 2011, except for the requirement concerning gross presentation of Level 3 activity, which will become effective for fiscal years beginning after December 15, 2010. Since this guidance is only related to financial statement disclosures, there will be no impact to the Company's financial results as a result of the adoption of this guidance.
Note 4. Related Party Transactions
The Company entered into a management agreement with The Carlyle Group to provide certain financial, strategic advisory and consultancy services. Under this management agreement, the Company is obligated to pay The Carlyle Group, or a designee thereof, an annual management fee of $1,000 plus fees and expenses associated with company-related meetings. The Company incurred expense of approximately $1,202, $1,008 and $1,070 for the years ended September 30, 2008, 2009 and 2010, respectively, related to this management agreement. These amounts were paid to The Carlyle Group during the years ended September 30, 2008, 2009 and 2010.
The Company leases several office and warehouse facilities under operating lease agreements from entities controlled by the Company's CEO. Rent expense on these facilities was approximately $1,688, $1,689 and $1,709 for the years ended September 30, 2008, 2009 and 2010, respectively (see Note 14).
On June 30, 2008, the Company's CEO purchased $50,000 of the total debt outstanding. For the years ended September 30, 2008, 2009 and 2010, total interest paid to the minority stockholder related to the debt was approximately $647, $1,635 and $1,222, respectively.
F-15
Wesco Aircraft Holdings, Inc. & Subsidiaries
Notes to the Consolidated Financial Statements (Continued)
(In thousands, except share and per share data)
Note 5. Property and Equipment, net
Property and equipment, net, consist of the following:
| |
2009 | 2010 | ||||||
|---|---|---|---|---|---|---|---|---|
Leasehold improvements |
$ | 9,516 | $ | 9,775 | ||||
Machinery and equipment |
9,148 | 11,403 | ||||||
Vehicles |
695 | 713 | ||||||
Computer and software |
7,528 | 9,485 | ||||||
Furniture and fixtures |
2,782 | 2,453 | ||||||
Construction in progress |
175 | — | ||||||
|
29,844 | 33,829 | ||||||
Less: accumulated depreciation and amortization |
(9,283 | ) | (13,656 | ) | ||||
Property and equipment, net |
$ | 20,561 | $ | 20,173 | ||||
At September 30, 2009 and 2010, property and equipment included assets of approximately $3,927 and $5,196, respectively, acquired under capital lease arrangements. Accumulated amortization of assets acquired under capital leases was approximately $1,080 and $2,237 as of September 30, 2009 and 2010, respectively.
Depreciation and amortization expense for property and equipment was approximately $4,455, $4,302 and $4,702 during the years ended September 30, 2008, 2009 and 2010, respectively (including amortization expense of approximately $1,337, $2,158 and $1,157 on assets acquired under capital leases for 2008, 2009 and 2010, respectively).
Note 6. Intangible Assets, net
As of September 30, 2009 and 2010, the gross amounts and accumulated amortization of intangible assets is as follows:
| |
2009 | 2010 | ||||||||||||
|---|---|---|---|---|---|---|---|---|---|---|---|---|---|---|
| |
Gross Amount |
Accumulated Amortization |
Gross Amount |
Accumulated Amortization |
||||||||||
Customer relationships (12 to 20 year life) |
$ | 65,962 | $ | (9,599 | ) | $ | 64,560 | $ | (12,832 | ) | ||||
Trademarks (5 years to indefinite life) |
39,332 | (1,500 | ) | 39,332 | (1,500 | ) | ||||||||
Backlog (2 year life) |
1,150 | (719 | ) | 1,150 | (1,150 | ) | ||||||||
Non-compete agreements (4 year life) |
1,000 | (312 | ) | 1,000 | (562 | ) | ||||||||
Total intangible assets |
$ | 107,444 | $ | (12,130 | ) | $ | 106,042 | $ | (16,044 | ) | ||||
F-16
Wesco Aircraft Holdings, Inc. & Subsidiaries
Notes to the Consolidated Financial Statements (Continued)
(In thousands, except share and per share data)
Note 6. Intangible Assets, net (Continued)
Estimated future amortization expense at September 30, 2010 is as follows:
2011 |
$ | 3,763 | ||
2012 |
3,701 | |||
2013 |
3,513 | |||
2014 |
3,513 | |||
2015 |
3,513 | |||
Thereafter |
35,285 | |||
|
$ | 53,288 | ||
In addition to its amortizing intangibles, the Company assigned an indefinite life to the Wesco Aircraft trademark. As of September 30, 2010, the trademark had a carrying value of $37,832. Amortization expense included in the accompanying statements of operations for the years ended September 30, 2008, 2009 and 2010 was $3,391, $5,763 and $4,119, respectively.
Note 7. Accrued Expenses and Other Current Liabilities
Accrued expenses and other current liabilities consist of the following:
| |
2009 | 2010 | ||||||
|---|---|---|---|---|---|---|---|---|
Accrued compensation and related expenses |
$ | 4,610 | $ | 8,392 | ||||
Accrual for commissions |
933 | 956 | ||||||
Accrued professional fees |
626 | 778 | ||||||
Fair value of the interest rate swap |
4,102 | 6,660 | ||||||
Unearned revenue |
867 | 633 | ||||||
Accrued customer rebates |
1,631 | 2,146 | ||||||
Accrued taxes (property, sales and use) |
582 | 954 | ||||||
Accrued interest |
216 | 76 | ||||||
Other accruals |
632 | 293 | ||||||
Accrued expenses and other current liabilities |
$ | 14,199 | $ | 20,888 | ||||
Note 8. Derivative Financial Instruments
The Company entered into an interest rate swap arrangement in order to manage its net exposure to interest rate changes on the Company's long-term debt. Interest rate swap contracts involve the exchange of floating rate interest payment obligations for fixed interest rate payments without the exchange of the underlying principal amounts. The Company accounts for this arrangement pursuant to the provisions of ASC 815, Derivatives and Hedging. ASC 815 establishes accounting and reporting standards requiring that every derivative instrument be recorded in the balance sheet as either an asset or liability measured at fair value and that any changes in fair value be recognized currently in earnings unless specific hedge accounting criteria are met. The Company's interest rate swap arrangement is not designated as a hedge pursuant to ASC 815 and, accordingly, the Company reflects the change in fair value of the interest rate swap in the consolidated statements of operations as part of interest expense.
F-17
Wesco Aircraft Holdings, Inc. & Subsidiaries
Notes to the Consolidated Financial Statements (Continued)
(In thousands, except share and per share data)
Note 8. Derivative Financial Instruments (Continued)
These arrangements also contain an element of risk in that the counterparties may be unable to meet the terms of such arrangements. In the event the parties required to deliver commitments are unable to fulfill their obligations, the Company could potentially incur significant additional costs by replacing the positions at then current market rates. The Company manages its risk of exposure by limiting counterparties to those banks and institutions deemed appropriate by management. The Company considers its own risk of non-performance to be limited. Upon the maturity of its previous interest rate swaps, the Company entered into two interest rate swaps arrangements, which expire in February and June 2012. Each interest rate swap converts the interest rate on approximately $200,000 (notional amount) of its outstanding debt from variable rates to a fixed interest rate. The swap agreements have fixed the LIBOR component of the term debt to interest rates of 1.77% and 1.96%.
The following table includes the notional amounts and fair value of derivative financial instruments as of September 30, 2009 and September 30, 2010:
| |
September 30, 2009 | September 30, 2010 | |||||||||||
|---|---|---|---|---|---|---|---|---|---|---|---|---|---|
| |
Notional Amount |
Fair Value | Notional Amount |
Fair Value | |||||||||
Swap contracts |
$ | 400,000 | $ | (4,102 | ) | $ | 400,000 | $ | (6,660 | ) | |||
During the years ended September 30, 2008, 2009 and 2010, the Company recorded losses in the amount of $0, $4,102 and $2,558, respectively, as a result of changes in fair value of derivative financial instruments. These losses are recorded as a component of interest expense.
Note 9. Fair Value of Financial Instruments
Fair value is the price that would be received to sell an asset or paid to transfer a liability in an orderly transaction between market participants at the measurement date. To determine fair value, the Company primarily utilizes reported market transactions and discounted cash flow analyses. On October 1, 2008, the Company adopted the FASB's new fair value model that establishes a fair value hierarchy that maximizes the use of observable inputs and minimizes the use of unobservable inputs. Observable inputs are inputs that reflect the assumptions market participants would use in pricing the asset or liability developed based on market data obtained from sources independent of the reporting entity. Unobservable inputs are inputs that reflect the reporting entity's own assumptions about the assumptions market participants would use in pricing the asset or liability developed based on the best information available in the circumstances. The fair value hierarchy prioritizes the inputs to valuation techniques into three broad levels whereby the highest priority is given to Level 1 inputs and the lowest to Level 3 inputs. The three broad categories are:
| Level 1: | Quoted prices in active markets for identical assets or liabilities. | |
Level 2: |
Inputs other than quoted prices that are observable for the asset or liability, either directly or indirectly. |
|
Level 3: |
Unobservable inputs for the asset or liability. |
The Company makes use of observable market-based inputs to calculate fair value, in which case the measurements are classified within Level 2. If quoted or observable market prices are not available,
F-18
Wesco Aircraft Holdings, Inc. & Subsidiaries
Notes to the Consolidated Financial Statements (Continued)
(In thousands, except share and per share data)
Note 9. Fair Value of Financial Instruments (Continued)
fair value is based upon internally developed models that use, where possible, current market-based parameters such as interest rates, yield curves and currency rates. These measurements are classified within Level 3.
Fair value measurements are classified according to the lowest level input or value-driver that is significant to the valuation. A measurement may therefore be classified within Level 3 even though there may be significant inputs that are readily observable.
The guidance on fair value measurements expanded the definition of fair value to include the consideration of nonperformance risk. Nonperformance risk refers to the risk that an obligation (either by a counterparty or us) will not be fulfilled. For financial assets traded in an active market (Level 1), the nonperformance risk is included in the market price. For certain other financial assets and liabilities (Level 2 and 3), the Company's fair value calculations have been adjusted accordingly.
Where available, the Company utilizes quoted market prices or observable inputs rather than unobservable inputs to determine fair value.
The valuation techniques used and key assumptions made to estimate the fair value of financial instruments measured at fair value are:
Derivative Financial Instruments
Exchange-traded derivative financial instruments are valued based on quoted market prices and classified within Level 1 of the valuation hierarchy. Derivative financial instruments that are traded on an index are valued based on direct or indirect prices and classified within Level 2 of the valuation hierarchy. If quoted market prices or other observable inputs are not available, fair value is based on unobservable inputs and classified within Level 3 of the fair value hierarchy.
The following tables set forth assets and liabilities measured at fair value as of September 30, 2009 and 2010, categorized by input level within the fair value hierarchy:
| |
Fair Value Measurements Using | ||||||||||
|---|---|---|---|---|---|---|---|---|---|---|---|
| |
Quoted Prices in Active Markets |
Significant Other Observable Inputs |
Significant Unobservable Inputs |
||||||||
| |
Level 1 | Level 2 | Level 3 | ||||||||
September 30, 2009 |
|||||||||||
Financial instruments measured at fair value on a recurring basis |
|||||||||||
Derivative financial instruments |
— | $ | (4,102 | ) | — | ||||||
| |
Level 1 | Level 2 | Level 3 | ||||||||
|---|---|---|---|---|---|---|---|---|---|---|---|
September 30, 2010 |
|||||||||||
Financial instruments measured at fair value on a recurring basis |
|||||||||||
Derivative financial instruments |
— | $ | (6,660 | ) | — | ||||||
F-19
Wesco Aircraft Holdings, Inc. & Subsidiaries
Notes to the Consolidated Financial Statements (Continued)
(In thousands, except share and per share data)
Note 9. Fair Value of Financial Instruments (Continued)
The fair value of our derivative financial instruments was estimated using the net present value of a series of cash flows on both the cap and floor components of the interest rate collars. These cash flows were based on yield curves that take into account the contractual terms of the derivatives, including the period to maturity and market-based parameters such as interest rates and volatility. The Company incorporates nonperformance risk by adjusting the present value of each liability position utilizing an estimation of its credit risk.
F-20
Wesco Aircraft Holdings, Inc. & Subsidiaries
Notes to the Consolidated Financial Statements (Continued)
(In thousands, except share and per share data)
Note 10. Long-Term Debt
Long-term debt consists of the following at:
| |
September 30, | |||||||
|---|---|---|---|---|---|---|---|---|
| |
2009 | 2010 | ||||||
$550,000 term loan, bearing interest based on Alternate Base Rate ("ABR") (defined as Prime Rate plus the applicable margin rate of 1.25%) or Eurodollar (defined as London Inter-Bank Offer Rate ("LIBOR") rates plus the applicable margin rate of 2.25%), at the option of the Company. The term loan is payable quarterly equal to 0.25% of the principal amount of $550,000 with the final payment due on September 29, 2013. Interest rate was 2.51% at September 30, 2010. |
$ | 537,625 | $ | 477,243 | ||||
$150,000 term loan, bearing interest based on ABR (defined as Prime Rate plus the applicable margin rate of 4.75%) or Eurodollar rate (defined as LIBOR rates plus an applicable margin rate of 5.75%), at the option of the Company. The entire balance is due on March 28, 2014. Interest rate was 6.01% at September 30, 2010. |
150,000 |
143,000 |
||||||
|
687,625 | 620,243 | ||||||
Less: current portion |
(5,528 | ) | — | |||||
Long-term debt |
$ | 682,097 | $ | 620,243 | ||||
Aggregate maturities of long-term debt as of September 30, 2010 are as follows:
Years Ended September 30, |
||||
2011 |
$ | — | ||
2012 |
— | |||
2013 |
477,243 | |||
2014 |
143,000 | |||
|
$ | 620,243 | ||
During year ended September 30, 2010, the Company made prepayments totaling approximately $61,854, exclusive of contractually scheduled payments, on its $550,000 and $150,000 term loans. In accordance with the loan agreement, $61,854 was applied to the Company's regular quarterly payments of $1,382 in 2011, 2012 and 2013, with the excess applied to the Company's balloon payment. As of September 30, 2010, the Company had prepaid all required quarterly payments.
As part of the loan agreement, the Company had a $75,000 revolving line of credit that expires on September 28, 2012. The applicable margin for the revolving facility is determined based on the ratio of the Company's EBITDA, as defined in the loan agreement, for the most recently ended four fiscal quarters and ranges between 0.75% and 1.50% for the ABR Loans and range between 1.75% and 2.50% for the Eurodollar Loans. There was no outstanding borrowing under this line of credit as of September 30, 2010 or at any point during fiscal year 2010. Annual commitment fees for this line of credit approximate $281.
F-21
Wesco Aircraft Holdings, Inc. & Subsidiaries
Notes to the Consolidated Financial Statements (Continued)
(In thousands, except share and per share data)
Note 10. Long-Term Debt (Continued)
In October 2008, the administrative and collateral agent under the Company's revolving line of credit, Lehman Commercial Paper Inc. ("LCPI"), filed for bankruptcy. LCPI is a lender under the Company's revolving credit facility with a commitment of approximately $20,000. As a result of LCPI's actions, the Company's availability to access these funds is at risk. The Company does not expect that LCPI's potential inability to fund this commitment would have a material adverse impact on its liquidity.
The Company's subsidiary, Wesco Aircraft Europe Limited, has available a £10,000 ($15,800 based on the September 30, 2010 exchange rate) line of credit that automatically renews annually on October 1. The line of credit bears interest based on the base rate plus an applicable margin of 1.15%. The net outstanding borrowing under this line of credit was £511 ($813) and zero as of September 30, 2009 and 2010, respectively.
Under the terms and definitions of the credit agreements, the Company is required to maintain a net debt-to-EBITDA ratio not to exceed 4.5, an EBITDA-to-net interest expense ratio greater than 2.25, and capital expenditures not to exceed $10,000 per year. The credit agreement also restricts the Company from incurring certain additional indebtedness, payment of dividends and sale of substantial assets, and limits certain investments. The Company was in compliance with these covenants at September 30, 2010.
Borrowings under these credit facilities are collateralized by all of the assets of the Company.
Note 11. Income Taxes
Income before provision for income taxes for the years ended September 30, 2008, 2009 and 2010 included the following:
| |
2008 | 2009 | 2010 | ||||||||
|---|---|---|---|---|---|---|---|---|---|---|---|
U.S. income |
$ | 88,978 | $ | 81,446 | $ | 108,846 | |||||
Foreign income |
13,875 | 14,863 | 8,741 | ||||||||
Total |
$ | 102,853 | $ | 96,309 | $ | 117,587 | |||||
F-22
Wesco Aircraft Holdings, Inc. & Subsidiaries
Notes to the Consolidated Financial Statements (Continued)
(In thousands, except share and per share data)
Note 11. Income Taxes (Continued)
The components of the Company's income tax provision for the years ended September 30, 2008, 2009 and 2010 are as follows:
| |
2008 | 2009 | 2010 | |||||||||
|---|---|---|---|---|---|---|---|---|---|---|---|---|
Current provision |
||||||||||||
Federal |
$ | 27,262 | $ | 12,228 | $ | 28,692 | ||||||
State and local |
5,440 | 4,808 | 4,724 | |||||||||
Foreign |
7,700 | 6,789 | 3,755 | |||||||||
Subtotal |
40,402 | 23,825 | 37,171 | |||||||||
Deferred provision (benefit) |
||||||||||||
Federal |
3,177 | 12,313 | 5,415 | |||||||||
State and local |
670 | 1,776 | 1,336 | |||||||||
Foreign |
2 | (52 | ) | (9 | ) | |||||||
Subtotal |
3,849 | 14,037 | 6,742 | |||||||||
Provision for income taxes |
$ | 44,251 | $ | 37,862 | $ | 43,913 | ||||||
Deferred income taxes reflect the tax effects of temporary differences between the carrying amounts of assets and liabilities for financial reporting purposes and the amounts used for income tax purposes.
The Company's deferred income tax assets consist of the following at September 30, 2009 and 2010:
| |
2009 | 2010 | ||||||
|---|---|---|---|---|---|---|---|---|
Deferred tax assets |
||||||||
Inventories |
$ | 9,759 | $ | 17,701 | ||||
Reserves and other accruals |
3,876 | 4,654 | ||||||
Compensation accruals |
9,923 | 10,783 | ||||||
Total deferred tax assets |
23,558 | 33,138 | ||||||
Deferred tax liabilities, net |
||||||||
Property and equipment |
(2,704 | ) | (3,442 | ) | ||||
Goodwill and intangible assets |
(9,637 | ) | (26,230 | ) | ||||
Stock options |
4,460 | 5,219 | ||||||
Deferred financing costs |
276 | 526 | ||||||
Total deferred tax liabilities, net |
(7,605 | ) | (23,927 | ) | ||||
Net deferred tax assets |
$ | 15,953 | $ | 9,211 | ||||
F-23
Wesco Aircraft Holdings, Inc. & Subsidiaries
Notes to the Consolidated Financial Statements (Continued)
(In thousands, except share and per share data)
Note 11. Income Taxes (Continued)
The following deferred tax balances are included in the consolidated balance sheets as of September 30, 2009 and 2010:
| |
2009 | 2010 | ||||||
|---|---|---|---|---|---|---|---|---|
Current deferred tax assets |
$ | 23,558 | $ | 33,138 | ||||
Non-current deferred tax liabilities |
(7,605 | ) | (23,927 | ) | ||||
Net deferred tax assets |
$ | 15,953 | $ | 9,211 | ||||
The Company believes its net deferred tax assets are more likely than not to be realized based on historical and projected taxable income levels.
The Company files income tax returns in the U.S. federal jurisdiction, various state jurisdictions, and various non-U.S. jurisdictions. The earliest tax year still subject to examination by a significant taxing jurisdiction is September 30, 2006.
The undistributed earnings of the Company's foreign subsidiaries, which amount to $29,384, are considered to be indefinitely reinvested. Accordingly, no provision for federal or state and local taxes or foreign withholding taxes has been provided on such undistributed earnings.
The Company adopted the provision of Accounting for Uncertainty in Income Taxes during the year ended September 30, 2008. As a result of adoption, the Company did not identify any material positions that would not meet the more likely than not recognition threshold. As of September 30, 2009 and September 30, 2010, there are no uncertain tax positions.
A reconciliation of the Company's provision for income taxes from applying the domestic federal statutory tax rate of 35% to actual income tax expense is as follows for the years ended September 30, 2008, 2009 and 2010:
| |
2008 | 2009 | 2010 | ||||||||||||||||
|---|---|---|---|---|---|---|---|---|---|---|---|---|---|---|---|---|---|---|---|
Provision for income taxes using the domestic federal statutory rate |
$ | 36,043 | 35.00 | % | $ | 33,543 | 35.00 | % | $ | 41,155 | 35.00 | % | |||||||
State taxes, net of tax benefit |
3,972 | 3.90 | 4,279 | 4.47 | 3,989 | 3.39 | |||||||||||||
Nondeductible items |
1,218 | 1.20 | 1,365 | 1.42 | 1,309 | 1.11 | |||||||||||||
Other |
3,563 | 3.50 | 26 | 0.03 | (704 | ) | (0.60 | ) | |||||||||||
Foreign income tax not taxed at the Federal rate |
1,455 | 1.40 | 1,405 | 1.47 | 572 | 0.45 | |||||||||||||
Foreign tax credit |
(2,000 | ) | (1.90 | ) | (2,756 | ) | (2.88 | ) | (2,408 | ) | (2.05 | ) | |||||||
Actual provision for income taxes |
$ | 44,251 | 43.10 | % | $ | 37,862 | 39.51 | % | $ | 43,913 | 37.30 | % | |||||||
Note 12. Stockholders' Equity
The various classes of stock differ primarily with respect to the voting and conversion rights. Only common stock—Class A shares have voting rights. Class B convertible redeemable common stock automatically converts to Class A common stock on a one-for-one basis immediately prior to a merger or consolidation of the Company in which the holders of the Class A common stock cease to hold
F-24
Wesco Aircraft Holdings, Inc. & Subsidiaries
Notes to the Consolidated Financial Statements (Continued)
(In thousands, except share and per share data)
Note 12. Stockholders' Equity (Continued)
more than 50% of the voting securities of the Company outstanding immediately prior to such transaction or upon the sale of substantially all the assets of the Company.
Note 13. Stock-Based and Other Compensation Arrangements
The Company's Equity Incentive Plan (the "Plan") provides for the issuance of stock options, restricted stock awards, and restricted stock units to certain employees, directors, and consultants to purchase shares of the Company's Class B convertible redeemable common stock. These awards are subject to call rights by the Company upon the occurrence of certain events, including employee separation. Awards that are called by the Company are valued at fair market value, as determined by the Company's Board of Directors. The aggregate number of shares that can be issued under this plan is 1,700,000 shares.
Additionally, the Company adopted a Stock Purchase Plan that provides an opportunity for key employees, directors and consultants to purchase shares of Class B convertible redeemable common stock. The aggregate number of shares that can be issued under this plan is 150,000 shares. Shares purchased under the plan are purchased at fair value on the date of purchase. As of September 30, 2010, 33,827 shares have been issued.
Stock Options
The Company's stock options typically vest over 5 years on the basis of continuous employment and financial performance of the Company, as further defined below. Of the total options granted, 25% are time-based options and 75% represent performance-based options. Vested shares are exercisable at any time until the earlier of a change in control or approximately 10 years from the date of the option grant. Certain vesting restrictions may apply in the year of change of control. The stock options granted had an exercise price equal to the estimated fair value of the Company's common stock on the grant date.
Continuous Employment Conditions
At September 30, 2010, the Company has outstanding 212,158 time-based stock options under the Plan, which will vest on the basis of continuous employment with the Company. Most of the time-based options vest in 20% increments over a period of 5 years. In case of a liquidity event, all the time-vesting options shall become fully vested and exercisable prior to the effective date of the first liquidity event. A liquidity event includes a sale, transfer or disposition of the equity securities of the Company held by all of the principal stockholders such that following such a transaction the total number of equity shares held by all of the principal stockholders is less than 30% of the total number of shares held at the effective date of acquisition of the Company, or a sale, transfer or other disposition of substantially all of the assets of the Company.
Performance Conditions
At September 30, 2010, the Company had outstanding 628,209 performance-based stock options (the "performance options") under the Plan to employees and directors. Most performance options vest in 20% increments over 5 years and become exercisable on the last day of each fiscal year, or
F-25
Wesco Aircraft Holdings, Inc. & Subsidiaries
Notes to the Consolidated Financial Statements (Continued)
(In thousands, except share and per share data)
Note 13. Stock-Based and Other Compensation Arrangements (Continued)
within 120 days after, if the following conditions are met: (i) if Bonus EBITDA for the applicable year equals or exceeds the financial results target for the applicable year, then 10% of the performance options shall become vested and exercisable; and (ii) if Bonus Cash Flow for the applicable year equals or exceeds the Bonus Cash Flow target for the applicable year, then the remaining 10% of the performance options shall become vested and exercisable.
If the Bonus EBITDA for the applicable year is less than the target set for the year but at least 90% of the Bonus EBITDA target through the end of such applicable year, then that portion of the performance options shall become exercisable on the last day of the fiscal year following the missed target year (the "Bonus EBITDA cumulative catch up year") or within 120 days thereafter if: (i) Bonus EBITDA equals or exceeds the Bonus EBITDA target for the cumulative catch up year and (ii) the cumulative Bonus EBITDA equals or exceeds the cumulative Bonus EBITDA target for the cumulative catch up year.
If the Bonus Cash Flow for the applicable year is less than the Bonus Cash Flow target for the year but at least 90% of the Bonus Cash Flow target through the end of such applicable year, then that portion of the performance options shall become exercisable on the last day of the fiscal year following the Bonus Cash Flow missed year (the "Bonus Cash Flow cumulative catch up year") or within 120 days thereafter if: (i) Bonus Cash Flow equals or exceeds the Bonus Cash Flow target for the Bonus Cash Flow cumulative catch up year and (ii) the cumulative Bonus Cash Flow equals or exceeds the cumulative Cash Flow target for the Bonus Cash Flow cumulative catch up year.
In case of a liquidity event, the following shall automatically become vested and exercisable in full prior to the effective date of such liquidity event: performance options that have not yet, as of such liquidity event, become eligible for yearly performance-based vesting, if and only if the cumulative Bonus EBITDA and the cumulative Bonus Cash Flow for the fiscal year in which liquidity event occurs equals or exceeds the cumulative Bonus EBITDA target and cumulative Bonus Cash Flow target for the fiscal year in which such liquidity event occurs.
The Board of Directors of the Company has the sole discretion to accelerate the vesting of any portion of the time or performance-based options, which otherwise does not vest pursuant to the Plan provisions.
During the year ended September 30, 2009, the Company's Bonus Cash Flows did not meet the performance condition targets necessary to entitle such awards to vest. The Bonus cash flow performance target was not waived by the Board of Directors which precluded the remaining performance based options to vest during fiscal year 2009. These unvested awards are subject to cumulative catch up provisions that will enable such awards to vest if the Company's cash flows during fiscal years 2010 and 2011 meet defined thresholds. The Company has determined that it is probable that this performance condition will be achieved and has not reduced the compensation expense recorded in the current year even though the vesting requirement was not met. During fiscal year 2010 the Company was deemed to have met the cumulative catch up provisions, which allowed such awards to vest.
F-26
Wesco Aircraft Holdings, Inc. & Subsidiaries
Notes to the Consolidated Financial Statements (Continued)
(In thousands, except share and per share data)
Note 13. Stock-Based and Other Compensation Arrangements (Continued)
During the year ended September 30, 2010, the Company did not meet the 2010 EBITDA target that was established for performance option vesting; however, the compensation committee determined that the failure to achieve the EBITDA target did not result from a lack of performance but rather from a change in overall market conditions that were beyond the control of the Company. Accordingly, the compensation committee allowed the EBITDA portion of the 2010 performance options to vest, effective as of September 30, 2010. The Company determined that this change constituted a stock option modification; however, since the awards were probable of vesting prior to the modification and did not affect any other terms of the awards other than accelerating vesting, no additional compensation expense was incurred.
The following table sets forth the summary of options activity under the plan for:
| |
Outstanding Options | ||||||||||||
|---|---|---|---|---|---|---|---|---|---|---|---|---|---|
| |
Number of Shares |
Weighted Average Exercise Price |
Weighted Average Remaining Contractual Life (in years) |
Aggregate Intrinsic Value(1) |
|||||||||
September 30, 2008 |
904,523 | $ | 37.52 | 8.1 | $ | 7,756,985 | |||||||
Granted |
65,574 | $ | 64.96 | ||||||||||
Exercised |
(437 | ) | 37.12 | ||||||||||
Forfeited options |
(116,386 | ) | 37.20 | ||||||||||
September 30, 2009 |
853,274 | $ | 39.77 | 7.3 | $ | 3,665,100 | |||||||
Granted |
7,557 | $ | 56.64 | ||||||||||
Forfeited options |
(20,464 | ) | 43.92 | ||||||||||
September 30, 2010 |
840,367 | $ | 39.41 | 6.3 | $ | 13,229,671 | |||||||
- (1)
- Aggregate intrinsic value is calculated on the difference between our closing stock price at year end and the exercise price, multiplied by the number of in-the-money options and represents the pre-tax amount that would have been received by the option holders, had they all exercised all their options on the fiscal year end date.
For the years ended September 30, 2008, 2009 and 2010, the Company recorded $5,795 and $2,404 and $2,310, respectively, of stock-based compensation expense related to these options that is included within selling, general and administrative expenses. At September 30, 2010, the unrecognized stock-based compensation related to these options was approximately $1,182 and is expected to be recognized through September 30, 2014.
Restricted Stock Awards and Units
During the year ending September 30, 2006, the Company issued, 57,845 Restricted Stock Awards ("RSAs") with a total fair value of $2,147 that were granted to certain key employees. RSAs represent a share of Class B convertible redeemable common stock. At September 30, 2007, these RSAs were fully vested.
F-27
Wesco Aircraft Holdings, Inc. & Subsidiaries
Notes to the Consolidated Financial Statements (Continued)
(In thousands, except share and per share data)
Note 13. Stock-Based and Other Compensation Arrangements (Continued)
Concurrent with Carlyle's acquisition of Wesco, 622,704 Restricted Stock Units ("RSUs") with a total fair value of $23,115 were granted to certain employees. RSUs represent the right to receive a share of restricted Class B convertible redeemable common stock. RSUs are subject to a 3-year continuous employment vesting starting September 30, 2006 through September 30, 2009. All 622,704 RSUs vested on September 30, 2009. During the years ended September 30, 2008, 2009 and 2010, the Company recorded $7,705, $7,705 and $0, respectively, of stock-based compensation expense related to the vested portion of these RSUs. As of September 30, 2010, the shares of common stock underlying the RSUs have not been issued to the employees; such shares will be issued on the earlier of September 28, 2012 or the occurrence of a change in control. Accordingly, the underlying 622,704 shares of common stock have not been included in the Consolidated Statements of Stockholders' Equity and Comprehensive Income or Consolidated Balance Sheets as issued and outstanding. Such shares have been included in the basic weighted average shares outstanding as of September 30, 2009 based on their vesting.
During the years ended September 30, 2008, 2009 and 2010, the Company granted 4,312, 4,312 and 3,532, respectively, of Class B convertible redeemable shares to its directors and recorded stock-based compensation expense of approximately $200, $280 and $200 respectively. The RSAs and RSUs do not contain any redemption provisions that are not within the Company's control. Accordingly, these equity awards have been classified within stockholders' equity.
Stock-Based Compensation
The Company accounts for stock-based compensation in accordance with ASC 718. The Company currently uses the Black-Scholes option pricing model to determine the fair value of the stock options. The determination of the fair value of stock-based payment awards on the date of grant using an option-pricing model is affected by the Company's stock price as well as assumptions regarding complex and subjective variables. These variables include the expected stock price volatility over the term of the awards, actual and projected employee stock option exercise behaviors, risk-free interest rate and expected dividends.
The Company estimated expected volatility based on historical data of comparable public companies. The expected term, which represents the period of time that options granted are expected to be outstanding, is estimated based on guidelines provided in SAB No. 110 and represents the average of the vesting tranches and contractual terms. The risk-free rate assumed in valuing the options is based on the U.S. Treasury rate in effect at the time of grant for the expected term of the option. The Company does not anticipate paying any cash dividends in the foreseeable future and, therefore, used an expected dividend yield of zero in the option pricing model. Compensation expense is recognized only for those options expected to vest with forfeitures estimated based on the Company's historical experience and future expectations. Stock-based compensation awards are amortized on a graded vesting method over the requisite service periods of the awards, which are generally the vesting periods.
F-28
Wesco Aircraft Holdings, Inc. & Subsidiaries
Notes to the Consolidated Financial Statements (Continued)
(In thousands, except share and per share data)
Note 13. Stock-Based and Other Compensation Arrangements (Continued)
The weighted average assumptions used to value the option grants are as follows:
| |
2008 | 2009 | 2010 | |||||||
|---|---|---|---|---|---|---|---|---|---|---|
Expected life (in years) |
6.48 | 5.83 | 6.46 | |||||||
Volatility |
50.81 | % | 52.65 | % | 50.17 | % | ||||
Risk free interest rate |
3.51 | % | 2.04 | % | 3.17 | % | ||||
Dividend yield |
— | — | — | |||||||
The weighted average fair value per option at the grant date for options issued during fiscal 2008, 2009 and 2010 was $22.45, $15.97 and $13.37, respectively.
Note 14. Commitments and Contingencies
Operating Leases
The Company leases office and warehouse facilities (certain of which are from related parties), and warehouse equipment under various non-cancelable operating leases that expire at various dates through December 31, 2020. Certain leases contain escalation clauses based on the Consumer Price Index. The Company is also committed under the terms of certain of these operating lease agreements to pay property taxes, insurance, utilities and maintenance costs.
Future minimum rental payments as of September 30, 2010 are as follows:
| |
Third Party |
Related Party |
Total | |||||||
|---|---|---|---|---|---|---|---|---|---|---|
Year Ending September 30, |
||||||||||
2011 |
$ | 1,920 | $ | 1,709 | $ | 3,629 | ||||
2012 |
1,630 | 1,709 | 3,339 | |||||||
2013 |
1,266 | 1,709 | 2,975 | |||||||
2014 |
664 | 1,709 | 2,373 | |||||||
2015 |
313 | 1,709 | 2,022 | |||||||
Thereafter |
14 | 7,152 | 7,166 | |||||||
|
$ | 5,807 | $ | 15,697 | $ | 21,504 | ||||
Total rent expense for the years ended September 30, 2008, 2009 and 2010 was $3,201, $3,891 and $3,863, respectively.
Capital Lease Commitments
The Company leases certain equipment under capital lease agreements that require minimum monthly payments that expire at various dates through November 2012.
F-29
Wesco Aircraft Holdings, Inc. & Subsidiaries
Notes to the Consolidated Financial Statements (Continued)
(In thousands, except share and per share data)
Note 14. Commitments and Contingencies (Continued)
Future minimum lease payments as of September 30, 2010 are as follows:
2011 |
$ | 1,577 | |||
2012 |
1,401 | ||||
2013 |
275 | ||||
2014 |
79 | ||||
2015 |
20 | ||||
|
3,352 | ||||
Less: interest |
(209 | ) | |||
Total |
$ | 3,143 | |||
Purchase Orders
As of September 30, 2010, the Company has open inventory purchase orders in the amount of $196,371.
Litigation
The Company is involved in various legal matters that arise in the normal course of its business. Management, after consulting with outside legal counsel, believes that the ultimate outcome of such matters will not have a material adverse effect on the Company's financial position, results of operations or cash flows. There can be no assurance, however, that such actions will not be material or adversely affect the Company's business, financial position, and results of operations or cash flows.
Note 15. Employee Benefit Plan
The Company maintains a 401(k) defined contribution plan and a retirement saving plan for the benefit of its eligible employees. All full-time employees who have completed at least six months of service and are at least 21 years of age are eligible to participate in the plans. Eligible employees may elect to contribute up to 60% of their eligible compensation. Contributions by the Company were $637, $687 and $725 during the years ending September 30, 2008, 2009 and 2010, respectively.
F-30
Wesco Aircraft Holdings, Inc. & Subsidiaries
Notes to the Consolidated Financial Statements (Continued)
(In thousands, except share and per share data)
Note 16. Supplemental Cash Flow Information
| |
2008 | 2009 | 2010 | |||||||
|---|---|---|---|---|---|---|---|---|---|---|
Cash payments for: |
||||||||||
Interest paid |
$ | 43,359 | $ | 28,371 | $ | 23,350 | ||||
Income taxes paid |
$ | 43,469 | $ | 22,028 | $ | 38,335 | ||||
Schedule of non-cash investing and financing activities: |
||||||||||
Property and equipment acquired pursuant to capital leases |
$ | 310 | $ | 3,624 | $ | 1,270 | ||||
Property and equipment disposed of pursuant to termination of capital leases |
$ | — | $ | (1,266 | ) | $ | — | |||
Liabilities assumed in connection with acquisition |
$ | 9,513 | $ | — | $ | — | ||||
Note 17. Quarterly Financial Data (unaudited)
Summarized unaudited quarterly financial data for quarters ended December 31, 2008 through September 30, 2010 is as follows:
Quarter Ended:
|
December 31, 2008 | March 31, 2009 | June 30, 2009 | September 30, 2009 | |||||||||
|---|---|---|---|---|---|---|---|---|---|---|---|---|---|
Net sales |
$ | 153,386 | $ | 157,906 | $ | 150,715 | $ | 150,680 | |||||
Gross profit |
62,696 | 64,955 | 56,878 | 53,758 | |||||||||
Income from operations |
35,811 | 37,928 | 32,799 | 27,854 | |||||||||
Net income |
15,237 | 18,365 | 13,624 | 11,221 | |||||||||
Basic net income per share(1) |
$ | 1.61 | $ | 1.95 | $ | 1.44 | $ | 1.19 | |||||
Diluted net income per share(1) |
$ | 1.54 | $ | 1.85 | $ | 1.37 | $ | 1.12 | |||||
Quarter Ended:
|
December 31, 2009 | March 31, 2010 | June 30, 2010 | September 30, 2010 | |||||||||
|---|---|---|---|---|---|---|---|---|---|---|---|---|---|
Net sales |
$ | 146,806 | $ | 164,105 | $ | 171,116 | $ | 174,009 | |||||
Gross profit |
54,643 | 63,197 | 68,240 | 68,150 | |||||||||
Income from operations |
29,885 | 38,629 | 43,272 | 42,529 | |||||||||
Net income |
14,071 | 18,114 | 21,457 | 20,032 | |||||||||
Basic net income per share(1) |
$ | 1.40 | $ | 1.80 | $ | 2.13 | $ | 1.99 | |||||
Diluted net income per share(1) |
$ | 1.40 | $ | 1.80 | $ | 2.13 | $ | 1.95 | |||||
- (1)
- Net income per share calculations for each quarter are based on the weighted average diluted shares outstanding for that quarter and may not total to the full year amount.
Note 18. Segment Reporting
The Company is organized based on geographical location. The Company's reportable segments are comprised of North America and the Rest of the World.
The Company evaluates segment performance based on segment operating earnings or loss. Each segment reports its results of operations and makes requests for capital expenditures and acquisition funding to the Company's chief operating decision-maker ("CODM"). The Company's Chief Executive
F-31
Wesco Aircraft Holdings, Inc. & Subsidiaries
Notes to the Consolidated Financial Statements (Continued)
(In thousands, except share and per share data)
Note 18. Segment Reporting (Continued)
Officer ("CEO") serves as CODM. Each operating segment has separate management teams and infrastructures dedicated to providing a full range of products and services to their customers.
The following table presents net sales and other financial information by business segment:
| |
Fiscal Year Ended September 30, 2008 | ||||||||||||
|---|---|---|---|---|---|---|---|---|---|---|---|---|---|
| |
North America |
Rest of the World |
Intercompany elimination |
Consolidated | |||||||||
Net sales |
$ | 551,135 | $ | 112,623 | $ | (59,415 | ) | $ | 604,343 | ||||
Gross profit |
221,898 | 42,143 | (7,433 | ) | 256,608 | ||||||||
Income from operations |
137,091 | 15,429 | (1,670 | ) | 150,850 | ||||||||
Interest expense, net |
(48,118 | ) | (625 | ) | (— | ) | (48,743 | ) | |||||
Provision for income taxes |
39,273 | 4,978 | — | 44,251 | |||||||||
Total assets |
1,106,850 | 87,963 | (21,193 | ) | 1,173,620 | ||||||||
Goodwill |
498,200 | 7,866 | — | 506,066 | |||||||||
Capital expenditures |
5,785 | 984 | — | 6,769 | |||||||||
Depreciation and amortization |
6,284 | 1,562 | — | 7,846 | |||||||||
| |
Fiscal Year Ended September 30, 2009 | ||||||||||||
|---|---|---|---|---|---|---|---|---|---|---|---|---|---|
| |
North America |
Rest of the World |
Intercompany elimination |
Consolidated | |||||||||
Net sales |
$ | 557,874 | 102,796 | (47,983 | ) | 612,687 | |||||||
Gross profit |
204,296 | 39,733 | (5,742 | ) | 238,287 | ||||||||
Income from operations |
118,289 | 15,762 | 341 | 134,392 | |||||||||
Interest expense, net |
(37,328 | ) | (379 | ) | (— | ) | (37,707 | ) | |||||
Provision for income taxes |
33,179 | 4,683 | — | 37,862 | |||||||||
Total assets |
1,178,558 | 92,645 | (16,391 | ) | 1,254,812 | ||||||||
Goodwill |
498,199 | 7,867 | — | 506,066 | |||||||||
Capital expenditures |
3,701 | 434 | — | 4,135 | |||||||||
Depreciation and amortization |
8,948 | 1,117 | — | 10,065 | |||||||||
| |
Fiscal Year Ended September 30, 2010 | ||||||||||||
|---|---|---|---|---|---|---|---|---|---|---|---|---|---|
| |
North America |
Rest of the World |
Intercompany elimination |
Consolidated | |||||||||
Net sales |
$ | 603,809 | 95,342 | (43,115 | ) | 656,036 | |||||||
Gross profit |
226,497 | 34,167 | (6,434 | ) | 254,230 | ||||||||
Income from operations |
144,823 | 10,002 | (510 | ) | 154,315 | ||||||||
Interest expense, net |
(35,505 | ) | (765 | ) | (— | ) | (36,270 | ) | |||||
Provision for income taxes |
41,314 | 2,599 | — | 43,913 | |||||||||
Total assets |
1,225,195 | 97,624 | (43,807 | ) | 1,279,012 | ||||||||
Goodwill |
498,199 | 6,642 | — | 504,841 | |||||||||
Capital expenditures |
2,867 | 210 | — | 3,077 | |||||||||
Depreciation and amortization |
7,861 | 960 | — | 8,821 | |||||||||
F-32
Wesco Aircraft Holdings, Inc. & Subsidiaries
Notes to the Consolidated Financial Statements (Continued)
(In thousands, except share and per share data)
Note 18. Segment Reporting (Continued)
Geographic Information
The Company operated principally in three geographic areas, North America, Europe and emerging markets, such as Asia, Pacific Rim and the Middle East.
Net sales by geographic area, for the fiscal years ended September 30, 2008, 2009 and 2010 were as follows:
| |
Fiscal Year Ended September 30, | ||||||||||||||||||
|---|---|---|---|---|---|---|---|---|---|---|---|---|---|---|---|---|---|---|---|
| |
2008 | 2009 | 2010 | ||||||||||||||||
| |
Sales | % of Sales |
Sales | % of Sales |
Sales | % of Sales |
|||||||||||||
North America |
$ | 499,873 | 82.7 | % | $ | 519,840 | 84.8 | % | $ | 569,099 | 86.7 | % | |||||||
Europe |
103,435 | 17.1 | 92,211 | 15.1 | 86,376 | 13.2 | |||||||||||||
Asia, Pacific Rim, Middle East and other |
1,035 | 0.2 | 636 | 0.1 | 561 | 0.1 | |||||||||||||
|
$ | 604,343 | 100.0 | % | $ | 612,687 | 100.0 | % | $ | 656,036 | 100.0 | % | |||||||
The Company determines the geographic area based on where the sale was originated from. Export sales from North America to customers in foreign countries amounted to $93, $103 and $84 for the years ended September 30, 2008, 2009 and 2010, respectively.
Long-lived assets by geographic area, for the fiscal years ended September 30, 2008, 2009 and 2010 were as follows:
| |
Fiscal Year Ended September 30, | |||||||||
|---|---|---|---|---|---|---|---|---|---|---|
| |
2008 | 2009 | 2010 | |||||||
North America |
$ | 15,900 | $ | 18,315 | $ | 18,338 | ||||
Europe |
2,800 | 2,246 | 1,835 | |||||||
Asia, Pacific Rim, Middle East and other |
— | — | — | |||||||
|
$ | 18,700 | $ | 20,561 | $ | 20,173 | ||||
Note 19. Subsequent Events (unaudited)
The Company has performed an evaluation of subsequent events through April 8, 2011, which is the date the financial statements were available to be issued.
During January 2011, the Company's CEO sold $44,384 of the Company's total outstanding debt. Subsequent to the sale, the Company's CEO has no ownership interest in the Company's debt.
On April 7, 2011, the Company completed a refinancing of its existing debt facilities for the purpose of extending the maturity dates under the term loans, increasing its borrowing capacity under the revolver and paying related fees and expenses. The Company did not increase their outstanding indebtedness as a result of the refinancing. The new senior secured credit facilities consist of a (i) $150,000 revolving credit facility, (ii) $265,000 term loan A facility and (iii) $350,000 in term loan B facility.
F-33
Wesco Aircraft Holdings, Inc. & Subsidiaries
Notes to the Consolidated Financial Statements (Continued)
(In thousands, except share and per share data)
Note 19. Subsequent Events (unaudited) (Continued)
Borrowings under the new revolving facility and new term loan A bear interest at the Eurocurrency rate plus the applicable margin or the ABR plus the applicable margin. Borrowings under the new term loan B facility bear interest at a rate equal to (A) the greater of (x) the Eurocurrency rate and (y) 1.25% or (B) the greater of (x) the ABR and (y) 1.25% plus, in each case, the applicable margin.
The new revolving facility and new term loan A facility each mature on April 7, 2016 and the new term loan B facility rate as of April 7, 2017. The new senior secured credit facilities require maintenance of a net debt-to-EBITDA ratio and an EBITDA-to-net interest expense ratio.
F-34
Wesco Aircraft Holdings, Inc. & Subsidiaries
Consolidated Balance Sheets
(In thousands, except share and per share data)
| |
September 30, 2010 |
December 31, 2010 |
|||||||
|---|---|---|---|---|---|---|---|---|---|
| |
|
(Unaudited) |
|||||||
Assets |
|||||||||
Current assets |
|||||||||
Cash and cash equivalents |
$ | 39,463 | $ | 27,266 | |||||
Accounts receivable, net of allowance for doubtful accounts of $4,011 at September 30, 2010 and $3,884 at December 31, 2010 |
89,427 | 100,079 | |||||||
Inventories |
483,442 | 486,079 | |||||||
Prepaid expenses and other current assets |
6,581 | 8,315 | |||||||
Deferred income taxes |
33,138 | 36,761 | |||||||
Total current assets |
652,051 | 658,500 | |||||||
Property and equipment, net |
20,173 |
19,213 |
|||||||
Deferred financing costs, net |
10,329 | 9,258 | |||||||
Goodwill |
504,841 | 504,699 | |||||||
Intangible assets, net |
89,998 | 88,947 | |||||||
Other assets |
1,620 | 1,222 | |||||||
Total assets |
$ | 1,279,012 | $ | 1,281,839 | |||||
Liabilities and Stockholders' Equity |
|||||||||
Current liabilities |
|||||||||
Accounts payable |
$ | 59,183 | $ | 48,727 | |||||
Accrued expenses and other current liabilities |
20,888 | 16,619 | |||||||
Income taxes payable |
5,500 | 10,116 | |||||||
Capital lease obligations—current portion |
1,354 | 1,354 | |||||||
Total current liabilities |
86,925 | 76,816 | |||||||
Long-term debt |
620,243 |
606,243 |
|||||||
Capital lease obligations |
1,789 | 1,402 | |||||||
Deferred income taxes |
23,927 | 29,672 | |||||||
Other liabilities |
389 | 263 | |||||||
Total liabilities |
733,273 | 714,396 | |||||||
Commitments and contingencies |
|||||||||
Stockholders' equity |
|||||||||
Preferred stock, $0.001 par value per share: 1,000,000 shares authorized; no shares issued and outstanding |
— | — | |||||||
Common stock, class A, $0.001 par value per share: 19,000,000 shares authorized; 9,319,450 shares issued and outstanding as of September 30, 2010 and December 31, 2010 |
9 | 9 | |||||||
Class B convertible redeemable common stock, $0.001 par value per share: 2,000,000 shares authorized; 121,083 and 125,327 shares issued and outstanding as of September 30, 2010 and December 31, 2010, respectively |
1 | 1 | |||||||
Additional paid-in captial |
329,256 | 329,619 | |||||||
Accumulated other comprehensive loss |
(7,288 | ) | (7,617 | ) | |||||
Retained earnings |
223,761 | 245,431 | |||||||
Total stockholders' equity |
545,739 | 567,443 | |||||||
Total liabilities and stockholders' equity |
$ | 1,279,012 | $ | 1,281,839 | |||||
See the accompanying notes to the consolidated financial statements.
F-35
Wesco Aircraft Holdings, Inc. & Subsidiaries
Consolidated Statements of Income
(In thousands, except share and per share data)
(Unaudited)
| |
Three Months Ended | |||||||||
|---|---|---|---|---|---|---|---|---|---|---|
| |
December 31, 2009 |
December 31, 2010 |
||||||||
Net sales |
$ | 146,806 | $ | 173,528 | ||||||
Cost of sales |
92,163 | 106,829 | ||||||||
Gross profit |
54,643 | 66,699 | ||||||||
Selling, general and administrative expenses |
24,758 | 25,388 | ||||||||
Income from operations |
29,885 | 41,311 | ||||||||
Interest expense, net |
(8,579 | ) | (6,277 | ) | ||||||
Other income (expense), net |
(41 | ) | 516 | |||||||
Income before provision for income taxes |
21,265 | 35,550 | ||||||||
Provision for income taxes |
7,194 | 13,880 | ||||||||
Net income |
$ | 14,071 | $ | 21,670 | ||||||
Net income per share: |
||||||||||
Basic |
$ | 1.40 | $ | 2.15 | ||||||
Diluted |
$ | 1.40 | $ | 2.11 | ||||||
Weighted average shares outstanding: |
||||||||||
Basic |
10,063,237 | 10,063,905 | ||||||||
Diluted |
10,063,487 | 10,284,934 | ||||||||
See the accompanying notes to the consolidated financial statements.
F-36
Wesco Aircraft Holdings, Inc. & Subsidiaries
Consolidated Statements of Cash Flows
(Unaudited)
(In thousands)
| |
Three Months Ended | |||||||||
|---|---|---|---|---|---|---|---|---|---|---|
| |
December 31, 2009 |
December 31, 2010 |
||||||||
Cash flows from operating activities |
||||||||||
Net income |
$ | 14,071 | $ | 21,670 | ||||||
Adjustments to reconcile net income to net cash provided by operating activities |
||||||||||
Amortization of intangible assets |
1,070 | 923 | ||||||||
Depreciation |
1,139 | 1,185 | ||||||||
Amortization of deferred financing costs |
926 | 1,072 | ||||||||
Bad debt and sales returns reserve |
(68 | ) | (121 | ) | ||||||
Non-cash foreign currency exchange |
(62 | ) | (423 | ) | ||||||
Non-cash stock-based compensation |
640 | 364 | ||||||||
Change in fair value of derivative |
249 | (1,532 | ) | |||||||
Deferred income tax provision |
1,104 | 2,119 | ||||||||
Changes in assets and liabilities |
||||||||||
Accounts receivable |
8,780 | (10,522 | ) | |||||||
Inventories |
(3,652 | ) | (2,475 | ) | ||||||
Prepaid expenses and other current assets |
1,508 | (1,503 | ) | |||||||
Accounts payable |
(7,995 | ) | (10,192 | ) | ||||||
Accrued expenses and other liabilities |
(437 | ) | (2,813 | ) | ||||||
Income taxes payable |
4,161 | 4,754 | ||||||||
Net cash provided by operating activities |
21,434 | 2,506 | ||||||||
Cash flows from investing activities |
||||||||||
Purchases of property and equipment |
(362 | ) | (234 | ) | ||||||
Net cash used in investing activities |
(362 | ) | (234 | ) | ||||||
Cash flows from financing activities |
||||||||||
Net repayments under line of credit |
(834 | ) | — | |||||||
Repayments of long-term debt |
(1,382 | ) | (14,000 | ) | ||||||
Repayment of capital lease obligations |
(279 | ) | (387 | ) | ||||||
Net cash used in financing activities |
(2,495 | ) | (14,387 | ) | ||||||
Effect of foreign currency exchange rates on cash and cash equivalents |
(14 | ) | (82 | ) | ||||||
Net increase (decrease) in cash and cash equivalents |
18,563 | (12,197 | ) | |||||||
Cash and cash equivalents, beginning of period |
11,406 | 39,463 | ||||||||
Cash and cash equivalents, end of period |
$ | 29,969 | $ | 27,266 | ||||||
Supplemental disclosure of cash flow information (see Note 9)
See the accompanying notes to the consolidated financial statements.
F-37
Wesco Aircraft Holdings, Inc. & Subsidiaries
Notes to the Consolidated Financial Statements
(In thousands, except share and per share data)
(Unaudited)
Note 1. Basis of Presentation and Significant Accounting Policies
The accompanying consolidated financial statements include the accounts of Wesco Aircraft Holdings, Inc. (referred to herein as the "Company" or in the first person notations "we," "us" and "our") and its wholly owned subsidiaries prepared in accordance with accounting principles generally accepted in the United States of America ("GAAP") and with the instructions to Form 10-Q and Article 10 of Regulation S-X. The financial statements presented herein have not been audited by an independent registered public accounting firm, but include all material adjustments (consisting of normal recurring adjustments) which are, in the opinion of management, necessary for fair statement of the financial condition, results of operations and cash flows for the period. However, these results are not necessarily indicative of results for any other interim period or for the full fiscal year. The preparation of financial statements in conformity with GAAP requires us to make certain estimates and assumptions for the reporting periods covered by the financial statements. These estimates and assumptions affect the reported amounts of assets, liabilities, revenues and expenses and the disclosure of contingent liabilities. Actual amounts could differ from these estimates.
Certain information and footnote disclosures normally included in financial statements in accordance with GAAP have been omitted pursuant to the rules of the Securities and Exchange Commission ("SEC"). The accompanying consolidated financial statements should be read in conjunction with the consolidated financial statements and notes thereto included in this offering.
Note 2. Recent Accounting Pronouncements
Changes to accounting principles generally accepted in the United States of America ("U.S. GAAP") are established by the Financial Accounting Standards Board ("FASB") in the form of Accounting Standards Updates ("ASUs") to the FASB's Accounting Standards Codification ("ASC").
The Company considers the applicability and impact of all ASUs. ASUs not listed below were assessed and determined to be either not applicable or are expected to have minimal impact on our consolidated financial position and results of operations.
In October 2009, the FASB issued guidance on revenue arrangements with multiple deliverables effective for the Company's 2012 fiscal year, although early adoption is permitted. The guidance revises the criteria for separating, measuring, and allocating arrangement consideration to each deliverable in a multiple element arrangement. The guidance requires companies to allocate revenue using the relative selling price of each deliverable, which must be estimated if the Company does not have a history of selling the deliverable on a stand-alone basis or third-party evidence of selling price. The Company does not believe that the adoption of this guidance will significantly change the timing in which revenue is recorded as the pricing of its service components are included in the per unit price of the products delivered to the customer, which is solely contingent on the number of units sold. As a result, the revenue earned on the service element does not become fixed or determinable until delivery of the product has taken place.
In June 2009, the FASB issued guidance to revise the approach to determine when a variable interest entity ("VIE") should be consolidated. The new consolidation model for VIEs considers, whether the Company has the power to direct the activities that most significantly impact the VIEs' economic performance and shares in the significant risks and rewards of the entity. The guidance on
F-38
Wesco Aircraft Holdings, Inc. & Subsidiaries
Notes to the Consolidated Financial Statements (Continued)
(In thousands, except share and per share data)
(Unaudited)
Note 2. Recent Accounting Pronouncements (Continued)
VIEs requires companies to continually reassess VIEs to determine if consolidation is appropriate and provide additional disclosures. The Company adopted the provisions of this VIE guidance at the beginning of fiscal year 2011, and the adoption did not have a material impact on the Company's financial statements.
In January 2010, the FASB issued guidance revised two disclosure requirements concerning fair value measurements and clarifies two others. It requires separate presentation of significant transfers into and out of Levels 1 and 2 of the fair value hierarchy and disclosure of the reasons for such transfers. It will also require the presentation of purchases, sales, issuances and settlements within Level 3 on a gross basis rather than a net basis. The guidance also clarifies that disclosures should be disaggregated by class of asset or liability and that disclosures about inputs and valuation techniques should be provided for both recurring and non-recurring fair value measurements. These new disclosure requirements will become effective for the Company's financial statements for the period ended September 30, 2011, except for the requirement concerning gross presentation of Level 3 activity, which will become effective for fiscal years beginning after December 15, 2010. Since the Company doesn't currently have any Level 3 fair value measurements, the adoption of this standard did not have an impact on the consolidated financial statements.
Note 3. Fair Value of Financial Instruments
The Company's financial instruments consist of cash and cash equivalents, accounts receivable and payable, accrued and other current liabilities, and line of credit. The carrying amounts of these instruments approximate fair value because of their short-term maturities. The fair value of the long-term debt instruments are determined using current applicable rates for similar instruments as of the balance sheet date. The carrying amounts and fair value of the debt instruments as of December 31, 2010 were as follows:
| |
Carrying Value | Fair Value | |||||
|---|---|---|---|---|---|---|---|
$550,000 term loan |
$ | 477,243 | $ | 477,246 | |||
$150,000 term loan |
$ | 129,000 | $ | 128,629 | |||
Note 4. Derivative Financial Instruments
The Company enters into an interest rate swap arrangement in order to manage its net exposure to interest rate changes on the Company's long-term debt. Interest rate swap contracts involve the exchange of floating rate interest payment obligations for fixed interest rate payments without the exchange of the underlying principle amounts. The Company accounts for this arrangement pursuant to the provisions of ASC 815, Derivatives and Hedging. ASC 815 establishes accounting and reporting standards requiring that every derivative instrument be recorded in the balance sheet as either an asset or liability measured at fair value and that any changes in fair value be recognized currently in earnings unless specific hedge accounting criteria are met. The Company's interest rate swap arrangement is not designated as a hedge pursuant to ASC 815 and, accordingly, the Company reflects the change in fair value of the interest rate swap in the consolidated statements of operations as part of interest expense.
F-39
Wesco Aircraft Holdings, Inc. & Subsidiaries
Notes to the Consolidated Financial Statements (Continued)
(In thousands, except share and per share data)
(Unaudited)
Note 4. Derivative Financial Instruments (Continued)
These arrangements also contain an element of risk in that the counterparties may be unable to meet the terms of such arrangements. In the event the parties to deliver commitments are unable to fulfill their obligations, the Company could potentially incur significant additional costs by replacing the positions at then current market rates. The Company manages its risk of exposure by limiting counterparties to those banks and institutions deemed appropriate by management. Upon the maturity of its previous interest rate swaps, the Company entered into two interest rate swaps arrangements that expire in February and June 2012. Each interest rate swap converts the interest rate on approximately $200,000 (notional amount) of its outstanding debt from variable rates to a fixed interest rate. The swap agreements have fixed the LIBOR component of the term debt to 1.77% and 1.96%.
Exchange-traded derivative financial instruments are valued based on quoted market prices and classified within Level 1 of the valuation hierarchy. Derivative financial instruments that are traded on an index are valued based on direct or indirect prices and classified within Level 2 of the valuation hierarchy. If quoted market prices or other observable inputs are not available, fair value is based on unobservable inputs, including assumptions of market activity and general market conditions, and classified within Level 3 of the valuation hierarchy.
The Company classifies assets and liabilities in their entirety based on the lowest level of input that is significant to the fair value measurement. The following table includes the notional amounts and fair value of derivative financial instruments as of September 30, 2010 and December 31, 2010:
| |
|
September 30, 2010 | December 31, 2010 | ||||||||||||
|---|---|---|---|---|---|---|---|---|---|---|---|---|---|---|---|
| |
Balance Sheet Location |
Notional Amount |
Fair Value |
Notional Amount |
Fair Value |
||||||||||
Swap Contracts |
Accrued Expenses | $ | 400,000 | $ | (6,660 | ) | $ | 400,000 | $ | (5,128 | ) | ||||
During the three months ending December 31, 2009, the Company recorded losses in the amount of $249 as a result of changes in fair value of derivative financial instruments. During the three months ending December 31, 2010, the Company recorded earnings in the amount of $1,532 as a result of changes in fair value of derivative financial instruments. These changes are recorded as a component of interest expense.
The Company classifies assets and liabilities in their entirety based on the lowest level of input that is significant to the fair value measurement. The following table sets forth assets and liabilities
F-40
Wesco Aircraft Holdings, Inc. & Subsidiaries
Notes to the Consolidated Financial Statements (Continued)
(In thousands, except share and per share data)
(Unaudited)
Note 4. Derivative Financial Instruments (Continued)
measured at fair value as of September 30, 2010 and December 31, 2010, categorized by input level within the fair value hierarchy:
| |
Fair Value Measurements Using | ||||||||||
|---|---|---|---|---|---|---|---|---|---|---|---|
| |
Quoted Prices in Active Markets |
Significant Other Observable Inputs |
Significant Unobservable Inputs |
||||||||
| |
Level 1 | Level 2 | Level 3 | ||||||||
September 30, 2010 |
|||||||||||
Financial instruments measured at fair value on a recurring basis |
|||||||||||
Derivative financial instruments |
— | $ | (6,660 | ) | — | ||||||
| |
Level 1 | Level 2 | Level 3 | ||||||||
|---|---|---|---|---|---|---|---|---|---|---|---|
December 31, 2010 |
|||||||||||
Financial instruments measured at fair value on a recurring basis |
|||||||||||
Derivative financial instruments |
— | $ | (5,128 | ) | — | ||||||
The fair value of our derivative financial instruments is estimated using the net present value of a series of cash flows on both the cap and floor components of the interest rate collars. These cash flows are based on yield curves that take into account the contractual terms of the derivatives, including the period to maturity and market-based parameters such as interest rates and volatility. We incorporated nonperformance risk by adjusting the present value of each liability position utilizing an estimation of our credit risk.
F-41
Wesco Aircraft Holdings, Inc. & Subsidiaries
Notes to the Consolidated Financial Statements (Continued)
(In thousands, except share and per share data)
(Unaudited)
Note 5. Long-Term Debt
Long-term debt consists of the following at:
| |
September 30, 2010 |
December 31, 2010 |
|||||||
|---|---|---|---|---|---|---|---|---|---|
$550,000 term loan, bearing interest based on Alternate Base Rate ("ABR") (defined as Prime Rate plus the applicable margin rate of 1.25%) or Eurodollar (defined as London Inter-Bank Offer Rate ("LIBOR") rates plus the applicable margin rate of 2.25%), at the option of the Company. The term loan is payable quarterly equal to 0.25% of the principal amount of $550,000 with the final payment due on September 29, 2013. Interest rate was 2.52% at December 31, 2010. |
$ | 477,243 | $ | 477,243 | |||||
$150,000 term loan, bearing interest based on ABR (defined as Prime Rate plus the applicable margin rate of 4.75%) or Eurodollar (defined as London Inter-Bank Offer Rate ("LIBOR") rates plus the applicable margin rate of 5.75%), at the option of the Company. The entire balance is due March 28, 2014. Interest rate was 6.02% at December 31, 2010. |
143,000 |
129,000 |
|||||||
|
620,243 | 606,243 | |||||||
Less: current portion |
— | — | |||||||
Long-term debt |
$ | 620,243 | $ | 606,243 | |||||
During the three months ended December 31, 2010, the Company made prepayments totaling approximately $14,000 on its $150,000 term loan. In accordance with the loan agreement, $14,000 was applied to the Company's balloon payment. As of December 31, 2010, the Company has prepaid all required quarterly payments.
As part of the loan agreement, the Company had a $75,000 revolving line of credit that expires on September 28, 2012. The applicable margin for the revolving facility is determined based on the ratio of the Company's EBITDA, as defined in the loan agreement, for the most recently ended four fiscal quarters and ranges between 0.75% and 1.50% for the ABR Loans and range between 1.75% and 2.50% for the Eurodollar Loans. There was no outstanding borrowing under this line of credit as of December 31, 2010 or at any point during fiscal 2011. Annual commitment fees for this line of credit approximate $281.
In October 2008, the administrative and collateral agent under the Company's revolving line of credit, Lehman Commercial Paper Inc. ("LCPI"), filed for bankruptcy. LCPI is a lender under the Company's revolving credit facility with a commitment of approximately $20,000. As a result of LCPI's actions, the Company's availability to access these funds is at risk. The Company does not expect that LCPI's potential inability to fund this commitment would have a material adverse impact on its liquidity.
F-42
Wesco Aircraft Holdings, Inc. & Subsidiaries
Notes to the Consolidated Financial Statements (Continued)
(In thousands, except share and per share data)
(Unaudited)
Note 5. Long-Term Debt (Continued)
The Company's subsidiary, Wesco Aircraft Europe Limited, has available a £10,000 ($15,700 based on the December 31, 2010 exchange rate) line of credit, subject to certain cash balance requirements as defined in the line of credit agreement, that automatically renews annually on October 1. The line of credit bears interest based on the bank based rate plus an applicable margin of 1.15%. The net outstanding borrowing under this line of credit was £0 ($0) as of December 31, 2010 and September 30, 2010.
Under the terms and definitions of the First Lien Credit Agreement as of December 31, 2010, the Company is required to maintain a net debt-to-EBITDA ratio not to exceed 4.0, an EBITDA-to-net interest expense ratio greater than 2.25, and capital expenditures not to exceed $10,000 per year. The credit agreement also restricts the Company from incurring certain additional indebtedness, payment of dividends, sale of substantial assets, and limits certain investments. The Company was in compliance with these covenants at December 31, 2010.
Borrowings under these credit facilities are collateralized by substantially all of the assets of the Company.
Note 6. Comprehensive Income
Comprehensive income consists of the following:
| |
Three Months Ended December 31, |
||||||
|---|---|---|---|---|---|---|---|
| |
2009 | 2010 | |||||
Net income |
$ | 14,071 | $ | 21,670 | |||
Foreign exchange translation adjustment |
(2,714 | ) | (329 | ) | |||
Total comprehensive income |
$ | 11,357 | $ | 21,341 | |||
Note 7. Net Income Per Share
Basic net income per share is computed by dividing net income available to common stockholders by the weighted average number of common shares outstanding during the period. Diluted net income per share includes the dilutive effect of both outstanding stock options and restricted shares, calculated using the treasury stock method. Assumed proceeds from in-the-money options include windfall tax
F-43
Wesco Aircraft Holdings, Inc. & Subsidiaries
Notes to the Consolidated Financial Statements (Continued)
(In thousands, except share and per share data)
(Unaudited)
Note 7. Net Income Per Share (Continued)
benefits, net of shortfalls, calculated under the "as-if" method as prescribed by ASC 718, Compensation—Stock Option Compensation.
| |
Three Months Ended December 31, 2009 |
Three Months Ended December 31, 2010 |
|||||
|---|---|---|---|---|---|---|---|
| |
(In thousands, except share and per share data) |
||||||
Net income |
$ | 14,071 | $ | 21,670 | |||
Basic weighted average shares outstanding |
10,063,237 | 10,063,905 | |||||
Dilutive effect of stock options and restricted stock awards/units |
250 | 221,029 | |||||
Dilutive weighted average shares outstanding |
10,063,487 | 10,284,934 | |||||
Basic net income per share |
$ | 1.40 | $ | 2.15 | |||
Diluted net income per share |
$ | 1.40 | $ | 2.11 | |||
There were no shares of common stock equivalents for the three months ended December 31, 2009 and December 31, 2010, respectively, which were not included in the diluted calculation due to their anti-dilutive effect.
Note 8. Segment Reporting
The Company is organized based on the geographical location. The Company's reportable segments are comprised of the North America and Rest of the World.
The Company evaluates segment performance based on segment operating earnings or loss. Each segment reports its results of operations and makes requests for capital expenditures and acquisition funding to the Company's chief operating decision-maker ("CODM"). The Company's Chief Executive Officer ("CEO") serves as CODM. Each operating segment has separate management teams and infrastructures dedicated to providing a full range of products and services to their customers.
F-44
Wesco Aircraft Holdings, Inc. & Subsidiaries
Notes to the Consolidated Financial Statements (Continued)
(In thousands, except share and per share data)
(Unaudited)
Note 8. Segment Reporting (Continued)
The following table presents net sales and operating income by business segment:
| |
Three Months Ended December 31, 2009 | ||||||||||||
|---|---|---|---|---|---|---|---|---|---|---|---|---|---|
| |
North America |
Rest of the World |
Intercompany elimination |
Consolidated | |||||||||
Net sales |
$ | 132,490 | $ | 23,296 | $ | (8,980 | ) | $ | 146,806 | ||||
Gross profit |
47,659 | 8,698 | (1,714 | ) | 54,643 | ||||||||
Income from operations |
27,517 | 2,475 | (107 | ) | 29,885 | ||||||||
Interest expense, net |
(8,321 | ) | (258 | ) | (— | ) | (8,579 | ) | |||||
Provision for income taxes |
6,617 | 577 | — | 7,194 | |||||||||
Total assets |
1,211,085 | 93,315 | (43,285 | ) | 1,261,115 | ||||||||
Goodwill |
498,199 | 6,692 | — | 504,891 | |||||||||
Capital expenditures |
362 | (— | ) | — | 362 | ||||||||
Depreciation and amortization |
1,942 | 267 | — | 2,209 | |||||||||
| |
Three Months Ended December 31, 2010 | ||||||||||||
|---|---|---|---|---|---|---|---|---|---|---|---|---|---|
| |
North America |
Rest of the World |
Intercompany elimination |
Consolidated | |||||||||
Net sales |
$ | 160,483 | $ | 26,071 | $ | (13,026 | ) | $ | 173,528 | ||||
Gross profit |
59,477 | 8,837 | (1,615 | ) | 66,699 | ||||||||
Income from operations |
38,998 | 2,158 | 155 | 41,311 | |||||||||
Interest expense, net |
(6,101 | ) | (176 | ) | (— | ) | (6,277 | ) | |||||
Provision for income taxes |
13,106 | 774 | — | 13,880 | |||||||||
Total assets |
1,225,919 | 98,812 | (42,892 | ) | 1,281,839 | ||||||||
Goodwill |
498,199 | 6,500 | — | 504,699 | |||||||||
Capital expenditures |
196 | 38 | — | 234 | |||||||||
Depreciation and amortization |
1,870 | 238 | — | 2,108 | |||||||||
Geographic Information
The Company operated principally in three geographic areas, the North America, Europe and emerging markets, such as Asia, Pacific Rim and the Middle East.
F-45
Wesco Aircraft Holdings, Inc. & Subsidiaries
Notes to the Consolidated Financial Statements (Continued)
(In thousands, except share and per share data)
(Unaudited)
Note 8. Segment Reporting (Continued)
Net sales by geographic area, for the quarter ended December 31, 2009 and December 31, 2010 were as follows:
| |
Quarter Ended December 31, | |||||||||||||
|---|---|---|---|---|---|---|---|---|---|---|---|---|---|---|
| |
2009 | 2010 | ||||||||||||
| |
Sales | % of Sales |
Sales | % of Sales |
||||||||||
North America |
$ | 125,794 | 85.7 | % | $ | 149,973 | 86.4 | % | ||||||
Europe |
20,880 | 14.2 | 23,386 | 13.5 | ||||||||||
Asia, Pacific Rim, Middle East and other |
132 | 0.1 | 169 | 0.1 | ||||||||||
Total net sales |
$ | 146,806 | 100.0 | % | $ | 173,528 | 100.0 | % | ||||||
The Company determines the geographic area based on where the sale was originated from. Export sales from North America to customers in foreign countries amounted to $19 and $24 for the quarters ended December 31, 2009 and 2010, respectively.
Note 9. Supplemental Cash Flow Information
| |
Three Months Ended | ||||||
|---|---|---|---|---|---|---|---|
| |
December 31, 2009 |
December 31, 2010 |
|||||
Schedule of non-cash investing activities |
|||||||
Property and equipment acquired persuant to capital leases |
$ |
881 |
$ |
— |
|||
Note 10. Subsequent Events
The Company has performed an evaluation of subsequent events through April 8, 2011, which is the date the financial statements were available to be issued.
During January 2011, the Company's CEO sold $44,384 of the Company's total outstanding debt. Subsequent to the sale, the Company's CEO and minority stockholder has no ownership interest in the Company's debt.
On April 7, 2011, the Company completed a refinancing of its existing debt facilities for the purpose of extending the maturity dates under the term loans, increasing its borrowing capacity under the revolver and paying related fees and expenses. The new senior secured credit facilities consist of a (i) $150,000 revolving credit facility, (ii) $265,000 term loan A facility and (iii) $350,000 term loan B facility.
Borrowings under the new revolving facility and new term loan A bear interest at the Eurocurrency rate plus the applicable margin or the ABR plus the applicable margin. Borrowings under the new term loan B facility bear interest at a rate equal to (A) the greater of (x) the
F-46
Wesco Aircraft Holdings, Inc. & Subsidiaries
Notes to the Consolidated Financial Statements (Continued)
(In thousands, except share and per share data)
(Unaudited)
Note 10. Subsequent Events (Continued)
Eurocurrency rate and (y) 1.25% or (B) the greater of (x) the ABR and (y) 1.25% plus, in each case, the applicable margin.
The new revolving facility and new term loan A facility each mature on April 7, 2016 and the new term loan B facility matures on April 7, 2017. The new senior secured credit facilities require maintenance of a net debt-to-EBITDA ratio and an EBITDA-to-net interest expense ratio.
F-47
Through and including , 2011 (the 25th day after the date of this prospectus), all dealers that buy, sell or trade our common stock, whether or not participating in this offering, may be required to deliver a prospectus. This delivery requirement is in addition to the obligation of dealers to deliver a prospectus when acting as underwriters and with respect to their unsold allotments or subscriptions.
Shares
Wesco Aircraft Holdings, Inc.
Common Stock
PROSPECTUS
| Barclays Capital | Morgan Stanley |
| BofA Merrill Lynch | J.P. Morgan | William Blair & Company |
, 2011
PART II
INFORMATION NOT REQUIRED IN PROSPECTUS
Item 13. Other Expenses of Issuance and Distribution.
The actual and estimated expenses in connection with this offering, all of which will be borne by us, are as follows:
SEC Registration Fee |
$ | 34,830 | ||
FINRA Filing Fee |
30,500 | |||
Printing Expense |
* | |||
Legal Fees |
* | |||
Accounting Fees |
* | |||
Blue Sky Fees |
* | |||
Stock Exchange Listing Fees |
* | |||
Transfer Agent Fee |
* | |||
Miscellaneous |
* | |||
Total |
$ | |||
- *
- To be filed by amendment.
Item 14. Indemnification of Directors and Officers
Reference is made to Section 102(b)(7) of the Delaware General Corporation Law, or the DGCL, which enables a corporation in its original certificate of incorporation or an amendment thereto to eliminate or limit the personal liability of a director for violations of the director's fiduciary duty, except (1) for any breach of the director's duty of loyalty to the corporation or its stockholders, (2) for acts or omissions not in good faith or which involve intentional misconduct or a knowing violation of law, (3) pursuant to Section 174 of the DGCL, which provides for liability of directors for unlawful payments of dividends of unlawful stock purchase or redemptions or (4) for any transaction from which a director derived an improper personal benefit.
Reference is also made to Section 145 of the DGCL, which provides that a corporation may indemnify any person, including an officer or director, who was or is, or is threatened to be made, party to any threatened, pending or completed legal action, suit or proceeding, whether civil, criminal, administrative or investigative, other than an action by or in the right of such corporation, by reason of the fact that such person is or was an officer, director, employee or agent of such corporation or is or was serving at the request of such corporation as a director, officer, employee or agent of another corporation or enterprise. The indemnity may include expenses (including attorneys' fees), judgments, fines and amounts paid in settlement actually and reasonably incurred by such person in connection with such action, suit or proceeding, provided such officer, director, employee or agent acted in good faith and in a manner he reasonably believed to be in, or not opposed to, the Company's best interest and, for criminal proceedings, had no reasonable cause to believe that his conduct was unlawful. A Delaware corporation may indemnify any officer or director in an action by or in the right of the corporation under the same conditions, except that no indemnification is permitted without judicial approval if the officer or director is adjudged to be liable to the corporation. Where an officer or director is successful on the merits or otherwise in the defense of any action referred to above, the corporation must indemnify him against the expenses that such officer or director actually and reasonably incurred in connection therewith.
We expect that our amended and restated certificate of incorporation to be filed as Exhibit 3.1 to this registration statement will provide that our directors will not be personally liable to the Company
II-1
or its stockholders for monetary damages resulting from breach of their fiduciary duties. However, nothing contained in such provision will eliminate or limit the liability of directors (1) for any breach of the director's duty of loyalty to us or our stockholders, (2) for acts or omissions not in good faith or which involve intentional misconduct or a knowing violation of the law, (3) under Section 174 of the DGCL or (4) for any transaction from which the director derived an improper personal benefit.
Our amended and restated bylaws provides for indemnification of the officers and directors to the full extent permitted by applicable law.
In addition, we intend to enter into agreements to indemnify our directors and executive officers containing provisions, which are in some respects broader than the specific indemnification provisions contained in the DGCL. The indemnification agreements may require us, among other things, to indemnify our directors against certain liabilities that may arise by reason of their status or service as directors and to advance their expenses incurred as a result of any proceeding against them as to which they could be indemnified.
The proposed form of Underwriting Agreement filed as Exhibit 1.1 to this Registration Statement provides for indemnification by the underwriters of the registrant and its officers and directors for certain liabilities arising under the Securities Act, or otherwise.
Item 15. Recent Sales of Unregistered Securities.
Since March 31, 2008, we have granted to our directors, officers and employees options to purchase an aggregate of 171,547 shares of our common stock with per share exercise prices ranging from $46.40 to $70.00 under our amended and restated equity incentive plan, which we refer to as the existing equity incentive plan.
Since March 31, 2008, we have issued to our directors, officers and employees an aggregate of 17,948 shares of our common stock at an exercise price of $37.12 pursuant to exercises of options granted under our existing equity incentive plan.
Since March 31, 2008, we have issued to certain of our officers an aggregate of 5,387 shares of our common stock for aggregate consideration of $249,956.80 pursuant to our stock purchase plan.
Since March 31, 2008, we have issued to certain of our directors an aggregate of 15,012 restricted stock awards in lieu of payment of an aggregate of $927,344.30 in fees for their service as directors pursuant to our existing equity incentive plan.
Unless otherwise stated, the sales of the above securities were deemed to be exempt from registration under the Securities Act in reliance upon Section 4(2) of the Securities Act or Regulation D promulgated thereunder, or Rule 701 promulgated under Section 3(b) of the Securities Acts as transactions by an issuer not involving any public offering or pursuant to benefit plans and contracts relating to compensation as provided under Rule 701. The recipients of securities in each of these transactions represented their intention to acquire the securities for investment only and not with a view to or for sale in connection with any distribution thereof, and appropriate legends were affixed to the share certificates and instruments issued in such transactions.
II-2
Item 16. Exhibits and Financial Statement Schedules.
- (a)
- Exhibits
| EXHIBIT NO. |
DESCRIPTION OF EXHIBIT | ||
|---|---|---|---|
| *1.1 | Form of Underwriting Agreement. | ||
*3.1 |
Form of Amended and Restated Certificate of Incorporation of Wesco Aircraft Holdings, Inc. |
||
*3.2 |
Form of Amended and Restated Bylaws of Wesco Aircraft Holdings, Inc. |
||
*4.1 |
Form of Stock Certificate. |
||
*4.2 |
Form of Amended and Restated Stockholders Agreement. |
||
*5.1 |
Opinion of Latham & Watkins LLP. |
||
*10.1 |
Credit Agreement, by and among Wesco Aircraft, Inc., Wesco Aircraft Hardware Corp., Barclays Bank PLC, Merrill Lynch, Pierce, Fenner & Smith Incorporated, Barclays Capital, J.P. Morgan Securities LLC, Morgan Stanley Senior Funding, Inc., Sumitomo Mitsui Banking Corporation, Royal Bank of Canada, Bank of America, N.A. and the lenders party thereto, dated as of April 7, 2011. |
||
*10.2 |
Guarantee and Collateral Agreement, by and among Wesco Aircraft, Inc., Wesco Aircraft Hardware Corp., Barclays Bank PLC and the subsidiary guarantors party thereto, dated as of April 7, 2011. |
||
10.3 |
Amended and Restated Equity Incentive Plan of Wesco Aircraft Holdings, Inc. |
||
10.4 |
Management Annual Incentive Plan of Wesco Aircraft Holdings, Inc. |
||
10.5 |
Employment Agreement between Wesco Aircraft Hardware Corp. and Randy Snyder, dated as of July 23, 2006. |
||
10.6 |
Amendment to the Employment Agreement between Wesco Aircraft Hardware Corp. and Randy Snyder, dated as of December 31, 2008. |
||
10.7 |
Employment Agreement between Wesco Holdings, Inc. and Gregory Hann, dated as of January 22, 2009. |
||
10.8 |
Employment Agreement between Wesco Aircraft Hardware Corp. and Hal Weinstein, dated as of June 15, 2007. |
||
10.9 |
Amendment to the Employment Agreement between Wesco Aircraft Hardware Corp. and Hal Weinstein, dated as of December 31, 2008. |
||
21.1 |
List of Subsidiaries. |
||
*23.1 |
Consent of Latham & Watkins LLP (included in Exhibit 5.1). |
||
23.2 |
Consent of Independent Registered Public Accounting Firm. |
||
23.3 |
Consent of Stax Inc. |
||
24.1 |
Powers of Attorney (included in the signature pages to this registration statement). |
||
- *
- To be filed by amendment.
II-3
- (b)
- Financial Statement Schedules
Schedules have been omitted because the information required to be set forth therein is not applicable or is shown in the consolidated financial statements or notes thereto.
The undersigned registrant hereby undertakes to provide to the underwriters at the closing specified in the underwriting agreement certificates in such denominations and registered in such names as required by the underwriters to permit prompt delivery to each purchaser.
Insofar as indemnification for liabilities arising under the Securities Act may be permitted to our directors, officers, and controlling persons pursuant to the foregoing provisions, or otherwise, we have been advised that in the opinion of the SEC such indemnification is against public policy as expressed in the Securities Act and is, therefore, unenforceable. In the event that a claim for indemnification against such liabilities (other than the payment by us of expenses incurred or paid by a director, officer, or controlling person of us in the successful defense of any action, suit, or proceeding) is asserted by such director, officer, or controlling person in connection with the securities being registered, we will, unless in the opinion of counsel the matter has been settled by controlling precedent, submit to a court of appropriate jurisdiction the question whether such indemnification by us is against public policy as expressed in the Securities Act and will be governed by the final adjudication of such issue.
We hereby undertake that:
- (i)
- for
purposes of determining any liability under the Securities Act, the information omitted from the form of prospectus filed as part of this registration
statement in reliance upon Rule 430A and contained in a form of prospectus filed by the registrant pursuant to Rule 424(b)(1) or (4) or 497(h) under the Securities Act shall be
deemed to be part of this registration statement as of the time it was declared effective.
- (ii)
- for purposes of determining any liability under the Securities Act, each post-effective amendment that contains a form of prospectus shall be deemed to be a new registration statement relating to the securities offered therein, and the offering of such securities at that time shall be deemed to be the initial bona fide offering thereof.
II-4
Pursuant to the requirements of the Securities Act of 1933, the registrant has duly caused this Registration Statement to be signed on its behalf by the undersigned, thereunto duly authorized, in the city of Valencia, state of California, on April 8, 2011.
| WESCO AIRCRAFT HOLDINGS, INC. | ||||
By: |
/s/ RANDY J. SNYDER Randy J. Snyder Chairman of the Board of Directors, President and Chief Executive Officer |
|||
Each person whose signature appears below constitutes and appoints Randy J. Snyder and Gregory A. Hann, and each of them singly, his or her true and lawful attorneys-in-fact and agents, with full power of substitution and resubstitution, for him or her and in his or her name, place and stead, in any and all capacities, to sign any and all amendments (including post-effective amendments) to this registration statement and any and all additional registration statements pursuant to Rule 462(b) of the Securities Act of 1933, as amended, and to file the same, with all exhibits thereto, and all other documents in connection therewith, with the Securities and Exchange Commission, granting unto each said attorney-in-fact and agents full power and authority to do and perform each and every act in person, hereby ratifying and confirming all that said attorneys-in-fact and agents or either of them or their or his or her substitute or substitutes may lawfully do or cause to be done by virtue hereof.
Pursuant to the requirements of the Securities Act of 1933, this Registration Statement has been signed by the following persons in the capacities and as of the dates indicated.
SIGNATURE
|
TITLE
|
DATE
|
||
|---|---|---|---|---|
| /s/ RANDY J. SNYDER |
Randy J. Snyder Chairman of the Board of Directors, President and Chief Executive Officer |
April 8, 2011 | ||
/s/ GREGORY A. HANN |
Gregory A. Hann Executive Vice President and Chief Financial Officer |
April 8, 2011 |
||
/s/ J. SHAWN TROGDON |
J. Shawn Trogdon Global Controller |
April 8, 2011 |
||
/s/ DAYNE A. BAIRD |
Dayne A. Baird Director |
April 8, 2011 |
||
/s/ PETER J. CLARE |
Peter J. Clare Director |
April 8, 2011 |
II-5
SIGNATURE
|
TITLE
|
DATE
|
||
|---|---|---|---|---|
| /s/ PAUL E. FULCHINO |
Paul E. Fulchino Director |
April 8, 2011 | ||
/s/ JOHN JUMPER |
John Jumper Director |
April 8, 2011 |
||
/s/ ADAM J. PALMER |
Adam J. Palmer Director |
April 8, 2011 |
||
/s/ ROBERT D. PAULSON |
Robert D. Paulson Director |
April 8, 2011 |
||
/s/ DAVID L. SQUIER |
David L. Squier Director |
April 8, 2011 |
II-6
| EXHIBIT NO. |
DESCRIPTION OF EXHIBIT | ||
|---|---|---|---|
| *1.1 | Form of Underwriting Agreement. | ||
*3.1 |
Form of Amended and Restated Certificate of Incorporation of Wesco Aircraft Holdings, Inc. |
||
*3.2 |
Form of Amended and Restated Bylaws of Wesco Aircraft Holdings, Inc. |
||
*4.1 |
Form of Stock Certificate. |
||
*4.2 |
Form of Amended and Restated Stockholders Agreement. |
||
*5.1 |
Opinion of Latham & Watkins LLP. |
||
*10.1 |
Credit Agreement, by and among Wesco Aircraft, Inc., Wesco Aircraft Hardware Corp., Barclays Bank PLC, Merrill Lynch, Pierce, Fenner & Smith Incorporated, Barclays Capital, J.P. Morgan Securities LLC, Morgan Stanley Senior Funding, Inc., Sumitomo Mitsui Banking Corporation, Royal Bank of Canada, Bank of America, N.A. and the lenders party thereto, dated as of April 7, 2011. |
||
*10.2 |
Guarantee and Collateral Agreement, by and among Wesco Aircraft, Inc., Wesco Aircraft Hardware Corp., Barclays Bank PLC and the subsidiary guarantors party thereto, dated as of April 7, 2011. |
||
10.3 |
Amended and Restated Equity Incentive Plan of Wesco Aircraft Holdings, Inc. |
||
10.4 |
Management Annual Incentive Plan of Wesco Aircraft Holdings, Inc. |
||
10.5 |
Employment Agreement between Wesco Aircraft Hardware Corp. and Randy Snyder, dated as of July 23, 2006. |
||
10.6 |
Amendment to the Employment Agreement between Wesco Aircraft Hardware Corp. and Randy Snyder, dated as of December 31, 2008. |
||
10.7 |
Employment Agreement between Wesco Holdings, Inc. and Gregory Hann, dated as of January 22, 2009. |
||
10.8 |
Employment Agreement between Wesco Aircraft Hardware Corp. and Hal Weinstein, dated as of June 15, 2007. |
||
10.9 |
Amendment to the Employment Agreement between Wesco Aircraft Hardware Corp. and Hal Weinstein, dated as of December 31, 2008. |
||
21.1 |
List of Subsidiaries. |
||
*23.1 |
Consent of Latham & Watkins LLP (included in Exhibit 5.1). |
||
23.2 |
Consent of Independent Registered Public Accounting Firm. |
||
23.3 |
Consent of Stax Inc. |
||
24.1 |
Powers of Attorney (included in the signature pages to this registration statement). |
||
- *
- To be filed by amendment.