Attached files
| file | filename |
|---|---|
| EX-31.1 - SECTION 302 CERTIFICATION OF PEO - Feihe International Inc | v217776_ex31-1.htm |
| EX-23.2 - CONSENT OF FORMER AUDITOR - Feihe International Inc | v217776_ex23-2.htm |
| EX-23.1 - CONSENT OF AUDITOR - Feihe International Inc | v217776_ex23-1.htm |
| EX-31.2 - SECTION 302 CERTIFICATION OF PFO - Feihe International Inc | v217776_ex31-2.htm |
| EX-32.1 - SECTION 906 CERTIFICATION OF PEO AND PFO - Feihe International Inc | v217776_ex32-1.htm |
U.S. SECURITIES AND EXCHANGE COMMISSION
Washington, D.C. 20549
FORM 10-K/A
(Amendment No. 1)
|
x
|
ANNUAL REPORT UNDER SECTION 13 OR 15(d) OF THE SECURITIES AND EXCHANGE ACT OF 1934
|
For the fiscal year ended December 31, 2010
|
o
|
TRANSITION REPORT UNDER SECTION 13 OR 15(d) OF THE SECURITIES EXCHANGE ACT OF 1934
|
For the transition period from ______________ to ________________
Commission File Number: 001-32473
FEIHE INTERNATIONAL, INC.
(Exact name of registrant as specified in its charter)
|
Utah
|
90-0208758
|
|
(State or other jurisdiction of Incorporation or organization)
|
(I.R.S. Employer Identification No.)
|
Star City International Building, 10 Jiuxianqiao Road, C-16th Floor
Chaoyang District, Beijing, China 100016
(Address of principal executive offices)
Registrant’s telephone number, including area code: 86(10) 6431-9357
Securities registered under Section 12(b) of the Exchange Act:
|
Title of each class
|
Name of each exchange on which registered
|
|
Common Stock
|
New York Stock Exchange, Inc.
|
Securities registered under Section 12(g) of the Exchange Act: None
Indicate by check mark if the registrant is a well-known seasoned issuer, as defined in Rule 405 of the Securities Act. o Yes x No
Indicate by check mark if the registrant is not required to file reports pursuant to Section 13 or Section 15(d) of the Act. o Yes x No
Indicate by check mark whether the registrant (1) has filed all reports required to be filed pursuant to Section 13 or Section 15(d) of the Securities Exchange Act of 1934 during the preceding 12 months (or for such shorter period that the registrant was required to file such reports), and (2) has been subject to such filing requirements for the past 90 days. x Yes o No
Indicate by check mark whether the registrant has submitted electronically and posted on its corporate Web site, if any, every Interactive Data File required to be submitted and posted pursuant to Rule 405 of Regulation S-T (§ 232.405 of this chapter) during the preceding 12 months (or for such shorter period that the registrant was required to submit and post such files). o Yes o No
Indicate by check mark if disclosure of delinquent filers pursuant to Item 405 of Regulation S-K is not contained herein, and will not be contained, to the best of registrant’s knowledge, in definitive proxy or information statements incorporated by reference in Part III of this Form 10-K or any amendment to this Form 10-K. x
Indicate by check mark whether the registrant is a large accelerated filer, an accelerated filer, or a non-accelerated filer. See definition of ”accelerated filer and large accelerated filer” in Rule 12b-2 of the Exchange Act. (Check one):
|
Large accelerated filer o
|
Accelerated filer x
|
Non-accelerated filer o
|
Smaller Reporting Company o
|
Indicate by check mark whether the registrant is a shell company (as defined in Rule 12b-2 of the Act). o Yes x No
The aggregate market value of the voting and non-voting common equity held by non-affiliates of the registrant as of the last business day of the registrant’s most recently completed second fiscal quarter, based upon the closing sale price of the registrant’s common stock on June 30, 2009 as reported on the NYSE, was approximately $177,850,000.
As of March 25, 2011, there were 22,306,291 shares of the registrant’s common stock outstanding.
DOCUMENTS INCORPORATED BY REFERENCE
Certain information is incorporated by reference to the Proxy Statement for the registrant’s 2010 Annual Meeting of Shareholders to be filed with the Securities and Exchange Commission pursuant to Regulation 14A not later than 120 days after the end of the fiscal year covered by this Form 10-K.
TABLE OF CONTENTS
|
PART I
|
||||
|
Item 1.
|
Business
|
1
|
||
|
Item 1A.
|
Risk Factors
|
11
|
||
|
Item 1B.
|
Unresolved Staff Comments
|
21
|
||
|
Item 2.
|
Properties
|
21
|
||
|
Item 3.
|
Legal Proceedings
|
21
|
||
|
Item 4.
|
(Removed and Reserved)
|
21
|
||
|
PART II
|
||||
|
Item 5.
|
Market for the Registrant’s Common Stock, Related Shareholder Matters and Issuer Repurchases of Equity Securities
|
22
|
||
|
Item 6.
|
Selected Financial Data
|
23
|
||
|
Item 7.
|
Management’s Discussion and Analysis of Financial Condition and Results of Operations
|
25
|
||
|
Item 7A.
|
Quantitative and Qualitative Disclosures About Market Risk
|
40
|
||
|
Item 8.
|
Financial Statements and Supplementary Data
|
41
|
||
|
Item 9.
|
Changes in and Disagreements with Accountants on Accounting and Financial Disclosure
|
41
|
||
|
Item 9A.
|
Controls and Procedures
|
41
|
||
|
Item 9B.
|
Other Information
|
44
|
||
|
PART III
|
||||
|
Item 10.
|
Directors, Executive Officers and Corporate Governance
|
45
|
||
|
Item 11.
|
Executive Compensation
|
45
|
||
|
Item 12.
|
Security Ownership of Certain Beneficial Owners and Management and Related Shareholder Matters
|
45
|
||
|
Item 13.
|
Certain Relationships and Related Transactions, and Director Independence
|
45
|
||
|
Item 14.
|
Principal Accountant Fees and Services
|
45
|
||
|
PART IV
|
||||
|
Item 15.
|
Exhibits and Financial Statement Schedules
|
46
|
In this Annual Report on Form 10-K, references to “dollars” and “$” are to United States dollars and, unless the context otherwise requires, references to “Feihe International,” “we,” “us” and “our” refer to Feihe International, Inc. and its consolidated subsidiaries.
EXPLANATORY NOTE
We are filing this Amendment No. 1 on Form 10-K/A (this “Amendment 1”) to our Annual Report on Form 10-K for the year ended December 31, 2010, filed with the Securities and Exchange Commission (the “SEC”) on March 31, 2011 (the “Original Filing”), to correct inadvertent printer errors. In this Amendment 1, we are:
|
|
·
|
Adding reference to the going concern emphasis paragraph in the final sentence of the Report of Independent Registered Public Accounting Firm in Item 9A.
|
|
|
·
|
Clarifying the discussions in Item 9A under the subheadings “Changes in Internal Controls” and “Remediation Plan.”
|
|
|
·
|
Inserting the phrase “as of December 31, 2010 and 2009” in the line items for notes receivable and trade receivables in our audited consolidated balance sheets and in the line item for notes receivable in the parent company balance sheet in Schedule 1.
|
|
|
·
|
Clarifying the discussion of welfare benefits in Note 23 to our consolidated financial statements.
|
|
|
·
|
Revising the line item name for other operating income in the parent company statements of operation in Schedule 1.
|
|
|
·
|
Correcting two summing errors in the Contractual Obligations table.
|
We have also made conforming changes, and corrected certain minor grammatical or typographical errors, throughout this Amendment 1.
As required by Rule 12b-15 under the Securities Exchange Act of 1934, as amended, new certifications by our Principal Executive Officer and Principal Financial Officer are being filed as exhibits to this Amendment 1 under Item 15 of Part IV.
For convenience, we have repeated the Original Filing in its entirety. No other changes have been made to the Original Filing, which continues to speak as of the date of the Original Filing, does not reflect any subsequent information or events, and does not modify, amend or update in any way any other item or disclosure in the Original Filing. Accordingly, this Amendment 1 should be read in conjunction with our filings made with the SEC subsequent to the Original Filing, including amendments to such filings.
PART I
Item 1. Business
Overview
We are a leading producer and distributor of milk powder, soybean milk powder, and related dairy products in the People’s Republic of China, or the PRC. Using proprietary processing techniques, we make products that are specially formulated for particular ages, dietary needs and health concerns. We have over 200 company-owned milk collection stations, two company-owned dairy farms, seven production facilities with an aggregate milk powder production capacity of approximately 1,950 tons per day and an extensive distribution network that reaches over 80,000 retail outlets throughout China.
Corporate History and Structure
We were incorporated in the State of Utah on December 31, 1985, originally under the corporate name of Gaslight, Inc. We were inactive until March 30, 1988, when we changed our corporate name to Lazarus Industries, Inc. and engaged in the business of manufacturing and marketing medical devices. We discontinued this business in 1991 and became a non-operating public company shell. Effective May 7, 2003, we acquired 100% of the issued and outstanding capital stock of American Flying Crane Corporation, or AFC, a Delaware corporation that operates a dairy business in China through various subsidiaries. In connection with that acquisition, we changed our name to American Dairy, Inc. In October 2010, we changed our name to Feihe International, Inc.
1
Today, we own various subsidiaries in the PRC that operate our business, including:
|
·
|
Heilongjiang Feihe Dairy Co., Limited, or Feihe Dairy, which produces, packages and distributes milk powder and other dairy products;
|
|
·
|
Gannan Flying Crane Dairy Products Co., Limited, or Gannan Feihe, which produces milk products;
|
|
·
|
Shanxi Feihesantai Biotechnology Scientific and Commercial Co., Limited, or Shanxi Feihe, which produces walnut and soybean products;
|
|
|
·
|
Langfang Flying Crane Dairy Products Co., Limited, or Langfang Feihe, which packages and distributes finished products;
|
|
·
|
Baiquan Feihe Dairy Co., Limited, or Baiquan Dairy, which produces milk products;
|
|
·
|
Heilongjiang Feihe Kedong Feedlots Co., Limited, or Kedong Farms, which operates dairy farms;
|
|
·
|
Heilongjiang Feihe Gannan Feedlots Co., Limited, or Gannan Farms, which operates dairy farms;
|
|
·
|
Heilongjiang Aiyingquan International Trading Co., Limited, or Aiyingquan, which markets and distributes water and cheese, specifically marketed for consumption by children;
|
|
·
|
Heilongjiang Flying Crane Trading Co., Limited, or Feihe Trading, which sells milk and soybean related products;
|
|
|
·
|
Qiqihaer Feihe Soybean Co., Limited, or Feihe Soybean, which manufactures and distributs soybean products; and
|
|
|
·
|
Beijing Feihe Biotechnology Scientific and Commercial Co., Limited, or Beijing Feihe, which markets and distributs dairy products.
|
The following chart reflects the current corporate structure of the Feihe International entities:
2
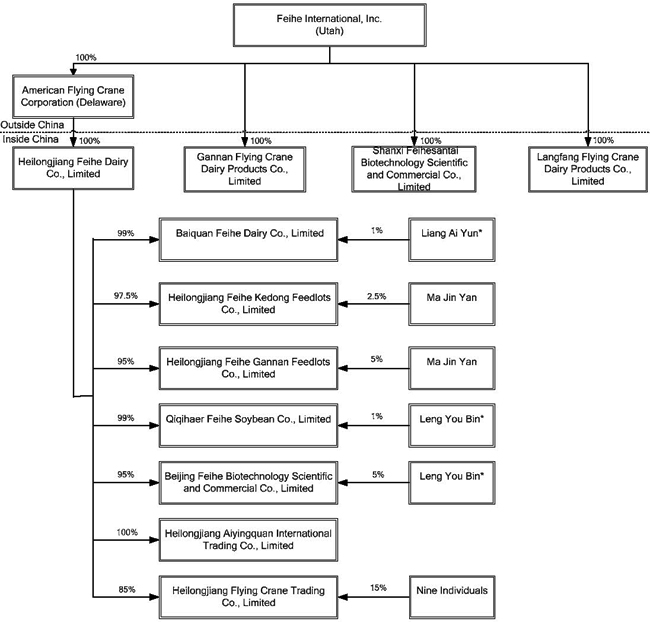
* Indicates a nominee shareholder who, pursuant to a former requirement under the PRC Company Law that certain PRC companies have at least two shareholders, holds its equity interest for the benefit of the majority shareholder.
Principal Products
Our products fall into four main product categories: milk powder, soybean powder, rice cereal and walnut and other products.
Milk Powder
Milk powder is our primary product and is divided into several sub-categories. We produce milk powder for infants and young children formulated for zero to six months, six months to one year, one to three years and three to six years of age. We also produce milk powder for expectant mothers, students and for the middle-aged and elderly populations. In addition, we occasionally purchase semi-finished milk powder, which we refer to as “raw milk powder,” from third parties, which we then process and distribute to beverage manufacturers and other wholesalers for use in their blended drink products.
Soybean Powder
Soybean powder is an auxiliary product to our milk powders and represents a low fat, high calcium alternative to milk powder, particularly for seniors.
3
Rice Cereal
Rice cereal is an auxiliary product to our milk powders and represents a low fat, high calcium alternative to milk powder, particularly for young children, teenagers, and seniors. We purchase semi-finished rice cereal from third parties, process it, and then distribute it to wholesalers and retailers.
Walnut and Other Products
We produce other auxiliary products that we market in conjunction with our infant milk powder, as well as to health-conscious adults. Walnut products include walnut powder and walnut oil. Other products include cream, skim milk powder, full milk powder, butter, cheese and other related milk powder products and water and cheese marketed specifically for children.
Product Sales
The following tables reflect the sales of our principal products during the fiscal years ended December 31, 2010, 2009 and 2008:
|
2010
|
2009
|
2010 over 2009
|
||||||||||||||||||||||||||||||||||
|
Product name
|
Quantity
(Kg’000)
|
Amount
($’000)
|
% of
Sales
|
Quantity
(Kg’000)
|
Amount
($’000)
|
% of
Sales
|
Quantity
(Kg’000)
|
Amount
($’000)
|
%
|
|||||||||||||||||||||||||||
|
Milk powder
|
22,816
|
180,218
|
70.1
|
28,783
|
216,230
|
79.8
|
(5,967
|
)
|
(36,012
|
)
|
(16.7
|
)
|
||||||||||||||||||||||||
|
Raw milk powder
|
15,691
|
57,752
|
22.5
|
11,637
|
34,328
|
12.7
|
4,054
|
23,424
|
68.2
|
|||||||||||||||||||||||||||
|
Soybean powder
|
4,917
|
10,812
|
4.2
|
3,349
|
7,319
|
2.7
|
1,568
|
3,493
|
47.7
|
|||||||||||||||||||||||||||
|
Rice cereal
|
633
|
4,040
|
1.6
|
1,103
|
6,730
|
2.5
|
(470
|
)
|
(2,690
|
)
|
(40.0
|
)
|
||||||||||||||||||||||||
|
Walnut products
|
263
|
1,511
|
0.6
|
601
|
3,070
|
1.1
|
(338
|
)
|
(1,559
|
)
|
(50.8
|
)
|
||||||||||||||||||||||||
|
Other
|
2,207
|
2,767
|
1.0
|
543
|
3,401
|
1.2
|
1,664
|
(634
|
)
|
(18.6
|
)
|
|||||||||||||||||||||||||
|
Total
|
46,527
|
257,100
|
100
|
46,016
|
271,078
|
100
|
511
|
(13,978
|
)
|
(5.2
|
)
|
|||||||||||||||||||||||||
|
2009
|
2008
|
2009 over 2008
|
||||||||||||||||||||||||||||||||||
|
Product name
|
Quantity
(Kg’000)
|
Amount
($’000)
|
% of
Sales
|
Quantity
(Kg’000)
|
Amount
($’000)
|
% of
Sales
|
Quantity
(Kg’000)
|
Amount
($’000)
|
%
|
|||||||||||||||||||||||||||
|
Milk powder
|
28,783
|
216,230
|
79.8
|
16,311
|
121,255
|
62.8
|
12,472
|
94,975
|
78.3
|
|||||||||||||||||||||||||||
|
Raw milk powder
|
11,637
|
34,328
|
12.7
|
16,572
|
60,753
|
31.4
|
(4,935)
|
(26,425)
|
(43.5)
|
|||||||||||||||||||||||||||
|
Soybean powder
|
3,349
|
7,319
|
2.7
|
2,153
|
4,400
|
2.3
|
1,196
|
2,919
|
66.3
|
|||||||||||||||||||||||||||
|
Rice cereal
|
1,103
|
6,730
|
2.5
|
816
|
4,631
|
2.4
|
287
|
2,099
|
45.3
|
|||||||||||||||||||||||||||
|
Walnut products
|
601
|
3,070
|
1.1
|
327
|
1,663
|
0.9
|
274
|
1,407
|
84.6
|
|||||||||||||||||||||||||||
|
Other
|
543
|
3,401
|
1.2
|
727
|
490
|
0.2
|
(184)
|
2,911
|
594.1
|
|||||||||||||||||||||||||||
|
Total
|
46,016
|
271,078
|
100
|
36,906
|
193,192
|
100
|
9,110
|
77,886
|
40
|
|||||||||||||||||||||||||||
Sources of Milk
We source our fresh milk from numerous small dairy farmers that have provided us access to over 200,000 cows that provide milk to our over 200 company-owned milk collection stations. On average, each cow provides four tons of milk per year, which farmers deliver to our milk collection stations. In addition, we own two dairy farms, Gannan Farms and Kedong Farms, which currently house a total of approximately 17,000 Australian Holstein cows, each of which, on average, provides us with 8-10 tons of milk per year. We expect that each of our dairy farms will have annual capacity to source up to 70,000 tons of fresh milk per year.
Raw Milk Processing
We believe that, through purchasing raw milk locally and employing minimal processing techniques, we are able to preserve the fresh taste of milk. The industry standard for the time it takes for raw milk to be converted to milk powder is approximately 48 hours. Many large regional dairies, we believe, process raw milk that may be three to four days old. Milk processed by conventional farms for sale to regional dairies is typically stored at the farm for a minimum of two days, commonly spends a full day in transit to the dairy facility, and is processed the following day.
4
However, our standard is to process the raw milk within 6-24 hours after milking, depending upon the time of day the raw milk is delivered to us. Within this time, the milk is chilled, transported, separated, sterilized and spray-dried. The raw milk is first received from milk collection centers or from our company-owned dairy farms. Fully enclosed, stainless-steel vacuum milking machines are used to receive the raw milk. Once received, the raw milk will no longer have any contact with air and is immediately processed with refrigeration equipment that cools the raw milk within four seconds to approximately zero to four degrees Celsius. The raw milk is then stored in air-tight tanks in preparation for advanced processes, which include milk fat separation, sterilization and spray-drying.
The milk used in our products is not homogenized. During homogenization, pressurized milk is forced through openings smaller than the size of the fat globules present in milk, breaking them into smaller particles. Thus treated, the milk fat remains suspended and does not separate out in the form of cream. We believe that this process adversely affects the taste and feel of milk. In addition, our milk is pasteurized at the lowest temperatures allowed by law to avoid imparting a cooked flavor to the milk. When the milk is clarified and the butterfat removed to yield cream and skim milk, a process of cold separation is used, rather than the more commonly employed hot separation, which we believe adversely affects the flavor of the milk.
Dairy Product Processing
Our products are made in small batches using minimal processing techniques to maintain freshness and allow maximum flavor and nutrition retention. They are made with wholesome ingredients and no chemicals or additives are employed. Our dairy products arrive to consumers in our marketing area sooner after production than most other dairy products because they are produced locally. To assure product quality, the beginning of each production run is sampled for flavor, aroma, texture and appearance. In addition, inspectors conduct spot-checks for bacteria and butterfat content in our products, as well as sanitary conditions in our facilities.
Quality Assurance
We are committed to delivering high-quality dairy products. We apply a 25-step quality control process that involves over a hundred points of testing from the feed for the dairy cows, throughout our manufacturing process, and extending to semi-finished products, which we purchase from third parties for further processing, and finished products.
The production facilities we have constructed comply with pharmaceutical good manufacturing practice, or GMP, standards, a higher level of quality control than required for consumer goods manufacturing facilities. Since 2000, our production facilities have obtained ISO 9002 and HACCP quality assurance certifications, as well as quality certifications from the PRC regulatory authorities. Our processing equipment is manufactured by well-known European manufacturing companies. We use whole-sealing and mechanized vacuum milk-pressing devices with freezing equipment for each milk station, which allows us to reduce the temperature of raw milk to zero to four degrees Celsius within seconds for storage. Our equipment also eliminates external air contact from the time milk is collected through the time that it is fully processed. We employ automated processes and scientific parameters throughout the manufacturing process that are designed to ensure that all products meet our quality requirements. We have in-house laboratories that utilize proprietary in-line sampling techniques to ensure the quality and safety of the entire production process, from raw materials to semi-finished products to finished products. We believe that our rigorous testing and inspection procedures have been critical in ensuring that our products are free from melamine and other contaminants, are premium quality products and are safe and healthy for customers.
Production and Packaging Facilities
We own and operate seven production and packaging facilities. The production facilities we have constructed comply with pharmaceutical GMP standards, a higher level of quality control than required for consumer goods manufacturing facilities. Since 2000, our production facilities have obtained ISO 9002 and HACCP quality assurance certifications, as well as quality certifications from the PRC regulatory authorities. In March 2011, we successfully renewed our manufacturing licenses with Heilongjiang and Hebei Bureau of Quality and Technical Supervision. The renewal permit was granted under regulatory measure introduced by the General Administration of Quality Supervision, Inspection and Quarantine of China in 2010. We believe that our design standards help us assure our product quality. We believe that we are one of the few PRC milk producers that have processing areas that meet a 300,000 cleanliness purification standard, which means that there are less than 300,000 dust particles per cubic centimeter of air. In a standard room, dust particles can reach over two million dust particles per cubic centimeter of air. Continuing our commitment to quality, we have also added testing equipment and other quality control procedures to our processing equipment manufactured by known European and American manufacturing companies.
5
Feihe Dairy
Located in Kedong, Heilongjiang Province, China, the Feihe Dairy premises are approximately 88,221 square meters. The plant is approximately 10 years old, although it was completely remodeled in 2005. Feihe Dairy principally produces infant milk formula and has a production capacity of 550 tons per day of milk powder. In addition, Feihe Dairy serves as a packaging facility and packages approximately 22,000 tons of products per year.
Gannan Feihe
Located in Gannan, Heilongjiang Province, China, the Gannan Feihe premises are approximately 300,000 square meters. The original plant is approximately 5 years old and commenced milk powder production in 2008. In 2010, we completed an expansion of the plant, which we refer to as “Phase II,” which is currently in a trial run stage. Gannan Feihe principally produces infant milk formula and has a production capacity of approximately 1,000 tons per day of milk powder, including the 700 tons per day added by Phase II.
Langfang Feihe
Located in Langfang, Hebei Province, China, the Langfang Feihe premises are approximately 80,243 square meters. The plant is approximately 5 years old and commenced operations in 2007. Langfang Feihe primarily serves as a packaging and distribution facility and packages approximately 50,000 tons of products per year.
Shanxi Feihe
Located in Licheng, Shanxi Province, China, the Shanxi Feihe premises are approximately 40,000 square meters. The plant is approximately 7 years old. Shanxi Feihe principally produces soybean powder, walnut powder and walnut oil and has a production capacity of approximately 5,000 tons per year of soybean powder and walnut powder combined, and 1,000 tons per year of walnut oil.
Baiquan Dairy
Located in Baiquan, Heilongjiang Province, China, the Baiquan Dairy premises are approximately 36,000 square meters. The plant is approximately 19 years old, although it was completely remodeled in 2004. Baiquan Dairy principally produces raw milk powder and has a production capacity of approximately 100 tons per day of milk powder.
Qiqihaer Feihe
Located in Qiqihaer, Heilongjiang Province, China, the Qiqihaer Feihe, a branch of Feihe Dairy, premises are approximately 90,000 square meters. The plant is approximately 6 years old. Qiqihaer Feihe principally produces infant milk formula and adult milk formula and has a production capacity of approximately 270 tons per day of milk powder. Qiqihaer Feihe also produces butter and has a production capacity of approximately 15 tons per day.
Longjiang Feihe
Located in Longjiang, Heilongjiang Province, China, the Longjiang Feihe, a branch of Gannan Feihe, premises are approximately 29,690 square meters. The plant is approximately 20 years old and is currently under expansion which is expected to be complete before the end of 2011. Longjiang Feihe produces adult milk formula and has a production capacity of approximately 16 tons per day of milk powder. Longjiang Feihe also produces raw milk powder and has a production capacity approximately 11 tons per day.
6
The table below summarizes key information regarding our production and packaging plants.
|
Facility
|
Province/
Region
|
Products
|
Production
Capacity
|
Packaging Capacity
(tons/year)
|
||||||
|
Feihe Dairy
|
Heilongjiang
|
Infant milk formula
|
550 (tons/day)
|
22,000
|
||||||
|
Gannan Feihe
|
Heilongjiang
|
Infant milk formula
|
1,000 (tons/day)
|
N/A
|
||||||
|
Langfang Feihe
|
Hebei
|
N/A
|
N/A
|
50,000
|
||||||
|
Shanxi Feihe
|
Shanxi
|
Walnut powder & Soybean powder;
|
5,000 (tons/year)
|
N/A
|
||||||
|
Walnut oil
|
1,000 (tons/year)
|
|||||||||
|
Baiquan Dairy
|
Heilongjiang
|
Raw milk powder
|
100 (tons/day)
|
N/A
|
||||||
|
Qiqihaer Feihe
|
Heilongjiang
|
Infant milk formula; Adult milk powder
|
270 (tons/day)
|
N/A
|
||||||
|
Butter
|
15 (tons/day)
|
|||||||||
|
Longjiang Feihe
|
Heilongjiang
|
Adult milk powder;
|
16 (tons/day)
|
N/A
|
||||||
|
Raw milk powder
|
11 (tons/day)
|
|||||||||
Sources of Walnut and Soybeans
We order walnuts and soybeans from local farmers for delivery to Feihe Dairy. We then distribute these raw materials to our facilities as necessary.
Product Distribution
Currently, our products are sold in stores nationwide throughout China, except in Hong Kong SAR, Macau SAR and Taiwan. Prior to distribution, we route our products to Feihe Dairy and Langfang Feihe for final packaging. Feihe Dairy then distributes our finished products primarily in northeastern China, including Heilongjiang, Jilin and Liaoning Provinces, and Langfang Feihe distributes our finished products throughout the rest of China. We have a distribution team based in our corporate headquarters that coordinates with a network of over 490 dealers or representatives in key provinces across China. The dealers, in turn, each typically hire one or two secondary agents who assist in the distribution process, including inventory management, product sales, customer service and payments. Dealer agents display and sell our products in specially designated areas in stores. In addition, in 2008 we began distributing our raw milk powder to beverage manufacturers and other wholesalers for use in their blended drink products. In 2010, we established a system to monitor distributor inventory levels and cross-territory selling activity.
Generally, we deliver our products only after receipt of payment from the dealer. We typically enter into new agreements with our dealers each year that specify sales targets and territories, among other provisions. We seek to expand the number of key provinces served by our dealer network as part of our growth strategy and ultimately to establish a distribution system based upon local production at local dairies. We currently distribute our products through an extensive distribution network that reaches over 80,000 retail outlets throughout China.
Customers
No single customer equaled or exceeded 10% of our sales during the years ended December 31, 2010, 2009 or 2008.
Intellectual Property
We rely principally on trade secrets and confidentiality agreements to protect our proprietary product formulations and production processes. We have obtained trademark registrations for the use of our trade name “Feihe,” as well as our “Xingfeifan” “Feifan,” “Feihui,” “Feirui,” “Feiyue,” and “Beidiqi” Chinese brands and our “Firmus,” “Astrobaby” and “Babyrich” English brand names, which have been registered with the PRC Trademark Bureau of the State Administration for Industry and Commerce with respect to our milk products. We have obtained trademark registrations for the use of our trade name “Feihe” and “Firmus,” which have been registered with the United States Patent and Trademark Office. We believe our trademarks are important to the establishment of consumer recognition of our products. However, due to uncertainties in PRC trademark law, the protection afforded by our trademarks may be less than we currently expect and may, in fact, be insufficient. In the event any of our trademarks are challenged or infringed, we may not have the financial resources to defend against the challenge or infringement and such defense could in any event be unsuccessful. Moreover, any events or conditions that negatively impact our trademark could have a material adverse effect on our business, operations and finances.
7
Research and Development
As of March 10, 2011, we had eight technicians engaged in research and development activities. These technicians monitor quality control at our production facilities to ensure that the processing, packaging and distribution of our milk products result in high quality premium milk products that are safe and healthy for customers. These technicians also pursue methods and techniques to improve the taste and quality of our milk products and to evaluate new milk products for further production based upon changes in consumer tastes, trends and the introduction of competitive products by other milk producers.
During the fiscal years ended December 31, 2010 and 2009, we spent approximately $169,000 and $66,000, respectively, on research and development, representing amounts paid in compensation to our quality control technicians described above.
Growth Strategy
We believe the market for dairy products in China is growing rapidly, including the market for high quality dairy products. Our growth strategy involves increasing market share during this rapid growth phase. To implement this strategy, we plan to:
|
·
|
Strengthen distribution logistics in strategic PRC markets. We plan to focus on improving sales at existing sales points, leveraging our extensive distribution network to generate revenues in a cost-effective manner. Our distribution network has grown in first-tier markets in the PRC, including Beijing, Shanghai, Guangzhou, Shenzhen and other major second and third-tier cities in the Pearl River Delta. Our extensive distribution network, which reaches many provincial capital and sub-provincial cities, has special channels into first-tier markets that we plan to expand. We believe that improving our distribution logistics in our network is important driver of our gross margins.
|
|
·
|
Strengthen our premium quality brand awareness. We believe that our products enjoy a reputation for high quality among those familiar with them, and our products routinely pass government and internal quality inspections. We have increased our advertising expenses and plan to continue advertising on China Central Television, or CCTV, as well as provincial stations in China, in order to market our products as premium and super-premium products. We believe many consumers in China tend to regard higher prices as indicative of higher quality and higher nutritional value, and as a result consumers with higher disposable incomes are increasingly inclined to purchase higher priced products, particularly in the areas of infant formula and nutritional products.
|
|
·
|
Align sourcing, production and distribution by region. We believe that we can increase our efficiency and decrease our costs if our products are produced from local sources and sold in local markets. We plan to select strategic locations for our company-owned collection stations and production facilities that will enhance this efficiency.
|
|
|
·
|
Maintaining quality through world-class production processes. We believe we can maintain our production of high quality dairy products by continuing to enter exclusive contracts with dairy farmers who can deliver quality milk, strengthening our company-owned large-scale dairy farm operations, expanding our company-owned collection stations and production facilities, and employing comprehensive testing and quality control measures.
|
8
Competition
The dairy industry in China is highly competitive. We face significant competition from large multinational producers, such as Dumex, Mead Johnson, Abbott and Wyeth, and large national milk companies, such as Yili, Beingmate, Synutra and Yashili, particularly in more affluent major urban areas. Many of our competitors have greater resources and sell more products than we do. We believe that our competitive position has improved following the melamine crisis in 2008, which did not involve any of our products. Our products are positioned as premium products and, accordingly, are generally priced higher than many similar competitive products. We believe that the principal competitive factors in marketing our products are quality, taste, freshness, price and product recognition. While we believe that we compete favorably in terms of quality, taste and freshness, our products are more expensive and less well known than certain other established brands. Our premium products may also be considered in competition with non-premium quality dairy products for discretionary food dollars.
Government Regulation
We are regulated under national, provincial and local laws in China. The following information summarizes aspects of those regulations that apply to us and is qualified in its entirety by reference to all particular statutory or regulatory provisions. Regulations at the national, provincial and local levels in China are subject to change. To date, compliance with governmental regulations has not had a material impact on our level of capital expenditures, earnings or competitive position, but, because of the evolving nature of such regulations, we are unable to predict the impact such regulations may have in the foreseeable future.
As a producer and distributor of nutritional products, and particularly dairy-based food products in China, we are subject to the regulations of China’s Agricultural Ministry. This regulatory scheme governs the manufacture (including composition and ingredients), labeling, packaging and safety of food. Specific PRC laws and regulations we face include:
|
·
|
the PRC Product Quality Law;
|
|
·
|
the PRC Food Hygiene Law;
|
|
·
|
the Access Conditions for Dairy Products Processing Industry;
|
|
·
|
the Implementation Rules on the Administration and Supervision of Quality and Safety in Food Producing and Processing enterprises;
|
|
·
|
the Regulation on the Administration of Production Licenses for Industrial Products;
|
|
·
|
the General Measure on Food Quality Safety Market Access Examination;
|
|
·
|
the General Standards for the Labeling of Prepackaged foods;
|
|
·
|
the Implementation Measures on Examination of Dairy Product Production Permits;
|
|
·
|
the Standardization Law;
|
|
·
|
the Raw Milk Collection Standard;
|
|
·
|
the Whole Milk Powder, Skimmed Milk Powder, Sweetened Whole Milk Powder and Flavored Milk Powder Standards; and
|
|
·
|
the General Technical Requirements for Infant Formula Powder and Supplementary Cereal for Infants and Children.
|
We and our products are also subject to provincial and local regulations through such measures as the licensing of dairy manufacturing facilities, enforcement of standards for our products, inspection of our facilities and regulation of our trade practices in connection with the sale of dairy products.
In March 2008, the PRC National Development and Reform Commission, or the NDRC, promulgated the Access Conditions for Dairy Products Processing Industry, or the Access Conditions. The Access Conditions set forth the conditions an entity must satisfy in order to engage, or continue to engage, in the dairy products processing business in China, including technique and equipment, product quality, energy and water consumption, sanitation and environmental protection, as well as production safety. Any new or continuing dairy products processing projects or enterprises will be required to meet all the conditions and requirements set forth in the Access Conditions. For projects or enterprises that already commenced operations before the promulgation of the Access Conditions, improvements or rectification actions may need to be taken in order to have such projects or enterprises meet the conditions within two years of the effective date of the Access Conditions on April 1, 2010.
9
The Access Conditions also set forth requirements relating to the location, processing capacity and raw milk source for any new or continuing dairy products processing project or enterprise. Any new or continuing dairy processing projects or enterprises that fail to meet the requirements will not be able to procure land, license, permits, loan facilities and electricity necessary for the processing of dairy products, and those projects or enterprises already in operation before the promulgation of the Access Conditions will be deregistered and ordered to shut down if they fail to meet the conditions within a two-year rectification period.
In May 2008, the NDRC issued the Dairy Industry Policies, or the Policies. According to the PRC government, the Policies are the first set of comprehensive government policies on the dairy industry in China, covering a broad range of matters such as industry planning, closure of inefficient capacity, milk supply, quality control and product safety, environmental protection and promotion of milk consumption. Moreover, the Policies provide conditions that new entrants to the dairy industry must meet in addition to the conditions set forth in the Access Conditions.
As a result of the melamine crisis, PRC governmental authorities have conducted several dairy industry inspections. In addition to the initial 22 companies implicated in the melamine crisis, these subsequent government inspections have identified other companies with unacceptable contaminants in dairy products. The melamine crisis did not involve any of our products, and we have passed all of these government inspections. In addition, we have worked with the PRC government and attended several emergency meetings to discuss ways to improve the dairy and overall food industry in China.
In 2010, the General Administration of Quality Supervision, Inspection and Quarantine of China, or AQSIQ, announced a nationwide renewal inspection for all infant formula manufacturing facilities in China. In March 2011, we successfully renewed our manufacturing license.
Environmental Matters
Our manufacturing facilities are subject to various pollution control regulations with respect to noise, water and air pollution and the disposal of waste and hazardous materials. We are also subject to periodic inspections by local environmental protection authorities. Our operating subsidiaries have received certifications from the relevant PRC government agencies in charge of environmental protection indicating that their business operations are in material compliance with the relevant PRC environmental laws and regulations. We are not currently subject to any pending actions alleging any violations of applicable PRC environmental laws.
Employees
As of March 20, 2011, we had approximately 3,219 employees on our payroll. We had eight group administrators, approximately 626 employees were in marketing and sales, approximately 80 employees provided marketing support, approximately 210 employees were performing administrative functions, including financing, auditing and human resources, and approximately 2,295 employees were in production, storage and distribution. Our employees are not represented by a labor union or covered by a collective bargaining agreement. We have not experienced any work stoppages. We believe that our relations with our employees are good.
10
Financial Information about Segments and Geographic Areas
We have two operating segments: dairy products and dairy farm. Our dairy products segment produces and sells dairy products, such as wholesale and retail milk powders, as well as soybean powder, rice cereal, walnut powder and walnut oil. Our dairy farm segment operates our two company-owned dairy farms, Gannon Farms and Kedong Farms, construction of which we completed in the fourth quarter of 2009. Our dairy farms provide milk to us and normally do not provide milk to external customers. Please see Note 33 to our audited financial statements included elsewhere in this report for further discussion about segments. As we primarily generate our revenues from customers in the PRC, we do not present geographical segments.
Available Information
Our website is http://ady.feihe.com. We provide free access to various reports that we file with, or furnish to, the U.S. Securities and Exchange Commission, or the SEC, through our website, as soon as reasonably practicable after they have been filed or furnished. These reports include, but are not limited to, our annual reports on Form 10-K, quarterly reports on Form 10-Q, current reports on Form 8-K, and any amendments to those reports. Also available on our website are printable versions of our Code of Business Conduct and Ethics and charters of our Audit Committee, Compensation Committee, Nominating/Corporate Governance Committee and other committees of our board of directors. Information on our website does not constitute part of and is not incorporated by reference into this Annual Report on Form 10-K or any other report we file or furnish with the SEC. Our SEC reports can also be accessed through the SEC’s website at www.sec.gov and may be read or copied at the SEC’s Public Reference Room located at 100 F Street, NE, Washington, D.C., 20549. Information regarding the Public Reference Room may be obtained by calling the SEC at 1-800-SEC-0330.
FORWARD-LOOKING STATEMENTS
The statements included in this report that are not purely historical are forward-looking statements within the meaning of Section 21E of the Securities Exchange Act, or the Exchange Act, and Section 27A of the Securities Act of 1933, as amended, or the Securities Act. These statements include, but are not limited to, statements about our plans, objectives, expectations, strategies, intentions or other characterizations of future events or circumstances and are generally identified by the words “may,” “expects,” “anticipates,” “intends,” “plans,” “believes,” “seeks,” “estimates,” “could,” “would,” and similar expressions. Because these forward-looking statements are subject to a number of risks and uncertainties, our actual results could differ materially from those expressed or implied by these forward-looking statements. Factors that could cause or contribute to such differences include, but are not limited to, those discussed under the heading “Risk Factors” and in other documents we file from time to time with the Securities and Exchange Commission. All forward-looking statements included in this report are based on information available to us on the date hereof. Our business and the associated risks may have changed since the date this report was originally filed with the SEC. We assume no obligation to update any such forward-looking statements.
Item 1A. Risk Factors
Investing in our common stock involves a high degree of risk. You should carefully consider the following risk factors and all other information contained in this report before purchasing our common stock. If any of the following events were to occur, our business, financial condition or results of operations could be materially and adversely affected. In these circumstances, the market price of our common stock could decline, and you could lose some or all of your investment. Additional risks and uncertainties not currently known to us or that we currently believe to be immaterial could also materially and adversely affect our business, financial condition, operating results and/or cash flow.
Any negative public perception regarding our products or industry, or any ill effects or product liability claims, could harm our reputation, damage our brand, result in costly and damaging recalls, and expose us to government investigations and sanctions, which would materially and adversely affect our results of operations.
11
We sell products for human consumption, which involves risks such as product contamination, spoilage and tampering. In 2008, sales in China of substandard milk formula contaminated with a substance known as melamine caused the death of six infants as well as illness of nearly 300,000 others. In 2009 and 2010, new incidents of substandard milk formula contaminated with melamine and hydrolyzed leather protein also occurred in China. Although our products were not involved in these incidents, China’s Administration of Quality Supervision, Inspection and Quarantine found that the products of at least 22 Chinese milk and formula producers were contaminated by melamine, a substance not approved for use in food, which caused significant negative publicity for the entire dairy industry in China. Furthermore, in 2010 there were widely publicized claims that certain Chinese infant formula products were linked to precocious puberty in female infants. While governmental authorities concluded these claims were false, the operations of the companies involved were adversely effected. The mere publication of information asserting that our milk powder, infant formula or other products contain melamine or other contaminants or have harmful health effects could have a material adverse effect on us, regardless of whether these reports are scientifically supported or concern our products or the raw materials used in our products. In addition, if the consumption of any of our products causes injury, illness or death, we may face product liability claims, product recalls, temporary or permanent suspensions of operations, government investigations or sanctions, any of which could be extremely expensive and damaging to our business.
Prior to the 2008 melamine crisis, there have also been widely publicized occurrences of counterfeit, substandard milk products in China. For example, in April 2004, such sales of counterfeit and substandard infant formula in Anhui Province, China caused the deaths of 13 infants and harmed many others. Counterfeiting or imitation of our products may occur in the future, and we may not be able to detect it and deal with it effectively. Any occurrence of counterfeiting or imitation could negatively impact our corporate brand and image or consumers’ perception of our products or similar nutritional products generally, particularly if the counterfeit or imitation products cause injury or death to consumers.
Our products may not achieve market acceptance.
We are currently selling our products principally in northern, central, and eastern China. Achieving market acceptance for our products, particularly in new markets, will require substantial marketing efforts and the expenditure of significant funds. There is substantial risk that any new markets may not accept or be as receptive to our products. In addition, we market our products as premium and super-premium products and have adopted a corresponding pricing model, which may not be accepted in new or existing markets. Market acceptance of our current and proposed products will depend, in large part, upon our ability to inform potential customers that the distinctive characteristics of our products make them superior to competitive products and justify their pricing. Our current and proposed products may not be accepted by consumers or able to compete effectively against other premium or non-premium dairy products. Lack of market acceptance would limit our revenues.
We have recently incurred operating losses, which may have a harmful effect on the value of our common stock.
In the year ended December 31, 2010, we incurred a net loss of approximately $9.9 million, primarily attributable to a decrease in revenue, an increase in cost of goods sold, and an increase in operating expenses. Under-producing cows at our company-owned dairy farms contributed to increased operating expenses. We recognized a loss on disposal of cows of approximately $10.2 million in 2010. If our revenue does not grow as expected or if we fail to control and improve the effectiveness of our expenditures, including expenses associated with managing our dairy farms, we may not be able to achieve or sustain operating profitability on a consistent basis. Our lack of profitability may have an adverse effect on the market value of our common stock and on our cash flow and liquidity.
The report of our independent registered public accounting firm contains a reference raising substantial doubt about our ability to continue as a “going concern.”
Because of our deficiency of net current assets as of and significant net loss for the fiscal year ended December 31, 2010, we may not have sufficient cash to fund our expected cash flow requirements for the next 12 months including the maturity of our short-term loans, redemption of our redeemable common stock and planned capital expenditures. Therefore, our independent registered public accounting firm has included a reference in its report on our consolidated financial statements for the fiscal year ended December 31, 2010 referring to substantial doubt regarding our ability to continue as a “going concern.” As of and for the year ended December 31, 2010, we had net loss of approximately $9.9 million and deficiency of net current assets of approximately $59.3 million, with short-term loans of approximately $68.8 million that mature in the next 12 months and redeemable common stock of $63 million expected to be redeemed in the upcoming fiscal year. While we believe we will be able to refinance much of our short-term bank loans when they become due and that our cash generated from operations, along with existing cash and our ability to draw down on unutilized credit lines, will be sufficient to fund our expected cash flow requirements for at least the next 12 months, including the redemption of our redeemable common stock and planned capital expenditures. Our belief may be mistaken.
Substantial doubt about our ability to continue as a going concern could affect our relationships with suppliers or customers. In accordance with generally accepted accounting principles in the U.S., or GAAP, our balance sheet generally states the book value of our assets, which does not necessarily represent the value that could be realized from the assets if we could not continue as a going concern.
Our planned growth may require more raw milk than is available and could diminish the quality of our dairy products.
Our business requires a supply of raw milk. Our growth will be limited if the supply of raw milk is insufficient to meet demand. Moreover, as we attempt to implement our growth strategy, it may become difficult to maintain current levels of quality control. Inadequate quality control could harm our reputation and the demand for our products, which would also limit our growth. A significant amount of the raw milk used in our products is supplied to us by numerous local farms under output contracts. We believe that our farmers can increase their production of raw milk. We further believe, however, that this supply may not be sufficient to meet increased demand for our products associated with our proposed marketing efforts and that such increase may compromise quality. Though we believe that additional raw milk is available locally, if needed, we may not be able to enter into arrangements with the producers of such milk on terms acceptable to us, if at all. Our efforts to source milk through our company-owned dairy farms are new, may involve unforeseen difficulties, and may not supply the quantity of raw milk we need to maintain and expand our levels of production. An inadequate supply of raw milk, coupled with concern over quality control, could increase costs for raw milk or decrease the sales price for our products, which could limit our ability to grow, cause our earnings to decline and make our business unable to become profitable.
12
The recent global economic and financial market crisis could significantly impact our financial condition.
Current global economic conditions could have a negative effect on our business and results of operations. Economic activity in China, the United States and throughout much of the world has undergone significant economic downturns following the housing crisis in the real estate and credit markets in both the United States and Europe, as well as natural disasters and related concerns in Asia. Market disruptions have included extreme volatility in securities prices, as well as severely diminished liquidity and credit availability. The economic crisis may adversely affect us in a variety of ways. Access to lines of credit or the capital markets may be severely restricted, which may preclude us from raising funds required for operations and to fund continued expansion. It may be more difficult for us to complete strategic transactions with third parties. The financial and credit market turmoil could also negatively impact our suppliers and customers, which could decrease our ability to source, produce and distribute our products and could decrease demand for our products. While it is not possible to predict with certainty the duration or severity of the current disruption in financial and credit markets, if economic conditions continue to worsen, it is possible these factors could significantly impact our financial condition.
Our results of operations may be affected by fluctuations in availability and price of raw materials.
The raw materials we use are subject to price fluctuations due to various factors beyond our control, including, among other pertinent factors:
|
·
|
increasing market demand;
|
|
·
|
inflation;
|
|
·
|
severe climatic and environmental conditions;
|
|
·
|
seasonal factors, with dairy cows generally producing more milk in temperate weather as opposed to cold or hot weather and extended unseasonably cold or hot weather potentially leading to lower than expected production;
|
|
·
|
commodity price fluctuations;
|
|
·
|
currency fluctuations; and
|
|
·
|
changes in governmental and agricultural regulations and programs.
|
For example, our external raw milk unit purchase cost increased by approximately 24% in 2010 due to various factors, including, we believe, general economic conditions, such as inflation and fuel prices, and rising production costs due to various other factors, including increased competition abroad and currency appreciation. We also expect that our raw material prices will continue to fluctuate and be affected by all of these factors in the future. Changes to our raw materials prices may result in increases in production and packaging costs, and we may be unable to raise the prices of our products to offset such increases in the short term or at all. As a result, our results of operations may be materially and adversely affected.
13
We are subject to public company reporting and other requirements for which we will incur substantial costs and our accounting and other management systems and resources may not be adequately prepared.
We incur significant legal, accounting, insurance and other expenses as a result of being a public company. For example, laws and regulations affecting public companies, including the provisions of the Sarbanes-Oxley Act of 2002, or SOX, and rules related to corporate governance and other matters subsequently adopted by the SEC and the NYSE, result in substantial costs to us, including legal and accounting costs, and may divert our management’s attention from other matters that are important to our business.
We have historically identified material weaknesses in our internal control over financial reporting. If we fail to remediate the material weaknesses or maintain an effective system of internal control over financial reporting, we may be unable to accurately report our financial results or prevent fraud, and investor confidence and the market price of our shares may be adversely affected.
We and our independent registered public accounting firm, in connection with the audit of internal control over financial reporting under Section 404 of the Sarbanes-Oxley Act for the fiscal year ended December 31, 2010, have identified the following material weakness in our internal control over financial reporting: We had insufficient accounting personnel with appropriate knowledge of GAAP. A “material weakness” is a deficiency, or a combination of deficiencies, in internal control over financial reporting, such that there is a reasonable possibility that a material misstatement of the company’s annual or interim financial statements will not be prevented or detected on a timely basis. We have taken measures and plan to continue to take measures to remedy this material weakness. However, the implementation of these measures may not fully address the material weakness in our internal control over financial reporting. Our failure to address any control deficiency could result in inaccuracies in our financial statements and could also impair our ability to comply with applicable financial reporting requirements and related regulatory filings on a timely basis. Moreover, effective internal control over financial reporting is important to prevent fraud. As a result, our business, financial condition, results of operations and prospects, as well as the trading price of our shares, may be materially and adversely affected.
We significantly depend on our management team.
Each of our executive officers is responsible for an important aspect of our operations. In addition, we rely on management and senior personnel to ensure that our sourcing, production, sales, distribution and other business functions are effective. Losing the services of our executive officers or key personnel could be detrimental to our operations. We do not have key-man life insurance for any of our executive officers or other employees.
Investors may not be able to enforce judgments entered by United States courts against certain of our officers and directors.
We are incorporated in the State of Utah. However, a majority of our directors and executive officers, and certain of our principal shareholders, live outside of the U.S., principally in China. As a result, you may not be able to effect service of process upon those persons within the U.S. or enforce against those persons judgments obtained in U.S. courts.
We face substantial competition in connection with the marketing and sale of our products.
Our products compete with other premium quality dairy brands as well as less expensive, non-premium brands. Our products face competition from non-premium producers distributing in our marketing area and other producers packaging their products in our marketing area. Many of our competitors are well established, have greater financial, marketing, personnel and other resources, have more established distribution channels into major markets, and have products that have gained wide customer acceptance in the marketplace. Our largest competitors are multi-national dairy companies owned by the government of China. The greater financial resources of such competitors will permit them to procure retail store shelf space and to implement extensive marketing and promotional programs, both generally and in direct response to advertising efforts by us. The dairy industry in China is also characterized by the frequent introduction of new products, accompanied by substantial promotional campaigns, such as large discounts to distributors. In addition, distributors in China often engage in cross-territory selling activities, which involves their diversion of products into different geographic regions, which can disrupt the price of our products and adversely impact our revenues. We may be unable to compete successfully with our competitors in some or all of our markets, and our competitors may develop products which have superior qualities or gain wider market acceptance than ours.
14
We expect to incur costs related to expansion into new plants and ventures, which may not prove to be profitable. Moreover, any delays in our expansion plans could cause adversely impact our results of operations and jeopardize our business.
We anticipate that any proposed expansion of our milk production facilities may include the acquisition and construction of new or additional facilities. Our cost estimates and projected completion dates for construction of new production facilities may change significantly as the projects progress. In addition, projects could entail significant construction risks, including shortages of materials or skilled labor, unforeseen environmental or engineering problems, weather interferences and unanticipated cost increases, any of which could have a material adverse effect on the projects and could delay their scheduled openings. A delay in scheduled openings of production facilities could delay our receipt of sales revenues from such facilities, which, when coupled with the increased costs and expenses of our expansion, could prevent us from becoming profitable.
Our plans to finance, develop, and expand our production facilities could be subject to the many risks inherent in the rapid expansion of a high growth business enterprise, including unanticipated design, construction, regulatory and operating problems, and the significant risks commonly associated with implementing a marketing strategy in changing and expanding markets. These projects may not become operational within their estimated time frames and budgets as projected at the time we enter into a particular agreement, or at all. In addition, we may develop projects as joint ventures in an effort to reduce our financial commitment to individual projects. The significant expenditures required to expand our production plants may not ultimately prove to be profitable.
When our future expansion projects become operational, we will be required to add and train personnel, expand our management information systems and control expenses. If we do not successfully address our increased management needs or are otherwise unable to manage our growth effectively, our operating results could be materially and adversely affected.
We face the potential risk of product liability associated with food products.
We face the risk of liability in connection with the sale and consumption of dairy products and other products should the consumption of such products cause injury, illness or death. Such risks may be particularly great in a company undergoing rapid and significant growth. The successful assertion of product liability claims against us could result in potentially significant monetary damages, divert management resources and require us to make significant payments and incur substantial legal expenses. We do not currently maintain product liability insurance. Any insurance that we may obtain in the future may be insufficient to cover potential claims or the level of insurance coverage needed may be unavailable at a reasonable cost. Even if a product liability claim is not successfully pursued to judgment by a claimant, we may still incur substantial legal expenses defending against such a claim and our brand image and reputation would suffer. Finally, serious product quality concerns could result in governmental action against us, which, among other things, could result in mandatory recalls of our products, the suspension of production or distribution of our products, loss of certain licenses, or other governmental penalties, including possible criminal liability.
Doing business in China involves various political and economic risks.
We conduct substantially all of our operations and generate most of our revenue in China. Accordingly, our business, financial condition, results of operations and prospects are affected significantly by economic, political and legal developments in China. China’s economy differs from the economies of most developed countries in many respects, including:
15
|
·
|
the higher level of government involvement and regulation;
|
|
·
|
the early stage of development of the market-oriented sector of the economy;
|
|
·
|
the rapid growth rate;
|
|
·
|
the higher level of control over foreign exchange; and
|
|
·
|
government control over the allocation of many resources.
|
As China’s economy has been transitioning from a planned economy to a more market-oriented economy, the government of China has implemented various measures to encourage economic growth and guide the allocation of resources. While these measures may benefit the overall economy of China, they may also have a negative effect on us.
Although the government of China has in recent years implemented measures emphasizing the utilization of market forces for economic reform, the PRC government continues to exercise significant control over economic growth in China through the allocation of resources, controlling payment of foreign currency-denominated obligations, setting monetary policy and imposing policies that impact particular industries or companies in different ways. Any adverse change in the economic conditions or government conditions or government policies in China could have a material adverse effect on the overall economic growth and the level of consumer spending in China, which in turn could lead to a reduction in demand for our products and consequently have a material adverse effect on our business and prospects.
Extensive regulation of the food processing and distribution industry in China could increase our expenses and make us unable to become profitable.
We are subject to extensive regulation by China’s Agricultural Ministry, and by other provincial and local authorities in jurisdictions in which our products are processed or sold, regarding the processing, packaging, storage, distribution and labeling of our products. For instance, in June 2009, regulatory requirements became effective in China requiring new package labeling for dairy products, which we believe impacted our sales cycles during the three months ended June 30, 2009. Additional labeling requirements became effective in June 2010 for all dairy products. Such requirements may have rapid implementation dates, require significant planning or expense, and have an adverse impact on our sales, inventory levels, or packing and distribution.
Other applicable laws and regulations governing our products may include nutritional labeling and serving size requirements. Our processing facilities and products are subject to periodic inspection by national, provincial and local authorities. For instance, in 2010, AQSIQ announced a nationwide renewal inspection for all infant manufacturing facilities. In March 2011, we successfully renewed our manufacturing license. Nevertheless, we may fall out of substantial compliance with current laws and regulations or may be unable to comply with any future laws and regulations. To the extent that new regulations are adopted, we will be required, possibly at considerable expense, to adjust our activities in order to comply with such regulations. Our failure to comply with applicable laws and regulations could subject us to civil remedies, including fines, injunctions, recalls or seizures, as well as potential criminal sanctions, which could have a material adverse effect on our business, operations and finances.
Regulations affecting acquisitions of PRC companies by foreign entities may make it more difficult for us to complete acquisitions and grow our business.
In 2005, the PRC State Administration of Foreign Exchange, or SAFE, issued a public notice, known as “Circular 75,” concerning the application of foreign exchange regulations to mergers and acquisitions involving foreign investment in China. Among other things, the public notice provides that if an offshore company controlled by PRC residents intends to acquire a PRC company, such acquisition will be subject to strict examination by the relevant foreign exchange authorities. Under Circular 75, if an acquisition of a PRC company by an offshore company controlled by PRC residents occurred prior to the issuance of Circular 75, certain PRC residents were required to submit a registration form to the local SAFE branch to register their ownership interests in the offshore company before March 31, 2006. Such PRC residents must also amend the registration form if there is a material event affecting the offshore company, such as, among other things, a change of the company’s share capital, a transfer of shares, or if the company is involved in a merger, an acquisition or a spin-off transaction or uses its assets in China to guarantee offshore obligations. In the past, we have acquired a number of assets from, or equity interests in, PRC companies.
16
There is still significant uncertainty in China regarding the interpretation and implementation of Circular 75. Nevertheless, we have requested that our shareholders who are PRC residents make the necessary applications, filings and amendments that required under Circular 75 and related regulations. However, all of our PRC-resident shareholders may not comply with such requirements. We also cannot predict how these regulations will affect our future acquisition strategy and business operations. For example, if we decide to acquire additional PRC companies, we or the owners of such companies may not be able to complete the filings and registrations, if any, required by the SAFE notices. Failure to complete Circular 75 registrations may limit the ability of our PRC subsidiaries to issue dividends to us, limit our ability to inject additional capital into our subsidiaries, restrict our ability to implement our acquisition strategy and adversely affect our business and prospects.
In addition, in 2006 six PRC regulatory authorities, including the PRC Ministry of Commerce and the PRC Securities Regulatory Commission, jointly promulgated a rule entitled “Provisions regarding Mergers and Acquisitions of Domestic Enterprises by Foreign Investors,” or the M&A Rules, in September 2006. The M&A Rules establish additional procedures and requirements that could make merger and acquisition activities by foreign investors more time-consuming and complex, including, in some circumstances, advance notice to the Ministry of Commerce of any change-of-control transaction in which a foreign investor takes control of a PRC domestic enterprise. Compliance with the M&A Rules, and any related approval processes, including obtaining approval from the Ministry of Commerce, may delay or inhibit our ability to complete such transactions, which could affect our ability to expand our business or maintain our market share.
Furthermore, in August 2008, SAFE issued a notice, known as “Circular 142,” regulating the conversion by a foreign-invested company of foreign currency into PRC currency, the Reminbi or RMB, by restricting the uses for the converted RMB. Circular 142 requires that the registered capital of a foreign-invested company denominated in RMB but converted from a foreign currency may only be used pursuant to the purposes set forth in the foreign-invested company’s business scope as approved by the applicable governmental authority. Such registered capital may not be used for equity investments within the PRC. In addition, SAFE strengthened its oversight of the flow and use of the registered capital of a foreign-invested company that was denominated in RMB but converted from foreign currency. Violations of Circular 142 may result in severe penalties, including significant fines. As a result, Circular 142 may significantly limit our ability to invest in or acquire other PRC companies using the RMB-denominated capital of our PRC subsidiaries.
The PRC government’s recent measures to curb inflation rates could adversely affect future results of operations.
China has faced rising inflation in recent years. The government of China undertook various measures to alleviate the effects of inflation, especially with respect to key commodities. In January 2008, the PRC National Development and Reform Commission announced national price controls on various products, including milk. Similarly, the government of China may conclude that the prices of infant formula or other of our products are too high and may institute price controls that would limit our ability to set prices for our products as we might wish. The government of China has also encouraged local governments to institute price controls on similar products. Such price controls could adversely affect our future results of operations and, accordingly, the price of our common stock.
17
Governmental control of currency conversion may affect the value of your investment.
The PRC government imposes controls on the convertibility of the Renminbi into foreign currencies and, in certain cases, the remittance of currency out of China. We receive substantially all of our revenues in Renminbi. Under existing PRC foreign exchange regulations, payments of current account items, including profit distributions, interest payments and trade and service-related foreign exchange transactions, can be made in foreign currencies without prior SAFE approval by complying with certain procedural requirements. However, approval from or registration with appropriate government authorities is required where Renminbi is to be converted into foreign currency and remitted out of China to pay capital expenses such as the repayment of loans denominated in foreign currencies. The PRC government may also, at its discretion, restrict access to foreign currencies for current account transactions in the future. If the foreign exchange control system prevents us from obtaining sufficient foreign currencies to satisfy our foreign currency demands, we may not be able to pay dividends in foreign currencies to our shareholders,
Fluctuation in the value of the Renminbi against the U.S. dollar may have a material adverse effect on your investment.
The value of the Renminbi against the U.S. dollar and other currencies is affected by, among other things, changes in China’s political and economic conditions and China’s foreign exchange policies. The conversion of the Renminbi into foreign currencies, including the U.S. dollar, has been based on exchange rates set by the People’s Bank of China. On July 21, 2005, the PRC government changed its decade-old policy of pegging the value of the Renminbi solely to the U.S. dollar. Under this revised policy, the Renminbi is permitted to fluctuate within a narrow and managed band against a basket of certain foreign currencies. Following the removal of the U.S. dollar peg, the Renminbi appreciated approximately 21.5% against the U.S. dollar over the following three years. Since July 2008, however, the Renminbi has traded within a narrow range against the U.S. dollar, remaining within 1% of its July 2008 high. As a consequence, the Renminbi has fluctuated significantly since July 2008 against other freely traded currencies, in tandem with the U.S. dollar. On June 20, 2010, the People’s Bank of China announced that the PRC government will further reform the Renminbi exchange rate regime and enhance the Renminbi exchange rate flexibility. It is difficult to predict how this new policy may impact the Renminbi exchange rate going forward.
Significant revaluation of the Renminbi may have a material adverse effect on your investment. If we decide to convert our Renminbi into U.S. dollars for the purpose of making payments for dividends on our common shares or for other business purposes, appreciation of the U.S. dollar against the Renminbi would have a negative effect on the U.S. dollar amount available to us.
Under the EIT Law, we may be classified as a “resident enterprise” of China, which would likely result in unfavorable tax consequences to us and our non-PRC shareholders.
Under the new PRC Enterprise Income Tax Law, or the EIT Law, and its implementing rules, which became effective in 2008, an enterprise established outside of China with a “de facto management body” within China is considered a “resident enterprise,” meaning that it can be treated in a manner similar to a Chinese enterprise for enterprise income tax purposes. Under the implementing rules of the EIT Law, de facto management means substantial and overall management and control over the production and operations, personnel, accounting, and properties of the enterprise. Because the EIT Law and its implementing rules are still new and there is limited guidance regarding tax residency determinations, it is unclear how tax authorities will determine tax residency based on the facts of each case.
If the PRC tax authorities determine that Feihe International, Inc. is a “resident enterprise” for PRC enterprise income tax purposes, unfavorable PRC tax consequences could follow. We may be subject to enterprise income tax at a rate of 25% on our worldwide taxable income as well as PRC enterprise income tax reporting obligations. Although under the EIT Law and its implementing rules dividends paid to us from our PRC subsidiaries would qualify as “tax-exempt income,” such dividends may be subject to a 10% withholding tax, as the PRC foreign exchange control authorities, which enforce the withholding tax, have not yet issued guidance with respect to the processing of outbound remittances to entities that are treated as resident enterprises for PRC enterprise income tax purposes. In addition, it is possible that the “resident enterprise” classification could result in a situation in which a 10% withholding tax is imposed on dividends we pay to our non-PRC shareholders and with respect to gains derived by our non-PRC shareholders from transferring our shares.
18
If we were treated as a “resident enterprise” by PRC tax authorities, we would be subject to tax in both the U.S. and China, and our PRC tax may not be fully creditable against our U.S. tax.
Lack of bank deposit insurance puts our funds at risk of loss from bank foreclosures or insolvencies.
We maintain certain bank accounts in China that are not protected by FDIC insurance or other insurance. As of December 31, 2010, we held approximately $17.5 million in bank accounts in China. If a PRC bank holding our funds experienced insolvency, it may not permit us to withdraw our funds, which would result in a loss of such funds and reduction of our net assets. As of December 31, 2010, we held approximately $65,000 of cash balances within the United States, of which $ nil was in excess of FDIC insurance limits, and exposes us to risk of loss of such funds and a resulting reduction of our net assets.
Limited and uncertain trademark protection in China makes the ownership and use of our trademark uncertain.
We rely principally on trade secrets and confidentiality agreements to protect our proprietary product formulations and production processes. We have obtained trademark registrations for the use of our trade name “Feihe,” as well as our “Xingfeifan” “Feifan,” “Feihui,” “Feirui,” “Feiyue,” and “Beidiqi” Chinese brands and our “Firmus,” “Astrobaby” and “Babyrich” English brand names, which have been registered with the PRC Trademark Bureau of the State Administration for Industry and Commerce with respect to our milk products. We have obtained trademark registrations for the use of our trade name “Feihe” and “Firmus,” which have been registered with the United States Patent and Trademark Office. We believe our trademark is important to the establishment of consumer recognition of our products. However, due to uncertainties in PRC trademark law, the protection afforded by our trademark may be less than we currently expect and may, in fact, be insufficient. In the event any of our trademarks are challenged or infringed, we may not have the financial resources to defend against the challenge or infringement and such defense could in any event be unsuccessful. Moreover, any events or conditions that negatively impact our trademark could have a material adverse effect on our business, operations and finances.
Our lack of patent protection could permit our competitors to copy our trade secrets and formula and thus gain a competitive advantage.
We have no patents covering our products or production processes, and we expect to rely principally on know-how and the confidentiality of our formula and production processes for our products and our flavoring formula in producing competitive product lines. Any breach of confidentiality by our executives or employees having access to our formula could result in our competitors gaining access to such formula. The ensuing competitive disadvantage could reduce our revenues and adversely impact our results of operations.
One of our shareholders owns a significant percentage of our stock and will be able to exercise significant influence over our affairs.
Leng You-Bin, our Chairman, Chief Executive Officer, President, and General Manager, beneficially owned approximately 40% of our common stock as of March 25, 2011. Consequently, Mr. Leng will likely be able to determine the composition of our board of directors, to approve certain matters requiring shareholder approval and to have significant influence over our operations. Mr. Leng’s interests may be different than the interests of other shareholders on these matters. This concentration of ownership could also have the effect of delaying or preventing a change in our control or otherwise discouraging a potential acquirer from attempting to obtain control of us, which in turn could reduce the price of our common stock.
19
Failure to comply with the U.S. Foreign Corrupt Practices Act could subject us to penalties and other adverse consequences.
Since we are a Utah corporation and a public company in the United States, we are subject to the U.S. Foreign Corrupt Practices Act, which generally prohibits U.S. companies from engaging in bribery or other prohibited payments to foreign officials for the purpose of obtaining or retaining business. Non-U.S. companies, including some that may compete with our company, are not subject to these prohibitions. Corruption, extortion, bribery, pay-offs, theft and other fraudulent practices may occur in China. Although such practices are prohibited at our company, our employees or other agents may engage in such conduct for which we might be held responsible. If our employees or other agents are found to have engaged in such practices, we could suffer severe penalties and other consequences that may have a material adverse effect on our business, financial condition and results of operations.
We have a significant amount of indebtedness, which may limit our operating flexibility.
As of December 31, 2010, we had approximately $106.7 million of bank loans. In addition, we expect to redeem our redeemable common stock for an aggregate amount of $63 million plus interest (see “—The terms of our agreements with the Purchasers may have adverse impacts on us.”). Our high level of indebtedness could have important consequences, including the following:
|
·
|
it may be difficult for us to satisfy our obligations with respect to our indebtedness;
|
|
·
|
our ability to obtain additional financing for working capital, capital expenditures, or general corporate or other purposes may be impaired;
|
|
·
|
a substantial portion of our cash flow from operations must be dedicated to the payment of principal and interest on our indebtedness, reducing the funds available to us for other purposes;
|
|
·
|
it may cause our trade creditors to change their terms for payment on goods and services provided to us, thereby negatively impacting our ability to receive products and services on acceptable terms;
|
|
·
|
it may place us at a competitive disadvantage compared to our competitors that have less debt or are less leveraged; and
|
|
·
|
we may be more vulnerable to economic downturns, may be limited in our ability to respond to competitive pressures and may have reduced flexibility in responding to changing business, regulatory and economic conditions.
|
Our ability to pay interest on and to satisfy our debt obligations will depend upon, among other things, our future operating performance and our ability to refinance indebtedness when necessary. Each of these factors is, to a large extent, dependent upon economic, financial, competitive and other factors beyond our control. If, in the future, we cannot generate sufficient cash from operations to meet our debt obligations, we will need to refinance our existing debt, obtain additional financing or sell assets. Our business may not generate sufficient cash flows to satisfy our existing indebtedness and funding sufficient to satisfy our debt service requirements may not be available on satisfactory terms, if at all.
The terms of our agreements with the Purchasers may have adverse impacts on us.
In August 2009, pursuant to a subscription agreement, we issued 2,100,000 shares of our common stock to Sequoia Capital China Growth Fund I, L.P. and certain of its affiliates, or the Purchasers, for an aggregate purchase price of $63.0 million. Because we did not meet certain earnings per share targets for 2009, we issued 525,000 additional shares to the Purchasers pursuant to the subscription agreement. In February 2011, we entered into a redemption agreement with the Purchasers to redeem and purchase from the Purchasers the 2,625,000 shares issued pursuant to the subscription agreement in four equal installments on or around March 31, 2011, September 30, 2011, December 31, 2011 and March 31, 2012, for an aggregate payment on each such date of $15,750,000, together with interest accruing at the rate of 1.5% per annum, compounded annually from August 27, 2009 until such date. This redemption could significantly impact our liquidity and capital resources.
20
We are at risk of securities litigation.
We are at risk of being subject to securities litigation, including possible enforcement action or class action lawsuits. Following notification by the SEC in 2007 of an informal investigation related to our former independent registered public accountants, we dismissed our former auditors, sued our former auditors, engaged new independent registered public accountants, commenced a re-audit of historical financial statements, and restated our financial statements as of and for our fiscal years ended December 31, 2005 and 2006. Accordingly, we were unable to file Exchange Act reports for 2007 and 2008 in a timely manner. In addition, we have restated our quarterly financial statements for the quarter ended March 31, 2009 to reclassify certain items from operating activities to investing activities, and we have amended our Form 10-K for the 2008 fiscal year to restate items in our statements of cash flows and to revise the note to our financial statements regarding quarterly operating results. Securities class action litigation has often been brought against companies who have been unable to provide current public information or who have restated previously filed financial statements. Such litigation is complex and could result in substantial costs, divert management’s attention and resources, and seriously harm our business, financial condition and results of operations.
Item 1B. Unresolved Staff Comments
None.
Item 2. Properties
Our principal executives are located at Star City International Building, 10 Jiuxianqiao Road, C-16th Floor, Chaoyang District, Beijing, China 100016. We have seven production and packaging facilities, which have an aggregate milk powder production capacity of 1,950 tons per day, encompass an aggregate of approximately 664,153 square meters of office, plant, and warehouse space, and are located in the Heilongjiang, Shanxi and Hebei Provinces in China. For additional information on our production and packaging facilities, see “Item 1. Business—Production and Packaging Facilities” above. In addition, we own two dairy farms, Gannan Farms and Kedong Farms, construction of which we completed in the fourth quarter of 2009, and which each consist of approximately 986,300 and 385,000 total square meters of cattle houses and administrative facilities, respectively. Gannan Farms and Kedong Farms currently house a total of approximately 17,000 Australian Holstein cows, each of which, on average, provides us with 8-10 tons of milk per year. We expect that each of our dairy farms will have annual capacity to source up to 70,000 tons of fresh milk per year.
There is no private ownership of land in China. All land is owned by the government of China, its agencies and collectives. Land use rights are obtained from the government for period ranging from 50 to 70 years, and are typically renewable. Land use rights can be transferred upon approval by the land administrative authorities of China (such as the State Land Administration Bureau) upon payment of the required land transfer fee.
We believe that our facilities are suitable for our current operations. As part of our growth strategy, we are in the process of expanding our production capacity and plan to strengthen our dairy farm operations.
Item 3. Legal Proceedings
From time to time, we may become involved in various claims and lawsuits incidental to our business. We know of no material existing or pending legal proceedings against us, nor are we involved as a plaintiff in any material proceeding or pending litigation.
We were a plaintiff in a lawsuit entitled American Dairy, Inc. v. Murrell, Hall, McIntosh & Co. PLLP et al., filed on April 15, 2008 in the United States District Court for the Western District of Oklahoma. This suit had alleged that Murrell, Hall, McIntosh & Co. LLP, or MHM, formerly our independent registered public accounting firm, breached its duties of due care and professional competence by failing to perform its audits in accordance with professional standards of care in that MHM improperly and negligently (i) accepted Henny Wee & Co.’s representation that it was independent and otherwise failed to make sufficient inquiries concerning Henny Wee & Co.’s independence, and (ii) permitted Henny Wee & Co. to perform such a significant and material part of the audit work that MHM should have evaluated whether it could act as principal auditor and report on our financial statements. We were seeking compensatory damages of not less than $10.0 million in connection with this suit. In September 2010, we agreed, and the court entered an order, to dismiss our suit without prejudice.
Item 4. (Removed and Reserved)
21
PART II
Item 5. Market for the Registrant’s Common Stock, Related Shareholder Matters and Issuer Repurchases of Equity Securities
Price Range of Our Common Stock
Our common stock trades on the NYSE under the symbol “ADY.” On March 25, 2011, there were 22,306,291 shares of our common stock issued and outstanding that were held by approximately 376 shareholders of record. The table below lists the high and low closing prices per share of our common stock for each quarterly period during the past two fiscal years as reported on the NYSE.
|
Closing Price Range of Common Stock
|
||||||||
|
High ($)
|
Low ($)
|
|||||||
|
Year Ended December 31, 2009:
|
||||||||
|
1st Quarter
|
$
|
17.08
|
$
|
9.77
|
||||
|
2nd Quarter
|
$
|
43.16
|
$
|
15.25
|
||||
|
3rd Quarter
|
$
|
39.95
|
$
|
20.08
|
||||
|
4th Quarter
|
$
|
34.85
|
$
|
20.25
|
||||
|
Year Ended December 31, 2010:
|
||||||||
|
1st Quarter
|
$
|
25.40
|
$
|
19.15
|
||||
|
2nd Quarter
|
$
|
19.93
|
$
|
15.63
|
||||
|
3rd Quarter
|
$
|
15.91
|
$
|
6.64
|
||||
|
4th Quarter
|
$
|
13.22
|
$
|
9.49
|
||||
Dividend Policy
We have not declared or paid any dividends on our common stock and presently do not expect to declare or pay any such dividends in the foreseeable future. Payment of dividends to our shareholders would require payment of dividends by our PRC subsidiaries to us. This, in turn, would require a conversion of Renminbi into US dollars and repatriation of funds to the US. Under current PRC law, the conversion of Renminbi into foreign currency for capital account transactions generally requires approval from SAFE and, in some cases, other government agencies. Government authorities may impose restrictions that could have a negative impact in the future on the conversion process and upon our ability to meet our cash needs, and to pay dividends to our shareholders. Although our subsidiaries’ classification as wholly foreign-owned enterprises under PRC law permits them to declare dividends and repatriate their funds to us in the United States, any change in this status or the regulations permitting such repatriation could prevent them from doing so. Any inability to repatriate funds to us would in turn prevent payments of dividends to our shareholders.
Transfer Agent and Registrar
Our transfer agent and registrar is Interwest Transfer Company, Inc., 1981 Murray Holladay Road, Suite 100, Salt Lake City, Utah 84117-5148; telephone 1 (801) 272-9294.
Performance Graph
The following graph compares the annual cumulative total shareholder return on an investment on December 31, 2005 of $100 in our common stock with the annual cumulative total return on the same investment in the S&P 500 Index and the S&P Packaged Foods and Meats Index for the five subsequent fiscal years.
22
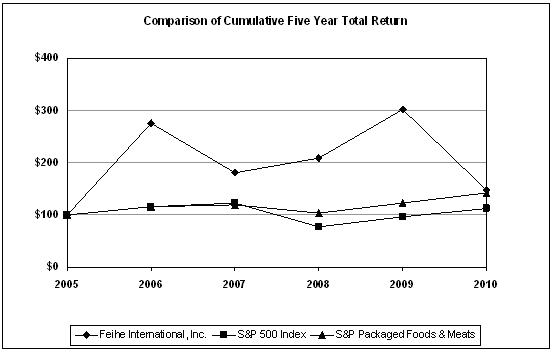
Securities Authorized for Issuance under Equity Compensation Plans
The following table sets forth information regarding issuances of securities pursuant to equity compensation plans as of December 31, 2010:
|
Plan Category
|
|
Number of
securities issued
and to be issued
upon exercise of
outstanding
options, warrants
and rights
|
|
|
Weighted-average
exercise price of
outstanding options,
warrants and rights
|
|
|
Number of
securities
remaining
available for
future issuance
|
|
|||
|
Equity compensation plans approved by security holders
|
|
|
856,254
|
|
|
$
|
15.84
|
|
|
|
2,143,746
|
|
|
Total
|
|
|
856,254
|
|
|
$
|
15.84
|
|
|
|
2,143,746
|
|
Recent Sales of Unregistered Securities
In March 2010, we issued 525,000 shares of redeemable common stock to accredited investors, pursuant to a performance adjustment clause in a subscription agreement because we failed to meet certain performance targets set out in the subscription agreement as of December 31, 2009. We issued these securities pursuant to the exemption from registration under Section 4(2) of the Securities Act for transactions by an issuer not involving any public offering.
In April 2010, we issued 8,000 shares of common stock upon the exercise of stock options granted pursuant to our stock incentive plans, in consideration for services provided to us by employees. We issued these securities pursuant to the exemption from registration under Section 4(2) of the Securities Act for transactions by an issuer not involving any public offering.
During the year ended December 31, 2010, we issued 55,915 shares of our common stock to our directors and employees in consideration for their services to us. We issued these securities pursuant to the exemption from registration under Section 4(2) of the Securities Act for transactions by an issuer not involving any public offering.
Item 6. Selected Financial Data
The following table sets forth our selected consolidated financial data. The financial data set forth below should be read in conjunction with, and are qualified in their entirety by reference to “Item 7. Management’s Discussion and Analysis of Financial Condition and Results of Operation” of this report. The selected consolidated balance sheet data and statements of operations data in the table below have been derived from our audited consolidated financial statements. Historical results are not necessarily indicative of results to be expected in the future.
23
|
For the Fiscal Years Ended December 31,
|
||||||||||||||||||||
|
2010
|
2009
|
2008
|
2007
|
2006
|
||||||||||||||||
|
(in thousands except earnings per share data)
|
||||||||||||||||||||
|
Selected Consolidated Statements of Operations Data:
|
||||||||||||||||||||
|
Sales
|
$
|
257,100
|
$
|
271,078
|
$
|
193,192
|
$
|
163,899
|
$
|
115,082
|
||||||||||
|
Cost of goods sold
|
(153,848
|
)
|
(140,427
|
)
|
(117,181
|
)
|
(19,430
|
)
|
(65,170
|
)
|
||||||||||
|
Gross profit
|
103,252
|
130,651
|
76,011
|
72,469
|
49,912
|
|||||||||||||||
|
Sales and marketing expenses
|
(99,476
|
)
|
(105,109
|
)
|
(50,686
|
)
|
(40,739
|
)
|
(40,740
|
)
|
||||||||||
|
General and administrative expenses
|
(23,380
|
)
|
(20,479
|
)
|
(19,047
|
)
|
(13,836
|
)
|
(13,840
|
)
|
||||||||||
|
Goodwill impairment
|
(1,437
|
)
|
(930
|
)
|
-
|
-
|
-
|
|||||||||||||
|
Loss on disposal of biological assets
|
(10,241
|
)
|
(1,740
|
)
|
(287
|
)
|
-
|
-
|
||||||||||||
|
Operating (loss) income
|
(31,036
|
)
|
2,368
|
6,460
|
17,893
|
16,256
|
||||||||||||||
|
Interest and finance costs
|
(2,516
|
)
|
(6,139
|
)
|
(18,843
|
)
|
(13,405
|
)
|
(1,521
|
)
|
||||||||||
|
Registration rights penalty
|
-
|
-
|
(2,389
|
)
|
(2,540
|
)
|
||||||||||||||
|
Gain on extinguishment of debt
|
-
|
-
|
30,497
|
-
|
(688
|
)
|
||||||||||||||
|
(Loss) gain on derivatives
|
-
|
(2,162
|
)
|
(8,321
|
)
|
3,279
|
-
|
|||||||||||||
|
Government subsidy
|
23,462
|
21,177
|
6,810
|
8,140
|
7,492
|
|||||||||||||||
|
(Loss) income before income taxes and discontinued operations
|
(10,175
|
)
|
15,427
|
14,137
|
13,507
|
21,280
|
||||||||||||||
|
Income tax (benefit) expenses
|
(280
|
)
|
(746
|
)
|
3,567
|
5,662
|
4,858
|
|||||||||||||
|
(Loss) income from continuing operations, net of tax
|
(9,895
|
)
|
16,173
|
10,570
|
7,842
|
16,422
|
||||||||||||||
|
Net income from discontinued operations, net of tax
|
-
|
3,290
|
6,463
|
442
|
-
|
|||||||||||||||
|
Net (loss) income
|
(9,895
|
)
|
19,463
|
17,033
|
8,284
|
16,422
|
||||||||||||||
|
Net (income) loss attributable to the noncontrolling interest
|
311
|
118
|
(10
|
)
|
(4
|
)
|
11
|
|||||||||||||
|
Net (loss) income attributable to Feihe International, Inc.
|
$
|
(9,584
|
)
|
$
|
19,581
|
$
|
17,023
|
$
|
8,280
|
$
|
16,433
|
|||||||||
|
Net (loss) income from continuing operations per share of common stock
|
||||||||||||||||||||
|
-Basic
|
$
|
(0.48
|
)
|
$
|
0.86
|
$
|
0.62
|
$
|
0.48
|
$
|
1.11
|
|||||||||
|
-Diluted
|
$
|
(0.48
|
)
|
$
|
0.81
|
$
|
0.60
|
$
|
0.46
|
$
|
0.98
|
|||||||||
|
Net income from discontinued operations per share of common stock
|
||||||||||||||||||||
|
-Basic
|
$
|
-
|
$
|
0.17
|
$
|
0.38
|
$
|
0.03
|
$
|
-
|
||||||||||
|
-Diluted
|
$
|
-
|
$
|
0.16
|
$
|
0.37
|
$
|
0.02
|
$
|
-
|
||||||||||
|
Net (loss) income per share of common stock
|
||||||||||||||||||||
|
-Basic
|
$
|
(0.48
|
)
|
$
|
1.03
|
$
|
1.00
|
$
|
0.51
|
$
|
1.11
|
|||||||||
|
-Diluted
|
$
|
(0.48
|
)
|
$
|
0.97
|
$
|
0.97
|
$
|
0.48
|
$
|
0.98
|
|||||||||
|
Net (loss) income per share of redeemable common stock
|
||||||||||||||||||||
|
-Basic
|
$
|
(0.07
|
)
|
$
|
1.03
|
$
|
-
|
$
|
-
|
$
|
-
|
|||||||||
|
-Diluted
|
$
|
(0.07
|
)
|
$
|
0.97
|
$
|
-
|
$
|
-
|
$
|
-
|
|||||||||
|
December 31,
|
||||||||||||||||||||
|
2010
|
2009
|
2008
|
2007
|
2006
|
||||||||||||||||
|
(in thousands)
|
||||||||||||||||||||
|
Selected Balance Sheets Data:
|
||||||||||||||||||||
|
Cash and cash equivalents
|
$
|
17,530
|
$
|
48,165
|
$
|
11,785
|
$
|
11,058
|
$
|
39,521
|
||||||||||
|
Working capital (deficit) (1)
|
(59,338
|
) |
(5,499
|
)
|
(69,467
|
)
|
(49,356
|
)
|
24,694
|
|||||||||||
|
Inventory
|
71,683
|
59,045
|
31,003
|
25,949
|
14,657
|
|||||||||||||||
|
Trade receivables, net
|
15,886
|
27,495
|
12,275
|
4,519
|
5,566
|
|||||||||||||||
|
Property, plant and equipment
|
213,507
|
177,743
|
117,137
|
85,289
|
44,699
|
|||||||||||||||
|
Biological assets
|
54,398
|
48,904
|
25,268
|
-
|
-
|
|||||||||||||||
|
Prepaid leases for land use right
|
29,754
|
29,016
|
29,148
|
20,968
|
6,063
|
|||||||||||||||
|
Total assets
|
464,309
|
440,258
|
358,547
|
260,578
|
117,625
|
|||||||||||||||
|
Short-term bank loans
|
68,816
|
58,182
|
7,737
|
8,214
|
11,115
|
|||||||||||||||
|
Convertible debt
|
-
|
-
|
91,542
|
55,238
|
16,484
|
|||||||||||||||
|
Long- term bank loans
|
37,859
|
39,740
|
13,165
|
484
|
1,581
|
|||||||||||||||
|
Derivatives
|
-
|
-
|
-
|
50,019
|
-
|
|||||||||||||||
|
Total liabilities
|
236,457
|
223,806
|
242,122
|
178,373
|
61,466
|
|||||||||||||||
|
Redeemable common stock
|
66,114
|
53,645
|
-
|
-
|
-
|
|||||||||||||||
|
Total equity
|
$
|
161,738
|
$
|
162,807
|
$
|
116,424
|
$
|
82,206
|
$
|
56,159
|
||||||||||
(1) Working capital (deficit) represents current assets minus current liabilities.
24
Item 7. Management’s Discussion and Analysis of Financial Condition and Results of Operations
This Annual Report contains our audited consolidated financial statements for the years ended December 31, 2010, 2009 and 2008 and data derived therefrom. The following discussion and analysis of our financial condition and results of operations should be read in conjunction with our audited consolidated financial statements and related notes appearing elsewhere in this Annual Report. In addition to historical financial information, the following discussion contains forward-looking statements that reflect our plans, estimates and beliefs. Our actual results could differ materially from those discussed in the forward-looking statements. Factors that could cause or contribute to these differences include those discussed below and elsewhere in this Annual Report, particularly in “Item 1A. Risk Factors” above.
Overview
We are a leading producer and distributor of milk powder, soybean milk powder, and related dairy products in the PRC. Using proprietary processing techniques, we make products that are specially formulated for particular ages, dietary needs and health concerns. We have over 200 company-owned milk collection stations, seven production and distribution facilities with an aggregate milk powder production capacity of 1,950 tons per day, and an extensive distribution network that reaches over 80,000 retail outlets throughout China.
Factors Affecting our Results of Operations
Our operating results are primarily affected by the following factors:
|
·
|
Dairy Industry Growth. We believe the market for dairy products in China for the long term will be growing rapidly, driven by China’s economic growth, increased penetration of infant formula, and a growing female working population. Despite the damage to the industry as a result of the melamine crisis in 2008, we expect these factors to continue to drive industry growth. We believe that the rapid economic growth of our primary markets has become an increasingly important driver of growth.
|
|
·
|
Production Capacity. We believe much of the dairy market in China is still underserved, particularly with respect to infant formula. In addition, since the melamine crisis in 2008, which did not involve any of our products, we have at times operated our milk production facilities at maximum capacity. Accordingly, we believe that the ability to increase production of high quality dairy products will allow well positioned companies to significantly increase revenues and market share.
|
|
|
·
|
Perceptions of Product Quality and Safety. We believe that rising consumer wealth in China has contributed to a greater demand for higher-priced products with perceived quality advantages. We believe many consumers in China tend to regard higher prices as indicative of higher quality and higher nutritional value, particularly in the areas of infant formula and nutritional products. Accordingly, we believe our reputation for quality and safety allows us to command higher average selling prices and generate higher gross margins than competitors who do not possess the same reputation. Conversely, any decrease in consumer perceptions of quality and safety could adversely impact us.
|
25
|
·
|
Seasonality. The dairy industry remains seasonal, with higher production in the summer season and greater demand in winter months. This seasonality is offset by production of powder products with longer shelf lives.
|
|
|
·
|
Raw Material Supply and Prices. The per unit costs of producing our infant formula are subject to the supply and price volatility of raw milk and other raw materials, which are affected by the PRC and global markets. For example, in 2008 our raw milk prices increased by approximately 45%, in 2009 decreased by approximately 20% and in 2010 increased by approximately 24% and we expect they will continue to be affected by factors such as geographic location, rising feed prices, general economic conditions such as inflation and fuel prices, and fluctuations in production, rising production costs and competition, as well as increased competition abroad and currency fluctuations.
|
|
·
|
Expenses Associated with Expansion and Competition. In implementing our plan to expand our business, we face corresponding increases in expenses, especially for sales and marketing expenses, in order to attract and retain qualified talent, monitor our sales by region and address potential cross-territory selling activities by distributors, implement strategic advertising campaigns, and finance our expansion.
|
We have two reportable segments: dairy products and dairy farm. Our dairy products segment produces and sells dairy products, such as wholesale and retail milk powders, as well as soybean powder, rice cereal, walnut powder and walnut oil. Our dairy farm segment operates our two company-owned dairy farms, Gannan Farms and Kedong Farms, construction of which we completed in the fourth quarter of 2009. Our dairy farms provide milk to us and normally do not provide milk to external customers.
Results of Operations
The following table sets forth certain information regarding our results of operations.
|
Years Ended December 31,
|
||||||||||||
|
2010
|
2009
|
2008
|
||||||||||
|
($ in thousands)
|
||||||||||||
|
Statements of Operations Data
|
||||||||||||
|
Sales
|
257,100 | 271,078 | 193,192 | |||||||||
|
Cost of goods sold
|
(153,848 | ) | (140,427 | ) | (117,181 | ) | ||||||
|
Gross profit
|
103,252 | 130,651 | 76,011 | |||||||||
|
Operating expenses:
|
||||||||||||
|
Sales and marketing
|
(99,476 | ) | (105,109 | ) | (50,686 | ) | ||||||
|
General and administrative
|
(23,380 | ) | (20,479 | ) | (19,047 | ) | ||||||
|
Goodwill impairment
|
(1,437 | ) | (930 | ) | - | |||||||
|
Loss on disposal of biological assets
|
(10,241 | ) | (1,740 | ) | (287 | ) | ||||||
|
Operating (loss) income
|
(31,036 | ) | 2,368 | 6,460 | ||||||||
|
Other income (expenses)
|
20,861 | 13,059 | 7,676 | |||||||||
|
Income tax (benefit) expenses
|
(280 | ) | (746 | ) | 3,567 | |||||||
|
Net income from discontinued operations, net of tax
|
- | 3,290 | 6,463 | |||||||||
|
Accretion of redemption premium on redeemable common stock
|
(1,087 | ) | - | - | ||||||||
|
Net (loss) income attributable to common shareholders of Feihe International, Inc.
|
(10,670 | ) | 19,581 | 17,023 | ||||||||
26
Comparison of Years Ended December 31, 2010 and 2009
Sales
Our sales consist primarily of revenues generated from sales of milk powder, raw milk powder, soybean powder, rice cereal, walnut products and fresh milk. Sales decreased by approximately $14.0 million, or 5.2%, from approximately $271.1 million in 2009 to approximately $257.1 million in 2010. This decrease was primarily attributable to decrease of sales of milk powder, offset in part by an increase in sales of raw milk powder, which reflected the fact that there were new competitors entering into our industry and old competitors aggressively attempting to reclaim market share following the melamine crisis. During 2010, we focused on improving sales of existing sales points and, accordingly, our expansion into new market areas was less rapid. While our full-year 2010 sales decreased, our sales in the quarterly period ended December 31, 2010 increased by approximately $18.3 million, or 41.6%, from approximately $44.0 million in the quarterly period ended December 31, 2009 to approximately $62.3 million in the quarterly period ended December 31, 2010. We believe this increase reflects our improved control of cross-territory selling activities by distributors, as well as our sales of excess inventory as lower-margin raw milk powder in an effort to manage inventory levels which occurred during the fourth quarter of 2009. Our inventories increased approximately $12.7 million, or 21.5%, from approximately $59.0 million as of December 31, 2009 to approximately $71.7 million as of December 31, 2010, reflecting our increased production during our first and second fiscal quarters of 2010 to prepare to meet expected sales demand.
The following table sets forth information regarding the sales of our principal products during the fiscal years ended December 31, 2010 and 2009:
|
2010
|
2009
|
2010 over 2009
|
||||||||||||||||||||||||||||||||||
|
Product name
|
Quantity
(Kg’000)
|
Amount
($’000)
|
% of
Sales
|
Quantity
(Kg’000)
|
Amount
($’000)
|
% of
Sales
|
Quantity
(Kg’000)
|
Amount
($’000)
|
% of
Sales
|
|||||||||||||||||||||||||||
|
Milk powder
|
22,816
|
180,218
|
70.1
|
28,783
|
216,230
|
79.8
|
(5,967
|
)
|
(36,012
|
)
|
(16.7
|
)
|
||||||||||||||||||||||||
|
Raw milk powder
|
15,691
|
57,752
|
22.5
|
11,637
|
34,328
|
12.7
|
4,054
|
23,424
|
68.2
|
|||||||||||||||||||||||||||
|
Soybean powder
|
4,917
|
10,812
|
4.2
|
3,349
|
7,319
|
2.7
|
1,568
|
3,493
|
47.7
|
|||||||||||||||||||||||||||
|
Rice cereal
|
633
|
4,040
|
1.6
|
1,103
|
6,730
|
2.5
|
(470
|
)
|
(2,690
|
)
|
(40.0
|
)
|
||||||||||||||||||||||||
|
Walnut products
|
263
|
1,511
|
0.6
|
601
|
3,070
|
1.1
|
(338
|
)
|
(1,559
|
)
|
(50.8
|
)
|
||||||||||||||||||||||||
|
Other
|
2,207
|
2,767
|
1.0
|
543
|
3,401
|
1.2
|
1,664
|
(634
|
)
|
(18.6
|
)
|
|||||||||||||||||||||||||
|
Total
|
46,527
|
257,100
|
100
|
46,016
|
271,078
|
100
|
511
|
(13,978
|
)
|
(5.2
|
)
|
|||||||||||||||||||||||||
While full-year 2010 sales of our higher-margin milk powder products decreased, our milk powder sales in the quarterly period ended December 31, 2010 increased by approximately $18.7 million, from approximately $20.7 million, or 47.0% of total sales, in the quarterly period ended December 31, 2009, to approximately $39.5 million or 63.4% of total sales, in the quarterly period ended December 31, 2010. This shift in product mix reflects our improved control of cross-territory selling activities by distributors which occurred during the fourth quarter of 2009 and our efforts to reclaim market share during the year 2010.
In 2010, we also experienced a decrease in the average sales price per kilogram of our products, as demonstrated in the table below:
|
2010
|
2009
|
|||||||
|
Sales revenues (in thousands)
|
$
|
257,100
|
$
|
271,078
|
||||
|
Total sales volume (kilograms in thousands)
|
46,527
|
46,016
|
||||||
|
Average selling prices/kilogram
|
$
|
5.53
|
$
|
5.89
|
||||
The decrease in average sales price per kilogram, as reflected in the table, was primarily attributable to a shift in product mix resulting from a decrease in sales of milk powder, a higher margin product. Prices per kilogram increased in our most significant product line, as demonstrated in the following table, which reflects the average sales price per kilogram by product for 2010 and 2009 and the percentage change in the sales price per kilogram.
27
|
Average Price Per Kilogram
|
Percentage
|
|||||||||||
|
Product
|
2010
|
2009
|
Change
|
|||||||||
|
Milk powder
|
$
|
7.90
|
$
|
7.51
|
5.2
|
|||||||
|
Raw milk powder
|
3.68
|
2.95
|
24.7
|
|||||||||
|
Soybean powder
|
2.20
|
2.19
|
0.5
|
|||||||||
|
Rice cereal
|
6.38
|
6.10
|
4.6
|
|||||||||
|
Walnut products
|
5.75
|
5.11
|
12.5
|
|||||||||
|
Other
|
1.25
|
6.27
|
(80.0
|
) | ||||||||
|
Total
|
$
|
5.53
|
$
|
5.89
|
(6.1
|
)
|
||||||
The average selling price per kilogram of milk powder increased by 5.2% from $7.51 in the year ended December 31, 2009 to $7.90 in the year ended December 31, 2010. This increase was primarily attributable to fewer promotional activities, including a decrease in sales discounts provided to distributors. The average selling price per kilogram for raw milk powder increased by 24.7%, from $2.95 in the year ended December 31, 2009 to $3.68 in the year ended December 31, 2010. This increase was primarily attributable to increased demand and market prices of raw milk and raw milk powder.
Cost of Goods Sold
Our costs of goods sold consist primarily of direct and indirect manufacturing costs, including production overhead costs, and shipping and handling costs for the products sold. Cost of goods sold increased approximately $13.4 million, or 9.5%, from approximately $140.4 million in 2009 to approximately $153.8 million in 2010. This increase was primarily attributable to general increases in raw milk and costs of added nutrients and approximately $0.4 million increase in provision for obsolete, slow moving, and excess inventory.
Operating Expenses
Our total operating expenses consist primarily of sales and marketing expenses, general and administrative expenses, goodwill impairment and disposal loss of biological assets. Our total operating expenses increased by approximately $6.2 million, or 4.8%, from approximately $128.3 million in 2009 to approximately $134.5 million in 2010.
Sales and marketing. Our sales and marketing expenses consist primarily of advertising and market promotion expenses, and other overhead expenses incurred by our sales and marketing personnel. Sales and marketing expenses decreased approximately $5.6 million, or 5.3%, from approximately $105.1 million for 2009 to approximately $99.5 million for 2010. This decrease was primarily attributable to a decrease of approximately $9.5 million, or 30.4%, in advertising expense, which was offset in part by an increase of approximately $3.2 million, or 34%, in salary of marketing staff and an increase of approximately of $1.3 million, or 2.8%, in promotion costs. Total promotion costs include expenses related to promotion activities and wages of certain sales people. During the year 2010, we improved the effectiveness of sales and marketing expenses and our sales at existing sales points, rather than focusing on the expansion of our distribution network.
General and Administrative. Our general and administrative expenses consist primarily of salary, travel expenses, entertainment expenses, benefits, share-based compensation, and professional service fees. General and administrative expenses increased approximately $2.9 million, or 14.1%, from approximately $20.5 million for 2009 to $23.4 million for 2010. The increase was primarily attributable to an increase of approximately $2.1 million, or 39.6%, in staff salary and welfare contributions and an increase of approximately $2.4 million, or 400% in travelling and office administrative expenses. The increase was partially offset by a decrease of approximately $1.6 million, or 40.0%, in professional service fees. General and administrative expenses are likely to increase as we continue to expand our production, sourcing capacity, and distribution capacity throughout China.
Goodwill Impairment Expense. We recognized a goodwill impairment charge of approximately $1.4 million, an increase of approximately $0.5 million or 55.6%, from approximately $0.9 million in 2009, related to Shanxi Feihe as a result of the stagnating growth of our walnut powder products. As a result, goodwill related to Shanxi Feihe has been reduced to nil.
28
Loss on Disposal of Biological Assets. Our loss on disposal of biological assets increased by approximately $8.5 million, or 488.7%, from approximately $1.7 million in 2009 to approximately $10.2 million in 2010. The increase reflects our sale of under-producing cows at our company-owned dairy farms.
Operating (Loss) Income
As a result of the foregoing, our income from continuing operations decreased by approximately $33.4 million from income of approximately $2.4 million in 2009 to a loss of approximately $31.0 million in 2010.
Other Income (Expenses)
Our other income (expenses) consists primarily of interest and finance costs, loss on derivatives and government subsidies. Other income increased by approximately $7.8 million, or 59.8%, from approximately $13.1 million for 2009 to approximately $20.9 million for 2010. The increase was primarily attributable to a decrease of approximately $3.6 million, or 59.0%, in interest and finance costs, an increase of approximately $2.3 million, or 10.8%, in government subsidies and a decrease of approximately $2.2 million, or 100%, in loss on derivatives. Loss on derivatives in 2009 was primarily attributable to change of the fair value of the derivatives relating to our common stock financing.
Income Tax (Benefit) Expenses
We are subject to U.S. federal and state income taxes, and our subsidiaries incorporated in the PRC are subject to enterprise income taxes in the PRC. Our income tax benefits were approximately $0.7 million and $0.3 million in 2009 and 2010, respectively. The decrease in income tax benefit was primarily due to the fact that certain PRC entities of ours which were tax exempt in 2009 become subject to income taxes at a rate of 12.5% in 2010.
Net Income from Discontinued Operations, Net of Tax
Due to a letter of intent we entered into in December 2008 to sell our former subsidiary Heilongjiang Moveup Co., Limited, or Moveup, accounts relating to Moveup are reflected in our financial statements as discontinued operations. Our net income from discontinued operations decreased by approximately $3.3 million, or 100.0%, from approximately $3.3 million in 2009 to $nil in 2010.
Comparison of Years Ended December 31, 2009 and 2008
Sales
Our sales consist primarily of revenues generated from sales of milk powder, raw milk powder, soybean powder, rice cereal, and walnut products. Sales increased by approximately $77.9 million, or 40.3%, from approximately $193.2 million in 2008 to approximately $271.1 million in 2009. This increase was primarily attributable to expanding our market areas and distribution network throughout China, increased demand for high quality products and strong market acceptance of these products, and increased sales quantities of several high profit margin products. While our full-year 2009 sales increased, our sales in the quarterly period ended December 31, 2009 decreased by approximately $35.6 million, or 44.8%, from approximately $79.6 million in the quarterly period ended December 31, 2008 to approximately $44.0 million in the quarterly period ended December 31, 2009. We believe this decrease reflects the impact of cross-territory selling activities by distributors, as well as our sales of excess inventory as lower-margin raw milk powder in an effort to manage inventory levels. Our inventories increased approximately $6.7 million, or 13%, from approximately $52.3 million as of December 31, 2008 to approximately $59.0 million as of December 31, 2009, reflecting our increased production during our first and second fiscal quarters of 2009 to prepare to meet expected sales demand during our third and fourth fiscal quarters of 2009.
29
The following table sets forth information regarding the sales of our principal products during the fiscal years ended December 31, 2009 and 2008:
|
2009
|
2008
|
2009 over 2008
|
|||||||||||||||||||||||||||||||||||
|
Product name
|
Quantity
(Kg’000)
|
Amount
($’000)
|
% of
Sales
|
Quantity
(Kg’000)
|
Amount
($’000)
|
% of
Sales
|
Quantity
(Kg’000)
|
Amount
($’000)
|
% of
Sales
|
||||||||||||||||||||||||||||
|
Milk powder
|
28,783
|
216,230
|
79.8
|
16,311
|
121,255
|
62.8
|
12,472
|
94,975
|
78.3
|
||||||||||||||||||||||||||||
|
Raw milk powder
|
11,637
|
34,328
|
12.7
|
16,572
|
60,753
|
31.4
|
(4,935
|
)
|
(26,425
|
)
|
(43.5
|
)
|
|||||||||||||||||||||||||
|
Soybean powder
|
3,349
|
7,319
|
2.7
|
2,153
|
4,400
|
2.3
|
1,196
|
2,919
|
66.3
|
||||||||||||||||||||||||||||
|
Rice cereal
|
1,103
|
6,730
|
2.5
|
816
|
4,631
|
2.4
|
287
|
2,099
|
45.3
|
||||||||||||||||||||||||||||
|
Walnut products
|
601
|
3,070
|
1.1
|
327
|
1,663
|
0.9
|
274
|
1,407
|
84.6
|
||||||||||||||||||||||||||||
|
Other
|
543
|
3,401
|
1.2
|
727
|
490
|
0.2
|
(184
|
)
|
2,911
|
594.1
|
|||||||||||||||||||||||||||
|
Total
|
46,016
|
271,078
|
100
|
36,906
|
193,192
|
100
|
9,110
|
77,886
|
40
|
||||||||||||||||||||||||||||
While full-year 2009 sales of our higher-margin milk powder products increased, our milk powder sales in the quarterly period ended December 31, 2009 decreased by approximately $38.6 million, from approximately $59.3 million, or 74.5% of total sales, in the quarterly period ended December 31, 2008, to approximately $20.7 million or 47.2% of total sales, in the quarterly period ended December 31, 2009. This shift in product mix reflects our sales of excess inventory as lower-margin raw milk powder in an effort to manage inventory levels.
In 2009, we also experienced an increase in the average sales price per kilogram of our products, as demonstrated in the table below:
|
2009
|
2008
|
|||||||
|
Sales revenues (in thousands)
|
$
|
271,078
|
$
|
193,192
|
||||
|
Total sales volume (kilograms in thousands)
|
46,016
|
36,906
|
||||||
|
Average selling prices/kilogram
|
$
|
5.89
|
$
|
5.23
|
||||
The increase in average sales price per kilogram, as reflected in the table, is relatively small and primarily attributable to the shift in product mix to higher end products rather than an increase in the sales price of individual products. Prices per kilogram increased in our most significant product line, as demonstrated in the following table, which reflects the average sales price per kilogram by product for 2009 and 2008 and the percentage change in the sales price per kilogram.
|
Average Price Per Kilogram
|
Percentage
|
|||||||||||
|
Product
|
2009
|
2008
|
Change
|
|||||||||
|
Milk powder
|
$
|
7.51
|
$
|
7.43
|
1.1
|
|||||||
|
Raw milk powder
|
2.95
|
3.67
|
(19.5
|
)
|
||||||||
|
Soybean powder
|
2.19
|
2.04
|
7.4
|
|||||||||
|
Rice cereal
|
6.10
|
5.68
|
7.4
|
|||||||||
|
Walnut products
|
5.11
|
5.09
|
0.4
|
|||||||||
|
Other
|
6.27
|
0.67
|
829.6
|
|||||||||
|
Total
|
$
|
5.89
|
$
|
5.23
|
12.6
|
|||||||
Cost of Goods Sold
Our costs of goods sold consist primarily of direct and indirect manufacturing costs, including production overhead costs, and shipping and handling costs for the products sold. Cost of goods sold increased approximately $23.2 million, or 19.8%, from approximately $117.2 million in 2008 to approximately $140.4 million in 2009. This increase was primarily attributable to increased sales volume and promotional activities, as well as general increases in costs of added nutrients. Cost of sales as a percentage of sales decreased due to the decreased raw milk powder pricing compared to the previous year.
Operating Expenses
Our total operating expenses consist primarily of sales and marketing expenses and general and administrative expenses, goodwill impairment and disposal loss of biological assets. Our total operating expenses increased by approximately $58.3 million, or 83.2%, from approximately $70.0 million in 2008 to approximately $128.3 million in 2009.
30
Sales and marketing. Our sales and marketing expenses consist primarily of advertising and market promotion expenses, and other overhead expenses incurred by our sales and marketing personnel. Sales and marketing expenses increased approximately $54.4 million, or 107.3%, from approximately $50.7 million for 2008 to approximately $105.1 million for 2009. This increase was primarily attributable to an increase of approximately $20.1 million, or 180.6%, in advertising expense, an increase of approximately $18.7 million, or 134.5%, in total promotion costs, an increase of approximately $10.1 million, or 74.6%, in salary of marketing staff, and an increase of approximately $3.0 million, or 59.9%, in transportation costs. Total promotion costs include expenses related to promotion activities and wages of certain sales people. Sales and marketing expenses are likely to increase as we continue to expand our distribution network throughout China and seek to increase our market share and awareness of our premium quality products.
General and Administrative. Our general and administrative expenses consist primarily of salary, travel expenses, entertainment expenses, benefits, share-based compensation, and professional service fees. General and administrative expenses increased approximately $1.5 million, or 7.5%, from approximately $19.0 million for 2008 to $20.5 million for 2009. The increase was primarily attributable to an increase of approximately $1.8 million, or 51.6%, in staff salary and welfare contributions and an increase of approximately $1.2 million, or 96.1%, in share-based compensation expenses. The increase was partially offset by a decrease of approximately $1.0 million, or 57.2%, in amortization expenses and a decrease of approximately $0.7 million, or 453.9%, in provisions for bad debt. Decrease in provisions for bad debt was primarily attributable to decreases in receivables from raw milk powder customers as the industry recovered from the melamine crisis. General and administrative expenses are likely to increase as we continue to expand our production, sourcing capacity, and distribution capacity throughout China.
Goodwill Impairment Expense. We recognized a goodwill impairment charge of approximately $0.9 million, an increase of approximately $0.9 million or 100.0%, from approximately $nil in 2008, related to Shanxi Feihe as a result of the decline in sales of our walnut powder products.
Loss on disposal of biological assets. Our loss on disposal of biological assets increased by approximately $1.4 million, or 466.7%, from approximately $0.3 million in 2008 to approximately $1.7 million in 2009. The increase reflects our sale of under-producing cows at our company-owned dairy farms.
Operating Income
As a result of the foregoing, our operating income decreased by approximately $4.1 million, or 63.1%, from approximately $6.5 million in 2008 to approximately $2.4 million in 2009.
Other Income (Expenses)
Our other income (expenses) consists primarily of interest and finance costs, registration rights penalty, loss on derivatives and government subsidies. Other income increased by approximately $5.4 million, or 70.1%, from approximately $7.7 million for 2008 to approximately $13.1 million for 2009. The increase was primarily attributable to a decrease of approximately $12.7 million, or 67.4%, in interest and finance costs, an increase of approximately $14.4 million, or 211.0%, in government subsidies and a decrease of approximately $2.4 million, or 100%, in registration penalty rights which were a one-off penalty expense. The decrease was partially offset by a decrease of approximately $6.2 million, or 74.0%, in loss on derivatives. Loss on derivatives in 2008 was primarily attributable to our repurchase of all of our 2012 Notes, which we completed in the third quarter of 2009, while the loss in 2009 was primarily attributable to our common stock financing.
Income Tax (Benefit) Expenses
We are subject to U.S. federal and state income taxes, and our subsidiaries incorporated in the PRC are subject to enterprise income taxes in the PRC. Our income tax expenses decreased by approximately $4.3 million, or 120.9%, from an expense of approximately $3.6 million in 2008 to a benefit of approximately $0.7 million in 2009. The decrease was primarily attributable to losses experienced in our fourth quarter which reduced our overall tax for the year.
31
Net Income from Discontinued Operations, Net of Tax
Due to a letter of intent we entered into in December 2008 to sell Moveup, accounts relating to our subsidiary Moveup are reflected in our financial statements as discontinued operations. Our net income from discontinued operations decreased by approximately $3.2 million, or 49.2%, from approximately $6.5 million in 2008 to approximately $3.3 million in 2009.
Liquidity and Capital Resources
Overview
In general, our primary uses of cash are providing for working capital purposes, which principally represent the purchase of inventory, servicing debt and financing construction related to our expansion plans. Capital expenditures for the years ended December 31, 2010, 2009 and 2008 amounted approximately to $45.3 million, $89.8 million and $35.3 million, respectively. Our largest source of operating cash flows is cash collections from our customers. We have been able to meet our cash needs principally by using cash on hand, cash flows from operations, bank loans, proceeds from the sale of securities and borrowings under our line of credit.
The accompanying consolidated financial statements have been prepared assuming we will continue as a “going concern.” We had a deficiency of net current assets of approximately $59.3 million as of December 31, 2010 and experienced a net loss of approximately $9.9 million in the year ended December 31, 2010. We have significant cash commitments in the upcoming fiscal year, including maturity of short-term loans of approximately $68.8 million and redemption of redeemable common stock of $63 million plus interest. However, we believe we will be able to refinance much of our short-term bank loans when they become due and that our cash generated from operations, along with existing cash and ability to draw down on unutilized credit lines, will be sufficient to fund our expected cash flow requirements for at least next 12 months, including the redemption of our redeemable common stock and planned capital expenditures. Our minimum projected obligations for fiscal year 2011 and beyond are set forth below under “Contractual Obligations.”
Cash Flows
As of December 31, 2010, we had retained earnings of approximately $60.7 million, cash and cash equivalents of approximately $17.5 million, and total current assets of approximately $137.2 million and working capital deflict of approximately $59.3 million.
Our summary cash flow information is as follows:
|
Year ended December 31
|
||||||||||||
|
Net cash provided by (used in):
|
2010
|
2009
|
2008
|
|||||||||
|
($ in thousands)
|
||||||||||||
|
Operating activities
|
5,545 | 27,207 | 22,504 | |||||||||
|
Investing activities
|
(42,878 | ) | (54,649 | ) | (23,282 | ) | ||||||
|
Financing activities
|
5,608 | 62,283 | (279 | ) | ||||||||
Net Cash Provided by Operating Activities
Net cash provided by operating activities for fiscal year 2010 decreased approximately $21.7 million, from net cash provided by operating activities of approximately $27.2 million in 2009 to approximately $5.5 million in 2010. This decrease was primarily attributable to the following changes in working capital items:
|
|
·
|
increase in inventory purchases of approximately $6.4 million reflecting our increased production in preparation to meet expected sales demand;
|
|
|
·
|
increase in advances to suppliers of approximately $4.6 million as a result of increased production combined with the rising costs of raw material, especially purchased raw milk powder which prices increased approximately 24% in 2010;
|
|
|
·
|
increased payment of approximately $6.5 million in notes payable primarily as a result of increased inventory purchases;
|
|
|
·
|
decrease of government subsidies of approximately $11.5 million as a significant amount of government subsidy received in 2009 was related to the Longjiang Feihe acquisition; and
|
|
|
·
|
increase of approximately $8.2 million in advances from customers for raw milk powder primarily attributable to increased sales of raw milk powder despite an overall decrease in sales.
|
32
For the year ended December 31, 2009 net income increased by approximately $5.6 million, while net cash provided by operating activities increased approximately $4.7 million, from approximately $22.5 million in 2008 to approximately $27.2 million in 2009 due to the following changes in working capital items:
|
|
·
|
decrease of inventory purchases of approximately $20.1 million partially offset by decrease in accounts payable of $15.9 million as compared with 2008. Because we intended to significantly expand the business in 2008 and believed our competitive position following the melamine crisis was favorable, we purchased significant amounts of raw material and accordingly produced increased levels of inventory in 2008. Although our business plan in 2009 still includes expansion, we have shifted our product mix to higher-margin milk powder and therefore sold off excess inventory at lower margins to stabilize our inventory levels;
|
|
|
·
|
increase in trade receivables of approximately $6.3 million primarily due to increases in sales of higher-margin products in addition to our expansion within China during 2009 as compared to 2008. In 2009, we also increased credit limits available to long term customers, although we continue to require advance payments from new customers;
|
|
|
·
|
decrease in advances from customers of approximately $8.1 million, which reflected a higher balance of advance from distributors at the year end of 2008, ordering sufficient milk powder to meet the increased needs of 2009 first quarter’s sales which was a direct result of the melamine crisis;
|
|
|
·
|
increase in amounts due to related parties of approximately $8.9 million, relating to the advance received from one related company for the purchase of cattle; and
|
|
|
·
|
increase in advances to suppliers of approximately $9.7 million relating to our upcoming productions in the first half of 2010 to meet our increasing demands in the winter season. Additionally, costs of raw material in 2009 have increased compared to 2008.
|
Net Cash Used in Investing Activities
Net cash used in investing activities decreased approximately $11.7 million, from approximately $54.6 million in 2009 to approximately $42.9 million in 2010. This decrease was primarily attributable to a decrease in purchase of property and equipment of approximately $34.7 million, a decrease in purchase of biological assets of approximately $9.7 million, an increase in the proceeds from sales of biological assets of approximately $4.5 million and purchase of our Longjiang Feihe dairy operations for approximately $4.4 million in 2009. This decrease was offset in part by an increase in restricted cash of approximately $2.6 million and proceeds from sale of a subsidiary of approximately $39.0 million. Net cash used in investing activities primarily relates to our bank and expenditures associated with our construction and acquisition of new facilities.
Net cash used in investing activities increased approximately $31.3 million, from approximately $23.3 million in 2008 to approximately $54.6 million in 2009. This increase was primarily attributable to an increase in purchase of property and equipment of approximately $41.1 million, an increase in purchase of biological assets of approximately $13.5 million and our purchase in 2009 of our Longjiang Feihe dairy operations for approximately $4.4 million. This increase was offset in part by proceeds from sale of a subsidiary of approximately $39.0 million and a decrease in time deposit of approximately $8.4 million. Net cash used in investing activities primarily relates to our bank and expenditures associated with our construction and acquisition of new facilities.
Net Cash Provided by (used in) Financing Activities
Net cash provided by financing activities decreased by approximately $56.7 million, from approximately $62.3 million in 2009 to approximately $5.6 million in 2010. The decrease was primarily attributable to the proceeds of approximately $62.9 million from our common stock financing in 2009, a decrease in proceeds from long term bank loans of approximately $21.0 million and increases in repayment of short term bank loans and long term bank loans of approximately $51.4 million and $9.4 million, respectively. The decrease was offset in part by the repayment of short term debt of approximately $80.5 million in 2009 and an increase in proceeds from short term bank loans of approximately $10.0 million.
33
Net cash provided by financing activities increased by approximately $62.6 million, from cash used approximately $0.3 million in 2008 to cash provided approximately $62.3 million in 2009. The increase was primarily attributable to the proceeds of approximately $62.9 million from our common stock financing, an increase in proceeds from short term bank loans of approximately $50.3 million and an increase in proceeds from long term bank loans of approximately $15.8 million, respectively. The increase was offset in part by the repayment of short term debt of approximately $69.5 million and a decrease in the repayment of short term bank loans of approximately $1.5 million.
Outstanding Indebtedness
Redemption Obligation
In August 2009, pursuant to a subscription agreement, we issued 2,100,000 shares of our common stock to the Purchasers, for an aggregate purchase price of $63.0 million. Because we did not meet certain earnings per share targets for 2009, we issued 525,000 additional shares to the Purchasers pursuant to the subscription agreement. In February 2011, we entered into a redemption agreement with the Purchasers to redeem and purchase from the Purchasers the 2,625,000 shares issued pursuant to the subscription agreement in four equal installments on or around March 31, 2011, September 30, 2011, December 31, 2011 and March 31, 2012, for an aggregate payment on each such date of $15,750,000, together with interest accruing at the rate of 1.5% per annum, compounded annually from August 27, 2009 until such date.
Short and Long Term Loans Payable
As of December 31, 2010, we had short term loans of approximately $68.8 million and long term loans of approximately $37.9 million from PRC banks. Our bank loans do not contain financial covenants. During the three and twelve month periods ended December 31, 2010, the largest aggregate amount of short term bank loans was approximately $71.5 million and $71.5 million, respectively. The maturity dates of the short term bank loans outstanding from PRC banks as of December 31, 2010 ranged from January 13, 2011 to December 23, 2011. All short term bank loans that have become due have been repaid. During the three and twelve month periods ended December 31, 2010, the largest aggregate amount of long term loans was approximately $37.9 million and $37.9 million, respectively. The maturity dates of the long term loans outstanding from PRC banks as of December 31, 2010 ranged from October 28, 2014 to December 24, 2015. The weighted average interest rate on short term bank loans and long term loans from PRC banks outstanding as of December 31, 2010 was 5.46% and 6.3%, respectively. The loans were secured by pledges of certain fixed assets held by our subsidiaries or by guarantees of certain of our subsidiaries. Our ability to incur additional secured indebtedness depends in part on the value of our assets, which depends, in turn, on the strength of our cash flows, results of operations, economic and market conditions and other factors.
Line of Credit
We also have a one year, unsecured line of credit with a bank of approximately $102 million (RMB 677 million) scheduled to expire in the last fiscal quarter of 2011. The line of credit entitles us to draw demand loans for general corporate purposes. If we were to draw on the line of credit, interest would be a base rate established by the People’s Bank of China on the unpaid principal amount. As of December 31, 2010, there were borrowings of approximately $30 million under the line of credit. The net availability of the line of credit was approximately $72 million as of December 31, 2010.
Equipment Financing
In October 2009, we entered into a loan agreement with a bank in the PRC for a principal amount of up to $9.2 million for the purpose of financing the purchase of certain equipment. The loan bears interest at the six-month LIBOR rate plus 1.95%, with principal payable in 10 equal semi-annual installments and interest payable semi-annually. As of December 31, 2009, there was approximately $4.0 million in principal payable under this loan. The loan was fully repaid in June 2010.
In November 2009, we entered into a six-year capital lease agreement for certain equipment under construction. The terms of the lease required an initial payment of approximately $756,200 and a payment of approximately $151,200 on January 30th of each year after successful completion of production quality tests. The equipment has been successfully installed and put into production as of December 31, 2010, and was depreciated over an estimated productive life of 14 years. As of December 31, 2010 and 2009, we had approximately $1.5 million and $nil, respectively, of equipment subject to the capital lease.
34
Contractual Obligations
Our contractual obligations consist mainly of payments related to long-term debt and related interest, capital leases to purchase certain equipment, FIN 48 obligations, capital purchase of property, plant and equipment, and product purchase obligations. The following table sets forth information regarding our outstanding contractual obligations by maturity as of December 31, 2010, as well our obligation to redeem $63 million redeemable common stock plus interest as a result of entering into a redemption agreement in February 2011:
|
Payment due by period
(amounts in thousands of US$)
|
|
Total
|
Less than
1 year
|
1-3 years
|
3-5 years
|
More than
5 years
|
||||||||||||||||
|
(in thousands)
|
||||||||||||||||||||
| Short-term debt obligations | $ | 68,816 | $ | 68,816 | $ | - | $ | - | $ | - | ||||||||||
|
Long-term debt obligations
|
|
37,859
|
|
9,756
|
|
-
|
|
28,103
|
|
-
|
||||||||||
|
Capital lease obligations
|
756
|
151
|
454
|
151
|
-
|
|||||||||||||||
|
FIN 48 obligations
|
5,062
|
-
|
-
|
-
|
-
|
|||||||||||||||
|
Purchase obligations
|
7,028
|
2,188
|
3,630
|
1,210
|
-
|
|||||||||||||||
|
Capital obligations
|
5,098
|
-
|
-
|
-
|
-
|
|||||||||||||||
|
Redemption of redeemable stock and interest
|
65,080
|
48,701
|
16,379
|
-
|
-
|
|||||||||||||||
|
Total
|
$
|
189,699
|
$
|
129,612
|
$
|
20,463
|
$
|
29,464
|
$
|
-
|
||||||||||
Selected Unaudited Quarterly Results of Operations
The following table sets forth unaudited quarterly statements of operations data for the eight quarters ended December 31, 2010. We believe this unaudited information has been prepared substantially on the same basis as the annual audited consolidated financial statements appearing elsewhere in this report. We believe this data includes all necessary adjustments, consisting only of normal recurring adjustments, necessary for a fair presentation. You should read the quarterly data in conjunction with our audited consolidated financial statements and related notes appearing elsewhere in this Annual Report. The consolidated results of operations for any quarter are not necessarily indicative of the operating results for any future period. We expect that our quarterly revenues may fluctuate significantly.
For our 2010 and 2009 fiscal years, our quarterly results of operations were summarized as follows:
|
Three Months Ended (Unaudited)
|
||||||||||||||||
|
Fiscal 2010
|
December 31
|
September 30
|
June 30
|
March 31
|
||||||||||||
|
US$
|
US$
|
US$
|
US$
|
|||||||||||||
|
Sales
|
62,328,127
|
61,141,112
|
52,194,506
|
81,435,903
|
||||||||||||
|
Gross profit
|
19,036,835
|
27,312,648
|
18,464,339
|
38,437,721
|
||||||||||||
|
Net income (loss) from continuing operations, net of tax
|
1,708,270
|
3,645,057
|
(20,720,485
|
)
|
5,471,903
|
|||||||||||
|
Net income (loss) from discontinued operations, net of tax
|
-
|
-
|
-
|
-
|
||||||||||||
|
Net income (loss) attributable to Feihe International, Inc.
|
793,239
|
3,577,264
|
(20,574,592
|
)
|
5,533,596
|
|||||||||||
|
Earnings per share – Basic
|
||||||||||||||||
|
Net income (loss) from continuing operations
|
0.08
|
0.16
|
(0.92
|
)
|
0.25
|
|||||||||||
|
Net income from discontinued operations
|
-
|
-
|
-
|
-
|
||||||||||||
|
Net income (loss)
|
0. 08
|
0.16
|
(0.92
|
)
|
0.25
|
|||||||||||
|
Earnings per share – Diluted
|
||||||||||||||||
|
Net income (loss) from continuing operations
|
0. 08
|
0.16
|
(0.92
|
)
|
0.25
|
|||||||||||
|
Net income from discontinued operations
|
-
|
-
|
-
|
-
|
||||||||||||
|
Net income (loss)
|
0. 08
|
0.16
|
(0.92
|
)
|
0.25
|
|||||||||||
|
Earnings per redeemable common share – Basic
|
||||||||||||||||
|
Net income (loss) from continuing operations
|
0.45
|
0.16
|
(0.92
|
)
|
0.25
|
|||||||||||
|
Net income from discontinued operations
|
-
|
-
|
-
|
-
|
||||||||||||
|
Net income (loss)
|
0.45
|
0.16
|
(0.92
|
)
|
0.25
|
|||||||||||
|
Earnings per redeemable common share – Diluted
|
||||||||||||||||
|
Net income (loss) from continuing operations
|
0.45
|
0.16
|
(0.92
|
)
|
0.25
|
|||||||||||
|
Net income from discontinued operations
|
-
|
-
|
-
|
-
|
||||||||||||
|
Net income (loss)
|
0.45
|
0.16
|
(0.92
|
)
|
0.25
|
|||||||||||
35
|
Three Months Ended (Unaudited)
|
||||||||||||||||
|
Fiscal 2009
|
December 31
|
September 30
|
June 30
|
March 31
|
||||||||||||
|
US$
|
US$
|
US$
|
US$
|
|||||||||||||
|
Sales
|
43,958,701
|
72,110,934
|
41,186,466
|
113,821,847
|
||||||||||||
|
Gross (loss) profit
|
(3,040,156)
|
36,981,402
|
24,132,413
|
72,577,578
|
||||||||||||
|
Net (loss) income from continuing operations
|
(27,046,014)
|
11,133,549
|
4,328,252
|
27,757,421
|
||||||||||||
|
Net income from discontinued operations
|
-
|
-
|
3,286,694
|
3,214
|
||||||||||||
|
Net (loss) income attributable to Feihe International, Inc.
|
(26,977,937)
|
11,141,097
|
7,631,443
|
27,786,783
|
||||||||||||
|
Earnings per share – Basic
|
||||||||||||||||
|
Net (loss) income from continuing operations
|
(1.24)
|
0.57
|
0.25
|
1.61
|
||||||||||||
|
Net income from discontinued operations
|
-
|
-
|
0.19
|
-
|
||||||||||||
|
Net (loss) income
|
(1.24)
|
0.57
|
0.44
|
1.61
|
||||||||||||
|
Earnings per share – Diluted
|
||||||||||||||||
|
Net (loss) income from continuing operations
|
(1.17)
|
0.52
|
0.24
|
1.55
|
||||||||||||
|
Net income from discontinued operations
|
-
|
-
|
0.16
|
-
|
||||||||||||
|
Net (loss) income
|
(1.17)
|
0.52
|
0.40
|
1.55
|
||||||||||||
|
Earnings per redeemable common stock – Basic
|
||||||||||||||||
|
Net (loss) income from continuing operations
|
(1.24)
|
0.57
|
0.25
|
1.61
|
||||||||||||
|
Net income from discontinued operations
|
-
|
-
|
0.19
|
-
|
||||||||||||
|
Net (loss) income
|
(1.24)
|
0.57
|
0.44
|
1.61
|
||||||||||||
|
Earnings per redeemable common share – Diluted
|
||||||||||||||||
|
Net (loss) income from continuing operations
|
(1.17)
|
0.52
|
0.24
|
1.55
|
||||||||||||
|
Net income from discontinued operations
|
-
|
-
|
0.16
|
-
|
||||||||||||
|
Net (loss) income
|
(1.17)
|
0.52
|
0.40
|
1.55
|
||||||||||||
36
Off Balance Sheet Arrangements
We have not entered into any transactions, agreements or other contractual arrangements to which an entity unconsolidated with us is a party and under which we have (i) any obligation under a guarantee, (ii) any retained or contingent interest in assets transferred to an unconsolidated entity that serves as credit, liquidity or market risk support to such entity, (iii) any obligation under derivative instruments that are indexed to our shares and classified as shareholders’ equity in our consolidated balance sheets, or (iv) any obligation arising out of a variable interest in any unconsolidated entity that provides financing, liquidity, market risk or credit support to us or engages in leasing, hedging or research and development services with us.
Critical Accounting Policies
The consolidated financial statements include the financial statements of us and our subsidiaries. All transactions and balances among us and our subsidiaries have been eliminated upon consolidation. Certain amounts included in or affecting our consolidated financial statements and related disclosures must be estimated, requiring us to make certain assumptions with respect to values or conditions that cannot be known with certainty at the time the financial statements are prepared. These estimates and assumptions affect the amounts we report for assets and liabilities, our disclosure of contingent assets and liabilities at the date of our financial statements, and the reported amounts of revenues and expenses during the reported periods. We routinely evaluate these estimates, utilizing historical experience, consulting with experts and utilizing other methods we consider reasonable in the particular circumstances. Nevertheless, actual results may differ significantly from our estimates. Any effects on our business, financial position or results of operations resulting from revisions to these estimates are recorded in the period in which the facts that give rise to the revision become known.
Estimates of allowances for bad debts – We periodically review our trade and other receivables to determine if all are collectible or whether an allowance is required for possible uncollectible balances. We perform this review quarterly, and in determining the allowances, a number of factors are considered, including the length of time the receivable is past due, past loss history, the counter party’s current ability to pay and the general condition of the economy and industry. As a result of this review and collection of older receivables, we have reduced our estimated allowance for bad debts by $240,309 for the year ended December 31, 2010 and reduced it by $523,473 for the year ended December 31, 2009. Although our write-offs of bad debts have been minimal in recent years and we had no write-off in the year ended December 31, 2010, events and circumstances could occur that would require that we increase our allowance in the future.
Estimate of the useful lives of property and equipment and biological assets – We estimate the useful lives and residual values of our property and equipment and biological assets. We also review property and equipment and biological assets for possible impairment whenever events and circumstances indicate that the carrying value of those assets may not be recovered from the estimated future cash flows expected to result from their use and eventual disposition. We recognized no impairments in the years ended December 31, 2010 and 2009. For our cows included in the biological assets, we regularly monitor their production level and intend to dispose of under producing cows. We recognized approximately $10.2 million and $1.7 million of loss on such disposal in fiscal year 2010 and 2009, respectively.
Inventory – We value inventories at the lower of cost or market value. We determine the cost of inventories using the weighted average cost method and include any related production overhead costs incurred in bringing the inventories to their present location and condition. We determine whether we have any excessive, slow moving, obsolete or impaired inventory. We perform this review quarterly, which requires management to estimate the future demand of our products and market conditions. We make provisions on the value of inventories at period end equal to the difference between the cost and the estimated market value. If actual market conditions change, additional provisions may be required.
37
Goodwill – We test goodwill annually for impairment or more frequently if events or changes in circumstances indicate that it might be impaired. We currently have ten reporting units and only two reporting units carry assigned goodwill: Shanxi Feihe and Gannan Feihe. We perform annual impairment test on December 31 on the two reporting units. We recognize a goodwill impairment loss in our statements of operations when the carrying amount of goodwill exceeds its implied fair value which is based on their undiscounted cash flows. These analyses require management to make assumptions and to apply judgment, including forecasting future sales, expenses, and discount rates, which can be affected by economic conditions and other factors that can be difficult to predict.
We perform the impairment test at the end of the fourth quarter each year. As a result of this impairment testing, we recognized $1,437,005 and $929,526 in goodwill impairment expense for the years ended December 31, 2010 and 2009, respectively, reducing the carrying value of goodwill related to Shanxi Feihe to nil as of December 31, 2010. For additional details, see Note 19 to the audited consolidated financial statements contained elsewhere in this report.
Revenue recognition – Revenue from the sale of goods is recognized on the transfer of risks and rewards of ownership, which generally coincides with the time when the goods are shipped to customers and the title has passed. Revenue is shown net of sales returns, which amounted to less than 0.8% of total sales in each of the years ended December 31, 2010, 2009 and 2008, and net of sales discounts, which are determined based on our distributors’ sales volumes.
Share-based compensation – Share-based compensation to employees is measured by reference to the fair value of the equity instrument as at the date of grant using the Black-Scholes model, which requires assumptions for dividend yield, expected volatility and expected life of stock options. The expected life of stock options is estimated by observing general option holder behavior. The assumption of the expected volatility has been set by reference to the implied volatility of our shares in the open market and historical patterns of volatility. Performance and service vesting conditions attached to the options are included in assumptions about the number of shares that the option holder will ultimately receive. On a regular basis we review the assumptions made and revise the estimates of the number of options expected to be settled, where necessary. Significant factors affecting the fair value of option awards include the estimated future volatility of our stock price and the estimated expected term until the option award is exercised or cancelled.
The fair value of awards is amortized over the requisite service period, except for 2,073,190 options granted in May 2009 that vest upon performance conditions. For such performance based awards, we assess the probability of meeting such conditions in order to determine the compensation cost to be recognized. For the years ended December 31, 2010 and 2009, we determined that it was improbable for the performance targets to be met for the performance awards. Total compensation expense recognized in general and administrative expenses for the years ended December 31, 2010, 2009 and 2008, were approximately $1.7 million, $2.2 million and $0.1 million, respectively.
Redeemable common stock – The value of redeemable common stock is measured at the fair value on the date of issuance. When and if the redemption right expires, the common stock will be classified as permanent shareholders’ equity. However, should the terms of the redemption change making it mandatory for us to redeem the common stock, such common stock will be reclassified to liabilities at its fair value with any differences between fair value and carrying value recognized in equity. We assess the probability of redemption and accrue proper accretion on a quarterly basis. Until management determines it is probable that the common stock will become redeemable, the change in the redemption value is not accreted.
At issuance, we determined that the contractual arrangement pursuant to which we issued the redeemable common stock contained an embedded derivative whereby additional shares would be granted should we fail to meet certain performance targets, which was bifurcated from the host and recorded at fair value. As of December 31, 2009, such performance targets were not attained and we recorded a loss of approximately $2.0 million for the difference in the fair value of the additional shares as a result of the performance adjustment and the initial fair value of the embedded derivative.
38
On February 1, 2011, we entered into a redemption agreement committing us to redeem the common stock at a total price of $63 million plus 1.5% annual compounded interest, beginning from August 27, 2009. We agreed to consummate the redemption in four closings from March 31, 2011 through March 31, 2012. As of December 31, 2010 we considered redemption to be probable and accreted the redeemable common stock to its redemption value of approximately $54.7 million as of December 31, 2010.
Taxation – Current income taxes are provided for in accordance with the laws of the relevant tax authorities. Deferred income taxes are recognized for temporary differences between the tax bases of assets and liabilities and their reported amounts in the financial statements. Net operating loss carry forwards and credits are applied using enacted statutory tax rates applicable to future years. Deferred tax assets are reduced by a valuation allowance when, in the opinion of management, it is more likely than not that some portion or all of the deferred tax assets will not be realized. The components of the deferred tax assets and liabilities are individually classified as current and non-current based on their characteristics.
We adopted ASC 740-10, “Income Taxes” (previously FASB Interpretation No. 48, “Accounting for Uncertainty in Income Taxes, an Interpretation of FASB Statement No. 109,” or FIN 48) effective April 1, 2007. In accordance with ASC 740-10, we recognize a tax benefit associated with an uncertain tax position when, in our judgment, it is more likely than not that the position will be sustained upon examination by a taxing authority. For a tax position that meets the more-likely-than-not recognition threshold, we initially and subsequently measure the tax benefit as the largest amount that we judge to have a greater than 50% likelihood of being realized upon ultimate settlement with a taxing authority. Our liability associated with unrecognized tax benefits is adjusted periodically due to changing circumstances, such as the progress of tax audits, case law developments and new or emerging legislation. Such adjustments are recognized entirely in the period in which they are identified. Our effective tax rate includes the net impact of changes in the liability for unrecognized tax benefits and subsequent adjustments as considered appropriate by management. We classify interest and penalties recognized on the liability for unrecognized tax benefits as income tax expense.
New Accounting Pronouncements
In January 2010, the Financial Accounting Standards Board, or the FASB, issued authoritative guidance to improve disclosures about fair value measurements. This guidance amends previous guidance on fair value measurements to add new requirements for disclosures about transfers into and out of Levels 1 and 2 and separate disclosures about purchases, sales, issuances, and settlements relating to Level 3 measurement on a gross basis rather than on a net basis as currently required. This guidance also clarifies existing fair value disclosures about the level of disaggregation and about inputs and valuation techniques used to measure fair value. This guidance is effective for annual and interim periods beginning after December 15, 2009, except for the requirement to provide the Level 3 activities of purchases, sales, issuances, and settlements on a gross basis, which will be effective for annual and interim periods beginning after December 15, 2010. Early application is permitted and, in the period of initial adoption, entities are not required to provide the amended disclosures for any previous periods presented for comparative purposes. The adoption of this guidance did not have a significant impact on our financial statements.
39
In March 2010, FASB issued authoritative guidance regarding the effect of denominating the exercise price of a share-based payment awards in the currency of the market in which the underlying equity securities trades and that currency is different from (1) entity’s functional currency, (2) functional currency of the foreign operation for which the employee provides services, and (3) payroll currency of the employee. The guidance clarifies that an employee share-based payment award with an exercise price denominated in the currency of a market in which a substantial portion of the entity’s equity securities trades should be considered an equity award assuming all other criteria for equity classification are met. The guidance will be effective for interim and annual periods beginning on or after December 15, 2010, and will be applied prospectively. Affected entities will be required to record a cumulative catch-up adjustment for all awards outstanding as of the beginning of the annual period in which the guidance is adopted. This adoption of the authoritative guidance is not expected to have a material impact on our financial statements.
In December 2010, FASB issued an authoritative pronouncement on when to perform Step 2 of the goodwill impairment test for reporting units with zero or negative carrying amounts. The amendments in this update modify Step 1 so that for those reporting units, an entity is required to perform Step 2 of the goodwill impairment test if it is more likely than not that a goodwill impairment exists. In determining whether it is more likely than not that a goodwill impairment exists, an entity should consider whether there are any adverse qualitative factors indicating that an impairment may exist. The qualitative factors are consistent with existing guidance, which requires that goodwill of a reporting unit be tested for impairment between annual tests if an event occurs or circumstances change that would more likely than not reduce the fair value of a reporting unit below its carrying amount. For public entities, the guidance is effective for impairment tests performed during entities’ fiscal years (and interim periods within those years) that begin after December 15, 2010. Early adoption will not be permitted. For nonpublic entities, the guidance is effective for impairment tests performed during entities’ fiscal years (and interim periods within those years) that begin after December 15, 2011. Early application for nonpublic entities is permitted; nonpublic entities that elect early application will use the same effective date as that for public entities. This adoption of the authoritative guidance is not expected to have a material impact on our financial statements.
In December 2010, the FASB issued an authoritative pronouncement on disclosure of supplementary pro forma information for business combinations. The objective of this guidance is to address diversity in practice regarding the interpretation of the pro forma revenue and earnings disclosure requirements for business combinations. The amendments in this update specify that if a public entity presents comparative financial statements, the entity should disclose revenue and earnings of the combined entity as though the business combination(s) that occurred during the current year had occurred as of the beginning of the comparable prior annual reporting period only. The amendments also expand the supplemental pro forma disclosures to include a description of the nature and amount of material, nonrecurring pro forma adjustments directly attributable to the business combination included in the reported pro forma revenue and earnings. The amendments will be effective for business combinations consummated in periods beginning after December 15, 2010, and should be applied prospectively as of the date of adoption. Early adoption is permitted. This adoption of the authoritative guidance is not expected to have a material impact on our financial statements.
Item 7A. Quantitative and Qualitative Disclosures About Market Risk
Interest Rate Risk
We invest in fixed and variable income investments classified as cash and cash equivalents and short-term investments. Our cash and cash equivalents are placed primarily in demand deposits, with maturities of three months or less and short-term investments are mutual funds. Our borrowings bear fixed interest rates. As of December 31, 2010, we had short term loans of approximately $68.8 million and long term loans of approximately $37.9 million from PRC banks, and the weighted average interest rates on our outstanding short term bank loans and long term loans was 5.46% and 6.3%, respectively. In addition, if we were to draw on our line of credit, interest would be a base rate established by the People’s Bank of China on the unpaid principal amount. Changes in interest rates would impact the interest income derived from our investments, which was $0.3 million, $0.3 million and $0.6 million for the years ended December 31, 2010, 2009 and 2008. We have not used derivative financial instruments to manage our interest rate risk exposure.
40
Foreign Currency Risk
We conduct substantially all of our operations in the PRC, and the Renminbi is the national currency in which our operations are conducted. We have not utilized any derivative financial instruments or any other financial instruments, nor do we utilize any derivative commodity instruments in our operations, nor any similar market sensitive instruments.
The exchange rate between the Renminbi and the U.S. dollar is subject to the PRC government’s foreign currency conversion policies, which may change at any time. The exchange rate at December 31, 2009 was approximately 6.8 Renminbi to 1 U.S. dollar. The exchange rate at December 31, 2010 was approximately 6.6 Renminbi to 1 U.S. dollar. The exchange rate is currently permitted to float within a very limited range. However, there remains significant international pressure on the PRC government to adopt a substantial liberalization of its currency policy, which could result in a further and more significant appreciation in the value of the Renminbi against the U.S. dollar. Any devaluation of the Renminbi against the U.S. dollar would consequently have an adverse effect on our financial performance and asset values when measured in terms of U.S. dollars. We recognized a foreign currency translation gain of approximately $7.2 million for the year ended December 31, 2010.
Inflation
In recent years, China has not experienced significant inflation, and thus inflation has not had a material impact on our results of operations. According to the National Bureau of Statistics of China, the change in Consumer Price Index in China was 5.9%, -0.7% and 4.6% in 2008, 2009 and 2010, respectively.
Item 8. Financial Statements and Supplementary Data
Please see the accompanying audited consolidated financial statements attached hereto beginning on page F-1.
Item 9. Changes in and Disagreements with Accountants on Accounting and Financial Disclosure
Effective April 13, 2010, we dismissed Grant Thornton, the Hong Kong member firm of Grant Thornton International Ltd., now known as JBPB & Co., as our independent registered public accounting firm. During the fiscal year ended December 31, 2010 or during the subsequent fiscal year, we had no disagreements with JBPB & Co. of the type described in Item 304(a)(1)(v) of Regulation S-K and no transactions or events similar to those which involved such disagreements or reportable events, which transactions or events were material and were accounted for or disclosed in a manner different from that which JBPB & Co. apparently would have concluded was required.
Item 9A. Controls and Procedures
Evaluation of Disclosure Controls and Procedures
Under the supervision and with the participation of our management, including our chief executive officer and acting chief financial officer, we conducted an evaluation of our disclosure controls and procedures as of December 31, 2010, as such term is defined in Exchange Act Rules 13a-15(e) and 15d-15(e). Based on this evaluation, our chief executive officer and acting chief financial officer concluded that during the period covered by this Annual Report on Form 10-K, our disclosure controls and procedures were not effective as of December 31, 2010 to give a reasonable assurance that information required to be disclosed by us in our Exchange Act reports is recorded, processed, summarized, and reported within the time periods specified in the SEC’s rules and forms, and that such information is accumulated and communicated to our management, including our chief executive officer and acting chief financial officer, as appropriate to allow timely decisions regarding required disclosure. This determination was primarily due to the identification of the material weakness in our internal control over financial reporting discussed below in “Management’s Annual Report on Internal Control Over Financial Reporting,” which we regard as an integral part of our disclosure controls and procedures.
41
Management’s Report on Internal Control Over Financial Reporting
Our management is responsible for establishing and maintaining adequate internal control over financial reporting, as such term is defined in Exchange Act Rules 13a-15(f) and 15d-15(f). Internal control over financial reporting refers to the process designed by, or under the supervision of, our chief executive officer and acting chief financial officer, and effected by our board of directors, management and other personnel, to provide reasonable assurance regarding the reliability of financial reporting and the preparation of financial statements for external purposes in accordance with GAAP, and includes those policies and procedures that:
1. Pertain to the maintenance of records that in reasonable detail accurately and fairly reflect the transactions and dispositions of our assets;
2. Provide reasonable assurance that transactions are recorded as necessary to permit preparation of financial statements in accordance with GAAP, and that our receipts and expenditures are being made only in accordance with authorization of our management and directors; and
3. Provide reasonable assurance regarding prevention or timely detection of unauthorized acquisitions, use or disposition of our assets that could have a material effect on the financial statements.
All internal control systems, no matter how well designed, have inherent limitations. Therefore, even those systems determined to be effective can provide only reasonable assurance with respect to financial statement preparation and presentation. Because of its inherent limitations, internal control over financial reporting may not prevent or detect misstatements. Projections of any evaluation of effectiveness to future periods are subject to the risk that controls may become inadequate because of changes in conditions or that the degree of compliance with the policies or procedures may deteriorate.
Under the supervision and with the participation of our management, including our chief executive officer and acting chief financial officer, we conducted a comprehensive review, evaluation and assessment of the effectiveness of our internal control over financial reporting as of December 31, 2010 based on the framework in Internal Control — Integrated Framework issued by the Committee of Sponsoring Organizations of the Treadway Commission. Based on our evaluation as discussed in the paragraphs below, our chief executive officer and acting chief financial officer have concluded that as of December 31, 2010, our internal control over financial reporting was not effective due to the identification of the following material weakness: We had insufficient accounting personnel with appropriate knowledge of GAAP.
A material weakness is a deficiency, or a combination of deficiencies, in internal control over financial reporting, such that there is a reasonable possibility that a material misstatement of our annual or interim financial statements will not be prevented or detected on a timely basis.
Because of this weakness and our historical weaknesses and deficiencies, management took additional steps to ensure the reliability of our financial reporting. These steps included additional internal review, additional Audit Committee review, efforts to remediate historical material weaknesses and significant deficiencies in internal control over financial reporting, and the performance of additional procedures by management with respect to the financial statements contained in this Annual Report.
Our independent registered public accounting firm, Deloitte Touche Tohmatsu CPA Ltd., who also audited our consolidated financial statements, independently assessed the effectiveness of our internal control over financial reporting as of December 31, 2010, as stated in their report which is included in this Annual Report on Form 10-K.
42
Report of Independent Registered Public Accounting Firm
REPORT OF INDEPENDENT REGISTERED PUBLIC ACCOUNTING FIRM
To the Board of Directors and Shareholders of Feihe International, Inc.
We have audited Feihe International, Inc. and subsidiaries’ (the “Company’s”) internal control over financial reporting as of December 31, 2010, based on criteria established in Internal Control — Integrated Framework issued by the Committee of Sponsoring Organizations of the Treadway Commission. The Company’s management is responsible for maintaining effective internal control over financial reporting and for its assessment of the effectiveness of internal control over financial reporting, included in the accompanying Management’s Report on Internal Control Over Financial Reporting. Our responsibility is to express an opinion on the Company’s internal control over financial reporting based on our audit.
We conducted our audit in accordance with the standards of the Public Company Accounting Oversight Board (United States). Those standards require that we plan and perform the audit to obtain reasonable assurance about whether effective internal control over financial reporting was maintained in all material respects. Our audit included obtaining an understanding of internal control over financial reporting, assessing the risk that a material weakness exists, testing and evaluating the design and operating effectiveness of internal control based on that risk, and performing such other procedures as we considered necessary in the circumstances. We believe that our audit provides a reasonable basis for our opinion.
A company’s internal control over financial reporting is a process designed by, or under the supervision of, the company’s principal executive and principal financial officers, or persons performing similar functions, and effected by the company’s board of directors, management, and other personnel to provide reasonable assurance regarding the reliability of financial reporting and the preparation of financial statements for external purposes in accordance with generally accepted accounting principles. A company’s internal control over financial reporting includes those policies and procedures that (1) pertain to the maintenance of records that, in reasonable detail, accurately and fairly reflect the transactions and dispositions of the assets of the company; (2) provide reasonable assurance that transactions are recorded as necessary to permit preparation of financial statements in accordance with generally accepted accounting principles, and that receipts and expenditures of the company are being made only in accordance with authorizations of management and directors of the company; and (3) provide reasonable assurance regarding prevention or timely detection of unauthorized acquisition, use, or disposition of the company’s assets that could have a material effect on the financial statements.
Because of the inherent limitations of internal control over financial reporting, including the possibility of collusion or improper management override of controls, material misstatements due to error or fraud may not be prevented or detected on a timely basis. Also, projections of any evaluation of the effectiveness of the internal control over financial reporting to future periods are subject to the risk that the controls may become inadequate because of changes in conditions, or that the degree of compliance with the policies or procedures may deteriorate.
A material weakness is a deficiency, or a combination of deficiencies, in internal control over financial reporting, such that there is a reasonable possibility that a material misstatement of the company’s annual or interim financial statements will not be prevented or detected on a timely basis. The following material weakness has been identified and included in management’s assessment.
The Company had insufficient accounting personnel with appropriate knowledge of accounting principles generally accepted in the United States of America.
This material weakness was considered in determining the nature, timing, and extent of audit tests applied in our audit of the consolidated financial statements and financial statement schedule as of and for the year ended December 31, 2010, of the Company and this report does not affect our report on such financial statements and financial statement schedule. In our opinion, because of the effect of the material weakness identified above on the achievement of the objectives of the control criteria, the Company has not maintained effective internal control over financial reporting as of December 31, 2010, based on the criteria established in Internal Control — Integrated Framework issued by the Committee of Sponsoring Organizations of the Treadway Commission.
43
We have also audited, in accordance with the standards of the Public Company Accounting Oversight Board (United States), the consolidated financial statements and financial statement schedule as of and for the year ended December 31, 2010, of the Company and our report dated March 31, 2011 expressed an unqualified opinion on those financial statements and financial statement schedule with an emphasis paragraph on the Company’s substantial doubt about the Company’s ability to continue as a going concern.
Deloitte Touche Tohmatsu CPA, Ltd.
Beijing, the People’s Republic of China
March 31, 2011
Changes in Internal Controls
As part of “Management’s Report In Internal Controls Over Financial Reporting” for the year ended December 31, 2009, we identified that we did not effectively and timely assess the accounting treatment for certain routine and non-routine transactions, including sales, purchases, government subsidy income, and operating expense, which we consider to constitute a material weakness. As required by Rule 13a-15(d) under the Securities Exchange Act of 1934, our management, including our chief executive officer and our acting chief financial officer, conducted an evaluation our internal control over financial reporting as of December 31, 2010. During this assessment, our chief executive officer and acting chief financial officer determined that the remedial measures we have taken surrounding financial reporting have addressed our previous material weakness of ineffective and untimely assessment of accounting treatment for routine and non-routine transactions. In particular, as described in our Form 10-Q for the quarterly period ended September 30, 2010, we have enhanced our control procedures by adding certain monitoring controls such as management reviews to assess the accounting treatment of routine transactions. We have also engaged a third party consultant to evaluate the accounting impact of non-routine transactions to our financial statements. There have not been any changes in our internal control over financial reporting in the three months ended December 31, 2010, that have materially affected, or are reasonably likely to materially affect, our internal control over financial reporting.
However, with the continuing expansion of our business and the inherent complexity in GAAP and SEC reporting requirements, we believe that we lack sufficient accounting personnel with appropriate knowledge GAAP.
Remediation Plan
After the identification of the material weakness as of December 31, 2010, we have undertaken or are in the process of undertaking a number of measures to improve our internal controls over financial reporting to address the material weakness. We have launched a recruitment program to hire additional qualified accounting personnel. We plan to hire additional qualified accounting personnel, as necessary to fulfill our reporting obligations and to reinforce our internal audit function. We have also implemented regular GAAP accounting and financial reporting training programs for our existing accounting and reporting personnel, including senior financial officers. The costs for such remediation plan cannot yet be quantified but are not likely to be significant. However, we do not expect that our plan will fully remediate the material weakness identified above until at least June 30, 2011, and it may not ensure the adequacy of our internal controls over our financial reporting and processes in the future. If we experience additional material weaknesses and significant deficiencies in our internal controls over financial reporting in the future, investors may lose confidence in our reported financial information, which could lead to a decline in our stock price, limit our ability to access the capital markets in the future, and require us to incur additional costs to further improve our internal control systems and procedures.
Item 9B. Other Information
Not applicable.
44
PART III
Item 10. Directors, Executive Officers and Corporate Governance
The information required by this item regarding our directors, director nominees, and committees of the board of directors is incorporated by reference to our definitive Proxy Statement for our 2011 Annual Meeting of Shareholders to be filed with the SEC not later than 120 days after the end of our fiscal year ended December 31, 2010, or the 2011 Proxy Statement, under the heading “Election of Directors” and “Corporate Governance.” Information regarding Section 16(a) beneficial ownership reporting compliance is incorporated by reference to our 2011 Proxy Statement under the heading “Section 16(a) Beneficial Ownership Reporting Compliance.” Information regarding our executive officers is incorporated by reference to our 2011 Proxy Statement under the heading “Management—Executive Officers.”
Code of Ethics
We have adopted a Code of Ethics that applies to all of our officers, directors and employees. The most recent version is available on the Investor Relations section of our website at http://ady.feihe.com. The information contained on our website is not incorporated by reference into this Annual Report on Form 10-K. If we make any substantive amendments to the code or grant any waiver from a provision of the code to any executive officer or director, we will promptly disclose the nature of the amendment or waiver on our website, as well as via any other means required by applicable law.
Item 11. Executive Compensation
The information required by this item is incorporated by reference to the 2011 Proxy Statement under the heading “Executive Compensation.”
Item 12. Security Ownership of Certain Beneficial Owners and Management and Related Shareholder Matters
The information required by this item is incorporated by reference to the 2011 Proxy Statement under the heading “Executive Compensation.”
Item 13. Certain Relationships and Related Transactions, and Director Independence
The information required by this item is incorporated by reference to the 2011 Proxy Statement under the captions “Certain Relationships and Related Transactions” and “Corporate Governance.”
The information required by this item is incorporated by reference to the 2011 Proxy Statement under the caption “Ratification of Appointment of Independent Registered Public Accounting Firm.”
45
Item 15. Exhibits and Financial Statement Schedules
Financial Statements
The financial statements required by this item are included herein:
|
F-1
|
|||||
|
Consolidated Balance Sheets
|
F-3
|
||||
|
Consolidated Statements of Operations
|
F-5
|
||||
|
Consolidated Statements of Changes in Shareholders’ Equity and Comprehensive Income (Loss)
|
F-6
|
||||
|
Consolidated Statements of Cash Flows
|
F-7
|
||||
|
Notes to the Consolidated Financial Statements
|
F-8
|
||||
|
Schedule I
|
F-43
|
Exhibits
The following exhibits are filed as a part of this Annual Report.
|
Incorporated by Reference
|
||||||||||||
|
Exhibit No.
|
Exhibit Title
|
Filed
Herewith
|
Form
|
Exhibit
No.
|
File No.
|
Filing Date
|
||||||
|
2
|
Stock Exchange Agreement, dated as of January 15, 2003, by and among the registrant, the registrant’s shareholders and Lazarus Industries, Inc.
|
8-K
|
2.1
|
000-27351
|
1/21/03
|
|||||||
|
2.1
|
Amendment to Stock Exchange Agreement, dated as of March 5, 2003, by and among the registrant, the registrant’s shareholders and Lazarus Industries, Inc
|
8-K/A
|
2.2
|
000-27351
|
3/5/03
|
|||||||
|
3.1
|
Articles of Incorporation
|
10-SB
|
1
|
000-27351
|
9/16/99
|
|||||||
|
3.2
|
Amendment to Articles of Incorporation
|
10-KSB/A
|
3.2
|
000-27351
|
5/25/04
|
|||||||
|
3.3
|
Articles of Amendment to Articles of Incorporation
|
8-K
|
3.1
|
001-32473
|
10/13/10
|
|||||||
|
3.3
|
Bylaws
|
10-SB
|
2
|
000-27351
|
9/16/99
|
|||||||
|
4.1
|
Specimen certificate evidencing shares of common stock
|
S-1/A
|
4.1
|
333-158777
|
5/28/09
|
|||||||
|
4.2
|
Form of 7.75% Convertible Note
|
8-K/A
|
4.1
|
001-32473
|
10/6/06
|
|||||||
|
4.3
|
Form of Common Stock Purchase Warrant
|
8-K/A
|
4.2
|
001-32473
|
10/6/06
|
|||||||
|
10.1
|
Joint Venture Agreement to organize Beijing Feihe
|
10-QSB
|
10.1
|
000-27351
|
5/17/04
|
|||||||
46
|
10.2
|
2003 Stock Incentive Plan
|
S-8
|
10
|
333-123932
|
4/7/05
|
|||||||
|
10.3
|
Asset Purchase Agreement, dated as of May 20, 2005, by and between the registrant and Nutricia Nutritionals Col, Ltd.
|
8-K
|
10.1
|
001-32473
|
5/26/05
|
|||||||
|
10.4
|
Form of Subscription Agreement, dated as of October 3, 2006, by and between the registrant and investors listed therein
|
8-K/A
|
10.1
|
333-128075
|
10/6/06
|
|||||||
|
10.5
|
Form of Registration Rights Agreement, dated as of October 3, 2006, by and between the registrant and investors listed therein
|
8-K/A
|
10.2
|
333-128075
|
10/6/06
|
|||||||
|
10.6
|
Share Transference Agreement, dated as of July 1, 2006, by and between the registrant and Shanxi Li Santai Science and Technology Co., Ltd.
|
S-1/A
|
10.16
|
333-128075
|
4/17/07
|
|||||||
|
10.7
|
Amended and Restated Notes Purchase Agreement, dated as of June 1, 2007, by and among the registrant, Leng You-Bin, Liu Hua and Citadel Equity Fund
|
8-K
|
10.1
|
001-32473
|
6/4/07
|
|||||||
|
10.8
|
Indenture, dated as of June 1, 2007, by and between the registrant and The Bank of New York.
|
8-K
|
10.2
|
001-32473
|
6/4/07
|
|
10.9
|
Form of Note (attached as exhibit to the Indenture filed as Exhibit 10.19)
|
8-K
|
10.2
|
001-32473
|
6/4/07
|
|||||||
|
10.10
|
Registration Rights Agreement
|
8-K
|
10.3
|
001-32473
|
6/4/07
|
|||||||
|
10.11
|
Investor Rights Agreement
|
8-K
|
10.4
|
001-32473
|
6/4/07
|
|||||||
|
10.12
|
Share Pledge Agreement
|
8-K
|
10.5
|
001-32473
|
6/4/07
|
|||||||
|
10.13
|
Indenture, dated as of June 27, 2007, by and among the registrant, the holders listed therein and The Bank of New York
|
S-1/A
|
10.25
|
333-128075
|
6/28/07
|
|||||||
|
10.14
|
Form of 1% Guaranteed Senior Secured Convertible Note (attached as an exhibit to the Indenture filed as exhibit 10.25)
|
S-1/A
|
10.25
|
333-128075
|
6/28/07
|
|||||||
|
10.15
|
Form of Accession Letter
|
S-1/A
|
10.26
|
333-128075
|
6/28/07
|
|||||||
|
10.16
|
Form of Non-Competition Agreement, by and between the registrant and each of Mr. Leng You-Bin and Roger Liu
|
S-1/A
|
10.27
|
333-128075
|
6/28/07
|
47
|
10.17
|
Joinder Agreement
|
S-1/A
|
10.28
|
333-128075
|
6/28/07
|
|||||||
|
10.18
|
Loan Agreement, dated as of June 27, 2007, by and between the registrant and Moveup
|
10-Q/A
|
10.1
|
001-32473
|
8/22/07
|
|||||||
|
10.19
|
Equity Purchase Agreement, dated as of August 2, 2007, by and among Moveup, Hunan Mulin Modern Food Company, Ltd., Australia Ausnutria Dairy Pty., Chen Yuanrong and Ausnutria
|
10-Q/A
|
10.2
|
001-32473
|
8/22/07
|
|||||||
|
10.20
|
Share Subscription Agreement, dated as of August 12, 2007, by and between Moveup and Ausnutria
|
10-Q/A
|
10.3
|
001-32473
|
8/22/07
|
|||||||
|
10.21
|
Share Subscription Agreement, by and between the registrant and Ausnutria
|
10-Q/A
|
10.4
|
001-32473
|
8/22/07
|
|||||||
|
10.22
|
Equity Purchase Agreement, dated as of October 25, 2007, by and among Moveup, Hunan Mulin Modern Food Company, Ltd Chen Yuanrong and Ausnutria
|
8-K
|
10.1
|
001-32473
|
10/31/07
|
|||||||
|
10.23
|
Employment Agreement, dated as of April 15, 2008 by and between the registrant and Jonathan H. Chou
|
8-K
|
10.1
|
001-32473
|
4/18/08
|
|||||||
|
10.24
|
Supplemental Indenture, dated as of November 12, 2008, by and between the registrant and The Bank of New York Mellon, as Trustee, as amended
|
8-K/A
|
10.1
|
001-32473
|
11/21/08
|
|||||||
|
10.25
|
Agreement Regarding 2009 Notes, dated as of November 12, 2008, by and among the registrant, Leng You-Bin and the investors named therein
|
8-K/A
|
10.2
|
001-32473
|
11/21/08
|
|||||||
|
10.26
|
Share Pledge Agreement, dated as of November 12, 2008, by and among the registrant, Leng You-Bin and The Bank of New York, Mellon, as collateral agent
|
8-K/A
|
10.3
|
001-32473
|
11/21/08
|
|||||||
|
10.27
|
First Amendment to Registration Rights Agreement, dated as of November 12, 2008, by and between the registrant and the investors named therein.
|
8-K/A
|
10.4
|
001-32473
|
11/21/08
|
|||||||
|
10.28
|
Waiver Letter to Registration Rights Agreement, dated as of November 12, 2008, by and between the registrant and the investors named therein
|
8-K/A
|
10.5
|
001-32473
|
11/21/08
|
|||||||
|
10.29
|
Form of Amended and Restated 7.75% Convertible Note due October 2, 2009
|
8-K/A
|
10.6
|
001-32473
|
11/21/08
|
48
|
10.30
|
Form of Amended and Restated Common Stock Purchase Warrant
|
8-K/A
|
10.7
|
001-32473
|
11/21/08
|
|||||||
|
10.31
|
Form of 2009 Stock Incentive Plan and related agreements
|
8-K/A
|
10.1
|
001-32473
|
5/14/09
|
|||||||
|
10.32
|
Subscription Agreement, dated as of August 12, 2009, by and among the registrant and the Purchasers
|
8-K
|
10.1
|
001-32473
|
8/12/09
|
|
10.33
|
Registration Rights Agreement, dated as of August 26, 2009, by and among the registrant and the Purchasers
|
8-K
|
10.1
|
001-32473
|
8/26/09
|
|||||||
|
10.34
|
Redemption Agreement, dated as of February 1, 2011, by and among the registrant and the Purchasers
|
8-K
|
10.1
|
001-32473
|
2/2/11
|
|||||||
|
14.1
|
Code of Business Conduct and Ethics
|
10-KSB
|
14
|
000-27351
|
3/31/05
|
|||||||
|
14.2
|
Amended and Restated Code of Business Conduct and Ethics
|
8-K
|
14
|
001-32473
|
5/12/08
|
|||||||
|
16.1
|
Letter of HJ & Associates, L.L.C. regarding change in certifying accountant
|
8-K
|
16
|
000-27351
|
8/6/03
|
|||||||
|
16.2
|
Letter of Weinberg & Company, regarding change in certifying accountant
|
8-K
|
16
|
000-27351
|
11/17/03
|
|||||||
|
16.3
|
Letter of Murrell, Hall, McIntosh & Co., PLLP, regarding change in certifying accountant
|
8-K
|
16.1
|
001-32473
|
12/13/07
|
|||||||
|
16.4
|
Letter of Grant Thornton regarding change in certifying accountant
|
8-K
|
16.1
|
001-32473
|
4/15/10
|
|||||||
|
21.1
|
Subsidiaries of the registrant
|
10-K
|
21.1 | 001-32473 | 3/31/2011 | |||||||
|
23.1
|
Consent of Deloitte Touche Tohmatsu CPA Ltd.
|
X
|
||||||||||
|
23.2
|
Consent of JBPB & Co.
|
X
|
||||||||||
|
24.1
|
Power of Attorney (included on signature page)
|
10-K
|
21.1 | 001-32473 | 3/31/2011 | |||||||
|
31.1
|
Certification of Principal Executive Officer pursuant to Rules 13a-14 and 15d-14(a), as adopted pursuant to Section 302 of the Sarbanes-Oxley Act of 2002
|
X
|
||||||||||
|
31.2
|
Certification of Principal Financial Officer pursuant to Rules 13a-14 and 15d-14(a), as adopted pursuant to Section 302 of the Sarbanes-Oxley Act of 2002
|
X
|
||||||||||
|
32.1
|
Certification of Principal Executive Officer and Principal Financial Officer pursuant to 18 U.S.C. § 1350, as adopted pursuant to Section 906 of the Sarbanes-Oxley Act of 2002
|
X
|
49
SIGNATURES
Pursuant to the requirements of Section 13 or 15(d) of the Securities Exchange Act of 1934, the registrant has duly caused this report to be signed on its behalf by the undersigned, thereunto duly authorized.
|
April 8, 2011
|
FEIHE INTERNATIONAL, INC.
|
||
|
By:
|
/s/ Leng You-Bin
|
||
|
Leng You-Bin, Chief Executive
|
|||
|
Officer and President (Principal Executive Officer)
|
|||
|
By:
|
/s/ Liu Hua
|
||
|
Liu Hua, Acting Chief Financial Officer
|
|||
|
(Principal Accounting and Financial Officer)
|
|||
Pursuant to the requirements of the Securities Exchange Act of 1934, this report has been signed below by the following persons on behalf of the registrant and in the capacities and on the dates indicated.
|
/s/ Leng You-Bin
|
April 8, 2011
|
|
Leng You-Bin, Director, Chief Executive
|
|
|
Officer and President (Principal Executive Officer)
|
|
|
/s/ Liu Hua
|
April 8, 2011
|
|
Liu Hua, Director, Vice Chairman, Secretary, Treasurer and Acting CFO
|
|
|
/s/ Liu Sheng-Hui
|
April 8, 2011
|
|
Liu Sheng-Hui, Director
|
|
|
/s/ Sean Shao*
|
April 8, 2011
|
|
Sean Shao, Director
|
|
|
/s/ Kirk Downing*
|
April 8, 2011
|
|
Kirk Downing, Director
|
|
|
/s/ James Lewis*
|
April 8, 2011
|
|
James Lewis, Director
|
|
/s/ Neil Shen*
|
April 8, 2011
|
|
Neil Shen, Director
|
| *By: |
/s/ Leng You-Bin
|
April 8, 2011
|
|
Leng You-Bin, Attorney-In-Fact
|
50
REPORT OF INDEPENDENT REGISTERED PUBLIC ACCOUNTING FIRM
Board of Directors and
Shareholders of American Dairy, Inc. (now known as Feihe International, Inc.)
We have audited the accompanying consolidated balance sheets of American Dairy, Inc. (now known as Feihe International, Inc.) (a Utah Corporation) and subsidiaries (the “Company”) as of December 31, 2009 and the related consolidated statements of operations, changes in shareholders' equity and comprehensive income, and cash flows for the years ended December 31, 2009 and December 31, 2008. These financial statements are the responsibility of the Company's management. Our responsibility is to express an opinion on these financial statements based on our audits.
We conducted our audits in accordance with the standards of the Public Company Accounting Oversight Board (United States). Those standards require that we plan and perform the audits to obtain reasonable assurance about whether the financial statements are free of material misstatement. An audit includes examining, on a test basis, evidence supporting the amounts and disclosures in the financial statements. An audit also includes assessing the accounting principles used and significant estimates made by management, as well as evaluating the overall financial statement presentation. We believe that our audits provide a reasonable basis for our opinion.
In our opinion, such 2009 and 2008 consolidated financial statements present fairly, in all material respects, the financial position of the Company as of December 31, 2009 and the results of their operations and their cash flows for the years ended December 31, 2009 and December 31, 2008 in conformity with accounting principles generally accepted in the United States of America.
/s/ JBPB & Co.
JBPB & Co. (formerly known as GRANT THORNTON)
Hong Kong
March 16, 2010
F-1
REPORT OF INDEPENDENT REGISTERED PUBLIC ACCOUNTING FIRM
To the Board of Directors and Shareholders of Feihe International, Inc.
We have audited the accompanying consolidated balance sheets of Feihe International, Inc. and subsidiaries (the "Company") as of December 31, 2010, and the related consolidated statements of operations, shareholders' equity and comprehensive income (loss), and cash flows for the year then ended. Our audit also included the financial statement schedule included in Schedule I as of December 31, 2010 and for the year ended December 31, 2010. These financial statements and financial statement schedule are the responsibility of the Company's management. Our responsibility is to express an opinion on the financial statements and financial statement schedule based on our audit.
We conducted our audit in accordance with the standards of the Public Company Accounting Oversight Board (United States). Those standards require that we plan and perform the audit to obtain reasonable assurance about whether the financial statements are free of material misstatement. An audit includes examining, on a test basis, evidence supporting the amounts and disclosures in the financial statements. An audit also includes assessing the accounting principles used and significant estimates made by management, as well as evaluating the overall financial statement presentation. We believe that our audit provide a reasonable basis for our opinion.
In our opinion, such consolidated financial statements present fairly, in all material respects, the financial position of Feihe International, Inc. and subsidiaries as of December 31, 2010, and the results of their operations and their cash flows for the year then ended in conformity with accounting principles generally accepted in the United States of America. Also, in our opinion, such financial statement schedule, when considered in relation to the basic consolidated financial statements taken as a whole, present fairly, in all material respects, the information set forth therein.
The accompanying consolidated financial statements have been prepared assuming that the Company will continue as a going concern. As discussed in Note 2 to the consolidated financial statements, the Company's losses from operations and deficiency of net current assets raise substantial doubt about its ability to continue as a going concern. Management's plans concerning these matters are also discussed in Note 2 to the consolidated financial statements. The consolidated financial statements do not include any adjustments that might result from the outcome of this uncertainty.
We have also audited, in accordance with the standards of the Public Company Accounting Oversight Board (United States), the Company's internal control over financial reporting as of December 31, 2010, based on the criteria established in Internal Control—Integrated Framework issued by the Committee of Sponsoring Organizations of the Treadway Commission and our report dated March 31, 2011 expressed an adverse opinion on the Company's internal control over financial reporting.
/s/ Deloitte Touche Tohmatsu CPA, Ltd.
Deloitte Touche Tohmatsu CPA, Ltd.
Beijing, the People’s Republic of China
March 31, 2011
F-2
FEIHE INTERNATIONAL, INC.
CONSOLIDATED BALANCE SHEETS
|
December 31,
2010
|
December 31,
2009
|
|||||||
|
US$
|
US$
|
|||||||
|
Assets
|
||||||||
|
Current assets:
|
||||||||
|
Cash and cash equivalents
|
17,529,582
|
48,164,932
|
||||||
|
Restricted cash
|
3,078,564
|
784,592
|
||||||
|
Notes receivable, net of allowance for doubtful
accounts of $3,500,028 and $4,000,000, as of December 31, 2010 and 2009, respectively
|
136,120
|
438,776
|
||||||
|
Trade receivables, net of allowance for doubtful
accounts of $1,084,308 and $791,119, as of December 31, 2010 and 2009, respectively
|
15,885,708
|
27,495,190
|
||||||
|
Due from related parties
|
1,806,889
|
2,188,243
|
||||||
|
Advances to suppliers
|
7,520,804
|
5,908,020
|
||||||
|
Inventories
|
71,683,471
|
59,044,665
|
||||||
|
Prepayments and other current assets
|
266,935
|
1,814,472
|
||||||
|
Income taxes receivable
|
4,970,271
|
4,834,754
|
||||||
|
Input value-added taxes
|
6,886,531
|
3,697,875
|
||||||
|
Other receivables
|
7,275,903
|
4,704,404
|
||||||
|
Investment in mutual funds- available-for-sale
|
139,294
|
136,466
|
||||||
|
Total current assets
|
137,180,072
|
159,212,389
|
||||||
|
Investments:
|
||||||||
|
Investment at cost
|
272,239
|
263,264
|
||||||
|
Property, plant and equipment:
|
||||||||
|
Property, plant and equipment, net
|
170,354,132
|
154,572,409
|
||||||
|
Construction in progress
|
43,152,905
|
23,170,909
|
||||||
|
213,507,037
|
177,743,318
|
|||||||
|
Biological assets:
|
||||||||
|
Immature biological assets
|
26,713,971
|
35,672,123
|
||||||
|
Mature biological assets, net
|
27,683,821
|
13,232,124
|
||||||
|
54,397,792
|
48,904,247
|
|||||||
|
Other assets:
|
||||||||
|
Advance to suppliers - non-current
|
22,643,263
|
18,509,948
|
||||||
|
Deferred tax assets – non-current
|
5,522,990
|
3,632,815
|
||||||
|
Prepaid leases for land use rights
|
29,754,376
|
29,016,486
|
||||||
|
Other intangible assets, net
|
585,671
|
821,331
|
||||||
|
Goodwill
|
445,842
|
1,784,331
|
||||||
|
Deferred charges, net
|
-
|
369,608
|
||||||
|
Total assets
|
464,309,282
|
440,257,737
|
||||||
F-3
|
Liabilities
|
||||||||
|
Current liabilities:
|
||||||||
|
Notes payable
|
378,112
|
3,429,767
|
||||||
|
Short term bank loans
|
68,816,359
|
58,181,712
|
||||||
|
Accounts payable
|
43,729,571
|
37,956,046
|
||||||
|
Accrued expenses
|
6,436,898
|
8,365,245
|
||||||
|
Income taxes payable
|
1,589,165
|
2,980,774
|
||||||
|
Advances from customers
|
12,183,444
|
6,893,947
|
||||||
|
Due to related parties
|
79,257
|
10,531,851
|
||||||
|
Advances from employees
|
456,261
|
483,647
|
||||||
|
Employee benefits and salary payable
|
7,018,794
|
4,120,053
|
||||||
|
Other payable
|
45,957,104
|
24,455,060
|
||||||
|
Current portion of long term bank loans
|
9,756,193
|
7,312,935
|
||||||
|
Current portion of capital lease obligation
|
116,770
|
-
|
||||||
|
Total current liabilities
|
196,517,928
|
164,711,037
|
||||||
|
Long term bank loans, net of current portion
|
28,102,786
|
32,427,230
|
||||||
|
Capital lease obligation, net of current portion
|
532,467
|
-
|
||||||
|
Unrecognized tax benefits – non-current
|
5,062,336
|
4,747,083
|
||||||
|
Deferred income
|
6,241,661
|
10,538,313
|
||||||
|
Performance share obligation
|
-
|
11,382,000
|
||||||
|
Total liabilities
|
236,457,178
|
223,805,663
|
||||||
|
Commitments and contingencies (See Note 32)
|
||||||||
|
Redeemable common stock (US$0.001 par value, 2,625,000 and
2,100,000 shares issued and outstanding as of December 31, 2010 and 2009, respectively)
|
66,113,715
|
53,645,093
|
||||||
|
Equity
|
||||||||
|
Feihe International, Inc. shareholders’ equity:
|
||||||||
|
Common stock (US$0.001 par value, 50,000,000 shares
authorized; 19,671,291 and 19,607,376 issued and
outstanding as of December 31, 2010 and 2009, respectively)
|
19,671
|
19,607
|
||||||
|
Additional paid-in capital
|
57,177,680
|
54,482,098
|
||||||
|
Common stock warrants
|
1,774,151
|
1,774,151
|
||||||
|
Statutory reserves
|
9,132,581
|
6,861,224
|
||||||
|
Accumulated other comprehensive income
|
32,836,344
|
25,651,571
|
||||||
|
Retained earnings
|
60,731,029
|
73,672,879
|
||||||
|
Total Feihe International, Inc. shareholders’ equity
|
161,671,456
|
162,461,530
|
||||||
|
Noncontrolling interests
|
66,933
|
345,451
|
||||||
|
Total equity
|
161,738,389
|
162,806,981
|
||||||
|
Total liabilities, redeemable common stock and equity
|
464,309,282
|
440,257,737
|
The accompanying notes are an integral part of these financial statements.
F-4
FEIHE INTERNATIONAL, INC.
CONSOLIDATED STATEMENTS OF OPERATIONS
|
For the years ended December 31,
|
||||||||||||
|
2010
|
2009
|
2008
|
||||||||||
|
US$
|
US$
|
US$
|
||||||||||
|
Sales
|
257,099,648 | 271,077,948 | 193,191,710 | |||||||||
|
Cost of goods sold
|
(153,848,105 | ) | (140,426,711 | ) | (117,180,986 | ) | ||||||
|
Gross profit
|
103,251,543 | 130,651,237 | 76,010,724 | |||||||||
|
Operating expenses:
|
||||||||||||
|
Sales and marketing
|
(99,475,595 | ) | (105,109,120 | ) | (50,685,804 | ) | ||||||
|
General and administrative
|
(23,380,145 | ) | (20,478,875 | ) | (19,046,939 | ) | ||||||
|
Goodwill impairment
|
(1,437,005 | ) | (929,526 | ) | - | |||||||
|
Loss on disposal of biological assets
|
(10,240,865 | ) | (1,739,714 | ) | (286,727 | ) | ||||||
|
Total operating expenses
|
(134,533,610 | ) | (128,257,235 | ) | (70,019,470 | ) | ||||||
|
Other operating income (expense), net
|
245,931 | (25,553 | ) | 469,133 | ||||||||
|
Operating (loss) income
|
(31,036,136 | ) | 2,368,449 | 6,460,387 | ||||||||
|
Other income (expenses):
|
||||||||||||
|
Interest income
|
294,915 | 306,691 | 579,724 | |||||||||
|
Interest and finance costs
|
(2,516,425 | ) | (6,139,152 | ) | (18,843,032 | ) | ||||||
|
Amortization of deferred charges
|
(379,413 | ) | (124,110 | ) | (657,258 | ) | ||||||
|
Registration rights penalty
|
- | - | (2,389,077 | ) | ||||||||
|
Gain on extinguishment of debt
|
- | - | 30,497,268 | |||||||||
|
Loss on derivatives
|
- | (2,162,000 | ) | (8,321,481 | ) | |||||||
|
Government subsidy
|
23,462,082 | 21,177,132 | 6,810,231 | |||||||||
|
(Loss) income before income taxes and discontinued operations
|
(10,174,977 | ) | 15,427,010 | 14,136,762 | ||||||||
|
Income tax (benefit) expenses
|
(279,722 | ) | (746,198 | ) | 3,567,135 | |||||||
|
(Loss) income from continuing operations
|
(9,895,255 | ) | 16,173,208 | 10,569,627 | ||||||||
|
Net income from discontinued operations, net of tax
|
- | 3,289,908 | 6,462,878 | |||||||||
|
Net (loss) income
|
(9,895,255 | ) | 19,463,116 | 17,032,505 | ||||||||
|
Net loss (income) attributable to noncontrolling interests
|
311,384 | 118,270 | (9,470 | ) | ||||||||
|
Accretion of redemption premium on redeemable common stock
|
(1,086,622 | ) | - | - | ||||||||
|
Net (loss) income attributable to common shareholders of Feihe International, Inc.
|
(10,670,493 | ) | 19,581,386 | 17,023,035 | ||||||||
| Net (loss) income from continuing operations per share of common stock | ||||||||||||
|
Basic
|
(0.48 | ) | 0.86 | 0.62 | ||||||||
|
Diluted
|
(0.48 | ) | 0.81 | 0.60 | ||||||||
| Net (loss) income from continuing operations per share of redeemable common stock | ||||||||||||
|
Basic
|
(0.07 | ) | 0.86 | - | ||||||||
|
Diluted
|
(0.07 | ) | 0.81 | - | ||||||||
| Net (loss) income from discontinued operations, net of tax per common stock | ||||||||||||
|
Basic
|
- | 0.17 | 0.38 | |||||||||
|
Diluted
|
- | 0.16 | 0.37 | |||||||||
| Net (loss) income from discontinued operations, net of tax, per share of redeemable common stock | ||||||||||||
|
Basic
|
- | 0.17 | - | |||||||||
|
Diluted
|
- | 0.16 | - | |||||||||
|
Net (loss) income per share of common stock
|
||||||||||||
|
Basic
|
(0.48 | ) | 1.03 | 1.00 | ||||||||
|
Diluted
|
(0.48 | ) | 0.97 | 0.97 | ||||||||
| Net (loss) income per share of redeemable common stock | ||||||||||||
|
Basic
|
(0.07 | ) | 1.03 | - | ||||||||
|
Diluted
|
(0.07 | ) | 0.97 | - | ||||||||
|
Weighted average shares used in calculating net (loss) income per share of common stock
|
||||||||||||
|
Basic
|
19,647,844 | 18,273,652 | 16,993,390 | |||||||||
|
Diluted
|
19,647,844 | 19,449,913 | 17,636,862 | |||||||||
|
Weighted average shares used in calculating net (loss) income per share of redeemable common stock
|
||||||||||||
|
Basic
|
2,625,000 | 730,685 | - | |||||||||
|
Diluted
|
2,625,000 | 730,685 | - | |||||||||
The accompanying notes are an integral part of these financial statements.
F-5
FEIHE INTERNATIONAL, INC.
CONSOLIDATED STATEMENTS OF CHANGES IN SHAREHOLDERS’ EQUITY AND COMPREHENSIVE INCOME (LOSS)
|
Feihe International, Inc. Shareholders
|
||||||||||||||||||||||||||||||||||||||||
|
Common Stock
|
||||||||||||||||||||||||||||||||||||||||
|
(US$0.001 par value)
|
Accumulated
|
|||||||||||||||||||||||||||||||||||||||
|
Number
|
Additional
|
Common
|
Other
|
Total
|
||||||||||||||||||||||||||||||||||||
|
of
|
Par
|
Paid-in
|
Stock
|
Statutory
|
Comprehensive
|
Retained
|
Noncontrolling
|
Total
|
Comprehensive
|
|||||||||||||||||||||||||||||||
|
Shares
|
Value
|
Capital
|
Warrants
|
Reserves
|
Income
|
Earnings
|
Interest
|
Equity
|
Income (Loss)
|
|||||||||||||||||||||||||||||||
|
US$
|
US$
|
US$
|
US$
|
US$
|
US$
|
US$
|
US$
|
US$ | ||||||||||||||||||||||||||||||||
|
Balance as of January 1, 2008
|
16,961,768 | 16,961 | 22,629,333 | 3,011,444 | 6,040,382 | 12,081,467 | 37,889,300 | 536,977 | 82,205,864 | |||||||||||||||||||||||||||||||
|
Warrant exercise
|
3,000 | 3 | 14,743 | (7,996 | ) | - | - | - | - | 6,750 | ||||||||||||||||||||||||||||||
|
Shares issued for services
|
72,500 | 73 | 1,092,578 | - | - | - | - | - | 1,092,651 | |||||||||||||||||||||||||||||||
|
Shares issued for notes conversion
|
216,639 | 217 | 2,881,082 | - | - | - | - | 2,881,299 | ||||||||||||||||||||||||||||||||
|
Stock compensation
|
- | - | 140,689 | - | - | - | - | - | 140,689 | |||||||||||||||||||||||||||||||
|
Net income
|
- | - | - | - | - | - | 17,023,035 | 9,470 | 17,032,505 | 17,032,505 | ||||||||||||||||||||||||||||||
|
Currency translation adjustments
|
- | - | - | - | - | 13,169,453 | - | - | 13,169,453 | 13,169,453 | ||||||||||||||||||||||||||||||
|
Change in fair value of available-for-sale investment
|
- | - | - | - | - | (104,865 | ) | - | - | (104,865 | ) | (104,865 | ) | |||||||||||||||||||||||||||
|
Comprehensive income
|
30,097,093 | |||||||||||||||||||||||||||||||||||||||
|
Appropriation to statutory reserves
|
- | - | - | - | 820,842 | - | (820,842 | ) | - | - | ||||||||||||||||||||||||||||||
|
Balance as of December 31, 2008
|
17,253,907 | 17,254 | 26,758,425 | 3,003,448 | 6,861,224 | 25,146,055 | 54,091,493 | 546,447 | 116,424,346 | |||||||||||||||||||||||||||||||
|
Warrant exercise
|
804,347 | 804 | 3,066,962 | (1,229,297 | ) | - | - | - | - | 1,838,469 | ||||||||||||||||||||||||||||||
|
Stock compensation
|
- | - | 2,196,106 | - | - | - | - | - | 2,196,106 | |||||||||||||||||||||||||||||||
|
Shares issued for notes conversion
|
1,549,122 | 1,549 | 22,460,605 | - | - | - | - | - | 22,462,154 | |||||||||||||||||||||||||||||||
|
Net income
|
- | - | - | - | - | - | 19,581,386 | (118,270 | ) | 19,463,116 | 19,463,116 | |||||||||||||||||||||||||||||
|
Currency translation adjustments
|
- | - | - | - | - | 446,554 | - | - | 446,554 | 446,554 | ||||||||||||||||||||||||||||||
|
Change in fair value of available-for-sale investment
|
- | - | - | - | - | 58,962 | - | - | 58,962 | 58,962 | ||||||||||||||||||||||||||||||
|
Comprehensive income
|
19,968,632 | |||||||||||||||||||||||||||||||||||||||
|
Sale of a subsidiary
|
- | - | - | - | - | - | - | (82,726 | ) | (82,726 | ) | |||||||||||||||||||||||||||||
|
Balance as of December 31, 2009
|
19,607,376 | 19,607 | 54,482,098 | 1,774,151 | 6,861,224 | 25,651,571 | 73,672,879 | 345,451 | 162,806,981 | |||||||||||||||||||||||||||||||
| Shares issued for services | 55,915 | 56 | 889,318 | - | - | - | - | - | 889,374 | |||||||||||||||||||||||||||||||
|
Stock compensation
|
- | - | 1,710,272 | - | - | - | - | - | 1,710,272 | |||||||||||||||||||||||||||||||
|
Issuance of common stock in connection with exercise of options
|
8,000 | 8 | 95,992 | - | - | - | - | - | 96,000 | |||||||||||||||||||||||||||||||
|
Net loss
|
- | - | - | - | - | - | (9,583,871 | ) | (311,384 | ) | (9,895,255 | ) | (9,895,255 | ) | ||||||||||||||||||||||||||
|
Accretion of redemption premium on redeemable common stock
|
- | - | - | - | - | - | (1,086,622 | ) | - | (1,086,622 | ) | |||||||||||||||||||||||||||||
|
Currency translation adjustments
|
- | - | - | - | - | 7,181,945 | - | 21,719 | 7,203,664 | 7,203,664 | ||||||||||||||||||||||||||||||
|
Change in fair value of available-for- sale investment
|
- | - | - | - | - | 2,828 | - | - | 2,828 | 2,828 | ||||||||||||||||||||||||||||||
|
Comprehensive loss
|
(2,688,763 | ) | ||||||||||||||||||||||||||||||||||||||
|
Dividend distributed to noncontrolling interests
|
- | - | - | - | - | - | - | (208,225 | ) | (208,225 | ) | |||||||||||||||||||||||||||||
|
Investment in an existing subsidiary
|
- | - | - | - | - | - | - | 219,372 | 219,372 | |||||||||||||||||||||||||||||||
|
Appropriation to statutory reserve
|
- | - | - | - | 2,271,357 | - | (2,271,357 | ) | - | - | ||||||||||||||||||||||||||||||
|
Balance as of December 31, 2010
|
19,671,291 | 19,671 | 57,177,680 | 1,774,151 | 9,132,581 | 32,836,344 | 60,731,029 | 66,933 | 161,738,389 | |||||||||||||||||||||||||||||||
The accompanying notes are an integral part of these financial statements.
F-6
FEIHE INTERNATIONAL, INC.
CONSOLIDATED STATEMENTS OF CASH FLOWS
|
For the years ended December 31,
|
||||||||||||
|
2010
|
2009
|
2008
|
||||||||||
|
US$
|
US$
|
US$
|
||||||||||
|
Cash flows from operating activities:
|
||||||||||||
|
Net (loss) income
|
(9,895,255
|
)
|
19,463,116
|
17,032,505
|
||||||||
|
Less: Net income from discontinued operations, net of tax
|
|
-
|
(3,289,908)
|
(6,462,878)
|
||||||||
|
Adjustments to reconcile net income to net cash provided by operating activities:
|
||||||||||||
|
Depreciation and amortization
|
8,728,275
|
6,631,203
|
5,300,479
|
|||||||||
|
Depreciation of biological assets
|
4,223,473
|
1,835,364
|
6,816
|
|||||||||
|
Loss on disposal of property, plant and equipment
|
14,637
|
475,363
|
5,397
|
|||||||||
|
Loss on disposal of biological assets
|
10,240,865
|
1,739,714
|
286,727
|
|||||||||
|
Provision for doubtful accounts
|
(240,309
|
)
|
(523,473
|
)
|
641,218
|
|||||||
|
Write down of inventories
|
1,164,384
|
156,297
|
(217,045
|
)
|
||||||||
|
Goodwill impairment
|
1,437,005
|
929,526
|
-
|
|||||||||
|
Gain on debt extinguishment
|
-
|
-
|
(30,497,268
|
)
|
||||||||
|
Share-based compensation
|
2,599,646
|
2,196,106
|
1,233,339
|
|||||||||
|
Registration rights penalty paid in shares
|
-
|
-
|
2,881,299
|
|||||||||
|
Interest expense from accrual of guaranteed redemption value
|
-
|
-
|
13,584,533
|
|||||||||
|
Interest expense from amortization of note discounts
|
-
|
5,129,617
|
8,028,585
|
|||||||||
|
Gain on waived interest expense
|
-
|
(550,000
|
)
|
-
|
||||||||
|
Loss on derivatives
|
-
|
2,162,000
|
8,321,481
|
|||||||||
|
Amortization of deferred charges
|
379,413
|
124,110
|
657,258
|
|||||||||
|
Gain on sales of subsidiary
|
-
|
(2,552,733
|
)
|
-
|
||||||||
|
Changes in assets and liabilities:
|
||||||||||||
|
Decrease (increase) in trade receivables
|
11,683,107
|
(14,696,220
|
)
|
(8,398,068
|
)
|
|||||||
|
Decrease (increase) in due from related parties
|
376,098
|
(1,922,764
|
)
|
(150,002
|
)
|
|||||||
|
Increase in inventories
|
(13,612,934
|
)
|
(7,228,712
|
)
|
(27,334,926
|
)
|
||||||
|
(Increase) decrease in advances to suppliers
|
(1,590,555
|
)
|
3,036,656
|
(6,711,087
|
)
|
|||||||
|
Decrease (increase) in prepayments and other current assets
|
1,526,207
|
(1,750,761
|
)
|
2,306,151
|
||||||||
|
Increase in income taxes receivable
|
(133,649
|
)
|
(4,834,754
|
)
|
-
|
|||||||
|
Increase in input value-added taxes
|
(3,144,706
|
)
|
(4,203,496
|
)
|
(345,235
|
)
|
||||||
|
(Increase) decrease in other receivables
|
(3,002,413
|
)
|
201,204
|
(946,674
|
)
|
|||||||
|
Decrease in notes receivable
|
298,484
|
1,058,182
|
1,432,072
|
|||||||||
|
(Decrease) increase in notes payable
|
(3,009,594
|
)
|
3,429,767
|
-
|
||||||||
|
Increase in deferred tax assets
|
(1,864,122
|
)
|
(2,902,325
|
)
|
(730,491
|
)
|
||||||
|
Increase in accounts payable
|
5,693,947
|
4,528,693
|
20,431,092
|
|||||||||
|
(Decrease) increase in accrued expenses
|
(1,901,768
|
)
|
(2,255,148
|
)
|
4,789,735
|
|||||||
|
(Decrease) increase in income taxes payable
|
(1,372,429
|
)
|
1,255,857
|
1,167,261
|
||||||||
|
Increase (decrease) in advances from customers
|
5,216,591
|
(2,970,133
|
)
|
5,125,231
|
||||||||
|
(Decrease) increase in due to related parties
|
(10,308,523
|
)
|
9,514,452
|
615,839
|
||||||||
|
(Decrease) increase in advances from employees
|
(27,010
|
)
|
(532,526
|
)
|
441,594
|
|||||||
|
Increase in employee benefits and salary payable
|
2,858,787
|
-
|
1,785,718
|
|||||||||
|
Increase in other payable
|
3,457,904
|
4,248,459
|
9,152,276
|
|||||||||
|
Increase in unrecognized tax benefits – non-current
|
310,908
|
1,996,196
|
1,036,458
|
|||||||||
|
(Decrease) increase in deferred income
|
(4,561,569
|
)
|
6,864,185
|
-
|
||||||||
|
Net cash provided by continuing operations
|
5,544,895
|
26,763,114
|
24,469,390
|
|||||||||
|
Net cash provided by (used in) discontinued operations
|
-
|
444,305
|
(1,965,294
|
)
|
||||||||
|
Net cash provided by operating activities
|
5,544,895
|
27,207,419
|
22,504,096
|
|||||||||
|
Cash flows from investing activities:
|
||||||||||||
|
Purchase of property, plant and equipment
|
(32,250,476
|
)
|
(66,996,852
|
)
|
(25,937,958
|
)
|
||||||
|
Purchase of biological assets
|
(13,086,486
|
)
|
(22,827,020
|
)
|
(9,341,769
|
)
|
||||||
|
Decrease in time deposit
|
-
|
-
|
8,446,778
|
|||||||||
|
Change in restricted cash
|
(2,293,973
|
)
|
388,786
|
589,345
|
||||||||
|
Purchase of Longjiang Feihe operation, net of $nil cash acquired
|
-
|
(4,382,890
|
)
|
-
|
||||||||
|
Deposit for disposal of a subsidiary
|
-
|
-
|
4,352,033
|
|||||||||
|
Proceeds from sale of a subsidiary, net of $310 cash disposed
|
-
|
38,957,413
|
-
|
|||||||||
|
Proceeds from sale of property, plant and equipment
|
32,182
|
16,275
|
-
|
|||||||||
|
Proceeds from disposal of biological assets
|
4,720,595
|
195,326
|
-
|
|||||||||
|
Net cash used in continuing operations
|
(42,878,158
|
)
|
(54,648,962
|
)
|
(21,891,571
|
)
|
||||||
|
Net cash used in discontinued operations
|
-
|
-
|
(1,390,763
|
)
|
||||||||
|
Net cash used in investing activities
|
(42,878,158
|
)
|
(54,648,962
|
)
|
(23,282,334
|
)
|
||||||
|
Cash flows from financing activities:
|
||||||||||||
|
Proceeds from short term bank loans
|
68,161,391
|
58,188,645
|
7,844,115
|
|||||||||
|
Repayment of short term bank loans
|
(58,712,808
|
)
|
(7,318,715
|
)
|
(8,777,630
|
)
|
||||||
|
Proceeds from long term bank loans
|
6,602,970
|
27,568,260
|
11,755,714
|
|||||||||
|
Repayment of long term bank loans
|
(9,815,750
|
)
|
(408,311
|
)
|
(108,369
|
)
|
||||||
|
Repayment of short term debt
|
-
|
(80,450,000
|
)
|
(11,000,000
|
)
|
|||||||
|
Proceeds from issuance of redeemable common stock
|
-
|
62,865,093
|
-
|
|||||||||
|
Capital injection in subsidiary by noncontrolling interests
|
219,372
|
-
|
-
|
|||||||||
|
Payment on capital lease obligations
|
(735,179)
|
-
|
-
|
|||||||||
|
Dividend distributed to noncontrolling interest
|
(208,225
|
)
|
-
|
-
|
||||||||
|
Proceeds from option exercise
|
96,000
|
-
|
-
|
|||||||||
|
Proceeds from warrant exercise
|
-
|
1,838,469
|
6,750
|
|||||||||
|
Net cash provided by (used in) continuing operations
|
5,607,771
|
62,283,441
|
(279,420
|
)
|
||||||||
|
Net cash provided by discontinued operations
|
-
|
-
|
-
|
|||||||||
|
Net cash provided by (used in) financing activities
|
5,607,771
|
62,283,441
|
(279,420
|
)
|
||||||||
|
Effect of exchange rate changes on cash
|
1,090,142
|
602,575
|
2,374,537
|
|||||||||
|
Net increase in cash of discontinued operations
|
-
|
2,108,429
|
3,106,821
|
|||||||||
|
Net (decrease) increase in cash and cash equivalents
|
(30,635,350
|
)
|
37,552,902
|
1,316,879
|
||||||||
|
Cash and cash equivalents, beginning of year
|
48,164,932
|
10,612,030
|
9,295,151
|
|||||||||
|
Cash and cash equivalents, end of year
|
17,529,582
|
48,164,932
|
10,612,030
|
|||||||||
|
Supplemental disclosure of cash flow information:
|
||||||||||||
|
Cash paid during the year for income tax
|
(1,942,509
|
)
|
(6,101,669
|
)
|
(3,084,582
|
)
|
||||||
|
Cash received during the year for tax refund
|
12,677,388
|
16,265,458
|
6,715,872
|
|||||||||
|
Interest paid during the year
|
(4,797,131
|
)
|
(2,667,860
|
)
|
(1,498,952
|
)
|
||||||
|
Supplemental disclosure of non-cash investing and financing activities:
|
||||||||||||
|
Conversion of convertible debt and accrued interest on common stock
|
-
|
22,462,154
|
-
|
|||||||||
|
Registration rights penalty paid in shares
|
- |
-
|
2,881,299
|
|||||||||
|
Conversion of bridge loan to redeemable common stock
|
- |
16,000,000
|
-
|
|||||||||
|
Issuance of performance shares of common stock
|
11,382,000
|
-
|
-
|
|||||||||
|
Accretion of redemption premium on redeemable common stock
|
1,086,622
|
-
|
-
|
|||||||||
The accompanying notes are an integral part of these financial statements.
F-7
FEIHE INTERNATIONAL, INC.
NOTES TO THE CONSOLIDATED FINANCIAL STATEMENTS
|
1. ORGANIZATION AND NATURE OF OPERATION
|
The accompanying consolidated financial statements include the financial statements of Feihe International, Inc. (the “Company” or “Feihe International”) and its subsidiaries. The Company and its subsidiaries are collectively referred to as the “Group.”
The Company was incorporated in the State of Utah on December 31, 1985, originally under the corporate name of Gaslight Inc. It was inactive until March 30, 1988 when it changed its corporate name to Lazarus Industries, Inc. and engaged in the business of manufacturing and marketing medical devices. This line of business was discontinued in 1991, and it became a non-operating public company shell.
Effective May 7, 2003, the Company acquired 100% of the issued and outstanding capital stock of American Flying Crane Corporation (“AFC”), a Delaware corporation. In connection with that acquisition, the Company changed its name to American Dairy, Inc. In October 2010, the Company changed its name to Feihe International, Inc.
AFC was incorporated in Delaware, with 50,000,000 shares of authorized common stock at a par value of $0.0001 per share. AFC owns 100% of the registered capital of Heilongjiang Feihe Dairy Co., Limited (“Feihe Dairy”). Feihe Dairy in turn owns 99% of the registered capital of Baiquan Feihe Dairy Co. Limited (“Baiquan Dairy”), 95% of Beijing Feihe Biotechnology Scientific and Commercial Co., Limited (“Beijing Feihe”) and 99% of Qiqihaer Feihe Soybean Co., Limited (“Feihe Soybean”), 97.5% of Heilongjiang Feihe Kedong Feedlots Co., Limited (“Kedong Farms”), 95% of Heilongjiang Feihe Gannan Feedlots Co., Limited (“Gannan Farms”), 100% of Heilongjiang Aiyingquan International Trading Co., Limited (“Aiyingquan”) which was established in 2009, and 85% of the registered capital of Heilongjiang Flying Crane Trading Co., Limited (“Feihe Trading”), which was established in January 2010.
From 2006 onwards, the Company also own 100% of the registered capital of Shanxi Feihesantai Biotechnology Scientific and Commercial Co., Limited (“Shanxi Feihe”), Langfang Flying Crane Dairy Products Co., Limited (“Langfang Feihe”) and Gannan Flying Crane Dairy Products Co., Limited (“Gannan Feihe”).
The core activities of subsidiaries included in the consolidated financial statements are as follow:
|
·
|
American Flying Crane Corporation – Investment holding
|
|
·
|
Langfang Flying Crane Dairy Products Co., Limited – Packaging and distributing dairy products
|
|
·
|
Gannan Flying Crane Dairy Products Co., Limited – Manufacturing dairy products
|
|
·
|
Heilongjiang Feihe Dairy Co., Limited – Manufacturing and distributing dairy products
|
|
·
|
Baiquan Feihe Dairy Co., Limited – Manufacturing dairy products
|
|
·
|
Beijing Feihe Biotechnology Scientific and Commercial Co., Limited – Marketing and distributing dairy products
|
|
·
|
Shanxi Feihesantai Biotechnology Scientific and Commercial Co., Limited – Manufacturing and distributing walnut and soybean products
|
|
·
|
Heilongjiang Feihe Kedong Feedlots Co., Limited – Breeding and rearing of dairy cows, and distributing fresh milk
|
|
·
|
Heilongjiang Feihe Gannan Feedlots Co., Limited – Breeding and rearing of dairy cows, and distributing fresh milk
|
F-8
|
·
|
Qiqihaer Feihe Soybean Co., Limited – Manufacturing and distributing soybean products
|
|
·
|
Heilongjiang Aiyingquan International Trading Co., Limited – Marketing and distributing water and cheese, specifically marketed for consumption by children
|
|
·
|
Heilongjiang Flying Crane Trading Co., Limited (“Feihe Trading”) – Distributing milk and soybean related products. The subsidiary was registered in Heilongjiang province, China on January 22, 2010. Feihe Dairy holds an 85% equity interest of the total paid-in capital of RMB 10,000,000 ( or approximately $1.5 million) of Heilongjiang Flying Crane Trading Co., Limited
|
Apart from AFC, the subsidiaries’ principal country of operations is the People’s Republic of China (the “PRC”).
|
2. PRINCIPAL ACCOUNTING POLICIES
|
Basis of presentation
The accompanying consolidated financial statements have been prepared in accordance with generally accepted accounting principles in the United States of America (“US GAAP”).
The Group had a deficiency of net current assets of approximately $59.3 million as of December 31, 2010 and experienced a net loss of approximately $9.9 million in the year ended December 31, 2010. The Group has significant cash commitments in the upcoming fiscal year, including maturity of short term loans of approximately $68.8 million and redemption of redeemable common stock of $63 million. However, the Group believes it will be able to refinance much of its short term bank loans when they become due and intends to do. If it is able to do so, it believes that cash generated from operations, along with the existing cash and the ability to draw down on unutilized credit lines will be sufficient to fund its expected cash flow requirements including the redemption of its redeemable common stock and planned capital expenditures for at least the next 12 months. The Group will be able to realize its assets and satisfy its liabilities in the normal course of business. As a result, the accompanying consolidated financial statements have been prepared assuming the Group will continue as a going concern. The accompanying consolidated financial statements do not reflect any adjustments relating to the recoverability and reclassification of assets and liabilities as that might be necessary if the Group is unable to continue as a going concern.
Principles of consolidation
The consolidated financial statements include the financial statements of the Company and its subsidiaries.
Subsidiaries are all entities over which the Group has the power to govern the financial and operating policies generally accompanying a shareholding of more than one half of the voting rights. The existence and effect of potential voting rights that are currently exercisable or convertible are considered when assessing whether the Group controls another entity. Subsidiaries are fully consolidated from the date on which control is transferred to the Group. They are de-consolidated from the date that control ceases.
Inter-company transactions, balances and unrealized gains on transactions between Group companies are eliminated. Unrealized losses are also eliminated.
Business Combination
Business combinations are recorded using the purchase method of accounting. On January 1, 2009, the Group adopted a new accounting pronouncement with prospective application, which made certain changes to the previous authoritative literature on business combinations. From January 1, 2009, the assets acquired, the liabilities assumed, and the noncontrolling interest of the acquiree at the acquisition date, if any, are measured at their fair values as of that date. Consideration transferred in a business acquisition is also measured at the fair value as at the date of acquisition. Goodwill is recognized and measured as the excess of the total consideration transferred plus the fair value of the noncontrolling interest of the acquiree, if any, at the acquisition date over the fair values of the identifiable net assets acquired. If the total acquisition date fair value of the identifiable net assets acquired exceeds the fair value of the consideration transferred plus any noncontrolling interest in the acquiree, such excess is recognized in earnings as a gain. Previously, any non-controlling interest was reflected at historical cost.
F-9
Where the consideration in an acquisition includes contingent consideration the payment of which depends on the achievement of certain specified conditions post-acquisition, from January 1, 2009 the contingent consideration is recognized and measured at its fair value at the acquisition date and if recorded as a liability it is subsequently carried at fair value with changes in fair value reflected in earnings. For periods prior to January 1, 2009 contingent consideration was not recorded until the contingency was resolved.
Foreign currency translation
The functional currency of the Company and AFC is the United States dollar ("US$", or "$"). The Group’s principal country of operations is the PRC. The financial position and results of operations of the subsidiaries are determined using the local currency (“Renminbi” or “RMB”) as the functional currency.
Assets and liabilities denominated in foreign currencies at the balance sheet date are translated at the market rate of exchange in effect at that date. The registered equity capital denominated in the functional currency is translated at the historical rate of exchange at the time of capital contribution. Revenues, expenses, gains and losses are translated using the average rate for the year. All translation adjustments resulting from the translation of the financial statements into US$ are reported as a component of accumulated other comprehensive income in shareholders’ equity. Transactions in currencies other than the functional currency during the year are converted into functional currency at the applicable rates of exchange prevailing when the transactions occurred. Transaction gains and losses are recognized in the statements of operations.
Cash and cash equivalents
Cash and cash equivalents represent cash on hand, demand deposits and highly liquid investments placed with banks or other financial institutions, which have original maturities less than three months. The carrying amounts reported approximate their fair value.
Restricted cash
Restricted cash consists of bank demand deposits for letters of credit and short term notes payable. These instruments are mainly used by the Group for the short term financing of imported dairy cows and the purchase of whey powder. Cash held in such accounts is normally restricted for a period of six months.
Available-for-sale securities
Investment in securities classified as available-for-sale are carried at fair market value, with the unrealized gains and losses, net of tax, included in the accumulated other comprehensive income.
The fair value of substantially all securities is determined by quoted market prices. The estimated fair value of securities for which there are no quoted market prices is based on similar types of securities that are traded in the market.
Investments
Investment at cost represents an investment in a non-marketable equity interest. Fair value is not estimated unless impairment is indicated. The Group has concluded that there are no impaired investments as of December 31, 2010 and 2009.
Trade receivables, net, and notes receivable, net
The Group’s trade receivables are due from trade customers. Credit is extended based on evaluation of customers’ financial condition. Trade receivable payment terms vary and amounts due from customers are stated in the financial statements net of an allowance for doubtful accounts. Receivables outstanding longer than the payment terms are considered past due. The Group determines its allowance by considering a number of factors, including the length of time the receivable is past due, the Group’s previous loss history, the counter party’s current ability to pay its obligation to the Group, and the condition of the general economy and the industry as a whole. The Group writes off receivables when they are deemed uncollectible, and payments subsequently received on such receivables are credited to the allowance for doubtful accounts.
F-10
Notes receivable consists of one promissory note and one note issued by a bank in the PRC received from a trade customer. Notes receivable are reviewed periodically as to whether their carrying value has become impaired. The Group considers the assets to be impaired if the collectability of the balances become doubtful. Interest is not accrued on notes receivable where the collectability of the balances are doubtful.
Interest income from notes receivable where the collectability of the balances are not doubtful and loans receivable is recognized when earned, taking into account the principal amounts outstanding and the interest rates applicable.
Inventories
Inventories are comprised of raw materials, work-in-progress and finished goods and are valued at the lower of cost or market value. The value of inventories is determined using the moving weighted average cost method and includes any related production overhead costs incurred in bringing the inventories to their present location and condition. Overhead costs included in finished goods include direct labor cost and other costs directly applicable to the manufacturing process.
The Group estimates an inventory allowance for excessive, slow moving and obsolete inventories as well as inventory whose carrying value is in excess of net realizable value. Inventory amounts are reported net of such allowances.
Construction in progress
All facilities purchased for installation, self-made or subcontracted are accounted for as construction in progress. Construction in progress is recorded at acquisition cost, including cost of facilities, installation expenses and interest. Upon completion and readiness for use of the project, the cost of construction in progress is transferred to property and equipment.
Interest costs associated with construction in progress are capitalized in the period they are incurred. Interest is no longer capitalized when the asset is completed and ready for use.
Property, plant and equipment, net
Property, plant and equipment are recorded at cost. Expenditures for major additions and improvements are capitalized and minor replacements, maintenance, and repairs are charged to expense as incurred. When property and equipment are retired or otherwise disposed of, the cost and accumulated depreciation are removed from the accounts and any resulting gain or loss is included in the results of operations in the year of retirement or disposition.
Depreciation is provided over the estimated useful lives of the related assets using the straight-line method. The estimated useful lives for significant property, plant and equipment categories are as follows:
|
Buildings and plant
|
20-33 years
|
|
Machinery and equipment
|
10-14 years
|
|
Office equipment
|
5 years
|
|
Motor vehicles
|
5-8 years
|
The Group reviews the carrying value of property, plant, and equipment for impairment whenever events and circumstances indicate that the carrying value of an asset may not be recoverable from the estimated future cash flows expected to result from its use and eventual disposition. In cases where undiscounted expected future cash flows are less than the carrying value, an impairment loss is recognized equal to an amount by which the carrying value exceeds the fair value of assets. The factors considered by management in performing this assessment include current operating results, trends and prospects, the manner in which the property is used, and the effects of obsolescence, demand, competition, and other economic factors. There were no impairments recorded in the years ended December 31, 2010, 2009 and 2008.
F-11
Biological assets
Immature biological assets
Biological assets consist of dairy cows held in the Group’s pastures for milking purposes. Immature biological assets are recorded at cost, including acquisition costs, transportation costs, insurance expenses, interest costs and feeding costs, incurred in bringing the asset to its intended productive state. Once the asset reaches productive state, the cost of the immature biological asset is transferred to mature biological assets using the weighted average cost method.
Interest costs associated with immature biological assets are capitalized in the period they are incurred. Interest is no longer capitalized when the asset reaches its productive state.
Mature biological assets
Mature biological assets are recorded at cost. When mature biological assets are retired or otherwise disposed of, the cost and accumulated depreciation are removed from the accounts and any resulting gain or loss is included in the results of operations for the respective period.
Depreciation is provided over the estimated useful lives of the mature biological assets of 5 years using the straight-line method. The estimated residual value of mature biological assets is 10%.
Feeding and management costs incurred on mature biological assets are included as costs of goods sold on the consolidated statements of operations.
When biological assets are retired or otherwise disposed of, the cost and accumulated depreciation are removed from the accounts and any resulting gain or loss is included in the results of operations in the year of retirement or disposition.
The Group reviews the carrying value of biological assets for impairment whenever events and circumstances indicate that the carrying value of an asset may not be recoverable from the estimated future cash flows expected to result from its use and eventual disposition. In cases where undiscounted expected future cash flows are less than the carrying value, an impairment loss is recognized equal to an amount by which the carrying value exceeds the fair value of assets. The factors considered by management in performing this assessment include current health status of the asset and production capacity. There were no impairments recorded in the years ended December 31, 2010, 2009 and 2008.
Prepaid leases for land use rights
All lands in the PRC are state-owned and no individual land ownership right exists. The Group acquired the rights to use certain lands and the premiums paid for such rights are recorded as prepaid leases and amortized over the use terms of 40 to 50 years in the statements of operations using the straight-line method.
Certain of the land use rights can only be used by the Group to which the right was granted and cannot be transferred or sold to others.
Other intangible assets
Other intangible assets consist of production permits and exclusive rights of milk supply, which are carried at cost less accumulated amortization. Amortization is calculated on a straight-line basis over the expected useful lives of one and 4.7 years, respectively.
Goodwill
Goodwill represents the excess of the cost of an acquisition over the fair value of the group’s share of the net identifiable tangible and intangible assets acquired at the date of acquisition. Goodwill is not amortized and is tested for impairment annually or more frequently if events or changes in circumstances indicate that it might be impaired. At the end of each year, the Group tests impairment of goodwill at the reporting unit level and recognizes impairment in the event that the carrying value exceeds the fair value of each reporting unit. The Company estimates the fair value of its reporting units based on their discounted cash flows. If the carrying value of a reporting unit exceeds its estimated fair value in the first step, a second step is performed, in which the reporting unit’s goodwill is written down to its implied fair value. The second step requires the Company to allocate the fair value of the reporting unit derived in the first step to the fair value of the reporting unit’s net assets, with any fair value in excess of amounts allocated to such net assets representing the implied fair value of goodwill for that reporting unit. If the carrying value of the goodwill allocated to a reporting unit exceeds its fair value, such goodwill is written down by an amount equal to such excess.
F-12
|
Fair value of financial instruments
|
Financial instruments include cash and cash equivalents, restricted cash, trade and notes receivables, available for sale investments, amounts due from related parties, accounts payable, amount due to related parties, bank loans and other current liabilities, and capital lease obligation. The carrying amounts of cash and cash equivalents, restricted cash, trade and notes receivables, accounts payable, amounts due from related parties, other current liabilities, and amount due to related parties approximate their fair value due to the short-term maturities of these instruments.
Bank loans and capital lease obligation are interest bearing. Because the stated interest rate reflects the market rate, the carrying amount of the bank loans and capital lease obligations approximates its fair value. Fair value of available for sale investments are based upon quoted market prices.
Revenue recognition
Sales Revenue
Revenue from the sale of goods is recognized on the transfer of risks and rewards of ownership, which coincides with the time when the goods are shipped to customers and the title has passed. Sales revenues represent amounts invoiced, net of a value-added tax (“VAT”). All of the Group’s products sold in the PRC are subject to Chinese VAT at a rate of 17% of the gross sales price or at a rate approved by the Chinese local government which totaled $80,406,328, $87,045,100, and $80,011,771 for the years ended December 31, 2010, 2009 and 2008, respectively.
Revenue is shown net of sales returns, which amounted to less than 0.8% of total sales in each of the years ended December 31, 2010, 2009 and 2008, and net of sales discounts, which are determined based on the distributors’ sales volumes.
Any shipping, handling or other costs incurred by the Group associated with the sale, are expensed as sales and marketing expenses in the period when the sale occurs. Such costs amounted to $7,920,298, $8,085,248 and $5,056,821 during the years ended December 31, 2010, 2009 and 2008, respectively.
Advances from customers
Revenue from the sale of goods is recognized when goods are shipped. Receipts in advance for goods to be shipped in the future are recorded as advances from customers.
Cost of goods sold
Cost of goods sold primarily consists of direct and indirect manufacturing costs, including production overhead costs, shipping and handling costs for the products sold.
Sales and marketing
Sales and marketing costs consist primarily of advertising and market promotion expenses, and other overhead expenses incurred by the Group’s sales and marketing personnel. Advertising expenses amounted to $21,727,818, $31,190,272 and $11,116,857 during the years ended December 31, 2010, 2009 and 2008, respectively.
Advertising expenses are expensed as incurred.
F-13
Product display fees
The Company has entered into a number of agreements with their resellers, whereby the Company pays the reseller an agreed upon amount to display its products. The Company has reduced sales by the amount paid under these agreements. For the years ended December 31, 2010, 2009 and 2008, these amounts were $29,346,857, $25,509,131 and $7,025,104, respectively.
Share-based compensation
Share-based compensation to employees is measured by reference to the fair value of the equity instrument as at the date of grant using the Black-Scholes model, which requires assumptions for dividend yield, expected volatility and expected life of stock options. The expected life of stock options is estimated by observing general option holder behavior. The assumption of the expected volatility has been set by reference to the implied volatility of the Company’s shares in the open market and historical patterns of volatility. Performance and service vesting conditions attached to the options are included in assumptions about the number of shares that the option holder will ultimately receive. On a regular basis we review the assumptions made and revise the estimates of the number of options expected to be settled, where necessary. Significant factors affecting the fair value of option awards include the estimated future volatility of the Company’s stock price and the estimated expected term until the option award is exercised or cancelled.
Government subsidy
Government subsidies granted to purchase manufacturing facilities are recorded as deferred income when the Group receives the funds. Such deferred income is amortized on a straight line basis over the life of the relevant manufacturing facilities, and are recorded as a reduction in cost of goods sold.
Government subsidies received by the Group without the appropriate documentation from the local government authorities to specify the purpose of the funds granted are recorded as deferred income, and are recognized as other income to match with the expenditure to which the grant relates once the Group obtains the appropriate documentation from the local government authorities.
The Group's entities that operate production facilities in Heilongjiang Province in the PRC, namely Feihe Dairy, Gannan Feihe and Baiquan Dairy, receive subsidies from the local government authorities as incentives to support the Group's business development and local economy. These subsidies are based on certain amounts of taxes paid by the entities but are not refunds of the tax paid from the taxing authority. They are without condition and recorded as other income upon receipt.
|
·
|
Feihe Dairy obtained refunds from the local government authorities for 50% of its VAT and 100% of its enterprise income tax ("EIT") paid and shared by local tax authorities during the year ended December 31, 2008. It enjoys tax refunds at 40% of VAT of its paid and shared by local tax authorities, and 40% of EIT paid and shared by local tax authorities during the years 2009 to 2013;
|
|
·
|
Gannan Feihe enjoyed 100% tax holidays during the years ended December 31, 2008 and 2009. Gannan Feihe obtained 100% of its EIT paid and shared by local tax authorities during the year ended December 31, 2010;
|
|
·
|
Baiquan Dairy obtained refunds from the local government authorities for 50% of its VAT during the years ended December 31, 2008 and 2009, respectively. Baiquan Dairy obtained refunds from the local government authorities for 100% and 40% EIT paid and shared by local tax authorities during the years ended December 31, 2008 and 2009, respectively.
|
F-14
For the years ended December 31, 2010, 2009 and 2008, the Group recognized governmental subsidies as other income of $23,462,082, $21,177,132, and $6,810,231, respectively.
Leases
Leases are classified as capital or operating leases. Leases where substantially all the rewards and risks incidental to ownership of assets are transferred to the lessee is classified as capital leases. At inception, capital leases are recorded at present value of minimum lease payments or the fair value of the asset, whichever is less. Assets under capital leases are amortized on a basis consistent with that of similar property, plant and equipment. Leases where substantially all the rewards and risks of ownership of assets remain with the lessor are accounted for as operating leases. Operating lease costs are recognized on a straight-line basis over the lease term.
Taxation
The Company must make certain estimates and judgments in determining income tax expense for financial reporting purposes. These estimates and judgments occur in the calculation of certain deferred tax assets and liabilities, which arise from differences in the timing of recognition of revenue and expense for tax and financial reporting purposes.
Refer to Note 5 in the notes to the consolidated financial statements for further information regarding the components of the Company's income taxes.
|
Comprehensive income (loss)
|
Comprehensive income includes net income, unrealized gain (loss) on available-for-sale investments and foreign currency translation adjustments. Comprehensive income is reported in the consolidated statements of changes in shareholders' equity and comprehensive income (loss).
Net income (loss) per share
Net income (loss) per common share is computed by dividing net income (loss) attributable to common shareholders by the weighted average number of common shares outstanding during the period.
The Group has determined that its redeemable common shares are participating securities as the redeemable common shares participate in undistributed earnings on an as-if-converted basis. Accordingly, the Group applies the two-class method of computing net income (loss) per share, for common and redeemable common shares according to their respective rights to participate in earnings. Under this method, undistributed net income (loss) is allocated on a pro rata basis to the holders of common and redeemable common shares to the extent that each class may share income for the period.
Diluted net income (loss) per common share reflects the potential dilution that could occur if securities or other contracts to issue common shares were exercised or converted into common shares. The dilutive effect of stock options is computed using treasury stock method. The dilutive effect of convertible debt is computed using as-if converted method.
Segment reporting
The Group has two reportable segments: dairy products and dairy farm. The dairy products segment produces and sells dairy products, such as wholesale and retail milk powders as well as soybean powder, rice cereal, walnut powder and walnut oil. The dairy farm segment operates the Group’s two dairy farms in the PRC, construction of which was completed in the fourth quarter of 2009. As the Group primarily generates its revenues from customers in the PRC, no geographical segments are presented.
Use of estimates
The preparation of financial statements in conformity with US GAAP requires management to make estimates and assumptions that affect the reported amounts of assets and liabilities, disclosures of contingent assets and liabilities at the balance sheet dates and the reported amounts of revenues and expenses during the reporting periods. Actual results could materially differ from those estimates.
F-15
The estimates and assumptions that have a significant risk of causing a material adjustment to the carrying amounts of assets and liabilities are provision for doubtful accounts on trade receivables, notes receivable, other receivables, reserves for inventory, estimated useful lives of property, plant and equipment and biological assets, valuation allowance for deferred tax assets, share-based compensation, purchase price allocation in business combinations, unrecognized tax benefits and impairment of goodwill.
Comparative figures
Certain comparative figures have been reclassified as of and for the years ended December 31, 2009 and 2008 to conform to current year's presentation including the following:
|
·
|
The balance of restricted cash of approximately $0.8 million as of December 31, 2009 has been reclassified from cash and cash equivalents. In addition changes in notes receivable and notes payable have been reclassified from investing and financing activities to operating activities on the Consolidated Statements of Cash Flows. As a result, for the year ended December 31, 2009, net cash provided by operating activities, used in investing activities, and provided by financing activities increased approximately $10 million, increased approximately $6.2 million, and decreased by approximately $3.4 million, respectively. For the year ended December 31, 2008 net cash provided by operating activities, used in investing activities, and used in financing activities decreased approximately $7.4 million, decreased by approximately $9.0 million, and increased approximately $1.0 million, respectively.
|
|
·
|
Total current assets as of December 31, 2009 decreased by approximately $18.4 million as a result of reclassifications of certain advances to suppliers from current to non-current slightly offset by the reclassification of available-for-sale investment into current assets.
|
|
·
|
Operating income presented for the year ended December 31, 2009 decreased approximately $2.7 million and increased approximately $0.2 million for the year ended December 31, 2008, mainly as a result of reclassification of goodwill impairment and loss on disposal of biological assets from "Other income (expense)" to "Operating expense" on the Consolidated Statements of Operations.
|
|
·
|
The presentation regarding noncontrolling interest was retroactively applied for December 31, 2009 and 2008.
|
|
·
|
Earnings per share for the years ended December 31, 2009 and 2008 have been amended to the two-class method.
|
3. RECENT ACCOUNTING PRONOUNCEMENTS
In January 2010, the FASB issued authoritative guidance to improve disclosures about fair value measurements. This guidance amends previous guidance on fair value measurements to add new requirements for disclosures about transfers into and out of Levels 1 and 2 and separate disclosures about purchases, sales, issuances, and settlements relating to Level 3 measurement on a gross basis rather than on a net basis as currently required. This guidance also clarifies existing fair value disclosures about the level of disaggregation and about inputs and valuation techniques used to measure fair value. This guidance is effective for annual and interim periods beginning after December 15, 2009, except for the requirement to provide the Level 3 activities of purchases, sales, issuances, and settlements on a gross basis, which will be effective for annual and interim periods beginning after December 15, 2010. Early application is permitted and, in the period of initial adoption, entities are not required to provide the amended disclosures for any previous periods presented for comparative purposes. The adoption of this guidance did not have a significant impact on the Group’s financial statements.
In March 2010, the FASB issued authoritative guidance regarding the effect of denominating the exercise price of a share-based payment awards in the currency of the market in which the underlying equity securities trades and that currency is different from (1) entity’s functional currency, (2) functional currency of the foreign operation for which the employee provides services, and (3) payroll currency of the employee. The guidance clarifies that an employee share-based payment award with an exercise price denominated in the currency of a market in which a substantial portion of the entity’s equity securities trades should be considered an equity award assuming all other criteria for equity classification are met. The guidance will be effective for interim and annual periods beginning on or after December 15, 2010, and will be applied prospectively. Affected entities will be required to record a cumulative catch-up adjustment for all awards outstanding as of the beginning of the annual period in which the guidance is adopted. This adoption of the authoritative guidance is not expected to have a material impact on the Group’s financial statements.
F-16
In December 2010, the FASB issued an authoritative pronouncement on when to perform Step 2 of the goodwill impairment test for reporting units with zero or negative carrying amounts. The amendments in this update modify Step 1 so that for those reporting units, an entity is required to perform Step 2 of the goodwill impairment test if it is more likely than not that a goodwill impairment exists. In determining whether it is more likely than not that a goodwill impairment exists, an entity should consider whether there are any adverse qualitative factors indicating that an impairment may exist. The qualitative factors are consistent with existing guidance, which requires that goodwill of a reporting unit be tested for impairment between annual tests if an event occurs or circumstances change that would more likely than not reduce the fair value of a reporting unit below its carrying amount. For public entities, the guidance is effective for impairment tests performed during entities’ fiscal years (and interim periods within those years) that begin after December 15, 2010. Early adoption will not be permitted. For nonpublic entities, the guidance is effective for impairment tests performed during entities' fiscal years (and interim periods within those years) that begin after December 15, 2011. Early application for nonpublic entities is permitted; nonpublic entities that elect early application will use the same effective date as that for public entities. This adoption of the authoritative guidance is not expected to have a material impact on the Group’s financial statements.
In December 2010, the FASB issued an authoritative pronouncement on disclosure of supplementary pro forma information for business combinations. The objective of this guidance is to address diversity in practice regarding the interpretation of the pro forma revenue and earnings disclosure requirements for business combinations. The amendments in this update specify that if a public entity presents comparative financial statements, the entity should disclose revenue and earnings of the combined entity as though the business combination(s) that occurred during the current year had occurred as of the beginning of the comparable prior annual reporting period only. The amendments also expand the supplemental pro forma disclosures to include a description of the nature and amount of material, nonrecurring pro forma adjustments directly attributable t the business combination included in the reported pro forma revenue and earnings. The amendments will be effective for business combinations consummated in periods beginning after December 15, 2010, and should be applied prospectively as of the date of adoption. Early adoption is permitted. This adoption of the authoritative guidance is not expected to have a material impact on the Group’s financial statements.
|
4. CONCENTRATIONS OF BUSINESS AND CREDIT RISK
|
Financial instruments that potentially subject the Group to significant concentrations of credit risk consist primarily of cash and cash equivalents, trade receivables, and notes and loans receivable.
(1) Cash and cash equivalents
The Company maintains certain bank accounts in the PRC which are not protected by FDIC insurance or other insurance. Cash balance held in PRC bank accounts to $17,457,228 and $47,200,559 as of December 31, 2010 and 2009, respectively. As of December 31, 2010 and 2009, the Company held $64,612 and $964,373 of cash balances within the United States of which $nil and $714,373 were in excess of insurance limits of Federal Deposit Insurance Corporation, respectively.
As of December 31, 2010 and 2009 substantially all of the Group’s cash and cash equivalents, restricted cash, investment in mutual funds and notes receivable were held by major financial institutions located in the PRC and the United States which management believes are of high credit quality.
(2) Sales and trade receivables
F-17
Nearly all of the Group's sales are concentrated in the PRC and substantially all of the Group's profits are generated from the operation there. Accordingly, the Group is susceptible to fluctuations in its business caused by adverse economic conditions in the PRC.
The Group provides credit in the normal course of business and substantially all customers are located in the PRC. The Group performs ongoing credit evaluations of its customers and maintains allowances for doubtful accounts based on factors surrounding the credit risk of specific customers, historical trends, and other information. No individual customer accounted for more than 10% of net revenues during the years ended December 31, 2010 and 2009.
(3) Notes receivable
Notes receivable includes a promissory note in the principal amount of $4,000,000 (the “Note”) issued by Huge Power Int’l S.A., a company organized in Samoa (“Huge Power”). On June 27, 2007, the Company loaned a principal amount of $4,000,000 to Huge Power and Huge Power issued the Note. The Note stated interest is an annual rate of 8%, payable in cash semi-annually. The Note matured on June 27, 2009. Huge Power has made payments of interest under the Note; however, the Company has been unable to obtain the collateral that is required to be pledged according to the Note agreement. As a result, the Company has provided a full allowance for doubtful collection of the Note as a result of not receiving collateral. Interest on the Note is recognized when received due to the doubtful collection.
|
5. INCOME TAXES
|
The Company is subject to U.S. federal and state income taxes. The Company’s subsidiaries incorporated in the PRC are subject to the PRC enterprise income taxes. The provision for income taxes from continuing operations consisted of the following:
|
2010
|
2009
|
2008
|
||||||||||
|
US$
|
US$
|
US$
|
||||||||||
|
Current:
|
||||||||||||
|
Federal
|
(271,969
|
)
|
253,644
|
-
|
||||||||
|
State
|
4,241
|
912
|
5,823
|
|||||||||
|
PRC
|
1,878,181
|
1,725,593
|
4,291,802
|
|||||||||
|
1,610,453
|
1,980,149
|
4,297,625
|
||||||||||
|
Deferred:
|
||||||||||||
|
Federal
|
-
|
-
|
-
|
|||||||||
|
State
|
-
|
-
|
-
|
|||||||||
|
PRC
|
(1,890,175
|
)
|
(2,726,347
|
)
|
(730,490
|
)
|
||||||
|
(279,722
|
)
|
(746,198
|
)
|
3,567,135
|
||||||||
The provision for income taxes is attributable to:
|
Continuing operations
|
(279,722 | ) | (746,198 | ) | 3,567,135 | |||||||
|
Discontinued operations
|
- | 539,389 | 2,130,686 | |||||||||
| (279,722 | ) | (206,809 | ) | 5,697,821 |
F-18
United States
The Company is incorporated in the State of Utah and is subject to U.S. federal taxes at gradual tax rates from 15% to 35% and state income tax at a rate of 5.0%.
PRC
On March 16, 2007, the National People's Congress enacted a new enterprise income tax law ("New EIT Law"), which took effect on January 1, 2008. The New EIT Law applies a uniform 25% enterprise income tax rate to both foreign invested enterprises and domestic enterprises.
The preferential tax rates applicable to the Company's PRC subsidiaries, which differ from the PRC statutory rates and were used to calculate the tax provision based on the Company's interpretation of the New EIT Law are presented in the following table.
|
2012 and
|
||||||||||||||||||||
|
Subsidiary
|
2008
|
2009
|
2010
|
2011
|
thereafter
|
|||||||||||||||
|
Shanxi Feihe (i)
|
0
|
%
|
0
|
%
|
12
|
.5%
|
12.5
|
%
|
12.5%-25
|
%
|
||||||||||
|
Langfang Feihe(i)
|
0
|
%
|
0
|
%
|
12
|
.5%
|
12.5
|
%
|
12.5%-25
|
%
|
||||||||||
|
Gannan Feihe(i)
|
0
|
%
|
0
|
%
|
12
|
.5%
|
12.5
|
%
|
12.5%-25
|
%
|
||||||||||
|
Kedong Farms(ii)
|
0
|
%
|
0
|
%
|
0
|
%
|
0
|
%
|
0
|
%
|
||||||||||
|
Gannan Farms(ii)
|
0
|
%
|
0
|
%
|
0
|
%
|
0
|
%
|
0
|
%
|
||||||||||
(i) Pursuant to Article 8 of the Income Tax Law of the PRC Concerning Foreign Investment and Foreign Enterprises ( the “FEIT Law”), a manufacturing enterprise that operates for at least 10 years was eligible to receive certain preferential tax treatments. Moreover, a foreign invested manufacturing enterprise (“FIME”), starting from its first profitable calendar year after offset of accumulated tax losses, was entitled to a two-year exemption from enterprise income tax followed by a three year 50% reduction in its enterprise income tax rate.
Under the new PRC EIT regime, an enterprise that is entitled to preferential treatment in the form of enterprise income tax reduction or exemption prior to January 1, 2008 would continue to enjoy such preferential treatment until the expiration of the period. The holiday, if not yet started, would need to start from 2008.
Since Gannan Feihe, Shanxi Feihe and Langfang Feihe are FIMEs established prior to the promulgation of the New EIT Law, they need to start the tax holiday with tax exemption for 2008 and 2009 and with 50% reduced tax rate for 2010, 2011 and 2012.
(ii) According to the New EIT Law, income earned by enterprises from their activities in agriculture is subject to tax exemptions and deductions. Gannan Farms and Kedong Farms mainly engaged in breeding and rearing of dairy cows, and distribution of fresh milk, as such, enjoy enterprise income tax exemption for their agricultural incomes.
F-19
The principal components of the Group’s deferred income tax assets and liabilities are as follows:
|
2010
|
2009
|
|||||||
|
US$
|
US$
|
|||||||
|
Current deferred tax assets:
|
||||||||
|
Accrued expenses
|
2,095,794 | 1,024,337 | ||||||
|
Provision for doubtful accounts
|
1,607,115 | 1,541,269 | ||||||
|
Other deferred tax assets
|
167,798 | 784,614 | ||||||
|
Total current deferred tax assets:
|
3,870,707 | 3,350,220 | ||||||
|
Less: Valuation allowance
|
1,634,394 | 1,675,546 | ||||||
|
Current deferred tax assets, net:
|
2,236,313 | 1,674,674 | ||||||
|
Non-current deferred tax assets:
|
||||||||
|
Stock option expense
|
24,811 | 191,395 | ||||||
|
Net operating loss carry forwards
|
3,924,715 | 2,295,769 | ||||||
|
Depreciation and amortization
|
1,283,674 | 994,566 | ||||||
| 5,233,200 | 3,481,730 | |||||||
|
Non-current deferred tax liabilities:
|
||||||||
|
Intangible assets acquired
|
(141,216 | ) | (196,902 | ) | ||||
|
Total non-current deferred tax assets:
|
5,091,984 | 3,284,828 | ||||||
|
Less: Valuation allowance
|
1,805,307 | 1,326,686 | ||||||
|
Non-current deferred tax assets, net:
|
3,286,677 | 1,958,142 | ||||||
For U.S. federal income tax purposes, the Company has net operating loss (“NOL”) carryforwards of approximately $2.5 million and $1.9 million, as of December 31, 2010 and 2009, respectively. The Company also has approximately $12.3 million and $6.6 million of NOL carryforwards for the PRC enterprise income tax purposes, as of December 31, 2010 and 2009, respectively. As of December 31, 2010 and 2009, valuation allowances were approximately $3.4 million and $3 million, respectively, which were provided against deferred tax assets of the Company and certain subsidiaries due to the uncertainty of realization. The NOL carryforwards for the Company and its subsidiaries as of December 31, 2010 will expire on various dates between 2014 and 2030.
The following is a reconciliation of the difference between the actual provision for income tax rate and the federal statutory rate:
F-20
|
2010
|
2009
|
2008
|
||||||||||
|
Tax at federal statutory rate
|
34 | % | 34 | % | 34 | % | ||||||
|
Permanent differences
|
-12.03 | % | 101.43 | % | 18.33 | % | ||||||
|
Effect of income tax rate differences in PRC
|
-16.57 | % | -25.45 | % | -15.55 | % | ||||||
|
Effect of tax holidays and preferential tax rates in PRC
|
8.45 | % | -99.79 | % | -24.03 | % | ||||||
|
Change in valuation allowance
|
-9.04 | % | -28.21 | % | 4.75 | % | ||||||
|
(Decrease) increase in unrecognized tax benefit balance
|
||||||||||||
| -5.32 | % | 12.65 | % | 6.85 | % | |||||||
|
Others
|
3.26 | % | 0.53 | % | 0.88 | % | ||||||
| 2.75 | % | -4.84 | % | 25.23 | % | |||||||
The following presents the aggregate dollar and per share effects of the Company's tax holidays:
|
2010
|
2009
|
2008
|
||||||||||
|
US$
|
US$
|
US$
|
||||||||||
|
Aggregate dollar effect of tax holiday
|
(859,790 | ) | (16,086,536 | ) | (3,397,666 | ) | ||||||
|
Per share effect—basic
|
0.04 | 0.85 | 0.20 | |||||||||
|
Per share effect—diluted
|
0.04 | 0.80 | 0.19 | |||||||||
A reconciliation of January 1, 2009 through December 31, 2010 amount of unrecognized tax benefits excluding interest and penalties (“Gross UTB”) is as follows:
|
Gross UTB
|
||||
|
US$
|
||||
|
Beginning balance as of January 1, 2009
|
3,465,640
|
|||
|
Increase in unrecognized tax benefits in the year
|
1,529,682
|
|||
|
Ending balance as of December 31, 2009
|
4,995,322
|
|||
|
Decrease in unrecognized tax benefits in the year
|
(1,032
|
)
|
||
|
Ending balance as of December 31, 2010
|
4,994,290
|
|||
F-21
The Company records interest and penalties related to unrecognized tax benefits in income tax expense. The Company had cumulatively accrued approximately $1.6 million and $1.0 million for estimated interest and penalties related to uncertain tax positions as of December 31, 2010 and 2009, respectively. For the twelve months ended December 31, 2010 and 2009, the Company recorded estimated interest and penalties of approximately $0.6 million and $0.4 million, respectively.
The Company does not expect significant change in unrecognized tax benefits in the next twelve months.
The Company and its subsidiaries are subject to taxation in the U.S. and the PRC. There is not any ongoing tax examination in any jurisdictions. Years from 2006 to 2010 of the Company remain open for US federal and state income tax purpose and tax years from 2005 to 2010 of the PRC subsidiaries remain open to examination by tax authorities in the PRC.
Uncertainties exist with respect to how the current income tax law in the PRC applies to the Group's overall operations, and more specifically, with regard to tax residency status. The New EIT Law includes a provision specifying that legal entities organized outside of the PRC will be considered residents for Chinese Income tax purposes if the place of effective management or control is within the PRC. The implementation rules to the New EIT Law provide that non-resident legal entities will be considered China residents if substantial and overall management and control over the manufacturing and business operations, personnel, accounting, properties, etc, occurs within the PRC. If the PRC tax authorities subsequently determine that the Company and its subsidiaries registered outside the PRC should be deemed a resident enterprise, the Company and its subsidiaries registered outside the PRC will be subject to the PRC income tax at a rate of 25%. As of the balance sheet date, the determination on tax residency of status of the Company is unclear because of the limited guidance issued by the PRC tax authorities. However, the Company reasonably believes that no material tax liability will occur for respective tax years if the Company is considered to be a PRC tax resident by the PRC tax authorities.
If the Company were to be non-resident for the PRC tax purpose, dividends paid to it by its PRC subsidiaries out of profits earned after January 1, 2008 would be subject to a PRC withholding tax at 10%.
Undistributed earnings of the Company's PRC subsidiaries amounted to approximately $122 million as of December 31, 2010. Those earnings are considered to be permanently reinvested and accordingly, no deferred tax expense is recorded for U.S. federal and state income tax or applicable withholding taxes. The PRC tax authorities have clarified that dividend distributions made out of pre-January 1, 2008 retained earnings will not be subject to withholding taxes.
|
6. EARNINGS PER SHARE OF COMMON STOCK
|
The following is a reconciliation of the numerators and denominators of the basic and diluted net (loss) income per share computations:
F-22
|
For the years ended
December 31,
|
||||||||||||
|
2010
|
2009
|
2008
|
||||||||||
|
Net (loss) income attributable to Feihe International, Inc. shareholders
|
||||||||||||
|
Net (loss) income from continuing operations
|
(9,583,871 | ) | 16,291,478 | 10,560,157 | ||||||||
|
Net income from discontinued operations, net of tax
|
- | 3,289,908 | 6,462,878 | |||||||||
|
Net (loss) income attributable to Feihe International, Inc. shareholders
|
(9,583,871 | ) | 19,581,386 | 17,023,035 | ||||||||
|
Deemed dividends on redeemable common stock
|
(1,086,622 | ) | - | - | ||||||||
|
Net (loss) income attributable to Feihe International, Inc. shareholders allocated for computing net (loss) income per common share - basic
|
(10, 670,493 | ) | 19,581,386 | 17,023,035 | ||||||||
|
Net (loss) income attributable to Feihe International, Inc. allocated for computing net (loss) income per share of common stock - Basic
|
||||||||||||
|
Net (loss) income from continuing operations
|
(9,412,906 | ) | 15,665,098 | 10,560,157 | ||||||||
|
Net income from discontinued operations, net of tax
|
- | 3,163,418 | 6,462,878 | |||||||||
|
Net (loss) income attributable to Feihe International, Inc. allocated for computing net (loss) income per share of common stock - Basic
|
(9,412,906 | ) | 18,828,516 | 17,023,035 | ||||||||
|
Net (loss) income attributable to Feihe International, Inc. allocated for computing net (loss) income per share of redeemable common stock - Basic
|
||||||||||||
|
Net (loss) income from continuing operations
|
(170,965 | ) | 626,380 | - | ||||||||
|
Net income from discontinued operations, net of tax
|
- | 126,492 | - | |||||||||
|
Net (loss)income attributable to Feihe International, Inc. allocated for computing net (loss) income per share of redeemable common stock - Basic
|
(170,965 | ) | 752,872 | - | ||||||||
|
Net (loss) income attributable to Feihe International, Inc. allocated for computing net (loss) income per share of common stock - Diluted
|
||||||||||||
|
Net (loss) income from continuing operations
|
(9,412,906 | ) | 15,665,098 | 10,560,157 | ||||||||
|
Net income from discontinued operations, net of tax
|
- | 3,163,418 | 6,462,878 | |||||||||
|
Net (loss) income attributable to Feihe International, Inc. allocated for computing net (loss) income per share of common stock - Diluted
|
(9,412,906 | ) | 18,828,516 | 17,023,035 | ||||||||
|
Weighted-average common stock outstanding used in computing net (loss) income per share of common stock – Basic
|
19,647,844 | 18,273,652 | 16,993,390 | |||||||||
|
Weighted-average common stock outstanding used in computing net (loss) income per share of common stock – Diluted (i)
|
19,647,844 | 19,449,913 | 17,636,862 | |||||||||
|
Weighted average shares of redeemable common stock outstanding used in computing net (loss) income per share of redeemable common stock – Basic
|
2,625,000 | 730,685 | - | |||||||||
|
Weighted average shares of redeemable common stock outstanding used in computing net (loss) income per share of redeemable common stock – Diluted
|
2,625,000 | 730,685 | - | |||||||||
|
Net (loss) income per share of common stock – Basic
|
||||||||||||
|
(Loss) income from continuing operations attributable to Feihe International, Inc.
|
(0.48 | ) | 0.86 | 0.62 | ||||||||
|
Income from discontinued operations attributable to Feihe International, Inc., net of tax
|
- | 0.17 | 0.38 | |||||||||
|
Net (loss) income attributable to Feihe International, Inc.
|
(0.48 | ) | 1.03 | 1.00 | ||||||||
|
Net (loss) income per share of common stock – Diluted
|
||||||||||||
|
(Loss) income from continuing operations attributable to Feihe International, Inc.
|
(0.48 | ) | 0.81 | 0.60 | ||||||||
|
Income from discontinued operations attributable to Feihe International, Inc., net of tax
|
- | 0.16 | 0.37 | |||||||||
|
Net (loss) income attributable to Feihe International, Inc.
|
(0.48 | ) | 0.97 | 0.97 | ||||||||
|
Net (loss) income per share of redeemable common stock – Basic
|
||||||||||||
|
(Loss) income from continuing operations attributable to Feihe International, Inc.
|
(0.07 | ) | 0.86 | - | ||||||||
|
Income from discontinued operations attributable to Feihe International, Inc., net of tax
|
- | 0.17 | - | |||||||||
|
Net (loss) income attributable to Feihe International, Inc.
|
(0.07 | ) | 1.03 | - | ||||||||
|
Net (loss) income per share of redeemable common stock – Diluted
|
||||||||||||
|
(Loss) income from continuing operations attributable to Feihe International, Inc.
|
(0.07
|
) | 0.81 | - | ||||||||
|
Income from discontinued operations attributable to Feihe International, Inc., net of tax
|
0.16 | - | ||||||||||
|
Net (loss) income attributable to Feihe International, Inc.
|
(0.07
|
) | 0.97 | - | ||||||||
|
(i)
|
The following table sets forth the computation of weighted-average shares outstanding for calculating basic and diluted (loss) earnings per share for the years ended December 31:
|
F-23
|
2010
|
2009
|
2008
|
||||||||||
|
Weighted-average shares – Basic
|
19,647,844
|
18,273,652
|
16,993,390
|
|||||||||
|
Effect of dilutive securities
|
||||||||||||
|
Stock options
|
- |
454,995
|
-
|
|||||||||
|
Warrants
|
- |
514,182
|
643,472
|
|||||||||
|
Performance adjustment share
|
- | 207,084 | - | |||||||||
|
Weighted-average shares – Diluted
|
19,647,844
|
19,449,913
|
17,636,862
|
|||||||||
For the year ended December 31, 2008, 1,473,437 shares of the Company’s common stock attributable to the potential conversion of the 7.75% Convertible Notes due 2009 and 251,040 warrants were excluded from the calculation of diluted income per share because the conversion price or exercise price exceeded the average price per share of the Company’s common stock. For the year ended December 31, 2010, 856,245 shares of the Company’s stock option and 237,937 warrants were excluded from the calculation of diluted loss per share because their anti-dilutive effect.
|
7. DISCONTINUED OPERATIONS
|
Heilongjiang Moveup Co., Limited (“Moveup”) was initially formed in October 2007 to serve as an acquisition vehicle in connection with the Company’s proposed acquisition of 100% of the outstanding equity interest in Ausnutria Dairy (Hunan) Company Ltd. (“Ausnutria”), a distributor of dairy products focused on the high-end segment of the dairy products market in the PRC. In 2007 and 2008, the Company entered into several agreements with Ausnutria in connection with this transaction, which did not close.
In December 2008, the Company and Ausnutria’s owners entered into a letter of intent to unwind the transactions. Accordingly, the prior transactions to acquire Ausnutria were effectively cancelled and Moveup is reflected in the Company’s consolidated financial statements as a discontinued operations. In February 2009, the Company, through its subsidiary Feihe Dairy, entered into an equity purchase agreement pursuant to which Feihe Dairy and the minority shareholder of Moveup, Liu Sheng-Hui, one of the Company’s directors and Vice President of Finance of Feihe Dairy, each agreed to sell to Hunan Xindaxin Co., Ltd. 100% of their equity interests in Moveup for an aggregate consideration of approximately $43.3 million. The Company received approximately $4.4 million in 2008 and approximately $6.6 million from the purchaser in January 2009. In May 2009, the final tranche of approximately $32.3 million was released from an escrow account to Feihe Dairy and Mr. Liu and a resulting gain on sale of a subsidiary of $2,552,733 was recognized in the consolidated statements of operations during the second quarter of 2009.
The following table presents the components of discontinued operations reported in the consolidated statements of operations:
|
For the years ended
December 31,
|
||||||||||||
|
2010
|
2009
|
2008
|
||||||||||
|
US$
|
US$
|
US$
|
||||||||||
|
Sales
|
- | 10,451,277 | 38,979,045 | |||||||||
|
Income from operations
|
- | 1,301,909 | 8,593,564 | |||||||||
|
Gain on sale of subsidiary
|
- | 2,552,733 | - | |||||||||
|
Income tax expenses
|
- | (564,734 | ) | (2,130,686 | ) | |||||||
|
Net income from discontinued operations
|
- | 3,289,908 | 6,462,878 | |||||||||
F-24
8. LONGJIANG FEIHE ACQUISITION
On May 20, 2009, the Company’s subsidiary Gannan Feihe acquired 100% interest of the dairy processing plant from Heilongjiang Xin Tian Dairy Co., Ltd, for a total cash consideration of $4,382,890. The transaction was accounted for as a business acquisition. The purpose of the acquisition was to expand milk production capacities in the Heilongjiang Province, the PRC.
|
US$
|
||||
|
Total purchase price
|
4,382,890
|
|||
|
Fair value of identifiable assets acquired:
|
||||
|
Property, plant and equipment, net
|
2,219,661
|
|||
|
Prepaid leases for land use rights
|
481,460
|
|||
|
Other intangible assets
|
1,081,113
|
|||
|
Deferred tax asset
|
175,980
|
|||
|
Goodwill
|
424,676
|
|||
|
4,382,890
|
||||
None of the goodwill resulting from this acquisition is tax deductible.
All sales of Longjiang Feihe are inter-company transactions and eliminated in consolidation.
Pro forma
The following supplemental unaudited pro forma results of operations for the years ended December 31, 2009 and 2008, presented the acquisition as if it had occurred on January 1, 2008. The information was obtained during the year of 2010. The unaudited pro forma results include estimates and assumptions regarding amortization of acquired intangible assets, which the Company believes are reasonable. However, pro forma results are not necessarily indicative of the results that would have occurred if the acquisition had occurred on the dates indicated, or that may result in the future:
|
For the year
ended
December 31,
2009
|
For the year
ended
December 31,
2008
|
|||||||
|
US$
(unaudited)
|
US$
(unaudited)
|
|||||||
|
Sales
|
271,077,948 | 193,191,710 | ||||||
|
Net income attributable to Feihe International, Inc.
|
19,301,217 | 16,182,110 | ||||||
|
Net income attributable to Feihe International, Inc. per common share -basic
|
1.06 | 0.95 | ||||||
|
Net income attributable to Feihe International, Inc. per common share -diluted
|
0.99 | 0.92 | ||||||
9. RESTRICTED CASH
Restricted cash consists of bank demand deposits for letters of credit and short term notes payable. These instruments are mainly used by the Group for the short term financing of imported dairy cows and the purchase of whey powder.
F-25
|
10. NOTES RECEIVABLE, NET
|
The notes receivable, net included in the consolidated balance sheets as of December 31, 2010 and 2009 were as follows:
|
2010
|
2009
|
|||||||
|
US$
|
US$
|
|||||||
|
PRC bank note, due within three months
|
136,120
|
438,776
|
||||||
|
Promissory note, bearing interest at 8%, due on June 27, 2009 (See Note 4(3))
|
3,500,028
|
4,000,000
|
||||||
|
3,636,148
|
4,438,776
|
|||||||
|
Less: Allowance for doubtful notes receivable
|
(3,500,028
|
)
|
(4,000,000
|
)
|
||||
|
136,120
|
438,776
|
|||||||
|
11. TRADE RECEIVABLES, NET
|
The trade receivables amount included in the consolidated balance sheets as of December 31, 2010 and 2009 were as follows:
|
2010
|
2009
|
|||||||
|
US$
|
US$
|
|||||||
|
Trade receivables
|
16,970,016
|
28,286,309
|
||||||
|
Less: Allowance for doubtful accounts
|
(1,084,308
|
)
|
(791,119
|
)
|
||||
|
Trade receivables, net
|
15,885,708
|
27,495,190
|
||||||
The movement of the allowance for doubtful notes and trade receivables during the years ended December 31, 2010 and 2009 was as follows:
|
2010
|
2009
|
|||||||
|
US$
|
US$
|
|||||||
|
Balance as of January 1
|
4,791,119
|
5,311,331
|
||||||
|
Add: Current year additions
|
561,016
|
2,198,399
|
||||||
|
Less: Current year reductions of provision
|
(801,325
|
)
|
(2,721,872
|
)
|
||||
|
Foreign exchange adjustment
|
33,526
|
3,261
|
||||||
|
Balance as of December 31
|
4,584,336
|
4,791,119
|
||||||
|
12. ADVANCES TO SUPPLIERS
|
Advances to suppliers consist primarily of advances for purchase of dairy cows, as well as advances for inventories and equipment, not delivered at the balance sheet dates. The Company utilizes advances to suppliers in an effort to keep future purchasing prices stable and consistent.
Advanced amounts are refundable if the transaction is not completed by the other party in accordance with the terms of the contract or agreement. During the years ended December 31, 2010 2009, no advances to suppliers were refunded in cash, and the Group has a minimal repayment history.
|
13. INVENTORIES
|
The inventory amounts included in the consolidated balance sheets as of December 31, 2010 and 2009 comprised of:
|
2010
|
2009
|
|||||||
|
US$
|
US$
|
|||||||
|
Raw materials
|
27,983,563
|
23,360,410
|
||||||
|
Work-in-progress
|
37,400,104
|
33,967,523
|
||||||
|
Finished goods
|
6,299,804
|
1,716,732
|
||||||
|
Total inventories
|
71,683,471
|
59,044,665
|
||||||
F-26
|
14. INVESTMENT IN MUTUAL FUNDS – AVAILABLE-FOR-SALE
|
Various inputs are considered when determining the fair value of the Company’s financial instruments. The inputs or methodologies used for valuing securities are not necessarily an indication of the risk associated with investing in these securities. These inputs are summarized in the three broad levels listed below.
Level 1
Level 1 applies to assets or liabilities for which there are quoted prices in active markets for identical assets or liabilities.
Level 2
Level 2 applies to assets or liabilities for which there are inputs other than quoted prices included within Level 1 that are observable for the asset or liability such as quoted prices for similar assets or liabilities in active markets; quoted prices for identical assets or liabilities in markets with insufficient volume or infrequent transactions (less active markets); or model-derived valuations in which significant inputs are observable or can be derived principally from, or corroborated by, observable market data.
Level 3
Level 3 applies to assets or liabilities for which there are unobservable inputs to the valuation methodology that are significant to the measurement of the fair value of the assets or liabilities.
Investment in mutual funds is carried at fair value based on the quoted market prices of the underlying fund as of December 31, 2010 and 2009. Unrealized gain recorded for the years ended December 31, 2010 and 2009 was $2,828 and $58,962, respectively.
|
Fair value measurement
|
||||||||||||||||
|
Description
|
December 31,
|
Quoted prices
in active
markets of
identical assets
(Level 1)
|
Significant
other
observable
inputs
(Level 2)
|
Significant
unobservable
inputs
(Level 3)
|
||||||||||||
|
US$
|
US$
|
US$
|
US$
|
|||||||||||||
|
Investment in mutual funds – 2010
|
139,294
|
139,294
|
-
|
-
|
||||||||||||
|
Investment in mutual funds – 2009
|
136,466
|
136,466
|
-
|
-
|
||||||||||||
|
15. PROPERTY, PLANT AND EQUIPMENT, NET
|
Property, plant and equipment and related accumulated depreciation as of December 31, 2010 and 2009 were as follows:
|
2010
|
2009
|
|||||||
|
US$
|
US$
|
|||||||
|
Buildings and plant
|
121,592,268
|
111,469,845
|
||||||
|
Machinery and equipment
|
67,521,048
|
55,787,234
|
||||||
|
Office equipment
|
4,065,779
|
2,793,510
|
||||||
|
Motor vehicles
|
3,404,990
|
2,210,482
|
||||||
|
196,584,085
|
172,261,071
|
|||||||
|
Less: Accumulated depreciation
|
(26,229,953
|
)
|
(17,688,662
|
)
|
||||
|
Property, plant and equipment, net
|
170,354,132
|
154,572,409
|
||||||
F-27
(1) Depreciation expenses
Depreciation expense for the years ended December 31, 2010, 2009 and 2008 was $7,742,767 and $5,707,017 and $4,840,402, respectively, of which $6,058,582, $4,448,935 and $3,700,632 were included as a component of cost of goods sold in the respective years.
(2) Pledged property, plant and equipment
The net book value of buildings and plant, and machinery and equipment pledged for bank loans were $53,207,408 and $25,571,012 as of December 31, 2010 and 2009.
(3) Capitalized interest
$372,679, $2,970,058 and $nil of interest expense were capitalized in property, plant and equipment for the years ended December 31, 2010, 2009 and 2008.
|
16. CONSTRUCTION IN PROGRESS
|
The construction projects in progress as of December 31, 2010 and 2009 were as follows:
|
2010
|
2009
|
|||||||
|
US$
|
US$
|
|||||||
|
Feihe Dairy processing facilities
|
-
|
4,671,469
|
||||||
|
Langfang Feihe production factory facilities
|
-
|
2,711
|
||||||
|
Gannan Feihe production factory facilities
|
39,208,398
|
13,721,606
|
||||||
|
Shanxi Feihe processing facilities
|
-
|
51,386
|
||||||
|
Gannan Farms facilities
|
1,326,026
|
702,116
|
||||||
|
Kedong Farms facilities
|
1,260,399
|
-
|
||||||
|
Feihe Soybean processing facilities
|
1,333,098
|
4,015,104
|
||||||
|
Others
|
24,984
|
6,517
|
||||||
|
Total
|
43,152,905
|
23,170,909
|
||||||
$861,606, $142,591 and $4,149,543 of interest expense were capitalized in construction in progress for the years ended December 31, 2010, 2009 and 2008.
|
17. BIOLOGICAL ASSETS
|
Biological assets included both immature biological assets and mature biological assets. Biological assets and related accumulated depreciation as of December 31, 2010 and 2009 were as follows:
|
2010
|
2009 | |||||||
|
US$
|
US$ | |||||||
|
Immature biological assets
|
26,713,971
|
35,672,123
|
||||||
|
Mature biological assets
|
32,841,081
|
15,008,468
|
||||||
|
Less: Accumulated depreciation
|
(5,157,260
|
)
|
(1,776,344
|
)
|
||||
|
Mature biological assets, net
|
27,683,821
|
13,232,124
|
||||||
|
Total biological assets
|
54,397,792
|
48,904,247
|
||||||
(1) Depreciation expenses
Depreciation expense for the years ended December 31, 2010, 2009 and 2008 were $4,223,473, $1,835,364 and $6,816, all of which were recorded in cost of goods sold.
F-28
(2) Pledged biological assets
The net book value of biological assets pledged for bank loans was $41,170,041 and $46,659,512 as of December 31, 2010 and 2009.
(3) Capitalized interest
$689,894, $1,433,903 and $1,999,630 of interest expense were capitalized in immature biological assets for the years ended December 31, 2010, 2009 and 2008.
18. OTHER INTANGIBLE ASSETS, NET
Other intangible assets, net, as of December 31, 2010 and 2009 consisted of the following:
|
December 31,
2010
|
December 31,
2009
|
|||||||
|
US$
|
US$
|
|||||||
|
Production permit
|
-
|
68,254
|
||||||
|
Exclusive rights of milk supply
|
585,671
|
753,077
|
||||||
|
Total other intangible assets, net
|
585,671
|
821,331
|
||||||
Amortization expense for the years ended December 31, 2010 and 2009 was $257,166 and $260,843, respectively.
Production permits and exclusive rights of milk supply, which the Group acquired in 2009, are carried at cost less accumulated amortization. Amortization is calculated on a straight-line basis over the expected useful lives of one and 4.7 years, respectively. Amortization expense of intangible assets is estimated to be approximately $193,000, $193,000, $193,000, and $7,000 for 2011, 2012, 2013, and 2014, respectively.
|
19. GOODWILL
|
Goodwill represents the excess of the purchase price over the estimated fair value of the net tangible and identifiable intangible assets acquired from the Shanxi Feihe minority interest acquisition in 2006 and from the Longjiang Feihe acquisition in 2009 (Note 8). Such amounts are not tax deductible.
The Company has performed step 1 and step 2 of the goodwill impairment test relating to goodwill arising from its acquisition of the Shanxi Feihe minority interest using a combination of a discounted cash flow and replacement cost approach and determined that the carrying value of the reporting unit exceeded the fair value of the reporting unit, which is based on the Level 3 (Note 14). The Company recorded impairment loss of $1,437,005 and $929,526 for the years ended December 31, 2010 and 2009. No goodwill impairment was recognized in 2008.
|
20. SHORT TERM BANK LOANS
|
Short term bank loans included in the consolidated balance sheets as of December 31, 2010 and 2009 comprised of the following:
F-29
|
|
|
2010
|
|
|
2009
|
|
||
|
|
|
US$
|
|
|
US$
|
|
||
|
|
|
|
|
|
|
|
|
|
|
Loan payable to a bank in the PRC, bearing interest at 5.31% per annum, secured by machinery, payable with interest on maturity, due on January 4, 2010
|
|
|
-
|
|
|
|
2,193,881
|
|
|
|
|
|
|
|
|
|
|
|
|
Loan payable to a bank in the PRC, bearing interest at 5.31% per annum, secured by machinery, payable with interest on maturity, due on January 5, 2010
|
|
|
-
|
|
|
|
3,656,468
|
|
|
|
|
|
|
|
|
|
|
|
|
Loan payable to a bank in the PRC, bearing interest at 5.31% per annum, secured by land use rights, guaranteed by Feihe Dairy, payable with interest on maturity, due on May 22, 2010
|
|
|
-
|
|
|
|
4,972,796
|
|
|
|
|
|
|
|
|
|
|
|
|
Loan payable to a bank in the PRC, bearing interest at 5.31% per annum, secured by machinery, payable with interest on maturity, due on May 22, 2010
|
|
|
-
|
|
|
|
2,340,139
|
|
|
|
|
|
|
|
|
|
|
|
|
Loan payable to a bank in the PRC, bearing interest at 5.31% per annum, secured by machinery, payable with interest on maturity, due on March 31, 2010
|
|
|
-
|
|
|
|
3,773,475
|
|
|
|
|
|
|
|
|
|
|
|
|
Loan payable to a bank in the PRC, bearing interest at 5.31% per annum, secured by buildings of Feihe Soybean, guaranteed by Feihe Dairy, payable with interest on maturity, due on July 19, 2010 (i)
|
|
|
-
|
|
|
|
1,775,581
|
|
|
|
|
|
|
|
|
|
|
|
|
Loan payable to a bank in the PRC, bearing interest at 5.31% per annum, guaranteed by Feihe Dairy, payable with interest on maturity, due on July 19, 2010 (i)
|
|
|
-
|
|
|
|
1,149,593
|
|
|
|
|
|
|
|
|
|
|
|
|
Loan payable to a bank in the PRC, bearing interest at 5.31% per annum, guaranteed by Feihe Dairy, payable with interest on maturity, due on August 30, 2010 (ii)
|
|
|
-
|
|
|
|
2,925,174
|
|
|
|
|
|
|
|
|
|
|
|
|
Loan payable to a bank in the PRC, bearing interest at 5.31% per annum, guaranteed by Feihe Dairy, payable with interest on maturity, due on September 28, 2010 (ii)
|
|
|
-
|
|
|
|
1,462,587
|
|
|
|
|
|
|
|
|
|
|
|
|
Loan payable to a bank in the PRC, bearing interest at 5.31% per annum, guaranteed by Feihe Dairy, payable with interest on maturity, due on September 14, 2010
|
|
|
-
|
|
|
|
11,846,955
|
|
|
|
|
|
|
|
|
|
|
|
|
Loan payable to a bank in the PRC, bearing interest at 5.31% per annum, secured by building, payable with interest on maturity, due on September 15, 2010
|
|
|
-
|
|
|
|
2,778,915
|
|
|
|
|
|
|
|
|
|
|
|
|
Loan payable to a bank in the PRC, bearing interest at 5.31% per annum, guaranteed by Feihe Dairy, payable with interest on maturity, due on October 22, 2010 (ii)
|
|
|
-
|
|
|
|
2,925,174
|
|
|
|
|
|
|
|
|
|
|
|
|
Loan payable to a bank in the PRC, bearing interest at 5.31% per annum, guaranteed by Feihe Dairy(i), payable with interest on maturity, due on July 19, 2010
|
|
|
-
|
|
|
|
5,850,348
|
|
|
|
|
|
|
|
|
|
|
|
|
Loan payable to a bank in the PRC, bearing interest at 5.31% per annum, guaranteed by Feihe Dairy, payable with interest on maturity, due on November 12, 2010
|
|
|
-
|
|
|
|
5,850,348
|
|
|
|
|
|
|
|
|
|
|
|
|
Loan payable to a bank in the PRC, bearing interest at 5.31% per annum, secured by machinery, guaranteed by Feihe Dairy, payable with interest on maturity, due on December 23, 2010
|
|
|
-
|
|
|
|
4,680,278
|
|
|
|
|
|
|
|
|
|
|
|
|
Loan payable to a bank in the PRC, bearing interest at 5.31% per annum, secured by machinery, payable with interest on maturity, due on January 17, 2011
|
1,361,203
|
-
|
||||||
|
Loan payable to a bank in the PRC, bearing interest at 5.31% per annum, payable with interest on maturity, due on July 25, 2011 (iii)
|
7,562,237
|
-
|
||||||
|
Loan payable to a bank in the PRC, bearing interest at 5.31% per annum, payable with interest on maturity, due on August 30, 2011 (vi)
|
3,024,895
|
-
|
||||||
|
Loan payable to a bank in the PRC, bearing interest at 5.31% per annum, payable with interest on maturity, due on September 7, 2011 (v)
|
7,562,237
|
-
|
||||||
|
Loan payable to a bank in the PRC, bearing interest at 5.31% per annum, payable with interest on maturity, due on September 14, 2011 (iv)
|
5,293,566
|
-
|
||||||
|
Loan payable to a bank in the PRC, bearing interest at 5.31% per annum, payable with interest on maturity, due on September 27, 2011 (vi)
|
1,512,447
|
-
|
||||||
|
Loan payable to a bank in the PRC, bearing interest at 5.56% per annum, payable with interest on maturity, due on October 26, 2011 (vi)
|
3,024,895
|
-
|
||||||
|
Loan payable to a bank in the PRC, bearing interest at 5.56% per annum, payable with interest on maturity, due on November 7, 2011
|
23,745,426
|
-
|
||||||
|
Loan payable to a bank in the PRC, bearing interest at 5.56% per annum, secured by plant and land use right, payable with interest on maturity, due on November 7, 2011
|
6,503,524
|
-
|
||||||
|
Loan payable to a bank in the PRC, bearing interest at 5.56% per annum, payable with interest on maturity, due on November 17, 2011
|
1,361,203
|
-
|
||||||
|
Loan payable to a bank in the PRC, bearing interest at 5.56% per annum, secured by machinery, payable with interest on maturity, due on December 23, 2011
|
3,932,363
|
-
|
||||||
|
Loan payable to a bank in the PRC, bearing interest at 5.56% per annum, payable with interest on maturity, due on December 23, 2011
|
3,932,363
|
-
|
||||||
|
|
|
|
|
|
|
|
|
|
|
Total
|
|
|
68,816,359
|
|
|
|
58,181,712
|
|
|
(i)
|
In connection with the purchase of raw materials by Qiqihaer Feihe Soybean Co., Limited, Feihe Dairy guaranteed the loans payable to a bank in the PRC for a period of one year, beginning on July 20, 2009 and ending on July 19, 2010. The maximum potential future amount under the terms of the guarantee is RMB 63,200,000 (or $9,253,000) as of December 31, 2009. The loan was fully repaid on July 19, 2010.
|
|
(ii)
|
Feihe Dairy guaranteed the loans payable to a bank in the PRC for a period of one year, beginning on August 30, 2009 and ending on August 29, 2010. The maximum potential future amount under the terms of the guarantee is RMB 100,000,000 (or $14,641,000) as of December 31, 2009. The loans, amounting $2,925,174, $1,462,587 and $2,925,174, were fully repaid on August 30, September 28 and October 22, 2010.
|
|
(iii)
|
Gannan Feihe guaranteed the loans payable to a bank in the PRC for a period, beginning on July 26, 2010 and ending on the date which is two years after the maturity date or the date of repayment if earlier.
|
|
(iv)
|
Feihe Dairy guaranteed the loans payable to a bank in the PRC for a period of one year, beginning on September 15, 2010 and ending on September 14, 2011. The maximum potential future payment amount under the terms of the guarantee is RMB 35,000,000 (or $5,294,000) as of December 31, 2010.
|
|
(v)
|
Gannan Feihe guaranteed the loans payable to a bank in the PRC for a period, beginning on September 7, 2010 and ending on the date which is two years after the maturity date or the date of repayment if earlier.
|
|
(vi)
|
Feihe Dairy guaranteed the loans payable to a bank in the PRC for a period of two years, beginning on August 30, 2010 and ending on August 30, 2012. The maximum potential future payment amount under the terms of the guarantee is RMB 50,000,000 (or $7,562,000) as of December 31, 2010.
|
F-30
None of the short term bank loans have restrictions or covenants attached.
|
21. ACCRUED EXPENSES
|
Accrued expenses as of December 31, 2010 and 2009 consisted of the following:
|
|
2010
|
2009
|
||||||
|
US$
|
US$
|
|||||||
|
Accrued sales and marketing expenses
|
5,885,595
|
8,050,982
|
||||||
|
Other accrued expenses
|
551,303
|
314,263
|
||||||
|
6,436,898
|
8,365,245
|
|||||||
Accrued sales and marketing expenses include advertising, transportation costs and some allocation of sales department salaries.
|
22. ADVANCES FROM EMPLOYEES
|
Advances from employees represent temporary funding by employees to improve cash flow and working capital of the Company. The advances were unsecured, interest free and repayable within one year.
|
23. EMPLOYEE BENEFITS PAYABLE
|
The full-time employees of the Company’s subsidiaries that are incorporated in the PRC are entitled to staff welfare benefits, including pension benefits, medical care, unemployment insurance, employee housing fund and other welfare benefits. These companies are required to accrue for these benefits based on certain percentages of the employees’ income in accordance with the relevant regulations, and to make contributions to the state-sponsored pension and medical plans out of the amounts accrued for medical and pension benefits. The total amounts charged to the consolidated statements of operations for such employee benefits amounted to approximately $5,222,484, $2,396,382 and $1,893,632 for the years ended December 31, 2010, 2009 and 2008, respectively.
Effective January 1, 2007, the Company established the Feihe International, Inc. 401(k) Profit Sharing Plan and Trust (the “Plan”). The Plan is a discretionary defined contribution plan and covers substantially all employees who have attained the age of 21, have completed at least six months of service, and have worked a minimum of 1,000 hours in the past Plan or anniversary year.
Under provisions of the Plan, the Company, for any plan year, has contributed an amount equal to 100% of the participant’s contribution or 5% of the participant’s eligible compensation, whichever is less. The Company may, at its own discretion, make additional matching contributions to participants. Company contributions, net of forfeitures, amounted to $16,704, $32,599 and $12,545 for the years ended December 31, 2010, 2009 and 2008, respectively.
|
24. OTHER PAYABLE
|
Other payable as of December 31, 2010 and 2009 consisted of the following:
|
2010
|
2009
|
|||||||
|
US$
|
US$
|
|||||||
|
Payable for property, plant and equipment
|
23,473,721
|
12,220,117
|
||||||
|
Payable for purchase of biological assets
|
6,742,211
|
-
|
||||||
|
Payable for land use rights
|
1,001,325
|
1,082,590
|
||||||
|
Other tax payable
|
385,050
|
1,989,165
|
||||||
|
Deposits from distributors
|
2,057,685
|
1,604,165
|
||||||
|
Payable to local County Finance Bureaus (i)
|
2,144,650
|
1,781,430
|
||||||
|
Advance received from Yuanshengtai for purchase of biological assets
|
891,436
|
-
|
||||||
|
Dividend payable to noncontrolling interests
|
208,226
|
-
|
||||||
|
Payable to an unrelated party, due on demand
|
442,600
|
442,600
|
||||||
|
Others (ii)
|
8,610,200
|
5,334,993
|
||||||
|
45,957,104
|
24,455,060
|
|||||||
|
(i)
|
The Group received funding from the local County Finance Department for construction of the production facilities in the region and working capital usage. Although, no repayment terms were attached with the funds, the Group considers them to be unsecured, non-interest bearing loans from the County Finance Department that are repayable on demand.
|
|
(ii)
|
Other payables mainly include deposits received from logistics companies and milk collection stations, prepayment made by employees on behalf of the Group, advertising cost, and other miscellaneous payables.
|
F-31
25. LONG TERM BANK LOANS
Long term bank loans comprised of the following as of December 31, 2010 and 2009:
|
December 31,
2010
|
December 31,
2009
|
|||||||
|
US$
|
US$
|
|||||||
|
Loan payable to a bank in the PRC, bearing interest at 7.47%, unsecured, guaranteed by Feihe Dairy (i), and payable on maturity. The loan commenced in October 29, 2008 and matures on October 28, 2014
|
1,552,679
|
3,861,230
|
||||||
|
Loan payable to a bank in the PRC, bearing interest at 7.47%, secured by biological assets, guaranteed by Feihe Dairy (i), and payable on maturity. The loan commenced on October 29, 2008 and matures on September 24, 2014
|
4,062,434
|
3,928,509
|
||||||
|
Loan payable to a bank in the PRC, bearing interest at 7.47%, secured by biological assets, guaranteed by Feihe Dairy (i), and payable on maturity. The loan commenced on October 29, 2008 and matures on September 25, 2014
|
4,141,081
|
4,004,563
|
||||||
|
Loan payable to a bank in the PRC, bearing interest at 5.94%, secured by biological assets, guaranteed by Feihe Dairy (i) and payable on maturity. The loan commenced on June 29, 2009 and matures on October 28, 2014
|
7,143,289
|
6,907,798
|
||||||
|
Loan payable to a bank in the PRC, bearing interest at 5.94%, secured by biological assets, guaranteed by Feihe Dairy (i) and payable on maturity. The loan commenced on March 27, 2009 and matures on October 28, 2014
|
3,982,274
|
3,850,992
|
||||||
|
Loan payable to a bank in the PRC, bearing interest at six months London Interbank Offered Rate ("LIBOR") plus 1.95%, guaranteed by American Dairy Inc. The loan commenced on October 13, 2009 and matures on October 13, 2014 (ii)
|
-
|
4,023,790
|
||||||
|
Loan payable to a bank in the PRC, bearing interest at 5.76%, secured by land use rights, plant and machinery. The loan commenced on December 24, 2009 and matures on December 24, 2014
|
5,036,569
|
4,870,530
|
||||||
|
Loan payable to a bank in the PRC, bearing interest at 5.76%, guaranteed by Langfang Feihe and payable on maturity. The loan commenced on December 24, 2009 and matures on December 24, 2014
|
8,575,458
|
8,292,753
|
||||||
|
Loan payable to a bank in the PRC, bearing interest at 5.96%, secured by land use right of Gannan Feihe. The loan commenced on December 24, 2010 and matures on December 24, 2015
|
3,365,195
|
-
|
||||||
|
37,858,979
|
39,740,165
|
|||||||
|
Less: current portion of long term bank loans
|
(9,756,193
|
)
|
(7,312,935
|
)
|
||||
|
28,102,786
|
32,427,230
|
|||||||
|
(i)
|
In connection with the purchase of long-lived fixed assets of Kedong Farms, Feihe Dairy guaranteed the loans payable to a bank in the PRC for a period of one year, beginning on October 29, 2008 and ending on October 28, 2009. The maximum potential amount under the terms of the guarantee was $38,040,000 (or RMB 251,510,000).
|
|
(ii)
|
In October 2009, the Company entered into a loan agreement with a bank in the PRC for a principal amount of up to approximately $9.2 million for the purpose of financing the purchase of certain equipment. The loan bears interest at the six-month LIBOR rate plus 1.95%, with principal payable in 10 equal semi-annual installments and interest payable semi-annually. As of December 31, 2009, there was $4,023,790 in principal payable under this loan. The loan was fully repaid in June 2010.
|
Principal payments due by year for the next five years and thereafter on long term bank loans were as follows:
|
Year ended December 31,
|
Future
repayments
|
|||
|
US$
|
||||
|
2011
|
9,756,193
|
|||
|
2012
|
-
|
|||
|
2013
|
-
|
|||
|
2014
|
24,737,591
|
|||
|
2015
|
3,365,195
|
|||
|
37,858,979
|
||||
F-32
|
26. CONVERTIBLE DEBT
|
On October 3, 2006, pursuant to a subscription agreement, the Company issued an aggregate principal amount of $18,200,000 in 7.75% Convertible Notes due 2009 (the “2009 Notes”) and warrants to purchase up to an aggregate of 251,000 shares of common stock (the “Warrants”). The principal of the convertible debt was recorded as a liability upon issuance and subsequently measured at its accreted value, which approximates the cash outlay that would be due upon settlement, if not converted into common stock. The value of the warrants of $1,871,859 was recorded as a discount to the value of the 2009 Notes and was to be amortized to interest expense over the term of the 2009 Notes.
On November 12, 2008, the Company entered into an agreement with respect to the 2009 Notes pursuant to which the Company issued to holders of the 2009 Notes an aggregate amount of 216,639 shares of common stock ($2,881,299, excluding $720,000 accrued as of December 31, 2007) and such holders waived claims for additional payments under the registration rights agreement relating to the 2009 Notes. In connection with the agreement, the Company amended and restated the 2009 Notes (the “New 2009 Notes”), amended and restated the warrants issued therewith (the “New Warrants”), and amended the prior registration rights agreement.
In July, August and October 2009, the holders of the 2009 Notes elected to convert the 2009 Notes into common stock. In connection with these conversions, $18.2 million in principal and approximately $4.3 million in accrued interest on the 2009 Notes were converted into 1,549,122 shares of common stock at a conversion price of $14.50 per share. No 2009 Notes remained outstanding as of December 31, 2009.
Interest expense amounting to $nil, $1,144,301 and $1,558,738 was recognized during the years ended December 31, 2010, 2009 and 2008, respectively. Amortization of the 2009 Notes discount of $nil, $467,967 and $623,952 was recognized during the years ended December 31, 2010, 2009 and 2008, respectively.
Issuance costs of convertible debt are deferred and amortized on a straight-line basis over the life of the associated debt from the date of issuance. Such amortization is presented separately as deferred charges in "Other income (expenses)" on the Consolidated Statements of Operations.
27. CAPITAL LEASE OBLIGATION
In November 2009, the Group entered a six-year capital lease agreement for certain equipment under construction. The terms of the lease required an initial payment of RMB 5 million (or approximately $756,200) and required a RMB 1 million (or approximately $151,200) payment on January 30th of each year after successful completion of production quality tests. The installment and trial run of the equipment had been completed by December 31, 2010, and the equipment under the capital lease is depreciated over an estimated productive life of 14 years when placed into service after passing production quality tests. As of December 31, 2010 and 2009, the Group had $1,516,343 and $nil, respectively, of equipment subject to the capital lease obligation.
Minimum future lease payments under capital leases as of December 31, 2010, were as follows:
|
Future payments
US$
|
||||
|
2011
|
151,245 | |||
|
2012
|
151,245 | |||
|
2013
|
151,245 | |||
|
2014
|
151,245 | |||
|
2015
|
151,245 | |||
|
Total minimum lease payments as of December 31, 2010
|
756,225 | |||
|
Less amount representing interest
|
(106,988 | ) | ||
|
Net present value of minimum lease payments
|
649,237 | |||
|
Current portion of capital lease obligation
|
(116,770 | ) | ||
|
Non-current portion of capital lease obligation
|
532,467 | |||
The interest rate on the capital lease is 5.31%. There was $39,368 and $nil amortization of interest recorded for the years ended December 31, 2010 and 2009, respectively. Accumulated amortization was $39,368 and $nil as of December 31, 2010 and 2009, respectively.
F-33
|
28. RELATED PARTY TRANSACTIONS
|
|
(1)
|
Due from /to related parties
|
Due from/to related parties included in the consolidated balance sheets as of December 31, 2010 and 2009 comprised of the following:
|
2010
|
2009
|
|||||||
|
US$
|
US$
|
|||||||
|
Due from related parties:
|
||||||||
|
Due from Directors of the Group
|
52,735
|
60,978
|
||||||
|
Due from related companies
|
1,754,154
|
2,127,265
|
||||||
|
Total
|
1,806,889
|
2,188,243
|
||||||
|
2010
|
2009
|
|||||||
|
US$
|
US$
|
|||||||
|
Due to related parties:
|
||||||||
|
Due to Directors of the Group
|
30,249
|
29,252
|
||||||
|
Due to related companies
|
610
|
10,429,470
|
||||||
|
Loan payable to a related party
|
48,398
|
73,129
|
||||||
|
Total
|
79,257
|
10,531,851
|
||||||
Due from/to Directors of the Group
As part of normal business operation, Directors of the Group will from time to time incur routine expenses on behalf of the Group, or receive general advances from the Group for settlement of Group expenses, such as travel, meals, and other business expenses. The amounts advanced are settled periodically throughout the year and amounts outstanding at year end are short term in nature and due on demand. During 2010, advance to directors aggregated to $41,302 and repayments to directors aggregated to $49,545. During 2009, advance to directors aggregated to $272,170 and repayments to directors aggregated to $248,107.
As of December 31, 2010 and 2009, the Group had the following balances due from its Directors:
|
2010
|
2009
|
|||||||
|
US$
|
US$
|
|||||||
|
Leng You-Bin
|
34,466
|
33,823
|
||||||
|
Liu Hua
|
18,269
|
27,155
|
||||||
|
Total
|
52,735
|
60,978
|
||||||
As of December 31, 2010 and 2009, the Group had the following balances due to its Directors:
|
2010
|
2009
|
|||||||
|
US$
|
US$
|
|||||||
|
Leng You-Bin
|
30,249
|
29,252
|
||||||
|
Total
|
30,249
|
29,252
|
||||||
F-34
Due from/to related companies
Mr. Leng You-Bin is the Chairman, Chief Executive Officer, President, and General Manager of the Group. During the years ended December 31, 2010, 2009 and 2008, the Group had certain transactions with companies owned by close family members of Mr. Leng, including Yuanshengtai, which was partially owned by Mr. Leng and Liu Sheng-Hui, on an arm’s length basis. Those shares held by Mr. Leng and Liu Sheng-Hui have been transferred to unrelated third parties who held no ownership interests in Yuanshengtai in January 2010. Additionally, subsequent to such date, the Company ceased being a related party of the Group and, accordingly, the balance due to Yuanshengtai has been classified as other payables, as disclosed in Note 24.
As of December 31, 2010 and 2009, the Group had the following balances due from its related companies:
|
2010
|
2009
|
|||||||
|
US$
|
US$
|
|||||||
|
Tangshan Feihe Trading Company
|
1,727,719
|
1,897,078
|
||||||
|
Qinhuangdao Feihe Trading Company
|
26,435
|
230,187
|
||||||
|
Total
|
1,754,154
|
2,127,265
|
||||||
As of December 31, 2010 and 2009, the Group had the following balances due to its related companies consisting primarily of advances on cow purchases and payments for goods received in advance:
|
2010
|
2009
|
|||||||
|
US$
|
US$
|
|||||||
|
Heilongjiang Feihe Yuanshengtai Co., Ltd
|
-
|
10,428,246
|
||||||
|
Dalian Hewang Trading Company
|
610
|
1,224
|
||||||
|
Total
|
610
|
10,429,470
|
||||||
|
(2)
|
Sales to related parties
|
For the years ended December 31, 2010, 2009 and 2008, the Group made sales of goods to the following related companies:
|
2010
|
2009
|
2008 | ||||||||||
|
US$
|
US$
|
US$ | ||||||||||
|
Tangshan Feihe Trading Company
|
1,562,374
|
5,750,743
|
1,216,948
|
|||||||||
|
Qinhuangdao Feihe Trading Company
|
-
|
411,312
|
476,397
|
|||||||||
|
Dalian Hewang Trading Company
|
197,345
|
227,392
|
90,629
|
|||||||||
|
Total
|
1,759,719
|
6,389,447
|
1,738,974
|
|||||||||
Loan payable to a related party
The Group has an outstanding loan payable to a charitable organization set up by Leng You-Bin for under privileged children in the Heilongjiang province of the PRC, of $48,398 and $73,129 as of December 31, 2010 and 2009, respectively. The loan is unsecured and bears interest at 5.85% per annum and is payable on demand.
29. REDEEMABLE COMMON STOCK
On July 24, 2009, the Company entered into a Summary of Terms with Sequoia Capital China Growth Fund I, LP and certain of its affiliates and designees (collectively, “Sequoia”) in which Sequoia agreed to provide a 90-day bridge loan in the amount of $16 million. The bridge loan was funded on July 29, 2009. On August 26, 2009, pursuant to a subscription agreement (the “Subscription Agreement”) with Sequoia the Company issued 2.1 million shares of its common stock for an aggregate purchase price of $63 million, including $47 million in cash and the conversion of the $16 million bridge loan. On August 26, 2009, the Company also entered into a registration rights agreement with Sequoia with respect to the shares. Pursuant to the registration rights agreement, the Company filed a registration statement covering the resale of the securities issued or issuable pursuant to the Subscription Agreement, which the SEC declared effective in October 2009. The registration rights agreement also granted demand and piggy-back registration rights to Sequoia.
F-35
The Company issued 525,000 shares of redeemable common stock to Sequoia in March 2010 pursuant to a performance adjustment clause in a Subscription Agreement because the Company failed to meet certain performance targets set out in the Subscription Agreement as of December 31, 2009. The 525,000 shares issued to Sequoia were valued at $11,382,000 and recorded as a performance share obligation as of December 31, 2009 and were classified as redeemable common stock during the first quarter of 2010.
Under the terms of the Subscription Agreement, the common stock issued to Sequoia is redeemable, at the option of the holder, if at any time after the third anniversary of the issuance date the average share closing prices of the Company’s common stock for the period of fifteen consecutive trading days is less than $39 per share, for an amount equal to $31.20, subject to certain adjustments. Due to the redeemable nature of the common stock issued to Sequoia, the Company has classified the common stock as temporary equity upon issuance. When and if the redemption right expires the common stock will be classified as shareholders’ equity.
The Company assesses the probability of redemption and accrues proper accretion on a quarterly basis. As of December 31, 2010, management determined that the probability of redemption was high and recognized $1,086,622 as accretion premium.
|
2010
|
2009
|
|||||||
|
US$
|
US$
|
|||||||
|
Balance as of January 1
|
53,645,093
|
-
|
||||||
|
Issuance of shares for performance obligation
|
11,382,000
|
-
|
||||||
|
Accretion of redemption premium on redeemable common stock
|
1,086,622
|
|||||||
|
Balance as of December 31
|
66,113,715
|
53,645,093
|
||||||
|
30. SHARE-BASED COMPENSATION
|
Share Options
The Company has two stock option plans: the 2009 Stock Incentive Plan (the “2009 Plan”) and the 2003 Stock Incentive Plan (the “2003 Plan”). The Company applies authoritative guidance issued by FASB regarding share-based payments in accounting for the 2009 Plan and the 2003 Plan, which requires that compensation for services that a corporation receives through share-based compensation plans should be measured by the quoted market price of the stock at the measurement date less the amount, if any, that the individual is required to pay.
(1) 2009 Stock Incentive Plan
On May 7, 2009, the Company’s Board of Directors approved the 2009 Plan, which was approved by the Company’s shareholders at the Company’s 2009 Annual Meeting of Shareholders. The 2009 Plan permits grants of certain equity incentives, including incentive stock options, nonqualified stock options, restricted stock awards, performance stock awards and other equity-based compensation, to certain employees, directors, officers, consultants, agents, advisors and independent contractors of the Company and its subsidiaries. The total number of shares of the Company’s common stock initially authorized for issuance under the 2009 Plan is 2,000,000 plus any authorized shares that, as of May 7, 2009, were available for issuance under the Company’s 2003 Stock Incentive Plan.
F-36
On May 7, 2009, the Compensation Committee of the Board of Directors granted an aggregate of 2,073,190 performance stock options to certain officers and employees of the Company under the 2009 Plan. The performance stock option each has an exercise price of $16.86 and a contractual life of 6 years. The performance stock options will vest in two equal tranches on the fourth and fifth anniversaries of the date such options were granted, provided that the recipient has met the performance criteria established in accordance with the 2009 Plan, including performance targets that must be met in each of the Company’s 2009, 2010 and 2011 fiscal years, and the recipient continues to be an employee of, or service provider to, the Company or its subsidiaries at the time of the relevant vesting dates. If the performance criteria are not met, the shares that would otherwise vest on vesting dates are forfeited and cancelled.
The performance targets for the year ended December 31, 2009 were not met for most option recipients and for the year ended December 31, 2010 were not met for any option recipient. Accordingly, the options granted were to be forfeited and cancelled. In December, 2009, the performance targets were amended in order to limit the amount of options that would otherwise be forfeited and cancelled due to the failure to satisfy the annual performance goals to one-third of stock options granted for each of fiscal year 2009, 2010, and 2011. The incremental cost or benefit resulting from the modification is measured as the excess of the fair value of the modified award over the fair value of the original award immediately before its terms are modified and the effect on the number of instruments expected to vest. As a result of this modification, $610,054 and $1,511,623 in incremental compensation cost were recognized during the years ended December 31, 2010 and 2009. 421 employees were affected by this modification.
The fair value of the option awards are estimated on the date of grant using the Black-Scholes option valuation model to be $22,106,218, of which $ 610,054 and $1,511,623 were recorded as compensation expense in general and administrative expenses during the years ended December 31, 2010 and 2009, in accordance with the graded vesting attribution method. The valuation was based on the assumptions noted in the following table.
|
Expected volatility
|
74.94
|
%
|
||
|
Expected dividends
|
0
|
%
|
||
|
Expected term (in years)
|
5.25
|
|||
|
Risk-free rate
|
2.27
|
%
|
On October 15, 2009, an option to purchase 50,000 shares was granted to an employee that vests on the 12-month anniversary of the date of grant, conditioned upon continued employment on such date, and has an exercise price of $16 and contractual life of 4 years. The fair value of the option award is estimated on the date of grant using the Black-Scholes option valuation model to be $1,103,400, of which $867,395 and $236,005 were recorded as compensation cost in general and administrative expenses during the years ended December 31, 2010 and 2009. The valuation was based on the assumptions noted in the following table.
|
Expected volatility
|
93
|
%
|
||
|
Expected dividends
|
0
|
%
|
||
|
Expected term (in years)
|
2.5
|
|||
|
Risk-free rate
|
1.24
|
%
|
||
On October 23, 2009, the Compensation Committee of the Board of Directors granted an aggregate of 30,000 new performance stock options to an employee of the Company under the 2009 Plan. The performance stock options have an exercise price of $27.69 and a contractual life of 6 years and vest in two equal tranches on the fourth and fifth anniversaries of the date such options were granted, provided that the recipient has met the performance criteria established in accordance with the 2009 Plan, including performance targets that must be met in each of the Company’s 2009, 2010 and 2011 fiscal years, and the recipient continues to be an employee of, or service provider to, the Company or its subsidiaries at the time of the relevant vesting dates. If the performance criteria are not met, the options that would otherwise vest on the vesting dates are forfeited and cancelled.
The fair value of the option awards are estimated on the date of grant using the Black-Scholes option valuation model to be $565,900, of which$129,316 and $26,409 were recorded as compensation expense in general and administrative expenses during the years ended December 31, 2010 and 2009. The valuation was based on the assumptions noted in the following table.
F-37
|
Expected volatility
|
83
|
%
|
||
|
Expected dividends
|
0
|
%
|
||
|
Expected term (in years)
|
5.2
|
5
|
||
|
Risk-free rate
|
2.59
|
%
|
On August 27, 2010, options to purchase 84,000 shares were granted to directors of the Company for their services provided for the period from August 1, 2010 through July 31, 2011, that vests in four equal amounts on each three-month anniversary of the grant date until all such shares are fully vested. The options have an exercise price of $7.25 and a contract life of 2 years. The fair value of the option award is estimated on the date of grant using the Black-Scholes option valuation model to be $164,500, of which $103,508 was recorded as compensation cost in the general and administrative expenses during the year ended December 31, 2010. The valuation was based on the assumptions noted in the following table.
|
Expected volatility
|
54
|
%
|
||
|
Expected dividends
|
0
|
%
|
||
|
Expected term (in years)
|
0.
|
81
|
||
|
Risk-free rate
|
0.22
|
%
|
(2) 2003 Stock Incentive Plan
Effective May 7, 2003, the Company adopted and approved its 2003 Plan, which reserved 3,000,000 shares of common stock for issuance under the Plan. The Plan allows the Company to issue awards of incentive non-qualified stock options, stock appreciation rights, and stock bonuses to directors, officers, employees and consultants of the Company which may be subject to restrictions.
No stock appreciation rights have been issued under the 2003 Plan.
On October 15, 2008, an option to purchase 80,000 shares was granted to an employee that vests on the 12-month anniversary of the date of grant, conditioned upon continued employment on such date, and have an exercise price of $12.00 and a contractual life of 4 years. The fair value of the option award is estimated on the date of grant using the Black-Scholes option valuation model to be $562,758, of which $nil, $422,069 and $140,689 were recorded as compensation cost in the general and administrative expenses during the years ended December 31, 2010, 2009 and 2008. The valuation was based on the assumptions noted in the following table.
|
Expected volatility
|
90.7
|
%
|
||
|
Expected dividends
|
0
|
%
|
||
|
Expected term (in years)
|
2.5
|
|||
|
Risk-free rate
|
2.7
|
%
|
||
A summary of option activity under the 2009 and 2003 Plans as of December 31, 2010 and 2009 and movement during the years then ended were as follows:
|
Options
|
Weighted
average
grant date
fair value
|
Weighted
average
exercise price
|
Aggregate
intrinsic
value
|
Weighted
average
remaining
contractual
term
|
||||||||||||||||
|
US$
|
US$
|
US$
|
||||||||||||||||||
|
Outstanding as of January 1, 2009
|
80,000 | 7.03 | 12.00 | 243,200 | 3.83 | |||||||||||||||
|
Granted
|
2,153,190 | 11.04 | 16.99 | - | - | |||||||||||||||
|
Exercised
|
- | - | - | - | - | |||||||||||||||
|
Forfeited or expired
|
(748,536 | ) | 10.66 | 16.86 | - | - | ||||||||||||||
|
Outstanding as of December 31, 2009
|
1,484,654 | 11.02 | 16.79 | 7,443,232 | 5.15 | |||||||||||||||
|
Granted
|
84,000 | 1.96 | 7.25 | 71,190 | 1.76 | |||||||||||||||
|
Exercised
|
(8,000 | ) | 7.03 | 12.00 | 63,120 | - | ||||||||||||||
|
Forfeited or expired
|
(704,409 | ) | 10.66 | 16.86 | - | - | ||||||||||||||
|
Outstanding as of December 31, 2010
|
856,245 | 10.45 | 15.84 | 71,190 | 3.97 | |||||||||||||||
|
Exercisable as of December 31, 2010
|
143,000 | 11.54 | 12.70 | 71,190 | 2.39 | |||||||||||||||
F-38
A summary of the status of the Company’s non-vested options as of December 31, 2010 and 2009, and movements during the two years then ended were as follows:
|
Options
|
Weighted average
granted date fair
value
|
|||||||
|
US$
|
||||||||
|
Non-vested as of January 1, 2009
|
80,000
|
7.03
|
||||||
|
Granted
|
2,153,190
|
11.04
|
||||||
|
Vested
|
(80,000
|
)
|
7.03
|
|||||
|
Forfeited or expired
|
(748,536
|
)
|
10.66
|
|||||
|
Non-vested as of December 31, 2009
|
1,404,654
|
11.25
|
||||||
|
Granted
|
84,000
|
1.96
|
||||||
|
Vested
|
(71,000
|
)
|
16.12
|
|||||
|
Forfeited or expired
|
(704,409
|
)
|
10.66
|
|||||
|
Non-vested as of December 31, 2010
|
713,245
|
10.24
|
||||||
As of December 31, 2010, there was a total of $4,295,032 of unrecognized compensation cost related to non-vested share-based compensation granted under the 2003 and 2009 Plans. The cost is expected to be recognized over various periods of ranging from 7 months to 55 months.
(3) Warrants
As of December 31, 2010, the Company had 237,937 warrants outstanding with a weighted average remaining contractual life of 1.8 years and a weighted average exercise price of $14.50 per warrant, which were issued in connection with the 2009 Notes disclosed in Note 26. The warrants will expire on October 4, 2012.
During the years ended December 31, 2010, 2009 and 2008, nil, 804,347 and 3,000 warrants, respectively, were exercised at various exercise prices, resulting in proceeds of $nil, $1,838,469 and $6,750, respectively, to the Company.
|
Warrants
|
Average
exercise
Price
|
|||||||
|
US$
|
||||||||
|
Outstanding warrants as of January 1, 2009
|
1,050,984
|
5.06
|
||||||
|
Exercised
|
(804,347
|
)
|
2.29
|
|||||
|
Expired
|
(8,700
|
)
|
1.50
|
|||||
|
Outstanding warrants as of December 31, 2009
|
237,937
|
14.50
|
||||||
|
Exercised
|
-
|
-
|
||||||
|
Expired
|
-
|
-
|
||||||
|
Outstanding warrants as of December 31, 2010
|
237,937
|
14.50
|
||||||
F-39
|
31. STATUTORY RESERVES
|
Relevant PRC laws and regulations permit payments of dividends by the Company’s PRC subsidiaries and affiliates only out of their retained earnings, if any, as determined in accordance with the PRC accounting standards and regulations. In addition, the statutory general reserve fund requires annual appropriations of 10% of net after-tax income should be set aside prior to payment of any dividends. The appropriations to statutory general reserve are required until the balance reaches 50% of the PRC entity registered capital. As a result of these and other restrictions under PRC laws and regulations, the PRC subsidiaries and affiliates are restricted in their ability to transfer a portion of their net assets to the Company either in the form of dividends, loans or advances. For the years ended December 31, 2010 and 2009, the Group made appropriations of $2,271,357 and nil to the statutory general reserve fund, respectively.
|
32. COMMITMENTS AND CONTINGENCIES
|
(1) Operating lease arrangements
The Group has entered into leasing arrangements relating to office premises and computer equipment that are classified as operating leases. There were no minimum future rental payments under non-cancellable operating leases having remaining terms in excess of one year.
Rent expenses incurred and expensed to consolidated statements of operations during the years ended December 31, 2010, 2009 and 2008 amounted to $473,381, $461,247 and $120,704, respectively.
(2) Capital commitments
Capital commitments for purchase of property, plant and equipment as of December 31, 2010 were $5,097,881.
(3) Purchase commitments
The Group has certain purchase commitments of $7,028,019 over five years relating to packaging materials in connection with the capital lease obligation disclosed in Note 27.
(4) Land use rights
All lands in the PRC are state-owned and no individual land ownership rights exist. The Group has obtained land use right certificates for the land on which its facilities are located, except that Langfang Feihe is in the process of obtaining such a certificate.
Feihe Dairy entered into a land use right contract on January 13, 2006 with the Bureau of Land and Real Estate of Langfang Economic and Technology Development Zone in Hebei Province, the PRC, as amended by a supplementary contract dated January 13, 2006, which sets forth rights to use the land on which Langfang Feihe's facilities are located. Feihe Dairy is applying to assign its rights under the contract to Langfang Feihe. Management believes that this contract adequately evidences Langfang Feihe's right to use the land, and that there should be no legal obstacle to Langfang Feihe's use of the land or obtaining a certificate of land use right. However, in the event that Langfang Feihe fails to obtain such a certificate, there is a risk that the PRC government may deem Langfang Feihe's operations illegitimate or impose penalties and fines. While present, however, management believes that this possibility is remote.
(4) Other assets
Substantially all of the Group’s assets and operations are located in the PRC. The Company has purchased insurance for certain kind of loss on biological assets, other than that it is self-insured for all risks.
|
33. SEGMENTS
|
In accordance with authoritative guidance issued by the FASB regarding disclosures about segments of an enterprise and related information, based upon the manner in which internal financial information is produced and evaluated by the Group’s chief operating decision maker, the Group has determined that it has two reportable segments: dairy products and dairy farm. The dairy products segment produces and sells dairy products, such as wholesale and retail milk powders, as well as soybean powder, rice cereal, walnut powder and walnut oil. The dairy farm segment operates the Group's two dairy farms in the PRC, construction of which was completed in the fourth quarter of 2009. The Group's two dairy farms provide milk to the Group. As the Group primarily generates its revenues from customers in the PRC and all of the Group's long-lived assets are located in the PRC, no geographical segments are presented.
F-40
The segment information for the reportable segments for the year ended December 31, 2010 was as follows:
|
Dairy products
|
Dairy farms
|
Corporate
|
Total
|
|||||||||||||
|
US$
|
US$
|
US$
|
US$
|
|||||||||||||
|
Sales from external customers
|
255,838,176
|
1,261,472
|
-
|
257,099,648
|
||||||||||||
|
Intersegment sales
|
776,152
|
27,151,876
|
-
|
27,928,028
|
||||||||||||
|
Interest income
|
287,968
|
6,947
|
-
|
294,915
|
||||||||||||
|
Interest expenses
|
2,009,925
|
505,142
|
1,358
|
2,516,425
|
||||||||||||
|
Depreciation and amortization
|
6,277,965
|
6,673,783
|
-
|
12,951,748
|
||||||||||||
|
Income tax
|
(11,993
|
)
|
-
|
(267,729
|
)
|
(279,722
|
)
|
|||||||||
|
Segment profit (loss)
|
576,902
|
(6,340,883
|
)
|
(4,410,996
|
)
|
(10,174,977
|
)
|
|||||||||
|
Segment assets
|
507,923,238
|
175,090,984
|
191,724,270
|
874,738,492
|
||||||||||||
|
Goodwill
|
445,842
|
-
|
-
|
445,842
|
||||||||||||
|
Addition to property, plant and equipment
|
32,660,079
|
5,318,045
|
-
|
37,978,124
|
||||||||||||
|
Addition to biological assets
|
-
|
22,543,420
|
-
|
22,543,420
|
||||||||||||
The segment information for the reportable segments for the year ended December 31, 2009 was as follows:
|
Dairy products
|
Dairy farms
|
Corporate
|
Total
|
|||||||||||||
|
US$
|
US$
|
US$
|
US$
|
|||||||||||||
|
Sales from external customers
|
271,077,948
|
-
|
-
|
271,077,948
|
||||||||||||
|
Intersegment sales
|
-
|
10,616,132
|
-
|
10,616,132
|
||||||||||||
|
Interest income
|
294,815
|
11,876
|
-
|
306,691
|
||||||||||||
|
Interest expenses
|
909,469
|
2,283
|
5,227,400
|
6,139,152
|
||||||||||||
|
Depreciation and amortization
|
5,800,112
|
2,680,230
|
-
|
8,480,342
|
||||||||||||
|
Income tax
|
(2,501,269
|
)
|
-
|
1,755,071
|
(746,198
|
)
|
||||||||||
|
Segment profit (loss)
|
30,634,469
|
(2,788,614
|
)
|
11,081,075
|
38,926,930
|
|||||||||||
|
Segment assets
|
468,919,425
|
151,112,953
|
190,001,003
|
810,033,381
|
||||||||||||
|
Goodwill
|
1,784,331
|
-
|
-
|
1,784,331
|
||||||||||||
|
Addition to property, plant and equipment
|
16,933,506
|
53,839,077
|
-
|
70,772,583
|
||||||||||||
|
Addition to biological assets
|
-
|
27,528,114
|
-
|
27,528,114
|
||||||||||||
F-41
The segment information for the reportable segments for the year ended December 31, 2008 was as follows:
|
Dairy products
|
Dairy farms
|
Corporate
|
Total
|
|||||||||||||
|
US$
|
US$
|
US$
|
US$
|
|||||||||||||
|
Sales from external customers
|
193,191,710
|
-
|
-
|
193,191,710
|
||||||||||||
|
Intersegment sales
|
-
|
91,299
|
-
|
91,299
|
||||||||||||
|
Interest income
|
254,457
|
5,242
|
320,025
|
579,724
|
||||||||||||
|
Interest expenses
|
1,041,447
|
183
|
18,401,184
|
19,442,814
|
||||||||||||
|
Depreciation and amortization
|
4,936,788
|
384,031
|
-
|
5,320,819
|
||||||||||||
|
Income tax
|
3,536,373
|
24,939
|
5,823
|
3,567,135
|
||||||||||||
|
Segment profit (loss)
|
21,266,451
|
(1,182,203
|
)
|
7,208,685
|
27,292,933
|
|||||||||||
|
Segment assets
|
385,536,806
|
89,175,716
|
188,428,520
|
663,141,042
|
||||||||||||
|
Goodwill
|
2,282,838
|
-
|
-
|
2,282,838
|
||||||||||||
|
Addition to property, plant and equipment
|
8,350,555
|
22,756,584
|
-
|
31,107,139
|
||||||||||||
|
Addition to biological assets
|
-
|
25,568,188
|
-
|
25,568,188
|
||||||||||||
The following table reflects the sales of the Company’s principal products during the fiscal years ended December 31, 2010, 2009 and 2008:
|
|
|
2010
|
|
2009
|
|
2008
|
||||||||||||||||||||||||||||||
|
Product name
|
|
Quantity
(Kg’000)
|
|
Amount
($’000)
|
|
% of
Sales
|
|
Quantity
(Kg’000)
|
|
Amount
($’000)
|
|
% of
Sales
|
|
Quantity
(Kg’000)
|
|
Amount
($’000)
|
|
% of Sales
|
||||||||||||||||||
|
|
|
|
|
|
|
|
|
|
|
|
|
|
|
|
|
|
|
|
|
|
|
|
|
|
|
|
|
|||||||||
|
Milk powder
|
|
|
22,816
|
180,218
|
70.1
|
|
|
|
28,783
|
|
|
|
216,230
|
|
|
|
79.8
|
|
|
|
16,311
|
121,255
|
62.8
|
|
||||||||||||
|
Raw milk powder
|
|
|
15,691
|
57,752
|
22.5
|
|
|
|
11,637
|
|
|
|
34,328
|
|
|
|
12.7
|
|
|
|
16,572
|
|
|
|
60,753
|
|
|
|
31.4
|
|
||||||
|
Soybean powder
|
|
|
4,917
|
10,812
|
4.2
|
|
|
|
3,349
|
|
|
|
7,319
|
|
|
|
2.7
|
|
|
|
2,153
|
|
|
|
4,400
|
|
|
|
2.3
|
|
||||||
|
Rice cereal
|
|
|
633
|
4,040
|
1.6
|
|
|
|
1,103
|
|
|
|
6,730
|
|
|
|
2.5
|
|
|
|
816
|
|
|
|
4,631
|
|
|
|
2.4
|
|
||||||
|
Walnut products
|
|
|
263
|
1,511
|
0.6
|
|
|
|
601
|
|
|
|
3,070
|
|
|
|
1.1
|
|
|
|
327
|
|
|
|
1,663
|
|
|
|
0.9
|
|||||||
|
Other
|
|
|
2,207
|
2,767
|
1.0
|
|
|
|
543
|
|
|
|
3,401
|
|
|
|
1.2
|
|
|
|
727
|
|
|
|
490
|
|
|
|
0.2
|
|||||||
|
Total
|
|
|
46,527
|
257,100
|
100
|
|
|
|
46,016
|
|
|
|
271,078
|
|
|
|
100
|
|
|
|
36,906
|
|
|
|
193,192
|
|
|
|
100
|
|||||||
A reconciliation of reportable segment sales, profit, and assets, to the Group's totals was as follows:
| For the years ended December 31, | ||||||||||||
|
2010
|
2009
|
2008
|
||||||||||
|
US$
|
US$
|
US$
|
||||||||||
|
Sales
|
||||||||||||
|
Total sales for reportable segments
|
285,027,676 | 281,694,080 | 193,283,009 | |||||||||
|
Elimination of intersegment sales
|
(27,928,028 | ) | (10,616,132 | ) | (91,299 | ) | ||||||
|
Total consolidated sales
|
257,099,648 | 271,077,948 | 193,191,710 | |||||||||
|
2010
|
2009
|
2008
|
||||||||||
|
US$
|
US$
|
US$
|
||||||||||
|
Profit
|
||||||||||||
|
Total profit for reportable segments
|
(10,174,977 | ) | 38,926,930 | 27,292,933 | ||||||||
|
Elimination of dividend
|
- | (23,499,920 | ) | (12,999,960 | ) | |||||||
|
Elimination of unrealized profit
|
- | - | (156,212 | ) | ||||||||
|
Income from continuing operations before income taxes and noncontrolling interest
|
(10,174,977 | ) | 15,427,010 | 14,136,761 | ||||||||
| As of December 31, | ||||||||
|
2010
|
2009
|
|||||||
|
US$
|
US$
|
|||||||
|
Assets
|
||||||||
|
Total assets for reportable segments
|
874,738,492
|
810,033,381
|
||||||
|
Elimination of intercompany receivables
|
(289,620,816
|
)
|
(249,519,304
|
)
|
||||
|
Elimination of investment
|
(120,808,394
|
)
|
(120,256,340
|
)
|
||||
|
Total assets
|
464,309,282
|
440,257,737
|
||||||
|
34. SUBSEQUENT EVENTS
|
Redemption Agreement with Sequoia
On February 1, 2011, the Company entered into a redemption agreement (the “Redemption Agreement”) with Sequoia, pursuant to which the Company agreed to redeem and purchase from Sequoia an aggregate of 2,625,000 shares (the “Shares”) of the Company's common stock. The Shares were originally issued to Sequoia pursuant to the Subscription Agreement with the Company entered into in August 2009, which, among other things, granted Sequoia a right to have the Shares redeemed if the average of closing prices of the Company's common stock for the fifteen trading days commencing on the third anniversary of the closing date is less than $39.00 per share. Pursuant to the Redemption Agreement, the Shares will be redeemed in four equal installments on or around March 31, 2011, September 30, 2011, December 31, 2011 and March 31, 2012 (each, a “Closing Date”), for an aggregate payment on each Closing Date of $15,750,000, together with interest accruing at the rate of 1.5% per annum, compounded annually from August 27, 2009 until such Closing Date. As a result of the Redemption Agreement, the redeemable common stock became mandatorily redeemable and will be reclassified into liabilities at its fair value with any differences between fair value and carrying value recognized in equity.
F-42
Feihe International, Inc.
Additional Information – Financial Statement Schedule I
Condensed Financial Information of Parent Company Balance Sheets
|
December 31,
2010
|
December 31,
2009
|
|||||||
|
US$
|
US$
|
|||||||
|
Assets
|
||||||||
|
Current assets:
|
||||||||
|
Cash and cash equivalents
|
64,612
|
964,373
|
||||||
|
Notes receivable, net of allowance for doubtful accounts of $3,500,028 and $4,000,000, as of December 31, 2010 and 2009, respectively
|
-
|
-
|
||||||
|
Due from related parties
|
-
|
3,496
|
||||||
|
Other receivables
|
1,598
|
151,566
|
||||||
|
Income tax receivable
|
670 | - | ||||||
|
Prepayments
|
-
|
29,167
|
||||||
|
Total current assets
|
66,880
|
1,148,602
|
||||||
|
Other assets:
|
||||||||
|
Due from subsidiaries
|
84,066,057
|
84,563,276
|
||||||
|
Investment in subsidiaries
|
145,471,859
|
144,951,533
|
||||||
|
Total assets
|
229,604,796
|
230,663,411
|
||||||
|
Liabilities
|
||||||||
|
Current liabilities:
|
||||||||
|
Accounts payable
|
478,239
|
964,612
|
||||||
|
Other payable
|
442,600
|
442,600
|
||||||
|
Income tax payable
|
-
|
267,058
|
||||||
|
Total current liabilities
|
920,839
|
1,674,270
|
||||||
|
Due to subsidiaries
|
652,412
|
-
|
||||||
| Unrecognized tax benefits - non-currents | 246,374 | 1,500,518 | ||||||
|
Performance share obligation
|
-
|
11,382,000
|
||||||
|
Total liabilities
|
1,819,625
|
14,556,788
|
||||||
|
Redeemable common stock (US$0.001 par value, 2,625,000 and
2,100,000 shares issued and outstanding as of December 31, 2010 and
2009, respectively)
|
66,113,715
|
53,645,093
|
||||||
|
Shareholders’ equity
|
161,671,456
|
162,461,530
|
||||||
|
Total liabilities, redeemable common stock and equity
|
229,604,796
|
230,663,411
|
||||||
F-43
Feihe International, Inc.
Additional Information – Financial Statement Schedule I
Condensed Financial Information of Parent Company Statements of Operations
|
For the years ended December 31,
|
||||||||||||
|
2010
|
2009
|
2008
|
||||||||||
|
US$
|
US$
|
US$
|
||||||||||
|
General and administrative
|
(4,422,488 | ) | (6,371,616 | ) | (7,620,468 | ) | ||||||
|
Operating (loss)
|
(4,422,488 | ) | (6,371,616 | ) | (7,620,468 | ) | ||||||
|
Other operating income, net
|
12,851 | 1,449,566 | - | |||||||||
|
Other income (expenses):
|
||||||||||||
|
Interest income
|
- | - | 320,025 | |||||||||
|
Interest and finance costs
|
(1,361 | ) | (5,227,400 | ) | (17,744,639 | ) | ||||||
|
Amortization of deferred charges
|
- | (107,396 | ) | (532,904 | ) | |||||||
|
Registration rights penalty
|
- | - | (2,389,077 | ) | ||||||||
|
Gain on extinguishment of debt
|
- | - | 30,497,268 | |||||||||
|
Loss on derivatives
|
- | (2,162,000 | ) | (8,321,481 | ) | |||||||
|
(Loss) before income tax expenses
|
(4,410,998 | ) | (12,418,846 | ) | (5,791,276 | ) | ||||||
|
Income tax (benefits) expenses
|
(267,729 | ) | 1,755,071 | 5,823 | ||||||||
|
(Loss) from continuing operations
|
(4,143,269 | ) | (14,173,917 | ) | (5,797,099 | ) | ||||||
|
Equity in (losses) earnings of subsidiaries
|
(5,440,602 | ) | 33,755,303 | 22,820,134 | ||||||||
|
Net (loss) income
|
(9,583,871 | ) | 19,581,386 | 17,023,035 | ||||||||
|
Accretion of redemption premium on redeemable common stock
|
(1,086,622 | ) | - | - | ||||||||
|
Net (loss) income attributable to common
shareholders of Feihe International, Inc.
|
(10,670,493 | ) | 19,581,386 | 17,023,035 | ||||||||
F-44
Feihe International, Inc.
Additional Information – Financial Statement Schedule I
Condensed Financial Information of Parent Company
Statements of Changes in Shareholders’ Equity and Comprehensive Income (Loss)
|
Common Stock
|
||||||||||||||||||||||||||||||||
|
(US$0.001 par value)
|
Accumulated
|
|||||||||||||||||||||||||||||||
|
Number
|
Additional
|
Common
|
Other
|
Total
|
||||||||||||||||||||||||||||
|
of
|
Par
|
Paid-in
|
Stock
|
Comprehensive
|
Retained
|
Total
|
Comprehensive
|
|||||||||||||||||||||||||
|
Shares
|
Value
|
Capital
|
Warrants
|
Income
|
Earnings
|
Equity
|
Income (Loss)
|
|||||||||||||||||||||||||
|
US$
|
US$
|
US$
|
US$
|
US$
|
US$
|
US$ | ||||||||||||||||||||||||||
|
Balance as of January 1, 2008
|
16,961,768 | 16,961 | 22,629,333 | 3,011,444 | 12,081,467 | 43,929,682 | 81,668,887 | |||||||||||||||||||||||||
|
Warrant exercise
|
3,000 | 3 | 14,743 | (7,996 | ) | - | - | 6,750 | ||||||||||||||||||||||||
|
Shares issued for services
|
72,500 | 73 | 1,092,578 | - | - | - | 1,092,651 | |||||||||||||||||||||||||
|
Shares issued for notes conversion
|
216,639 | 217 | 2,881,082 | - | - | - | 2,881,299 | |||||||||||||||||||||||||
|
Stock compensation
|
- | - | 140,689 | - | - | - | 140,689 | |||||||||||||||||||||||||
|
Net income
|
- | - | - | - | - | 17,023,035 | 17,023,035 | 17,023,035 | ||||||||||||||||||||||||
|
Currency translation adjustments
|
- | - | - | - | 13,169,453 | - | 13,169,453 | 13,169,453 | ||||||||||||||||||||||||
|
Change in fair value of available-for- sale investments
|
- | - | - | - | (104,865 | ) | - | (104,865 | ) | (104,865 | ) | |||||||||||||||||||||
|
Comprehensive income
|
30,087,623 | |||||||||||||||||||||||||||||||
|
Balance as of December 31, 2008
|
17,253,907 | 17,254 | 26,758,425 | 3,003,448 | 25,146,055 | 60,952,717 | 115,877,899 | |||||||||||||||||||||||||
|
Warrant exercise
|
804,347 | 804 | 3,066,962 | (1,229,297 | ) | - | - | 1,838,469 | ||||||||||||||||||||||||
|
Stock compensation
|
- | - | 2,196,106 | - | - | - | 2,196,106 | |||||||||||||||||||||||||
|
Shares issued for notes conversion
|
1,549,122 | 1,549 | 22,460,605 | - | - | - | 22,462,154 | |||||||||||||||||||||||||
|
Net income
|
- | - | - | - | - | 19,581,386 | 19,581,386 | 19,581,386 | ||||||||||||||||||||||||
|
Currency translation adjustments
|
- | - | - | - | 446,554 | - | 446,554 | 446,554 | ||||||||||||||||||||||||
|
Change in fair value of available-for-sale investment
|
- | - | - | - | 58,962 | - | 58,962 | 58,962 | ||||||||||||||||||||||||
|
Comprehensive income
|
20,086,902 | |||||||||||||||||||||||||||||||
|
Balance as of December 31, 2009
|
19,607,376 | 19,607 | 54,482,098 | 1,774,151 | 25,651,571 | 80,534,103 | 162,461,530 | |||||||||||||||||||||||||
|
Shares issued for services
|
55,915 | 56 | 889,318 | - | - | - | 889,374 | |||||||||||||||||||||||||
|
Stock compensation
|
- | - | 1,710,272 | - | - | - | 1,710,272 | |||||||||||||||||||||||||
|
Issuance of common stock in connection with exercise of options
|
8,000 | 8 | 95,992 | - | - | - | 96,000 | |||||||||||||||||||||||||
|
Net loss
|
- | - | - | - | - | (9,583,871 | ) | (9,583,871 | ) | (9,583,871 | ) | |||||||||||||||||||||
|
Accretion of redemption premium on redeemable common stock
|
- | - | - | - | - | (1,086,622 | ) | (1,086,622 | ) | |||||||||||||||||||||||
|
Currency translation adjustments
|
- | - | - | - | 7,181,945 | - | 7,181,945 | 7,181,945 | ||||||||||||||||||||||||
|
Change in fair value of available-for- sale investment
|
- | - | - | - | 2,828 | - | 2,828 | 2,828 | ||||||||||||||||||||||||
|
Comprehensive loss
|
(2,399,098 | ) | ||||||||||||||||||||||||||||||
|
Balance as of December 31, 2010
|
19,671,291 | 19,671 | 57,177,680 | 1,774,151 | 32,836,344 | 69,863,610 | 161,671,456 | |||||||||||||||||||||||||
F-45
Feihe International, Inc.
Additional Information – Financial Statement Schedule I
Condensed Financial Information of Parent Company Statements of Cash Flows
|
For the years ended December 31,
|
||||||||||||
|
2010
|
2009
|
2008
|
||||||||||
|
US$
|
US$
|
US$
|
||||||||||
|
Cash flows from operating activities:
|
||||||||||||
|
Net (loss) income
|
(9,583,871
|
)
|
19,581,386
|
17,023,035
|
||||||||
|
Adjustments to reconcile net (loss) income to net cash (used in) provided by operating activities:
|
||||||||||||
|
Equity in earnings (losses) of subsidiaries
|
5,440,602
|
(33,755,303
|
)
|
(22,820,134
|
)
|
|||||||
|
Gain on debt extinguishment
|
-
|
-
|
(30,497,268
|
)
|
||||||||
|
Share-based compensation
|
2,599,646
|
2,196,106
|
1,233,339
|
|||||||||
|
Registration rights penalty paid in shares
|
-
|
-
|
2,881,299
|
|||||||||
|
Interest expense from accrual of guaranteed redemption value
|
-
|
-
|
13,584,533
|
|||||||||
|
Interest expense from amortization of note discounts
|
-
|
5,129,617
|
8,028,585
|
|||||||||
|
Gain on waived interest expense
|
-
|
(550,000
|
)
|
-
|
||||||||
|
Loss on derivatives
|
-
|
2,162,000
|
8,321,481
|
|||||||||
|
Amortization of deferred charges
|
-
|
107,396
|
532,904
|
|||||||||
|
Changes in assets and liabilities:
|
||||||||||||
|
Decrease in due from related parties
|
500,716
|
9,159
|
28,128
|
|||||||||
|
Decrease (increase) in other receivable, prepayments and other assets
|
179,137
|
(150,000
|
)
|
348,483
|
||||||||
|
(Decrease) increase in accounts payable
|
(486,374
|
)
|
(2,800,499
|
)
|
3,376,451
|
|||||||
|
Increase in accrued expenses, other payable and income taxes payable
|
956,115
|
667,601
|
1,928,826
|
|||||||||
|
Increase (decrease) in due to subsidiaries
|
652,412
|
(3,080,474
|
)
|
205,066
|
||||||||
|
(Decrease) increase of unrecognized tax benefits - non-current
|
(1,254,144 | ) | 1,500,518 | - | ||||||||
|
Net cash (used in) provided by operating activities
|
(995,761
|
)
|
(8,982,493
|
)
|
4,174,728
|
|||||||
|
Cash flows from investing activities:
|
||||||||||||
|
Capitalized interest in long term assets
|
-
|
2,528,844
|
-
|
|||||||||
|
Increase in due from subsidiaries
|
-
|
(497,219
|
)
|
(6,196,209
|
)
|
|||||||
|
Dividend distributed from subsidiaries
|
-
|
23,499,920
|
12,999,960
|
|||||||||
|
Net cash provided by investing activities
|
-
|
25,531,545
|
6,803,751
|
|||||||||
|
Cash flows from financing activities:
|
||||||||||||
|
Repayment of short term debt
|
-
|
(80,450,000
|
)
|
(11,000,000
|
)
|
|||||||
|
Proceeds from issuance of redeemable common stock
|
-
|
62,865,093
|
-
|
|||||||||
|
Proceeds from option exercise
|
96,000
|
-
|
-
|
|||||||||
|
Proceeds from warrant exercise
|
-
|
1,838,469
|
6,750
|
|||||||||
|
Net cash provided by (used in) financing activities
|
96,000
|
(15,746,438
|
)
|
(10,993,250
|
)
|
|||||||
|
Effect of exchange rate changes on cash
|
-
|
-
|
-
|
|||||||||
|
Net (decrease) increase in cash and cash equivalents
|
(899,761
|
)
|
802,614
|
(14,771
|
)
|
|||||||
|
Cash and cash equivalents, beginning of year
|
964,373
|
161,759
|
176,530
|
|||||||||
|
Cash and cash equivalents, end of year
|
64,612
|
964,373
|
161,759
|
|||||||||
BASIS FOR PREPARATION
The condensed financial information of the parent company, Feihe International, Inc., only has been prepared using the same accounting policies as set out in the Group's consolidated financial statements except that the parent company has used equity method to account for its investment in its subsidiaries.
F-46