Attached files
| file | filename |
|---|---|
| 8-K - PRESENTATION OF THOMAS PROPERTIES GROUP, INC. DATED APRIL 2011 - THOMAS PROPERTIES GROUP INC | tpgi8k040511slidepresentat.htm |
Exhibit 99.1
PRESENTATION OF THOMAS PROPERTIES GROUP, INC.
DATED AS OF APRIL 2011
Thomas Properties Group, Inc.
April 2011
Forward Looking Statements
This presentation contains forward-looking statements that are not historical facts. These statements include management’s expectations with respect to future events and trends that may affect the Company’s business and results of operations, and are subject to risks and uncertainties. Actual results may differ from those expected in the forward-looking statements. You are advised to review the reports filed by Thomas Properties Group, Inc. with the Securities and Exchange Commission for additional information regarding some of the factors that may affect the Company’s business and results of operations.
Investment Highlights
Class A, Institutional Quality Office Portfolio
Seasoned Management Team with Superior Leasing Platform
Strong Partnerships with Leading Institutional Investors
Attractive Valuation
Internal and External Growth Opportunities
Significant Insider Ownership
Overview
Fully integrated institutional real estate platform, which owns, acquires, operates and selectively redevelops Class A office properties
Strong management team has extensive experience together across multiple economic cycles, and strong alignment of interest with shareholders
Own interests in and manage 24 operating properties with 12.6 million square feet, and provide asset management services on behalf of third parties for an additional four operating properties with 2.3 million square feet
Reliable investment management business includes programmatic joint ventures and funds with institutional partners
Highly regarded development team with expertise to take advantage of selective development and redevelopment opportunities
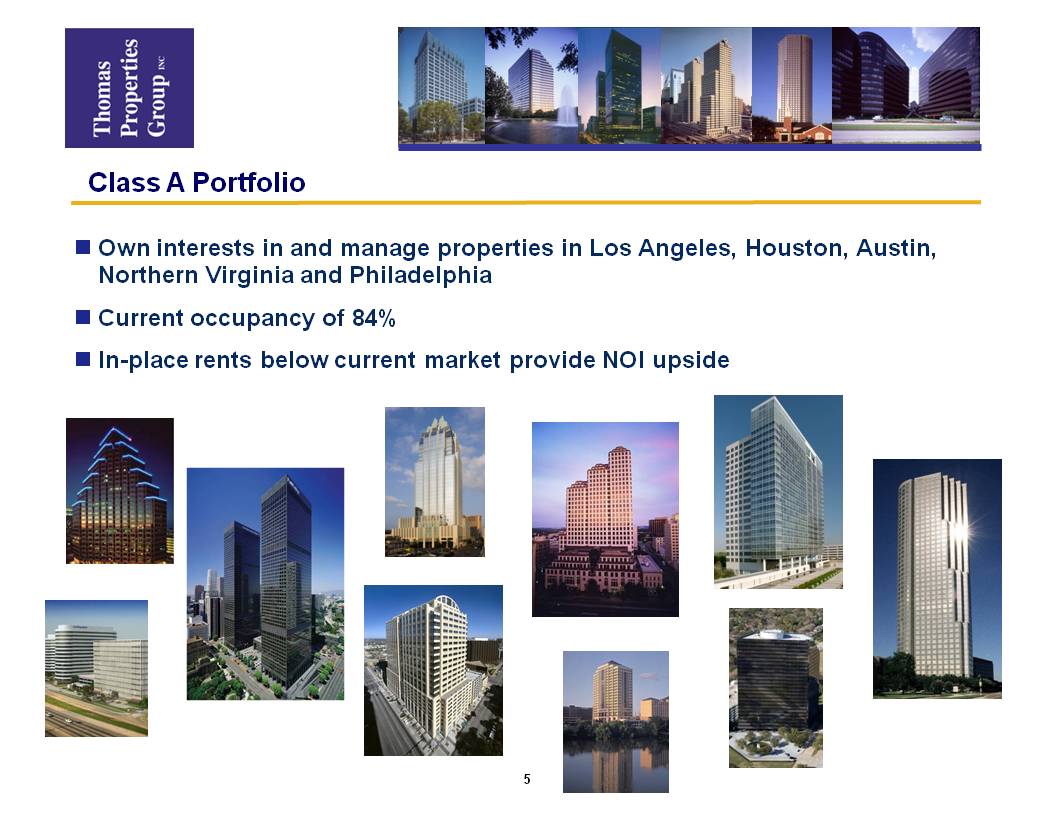
Class A Portfolio
Own interests in and manage properties in Los Angeles, Houston, Austin, Northern Virginia and Philadelphia
Current occupancy of 84%
In-place rents below current market provide NOI upside
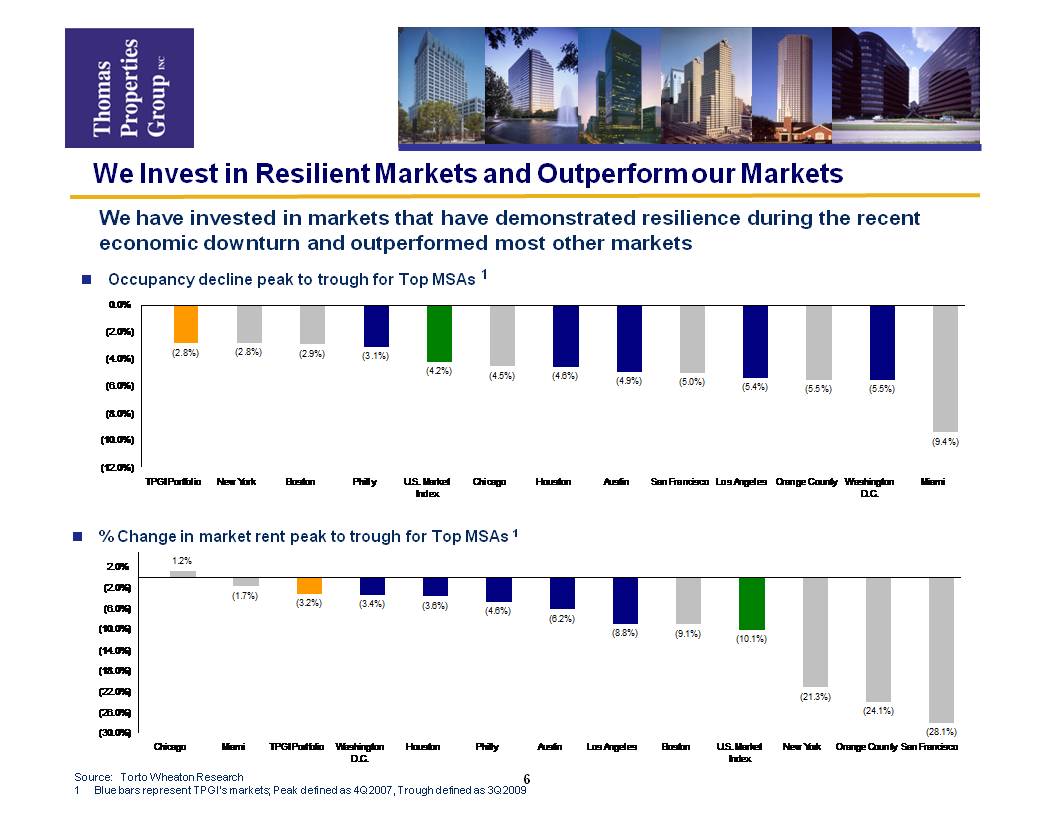
We Invest in Resilient Markets and Outperform our Markets
We have invested in markets that have demonstrated resilience during the recent economic downturn and outperformed most other markets
Occupancy decline peak to trough for Top MSAs 1
% Change in market rent peak to trough for Top MSAs 1
Source: Torto Wheaton Research
1 Blue bars represent TPGI’s markets; Peak defined as 4Q2007, Trough defined as 3Q2009
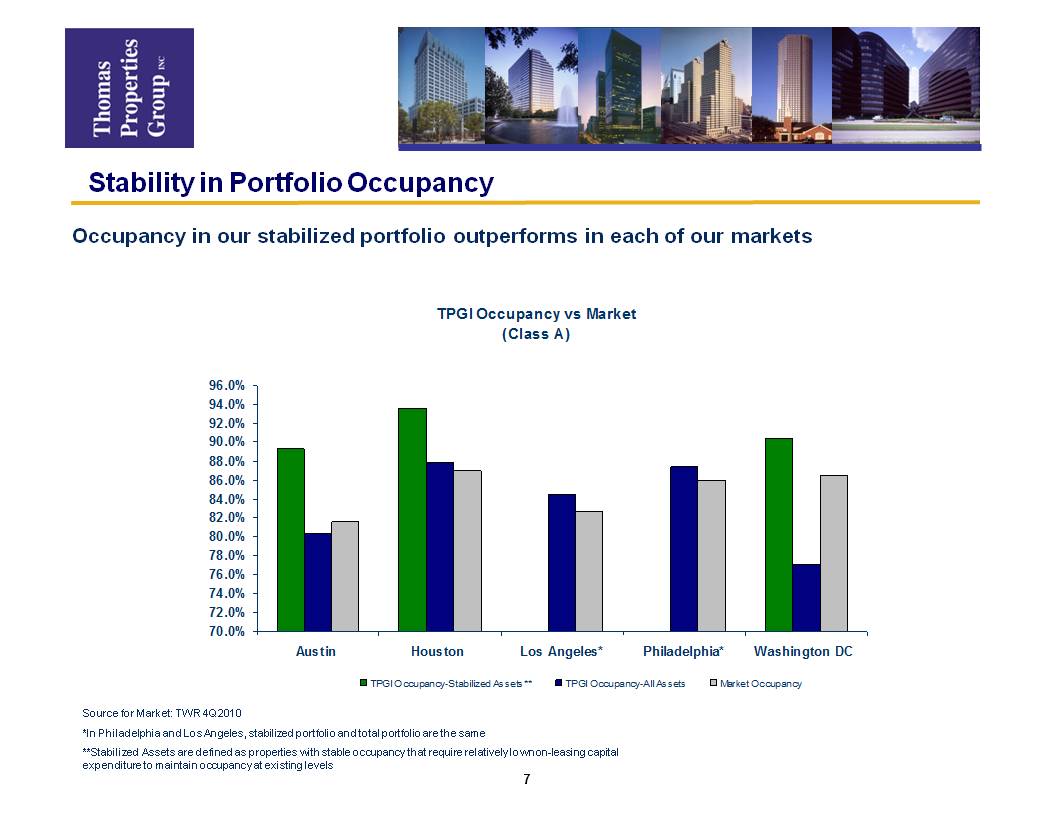
Stability in Portfolio Occupancy
Occupancy in our stabilized portfolio outperforms in each of our markets
Source for Market: TWR 4Q2010
*In Philadelphia and Los Angeles, stabilized portfolio and total portfolio are the same
**Stabilized Assets are defined as properties with stable occupancy that require relatively low non-leasing capital expenditure to maintain occupancy at existing levels

Occupancy Performance Relative to Peers
TPGI Change in Portfolio Occupancy vs Peers
January 1, 2009 - December 31, 2010
January 1, 2009 - December 31, 2010
Source: Companies’ Supplemental Financial Data

Superior Leasing Spreads
TPGI vs. Office Peers
2010 GAAP Leasing Spreads
Source: Companies’ Supplemental Financial Data
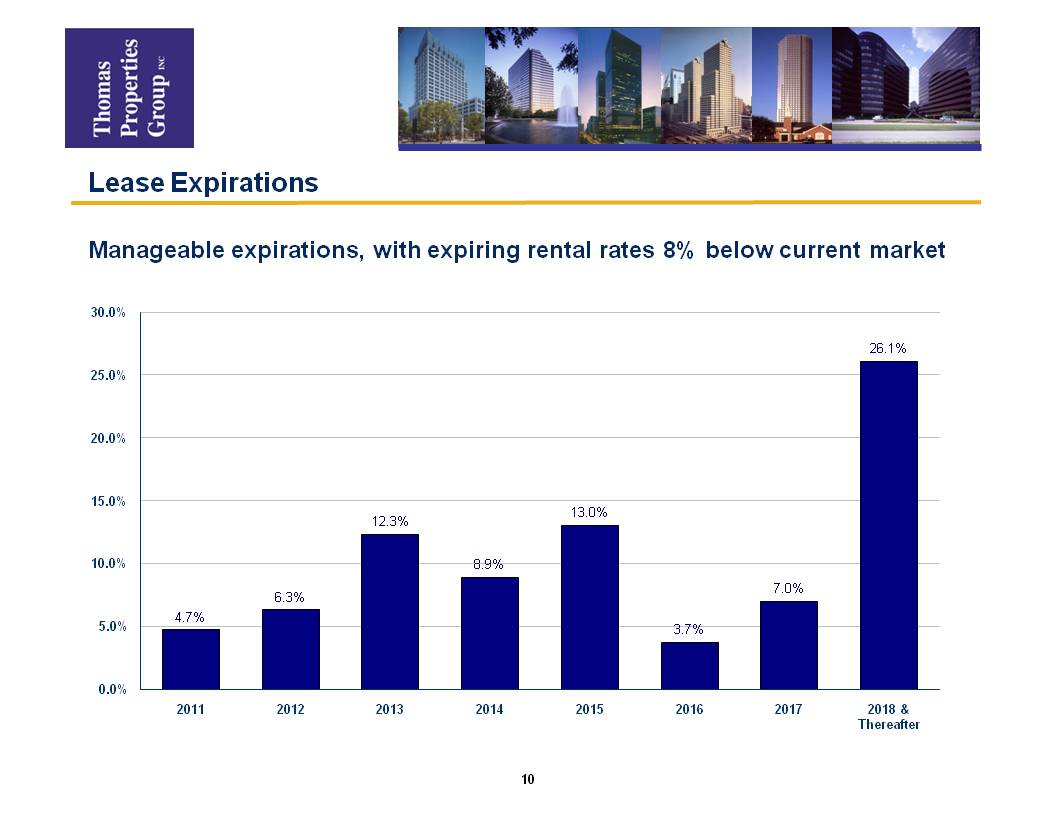
Lease Expirations
Manageable expirations, with expiring rental rates 8% below current market

Strong NOI Growth
TPGI vs. Office Peers
2010 Same Property NOI Growth
Cash Basis
GAAP Basis
*Excludes Two Commerce Square, eliminating the impact of Conrail lease expiration in 2008 and 2009
Source: Companies’ Supplemental Financial Data
Successful Refinancing Activities
We have focused on reducing the leverage on our balance sheet and taking advantage of opportunities to repay debt at a discount. Since January 2008, we have:
Reduced our pro rata share of property level debt by $260 mm (35% reduction)
Together with our partners, retired $454 mm of debt, at an average 29% discount from par value
Refinanced $911 million of joint venture debt with average maturities of 8.8 years at an average interest rate of 5.1%
Raised over $300 million of additional equity capital from our joint venture partner, California State Teachers’ Retirement System (CalSTRS) primarily for investment in our existing portfolio
Ranked as CalSTRS top “core” manager for past five years
Ranked in the top 25% in “specialty” portfolio
Our unrestricted cash balance at December 31, 2010 was $42.3 mm
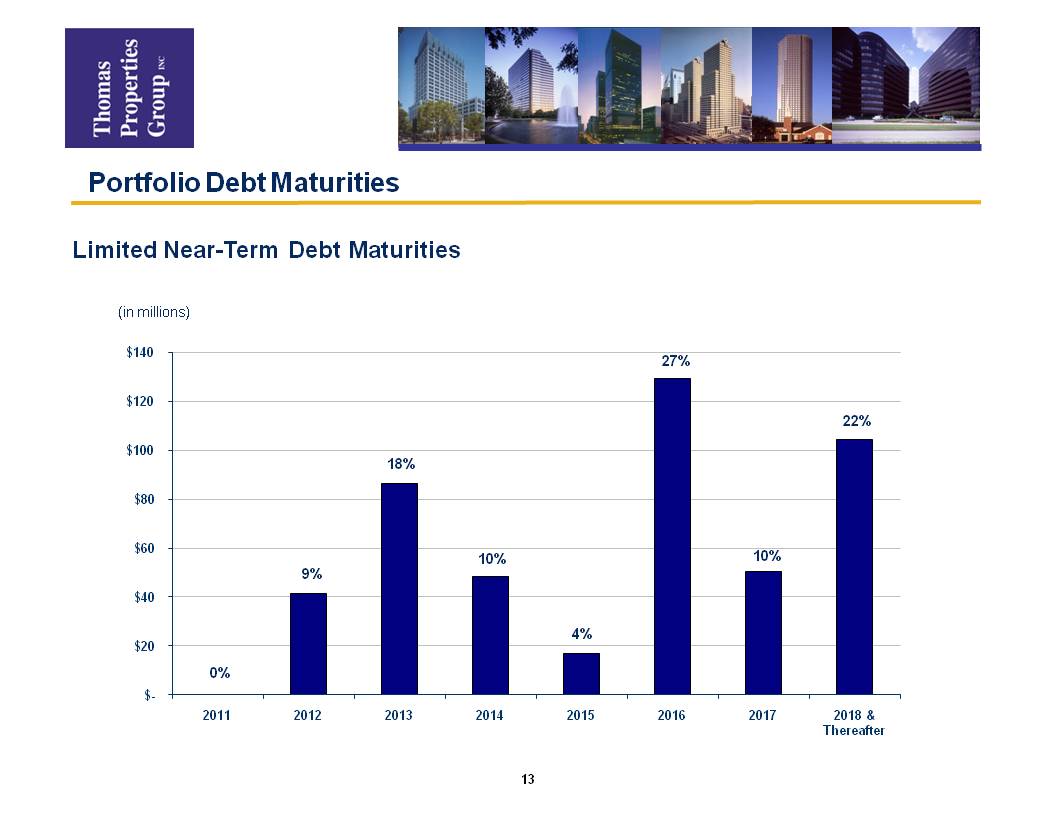
Portfolio Debt Maturities
Limited Near-Term Debt Maturities
(in millions)
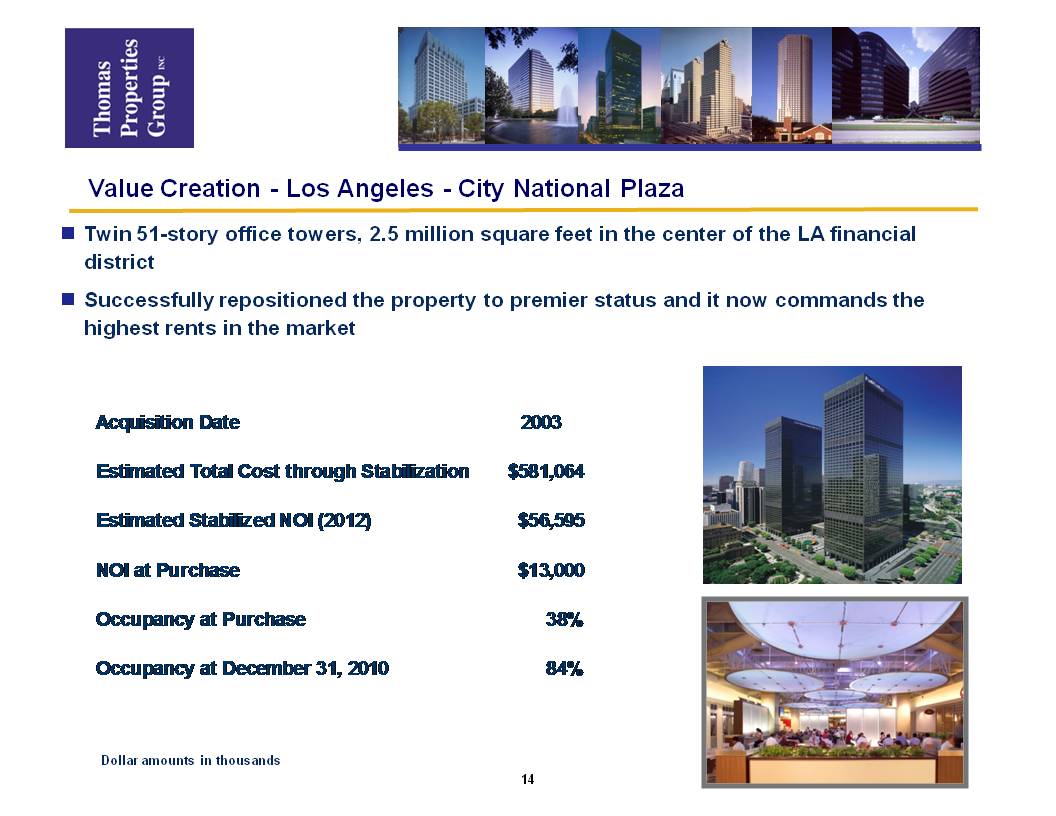
Value Creation - Los Angeles - City National Plaza
Twin 51-story office towers, 2.5 million square feet in the center of the LA financial district
Successfully repositioned the property to premier status and it now commands the highest rents in the market
Acquisition Date 2003
Estimated Total Cost through Stabilization $581,064
Estimated Stabilized NOI (2012) $56,595
NOI at Purchase $13,000
Occupancy at Purchase 38%
Occupancy at December 31, 2010 84%
Dollar amounts in thousands
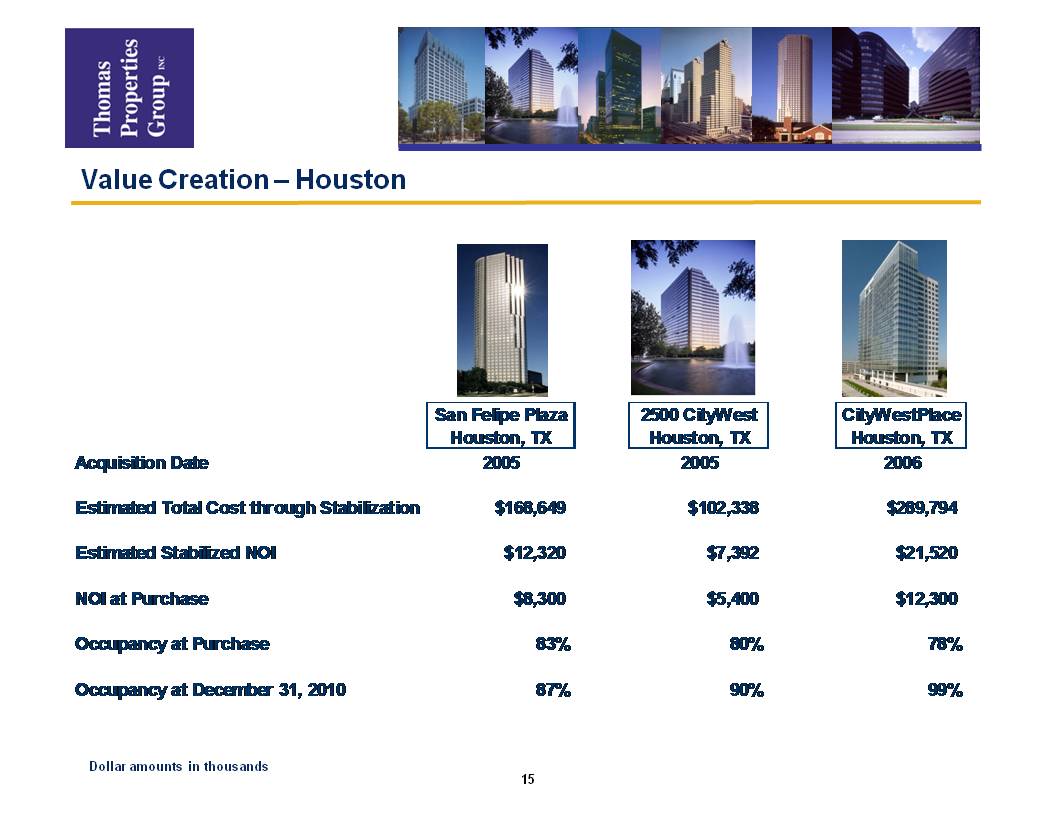
Value Creation – Houston
San Felipe Plaza Houston, TX
Acquisition Date 2005
Estimated Total Cost through Stabilization $168,649
Estimated Stabilized NOI $12,320
NOI at Purchase $8,300
Occupancy at Purchase 83%
Occupancy at December 31, 2010 87%
2500 CityWest Houston, TX
Acquisition Date 2005
Estimated Total Cost through Stabilization $102,338
Estimated Stabilized NOI $7,392
NOI at Purchase $5,400
Occupancy at Purchase 80%
Occupancy at December 31, 2010 90%
CityWestPlace Houston, TX
Acquisition Date 2006
Estimated Total Cost through Stabilization $289,794
Estimated Stabilized NOI $21,520
NOI at Purchase $12,300
Occupancy at Purchase 78%
Occupancy at December 31, 2010 99%
Dollar amounts in thousands

Murano - Philadelphia.
302-unit luxury condominium tower in downtown Philadelphia
Through December 31, 2010, have sold 220 units (73%), with completion of sales expected over the next 24 months
Loan balance of $214 per square foot, just 26% of the list price of $811 per square foot for the remaining 82 units
Remaining units are the most desirable in the building due to both location and size
Our ownership interest in net sales proceeds is approximately 90%. Using conservative pricing estimates, this represents approximately $30-50 million of net proceeds
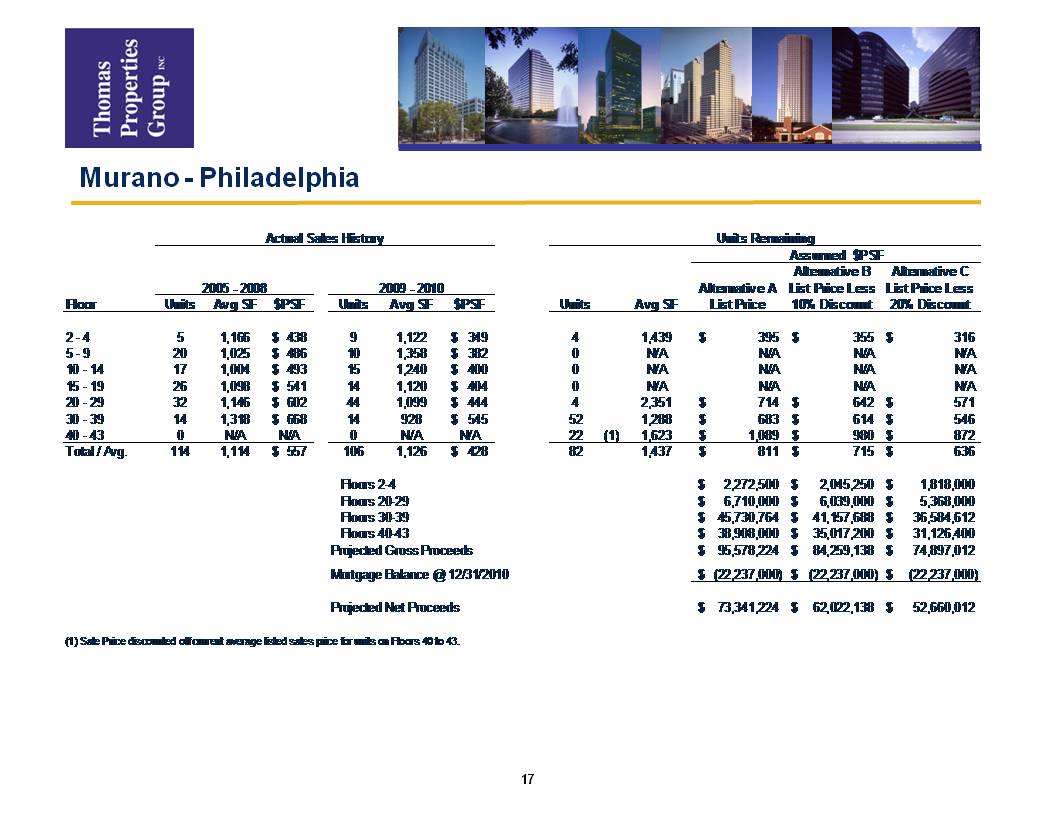
Murano - Philadelphia
Actual Sales History Units
Years 2005 - 2008, Floors 2 - 4, units 5, avg sf 1,166, $PSF $438; Floors 5 - 9, units 20, avg sf 1,025, $PSF $486; Floors 10 - 14, units 17, avg sf 1,004, $PSF $493; Floors 15 - 19, units 26, avg sf 1,098, $PSF $541; Floors 20 - 29, units 32, avg sf 1,146, $PSF $602; Floors 30 - 39, units14, avg sf 1,318, $PSF $668; Floors 40 - 43, units 0, avg sf N/A, $PSF N/A; Total/Avg. 114 units; Avg SF 1,114; SPSF $557
Years 2009 - 2010, Floors 2 - 4, units 9, avg sf 1,122, $PSF $349; Floors 5 - 9, units 10, avg sf 1,358, $PSF $382; Floors 10 - 14, units 15, avg sf 1,240, $PSF $400; Floors 15 - 19, units 14, avg sf 1,120, $PSF $404; Floors 20 - 29, units 44, avg sf 1,099, $PSF $444; Floors 30 - 39, units 14, avg sf 928, $PSF $545; Floors 40 - 43, units 0, avg sf N/A, $PSF N/A;Total/Avg. 106 units; Avg SF 1,126; SPSF $428
Units Remaining Assumed $PSF
Alternative A
Floors 2 - 4, Units 4, Avg SF 1,439, List Price $395; Floors 5 - 9,Units 0, Avg SF N/A, List Price N/A; Floors 10 - 14, Units 0, Avg SF N/A, List Price N/A; Floors 15 - 19, Units 0, Avg SF N/A, List Price N/A; Floors 20 - 29, units 4, avg sf 2,351, $PSF $714; Floors 30 - 39, units 52, avg sf 1,288, $PSF $683; Floors 40 - 43, units 22 (1), avg sf 1,623, $PSF $1,089;
Alternative B List Price Less 10% Discount
Floors 2 - 4, Units 4, Avg SF 1,439, Price $355; Floors 5 - 9,Units 0, Avg SF N/A, Price N/A; Floors 10 - 14, Units 0, Avg SF N/A, Price N/A; Floors 15 - 19, Units 0, Avg SF N/A, Price N/A; Floors 20 - 29, units 4, avg sf 2,351, $PSF $642; Floors 30 - 39, units 52, avg sf 1,288, $PSF $614; Floors 40 - 43, units 22 (1), avg sf 1,623, $PSF $980;
Alternative C List Price Less 20% Discount
Floors 2 - 4, Units 4, Avg SF 1,439, Price $316; Floors 5 - 9,Units 0, Avg SF N/A, Price N/A; Floors 10 - 14, Units 0, Avg SF N/A, Price N/A; Floors 15 - 19, Units 0, Avg SF N/A, Price N/A; Floors 20 - 29, units 4, avg sf 2,351, $PSF $571; Floors 30 - 39, units 52, avg sf 1,288, $PSF $546; Floors 40 - 43, units 22 (1), avg sf 1,623, $PSF $872;
Total/Avg. 82 units; Avg SF 1,437; Alternative A Average List Price SPSF $811;Alternative B Average List Price less 10% discount SPSF $715;Alternative C Average List Price less 20% discount SPSF $636;
Projected Gross Proceeds
Alternative A
Floors 2 - 4, Gross Proceeds $2,272,500; Floors 20 - 29, Gross Proceeds $6,710,000; Floors 30 - 39, Gross Proceeds$45,730,764; Floors 40 - 43, Gross Proceeds$38,908,000; Total Projected Gross Proceeds $95,578,224; Mortgage Balance @ 12/31/2010 ($22,237,000); Projected Net Proceeds $73,341,224
Alternative B
Floors 2 - 4, Gross Proceeds $2,045,250; Floors 20 - 29, Gross Proceeds $6,039,000; Floors 30 - 39, Gross Proceeds$41,157,688; Floors 40 - 43, Gross Proceeds$35,017,200; Total Projected Gross Proceeds $84,259,138; Mortgage Balance @ 12/31/2010 ($22,237,000); Projected Net Proceeds $62,022,138
Alternative C
Floors 2 - 4, Gross Proceeds $1,818,000; Floors 20 - 29, Gross Proceeds $5,368,000; Floors 30 - 39, Gross Proceeds$36,584,612; Floors 40 - 43, Gross Proceeds$31,126,400; Total Projected Gross Proceeds $74,897,012; Mortgage Balance @ 12/31/2010 ($22,237,000); Projected Net Proceeds $52,660,012
(1) Sale Price discounted off current average listed sales price for units on Floors 40 to 43.
Strategic Plan
TPGI has recently completed an extensive strategic review utilizing both internal and external resources and has adopted a new strategic plan that capitalizes on its strengths
TPGI’s goal is to expand its asset base by acquiring wholly-owned assets
TPGI intends to focus on maximizing the portfolio’s recurring cash flow and NOI growth
Strategic Plan - Highlights
Selectively sell non-core assets that have achieved their maximum value
Redeploy sales proceeds in institutional quality assets in high barrier to entry markets to generate superior recurring cash flow and NOI growth
Continue to create value by repositioning value-add properties
Continue capital relationships with institutional investors to acquire and control trophy quality office properties, with a long term goal of increasing ownership interests
Continue to reduce leverage on our portfolio with a target of 50% LTV
Reduce the size of our development portfolio to approximately 10% of net asset value
Long term goal to convert to REIT status
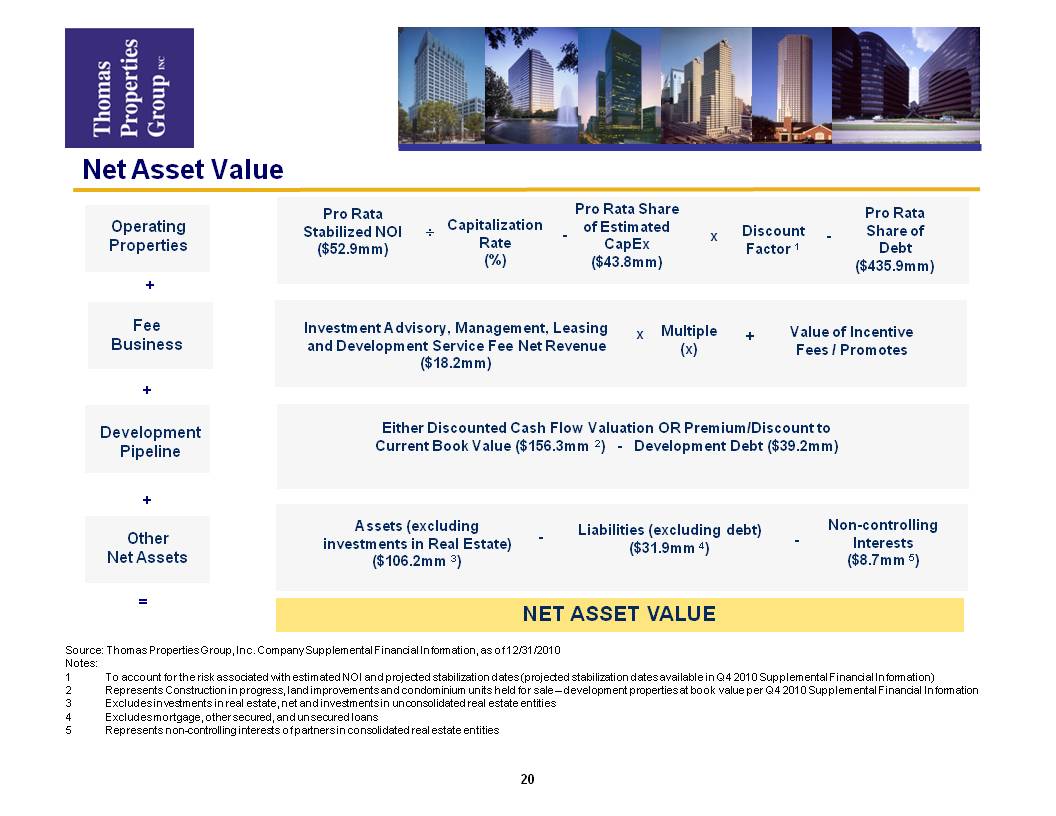
Net Asset Value
Operating Properties Pro Rata Stabilized NOI ($52.9mm) Capitalization Rate (%) Pro Rata Share of Estimated CapEx ($43.8mm) Discount Factor 1 Pro Rata Share of Debt ($435.9mm)
Fee Business Investment Advisory, Management, Leasing and Development Service Fee Net Revenue ($18.2mm) Multiple (x) Value of Incentive Fees / Promotes
Development Pipeline Either Discounted Cash Flow Valuation OR Premium/Discount to Current Book Value ($156.3mm 2) - Development Debt ($39.2mm)
Other Net Assets Assets (excluding investments in Real Estate) ($106.2mm 3) Liabilities (excluding debt) ($31.9mm 4) Non-controlling Interests ($8.7mm 5)
NET ASSET VALUE
Source: Thomas Properties Group, Inc. Company Supplemental Financial Information, as of 12/31/2010
Notes:
1 To account for the risk associated with estimated NOI and projected stabilization dates (projected stabilization dates available in Q4 2010 Supplemental Financial Information)
2 Represents Construction in progress, land improvements and condominium units held for sale – development properties at book value per Q4 2010 Supplemental Financial Information
3 Excludes investments in real estate, net and investments in unconsolidated real estate entities
4 Excludes mortgage, other secured, and unsecured loans
5 Represents non-controlling interests of partners in consolidated real estate entities
Net Asset Value – Investor Model
TPGI intends to publish an Excel-based calculator on our website to assist investors with the calculation of the net asset value of the company. This calculator, which will be updated quarterly, will allow investors to input the following variables:
Cap rates to be applied to estimated stabilized operating property NOI
Predevelopment property valuations
Multiple to be applied to net fee revenue
Summary
Experienced management team with Class A institutional quality office portfolio
Reduced loan balances and extended debt maturities
New strategic plan includes:
Expansion of our office portfolio with an increased focus on acquiring wholly-owned assets in California and the western United States
Disposition of selected assets and redeployment of the proceeds to acquire new assets
Continuing to create value by repositioning properties to maximize recurring cash flow
Appendix
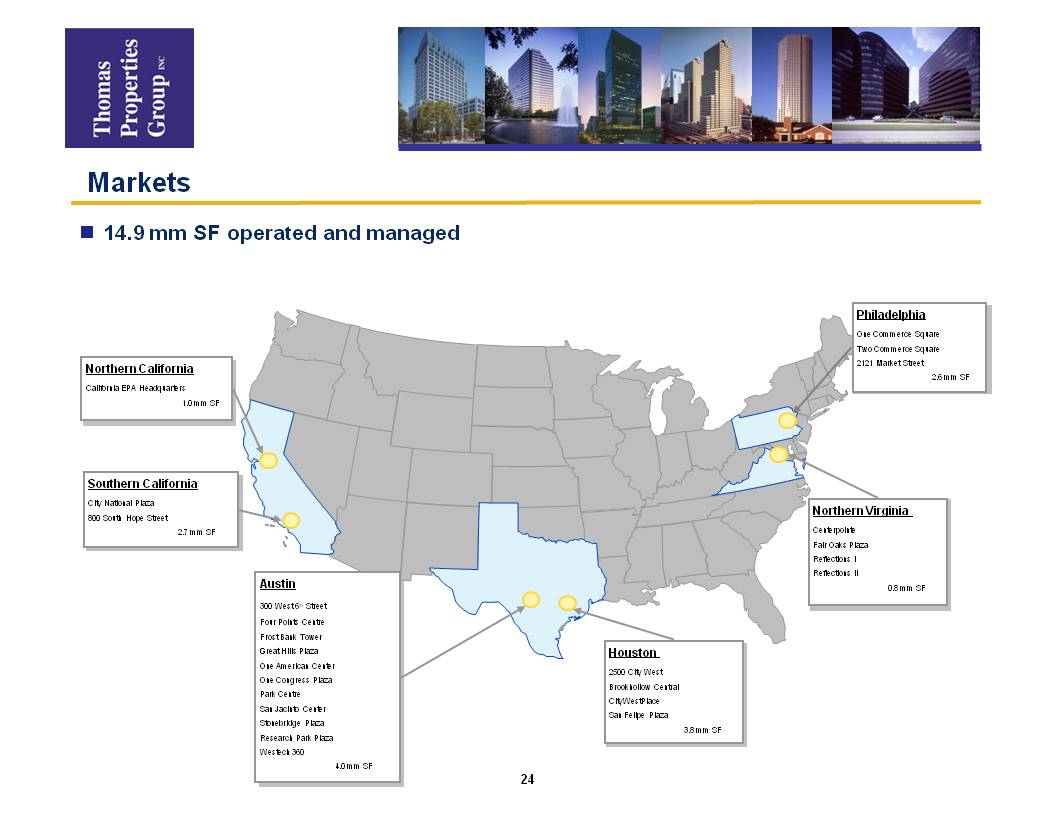
Markets
14.9 mm SF operated and managed
Northern California
California EPA Headquarters
1.0 mm SF
Southern California
City National Plaza
800 South Hope Street
2.7 mm SF
Austin
300 West 6th Street
Four Points Centre
Frost Bank Tower
Great Hills Plaza
One American Center
One Congress Plaza
Park Centre
San Jacinto Center
Stonebridge Plaza
Research Park Plaza
Westech 360
4.0 mm SF
Philadelphia
One Commerce Square
Two Commerce Square
2121 Market Street
2.6 mm SF
Northern Virginia
Centerpointe
Fair Oaks Plaza
Reflections I
Reflections II
0.8 mm SF
Houston
2500 City West
Brookhollow Central
CityWestPlace
San Felipe Plaza
3.8 mm SF
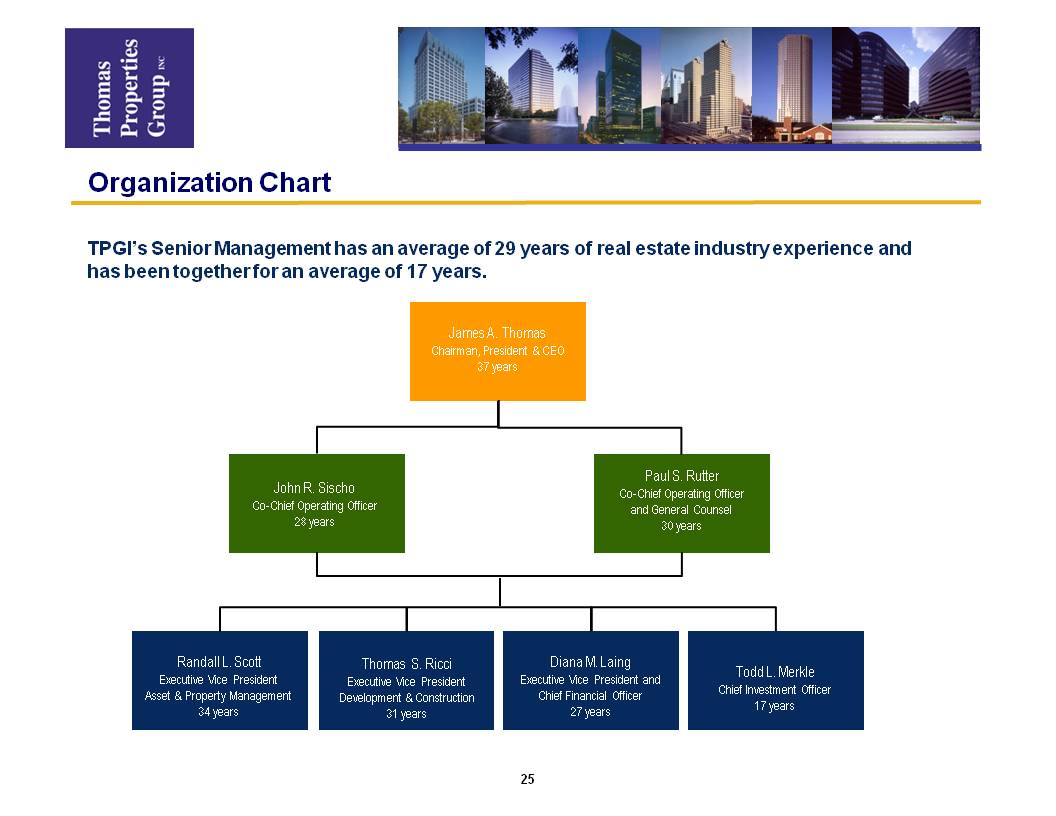
Organization Chart
TPGI’s Senior Management has an average of 29 years of real estate industry experience and has been together for an average of 17 years.
James A. Thomas
Chairman, President & CEO
37 years
John R. Sischo
Co-Chief Operating Officer
28 years
Paul S. Rutter
Co-Chief Operating Officer
and General Counsel
30 years
Randall L. Scott
Executive Vice President
Asset & Property Management
34 years
Thomas S. Ricci
Executive Vice President
Development & Construction
31 years
Diana M. Laing
Executive Vice President and
Chief Financial Officer
27 years
Todd L. Merkle
Chief Investment Officer
17 years