Attached files
DECLARATION
Sentry Petroleum Ltd (“Sentry”) has commissioned RISC Pty Ltd to provide an Independent review of selected conventional petroleum accumulations the exploration permit ATP 865P, Queensland, Australia for capital raising. This report includes a statement compliant with the Canadian standard NI-51 101 and expands disclosure to demonstrate that resource estimates are in accordance with COGEH definitions.
The statements and opinions attributable to RISC are given in good faith and in the belief that such statements are neither false nor misleading. In carrying out its tasks, RISC has considered and relied upon information obtained from Sentry as well as information in the public domain. The information provided to RISC has included both hard copy and electronic information supplemented with discussions between RISC and key Sentry staff.
Whilst every effort has been made to verify data and resolve apparent inconsistencies, neither RISC nor its servants accept any liability for its accuracy, nor do we warrant that our enquiries have revealed all of the matters, which an extensive examination may disclose. In particular, we have not independently verified property title, encumbrances, regulations that apply to this asset(s). RISC has also not audited the opening balances at the evaluation date of past recovered and unrecovered development and exploration costs, undepreciated past development costs and tax losses.
The assessment of petroleum assets is subject to uncertainty because it involves judgments on many variables that cannot be precisely assessed, including reserves, future oil and gas production rates, the costs associated with producing these volumes, access to product markets, product prices and the potential impact of fiscal/regulatory changes. We believe our review and conclusions are sound but no warranty of accuracy or reliability is given to our conclusions. Our estimates of resources, costs and associated risks may increase or decrease and our opinions may change as further information becomes available.
RISC is independent with respect to Sentry. RISC has no pecuniary interest, other than to the extent of the professional fees receivable for the preparation of this report, or other interest in the assets evaluated, that could reasonably be regarded as affecting our ability to give an unbiased view of these assets.
Our review was carried out only for the purpose referred to above and may not have relevance in other contexts.
CONFIDENTIALITY
This report is prepared for the TSX V exchange and as such is not confidential and therefore available for public use.
COPYRIGHT
This document is protected by copyright laws. Any unauthorised reproduction or distribution of the document or any portion of it may entitle a claim for damages.

DOCUMENT CONTROL
Independent Review of Selected Conventional Petroleum Accumulations in ATP 865P, Queensland, Australia.
|
Client Name
|
Sentry Petroleum Ltd
|
Client
Representative
|
Dr. RT Rajeswaran
|
||
|
RISC Coordinator
|
Geoff Barker
|
RISC Job #
|
10.0112
|
Client Order #
|
|
Approvals
|
Name
|
Date
|
|
|
Prepared By
|
Andrew Pitchford
|
25 January 2011
|
|
Prepared By
|
Geoff Barker
|
17 January 2011
|
|
Peer Review By
|
Nick Eustance
|
1 February 2011
|
|
Peer Review By
|
Joe Salomon
|
3 February 2011
|
|
Peer Review By
|
Pat Taylor
|
1 February 2011
|
|
Editorial Review By
|
Geoff Barker
|
9 February 2011
|
|
Authorised For Release By
|
Patrick Taylor
|
9 February 2011
|
Revision History
|
Revision
|
Date
|
Description
|
Checked By
|
Approved By
|

TABLE OF CONTENTS
|
1
|
EXECUTIVE SUMMARY
|
1
|
|||
|
2
|
INTRODUCTION
|
2
|
|||
|
2.1
|
Intended use of this report
|
2
|
|||
|
2.2
|
Owner contact and property inspection
|
2
|
|||
|
2.3
|
Applicable standards
|
2
|
|||
|
3
|
REQUIRED DISCLOSURES
|
3
|
|||
|
3.1
|
COGE Handbook Section 5 disclosures
|
3
|
|||
|
3.1.1
|
Estimation of Fair Value
|
3
|
|||
|
3.1.2
|
Supporting Filings
|
3
|
|||
|
3.1.3
|
Consistent Use of Units of Measurement
|
3
|
|||
|
3.2
|
Location and Basin name
|
3
|
|||
|
3.3
|
Property ownership and expiration
|
4
|
|||
|
3.4
|
Exploration and development activities
|
4
|
|||
|
3.4.1
|
General description of proposed exploration activities
|
4
|
|||
|
3.4.2
|
Exploration Activities for financial previous year
|
4
|
|||
|
3.4.3
|
Next financial year work commitments
|
5
|
|||
|
3.5
|
Description of target zones
|
5
|
|||
|
3.6
|
Depth of targets
|
6
|
|||
|
3.7
|
Distance to nearest commercial production
|
6
|
|||
|
3.8
|
Product types reasonably expected
|
7
|
|||
|
3.9
|
Range of pool or field size
|
7
|
|||
|
3.10
|
Data availability and reliability
|
7
|
|||
|
3.11
|
Drilling results, well status and completions
|
8
|
|||
|
3.11.1
|
Rosebank 1
|
9
|
|||
|
3.11.2
|
Paradise 1
|
9
|
|||
|
3.11.3
|
Gumbardo 1
|
9
|
|||
|
3.11.4
|
Buckabie 1
|
10
|
|||
|
3.11.5
|
Paroo 1
|
10
|
|||
|
3.11.6
|
Dartmouth 1
|
11
|
|||
|
3.11.7
|
Emu Creek 1
|
11
|
|||
|
3.12
|
Procedures for estimation and classification of undiscovered resources
|
11
|
|||
|
3.13
|
Resources risks and probability of successes
|
11
|
|||
|
4
|
REGIONAL GEOLOGICAL OVERVIEW
|
12
|
|||
|
5
|
RESOURCE ASSESSMENT ATP 865P
|
18
|
|||
|
5.1
|
Ravenscourt Prospect
|
18
|
|||
|
5.1.1
|
Ravenscourt risk and volume
|
20
|
|||
|
5.2
|
Sherwood Park Prospect
|
21
|
|||
|
5.2.1
|
Sherwood Park risk and volume
|
23
|
|||
|
5.3
|
Gumbardo Redrill Prospect
|
23
|
|||
|
5.3.1
|
Gumbardo Redrill Prospect risk and volume
|
24
|

|
5.4
|
Wade Hill Prospect
|
25
|
|||
|
5.4.1
|
Wade Hill Prospect risk and volume
|
25
|
|||
|
5.5
|
Leads
|
26
|
|||
|
5.5.1
|
Permian Channel Lead
|
26
|
|||
|
5.5.1.1
|
Permian Channel Lead risk and volume
|
27
|
|||
|
5.5.2
|
Up-dip Buckabie lead
|
27
|
|||
|
5.5.2.1
|
Up-dip Buckabie lead risk and volume
|
27
|
|||
|
5.5.3
|
Other potential
|
28
|
|||
|
5.6
|
Risk and volume summary
|
28
|
|||
|
6
|
CERTIFICATE OF QUALIFICATION
|
31
|
|||
|
7
|
APPENDIX 1: AREA DEFINITION FROM GOVERNMENT GAZETTAL NOTICES.
|
32
|
|||
|
8
|
APPENDIX 2: INPUT PARAMETERS FOR PROBABILISTIC VOLUME CALCULATION
|
33
|
|||
|
9
|
LIST OF TERMS
|
38
|

LIST OF FIGURES
|
Figure 3-1
|
Location of permit ATP 865Pand wells
|
4
|
|
Figure 3-2
|
Location Map and Sentry Petroleum’s Permits (in yellow), Queensland
|
7
|
|
Figure 3-3
|
Gumbardo 1 petrophysical evaluation by Sentry
|
10
|
|
Figure 4-1
|
Location and stratigraphic setting of ATP 865P
|
12
|
|
Figure 4-2
|
General stratigraphic section
|
13
|
|
Figure 4-3
|
Detail of Devonian stratigraphic section
|
14
|
|
Figure 4-4
|
Location of basin elements, wells and seismic
|
17
|
|
Figure 5-1
|
Location of prospects and leads in ATP 865P
|
18
|
|
Figure 5-2
|
Top Etonvale Limestone depth structure map
|
19
|
|
Figure 5-3
|
2D seismic line 82-V7
|
20
|
|
Figure 5-4
|
Carboniferous unconformity depth map at Sherwood Park
|
22
|
|
Figure 5-5
|
2D seismic line 584R-40 over the Sherwood Park prospect
|
22
|
|
Figure 5-6
|
Gumbardo redrill prospect depth structure map
|
24
|
|
Figure 5-7
|
Gumbardo area depth structure map with prospect and leads
|
25
|
|
Figure 5-8
|
Area of Permian Channel lead time map
|
26
|

LIST OF TABLES
|
Table 1-1
|
ATP 865P selected prospect and lead Undiscovered Petroleum Initially in Place as at 15 January 2011
|
1
|
|
Table 3-1
|
Proposed Well Locations
|
6
|
|
Table 3-2
|
ATP 865P well results from Geoscience Australia database
|
8
|
|
Table 5-1
|
Ravenscourt prospective in-place oil volume
|
21
|
|
Table 5-2
|
Sherwood Park prospective in-place volume oil OR gas
|
23
|
|
Table 5-3
|
Gumbardo Prospect prospective In-place volume oil OR gas
|
24
|
|
Table 5-4
|
Wade Hill Prospect prospective in-place volume oil OR gas
|
26
|
|
Table 5-5
|
Permian Channel Lead prospective in-place oil volume
|
27
|
|
Table 5-6
|
UpDip Buckabie prospective in-place oil volume
|
27
|
|
Table 5-7
|
Summary of Geological Probability of Success (G PoS)
|
29
|
|
Table 5-8
|
Summary of ATP 865P undiscovered in place volumes for selected leads and prospects as at 15 January 2011
|
|
|
30
|
||
|
Table 8-1
|
Ravenscourt - oil only case
|
33
|
|
Table 8-2
|
Sherwood Park - oil only case
|
33
|
|
Table 8-3
|
Sherwood Park - gas only case
|
34
|
|
Table 8-4
|
Gumbardo Re-drill - gas only case
|
34
|
|
Table 8-5
|
Gumbardo Re-drill - oil only case
|
35
|
|
Table 8-6
|
Wade Hill - gas only case
|
35
|
|
Table 8-7
|
Wade Hill - oil only case
|
36
|
|
Table 8-8
|
Permian Channel lead - oil only case
|
36
|
|
Table 8-9
|
UpDip Buckabie lead - oil only case
|
37
|

1 EXECUTIVE SUMMARY
Sentry Petroleum Ltd (“Sentry”) has engaged RISC to conduct a technical audit of its conventional petroleum resources in exploration permit ATP 865P, Queensland Australia. Sentry has a 100% interest in this permit held through its wholly owned subsidiary Sentry Petroleum (Australia) Pty Ltd . The data used in this report has been provided by Sentry Petroleum (Australia).
RISC has carried out this assessment of ATP 865P resources in accordance with Canadian NI 51‐101 and the resource definitions contained in Section 5 of the Canadian Oil and Gas Evaluation Handbook (COGEH). RISC has reported the required disclosures compliant with Canadian NI 51 101 Item 6.2 “Properties With No Attributed Reserves”.
RISC has reviewed all wells with shows, all prospects and selected leads defined by Sentry in ATP 865P to date. Sentry considers some of the wells with shows to be discoveries. RISC does not consider that there are discoveries in ATP 865P and consequently we have classified the resources as undiscovered. Sentry’s estimates of petroleum in-place have been audited and we have made adjustments that in our judgment are necessary where our estimate differs materially from Sentry’s.
Probabilistic methods have been used in estimating resource volumes. RISC has assigned the P90 value as the Low estimate, the P50 value as the Best Estimate and the P10 value as the High estimate. The total unrisked undiscovered petroleum for the selected accumulations evaluated by RISC using arithmetic addition is shown in Table 1-1.
|
RISC
|
OIIP Low
MM bbls
|
OIIP Best
MM bbls
|
OIIP High
MM bbls
|
GIIP Low
Bcf
|
GIIP Best
Bcf
|
GIIP High
Bcf
|
|
Total arithmetic addition
|
17
|
75
|
219
|
66
|
233
|
584
|
Table 1-1 ATP 865P selected prospect and lead Undiscovered Petroleum Initially in Place as at 15 January 2011
It should be noted that because there is a degree of independence between the individual estimates arithmetic addition will result in a Low aggregate that will have a greater than 90% confidence level and a High aggregate that will have a less than 10% confidence level.
Undiscovered petroleum has associated chances of discovery and development which represent the risks of failure. The resource estimates contained in this report have not been adjusted for these risks. Table 5-7 contains RISC’s estimates of geological chance of success of discovery.
A number of the prospects and leads may contain either oil or gas. In this event, we have formed a judgment about which occurrence we believe to be more likely and reported this quantity in Table 1-1, however both oil and gas estimates are provided in the main report. Volumes have not been assigned for leads not reviewed by RISC.
The audit is based on data collected up to the middle of January 2011. Hence the effective date may be taken as 15 January 2011. None of the assets were on production or under development at that time and to the best of our knowledge there is no new information at the date of writing this report that would cause us to change our opinions.

2 INTRODUCTION
This report has been compiled at the request of Sentry as an independent review the conventional petroleum properties in Australia for capital raising. The report also includes a statement compliant with NI-51 101.
2.1 Intended use of this report
The intended purpose of this report is to provide an independent report for filing on the Toronto Stock Exchange.
2.2 Owner contact and property inspection
As the Consultant, RISC staff has had frequent contact with the Client up to the date of the issue of this report. The Consultant has not personally inspected the property ATP-865P, however we do not believe and inspection of the property is necessary to prepare our report.
2.3 Applicable standards
This report has been prepared in accordance with the Canadian National Instrument 51 101. This requires specific disclosures which are contained in section 3 of this report.
The purpose of the Canadian NI 51-101 Instrument is to enhance the quality, consistency, timeliness and comparability of public disclosure by reporting issuers (Sentry) concerning their upstream oil and gas activities. To accomplish these objectives, the Instrument establishes disclosure standards and procedures somewhat akin to those long applied to financial disclosure. It prescribes standards for the preparation and disclosure of oil and gas reserves and related estimates, requires the annual public filing of certain of those estimates and other information pertaining to oil and gas activities, and specifies responsibilities of corporate directors.
Resource estimates in this report comply with the disclosure requirements set out under section 5.9 and 5.10 of NI 51 101. Furthermore RISC was directed to Companion Policy 51 101 CP Part 5, sections 5.3, 5.5, 5.6 for additional guidance on resource disclosure.
When evaluating prospective resources, the following mutually exclusive categories have been used:
|
•
|
Low Estimate: This is considered to be a conservative estimate of the quantity that will actually be recovered from the accumulation. If probabilistic methods are used, this term reflects a P90 confidence level.
|
|
•
|
Best Estimate: This is considered to be the best estimate of the quantity that will actually be recovered from the accumulation. If probabilistic methods are used, this term is a measure of central tendency of the uncertainty distribution (most likely/mode, P50/median, or arithmetic average/mean.)
|
|
•
|
High Estimate: This is considered to be an optimistic estimate of the quantity that will actually be recovered from the accumulation. If probabilistic methods are used, this term reflects a P10 confidence level.
|
In accordance with section 5.5.3 in the COGE handbook relating to aggregation of reserve estimates, the probabilistic volumes from the prospect and lead volumes have been arithmetically added to give the prospective resources shown Table 1-1 and Table 5-8.
It should be noted that because there is a degree of independence between the individual estimates arithmetic addition will result in a Low aggregate that will have a greater than 90% confidence level and a High estimate that will have a lower than 10% confidence level.

3 REQUIRED DISCLOSURES
3.1 COGE Handbook Section 5 disclosures
RISC has carried out this assessment of ATP 865P resources in accordance with Canadian NI 51‐101 and the resource definitions contained in Section 5 of the COGEH.
Resource estimates in this report comply with the disclosure requirements set out under section 5.9 and 5.10 of NI 51 101. Furthermore RISC was directed for additional guidance on resource disclosure to Companion Policy 51 101 CP Part 5, sections 5.3, 5.5, 5.6.
3.1.1 Estimation of Fair Value
Companion Policy 51 101 CP Part 5, sections 5.3 Estimation of Fair Value; this report has been accepted by Patrick Taylor a professional valuator (Section 6) on the 7th February 2011.
3.1.2 Supporting Filings
Companion Policy 51 101 CP Part 5, sections 5.5 Supporting Filings; No supporting filings are disclosed with this report.
3.1.3 Consistent Use of Units of Measurement
Companion Policy 51 101 CP Part 5, sections 5.6 Consistent Use of Units of Measurement; This report states all units of hydrocarbon volume in imperial units in line with common industry practise. All other units, depth, area, etc. are reported in Système International (SI) units in line with official Australian units of measurements.
3.2 Location and Basin name
This report covers the in-place discovered and undiscovered hydrocarbons and resource potential in ATP 865P, which is located in central Queensland’s Adavale Basin (Figure 3-2) in Australia.


Figure 3-1 Location of permit ATP 865Pand wells
3.3 Property ownership and expiration
Petroleum exploration permit ATP 865P was granted to Sentry Petroleum (Australia) Pty Ltd on 29/02/2008 and expires on 29/02/2020. Sentry Petroleum (Australia) Pty Ltd has a 100% working interest in ATP 865P (Figure 3-1) which has a gross area of 7467.2 sq km or 1.85 million acres. The Medina Group Ltd has a 7% overriding royalty. Consequently the net area Sentry Petroleum (Australia) Pty Ltd has an interest in is 7467.2 sq km or 1.85 million acres.
There is no relinquishment requirement of this permit within the next year from the date of report issue. At the end of the 4 year period one-third of the area must be relinquished unless a production permit is applied for. This does not include the area already excised for the Mariala National Park.
3.4 Exploration and development activities
There are no development activities in this permit.
3.4.1 General description of proposed exploration activities
Sentry proposes to drill several wells (up to 4 wells) to prove up their evaluations of hydrocarbons in the permit. At least two of these are planned as twins of existing wells. Acquisition of 2D seismic is also planned to better delineate some of the leads and prospects.
3.4.2 Exploration Activities for financial previous year
Exploration activity consisted of data evaluation, primarily seismic interpretation. No other activity was undertaken.
The fiscal year ending February 28, 2010 had total exploration expenditures for ATP 865Pof US$ 57,756. For the first nine months of 2010 financial year Sentry have spent US$20,330.

3.4.3 Next financial year work commitments
Sentry plan on acquiring 100km of 2D seismic in the 2011-2012 financial year. Next year’s budget is still in preparation, however, Sentry are expecting to spend between US$2 and US$3 million.
RISC considers the work programme to be reasonable and the budget to be adequate to carry out the work planned for this permit. Additional work that could be undertaken to reduce source risk of some prospects and leads includes geochemical modeling, calculation of generation volumes and mapping hydrocarbon migration pathways. Fluid inclusion analysis of core and cuttings in the relevant wells would be beneficial to this geochemical analysis and may provide direct evidence of the presence of hydrocarbons in wells where this is currently ambiguous.
3.5 Description of target zones
There are several potential target zones for the Sentry leads and prospects;
Buckabie Formation is the Adavale Basin’s uppermost unit, with Devonian continental red beds of quartzose sandstone and mudstone of fluvial origin. The Buckabie Formation varies in thickness from 118 to 1680 meters; it is thinnest, and can be absent, in the east and north of the Adavale Basin. Porosity readings between about 5% and 15% have been reported in the Gilmore gas field in the Buckabie Formation, Lissoy Sandstone and Log Creek Formation.
In the Rosebank 1 well the Etonvale Limestone (within the Etonvale Formation) consisted of a low porosity reservoir dolomitic limestone with vuggy and or fracture porosity. The Etonvale Formation is one of the source rocks in the Adavale basin. It is generally described as consisting of black, moderately calcareous shale and silts deposited through a marine environment during the Devonian.
The Cooladdie Dolomite of the Log Creek Formation consists primarily of dolomitic mudstone and siltstone laminations and interbedded with fine, sub-labile sandstone and minor limestone. The Cooladdie Dolomite is productive at Gilmore-3 in the Gilmore Gas Field 50 km to the north of ATP 865. This ranges in thickness from 12 to 80 meters and is thickest in the central Adavale Basin.
The Lissoy Sandstone is a proven hydrocarbon reservoir. It consists of thin sandstones interbedded with stringers of carbonate and shale. Lissoy Sandstone porosity at the Gilmore field ranges from 5 to 15 per cent However, permeability is generally low, though highly permeable intervals, of up to 800 mD are locally developed fractures. Net thickness of the porous sandstone intervals ranges from 30 m to 79 m. Gilmore-4a and Phfarlet 1 recovered gas from the Lissoy Sandstone during testing.

3.6 Depth of targets
Several well locations have been proposed in ATP835. The depths range is shown in Table 3-1 below.
|
ATP 865Proposed well locations
|
TD meters
|
Target Depth meters
|
|
Depths below GL (ground level)
|
||
|
Ravenscourt 1 (proposal 1)
|
1660
|
1430
|
|
Ravenscourt 1 (proposal 2)
|
1660
|
1450
|
|
Sherwood Park 1 (proposal 1)
|
1900
|
1670
|
|
Sherwood Park 1 (proposal 2)
|
1900
|
1670
|
|
Wade Hill 1 (proposed)
|
2700
|
2440
|
Table 3-1 Proposed Well Locations
3.7 Distance to nearest commercial production
The ATP 865Pis located 50 km to the south of the Gilmore gas field (PL 65), approximately 50km to the east of the Kenmore oil fields in PL32.


Figure 3-2 Location Map and Sentry Petroleum’s Permits (in yellow), Queensland
The Gilmore gas field produced gas over the period 1995 to 2003 from the Adavale Basin Lissoy sandstone via the Gilmore to Barcaldine Pipeline (PPL 15,completed 1995) to the gas-fired power station at Barcaldine. However the field has been shut in since 2003 and is reported to be on care and maintenance.
The Kenmore oil fields produced approximately 450 stb/d from the Cooper-Eromanga Basin Birkhead/Hutton and Poolwanna/Basal Jurassic formations from 34 production wells in the 12 month period to June 2010. Proved plus probable reserves reported by the Queensland Government as at 30 June 2010 were 872 Mstb.
3.8 Product types reasonably expected
There is an expectation of both oil and/or gas prospects in ATP 865P. The presence of gas in the mud while drilling several wells in and around the permit and the oil over the shakers at Rosebank 1 support this expectation.
3.9 Range of pool or field size
The expected range in field size, assuming a discovery, is from 5 to 250 MMstb of original oil in-place or 8 to 206 Bcf of original gas in-place. The hydrocarbon type has been inferred from the hydrocarbons of adjacent relevant wells. Where there is no prediction of hydrocarbon type both 100% gas and 100% oil volumes are presented.
3.10 Data availability and reliability
RISC was provided with a Kingdom project that contained all the seismic and well data available to Sentry and used for their assessment of the conventional hydrocarbon potential in the area. Other

well data included some well completion reports for the conventional wells, plus LAS files and image logs. Also presentations, spreadsheets and personal communications outlining the working and methodology of the Sentry assessment have been made available. The data provided, although sufficient, had some gaps which have resulted in an increased level of uncertainty than would otherwise be the case, which has been reflected in our assessment.
RISC has relied upon the information provided, and although we have made consistency checks where possible, we are not able to independently verify this information, as the source data upon which it is based was not available for our review.
RISC believes that Sentry has disclosed all the data that is available, its source and uncertainty and has a realistic appreciation of the data, assets and their associated uncertainty.
3.11 Drilling results, well status and completions
Six wells have been drilled within ATP 865P. Additionally the well Emu Creek 1 has been drilled within the permit in an area that has been excised out of ATP 865Pfor the Mariala national Park. Sentry have re-evaluated the wells and concluded that four of the wells have had hydrocarbon shows.
|
Well
|
Comp. Date
|
Type
|
Result
|
Resource
|
|
Buckabie 1
|
25 July 1961
|
Exploration
|
No HC Shows
P&A
|
Conventional
|
|
Dartmouth 1
|
24 September 1966
|
Exploration
|
No HC Shows
Water Well
|
Conventional
|
|
Gumbardo 1
|
1 November 1962
|
Exploration
|
No HC Shows
P&A
|
Conventional
|
|
Paradise 1
|
9 May 1998
|
Exploration
|
No HC Shows
P&A
|
Conventional
|
|
Paroo 1
|
26 September 1980
|
Exploration
|
No HC Shows
Water Well
|
Conventional
|
|
Rosebank 1
|
17 July 1984
|
Exploration
|
No HC Shows
Water Well
|
Conventional
|
|
Emu Creek 1
In National Park
|
19 April 1987
|
Exploration
|
No HC Shows
Water Well
|
Conventional
|
Table 3-2 ATP 865P well results from Geoscience Australia database
The wells with hydrocarbon shows, according to Sentry, are Rosebank 1, Gumbardo 1, Paradise 1 and Buckabie 1.
RISC’s assessment agrees with the evaluation of hydrocarbon shows in Paradise 1 and Rosebank 1. RISC has not fully evaluated the Buckabie 1 well but from the information provided accepts that hydrocarbons are likely to be present. RISC considers that even though the logging results are not conclusive the likelihood is that Gumbardo 1 well is dry.

3.11.1 Rosebank 1
Rosebank 1 was drilled in 1984 to 1498 meters by AAR as a conventional test of a large 4-way dip-closed structure. The well report states that oil was noted over the shakers just before the well encountered salt, and was abandoned before any testing or evaluation over the oil zone could be undertaken. What logs are available suggest that the oil was contained in vugs or fractures over a 2.5 metre interval. Other lower porosity zones have been identified above the vuggy interval. This vuggy or fractured interval is part of the Devonian Etonvale Formation.
3.11.2 Paradise 1
Paradise 1 was drilled as a commitment by Icon Oil NL in 1998 to a depth of 2412 meters and wireline log analysis indicates hydrocarbon saturations in the Cooladdi Dolomite. The primary objective was the Lissoy Sandstone which was absent. Wet gas was recorded while drilling through the Cooladdi Dolomite section. No funding was available for tests or further logging runs such as density logs. The porosity range is low from 7% to 10% and the capacity to flow is unknown.
3.11.3 Gumbardo 1
Gumbardo 1 was drilled in 1963 to 3944 metres by Phillips-Sunray and a reasonable set of logs (Figure 3-3), sidewall cores and DST’s were acquired. The well was drilled with fresh water and
Sentry consider that the well bore suffered considerable formation damage from swelling clays as well as mud invasion that repressed the hydrocarbon saturation prior to open hole logging. As a result of this Sentry evaluate 46 metres of hydrocarbons (most likely gas) within the Lissoy Sandstone of the Log Creek Formation.
There may have been a significant time delay of several days between reaching the reservoir depth and the log run. This interval was cored before logging. There were also six bit and core barrel changes while drilling the reservoir interval. It took two days to complete the log runs. These delays increased the likelihood of fluid invasion, such that the log response may not be measuring full response of formation fluid. As possible evidence for this, the salinity of muddy water produced on DST#8 does not match SP or Pickett Plot, the implication being that the water derives from invaded mud rather than formation fluid.
RISC does not believe that the log and other data unambiguously point to the presence of hydrocarbons. Rather, RISC believes that the logs are inconclusive and the presence of hydrocarbons cannot at this stage be ruled out. However the majority of the evidence suggests that the well does not contain significant hydrocarbons.
The fluid history analysis may provide evidence for the presence of hydrocarbons; that is, the examination of the thin sections of reservoir rock for microscopic fluid inclusions that are tested for hydrocarbons.


Figure 3-3 Gumbardo 1 petrophysical evaluation by Sentry
3.11.4 Buckabie 1
Buckabie 1 was drilled in 1961 by Phillips-Sunray to 2765 metres and acquired wire-line logs, sidewall cores and five DST’s. The log data is considered poor quality. The well was drilled to test the stratigraphy and petroleum potential on the crest of an anticline structure at the Devonian level that is broad at shallow depths but becomes more pronounced and deeper levels. Hydrocarbon shows consisting of crush cut fluorescence in the Cretaceous Mooga Sandstone of the Blythsdale Group are considered to be immature generation products from a very recent or currently active generation and migration system. The kitchen is believed to be local.
3.11.5 Paroo 1
Paroo 1 was drilled by Australian Aquitaine in 1980 to test an area having potential for reef development in lower to middle Devonian age rocks. Study of old and newly acquired seismic data in the period 1978 to 1980 located areas of anomalous seismic character in the region previously identified as having potential for reef development. No reef development and no hydrocarbon shows were encountered. The well penetrated Eromanga Basin sediments down to 1402 metres, Permian age sediments from 1402 metres to 1518 metres, and Devonian sediments from 1518 metres to total depth at 2502 metres in the Log Creek Formation. Severely altered igneous rocks within the Bury limestone contain anorthite. The alteration may have resulted from intrusion of a sill into carbonates saturated with highly saline ground-waters.

One core was cut for stratigraphic purposes, in Devonian age rocks. No drill stem tests were run. The well was abandoned and converted to a water well, perforated over the interval 1286 metres to 1290 metres. The Devonian section exhibits back-reef facies; reef proximity is more evident in the upper part, particularly in the interval 1888m to 1920m.
3.11.6 Dartmouth 1
Dartmouth 1 was drilled by Phillips-Sunray in 1966 to 3,051 metres Subsea in the Devonian Log Creek Formation and P&A’d as a dry hole. The well was located on the relatively untested northeastern flank of the Cooladdi Trough, near the south-westerly edge of the Langlo Embayment. The well was drilled as a stratigraphic test of the northern Dartmouth Anticline which is a large seismically defined high. A primary objective of the well was to determine the stratigraphy of the pre-Jurassic sediments and evaluate their petroleum potential. Sidewall cores, four DST’s and a suite of wireline logs were obtained. No formation fluids were recovered from any of the tests. Dartmouth was devoid of any potential reservoir rock in the Devonian, but good porosity sandstones (up to 25%) were intersected in the Permian.
3.11.7 Emu Creek 1
Emu Creek 1 was drilled by Agip Australia Pty Ltd in 1987 to test the Jurassic, as part of the Eromanga Basin sequence. The well was plugged and abandoned after encountering no hydrocarbons shows. Total depth reached was at 1327 m in the Etonvale Formation. There is no reason to suppose that the structure is not a valid closure as interpreted from the Emu Creek Survey. Fair to good reservoir potential was encountered in all the Jurassic- Early Cretaceous target formations but all proved to be water filled. No reservoir potential was found in the Devonian sub-unconformity sequence.
The sealing potential of the Birkhead Formation is in doubt due to the lack of argillaceous material. However several potentially sealing argillaceous siltstones exist in the Basal Jurassic, the Westbourne and the Cadna-Owie. A regional seal is still provided by the Wallumbilla Claystones.
3.12 Procedures for estimation and classification of undiscovered resources
RISC has relied upon the information provided and has undertaken the evaluation on the basis of a review and audit of existing interpretations and assessments as supplied by Sentry making adjustments as necessary. The classification of the resources in this block as undiscovered is based our opinion that there is a lack of conclusive evidence that the wells encountered significant quantities of potentially moveable hydrocarbons. While Sentry is of the opinion that the wells had hydrocarbon shows, they make no claim of discovered resources in ATP 865P. All resources described by RISC in ATP 865P are based on exploration data analysis and review.
RISC believes that Sentry has disclosed all relevant data, its source and uncertainty. Although RISC has made consistency checks where possible, the audit trail for some data is unclear resulting in an increased level of uncertainty. This uncertainty has been reflected in our assessment.
RISC has accepted the statements by Sentry relation to their exploration programmes and the decision that the next exploration activity for the four prospects is drilling rather than any other activity.
3.13 Resources risks and probability of successes
ATP 865P is considered a property with no attributed reserves. As such it meets the criteria for an unproved property as it contains no commercial or discovered fields. The undiscovered resources in ATP 865P have been independently audited and are summarisedalong with a description of each prospect and lead in Section 5 below.

4 REGIONAL GEOLOGICAL OVERVIEW
Permit ATP 865P, awarded for conventional hydrocarbon exploration, is located within Eromanga Basin in central Queensland and on the edge of the underlying Adavale Basin.

Figure 4-1 Location and stratigraphic setting of ATP 865P
The Adavale Basin (Figure 4-1) is a wholly concealed subsurface basin that lies below the giant Eromanga Basin. The basin overlies a basement of early Paleozoic metamorphic and igneous rocks. The basin formed during the early to middle Devonian Period when the basement was overlain by volcanic and continental and marine clastics. This was followed by more marine deposition and evaporite deposits. The basin may be as much as 8500 meters thick at its deepest.
In the ATP 865P area the equivalent to the Cooper Basin section would be the Permian (Galilee) that comes and goes throughout the area. The Galilee Basin in this area contains a fluvial-deltaic, coal measure related Permian sequence which has been extensively eroded eastward. It thickens to the north east, but generally manifests itself as channel fill with numerous pinch-outs.
The Eromanga Basin is a very large, relatively underexplored, intracratonic basin, of Early Jurassic to Late Cretaceous age and overlies the Adavale basin. The Eromanga Basin covers an area of 1,200,000 sq km of Queensland, New South Wales, South Australia and Northern Territory. It has a maximum sediment thickness of 2,600 m and deposition was relatively continuous and widespread. Sediment thickness in this area ranges from 1000 to almost 2000 metres in the Adavale Basin area.
ATP 865P lies in an area of structural complexity. It is bounded to the west by the Canaway Fault and Quilpie anticline and to the north by the Cothalow Arch. These areas are devoid of Devonian sediments. To the south is the Cheepie Shelf separating the Quilpie Trough from the Cooladdi Trough which both contains thick Devonian Adavale Basin successions. The southern limit of the

Carboniferous Joe Joe Group of the Galilee Basin sequence is present on the north-western side of ATP 865Pand extends just south of the Buckabie 1 well. Depth to economic basement, usually considered to be rocks of Silurian to Ordovician age, ranges from approximately 1500m in the Cothalow Arch block to over 3900m at in the Cooladdi Trough (Gumbardo 1). The main reservoir targets in ATP 865Pinclude reservoirs in the Eromanga sequence and clastics and carbonates in the Adavale sequence. Basement comprises metasediments, granites and volcanic rocks of the Thompson Fold Belt (commonly schist and quartzite) of Early Palaeozoic age.

Figure 4-2 General stratigraphic section
The Devonian (Figure 4-3) rocks overlie basement in erosional/tectonic remnants. The Gumbardo Formation was deposited under continental conditions in a developing rift basin. Unconformably overlying it are the Eastwood Beds, a fluvial unit containing quartzose and sub-labile sandstone, interbedded with siltstone and mudstone. An unconformity separates these strata from the Log Creek Formation. It consists of feldspatho-lithic and quartzose sandstone, siltstone, mudstone, conglomerate and minor siltstone deposited initially as a fluvial succession, but following a marine transgression, deposition occurred in a range of environments from fluvial to deltaic and shallow marine. Associated with the marine transgression was deposition of the Bury Limestone, the lower part of which is laterally equivalent to the Log Creek Formation. It comprises packstone, wackestone, calcareous siltstone and mudstone and was deposited in lagoonal, reef and offshore environments.

The coastal to marginal marine Lissoy Sandstone comprising feldspathic sandstone, minor siltstone and conglomerates, is coeval with the Bury Limestone which continued to represent the offshore environments.

Figure 4-3 Detail of Devonian stratigraphic section
This culminated in a widespread transgressive-regressive succession, the Cooladdi Dolomite. Dolomitisation took place both prior to and during the deposition of the halite-dominant Boree Salt, at the onset of tectonically controlled basin restriction. Unconformably overlying the Cooladdi Dolomite, Boree Salt and Bury Limestone are quartzose sandstone, mudstone, shale and minor limestone of the Etonvale Formation which was deposited in a fluvial to marginal marine environment under arid conditions. The uppermost Devonian unit, the Buckabie Formation consists of red beds of quartzose sandstone and mudstone of fluvial origin. Only gas has been produced from the Buckabie Formation in the nearby Gilmore gas field.

The Galilee Basin is a large (~250,000 km2) intracratonic basin in central Queensland. It is relatively shallow with maximum depth to basement of approximately 3000 meters below surface and contains Late Carboniferous to Middle Triassic aged fluvial, lacustrine and glacial sediments. The southern Galilee contains a thinner Permian sequence and generally thicker Triassic sequence than in the north and has a total of approximately 1400m of sediments.
Sedimentation in the Galilee Basin commenced in Late Carboniferous time and continued to the Mid Triassic with dominantly fluviatile sediments being deposited. Most of the basin is concealed by later sediments of the Eromanga Basin, and only the north-eastern margin is exposed.
Late Carboniferous and earliest Permian sediments were laid down over most of the Galilee Basin. The north-western lobe of the basin, the Lovelle Depression, may have been separated from the main area of the basin throughout this period of deposition.
The thickest section of Late Carboniferous-earliest Permian rocks, in the north-eastern part of the basin (Koburra Trough), was defined as the Joe Joe Group. This Group consists entirely of freshwater sediments including glacial deposits. The sediments were derived mainly from a volcanic source area to the west.
The Early to Middle Permian was a period of non-deposition and minor tectonism in the Galilee Basin. Unnamed sediments of Early Permian age may be present in the Lovelle Depression but over the remainder of the basin, a relatively thin sequence of Middle Permian strata disconformably and unconformably overlies the Late Carboniferous and earliest Permian Joe Joe Group.
A twofold subdivision of the Middle Permian sequence into correlatives of the Colinlea Sandstone of the Springsure Shelf and the Bandanna Formation of the Denison Trough can be recognised on wireline logs from most bores, except in the western and southern areas of the basin. The Colinlea Sandstone correlatives consist of fluviatile sandstone with subordinate mudstone, siltstone and coal. They were derived from volcanic, granitic, and metamorphic source areas and were deposited in a broad, poorly drained floodplain with an overall paleoslope from north to south.
The depositional area shrank considerably in the later Permian and Triassic, and all units are thickest in the northern and north-eastern parts of the basin.
A mountainous region to the north appears to have been a major source area throughout the depositional history of the Galilee Basin. A marked change in the topography of the eastern basin margin during deposition of the Clematis Formation is indicated by the palaeocurrent data. Palaeocurrent measurements from the basal section of the Clematis Formation show that streams flowed westwards.
The geological evolution of the Eromanga Basin closely parallels that of the Surat Basin, and the two basins were joined across the Nebine Ridge almost from their inception. Sedimentation commenced in Early Jurassic time and remained dominantly fluviatile until early in the Cretaceous.
Initial sedimentation, the “Basal Jurassic”, appears to have been confined to areas immediately overlying depositional troughs, where lithological correlatives of the Precipice and Evergreen Formations accumulated.
The Eromanga Basin enlarged enormously during deposition of the fluviatile Hutton Sandstone (Pliensbachian to Bajocian) which can be seen on seismic to onlap the Maneroo Platform. This unit and the overlying Middle Jurassic Birkhead Formation (Bajocian) are the equivalent of the second cycle of sedimentation of the Surat Basin; the Adori Sandstone and Westbourne Formation (Bathonian to Callovian) represent the third cycle. The shales within these cycles form widespread potential source rocks and also act as vertical seals for the interbedded sands.

The Eromanga Basin attained its present configuration in Late Jurassic to Early Cretaceous time during deposition of the Hooray Sandstone (Oxfordian to Berriasian) and its correlatives. The Hooray Sandstone appears to encompass the fourth and fifth cycles of sedimentation of the Surat Basin. In early Cretaceous (late Neocomian) time the sea entered the Eromanga Basin from the north and northwest and the dominantly fluviatile Jurassic sedimentation was replaced by deposition in a marginal marine environment. The Cadna-Owie Formation was deposited in this environment while the overlying Wallumbilla Formation is entirely marine in nature.
During early Albian time, a eustatically controlled fall in sea level coupled with minor uplift of the Nebine and Eulo Ridges resulted in the closure of the eastern seaway between the Eromanga and Surat Basins. Paralic environments prevailed in the southern part of the Eromanga Basin. Contemporaneous deposition in the northern part of the Eromanga Basin took place in restricted marine and lagoonal environments indicating limited communication with the sea in the Carpentaria Basin to the north.
Re-establishment of the northern seaway across the Euroka Arch in late Albian time was marked by deposition of interbedded black shale and limestone of the Toolebuc Formation (Albian). The subsurface extent of this thin, very widespread unit is based on its correlation with a strong, positive gamma-ray anomaly.
Continued Late Albian transgression resulted in the deposition of the Allaru Mudstone representing deposition under normal marine conditions.
The regressive cycle which closed sedimentation in the Eromanga Basin began in late Albian time as the sea withdrew into the Carpentaria Basin. The cycle comprises mainly arenaceous, paralic sediments of Mackunda Formation and lacustrine and low-energy fluviatile sediments of the Winton Formation. Sedimentation in the Eromanga Basin ceased during Cenomanian time.
The deposition of the Winton Formation was followed by a period of intense weathering and lateritisation, during which a hard surface crust, the duricrust, was widely developed on all units of the Cretaceous. This indicates either that during deposition of the Cretaceous rocks the basin sagged, and each successive unit was deposited over a smaller area than the last, or that sagging occurred after deposition of the Winton Formation, with consequent erosion laying bare the older sediments.
Widespread late Paleocene to Eocene fluviatile sandy sediments as much as 140 m thick were spread over much of the region by streams rising in the uplifted margins. The major unit was mapped as Glendower Formation, but is now thought to be continuous with the Eyre Formation in South Australia.
Structural features of the Eromanga Basin generally reflect those of the underlying sedimentary basins and basement. As in the Surat Basin differential compaction and rejuvenation of old fault structures appear to be responsible for observed structures. However, the effect of post-Cretaceous tectonism is more pronounced in the Eromanga Basin where Tertiary compression has reversed the throw on many pre-existing faults to create large thrust-related structures.
The ATP 865P area is located on the south-western side of the current day Adavale Basin and exploration drilling has targeted plays in both the Adavale and Eromanga sequences.


Figure 4-4 Location of basin elements, wells and seismic

5 RESOURCE ASSESSMENT ATP 865P
Sentry mapped a number of conventional prospects and leads within ATP 865P. RISC has assessed the risks and volumes for four prospects and two leads identified by Sentry (Figure 5-1). The classification of prospect or lead is partially dependent on the Sentry proposed work programme for each feature, and on RISC’s assessment of the maturity of the mapping and data availability. The assessment is based on data provided by Sentry and open file data.
All available seismic data has been examined and the prospects and leads all have the structural form, within the bounds of seismic coverage and quality, as mapped by Sentry, with the exception of the Permian Channel lead which is a stratigraphic play and therefore more difficult to define on 2D seismic.

Figure 5-1 Location of prospects and leads in ATP 865P
5.1 Ravenscourt Prospect
Ravenscourt Prospect is a redrill of the Rosebank 1 well which recovered oil over the shakers in the Devonian-Carboniferous Etonvale Formation. The structure is defined by seven 2D seismic lines consisting of two lines across the crest and five surrounding lines. The structure is a 4-way dip closed structure (Figure 5-3) with a fault through the center of the anticline. It is a thrust-related feature formed during the Early Carboniferous Orogeny with salt diapir intrusion/movement into the Jurassic. The reservoir is a low porosity dolomitic limestone that can be vuggy or fractured and is located at the base of the Etonvale Formation. The shales in the lower Etonvale Formation are the likely seal. The source rocks are likely to be in the Early Devonian which is buried up to 4,000 meters in depocentre to south and to the east.
Sentry is intending to drill the Ravenscourt Prospect without any further acquisition of seismic or other data. The Ravenscourt feature is considered a Prospect as the next step in its assessment is

planned to be the drilling of a well. It is considered to be drill ready with the existing dataset. RISC has assessed the relevant 2D seismic lines and agrees that the structure is present and is such a prominent feature that it is a significantly smaller risk than the reservoir quality.
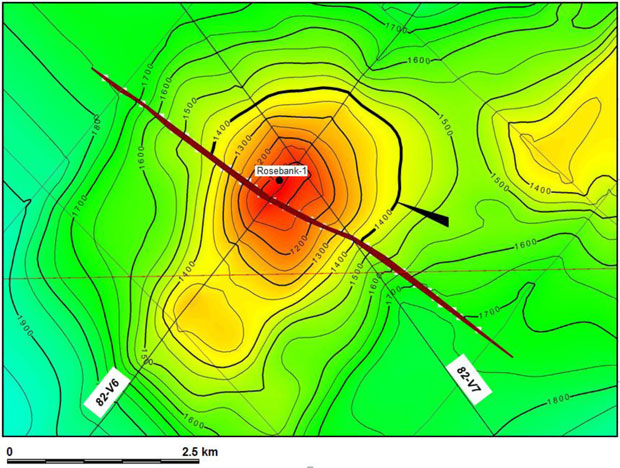
Figure 5-2 Top Etonvale Limestone depth structure map


Figure 5-3 2D seismic line 82-V7
5.1.1 Ravenscourt risk and volume
The G PoS (Geological Probability of Successes) has been calculated for all the prospects and the most mature leads. G PoS is the probability that hydrocarbons of any amount will be discovered by the drilling. The G PoS is calculated as 34%. Quantitative details are provided in Table 5-7 below, however the reasoning for the input values is described here.
Source; considered to be proven with the oil on shakers while drilling. As the generation capacity of the source has not been calculated RISC has assumed for the Best Estimate that the structure is filled to 50% of the column.
Structure; the structure is very likely to be present even though defined on few seismic lines. The concern is over the presence of faults that could breach the structure (seal)
Seal; because the oil appears to come from vuggy or fractured porosity it is not clear if the reservoir is extensive or local and whether an adequate seal is present.
Reservoir; the incomplete log data set does not allow a definitive evaluation of the reservoir. There are still questions about whether the porosity is vuggy or fractured, or the extent of the connected porosity. This risk will remain the highest risk for this prospect until the section can be drilled and logged and cored sufficiently to fully evaluate.
Prospective in-place volumes (Table 5-1) have been calculated by RISC using industry-standard probabilistic software. The parameters with the greatest uncertainty are net-to-gross, area and thickness. The input parameters for the volumes are presented in Appendix 33. The areas were calculated by using a variety of contacts representing fill of 25%, 50% and 100%, with the largest

representing closure at the spill point. The porosity and NTG were based on the Rosebank 1 well. A single point FVF was calculated based on the depth and pressure expected at the target level.
|
Unrisked Prospective Volume
|
Low Estimate
|
Mid Estimate
|
High Estimate
|
|
OOIP MMbbls
|
7
|
32
|
98
|
Table 5-1 Ravenscourt prospective in-place oil volume
5.2 Sherwood Park Prospect
The Sherwood Park Prospect is a large erosional remnant trending north-south with vertical closure of 200m. The structure is defined by 2D seismic consisting of nine dip lines and one strike line (Figure 5-4). The structure is created by erosion of westerly dipping Buckabie Formation at the Carboniferous Unconformity, with major channeling creating closure to the east (Figure 5-5).
The Buckabie Formation is unconformably overlain by Late Permian Bandanna Formation which forms the seal. However, only the upper 60 90 m of this unit is clearly shaly; the major risk is the potential for leakage through thin sands that may be present in lower portion of this unit.
The most likely hydrocarbon sources are Devonian to Carboniferous siltstones and shales, and coals of the Upper Permian Bandanna sealing flanks of the structure. The Sherwood Park Prospect is well placed to access source rocks in the axis of the Galilee Basin.


Figure 5-4 Carboniferous unconformity depth map at Sherwood Park

Figure 5-5 2D seismic line 584R-40 over the Sherwood Park prospect

The Sherwood Park feature is considered by Sentry to be a Prospect as the next step in its assessment is planned to be the drilling of a well. It is considered to be drill ready with the existing dataset.
5.2.1 Sherwood Park risk and volume
The G PoS are summarised in Table 5-7 below, the reasoning for the input values is described here. The G PoS is calculated as 10%.
Source; although there is a known kitchen located nearby between the Rosebank 1 well and Gumbardo 1, there are risks on timing of migration with respect to trap creation, migration pathways and unknown generation volumes.
Structure; the structure is very likely to be present and is reasonably well defined by 2D seismic
Seal; is the major risk because facies of the overlying succession is poorly known. For this erosional remnant to seal it needs the seal to be competent over a large area and a large interval.
Reservoir; although known from Gumbardo 1, 22 km away, the effectiveness and quality at the prospect location is locally unknown.
The input parameters for the volumes are presented in Appendix 33 below. Note that the volumes presented in Table 5-2 are for either oil or gas not both. The areas used for the volume calculations are derived from variation in lower contact of 1740, 1800 and 1839 metres subsea which relates to column fills of 50%, 80% and 100% respectively. The areas are shown on the depth map below.
The proposed reservoirs are the Continental Red Beds of the Upper Devonian to Carboniferous Buckabie Formation. These consist of coarse-grained high energy sandstones and conglomerates which have porosities up to 17%, with an average of 13% in Gumbardo 1 (22 km away). A single FVF was calculated for the depth of the target zone.
|
Unrisked Prospective Volume
|
Low Estimate
|
Best Estimate
|
High Estimate
|
|||
|
100% Oil case - OOIP MMbbls
|
10
|
45
|
124
|
|||
|
100% Gas case - OGIP Bcf
|
7
|
36
|
117
|
Table 5-2 Sherwood Park prospective in-place volume oil OR gas
5.3 Gumbardo Redrill Prospect
Sentry is planning to twin the Gumbardo 1 well to test the 46 metres of hydrocarbons that they interpret to be in the well. Sentry have reinterpreted the Gumbardo 1 well and concluded that there are 46 metres of hydrocarbons present in sandstones of the Lissoy Sandstones. RISC does not support this reinterpretation and have accounted for this by assigning a very low source and seal risk. More detail on the Gumbardo 1 well is in section 3.11.3 above.
The Gumbardo structure is defined by a very sparse grid of at best five 2D lines (Figure 5-6) which give minimal coverage near the crest of the structure.
The Gumbardo feature is considered by Sentry to be a prospect as they consider that the next step in its assessment would be the drilling of a well. It is considered to be drill ready with the existing

dataset.

Figure 5-6 Gumbardo redrill prospect depth structure map
5.3.1 Gumbardo Redrill Prospect risk and volume
The G PoS is calculated as 9%. Source and seal are the most significant risks for this prospect. RISC’ evaluation is that there is evidence to suggest that the most likely outcome is that there are no hydrocarbons present in this structure.
Reservoir: Lissoy Sandstone (as a member of the Log Creek Formation) is considered to be almost certain although the extent and quality are not well known. Porosity is evaluated from sonic only.
Seal: shale lithology above the reservoir is considered to have a good chance of being present and effective
Structure: the structure is likely to be present although it is effectively only defined on two crossing 2D lines. Control for the closing contours to the north east and south are provided by 2D seismic lines not shown on the map above.
Probabilistic volumes are displayed in Table 5-3. The porosity, NTG and FVF have been derived from the Gumbardo-1 well.
|
Unrisked Prospective Volume
|
Low Estimate
|
Best Estimate
|
High Estimate
|
|||
|
100% Oil case - OOIP MMbbls
|
26
|
86
|
210
|
|||
|
100% Gas case - OGIP Bcf
|
31
|
103
|
252
|
Table 5-3 Gumbardo Prospect prospective In-place volume oil OR gas

5.4 Wade Hill Prospect
The Wade Hill feature is considered by Sentry as a prospect, as the next step in their assessment is planned to be the drilling of a well. It is considered to be drill ready with the existing dataset. RISC accepts Sentry’ s definition sa a proposed evaluation proposal.
Wade Hill is located between Gumbardo 1 and Paradise 1 on a structural high that stretches between the two wells. The structure is an anticline defined by compressional tectonics with some closure being independent of the bounding fault. Paradise 1 had “wet gas” shows and Gumbardo 1, according to Sentry, had high hydrocarbon saturations over 46m of porous sand (Lissoy Sandstone) that had an invalid drill stem test in 1963. Sentry also has identified Paradise up-dip as a lead.

Figure 5-7 Gumbardo area depth structure map with prospect and leads
5.4.1 Wade Hill Prospect risk and volume
Paradise 1 and Gumbardo 1 wells have, between them, all the elements for a technically successful well. However the risks are substantial given RISC’ s view that Gumbardo 1 doses not contain any significant hydrocarbons and that Paradise 1 contains shows. These include presence of reasonable reservoirs, presence of hydrocarbons at Paradise 1, and a reasonable potential seal. The structure, while poorly defined by the seismic, is part of a larger high that runs from Paradise 1 to Gumbardo 1 (Figure 5-7). All risks are considered equally likely. The probabilistic volumes are shown in Table 5-4. The volume parameters are derived from Paradise 1 and Gunbardo 1 parameters. A single gross rock volume was used in conjunction with a degree of fill factor of 25%, 500% and 100% to represent the bulk rock volume uncertainty.

|
Unrisked Prospective Volume
|
Low Estimate
|
Best Estimate
|
High Estimate
|
|||
|
100% Oil case - OOIP MMbbls
|
24
|
78
|
179
|
|||
|
100% Gas case - OGIP Bcf
|
29
|
94
|
215
|
Table 5-4 Wade Hill Prospect prospective in-place volume oil OR gas
5.5 Leads
Sentry has also identified a number of leads in the area which range in maturity. The leads that are technically most mature are presented here. Other leads are displayed on the G PoS summary Table 5-7 and their locations are shown on Figure 5-1.
5.5.1 Permian Channel Lead
The Permian channels lead has been defined on the amplitude characteristics of several 2D seismic lines. There is a reasonable chance that the amplitude designated as channels by Sentry are channels, however it is unlikely that the channel dimensions and orientation can be defined without 3D seismic cover.
The Permian channels feature is currently considered a lead. Further seismic may be required to bring it to prospect status; however the relatively low cost of onshore drilling compared to seismic acquisition may lead to project economics re-determining this status.

Figure 5-8 Area of Permian Channel lead time map
Dartmouth 1 intersected the Permian down-dip from where the current Permian channel prospectivity is interpreted. Dartmouth 1 is on the northern end of a N-S trending nose (updip end to the south). While the automated gridding suggests closure at Dartmouth 1 there is no controlling seismic data defines this closure, leading to the interpretation that the Dartmouth 1 well did not test this play.
While sediment of the same age as the interpreted Permian channels have been intersected in Dartmouth 1 they are not channel sands. Hydrocarbons in the stratigraphically lower Rosebank 1 well indicate that a hydrocarbon charge is possible.

5.5.1.1 Permian Channel Lead risk and volume
RISC audit of the volumes concluded that the areas could be smaller than the areas defined by Sentry. Particularly because the well Dartmouth 1 lies in the middle of the channel outline and has not encountered channel sands or hydrocarbons. High porosity sands at this level were encountered in the Dartmouth well. RISC used a mid-case area that is 50% the size of the Sentry most likely area and the low case is 30% of the size. RISC also used a range of thickness to account for the potential variation. Consequently the RISC volume range (Table 5-5) is lower than the Sentry range.
The lack of any definable structure and the inability, with the current data set, to trace out the channels adequately means that the trap is the major risk. Reservoir and seal are unpenetrated in Dartmouth 1, and therefore the risk for these elements is unknown.
|
Unrisked Prospective Volume
|
Low Estimate
|
Best Estimate
|
High Estimate
|
|||
|
OOIP MMbbls
|
6
|
26
|
75
|
Table 5-5 Permian Channel Lead prospective in-place oil volume
5.5.2 Up-dip Buckabie lead
Up-dip Buckabie is a Cretaceous Cadna-owie Formation feature based on the shows in the Buckabie 1 well in this formation; the seismic interpretation at the Top Cadna-owie level is based on only two 2D seismic lines to define the crest.
5.5.2.1 Up-dip Buckabie lead risk and volume
Given minimal seismic control, RISC considers the structural to be major risk for this lead; however, reservoir and source are also considerable risks. Additional seismic is required to delineate this lead prior to drilling. The structure was mapped by the previous operator (Phillips-Sunray) on an irregular grid of approximately six 2D lines. As noted, the current Sentry interpretation is based on only two (1985) 2D seismic lines. The other seismic data is not available (presumed lost). The original time interpretation had the crest at top Blythsdale level to the southeast of the current crest mapped on the Top Cadna-owie Formation in depth. With the current interpretation there is a clear risk that the structure is completely open to the south.
The shows in the Cadna-owie Formation sands were induced by crushing the samples and washing with carbon-tetrachloride. Shows induced by crushing are considered by RISC to indicate in-situ generated hydrocarbons or very low permeability, suggesting poor quality reservoir. At the time of abandonment, Buckabie 1 was considered to be not commercial.
The low, mid and high case areas of the structure were determined by the field being approximately 40%, 60% and 100% filled to spill. Areas were measured from the Sentry depth map. RISC determined that the closing depth contour was at 925 m subsea.
The probabilistic unrisked prospective volumes are shown in Table 5-6.
|
Unrisked Prospective Volume
|
Low Estimate
|
Best Estimate
|
High Estimate
|
|||
|
OOIP MMbbls
|
4
|
17
|
46.7
|
Table 5-6 UpDip Buckabie prospective in-place oil volume

5.5.3 Other potential
Sentry has also mapped out a number of other leads within ATP 865P. These leads have not been assessed for volume or chance of successes. However the seismic data has been examined and the leads all have the structural form, within the bounds of seismic coverage and quality, as mapped by Sentry. Volumes have not been calculated for the Paradise redrill lead as the updip potential is likely to be very small.
RISCS has assessed the chance of success for some of the slightly more mature leads that are close to the prospects or are reasonably well defined by the 2D seismic.
5.6 Risk and volume summary
The table below is an assessment of the geological chances of success (G PoS) for all currently identified leads and prospects in permit ATP 865P. The rational used to assign the individual risks has been consistently applied for throughout the permit.
In Table 5-7 the term discovery is used to identify the wells Sentry consider discoveries. RISC considers these to be prospects or leads. The probabilistic volumes tabulated are classed as undiscovered in-place hydrocarbons.
|
Name
|
Rank
|
Source
|
Sructure
|
Reservoir
|
Seal
|
PoS
|
||||||
|
Cretaceous Leads
|
||||||||||||
|
Buckabie updip
|
Lead
|
0.6
|
0.5
|
0.6
|
0.6
|
11%
|
||||||
|
Varna
|
Lead
|
not assessed
|
||||||||||
|
Bulyera
|
Lead
|
not assessed
|
||||||||||
|
Ambathala
|
Lead
|
not assessed
|
||||||||||
|
East Rosebank
|
Lead
|
not assessed
|
||||||||||
|
Devonian
|
||||||||||||
|
Gumbardo Redrill
|
Discovery/Prospect
|
0.3
|
0.7
|
0.9
|
0.5
|
9%
|
||||||
|
Paradise Redrill
|
Discovery/Lead
|
1
|
1
|
0.5
|
0.7
|
35%
|
||||||
|
Wade Hill
|
Prospect
|
0.7
|
0.7
|
0.7
|
0.7
|
24%
|
||||||
|
SW Buckabie
|
Lead
|
0.5
|
0.5
|
0.7
|
0.6
|
11%
|
||||||
|
Gumbardo Stepout
|
Lead
|
0.8
|
0.5
|
0.7
|
0.6
|
17%
|
||||||
|
West
|
||||||||||||

|
Name
|
Rank
|
Source
|
Sructure
|
Reservoir
|
Seal
|
PoS
|
||||||
|
Gumbardo South
|
Lead
|
0.5
|
0.5
|
0.7
|
0.6
|
11%
|
||||||
|
Blackwater Creek
|
Lead
|
0.5
|
0.6
|
0.7
|
0.6
|
13%
|
||||||
|
Glenidol
|
Lead
|
0.5
|
0.6
|
0.7
|
0.6
|
13%
|
||||||
|
Sherwood Park
|
Prospect
|
0.6
|
0.7
|
0.6
|
0.4
|
10%
|
||||||
|
Ravenscourt
|
Discovery/Prospect
|
1
|
0.8
|
0.6
|
0.7
|
34%
|
||||||
|
Rosebank redrill
|
||||||||||||
|
Bilby
|
Lead
|
not assessed
|
||||||||||
|
Carney
|
Lead
|
not assessed
|
||||||||||
|
Permian Leads
|
||||||||||||
|
Channels
|
Lead
|
0.6
|
0.4
|
0.5
|
0.5
|
6%
|
Table 5-7 Summary of Geological Probability of Success (G PoS)
A summary of the probabilistically derived Low, Best and High undiscovered petroleum-in-place for he selected leads and prospects evaluated by RISC is shown in Table 5-8.
It should be noted that because there is a degree of independence between the individual estimates arithmetic addition will result in a Low aggregate that will have a greater than 90% confidence level and a High aggregate that will have a less than 10% confidence level.
Undiscovered petroleum has associated chances of discovery and development which represent the risks of failure. The resource estimates contained in this report have not been adjusted for these risks.
A number of the prospects are leads may contain either oil or gas. In this event, we have formed a judgment about which occurrence we believe to be more likely and reported this quantity in Table 5-8 , however both oil and gas estimates are provided elsewhere in this report. Volumes have not been assigned for leads not reviewed by RISC.

|
Prospect & lead
|
100% Oil Case - OOIP
|
100% Gas Case - OGIP
|
G PoS
|
||||||||||
|
Low Estimate MMstb
|
Best Estimate MMstb
|
High Estimate MMstb
|
Low Estimate Bcf
|
Best Estimate Bcf
|
High Estimate Bcf
|
||||||||
|
Ravenscourt -Rosebank redrill
|
7
|
32
|
98
|
-
|
-
|
-
|
34%
|
||||||
|
Sherwood Park
|
-
|
-
|
-
|
7
|
36
|
117
|
10%
|
||||||
|
Wade Hill
|
-
|
-
|
-
|
29
|
94
|
215
|
24%
|
||||||
|
Gumbardo redrill
|
-
|
-
|
-
|
31
|
103
|
252
|
18%
|
||||||
|
Updip Buckabie
|
4
|
17
|
47
|
-
|
-
|
-
|
11%
|
||||||
|
Permian channels
|
6
|
26
|
75
|
-
|
-
|
-
|
6%
|
||||||
|
Total arithmetic addition
|
17
|
75
|
219
|
66
|
233
|
584
|
|||||||
Table 5-8 Summary of ATP 865P undiscovered in place volumes for selected leads and prospects as at 15 January 2011

6 CERTIFICATE OF QUALIFICATION
I, Patrick Taylor, hereby certify:
|
1.
|
I am an employee and Director of RISC (UK) Limited, 53 Chandos Place, London WC2N 4HS, United Kingdom, being a wholly-owned subsidiary of RISC Pty Ltd. (RISC). RISC has prepared an independent review of conventional petroleum properties in the Adavale Basin, Queensland, Australia on behalf of Sentry Petroleum Ltd.. I have reviewed and accepted this report and its findings.
|
|
|
2.
|
I am a Chartered Petroleum Engineer and Fellow of the Energy Institute. I am also a Fellow of the London Geological Society and a Member of the Society of Petroleum Engineers.
|
|
|
3.
|
I have over 40 years’ experience in the conduct and supervision of operations, evaluations and studies related to oil and gas fields, including over 30 years with BP Exploration and over 4 years in my current position.
|
|
|
4.
|
I do not have or expect to receive any direct or indirect holdings in Sentry Petroleum Ltd.
|

Patrick Taylor
Director RISC
(UK) Limited

7 APPENDIX 1: AREA DEFINITION FROM GOVERNMENT GAZETTAL NOTICES.
|
Area LR2007 1-5P
|
|||
|
2,422 sub-blocks
|
CHAR 1801 All
|
||
|
Charleville block identification map
|
CHAR 1802 All
|
||
|
Blocks Sub-blocks
|
CHAR 1803 All
|
||
|
CHAR 1585 All
|
CHAR 1804 All
|
||
|
CHAR 1586 All
|
CHAR 1805 All
|
||
|
CHAR 1587 All
|
CHAR 1806 All
|
||
|
CHAR 1588 All
|
CHAR 1807 All
|
||
|
CHAR 1589 All
|
CHAR 1808 All
|
||
|
CHAR 1590 All
|
CHAR 1809 All
|
||
|
CHAR 1591 All
|
CHAR 1810 All
|
||
|
CHAR 1592 All
|
CHAR 1811 All
|
||
|
CHAR 1593 All
|
CHAR 1812 a,b,c,f,g,h,l,m,n,o,p,q,r,s,t,u,
|
||
|
CHAR 1594 All
|
v,w,x,y,z
|
||
|
CHAR 1595 All
|
CHAR 1813 q,r,s,t,u,v,w,x,y,z
|
||
|
CHAR 1596 All
|
CHAR 1814 b,c,d,e,g,h,j,k,m,n,o,p,q,r,s,
|
||
|
CHAR 1597 All
|
t,u,v,w,x,y,z
|
||
|
CHAR 1598 All
|
CHAR 1815 All
|
||
|
CHAR 1599 All
|
CHAR 1816 All
|
||
|
CHAR 1600 All
|
CHAR 1817 All
|
||
|
CHAR 1601 All
|
CHAR 1873 All
|
||
|
CHAR 1657 All
|
CHAR 1874 All
|
||
|
CHAR 1658 All
|
CHAR 1875 All
|
||
|
CHAR 1659 All
|
CHAR 1876 All
|
||
|
CHAR 1660 All
|
CHAR 1877 All
|
||
|
CHAR 1661 All
|
CHAR 1878 All
|
||
|
CHAR 1662 All
|
CHAR 1879 All
|
||
|
CHAR 1663 All
|
CHAR 1880 All
|
||
|
CHAR 1664 All
|
CHAR 1881 All
|
||
|
CHAR 1665 All
|
CHAR 1882 All
|
||
|
CHAR 1666 All
|
CHAR 1883 All
|
||
|
CHAR 1667 All
|
CHAR 1884 All
|
||
|
CHAR 1668 All
|
CHAR 1885 All
|
||
|
CHAR 1669 a,b,c,d,e
|
CHAR 1886 All
|
||
|
CHAR 1670 a,b,c,d,e,g,h,j,k,m,n,o,p,q,r,s,t,u,v,w,x,y,z
|
CHAR 1887 All
|
||
|
CHAR 1671 All
|
CHAR 1888 All
|
||
|
CHAR 1672 All
|
CHAR 1889 All
|
||
|
CHAR 1673 All
|
CHAR 1945 All
|
||
|
CHAR 1729 All
|
CHAR 1946 All
|
||
|
CHAR 1730 All
|
CHAR 1947 All
|
||
|
CHAR 1731 All
|
CHAR 1948 All
|
||
|
CHAR 1732 All
|
CHAR 2017 All
|
||
|
CHAR 1733 All
|
CHAR 2018 All
|
||
|
CHAR 1734 All
|
CHAR 2019 All
|
||
|
CHAR 1735 All
|
CHAR 2020 All
|
||
|
CHAR 1736 All
|
CHAR 2090 All
|
||
|
CHAR 1737 All
|
CHAR 2091 All
|
||
|
CHAR 1738 All
|
CHAR 2162 All
|
||
|
CHAR 1739 All
|
CHAR 2163 All
|
||
|
CHAR 1740 a,b,c,d,e,f,g,h,j,l,m,n,o,q,r,s,t,v,w,x,y
|
CHAR 2233 All
|
||
|
CHAR 1742 b,c,d,e,g,h,j,k,m,n,o,p,r,s,t,u,w,x,y,z
|
CHAR 2234 All
|
||
|
CHAR 1743 All
|
CHAR 2235 All
|
||
|
CHAR 1744 All
|
|||
|
CHAR 1745 All
|

8 APPENDIX 2: INPUT PARAMETERS FOR PROBABILISTIC VOLUME CALCULATION
|
Name
|
Unit
|
Shape
|
Min
|
P90
|
P50
|
P10
|
Max
|
Mode
|
Mean
|
||||||||||
|
Area
|
km2
|
Lognor
|
0.926
|
2.44
|
5.04
|
10.4
|
27.5
|
3.67
|
5.92
|
||||||||||
|
Thickness
|
m
|
Normal
|
0
|
20
|
40
|
60
|
86.8
|
40
|
40
|
||||||||||
|
Shape factor
|
fr
|
Triang
|
0.599
|
0.718
|
0.864
|
0.955
|
1
|
0.95
|
0.85
|
||||||||||
|
Deg. of fill
|
%
|
Single
|
100
|
100
|
100
|
100
|
100
|
100
|
100
|
||||||||||
|
Net-to-gross
|
%
|
Normal
|
0
|
10
|
50
|
90
|
144
|
50
|
50
|
||||||||||
|
Porosity
|
%
|
Normal
|
5.98
|
10
|
13
|
16
|
20
|
13
|
13
|
||||||||||
|
Sw
|
%
|
Normal
|
16.6
|
30
|
40
|
50
|
63.4
|
40
|
40
|
||||||||||
|
FVF (Bo)
|
vol/vol
|
Single
|
1.1
|
1.1
|
1.1
|
1.1
|
1.1
|
1.1
|
1.1
|
||||||||||
|
Oil rec fac
|
%
|
Single
|
100
|
100
|
100
|
100
|
100
|
100
|
100
|
Table 8-1 Ravenscourt - oil only case
|
Name
|
Unit
|
Shape
|
Min
|
P90
|
P50
|
P10
|
Max
|
Mode
|
Mean
|
||||||||||
|
Area
|
km2
|
Normal
|
0
|
1.85
|
16.5
|
31.1
|
50.7
|
16.5
|
16.5
|
||||||||||
|
Thickness
|
m
|
Triang
|
32.7
|
70
|
116
|
150
|
175
|
130
|
113
|
||||||||||
|
Shape factor
|
fr
|
Normal
|
0.266
|
0.4
|
0.5
|
0.6
|
0.734
|
0.5
|
0.5
|
||||||||||
|
Deg. of fill
|
%
|
Single
|
100
|
100
|
100
|
100
|
100
|
100
|
100
|
||||||||||
|
Net-to-gross
|
%
|
Normal
|
0
|
10
|
20
|
30
|
43.4
|
20
|
20
|
||||||||||
|
Porosity
|
%
|
Normal
|
2.98
|
7
|
10
|
13
|
17
|
10
|
10
|
||||||||||
|
Sw
|
%
|
Normal
|
26.6
|
40
|
50
|
60
|
73.4
|
50
|
50
|
||||||||||
|
FVF (Bo)
|
vol/vol
|
Single
|
1.1
|
1.1
|
1.1
|
1.1
|
1.1
|
1.1
|
1.1
|
||||||||||
|
Oil rec fac%
|
Single
|
100
|
100
|
100
|
100
|
100
|
100
|
100
|
Table 8-2 Sherwood Park - oil only case

|
Name
|
Unit
|
Shape
|
Min
|
P90
|
P50
|
P10
|
Max
|
Mode
|
Mean
|
||||||||||
|
Area
|
km2
|
Normal
|
0
|
1.85
|
16.5
|
31.1
|
50.7
|
16.5
|
16.5
|
||||||||||
|
Thickness
|
m
|
Triang
|
32.7
|
70
|
116
|
150
|
175
|
130
|
113
|
||||||||||
|
Shape factor
|
fr
|
Normal
|
0.266
|
0.4
|
0.5
|
0.6
|
0.734
|
0.5
|
0.5
|
||||||||||
|
Deg. of fill
|
%
|
Normal
|
9.78
|
50
|
80
|
110
|
150
|
80
|
80
|
||||||||||
|
Net-to-gross
|
%
|
Normal
|
0
|
10
|
20
|
30
|
43.4
|
20
|
20
|
||||||||||
|
Porosity
|
%
|
Normal
|
0
|
7
|
13
|
19
|
27
|
13
|
13
|
||||||||||
|
Sw
|
%
|
Normal
|
26.6
|
40
|
50
|
60
|
73.4
|
50
|
50
|
||||||||||
|
Dry gas FVF (1/Bg)
|
vol/vol
|
Single
|
152
|
152
|
152
|
152
|
152
|
152
|
152
|
||||||||||
|
Gas rec fac
|
%
|
Single
|
100
|
100
|
100
|
100
|
100
|
100
|
100
|
Table 8-3 Sherwood Park - gas only case
|
Name
|
Unit
|
Shape
|
Min
|
P90
|
P50
|
P10
|
Max
|
Mode
|
Mean
|
||||||||||
|
Area
|
km2
|
Normal
|
0
|
13.2
|
34
|
54.8
|
82.7
|
34
|
34
|
||||||||||
|
Thickness
|
m
|
Lognor
|
26.6
|
50
|
80
|
128
|
240
|
69.9
|
85.6
|
||||||||||
|
Shape factor
|
fr
|
Single
|
0.4
|
0.4
|
0.4
|
0.4
|
0.4
|
0.4
|
0.4
|
||||||||||
|
Deg. of fill
|
%
|
Single
|
100
|
100
|
100
|
100
|
100
|
100
|
100
|
||||||||||
|
Net-to-gross
|
%
|
Normal
|
8.3
|
15
|
20
|
25
|
31.7
|
20
|
20
|
||||||||||
|
Porosity
|
%
|
Normal
|
0
|
7
|
13
|
19
|
27
|
13
|
13
|
||||||||||
|
Sw
|
%
|
Normal
|
16.6
|
30
|
40
|
50
|
63.4
|
40
|
40
|
||||||||||
|
Dry gas FVF (1/Bg)
|
vol/vol
|
Single
|
194
|
194
|
194
|
194
|
194
|
194
|
194
|
||||||||||
|
Gas rec fac%
|
Single
|
100
|
100
|
100
|
100
|
100
|
100
|
100
|
Table 8-4 Gumbardo Re-drill - gas only case

|
Name
|
Unit
|
Shape
|
Min
|
P90
|
P50
|
P10
|
Max
|
Mode
|
Mean
|
||||||||||
|
Area
|
km2
|
Normal
|
0
|
13.2
|
34
|
54.8
|
82.7
|
34
|
34
|
||||||||||
|
Thickness
|
m
|
Lognor
|
26.6
|
50
|
80
|
128
|
240
|
69.9
|
85.6
|
||||||||||
|
Shape factor
|
fr
|
Single
|
0.4
|
0.4
|
0.4
|
0.4
|
0.4
|
0.4
|
0.4
|
||||||||||
|
Deg. of fill
|
%
|
Single
|
100
|
100
|
100
|
100
|
100
|
100
|
100
|
||||||||||
|
Net-to-gross
|
%
|
Normal
|
8.3
|
15
|
20
|
25
|
31.7
|
20
|
20
|
||||||||||
|
Porosity
|
%
|
Normal
|
0
|
7
|
13
|
19
|
27
|
13
|
13
|
||||||||||
|
Sw
|
%
|
Normal
|
16.6
|
30
|
40
|
50
|
63.4
|
40
|
40
|
||||||||||
|
FVF (Bo)
|
vol/vol
|
Single
|
1.1
|
1.1
|
1.1
|
1.1
|
1.1
|
1.1
|
1.1
|
||||||||||
|
Oil rec fac
|
%
|
Single
|
100
|
100
|
100
|
100
|
100
|
100
|
100
|
Table 8-5 Gumbardo Re-drill - oil only case
|
Name
|
Unit
|
Shape
|
Min
|
P90
|
P50
|
P10
|
Max
|
Mode
|
Mean
|
||||||||||
|
GRV
|
km2.m
|
Single
|
1026
|
1026
|
1026
|
1026
|
1026
|
1026
|
1026
|
||||||||||
|
Deg. of fill
|
%
|
Normal
|
0
|
25
|
50
|
75
|
109
|
50
|
50
|
||||||||||
|
Net-to-gross
|
%
|
Normal
|
0
|
20
|
40
|
60
|
86.8
|
40
|
40
|
||||||||||
|
Porosity
|
%
|
Normal
|
0
|
7
|
13
|
19
|
27
|
13
|
13
|
||||||||||
|
Sw
|
%
|
Normal
|
16.6
|
30
|
40
|
50
|
63.4
|
40
|
40
|
||||||||||
|
Dry gas FVF (1/Bg)
|
vol/vol
|
Single
|
195
|
195
|
195
|
195
|
195
|
195
|
195
|
||||||||||
|
Gas rec fac
|
%
|
Single
|
100
|
100
|
100
|
100
|
100
|
100
|
100
|
Table 8-6 Wade Hill - gas only case

|
Name
|
Unit
|
Shape
|
Min
|
P90
|
P50
|
P10
|
Max
|
Mode
|
Mean
|
||||||||||
|
GRV
|
km2.m
|
Single
|
1026
|
1026
|
1026
|
1026
|
1026
|
1026
|
1026
|
||||||||||
|
Deg. of fill
|
%
|
Normal
|
-8.52
|
25
|
50
|
75
|
109
|
50
|
50
|
||||||||||
|
Net-to-gross
|
%
|
Normal
|
-6.82
|
20
|
40
|
60
|
86.8
|
40
|
40
|
||||||||||
|
Porosity
|
%
|
Normal
|
-1.04
|
7
|
13
|
19
|
27
|
13
|
13
|
||||||||||
|
Sw
|
%
|
Normal
|
16.6
|
30
|
40
|
50
|
63.4
|
40
|
40
|
||||||||||
|
FVF (Bo)
|
vol/vol
|
Single
|
1.1
|
1.1
|
1.1
|
1.1
|
1.1
|
1.1
|
1.1
|
||||||||||
|
Oil rec fac
|
%
|
Single
|
100
|
100
|
100
|
100
|
100
|
100
|
100
|
Table 8-7 Wade Hill - oil only case
|
Name
|
Unit
|
Shape
|
Min
|
P90
|
P50
|
P10
|
Max
|
Mode
|
Mean
|
||||||||||
|
Area
|
km2
|
Normal
|
0
|
7.6
|
15.3
|
23
|
33.3
|
15.3
|
15.3
|
||||||||||
|
Thickness
|
m
|
Normal
|
0
|
10
|
18
|
26
|
36.7
|
18
|
18
|
||||||||||
|
Shape factor
|
fr
|
Normal
|
0.232
|
0.5
|
0.7
|
0.9
|
1.17
|
0.7
|
0.7
|
||||||||||
|
Deg. of fill
|
%
|
Single
|
100
|
100
|
100
|
100
|
100
|
100
|
100
|
||||||||||
|
Net-to-gross
|
%
|
Normal
|
0
|
10
|
25
|
40
|
60.1
|
25
|
25
|
||||||||||
|
Porosity
|
%
|
Normal
|
0
|
10
|
20
|
30
|
43.4
|
20
|
20
|
||||||||||
|
Sw
|
%
|
Normal
|
16.6
|
30
|
40
|
50
|
63.4
|
40
|
40
|
||||||||||
|
FVF (Bo)
|
vol/vol
|
Single
|
1.05
|
1.05
|
1.05
|
1.05
|
1.05
|
1.05
|
1.05
|
||||||||||
|
Oil rec fac
|
%
|
Single
|
100
|
100
|
100
|
100
|
100
|
100
|
100
|
Table 8-8 Permian Channel lead - oil only case

|
Name
|
Unit
|
Shape
|
Min
|
P90
|
P50
|
P10
|
Max
|
Mode
|
Mean
|
||||||||||
|
Area
|
km2
|
Normal
|
0
|
0.698
|
8.7
|
16.7
|
27.4
|
8.7
|
8.7
|
||||||||||
|
Thickness
|
m
|
Lognor
|
4.54
|
9
|
15
|
25
|
49.6
|
12.8
|
16.2
|
||||||||||
|
Shape factor
|
fr
|
Normal
|
0.266
|
0.4
|
0.5
|
0.6
|
0.734
|
0.5
|
0.5
|
||||||||||
|
Deg. of fill
|
%
|
Single
|
100
|
100
|
100
|
100
|
100
|
100
|
100
|
||||||||||
|
Net-to-gross
|
%
|
Normal
|
26.6
|
40
|
50
|
60
|
73.4
|
50
|
50
|
||||||||||
|
Porosity
|
%
|
Normal
|
3.61
|
13
|
20
|
27
|
36.4
|
20
|
20
|
||||||||||
|
Sw
|
%
|
Normal
|
26.6
|
40
|
50
|
60
|
73.4
|
50
|
50
|
||||||||||
|
FVF (Bo)
|
vol/vol
|
Single
|
1.1
|
1.1
|
1.1
|
1.1
|
1.1
|
1.1
|
1.1
|
||||||||||
|
Oil rec fac
|
%
|
Single
|
100
|
100
|
100
|
100
|
100
|
100
|
100
|
Table 8-9 UpDip Buckabie lead - oil only case

9 LIST OF TERMS
The following lists, along with a brief definition, abbreviated terms that are commonly used in the oil and gas industry and which may be used in this report.
|
Abbreviation
|
Definition
|
|||
|
1P
|
Equivalent to Proved reserves or Proved in-place quantities, depending on the context.
|
|||
|
1Q
|
1st quarter
|
|||
|
2P
|
The sum of Proved and Probable reserves or in-place quantities, depending on the context.
|
|||
|
2Q
|
2nd quarter
|
|||
|
2D
|
Two dimensional
|
|||
|
3D
|
Three dimensional
|
|||
|
4D
|
Four dimensional time lapsed 3D in relation to seismic
|
|||
|
3P
|
The sum of Proved, Probable and Possible Reserves or in-place quantities, depending on the context.
|
|||
|
3Q
|
3rd quarter
|
|||
|
4Q
|
4th quarter
|
|||
|
AEO
|
US Energy Information Administration’s Annual Energy Outlook
|
|||
|
AFE
|
Authority for Expenditure
|
|||
|
Boe
|
US barrels of oil equivalent
|
|||
|
Bbl
|
US barrel
|
|||
|
bbl/d
|
US barrels per day
|
|||
|
Bcf
|
Billion (109) cubic feet
|
|||
|
Bcm
|
Billion (109) cubic meters
|
|||
|
BFPD
|
Barrels of fluid per day
|
|||
|
BOPD
|
Barrels of oil per day
|
|||
|
BTU
|
British Thermal Units
|

|
Abbreviation
|
Definition
|
|||
|
BWPD
|
Barrels of water per day
|
|||
|
C
|
Celsius
|
|||
|
Capex
|
Capital expenditure
|
|||
|
CAPM
|
Capital asset pricing model
|
|||
|
CGR
|
Condensate Gas Ratio usually expressed as bbl/MMscf
|
|||
|
COGEH
|
Canadian Oil and Gas Evaluation Handbook
|
|||
|
Contingent Resources
|
Those quantities of petroleum estimated, as of a given date, to be potentially recoverable from known accumulations by application of development projects but which are not currently considered to be commercially recoverable due to one or more contingencies. Contingent Resources are a class of discovered recoverable resources as defined in the SPE-PRMS.
|
|||
|
CO2
|
Carbon dioxide
|
|||
|
Cp
|
Centipoise (measure of viscosity)
|
|||
|
CPI
|
Consumer Price Index
|
|||
|
Deg
|
Degrees
|
|||
|
DHI
|
Direct hydrocarbon indicator
|
|||
|
Discount Rate
|
The interest rate used to discount future cash flows into a dollars of a reference date
|
|||
|
DST
|
Drill stem test
|
|||
|
E&P
|
Exploration and Production
|
|||
|
Eg
|
Gas expansion factor. Gas volume at standard (surface) conditions / gas volume at reservoir conditions (pressure & temperature)
|
|||
|
EIA
|
US Energy Information Administration
|
|||
|
EMV
|
Expected Monetary Value
|
|||
|
EOR
|
Enhanced Oil Recovery
|
|||
|
ESP
|
Electric submersible pump
|

|
Abbreviation
|
Definition
|
|||
|
EUR
|
Economic ultimate recovery
|
|||
|
Expectation
|
The mean of a probability distribution
|
|||
|
F
|
Degrees Fahrenheit
|
|||
|
FDP
|
Field Development Plan
|
|||
|
FEED
|
Front end engineering design
|
|||
|
FID
|
Final investment decision
|
|||
|
Fm
|
Formation
|
|||
|
FPSO
|
Floating offshore production and storage unit
|
|||
|
FWL
|
Free water level
|
|||
|
FVF
|
Formation volume factor
|
|||
|
GIIP
|
Gas Initially In Place
|
|||
|
GJ
|
Giga (109) joules
|
|||
|
GOC
|
Gas-oil contact
|
|||
|
GOR
|
Gas oil ratio
|
|||
|
G PoS
|
Geological probability of success
|
|||
|
GRV
|
Gross rock volume
|
|||
|
GSA
|
Gas sales agreement
|
|||
|
GTL
|
Gas To Liquid(s)
|
|||
|
GWC
|
Gas water contact
|
|||
|
H2S
|
Hydrogen sulphide
|
|||
|
HHV
|
Higher heating value
|
|||
|
ID
|
Internal diameter
|
|||
|
IRR
|
Internal Rate of Return is the discount rate that results in the NPV being equal to zero.
|

|
Abbreviation
|
Definition
|
|||
|
JV(P)
|
Joint Venture (Partners)
|
|||
|
Kh
|
Horizontal permeability
|
|||
|
km2
|
Square kilometres
|
|||
|
Krw
|
Relative permeability to water
|
|||
|
Kv
|
Vertical permeability
|
|||
|
kPa
|
Kilo (thousand) pascal (measurement of pressure)
|
|||
|
Mstb/d
|
Thousand US barrels per day
|
|||
|
LIBOR
|
London inter-bank offered rate
|
|||
|
LNG
|
Liquefied Natural Gas
|
|||
|
LTBR
|
Long-Term Bond Rate
|
|||
|
M
|
Metres
|
|||
|
MDT
|
Modular dynamic formation tester
|
|||
|
mD
|
Millidarcies (permeability)
|
|||
|
MJ
|
Mega (106) Joules
|
|||
|
MMbbl
|
Million US barrels
|
|||
|
MMscf(d)
|
Million standard cubic feet (per day)
|
|||
|
MMstb
|
Million US stock tank barrels
|
|||
|
MOD
|
Money of the Day (nominal dollars) as opposed to money in real terms
|
|||
|
MOU
|
Memorandum of Understanding
|
|||
|
Mscf
|
Thousands standard cubic feet
|
|||
|
Mstb
|
Thousand US stock tank barrels
|
|||
|
MPa
|
Mega (106) pascal (measurement of pressure)
|
|||
|
Mss
|
Metres subsea
|
|||
|
MSV
|
Mean Success Volume
|

|
Abbreviation
|
Definition
|
|||
|
mTVDss
|
Metres true vertical depth subsea
|
|||
|
MW
|
Megawatt
|
|||
|
NPV
|
Net Present Value (of a series of cash flows)
|
|||
|
NTG
|
Net to Gross (ratio)
|
|||
|
ODT
|
Oil down to
|
|||
|
OGIP
|
Original Gas In Place
|
|||
|
OOIP
|
Original Oil in Place
|
|||
|
Opex
|
Operating expenditure
|
|||
|
OWC
|
Oil-water contact
|
|||
|
P90, P50, P10
|
90%, 50% & 10% probabilities respectively that the stated quantities will be equalled or exceeded. The P90, P50 and P10 quantities correspond to the Proved (1P), Proved + Probable (2P) and Proved + Probable + Possible (3P) confidence levels respectively.
|
|||
|
PBU
|
Pressure build-up
|
|||
|
PHIT
|
Total porosity
|
|||
|
PJ
|
Peta (1015) Joules
|
|||
|
POS
|
Probability of Success
|
|||
|
Possible Reserves
|
As defined in the SPE-PRMS, an incremental category of estimated recoverable volumes associated with a defined degree of uncertainty. Possible Reserves are those additional reserves which analysis of geoscience and engineering data suggest are less likely to be recoverable than Probable Reserves. The total quantities ultimately recovered from the project have a low probability to exceed the sum of Proved plus Probable plus Possible (3P) which is equivalent to the high estimate scenario. When probabilistic methods are used, there should be at least a 10% probability that the actual quantities recovered will equal or exceed the 3P estimate.
|
|||
|
Probable Reserves
|
As defined in the SPE-PRMS, an incremental category of estimated recoverable volumes associated with a defined degree of uncertainty. Probable Reserves are those additional Reserves that are less likely to be recovered than Proved Reserves but more certain to be recovered than Possible Reserves. It is equally likely that actual remaining quantities recovered will be greater than or less than the sum of the estimated
|

|
Abbreviation
|
Definition
|
|||
|
Proved plus Probable Reserves (2P). In this context, when probabilistic methods are used, there should be at least a 50% probability that the actual quantities recovered will equal or exceed the 2P estimate.
|
||||
|
Prospective Resources
|
Those quantities of petroleum which are estimated, as of a given date, to be potentially recoverable from undiscovered accumulations as defined in the SPE-PRMS.
|
|||
|
Proved Reserves
|
As defined in the SPE-PRMS, an incremental category of estimated recoverable volumes associated with a defined degree of uncertainty Proved Reserves are those quantities of petroleum, which by analysis of geoscience and engineering data, can be estimated with reasonable certainty to be commercially recoverable, from a given date forward, from known reservoirs and under defined economic conditions, operating methods, and government regulations. If deterministic methods are used, the term reasonable certainty is intended to express a high degree of confidence that the quantities will be recovered. If probabilistic methods are used, there should be at least a 90% probability that the quantities actually recovered will equal or exceed the estimate. Often referred to as 1P, also as “Proven”.
|
|||
|
PSC
|
Production Sharing Contract
|
|||
|
PSDM
|
Pre-stack depth migration
|
|||
|
PSTM
|
Pre-stack time migration
|
|||
|
Psia
|
Pounds per square inch pressure absolute
|
|||
|
p.u.
|
Porosity unit e.g. porosity of 20% +/- 2 p.u. equals a porosity range of 18% to 22%
|
|||
|
PVT
|
Pressure, volume & temperature
|
|||
|
QA
|
Quality assurance
|
|||
|
QC
|
Quality control
|
|||
|
rb/stb
|
Reservoir barrels per stock tank barrel under standard conditions
|
|||
|
RFT
|
Repeat Formation Test
|
|||
|
Real Terms (RT)
|
Real Terms (in the reference date dollars) as opposed to Nominal Terms of Money of the Day
|
|||
|
Reserves
|
RESERVES are those quantities of petroleum anticipated to be commercially recoverable by application of development projects to known accumulations from a given date forward under defined conditions.
|

|
Abbreviation
|
Definition
|
|||
|
Reserves must further satisfy four criteria: they must be discovered, recoverable, commercial, and remaining (as of the evaluation date) based on the development project(s) applied. Reserves are further categorised in accordance with the level of certainty associated with the estimates and may be sub-classified based on project maturity and/or characterized by development and production status.
|
||||
|
RISC
|
Resource Investment Strategy Consultants (t/a RISC Pty Ltd Authors of this report)
|
|||
|
RT
|
Measured from Rotary Table or Real Terms, depending on context
|
|||
|
SC
|
Service Contract
|
|||
|
Scf
|
Standard cubic feet (measured at 60 degrees F and 14.7 psia)
|
|||
|
Sg
|
Gas saturation
|
|||
|
Sgr
|
Residual gas saturation
|
|||
|
SRD
|
Seismic reference datum lake level
|
|||
|
SPE
|
Society of Petroleum Engineers
|
|||
|
SPE-PRMS
|
Petroleum Resources Management System, approved by the Board of the SPE March 2007 and endorsed by the Boards of Society of Petroleum Engineers, American Association of Petroleum Geologists, World Petroleum Council and Society of Petroleum Evaluation Engineers.
|
|||
|
s.u.
|
Fluid saturation unit. e.g. saturation of 80% +/- 10 s.u. equals a saturation range of 70% to 90%
|
|||
|
Ss
|
Subsea
|
|||
|
Stb
|
Stock tank barrels
|
|||
|
STEO
|
Short term energy outlook
|
|||
|
STOIIP
|
Stock Tank Oil Initially In Place
|
|||
|
Sw
|
Water saturation
|
|||
|
TCM
|
Technical committee meeting
|
|||
|
Tcf
|
Trillion (1012) cubic feet
|
|||
|
TJ
|
Tera (1012) Joules
|

|
Abbreviation
|
Definition
|
|||
|
TLP
|
Tension Leg Platform
|
|||
|
TRSSV
|
Tubing retrievable subsurface safety valve
|
|||
|
TSX
|
Toronto Stock Exchange
|
|||
|
TVD
|
True vertical depth
|
|||
|
US$
|
United States dollar
|
|||
|
US$million
|
Million United States dollars
|
|||
|
WACC
|
Weighted average cost of capital
|
|||
|
WHFP
|
Well Head Flowing Pressure
|
|||
|
Working interest
|
A company’s equity interest in a project before reduction for royalties or production share owed to others under the applicable fiscal terms.
|
|||
|
WPC
|
World Petroleum Council
|
|||
|
WTI
|
West Texas Intermediate Crude Oil
|

