Attached files
Exhibit 13
|
|
|
|
|
|
|
|
|
|
|
|
|
|
|
|
|
|
|
Stockholders’
Information |
|
December 31 |
|
|||||||||||||
|
|
|
|
|
|||||||||||||
|
|
||||||||||||||||
|
For the Years Ended |
|
2010 |
|
2009 |
|
2008 |
|
2007 |
|
2006 |
|
|||||
|
Net income (loss) |
|
$ |
(16,979 |
) |
$ |
(21,126 |
) |
$ |
7,326 |
|
$ |
6,770 |
|
$ |
6,488 |
|
|
Net income (loss) available to common stockholders |
|
|
(18,262 |
) |
|
(22,329 |
) |
|
7,326 |
|
|
6,770 |
|
|
6,488 |
|
|
Common cash dividends |
|
|
-0- |
|
|
2,311 |
|
|
3,696 |
|
|
3,597 |
|
|
3,542 |
|
|
Net income (loss) available to common stockholders to average stockholders’ equity |
|
|
(23.82 |
)% |
|
(22.81 |
)% |
|
10.59 |
% |
|
10.32 |
% |
|
10.07 |
% |
|
|
|
|
|
|
|
|
|
|
|
|
|
|
|
|
|
|
|
At Year-End |
|
|
|
|
|
|
|
|
|
|
|
|
|
|
|
|
|
Common stock shares outstanding |
|
|
3,325,941 |
|
|
3,306,369 |
|
|
3,298,041 |
|
|
3,308,447 |
|
|
3,351,410 |
|
|
Treasury shares outstanding |
|
|
1,152,354 |
|
|
1,171,926 |
|
|
1,180,254 |
|
|
1,169,848 |
|
|
1,126,885 |
|
|
Basic weighted average shares outstanding |
|
|
3,311,291 |
|
|
3,301,016 |
|
|
3,297,990 |
|
|
3,326,467 |
|
|
3,369,567 |
|
|
Diluted weighted average shares outstanding |
|
|
3,311,291 |
|
|
3,301,479 |
|
|
3,314,439 |
|
|
3,334,406 |
|
|
3,389,765 |
|
|
|
|
|
|
|
|
|
|
|
|
|
|
|
|
|
|
|
|
Per Share Data |
|
|
|
|
|
|
|
|
|
|
|
|
|
|
|
|
|
Basic earnings (loss) per share available to common stockholders |
|
$ |
(5.52 |
) |
$ |
(6.76 |
) |
$ |
2.22 |
|
$ |
2.04 |
|
$ |
1.93 |
|
|
Diluted earnings (loss) per share available to common stockholders |
|
|
(5.52 |
) |
|
(6.76 |
) |
|
2.21 |
|
|
2.03 |
|
|
1.91 |
|
|
Common book value |
|
|
9.58 |
|
|
15.03 |
|
|
21.97 |
|
|
20.74 |
|
|
19.50 |
|
|
Common cash dividends |
|
|
-0- |
|
|
0.70 |
|
|
1.12 |
|
|
1.08 |
|
|
1.05 |
|
|
|
|
|
|
|
|
|
|
|
|
|
|
|
|
|
|
|
|
Market Valuation (at year-end) |
|
|
|
|
|
|
|
|
|
|
|
|
|
|
|
|
|
Stock price |
|
$ |
3.64 |
|
$ |
10.81 |
|
$ |
22.14 |
|
$ |
24.25 |
|
$ |
32.55 |
|
|
Price/Earnings multiple |
|
|
n/a |
|
|
n/a |
|
|
10.0 |
|
|
11.9 |
|
|
16.9 |
|
|
|
||||||||||||||||
8
|
|
|
|
|
225 N. Water Street, Suite 400 |
|
|
|

Report of Independent Registered Public Accounting Firm
Audit Committee, Board of
Directors and Stockholders
Princeton National Bancorp, Inc.
Princeton, Illinois
We have audited the accompanying consolidated balance sheets of Princeton National Bancorp, Inc. as of December 31, 2010 and 2009, and the related consolidated statements of income, stockholders’ equity and cash flows for each of the years in the three-year period ended December 31, 2010. The Company’s management is responsible for these financial statements. Our responsibility is to express an opinion on these financial statements based on our audits.
We conducted our audits in accordance with the standards of the Public Company Accounting Oversight Board (United States). Those standards require that we plan and perform the audit to obtain reasonable assurance about whether the financial statements are free of material misstatement. Our audits included examining, on a test basis, evidence supporting the amounts and disclosures in the financial statements, assessing the accounting principles used and significant estimates made by management, and evaluating the overall financial statement presentation. We believe that our audits provide a reasonable basis for our opinion.
In our opinion, the consolidated financial statements referred to above present fairly, in all material respects, the financial position of Princeton National Bancorp, Inc. as of December 31, 2010 and 2009, and the results of its operations and its cash flows for each of the three years in the period ended December 31, 2010, in conformity with accounting principles generally accepted in the United States of America.

Decatur, Illinois
March 30, 2011
|
|
|
|
|
|


9
Consolidated
Balance Sheets
(dollars
in thousands except share data)
|
|
|
|
|
|
|
|
|
|
|
|
December 31 |
|||||
|
|
|
2010 |
|
2009 |
|
||
|
|
|
|
|
|
|
||
|
ASSETS |
|
|
|
|
|
|
|
|
Cash and due from banks |
|
$ |
12,992 |
|
$ |
15,546 |
|
|
Interest-bearing deposits with financial institutions |
|
|
30,888 |
|
|
55,527 |
|
|
|
|
|
|
|
|
|
|
|
Total cash and cash equivalents |
|
|
43,880 |
|
|
71,073 |
|
|
Loans held-for-sale, at lower of cost or market |
|
|
5,515 |
|
|
3,296 |
|
|
Investment securities: |
|
|
|
|
|
|
|
|
Available-for-sale, at fair value |
|
|
248,752 |
|
|
288,474 |
|
|
Held-to-maturity, at amortized cost (fair value of $12,472 and $13,331) |
|
|
12,187 |
|
|
12,793 |
|
|
|
|
|
|
|
|
|
|
|
Total investment securities |
|
|
260,939 |
|
|
301,267 |
|
|
Loans: |
|
|
|
|
|
|
|
|
Loans, net of unearned interest |
|
|
704,074 |
|
|
798,074 |
|
|
Allowance for loan losses |
|
|
(29,726 |
) |
|
(12,075 |
) |
|
|
|
|
|
|
|
|
|
|
Net loans |
|
|
674,348 |
|
|
785,999 |
|
|
Premises and equipment, net of accumulated depreciation |
|
|
26,901 |
|
|
28,269 |
|
|
Land held for sale, at lower of cost or market |
|
|
2,244 |
|
|
2,354 |
|
|
Federal Reserve and Federal Home Loan Bank stock |
|
|
4,498 |
|
|
4,230 |
|
|
Bank-owned life insurance |
|
|
23,416 |
|
|
22,540 |
|
|
Accrued interest receivable |
|
|
7,482 |
|
|
9,267 |
|
|
Other real estate owned |
|
|
20,652 |
|
|
17,658 |
|
|
Deferred income taxes |
|
|
10,512 |
|
|
608 |
|
|
Intangible assets, net of accumulated amortization |
|
|
2,531 |
|
|
3,347 |
|
|
Other assets |
|
|
13,553 |
|
|
11,430 |
|
|
|
|
|
|
|
|
|
|
|
TOTAL ASSETS |
|
$ |
1,096,471 |
|
$ |
1,261,338 |
|
|
|
|
|
|
|
|
|
|
|
|
|
|
|
|
|
|
|
|
|
|
|
|
|
|
|
|
|
LIABILITIES |
|
|
|
|
|
|
|
|
Deposits: |
|
|
|
|
|
|
|
|
Demand |
|
$ |
138,683 |
|
$ |
136,026 |
|
|
Interest-bearing demand |
|
|
383,126 |
|
|
374,624 |
|
|
Savings |
|
|
74,817 |
|
|
68,292 |
|
|
Time |
|
|
366,335 |
|
|
496,597 |
|
|
|
|
|
|
|
|
|
|
|
Total deposits |
|
|
962,961 |
|
|
1,075,539 |
|
|
Borrowings: |
|
|
|
|
|
|
|
|
Customer repurchase agreements |
|
|
35,806 |
|
|
47,327 |
|
|
Interest-bearing demand notes issued to the U.S. Treasury |
|
|
1,753 |
|
|
1,021 |
|
|
Advances from the Federal Home Loan Bank |
|
|
9,000 |
|
|
31,500 |
|
|
Trust preferred securities |
|
|
25,000 |
|
|
25,000 |
|
|
|
|
|
|
|
|
|
|
|
Total borrowings |
|
|
71,559 |
|
|
104,848 |
|
|
Other liabilities |
|
|
5,090 |
|
|
6,291 |
|
|
|
|
|
|
|
|
|
|
|
TOTAL LIABILITIES |
|
|
1,039,610 |
|
|
1,186,678 |
|
|
|
|
|
|
|
|
|
|
|
|
|
|
|
|
|
|
|
|
STOCKHOLDERS’ EQUITY |
|
|
|
|
|
|
|
|
Preferred stock: no par value, 100,000 shares authorized: |
|
|
|
|
|
|
|
|
25,083 shares issued and outstanding at December 31, 2010 and 2009 |
|
|
24,986 |
|
|
24,958 |
|
|
Common stock: $5 par value, 7,000,000 shares authorized: |
|
|
|
|
|
|
|
|
4,478,295 shares issued at December 31, 2010 and 2009 |
|
|
22,391 |
|
|
22,391 |
|
|
Common stock warrants |
|
|
150 |
|
|
150 |
|
|
Surplus |
|
|
18,275 |
|
|
18,423 |
|
|
Retained earnings |
|
|
11,589 |
|
|
29,851 |
|
|
Accumulated other comprehensive income, net of tax |
|
|
3,064 |
|
|
2,816 |
|
|
Less: cost of 1,152,354 and 1,171,926 treasury shares at December 31, 2010 and 2009, respectively |
|
|
(23,594 |
) |
|
(23,929 |
) |
|
|
|
|
|
|
|
|
|
|
TOTAL STOCKHOLDERS’ EQUITY |
|
|
56,861 |
|
|
74,660 |
|
|
|
|
|
|
|
|
|
|
|
TOTAL LIABILITIES AND STOCKHOLDERS’ EQUITY |
|
$ |
1,096,471 |
|
$ |
1,261,338 |
|
|
|
|
|
|
|
|
|
|
|
|
|||||||
|
|
|
|
|
|
|
|
|
|
|
|||||||
|
See accompanying notes to consolidated financial statements. |
|||||||
10
Consolidated
Statements of Income
(dollars
in thousands except share data)
|
|
|
|
|
|
|
|
|
|
|
|
|
|
|
For the Years Ended December 31 |
|
|||||||
|
|
|
2010 |
|
2009 |
|
2008 |
|
|||
|
|
|
|
|
|
|
|
|
|||
|
Interest income: |
|
|
|
|
|
|
|
|
|
|
|
Interest and fees on loans |
|
$ |
39,310 |
|
$ |
43,719 |
|
$ |
47,715 |
|
|
Interest and dividends on investment securities: |
|
|
|
|
|
|
|
|
|
|
|
Taxable |
|
|
6,290 |
|
|
7,607 |
|
|
6,834 |
|
|
Tax-exempt |
|
|
3,827 |
|
|
5,296 |
|
|
4,148 |
|
|
Interest on federal funds sold |
|
|
-0- |
|
|
-0- |
|
|
71 |
|
|
Interest on interest-bearing deposits in other banks |
|
|
139 |
|
|
114 |
|
|
54 |
|
|
|
|
|
|
|
|
|
|
|
|
|
|
Total interest income |
|
|
49,566 |
|
|
56,736 |
|
|
58,822 |
|
|
|
|
|
|
|
|
|
|
|
|
|
|
Interest expense: |
|
|
|
|
|
|
|
|
|
|
|
Interest on deposits |
|
|
10,385 |
|
|
19,220 |
|
|
23,782 |
|
|
Interest on borrowings |
|
|
1,853 |
|
|
2,865 |
|
|
3,519 |
|
|
|
|
|
|
|
|
|
|
|
|
|
|
Total interest expense |
|
|
12,238 |
|
|
22,085 |
|
|
27,301 |
|
|
|
|
|
|
|
|
|
|
|
|
|
|
Net interest income |
|
|
37,328 |
|
|
34,651 |
|
|
31,521 |
|
|
Provision for loan losses |
|
|
40,550 |
|
|
11,062 |
|
|
2,968 |
|
|
|
|
|
|
|
|
|
|
|
|
|
|
Net interest income (loss) after provision for loan losses |
|
|
(3,222 |
) |
|
23,589 |
|
|
28,553 |
|
|
|
|
|
|
|
|
|
|
|
|
|
|
Non-interest income: |
|
|
|
|
|
|
|
|
|
|
|
Trust and farm management fees |
|
|
1,148 |
|
|
1,334 |
|
|
1,530 |
|
|
Service charges on deposit accounts |
|
|
3,695 |
|
|
3,961 |
|
|
4,408 |
|
|
Other service charges |
|
|
1,913 |
|
|
1,954 |
|
|
2,137 |
|
|
Gain on sales of securities available-for-sale |
|
|
722 |
|
|
1,781 |
|
|
405 |
|
|
Brokerage fee income |
|
|
754 |
|
|
857 |
|
|
913 |
|
|
Mortgage servicing rights impairment |
|
|
(110 |
) |
|
(185 |
) |
|
-0- |
|
|
Mortgage banking income, net |
|
|
2,383 |
|
|
2,462 |
|
|
1,069 |
|
|
Bank-owned life insurance income |
|
|
910 |
|
|
941 |
|
|
874 |
|
|
Other operating income |
|
|
77 |
|
|
139 |
|
|
257 |
|
|
|
|
|
|
|
|
|
|
|
|
|
|
Total non-interest income |
|
|
11,492 |
|
|
13,244 |
|
|
11,593 |
|
|
|
|
|
|
|
|
|
|
|
|
|
|
Non-interest expense: |
|
|
|
|
|
|
|
|
|
|
|
Salaries and employee benefits |
|
|
18,211 |
|
|
18,011 |
|
|
17,692 |
|
|
Occupancy |
|
|
2,635 |
|
|
2,598 |
|
|
2,559 |
|
|
Equipment expense |
|
|
3,117 |
|
|
3,071 |
|
|
2,996 |
|
|
Federal insurance assessments |
|
|
2,519 |
|
|
2,584 |
|
|
845 |
|
|
Goodwill impairment losses |
|
|
-0- |
|
|
24,521 |
|
|
-0- |
|
|
Intangible assets amortization |
|
|
807 |
|
|
816 |
|
|
714 |
|
|
Data processing |
|
|
1,327 |
|
|
1,290 |
|
|
1,151 |
|
|
Marketing |
|
|
696 |
|
|
751 |
|
|
742 |
|
|
Other real estate expenses, net |
|
|
2,586 |
|
|
1,064 |
|
|
201 |
|
|
Loan collection expenses |
|
|
691 |
|
|
581 |
|
|
218 |
|
|
Write-down of land held-for-sale |
|
|
110 |
|
|
-0- |
|
|
-0- |
|
|
Other operating expense |
|
|
4,454 |
|
|
4,272 |
|
|
4,005 |
|
|
|
|
|
|
|
|
|
|
|
|
|
|
Total non-interest expense |
|
|
37,153 |
|
|
59,559 |
|
|
31,123 |
|
|
|
|
|
|
|
|
|
|
|
|
|
|
Income (loss) before income taxes |
|
|
(28,883 |
) |
|
(22,726 |
) |
|
9,023 |
|
|
Income tax expense (benefit) |
|
|
(11,904 |
) |
|
(1,600 |
) |
|
1,697 |
|
|
|
|
|
|
|
|
|
|
|
|
|
|
Net income (loss) |
|
$ |
(16,979 |
) |
$ |
(21,126 |
) |
$ |
7,326 |
|
|
|
|
|
|
|
|
|
|
|
|
|
|
Dividends on preferred shares |
|
|
1,255 |
|
|
1,178 |
|
|
-0- |
|
|
Accretion of preferred stock discount |
|
|
28 |
|
|
25 |
|
|
-0- |
|
|
|
|
|
|
|
|
|
|
|
|
|
|
Net income (loss) available to common stockholders |
|
$ |
(18,262 |
) |
$ |
(22,329 |
) |
$ |
7,326 |
|
|
|
|
|
|
|
|
|
|
|
|
|
|
|
|
|
|
|
|
|
|
|
|
|
|
Earnings (loss) per share: |
|
|
|
|
|
|
|
|
|
|
|
Basic net income (loss) per common share available to common stockholders |
|
$ |
(5.52 |
) |
$ |
(6.76 |
) |
$ |
2.22 |
|
|
Diluted net income (loss) per common share available to common stockholders |
|
$ |
(5.52 |
) |
$ |
(6.76 |
) |
$ |
2.21 |
|
|
Basic weighted average shares outstanding |
|
|
3,311,291 |
|
|
3,301,016 |
|
|
3,297,990 |
|
|
Diluted weighted average shares outstanding |
|
|
3,311,291 |
|
|
3,301,479 |
|
|
3,314,439 |
|
|
|
||||||||||
|
|
|
|
|
|
|
|
|
|
|
|
See accompanying notes to consolidated financial statements.
11
Consolidated Statements of Changes in
Stockholders’ Equity
(dollars in
thousands except share data)
|
|
|
|
|
|
|
|
|
|
|
|
|
|
|
|
|
|
|
|
|
|
|
|
|
|
|
|
|
|
Preferred |
|
Common |
|
Common |
|
Surplus |
|
Retained |
|
Accumulated |
|
Treasury |
|
Total |
|
||||||||
|
|
|
|
|
|
|
|
|
|
|
|
|
|
|
|
|
|
|
||||||||
|
Balance, January 1, 2008 |
|
$ |
-0- |
|
$ |
22,391 |
|
$ |
-0- |
|
$ |
18,275 |
|
$ |
51,279 |
|
$ |
344 |
|
$ |
(23,682 |
) |
$ |
68,607 |
|
|
|
|
|
|
|
|
|
|
|
|
|
|
|
|
|
|
|
|
|
|
|
|
|
|
|
|
|
Net income |
|
|
|
|
|
|
|
|
|
|
|
|
|
|
7,326 |
|
|
|
|
|
|
|
|
7,326 |
|
|
Sale of 4,894 shares of treasury stock |
|
|
|
|
|
|
|
|
|
|
|
40 |
|
|
|
|
|
|
|
|
84 |
|
|
124 |
|
|
Purchase of 20,000 shares of treasury stock |
|
|
|
|
|
|
|
|
|
|
|
|
|
|
|
|
|
|
|
|
(553 |
) |
|
(553 |
) |
|
Exercise of stock options and re-issuance of treasury stock (4,700 shares) |
|
|
|
|
|
|
|
|
|
|
|
21 |
|
|
|
|
|
|
|
|
80 |
|
|
101 |
|
|
Cash dividends ($1.12 per share) |
|
|
|
|
|
|
|
|
|
|
|
|
|
|
(3,696 |
) |
|
|
|
|
|
|
|
(3,696 |
) |
|
Amortization of unearned compensation expense |
|
|
|
|
|
|
|
|
|
|
|
84 |
|
|
|
|
|
|
|
|
|
|
|
84 |
|
|
Adjustment to initially apply ASC 715, split-dollar life insurance |
|
|
|
|
|
|
|
|
|
|
|
|
|
|
(580 |
) |
|
|
|
|
|
|
|
(580 |
) |
|
Other comprehensive income, net of $660 tax effect |
|
|
|
|
|
|
|
|
|
|
|
|
|
|
|
|
|
1,058 |
|
|
|
|
|
1,058 |
|
|
|
|
|
|
|
|
|
|
|
|
|
|
|
|
|
|
|
|
|
|
|
|
|
|
|
|
|
Balance, December 31, 2008 |
|
$ |
-0- |
|
$ |
22,391 |
|
$ |
-0- |
|
$ |
18,420 |
|
$ |
54,329 |
|
$ |
1,402 |
|
$ |
(24,071 |
) |
$ |
72,471 |
|
|
|
|
|
|
|
|
|
|
|
|
|
|
|
|
|
|
|
|
|
|
|
|
|
|
|
|
|
Net loss |
|
|
|
|
|
|
|
|
|
|
|
|
|
|
(21,126 |
) |
|
|
|
|
|
|
|
(21,126 |
) |
|
Sale of 25,083 shares of preferred stock and 155,025 common stock warrants, net of expense |
|
|
24,933 |
|
|
|
|
|
150 |
|
|
(63 |
) |
|
|
|
|
|
|
|
|
|
|
25,020 |
|
|
Dividends on preferred stock |
|
|
|
|
|
|
|
|
|
|
|
|
|
|
(1,016 |
) |
|
|
|
|
|
|
|
(1,016 |
) |
|
Accretion on preferred stock discount |
|
|
25 |
|
|
|
|
|
|
|
|
|
|
|
(25 |
) |
|
|
|
|
|
|
|
-0- |
|
|
Sale of 8,328 shares of treasury common stock |
|
|
|
|
|
|
|
|
|
|
|
(28 |
) |
|
|
|
|
|
|
|
142 |
|
|
114 |
|
|
Dividends on common stock ($.70 per share) |
|
|
|
|
|
|
|
|
|
|
|
|
|
|
(2,311 |
) |
|
|
|
|
|
|
|
(2,311 |
) |
|
Amortization of unearned compensation expense |
|
|
|
|
|
|
|
|
|
|
|
94 |
|
|
|
|
|
|
|
|
|
|
|
94 |
|
|
Other comprehensive income, net of $868 tax effect |
|
|
|
|
|
|
|
|
|
|
|
|
|
|
|
|
|
1,414 |
|
|
|
|
|
1,414 |
|
|
|
|
|
|
|
|
|
|
|
|
|
|
|
|
|
|
|
|
|
|
|
|
|
|
|
|
|
Balance, December 31, 2009 |
|
$ |
24,958 |
|
$ |
22,391 |
|
$ |
150 |
|
$ |
18,423 |
|
$ |
29,851 |
|
$ |
2,816 |
|
$ |
(23,929 |
) |
$ |
74,660 |
|
|
|
|
|
|
|
|
|
|
|
|
|
|
|
|
|
|
|
|
|
|
|
|
|
|
|
|
|
Net loss |
|
|
|
|
|
|
|
|
|
|
|
|
|
|
(16,979 |
) |
|
|
|
|
|
|
|
(16,979 |
) |
|
Dividends on preferred stock |
|
|
|
|
|
|
|
|
|
|
|
|
|
|
(1,255 |
) |
|
|
|
|
|
|
|
(1,255 |
) |
|
Accretion on preferred stock discount |
|
|
28 |
|
|
|
|
|
|
|
|
|
|
|
(28 |
) |
|
|
|
|
|
|
|
-0- |
|
|
Sale of 11,072 shares of treasury common stock |
|
|
|
|
|
|
|
|
|
|
|
(135 |
) |
|
|
|
|
|
|
|
190 |
|
|
55 |
|
|
Award of 8,500 shares of nonvested common stock out of treasury common stock |
|
|
|
|
|
|
|
|
|
|
|
(102 |
) |
|
|
|
|
|
|
|
145 |
|
|
43 |
|
|
Amortization of unearned compensation expense |
|
|
|
|
|
|
|
|
|
|
|
89 |
|
|
|
|
|
|
|
|
|
|
|
89 |
|
|
Other comprehensive income, net of $157 tax effect |
|
|
|
|
|
|
|
|
|
|
|
|
|
|
|
|
|
248 |
|
|
|
|
|
248 |
|
|
|
|
|
|
|
|
|
|
|
|
|
|
|
|
|
|
|
|
|
|
|
|
|
|
|
|
|
Balance, December 31, 2010 |
|
$ |
24,986 |
|
$ |
22,391 |
|
$ |
150 |
|
$ |
18,275 |
|
$ |
11,589 |
|
$ |
3,064 |
|
$ |
(23,594 |
) |
$ |
56,861 |
|
|
|
|
|
|
|
|
|
|
|
|
|
|
|
|
|
|
|
|
|
|
|
|
|
|
|
|
|
|
|||||||||||||||||||||||||
|
|
|
|
|
|
|
|
|
|
|
|
|
|
|
|
|
|
|
|
|
|
|
|
|
|
|
See accompanying notes to consolidated financial statements.
12
Consolidated Statements of Cash Flows
(dollars in
thousands)
|
|
|
|
|
|
|
|
|
|
|
|
|
|
|
For the Years Ended December 31 |
|
|||||||
|
|
|
2010 |
|
2009 |
|
2008 |
|
|||
|
|
|
|
|
|
|
|
|
|||
|
Operating activities: |
|
|
|
|
|
|
|
|
|
|
|
Net income (loss) |
|
$ |
(16,979 |
) |
$ |
(21,126 |
) |
$ |
7,326 |
|
|
Adjustments to reconcile net income (loss) to net cash provided by operating activities: |
|
|
|
|
|
|
|
|
|
|
|
Depreciation |
|
|
2,075 |
|
|
2,170 |
|
|
2,219 |
|
|
Provision for loan losses |
|
|
40,550 |
|
|
11,062 |
|
|
2,968 |
|
|
Deferred income tax (benefit) expense |
|
|
(10,061 |
) |
|
(3,747 |
) |
|
(602 |
) |
|
Impairment of goodwill |
|
|
-0- |
|
|
24,521 |
|
|
-0- |
|
|
Amortization of intangible assets and other purchase accounting adjustments, net |
|
|
816 |
|
|
816 |
|
|
714 |
|
|
Amortization (accretion) of premiums and discounts on investment securities, net |
|
|
1,544 |
|
|
1,549 |
|
|
56 |
|
|
Gain on sales of securities available-for-sale, net |
|
|
(722 |
) |
|
(1,781 |
) |
|
(405 |
) |
|
Compensation expense for vested stock options |
|
|
89 |
|
|
94 |
|
|
84 |
|
|
Impairment of mortgage servicing rights, net of recoveries |
|
|
110 |
|
|
185 |
|
|
-0- |
|
|
Loss on sales or writedowns of other real estate owned, net |
|
|
1,380 |
|
|
943 |
|
|
2 |
|
|
Writedown of land held for sale |
|
|
110 |
|
|
-0- |
|
|
-0- |
|
|
Loans originated for sale |
|
|
(126,400 |
) |
|
(141,315 |
) |
|
(77,851 |
) |
|
Proceeds from sales of loans originated for sale |
|
|
124,181 |
|
|
140,174 |
|
|
76,624 |
|
|
Decrease in accrued interest payable |
|
|
(1,660 |
) |
|
(1,473 |
) |
|
(669 |
) |
|
Decrease in accrued interest receivable |
|
|
1,785 |
|
|
426 |
|
|
1,183 |
|
|
Increase in other assets |
|
|
(3,109 |
) |
|
(7,099 |
) |
|
(398 |
) |
|
Increase (decrease) in other liabilities |
|
|
459 |
|
|
(502 |
) |
|
(1,066 |
) |
|
|
|
|
|
|
|
|
|
|
|
|
|
|
|
|
|
|
|
|
|
|
|
|
|
Net cash provided by (used in) operating activities |
|
|
14,168 |
|
|
4,897 |
|
|
10,185 |
|
|
|
|
|
|
|
|
|
|
|
|
|
|
|
|
|
|
|
|
|
|
|
|
|
|
Investing activities: |
|
|
|
|
|
|
|
|
|
|
|
Proceeds from sales of investment securities available-for-sale |
|
|
52,730 |
|
|
88,847 |
|
|
38,499 |
|
|
Proceeds from maturities of investment securities available-for-sale |
|
|
23,863 |
|
|
58,550 |
|
|
53,568 |
|
|
Purchase of investment securities available-for-sale |
|
|
(37,288 |
) |
|
(196,419 |
) |
|
(112,754 |
) |
|
Proceeds from maturities of investment securities held-to-maturity |
|
|
4,129 |
|
|
4,564 |
|
|
2,100 |
|
|
Purchase of investment securities held-to-maturity |
|
|
(3,523 |
) |
|
(3,182 |
) |
|
(1,944 |
) |
|
Proceeds from sales of other real estate owned |
|
|
6,675 |
|
|
549 |
|
|
891 |
|
|
Net (increase) decrease in loans |
|
|
60,052 |
|
|
(27,873 |
) |
|
(71,668 |
) |
|
Purchase of premises and equipment |
|
|
(707 |
) |
|
(1,142 |
) |
|
(1,725 |
) |
|
Purchase of Federal Home Loan and Federal Reserve Bank stock |
|
|
(268 |
) |
|
(19 |
) |
|
(113 |
) |
|
|
|
|
|
|
|
|
|
|
|
|
|
|
|
|
|
|
|
|
|
|
|
|
|
Net cash provided by (used in) investing activities |
|
|
105,663 |
|
|
(76,125 |
) |
|
(93,146 |
) |
|
|
|
|
|
|
|
|
|
|
|
|
|
|
|
|
|
|
|
|
|
|
|
|
|
Financing activities: |
|
|
|
|
|
|
|
|
|
|
|
Net increase (decrease) in deposits |
|
|
(112,578 |
) |
|
113,408 |
|
|
70,725 |
|
|
Net increase (decrease) in short-term borrowings |
|
|
(10,789 |
) |
|
2,875 |
|
|
(18,082 |
) |
|
Proceeds from borrowings |
|
|
-0- |
|
|
-0- |
|
|
33,000 |
|
|
Repayment of borrowings |
|
|
(22,500 |
) |
|
(16,050 |
) |
|
(6,001 |
) |
|
Dividends paid on preferred stock |
|
|
(1,255 |
) |
|
(1,016 |
) |
|
-0- |
|
|
Dividends paid on common stock |
|
|
-0- |
|
|
(2,311 |
) |
|
(3,696 |
) |
|
Purchase of treasury stock |
|
|
-0- |
|
|
-0- |
|
|
(553 |
) |
|
Sales of treasury stock |
|
|
55 |
|
|
114 |
|
|
124 |
|
|
Exercise of stock options and issuance of treasury stock |
|
|
-0- |
|
|
-0- |
|
|
101 |
|
|
Award of nonvested stock from treasury stock |
|
|
43 |
|
|
-0- |
|
|
-0- |
|
|
Proceeds from issuance of preferred stock and common stock warrants, net of expenses |
|
|
-0- |
|
|
25,020 |
|
|
-0- |
|
|
|
|
|
|
|
|
|
|
|
|
|
|
|
||||||||||
|
Net cash provided by (used in) financing activities |
|
|
(147,024 |
) |
|
122,040 |
|
|
75,618 |
|
|
|
|
|
|
|
|
|
|
|
|
|
|
|
|
|
|
|
|
|
|
|
|
|
|
Increase (decrease) in cash and cash equivalents |
|
|
(27,193 |
) |
|
50,812 |
|
|
(7,343 |
) |
|
Cash and cash equivalents at beginning of year |
|
|
71,073 |
|
|
20,261 |
|
|
27,604 |
|
|
|
|
|
|
|
|
|
|
|
|
|
|
|
||||||||||
|
Cash and cash equivalents at end of year |
|
$ |
43,880 |
|
$ |
71,073 |
|
$ |
20,261 |
|
|
|
|
|
|
|
|
|
|
|
|
|
|
|
|
|
|
|
|
|
|
|
|
|
|
Cash paid during the year for: |
|
|
|
|
|
|
|
|
|
|
|
Interest |
|
$ |
13,898 |
|
$ |
23,558 |
|
$ |
27,970 |
|
|
Income taxes |
|
$ |
1,019 |
|
$ |
2,040 |
|
$ |
3,123 |
|
|
Supplemental disclosure of non-cash flow activities: |
|
|
|
|
|
|
|
|
|
|
|
Loans transferred to other real estate owned |
|
$ |
11,049 |
|
$ |
16,663 |
|
$ |
2,547 |
|
|
Land transferred to held-for-sale |
|
$ |
-0- |
|
$ |
-0 - |
|
$ |
1,010 |
|
|
|
||||||||||
|
|
|
|
|
|
|
|
|
|
|
|
See accompanying notes to consolidated financial statements.
13
Notes to Consolidated Financial Statements
(dollar amounts
in thousands except share data)
1. Summary of Significant Accounting Policies
The consolidated financial statements have been prepared in conformity with accounting principles generally accepted in the United States of America and conform with general practices within the banking industry. A description of the significant accounting policies follows:
Nature of Operations - Princeton National Bancorp, Inc. (“the Corporation”) is a bank holding company whose principal activity is the ownership and management of its wholly-owned subsidiary, Citizens First National Bank (“the Bank” or “subsidiary bank”). The Bank is primarily engaged in providing a full range of banking and financial services to individual and corporate customers located primarily in North Central Illinois. The Bank is subject to competition from other financial institutions. The Bank is subject to the regulation of certain federal and state agencies and undergoes periodic examinations by those regulatory authorities.
Basis of Consolidation - The Consolidated Financial Statements of the Corporation include the accounts of the Corporation and its wholly-owned subsidiary, Citizens First National Bank. Intercompany accounts and transactions have been eliminated in consolidation. The Corporation, through the subsidiary bank, operates in a single segment engaging in general retail and commercial banking.
Use of Estimates - In order to prepare the Corporation’s Consolidated Financial Statements in conformity with accounting principles generally accepted in the United States of America, management is required to make certain estimates that affect the amounts reported in the Consolidated Financial Statements and accompanying notes. These estimates may differ from actual results.
Material estimates that are particularly susceptible to significant change relate to the determination of the allowance for loan losses, the valuation of real estate acquired in connection with foreclosures or in satisfaction of loans, fair value measurements of investment securities, income tax accruals and deferrals, evaluation of the impairment of intangibles and mortgage servicing rights.
Interest-bearing Deposits in Banks - Interest-bearing deposits with financial institutions mature within one year and are carried at cost.
Investment Securities - Investment securities which the Corporation has the positive intent and ability to hold to maturity are classified as held-to-maturity and recorded at amortized cost. The Corporation does not have a trading portfolio. All other investment securities that are not classified as held-to-maturity are classified as available-for-sale. Investment securities available-for-sale are recorded at fair value, with any changes in fair value reflected as a separate component of stockholders’ equity, net of related tax effects. Gains and losses on the sales of securities are determined using the specific identification method. Premiums and discounts on investment securities are amortized or accreted over the contractual lives of those securities. The method of amortization or accretion results in a constant effective yield on those securities (the interest method). Any security for which there has been other than temporary impairment of value is written down to its estimated market value through a charge to earnings.
For debt securities with fair value below carrying value when the Corporation does not intend to sell a debt security, and it is more likely than not the Corporation will not have to sell the security before recovery of its cost basis, it recognizes the credit component of an other-than-temporary impairment of a debt security in earnings and the remaining portion in other comprehensive income. For held-to-maturity debt securities, the amount of an other-than-temporary impairment recorded in other comprehensive income for the noncredit portion of a previous other-than-temporary impairment is amortized prospectively over the remaining life of the security on the basis of the timing of future estimated cash flows of the security.
Federal Reserve and Federal Home Loan Bank Stock - The subsidiary bank held Federal Home Loan Bank and Federal Reserve Bank stock totaling $2,373 and $2,125 at December 31, 2010, and $2,373 and $1,857 at December 31, 2009, respectively. During the third quarter of 2007, the Federal Home Loan Bank of Chicago received a Cease and Desist Order from their regulator, the Federal Housing Finance Board. The Federal Home Loan Bank will continue to provide liquidity and funding through advances, however, the order prohibits capital stock repurchases until a time to be determined by the Federal Housing Finance Board and requires their approval for dividends. With regard to dividends, the Federal Home Loan Bank of Chicago continues to assess its dividend capacity each quarter and make appropriate request for approval. While there were no dividends paid in 2010, 2009 or 2008, a dividend was declared based on preliminary results from the fourth quarter of 2010, payable in February 2011. Management performed an analysis and deemed the cost-method investment in Federal Home Loan Bank stock was ultimately recoverable.
Loans Held For Sale - Mortgage loans originated and intended for sale in the secondary market are carried at the lower of cost or fair value in the aggregate. Net unrealized losses, if any, are recognized through a valuation allowance by charges to non-interest income. Gains and losses on loan sales are recorded in non-interest income, and direct loan origination costs and fees are deferred at origination of the loan and are recognized in non-interest income upon sale of the loan.
Loans - Loans are stated at the principal amount outstanding, net of unearned interest and allowance for loan losses. Interest on commercial, real estate and certain installment loans is credited to operations as earned, based upon the principal amount outstanding. Interest on other installment loans is credited to operations using a method which approximates the interest method. Certain non-refundable loan origination fees and direct costs are deferred at the time a loan is originated. Net deferred loan fees are recognized as yield adjustments over the contractual life of the loan fees using the interest method.
It is the subsidiary bank’s policy to discontinue the accrual of interest on any loan when, in the opinion of management, full and timely payment of principal and interest is not expected, or principal and interest is due and remains unpaid for 90 days or more, unless the loan is both well-secured and in the process of collection. Interest on these loans is recorded as income only when the collection of principal has been assured and only to the extent interest payments are received.
Impaired loans are measured based on current information and events, if it is probable the Corporation will be unable to collect the scheduled payments of principal or interest when due according to the contractual terms of the loan agreement. Certain groups of small-balance homogeneous loans, which are collectively evaluated for impairment and are generally represented by consumer and residential mortgage loans and loans held-for-sale, are not analyzed individually for impairment. The Corporation generally identifies impaired loans within the non-accrual and restructured commercial and commercial real estate portfolios on an individual loan-by-loan basis. The measurement of impaired loans is generally based on the fair value of the related collateral.
Allowance for Loan Losses - The allowance for loan losses is increased by provisions charged to operating expense and decreased by charge-offs, net of recoveries, and is available to absorb probable losses on loans. Loan losses are charged against the allowance when management believes the uncollectibility of a loan balance is confirmed. Subsequent recoveries, if any, are credited to the allowance.
The allowance is based on factors that include overall composition of the loan portfolio, types of loans, past loss experience, loan delinquencies, substandard and doubtful credits, and such other factors that, in management’s best judgment, deserve evaluation in estimating loan losses.
In addition, various regulatory agencies, as an integral part of their examination process, periodically review the subsidiary bank’s allowance for loan losses. Such agencies may require the subsidiary bank to recognize additions to the allowance for loan losses based on their judgments of information available to them at the time of their examination.
14
The allowance consists of allocated and general components. The allocated components relate to loans that are classified as impaired. For those loans that are classified as impaired, an allowance is established when the discounted cash flows (or collateral value or observable market price) of the impaired loan is lower than the carrying value of that loan. The general component covers non-classified loans and is based on historical charge-off experience and expected loss given default derived from the Corporation’s internal risk rating process. Other adjustments may be made to the allowance for pools of loans after an assessment of internal or external influences on credit quality that are not fully reflected in the historical loss or risk rating data.
A loan is considered impaired when, based on current information and events, it is probable that the Corporation will be unable to collect the scheduled payments of principal or interest when due according to the contractual terms of the loan agreement. Factors considered by management in determining impairment include payment status, collateral value and the probability of collecting scheduled principal and interest payments when due. Loans that experience insignificant payment delays and payment shortfalls generally are not classified as impaired. Management determines the significance of payment delays and payment shortfalls on a case-by-case basis, taking into consideration all of the circumstances surrounding the loan and the borrower, including the length of the delay, the reasons for the delay, the borrower’s prior payment record and the amount of the shortfall in relation to the principal and interest owed. Impairment is measured on a loan-by-loan basis for commercial and construction loans by either the present value of expected future cash flows discounted at the loan’s effective interest rate, the loan’s obtainable market price or the fair value of the collateral if the loan is collateral dependent.
Groups of loans with similar risk characteristics are collectively evaluated for impairment based on the group’s historical loss experience adjusted for changes in trends, conditions and other relevant factors that affect repayment of the loans. Accordingly, the Corporation does not separately identify individual consumer and residential loans for impairment measurements, unless such loans are the subject of a restructuring agreement due to financial difficulties of the borrower.
Sales of First Mortgage Loans and Loan Servicing - The subsidiary bank sells certain first mortgage loans on a non-recourse basis. The total cost of these loans is allocated between loans and servicing rights, based on the relative fair value of each. Loan servicing fees are recognized to income, and loan servicing costs are charged to expense, as incurred. Loans held-for-sale are stated at the lower of aggregate cost or market. Mortgage loans serviced for others are not included in the accompanying Consolidated Balance Sheets.
The Corporation recognizes as a separate asset the rights to service mortgage loans for others. Mortgage servicing rights are recorded at the lower of cost or market value and are included in other assets in the Consolidated Balance Sheets. Mortgage servicing rights are amortized in proportion to the amount of principal received on loans serviced. The amortization of capitalized mortgage servicing rights is reflected in the Consolidated Statements of Income as a reduction to mortgage banking income. Impairment of mortgage servicing rights is assessed based on the fair value of those rights. Fair values are estimated using discounted cash flows based on a current market interest rate. For purposes of measuring impairment, the rights are stratified based on the predominant risk characteristics of the underlying loans. The predominant characteristic currently used for stratification is type of loan. The amount of impairment recognized is the amount by which the capitalized mortgage servicing rights for a stratum exceed their fair value.
Premises and Equipment - Premises and equipment are carried at cost, less accumulated depreciation. Depreciation is computed on the straight-line basis over the estimated useful lives of the assets, as follows: buildings, fifteen to forty years and furniture and equipment, three to fifteen years. The carrying amounts of assets sold or retired and the related accumulated depreciation are eliminated from the accounts, and any resulting gains or losses are reflected in income.
Intangible Assets - The Corporation has identifiable intangible assets assigned to core deposit relationships and customer lists acquired. Identifiable intangible assets generally arise from branches acquired that the Corporation accounted for as purchases. Such assets consist of the excess of the purchase price over the fair value of net assets acquired, with specific amounts assigned to core deposit relationships. Intangible assets are amortized by the straight-line method over various periods up to fifteen years. Management reviews intangible assets for possible impairment whenever events or changes in circumstances indicate that the carrying amount of an asset may be not recoverable. As of December 31, 2010, no impairment was deemed necessary.
Other Real Estate Owned - Other real estate owned represents assets to which the subsidiary bank has acquired legal title in satisfaction of indebtedness. Such real estate is recorded at the lower of cost or fair market value at the date of acquisition, less estimated selling costs. Any deficiency, at the date of transfer, is charged to the allowance for loan losses. Subsequent declines in value, based on changes in market conditions, are recorded to expense as incurred. Gains or losses on the disposition of other real estate owned are recorded to the income statement in the period in which they are realized.
Income Taxes - The Corporation accounts for income taxes in accordance with income tax accounting guidance (ASC 740 – Income Taxes). The income tax accounting guidance results in two components of income tax expense: current and deferred. Current income tax expense reflects taxes to be paid or refunded for the current period by applying the provisions of the enacted tax law to the taxable income or excess of deductions over revenues. The Corporation determines deferred income taxes using the liability (or balance sheet) method. Under this method, the net deferred tax asset or liability is based on the tax effects of the differences between the book and tax bases of assets and liabilities, and enacted changes in tax rates and laws are recognized in the period in which they occur.
Deferred income tax expense results from changes in deferred tax assets and liabilities between periods. Deferred tax assets are recognized if it is more likely than not, based on the technical merits, that the tax position will be realized or sustained upon examination. The term more likely than not means a likelihood of more than 50 percent; the terms examined and upon examination also include resolution of the related appeals or litigation processes, if any. A tax position that meets the more-likely-than-not recognition threshold is initially and subsequently measured as the largest amount of tax benefit that has a greater than 50 percent likelihood of being realized upon settlement with a taxing authority that has full knowledge of all relevant information. The threshold considers the facts, circumstances and information available at the reporting date and is subject to management’s judgment. Deferred tax assets are reduced by a valuation allowance if, based on the weight of evidence available, it is more likely than not that some portion or all of a deferred tax asset will not be realized.
The Corporation recognizes interest and penalties on income taxes as a component of income tax expense.
The Corporation files consolidated income tax returns with its subsidiaries.
Trust Assets - Assets held in fiduciary or agency capabilities are not included in the Consolidated Balance Sheets since such items are not assets of the Corporation. Fees from trust activities are recorded on an accrual basis over the period in which the service is provided. Fees are a function of the market value of assets managed and administered, the volume of transactions and fees for other services rendered, as set forth in the underlying client agreement with fiduciary services. This revenue recognition involves the use of estimates and assumptions, including components that are calculated based on estimated asset valuations and transaction volumes. Generally, the actual trust fee is charged to each account on a monthly prorated basis. Any out-of-pocket expenses for services not typically covered by the fee schedule for trust activities are charged directly to the trust account on a gross basis as trust revenue is incurred. The Corporation was the manager or administrator of 907 trust accounts with assets totaling approximately $175,519 at December 31, 2010 and 965 trust accounts with assets totaling approximately $171,429 at December 31, 2009.
Treasury Stock - Treasury stock is stated at cost. Cost is determined by the first-in, first-out method.
15
Notes to Consolidated Financial Statements (Continued)
(dollar amounts in thousands except share data)
Transfers of Financial Assets - Transfers of financial assets are accounted for as sales, when control over the assets has been surrendered. Control over transferred assets is deemed to be surrendered when (1) the assets have been isolated from the Corporation - put presumptively beyond the reach of the transferor and its creditors, even in bankruptcy or other receivership, (2) the transferee obtains the right (free of conditions that constrain it from taking advantage of that right) to pledge or exchange the transferred assets and (3) the Corporation does not maintain effective control over the transferred assets through an agreement to repurchase them before their maturity or the ability to unilaterally cause the holder to return specific assets.
Earnings Per Share - Basic earnings (loss) per share represents income (loss) available to common stockholders divided by the weighted-average number of common shares outstanding each period. Diluted earnings per share reflects additional potential common shares that would have been outstanding if dilutive potential common shares had been issued, as well as any adjustment to income that would result from the assumed issuance. Potential common shares that may be issued by the Corporation relate solely to outstanding stock options and warrants issued in conjunction with the Capital Purchase Program/Troubled Asset Relief Program (TARP). (See Note 20 - “Capital Purchase Program/Troubled Asset Relief Program (TARP)” in the Notes to Consolidated Financial Statements.
Treasury shares are not deemed outstanding for earnings per share calculations.
Comprehensive Income - Comprehensive income consists of net income and other comprehensive income, net of applicable income taxes. Other comprehensive income includes unrealized appreciation (depreciation) on available-for-sale securities and changes in the funded status of the post-retirement health care plan.
Cash Equivalents - The Corporation considers all liquid investments with original maturities of three months or less to be cash equivalents. At December 31, 2010 and 2009, cash equivalents consisted of non-interest bearing and interest-bearing cash accounts.
The financial institutions holding the Corporation’s cash accounts are participating in the FDIC’s Transaction Account Guarantee Program. Under that program, through December 31, 2010, all non-interest bearing transaction accounts are fully guaranteed by the FDIC for the entire amount in the account. Pursuant to legislation enacted in 2010, the FDIC will fully insure all non-interest bearing transaction accounts beginning December 31, 2010 through December 31, 2012, at all FDIC-insured institutions.
The Corporation’s interest-bearing cash accounts are held at the Federal Home Loan and Federal Reserve Banks of Chicago and are fully guaranteed for the entire amount in the account.
Reclassification - Certain amounts in the 2009 and 2008 Consolidated Financial Statements have been reclassified to conform to the 2010 presentation. These reclassifications had no effect on net income.
Stock Options - At December 31, 2010 and 2009, the Corporation had a share-based employee compensation plan, which is described more fully in Note 14 - “Employee, Officer and Director Benefit Plans” in the Notes to Consolidated Financial Statements. The Corporation accounts for this plan under the recognition and measurement principles of Financial Accounting Standards Board Accounting Standards Codification 718 (ASC 718), “Share-Based Payment.” The number of shares of common stock authorized under the stock option plans is 802,500. The exercise price must be at least 100% of the fair market value of the common stock on the date of the grant, and the option term cannot exceed ten years.
Beginning in 2010, the Corporation awarded nonvested shares at no cost to certain officers as described more fully in Note 14 - “Employee, Officer and Director Benefit Plans” in the Notes to Consolidated Financial Statements. The Corporation also accounts for this plan under the recognition and measurement principles of ASC 718, “Share-Based Payment.”
Impact of New Accounting Standards - In January 2010, the Financial Accounting Standards Board (“FASB”) issued Accounting Standards Update (ASU) No. 2009-16, “Transfers and Servicing (Topic 860) - Accounting for Transfers of Financial Assets.” ASU 2009-16 amends prior accounting guidance to enhance reporting about transfers of financial assets, including securitizations, and where companies have continuing exposure to the risks related to transferred financial assets. ASU 2009-16 eliminates the concept of a “qualifying special-purpose entity” and changes the requirements for derecognizing financial assets. ASU 2009-16 also requires additional disclosures about all continuing involvements with transferred financial assets including information about gains and losses resulting from transfers during the period. The provisions of ASU 2009-16 did not have a significant impact on the Corporation’s Consolidated Financial Statements.
The FASB issued ASU No. 2010-06, “Fair Value Measurements and Disclosures (Topic 820) - Improving Disclosures About Fair Value Measurements.” ASU 2010-06 requires expanded disclosures related to fair value measurements including (i) the amounts of significant transfers of assets or liabilities between Levels 1 and 2 of the fair value hierarchy and the reasons for the transfers, (ii) the reasons for transfers of assets or liabilities in or out of Level 3 of the fair value hierarchy, with significant transfers disclosed separately, (iii) the policy for determining when transfers between levels of the fair value hierarchy are recognized and (iv) for recurring fair value measurements of assets and liabilities in Level 3 of the fair value hierarchy, a gross presentation of information about purchases, sales, issuances and settlements. ASU 2010-06 further clarifies that (i) fair value measurement disclosures should be provided for each class of assets and liabilities (rather than major category), which would generally be a subset of assets or liabilities within a line item in the statement of financial position and (ii) companies should provide disclosures about the valuation techniques and inputs used to measure fair value for both recurring and nonrecurring fair value measurements for each class of assets and liabilities included in Levels 2 and 3 of the fair value hierarchy. The disclosures related to the gross presentation of purchases, sales, issuances and settlements of assets and liabilities included in Level 3 of the fair value hierarchy will be required for the Corporation beginning January 1, 2011. The remaining disclosure requirements and clarifications made by ASU 2010-06 became effective for the Corporation on January 1, 2010. The adoption of this accounting standard related to expanded disclosures of the Corporation’s fair value measurements is included in Note 16 - “Fair Value of Financial Instruments” to the Consolidated Financial Statements and had no impact on the retained earnings of the Corporation or the Corporation’s statements of income or condition.
ASU No. 2010-20, “Receivables (Topic 310) - Disclosures about the Credit Quality of Financing Receivables and the Allowance for Credit Losses,” requires entities to provide disclosures designed to facilitate financial statement users’ evaluation of (i) the nature of credit risk inherent in the entity’s portfolio of financing receivables, (ii) how that risk is analyzed and assessed in arriving at the allowance for credit losses and (iii) the changes and reasons for those changes in the allowance for credit losses. Disclosures must be disaggregated by portfolio segment, the level at which an entity develops and documents a systematic method for determining its allowance for credit losses, and class of financing receivable, which is generally a disaggregation of portfolio segment. The required disclosures include, among other things, a rollforward of the allowance for credit losses as well as information about modified, impaired, non-accrual and past due loans and credit quality indicators. ASU 2010-20 became effective for the Corporation’s financial statements as of December 31, 2010, as it relates to disclosures required as of the end of a reporting period. Disclosures that relate to activity during a reporting period will be required for the Corporation’s financial statements that include periods beginning on or after January 1, 2011. ASU 2011-01, “Receivables (Topic 310) - Deferral of the Effective Date of Disclosures about Troubled Debt Restructurings in Update No. 2010-20,” temporarily deferred the effective date for disclosures related to troubled debt restructurings to coincide with the effective date of a proposed accounting standards update related to troubled debt restructurings, which is currently expected to be effective for periods ending after June 15, 2011. The adoption of this accounting standard related to expanded disclosures of the Corporation’s disclosures about the credit quality of loans and the allowance for loan and lease losses is included in Note 5 - “Loans and the Allowance for Loan Losses” to the Consolidated Financial Statements and had no impact on the retained earnings of the Corporation or the Corporation’s statements of income or condition.
16
2. Earnings Per Share
The following table sets forth the computation for basic and diluted earnings (loss) per share for the years ended December 31, 2010, 2009 and 2008:
|
|
|
|
|
|
|
|
|
|
|
|
|
|
|
2010 |
|
2009 |
|
2008 |
|
|||
|
Numerator: |
|
|
|
|
|
|
|
|
|
|
|
Net income (loss) available to common stockholders |
|
$ |
(18,262 |
) |
$ |
(22,329 |
) |
$ |
7,326 |
|
|
Denominator: |
|
|
|
|
|
|
|
|
|
|
|
Basic earnings per share - weighted average common shares |
|
|
3,311,291 |
|
|
3,301,016 |
|
|
3,297,990 |
|
|
Effect of dilutive securities - stock options |
|
|
-0- |
|
|
463 |
|
|
16,449 |
|
|
|
|
|
|
|
|
|
|
|
|
|
|
Diluted earnings per share - adjusted weighted average common shares |
|
|
3,311,291 |
|
|
3,301,479 |
|
|
3,314,439 |
|
|
Net income (loss) per share available to common stockholders |
|
|
|
|
|
|
|
|
|
|
|
Basic |
|
$ |
(5.52 |
) |
$ |
(6.76 |
) |
$ |
2.22 |
|
|
Diluted |
|
$ |
(5.52 |
) |
$ |
(6.76 |
) |
$ |
2.21 |
|
The following shares were not considered in computing diluted earnings per share for the years ended December 31, 2010, 2009 and 2008 because they were anti-dilutive:
|
|
|
|
|
|
|
|
|
|
|
|
|
|
|
2010 |
|
2009 |
|
2008 |
|
|||
|
|
|
|
|
|
|
|
|
|
|
|
|
Stock options to purchase shares of common stock |
|
|
555,277 |
|
|
519,777 |
|
|
341,516 |
|
|
|
|
|
|
|
|
|
|
|
|
|
|
Average dilutive potential common shares associated with common stock warrants |
|
|
155,025 |
|
|
155,025 |
|
|
-0- |
|
3. Cash and Due From Banks
The average compensating balances held at correspondent banks during 2010 and 2009 were $3,272 and $2,384, respectively. The subsidiary bank maintains such compensating balances with correspondent banks to offset charges for services rendered by those banks. In addition, the Federal Reserve Bank required the subsidiary bank to maintain average balances of approximately $5,002 and $4,007, for 2010 and 2009, respectively, as reserve requirements.
4. Investment Securities
The amortized cost, gross unrealized gains, gross unrealized losses and estimated fair value of available-for-sale and held-to-maturity securities by major security type at December 31, 2010 and December 31, 2009 were as follows:
|
|
|
|
|
|
|
|
|
|
|
|
|
|
|
|
|
|
2010 |
|
||||||||||
|
|
|
Amortized |
|
Gross |
|
Gross |
|
Fair |
|
||||
|
|
|
|
|
|
|
|
|
|
|
||||
|
Available-for-sale: |
|
|
|
|
|
|
|
|
|
|
|
|
|
|
United States Government and |
|
|
|
|
|
|
|
|
|
|
|
|
|
|
federal agency and U.S. Government |
|
|
|
|
|
|
|
|
|
|
|
|
|
|
sponsored enterprises (GSEs) |
|
$ |
77,166 |
|
$ |
1,671 |
|
$ |
(633 |
) |
$ |
78,204 |
|
|
State and Municipal |
|
|
113,308 |
|
|
2,730 |
|
|
(384 |
) |
|
115,654 |
|
|
Collateralized mortgage obligations: |
|
|
|
|
|
|
|
|
|
|
|
|
|
|
GSE residential |
|
|
52,746 |
|
|
2,148 |
|
|
-0- |
|
|
54,894 |
|
|
|
|
|
|
|
|
|
|
|
|
|
|
|
|
|
Total |
|
|
243,220 |
|
|
6,549 |
|
|
(1,017 |
) |
|
248,752 |
|
|
|
|
|
|
|
|
|
|
|
|
|
|
|
|
|
Held-to-maturity: |
|
|
|
|
|
|
|
|
|
|
|
|
|
|
State and Municipal |
|
|
12,187 |
|
|
309 |
|
|
(24 |
) |
|
12,472 |
|
|
|
|
|
|
|
|
|
|
|
|
|
|
|
|
|
Total |
|
$ |
255,407 |
|
$ |
6,858 |
|
$ |
(1,041 |
) |
$ |
261,224 |
|
|
|
|
|
|
|
|
|
|
|
|
|
|
|
|
|
|
|
|
|
|
|
|
|
|
|
|
|
|
|
|
|
|
2009 |
|
||||||||||
|
|
|
Amortized |
|
Gross |
|
Gross |
|
Fair |
|
||||
|
|
|
|
|
|
|
|
|
|
|
||||
|
Available-for-sale: |
|
|
|
|
|
|
|
|
|
|
|
|
|
|
United States Government and |
|
|
|
|
|
|
|
|
|
|
|
|
|
|
federal agency and U.S. Government |
|
|
|
|
|
|
|
|
|
|
|
|
|
|
sponsored enterprises (GSEs) |
|
$ |
95,498 |
|
$ |
1,560 |
|
$ |
(745 |
) |
$ |
96,313 |
|
|
State and Municipal |
|
|
116,864 |
|
|
3,580 |
|
|
(366 |
) |
|
120,078 |
|
|
Collateralized mortgage obligations: |
|
|
|
|
|
|
|
|
|
|
|
|
|
|
GSE residential |
|
|
70,985 |
|
|
1,156 |
|
|
(58 |
) |
|
72,083 |
|
|
|
|
|
|
|
|
|
|
|
|
|
|
|
|
|
Total |
|
|
283,347 |
|
|
6,296 |
|
|
(1,169 |
) |
|
288,474 |
|
|
|
|
|
|
|
|
|
|
|
|
|
|
|
|
|
Held-to-maturity: |
|
|
|
|
|
|
|
|
|
|
|
|
|
|
State and Municipal |
|
|
12,793 |
|
|
547 |
|
|
(9 |
) |
|
13,331 |
|
|
|
|
|
|
|
|
|
|
|
|
|
|
|
|
|
Total |
|
$ |
296,140 |
|
$ |
6,843 |
|
$ |
(1,178 |
) |
$ |
301,805 |
|
|
|
|
|
|
|
|
|
|
|
|
|
|
|
|
17
Notes to Consolidated Financial Statements (Continued)
(dollar amounts in thousands except share data)
Maturities of investment securities classified as available-for-sale and held-to-maturity were as follows at December 31, 2010:
|
|
|
|
|
|
|
|
|
|
|
|
Adjusted |
|
Fair |
|
||
|
|
|
|
|
|
|
||
|
Available-for-sale: |
|
|
|
|
|
|
|
|
Due in one year or less |
|
$ |
2,677 |
|
$ |
2,730 |
|
|
Due after one year through five years |
|
|
26,271 |
|
|
26,984 |
|
|
Due after five years through ten years |
|
|
65,031 |
|
|
66,322 |
|
|
Due after ten years |
|
|
39,601 |
|
|
40,008 |
|
|
|
|
|
|
|
|
|
|
|
|
|
|
133,580 |
|
|
136,044 |
|
|
|
|
|
|
|
|
|
|
|
Mortgage-backed securities |
|
|
56,893 |
|
|
57,813 |
|
|
Collateralized mortgage obligations |
|
|
52,747 |
|
|
54,895 |
|
|
|
|
|
|
|
|
|
|
|
|
|
$ |
243,220 |
|
$ |
248,752 |
|
|
|
|
|
|
|
|
|
|
|
Held-to-maturity: |
|
|
|
|
|
|
|
|
Due in one year or less |
|
$ |
2,841 |
|
$ |
2,866 |
|
|
Due after one year through five years |
|
|
6,627 |
|
|
6,862 |
|
|
Due after five years through ten years |
|
|
2,540 |
|
|
2,567 |
|
|
Due after ten years |
|
|
179 |
|
|
177 |
|
|
|
|
|
|
|
|
|
|
|
|
|
$ |
12,187 |
|
$ |
12,472 |
|
|
|
|
|
|
|
|
|
|
Proceeds from sales of investment securities available-for-sale during 2010, 2009 and 2008 were $52,730, $88,847 and $38,499, respectively. Gross gains were realized of $974 in 2010, $3,323 in 2009 and $431 in 2008 on those sales. Gross losses were realized of $252 in 2010, $1,542 in 2009 and $26 in 2008 on those sales. There was resulting tax expense of $280 in 2010, $690 in 2009 and $157 in 2008 from those sales. There were no sales of investment securities classified as held-to-maturity during 2010, 2009 or 2008.
Securities with unrealized losses at December 31, 2010 and 2009 not recognized in income are as follows:
|
|
|
|
|
|
|
|
|
|
|
|
|
|
|
|
|
|
|
|
|
|
|
|
|
|
|
|
2010 |
|
|
|
|
|
||||||||
|
|
|
Less than 12 Months |
|
12 Months or More |
|
Total |
|
||||||||||||
|
|
|
Fair |
|
Gross |
|
Fair |
|
Gross |
|
Fair |
|
Gross |
|
||||||
|
|
|
|
|
|
|
|
|
|
|
|
|
|
|
||||||
|
United States Government and federal agency and U.S. Government sponsored enterprises (GSEs) |
|
$ |
26,238 |
|
$ |
(633 |
) |
$ |
-0- |
|
$ |
-0- |
|
$ |
26,238 |
|
$ |
(633 |
) |
|
State and Municipal |
|
|
20,493 |
|
|
(367 |
) |
|
1,343 |
|
|
(41 |
) |
|
21,836 |
|
|
(408 |
) |
|
Collateralized mortgage obligations: |
|
|
|
|
|
|
|
|
|
|
|
|
|
|
|
|
|
|
|
|
GSE residential |
|
|
6 |
|
|
-0- |
|
|
-0- |
|
|
-0- |
|
|
6 |
|
|
-0- |
|
|
|
|
|
|
|
|
|
|
|
|
|
|
|
|
|
|
|
|
|
|
|
Total temporarily impaired |
|
$ |
46,737 |
|
$ |
(1,000 |
) |
$ |
1,343 |
|
$ |
(41 |
) |
$ |
48,080 |
|
$ |
(1,041 |
) |
|
|
|
|
|
|
|
|
|
|
|
|
|
|
|
|
|
|
|
|
|
|
|
|
|
|
|
|
|
|
|
|
|
|
|
|
|
|
|
|
|
|
|
|
|
|
|
|
|
2009 |
|
|
|
|
|
||||||||
|
|
|
Less than 12 Months |
|
12 Months or More |
|
Total |
|
||||||||||||
|
|
|
Fair
|
|
Gross
|
|
Fair
|
|
Gross
|
|
Fair
|
|
Gross
|
|
||||||
|
|
|
|
|
|
|
|
|
|
|
|
|
|
|
||||||
|
United States Government and federal agency and U.S. Government sponsored enterprises (GSEs) |
|
$ |
39,012 |
|
$ |
(745 |
) |
$ |
7 |
|
$ |
-0- |
|
$ |
39,019 |
|
$ |
(745 |
) |
|
State and Municipal |
|
|
17,114 |
|
|
(255 |
) |
|
5,344 |
|
|
(120 |
) |
|
22,458 |
|
|
(375 |
) |
|
Collateralized mortgage obligations GSE residential |
|
|
8,006 |
|
|
(58 |
) |
|
-0- |
|
|
-0- |
|
|
8,006 |
|
|
(58 |
) |
|
|
|
|
|
|
|
|
|
|
|
|
|
|
|
|
|
|
|
|
|
|
Total temporarily impaired |
|
$ |
64,132 |
|
$ |
(1,058 |
) |
$ |
5,351 |
|
$ |
(120 |
) |
$ |
69,483 |
|
$ |
(1,178 |
) |
|
|
|
|
|
|
|
|
|
|
|
|
|
|
|
|
|
|
|
|
|
As of December 31, 2010, the amount of securities with an unrealized loss of more than twelve consecutive months is not material.
There are 68 securities in an unrealized loss position in the investment portfolio at December 31, 2010, all due to interest rate changes and not credit events. These unrealized losses are considered temporary and, therefore, have not been recognized into income, because the issuers are of high credit quality and management has the ability and intent to hold for the foreseeable future. The fair value is expected to recover as the investments approach their maturity date or there is a downward shift in interest rates.
The carrying value of securities pledged as collateral to secure public deposits and for other purposes was $209,512 at December 31, 2010 and $283,011 at December 31, 2009.
18
5. Loans and Allowance for Loan Losses
The composition of the loan portfolio as of December 31 was as follows:
|
|
|
|
|
|
|
|
|
|
|
|
2010 |
|
2009 |
|
||
|
Commercial |
|
$ |
138,325 |
|
$ |
163,761 |
|
|
Agricultural |
|
|
78,086 |
|
|
77,060 |
|
|
Agricultural Real Estate |
|
|
46,361 |
|
|
61,348 |
|
|
Commercial Real Estate |
|
|
205,301 |
|
|
214,767 |
|
|
Commercial Real Estate Development |
|
|
88,402 |
|
|
102,633 |
|
|
Residential Real Estate |
|
|
90,869 |
|
|
108,096 |
|
|
|
|
|
|
|
|
|
|
|
Total real estate |
|
|
430,933 |
|
|
486,844 |
|
|
|
|
|
|
|
|
|
|
|
Consumer |
|
|
56,730 |
|
|
70,409 |
|
|
|
|
|
|
|
|
|
|
|
Total |
|
$ |
704,074 |
|
$ |
798,074 |
|
|
|
|
|
|
|
|
|
|
At December 31, 2010 and 2009, the Corporation held $205,301 and $214,767 in commercial real estate and $88,402 and $102,633 in commercial real estate development, respectively. Generally, those loans are collateralized by the real estate being financed. The loans are expected to be repaid from cash flows or from proceeds of sale of the real estate of the borrowers.
At December 31, 2010 and 2009, the Corporation held $78,086 and $77,060 in agricultural production loans and $46,361 and $61,348 in agricultural real estate loans, respectively. Generally, those loans are collateralized by the assets of the borrower. The loans are expected to be repaid from cash flows or from proceeds of sale of selected assets of the borrowers.
During 2010, the Corporation experienced a higher level of charge-offs due in part to the economic environment, particularly in the commercial sector. Accordingly, with the higher charge-offs and the increased level of non-performing loans, the Corporation recorded a provision for loan losses of $40,550 (an increase of $29,488, or 266.6%, over the 2009 provision).
The following table presents the balance in the allowance for loan losses and the recorded investment in loans based on portfolio segment and impairment method as of December 31, 2010.
|
|
|
|
|
|
|
|
|
|
|
|
|
|
|
|
|
|
|
|
|
|
|
|
|
|
|
|
|
|
|
|
|
|
Commercial |
|
Agricultural |
|
Agricultural |
|
Commercial |
|
Commercial |
|
Residential |
|
Consumer |
|
Unallocated |
|
Total |
|
||||||||||
|
|
|
|
|
|
|
|
|
|
|
|
|
|
|
|
|
|
|
|
|
||||||||||
|
Allowance for Loan Losses |
|
|
|
|
|
|
|
|
|
|
|
|
|
|
|
|
|
|
|
|
|
|
|
|
|
|
|
|
|
|
Balance, beginning of year |
|
$ |
181 |
|
$ |
129 |
|
$ |
1,181 |
|
$ |
2,661 |
|
$ |
3,022 |
|
$ |
3,419 |
|
$ |
1,059 |
|
$ |
423 |
|
$ |
12,075 |
|
|
|
Provision charged to expense |
|
|
9,134 |
|
|
(173 |
) |
|
(1,054 |
) |
|
4,828 |
|
|
25,681 |
|
|
745 |
|
|
1,774 |
|
|
(385 |
) |
|
40,550 |
|
|
|
Less: loans charged off |
|
|
4,888 |
|
|
-0- |
|
|
68 |
|
|
1,460 |
|
|
13,177 |
|
|
2,267 |
|
|
1,306 |
|
|
-0- |
|
|
23,166 |
|
|
|
Recoveries |
|
|
8 |
|
|
143 |
|
|
48 |
|
|
-0- |
|
|
-0- |
|
|
-0- |
|
|
68 |
|
|
-0- |
|
|
267 |
|
|
|
|
|
|
|
|
|
|
|
|
|
|
|
|
|
|
|
|
|
|
|
|
|
|
|
|
|
|
|
|
|
|
Balance, end of year |
|
$ |
4,435 |
|
$ |
99 |
|
$ |
107 |
|
$ |
6,029 |
|
$ |
15,526 |
|
$ |
1,897 |
|
$ |
1,595 |
|
$ |
38 |
|
$ |
29,726 |
|
|
|
|
|
|
|
|
|
|
|
|
|
|
|
|
|
|
|
|
|
|
|
|
|
|
|
|
|
|
|
|
|
|
Ending Balance: individually evaluated for impairment |
|
$ |
1,004 |
|
$ |
-0- |
|
$ |
-0- |
|
$ |
3,425 |
|
$ |
6,906 |
|
$ |
484 |
|
$ |
426 |
|
$ |
-0- |
|
$ |
12,245 |
|
|
|
|
|
|
|
|
|
|
|
|
|
|
|
|
|
|
|
|
|
|
|
|
|
|
|
|
|
|
|
|
|
|
Ending Balance: collectively evaluated for impairment |
|
$ |
3,431 |
|
$ |
99 |
|
$ |
107 |
|
$ |
2,604 |
|
$ |
8,620 |
|
$ |
1,413 |
|
$ |
1,169 |
|
$ |
38 |
|
$ |
17,481 |
|
|
|
|
|
|
|
|
|
|
|
|
|
|
|
|
|
|
|
|
|
|
|
|
|
|
|
|
|
|
|
|
|
|
|
|
|
|
|
|
|
|
|
|
|
|
|
|
|
|
|
|
|
|
|
|
|
|
|
|
|
|
|
|
|
Loans |
|
|
|
|
|
|
|
|
|
|
|
|
|
|
|
|
|
|
|
|
|
|
|
|
|
|
|
|
|
|
Ending Balance |
|
$ |
138,325 |
|
$ |
78,086 |
|
$ |
46,361 |
|
$ |
205,301 |
|
$ |
88,402 |
|
$ |
90,869 |
|
$ |
56,730 |
|
$ |
-0- |
|
$ |
704,074 |
|
|
|
|
|
|
|
|
|
|
|
|
|
|
|
|
|
|
|
|
|
|
|
|
|
|
|
|
|
|
|
|
|
|
Ending Balance: individually evaluated for impairment |
|
$ |
2,085 |
|
$ |
-0- |
|
$ |
-0- |
|
$ |
18,130 |
|
$ |
18,334 |
|
$ |
3,873 |
|
$ |
734 |
|
$ |
-0- |
|
$ |
43,156 |
|
|
|
|
|
|
|
|
|
|
|
|
|
|
|
|
|
|
|
|
|
|
|
|
|
|
|
|
|
|
|
|
|
|
Ending Balance: collectively evaluated for impairment |
|
$ |
136,240 |
|
$ |
78,086 |
|
$ |
46,361 |
|
$ |
187,171 |
|
$ |
70,068 |
|
$ |
86,996 |
|
$ |
55,996 |
|
$ |
-0- |
|
$ |
660,918 |
|
|
|
|
|
|
|
|
|
|
|
|
|
|
|
|
|
|
|
|
|
|
|
|
|
|
|
|
|
|
|
|
|
Changes in the allowance for loan losses for the years ended December 31, 2009 and 2008 were as follows:
|
|
|
|
|
|
|
|
|
|
|
|
2009 |
|
2008 |
|
||
|
Balance, January 1 |
|
$ |
5,064 |
|
$ |
3,248 |
|
|
Provision for loan losses |
|
|
11,602 |
|
|
2,968 |
|
|
Loans charged off |
|
|
(4,256 |
) |
|
(1,334 |
) |
|
Recoveries of loans previously charged off |
|
|
205 |
|
|
182 |
|
|
|
|
|
|
|
|
|
|
|
Balance, December 31 |
|
$ |
12,075 |
|
$ |
5,064 |
|
|
|
|
|
|
|
|
|
|
19
Notes to Consolidated Financial Statements (Continued)
(dollar amounts in thousands except share data)
The following tables present the credit risk profile of the Corporation’s loan portfolio based on rating category and payment activity as of December 31, 2010:
Commercial Credit Exposure: Credit Risk Profile by Creditworthiness Category
|
|
|
|
|
|
|
|
|
|
|
|
|
|
|
|
|
|
|
|
|
|
Risk Rating: |
|
Commercial |
|
Agricultural |
|
Agricultural |
|
Commercial |
|
Commercial |
|
Total |
|
||||||
|
1-2 |
|
$ |
3,921 |
|
$ |
12,680 |
|
$ |
5,346 |
|
$ |
5,676 |
|
$ |
52 |
|
$ |
27,675 |
|
|
3 |
|
|
90,147 |
|
|
41,653 |
|
|
27,742 |
|
|
101,219 |
|
|
13,631 |
|
|
274,392 |
|
|
4 |
|
|
23,495 |
|
|
17,319 |
|
|
9,195 |
|
|
29,985 |
|
|
8,744 |
|
|
88,738 |
|
|
5 |
|
|
3,370 |
|
|
2,994 |
|
|
3,385 |
|
|
25,814 |
|
|
22,414 |
|
|
57,977 |
|
|
6 |
|
|
17,392 |
|
|
3,440 |
|
|
693 |
|
|
42,607 |
|
|
43,561 |
|
|
107,693 |
|
|
7 |
|
|
-0- |
|
|
-0- |
|
|
-0- |
|
|
-0- |
|
|
-0- |
|
|
-0- |
|
|
|
|
|
|
|
|
|
|
|
|
|
|
|
|
|
|
|
|
|
|
|
Total |
|
$ |
138,325 |
|
$ |
78,086 |
|
$ |
46,361 |
|
$ |
205,301 |
|
$ |
88,402 |
|
$ |
556,475 |
|
|
|
|
|
|
|
|
|
|
|
|
|
|
|
|
|
|
|
|
|
|
Consumer Credit Exposure: Credit Risk Profile by Creditworthiness Category
|
|
|
|
|
|
|
|
|
|
|
|
|
Risk Rating: |
|
Residential |
|
Consumer |
|
Total |
|
|||
|
Pass |
|
$ |
81,504 |
|
$ |
53,958 |
|
$ |
135,462 |
|
|
Special Mention |
|
|
314 |
|
|
147 |
|
|
461 |
|
|
Substandard |
|
|
9,051 |
|
|
2,539 |
|
|
11,590 |
|
|
Doubtful |
|
|
-0- |
|
|
86 |
|
|
86 |
|
|
|
|
|
|
|
|
|
|
|
|
|
|
Total |
|
$ |
90,869 |
|
$ |
56,730 |
|
$ |
147,599 |
|
|
|
|
|
|
|
|
|
|
|
|
|
Credit Quality Indicators
The Corporation categorizes loans into risk categories based on relevant information about the ability of borrowers to service their debt such as current financial information, historical payment experience, credit documentation, public information and current economic trends among other factors. The Corporation analyzes loans individually by classifying the loans as to credit risk. This analysis is performed on all loans at origination and regularly reviewed by the Risk Management department.
The Corporation has established a uniform internal risk rating methodology for commercial loans utilizing risk grades from 1 through 7, with 1 being considered “excellent” and the rating of 7 being considered “doubtful.” A summary of the general definitions for the risk ratings follows:
|
|
|
|
|
|
1 |
Prime Quality: This category includes all obligors whose balance sheet, current position, capitalization, profitability and cash flow have been demonstrated to be consistently of such high quality that the potential for significant disruption in their financial performance is virtually nonexistent. Such borrowers have excellent management in place with depth, well defined and established product lines or services, and operate businesses generally isolated from the normal influences of the business cycle. |
|
|
|
|
|
|
2 |
High Quality: Borrowers assigned this rating are considered above average with high quality and excellent credit standards based on leverage, liquidity and debt coverage ratios, as well as having excellent management in critical areas. |
|
|
|
|
|
|
3 |
Satisfactory “Average” Quality: This category includes borrowers that have average leverage, liquidity and debt service ratios that compare favorably with industry standards. |
|
|
|
|
|
|
4 |
Low Pass: This risk rating includes borrowers that have below average leverage, liquidity and debt service coverage ratios and management that may not be as solid on a historical basis or may compare less favorably with industry standards but are still considered acceptable. |
|
|
|
|
|
|
5 |
Watch/Special Mention (OAEM): A borrower assigned to this rating category exhibits potential weaknesses or early warning signals that deserve close monitoring by management. If left uncorrected, these potential weaknesses may result in the borrower being unable to meet its financial obligations at some future date. |
|
|
|
|
|
|
6 |
Substandard: A substandard rating is assigned to a borrower whose credit is inadequately protected by the paying capacity of the borrower, or by the collateral pledged, if any. Loans so classified have a well-defined weakness or weaknesses that jeopardize the liquidation of the debt. These credits are characterized by the distinct possibility that the Corporation will sustain some loss if deficiencies are not corrected. |
|
|
|
|
|
|
7 |
Doubtful: Borrowers assigned to this rating category have all of the weaknesses inherent in a substandard rating with the added factor that the weaknesses are pronounced to the point where, on the basis of current facts, conditions and values, collection or liquidation in full is highly questionable or improbable. While the possibility of loss is extremely high, the existence of specific pending factors, which may work to the borrower’s advantage, warrants that the estimated loss be deferred until a more exact status can be determined. |
The Corporation classifies consumer loans in the risk rating classifications of Pass, Special Mention, Substandard and Doubtful. These classifications generally conform to the risk rating methodology for commercial loans as follows: Pass - risk rating 1 through 4; Special Mention - risk rating 5; Substandard - risk rating 6; Doubtful - risk rating 7.
20
The following table presents the Corporation’s loan portfolio aging analysis as of December 31, 2010:
|
|
|
|
|
|
|
|
|
|
|
|
|
|
|
|
|
|
|
|
|
|
|
|
|
|
|
30-59 Days |
|
60-89 Days |
|
>90 Days |
|
Total |
|
Total |
|
Total |
|
> 90 Days and |
|
|||||||
|
|
|
|
|
|
|
|
|
|
|
|
|
|
|
|
|
|||||||
|
Commercial |
|
$ |
2,221 |
|
$ |
420 |
|
$ |
222 |
|
$ |
2,863 |
|
$ |
126,621 |
|
$ |
129,484 |
|
$ |
222 |
|
|
Agricultural |
|
|
284 |
|
|
-0- |
|
|
-0- |
|
|
284 |
|
|
75,892 |
|
|
76,176 |
|
|
-0- |
|
|
Agricultural Real Estate |
|
|
249 |
|
|
-0- |
|
|
-0- |
|
|
249 |
|
|
45,667 |
|
|
45,916 |
|
|
-0- |
|
|
Commercial Real Estate |
|
|
3,288 |
|
|
1,324 |
|
|
1,140 |
|
|
5,752 |
|
|
173,890 |
|
|
179,642 |
|
|
1,140 |
|
|
Commercial Real Estate Development |
|
|
669 |
|
|
-0- |
|
|
-0- |
|
|
669 |
|
|
50,642 |
|
|
51,311 |
|
|
-0- |
|
|
Residential Real Estate |
|
|
4,340 |
|
|
1,601 |
|
|
199 |
|
|
6,140 |
|
|
77,970 |
|
|
84,110 |
|
|
199 |
|
|
Consumer |
|
|
681 |
|
|
156 |
|
|
-0- |
|
|
837 |
|
|
55,176 |
|
|
56,013 |
|
|
-0- |
|
|
Non-Accrual |
|
|
846 |
|
|
8,390 |
|
|
53,393 |
|
|
62,629 |
|
|
18,793 |
|
|
81,422 |
|
|
-0- |
|
|
|
|
|
|
|
|
|
|
|
|
|
|
|
|
|
|
|
|
|
|
|
|
|
|
Total |
|
$ |
12,578 |
|
$ |
11,891 |
|
$ |
54,954 |
|
$ |
79,423 |
|
$ |
624,651 |
|
$ |
704,074 |
|
$ |
1,561 |
|
|
|
|
|
|
|
|
|
|
|
|
|
|
|
|
|
|
|
|
|
|
|
|
|
A loan is considered impaired, in accordance with the impairment accounting guidance (ASC 310-10-35-16), when based on current information and events it is probable the Corporation will be unable to collect all amounts due from the borrower in accordance with the contractual terms of the loan. Impaired loans include non-performing loans but also include loans modified in troubled debt restructurings where concessions have been granted to borrowers experiencing financial difficulties. These concessions could include a reduction in the interest rate on the loan, payment extensions, forgiveness of principal, forbearance or other actions intended to maximize collection.
The following table presents impaired loans for the year ended December 31, 2010:
|
|
|
|
|
|
|
|
|
|
|
|
|
|
|
|
|
|
|
|
|
Recorded |
|
Unpaid |
|
Specific |
|
Average |
|
Interest |
|
|||||
|
|
|
|
|
|
|
|
|
|
|
|
|
|||||
|
With no related allowance recorded: |
|
|
|
|
|
|
|
|
|
|
|
|
|
|
|
|
|
Commercial |
|
$ |
9,887 |
|
$ |
11,660 |
|
$ |
-0- |
|
$ |
5,874 |
|
$ |
36 |
|
|
Commercial Real Estate |
|
|
12,903 |
|
|
13,220 |
|
|
-0- |
|
|
8,915 |
|
|
480 |
|
|
Commercial Real Estate Development |
|
|
26,695 |
|
|
36,909 |
|
|
-0- |
|
|
21,573 |
|
|
225 |
|
|
Residential Real Estate |
|
|
4,680 |
|
|
5,306 |
|
|
-0- |
|
|
5,591 |
|
|
96 |
|
|
Consumer |
|
|
-0- |
|
|
-0- |
|
|
-0- |
|
|
-0- |
|
|
-0- |
|
|
With an allowance recorded: |
|
|
|
|
|
|
|
|
|
|
|
|
|
|
|
|
|
Commercial |
|
$ |
1,908 |
|
$ |
2,095 |
|
$ |
1,004 |
|
$ |
1,384 |
|
$ |
59 |
|
|
Commercial Real Estate |
|
|
18,130 |
|
|
18,130 |
|
|
3,425 |
|
|
9,065 |
|
|
77 |
|
|
Commercial Real Estate Development |
|
|
18,507 |
|
|
18,507 |
|
|
6,906 |
|
|
14,444 |
|
|
428 |
|
|
Residential Real Estate |
|
|
3,873 |
|
|
3,873 |
|
|
484 |
|
|
3,505 |
|
|
82 |
|
|
Consumer |
|
|
768 |
|
|
735 |
|
|
426 |
|
|
679 |
|
|
14 |
|
|
Total: |
|
|
|
|
|
|
|
|
|
|
|
|
|
|
|
|
|
Commercial |
|
$ |
88,030 |
|
$ |
100,521 |
|
$ |
11,335 |
|
$ |
61,254 |
|
$ |
1,305 |
|
|
|
|
|
|
|
|
|
|
|
|
|
|
|
|
|
|
|
|
Residential |
|
$ |
8,553 |
|
$ |
9,179 |
|
$ |
484 |
|
$ |
9,096 |
|
$ |
178 |
|
|
|
|
|
|
|
|
|
|
|
|
|
|
|
|
|
|
|
|
Consumer |
|
$ |
768 |
|
$ |
735 |
|
$ |
426 |
|
$ |
679 |
|
$ |
14 |
|
|
|
|
|
|
|
|
|
|
|
|
|
|
|
|
|
|
|
Included in certain loan categories in the impaired loans are troubled debt restructurings that were classified as impaired. At December 31, 2010, the Corporation had $1,672 of residential real estate loans, $330 of consumer loans, $5,293 of commercial real estate development loans and $16,091 of commercial real estate loans that were modified in troubled debt restructurings and impaired. Of these amounts, the Corporation had troubled debt restructurings that were performing in accordance with their modified terms of $1,522 of residential real estate loans, $262 of consumer loans, $5,293 of commercial real estate development loans and $14,757 of commercial real estate loans at December 31, 2010.
The following table presents the Corporation’s non-accrual loans at December 31, 2010 and 2009. This table excludes accruing troubled debt restructurings.
|
|
|
|
|
|
|
|
|
|
|
|
2010 |
|
2009 |
|
||
|
Commercial |
|
$ |
8,841 |
|
$ |
10,751 |
|
|
Agricultural |
|
|
1,910 |
|
|
110 |
|
|
Agricultural Real Estate |
|
|
444 |
|
|
444 |
|
|
Commercial Real Estate |
|
|
25,659 |
|
|
16,169 |
|
|
Commercial Real Estate Development |
|
|
37,091 |
|
|
16,367 |
|
|
Residential Real Estate |
|
|
6,760 |
|
|
7,024 |
|
|
Consumer |
|
|
717 |
|
|
621 |
|
|
|
|
|
|
|
|
|
|
|
Total |
|
$ |
81,422 |
|
$ |
51,486 |
|
|
|
|
|
|
|
|
|
|
Interest income that would have been recorded on these non-accrual loans, had they remained current, was approximately $5,694, $3,256 and $1,449, respectively. At December 31, 2010, 2009 and 2008, accruing loans delinquent 90 days or more totaled $1,561, $2,087 and $2,655, respectively.
Impaired loans at December 31, 2009 and 2008 totaled $44,116 and $25,128, respectively, and consisted of commercial, commercial real estate, commercial real estate development and residential real estate loans. Of these totals, $14,376 and $1,976 of loans had valuation reserves totaling $4,472 and $370 at December 31, 2009 and 2008, respectively. For the years ended December 31, 2009 and 2008, the average recorded investment in impaired loans was approximately $23,139 and $10,414, respectively. Interest recognized on impaired loans during the portion of the year that they were impaired was not material.
21
Notes to Consolidated Financial Statements (Continued)
(dollar amounts in thousands except share data)
The Corporation’s subsidiary bank had loans outstanding to directors, executive officers and to their related interests (related parties) of the Corporation and its subsidiary bank of approximately $2,404, $9,394 and $6,356, at December 31, 2010, 2009 and 2008, respectively. These loans were made in the ordinary course of business on substantially the same terms and conditions, including interest rates and collateral, as those prevailing at the time for comparable transactions with other customers and did not involve more than the normal risk of collectibility. As a practice, the subsidiary bank does not make loans to its executive officers. A summary of the activity in 2010 for loans made to directors, executive officers or principal holders of common stock or to any associate of such persons for which the aggregate to any such person exceeds $60 at December 31, 2010 is as follows:
|
|
|
|
|
|
|
|
|
|
|
|
|
|
|
|
|
|
|
|
|
|
|
|
|
|
|
|
|
|
|
Balance |
|
Change in |
|
Additions |
|
Payments |
|
Balance |
|
|||||||||||||||
|
|
|
|
|
|
|
|
|
|
|
|
|
|||||||||||||||
|
|
|
|
$ |
9,394 |
|
|
|
$ |
(5,197 |
) |
|
|
$ |
5,455 |
|
|
|
$ |
7,248 |
|
|
|
$ |
2,404 |
|
|
6. Premises and Equipment
As of December 31, the components of premises and equipment (at cost), less accumulated depreciation, were as follows:
|
|
|
|
|
|
|
|
|
|
|
|
2010 |
|
2009 |
|
||
|
Land |
|
$ |
6,175 |
|
$ |
6,170 |
|
|
Buildings |
|
|
30,398 |
|
|
30,364 |
|
|
Furniture and Equipment |
|
|
23,597 |
|
|
22,929 |
|
|
|
|
|
|
|
|
|
|
|
|
|
|
60,170 |
|
|
59,463 |
|
|
Less: accumulated depreciation |
|
|
33,269 |
|
|
31,194 |
|
|
|
|
|
|
|
|
|
|
|
Total |
|
$ |
26,901 |
|
$ |
28,269 |
|
|
|
|
|
|
|
|
|
|
The Corporation owns separate lots in Elburn, Aurora and Somonauk, Illinois that have been removed from the land balance and are shown on the Corporation’s balance sheet as land held-for-sale, at the lower of cost or market. The land in Elburn, approximately 2 acres, was purchased in 2003 in anticipation of the construction of a branch facility and has a cost basis of $820 at December 31, 2010, down from $930 at December 31, 2009, due to a write down of $110 in 2010. The land in Aurora, consisting of two lots remaining from the original purchase of 14 acres in 2004 which was used to construct a branch facility, has a cost basis of $1,344. The land in Somonauk, acquired in 2005 during the acquisition of FSB Bancorp, Inc., consists of approximately 2 acres with a cost basis of $80.
Depreciation expense charged to operating expense for 2010, 2009 and 2008 was $2,075, $2,170 and $2,219, respectively.
7. Goodwill
The changes in carrying amount of goodwill for the year ended December 31, 2009 was:
|
|
|
|
|
|
|
|
|
2009 |
|
|
|
|
|
|
|
|
|
Balance as of January 1 |
|
$ |
24,521 |
|
|
Goodwill impairment losses |
|
|
(24,521 |
) |
|
|
|
|
|
|
|
Balance as of December 31 |
|
$ |
-0- |
|
|
|
|
|
|
|
In accordance with ASC 350, formerly SFAS No. 142, the Corporation’s goodwill was tested annually for potential impairment and more frequently if events or changes in circumstances indicated the asset might be impaired. Due to the decline in the Corporation’s stock price and the additional provision for loan losses and increased nonperforming assets, the Corporation hired a valuation specialist to perform a valuation of the Corporation’s goodwill to test for impairment at December 31, 2009.
ASC 350 has a two-step process to test goodwill for impairment. The first step is to compare the estimated fair value, including goodwill, of the reporting unit (the Corporation) to its net book value. If the estimated fair value is less than the net book value, a second step is required. The Corporation evaluated the first step by utilizing three valuation methodologies including the Comparable Transactions approach, the Control Premium approach and the Discounted Cash Flow approach. The Comparable Transactions approach is based on pricing ratios recently paid in the sale or merger of reasonably comparable banking franchises; the Control Premium approach is based on the Corporation’s trading price and application of industry based control premiums, and the Discounted Cash Flow approach is estimated based on the present value of projected dividends and a terminal value, based on a five-year forward-looking operating scenario. Based on the three approaches, it was determined the fair value, including goodwill, was lower than its net book value. This was primarily due to the Corporation’s continued stock price decline, the additional provisions for loan losses and increased nonperforming assets.
Therefore, the Corporation performed the second step as required by ASC 350. In the second step of the process, the implied fair value of the Corporation’s goodwill (determined by comparing the estimated fair value of the Corporation to the sum of the fair values of the Corporation’s tangible and separately identifiable intangible net assets as determined by ASC 805, formerly SFAS No. 141R) was compared with the carrying value of goodwill in order to determine the amount of impairment. As a result of the second step of the process, the Corporation determined that the goodwill was fully impaired as of December 31, 2009 and recorded an impairment charge of $24,521 in the fourth quarter of 2009.
22
8. Intangible Assets
The
balance of intangible assets, net of accumulated amortization, totaled $2,531
and $3,347 at December 31, 2010 and December 31, 2009, respectively.
The
following table summarizes the Corporation’s intangible assets, which are
subject to amortization, as of December 31, 2010 and 2009:
|
|
|
|
|
|
|
|
|
|
|
|
|
|
|
|
|
|
2010 |
|
2009 |
|
||||||||
|
|
|
Gross Carrying |
|
Accumulated |
|
Gross Carrying |
|
Accumulated |
|
||||
|
|
|
|
|
|
|
|
|
|
|
||||
|
Core deposit intangible |
|
$ |
9,004 |
|
$ |
(6,522 |
) |
$ |
9,004 |
|
$ |
(5,715 |
) |
|
Other acquisition costs |
|
|
234 |
|
|
(185 |
) |
|
234 |
|
|
(176 |
) |
|
|
|
|
|
|
|
|
|
|
|
|
|
|
|
|
Total |
|
$ |
9,238 |
|
$ |
(6,707 |
) |
$ |
9,238 |
|
$ |
(5,891 |
) |
|
|
|
|
|
|
|
|
|
|
|
|
|
|
|
Intangible asset amortization expense charged to operating expense for 2010, 2009 and 2008 was $816, $860 and $714, respectively. The following table shows the future estimated amortization expense for the Corporation’s intangible assets based on existing balances as of December 31, 2010:
Estimated Amortization Expense for the years ended December 31:
|
|
|
|
|
|
|
2011 |
|
$ |
653 |
|
|
2012 |
|
|
549 |
|
|
2013 |
|
|
526 |
|
|
2014 |
|
|
504 |
|
|
2015 |
|
|
289 |
|
|
Thereafter |
|
|
10 |
|
Mortgage servicing rights, which are included in other assets on the Consolidated Balance Sheets, are accounted for on an individual loan-by-loan basis. Accordingly, amortization is recorded in proportion to the amount of principal payment received on loans serviced. The mortgage servicing rights are subject to periodic impairment testing. As of December 31, 2010, the Corporation recognized a valuation allowance on mortgage servicing rights of $110. The valuation allowance includes impairment charges of $922, as well as a subsequent recovery of $812 during 2010. As of December 31, 2009, the Corporation recognized a valuation allowance on mortgage servicing rights of $185. Changes in the carrying value of mortgage servicing rights are summarized as follows:
|
|
|
|
|
|
|
|
|
|
|
|
|
|
|
2010 |
|
2009 |
|
2008 |
|
|||
|
Balance, January 1 |
|
$ |
3,285 |
|
$ |
2,936 |
|
$ |
2,498 |
|
|
Servicing rights capitalized |
|
|
900 |
|
|
1,196 |
|
|
815 |
|
|
Amortization of servicing rights |
|
|
(690 |
) |
|
(662 |
) |
|
(377 |
) |
|
Valuation adjustment |
|
|
(110 |
) |
|
(185 |
) |
|
-0- |
|
|
|
|
|
|
|
|
|
|
|
|
|
|
Balance, December 31 |
|
$ |
3,385 |
|
$ |
3,285 |
|
$ |
2,936 |
|
|
|
|
|
|
|
|
|
|
|
|
|
Activity in the valuation allowance for mortgage servicing rights was as follows:
|
|
|
|
|
|
|
|
|
|
|
|
|
|
|
2010 |
|
2009 |
|
2008 |
|
|||
|
Balance, January 1 |
|
$ |
185 |
|
$ |
-0- |
|
$ |
-0- |
|
|
Additions |
|
|
922 |
|
|
556 |
|
|
-0- |
|
|
Reductions |
|
|
(812 |
) |
|
(371 |
) |
|
-0- |
|
|
|
|
|
|
|
|
|
|
|
|
|
|
Balance, December 31 |
|
$ |
295 |
|
$ |
185 |
|
$ |
-0- |
|
|
|
|
|
|
|
|
|
|
|
|
|
The following table shows the future estimated amortization expense for mortgage servicing rights based on existing balances as of December 31, 2010. The Corporation’s actual amortization expense in any given period may be significantly different from the estimated amounts displayed, depending on the amount of additional mortgage servicing rights, changes in mortgage interest rates, estimated prepayment speeds and market conditions.
Estimated Amortization Expense for the year ended December 31:
|
|
|
|
|
|
|
2011 |
|
$ |
381 |
|
|
2012 |
|
|
357 |
|
|
2013 |
|
|
335 |
|
|
2014 |
|
|
314 |
|
|
2015 |
|
|
295 |
|
|
Thereafter |
|
|
1,703 |
|
The Corporation services loans for others with unpaid principal balances at December 31, 2010, 2009 and 2008 of approximately $395,046, $363,862 and $304,551, respectively.
23
Notes to Consolidated Financial Statements (Continued)
(dollar amounts in thousands except share data)
9. Deposits
As of December 31, the aggregate amounts of time deposits in denominations of $100 or more and related interest expense were as follows:
|
|
|
|
|
|
|
|
|
|
|
|
|
|
|
2010 |
|
2009 |
|
2008 |
|
|||
|
Amount |
|
$ |
146,685 |
|
$ |
193,449 |
|
$ |
232,811 |
|
|
Interest expense for the year |
|
|
1,883 |
|
|
4,044 |
|
|
4,124 |
|
Total interest expense on deposits for the years ending December 31 was as follows:
|
|
|
|
|
|
|
|
|
|
|
|
|
|
|
2010 |
|
2009 |
|
2008 |
|
|||
|
Interest-bearing demand |
|
$ |
2,972 |
|
$ |
3,734 |
|
$ |
3,647 |
|
|
Savings |
|
|
62 |
|
|
55 |
|
|
67 |
|
|
Time |
|
|
7,351 |
|
|
15,431 |
|
|
20,068 |
|
|
|
|
|
|
|
|
|
|
|
|
|
|
Total |
|
$ |
10,385 |
|
$ |
19,220 |
|
$ |
23,782 |
|
|
|
|
|
|
|
|
|
|
|
|
|
At December 31, 2010, the scheduled maturities of time deposits are as follows:
|
|
|
|
|
|
|
2011 |
|
$ |
316,816 |
|
|
2012 |
|
|
42,055 |
|
|
2013 |
|
|
2,950 |
|
|
2014 |
|
|
1,184 |
|
|
2015 |
|
|
3,311 |
|
|
Thereafter |
|
|
19 |
|
|
|
|
|
|
|
|
Total |
|
$ |
366,335 |
|
|
|
|
|
|
|
10. Borrowings
As of December 31, borrowings consisted of the following:
|
|
|
|
|
|
|
|
|
|
|
|
|
|
|
|
|
|
2010 |
|
2009 |
|
||||||||
|
|
|
Amount |
|
Weighted |
|
Amount |
|
Weighted |
|
||||
|
|
|
|
|
|
|
|
|
|
|
||||
|
Customer repurchase agreements |
|
$ |
35,806 |
|
|
0.63 |
% |
$ |
47,327 |
|
|
1.03 |
% |
|
Advances from the Federal Home Loan Bank of Chicago due: |
|
|
|
|
|
|
|
|
|
|
|
|
|
|
February 1, 2010 |
|
|
-0- |
|
|
n/a |
|
|
5,000 |
|
|
2.87 |
|
|
March 19, 2010 |
|
|
-0- |
|
|
n/a |
|
|
4,000 |
|
|
3.45 |
|
|
August 27, 2010 |
|
|
-0- |
|
|
n/a |
|
|
2,500 |
|
|
2.00 |
|
|
September 19, 2010 |
|
|
-0- |
|
|
n/a |
|
|
4,000 |
|
|
3.60 |
|
|
December 20, 2010 |
|
|
-0- |
|
|
n/a |
|
|
7,000 |
|
|
2.19 |
|
|
March 21, 2011 |
|
|
4,000 |
|
|
1.23 |
|
|
4,000 |
|
|
1.23 |
|
|
May 23, 2011 |
|
|
5,000 |
|
|
0.99 |
|
|
5,000 |
|
|
0.99 |
|
|
Interest-bearing demand notes issued to the U.S. Treasury |
|
|
1,753 |
|
|
0.00 |
|
|
1,021 |
|
|
0.00 |
|
|
Trust preferred securities |
|
|
25,000 |
|
|
4.55 |
|
|
25,000 |
|
|
5.68 |
|
|
|
|
|
|
|
|
|
|
|
|
|
|
|
|
|
Total |
|
$ |
71,559 |
|
|
2.04 |
% |
$ |
104,848 |
|
|
2.51 |
% |
|
|
|
|
|
|
|
|
|
|
|
|
|
|
|
The subsidiary bank has adopted a collateral pledge agreement whereby they agree to keep on hand at all times, free of all other pledges, liens and encumbrances, first mortgages with unpaid principal balances aggregating no less than 167% of the outstanding secured advances from the Federal Home Loan Bank of Chicago (FHLB). The advances from the FHLB, which have fixed interest rates ranging from 0.99% to 1.23% as of December 31, 2010, are subject to restrictions or penalties in the event of prepayment. All stock in the FHLB is also pledged as additional collateral for these advances.
On July 15, 2005, the Corporation, through its subsidiary PNBC Capital Trust I, issued trust preferred securities in the amount of $25,000. These securities were issued to help finance the acquisition of Somonauk FSB Bancorp, Inc. Additionally, these securities have a maturity of thirty years and a fixed interest rate of 5.68% for the first five years to July 15, 2010. The interest then adjusts to a floating rate at the three-month LIBOR plus 154 basis points. The rate on December 31, 2010 was LIBOR plus 154 basis points, or 1.84%. While these securities are recorded as a liability for financial reporting purposes, a portion qualifies as Tier 1 capital for regulatory purposes. According to the provisions of ASC Topic 810, “Consolidation of Variable Interest Entities,” PNBC Capital Trust I is a variable interest entity which is not required to be consolidated by the Corporation.
On January 24, 2011, the Corporation provided notice to Bank of America, N.A., as successor trustee by merger, of the Corporation’s $25,000 in junior subordinated debt securities due 2035 (PNBC Capital Trust I) that the Corporation is exercising its right to defer interest payments for a period of twenty (20) consecutive quarterly interest payment periods beginning with the next interest payment period of March 15, 2011, unless the Corporation subsequently gives notice that it has elected to shorten such deferral period.
Customer repurchase agreements consist of obligations of the Bank to other parties. The obligations are secured by investment securities and such collateral is held by the Bank. The maximum amount of outstanding agreements at any month-end during 2010 and 2009 totaled $43,391 and $50,025, respectively, and the daily average of such agreements totaled $36,981 and $37,921 for 2010 and 2009, respectively. The agreements at December 31, 2010 are ongoing and as such have no fixed maturity date.
24
11. Income Taxes
Income tax expense (benefit) consisted of the following:
|
|
|
|
|
|
|
|
|
|
|
|
|
|
|
Current |
|
Deferred |
|
Total |
|
|||
|
|
|
|
|
|
|
|
|
|||
|
Year ended December 31, 2010: |
|
|
|
|
|
|
|
|
|
|
|
Federal |
|
$ |
(1,843 |
) |
$ |
(7,863 |
) |
$ |
(9,706 |
) |
|
State |
|
|
-0- |
|
|
(2,198 |
) |
|
(2,198 |
) |
|
|
|
|
|
|
|
|
|
|
|
|
|
Total |
|
$ |
(1,843 |
) |
$ |
(10,061 |
) |
$ |
(11,904 |
) |
|
|
|
|
|
|
|
|
|
|
|
|
|
|
|
|
|
|
|
|
|
|
|
|
|
Year ended December 31, 2009: |
|
|
|
|
|
|
|
|
|
|
|
Federal |
|
$ |
1,738 |
|
$ |
(3,191 |
) |
$ |
(1,453 |
) |
|
State |
|
|
409 |
|
|
(556 |
) |
|
(147 |
) |
|
|
|
|
|
|
|
|
|
|
|
|
|
Total |
|
$ |
2,147 |
|
$ |
(3,747 |
) |
$ |
(1,600 |
) |
|
|
|
|
|
|
|
|
|
|
|
|
|
Year ended December 31, 2008: |
|
|
|
|
|
|
|
|
|
|
|
Federal |
|
$ |
1,690 |
|
$ |
(391 |
) |
$ |
1,299 |
|
|
State |
|
|
609 |
|
|
(211 |
) |
|
398 |
|
|
|
|
|
|
|
|
|
|
|
|
|
|
Total |
|
$ |
2,299 |
|
$ |
(602 |
) |
$ |
1,697 |
|
|
|
|
|
|
|
|
|
|
|
|
|
Income tax expense (benefit) differed from the amounts computed by applying the U.S. Federal income tax rate of 34 percent to pretax income (loss) as a result of the following for the years ended December 31:
|
|
|
|
|
|
|
|
|
|
|
|
|
|
|
2010 |
|
2009 |
|
2008 |
|
|||
|
Computed “expected” tax expense (benefit) |
|
$ |
(9,820 |
) |
$ |
(7,727 |
) |
$ |
3,068 |
|
|
Increase (decrease) in income taxes resulting from: |
|
|
|
|
|
|
|
|
|
|
|
Tax-exempt income |
|
|
(1,391 |
) |
|
(1,891 |
) |
|
(1,439 |
) |
|
Non-deductible interest expense |
|
|
67 |
|
|
118 |
|
|
131 |
|
|
State income taxes, net of federal tax benefit |
|
|
(1,452 |
) |
|
(63 |
) |
|
240 |
|
|
Bank-owned life insurance income |
|
|
(314 |
) |
|
(350 |
) |
|
(285 |
) |
|
Non-deductible goodwill impairment |
|
|
-0- |
|
|
8,269 |
|
|
-0- |
|
|
Recharacterization of municipal income |
|
|
962 |
|
|
-0- |
|
|
-0- |
|
|
Other, net |
|
|
44 |
|
|
44 |
|
|
(18 |
) |
|
|
|
|
|
|
|
|
|
|
|
|
|
|
|
$ |
(11,904 |
) |
$ |
(1,600 |
) |
$ |
1,697 |
|
|
|
|
|
|
|
|
|
|
|
|
|
The tax effects of temporary differences that give rise to significant portions of the deferred tax assets and deferred tax liabilities at December 31, 2010 and 2009 are presented below:
|
|
|
|
|
|
|
|
|
|
|
|
2010 |
|
2009 |
|
||
|
Deferred tax assets: |
|
|
|
|
|
|
|
|
Deferred compensation |
|
$ |
143 |
|
$ |
176 |
|
|
Allowance for loan losses |
|
|
11,542 |
|
|
4,687 |
|
|
Nonaccrual loan interest income |
|
|
942 |
|
|
408 |
|
|
AMT credit carryforwards |
|
|
1,975 |
|
|
1,053 |
|
|
Post-retirement health benefit plan accrual |
|
|
441 |
|
|
441 |
|
|
Stock option expense |
|
|
104 |
|
|
70 |
|
|
Federal net operating losses, net |
|
|
772 |
|
|
-0- |
|
|
State net operating losses, net of federal benefit |
|
|
526 |
|
|
-0- |
|
|
Other, net |
|
|
441 |
|
|
55 |
|
|
|
|
|
|
|
|
|
|
|
Total gross deferred tax assets |
|
|
16,886 |
|
|
6,890 |
|
|
|
|
|
|
|
|
|
|
|
Deferred tax liabilities: |
|
|
|
|
|
|
|
|
Buildings and equipment, principally due to differences in depreciation |
|
|
(403 |
) |
|
(589 |
) |
|
Accretion |
|
|
(32 |
) |
|
(21 |
) |
|
Purchase accounting adjustments |
|
|
(1,853 |
) |
|
(2,069 |
) |
|
FHLB stock dividends |
|
|
(276 |
) |
|
(276 |
) |
|
Mortgage servicing rights |
|
|
(1,314 |
) |
|
(1,275 |
) |
|
Prepaid expenses |
|
|
(353 |
) |
|
(66 |
) |
|
Unrealized gain on investment securities available-for-sale |
|
|
(2,143 |
) |
|
(1,986 |
) |
|
|
|
|
|
|
|
|
|
|
Total gross deferred tax liabilities |
|
|
(6,374 |
) |
|
(6,282 |
) |
|
|
|
|
|
|
|
|
|
|
Net deferred tax assets |
|
$ |
10,512 |
|
$ |
608 |
|
|
|
|
|
|
|
|
|
|
25
Notes to Consolidated Financial Statements (Continued)
(dollar amounts in thousands except share data)
During 2010, the Corporation filed amended tax returns for 2007 through 2009 to recharacterize income on certain municipal securities determined to be taxable. The effect was recognized in the 2010 tax provision as a change in estimate.
At December 31, 2010 and 2009, the Company had alternative minimum tax credits of $1,975 and $1,053, respectively, that can be carried forward indefinitely. At December 31, 2010, the Company has a federal net operating loss carryforward of $2,272 that will expire in 2030 and an Illinois net operating loss carryforward of $10,913 that is suspended until 2014 and will expire in 2025. Management believes it is more likely than not that the deferred tax assets will be realized. Therefore, no valuation allowance has been recorded at December 31, 2010 and 2009.
12. Comprehensive Income
Other comprehensive income components and related taxes were as follows:
|
|
|
|
|
|
|
|
|
|
|
|
|
|
|
2010 |
|
2009 |
|
2008 |
|
|||
|
Net unrealized gains on securities available-for-sale |
|
$ |
1,127 |
|
$ |
4,089 |
|
$ |
2,107 |
|
|
Reclassification adjustment for realized gains included in income |
|
|
(722 |
) |
|
(1,781 |
) |
|
(405 |
) |
|
|
|
|
|
|
|
|
|
|
|
|
|
|
|
|
405 |
|
|
2,308 |
|
|
1,702 |
|
|
Defined benefit pension plan |
|
|
|
|
|
|
|
|
|
|
|
Net prior service credit |
|
|
62 |
|
|
62 |
|
|
-0- |
|
|
Amortization of transition obligation |
|
|
-0- |
|
|
-0- |
|
|
16 |
|
|
Net loss |
|
|
(62 |
) |
|
(88 |
) |
|
-0- |
|
|
|
|
|
|
|
|
|
|
|
|
|
|
Other comprehensive income, before tax effect |
|
|
405 |
|
|
2,282 |
|
|
1,718 |
|
|
Tax expense |
|
|
157 |
|
|
868 |
|
|
660 |
|
|
|
|
|
|
|
|
|
|
|
|
|
|
Other comprehensive income |
|
$ |
248 |
|
$ |
1,414 |
|
$ |
1,058 |
|
|
|
|
|
|
|
|
|
|
|
|
|
The components of accumulated other comprehensive income included in stockholders’ equity, are as follows:
|
|
|
|
|
|
|
|
|
|
|
|
|
|
|
2010 |
|
2009 |
|
2008 |
|
|||
|
Net unrealized gain on securities available-for-sale |
|
$ |
5,532 |
|
$ |
5,127 |
|
$ |
2,820 |
|
|
Net unrealized benefit obligations |
|
|
(531 |
) |
|
(531 |
) |
|
(540 |
) |
|
|
|
|
|
|
|
|
|
|
|
|
|
|
|
|
5,001 |
|
|
4,596 |
|
|
2,280 |
|
|
Tax effect |
|
|
(1,937 |
) |
|
(1,780 |
) |
|
(878 |
) |
|
|
|
|
|
|
|
|
|
|
|
|
|
Net-of-tax amount |
|
$ |
3,064 |
|
$ |
2,816 |
|
$ |
1,402 |
|
|
|
|
|
|
|
|
|
|
|
|
|
13. Regulatory Matters
The Corporation and its subsidiary bank are subject to various regulatory capital requirements administered by the federal banking agencies. Failure to meet minimum capital requirements can initiate certain mandatory, and possibly additional discretionary, actions by regulators that, if undertaken, could have a direct material effect on the Corporation’s financial statements. Under capital adequacy guidelines and the regulatory framework for prompt corrective action, the Corporation and its subsidiary bank must meet specific capital guidelines that involve quantitative measures of each entity’s assets, liabilities, and certain off-balance sheet items as calculated under regulatory accounting practices. The Corporation’s and its subsidiary bank’s capital amounts and classifications are also subject to qualitative judgments by the regulators about components, risk weightings and other factors.
Quantitative measures established by regulation to ensure capital adequacy require the Corporation and its subsidiary bank to maintain minimum amounts and ratios (set forth in the table below) of total and Tier 1 capital to risk-weighted assets, and of Tier 1 capital to average adjusted assets. As of December 31, 2010, the subsidiary bank was categorized as well-capitalized for all three ratios under the regulatory framework, while the Corporation was classified as well-capitalized for two ratios and adequately-capitalized for one ratio. As of December 31, 2009, the subsidiary bank and the Corporation were categorized as well-capitalized for all three ratios under the regulatory framework.
The most recent notifications, at December 31, 2010 and 2009, from the federal banking agencies categorized the subsidiary bank as well-capitalized under the regulatory framework for prompt corrective action. To be categorized as well-capitalized, the Corporation and the subsidiary bank must maintain total risk-based, Tier 1 risk-based and Tier 1 leverage ratios as set forth in the table that follows, at December 31, 2010.
26
The Corporation’s and the subsidiary bank’s actual capital amounts and ratios as of December 31, 2010 and 2009 are as follows:
|
|
|
|
|
|
|
|
|
|
|
|
|
|
|
|
|
|
|
|
|
|
|
|
Actual |
|
Minimum Capital |
|
Minimum |
|
||||||||||||
|
|
|
Amount |
|
Ratio |
|
Amount |
|
Ratio |
|
Amount |
|
Ratio |
|
||||||
|
|
|
|
|
|
|
|
|
|
|
|
|
|
|
||||||
|
As of December 31, 2010: |
|
|
|
|
|
|
|
|
|
|
|
|
|
|
|
|
|
|
|
|
|
|
|
|
|
|
|
|
|
|
|
|
|
|
|
|
|
|
|
|
|
Total Capital (to risk-weighted assets): |
|
|
|
|
|
|
|
|
|
|
|
|
|
|
|
|
|
|
|
|
Princeton National Bancorp, Inc. |
|
$ |
76,618 |
|
|
9.68 |
% |
$ |
63,339 |
|
|
8.00 |
% |
$ |
79,174 |
|
|
10.00 |
% |
|
Citizens First National Bank |
|
|
81,447 |
|
|
10.29 |
% |
|
63,326 |
|
|
8.00 |
% |
|
79,157 |
|
|
10.00 |
% |
|
|
|
|
|
|
|
|
|
|
|
|
|
|
|
|
|
|
|
|
|
|
Tier 1 Capital (to risk-weighted assets): |
|
|
|
|
|
|
|
|
|
|
|
|
|
|
|
|
|
|
|
|
Princeton National Bancorp, Inc. |
|
$ |
66,476 |
|
|
8.40 |
% |
$ |
31,669 |
|
|
4.00 |
% |
$ |
47,504 |
|
|
6.00 |
% |
|
Citizens First National Bank |
|
|
71,307 |
|
|
9.01 |
% |
|
31,663 |
|
|
4.00 |
% |
|
47,494 |
|
|
6.00 |
% |
|
|
|
|
|
|
|
|
|
|
|
|
|
|
|
|
|
|
|
|
|
|
Tier 1 Capital (to average adjusted assets): |
|
|
|
|
|
|
|
|
|
|
|
|
|
|
|
|
|
|
|
|
Princeton National Bancorp, Inc. |
|
$ |
66,476 |
|
|
5.76 |
% |
$ |
46,190 |
|
|
4.00 |
% |
$ |
57,738 |
|
|
5.00 |
% |
|
Citizens First National Bank |
|
|
71,307 |
|
|
6.18 |
% |
|
46,184 |
|
|
4.00 |
% |
|
57,730 |
|
|
5.00 |
% |
|
|
|
|
|
|
|
|
|
|
|
|
|
|
|
|
|
|
|
|
|
|
|
|
|
|
|
|
|
|
|
|
|
|
|
|
|
|
|
|
|
|
|
|
|
Actual |
|
Minimum Capital |
|
Minimum |
|
||||||||||||
|
|
|
Amount |
|
Ratio |
|
Amount |
|
Ratio |
|
Amount |
|
Ratio |
|
||||||
|
|
|
|
|
|
|
|
|
|
|
|
|
|
|
||||||
|
As of December 31, 2009: |
|
|
|
|
|
|
|
|
|
|
|
|
|
|
|
|
|
|
|
|
|
|
|
|
|
|
|
|
|
|
|
|
|
|
|
|
|
|
|
|
|
Total Capital (to risk-weighted assets): |
|
|
|
|
|
|
|
|
|
|
|
|
|
|
|
|
|
|
|
|
Princeton National Bancorp, Inc. |
|
$ |
104,541 |
|
|
11.50 |
% |
$ |
72,729 |
|
|
8.00 |
% |
$ |
90,911 |
|
|
10.00 |
% |
|
Citizens First National Bank |
|
|
102,305 |
|
|
11.25 |
% |
|
72,724 |
|
|
8.00 |
% |
|
90,905 |
|
|
10.00 |
% |
|
|
|
|
|
|
|
|
|
|
|
|
|
|
|
|
|
|
|
|
|
|
Tier 1 Capital (to risk-weighted assets): |
|
|
|
|
|
|
|
|
|
|
|
|
|
|
|
|
|
|
|
|
Princeton National Bancorp, Inc. |
|
$ |
93,168 |
|
|
10.25 |
% |
$ |
36,364 |
|
|
4.00 |
% |
$ |
54,547 |
|
|
6.00 |
% |
|
Citizens First National Bank |
|
|
90,933 |
|
|
10.00 |
% |
|
36,362 |
|
|
4.00 |
% |
|
54,543 |
|
|
6.00 |
% |
|
|
|
|
|
|
|
|
|
|
|
|
|
|
|
|
|
|
|
|
|
|
Tier 1 Capital (to average adjusted assets): |
|
|
|
|
|
|
|
|
|
|
|
|
|
|
|
|
|
|
|
|
Princeton National Bancorp, Inc. |
|
$ |
93,168 |
|
|
7.48 |
% |
$ |
49,823 |
|
|
4.00 |
% |
$ |
62,278 |
|
|
5.00 |
% |
|
Citizens First National Bank |
|
|
90,933 |
|
|
7.30 |
% |
|
49,813 |
|
|
4.00 |
% |
|
62,266 |
|
|
5.00 |
% |
|
|
|
|
|
|
|
|
|
|
|
|
|
|
|
|
|
|
|
|
|
On March 15, 2010, the Bank entered into a written agreement (the “Agreement”) with the OCC. The Agreement sets forth the Bank’s commitment to: (i) review and take action as necessary regarding its allowance for loan and lease losses; (ii) improve the Bank’s asset quality through the development of workout plans for criticized assets and the assessment of credit risk; and (iii) revise the Bank’s credit risk rating management information system. The Bank has taken steps to address the issues raised in the Agreement and intends to fully comply with the requirements set forth in the Agreement.
On February 28, 2011, as required by the Corporation’s primary regulator, the Federal Reserve Bank, a resolution of the Corporation’s Board of Directors was passed requiring that the Corporation obtain written approval from the Federal Reserve Bank prior to any of the following: the declaration or payment of dividends; any increase in debt; any distribution of interest, principal, or other sum associated with subordinated debentures or trust preferred securities; and the redemption of Corporation stock.
14. Employee, Officer and Director Benefit Plans
The subsidiary bank has a defined contribution investment 401(k) plan. Under this plan employees could elect to contribute, on a tax-deferred basis, up to a maximum of $17 ($23 for those employees eligible to make catch-up contributions). In addition, the subsidiary bank will match employees’ contributions up to three percent of each employee’s salary and match 50% of the next two percent contributed. The subsidiary bank’s contribution to the defined contribution investment 401(k) plan for 2010, 2009 and 2008 was $442, $438 and $404, respectively.
The subsidiary bank has an employee stock purchase program in which employees contribute through payroll deductions. These amounts are pooled and used to purchase shares of the Corporation’s common stock on a quarterly basis at the opening bid price on the last business day of the quarter.
The subsidiary bank also has a profit sharing plan. Annual contributions to the subsidiary bank’s plan are based on a formula. The total contribution is at the discretion of the Board of Directors. The cost of the profit sharing plan charged to operating expense was $0 in 2010, $142 in 2009 and $409 in 2008.
Stock Based Compensation Plan
Additionally, the Corporation has non-qualified stock option plans (“the plans”) for the benefit of employees and directors of the subsidiary bank, as well as directors of the Corporation. The plans permit the grant of share options and shares for up to 802,500 shares of common stock. The Corporation believes that such awards better align the interests of its employees with those of its stockholders. Option awards are granted with an exercise price equal to the market price of the Corporation’s stock at the date of grant. The option awards generally vest based on three years of continuous service and have ten-year contractual terms.
27
Notes to Consolidated Financial Statements (Continued)
(dollar amounts in thousands except share data)
The fair value of each option award is estimated on the date of grant using a Black-Scholes closed-form model that uses the assumptions noted in the following table. Expected volatility is based on historical volatility of the Corporation’s stock and other factors. The Corporation uses historical data to estimate option exercise and employee termination within the valuation model. The expected term of the options granted is derived from the Corporation’s historical option exercise experience and represents the period of time that options granted are expected to be outstanding. The risk-free rate for periods within the contractual life of the option is based on the U.S. Treasury yield curve in effect at the time of the grant. The following assumptions were used in estimating the fair value for options granted in 2010, 2009 and 2008:
|
|
|
|
|
|
|
|
|
|
|
|
|
|
|
2010 |
|
2009 |
|
2008 |
|
|||
|
Expected volatility |
|
|
.360 |
|
|
.380 |
|
|
.180 |
|
|
Expected dividends |
|
|
5.75 |
% |
|
3.56 |
% |
|
4.96 |
% |
|
Expected term (in years) |
|
|
7 yrs. |
|
|
3 yrs. |
|
|
3 yrs. |
|
|
Risk-free rate |
|
|
2.71 |
% |
|
1.70 |
% |
|
1.00 |
% |
A summary of option activity under the Plan as of December 31, 2010, 2009 and 2008, and changes during the years then ended, is presented as follows:
|
|
|
|
|
|
|
|
|
|
|
|
|
|
|
|
|
|
2010 |
|
|
|
|
|
||||||
|
|
|
Shares |
|
Weighted |
|
Weighted |
|
Aggregate |
|
||||
|
|
|
|
|
|
|
|
|
|
|
||||
|
Outstanding, beginning of year |
|
|
523,211 |
|
$ |
25.53 |
|
|
|
|
|
|
|
|
Granted |
|
|
51,700 |
|
|
3.64 |
|
|
|
|
|
|
|
|
Exercised |
|
|
-0- |
|
|
n/a |
|
|
|
|
|
|
|
|
Forfeited or expired |
|
|
(19,634 |
) |
|
n/a |
|
|
|
|
|
|
|
|
|
|
|
|
|
|
|
|
|
|
|
|
|
|
|
Outstanding, end of year |
|
|
555,277 |
|
|
23.60 |
|
|
6.31 yrs. |
|
$ |
-0- |
|
|
|
|
|
|
|
|
|
|
|
|
|
|
|
|
|
Options exercisable end of year |
|
|
435,469 |
|
$ |
27.22 |
|
|
5.51 yrs. |
|
$ |
-0- |
|
|
|
|
|
|
|
|
|
|
|
|
|
|
|
|
The intrinsic value of the outstanding shares and the options exercisable noted above excludes 555,277 shares and 415,319 shares, respectively, which were anti-dilutive for 2010.
|
|
|
|
|
|
|
|
|
|
|
|
|
|
|
|
|
|
2009 |
|
|
|
|
|
||||||
|
|
|
Shares |
|
Weighted |
|
Weighted |
|
Aggregate |
|
||||
|
|
|
|
|
|
|
|
|
|
|
||||
|
Outstanding, beginning of year |
|
|
460,061 |
|
$ |
27.53 |
|
|
|
|
|
|
|
|
Granted |
|
|
63,150 |
|
|
10.91 |
|
|
|
|
|
|
|
|
Exercised |
|
|
-0- |
|
|
n/a |
|
|
|
|
|
|
|
|
Forfeited or expired |
|
|
-0- |
|
|
n/a |
|
|
|
|
|
|
|
|
|
|
|
|
|
|
|
|
|
|
|
|
|
|
|
Outstanding, end of year |
|
|
523,211 |
|
|
25.53 |
|
|
6.89 yrs. |
|
$ |
-0- |
|
|
|
|
|
|
|
|
|
|
|
|
|
|
|
|
|
Options exercisable end of year |
|
|
375,994 |
|
$ |
28.48 |
|
|
5.96 yrs. |
|
$ |
-0- |
|
|
|
|
|
|
|
|
|
|
|
|
|
|
|
|
The intrinsic value of the outstanding shares and the options exercisable noted above excludes 523,211 shares and 375,944 shares, respectively, which were anti-dilutive for 2009.
|
|
|
|
|
|
|
|
|
|
|
|
|
|
|
|
|
|
2008 |
|
|
|
|
|
||||||
|
|
|
Shares |
|
Weighted |
|
Weighted |
|
Aggregate |
|
||||
|
|
|
|
|
|
|
|
|
|
|
||||
|
Outstanding, beginning of year |
|
|
404,186 |
|
$ |
28.57 |
|
|
|
|
|
|
|
|
Granted |
|
|
86,125 |
|
|
22.57 |
|
|
|
|
|
|
|
|
Exercised |
|
|
(4,700 |
) |
|
17.61 |
|
|
|
|
|
|
|
|
Forfeited or expired |
|
|
(25,550 |
) |
|
29.37 |
|
|
|
|
|
|
|
|
|
|
|
|
|
|
|
|
|
|
|
|
|
|
|
Outstanding, end of year |
|
|
460,061 |
|
|
27.53 |
|
|
7.46 yrs. |
|
$ |
172 |
|
|
|
|
|
|
|
|
|
|
|
|
|
|
|
|
|
Options exercisable end of year |
|
|
295,042 |
|
$ |
29.03 |
|
|
6.40 yrs. |
|
$ |
49 |
|
|
|
|
|
|
|
|
|
|
|
|
|
|
|
|
28
The intrinsic value of the outstanding shares and the options exercisable noted above excludes 261,566 shares and 235,972 shares, respectively, which were anti-dilutive for 2008.
The weighted-average grant date fair value of options granted during the years 2010, 2009 and 2008 was $35, $133 and $21, respectively. The total intrinsic value of options exercised during the years ended December 31, 2010, 2009 and 2008 was $0, $0 and $21, respectively.
A summary of the status of the Corporation’s non-vested shares and changes during the year ended December 31, 2010, 2009 and 2008 is presented below:
|
|
|
|
|
|
|
|
|
|
|
|
2010 |
|
||||
|
|
|
Shares |
|
Weighted |
|
||
|
|
|
|
|
|
|
||
|
Non-vested, beginning of year |
|
|
147,217 |
|
$ |
0.97 |
|
|
Granted |
|
|
51,700 |
|
|
0.68 |
|
|
Vested |
|
|
(72,309 |
) |
|
1.13 |
|
|
Forfeited |
|
|
(6,800 |
) |
|
1.34 |
|
|
|
|
|
|
|
|
|
|
|
Non-vested, end of year |
|
|
119,808 |
|
$ |
0.90 |
|
|
|
|
|
|
|
|
|
|
|
|
|
|
|
|
|
|
|
|
|
|
2009 |
|
||||
|
|
|
Shares |
|
Weighted |
|
||
|
|
|
|
|
|
|
||
|
Non-vested, beginning of year |
|
|
165,019 |
|
$ |
0.59 |
|
|
Granted |
|
|
63,150 |
|
|
2.11 |
|
|
Vested |
|
|
(80,952 |
) |
|
1.09 |
|
|
Forfeited |
|
|
-0- |
|
|
n/a |
|
|
|
|
|
|
|
|
|
|
|
Non-vested, end of year |
|
|
147,217 |
|
$ |
0.97 |
|
|
|
|
|
|
|
|
|
|
|
|
|
|
|
|
|
|
|
|
|
|
2008 |
|
||||
|
|
|
Shares |
|
Weighted |
|
||
|
|
|
|
|
|
|
||
|
Non-vested, beginning of year |
|
|
141,939 |
|
$ |
1.43 |
|
|
Granted |
|
|
86,125 |
|
|
0.36 |
|
|
Vested |
|
|
(37,495 |
) |
|
1.43 |
|
|
Forfeited |
|
|
(25,550 |
) |
|
1.43 |
|
|
|
|
|
|
|
|
|
|
|
Non-vested, end of year |
|
|
165,019 |
|
$ |
0.59 |
|
|
|
|
|
|
|
|
|
|
As of December 31, 2010, there was $137 of total unrecognized compensation cost related to nonvested share-based compensation arrangements granted under the plan. That cost is expected to be recognized over a weighted-average period of 3 years. The total fair value of shares vested during the years ended December 31, 2010, 2009, and 2008, was $82, $88 and $54, respectively.
During 2010, 8,500 shares were granted under the plans in the form of nonvested shares at no cost to the officers. The nonvested shares vest annually over a five year restriction period, and the participant is not entitled to receive distribution on the nonvested shares during the five year period.
The fair value of nonvested shares is determined based on the market value of the Corporation’s shares on the grant date. The weighted average grant date fair value of awards granted during 2010 was $5.05.
A summary of the nonvested share activity during 2010 is presented below. There were no nonvested share awards granted in 2009.
|
|
|
|
|
|
|
|
|
|
|
|
Nonvested |
|
Weighted |
|
||
|
|
|
|
|
|
|
||
|
Nonvested, beginning of year |
|
|
-0- |
|
$ |
-0- |
|
|
Granted |
|
|
8,500 |
|
|
5.05 |
|
|
Vested |
|
|
-0- |
|
|
-0- |
|
|
Forfeited |
|
|
-0- |
|
|
-0- |
|
|
|
|
|
|
|
|
|
|
|
Nonvested, end of year |
|
|
8,500 |
|
$ |
5.05 |
|
|
|
|
|
|
|
|
|
|
At December 31, 2010, there was approximately $43 of total unrecognized compensation expense related to nonvested shares. The amount to be recognized as compensation expense during the next four fiscal years is approximately $11 per year. The total fair value of nonvested share awards vesting during 2010 is $0 as the shares first vest in January, 2015.
29
Notes to Consolidated Financial Statements (Continued)
(dollar amounts in thousands except share data)
15. Pension and Other Post-Retirement Benefits
Employee Health Benefit Plan
The Corporation does not have a defined benefit pension plan. The Corporation does have a defined contribution investment plan which is discussed in Note 14 - “Employee, Officer, and Director Benefit Plans.” The Corporation offers certain retirees the opportunity to continue benefits in the subsidiary bank’s Employee Health Benefit Plan. The Corporation’s level of contribution is based upon age, service formula, date of employment and retirement date. Employees hired prior to October 1, 1994 who retired prior to July 1, 2008 were eligible to receive benefits under the Bank’s Health Benefit Plan for life. All employees hired on or before October 1, 1994 previously were allowed coverage for life. The plan was amended on December 31, 2007 to require employees hired on or before October 1, 1994 who retire after July 1, 2008 to convert to a Medicare Supplement Plan at age 65. Coverage stops at age 65 for employees hired after October 1, 1994. The Corporation uses a December 31 measurement date for its plan. Information about the plan’s funded status follows:
|
|
|
|
|
|
|
|
|
|
|
|
2010 |
|
2009 |
|
||
|
Change in benefit obligation |
|
|
|
|
|
|
|
|
Beginning of year |
|
$ |
1,115 |
|
$ |
1,100 |
|
|
Service cost |
|
|
23 |
|
|
23 |
|
|
Interest cost |
|
|
59 |
|
|
58 |
|
|
Amortization of transition obligation |
|
|
-0- |
|
|
(16 |
) |
|
Amortization of prior service cost |
|
|
(62 |
) |
|
(62 |
) |
|
Actuarial loss |
|
|
53 |
|
|
56 |
|
|
Benefits paid |
|
|
(51 |
) |
|
(44 |
) |
|
|
|
|
|
|
|
|
|
|
Funded status at end of year |
|
$ |
1,137 |
|
$ |
1,115 |
|
|
|
|
|
|
|
|
|
|
The components of the 2010, 2009, and 2008 net periodic post-retirement benefit cost are shown below:
|
|
|
|
|
|
|
|
|
|
|
|
|
|
|
2010 |
|
2009 |
|
2008 |
|
|||
|
Service cost |
|
$ |
23 |
|
$ |
23 |
|
$ |
20 |
|
|
Interest cost |
|
|
59 |
|
|
58 |
|
|
66 |
|
|
Amortization of transition obligation |
|
|
-0- |
|
|
-0- |
|
|
-0- |
|
|
Amortization of prior service cost |
|
|
(62 |
) |
|
(62 |
) |
|
(62 |
) |
|
Amortization of net loss |
|
|
53 |
|
|
56 |
|
|
69 |
|
|
|
|
|
|
|
|
|
|
|
|
|
|
Net periodic post-retirement benefit cost |
|
$ |
73 |
|
$ |
75 |
|
$ |
93 |
|
|
|
|
|
|
|
|
|
|
|
|
|
Other changes in benefit obligations recognized in other comprehensive loss:
|
|
|
|
|
|
|
|
|
|
|
|
2010 |
|
2009 |
|
||
|
Net loss |
|
$ |
(62 |
) |
$ |
(88 |
) |
|
Prior service cost recognized |
|
|
62 |
|
|
62 |
|
|
|
|
|
|
|
|
|
|
|
Total recognized in other comprehensive loss |
|
|
-0- |
|
|
(26 |
) |
|
|
|
|
|
|
|
|
|
|
Total recognized in net periodic benefit cost and other comprehensive loss |
|
$ |
(73 |
) |
$ |
(101 |
) |
|
|
|
|
|
|
|
|
|
The estimated net loss, prior service cost and transition obligation for the defined benefit plan that will be amortized from accumulated other comprehensive income (loss) into net periodic benefit cost over the next fiscal year is a net loss of $5.
Amounts recognized in the Consolidated Balance Sheets:
|
|
|
|
|
|
|
|
|
|
|
|
|
2010 |
|
|
2009 |
|
|
Liabilities |
|
$ |
1,137 |
|
$ |
1,115 |
|
Amounts recognized in accumulated other comprehensive income (loss) and not yet recognized as components of net periodic benefit cost consist of:
|
|
|
|
|
|
|
|
|
|
|
|
2010 |
|
2009 |
|
||
|
Net loss |
|
$ |
(62 |
) |
|
(88 |
) |
|
Prior service cost recognized |
|
|
62 |
|
|
62 |
|
|
|
|
|
|
|
|
|
|
|
Total |
|
$ |
-0- |
|
$ |
(26 |
) |
|
|
|
|
|
|
|
|
|
The accumulated benefit obligation for all defined benefit plans was $1,137 and $1,115 at December 31, 2010 and 2009, respectively.
30
Significant assumptions include:
|
|
|
|
|
|
|
|
|
|
|
|
2010 |
|
2009 |
|
||
|
|
|
|
|
|
|
||
|
Weighted average assumptions used to determine benefit obligation: |
|
|
|
|
|
|
|
|
Discount rate |
|
|
5.25 |
% |
|
5.75 |
% |
|
Rate of compensation increase |
|
|
n/a |
|
|
n/a |
|
|
|
|
|
|
|
|
|
|
|
Weighted average assumptions used to determine benefit cost: |
|
|
|
|
|
|
|
|
Discount rate |
|
|
5.25 |
% |
|
5.75 |
% |
|
Expected return on plan assets |
|
|
n/a |
|
|
n/a |
|
|
Rate of compensation increase |
|
|
n/a |
|
|
n/a |
|
For measurement purposes, a 7.0% annual rate of increase in the per capita cost of covered health care benefits was assumed for 2010 and 2009, respectively. The rate was assumed to decrease gradually to 5.00% by the year 2015 and remain at that level thereafter.
Assumed health care cost trend rates have a significant effect on the amounts reported for the health care plans. A one-percentage point change in assumed health care cost trend rates would have the following effects:
|
|
|
|
|
|
|
|
|
|
|
|
|
|
|
|
1-Percentage- |
|
1-Percentage- |
|
||||||
|
Effect on total of service and interest cost components |
|
|
$ |
8 |
|
|
|
$ |
(7 |
) |
|
|
Effect on post-retirement benefit obligation |
|
|
|
75 |
|
|
|
|
(68 |
) |
|
The following benefit payments, which reflect expected future service, as appropriate, are expected to be paid as of December 31, 2010:
|
|
|
|
|
|
|
|
|
|
|
Post Retirement |
|
|||
|
|
|
|
|
|||
|
2011 |
|
|
$ |
67 |
|
|
|
2012 |
|
|
|
49 |
|
|
|
2013 |
|
|
|
76 |
|
|
|
2014 |
|
|
|
90 |
|
|
|
2015 |
|
|
|
108 |
|
|
|
2016-2020 |
|
|
|
546 |
|
|
Split Dollar Life Insurance
ASC Topic 715 requires the Corporation to recognize a liability and compensation expense for endorsement split-dollar life insurance arrangements that provide a benefit to an employee that extends to post retirement periods. The benefit to the employees is the payment of the premiums by the Corporation. The Corporation adopted ASC Topic 715 as of January 1, 2008, through a cumulative effect adjustment as a liability and a decrease to retained earnings of $580. Beginning January 1, 2008, an expense was recorded as the remaining benefit is earned with a corresponding addition to the post retirement benefit obligation. The amount of the expense for 2010, 2009 and 2008 was $61, $58 and $36, respectively. For the period from retirement to the estimated date of death for the participants, this liability is reversed into income.
16. Fair Value of Financial Instruments
ASC 820, Fair Value Measurements, defines the fair value as the price that would be received to sell an asset or paid to transfer a liability in an orderly transaction between market participants at the measurement date. ASC 820 also establishes a fair value hierarchy which requires an entity to maximize the use of observable inputs and minimize the use of unobservable inputs when measuring fair value.
In accordance with ASC 820, the Corporation groups its financial assets and financial liabilities measured at fair value in three levels, based on the markets in which the assets and liabilities are traded and the reliability of the assumptions used to determine fair value. These levels are:
|
|
|
|
|
|
Level 1 |
Valuations for assets and liabilities traded in active exchange markets, such as the New York Stock Exchange. Valuations are obtained from readily available pricing sources for market transactions involving identical assets or liabilities. |
|
|
|
|
|
|
Level 2 |
Valuations for assets and liabilities traded in less active dealer or broker markets. Valuations are obtained from third party pricing services for identical or comparable assets or liabilities which use observable inputs other than Level 1 prices, such as quoted prices for similar assets or liabilities; quoted prices in markets that are not active; or other inputs that are observable or can be corroborated by observable market data for substantially the full term of the assets and liabilities. |
|
|
|
|
|
|
Level 3 |
Unobservable inputs that are supported by little or no market activity and that are significant to the fair value of the assets or liabilities. |
Following is a description of the valuation methodologies and inputs used for instruments measured at fair value on a recurring basis and recognized in the accompanying Consolidated Balance Sheets.
Available-for-Sale Securities - The fair values of available-for-sale securities are determined by various valuation methodologies. Where quoted market prices are available in an active market, securities are classified within Level 1. The Corporation has no securities classified within Level 1. If quoted market prices are not available, then fair values are estimated by using pricing models or quoted prices of securities with similar characteristics. Level 2 securities include U.S. Treasury securities, obligations of U.S. Government and federal agency and U.S. Government sponsored enterprises (GSEs), obligations of states and political subdivisions, mortgage-backed securities and GSE residential collateralized mortgage obligations. In certain cases where Level 1 or Level 2 inputs are not available, securities are classified within Level 3 of the hierarchy. The Corporation has no securities classified within Level 3.
31
Notes to Consolidated Financial Statements (Continued)
(dollar amounts in thousands except share data)
The following table presents the Corporation’s assets that are measured at fair value on a recurring basis and the level within the ASC 820 hierarchy in which the fair value measurements fall as of December 31, 2010 and 2009:
|
|
|
|
|
|
|
|
|
|
|
|
|
|
|
|
|
|
|
|
|
|
|
|
|
|
|
|
Fair Value Measurements Using |
|
|
|
||||||||||||||
|
|
|
|
|
|
|
|
|
||||||||||||||
|
December 31, 2010 |
|
Fair Value |
|
Quoted Prices in |
|
Significant Other |
|
Significant |
|
||||||||||||
|
|
|
|
|
|
|
|
|
|
|
||||||||||||
|
Available-for-sale: |
|
|
|
|
|
|
|
|
|
|
|
|
|
||||||||
|
United States Government and Federal agency and U.S. Government sponsored enterprises (GSEs) |
|
|
$ |
78,204 |
|
|
|
$ |
-0- |
|
|
|
$ |
78,204 |
|
|
|
$ |
-0- |
|
|
|
State and Municipal |
|
|
|
115,654 |
|
|
|
|
-0- |
|
|
|
|
115,654 |
|
|
|
|
-0- |
|
|
|
Collateralized mortgage obligations: |
|
|
|
|
|
|
|
|
|
|
|
|
|
|
|
|
|
|
|
|
|
|
GSE Residential |
|
|
|
54,894 |
|
|
|
|
-0- |
|
|
|
|
54,894 |
|
|
|
|
-0- |
|
|
|
|
|
|
|
|
|
|
|
|
|
|
|
|
|
|
|
|
|
|
|
|
|
|
Total |
|
|
$ |
248,752 |
|
|
|
$ |
-0- |
|
|
|
$ |
248,752 |
|
|
|
$ |
-0- |
|
|
|
|
|
|
|
|
|
|
|
|
|
|
|
|
|
|
|
|
|
|
|
|
|
|
|
|
|
|
|
|
|
|
|
|
|
|
|
|
|
|
|
|
|
|
|
|
|
|
|
|
|
Fair Value Measurements Using |
|
|
|
||||||||||||||
|
|
|
|
|
|
|
|
|
||||||||||||||
|
December 31, 2009 |
|
Fair Value |
|
Quoted Prices in |
|
Significant Other |
|
Significant |
|
||||||||||||
|
|
|
|
|
|
|
|
|
|
|
||||||||||||
|
Available-for-sale: |
|
|
|
|
|
|
|
|
|
|
|
|
|
||||||||
|
United States Government and |
|
|
$ |
96,313 |
|
|
|
$ |
-0- |
|
|
|
$ |
96,313 |
|
|
|
$ |
-0- |
|
|
|
State and Municipal |
|
|
|
120,078 |
|
|
|
|
-0- |
|
|
|
|
120,078 |
|
|
|
|
-0- |
|
|
|
Collateralized mortgage obligations: |
|
|
|
|
|
|
|
|
|
|
|
|
|
|
|
|
|
|
|
|
|
|
GSE Residential |
|
|
|
72,083 |
|
|
|
|
-0- |
|
|
|
|
72,083 |
|
|
|
|
-0- |
|
|
|
|
|
|
|
|
|
|
|
|
|
|
|
|
|
|
|
|
|
|
|
|
|
|
Total |
|
|
$ |
288,474 |
|
|
|
$ |
-0- |
|
|
|
$ |
288,474 |
|
|
|
$ |
-0- |
|
|
|
|
|
|
|
|
|
|
|
|
|
|
|
|
|
|
|
|
|
|
|
|
|
Following is a description of the valuation methodologies used for assets measured at fair value on a non-recurring basis and recognized in the accompanying Consolidated Balance Sheets, as well as the general classification of such assets pursuant to the valuation hierarchy.
Impaired Loans (Collateral Dependent) - Loans for which it is probable that the Corporation will not collect all principal and interest due according to contractual terms are measured for impairment. Allowable methods for determining the amount of impairment include estimating the fair value of the collateral for collateral dependent loans.
If the
impaired loan is identified as collateral dependent, then the fair value method
of measuring the amount of impairment is utilized. This method requires
obtaining a current independent appraisal of the collateral and applying a
discount factor to the value.
Impaired loans that are collateral dependent are
classified within Level 3 of the fair value hierarchy when impairment is
determined using the fair value method.
Mortgage Servicing Rights - The fair value used to determine the valuation allowance is estimated using discounted cash flow models. The valuation models incorporate assumptions that market participants would use in estimating future net servicing income, such as the cost to service, the discount rate, the custodial earnings rate, an inflation rate, ancillary income, prepayment speeds and default rates and losses. These variables change from quarter to quarter as market conditions and projected interest rates change, and may have an adverse impact on the value of the mortgage servicing rights and may result in a reduction to noninterest income. Due to the nature of the valuation inputs, mortgage servicing rights are classified within Level 3 of the hierarchy.
Other Real Estate Owned - Other real estate owned acquired through loan foreclosure is initially recorded at fair value less costs to sell when acquired, establishing a new cost basis. The adjustment at the time of foreclosure is recorded through the allowance for loan losses. Due to the subjective nature of establishing the fair value when the asset is acquired, the actual fair value of the other real estate owned or foreclosed asset could differ from the original estimate and are classified within Level 3 of the fair value hierarchy. If it is determined the fair value declines subsequent to foreclosure, a valuation allowance is recorded through non-interest expense. Operating costs associated with the assets after acquisition are also recorded as non-interest expense. Gains and losses on the disposition of other real estate owned and foreclosed assets are netted and posted to other non-interest expense.
The following table presents the fair value measurement of assets and liabilities measured at fair value on a nonrecurring basis and the level within the ASC 820 fair value hierarchy in which the fair value measurements fall at December 31, 2010 and 2009:
|
|
|
|
|
|
|
|
|
|
|
|
|
|
|
|
|
|
|
|
|
|
|
|
Fair Value Measurements Using |
|
|
|
||||||||||
|
|
|
|
|
|
|
|
|
||||||||||
|
December 31, 2010 |
|
Fair Value |
|
Quoted Prices in |
|
Significant Other |
|
Significant |
|
||||||||
|
|
|
|
|
|
|
|
|
|
|
||||||||
|
Impaired loans (collateral dependent) |
|
|
$ |
30,756 |
|
|
|
-0- |
|
|
-0- |
|
|
$ |
30,756 |
|
|
|
Mortgage servicing rights |
|
|
|
3,385 |
|
|
|
-0- |
|
|
-0- |
|
|
|
3,385 |
|
|
|
Other real estate owned |
|
|
|
2,899 |
|
|
|
-0- |
|
|
-0- |
|
|
|
2,899 |
|
|
32
|
|
|
|
|
|
|
|
|
|
|
|
|
|
|
|
|
|
|
|
|
|
|
|
Fair Value Measurements Using |
|
|
|
||||||||||
|
|
|
|
|
|
|
|
|
||||||||||
|
December 31, 2009 |
|
Fair Value |
|
Quoted Prices in |
|
Significant Other |
|
Significant |
|
||||||||
|
|
|
|
|
|
|
|
|
|
|
||||||||
|
Impaired loans (collateral dependent) |
|
|
$ |
14,716 |
|
|
|
-0- |
|
|
-0- |
|
|
$ |
14,716 |
|
|
|
Mortgage servicing rights |
|
|
|
3,285 |
|
|
|
-0- |
|
|
-0- |
|
|
|
3,285 |
|
|
|
Other real estate owned |
|
|
|
17,658 |
|
|
|
-0- |
|
|
-0- |
|
|
|
17,658 |
|
|
ASC 825, “Disclosures about Fair Value of Financial Instruments,” requires all entities to disclose the estimated fair value of their financial instrument assets and liabilities. For the Corporation, as for most financial institutions, the majority of its assets and liabilities are considered financial instruments as defined in ASC 825. Many of the Corporation’s financial instruments, however, lack an available trading market as characterized by a willing buyer and willing seller engaging in an exchange transaction. It is also the Corporation’s general practice and intent to hold its financial instruments to maturity and to not engage in trading or sales activities except for loans held-for-sale and available-for-sale securities. Therefore, significant estimations and assumptions, as well as present value calculations, were used by the Corporation for the purposes of this disclosure.
Estimated fair values have been determined by the Corporation using the best available data and an estimation methodology suitable for each category of financial instruments. For those loans and deposits with floating interest rates, it is presumed that estimated fair values generally approximate the recorded book balances. The estimation methodologies used, the estimated fair values and the recorded book balances at December 31, 2010 and 2009, were as follows:
|
|
|
|
|
|
|
|
|
|
|
|
|
|
|
|
|
|
December 31, 2010 |
|
December 31, 2009 |
|
||||||||
|
|
|
|
|
|
|
||||||||
|
|
|
Carrying |
|
Fair |
|
Carrying |
|
Fair |
|
||||
|
|
|
|
|
|
|
|
|
|
|
||||
|
|
|
|
|
|
|
|
|
|
|
|
|
|
|
|
Financial Assets: |
|
|
|
|
|
|
|
|
|
|
|
|
|
|
Cash and due from banks |
|
$ |
12,992 |
|
$ |
12,992 |
|
$ |
15,546 |
|
$ |
15,546 |
|
|
Interest-bearing deposits in financial institutions |
|
|
30,888 |
|
|
30,888 |
|
|
55,527 |
|
|
55,527 |
|
|
Investment securities |
|
|
260,939 |
|
|
261,224 |
|
|
301,267 |
|
|
301,805 |
|
|
Loans, net, including loans held-for-sale |
|
|
679,863 |
|
|
684,438 |
|
|
789,295 |
|
|
793,674 |
|
|
Accrued interest receivable |
|
|
7,482 |
|
|
7,482 |
|
|
9,267 |
|
|
9,267 |
|
|
|
|
|
|
|
|
|
|
|
|
|
|
|
|
|
Total Financial Assets |
|
$ |
992,164 |
|
$ |
997,024 |
|
$ |
1,170,902 |
|
$ |
1,175,819 |
|
|
|
|
|
|
|
|
|
|
|
|
|
|
|
|
|
|
|
|
|
|
|
|
|
|
|
|
|
|
|
|
Financial Liabilities: |
|
|
|
|
|
|
|
|
|
|
|
|
|
|
Non-interest-bearing demand deposits |
|
$ |
138,683 |
|
$ |
138,683 |
|
$ |
136,026 |
|
$ |
136,026 |
|
|
Interest-bearing deposits |
|
|
824,278 |
|
|
827,266 |
|
|
939,513 |
|
|
945,637 |
|
|
Borrowings |
|
|
71,559 |
|
|
71,615 |
|
|
104,848 |
|
|
119,301 |
|
|
Accrued interest payable |
|
|
1,315 |
|
|
1,315 |
|
|
2,999 |
|
|
2,999 |
|
|
|
|
|
|
|
|
|
|
|
|
|
|
|
|
|
Total Financial Liabilities |
|
$ |
1,035,835 |
|
$ |
1,038,879 |
|
$ |
1,183,386 |
|
$ |
1,203,963 |
|
|
Unrecognized financial instruments (net of contract amount) |
|
|
|
|
|
|
|
|
|
|
|
|
|
|
Commitments to originate loans |
|
|
-0- |
|
|
-0- |
|
|
-0- |
|
|
-0- |
|
|
Lines of credit |
|
|
-0- |
|
|
-0- |
|
|
-0- |
|
|
-0- |
|
|
|
|
|
|
|
|
|
|
|
|
|
|
|
|
Financial instruments actively traded in a secondary market have been valued using quoted available market prices. Cash and due from banks, interest-bearing time deposits in other banks, federal funds sold, loans held-for-sale and interest receivable are valued at book value, which approximates fair value.
Financial liability instruments with stated maturities have been valued using a present value discounted cash flow analysis with a discount rate approximating current market for similar liabilities. Interest payable is valued at book value, which approximates fair value.
Financial liability instruments with no stated maturities have an estimated fair value equal to both the amount payable on demand and the recorded book balance.
The net loan portfolio has been valued using a present value discounted cash flow. The discount rate used in these calculations is the current rate at which similar loans would be made to borrowers with similar credit ratings, same remaining maturities and assumed prepayment risk.
The fair value of commitments to originate loans is estimated using the fees currently charged to enter into similar agreements, taking into account the remaining terms of the agreements and the present creditworthiness of the counterparties. For fixed-rate loan commitments, fair value also considers the difference between current levels of interest rates and the committed rates. The fair values of letters of credit and lines of credit are based on fees currently charged for similar agreements or on the estimated cost to terminate or otherwise settle the obligations with the counterparties at the reporting date.
Changes in assumptions or estimation methodologies may have a material effect on these estimated fair values.
The Corporation’s remaining assets and liabilities, which are not considered financial instruments, have not been valued differently than has been customary with historical cost accounting. No disclosure of the relationship value of the Corporation’s core deposit base is required by ASC 825.
Fair value estimates are based on existing balance sheet financial instruments, without attempting to estimate the value of anticipated future business and the value of assets and liabilities that are not considered financial instruments. For example, the subsidiary bank has a fiduciary services department that contributes net fee income annually. The fiduciary services department is not considered a financial instrument, and its value has not been incorporated into the fair value estimates. Other significant assets and liabilities that are not considered financial assets or liabilities include the mortgage banking operation, brokerage network, deferred taxes, premises and equipment and goodwill. In addition, the tax ramifications related to the realization of the unrealized gains and losses can have a significant effect on fair value estimates and have not been considered in the estimates.
33
Notes to Consolidated Financial Statements (Continued)
(dollar amounts in thousands except share data)
Management believes that reasonable comparability between financial institutions may not be likely, due to the wide range of permitted valuation techniques and numerous estimates which must be made, given the absence of active secondary markets for many of the financial instruments. This lack of uniform valuation methodologies also introduces a greater degree of subjectivity to these estimated fair values.
17. Undistributed Earnings of Subsidiary Bank
National banking regulations and capital guidelines limit the amount of dividends that may be paid by banks. At December 31, 2010, the subsidiary bank had $0 available for dividends. Additionally, according to the guidelines, at January 1, 2011, the subsidiary bank had $0 available for dividends. Future dividend payments by the subsidiary bank will be dependent upon individual regulatory capital requirements and levels of profitability. Since the Corporation is a legal entity, separate and distinct from the bank, the dividends of the Corporation are not subject to such bank regulatory guidelines.
18. Commitments, Contingencies and Credit Risk
The Corporation generates agribusiness, commercial, mortgage and consumer loans to customers located primarily in North Central Illinois. The Corporation’s loans are generally secured by specific items of collateral including real property, consumer assets and business assets. Although the Corporation has a diversified loan portfolio, a substantial portion of its debtors’ ability to honor their contracts is dependent upon economic conditions in the agricultural industry.
Foreclosed
assets held for sale include commercial real estate development, residential
real estate and commercial properties. Of the $20,652 held in foreclosed assets
as of December 31, 2010, $12,859 was commercial real estate development; $5,288
was residential real estate; and $2,505 was commercial. The carrying value
reflects management’s best estimate of the amount to be realized from the sale
of the property. The amount that the Corporation realizes from the sale of the
property could differ materially in the near term from the carrying value
reflected in these financial statements.
The current protracted economic
decline continues to present financial institutions with circumstances and
challenges, which in some cases have resulted in large and unanticipated
declines in fair values of investments and other assets, constraints on
liquidity and capital and significant credit quality problems, including severe
volatility in the valuation of real estate and other collateral supporting
loans.
As discussed further in Note 5, the Corporation has concentrations in commercial real estate and commercial and development real estate. Due to national, state and local economic conditions, values for commercial and development real estate have declined significantly, and the market for these properties is depressed.
The accompanying financial statements have been prepared using values and information currently available to the Corporation.
Given the volatility of current economic conditions, the value of assets and liabilities recorded in the financial statements could change rapidly, resulting in material future adjustments in asset values, the allowance for loan losses and capital that could negatively impact the Corporation’s ability to meet regulatory capital requirements and maintain sufficient liquidity.
In the normal course of business to meet the financing needs of its customers, the subsidiary bank is party to financial instruments with off-balance sheet risk. These financial instruments include commitments to extend credit and standby letters of credit. These instruments involve, to varying degrees, elements of credit and interest rate risk in excess of the amount recognized in the Consolidated Balance Sheets. The contract amounts of those instruments reflect the extent of involvement the subsidiary bank has in particular classes of financial instruments.
The
subsidiary bank’s exposure to credit loss in the event of non-performance by
the other party to the financial instrument for commitments to extend credit
and standby letters of credit is represented by the contractual notional amount
of those instruments. The subsidiary bank uses the same credit policies in
making commitments and conditional obligations as it does for on-balance-sheet
instruments. At December 31, 2010, commitments to extend credit and standby
letters of credit were approximately $118,357 and $1,503, respectively. At
December 31, 2009, commitments to extend credit and standby letters of credit
were approximately $129,142 and $3,970, respectively.
Commitments to extend
credit are agreements to lend to a customer as long as there is no violation of
any condition established in the contract. Commitments generally have fixed
expiration dates or other termination clauses and may require payment of a fee.
Since many of the commitments are expected to expire without being drawn upon,
the total commitment amounts do not necessarily represent future cash
requirements. The subsidiary bank evaluates each customer’s creditworthiness on
a case-by-case basis. The amount of collateral obtained, if deemed necessary,
by the subsidiary bank upon extension of credit is based on management’s credit
evaluation of the counterparty. Collateral held varies, but may include real
estate, accounts receivable, inventory, property, plant and equipment and
income-producing properties.
Standby letters of credit are conditional commitments issued by the subsidiary bank to guarantee the performance of a customer to a third party. The credit risk involved in issuing standby letters of credit is essentially the same as that involved in extending loan facilities to customers. The subsidiary bank secures the standby letters of credit with the same collateral used to secure the loan. The maximum amount of credit that would be extended under standby letters of credit is equal to the off-balance sheet contract amount. At December 31, 2010 and 2009, the standby letters of credit had terms that expire in one year or less.
There are various claims pending against the Corporation’s subsidiary bank, arising in the normal course of business. Management believes, based upon consultation with counsel, that liabilities arising from these proceedings, if any, will not be material to the Corporation’s financial position or results of operations.
19. FDIC One-Time Assessment Credit
On February 27, 2009, the FDIC adopted a final rule modifying the risk-based assessment system and setting initial base assessment rates beginning April 1, 2009, at 12 to 50 basis points and, due to extraordinary circumstances, extended the period of the Restoration Plan to seven years. The Corporation’s assessment, according to the new formula was 17 basis points in 2009. Previously, the quarterly assessment rate was 7 basis points. The FDIC has the ability to increase assessments each quarter, if needed.
On May 22, 2009, the FDIC adopted a final rule imposing a 5 basis point special assessment on each insured depository institution’s assets minus Tier 1 capital as of June 30, 2009, which was paid on September 30, 2009. This assessment equated to a one-time cost of $588 and is reflected in the Corporation’s income statement for the year ended December 31, 2009.
On September 29, 2009 the Board of Directors of the FDIC adopted a Notice of Proposed Rulemaking (NPR) that would require insured institutions to prepay their estimated quarterly risk-based assessments for the fourth quarter of 2009 and for all of 2010, 2011 and 2012. The FDIC estimates that the total prepaid assessments collected would be approximately $45 billion. The FDIC Board also voted to adopt a uniform three-basis point increase in assessment rates effective on January 1, 2011 and to extend the restoration period from seven to eight years.
Under GAAP accounting rules, unlike special assessments, prepaid assessments would not immediately affect bank earnings. Each institution would record the entire amount of its assessment related to future periods as a prepaid expense (an asset) as of December 31, 2009, the date the payment would be made. The Corporation paid an assessment of $6,763 for the fourth quarter of 2009 and for all of 2010, 2011 and 2012.
34
As of December 31, 2009, and each quarter thereafter, each institution would record an expense (charge to earnings) for its regular quarterly assessment and an offsetting credit to the prepaid assessment until the asset is exhausted. At December 31, 2010 and 2009, the Corporation had a remaining prepaid assessment of $4,243 and $6,332, respectively. This amount is reflected in the Other Assets in the Consolidated Balance Sheets.
20. Capital Purchase Program/Troubled Asset Relief Program (TARP)
On January 23, 2009, the Corporation received $25,083 of equity capital by issuing to the United States Department of Treasury 25,083 shares of the Corporation’s 5.00% Series B Non-voting Cumulative Preferred Stock, par value $0.01 per share with a liquidation preference of $1.000 per share and a ten-year warrant to purchase up to 155,025 shares of the Corporation’s common stock, par value $5.00 per share, at an exercise price of $24.27 per share. The proceeds received were allocated to the preferred stock and additional paid-in capital based on their relative fair values. The resulting discount on the preferred stock is amortized against retained earnings and is reflected in the Corporation’s Consolidated Statements of Income as “Dividends on preferred shares,” resulting in additional dilution to the Corporation’s earnings per share. The warrants would be immediately exercisable, in whole or in part, over a term of 10 years. The warrants were included in the Corporation’s diluted average common shares outstanding (subject to anti-dilution). Both the preferred securities and warrants were accounted for as additions to the Corporation’s regulatory Tier 1 and total capital.
The Series B Preferred stock is not mandatorily redeemable and will pay cumulative dividends at a rate of 5% per year for the first five years and 9% per year thereafter. The Corporation can redeem the preferred securities at any time with Federal Reserve approval. The Series B Preferred stock ranks on equal priority with the Corporation’s currently authorized Series A Preferred stock.
Based on a Black-Scholes options pricing model, the common stock warrants have been assigned a fair value of $0.97 per warrant, or $150 in the aggregate, as of January 23, 2009. As a result, $150 has been recorded as the discount on the preferred stock obtained above and will be accreted as a reduction in net income available for common stockholders over the next five years at approximately $28 per year. For purposes of these calculations, the fair value of the common stock warrants as of January 23, 2009 was estimated using the Black-Scholes option pricing model and the following assumptions:
|
|
|
|
|
|
|
Risk-free interest rate |
1.64% |
|
|
|
Expected life of options |
5 years |
|
|
|
Expected dividend yield |
3.00% |
|
|
|
Expected volatility |
17.72% |
|
|
|
Weighted average fair value |
$0.97 |
|
A company that participates must adopt certain standards for executive compensation, including (a) prohibiting “golden parachute” payments as defined in the Emergency Economic Stabilization Act of 2008 (EESA) to senior Executive Officers; (b) requiring recovery of any compensation paid to senior Executive Officers based on criteria that is later proven to be materially inaccurate; (c) prohibiting incentive compensation that encourages unnecessary and excessive risks that threaten the value of the financial institution; and (d) accepting restrictions on the payment of dividends and the repurchase of common stock.
On January 24, 2011, the Corporation notified the U.S. Treasury that it will defer regularly scheduled dividend payments on the Corporation’s 25,083 in Series B Preferred Shares.
35
Notes to Consolidated Financial Statements (Continued)
(dollar amounts in thousands except share data)
21. Condensed Financial Information of Princeton National Bancorp, Inc.
The following condensed financial statements are presented for the Corporation on a stand alone basis:
Condensed Balance Sheets
|
|
|
|
|
|
|
|
|
|
|
|
December 31 |
|
||||
|
|
|
2010 |
|
2009 |
|
||
|
Assets |
|
|
|
|
|
|
|
|
Cash |
|
$ |
31 |
|
$ |
840 |
|
|
Interest-bearing deposits in subsidiary bank |
|
|
18 |
|
|
554 |
|
|
Other assets |
|
|
1,718 |
|
|
1,058 |
|
|
Investment in subsidiary bank |
|
|
80,157 |
|
|
97,425 |
|
|
|
|
|
|
|
|
|
|
|
Total assets |
|
|
81,924 |
|
|
99,877 |
|
|
|
|
|
|
|
|
|
|
|
Liabilities |
|
|
|
|
|
|
|
|
Borrowings |
|
$ |
25,000 |
|
$ |
25,000 |
|
|
Other liabilities |
|
|
63 |
|
|
217 |
|
|
|
|
|
|
|
|
|
|
|
Total liabilities |
|
|
25,063 |
|
|
25,217 |
|
|
|
|
|
|
|
|
|
|
|
Stockholders’ Equity |
|
|
|
|
|
|
|
|
Preferred stock |
|
|
24,986 |
|
|
24,958 |
|
|
Common stock |
|
|
22,391 |
|
|
22,391 |
|
|
Common stock warrants |
|
|
150 |
|
|
150 |
|
|
Surplus |
|
|
18,275 |
|
|
18,423 |
|
|
Retained earnings |
|
|
11,589 |
|
|
29,851 |
|
|
Accumulated other comprehensive income, net of tax |
|
|
3,064 |
|
|
2,816 |
|
|
Less: cost of treasury shares |
|
|
(23,594 |
) |
|
(23,929 |
) |
|
|
|
|
|
|
|
|
|
|
Total stockholders’ equity |
|
|
56,861 |
|
|
74,660 |
|
|
|
|
|
|
|
|
|
|
|
Total liabilities and stockholders’ equity |
|
$ |
81,924 |
|
$ |
99,877 |
|
|
|
|
|
|
|
|
|
|
Condensed Statements of Income
|
|
|
|
|
|
|
|
|
|
|
|
|
|
|
For the Years Ended December 31 |
|
|||||||
|
|
|
2010 |
|
2009 |
|
2008 |
|
|||
|
Income |
|
|
|
|
|
|
|
|
|
|
|
Dividends received from subsidiary bank |
|
$ |
1,500 |
|
$ |
5,200 |
|
$ |
5,600 |
|
|
Interest income |
|
|
3 |
|
|
54 |
|
|
5 |
|
|
Other income |
|
|
18 |
|
|
44 |
|
|
43 |
|
|
|
|
|
|
|
|
|
|
|
|
|
|
Total income |
|
|
1,521 |
|
|
5,298 |
|
|
5,648 |
|
|
|
|
|
|
|
|
|
|
|
|
|
|
Expenses |
|
|
|
|
|
|
|
|
|
|
|
Interest expense |
|
|
1,142 |
|
|
1,517 |
|
|
2,100 |
|
|
Amortization and depreciation |
|
|
5 |
|
|
5 |
|
|
7 |
|
|
Other expenses |
|
|
300 |
|
|
521 |
|
|
253 |
|
|
|
|
|
|
|
|
|
|
|
|
|
|
Total expenses |
|
|
1,447 |
|
|
2,043 |
|
|
2,360 |
|
|
|
|
|
|
|
|
|
|
|
|
|
|
Income before income taxes and equity in undistributed income (loss) of subsidiary bank |
|
|
74 |
|
|
3,255 |
|
|
3,288 |
|
|
Applicable income tax benefit |
|
|
(552 |
) |
|
(699 |
) |
|
(892 |
) |
|
|
|
|
|
|
|
|
|
|
|
|
|
Income before equity in undistributed income of subsidiary bank |
|
|
626 |
|
|
3,954 |
|
|
4,180 |
|
|
Equity in undistributed income (loss) of subsidiary bank |
|
|
(17,605 |
) |
|
(25,080 |
) |
|
3,146 |
|
|
|
|
|
|
|
|
|
|
|
|
|
|
Net income (loss) |
|
|
(16,979 |
) |
|
(21,126 |
) |
|
7,326 |
|
|
|
|
|
|
|
|
|
|
|
|
|
|
Dividends on preferred shares |
|
|
1,255 |
|
|
1,178 |
|
|
-0- |
|
|
Accretion of preferred stock discount |
|
|
28 |
|
|
25 |
|
|
-0- |
|
|
|
|
|
|
|
|
|
|
|
|
|
|
Net income (loss) available to common stockholders |
|
$ |
(18,262 |
) |
$ |
(22,329 |
) |
$ |
7,326 |
|
|
|
|
|
|
|
|
|
|
|
|
|
36
Condensed Statements of Cash Flows
|
|
|
|
|
|
|
|
|
|
|
|
|
|
|
For the Years Ended December 31 |
|
|||||||
|
|
|
2010 |
|
2009 |
|
2008 |
|
|||
|
Operating activities: |
|
|
|
|
|
|
|
|
|
|
|
Net income (loss) |
|
$ |
(16,979 |
) |
$ |
(21,126 |
) |
$ |
7,326 |
|
|
Adjustments to reconcile net income (loss) to net cash provided by operating activities: |
|
|
|
|
|
|
|
|
|
|
|
Equity in undistributed (income) loss of subsidiary bank |
|
|
17,605 |
|
|
25,080 |
|
|
(3,146 |
) |
|
Amortization of other intangible assets |
|
|
5 |
|
|
5 |
|
|
7 |
|
|
Increase in other assets |
|
|
(665 |
) |
|
(8,481 |
) |
|
(1,882 |
) |
|
(Decrease) increase in other liabilities |
|
|
(154 |
) |
|
(683 |
) |
|
747 |
|
|
|
|
|
|
|
|
|
|
|
|
|
|
Net cash provided by (used in) operating activities |
|
|
(188 |
) |
|
(5,205 |
) |
|
3,052 |
|
|
|
|
|
|
|
|
|
|
|
|
|
|
|
|
|
|
|
|
|
|
|
|
|
|
Financing activities: |
|
|
|
|
|
|
|
|
|
|
|
Net increase (decrease) in borrowings |
|
|
-0- |
|
|
(16,050 |
) |
|
1,500 |
|
|
Proceeds from issuance of preferred stock and common stock warrants, net of expenses |
|
|
-0- |
|
|
25,020 |
|
|
-0- |
|
|
Dividends paid on preferred stock |
|
|
(1,255 |
) |
|
(1,017 |
) |
|
-0- |
|
|
Dividends paid on common stock |
|
|
-0- |
|
|
(2,311 |
) |
|
(3,696 |
) |
|
Sale of treasury stock |
|
|
55 |
|
|
114 |
|
|
124 |
|
|
Purchase of treasury stock |
|
|
-0- |
|
|
-0- |
|
|
(553 |
) |
|
Award of nonvested common stock out of treasury stock |
|
|
43 |
|
|
-0- |
|
|
-0- |
|
|
Exercise of stock options and issuance of treasury stock |
|
|
-0- |
|
|
-0- |
|
|
101 |
|
|
|
|
|
|
|
|
|
|
|
|
|
|
Net cash provided by (used in) financing activities |
|
|
(1,157 |
) |
|
5,756 |
|
|
(2,524 |
) |
|
|
|
|
|
|
|
|
|
|
|
|
|
Increase (decrease) in cash and cash equivalents |
|
|
(1,345 |
) |
|
551 |
|
|
528 |
|
|
Cash and cash equivalents at beginning of year |
|
|
1,394 |
|
|
843 |
|
|
315 |
|
|
|
|
|
|
|
|
|
|
|
|
|
|
Cash and cash equivalents at end of year |
|
$ |
49 |
|
$ |
1,394 |
|
$ |
843 |
|
|
|
|
|
|
|
|
|
|
|
|
|
37
Management’s Discussion and Analysis of
Financial Condition and Results of Operations
(dollar amounts
in thousands except share data)
The following discussion and analysis provides information about the Corporation’s financial condition and results of operations for the years ended December 31, 2010, 2009, and 2008. This discussion and analysis should be read in conjunction with the Corporation’s Consolidated Financial Statements and the Notes thereto included in this report.
Overview
The Corporation reported a net loss available to common stockholders of $(18,262) for 2010, a decrease in net loss of $4,067 (or 18.2%) when compared to a net loss of $(22,329) in 2009. Earnings in 2010 were negatively impacted by an increase in the provision for loan losses ($40,550 in 2010 versus $11,062 in 2009) and an increase in other real estate owned expenses ($2,586 in 2010 versus $1,064 in 2009). Partially offsetting these expenses was an increase in net interest income of $2,677, or 7.7%. Earnings in 2009 were significantly impacted by the impairment of goodwill of $24,521. The following represents the Corporation’s net income (loss) available to common stockholders, earnings (loss) per share and provision for loan loss expense for each quarter of 2010:
|
|
|
|
|
|
|
|
|
|
|
|
|
|
|
|
|
|
|
|
|
Net Income (Loss) |
|
Earnings (Loss) per Share |
|
Provision for |
|
|||||||||
|
|
|
|
|
|
|
|
|
|||||||||
|
1st Quarter |
|
|
$ |
(62 |
) |
|
|
$ |
(0.02 |
) |
|
|
$ |
3,925 |
|
|
|
2nd Quarter |
|
|
|
99 |
|
|
|
|
0.03 |
|
|
|
|
2,650 |
|
|
|
3rd Quarter |
|
|
|
(2,232 |
) |
|
|
|
(0.67 |
) |
|
|
|
6,725 |
|
|
|
4th Quarter |
|
|
|
(16,067 |
) |
|
|
|
(4.86 |
) |
|
|
|
27,250 |
|
|
During the fourth quarter of 2010, $16,076 in loan charge-offs were recorded due to the receipt of updated appraisals reflecting the current deterioration in the collateral value of commercial real estate and commercial real estate development properties, primarily in the northern and eastern markets. In estimating the adequacy of the allowance for loan losses, management utilizes a twelve-quarter loan loss history as one component in assessing the probability of inherent future losses, which includes higher weighting of the most recent data. Thus, fourth quarter 2010 loan charge-offs increased the historical losses contained in the twelve quarter loan loss history and significantly increased the general reserve portion of the allowance for loan losses. These charge-offs, combined with the continued credit deterioration in the northern and eastern markets, resulted in the large fourth quarter provision for loan losses.
Updated collateral assessments, particularly in the areas noted, were negatively impacted by economic conditions which, though improving, have not yet stabilized and continue to be influenced by the volume of troubled commercial and residential real estate properties on the market. This situation remains dynamic and, though overall improvement is expected, further deterioration could occur in the future in isolated circumstances. Management considers the balance of the allowance for loan losses adequate to meet probable losses as of December 31, 2010.
Non-interest income declined to 0.99% of average total assets for 2010, compared to 1.06% in 2009. Most categories were down year over year, reflecting an industry trend of lower service charge income. Gains from the sales of available for sale securities decreased by $1,059 due to (1) a decrease in the number of securities sold, and (2) a decrease in the level of gain realized from portfolio management and restructuring transactions.
Total non-interest expense as a percentage of average assets increased to 3.21% in 2010 from 2.80% in 2009, excluding the 2009 goodwill impairment loss of $24,521. Excluding the increase in other real estate owned and loan collection expenses in 2010 over 2009 of $1,632, and a 2010 write down of land held for sale of $110, total non-interest expense as a percentage of average assets increased to 3.06%.
In 2010, the Corporation’s asset size declined by $164,867 (or 13.1%), ending the year at $1,096,471 in total assets. With loan demand remaining tempered during 2010, the Corporation implemented a strategic reduction of the balance sheet. This was accomplished by using the proceeds of investment security sales to fund the redemption of higher rate public deposits and borrowings. This resulted in a decrease in the investment portfolio of $40,328, a decrease in time deposits of $130,262, and a decrease in the Corporation’s liquidity of $27,193. Additionally, the Corporation’s borrowings in the form of Federal Home Loan Bank advances decreased by $22,500.
Total stockholders’ equity decreased by $17,799 from $74,660 in 2009 to a 2010 balance of $56,861. This decrease was substantially due to the $(18,262) net loss available to common stockholders discussed above.
On March 15, 2010, the Bank entered into a written agreement (the “Agreement”) with the OCC. The Agreement sets forth the Bank’s commitments to: (i) review and take action as necessary regarding its allowance for loan and lease losses; (ii) improve the Bank’s asset quality through the development of workout plans for criticized assets and the assessment of credit risk; and (iii) revise the Bank’s credit risk rating management information system. The Bank has taken steps to address the issues raised in the Agreement and intends to fully comply with the requirements set forth in the Agreement.
On February 28, 2011, as required by the Corporation’s primary regulator, the Federal Reserve Bank, a resolution of the Corporation’s Board of Directors was passed requiring that the Corporation obtain written approval from the Federal Reserve Bank prior to any of the following: the declaration or payment of dividends; any increase in debt; any distribution of interest, principal, or other sum associated with subordinated debentures or trust preferred securities; and the redemption of Corporation stock.
|
|
|
|
|
|
|
|
|
|
|
|
|
|
|
|
|
|
|
|
|
|
|
|
Assets at |
|
Percent |
|
Equity at |
|
Percent |
|
Net Income (Loss) |
|
Percent |
|
||||||
|
|
|
|
|
|
|
|
|
|
|
|
|
|
|
||||||
|
2010 |
|
$ |
1,096,471 |
|
|
(13.07 |
)% |
$ |
56,861 |
|
|
(23.84 |
)% |
$ |
(18,262 |
) |
|
18.21 |
% |
|
2009 |
|
|
1,261,338 |
|
|
8.44 |
|
|
74,660 |
|
|
3.02 |
|
|
(22,329 |
) |
|
(404.79 |
) |
|
2008 |
|
|
1,163,130 |
|
|
7.63 |
|
|
72,471 |
|
|
5.63 |
|
|
7,326 |
|
|
8.21 |
|
38
Critical Accounting Policies and Use of Significant Estimates
The Corporation has established various accounting policies that govern the application of U.S. generally accepted accounting principles in the preparation of the Corporation’s financial statements. The significant accounting policies of the Corporation are described in the footnotes to the Consolidated Financial Statements. Certain accounting policies involve significant judgments and assumptions by management that have a material impact on the carrying value of certain assets and liabilities; management considers such accounting policies to be critical accounting policies. The judgments and assumptions used by management are based on historical experience and other factors, which are believed to be reasonable under the circumstances. Because of the nature of the judgments and assumptions made by management, actual results could differ from these judgments and assumptions, which could have a material impact on the carrying values of assets and liabilities and the results of operations of the Corporation.
Allowance for Loan Losses - The Corporation believes the allowance for loan losses is the critical accounting policy that requires the most significant judgments and assumptions used in the preparation of its Consolidated Financial Statements. We determine probable incurred losses inherent in our loan portfolio and establish an allowance for those losses by considering factors including historical loss rates, expected cash flows and estimated collateral values. In assessing these factors, we use organizational history and experience with credit decisions and related outcomes. The allowance for loan losses represents our best estimate of losses inherent in the existing loan portfolio. The allowance for loan losses is increased by the provision for loan losses charged to expense and reduced by loans charged off, net of recoveries. We evaluate our allowance for loan losses quarterly. If our underlying assumptions later prove to be inaccurate based on subsequent loss evaluations, the allowance for loan losses is adjusted.
We estimate the appropriate level of allowance for loan losses by separately evaluating impaired and non-impaired loans. A specific allowance is assigned to an impaired loan when expected cash flows or collateral do not justify the carrying amount of the loan. The methodology used to assign an allowance to a non-impaired loan is more subjective. Generally, the allowance assigned to non-impaired loans is determined by applying historical loss rates to existing loans with similar risk characteristics, adjusted for qualitative factors including the volume and severity of identified classified loans, changes in economic conditions, changes in credit policies or underwriting standards, and changes in the level of credit risk associated with specific industries and markets. Because the economic and business climate in any given industry or market, and its impact on any given borrower, can change rapidly, the risk profile of the loan portfolio is continually assessed and adjusted when appropriate. Notwithstanding these procedures, there still exists the possibility that our assessment could prove to be incorrect and that an immediate adjustment to the allowance for loan losses would be required.
Other Real Estate Owned - Other real estate owned acquired through loan foreclosure is initially recorded at fair value less costs to sell when acquired, establishing a new cost basis. The adjustment at the time of foreclosure is recorded through the allowance for loan losses. Due to the subjective nature of establishing the fair value when the asset is acquired, the actual fair value of the other real estate owned or foreclosed asset could differ from the original estimate. If it is determined that fair value declines subsequent to foreclosure, a valuation allowance is recorded through non-interest expense. Operating costs associated with the assets after acquisition are also recorded as non-interest expense. Gains and losses on the disposition of other real estate owned and foreclosed assets are netted and posted to other non-interest expense.
Deferred Income Tax Assets/Liabilities - Our net deferred income tax asset arises from differences in the dates that items of income and expense enter into our reported income and taxable income. Deferred tax assets and liabilities are established for these items as they arise. From an accounting standpoint, deferred tax assets are reviewed to determine if they are realizable based on the historical level of our taxable income, estimates of our future taxable income and the reversals of deferred tax liabilities. In most cases, the realization of the deferred tax asset is based on our future profitability. If we experience net operating losses for tax purposes, the realization of deferred tax assets is evaluated for a potential valuation reserve.
Additionally, the Corporation reviews its uncertain tax positions annually under ASC Topic 740, Accounting for Uncertainty in Income Taxes. An uncertain tax position is recognized as a benefit only if it is “more likely than not” that the tax position would be sustained in a tax examination, with a tax examination being presumed to occur. The amount actually recognized is the largest amount of tax benefit that is greater than 50% likely to be recognized on examination. For tax positions not meeting the “more likely than not” test, no tax benefit is recorded. A significant amount of judgment is applied to determine both whether the tax position meets the “more likely than not” test as well as to determine the largest amount of tax benefit that is greater than 50% likely to be recognized. Differences between the position taken by management and that of taxing authorities could result in a reduction of a tax benefit or increase to tax liability, which could adversely affect future income tax expense.
Impairment of Intangible Assets - Core deposit and customer relationships, which are intangible assets with a finite life, are recorded on our balance sheets. These intangible assets were capitalized as a result of past acquisitions and are being amortized over their estimated useful lives of up to 15 years. Core deposit intangible assets with finite lives will be tested for impairment when changes in events or circumstances indicate that its carrying amount may not be recoverable. Core deposit intangible assets were tested for impairment during 2010 and 2009, and no impairment was deemed necessary.
As a result of our acquisition activity, goodwill, an intangible asset with an indefinite life, was reflected on our balance sheet in prior periods. Goodwill was evaluated for impairment annually, unless there were factors present that indicated a potential impairment, in which case, the goodwill impairment test was performed more frequently than annually. Accordingly, as the Corporation’s stock price at December 31, 2009 decreased below book value, a goodwill impairment test was performed and full impairment was deemed necessary (see Note 7 – “Goodwill” in the Notes to Consolidated Financial Statements).
Mortgaging Service Rights (MSRs) - MSR fair values are very sensitive to movements in interest rates as expected future net servicing income depends on the projected outstanding principal balances of the underlying loans, which can be greatly reduced by prepayments. Prepayments usually increase when mortgage interest rates decline and decrease when mortgage interest rates rise. For discussion regarding the impairment of MSRs, see Note 8 – “Intangible Assets” in the Notes to Consolidated Financial Statements.
Fair Value Measurements - The fair value of a financial instrument is defined as the amount at which the instrument could be exchanged in a current transaction between willing parties, other than in a forced or liquidation sale. The Corporation estimates the fair value of a financial instrument using a variety of valuation methods. Where financial instruments are actively traded and have quoted market prices, quoted market prices are used for fair value. When the financial instruments are not actively traded, other observable market inputs, such as quoted prices of securities with similar characteristics, may be used, if available, to determine fair value. When observable market prices do not exist, the Corporation estimates fair value. The Corporation’s valuation methods consider factors such as liquidity and concentration concerns. Other factors such as model assumptions, market dislocations and unexpected correlations can affect estimates of fair value. Imprecision in estimating these factors can impact the amount of revenue or loss recorded.
39
Management’s Discussion and Analysis of
Financial Condition and Results of Operations (Continued)
(dollar amounts in thousands except share data)
ASC 820, “Fair Value Measurements,” establishes a framework for measuring the fair value of financial instruments that considers the attributes specific to particular assets or liabilities and establishes a three-level hierarchy for determining fair value based on the transparency of inputs to each valuation as of the fair value measurement date. The three levels are defined as follows:
|
|
|
|
|
|
Level 1 - |
quoted prices (unadjusted) for identical assets or liabilities in active markets. |
|
|
|
|
|
|
Level 2 - |
inputs include quoted prices for similar assets and liabilities in active markets, quoted prices of identical or similar assets or liabilities in markets that are not active, and inputs that are observable for the asset or liability, either directly or indirectly, for substantially the full term of the financial instrument. |
|
|
|
|
|
|
Level 3 - |
inputs that are unobservable and significant to the fair value measurement. |
At the end of each quarter, the Corporation assesses the valuation hierarchy for each asset or liability measured. From time to time, assets or liabilities may be transferred within hierarchy levels due to changes in availability of observable market inputs to measure fair value at the measurement date. Transfers into or out of hierarchy levels are based upon the fair value at the beginning of the reporting period. A more detailed description of the fair values measured at each level of the fair value hierarchy can be found in Note 16 - “Fair Value of Financial Instruments” in the Notes to Consolidated Financial Statements.
Analysis of Results of Operations
Net Income (Loss). The Corporation recorded a net loss available to common stockholders of $(18,262), or $(5.52) per basic and diluted loss per common share, in 2010. This represented an improvement over the net loss available to common stockholders reported in 2009 of $(22,329), or $(6.76) per basic and diluted earnings (loss) per common share. The loss experienced in 2010 is primarily due to an increase in loan loss provisioning expense during the year and increased costs incurred in the collection of problem loans and management of other real estate owned properties. The heightened provision level of $40,550 was significantly impacted by the level of deterioration in the valuation of collateral supporting problem loans. The Corporation experienced an increase of $2,677, or 7.7%, in net interest income from $34,651 in 2009 to $37,328 in 2010 due to a continued focus on interest cost reduction in the current low rate environment.
Net income (loss) available to common stockholders for 2009 decreased by $29,655 (or 404.8%) to $(22,329) (or $(6.76) per basic and diluted earnings (loss) per share available to common stockholders), from $7,326 (or $2.22 per basic earnings per share available to common stockholders and $2.21 per diluted earnings per share available to common stockholders) in 2008. The lower results are due in part to the impairment of goodwill of $24,521, an increase in provision for loan losses of $8,094 and an increase in federal deposit insurance assessments of $1,739. These were partially offset by a $3,130 improvement in net interest income and a $1,651 increase in non-interest income.
For a more detailed review of net interest income, non-interest income and non-interest expense please refer to those sections contained in this Management’s Discussion and Analysis.
Net Interest Income. The Corporation experienced a $1,924 improvement in net interest income, on a taxable-equivalent basis, during 2010, increasing to $39,449 from $37,525 in 2009, representing an improvement of 5.1%. This positive change was made possible through continued emphasis on reducing the Corporation’s cost of funds in the current low interest rate environment. Average interest-earning assets decreased $99,940 (9.1%) during 2010 to $992,306 from $1,092,246 in 2009. This decrease was due in part to the Corporation’s strategy to shrink the balance sheet. Implementation of this strategy resulted in the sale of investment securities to fund the redemption of higher-rate public deposits. The average balance of investment securities decreased by $50,817, or 16.9%, to $249,777 in 2010 from $300,594 in 2009. Net loans decreased $56,710 or 7.6% in 2010 due to limited customer demand, loans charged-off and reclassification of loans to other real estate owned. Efforts in 2010 to maintain a higher level of liquidity resulted in an increase in average interest-bearing deposits of $7,592 or 15.9%.
Average interest-bearing liabilities decreased by $81,535 or 7.9% to $948,247, while the interest expense paid for those liabilities decreased significantly by $9,847 or 44.6% from $22,085 in 2009 to $12,238 in 2010. This interest cost reduction was due to tightly controlled pricing and the reduction of other borrowings, along with scheduled repricing during the continued historic low interest rate environment. The resulting net yield on average interest-earning assets for 2010 increased significantly to 3.98% from 3.44% in 2009 primarily due to reduction in interest costs on redemption of higher rate public deposits.
The following table sets forth details of average balances, interest income and expense, and resulting rates for the past three years, reported on a taxable equivalent basis using a tax rate of 34%:
|
|
|
|
|
|
|
|
|
|
|
|
|
|
|
|
|
|
|
|
|
|
|
|
|
|
|
|
|
|
|
|
|
For the Years Ending December 31 |
|
|||||||||||||||||||||||||
|
|
|
|
|
|||||||||||||||||||||||||
|
|
|
2010 |
|
2009 |
|
2008 |
|
|||||||||||||||||||||
|
|
|
Average |
|
Interest |
|
Yield/ |
|
Average |
|
Interest |
|
Yield/ |
|
Average |
|
Interest |
|
Yield/ |
|
|||||||||
|
|
|
|
|
|
|
|
|
|
|
|
|
|
|
|
|
|
|
|
|
|
|
|
|
|
|
|
|
|
|
Average Interest-Earning Assets |
|
|
|
|
|
|
|
|
|
|
|
|
|
|
|
|
|
|
|
|
|
|
|
|
|
|
|
|
|
Interest-bearing deposits |
|
$ |
55,352 |
|
$ |
139 |
|
|
0.25 |
% |
$ |
47,760 |
|
$ |
114 |
|
|
0.24 |
% |
$ |
2,785 |
|
$ |
55 |
|
|
1.97 |
% |
|
Taxable investment securities |
|
|
151,930 |
|
|
6,290 |
|
|
4.14 |
|
|
176,871 |
|
|
7,607 |
|
|
4.30 |
|
|
143,108 |
|
|
6,834 |
|
|
4.78 |
|
|
Tax-exempt investment securities (a) |
|
|
97,847 |
|
|
5,798 |
|
|
5.93 |
|
|
123,723 |
|
|
8,025 |
|
|
6.49 |
|
|
94,926 |
|
|
6,284 |
|
|
6.62 |
|
|
Federal funds sold |
|
|
-0- |
|
|
-0- |
|
|
0.00 |
|
|
5 |
|
|
-0- |
|
|
0.00 |
|
|
5,316 |
|
|
71 |
|
|
1.34 |
|
|
Net loans (a) (b) |
|
|
687,177 |
|
|
39,460 |
|
|
5.74 |
|
|
743,887 |
|
|
43,864 |
|
|
5.90 |
|
|
734,672 |
|
|
47,796 |
|
|
6.51 |
|
|
|
|
|
|
|
|
|
|
|
|
|
|
|
|
|
|
|
|
|
|
|
|
|
|
|
|
|
|
|
|
Total interest-earning assets |
|
|
992,306 |
|
|
51,687 |
|
|
5.21 |
|
|
1,092,246 |
|
|
59,610 |
|
|
5.46 |
|
|
980,807 |
|
|
61,040 |
|
|
6.22 |
|
|
|
|
|
|
|
|
|
|
|
|
|
|
|
|
|
|
|
|
|
|
|
|
|
|
|
|
|
|
|
|
Average non-interest-earning assets |
|
|
165,319 |
|
|
|
|
|
|
|
|
156,998 |
|
|
|
|
|
|
|
|
126,526 |
|
|
|
|
|
|
|
|
|
|
|
|
|
|
|
|
|
|
|
|
|
|
|
|
|
|
|
|
|
|
|
|
|
|
|
|
|
|
Total average assets |
|
$ |
1,157,625 |
|
|
|
|
|
|
|
$ |
1,249,244 |
|
|
|
|
|
|
|
$ |
1,107,333 |
|
|
|
|
|
|
|
|
|
|
|
|
|
|
|
|
|
|
|
|
|
|
|
|
|
|
|
|
|
|
|
|
|
|
|
|
|
|
Average Interest-Bearing Liabilities |
|
|
|
|
|
|
|
|
|
|
|
|
|
|
|
|
|
|
|
|
|
|
|
|
|
|
|
|
|
Interest-bearing demand deposits |
|
$ |
375,537 |
|
|
2,972 |
|
|
0.79 |
% |
$ |
301,035 |
|
|
3,734 |
|
|
1.24 |
% |
$ |
253,982 |
|
|
3,647 |
|
|
1.44 |
% |
|
Savings deposits |
|
|
73,196 |
|
|
62 |
|
|
0.08 |
|
|
66,040 |
|
|
55 |
|
|
0.08 |
|
|
61,815 |
|
|
67 |
|
|
0.11 |
|
|
Time deposits |
|
|
415,127 |
|
|
7,351 |
|
|
1.77 |
|
|
563,901 |
|
|
15,431 |
|
|
2.74 |
|
|
506,663 |
|
|
20,068 |
|
|
3.96 |
|
|
Interest-bearing demand notes issued to the U.S. Treasury |
|
|
957 |
|
|
-0- |
|
|
0.00 |
|
|
924 |
|
|
-0- |
|
|
0.00 |
|
|
1,099 |
|
|
15 |
|
|
1.36 |
|
|
Federal funds purchased and customer repurchase agreements |
|
|
36,981 |
|
|
279 |
|
|
0.75 |
|
|
38,175 |
|
|
424 |
|
|
1.11 |
|
|
41,584 |
|
|
757 |
|
|
1.82 |
|
|
Advances from Federal Home Loan Bank |
|
|
21,449 |
|
|
432 |
|
|
2.01 |
|
|
32,332 |
|
|
924 |
|
|
2.86 |
|
|
19,362 |
|
|
647 |
|
|
3.34 |
|
|
Trust preferred securities |
|
|
25,000 |
|
|
1,142 |
|
|
4.57 |
|
|
25,000 |
|
|
1,420 |
|
|
5.68 |
|
|
25,000 |
|
|
1,420 |
|
|
5.68 |
|
|
Note payable |
|
|
-0- |
|
|
-0- |
|
|
0.00 |
|
|
2,375 |
|
|
97 |
|
|
4.08 |
|
|
15,296 |
|
|
680 |
|
|
4.45 |
|
|
|
|
|
|
|
|
|
|
|
|
|
|
|
|
|
|
|
|
|
|
|
|
|
|
|
|
|
|
|
|
Total interest-bearing liabilities |
|
|
948,247 |
|
|
12,238 |
|
|
1.29 |
|
|
1,029,782 |
|
|
22,085 |
|
|
2.14 |
|
|
924,801 |
|
|
27,301 |
|
|
2.95 |
|
|
|
|
|
|
|
|
|
|
|
|
|
|
|
|
|
|
|
|
|
|
|
|
|
|
|
|
|
|
|
|
Net taxable equivalent yield on average interest-earning assets |
|
|
|
|
$ |
39,449 |
|
|
3.98 |
% |
|
|
|
$ |
37,525 |
|
|
3.44 |
% |
|
|
|
$ |
33,739 |
|
|
3.44 |
% |
|
|
|
|
|
|
|
|
|
|
|
|
|
|
|
|
|
|
|
|
|
|
|
|
|
|
|
|
|
|
|
Average non-interest-bearing liabilities |
|
|
132,696 |
|
|
|
|
|
|
|
|
121,578 |
|
|
|
|
|
|
|
|
113,348 |
|
|
|
|
|
|
|
|
|
|
|
|
|
|
|
|
|
|
|
|
|
|
|
|
|
|
|
|
|
|
|
|
|
|
|
|
|
|
Average stockholders’ equity |
|
|
76,682 |
|
|
|
|
|
|
|
|
97,884 |
|
|
|
|
|
|
|
|
69,184 |
|
|
|
|
|
|
|
|
|
|
|
|
|
|
|
|
|
|
|
|
|
|
|
|
|
|
|
|
|
|
|
|
|
|
|
|
|
|
Total average liabilities and stockholders’ equity |
|
$ |
1,157,625 |
|
|
|
|
|
|
|
$ |
1,249,244 |
|
|
|
|
|
|
|
$ |
1,107,333 |
|
|
|
|
|
|
|
|
|
|
|
|
|
|
|
|
|
|
|
|
|
|
|
|
|
|
|
|
|
|
|
|
|
|
|
|
|
|
|
|
|
(a) |
Interest income on non-taxable investment securities and non-taxable loans includes the effects of taxable-equivalent adjustments, using a tax rate of 34% in adjusting interest on tax-exempt securities and tax-exempt loans to a taxable equivalent basis. The amount of taxable equivalent adjustments were $2,121 in 2010, $2,874 in 2009 and $2,218 in 2008. |
|
|
|
|
(b) |
Includes $59 in 2010, $(167) in 2009 and $32 in 2008 attributable to interest from non-accrual loans. |
40
The following table reconciles taxable-equivalent net interest income (as shown above) to net interest income as reported on the Consolidated Statements of Income:
|
|
|
|
|
|
|
|
|
|
|
|
|
|
|
2010 |
|
2009 |
|
2008 |
|
|||
|
|
|
|
|
|
|
|
|
|||
|
Net interest income as stated |
|
$ |
37,328 |
|
$ |
34,651 |
|
$ |
31,521 |
|
|
Taxable-equivalent adjustment-investments |
|
|
1,971 |
|
|
2,729 |
|
|
2,137 |
|
|
Taxable-equivalent adjustment-loans |
|
|
150 |
|
|
145 |
|
|
81 |
|
|
|
|
|
|
|
|
|
|
|
|
|
|
Taxable-equivalent net interest income |
|
$ |
39,449 |
|
$ |
37,525 |
|
$ |
33,739 |
|
|
|
|
|
|
|
|
|
|
|
|
|
The following table reconciles the net yield on average interest-earning assets to the net yield on average interest-earning assets on a taxable-equivalent basis:
|
|
|
|
|
|
|
|
|
|
|
|
|
|
|
2010 |
|
2009 |
|
2008 |
|
|||
|
|
|
|
|
|
|
|
|
|||
|
Net yield on interest-earning assets |
|
|
3.76 |
% |
|
3.17 |
% |
|
3.21 |
% |
|
Taxable equivalent adjustment-investments |
|
|
0.20 |
|
|
0.25 |
|
|
0.22 |
|
|
Taxable equivalent adjustment-loans |
|
|
0.02 |
|
|
0.02 |
|
|
0.01 |
|
|
|
|
|
|
|
|
|
|
|
|
|
|
Taxable equivalent net yield on interest-earning assets |
|
|
3.98 |
% |
|
3.44 |
% |
|
3.44 |
% |
|
|
|
|
|
|
|
|
|
|
|
|
The Corporation experienced a $3,786 improvement in net interest income, on a taxable-equivalent basis, during 2009, increasing to $37,525 from $33,739 in 2008, representing an improvement of 11.2%. This positive change was made possible through growth in the balance sheet and, more importantly, continued emphasis on reducing the Corporation’s cost of funds in the lower interest rate environment. Average interest-earning assets during 2009 increased to $1,092,246 from $980,807 in 2008, representing growth of $111,439 (or 11.4%). As loan demand weakened in 2009, the asset mix of the balance sheet shifted more to investments with the average balance of investment securities increasing by $62,560 (or 26.3%), while the average balance of net loans increased just $9,215 (or 1.3%). In addition, the average balance of interest-bearing deposits increased $44,975 (or 1,614.9%) in 2009, as a result of the Corporation’s successful efforts to build liquidity into the balance sheet.
However, on the liability side, although average interest-bearing liabilities increased by $105,000 (10.4%) to $1,029,782, the interest expense paid for those liabilities decreased from $27,301 in 2008 to $22,085 in 2009, a reduction of $5,216 (or 19.1%). This was due to controlled pricing and the efficient use of other borrowings, along with normal repricing from the low interest-rate environment. The net yield on interest-earning assets for 2009 remained at the same rate of 3.44% from 2008.
41
Management’s Discussion and Analysis of
Financial Condition and Results of Operations (Continued)
(dollar amounts in thousands except share data)
The following table describes changes in net interest income attributable to changes in the volume of interest-earning assets and interest-bearing liabilities compared to changes in interest rates:
|
|
|
|
|
|
|
|
|
|
|
|
|
|
|
|
|
|
|
|
|
|
|
|
|
|
|
|
|
|
|
|
|
Year ended December 31 |
|
|||||||||||||||||||||||||
|
|
|
|
|
|||||||||||||||||||||||||
|
|
|
2010 compared to 2009 |
|
2009 compared to 2008 |
|
2008 compared to 2007 |
|
|||||||||||||||||||||
|
|
|
Volume(a) |
|
Rate(a) |
|
Net |
|
Volume(a) |
|
Rate(a) |
|
Net |
|
Volume(a) |
|
Rate(a) |
|
Net |
|
|||||||||
|
|
|
|
|
|
|
|
|
|||||||||||||||||||||
|
Interest from interest-earning assets |
|
|
|
|
|
|
|
|
|
|
|
|
|
|
|
|
|
|
|
|
|
|
|
|
|
|
|
|
|
|
||||||||||||||||||||||||||||
|
Interest-bearing time deposits |
|
$ |
19 |
|
$ |
6 |
|
$ |
25 |
|
$ |
498 |
|
$ |
(439 |
) |
$ |
59 |
|
$ |
11 |
|
$ |
(78 |
) |
$ |
(67 |
) |
|
Taxable investment securities |
|
|
(1,053 |
) |
|
(264 |
) |
|
(1,317 |
) |
|
1,532 |
|
|
(759 |
) |
|
773 |
|
|
(422 |
) |
|
434 |
|
|
12 |
|
|
Tax-exempt investment securities (b) |
|
|
(1,606 |
) |
|
(621 |
) |
|
(2,227 |
) |
|
1,887 |
|
|
(146 |
) |
|
1,741 |
|
|
342 |
|
|
(576 |
) |
|
(234 |
) |
|
Federal funds sold |
|
|
-0- |
|
|
-0- |
|
|
-0- |
|
|
(35 |
) |
|
(36 |
) |
|
(71 |
) |
|
(44 |
) |
|
(217 |
) |
|
(261 |
) |
|
Net loans (c) |
|
|
(3,300 |
) |
|
(1,104 |
) |
|
(4,404 |
) |
|
571 |
|
|
(4,503 |
) |
|
(3,932 |
) |
|
4,752 |
|
|
(7,028 |
) |
|
(2,276 |
) |
|
|
|
|
|
|
|
|
|
|
|
|
|
|
|
|
|
|
|
|
|
|
|
|
|
|
|
|
|
|
|
Total income from interest-earning assets |
|
|
(5,940 |
) |
|
(1,983 |
) |
|
(7,923 |
) |
|
4,453 |
|
|
(5,883 |
) |
|
(1,430 |
) |
|
4,639 |
|
|
(7,465 |
) |
|
(2,826 |
) |
|
|
|
|
|
|
|
|
|
|
|
|
|
|
|
|
|
|
|
|
|
|
|
|
|
|
|
|
|
|
|
|
|
|
|
|
|
|
|
|
|
|
|
|
|
|
|
|
|
|
|
|
|
|
|
|
|
|
|
|
|
Expense of interest-bearing liabilities |
|
|
|
|
|
|
|
|
|
|
|
|
|
|
|
|
|
|
|
|
|
|
|
|
|
|
|
|
|
|
|
|
|
|
|
|
|
|
|
|
|
|
|
|
|
|
|
|
|
|
|
|
|
|
|
|
|
|
|
Interest-bearing demand deposits |
|
|
757 |
|
|
(1,519 |
) |
|
(762 |
) |
|
630 |
|
|
(543 |
) |
|
87 |
|
|
323 |
|
|
(3,243 |
) |
|
(2,920 |
) |
|
Savings deposits |
|
|
6 |
|
|
1 |
|
|
7 |
|
|
4 |
|
|
(16 |
) |
|
(12 |
) |
|
(4 |
) |
|
(178 |
) |
|
(182 |
) |
|
Time deposits |
|
|
(3,353 |
) |
|
(4,727 |
) |
|
(8,080 |
) |
|
1,917 |
|
|
(6,554 |
) |
|
(4,637 |
) |
|
1,102 |
|
|
(4,543 |
) |
|
(3,441 |
) |
|
Interest-bearing demand notes issued to the U.S. Treasury |
|
|
-0- |
|
|
-0- |
|
|
-0- |
|
|
(1 |
) |
|
(14 |
) |
|
(15 |
) |
|
2 |
|
|
(36 |
) |
|
(34 |
) |
|
Federal funds purchased and securities repurchase agreements |
|
|
(11 |
) |
|
(134 |
) |
|
(145 |
) |
|
(50 |
) |
|
(283 |
) |
|
(333 |
) |
|
220 |
|
|
(1,019 |
) |
|
(799 |
) |
|
Advances from Federal Home Loan Bank |
|
|
(265 |
) |
|
(227 |
) |
|
(492 |
) |
|
402 |
|
|
(125 |
) |
|
277 |
|
|
532 |
|
|
(251 |
) |
|
281 |
|
|
Trust preferred securities |
|
|
-0- |
|
|
(278 |
) |
|
(278 |
) |
|
-0- |
|
|
-0- |
|
|
-0- |
|
|
-0- |
|
|
-0- |
|
|
-0- |
|
|
Note payable |
|
|
(49 |
) |
|
(48 |
) |
|
(97 |
) |
|
(551 |
) |
|
(32 |
) |
|
(583 |
) |
|
234 |
|
|
(343 |
) |
|
(109 |
) |
|
|
|
|
|
|
|
|
|
|
|
|
|
|
|
|
|
|
|
|
|
|
|
|
|
|
|
|
|
|
|
Total expense from interest-bearing liabilities |
|
|
(2,915 |
) |
|
(6,932 |
) |
|
(9,847 |
) |
|
2,351 |
|
|
(7,567 |
) |
|
(5,216 |
) |
|
2,409 |
|
|
(9,613 |
) |
|
(7,204 |
) |
|
|
|
|
|
|
|
|
|
|
|
|
|
|
|
|
|
|
|
|
|
|
|
|
|
|
|
|
|
|
|
|
|
|
|
|
|
|
|
|
|
|
|
|
|
|
|
|
|
|
|
|
|
|
|
|
|
|
|
|
|
Net difference |
|
$ |
(3,025 |
) |
$ |
4,949 |
|
$ |
1,924 |
|
$ |
2,102 |
|
$ |
1,684 |
|
$ |
3,786 |
|
$ |
2,230 |
|
$ |
2,148 |
|
$ |
4,378 |
|
|
|
|
|
|
|
|
|
|
|
|
|
|
|
|
|
|
|
|
|
|
|
|
|
|
|
|
|
|
|
|
|
|
|
(a) |
The change in interest due both to rate and volume has been allocated equally. |
|
|
|
|
(b) |
Interest income on non-taxable investment securities and non-taxable loans includes the effects of taxable-equivalent adjustments using a tax rate of 34% in adjusting interest on tax-exempt securities and tax-exempt loans to a taxable-equivalent basis. The amount of taxable-equivalent adjustments were $2,121 in 2010, $2,874 in 2009 and $2,218 in 2008. |
|
|
|
|
(c) |
Includes loan fees of $294 in 2010, $734 in 2009 and $996 in 2008. Interest income on loans includes the effect of taxable-equivalent adjustments for non-taxable loans using a tax rate of 34% in adjusting interest on tax-exempt loans to a taxable-equivalent basis. Includes non-accrual loans, with year-end balances of $72,404 in 2010, $42,593 in 2009 and $30,383 in 2008. |
Non-interest Income. Total non-interest income decreased in 2010 by $1,752, or 13.2%, to $11,492 from the 2009 total of $13,244. The largest decrease occurred due to a reduction in net gains realized from the sales of investment securities. The Corporation realized $722 in net gains from the sales of investment securities in 2010, compared to $1,781 in 2009, a decrease of $1,059 or 59.5%. This was largely due to the level of sales in 2009 of short-term securities to reposition cash flows in the portfolio. Service charges on deposits decreased by $266, or 6.7%, due largely to a decrease in the number of customer overdrafts. Trust and farm management fees decreased by $186, or 13.9%, due to a decline in estate settlement fees and a restructuring of fee levels. The remaining categories of non-interest income showed either slight increases or decreases over the prior year.
The following table provides non-interest income by category, total non-interest income and non-interest income to average total assets for the periods indicated:
|
|
|
|
|
|
|
|
|
|
|
|
|
|
|
For the Years ended December 31 |
|
|||||||
|
|
|
|
|
|||||||
|
|
|
2010 |
|
2009 |
|
2008 |
|
|||
|
|
|
|
|
|
|
|
|
|
|
|
|
Trust and farm management fees |
|
$ |
1,148 |
|
$ |
1,334 |
|
$ |
1,530 |
|
|
Service charges on deposit accounts |
|
|
3,695 |
|
|
3,961 |
|
|
4,408 |
|
|
Other service charges |
|
|
1,913 |
|
|
1,954 |
|
|
2,137 |
|
|
Gain on sales of securities available-for-sale |
|
|
722 |
|
|
1,781 |
|
|
405 |
|
|
Brokerage fee income |
|
|
754 |
|
|
857 |
|
|
913 |
|
|
Mortgage banking income |
|
|
2,273 |
|
|
2,277 |
|
|
1,069 |
|
|
Bank-owned life insurance income |
|
|
910 |
|
|
941 |
|
|
874 |
|
|
Other operating income |
|
|
77 |
|
|
139 |
|
|
257 |
|
|
|
|
|
|
|
|
|
|
|
|
|
|
Total non-interest income |
|
$ |
11,492 |
|
$ |
13,244 |
|
$ |
11,593 |
|
|
|
|
|
|
|
|
|
|
|
|
|
|
Non-interest income to average total assets |
|
|
0.99 |
% |
|
1.06 |
% |
|
1.05 |
% |
42
Total non-interest income increased in 2009 by $1,651, or 14.2%, to $13,244 from the 2008 total of $11,593. The Corporation recorded $1,781 in net gains from the sales of investment securities in 2009, compared to $405 in 2008, an increase of $1,376 or 339.8%. This was due largely to sales of shorter-term securities to reposition cash flows in the portfolio. Significant earnings improvement was seen in the category of mortgage banking income, which increased by $1,208 or 113.0%, due to increased loan production as well as servicing income from a larger portfolio. Service charges on deposits decreased by $447, (or 10.1%) due largely to a decrease in the number of overdrafts. The remaining categories of non-interest income showed either slight increases or decreases over the prior year.
Non-interest Expense. Total non-interest expense decreased to $37,153 in 2010 from $59,559 in 2009 (a decrease of $22,406 or 37.6%). This change was primarily the result of the goodwill impairment loss of $24,521 recorded in 2009. See Note 7 - “Goodwill” in the Notes to the Consolidated Financial Statements. Other real estate owned expense increased by $1,522, or 143.0%, from $1,064 in 2009 to $2,586 in 2010, due to an increase in the balance of other real estate owned property and an increase in losses on sales or writedowns of other real estate owned from 2009 to 2010. Loan collection expenses increased by $110, or 18.9%, from 2009 to 2010. The Corporation also incurred a write-down on a parcel of land held for sale of $110 in 2010. As a percentage of average total assets, non-interest expense declined to 3.21% in 2010 from 4.77% in 2009, due to 2009 including the goodwill impairment loss.
The following table provides non-interest expense and non-interest expense to average total assets for the periods indicated:
|
|
|
|
|
|
|
|
|
|
|
|
|
|
|
For the Years ended December 31 |
|
|||||||
|
|
|
|
|
|||||||
|
|
|
2010 |
|
2009 |
|
2008 |
|
|||
|
|
|
|
|
|
|
|
|
|||
|
Salaries and employee benefits |
|
$ |
18,211 |
|
$ |
18,011 |
|
$ |
17,692 |
|
|
Occupancy |
|
|
2,635 |
|
|
1,903 |
|
|
1,890 |
|
|
Equipment expense |
|
|
3,117 |
|
|
3,071 |
|
|
2,996 |
|
|
Federal insurance assessments |
|
|
2,519 |
|
|
2,584 |
|
|
845 |
|
|
Goodwill impairment losses |
|
|
-0- |
|
|
24.521 |
|
|
-0- |
|
|
Intangible assets amortization |
|
|
807 |
|
|
816 |
|
|
714 |
|
|
Data processing |
|
|
1,327 |
|
|
1,290 |
|
|
1,151 |
|
|
Marketing |
|
|
696 |
|
|
751 |
|
|
742 |
|
|
Postage |
|
|
537 |
|
|
544 |
|
|
547 |
|
|
Property taxes |
|
|
717 |
|
|
695 |
|
|
669 |
|
|
Supplies |
|
|
408 |
|
|
386 |
|
|
347 |
|
|
Other real estate owned expense |
|
|
2,586 |
|
|
1,064 |
|
|
203 |
|
|
Loan collection expenses |
|
|
691 |
|
|
581 |
|
|
218 |
|
|
Write-down of land held for sale |
|
|
110 |
|
|
-0- |
|
|
-0- |
|
|
Other operating expense |
|
|
2,792 |
|
|
3,342 |
|
|
3,109 |
|
|
|
|
|
|
|
|
|
|
|
|
|
|
Total non-interest expense |
|
$ |
37,153 |
|
$ |
59,559 |
|
$ |
31,123 |
|
|
|
|
|
|
|
|
|
|
|
|
|
|
Non-interest expense to average total assets |
|
|
3.21 |
% |
|
4.77 |
% |
|
2.81 |
% |
Total non-interest expense increased to $59,559 in 2009 from $31,123 in 2008 (an increase of $28,436 or 91.4%). The majority of the increase resulted from the goodwill impairment loss recorded in the fourth quarter, along with the increases in Federal deposit insurance assessments and other real estate owned expenses, which increased by $1,739 (205.8%) and $861 (424.1%), respectively. See Note 7 - “Goodwill” in the Notes to Consolidated Financial Statements. Federal insurance assessments increased to $2,584 in 2009 from $845 in 2008 due to the special assessment as well as an increase in the quarterly multiplier rate and an increase in the balance of deposit liabilities. Other real estate owned expenses increased to $1,064 in 2009 from $203 in 2008, due to an increase in the balance of other real estate owned property from 2008 to 2009. In addition, the categories of salaries and employee benefits and other operating expense increased by $319 (or 1.8%) and $233 (or 7.5%), respectively, from 2008 to 2009. Due primarily to the goodwill impairment loss, non-interest expense as a percentage of average total assets increased to 4.77% in 2009, compared to 2.81% in 2008. Without the goodwill impairment loss, non-interest expense as a percentage of average assets would have decreased slightly to 2.80% in 2009.
Income Taxes. The income tax benefit in 2010 was $11,904 and $1,600 in 2009, while income tax expense was $1,697 in 2008. The income tax benefit in 2010 was generated from a pre-tax loss of $(28,883), largely from loan charge-offs, coupled with tax-free income of $4,263 from tax-exempt loans, investments and bank-owned life insurance. In 2009, the income tax benefit was generated from lower pre-tax earnings of $1,795, without regard to the goodwill impairment loss, in conjunction with tax-free income of $6,237 from tax-exempt loans, investment securities and bank-owned life insurance. The effective tax rates were (41.2%), (8.9%) and 18.8% for the respective years then ended.
At year-end 2010, after weighing all positive and negative evidence, the Corporation concluded that it was more than likely than not that the deferred tax asset would be realized, and no valuation allowance was required. Management concluded that the positive weight of its historic profitability prior to the current economic environment and the non-recurring goodwill impairment loss in 2009, and management’s projections that sufficient taxable income would be generated within the carryforward periods allowed by current federal and state tax regulations, was greater than the negative weight represented by issues concerning the Corporation’s asset quality in the current economic environment.
43
Management’s Discussion and Analysis of
Financial Condition and Results of Operations (Continued)
(dollar amounts in thousands except share data)
Analysis of Financial Condition
Loans. The Corporation’s loan portfolio largely reflects the profile of the communities in which it operates. The Corporation essentially offers four types of loans: commercial, agricultural, real estate and consumer installment. The Corporation has no foreign loans. The following table summarizes the Corporation’s loan portfolio:
|
|
|
|
|
|
|
|
|
|
|
|
|
|
|
|
|
|
|
|
|
|
|
|
|
|
|
|
|
|
|
|
|
|
|
|
December 31 |
|
||||||||||||||||||||||||||||
|
|
|
|
|
||||||||||||||||||||||||||||
|
|
|
2010 |
|
2009 |
|
2008 |
|
2007 |
|
2006 |
|
||||||||||||||||||||
|
|
|
Amount |
|
% of |
|
Amount |
|
% of |
|
Amount |
|
% of |
|
Amount |
|
% of |
|
Amount |
|
% of |
|
||||||||||
|
|
|
|
|
|
|
|
|
|
|
|
|
|
|
|
|
|
|
|
|
|
|
||||||||||
|
|
|||||||||||||||||||||||||||||||
|
Commercial |
|
$ |
138,325 |
|
|
19.6 |
% |
$ |
163,761 |
|
|
20.5 |
% |
$ |
151,520 |
|
|
19.1 |
% |
$ |
113,359 |
|
|
15.6 |
% |
$ |
90,186 |
|
14.3 |
% |
|
|
Agricultural |
|
|
78,086 |
|
|
11.1 |
|
|
77,060 |
|
|
9.7 |
|
|
79,536 |
|
|
10.1 |
|
|
85,571 |
|
|
11.8 |
|
|
83,610 |
|
13.3 |
|
|
|
Agricultural real estate |
|
|
46,361 |
|
|
6.6 |
|
|
61,348 |
|
|
7.7 |
|
|
64,212 |
|
|
8.1 |
|
|
61,158 |
|
|
8.4 |
|
|
61,511 |
|
9.8 |
|
|
|
Commercial real estate |
|
|
205,301 |
|
|
29.2 |
|
|
214,767 |
|
|
26.9 |
|
|
197,215 |
|
|
24.9 |
|
|
172,866 |
|
|
23.9 |
|
|
140,687 |
|
22.3 |
|
|
|
Commercial real estate development |
|
|
88,402 |
|
|
12.6 |
|
|
102,633 |
|
|
12.9 |
|
|
107,526 |
|
|
13.6 |
|
|
107,499 |
|
|
14.8 |
|
|
91,754 |
|
14.6 |
|
|
|
Residential real estate |
|
|
90,869 |
|
|
12.9 |
|
|
108,096 |
|
|
13.5 |
|
|
115,703 |
|
|
14.6 |
|
|
111,848 |
|
|
15.4 |
|
|
105,652 |
|
16.8 |
|
|
|
|
|
|
|
|
|
|
|
|
|
|
|
|
|
|
|
|
|
|
|
|
|
|
|
|
|
|
|
|
|
|
|
|
Total Real Estate |
|
|
430,933 |
|
|
61.2 |
|
|
486,844 |
|
|
61.0 |
|
|
484,657 |
|
|
61.3 |
|
|
453,371 |
|
|
62.6 |
|
|
399,604 |
|
63.4 |
|
|
|
|
|
|
|
|
|
|
|
|
|
|
|
|
|
|
|
|
|
|
|
|
|
|
|
|
|
|
|
|
|
|
|
|
Consumer |
|
|
56,730 |
|
|
8.1 |
|
|
70,409 |
|
|
8.8 |
|
|
75,125 |
|
|
9.5 |
|
|
72,346 |
|
|
10.0 |
|
|
56,071 |
|
8.9 |
|
|
|
|
|
|
|
|
|
|
|
|
|
|
|
|
|
|
|
|
|
|
|
|
|
|
|
|
|
|
|
|
|
|
|
|
Total loans |
|
$ |
704,074 |
|
|
100.0 |
% |
$ |
798,074 |
|
|
100.0 |
% |
$ |
790,837 |
|
|
100.0 |
% |
$ |
722,647 |
|
|
100.0 |
% |
$ |
629,472 |
|
100.0 |
% |
|
|
|
|
|
|
|
|
|
|
|
|
|
|
|
|
|
|
|
|
|
|
|
|
|
|
|
|
|
|
|
|
|
|
|
|
|
|
|
|
|
|
|
|
|
|
|
|
|
|
|
|
|
|
|
|
|
|
|
|
|
|
|
|
|
|
|
|
Total assets |
|
$ |
1,096,471 |
|
|
|
|
$ |
1,261,338 |
|
|
|
|
$ |
1,163,130 |
|
|
|
|
$ |
1,080,702 |
|
|
|
|
$ |
1,031,959 |
|
|
|
|
|
Loans to total assets |
|
|
|
|
|
64.2 |
% |
|
|
|
|
63.3 |
% |
|
|
|
|
68.0 |
% |
|
|
|
|
67.1 |
% |
|
|
|
61.0 |
% |
|
Total loans decreased $94,000 (or 11.8%) in 2010 as compared to an increase of $7,237 (or 0.9%) in 2009. There were no acquisitions in 2010. The decrease reflects the Corporation’s 2010 capital management objectives, as well as the dual effects of the present economic environment in which business and consumer borrowers have reduced demand and capacity for new indebtedness and borrower financial deterioration resulting in a higher level of loans charged off and transferred to other real estate owned.
Commercial loans decreased $25,436 (or 18.4%) in 2010, which compares to an increase of $12,241 (or 8.1%) in 2009. The competitive environment has lessened as many financial institutions are restricting lending activities.
Loans to agricultural operations increased $1,026 (or 1.3%) in 2010, which compared to a decrease of $2,476 (or 3.1%) in 2009. Short-term agricultural loans are seasonal in nature with paydown from grain sales occurring near the beginning and end of each year. Rapid growth in the bio-fuels industry (primarily ethanol) and rising worldwide food demand have dramatically influenced corn prices since the latter part of 2006. Rising corn prices have influenced soybean prices as the two commodities compete for planted acreage. Corn and soybeans are the two primary crops of the Corporation’s market area. Selling prices were again strong in 2010, particularly the second half of the year, resulting in another year of high profitability for most of the Corporation’s agricultural customers. The balance sheet of local agriculture remains strong, both in terms of equity and liquidity. Agriculture remains the largest single loan industry concentration of the Corporation. The highly experienced agricultural staff continues to effectively manage risk and seek opportunities in this portfolio. Agricultural loans as a percentage of total loans were 11.1% at year-end 2010, compared to 9.7% at year-end 2009.
Total real estate loans decreased $55,911 (or 11.5%) in 2010 compared to an increase of $2,187 (or 0.5%) in 2009. Residential real estate loans with fixed rates of more than 5 years are generally sold into the secondary market. The Corporation retains the servicing of sold loans, maintaining the local relationship with customers and generating servicing fee income. With home mortgage rates in 2010 at their lowest level in over 50 years, many borrowers refinanced adjustable rate loans into fixed rate loans that were sold. Total home mortgage closings were $130,000 in 2010, $45,000 below the record level of $175,000 in 2009.
Consumer installment loans decreased $13,679 (or 19.4%) in 2010 from 2009. This follows a decrease of $4,716 (or 6.3%) in 2009. Home equity lending comprises over two thirds of the installment portfolio.
Although the risk of non-payment for any reason exists with respect to all loans, certain other more specific risks are associated with each type of loan. The primary risks associated with commercial loans are quality of the borrower’s management and the impact of national economic factors. Development and construction loans have primary risks associated with demand for housing and other construction projects. As these businesses are capital intensive, when demand for product weakens, revenues are reduced while fixed costs such as debt service remain. With respect to agricultural loans, the primary risks are weather and, like commercial loans, the quality of the borrower’s management. Risks associated with real estate loans include concentrations of loans in a loan type, such as commercial or agricultural, and fluctuating land values. Non-owner occupied commercial real estate loans have risks related to occupancy and lease rates during economic downturns. Installment loans also have risks associated with concentrations of loans in a single type of loan. Installment loans additionally carry the risk of a borrower’s unemployment as a result of deteriorating economic conditions. With the exception of agricultural lending, the current economic environment has increased the risk level in the subsidiary bank’s loan portfolio.
The Corporation’s strategy with respect to addressing and managing these types of risks, whether loan demand is weak or strong, is for the subsidiary bank to follow its loan policies and sound underwriting practices, which include: (i) granting loans on a sound and collectible basis, (ii) investing funds profitably for the benefit of the stockholders and the protection of depositors, (iii) serving the legitimate needs of the community and the subsidiary bank’s general market area while obtaining a balance between maximum yield and minimum risk, (iv) ensuring that primary and secondary sources of repayment are adequate in relation to the amount of the loan, (v) administering loan policies through a Directors’ Loan Committee, an Executive Loan Committee and Officer approvals, (vi) developing and maintaining adequate diversification of the loan portfolio as a whole and of the loans within each loan category and (vii) ensuring that each loan is properly documented and, if appropriate, secured or guaranteed by government agencies, and that insurance coverage is adequate, especially with respect to certain agricultural loans because of the risk of poor weather. In the present difficult economic environment, bank staff actively work with borrowers to achieve the best resolutions possible.
44
Non-performing Loans and Other Real Estate Owned. Non-performing loans consist of non-accrual loans, loans past due 90 days on which interest is still accruing, and loans modified in troubled debt restructurings (restructured loans). Non-performing loans amounted to 13.83% of total loans at year-end 2010 compared to 7.35% at year-end 2009. The increase reflects a higher level of stress in the commercial real estate industry. The primary components of the non-accrual total are in two industries. One is the commercial real estate development industry, primarily in the Corporation’s northern and eastern market areas. Non-performing commercial real estate development loans comprise approximately 46.4% of the Corporation’s total non-performing loans as of December 31, 2010. Due to dramatic declines in residential real estate sales activity, certain builders and developers have encountered difficulty in servicing their debt, eventually leading to non-performing status. The other primary component of non-performing loans is commercial real estate loans, which comprise approximately 31.9% of the year-end 2010 non-performing total. These are comprised of owner-occupied facilities and leased facilities and are located throughout the Corporation’s market area. The balance of non-performing loans is comprised primarily of residential real estate and home equity credits. The Corporation has been proactive in obtaining updated appraisals for non-performing loans secured by real estate. The continued downward pressure on real estate values, particularly development properties, has prompted charge-offs and the recording of specific reserves for potential loss on loans secured by real estate. Management believes this situation has peaked at year-end 2010.
Restructured loans at the end of 2010 were $23,386 compared to $13,941 at year-end 2009. These are loans to borrowers that are experiencing varying levels of financial stress but are expected to recover. To assist the borrowers, the Corporation has provided some concession in loan terms, most commonly extending the loan amortization or adjusting the interest rate. In the present economic environment, the vast majority of non-performing loans are secured by real estate. At the time a loan is restructured, the Corporation considers the repayment history of the loan and the value of the collateral. If the principal or interest is due and has remained unpaid for 90 days of more and the loan is not well-secured, the loan is placed on nonaccrual status. If the principal and interest payments are current and the loan is well-secured, the restructured loan continues to accrue interest. Once a loan is placed on nonaccrual status, the borrower is required to make current principal and interest payments based on the modified terms for a period of at least 6 months before returning the loan to accrual status.
As of December 31, 2010 and 2009, $14,368 and $5,084, respectively, in restructured loans were in accrual status. When the loan is restructured, the Loan Officer is required to document the basis for the restructure, obtain current and complete credit and cash flow information and identify a specific repayment plan that would retire the debt. This information is provided to the Credit Analysis department which prepares a thorough credit presentation. The credit presentation includes the modified terms of the loan, a collateral analysis and a cash flow analysis based on the modified terms of the loan. The credit presentation is presented to the Directors’ Loan Committee for approval.
Problem credits are closely monitored by the lending staff, credit administration division and special assets group, which was newly formed in 2010. In addition, an independent loan review staff provides further assistance in identifying problem situations. Loans over 90 days past due are normally either charged off or placed on a non-accrual status. Problem credits have a life cycle. They either improve or they move through a workout/liquidation process. The workout process often includes reclassification to non-accrual status, unless the loan is well secured and in the process of collection. Collateral securing non-accrual real estate loans that are not resolved by borrowers becomes other real estate owned via foreclosure or receipt of a deed in lieu of foreclosure. The Corporation actively markets other real estate owned properties for sale.
The Corporation formed a special assets group in 2010 to focus on the management of the other real estate owned workout process. Total other real estate owned as of December 31, 2010 was $20,652. The Corporation had $17,658 in other real estate owned as of December 31, 2009. Over 40% of the December 31, 2010 total is one industrial development property located in the Corporation’s northern region. The Corporation is actively marketing the property by parcel or as a bulk sale. Most of all improvements are complete on the property. Two distribution centers are presently located in the industrial park. Additional roadways may be built depending on how end users choose parcel configuration. A third distribution center is under construction as of December 31, 2010 on a portion of the parcel that was sold in 2010. The selling price per acre was significantly above the Corporation’s carrying value of the property. As with non-performing loans, the Corporation is proactive in obtaining appraisals to support the carrying value of other real estate owned property on the Consolidated Balance Sheets. The following table provides information on the Corporation’s non-performing loans and other real estate owned since 2006:
|
|
|
|
|
|
|
|
|
|
|
|
|
|
|
|
|
|
|
|
|
December 31 |
|
|||||||||||||
|
|
|
|
|
|||||||||||||
|
|
|
2010 |
|
2009 |
|
2008 |
|
2007 |
|
2006 |
|
|||||
|
Non-accrual |
|
$ |
72,404 |
|
$ |
42,593 |
|
$ |
30,383 |
|
$ |
7,361 |
|
$ |
3,893 |
|
|
90 days past due and accruing |
|
|
1,561 |
|
|
2,087 |
|
|
2,655 |
|
|
73 |
|
|
33 |
|
|
Restructured |
|
|
23,386 |
|
|
13,941 |
|
|
-0- |
|
|
-0- |
|
|
-0- |
|
|
|
|
|
|
|
|
|
|
|
|
|
|
|
|
|
|
|
|
Total non-performing loans |
|
$ |
97,351 |
|
$ |
58,621 |
|
$ |
33,038 |
|
$ |
7,434 |
|
$ |
3,926 |
|
|
Other real estate owned |
|
|
20,652 |
|
|
17,658 |
|
|
2,487 |
|
|
833 |
|
|
-0- |
|
|
Total non-performing assets |
|
$ |
118,003 |
|
$ |
76,279 |
|
$ |
35,525 |
|
$ |
8,267 |
|
$ |
3,926 |
|
|
|
|
|
|
|
|
|
|
|
|
|
|
|
|
|
|
|
|
|
|
|
|
|
|
|
|
|
|
|
|
|
|
|
|
|
|
Non-performing loans to total loans (net of unearned interest) |
|
|
13.83 |
% |
|
7.35 |
% |
|
4.18 |
% |
|
1.03 |
% |
|
0.62 |
% |
|
Non-performing assets to total assets |
|
|
10.76 |
% |
|
6.05 |
% |
|
3.05 |
% |
|
0.76 |
% |
|
0.38 |
% |
Impaired loans consist of non-accrual loans, loans past due 90 days on which interest is still accruing and restructured loans. Of the $97,351 in impaired loans at December 31, 2010, the Corporation relied on third party appraisals for $96,726 of the impaired loans. Approximately, $82,946 or 85.29% of the impaired loans had current third party appraisals which were relied upon. These appraisals were completed within 12 months of December 31, 2010. The appraisals for the remaining $14,405 in impaired loans in which third party appraisals were obtained had not been updated as the fair value in the last appraisal received and the current estimated value were in significant excess of the outstanding debt. The average loan to fair value for the $14,405 was approximately 73.9%. Collateral values which are not based on current appraisals are discounted 10% to 20% in the collateral evaluation in addition to the already required 10% discount. The initial 10% discount is due to the anticipated selling costs of the collateral. The additional discount is based on several factors. These factors include the Loan Officer’s review of the collateral and its current condition, the Corporation’s knowledge of the current economic environment in the collateral’s market, and the Corporation’s past experience with real estate in the area. The date of the appraisal is also considered in conjunction with the economic environment and the decline in the real estate market since the appraisal was obtained. The increase in the general reserve portion of the allowance for loan losses, which was significantly impacted by the increased level of fourth quarter 2010 loan losses, is adequate to provide for the potential exposure on loans with non-current appraisals.
45
Management’s Discussion and Analysis of
Financial Condition and Results of Operations(Continued)
(dollar amounts in thousands except share data)
The following table provides a loan-to-value ratio distribution for the $14,405 in impaired loans with appraisals over twelve months old as of December 31, 2010:
|
|
|
|
|
|
|
|
Loan-to-Value |
|
Amount |
|
||
|
0 - 50 |
% |
|
$ |
880 |
|
|
50 - 60 |
% |
|
|
348 |
|
|
60 - 70 |
% |
|
|
3,291 |
|
|
70 - 80 |
% |
|
|
554 |
|
|
80 - 90 |
% |
|
|
7,262 |
|
|
90 |
%+ |
|
$ |
2,070 |
|
Once a loan is deemed an impaired loan, the Loan Officer completes a Problem Asset Workout Summary, which includes a detailed review of the collateral. If the estimated current collateral value is in significant excess of the outstanding debt, a new appraisal is not ordered. If the collateral value is not in significant excess of the outstanding debt, the Loan Officer will determine if a new appraisal should be ordered based on their knowledge of the current market in the collateral’s area. If the Corporation determines that full collection of the principal of the debt owed is not likely, a new appraisal is ordered. If the estimated fair value represented in the new appraisal is less than the outstanding debt, a charge-off is recorded equal to the difference between the discounted collateral value and the outstanding debt.
The determination of a specific allowance or charge-off is reviewed by the Corporation on a monthly basis. During 2010, the Corporation recorded partial charge-offs totaling $13,097 of the impaired loans with an outstanding balance of $23,155. The charge-offs were considered warranted as the loans were considered collateral dependent and the discounted collateral value was not sufficient to cover the outstanding debt.
Through December 31, 2009, there were charge-offs of $1,221 on impaired loans of $5,679 out of the total impaired loans of $44,116 as of December 31, 2009. Specific valuation allowances of $234 were recorded on the $5,679 of impaired loans as of December 31, 2009 and $3,007 was charged off on these loans in 2010. On the total impaired loans of $44,116 as of December 31, 2009, $10,267 has been charged off in 2010. Therefore, through December 31, 2010, the total amount of charge-offs on the December 31, 2009 impaired loans was $11,488. The charge-offs were based on the fair values in the most recently obtained independent appraisals. The fair values in the appraisals on impaired loans were discounted by 10% to 20% to obtain the estimated value based on the Loan Officer’s review of the collateral and its current condition, the Corporation’s knowledge of the current economic environment and the Corporation’s past experience with real estate in the area. The date of the appraisal is also considered in conjunction with the economic environment and the decline in the real estate market since the appraisal was obtained. This was in addition to the 10% discount on the collateral as already required by the Corporation. The fair value from the appraisal was discounted to determine a reasonable amount that would be received in the liquidation of the collateral.
The Corporation requires appraisals on real estate if the loan is over $250,000 or if the collateral is commercial real estate at the time of origination of the loan. If the appraisal is not within one year of the reporting period, the loan officer provides an additional discount on the collateral based on the Loan Officer’s review of the collateral and its current condition, the Corporation’s knowledge of the current economic environment in the collateral’s market and the Corporation’s past experience with real estate in the area. The date of the appraisal is also considered in conjunction with the economic environment and the decline in the real estate market since the appraisal was obtained. This additional discount is usually 10% to 20%. If the loan is below $250,000 and is not commercial real estate, an internal valuation of the collateral may be used, but must be completed by a staff member who has no involvement in the credit decision. Underlying collateral consisting of vehicles, equipment or other assets is valued using information provided by the borrower. The Loan Officer must confirm the existence of the assets and provide adequate discounts on the value of the collateral when determining its adequacy to cover the loan.
Problem Asset Workout Summaries are reviewed by the Risk Management department and utilized in the preparation of the allowance for loan losses calculation. Summaries include a collateral analysis detailing a description of the collateral, the date of the appraisal and the discounts on the collateral. If the discounted collateral is sufficient to cover the outstanding loan balance, no specific valuation allowance is placed on the loan.
46
Allowance for Possible Loan Losses. The allowance shown in the following table represents the allowance available to absorb losses within the entire portfolio:
|
|
|
|
|
|
|
|
|
|
|
|
|
|
|
|
|
|
|
|
|
For the Years Ended December 31 |
|
|||||||||||||
|
|
|
|
|
|||||||||||||
|
|
|
2010 |
|
2009 |
|
2008 |
|
2007 |
|
2006 |
|
|||||
|
Amount of loans outstanding at end of year (net of unearned interest) |
|
$ |
704,074 |
|
$ |
798,074 |
|
$ |
790,837 |
|
$ |
722,647 |
|
$ |
629,472 |
|
|
Average amount of loans outstanding for the year (net of unearned interest) |
|
$ |
687,177 |
|
$ |
743,887 |
|
$ |
734,672 |
|
$ |
666,853 |
|
$ |
585,382 |
|
|
Allowance for loan losses at beginning of year |
|
$ |
12,075 |
|
$ |
5,064 |
|
$ |
3,248 |
|
$ |
3,053 |
|
$ |
3,109 |
|
|
Charge-offs: |
|
|
|
|
|
|
|
|
|
|
|
|
|
|
|
|
|
Agricultural |
|
|
68 |
|
|
21 |
|
|
-0- |
|
|
-0- |
|
|
162 |
|
|
Commercial |
|
|
19,525 |
|
|
2,516 |
|
|
797 |
|
|
373 |
|
|
227 |
|
|
Real estate-mortgage |
|
|
2,266 |
|
|
511 |
|
|
91 |
|
|
2 |
|
|
21 |
|
|
Installment |
|
|
1,307 |
|
|
1,208 |
|
|
446 |
|
|
269 |
|
|
194 |
|
|
|
|
|
|
|
|
|
|
|
|
|
|
|
|
|
|
|
|
Total charge-offs |
|
|
23,166 |
|
|
4,256 |
|
|
1,334 |
|
|
664 |
|
|
604 |
|
|
|
|
|
|
|
|
|
|
|
|
|
|
|
|
|
|
|
|
|
|
|
|
|
|
|
|
|
|
|
|
|
|
|
|
|
|
Recoveries: |
|
|
|
|
|
|
|
|
|
|
|
|
|
|
|
|
|
Agricultural |
|
|
-0- |
|
|
-0- |
|
|
-0- |
|
|
1 |
|
|
-0- |
|
|
Commercial |
|
|
45 |
|
|
42 |
|
|
37 |
|
|
29 |
|
|
90 |
|
|
Real estate-mortgage |
|
|
-0- |
|
|
-0- |
|
|
-0- |
|
|
17 |
|
|
5 |
|
|
Installment |
|
|
222 |
|
|
163 |
|
|
145 |
|
|
172 |
|
|
168 |
|
|
|
|
|
|
|
|
|
|
|
|
|
|
|
|
|
|
|
|
Total recoveries |
|
|
267 |
|
|
205 |
|
|
182 |
|
|
219 |
|
|
263 |
|
|
|
|
|
|
|
|
|
|
|
|
|
|
|
|
|
|
|
|
Net loans charged off |
|
|
22,899 |
|
|
4,051 |
|
|
1,152 |
|
|
445 |
|
|
341 |
|
|
Provision for loan losses |
|
|
40,550 |
|
|
11,062 |
|
|
2,968 |
|
|
640 |
|
|
285 |
|
|
|
|
|
|
|
|
|
|
|
|
|
|
|
|
|
|
|
|
Allowance for loan losses at end of year |
|
$ |
29,726 |
|
$ |
12,075 |
|
$ |
5,064 |
|
$ |
3,248 |
|
$ |
3,053 |
|
|
|
|
|
|
|
|
|
|
|
|
|
|
|
|
|
|
|
|
Net loans charged off to average loans |
|
|
3.33 |
% |
|
0.54 |
% |
|
0.16 |
% |
|
0.07 |
% |
|
0.06 |
% |
|
Allowance for loan losses to non-performing loans |
|
|
30.53 |
% |
|
20.60 |
% |
|
15.33 |
% |
|
43.69 |
% |
|
77.76 |
% |
|
Allowance for loan losses to total loans at end of year (net of unearned interest) |
|
|
4.22 |
% |
|
1.51 |
% |
|
0.64 |
% |
|
0.45 |
% |
|
0.49 |
% |
The allowance for loan losses is considered by management to be a critical accounting policy. The allowance for loan losses is increased by provisions charged to operating expense and decreased by charge-offs, net of recoveries. The allowance is based on factors that include the overall composition of the loan portfolio, types of loans, past loss experience, loan delinquencies, potential substandard and doubtful loans, and such other factors that, in management’s best judgment, deserve evaluation in estimating possible loan losses. The adequacy of the allowance for possible loan losses is monitored monthly during the ongoing, systematic review of the loan portfolio by the Loan Review staff of the Risk Management Department, Senior Lending Officers, Chief Credit Officer, Chief Operating Officer, Chief Financial Officer, Risk Manager and Chief Executive Officer of the subsidiary bank. The results of these reviews are reported to the Board of Directors of the subsidiary bank on a monthly basis. Monitoring and addressing problem loan situations are primarily the responsibility of the subsidiary bank’s staff, management and its Board of Directors.
More specifically, the Corporation calculates the appropriate level of the allowance for loan losses on a monthly basis using base charge-offs for each loan type, substandard loans and potential losses with respect to specific loans. In addition to management’s assessment of the portfolio, the Corporation and the subsidiary bank are examined periodically by regulatory agencies. Although the regulatory agencies do not determine whether the subsidiary bank’s allowance for loan losses is adequate, such agencies do review the procedures and policies followed by management of the subsidiary bank in establishing the allowance.
Given the current state of the economy, management has assessed the impact of the recession on each category of loans and adjusted historical loss factors for more recent economic trends. Management utilizes a twelve quarter history as one component in assessing the probability of inherent future losses, while including additional weighting of the most recent historical data. Given the decline in economic conditions over the past year, management has also increased its allocation to various loan categories for economic factors. Some of the economic factors include the potential for reduced cash flow for commercial operating loans from reduction in sales or increased operating costs, decreased occupancy rates for commercial buildings, reduced levels of home sales for commercial and land developments, reduced values in real estate or other collateral, the decline in and uncertainty regarding grain prices and increased operating costs for farmers, and increased levels of unemployment and bankruptcy impacting consumers’ ability to pay. Each of these economic uncertainties was taken into consideration in developing the appropriate level of reserve.
The Corporation’s allowance for loan losses has two components. The first component is based upon individual review of nonperforming, substandard or other loans identified as a risk for loss and deemed impaired. This includes our nonperforming loans, which consist of nonaccrual loans, loans past due over 90 days and troubled debt restructurings, loans designated as impaired as defined by accounting and regulatory guidance and loans evaluated for potential loss on an individual basis.
The second component is based upon expected, but unidentified, losses inherent in our loan portfolio. The second component is determined utilizing the Corporation’s most recent twelve quarter net charge-off history which is then adjusted for qualitative and quantitative factors. These reserve percentages are reviewed on a quarterly basis by an Allowance Review Committee which is comprised of members of management, including lending, accounting and risk management. The qualitative and quantitative factors considered include economic conditions, changes in underwriting practices, changes in the value of collateral, changes in the portfolio volume, staff experience, past due and nonaccrual loans, loan review oversight, concentrations of loans and competition.
The allowance for loan losses of $29,726 and $12,075, respectively, was 4.22% and 1.51% of total loans as of December 31, 2010 and December 31, 2009. The Corporation’s net losses as a percentage of loans was 3.33% and 0.54% for the years ended 2010 and 2009, respectively. The Corporation’s net losses experienced and the level of the required allowance for loan losses continue to grow due to the continued deterioration in the economic environment, especially relative to commercial real estate and commercial real estate development loans in its northern and eastern markets in Grundy, Kane and DuPage counties.
47
Management’s Discussion and Analysis of
Financial Condition and Results of Operations (Continued)
(dollar amounts in thousands except share data)
During the fourth quarter of 2010, $16,076 in loan charge-offs were recorded due to the receipt of updated appraisals reflecting the current deterioration in the collateral value of commercial real estate and commercial real estate development properties primarily in the northern and eastern markets. In estimating the adequacy of the allowance for loan losses, management utilizes a twelve-quarter loan loss history as one component in assessing the probability of inherent future losses, while including higher weighting of the most recent data. Thus, fourth quarter 2010 loan charge-offs increased the historical losses contained in the twelve quarter loan loss history and significantly increased the general reserve portion of the allowance for loan losses. These charge-offs, combined with the continued credit deterioration in the northern and eastern markets, resulted in the large fourth quarter provision for loan losses, resulting in a total of $40,550 provision for loan losses for 2010. In conjunction with recorded charge-offs and recoveries for 2010, this resulted in an increase in the ratio of the allowance for loan losses to loans net of unearned interest as of December 31, 2010 to 4.22% compared to 1.51% as of December 31, 2009.
The allowance for loan losses as a percentage of non-performing loans has increased from 20.6% as of December 31, 2009 to 30.5% as of December 31, 2010. The allowance for loan losses calculation takes into consideration continuing economic declines and resulting increases in non-performing loans in the quantitative and qualitative factors used to adjust the reserve percentages on loans not specifically reserved for in the calculation.
There are $12,245 in specific loan loss reserves for the non-performing loans as of December 31, 2010, compared to $4,472 one year ago. Although non-performing loans have increased, the balance is comprised of loans that management believes will not result in significant additional losses not reserved in the allowance for loan losses as of December 31, 2010. Management considers the allowance for loan losses adequate to meet probable losses as of December 31, 2010.
Investment Securities. The objective of the investment portfolio is to provide the subsidiary bank with an adequate source of earnings and liquidity. The following table provides information on the carrying value of investment securities as of the dates indicated:
|
|
|
|
|
|
|
|
|
|
|
|
December 31 |
|
||||
|
|
|
|
|
||||
|
|
|
|
2010 |
|
|
2009 |
|
|
|
|
|
|
|
|
|
|
|
United States Government and federal agency and U.S. Government sponsored enterprises (GSEs) |
|
$ |
78,203 |
|
$ |
96,313 |
|
|
State and Municipal |
|
|
127,841 |
|
|
132,871 |
|
|
Collateralized mortgage obligations: |
|
|
|
|
|
|
|
|
GSE Residential |
|
|
54,895 |
|
|
72,083 |
|
|
|
|
|
|
|
|
|
|
|
Total |
|
$ |
260,939 |
|
$ |
301,267 |
|
|
|
|
|
|
|
|
|
|
Investment securities totaled $260,939 on December 31, 2010, a decrease of $40,328 (or 13.4%) from the December 31, 2009 total of $301,267. The decrease was due to securities sold to meet funding requirements due to the redemption of higher-cost public deposits. These term deposits were redeemed as part of a general strategy to shrink the asset size of the Bank, thereby improving capital ratios. Each category of securities decreased, but the majority of the decrease was in the U.S. Government Agency and GSE securities category and collateralized mortgage obligations. Because the reduction of the municipal bond category was less, this caused the investment mix of the overall portfolio to shift higher in relation to the percentage of municipal bonds. U.S. Government Agencies and GSEs declined to 30.0% of the total portfolio in 2010, down from 32.0% in 2009, and collateralized mortgage obligations decreased to 21.0%, down from 24.2% in 2009. Municipal bond holdings increased in 2010 from 44.1% in 2009 to 49.0%. A portion of this change occurred due to continued value created in the tax-free market and purchases of taxable municipal bonds arising out of the continued issuance of Build America Bonds. Certain investment restructuring strategies executed during the year to improve the overall performance of the portfolio resulted in the repositioning of cash flows and the capture of $722 of gains on shorter-term securities. There were no positions in Fannie Mae or Freddie Mac preferred stock, collateralized deposit obligations, asset-backed securities or sub-prime mortgage securities held in the securities portfolio in 2010, 2009 or 2008.
Investment securities totaled $301,267 on December 31, 2009, an increase of $50,152 (or 20.0%) from the December 31, 2008 total of $251,115. The increase was due to securities purchased to meet pledging requirements for new deposits, as well as the investment of excess liquidity from deposit growth with a lack of loan demand. Every category of securities increased, but the investment mix changed only slightly. U.S. Government Agencies and mortgage-backed securities decreased to 55.9% of the total portfolio, down from 58.6% a year ago. Municipal bond holdings increased from 41.4% to 44.1%. This change occurred due to the tightening of yield spreads in the agency market, the value created in the tax-free market, and increased purchases of taxable municipal bonds arising out of the new issuance of Build America Bonds. Several investment restructuring strategies executed during the year to improve the overall performance of the portfolio resulted in the repositioning of cash flows and the capture of $1,781 of gains on short-term securities. It should also be noted that the investment portfolio has never contained any sub-prime mortgage securities, nor any Fannie Mae or Freddie Mac preferred stock.
Deposits. Total deposits decreased in 2010 by approximately $112,578, a 10.5% reduction from 2009. Time deposits were $130,262 lower, a 26.2% decrease from the prior year, largely due to a restructuring of the balance sheet, including redemption of higher rate public deposits. Interest-bearing demand accounts increased $8,502, a 2.3% increase from 2009. Non-interest bearing demand accounts showed an increase of $2,657, or 1.95%, from 2009. Savings accounts represented an increase of $6,525 or 9.6%, due to customers moving to fixed rate investments. The average rate for overall deposits decreased 0.71% in 2010 as a result of certificates of deposit maturing and repricing as well as liquid accounts pricing lowering. These deposit balance changes reflect a continuing trend of customers shifting deposits to FDIC-insured investments over the last several years. We have experienced growth in many of the markets served by the subsidiary bank and continue to have no brokered deposits other than $16,196 of CDARS relationships.
Over the last three years, the subsidiary bank has seen deposits increase 8.0%. The increase in consumer deposits reflects our continued focus on investing in offices in high growth areas and continued emphasis on officers calling on customers and potential customers through our officer call program to develop core deposit relationships. This growth also reflects the well-trained staff that looks to assist customers by identifying needs and providing sound solutions. There continues to be considerable interest in alternative delivery mechanisms, such as electronic methods which include ATMs, Internet Banking with Bill Payment, Remote Deposit Capture and Telebanker as a convenient means for customers to better manage their money, maximize return and have peace of mind by dealing safely and securely with only one financial institution. Due to the diversity within our various market areas, such delivery mechanisms provide a solid foundation for continued future growth.
48
The following table sets forth the classification of deposits with year-end balances and the average rates paid for the periods indicated.
|
|
|
|
|
|
|
|
|
|
|
|
|
|
|
|
|
|
|
|
|
|
|
|
For the Years Ended December 31 |
|
||||||||||||||||
|
|
|
|
|
||||||||||||||||
|
|
|
2010 |
|
2009 |
|
2008 |
|
||||||||||||
|
|
|
Balance |
|
Rate |
|
Balance |
|
Rate |
|
Balance |
|
Rate |
|
||||||
|
|
|
|
|
|
|
|
|
|
|
|
|
|
|
||||||
|
Non-interest bearing demand |
|
$ |
138,683 |
|
n/a |
|
|
$ |
136,026 |
|
n/a |
|
|
$ |
110,559 |
|
n/a |
|
|
|
Interest-bearing demand |
|
|
383,126 |
|
0.79 |
% |
|
|
374,624 |
|
1.24 |
% |
|
|
246,714 |
|
1.44 |
% |
|
|
Savings |
|
|
74,817 |
|
0.08 |
|
|
|
68,292 |
|
0.08 |
|
|
|
61,089 |
|
0.11 |
|
|
|
Time deposits |
|
|
366,335 |
|
1.77 |
|
|
|
496,597 |
|
2.74 |
|
|
|
543,770 |
|
3.96 |
|
|
|
|
|
|
|
|
|
|
|
|
|
|
|
|
|
|
|
|
|
|
|
|
Total |
|
$ |
962,961 |
|
0.99 |
% |
|
$ |
1,075,539 |
|
1.70 |
% |
|
$ |
962,132 |
|
2.61 |
% |
|
|
|
|
|
|
|
|
|
|
|
|
|
|
|
|
|
|
|
|
|
|
The following table summarizes time deposits in amounts of $100 or more by time remaining until maturity as of December 31, 2010. These time deposits are made by individuals, corporations and public entities.
|
|
|
|
|
|
|
Three months or less |
|
$ |
34,273 |
|
|
Over three months through six months |
|
|
16,253 |
|
|
Over six months through one year |
|
|
66,849 |
|
|
Over one year |
|
|
17,407 |
|
|
|
|
|
|
|
|
Total |
|
$ |
134,782 |
|
|
|
|
|
|
|
Liquidity. Liquidity is measured by a financial institution’s ability to raise funds through deposits, borrowed funds, capital or the sale of assets. Additional sources of liquidity, including cash flow from both the repayment of loans and the securitization of assets, are also considered in determining whether liquidity is satisfactory. The funds are used to maintain reserve requirements, fund loans, purchase treasury shares and meet deposit withdrawals and operational requirements. Liquidity is obtained through growth of core funds (defined as core deposits, 50% of non-public entity certificates of deposit over $100 and repurchase agreements issued to commercial customers), liquid assets and accessibility to the money and capital markets. The Corporation and the subsidiary bank have access to short-term funds through the Federal Home Loan Bank of Chicago and the Federal Reserve Bank, which can also provide longer-term borrowings to help meet liquidity requirements.
The ratio of temporary investments and other short-term available funds (those investments maturing within one year, plus twelve months’ projected payments on mortgage-backed securities and collateralized mortgage obligations, and cash and due from banks’ balances) to volatile liabilities (50% of non-public entity certificates of deposit over $100, repurchase agreements issued to public entities, treasury tax and loan deposits, short-term borrowings from banks, and deposits of public entities) was 43.1% at December 31, 2010 and 41.5% at December 31, 2009. Core deposits (demand deposits, interest-bearing checking accounts, savings deposits and certificates of deposit less than $100) were 87.4% of total deposits at December 31, 2010 and 83.2% at December 31, 2009. Money market accounts of approximately $252,000 and $240,000 at December 31, 2010 and 2009, respectively, are classified by the Corporation as core deposits.
In 2010, the Corporation experienced a net decrease of $27,193 in cash and cash equivalents. This decrease was due in part to the use of excess liquidity to redeem higher rate public deposits in an effort to restructure the balance sheet. As a result of this restructuring, deposits decreased $112,578 making up the majority of the $147,024 in liquidity used by financing activities. Investing activities, consisting of a $60,052 decrease in new loans and a $39,911 decrease in the investment portfolio, provided the Corporation with $105,663 in liquidity.
In 2009, with the struggling economy, an effort was made to increase liquidity. Accordingly, the Corporation experienced a net increase of $50,812 in cash and cash equivalents. Financing activities, consisting mostly of an increase in deposits of $113,408, provided the Corporation with $122,040. Additionally, operating activities provided the Corporation with $4,897. Offsetting these provisions, the Corporation used $76,125 in investing activities, consisting of an increase in the investment portfolio of $47,640 and an increase of $27,873 in net loans. Cash and cash equivalents of $71,073 at December 31, 2009, along with established lines of credit, are deemed more than adequate to meet short-term liquidity needs.
On January 24, 2011, the Corporation notified the U.S. Treasury that it will defer regularly scheduled dividend payments on the Corporation’s 25,083 in Series B Preferred Shares, and the Corporation provided notice to Bank of America, N.A., as successor Trustee by merger, of the Corporation’s $25,000 in junior subordinated debt securities due 2035 (the Corporation Capital Trust I) that the Corporation is exercising its right to defer interest payments for a period of twenty (20) consecutive quarterly interest payment periods beginning with the next interest payment period of March 15, 2011, unless the Corporation subsequently gives notice that it has elected to shorten such deferral period. By taking these actions, the Corporation expects to save approximately $1,700 in annual cash payments, based on current rates.
The long-term liquidity needs of the Corporation will be driven by the changing needs of its customers and the ability to offset strategies of its competitors. The Corporation’s equity base, coupled with common stock available for issuance, a low level of debt and available borrowing sources provide multiple options for funding future liquidity needs, including contingency funding in the event of periods of unexpected reduction of liquidity.
Asset-Liability Management. The Corporation actively manages its assets and liabilities through coordinating the levels of interest rate sensitive assets and liabilities to minimize changes in net interest income, despite changes in market interest rates. The Corporation defines interest rate sensitive assets and liabilities as any instruments that can be repriced within 180 days, either because the instrument will mature during the period or because it carries a variable interest rate. Changes in net interest income occur when interest rates on loans and investments change in a different time period from changes in interest rates on interest-bearing liabilities. Additional changes occur when the mix and volume of interest-earning assets and interest-bearing liabilities change. The interest rate sensitivity gap represents the total dollar amount of the difference between rate sensitive assets and rate sensitive liabilities within a given time period (GAP). A GAP ratio is determined by dividing rate sensitive assets by rate sensitive liabilities. A ratio of 1.0 indicates a perfectly matched position, in which case the effect on net interest income due to interest rate movements would be zero.
The Corporation’s strategy with respect to asset-liability management is to maximize net interest income while limiting the Corporation’s exposure to risks associated with volatile interest rates. The subsidiary bank’s Funds Management Committee is responsible for monitoring the GAP position. As a general rule, the subsidiary bank’s policy is to maintain GAP as a percent of total assets within a range from +20% to -20% in any given time period. Based on the simulation of various rising or falling interest rate scenarios in comparison to one considered to be the most likely interest rate scenario (“base model”), management seeks to operate with net interest income within a range of +/-10% and with net income within a range of +/- 25% during any twelve-month period. The Corporation also performs an interest rate risk analysis, on a monthly basis, on the assets and liabilities of the subsidiary bank. This analysis applies an immediate shift (“interest-rate shock”) in interest rates of up to +300 basis points and -300 basis points to the assets and liabilities to determine the impact on the net interest income and net income of the subsidiary bank, when compared to a flat rate scenario. This analysis does not take into account any other balance sheet management plans that would most likely be implemented should such rapid interest rate movement occur.
49
Management’s Discussion and Analysis of
Financial Condition and Results of Operations (Continued)
(dollar amounts in thousands except share data)
The following table shows the estimated changes to net interest income (on a taxable-equivalent basis) from the base scenario as of December 31, 2010 and 2009 (note the 200 and 300 basis point decline scenarios were not calculated due to many deposit products being unable to decline to that level):
|
|
|
|
|
|
|
|
|
|
|
|
|
|
|
|
|
Change in |
|
|
Estimated Net Interest Income |
|
||||||||||
|
Interest Rate |
|
|
2010 |
|
% of change |
|
2009 |
|
% of change |
|
||||
|
|
|
|
|
|
|
|
|
|
|
|
||||
|
300 basis point rise |
|
$ |
38,720 |
|
-6.90 |
% |
|
$ |
34,663 |
|
-14.56 |
% |
|
|
|
200 basis point rise |
|
|
39,331 |
|
-5.43 |
|
|
|
36,226 |
|
-10.71 |
|
|
|
|
100 basis point rise |
|
|
40,314 |
|
-3.07 |
|
|
|
38,258 |
|
-5.70 |
|
|
|
|
Base scenario |
|
|
41,591 |
|
— |
|
|
|
40,570 |
|
— |
|
|
|
|
100 basis point decline |
|
|
39,819 |
|
-4.26 |
|
|
|
39,864 |
|
-1.74 |
|
|
|
Contractual Obligations, Commercial Commitments and Off-Balance Sheet Arrangements. As disclosed in the Notes to Consolidated Financial Statements, the Corporation has certain obligations and commitments to make future payments under contracts. At December 31, 2010, the aggregate contracted obligations (excluding bank deposits) and commercial commitments are as follows:
|
|
|
|
|
|
|
|
|
|
|
|
|
|
|
|
|
|
|
|
|
Total |
|
Less Than |
|
1-3 Years |
|
3-5 Years |
|
Over 5 Years |
|
|||||
|
|
|
|
|
|
|
|
|
|
|
|
|
|||||
|
Contractual Obligations: |
|
|
|
|
|
|
|
|
|
|
|
|
|
|
|
|
|
Time Deposits |
|
$ |
366,335 |
|
$ |
316,816 |
|
$ |
45,005 |
|
$ |
4,495 |
|
$ |
19 |
|
|
Customer repurchase agreements |
|
|
35,806 |
|
|
35,806 |
|
|
-0- |
|
|
-0- |
|
|
-0- |
|
|
Interest-bearing demand notes issued to the U.S. Treasury |
|
|
1,753 |
|
|
1,753 |
|
|
-0- |
|
|
-0- |
|
|
-0- |
|
|
Advances from the Federal Home Loan Bank |
|
|
9,000 |
|
|
9,000 |
|
|
-0- |
|
|
-0- |
|
|
-0- |
|
|
Federal funds purchased |
|
|
-0- |
|
|
-0- |
|
|
-0- |
|
|
-0- |
|
|
-0- |
|
|
Trust preferred securities |
|
|
25,000 |
|
|
25,000 |
|
|
-0- |
|
|
-0- |
|
|
-0- |
|
|
Post-retirement health insurance |
|
|
936 |
|
|
67 |
|
|
125 |
|
|
198 |
|
|
546 |
(1) |
|
|
|
|
|
|
|
|
|
|
|
|
|
|
|
|
|
|
|
Total |
|
$ |
438,830 |
|
$ |
388,442 |
|
$ |
45,130 |
|
$ |
4,693 |
|
$ |
565 |
|
|
|
|
|
|
|
|
|
|
|
|
|
|
|
|
|
|
|
|
|
|
|
|
|
|
|
|
|
|
|
|
|
|
|
|
|
|
Off-Balance Sheet Arrangements: |
|
|
|
|
|
|
|
|
|
|
|
|
|
|
|
|
|
Commitments to lend |
|
$ |
118,357 |
|
$ |
118,357 |
|
$ |
-0- |
|
$ |
-0- |
|
$ |
-0- |
|
|
Standby letters of credit |
|
|
1,503 |
|
|
1,503 |
|
|
-0- |
|
|
-0- |
|
|
-0- |
|
|
|
|
|
|
|
|
|
|
|
|
|
|
|
|
|
|
|
|
Total |
|
$ |
119,860 |
|
$ |
119,860 |
|
$ |
-0- |
|
$ |
-0- |
|
$ |
-0- |
|
|
|
|
|
|
|
|
|
|
|
|
|
|
|
|
|
|
|
(1) For the years 2016 through 2020.
See Note 18 of the Consolidated Financial Statements for additional discussion on contractual obligations, commercial commitments and off-balance sheet arrangements.
The following table sets forth the Corporation’s interest rate repricing gaps for selected maturity periods at December 31, 2010:
|
|
|
|
|
|
|
|
|
|
|
|
|
|
|
|
|
|
|
|
|
|
|
|
|
|
|
Rate Sensitive Within |
|
|||||||||||||||||||
|
|
|
|
|
|||||||||||||||||||
|
|
|
1 year |
|
1-2 yrs. |
|
2-3 yrs. |
|
3-5 yrs. |
|
Thereafter |
|
Total |
|
Fair Value |
|
|||||||
|
|
|
|
|
|
|
|
|
|
|
|
|
|
|
|
|
|||||||
|
Interest-earning assets: |
|
|
|
|
|
|
|
|
|
|
|
|
|
|
|
|
|
|
|
|
|
|
|
Interest-bearing deposits |
|
$ |
30,888 |
|
$ |
-0- |
|
$ |
-0- |
|
$ |
-0- |
|
$ |
-0- |
|
$ |
30,888 |
|
$ |
30,888 |
|
|
Taxable investment securities |
|
|
10,183 |
|
|
29,084 |
|
|
33,362 |
|
|
34,829 |
|
|
52,656 |
|
|
160,114 |
|
|
164,064 |
|
|
Tax-exempt investment securities |
|
|
2,973 |
|
|
3,688 |
|
|
2,828 |
|
|
12,712 |
|
|
73,092 |
|
|
95,293 |
|
|
97,160 |
|
|
Loans |
|
|
354,425 |
|
|
90,694 |
|
|
82,392 |
|
|
63,663 |
|
|
88,689 |
|
|
679,863 |
|
|
684,438 |
|
|
|
|
|
|
|
|
|
|
|
|
|
|
|
|
|
|
|
|
|
|
|
|
|
|
Total rate sensitive assets (“RSA”) |
|
$ |
398,469 |
|
$ |
123,466 |
|
$ |
118,582 |
|
$ |
111,204 |
|
$ |
214,437 |
|
$ |
966,158 |
|
$ |
976,550 |
|
|
|
|
|
|
|
|
|
|
|
|
|
|
|
|
|
|
|
|
|
|
|
|
|
|
Interest-bearing liabilities: |
|
|
|
|
|
|
|
|
|
|
|
|
|
|
|
|
|
|
|
|
|
|
|
Interest-bearing demand deposits |
|
$ |
383,126 |
|
$ |
-0- |
|
$ |
-0- |
|
$ |
-0- |
|
$ |
-0- |
|
$ |
383,126 |
|
$ |
383,126 |
|
|
Savings deposits |
|
|
74,817 |
|
|
-0- |
|
|
-0- |
|
|
-0- |
|
|
-0- |
|
|
74,817 |
|
|
74,817 |
|
|
Time deposits |
|
|
316,816 |
|
|
42,055 |
|
|
2,950 |
|
|
4,495 |
|
|
19 |
|
|
366,335 |
|
|
369,323 |
|
|
Customer repurchase agreements |
|
|
35,806 |
|
|
-0- |
|
|
-0- |
|
|
-0- |
|
|
-0- |
|
|
35,806 |
|
|
35,806 |
|
|
Advances from Federal Home Loan Bank |
|
|
9,000 |
|
|
-0- |
|
|
-0- |
|
|
-0- |
|
|
-0- |
|
|
9,000 |
|
|
9,055 |
|
|
Federal funds purchased |
|
|
-0- |
|
|
-0- |
|
|
-0- |
|
|
-0- |
|
|
-0- |
|
|
-0- |
|
|
-0- |
|
|
Interest-bearing demand notes issued to the U.S. Treasury |
|
|
1,753 |
|
|
-0- |
|
|
-0- |
|
|
-0- |
|
|
-0- |
|
|
1,753 |
|
|
1,753 |
|
|
Trust preferred securities |
|
|
25,000 |
|
|
-0- |
|
|
-0- |
|
|
-0- |
|
|
-0- |
|
|
25,000 |
|
|
25,000 |
|
|
|
|
|
|
|
|
|
|
|
|
|
|
|
|
|
|
|
|
|
|
|
|
|
|
Total rate sensitive liabilities (“RSL”) |
|
$ |
846,318 |
|
$ |
42,055 |
|
$ |
2,950 |
|
$ |
4,495 |
|
$ |
19 |
|
$ |
895,837 |
|
$ |
898,880 |
|
|
|
|
|
|
|
|
|
|
|
|
|
|
|
|
|
|
|
|
|
|
|
|
|
|
|
|
|
|
|
|
|
|
|
|
|
|
|
|
|
|
|
|
|
|
|
|
|
|
Interest rate sensitivity GAP (RSA less RSL) |
|
$ |
(447,849 |
) |
$ |
81,411 |
|
$ |
115,632 |
|
$ |
106,709 |
|
$ |
214,418 |
|
|
|
|
|
|
|
|
Cumulative GAP |
|
$ |
(447,849 |
) |
$ |
(366,439 |
) |
$ |
(250,807 |
) |
$ |
(144,098 |
) |
$ |
70,320 |
|
|
|
|
|
|
|
|
RSA/RSL |
|
|
47.08 |
% |
|
293.58 |
% |
|
4,019.73 |
% |
|
2,473.95 |
% |
|
1,128,615.79 |
% |
|
|
|
|
|
|
|
Cumulative RSA/RSL |
|
|
47.08 |
% |
|
58.75 |
% |
|
71.86 |
% |
|
83.91 |
% |
|
107.85 |
% |
|
|
|
|
|
|
50
In the table above, interest-bearing demand deposits and savings deposits are included as rate sensitive in the amounts reflected in the 0-3 month time frame, as such interest-bearing liabilities are subject to immediate withdrawal.
Management of the Corporation considers $65,500 (one-half) of the interest-bearing checking account balances and $126,000 (one-half) of the money market account balances (both being the components of interest-bearing demand deposits) and all savings deposits as core, or non-rate sensitive deposits, primarily since interest-bearing demand and savings deposits historically have not been rate sensitive. As a general rule, the subsidiary bank’s policy is to maintain RSA as a percent of RSL within a range of +70% to +120% within a six-month time period.
At December 31, 2010, savings deposits totaled approximately $74,800. If the $74,800 in savings deposits, the $65,500 of interest-bearing checking account balances and the $126,000 in money market account balances reflected in the less than one year time frame are excluded from the rate sensitivity above (consistent with the consideration mentioned in the paragraph above), then rate sensitive liabilities would be approximately $579,900 decreasing the negative gap to approximately $181,500. RSA as a percent of RSL would be 68.7%.
Effects of Inflation. The Consolidated Financial Statements and related consolidated financial data presented herein have been prepared in accordance with accounting principles generally accepted in the United States of America and practices within the banking industry which require the measurement of financial condition and operating results in terms of historical dollars, without considering the changes in the relative purchasing power of money over time due to inflation. Unlike most industrial companies, virtually all the assets and liabilities of a financial institution are monetary in nature. As a result, interest rates have a more significant impact on a financial institution’s performance than the effects of general levels of inflation.
Investment Maturities and Yields. The following table sets forth the contractual maturities of the amortized cost of investment securities at December 31, 2010, and the taxable equivalent yields of such securities:
|
|
|
|
|
|
|
|
|
|
|
|
|
|
|
|
|
|
|
|
|
|
|
|
|
|
|
|
|
|
Due
within |
|
Due
after one but |
|
Due
after |
|
Other |
|
||||||||||||||||
|
|
|
|
|
|
|
|
|
|
|
||||||||||||||||
|
|
|
Amount |
|
Yield |
|
Amount |
|
Yield |
|
Amount |
|
Yield |
|
Amount |
|
Yield |
|
||||||||
|
United States Government and federal agency and U.S. Government sponsored enterprises (GSEs) |
|
$ |
7 |
|
|
4.36 |
% |
$ |
48,876 |
|
|
3.30 |
% |
$ |
28,283 |
|
|
3.40 |
% |
$ |
-0- |
|
|
— |
|
|
State and Municipal |
|
|
2,973 |
|
|
3.52 |
|
|
25,168 |
|
|
5.42 |
|
|
97,354 |
|
|
5.80 |
|
|
-0- |
|
|
— |
|
|
Collateralized mortgage obligations: |
|
|
|
|
|
|
|
|
|
|
|
|
|
|
|
|
|
|
|
|
|
|
|
|
|
|
GSE residential |
|
|
10,176 |
|
|
3.02 |
|
|
42,459 |
|
|
3.77 |
|
|
111 |
|
|
6.97 |
|
|
-0- |
|
|
— |
|
|
|
|
|
|
|
|
|
|
|
|
|
|
|
|
|
|
|
|
|
|
|
|
|
|
|
|
|
Total |
|
$ |
13,156 |
|
|
3.13 |
% |
$ |
116,503 |
|
|
3.93 |
% |
$ |
125,748 |
|
|
5.27 |
% |
$ |
-0- |
|
|
— |
|
|
|
|
|
|
|
|
|
|
|
|
|
|
|
|
|
|
|
|
|
|
|
|
|
|
|
|
Loan Maturities. The following table sets forth scheduled loan repayments on agricultural, commercial and real estate construction loans at December 31, 2010:
|
|
|
|
|
|
|
|
|
|
|
|
|
|
|
|
|
|
|
|
|
Due within |
|
Due after one but |
|
Due after |
|
Non-accrual |
|
Total |
|
|||||
|
|
|
|
|
|
|
|
|
|
|
|
|
|||||
|
Agricultural |
|
$ |
69,528 |
|
$ |
6,549 |
|
$ |
99 |
|
$ |
1,910 |
|
$ |
78,086 |
|
|
Commercial |
|
|
73,783 |
|
|
41,969 |
|
|
6,762 |
|
|
8,665 |
|
|
131,179 |
|
|
Real Estate-Construction |
|
|
53,565 |
|
|
4,731 |
|
|
-0- |
|
|
37,091 |
|
|
95,387 |
|
|
|
|
|
|
|
|
|
|
|
|
|
|
|
|
|
|
|
|
Total |
|
$ |
196,876 |
|
$ |
53,249 |
|
$ |
6,861 |
|
$ |
47,666 |
|
$ |
304,652 |
|
|
|
|
|
|
|
|
|
|
|
|
|
|
|
|
|
|
|
Of the loans shown above, the following table sets forth loans due after one year which have predetermined (fixed) interest rates or adjustable (variable) interest rates at December 31, 2010:
|
|
|
|
|
|
|
|
|
|
|
|
|
|
|
Fixed rate |
|
Variable rate |
|
Total |
|
|||
|
|
|
|
|
|
|
|
|
|||
|
Due after one year |
|
$ |
51,526 |
|
$ |
8,584 |
|
$ |
60,110 |
|
Allocation of Allowance for Loan Losses. The subsidiary bank has allocated the allowance for loan losses to provide for the possibility of losses being incurred within the categories of loans set forth in the table below. The allocation of the allowance during 2010 is found in Note 5 - “Loans and the Allowance for Loan and Lease Losses” in the Notes to Consolidated Financial Statements. The allocation of the allowance and the ratio of loans within each category to total loans at December 31, 2010, 2009, 2008 and 2007 are as follows:
|
|
|
|
|
|
|
|
|
|
|
|
|
|
|
|
|
|
|
|
|
|
|
|
|
|
|
|
|
|
December 31 |
|
||||||||||||||||||||||
|
|
|
|
|
||||||||||||||||||||||
|
|
|
2010 |
|
2009 |
|
2008 |
|
2007 |
|
||||||||||||||||
|
|
|
Allowance |
|
Percent |
|
Allowance |
|
Percent |
|
Allowance |
|
Percent |
|
Allowance |
|
Percent |
|
||||||||
|
|
|
|
|
|
|
|
|
|
|
|
|
|
|
|
|
|
|
||||||||
|
Commercial |
|
$ |
4,435 |
|
|
19.6 |
% |
$ |
181 |
|
|
20.5 |
% |
$ |
2,469 |
|
|
19.1 |
% |
$ |
1,188 |
|
|
15.6 |
% |
|
Agricultural |
|
|
99 |
|
|
11.1 |
|
|
129 |
|
|
9.7 |
|
|
235 |
|
|
10.1 |
|
|
580 |
|
|
11.8 |
|
|
Real estate |
|
|
23,559 |
|
|
61.2 |
|
|
10,283 |
|
|
61.0 |
|
|
1,284 |
|
|
61.3 |
|
|
743 |
|
|
62.6 |
|
|
Consumer |
|
|
1,595 |
|
|
8.1 |
|
|
1,059 |
|
|
8.8 |
|
|
890 |
|
|
9.5 |
|
|
486 |
|
|
10.0 |
|
|
Unallocated |
|
|
38 |
|
|
n/a |
|
|
423 |
|
|
n/a |
|
|
186 |
|
|
n/a |
|
|
251 |
|
|
n/a |
|
|
|
|
|
|
|
|
|
|
|
|
|
|
|
|
|
|
|
|
|
|
|
|
|
|
|
|
|
Total |
|
$ |
29,726 |
|
|
100.0 |
% |
$ |
12,075 |
|
|
100.0 |
% |
$ |
5,064 |
|
|
100.0 |
% |
$ |
3,248 |
|
|
100.0 |
% |
|
|
|
|
|
|
|
|
|
|
|
|
|
|
|
|
|
|
|
|
|
|
|
|
|
|
|
51
Quarterly Results of Operations
(dollars in thousands
except share data)
The following table sets forth certain unaudited income and expense and share data on a quarterly basis for the three-month periods indicated:
|
|
|
|
|
|
|
|
|
|
|
|
|
|
|
|
|
|
Year Ended December 31, 2010 |
|
||||||||||
|
|
|
|
|
||||||||||
|
|
|
1st Qtr |
|
2nd Qtr |
|
3rd Qtr |
|
4th Qtr |
|
||||
|
|
|
|
|
|
|
|
|
|
|
|
|
|
|
|
Interest income |
|
$ |
13,460 |
|
$ |
12,373 |
|
$ |
12,042 |
|
$ |
11,691 |
|
|
Interest expense |
|
|
3,977 |
|
|
3,188 |
|
|
2,797 |
|
|
2,276 |
|
|
|
|
|
|
|
|
|
|
|
|
|
|
|
|
|
Net interest income |
|
|
9,483 |
|
|
9,185 |
|
|
9,245 |
|
|
9,415 |
|
|
Provision for loan losses |
|
|
3,925 |
|
|
2,650 |
|
|
6,725 |
|
|
27,250 |
|
|
|
|
|
|
|
|
|
|
|
|
|
|
|
|
|
Net interest income after provision for loan losses |
|
|
5,558 |
|
|
6,535 |
|
|
2,520 |
|
|
(17,835 |
) |
|
Non-interest income |
|
|
3,192 |
|
|
2,029 |
|
|
2,474 |
|
|
3,797 |
|
|
Non-interest expense |
|
|
9,286 |
|
|
8,816 |
|
|
9,047 |
|
|
10,004 |
|
|
|
|
|
|
|
|
|
|
|
|
|
|
|
|
|
Income (loss) before income taxes |
|
|
(536 |
) |
|
(252 |
) |
|
(4,053 |
) |
|
(24,042 |
) |
|
Income tax (benefit) |
|
|
(795 |
) |
|
(672 |
) |
|
(2,142 |
) |
|
(8,295 |
) |
|
|
|
|
|
|
|
|
|
|
|
|
|
|
|
|
Net income (loss) |
|
|
259 |
|
|
420 |
|
|
(1,911 |
) |
|
(15,747 |
) |
|
Preferred stock dividends |
|
|
314 |
|
|
314 |
|
|
314 |
|
|
313 |
|
|
Accretion of preferred stock discount |
|
|
7 |
|
|
7 |
|
|
7 |
|
|
7 |
|
|
|
|
|
|
|
|
|
|
|
|
|
|
|
|
|
Net income (loss) available to common stockholders |
|
$ |
(62 |
) |
$ |
99 |
|
$ |
(2,232 |
) |
$ |
(16,067 |
) |
|
|
|
|
|
|
|
|
|
|
|
|
|
|
|
|
|
|
|
|
|
|
|
|
|
|
|
|
|
|
|
Earnings (loss) per share: |
|
|
|
|
|
|
|
|
|
|
|
|
|
|
Basic net income (loss) per common share available to common stockholders |
|
$ |
(0.02 |
) |
$ |
0.03 |
|
$ |
(0.67 |
) |
$ |
(4.86 |
) |
|
Diluted income (loss) per common share available to common stockholders |
|
$ |
(0.02 |
) |
$ |
0.03 |
|
$ |
(0.67 |
) |
$ |
(4.86 |
) |
|
Cash dividends declared per share |
|
$ |
-0- |
|
$ |
-0- |
|
$ |
-0- |
|
$ |
-0- |
|
|
|
|
|
|
|
|
|
|
|
|
|
|
|
|
|
|
|
Year Ended December 31, 2009 |
|
||||||||||
|
|
|
|
|
||||||||||
|
|
|
1st Qtr |
|
2nd Qtr |
|
3rd Qtr |
|
4th Qtr |
|
||||
|
|
|
|
|
|
|
|
|
|
|
|
|
|
|
|
Interest income |
|
$ |
14,322 |
|
$ |
14,418 |
|
$ |
14,424 |
|
$ |
13,572 |
|
|
Interest expense |
|
|
5,928 |
|
|
5,789 |
|
|
5,541 |
|
|
4,827 |
|
|
|
|
|
|
|
|
|
|
|
|
|
|
|
|
|
Net interest income |
|
|
8,394 |
|
|
8,629 |
|
|
8,883 |
|
|
8,745 |
|
|
Provision for loan losses |
|
|
1,170 |
|
|
1,465 |
|
|
2,410 |
|
|
6,017 |
|
|
|
|
|
|
|
|
|
|
|
|
|
|
|
|
|
Net interest income after provision for loan losses |
|
|
7,224 |
|
|
7,164 |
|
|
6,473 |
|
|
2,728 |
|
|
Non-interest income |
|
|
2,544 |
|
|
3,731 |
|
|
2,772 |
|
|
4,197 |
|
|
Non-interest expense |
|
|
8,716 |
|
|
8,715 |
|
|
9,001 |
|
|
33,128 |
|
|
|
|
|
|
|
|
|
|
|
|
|
|
|
|
|
Income (loss) before income taxes |
|
|
1,052 |
|
|
2,180 |
|
|
244 |
|
|
(26,203 |
) |
|
Income tax expense |
|
|
(104 |
) |
|
282 |
|
|
(516 |
) |
|
(1,263 |
) |
|
|
|
|
|
|
|
|
|
|
|
|
|
|
|
|
Net income (loss) |
|
|
1,156 |
|
|
1,898 |
|
|
760 |
|
|
24,940 |
|
|
Preferred stock dividends |
|
|
237 |
|
|
317 |
|
|
313 |
|
|
311 |
|
|
Accretion of preferred stock discount |
|
|
5 |
|
|
6 |
|
|
7 |
|
|
7 |
|
|
|
|
|
|
|
|
|
|
|
|
|
|
|
|
|
Net income (loss) available to common stockholders |
|
$ |
914 |
|
$ |
1,575 |
|
$ |
440 |
|
$ |
(25,258 |
) |
|
|
|
|
|
|
|
|
|
|
|
|
|
|
|
|
Earnings per share: |
|
|
|
|
|
|
|
|
|
|
|
|
|
|
Basic income (loss) per common share available to common stockholders |
|
$ |
0.28 |
|
$ |
0.48 |
|
$ |
0.13 |
|
$ |
(7.65 |
) |
|
Diluted income (loss) per common share available to common stockholders |
|
$ |
0.28 |
|
$ |
0.48 |
|
$ |
0.13 |
|
$ |
(7.65 |
) |
|
Cash dividends declared per share |
|
$ |
0.28 |
|
$ |
0.14 |
|
$ |
0.14 |
|
$ |
0.14 |
|
52
Selected Consolidated Financial Information
(dollars in thousands except share data)
|
|
|
|
|
|
|
|
|
|
|
|
|
|
|
|
|
|
|
|
|
For the Years Ended December 31 |
|
|||||||||||||
|
|
|
|
|
|||||||||||||
|
|
|
2010 |
|
2009 |
|
2008 |
|
2007 |
|
2006 |
|
|||||
|
|
|
|
|
|
|
|
|
|
|
|
|
|
|
|
|
|
|
Summary of Income |
|
|
|
|
|
|
|
|
|
|
|
|
|
|
|
|
|
Interest income |
|
$ |
49,566 |
|
$ |
56,736 |
|
$ |
58,822 |
|
$ |
61,559 |
|
$ |
53,526 |
|
|
Interest expense |
|
|
12,238 |
|
|
22,085 |
|
|
27,301 |
|
|
34,505 |
|
|
27,630 |
|
|
Net interest income |
|
|
37,328 |
|
|
34,651 |
|
|
31,521 |
|
|
27,054 |
|
|
25,896 |
|
|
Provision for loan losses |
|
|
40,550 |
|
|
11,062 |
|
|
2,968 |
|
|
640 |
|
|
285 |
|
|
Non-interest income |
|
|
11,492 |
|
|
13,244 |
|
|
11,593 |
|
|
11,298 |
|
|
10,245 |
|
|
Non-interest expense |
|
|
37,153 |
|
|
59,559 |
|
|
31,123 |
|
|
29,565 |
|
|
28,335 |
|
|
Income (loss) before income taxes |
|
|
(28,883 |
) |
|
(22,726 |
) |
|
9,023 |
|
|
8,147 |
|
|
7,521 |
|
|
Income tax expense (benefit) |
|
|
(11,904 |
) |
|
(1,600 |
) |
|
1,697 |
|
|
1,377 |
|
|
1,033 |
|
|
Net income (loss) |
|
|
(16,979 |
) |
|
(21,126 |
) |
|
7,326 |
|
|
6,770 |
|
|
6,488 |
|
|
Dividends on preferred shares |
|
|
1,255 |
|
|
1,178 |
|
|
-0- |
|
|
-0- |
|
|
-0- |
|
|
Accretion of preferred stock discount |
|
|
28 |
|
|
25 |
|
|
-0- |
|
|
-0- |
|
|
-0- |
|
|
Net income (loss) available to common stockholders |
|
|
(18,262 |
) |
|
(22,329 |
) |
|
7,326 |
|
|
6,770 |
|
|
6,488 |
|
|
|
|
|
|
|
|
|
|
|
|
|
|
|
|
|
|
|
|
Per Share Data |
|
|
|
|
|
|
|
|
|
|
|
|
|
|
|
|
|
Basic earnings (loss) per share available to common stockholders |
|
$ |
(5.52 |
) |
$ |
(6.76 |
) |
$ |
2.22 |
|
$ |
2.04 |
|
$ |
1.93 |
|
|
Diluted earnings (loss) per share available to common stockholders |
|
|
(5.52 |
) |
|
(6.76 |
) |
|
2.21 |
|
|
2.03 |
|
|
1.91 |
|
|
Common Book value (at end of period) |
|
|
9.58 |
|
|
15.03 |
|
|
21.97 |
|
|
20.74 |
|
|
19.50 |
|
|
Cash dividends declared |
|
|
0.00 |
|
|
0.70 |
|
|
1.12 |
|
|
1.08 |
|
|
1.05 |
|
|
Dividend payout ratio |
|
|
n/a |
|
|
n/a |
|
|
50.5 |
% |
|
53.1 |
% |
|
54.6 |
% |
|
|
|
|
|
|
|
|
|
|
|
|
|
|
|
|
|
|
|
Selected Balances (at end of year) |
|
|
|
|
|
|
|
|
|
|
|
|
|
|
|
|
|
Total assets |
|
$ |
1,096,471 |
|
$ |
1,261,338 |
|
$ |
1,163,130 |
|
$ |
1,080,702 |
|
$ |
1,031,959 |
|
|
Earning assets |
|
|
914,119 |
|
|
1,097,992 |
|
|
1,013,521 |
|
|
949,534 |
|
|
904,504 |
|
|
Investments |
|
|
260,939 |
|
|
301,267 |
|
|
251,115 |
|
|
228,575 |
|
|
267,916 |
|
|
Gross loans |
|
|
709,589 |
|
|
801,370 |
|
|
792,992 |
|
|
723,575 |
|
|
633,984 |
|
|
Allowance for loan losses |
|
|
29,726 |
|
|
12,075 |
|
|
5,064 |
|
|
3,248 |
|
|
3,053 |
|
|
Deposits |
|
|
962,961 |
|
|
1,075,539 |
|
|
962,132 |
|
|
891,407 |
|
|
881,899 |
|
|
Borrowings |
|
|
71,559 |
|
|
104,848 |
|
|
118,016 |
|
|
109,089 |
|
|
74,147 |
|
|
Stockholders’ equity |
|
|
56,861 |
|
|
74,660 |
|
|
72,471 |
|
|
68,607 |
|
|
65,355 |
|
|
|
|
|
|
|
|
|
|
|
|
|
|
|
|
|
|
|
|
Selected Financial Ratios |
|
|
|
|
|
|
|
|
|
|
|
|
|
|
|
|
|
Net income (loss) available to common stockholders to average stockholders’ equity |
|
|
(23.82 |
)% |
|
(22.81 |
)% |
|
10.59 |
% |
|
10.32 |
% |
|
10.07 |
% |
|
Net income (loss) available to common stockholders to average assets |
|
|
(1.58 |
) |
|
(1.79 |
) |
|
0.66 |
|
|
0.65 |
|
|
0.68 |
|
|
Average stockholders’ equity to average assets |
|
|
6.62 |
|
|
7.84 |
|
|
6.25 |
|
|
6.33 |
|
|
6.70 |
|
|
Average earning assets to average assets |
|
|
85.72 |
|
|
87.43 |
|
|
88.57 |
|
|
88.61 |
|
|
88.73 |
|
|
Non-performing loans to total loans at end of year (net of unearned interest) |
|
|
13.83 |
|
|
7.35 |
|
|
4.18 |
|
|
1.03 |
|
|
0.62 |
|
|
Tier 1 capital to average adjusted assets |
|
|
5.76 |
|
|
7.48 |
|
|
6.22 |
|
|
6.33 |
|
|
6.67 |
|
|
Risk-based capital to risk-weighted assets |
|
|
9.68 |
|
|
11.50 |
|
|
8.30 |
|
|
8.44 |
|
|
9.18 |
|
|
Net loans charged-off to average loans |
|
|
3.33 |
|
|
0.54 |
|
|
0.16 |
|
|
0.07 |
|
|
0.06 |
|
|
Allowance for loan losses to total loans at end of year (net of unearned interest) |
|
|
4.22 |
|
|
1.51 |
|
|
0.64 |
|
|
0.45 |
|
|
0.49 |
|
|
Average interest-bearing deposits to average deposits |
|
|
87.13 |
|
|
89.36 |
|
|
89.02 |
|
|
89.01 |
|
|
88.27 |
|
|
Average non-interest-bearing deposits to average deposits |
|
|
12.87 |
|
|
10.64 |
|
|
10.98 |
|
|
10.99 |
|
|
11.73 |
|
53
Market Information
MARKET INFORMATION
Citizens First National Bank acts as the transfer agent for Princeton National Bancorp, Inc. All transfer requests or inquiries should be directed to the following:
|
|
|
|
|
Lou Ann Birkey |
|
|
Vice President - Investor Relations & Corporate Secretary |
|
|
Princeton National Bancorp, Inc. |
|
|
606 South Main St. |
|
|
Princeton, IL 61356 |
|
|
|
|
|
PHONE: 815-872-6131 or 815-872-6134 |
|
|
E-MAIL: pnbc@citizens1st.com |
The table below indicates the high and low prices and the dividends declared per share for PNBC common stock during the periods indicated:
|
|
|
|
|
|
|
|
|
|
|
|
|
|
|
|
|
|
|
|
|
|
|
|
2010 |
|
High |
|
Low |
|
Cash |
|
2009 |
|
High |
|
Low |
|
Cash |
|
||||||
|
|
|
|
|
|
|
|
|
|
|
|
|
|
|
|
|
||||||
|
First Quarter |
|
$ |
11.50 |
|
$ |
8.01 |
|
$ |
0.00 |
|
First Quarter |
|
$ |
23.06 |
|
$ |
12.30 |
|
$ |
0.28 |
|
|
Second Quarter |
|
|
10.00 |
|
|
5.50 |
|
|
0.00 |
|
Second Quarter |
|
|
15.75 |
|
|
13.49 |
|
|
0.14 |
|
|
Third Quarter |
|
|
6.50 |
|
|
4.65 |
|
|
0.00 |
|
Third Quarter |
|
|
18.94 |
|
|
13.39 |
|
|
0.14 |
|
|
Fourth Quarter |
|
|
5.50 |
|
|
2.73 |
|
|
0.00 |
|
Fourth Quarter |
|
|
15.99 |
|
|
9.70 |
|
|
0.14 |
|
On December 31, 2010, PNBC had 758 registered holders of record of its common stock.
The holders of the Common Stock are entitled to receive such dividends as are declared by the Board of Directors of the Corporation, which considers payment of dividends quarterly. The ability of the Corporation to pay dividends is dependent upon receipt of dividends from the Bank. In determining cash dividends, the Board of Directors considers the earnings, capital requirements, debt servicing requirements, financial ratio guidelines established by the Board, the financial condition of the Corporation and other relevant factors. The Bank’s ability to pay dividends to the Corporation is subject to regulatory restrictions. See Note 17 - “Undistributed Earnings of Subsidiary Bank” in the Notes to Consolidated Financial Statements.
The timing and amount of dividends will depend upon the earnings, capital requirements, and financial condition of the Corporation and the subsidiary bank, as well as the general economic conditions and other relevant factors affecting the Corporation and the subsidiary bank. In 2010, a decision was made to suspend dividends to bolster capital levels. See “Management’s Discussion and Analysis of Financial Condition and Results of Operations.”
|
|
|
|
|
|
|
|
|
|
|
|
|
|
|
|
|
|
Annual Report on Form 10-K and Investor Information |
|
|
|
Annual Meeting of Stockholders |
|
|
|
|
|
|
|
|
|
|
|
A copy of Princeton National Bancorp, Inc.’s Annual Report on Form 10-K to be filed with the Securities & Exchange Commission, is available without charge by writing: |
|
|
|
The annual meeting of the stockholders of Princeton National Bancorp, Inc. will be held at 10:00 AM, Tuesday, May 10, 2011, at the following location: |
|
|
|
|
|
|
|
|
|
|
|
Lou Ann Birkey |
|
|
|
The Galleria Convention Center |
|
|
|
Vice President - Investor Relations & Corporate Secretary |
|
|
|
1659 North Main St. |
|
|
|
Princeton National Bancorp, Inc. |
|
|
|
Princeton, IL 61356 |
|
|
|
606 South Main St. |
|
|
|
|
|
|
|
Princeton, IL 61356 |
|
|
|
Stockholders are invited to attend. |
|
|
|
|
|
|
|
|
|
|
|
or E-MAIL us at pnbc@citizens1st.com |
|
|
|
|
|
|
|
|
|
|
|
|
|
54
Common Stock Price Performance Graph
The following Common Stock price performance graph compares the monthly change in the Corporation’s cumulative total stockholder returns on its Common Stock, assuming the Common Stock was purchased on December 31, 2005 and sold on December 31, 2010, with the cumulative total return of stocks included in the Russell 3000, the NASDAQ Bank Index and the SNL Midwest Bank Stock Index for the same period. The amounts shown assume the reinvestment of dividends.
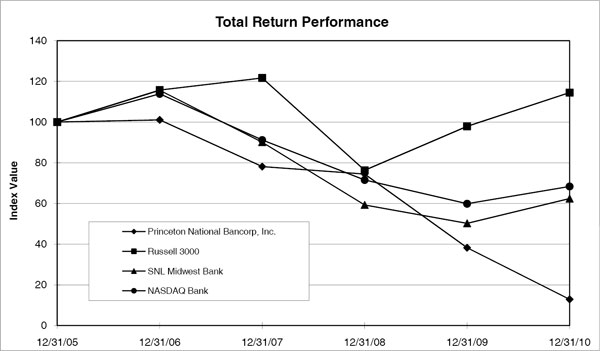
|
|
|
|
|
|
|
|
|
|
|
|
|
|
|
|
|
Period Ending |
||||||||||
|
|
|
|
||||||||||
|
Index |
|
12/31/05 |
|
12/31/06 |
|
12/31/07 |
|
12/31/08 |
|
12/31/09 |
|
12/31/10 |
|
|
|
|
|
|
|
|
|
|
|
|
|
|
|
Princeton National Bancorp, Inc. |
|
100.00 |
|
101.04 |
|
78.11 |
|
74.45 |
|
38.23 |
|
12.87 |
|
Russell 3000 |
|
100.00 |
|
115.71 |
|
121.66 |
|
76.27 |
|
97.89 |
|
114.46 |
|
SNL Midwest Bank Index |
|
100.00 |
|
115.59 |
|
90.09 |
|
59.27 |
|
50.23 |
|
62.38 |
|
NASDAQ Bank |
|
100.00 |
|
113.82 |
|
91.16 |
|
71.52 |
|
59.87 |
|
68.34 |
The Corporation’s Common Stock began trading on the NASDAQ Stock Market under the symbol PNBC on May 8, 1992. On December 31, 2010, the closing bid price for the Common Stock as quoted on NASDAQ Online was $3.64.
55