Attached files
| file | filename |
|---|---|
| EX-23.1 - ID SYSTEMS INC | c64950_ex23-1.htm |
| EX-32.1 - ID SYSTEMS INC | c64950_ex32-1.htm |
| EX-10.12 - ID SYSTEMS INC | c64950_ex10-12.htm |
| EX-32.2 - ID SYSTEMS INC | c64950_ex32-2.htm |
| EX-31.2 - ID SYSTEMS INC | c64950_ex31-2.htm |
| EX-31.1 - ID SYSTEMS INC | c64950_ex31-1.htm |
| EX-21.1 - ID SYSTEMS INC | c64950_ex21-1.htm |
|
|
|
UNITED STATES |
|
SECURITIES AND EXCHANGE COMMISSION |
|
Washington, D.C. 20549 |
|
|
|
FORM 10-K |
|
|
|
|
(Mark One) |
|
|
|
|
|
x |
ANNUAL REPORT PURSUANT TO SECTION 13 OR 15(d) OF THE SECURITIES EXCHANGE ACT OF 1934 |
|
|
|
|
|
For the fiscal year ended December 31, 2010. |
|
|
|
|
o |
TRANSITION REPORT PURSUANT TO SECTION 13 OR 15(D) OF THE SECURITIES EXCHANGE ACT OF 1934 |
|
|
|
|
|
For the transition period from _______ to _______. |
|
|
|
|
Commission file number: 1-15087 |
|
|
|
|
|
I.D. SYSTEMS, INC. |
|
|
(Exact name of registrant as specified in its charter) |
|
|
|
|
|
Delaware |
22-3270799 |
|
(State or other jurisdiction of |
(IRS Employer |
|
incorporation or organization) |
Identification No.) |
|
|
|
|
123 Tice Boulevard, Woodcliff Lake, New Jersey |
07677 |
|
(Address of principal executive offices) |
(Zip Code) |
|
|
|
|
|
|
|
(201) 996-9000 |
|
|
(Registrant’s telephone number, including area code) |
|
|
|
|
|
Securities registered pursuant to Section 12(b) of the Act: |
|
|
|
|
|
Common Stock, par value $0.01 per share |
The NASDAQ Global Market |
|
(Title of class) |
(Name of exchange on which registered) |
|
|
|
|
Securities registered pursuant to Section 12(g) of the Act: None |
|
Indicate by checkmark if the registrant is a well-known seasoned issuer, as defined in Rule 405 of the Securities Act. Yes o No x
Indicate by checkmark if the registrant is not required to file reports pursuant to Section 13 or 15(d) of the Act. Yes o No x
Indicate by check mark whether the registrant (1) has filed all reports required to be filed by Section 13 or 15(d) of the Securities Exchange Act of 1934 during the preceding 12 months (or for such shorter period that the registrant was required to file such reports), and (2) has been subject to such filing requirements for the past 90 days. Yes x No o
Indicate by check mark whether the registrant has submitted electronically and posted on its corporate Web site, if any, every Interactive Data File required to be submitted and posted pursuant to Rule 405 of Regulation S-T (§232.405 of this chapter) during the preceding 12 months (or for such shorter period that the registrant was required to submit and post such files). Yes o No o
Indicate by check mark if disclosure of delinquent filers pursuant to Item 405 of Regulation S-K (§229.405 of this chapter) is not contained herein, and will not be contained, to the best of registrant’s knowledge, in definitive proxy or information statements incorporated by reference in Part III of this Form 10-K or any amendment to this Form 10-K. o
Indicate by check mark whether the registrant is a large accelerated filer, an accelerated filer, a non-accelerated filer, or a smaller reporting company. See the definitions of “large accelerated filer,” “accelerated filer” and “smaller reporting company” in Rule 12b-2 of the Exchange Act.
|
|
|
|
Large accelerated filer o |
Accelerated filer o |
|
|
|
|
Non-accelerated filer x (Do not check if a smaller reporting company) |
Smaller reporting company o |
Indicate by check mark whether the registrant is a shell company (as defined in Rule 12b-2 of the Exchange Act). Yes o No x
The aggregate market value of the registrant’s common stock, par value $0.01 per share (“Common Stock”), held by non-affiliates, computed by reference to the closing price of the Common Stock as of June 30, 2010, the last business day of the registrant’s most recently completed second fiscal quarter, was approximately $25.8 million.
The number of shares of the registrant’s Common Stock outstanding as of March 28, 2010, was 11,171,000 shares.
DOCUMENTS INCORPORATED BY REFERENCE
|
|
|
|
|
Document |
|
Part of Form 10-K |
|
|
|
|
|
|
||
|
Portions of the Proxy Statement For the Registrant’s 2010 Annual Meeting of Stockholders |
|
Part III |
I.D. SYSTEMS, INC.
TABLE OF CONTENTS
i
Cautionary Note Regarding Forward-Looking Statements
In addition to historical information, this Annual Report on Form 10-K of I.D. Systems, Inc. contains “forward-looking statements” (within the meaning of Section 27A of the Securities Act of 1933, as amended (the “Securities Act”), and Section 21E of the Securities Exchange Act of 1934, as amended (the “Exchange Act”)), which may include information concerning our beliefs, plans, objectives, goals, expectations, strategies, anticipations, assumptions, estimates, intentions, future events, future revenues or performance, capital expenditures and other information that is not historical information. Forward-looking statements involve known and unknown risks, uncertainties and other factors, which may be beyond our control, and which may cause our actual results, performance or achievements to be materially different from future results, performance or achievements expressed or implied by such forward-looking statements. Many of these statements appear, in particular, under the headings “Business,” “Selected Financial Data” and “Management’s Discussion and Analysis of Financial Condition and Results of Operations” in this Annual Report on Form 10-K. When used in this report, the words “seek,” “estimate,” “expect,” “anticipate,” “project,” “plan,” “contemplate,” “plan,” “continue,” “intend,” “believe” and variations of such words or similar expressions are intended to identify forward-looking statements. All forward-looking statements are based upon our current expectations and various assumptions. We believe there is a reasonable basis for our expectations and beliefs, but there can be no assurance that we will realize our expectations or that our beliefs will prove to be correct.
There are a number of risks and uncertainties that could cause our actual results to differ materially from the forward-looking statements contained in this report. Important factors that could cause our actual results to differ materially from those expressed as forward-looking statements herein include, but are not limited, to:
|
|
|
|
|
|
• |
future economic and business conditions; |
|
|
• |
the loss of any of our key customers or reduction in the purchase of our products by any such customers; |
|
|
• |
the failure of the market for our products to continue to develop; |
|
|
• |
our inability to protect our intellectual property; |
|
|
• |
the possibility that we may not be able to integrate successfully the business, operations and employees of acquired businesses; |
|
|
• |
the effects of competition from a wide variety of local, regional, national and other providers of wireless solutions; |
|
|
• |
changes in laws and regulations or changes in accounting policies, rules and practices; |
|
|
• |
changes in technology or products, which may be more difficult or costly, or less effective, than anticipated; and |
|
|
• |
those risks and uncertainties set forth under the heading “Risk Factors” in Item 1A of this report. |
There may be other factors of which we are currently unaware or deem immaterial that may cause our actual results to differ materially from the forward-looking statements. All forward-looking statements attributable to us or persons acting on our behalf apply only as of the date they are made and are expressly qualified in their entirety by the cautionary statements included in this report. Except as may be required by law, we undertake no obligation to publicly update or revise any forward-looking statement to reflect events or circumstances occurring after the date they were made or to reflect the occurrence of unanticipated events.
Note Regarding Trademarks
I.D. Systems has, or has applied for, trademark protection for I.D. Systems, Inc.®, Vehicle Asset Communicator®, ChaMP®, Wireless Asset Net®, AvRamp®, Opti-Kan®, WiFree®, Intelli-Listening®, SecureStream®, PowerFleet®, INTELLIPOINT®, PowerKey®, SafeNav™, and VeriWiseTM.
Overview
I.D. Systems, Inc. (together with its subsidiaries, “I.D. Systems,” the “Company,” “we,” “our” or “us”) develops, markets and sells wireless solutions for managing and securing high-value enterprise assets. These assets include industrial vehicles, such as forklifts, airport ground support equipment, rental vehicles, and transportation assets, such as dry van trailers, refrigerated trailers, railcars and containers. Our patented systems utilize radio frequency identification (RFID), Wi-Fi, satellite or cellular communications, and sensor technology to address the needs of organizations to control, track, monitor and analyze their assets. Our solutions enable customers to achieve tangible economic benefits by making timely, informed decisions that increase the security, productivity and efficiency of their operations.
We have focused our business activities on three primary applications: (i) industrial fleet management, (ii) transportation asset management, and (iii) rental fleet management. Our solution for industrial fleet management allows our customers to reduce operating costs and capital expenditures and to comply with certain safety regulations by accurately and reliably measuring and controlling fleet activity. This solution also enhances security at industrial facilities and areas of critical infrastructure, such as airports, by controlling access to, and restricting the use of, vehicles and equipment. Our solution for transportation asset management allows our customers to increase revenue per asset deployed, reduce fleet size, and improve the monitoring and control of sensitive cargo. Our solution for rental fleet management assists rental car companies in generating higher revenue by more accurately tracking vehicle data, such as fuel consumption and odometer readings, and improving customer service by expediting the rental and return processes. In addition, our wireless solution for “carsharing” enables rental car companies to establish a network of vehicles positioned strategically around cities, control vehicles remotely, manage member reservations by phone or Internet, and charge members for vehicle use by the hour.
2
In addition to focusing on these core applications, we adapt our systems to meet our customers’ broader asset management needs and seek opportunities to expand our solution offerings through strategic acquisitions. In 2009, for example, we acquired Didbox Ltd., a privately held, United Kingdom-based manufacturer and marketer of vehicle operator identification systems, which provides us with a wider range of industrial vehicle management solutions and expands our base of operations in Europe. On January 7, 2010, we acquired the Asset Intelligence business unit of the General Electric Company, which provides trailer, railcar, and container tracking solutions for manufacturers, retailers, shippers and freight transportation providers, through the acquisition of Asset Intelligence, LLC (“Asset Intelligence” or “AI”), which became our wholly owned subsidiary following the acquisition. We believe that the Asset Intelligence business complements the Company’s existing businesses, as the focus of Asset Intelligence on trucking, rail, and intermodal applications significantly expands the scope of assets addressed by the Company’s product solutions. The web and mobile communications technologies of Asset Intelligence also complement I.D. Systems’ portfolio of wireless asset management patents. In addition, the acquisition has provided the Company with access to a broader base of customers.
Prior to the AI acquisition, the Company operated in a single reportable segment, which consisted of the historical operations of I.D. Systems, Inc. (“IDS”). Subsequent thereto, the Company has determined that it has two reportable segments organized by product line: IDS and AI. The IDS operating segment includes the Company’s core wireless asset management systems operations: I.D. Systems, Inc., I.D. Systems GmbH, and Didbox Ltd. This core business develops, markets and sells solutions for industrial fleet management and rental fleet management. The AI operating segment, which consists of Asset Intelligence, LLC, provides data-driven telematics solutions for transportation asset management such as trailers and containers.
We sell our solutions to both executive and division-level management. Typically, our initial system deployment serves as a basis for potential expansion across the customer’s organization. We work closely with customers to help maximize the utilization and benefits of our system and demonstrate the value of enterprise-wide deployments. Post-implementation, we consult with our customers to further extend and customize the benefits to the enterprise by delivering enhanced analytics capabilities.
We market and sell our solutions to a wide range of customers in the commercial and government sectors. Our customers operate in diverse markets, such as automotive manufacturing, heavy industry, retail and wholesale distribution, transportation, aviation, aerospace and defense, homeland security and vehicle rental. Based on revenues for 2010, our top customers were Wal-Mart Stores, Inc., Ford Motor Company, GE Trailer Fleet Services, and the Raymond Corporation.
IDS was incorporated in the State of Delaware in 1993.
3
Our Solutions
We design and implement asset management solutions that deliver an enterprise-level return on investment for our customers. Our solutions can be categorized as either closed-loop systems for managing campus-based assets, or mobile systems for managing remote, “over-the-road” assets.
Campus-Based Asset Management Solutions
Our campus-based asset management solutions incorporate short range wireless devices that provide on-board control, location tracking and data processing for enterprise assets, to provide real-time visibility of, and two-way communications with, such assets. These systems provide architectural and functional advantages that differentiate them from systems used for inventory and logistics tracking. For example, while inventory tracking systems rely on constant, continuous radio frequency, or RF, connectivity to perform core functions, our systems require only periodic RF communications, and our on-asset devices perform their core functions autonomously.
Our campus-based asset management system consists of three principal elements:
|
|
|
|
|
|
• |
miniature wireless programmable computers attached to assets; |
|
|
|
|
|
|
• |
fixed-position communication infrastructure consisting of network devices with two-way RF capabilities, RF-based location-emitting beacons and application-specific network servers; and |
|
|
|
|
|
|
• |
proprietary software, which is a user-friendly, Windows-based and browser-based graphical user interface that provides visibility and control of the system database, and which is hosted either at the local installation site or at I.D. Systems’ commercial data center. |
Each of these system elements processes and stores information independently to create a unique, patented system of “distributed intelligence,” which mitigates the risk that a single point of failure could compromise system integrity or data and asset security. Our on-asset hardware stores and processes information locally so that it can autonomously and automatically control the asset and monitor asset activity regardless of the status or availability of other system components. Our on-asset hardware performs its functions even when outside the RF range of any other system component or if the facility computer network is unavailable. Our communication infrastructure independently processes data and executes programmable application logic, in addition to linking monitored mobile asset data automatically to our system’s database. Our server software populates the database and is designed to mitigate the effects of any computer outages that could affect real-time availability of the database. Finally, our client software interfaces only with the database, not directly with our communication infrastructure or on-asset hardware, which restricts access to, and limits corruption of, system information and minimizes network bandwidth usage.
Our campus-based asset management solutions focus on two primary applications: (i) industrial fleet management and (ii) rental fleet management. In addition to focusing on these core applications, we have adapted, and intend to continue to adapt, our wireless solutions to meet our customers’ broader asset management needs.
Industrial Fleet Management
Our PowerFleet®, PowerBox and didBOX solutions for industrial fleet management allow fleet operators to reduce operating costs and capital expenditures, comply with certain safety regulations and enhance security.
To help improve fleet safety and security, our PowerFleet, PowerBox and didBOX systems provide vehicle operator access control, to ensure that only trained and authorized personnel can use equipment, and impact sensing to assign responsibility for abusive driving.
PowerFleet and PowerBox also provide: electronic operator identification; automatic wireless data communications; electronic vehicle inspection checklists for paperless compliance with governmental safety regulations, automatic reporting of emerging vehicle safety issues; automatic on-vehicle intervention, such as alarms and the disabling of equipment, in response to user-definable safety and security parameters; and remote vehicle deactivation capabilities, allowing a vehicle to be shut down manually or automatically under defined conditions.
In addition, our PowerFleet system is compatible with a variety of electronic driver identification technologies and can communicate using the customer’s Wi-Fi network. PowerFleet also provides indoor and outdoor vehicle/operator visibility, through a combination of GPS and RFID technologies, and geo-fencing to restrict vehicles from operating in prohibited areas or issue alerts upon unauthorized entry to such areas. PowerFleet also supports additional optional sensing elements to provide additional vehicle utilization data.
To analyze and benchmark vehicle utilization and operator productivity, our PowerFleet and PowerBox systems automatically record a wide range of activity and enable detailed performance comparisons to help management make informed decisions about vehicle and manpower allocations. This can lead to fleet and personnel reductions as well as increases in productivity. The PowerFleet system also provides real-time and historical visibility of vehicle movements and other advanced asset management options.
4
To help reduce fleet maintenance costs, our PowerFleet and PowerBox systems can automate and enforce preventative maintenance scheduling by:
|
|
|
|
|
|
• |
wirelessly uploading usage data from each vehicle; |
|
|
|
|
|
|
• |
automatically prioritizing maintenance events based on weighted, user-defined variables; |
|
|
|
|
|
|
• |
automatically sending reminders to individual vehicles or operators via the system’s text messaging module; |
|
|
|
|
|
|
• |
enabling remote lock-out of vehicles overdue for maintenance; and |
|
|
|
|
|
|
• |
allowing maintenance personnel to locate and retrieve vehicles due for service via the system’s graphical viewer software. |
The PowerFleet system also enables automatic data feeds to our customers’ existing enterprise maintenance software systems.
A specialized application of our solution in the industrial fleet management and security market is vehicle security, particularly at airports, seaports and other areas of critical infrastructure. The Transportation Security Act of 2001 mandates security for aircraft servicing equipment, including aircraft tow tractors, baggage tugs, cargo loaders, catering vehicles and fuel trucks. The airport market-specific version of our system is called AvRamp®, referencing the aviation industry and the ramp area at airports in which aircraft servicing equipment operates. In addition, we have developed a standalone product called SafeNavTM Powered by GarminTM, which is designed to enhance airport safety by alerting airport vehicle operators when they are too close to active runways and taxiways.
5
Rental Fleet Management
Our solution for traditional rental fleet management is designed both to enhance the consumer’s rental experience and benefit the rental company by providing information that can be used to increase revenues, reduce costs and improve customer service. Our rental fleet management system automatically uploads vehicle identification number, mileage and fuel data as a vehicle enters and exits the rental lot, which can significantly expedite the rental and return processes for travelers and provide the rental company with more timely inventory status, more accurate billing data that can generate higher fuel-related revenue, and an opportunity to utilize customer service personnel for more productive activities, such as inspecting vehicles for damage and helping customers with luggage.
In addition, we provide a wireless solution for the relatively new concept of “carsharing,” whereby a rental car company (i) positions vehicles strategically around cities, universities and corporate campuses for “shared” use by its members, (ii) remotely controls the vehicles, (iii) manages member reservations by phone or Internet, and (iv) charges members for vehicle use by the hour. The entire process—from remotely controlling the car door locks to tracking car mileage and fuel consumption to billing for the transaction—are automatically conducted by an integration of wireless vehicle management technology and the rental company’s fleet management software.
Remote Asset Management Solutions
Our mobile systems for managing remote, “over-the-road” assets are provided by Asset Intelligence, our recently acquired subsidiary. These systems provide mobile-asset tracking and condition-monitoring solutions to meet the transportation market’s desire for greater safety, security, and productivity throughout global supply chains. By leveraging a combination of satellite and cellular wireless communications and Web data management technologies, the Asset Intelligence VeriWiseTM product family provides shippers and carriers with tools to better manage their trailer and container fleets, freight transport operations, and maintenance controls. VeriWise systems enable quick access to actionable intelligence that results in better utilization, control, and security of our customers’ freight-carrying assets.
Our remote asset management systems consist of five principal elements:
|
|
|
|
|
|
• |
satellite or cellular communicators attached to assets; |
|
|
|
|
|
|
• |
GPS receivers that provide latitude/longitude location fixes that are transmitted based on logic resident in the communicator; |
|
|
|
|
|
|
• |
proprietary browser-based graphical user interface that provides visibility and two-way control of the system database (the data can also be transmitted to the customer via XML or web services data feed); |
|
|
|
|
|
|
• |
patented power management intelligence to ensure reliable system performance in a power-starved environment; and |
|
|
|
|
|
|
• |
several sensor types, including cargo, temperature, and door, that provide additional status information for the remote asset. |
To increase asset utilization, our VeriWise system can reduce the number of assets needed and/or increase the revenue generated per asset by:
|
|
|
|
|
|
• |
monitoring asset pool size based on user-defined requirements; |
|
|
|
|
|
|
• |
generating dormancy reports to flag under-utilized assets; |
|
|
|
|
|
|
• |
alerting the driver to the location of the closest empty asset, resulting in a more rapid pick-up; and |
|
|
|
|
|
|
• |
providing trailer detention alerts when an asset has exceeded the time allotted for unloading. |
To better control remote assets, our VeriWise system provides:
|
|
|
|
|
|
• |
integration into refrigerated asset microcontrollers to provide temperature and set point data and alerts via our VeriWise Intelligent Portal (VIP) or by an e-mail notification directly to the customer when an alarm condition develops; |
|
|
|
|
|
|
• |
change in cargo status of an asset via our patented full-length cargo sensor; |
|
|
|
|
|
|
• |
on-device geofencing that alerts the customer when an asset is approaching or leaving its destination; and |
|
|
|
|
|
|
• |
on-board intelligence utilizing a motion sensor and patented logic that identifies the beginning of a drive and the end of a drive. |
To help improve asset and cargo security, our VeriWise system offers the following capabilities:
6
|
|
|
|
|
|
• |
asset lockdown, which automatically sends an e-mail or text message to the customer when movement is detected outside of user-defined time periods; |
|
|
|
|
|
|
• |
door sensors, which detect an unauthorized open door either by time or location, resulting in a door breach alert; |
|
|
|
|
|
|
• |
emergency track functionality that can be enabled to track an asset at more frequent intervals if a theft condition is expected; |
|
|
|
|
|
|
• |
geofencing, which can alert our customer when an asset enters a prohibited geography or location; and |
|
|
|
|
|
|
• |
by utilizing our Tractor ID product notification if the incorrect tractor connects to the asset. |
Growth Strategy
Our objective is to become the leading global provider of wireless solutions for managing and securing enterprise assets. To achieve this goal, we intend to:
Increase sales in existing markets to existing customers and pursue opportunities with new customers by:
|
|
|
|
|
|
• |
maintaining a sales and marketing team that is focused on identifying, seizing and managing revenue opportunities, with the primary goal of expanding our customer base and achieving wider market penetration; |
|
|
|
|
|
|
• |
utilizing a performance services team to (i) shorten our initial sales cycles by helping prospective customers identify and quantify benefits expected from our system, (ii) accelerate transitions from initial implementation to roll-out programs by helping customers achieve and prove expected system benefits, and (iii) build service revenue through long-term consultative engagements that help customers use our system to attain continuous improvements in their operations; |
|
|
|
|
|
|
• |
developing channel partners to provide new sales, marketing, distribution and support networks, especially for our PowerBox product, which is designed to be simple enough for industrial truck dealers to sell, install and support without relying on the Company’s technical resources, and |
|
|
|
|
|
|
• |
expanding our resources and activities internationally, especially in Europe, where we believe re-packaging, promoting and supporting our products represents a large growth opportunity. |
Expand into new applications and markets for our technology by:
|
|
|
|
|
|
• |
pursuing opportunities to integrate our system with computer hardware and software vendors, including original equipment manufacturers; |
|
|
|
|
|
|
• |
establishing relationships with global distributors to market and sell our system internationally; and |
|
|
|
|
|
|
• |
pursuing acquisitions of companies that we believe will enhance the functionality and broaden the applicability of our solutions. |
7
Products and Services
We offer our customers integrated wireless solutions to control, monitor, track and analyze their enterprise assets. Our solutions are comprised of hardware and software, as well as maintenance, support and consulting services.
Campus-Based Fleet Management Products
On-Asset Hardware. With a variety of mounting and user-interface options, our on-asset hardware is designed to be installed quickly and easily and provide an autonomous means of asset control and monitoring. Our on-asset hardware:
|
|
|
|
|
|
• |
contains an integrated computer, programmed with a product-specific application, and an advanced wireless transceiver with a communication range of more than one-half mile; |
|
|
|
|
|
|
• |
controls equipment access with a variety of electronic interface options; |
|
|
|
|
|
|
• |
is compatible with most existing facility access security systems; |
|
|
|
|
|
|
• |
generates paperless electronic safety checklists via a built-in display and keypad; |
|
|
|
|
|
|
• |
wirelessly and automatically uploads and downloads data to and from other system components; |
|
|
|
|
|
|
• |
performs monitoring and control functions at all times, independent of RF or network connectivity; and |
|
|
|
|
|
|
• |
incorporates a multi-voltage power supply designed to control electrical anomalies. |
Wireless Asset Managers. Most of our system deployments require at least one fixed-position communication device, referred to as a Wireless Asset Manager, to link the mobile assets being monitored with the customer’s computer network or to a remotely hosted server. Our Wireless Asset Managers conduct two-way RF communications with the assets being monitored and can communicate on a local area network, a wide area network, or via cellular communications. The use of Wireless Asset Managers enables flexible system configuration options and scalability. A single Wireless Asset Manager is sufficient to operate an entire asset management system. For expanded, real-time data communication and location tracking, Wireless Asset Managers can be added incrementally as needed. They also allow system settings and on-asset functionality to be changed without physically interfacing with on-asset hardware, which can save significant time and money.
Each of our Wireless Asset Managers:
|
|
|
|
|
|
• |
incorporates an integrated computer, programmed with a product specific application, and an advanced wireless transceiver with a communication range of more than one-half mile; |
|
|
|
|
|
|
• |
accommodates an unlimited number of on-asset hardware devices; |
|
|
|
|
|
|
• |
automatically uploads and downloads data to and from other system components; |
|
|
|
|
|
|
• |
employs built-in self-diagnostic capabilities; and |
|
|
|
|
|
|
• |
is configurable to achieve a wide range of asset management goals. |
8
Server Software. Each of our system deployments requires at least one installation of our server software, which automatically manages data communications between the system’s database and either the Wireless Asset Managers or on-asset hardware. Our server software:
|
|
|
|
|
|
• |
is a set of Windows services; |
|
|
|
|
|
|
• |
automatically processes data between our devices and system databases; |
|
|
|
|
|
|
• |
actively polls Wireless Asset Managers to retrieve data on demand; |
|
|
|
|
|
|
• |
passively listens to allow remote systems to initiate data communications for data download; |
|
|
|
|
|
|
• |
automates event scheduling, including data downloads, database archiving and diagnostic notifications; |
|
|
|
|
|
|
• |
interfaces with certain existing external systems, including maintenance and training systems; |
|
|
|
|
|
|
• |
supports remote control/management of event processes; |
|
|
|
|
|
|
• |
automatically performs diagnostics on system components; and |
|
|
|
|
|
|
• |
automatically e-mails event alerts and customizable reports. |
Client Software. Our client software provides an intuitive, easy-to-use, user interface. The console is deployed either as a standard client-server application or as a thin-client. The console interfaces only with the system database, not directly with our communication infrastructure or on-asset hardware, which restricts access to, and limits corruption of, system information and minimizes network bandwidth usage. An unlimited number of clients can be used on a network at any given time.
Our client software:
|
|
|
|
|
|
• |
can show the location, status and inventory of vehicles – in real time and historically – in each area of a facility; |
|
|
|
|
|
|
• |
allows real-time, two-way text communications, including broadcast text paging to all operators simultaneously; |
|
|
|
|
|
|
• |
searches, sorts and analyzes assets by usage/motion time, idle time, location, status, group, maintenance condition and other parameters; |
|
|
|
|
|
|
• |
displays and prints predefined and ad hoc reports; and |
|
|
|
|
|
|
• |
allows remote access by management, customers and vendors through any Internet browser application. |
Our vehicle management systems are available as either remotely or locally hosted solutions to meet a wide range of customer needs and information technology requirements. Our vehicle management systems are available as either remotely or locally hosted solutions to meet a wide range of customer needs and information technology requirements. Our remotely hosted solutions utilize I.D. Systems’ commercial data center.
9
Remote Asset Management Products
On-Asset Hardware. We offer several hardware configurations to address different remote asset types (e.g., dry van trailers, refrigerated trailers, domestic containers, and railcars), as well as customer-specific requirements. Our on-asset hardware options:
|
|
|
|
|
|
• |
contain an integrated computer programmed with a product-specific application, a cellular or satellite transceiver, and a GPS receiver; |
|
|
|
|
|
|
• |
temperature, door, cargo, or tractor ID sensors mounted on the asset; |
|
|
|
|
|
|
• |
solar panels and circuitry to maintain the charge of the on-asset device’s battery pack; |
|
|
|
|
|
|
• |
either sealed lead acid or lithium battery packs to power the hardware when untethered from a power source; and |
|
|
|
|
|
|
• |
a wire harness to connect to an existing power source (e.g., on the tractor). |
Client Website. The VeriWise Intelligence Portal (VIP) is a hosted website that provides Internet access to client asset information. Upon installation of the on-asset hardware, the customer is provided access to the VIP site where they can configure the hardware, establish user passwords, IDs, and access privileges. Our client website:
|
|
|
|
|
|
• |
displays a user-configurable dashboard highlighting the enterprise critical asset information; |
|
|
|
|
|
|
• |
has the ability to e-mail the dashboard to a distribution list at a time interval established by the client; |
|
|
|
|
|
|
• |
provides asset status and history including location, landmark, and sensor information; |
|
|
|
|
|
|
• |
provides latitude/longitude location information for each asset based on reverse geocodes; |
|
|
|
|
|
|
• |
displays asset location on a geographic map; |
|
|
|
|
|
|
• |
generates user configurable reports that can be accessed via the website or e-mailed to a distribution list at a time interval established by the client; |
|
|
|
|
|
|
• |
allows the client to “ping” an asset to receive an updated location report; and |
|
|
|
|
|
|
• |
allows the client to set a unit(s) to “Emergency Track”, which increases the reporting frequency for a specified time-period. |
Direct Data Feed. In addition to the asset information provided on the VIP website, we also offer a direct feed of the data to the customer via XML or web services. The feed complies with established industry conventions, such as TTIS (trailer tracking interface standard), to allow for easy integration into the client’s legacy system or to third-party software packages.
Services
Maintenance Service. We provide a warranty on all hardware and software components of our system. During the warranty period, we either replace or repair defective hardware. We also make extended maintenance contracts available to customers and offer ongoing maintenance and support on a time and materials basis. Pricing for our extended maintenance and support contracts is dependent upon the level of service we expect to provide. Our maintenance and support services typically include remote system monitoring, help desk technical support, escalation procedure development and routine diagnostic data analysis. Expenses to fulfill our warranty obligations have historically been minimal.
Customer Support and Consulting Services. We have developed a framework for the various phases of system training and support that offers our customers both structure and flexibility. Major training phases include hardware installation and troubleshooting, software installation and troubleshooting, “train-the-trainer” training on asset hardware operation, preliminary software user training, system administrator training, information technology issue training, ad hoc training during system launch and advanced software user training. These services are priced based on the extent of training that the customer requests.
Following system launch and advanced training, we make additional, refresher training available for a fee, either at the customer’s site or at our offices. The customer may also elect to purchase additional training as part of a larger extended maintenance contract.
To help our customers derive the most benefit from our system, we supply a broad range of support documentation and provide initial post-launch data consulting. Our support documentation includes hardware user guides, software manuals, vehicle installation overviews, troubleshooting guides and issue escalation procedures. Our initial data consulting is intended to help the customer determine which reports and charts are most meaningful to different system users and which specific data may represent cost-saving or productivity-enhancing opportunities.
We have provided our consulting services, both as a stand-alone service to study the potential benefits of implementing a wireless fleet management system, and as part of the system implementation itself.
In certain instances, customers prepay us for extended maintenance, support and consulting services. In those instances, the payment amount is recorded as deferred revenue and revenue is recognized over the service period.
10
Sales and Marketing
Our sales and marketing objective is to achieve broad market penetration, with an emphasis both on expanding business opportunities with existing customers and on securing new customers.
We market our systems directly to commercial and government organizations and through indirect sales channels, such as industrial equipment dealers. In addition, we are actively pursuing strategic relationships with key companies in our target markets — including original equipment manufacturers, complementary hardware and software vendors, and service providers — to further penetrate these markets by embedding our products in the assets our systems monitor and integrating our solutions with other systems.
We sell our systems to both executive and division-level management. Typically, our initial system deployment serves as a basis for potential expansion across the customer’s organization.
We work closely with customers to help maximize the utilization and benefits of our system and demonstrate the value of enterprise-wide deployments.
Customers
We market and sell our wireless solutions to a wide range of customers in the commercial and government sectors. Our customers operate in diverse markets, such as automotive manufacturing, retailers, shippers, freight transportation companies, heavy industry, retail and wholesale distribution, aerospace and defense, homeland security and vehicle rental.
During the year ended December 31, 2010, we generated revenues of $25.9 million, including $15.2 million of revenue from AI (which we acquired on January 7, 2010), and Wal-Mart Stores, Inc. accounted for 26% of our revenues. During the year ended December 31, 2010, no other customer accounted for more than 10% of our revenues. During the year ended December 31, 2009, we generated revenues of $10.3 million and the U.S. Postal Service, Wal-Mart Stores, NACCO Materials Handling Group, Inc. and Ford Motor Company accounted for 20%, 15%, 15%, and 14%, respectively, of our revenues. During the year ended December 31, 2008, the U.S. Postal Service and Wal-Mart Stores, Inc. accounted for 42% and 41%, respectively, of our revenues.
The Company enters into master agreements with its customers in the normal course of its business. These agreements define the terms of any sales of products and/or services by the Company to the applicable customer, including, but not limited to, terms regarding payment, support services, termination and assignment rights. These agreements generally obligate the Company only when products or services are actually sold to the customer thereunder.
We strive to establish long-term relationships with our customers in order to maximize opportunities for new application development and increased sales.
11
Competition
The market for our solutions is rapidly evolving, highly competitive and fragmented. Our target markets are also subject to quickly changing product technologies, shifting customer needs, regulatory requirements and frequent introductions of new products and services. A significant number of companies have developed or are developing and marketing software and hardware for wireless products that currently compete or will compete directly with our solutions. We compete with organizations varying in size, including many small, start-up companies as well as large, well-capitalized organizations. While some of our competitors focus exclusively on providing wireless asset management solutions, many are involved in wireless technology as an extension of a broader business. Many of our larger competitors are able to dedicate extensive financial resources to the research and development and deployment of wireless solutions. As government and commercial entities expand the use of wireless technologies, we expect that competition will continue to increase within our target markets.
We distinguish ourselves from our competitors by focusing on three primary applications: (i) industrial fleet management, (ii) rental fleet management, and (iii) remote transportation asset management. This focus has enabled us to direct product development efforts specifically suited for our target markets. Our on-asset devices are designed to operate independently of other system components, allowing for continuous asset control and data gathering even when the asset is out of wireless communication range. We believe that our proprietary technology as well as our experience in designing and developing products for our target markets distinguishes us within these markets.
In each of our markets, we encounter different competitors due to the competitive dynamics of each segment. In the industrial fleet management market, the wireless control, tracking and management of enterprise assets is relatively new. Although we are not aware of any current competitors that provide the precise capabilities of our systems, we are aware of competitors that offer subsets of our system capabilities or alternate approaches to the needs our products address. Those companies include both emerging companies with limited operating histories, such as ShockWatch, a division of Media Recovery Inc., and Access Control Group, and companies with longer operating histories, greater name recognition and/or significantly greater financial, technical and marketing resources than ours, such as Crown Equipment Corp., Savi Technology (which was acquired by Lockheed Martin Company), Symbol Technologies (which was acquired by Motorola, Inc.), Intermec, Inc. and Zebra Enterprise Solutions, a division of Zebra Technologies Corporation.
In the rental fleet management market, we compete primarily against handheld device companies that currently provide the solutions used by vehicle rental companies. Currently, our principal competitors in this market are handheld device providers, such as Motorola, and other wireless technology companies, such as Zebra Enterprise Solutions, a division of Zebra Technologies Corporation. Although handheld device providers currently control the majority of the rental fleet market, we believe a shift to other wireless technologies, such as our patented rental fleet management system, represents a compelling opportunity for vehicle rental companies, with the potential to increase both operating efficiency and customer satisfaction. Because of these potential benefits, we believe our market-focused product development strategy, portfolio of intellectual property and proven system efficacy are key competitive advantages in this market.
In the remote transportation asset management market, we compete against several established competitors, including Qualcomm Incorporated, SkyBitz, Inc., Par Technology Corporation and StarTrak Systems, LLC which was acquired by Orbcomm Inc. We attempt to differentiate our solutions in this segment by offering a choice of communication mode (satellite or cellular), sensor options (door, cargo, tractor ID), and installation configurations (dry van trailers, refrigerated trailers, domestic containers, flatbed trailers, covered hopper and tanker railcars, and chassis).
12
Research and Development
Our research and development team has expertise in areas such as software and firmware development, database design and data analytics, wireless communications, mechanical and electrical engineering, product marketing and product management. In addition, we utilize external contractors to supplement our team in the areas of software development, digital design, and product testing.
We spent $2.9 million, $2.6 million, and $4.4 million for research and development during the years ended December 31, 2008, 2009, and 2010, respectively. The increase in 2010 is primarily attributable to the acquisition of Asset Intelligence, and its associated product development activities.
Generally, our research and development efforts are focused on: simplifying the implementation, support and utilization of our systems; reducing the cost of our systems; expanding the functionality of our systems to meet customer and market requirements; improving our products by applying new advances in technology; and building further competitive advantages through our intellectual property portfolio.
In 2010, we focused our research and development investments in several key areas:
|
|
|
|
|
|
• |
the transition of our wireless industrial vehicle management system to a more plug-and-play solution, with easier installation and support requirements, to stimulate more widespread use of our technology on a broader range of equipment; |
|
|
|
|
|
|
• |
the further enhancement of the Wi-Fi version of our vehicle management system, leveraging the “distributed intelligence” of our patented system design to overcome many of the limitations of other Wi-Fi systems and provide a uniquely flexible, secure solution for customers who wish to integrate our system into their existing 802.11 b/g wireless infrastructure; |
|
|
|
|
|
|
• |
the development and deployment of an I.D. Systems-hosted vehicle management solution, incorporating a hybrid of RF and cellular communications technologies, which makes it easier for customers to acquire, deploy and support our system without relying on their own information technology resources; |
|
|
|
|
|
|
• |
the further adaptation of our wireless asset management technology to meet the needs of the emerging markets for airport vehicle security and rental car management; |
|
|
|
|
|
|
• |
the broadening of our product line for the over-the-road asset management market; and |
|
|
|
|
|
|
• |
the continued development of specific features and data interfaces for our solutions to meet the individual requirements of large customers. |
Specifically, we developed and introduced several new products in 2010 to expand the markets and applications addressed by I.D. Systems’ solutions:
|
|
|
|
• |
the PowerBox industrial vehicle management system, a hosted, out-of-the-box solution designed to simplify system acquisition, deployment and benefit achievement for customers with small to medium fleets, or larger fleets with basic vehicle management requirements; |
|
|
|
|
• |
SafeNav™ Powered by Garmin™, an on-vehicle, GPS-based navigation and alert system designed to provide airport vehicle operators with real-time situational awareness, with the goal of avoiding accidental runway incursions; |
|
|
|
|
• |
a new generation of our patented Rental Fleet Management system that can be integrated with any vehicle’s diagnostic data port to provide both traditional airport-based rental fleet management and a remote, charge-by-the-hour “car-sharing“ solution; |
|
|
|
|
• |
VeriWise™ Track & Trace, a low-cost, long-life cellular product with flexible mounting options and simple installation, aimed at trailer and container location tracking, theft countermeasures, and short-term asset analytics; |
|
|
|
|
• |
VeriWise™ Intermodal, a satellite-based container management system with patented solar energy management, cargo detection, and motion sensing, which enables reliable visibility of asset status for faster container turns, improved cargo security, and optimal fleet efficiency; and |
|
|
|
|
• |
VeriWise™ Reefer, a refrigerated trailer management solution, which has been integrated with both Thermo King and Carrier, the world’s leading reefer manufacturers, to enable users to manage temperature set points remotely and react to problems quickly, with real-time alerts based on automatic exception data analysis. |
Intellectual Property
Patents
We attempt to protect our technology and products through a variety of intellectual property protections, including the pursuit of patent protection in the United States and certain foreign jurisdictions. Because of the differences in patent laws and laws concerning proprietary rights, the extent of protection provided by U.S. patents or proprietary rights owned by us may differ from that of their foreign counterparts.
I.D. Systems has built a portfolio of patents and patent applications relating to various aspects of its technology and products. As of March 30, 2011, I.D. Systems has 14 U.S. patents, 17 pending U.S. patent applications, and 1 pending PCT application. With the timely payment of all maintenance fees, the U.S. patents have expiration dates falling between 2014 and 2026. I.D. Systems also has foreign patents and pending applications relating to its wireless asset management system, and pending applications relating to its mobile RFID portal. No single patent or patent family is considered material to the I.D. Systems business.
Asset Intelligence also utilizes patents to protect aspects of its intellectual property assets. The AI patent portfolio focuses on methods, systems, and devices for managing mobile assets and reducing power consumption in mobile assets. The AI patent portfolio currently includes 16 pending applications and 47 granted patents and allowed applications in the U.S. and in foreign jurisdictions. The granted patents have expiration dates falling between 2014 and 2028. No single patent or family of patents is considered material to the AI business.
13
Trademarks
We have, or have applied for, trademark protection for I.D. Systems, Inc.®, Vehicle Asset Communicator®, ChaMP®, Wireless Asset Net®, AvRamp®, Opti-Kan®, WiFree®, Intelli-Listening®, SecureStream®, PowerFleet®, INTELLIPOINT®, PowerKey®, SafeNav™, and VeriWiseTM.
We attempt to avoid infringing known proprietary rights of third parties in our product development and sales efforts. However, it is difficult to proceed with certainty in a rapidly evolving technological environment in which there may be numerous patent applications pending, many of which are confidential at the time of the application filing, with regard to similar technologies. If we were to discover that our products violate third-party proprietary rights, we may not be able to:
|
|
|
|
|
|
• |
obtain licenses to continue offering such products without substantial reengineering; |
|
|
|
|
|
|
• |
reengineer our products successfully to avoid infringement; |
|
|
|
|
|
|
• |
obtain licenses on commercially reasonable terms, if at all; or |
|
|
|
|
|
|
• |
litigate an alleged infringement successfully or settle without substantial expense and damage awards. |
Any claims against us relating to the infringement of third-party proprietary rights, even if without merit, could result in the expenditure of significant financial and managerial resources or in injunctions preventing us from distributing certain products. Such claims could materially adversely affect our business, financial condition and results of operations.
Our software products are susceptible to unauthorized copying and uses that may go undetected, and policing such unauthorized use is difficult. In general, our efforts to protect our intellectual property rights through patent, copyright, trademark and trade secret laws and contractual safeguards may not be effective to prevent misappropriation of our technology, or to prevent the development and design by others of products or technologies similar to or competitive with those developed by us. Our failure or inability to protect our proprietary rights could materially adversely affect our business, financial condition and results of operations.
14
Manufacturing
We outsource our hardware manufacturing operations to leading contract manufacturers, such as Flextronics International Ltd. This strategy enables us to focus on our core competencies — designing hardware and software systems and delivering solutions to customers — and avoid investing in capital-intensive electronics manufacturing infrastructure. Outsourcing also provides us with the ability to ramp up deliveries to meet increases in demand without increasing fixed expenses.
Our manufacturers are responsible for obtaining the necessary components and supplies to manufacture our products. While components and supplies are generally available from a variety of sources, manufacturers generally depend on a limited number of suppliers. In the past, unexpected demand for communication products has caused worldwide shortages of certain electronic parts and allocation of such parts by suppliers that had an adverse impact on the ability of manufacturers to deliver products as well as on the cost of producing such products.
Due to the general availability of manufacturers for our products, we do not believe that the loss of any of our manufacturers would have a long-term material adverse effect on our business, although there could be a short-term adverse effect on our business.
We generally attempt to maintain sufficient inventory to meet customer demand for products, as well as to meet anticipated sales levels. If our product mix changes in unanticipated ways, or if sales for particular products do not materialize as anticipated, we may have excess inventory or inventory that becomes obsolete. In such cases, our operating results could be negatively affected.
Government Regulations
The use of radio emissions is subject to regulation in the United States by various federal agencies, including the Federal Communications Commission, or FCC, and the Occupational Safety and Health Administration, or OSHA. Various state agencies also have promulgated regulations which concern the use of lasers and radio/electromagnetic emissions standards.
Regulatory changes in the United States and other countries in which we may operate in the future could require modifications to some of our products in order for us to continue manufacturing and marketing our products in those areas.
Our products intentionally transmit radio signals, including narrow band and spread spectrum signals, as part of their normal operation. We have obtained certification from the FCC for our products that require certification. Users of these products in the United States do not require any license from the FCC to use or operate our products. To market and sell our integrated wireless solutions in the European Union, we also utilize unlicensed radio spectra, and have obtained the required European Norm (EN) certifications.
In addition, some of our operations use substances regulated under various federal, state and local laws governing the environment and worker health and safety, including those governing the discharge of pollutants into the ground, air and water, the management and disposal of hazardous substances and wastes and the cleanup of contaminated sites. Certain of our products are subject to various federal, state and local laws governing chemical substances in electronic products.
The adoption of unfavorable regulations, or unfavorable interpretations of existing regulations by courts or regulatory bodies, could require us to incur significant compliance costs, cause the development of the affected markets to become impractical or otherwise adversely affect our ability to produce or market our products.
Employees
As of March 9, 2011, we had 86 full-time employees, including five employees based in Germany and the United Kingdom, of which 20 were engaged in customer service, 12 in product development (which includes engineering), 5 in new product management, 9 in operations, 18 in sales and marketing, 8 in information technology and 14 in finance and administration. We believe that our relationships with our employees are good.
As a result of the integration of AI, the Company eliminated 39 positions during 2010, representing approximately 32% of our total personnel. In order to earn a severance payment, affected employees were required to complete their transition duties and execute a general release agreement. Total severance costs incurred during the year ended December 31, 2010 were $487,000, of which $100,000 is included in research and development expenses and $387,000 is included in selling, general and administrative expenses in the consolidated statement of operations. As of December 31, 2010, these costs have been paid.
Available Information
Our primary website is www.id-systems.com. We make available on this website, free of charge, our annual reports on Form 10-K, quarterly reports on Form 10-Q, current reports on Form 8-K and amendments to those reports pursuant to Section 13(a) or 15(d) of the Exchange Act as soon as reasonably practicable after we electronically file such material with, or furnish such information to, the Securities and Exchange Commission (“SEC”). We also make available on this website, free of charge, our Code of Ethics for Senior Financial Officers, which applies to our principal executive officer, principal financial officer and principal accounting officer.
15
In addition to the other information contained in this Annual Report on Form 10-K, the following risk factors should be considered carefully in evaluating the Company’s business. Our business, financial condition or results of operations could be materially and adversely affected by any of these risks. Additional risks not presently known to the Company or that the Company currently deems immaterial may also adversely affect its business, financial condition or results of operations.
We have incurred significant losses and have a substantial accumulated deficit. If we cannot achieve profitability, the market price of our common stock could decline significantly.
We incurred net losses of approximately $4.2 million, $13.2 million and $12.6 million for the years ended December 31, 2008, 2009 and 2010, respectively, and have incurred additional net losses since inception. At December 31, 2010, we had an accumulated deficit of approximately $49.5 million. Our ability to increase our revenues from the sale of our products will depend on our ability to successfully implement our growth strategy and the continued expansion of our markets. If our revenues do not grow or if our operating expenses continue to increase, we may not be able to become profitable and the market price of our common stock could decline further.
We are highly dependent upon sales of our wireless asset management system to a few customers. The loss of any of these customers, or any material reduction in the amount of our products they purchase, could materially and adversely affect our financial condition and results of operations.
During the year ended December 31, 2010, we generated revenues of $25.9 million and the Wal-Mart Stores, Inc. accounted for 26% of our revenues. During the year ended December 31, 2009, we generated revenues of $10.3 million and the U.S. Postal Service, Wal-Mart Stores Inc., NACCO Materials Handling Group, Inc. and Ford Motor Company accounted for 20%, 15%, 15%, and 14% of our revenues, respectively. During the year ended December 31, 2008, the U.S. Postal Service and Wal-Mart Stores, Inc. accounted for 42% and 41% of our revenues, respectively. Some of these and other customers operate in markets that have suffered business downturns in the past few years or may so suffer in the future. The loss of or any material reduction in the amount of our products that these customers purchase, or any material adverse change in the financial condition of such customers, could materially and adversely affect our financial condition and results of operations. If we are unable to replace such revenue from existing or new customers, the market price of our common stock could decline significantly.
If the market for our technology does not develop or become sustainable, expands more slowly than we expect or becomes saturated, our revenues will decline and our financial condition and results of operations could be materially and adversely affected.
Our success is highly dependent on the continued market acceptance of our wireless asset management system. The market for our wireless products and services is new and rapidly evolving. If the market for our products and services does not become sustainable, or becomes saturated with competing products or services, our revenues will decline and our financial condition and results of operations could be materially and adversely affected.
If we are unable to keep up with rapid technological change, we may be unable to meet the needs of our customers, which could materially and adversely affect our financial condition and results of operations and reduce our ability to grow our market share.
Our market is characterized by rapid technological change and frequent new product announcements. Significant technological changes could render our existing technology obsolete. We are active in the research and development of new products and technologies and in enhancing our current products. However, research and development in our industry is complex and filled with uncertainty. For example, it is common for research and development projects to encounter delays due to unforeseen problems, resulting in low initial volume production, fewer product features than originally considered desirable and higher production costs than initially budgeted, any of which may result in lost market opportunities. In addition, these new products may not adequately meet the requirements of the marketplace and may not achieve any significant degree of market acceptance. If our efforts do not lead to the successful development, marketing and release of new products that respond to technological developments or changing customer needs and preferences, our revenues and market share could be materially and adversely affected. We may expend a significant amount of resources in unsuccessful research and development efforts. In addition, new products or enhancements by our competitors may cause customers to defer or forego purchases of our products. Any of the foregoing could materially and adversely affect our financial condition and results of operations and reduce our ability to grow our market share.
16
The long and variable sales cycles for our solutions may cause our revenues and operating results to vary significantly from quarter to quarter or year to year, which could adversely affect the market price of our common stock.
We expect that many customers who utilize our solutions will do so as part of a large-scale deployment of these solutions across multiple or all divisions of their organizations. A customer’s decision to deploy our solutions throughout its organization will involve a significant commitment of its resources. Accordingly, initial implementations may precede any decision to deploy our solutions enterprise-wide. Throughout this sales cycle, we may spend considerable time and expense educating and providing information to prospective customers about the benefits of our solutions.
The timing of the deployment of our solutions may vary widely and will depend on the specific deployment plan of each customer, the complexity of the customer’s organization and the difficulty of such deployment. Customers with substantial or complex organizations may deploy our solutions in large increments on a periodic basis. Accordingly, we may receive purchase orders for significant dollar amounts on an irregular and unpredictable basis. Because of our limited operating history and the nature of our business, we cannot predict the timing or size of these sales and deployment cycles. Long sales cycles, as well as our expectation that customers will tend to place large orders sporadically with short lead times, may cause our revenue and results of operations to vary significantly and unexpectedly from quarter to quarter. These variations could materially and adversely affect the market price of our common stock.
17
If we are unable to protect our intellectual property rights, our financial condition and results of operations could be materially and adversely affected.
We rely on a combination of patents, copyrights, trademarks, trade secrets and contractual measures to protect our intellectual property rights. Third parties may seek to challenge, invalidate, circumvent or render unenforceable any patents or proprietary rights owned by us. If such challenges are successful, our business will be materially and adversely affected.
Our employees, consultants and advisors enter into confidentiality agreements with us that prohibit the disclosure or use of our confidential information. We also have entered into confidentiality agreements to protect our confidential information delivered to third parties for research and other purposes. Despite these efforts, we cannot assure you that we will be able to effectively enforce these agreements or our confidential information will not be disclosed, that others will not independently develop substantially equivalent confidential information and techniques or otherwise gain access to our confidential information or that we can meaningfully protect our confidential information.
Disputes may arise in the future with respect to the ownership of rights to any technology developed with advisors or collaborators. These and other possible disagreements could lead to delays in the collaborative research, development or commercialization of our systems, or could require or result in costly and time-consuming litigation that may not be decided in our favor. Any such event could materially and adversely affect our financial condition and results of operations.
Policing the unauthorized use of our intellectual property is difficult, and we cannot assure you that the steps we have taken will prevent unauthorized use of our technology or other intellectual property, particularly in foreign countries where the laws may not protect our proprietary rights as fully as in the United States. Accordingly, we may not be able to protect our proprietary rights against unauthorized third party copying or use. If we are unsuccessful in protecting our intellectual property, we may lose any technological advantages we have over competitors and our financial condition and results of operations could be materially and adversely affected.
We may become involved in an intellectual property dispute that could subject us to significant liability, divert the time and attention of our management and prevent us from selling our products, any of which could materially and adversely affect our financial condition and results of operations.
In recent years, there has been significant litigation in the United States and internationally involving claims of alleged infringement of patents and other intellectual property rights. Litigation may be necessary to enforce our intellectual property rights, defend ourselves against alleged infringement and determine the scope and validity of our intellectual property rights.
Any such litigation, whether or not successful, could result in substantial costs, divert the time and attention of our management and prevent us from selling our products. If a claim of patent infringement was decided against us, we could be required to, among other things:
|
|
|
|
|
|
• |
pay substantial damages to the party making such claim; |
|
|
|
|
|
|
• |
stop selling, making, having made or using products or services that incorporate the challenged intellectual property; |
|
|
|
|
|
|
• |
obtain from the holder of the infringed intellectual property right a license to sell, make or use the relevant technology, which license may not be available on commercially reasonable terms, or at all; or |
|
|
|
|
|
|
• |
redesign those products or services that incorporate such intellectual property. |
The failure to obtain the necessary licenses or other rights could preclude the sale, manufacture or distribution of our products and could materially and adversely affect our financial condition and results of operations.
18
The U.S. government’s right to use technology developed by us with government funds could limit our intellectual property rights.
We have developed, and may in the future develop, improvements to our technology that are funded in part by the U.S. government. As a result, we do not have the right to prohibit the U.S. government from using certain technologies developed by us with such government funds or to prohibit third parties from using those technologies to provide products and services at the request of the U.S. government. Although such government rights do not affect our ownership of the technology developed using such funds, the U.S. government has the right to royalty-free use of technologies that we have developed under such contracts. We are free to commercially exploit those government-funded technologies and may assert our intellectual property rights to seek to block other non-government users thereof, but we cannot assure you that we can successfully do so.
We rely on subcontractors to manufacture and deliver our products. Any quality or performance failures by our subcontractors or changes in their financial condition could disrupt our ability to supply quality products to our customers in a timely manner, resulting in business interruptions, increased costs, claims for damages, reputation damage and reduced revenue.
In order to meet the requirements under our customer contracts, we rely on subcontractors to manufacture and deliver our products to our customers. Any quality or performance failures by our subcontractors or changes in their financial or business condition could disrupt our ability to supply quality products to our customers in a timely manner. If we are unable to fulfill orders from our customers in a timely manner, we could experience business interruptions, increased costs, damage to our reputation and loss of our customers. In addition, we may be subject to claims from our customers for failing to meet our contractual obligations. Although we have several sources for production, the inability to provide our products to our customers in a timely manner could result in the loss of customers and our revenues could be materially reduced. In addition, there is great competition for the most qualified and competent subcontractors. If we are unable to hire qualified subcontractors, the quality of our services and products could decline. Furthermore, third-party manufacturers in the electronic component industry are consolidating. The consolidation of third-party manufacturers may give remaining manufacturers greater leverage to increase the prices that they charge, thereby increasing our manufacturing costs. If we are unable to pass the increased costs onto our customers, our profitability could be materially and adversely affected.
We rely on a limited number of suppliers for several significant components and raw materials used in our products. If we are unable to obtain these components or raw materials on a timely basis, we will be unable to meet our customers’ orders, which could reduce our revenues, subject us to claims for damages and adversely affect our relationships with our customers.
We rely on a limited number of suppliers for the components and raw materials used in our products, including Flextronics. Although there are many suppliers for most of our component parts and raw materials, we are dependent on a limited number of suppliers for many of our significant components and raw materials. This reliance involves a number of significant risks, including:
|
|
|
|
|
|
• |
unavailability of materials and interruptions in delivery of components and raw materials from our suppliers, which could result in manufacturing delays; and |
|
|
|
|
|
|
• |
fluctuations in the quality and price of components and raw materials. |
We currently do not have any long-term or exclusive purchase commitments with any of our suppliers. In addition, our suppliers may enter into exclusive arrangements with our competitors, be acquired by our competitors, or stop selling their products or components to us at commercially reasonable terms or at all. We may not be able to develop alternative sources for the components and raw materials. Even if alternate suppliers are available to us, identifying them is often difficult and time consuming. If we are unable to obtain an ample supply of product or raw materials from our existing suppliers or alternative sources of supply, we may be unable to satisfy our customers’ orders, which could reduce our revenues, subject us to claims for damages and adversely affect our relationships with our customers.
If we lose our executive officers, or are unable to recruit additional personnel, our ability to manage our business could be materially and adversely affected.
We are dependent on the continued employment and performance of our executive officers. We currently do not have employment agreements with any of our executive officers. Like other companies in our industry, we face intense competition for qualified personnel. Many of our competitors have greater resources than we have to hire qualified personnel. Accordingly, if we are not successful in attracting or retaining qualified personnel in the future, our ability to manage our business could be materially and adversely affected.
19
The industry in which we operate is highly competitive, and competitive pressures from existing and new companies could have a material adverse effect on our financial condition and results of operations.
The industry in which we operate is highly competitive and influenced by the following:
|
|
|
|
|
|
• |
advances in technology; |
|
|
|
|
|
|
• |
new product introductions; |
|
|
|
|
|
|
• |
evolving industry standards; |
|
|
|
|
|
|
• |
product improvements; |
|
|
|
|
|
|
• |
rapidly changing customer needs; |
|
|
|
|
|
|
• |
intellectual property invention and protection; |
|
|
|
|
|
|
• |
marketing and distribution capabilities; |
|
|
|
|
|
|
• |
ability to attract and retain highly skilled professionals; |
|
|
|
|
|
|
• |
competition from highly capitalized companies; |
|
|
|
|
|
|
• |
entrance of new competitors; |
|
|
|
|
|
|
• |
ability of customers to invest in information technology; and |
|
|
|
|
|
|
• |
price competition. |
The products marketed by us and our competitors are becoming more complex. As the technological and functional capabilities of future products increase, these products may begin to compete with products being offered by traditional computer, network and communications industry participants that have substantially greater financial, technical, marketing and manufacturing resources than we do.
Although we are not aware of any current competitors that provide the precise capabilities of our systems, we are aware of competitors that offer subsets of our system capabilities or alternate approaches to the needs our products address. Those companies include both emerging companies with limited operating histories, such as ShockWatch, a division of Media Recovery, Inc., and Access Control Group L.L.C., and companies with longer operating histories, greater name recognition and/or significantly greater financial, technical and marketing resources than ours, such as Crown Equipment Corp., Savi Technology, Inc., which was acquired by Lockheed Martin Company, Symbol Technologies, Inc., which was acquired by Motorola, Inc., Intermec, Inc. and Zebra Enterprise Solutions, a division of Zebra Technologies Corporation.
In the rental fleet management market, we compete primarily against handheld device companies that currently provide the solutions used by vehicle rental companies. Currently, our principal competitors in this market are handheld device providers, such as Motorola, and other wireless technology companies, such as Zebra Enterprise Solutions, a division of Zebra Technologies Corporation. Although handheld device providers currently control the majority of the rental fleet market, we believe a shift to other wireless technologies, such as our patented rental fleet management system, represents a compelling opportunity for vehicle rental companies, with the potential to increase both operating efficiency and customer satisfaction. Because of these potential benefits, we believe our market-focused product development strategy, portfolio of intellectual property and proven system efficacy are key competitive advantages in this market.
In the remote transportation asset management market, we compete against several established competitors, including Qualcomm Incorporated , SkyBitz, Inc., Par Technology Corporation and StarTrack Systems, LLC which was acquired by Orbcomm Inc. We attempt to differentiate our solutions in this segment by offering a choice of communication mode (satellite or cellular), sensor options (door, cargo, tractor ID), and installation configurations (dry van trailers, refrigerated trailers, domestic containers, flatbed trailers, covered hopper and tanker railcars, and chassis).
If we do not keep pace with product and technology advances, including the development of superior products by our competitors, or if we are unable to otherwise compete successfully against our competitors, there could be a material adverse effect on our competitive position, revenues and prospects for growth. As a result, our financial condition and results of operations could be materially and adversely affected.
20
Our recent employee layoff may disrupt, hinder or delay our business activities.
As a result of the integration of Asset Intelligence, we eliminated 39 positions within our company by the third quarter of 2010, representing approximately 32% of our total personnel. Although we have reassigned the duties associated with these eliminated positions to other personnel, inefficiencies related to task unfamiliarity, heavier workloads, potential loss of knowledge and unfilled gaps may arise, especially if we are unable to effectively manage and implement the transition. Any such inefficiency may cause disruption or delay in our business activities.
The federal government or independent standards organizations may implement significant regulations or standards that could adversely affect our ability to produce or market our products.
Our products transmit radio frequency waves, the transmission of which is governed by the rules and regulations of the FCC, as well as other federal and state agencies. Our ability to design, develop and sell our products will continue to be subject to these rules and regulations for the foreseeable future. In addition, our products and services may become subject to independent industry standards. The implementation of unfavorable regulations or industry standards, or unfavorable interpretations of existing regulations by courts or regulatory bodies, could require us to incur significant compliance costs, cause the development of the affected products to become impractical or otherwise adversely affect our ability to produce or market our products. The adoption of new industry standards applicable to our products may require us to engage in rapid product development efforts that would cause us to incur higher expenses than we anticipated. In some circumstances, we may not be able to comply with such standards, which could materially and adversely affect our ability to generate revenues through the sale of our products.
Because our products are complex, they may have undetected errors or failures when they are introduced that could seriously harm our business.
Technical products like ours often contain undetected errors or failures when first introduced. Despite our efforts to eliminate these flaws, there still may be flaws in our products, even after the commencement of commercial shipments. Because our products are used in business-critical applications, we could be subject to product liability claims if our systems fail to perform as intended. Even unsuccessful claims against us could result in costly litigation and the diversion of management’s time and resources and could damage our reputation and impair the marketability of our systems. Although we maintain insurance, we cannot assure you that:
|
|
|
|
|
|
• |
our insurance will provide adequate coverage against potential liabilities if our products cause harm or fail to perform as promised; or |
|
|
|
|
|
|
• |
adequate product liability insurance will continue to be available to us in the future on commercially reasonable terms or at all. |
If our insurance is insufficient to pay any product liability claims, our financial condition and results of operations could be materially and adversely affected. In addition, any such claims could permanently injure our reputation and customer relationships.
We may need to obtain additional capital to fund our operations that could have negative consequences on our business.
We may require additional capital in the future to develop and commercialize additional products and technologies or take advantage of other opportunities that may arise, including potential acquisitions. We may seek to raise the necessary funds through public or private equity offerings, debt financings or strategic alliances and licensing arrangements. To the extent we raise additional capital by issuing equity securities, our existing stockholders may experience substantial dilution. If additional capital is raised through debt, such debt may subject us to significant restrictive covenants that could affect our ability to operate our business. In addition, we may be required to relinquish rights to our technologies or systems, or grant licenses on terms that are not favorable to us in order to raise additional funds through strategic alliance, joint venture and licensing arrangements. If adequate funds are not available, we may be required to delay, reduce the scope of or eliminate one or more of our development programs, and our business, financial condition, results of operations and stock price could be materially and adversely affected.
21
If we do not adequately anticipate and respond to the risks inherent in growing our business internationally, our operating results and the market price of our common stock could be materially and adversely affected.
To date, we have not generated significant revenues outside of North America. As part of our growth strategy, we are seeking ways to expand our operations outside of North America by establishing offices in the United Kingdom and Europe and developing relationships with global distributors to market and sell our systems internationally. For example, as of March 9, 2011, we had three employees in Germany and two in the United Kingdom who market and sell our systems in Europe. There are a number of risks inherent in doing business in international markets, including:
|
|
|
|
|
|
• |
unexpected legal or regulatory changes; |
|
|
|
|
|
|
• |
unfavorable political or economic factors; |
|
|
|
|
|
|
• |
less developed infrastructure; |
|
|
|
|
|
|
• |
difficulties in recruiting and retaining personnel, and managing international operations; |
|
|
|
|
|
|
• |
fluctuations in foreign currency exchange rates; |
|
|
|
|
|
|
• |
lack of sufficient protection for intellectual property rights; and |
|
|
|
|
|
|
• |
potentially adverse tax consequences. |
Until recently, we had no operations outside of North America, and we have limited experience establishing or operating businesses outside of North America. If we do not adequately anticipate and respond to the risks inherent in international operations, our operating results and the market price of our common stock could be materially and adversely affected. In addition, although we intend to expand our business outside of North America, there are risks associated with conducting an international operation, including the risks listed above, and such expansion may not be successful or have a positive effect on, and could materially and adversely affect, our financial condition and results of operations.
We cannot assure you that we will be able to successfully integrate any businesses, products, technologies or personnel that we have acquired or might acquire in the future.
We may, from time to time, continue to consider investments in or acquisitions of complementary companies, products or technologies. In the event of any future acquisitions, we could:
|
|
|
|
|
|
• |
issue stock that would dilute our current stockholders’ percentage ownership; |
|
|
|
|
|
|
• |
incur debt; |
|
|
|
|
|
|
• |
assume liabilities; |
|
|
|
|
|
|
• |
incur expenses related to the impairment of goodwill; or |
|
|
|
|
|
|
• |
incur large and immediate write-offs. |
We may not be able to identify suitable acquisition candidates, and if we do identify suitable candidates, we may not be able to make these acquisitions on acceptable terms, or at all.
22
Our operation of any acquired business will also involve numerous risks, including:
|
|
|
|
|
|
• |
problems integrating the acquired operations, personnel, technologies or products; |
|
|
|
|
|
|
• |
unanticipated costs; |
|
|
|
|
|
|
• |
diversion of management’s time and attention from our core businesses; |
|
|
|
|
|
|
• |
adverse effects on existing business relationships with suppliers and customers; |
|
|
|
|
|
|
• |
risks associated with entering markets in which we have no or limited prior experience; and |
|
|
|
|
|
|
• |
potential loss of key employees, particularly those of acquired companies. |
Since our inception, we have not made any acquisitions other than the PowerKey acquisition during 2008, the Didbox Ltd. acquisition during 2009, and the acquisition of the Asset Intelligence business during 2010, and we cannot assure you that we will be able to successfully integrate any businesses, products, technologies or personnel that we have acquired or that we might acquire in the future. Any failure to do so could have a material adverse effect on our financial condition and results of operations. Acquisitions also involve the risk of potential unknown liabilities associated with the acquired business. As a result of these risks, we may not be able to achieve the expected benefits of any acquisition, including the Asset Intelligence acquisition. The successful integration of Asset Intelligence will require, among other things, integration of Asset Intelligence’s operations, products, policies and personnel with our business. We may not achieve successful integration in a timely manner, or at all, and we may not realize the anticipated benefits and synergies of the acquisition to the extent, or in the timeframe, anticipated.
In addition, if we make changes to our business strategy or if external conditions adversely affect our business operations, we may be required to record an impairment charge for goodwill or intangibles, which would lead to decreased assets and reduced net operating performance.
The concentration of common stock ownership among our executive officers and directors could limit the ability of other stockholders of the Company to influence the outcome of corporate transactions or other matters submitted for stockholder approval.
As of March 28, 2011, our executive officers and directors beneficially owned, in the aggregate, 13% of our outstanding common stock, not including 1,789,000 shares of common stock that our executive officers and directors may acquire upon the exercise of outstanding options or if they otherwise acquire additional shares of common stock in the future. As a result, our officers and directors may have the ability to influence the outcome of all corporate actions requiring stockholder approval, irrespective of how our other stockholders may vote, including the following actions:
|
|
|
|
|
|
• |
the election of directors; |
|
|
|
|
|
|
• |
adoption of stock option or other equity incentive compensation plans; |
|
|
|
|
|
|
• |
the amendment of our organizational documents; and |
|
|
|
|
|
|
• |
the approval of certain mergers and other significant corporate transactions, including a sale of substantially all of our assets. |
23
The unpredictability of our quarterly operating results could adversely affect the market price of our common stock.
Our revenues and operating results may vary significantly from quarter to quarter due to a number of factors, many of which are outside of our control and any of which could adversely affect the market price of our common stock. The main factors that may affect us include the following:
|
|
|
|
|
|
• |
variations in the sales of our products to our significant customers; |
|
|
|
|
|
|
• |
variations in the mix of products and services provided by us; |
|
|
|
|
|
|
• |
the timing and completion of initial programs and larger or enterprise-wide purchases of our products by our customers; |
|
|
|
|
|
|
• |
the length and variability of the sales cycle for our products; |
|
|
|
|
|
|
• |
the timing and size of sales; |
|
|
|
|
|
|
• |
changes in market and economic conditions, including fluctuations in demand for our products; and |
|
|
|
|
|
|
• |
announcements of new products by our competitors. |
As a result of these and other factors, revenues for any quarter are subject to significant variation that could adversely affect the market price for our common stock.
Future sales of our common stock, including sales of our common stock acquired upon the exercise of outstanding options, may cause the market price of our common stock to decline.
The market price of our common stock could decline as a result of sales by our existing stockholders of shares of common stock in the market, or sales of our common stock acquired upon the exercise of outstanding options, or the perception that these sales could occur. These sales also may make it more difficult for us to sell equity securities at a time and price that we deem appropriate.
We have 11,171,000 shares of common stock outstanding as of March 28, 2011, of which 9,681,000 shares are freely transferable without restriction, and 1,490,000 shares are held by our officers and directors and, as such, are subject to the applicable volume, manner of sale, holding period and other limitations of Rule 144 under the Securities Act. In addition, as of December 31, 2010, options to purchase 2,666,000 shares of our common stock were issued and outstanding, of which 1,522,000 were vested. The remaining options will vest ratably over a five-year period measured from the date of grant. The weighted-average exercise price of the vested stock options is $9.60. We also may issue additional shares of stock in connection with our business, including in connection with acquisitions, and may grant additional stock options to our employees, officers, directors and consultants under our stock option plans or warrants to third parties. If a significant portion of these shares of common stock were sold in the public market, the market value of our common stock could be adversely affected.
Interest rate fluctuations may adversely affect our income and results of operations.
As of December 31, 2010, we had cash, cash equivalents and investments of $28.4 million. In a declining interest rate environment, reinvestment typically occurs at less favorable market rates, negatively impacting future investment income. Accordingly, interest rate fluctuations may adversely affect our income and results of operations.
24
Our cash and cash equivalents could be adversely affected by the current downturn in the financial and credit markets.
We maintain our cash and cash equivalents with major financial institutions; however, our cash and cash equivalent balances with these institutions exceed the Federal Deposit Insurance Corporation insurance limits. While we monitor on a systematic basis the cash and cash equivalent balances in the operating accounts and adjust the balances as appropriate, these balances could be impacted if one or more of the financial institutions with which we deposit our cash and cash equivalents fails or is subject to other adverse conditions in the financial or credit markets. To date, we have experienced no loss of principal or lack of access to our invested cash or cash equivalents; however, we can provide no assurance that access to our invested cash and cash equivalents will not be affected if the financial institutions in which we hold our cash and cash equivalents fail or the financial and credit markets continue to deteriorate.
Goodwill impairment or intangible impairment charges may affect our results of operations in the future.
We test goodwill for impairment on an annual basis and more often if events occur or circumstances change that would likely reduce the fair value of a reporting unit to an amount below its carrying value. We also test for other possible acquisition intangible impairments if events occur or circumstances change that would indicate that the carrying amount of such intangible may not be recoverable. Any resulting impairment loss would be a non-cash charge and may have a material adverse impact on our results of operations in any future period in which we record a charge.
Long-lived assets with determinable useful lives are reviewed for impairment whenever events or changes in circumstances indicate that the carrying amount of an asset may not be recoverable. Such charges could have a material adverse effect on our results of operations in the period in which they are recorded.
Declines in general economic conditions could result in decreased demand for our products and services, which would adversely affect our business, financial condition and results of operations.
Our results of operations are affected by the levels of business activities of our customers, which can be affected by economic conditions in the United States and globally. During periods of economic downturns, our customers may decrease their demand for wireless technology solutions, as well as the maintenance, support and consulting services we provide. This slowdown may have an adverse effect on the wireless solutions industry in general and on demand for our products and services, but the magnitude of that impact is uncertain. Our future growth is dependent, in part, upon the demand for our products and services. Prolonged weakness in the economy may cause business enterprises to delay or cancel wireless solutions projects, reduce their overall wireless solutions budgets and/or reduce or cancel orders for our services. This, in turn, may lead to longer sales cycles, delays in purchase decisions, and payment and collection issues, and may also result in price pressures, causing us to realize lower revenues and operating margins. Additionally, if our customers cancel or delay their wireless solutions initiatives, our business, financial condition and results of operations could be materially and adversely affected.
25
Provisions of Delaware law, our charter documents or our shareholder rights plan could delay or prevent an acquisition of the Company, even if the acquisition would be beneficial to our stockholders, and could make it more difficult for our stockholders to change the Company’s management.
Section 203 of the Delaware General Corporation Law prohibits us from engaging in a business combination with any of our interested stockholders for three years after such stockholder became an interested stockholder unless certain specified conditions are met. As a result, these provisions and Delaware law could limit the price that investors are willing to pay in the future for shares of our common stock.
In addition, provisions of our certificate of incorporation and bylaws may discourage, delay or prevent a merger, acquisition or other change in control that stockholders may consider favorable, including transactions in which stockholders might otherwise receive a premium for their shares. This is because these provisions may prevent or frustrate attempts by stockholders to replace or remove our current management or members of our Board of Directors. These provisions, among other things:
|
|
|
|
|
|
• |
permit our Board of Directors to issue, without further action by our stockholders, up to 5,000,000 shares of preferred stock, with any rights, preferences and privileges as they may designate, including the right to approve an acquisition or other change in control; |
|
|
|
|
|
|
• |
provide that special meetings of stockholders may be called only by (i) our Board of Directors pursuant to a resolution adopted by a majority of the entire Board of Directors, either upon motion of a director or upon written request by the holders of at least 50% of the voting power of all the shares of our capital stock entitled to vote in the election of directors, voting as a single class, or (ii) our Chairman of the Board or our President; and |
|
|
|
|
|
|
• |
require the affirmative vote of at least 75% of the voting power of all the shares of our capital stock entitled to vote in the election of directors, voting as a single class, to amend or repeal the provisions outlined above dealing with meetings of stockholders. |
Also, in July 2009, we entered into a Rights Agreement, dated as of July 1, 2009 (the “Rights Agreement”), under which the Board of Directors authorized and declared a dividend of one preferred stock purchase right (a “Right” and, collectively, the “Rights”) for each share of the Company’s common stock outstanding as of July 13, 2009. Each Right entitles the registered holder to purchase from the Company one one-thousandth (subject to adjustment) of a share of Series A Junior Participating Preferred Stock at a price of $19.47, subject to adjustment. The Rights become exercisable upon the occurrence of certain events and may make the acquisition of the Company more difficult and expensive. The Rights Agreement may delay or prevent an acquisition of the Company that stockholders may consider favorable, which could decrease the value of our common stock. The Rights will expire upon the earliest to occur of: (i) the close of business on the “Sunset Date” (as defined in the Rights Agreement); (ii) the time at which the Rights are redeemed as provided in the Rights Agreement; or (iii) the time at which such Rights are exchanged as provided in the Rights Agreement.
26
Item 1B. Unresolved Staff Comments
None.
Our executive and I.D. Systems administrative offices are located in Woodcliff Lake, New Jersey. In May 2010, we entered into a lease for this facility, covering approximately 21,400 square feet, that expires on February 28, 2021. The rent is currently $35,063 per month.
As a result of the Asset Intelligence acquisition on January 7, 2010, we assumed the sublease, covering approximately 14,981 square feet, for the Asset Intelligence administrative offices located in Plano, Texas, which expires on January 18, 2012. The rent expense per month for this sublease is $16,229.
We believe that our existing facilities are adequate for our existing needs.
In the ordinary course of its business, the Company is at times subject to various legal proceedings. As of March 30, 2011, the Company was not a party to any material legal proceedings.
Item 4. (Removed and Reserved)
27
Item 5. Market for Registrant’s Common Equity, Related Stockholder Matters and Issuer Purchases of Equity Securities
Market Information.
Our common stock is quoted on the NASDAQ Global Market under the symbol “IDSY.” The following table sets forth the high and low sales price for our common stock as reported on such quotation system for each fiscal quarter during the years ended December 31, 2010 and 2009.
|
|
|
|
|
|
|
|
|
|
Quarter Ended |
|
High |
|
Low |
|
||
|
|
|
|
|
|
|
||
|
2010 |
|
|
|
|
|
|
|
|
March 31, 2010 |
|
$ |
3.88 |
|
$ |
2.75 |
|
|
June 30, 2010 |
|
|
3.89 |
|
|
2.60 |
|
|
September 30, 2010 |
|
|
2.85 |
|
|
1.77 |
|
|
December 31, 2010 |
|
|
3.49 |
|
|
1.93 |
|
|
|
|
|
|
|
|
|
|
|
2009 |
|
|
|
|
|
|
|
|
March 31, 2009 |
|
$ |
4.20 |
|
$ |
3.11 |
|
|
June 30, 2009 |
|
|
4.14 |
|
|
3.23 |
|
|
September 30, 2009 |
|
|
4.20 |
|
|
3.11 |
|
|
December 31, 2009 |
|
|
4.17 |
|
|
2.98 |
|
Performance Graph.
The following graph shows a five-year comparison of cumulative total shareholder return for (i) the Company, (ii) the NASDAQ Market Index, and (iii) the Morningstar Communication Equipment Index (the “Morningstar Index”).
The graph assumes that $100 was invested in each of the Company’s common stock, the NASDAQ Market Index and the Morningstar Index on December 31, 2005, and that any dividends were reinvested. Data points on the graph are annual. Note that historic stock price performance is not necessarily indicative of future stock price performance. The following graph and related information shall not be deemed “soliciting material” or to be “filed” with the SEC, nor shall such information be incorporated by reference into any filing under the Securities Act or the Exchange Act, except to the extent that we specifically incorporate it by reference into such filing.
28
COMPARISON OF CUMULATIVE TOTAL RETURN
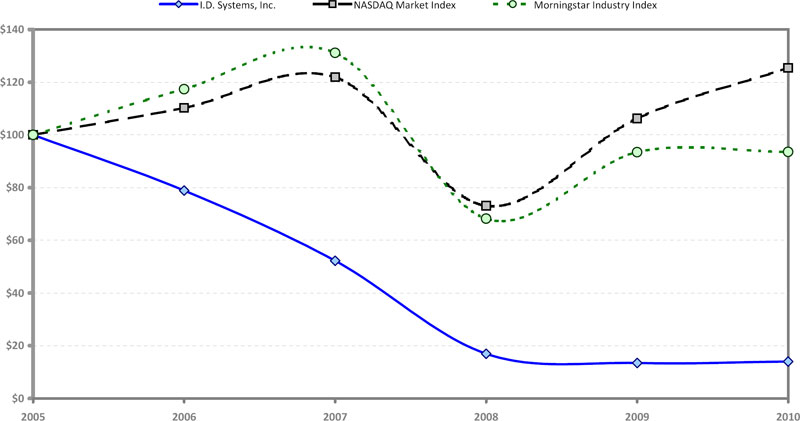
ASSUMES $100 INVESTED ON JAN. 01, 2006
ASSUMES DIVIDENDS (IF ANY) REINVESTED
FISCAL YEAR ENDED DEC. 31, 2010
|
|
|
|
|
|
|
|
|
|
|
|
|
|
|
|
|
|
|
|
|
|
|
|
Fiscal Year Ended |
|
||||||||||||||||
|
|
|
|
|
||||||||||||||||
|
COMPANY/INDEX/MARKET |
|
12/31/2005 |
|
12/31/2006 |
|
12/31/2007 |
|
12/31/2008 |
|
12/31/2009 |
|
12/31/2010 |
|
||||||
|
|
|
|
|
|
|
|
|
|
|
|
|
|
|
||||||
|
I.D. Systems, Inc. |
|
|
100.00 |
|
|
78.91 |
|
|
52.24 |
|
|
16.98 |
|
|
13.46 |
|
|
14.00 |
|
|
NASDAQ Market Index |
|
|
100.00 |
|
|
110.26 |
|
|
121.89 |
|
|
73.10 |
|
|
106.23 |
|
|
125.37 |
|
|
Morningstar Industry Index(1) |
|
|
100.00 |
|
|
117.34 |
|
|
131.12 |
|
|
68.22 |
|
|
93.44 |
|
|
93.56 |
|
| ___________ | ||
| (1) | Morningstar, Inc. reconstituted the Morningstar Communication Equipment Index in the second half of 2010. As a result of such reconstitution, historical returns have been recalculated to reflect the updated composition of that industry index. | |
Source: Morningstar, Inc.
29
Holders.
As of March 22, 2011, there were 27 holders of record of our common stock.
Dividends.
We have never paid a cash dividend on our common stock and do not expect to pay a cash dividend in the near future. We currently intend to retain future earnings, if any, to finance our operations and expand our business. Any future determination to pay cash dividends will be at the discretion of our Board of Directors and will depend upon our financial condition, operating results, capital requirements and any other factors our Board of Directors deems relevant.
Sales of Unregistered Securities.
None.
Purchases of Equity Securities by the Issuer.
On November 4, 2010, the Company announced that its Board of Directors authorized the repurchase of issued and outstanding shares of the Company’s common stock having an aggregate value of up to $3,000,000 pursuant to a share repurchase program. The repurchases under the share repurchase program will be made from time to time in the open market or in privately negotiated transactions and will be funded from the Company’s working capital. The amount and timing of such repurchases will be dependent upon the price and availability of shares, general market conditions and the availability of cash, as determined at the discretion of the Company’s management. All shares of common stock repurchased under the Company’s share repurchase program are held as treasury stock. The share repurchase program does not have an expiration date, and the Company may discontinue or suspend the share repurchase program at any time.
The following table describes the Company’s share repurchase activity for each month of the quarterly period ended December 31, 2010. All of the repurchases set forth in the table were made under the share repurchase program in open market transactions.
ISSUER PURCHASES OF EQUITY SECURITIES
|
|
|
|
|
|
|
|
|
|
|
|
|
Period |
|
Total Number of |
|
Average Price |
|
Total Number of Shares |
|
Approximate Dollar Value of |
||
|
|
|
|
|
|
|
|
|
|
||
|
October 1, 2010 − October 31, 2010 |
|
— |
|
|
— |
|
— |
|
$ |
3,000,000 |
|
November 1, 2010 − November 30, 2010 |
|
26,000 |
|
$ |
2.72 |
|
26,000 |
|
|
2,930,000 |
|
December 1, 2010 − December 31, 2010 |
|
10,000 |
|
$ |
2.67 |
|
10,000 |
|
|
2,901,000 |
|
|
|
|
|
|
|
|
|
|
|
|
|
Total |
|
36,000 |
|
$ |
2.71 |
|
36,000 |
|
$ |
2,901,000 |
|
|
|
|
|
|
|
|
|
|
|
|
In addition, on May 3, 2007, the Company previously had announced that its Board of Directors had authorized the repurchase of issued and outstanding shares of our common stock having an aggregate value of up to $10,000,000 pursuant to a share repurchase program (the “2007 Repurchase Program“). The Company did not purchase any shares of its common stock under the 2007 Repurchase Program during the years ended December 31, 2009 or 2010. As of December 31, 2010, the Company had purchased approximately 1,075,000 shares of its common stock in open market transactions under the 2007 Repurchase Program for an aggregate purchase price of approximately $9,970,000. The repurchases were funded from the Company’s working capital, and the amount and timing of such repurchases depended upon the price and availability of shares, general market conditions and the availability of cash, as determined at the discretion of our management. The 2007 Repurchase Program does not have an expiration date, and the Company may discontinue or suspend the 2007 Repurchase Program at any time. All shares of common stock repurchased under the 2007 Repurchase Program are held as treasury stock.
Securities Authorized for Issuance Under Equity Compensation Plans.
The following table provides certain information with respect to the Company’s equity compensation plans in effect as of December 31, 2010:
EQUITY COMPENSATION PLAN INFORMATION
|
|
|
|
|
|
|
|
|
|
|
|
|
Plan category |
|
Number of
Securities to be |
|
Weighted-average
exercise price |
|
Number of
securities remaining |
||||
|
|
|
|
|
|
|
|
|
|
||
|
|
|
|
|
|
|
|
|
|
|
|
|
Equity compensation plans approved by security holders (1) |
|
2,666,000 |
|
|
$ |
7.34 |
|
|
274,000 |
|
|
Equity compensation plans not approved by security holders |
|
— |
|
|
|
— |
|
|
— |
|
|
|
|
|
|
|
|
|
|
|
|
|
|
Total |
|
2,666,000 |
|
|
$ |
7.34 |
|
|
274,000 |
|
|
|
|
|
|
|
|
|
|
|
|
|
(1) These plans consist of the Company’s 1999 Stock Option Plan, 1999 Director Option Plan, 2007 Equity Compensation Plan and 2009 Non-Employee Director Equity Compensation Plan, which were our only equity compensation plans in existence as of December 31, 2010. Each of our 1999 Stock Option Plan and 1999 Director Option Plan has terminated, and no additional awards were, or may be, granted thereunder.
30
|
|
|
The following table sets forth selected financial data for each of the five years ended December 31, 2010 derived from our audited financial statements. You should read the information in the table below together with the section of this Annual Report on Form 10-K entitled “Management’s Discussion and Analysis of Financial Condition and Results of Operations,” which discusses the 2008, 2009 and 2010 fiscal years, and our financial statements and related notes and the other financial data included elsewhere in this Annual Report on Form 10-K.
|
|
|
|
|
|
|
|
|
|
|
|
|
|
|
|
|
|
|
|
|
Year Ended December 31, |
|
|||||||||||||
|
|
|
|
|
|||||||||||||
|
|
|
2006 |
|
2007 |
|
2008 |
|
2009 |
|
2010 |
|
|||||
|
|
|
|
|
|
|
|
|
|
|
|
|
|||||
|
Statement of Operations Data: |
|
|
|
|
|
|
|
|
|
|
|
|
|
|
|
|
|
Revenues |
|
$ |
24,740,000 |
|
$ |
17,083,000 |
|
$ |
27,046,000 |
|
$ |
10,316,000 |
|
$ |
25,861,000 |
|
|
Cost of revenues |
|
|
13,701,000 |
|
|
8,929,000 |
|
|
13,466,000 |
|
|
5,554,000 |
|
|
11,440,000 |
|
|
|
|
|
|
|
|
|
|
|
|
|
|
|
|
|
|
|
|
|
|
|
|
|
|
|
|
|
|
|
|
|
|
|
|
|
|
Gross profit |
|
|
11,039,000 |
|
|
8,154,000 |
|
|
13,580,000 |
|
|
4,762,000 |
|
|
14,421,000 |
|
|
Operating expenses: |
|
|
|
|
|
|
|
|
|
|
|
|
|
|
|
|
|
Selling, general and administrative expenses |
|
|
12,943,000 |
|
|
15,963,000 |
|
|
16,760,000 |
|
|
16,543,000 |
|
|
23,326,000 |
|
|
Research and development expenses |
|
|
2,639,000 |
|
|
2,849,000 |
|
|
2,883,000 |
|
|
2,604,000 |
|
|
4,429,000 |
|
|
|
|
|
|
|
|
|
|
|
|
|
|
|
|
|
|
|
|
|
|
|
|
|
|
|
|
|
|
|
|
|
|
|
|
|
|
Income (loss) from operations |
|
|
(4,543,000 |
) |
|
(10,658,000 |
) |
|
(6,063,000 |
) |
|
(14,385,000 |
) |
|
(13,334,000 |
) |
|
Interest income |
|
|
2,801,000 |
|
|
3,238,000 |
|
|
2,226,000 |
|
|
933,000 |
|
|
675,000 |
|
|
Interest expense |
|
|
(29,000 |
) |
|
(10,000 |
) |
|
— |
|
|
(130,000 |
) |
|
(56,000 |
) |
|
Other income (loss) |
|
|
155,000 |
|
|
89,000 |
|
|
338,000 |
|
|
390,000 |
|
|
104,000 |
|
|
|
|
|
|
|
|
|
|
|
|
|
|
|
|
|
|
|
|
|
|
|
|
|
|
|
|
|
|
|
|
|
|
|
|
|
|
Net income (loss) |
|
$ |
(1,616,000 |
) |
$ |
(7,341,000 |
) |
$ |
(4,175,000 |
) |
$ |
(13,192,000 |
) |
$ |
(12,611,000 |
) |
|
|
|
|
|
|
|
|
|
|
|
|
|
|
|
|
|
|
|
|
|
|
|
|
|
|
|
|
|
|
|
|
|
|
|
|
|
Net income (loss) per share - basic |
|
$ |
(0.15 |
) |
$ |
(0.66 |
) |
$ |
(0.38 |
) |
$ |
(1.20 |
) |
$ |
(1.12 |
) |
|
|
|
|
|
|
|
|
|
|
|
|
|
|
|
|
|
|
|
|
|
|
|
|
|
|
|
|
|
|
|
|
|
|
|
|
|
Net income (loss) per share - diluted |
|
$ |
(0.15 |
) |
$ |
(0.66 |
) |
$ |
(0.38 |
) |
$ |
(1.20 |
) |
$ |
(1.12 |
) |
|
|
|
|
|
|
|
|
|
|
|
|
|
|
|
|
|
|
|
|
|
|
|
|
|
|
|
|
|
|
|
|
|
|
|
|
|
Weighted average common shares outstanding - basic |
|
|
10,501,000 |
|
|
11,205,000 |
|
|
10,887,000 |
|
|
10,991,000 |
|
|
11,239,000 |
|
|
|
|
|
|
|
|
|
|
|
|
|
|
|
|
|
|
|
|
Weighted average common shares outstanding - diluted |
|
|
10,501,000 |
|
|
11,205,000 |
|
|
10,887,000 |
|
|
10,991,000 |
|
|
11,239,000 |
|
|
|
|
|
|
|
|
|
|
|
|
|
|
|
|
|
|
|
|
Balance Sheet Data (at end of period): |
|
|
|
|
|
|
|
|
|
|
|
|
|
|
|
|
|
|
|
|
|
|
|
|
|
|
|
|
|
|
|
|
|
|
|
Cash and cash equivalents |
|
$ |
9,644,000 |
|
$ |
5,103,000 |
|
$ |
12,558,000 |
|
$ |
19,481,000 |
|
$ |
14,491,000 |
|
|
|
|
|
|
|
|
|
|
|
|
|
|
|
|
|
|
|
|
Investments |
|
|
60,716,000 |
|
|
59,900,000 |
|
|
43,461,000 |
|
|
40,661,000 |
|
|
13,929,000 |
|
|
|
|
|
|
|
|
|
|
|
|
|
|
|
|
|
|
|
|
Total assets |
|
|
84,905,000 |
|
|
74,796,000 |
|
|
69,948,000 |
|
|
70,575,000 |
|
|
60,885,000 |
|
|
|
|
|
|
|
|
|
|
|
|
|
|
|
|
|
|
|
|
Long-term debt |
|
|
240,000 |
|
|
19,000 |
|
|
— |
|
|
— |
|
|
— |
|
|
|
|
|
|
|
|
|
|
|
|
|
|
|
|
|
|
|
|
Total stockholders’ equity |
|
|
81,284,000 |
|
|
71,670,000 |
|
|
67,085,000 |
|
|
55,881,000 |
|
|
44,745,000 |
|
31
|
|
|
|
Item 7. Management’s Discussion and Analysis of Financial Condition and Results of Operations |
|
The following discussion is intended to assist you in understanding our financial condition and results of operations and should be read in conjunction with the financial statements and related notes included elsewhere in this Annual Report on Form 10-K. Many of the amounts and percentages in this section have been rounded for convenience of presentation, but actual recorded amounts have been used in computations. Accordingly, some information may appear not to compute accurately.
Overview
I.D. Systems, Inc. (together with its subsidiaries, “I.D. Systems,” the “Company,” “we,” “our,” or “us”) develops, markets and sells wireless solutions for managing and securing high-value enterprise assets. These assets include industrial vehicles, such as forklifts, airport ground support equipment and rental vehicles, and transportation assets, such as dry van trailers, refrigerated trailers, railcars and containers. Our patented wireless asset management systems, utilize radio frequency identification (RFID),Wi-Fi, satellite or cellular communications, and sensor technology to address the needs of organizations to control, track, monitor and analyze their assets. Our solutions enable our customers to achieve tangible economic benefits by making timely, informed decisions that increase the security, productivity and efficiency of their operations. As used herein, references to “IDS” refer to our IDS operating segment, which consists of the our historical core wireless asset management systems operations, and references to “AI” refer to our AI operating segment, which consists of our data-driven telematics solutions business for transportation asset management conducted by Asset Intelligence, LLC.
We have focused our business activities on three primary applications: (i) industrial fleet management, (ii) transportation asset management, and (iii) rental fleet management. Our solution for industrial fleet management allows our customers to reduce operating costs and capital expenditures and to comply with certain safety regulations by accurately and reliably measuring and controlling fleet activity. This solution also enhances security at industrial facilities and areas of critical infrastructure, such as airports, by controlling access to, and restricting the use of, vehicles and equipment. Our solution for transportation asset management allows our customers to increase revenue per asset deployed, reduce fleet size, and improve the monitoring and control of sensitive cargo. Our solution for rental fleet management allows rental car companies to generate higher revenue by more accurately tracking vehicle data, such as fuel consumption and odometer readings, and improve customer service by expediting the rental and return processes. In addition, our wireless solution for “carsharing” enables rental car companies to establish a network of vehicles positioned strategically around cities for use by their members, control vehicles remotely, manage member reservations by phone or Internet, and charge members for vehicle use by the hour.
We sell our system to both executive and division-level management. Typically, our initial system deployment serves as a basis for potential expansion across the customer’s organization. We work closely with customers to help maximize the utilization and benefits of our system and demonstrate the value of enterprise-wide deployments. Post-implementation, we consult with our customers to further extend and customize the benefits to the enterprise by delivering enhanced analytics capabilities.
We market and sell our solutions to a wide range of customers in the commercial and government sectors. Our customers operate in diverse markets, such as automotive manufacturing, heavy industry, retail and wholesale distribution, transportation, aerospace and defense, homeland security and vehicle rental.
We have incurred net losses of approximately $4.2 million, $13.2 million and $12.6 million for the years ended December 31, 2008, 2009 and 2010, respectively, and have incurred additional net losses since inception. At December 31, 2010, we had an accumulated deficit of approximately $49.5 million.
During the year ended December 31, 2010, we generated revenues of $25.9 million and the Wal-Mart Stores, Inc. accounted for 26% of our revenues. During the year ended December 31, 2009, we generated revenues of $10.3 million and the U.S. Postal Service, Wal-Mart Stores, Inc., NACCO Materials Handling Group, Inc. and Ford Motor Company accounted for 20%, 15%, 15%, and 14% of our revenues, respectively. During the year ended December 31, 2008, we generated revenues of $27.0 million, and the U.S. Postal Service and Wal-Mart Stores, Inc. accounted for 42% and 41% of our revenues, respectively.
32
We are highly dependent upon sales of our system to a few customers. The loss of any of these key customers, or any material reduction in the amount of our products they purchase during a particular period, could materially and adversely affect our revenues for such period. Conversely, a material increase in the amount of our products purchased by a key customer (or customers) during a particular period could result in a significant increase in our revenues for such period, and such increased revenues may not recur in subsequent periods. Some of these key customers, as well as other customers of the Company, operate in markets that have suffered business downturns in the past few years or may so suffer in the future, particularly in light of the current global economic downturn, and any material adverse change in the financial condition of such customers could materially and adversely affect our financial condition and results of operations. If we are unable to replace such revenue from existing or new customers, the market price of our common stock could decline significantly.
We expect that many customers who utilize our solutions will do so as part of a large-scale deployment of these solutions across multiple or all divisions of their organizations. A customer’s decision to deploy our solutions throughout its organization will involve a significant commitment of its resources. Accordingly, initial implementations may precede any decision to deploy our solutions enterprise-wide. Throughout this sales cycle, we may spend considerable time and expense educating and providing information to prospective customers about the benefits of our solutions.
The timing of the deployment of our solutions may vary widely and will depend on the specific deployment plan of each customer, the complexity of the customer’s organization and the difficulty of such deployment. Customers with substantial or complex organizations may deploy our solutions in large increments on a periodic basis. Accordingly, we may receive purchase orders for significant dollar amounts on an irregular and unpredictable basis. Because of our limited operating history and the nature of our business, we cannot predict the timing or size of these sales and deployment cycles. Long sales cycles, as well as our expectation that customers will tend to place large orders sporadically with short lead times, may cause our revenues and results of operations to vary significantly and unexpectedly from quarter to quarter.
Our ability to increase our revenues and generate net income will depend on a number of factors, including our ability to:
|
|
|
|
|
|
• |
increase sales of products and services to our existing customers; |
|
|
|
|
|
|
• |
convert our initial programs into larger or enterprise-wide purchases by our customers; |
|
|
|
|
|
|
• |
increase market acceptance and penetration of our products; and |
|
|
|
|
|
|
• |
develop and commercialize new products and technologies. |
Critical Accounting Policies And Estimates
We have adopted various accounting policies that govern the application of accounting principles generally accepted in the United States in the preparation of our financial statements. Our significant accounting policies are described in Note 2 to our consolidated financial statements included in this Annual Report on Form 10-K. Certain accounting policies involve significant judgments and assumptions by our management that can have a material impact on the carrying value of certain assets and liabilities. We consider such accounting policies to be our critical accounting policies. The judgments and assumptions used by our management in these critical accounting policies are based on historical experience and other factors that our management believes to be reasonable under the circumstances. Because of the nature of these judgments and assumptions, actual results could differ significantly from these judgments and estimates, which could have a material impact on the carrying values of our assets and liabilities and our results of operations. Our critical accounting policies are described below.
33
Revenue Recognition
We derive revenue from: (i) sales of our industrial fleet and rental fleet wireless asset management systems and services, which includes training and technical support; (ii) sale of our remote asset wireless asset management systems and spare parts sold to customers (for which title transfers on date of customer receipt) and from the related communication services under contracts that generally provide for service over periods ranging from one to five years; (iii) from post-contract maintenance and support agreements; and (iv) periodically, from leasing arrangements.
Our industrial and rental fleet wireless asset management systems consist of on-asset hardware, communication infrastructure and software. Revenue derived from the sale of our industrial and rental fleet wireless asset management systems is allocated to each element based upon vendor specific objective evidence (VSOE) of the fair value of the element. VSOE of the fair value is based upon the price charged when the element is sold separately. Revenue is recognized as each element is earned based on the selling price of each element, and when there are no undelivered elements that are essential to the functionality of the delivered elements. The Company’s system is typically implemented by the customer or a third party and, as a result, revenue is recognized when title and risk of loss passes to the customer, which usually is upon delivery of the system, persuasive evidence of an arrangement exists, sales price is fixed and determinable, collectability is reasonably assured and contractual obligations have been satisfied. In some instances, we are also responsible for providing installation services. The additional installation services, which could be performed by third parties, are considered another element in a multi-element deliverable and revenue for installation services is recognized at the time the installation is provided. Training and technical support revenue are recognized at time of performance.
We recognize revenues from the sale of remote asset wireless asset management systems and spare parts when persuasive evidence of an arrangement exists, delivery has occurred, the price is fixed or determinable, and collectability is reasonably assured. These criteria include requirements that the delivery of future products or services under the arrangement is not required for the delivered items to serve their intended purpose. We have determined that the revenue derived from the sale of remote asset wireless management systems does not have stand alone value to the customer separate from the communication services provided and therefore the arrangements constitute a single unit of accounting. Under these provisions, all of the Company’s billings for equipment and the related cost are deferred, recorded, and classified as a current and long-term liability and a current and long-term asset, respectively. Deferred revenue and cost are recognized over the service contract life, beginning at the time that a customer acknowledges acceptance of the equipment and service. The customer service contracts typically range from one to five years.
The service revenue for our remote asset monitoring equipment relates to charges for monthly messaging usage and value-added features charges. The usage fee is a monthly fixed charge based on the expected utilization according to the rate plan chosen by the customer. Service revenue generally commences upon equipment installation and customer acceptance, and is recognized over the period such services are provided.
Spare parts sales are reflected in product revenues and recognized on the date of customer receipt of the part. Revenue from remote asset monitoring equipment activation fees are deferred and amortized over the life of the contract.
We also derive revenue under leasing arrangements of remote asset monitoring equipment. Such arrangements provide for monthly payments covering the system sale, maintenance, support and interest. These arrangements meet the criteria to be accounted for as sales-type leases. Accordingly, an asset is established for the “sales-type lease receivable” and revenue is deferred and recognized over the service contract as described above. Maintenance revenues and interest income are recognized monthly over the lease term.
We also enter into post-contract maintenance and support agreements for our wireless asset management systems. Revenue is recognized over the service period and the cost of providing these services is expensed as incurred.
Stock-Based Compensation
We account for stock-based employee compensation for all share-based payments, including grants of stock options, as an operating expense, based on their fair values on the grant date. The Company recorded stock-based compensation expense of $2,989,000, $2,157,000 and $1,558,000 for the years ended December 31, 2008, 2009 and 2010, respectively.
We estimate the fair value of share-based payment awards on the grant date using an option pricing model. The value of the portion of the award that is ultimately expected to vest is recognized as expense over the requisite service period in our consolidated statement of operations. We estimate forfeitures at the time of grant in order to estimate the amount of share-based awards that will ultimately vest. The estimate is based on our historical rates of forfeitures. Estimated forfeitures are revised, if necessary, in subsequent periods if actual forfeitures differ from those estimates.
Long-lived Assets
Long-lived assets are reviewed for impairment whenever events or changes in circumstances indicate that the carrying amount of an asset may not be recoverable. Recoverability of assets to be held and used is measured by a comparison of the carrying amount of the assets to the future undiscounted net cash flows expected to be generated by the asset. If such assets are considered to be impaired, the impairment to be recognized is measured by the amount by which the carrying amount of the assets exceeds the fair value of the assets and would be charged to earnings.
Goodwill and Other Intangible Assets
Goodwill represents costs in excess of fair values assigned to the underlying net assets of acquired businesses. Goodwill and intangible assets deemed to have indefinite lives are not amortized. Intangible assets are amortized over their estimated useful lives unless the lives are determined to be indefinite. Intangible assets are carried at cost, less accumulated amortization and impairment charges. Intangible assets consist of trademarks and trade names, patents, customer relationships and other intangible assets. We test goodwill and other intangible assets annually, or when a triggering event occurs between annual impairment tests, to determine if impairment exists and if the use of indefinite lives is currently applicable.
Product Warranties
The AI segment provides a one-year warranty on its products. Estimated future warranty costs are accrued in the period that the related revenue is recognized. These estimates are derived from historical data and trends of product reliability and costs of repairing and replacing defective products.
34
Income taxes
We use the asset and liability method of accounting for deferred income taxes. Deferred income taxes are measured by applying enacted statutory rates to net operating loss carryforwards and to the differences between the financial reporting and tax bases of assets and liabilities. Deferred tax assets are reduced, if necessary, by a valuation allowance if it is more likely than not that some portion or all of the deferred tax assets will not be realized.
Fair Value Measurements
In determining fair value of financial instruments, we utilize a fair value hierarchy that prioritizes the inputs to valuation techniques used to measure fair value into three broad levels. The following is a brief description of those levels:
|
|
|
|
|
|
§ |
Level 1: Unadjusted quoted prices in active markets for identical assets or liabilities. |
|
|
|
|
|
|
§ |
Level 2: Inputs other than quoted prices that are observable for the asset or liability, either directly or indirectly. These include quoted prices for similar assets or liabilities in active markets and quoted prices for identical or similar assets or liabilities in markets that are not active. |
|
|
|
|
|
|
§ |
Level 3: Unobservable inputs that reflect the reporting entity’s own assumptions. |
Results of Operations
The following table sets forth certain items related to our statement of operations as a percentage of revenues for the periods indicated and should be read in conjunction with our consolidated financial statements and the related notes included elsewhere in this Annual Report on Form 10-K. A detailed discussion of the material changes in our operating results is set forth below.
|
|
|
|
|
|
|
|
|
|
|
|
|
|
|
Year Ended December 31, |
|
|||||||
|
|
|
|
|
|||||||
|
|
|
2008 |
|
2009 |
|
2010 |
|
|||
|
|
|
|
|
|
|
|
|
|||
|
Revenues: |
|
|
|
|
|
|
|
|
|
|
|
Products |
|
|
74.2 |
% |
|
62.7 |
% |
|
36.7 |
% |
|
Services |
|
|
25.8 |
|
|
37.3 |
|
|
63.3 |
|
|
|
|
|
|
|
|
|
|
|
|
|
|
|
|
|
100.0 |
|
|
100.0 |
|
|
100.0 |
|
|
|
|
|
|
|
|
|
|
|
|
|
|
Cost of revenues: |
|
|
|
|
|
|
|
|
|
|
|
Cost of products |
|
|
37.0 |
|
|
37.6 |
|
|
19.6 |
|
|
Cost of services |
|
|
12.8 |
|
|
16.2 |
|
|
24.6 |
|
|
|
|
|
|
|
|
|
|
|
|
|
|
|
|
|
|
|
|
|
|
|
|
|
|
Total gross profit |
|
|
50.2 |
|
|
46.2 |
|
|
55.8 |
|
|
|
|
|
|
|
|
|
|
|
|
|
|
Selling, general and administrative expenses |
|
|
62.0 |
|
|
160.4 |
|
|
90.2 |
|
|
Research and development expenses |
|
|
10.7 |
|
|
25.2 |
|
|
17.1 |
|
|
|
|
|
|
|
|
|
|
|
|
|
|
|
|
|
|
|
|
|
|
|
|
|
|
Loss from operations |
|
|
(22.4 |
) |
|
(139.4 |
) |
|
(51.5 |
) |
|
Interest income |
|
|
8.2 |
|
|
9.0 |
|
|
2.6 |
|
|
Interest expense |
|
|
— |
|
|
(1.3 |
) |
|
(0.2 |
) |
|
Other income (loss) |
|
|
(1.2 |
) |
|
3.8 |
|
|
0.4 |
|
|
|
|
|
|
|
|
|
|
|
|
|
|
|
|
|
|
|
|
|
|
|
|
|
|
Net loss |
|
|
(15.4 |
)% |
|
(127.9 |
)% |
|
(48.7 |
)% |
|
|
|
|
|
|
|
|
|
|
|
|
35
Year Ended December 31, 2010 Compared to Year Ended December 31, 2009
|
|
|
|
|
REVENUES. Revenues increased by $15.6 million, or 150.7%, to $25.9 million in 2010 from $10.3 million in the same period in 2009. The increase in revenue is principally attributable to revenue of $15.2 million from AI, which was acquired on January 7, 2010. |
|
|
|
|
|
Revenues from products increased by $3.0 million, or 46.6%, to $9.5 million in 2010 from $6.5 million in the same period in 2009. Overall, the increase in revenues was attributable to AI product revenue of $2.2 million, which includes $0.7 million of revenue from Wal-Mart Stores, Inc. and an increase in IDS product revenue of $0.8 million resulting principally from an increase in revenue from the Raymond Corporation and Ford Motor Company of $1.1 million and $0.4 million, respectively, as well as other customers, offset by decreased product sales to the U. S. Postal Service and NACCO Material Handling Group, Inc. of $0.9 million, and $0.8 million, respectively. |
|
|
|
|
|
Revenues from services increased by $12.5 million, or 325.8%, to $16.4 million in 2010 from $3.8 million in the same period in 2009. The increase in service revenue is primarily attributable to AI service revenue of $12.9 million, which consists principally of revenue from Wal-Mart Stores, Inc. and GE Trailer Fleet Services of $5.2 million and $1.6 million, respectively, partially offset by a decrease in IDS service revenue of $0.4 million resulting principally from a decrease in the amount of services rendered to the U. S. Postal Service of $0.7 million. |
|
|
|
|
|
COST OF REVENUES. Cost of revenues increased by $5.8 million, or 106.0%, to $11.4 million in 2010 from $5.6 million for the same period in 2009. The increase is attributable to the increase in revenue in 2010 from the acquisition of AI. Gross profit was $14.4 million in 2010 compared to $4.8 million in 2009. As a percentage of revenues, gross profit increased to 55.8% in 2010 from 46.2% in 2009. |
|
|
|
|
|
Cost of products increased by $1.2 million, or 30.8%, to $5.1 million in 2010 from $3.9 million in the same period in 2009. Gross profit for products was $4.4 million in 2010 compared to $2.6 million in 2009. The increase in gross profit was attributable to a gross profit contribution of $1.0 million from AI and an increase of $0.8 million in the IDS gross profit. As a percentage of product revenues, gross profit increased to 46.5% in 2010 from 40.0% in 2009. The increase in gross profit as a percent of product revenue was due to an increase in the IDS gross profit percentage to 46.4% in 2010 from 40.0% in 2009 and AI product revenue contributing a gross profit percentage of 46.6% in 2010. The increase in gross profit was primarily due to a $0.6 million reserve for inventory obsolescence in 2009. |
|
|
|
|
|
Cost of services increased by $4.7 million, or 280.6%, to $6.4 million in 2010 from $1.7 million in the same period in 2009. Gross profit for services was $10.0 million in 2010 compared to $2.2 million in 2009. The increase in gross profit was attributable to a gross profit contribution of $7.9 million from AI partially offset by a decrease of $0.1 million in the IDS gross profit. As a percentage of service revenues, gross profit increased to 61.1% in 2010 from 56.5% in 2009. The increase in gross profit as a percent of services revenue was due to an increase in the IDS gross profit percentage to 61.0% in 2010 from 56.5% in 2009 and AI service revenue contributing a higher gross profit percentage of 61.2% in 2010. The increase in the IDS gross profit margin was primarily due to an increase in service revenue with fixed costs remaining constant, driving the margin higher. |
|
|
|
|
|
SELLING, GENERAL AND ADMINISTRATIVE EXPENSES. Selling, general and administrative expenses increased by $6.8 million, or 41.0%, to $23.3 million in 2010 compared to $16.5 million in 2009. This increase was primarily attributable to AI selling, general and administrative expenses of $9.9 million consisting principally of payroll-related expenses of $3.6 million, consulting expenses of $2.5 million, depreciation and amortization expense of $1.9 million, travel expenses of $0.4 million and communication and technology expenses of $0.9 million, partially offset by decreases in payroll-related and stock-based compensation expense of $2.1 million and professional fees of $1.5 million. As a percentage of revenues, selling, general and administrative expenses decreased to 90.2% in 2010 from 160.4% in the same period in 2009, primarily due to the increase in revenue resulting from the AI acquisition. |
|
|
|
|
|
RESEARCH AND DEVELOPMENT EXPENSES. Research and development expenses increased by $1.8 million, or 70.1%, to $4.4 million in 2010 from $2.6 million in 2009 due primarily to AI research and development expenses of $2.4 million consisting principally of payroll-related and engineering development expenses of $1.4 million and $0.3 million, respectively, offset by a decrease in payroll-related and stock-based compensation expense of $0.3 million. As a percentage of revenues, research and development expenses decreased to 17.1% in 2010 from 25.2% in 2009, primarily due to the increase in revenue resulting from the AI acquisition. |
|
|
|
|
|
INTEREST INCOME. Interest income decreased by $258,000 to $675,000 in 2010 from $933,000 in the same period in 2009. This decrease was attributable primarily to the decrease in cash and investments and in the rate of interest earned on the Company’s cash and investments. |
|
|
|
|
|
INTEREST EXPENSE. Interest expense of $56,000 decreased by $74,000 in 2010 from $130,000 in the same period in 2009. This decrease was due to the principal reduction in Company’s line of credit borrowing facility. |
36
|
|
|
|
|
OTHER INCOME/EXPENSE. Other income of $104,000 in 2010 decreased $286,000 from other income of $390,000 in the same period in 2009. Other income for the year ended December 31, 2010 consists principally of the remeasurement of the Didbox contingent consideration of $110,000. |
|
|
|
|
|
NET LOSS. Net loss was $12.6 million, or $(1.12) per basic and diluted share, in 2010, as compared to net loss of $13.2 million, or $(1.20) per basic and diluted share, in 2009. The decrease in the net loss was due primarily to the reasons described above. |
Year Ended December 31, 2009 Compared to Year Ended December 31, 2008
REVENUES. Revenues decreased by $16.7 million, or 61.9%, to $10.3 million in 2009 from $27.0 million in 2008. The decrease in revenues was primarily attributable to the decrease in revenue from the U.S. Postal Service in the amount of $9.3 million due to a spending freeze and from Wal-Mart Stores, Inc. in the amount of $9.6 million, partially offset in increases in revenue from Ford Motor Company of $0.9 million, NACCO Materials Handling Group, Inc. of $1.0 million and American Eagle Airlines of $0.7 million.
Revenues from products decreased by $13.6 million, or 67.8%, to $6.5 million in 2009 from $20.1 million in 2008. The decrease in revenues was primarily attributable to the decrease in revenue from the U.S. Postal Service and from Wal-Mart Stores, Inc. noted above.
Revenues from services decreased by $3.1 million, or 44.9%, to $3.8 million in 2009 from $6.9 million in 2008. The decrease in service revenue is primarily attributable to a decrease in the amount of services rendered to the U.S. Postal Service to a spending freeze and Wal-Mart Stores, Inc., as noted above.
COST OF REVENUES. Cost of revenues decreased by $7.9 million, or 58.8%, to $5.6 million in 2009 from $13.5 million in 2008. The decrease was attributable to the decrease in revenue in 2009. Gross profit was $4.8 million in 2009 compared to $13.6 million in 2008. As a percentage of revenues, gross profit decreased to 46.2% in 2009 from 50.2% in 2008.
Cost of products decreased by $6.1 million, or 61.2%, to $3.9 million in 2009 from $10.0 million in 2008. Gross profit for products was $2.6 million in 2009 compared to $10.1 million in 2008. As a percentage of product revenues, gross profit decreased to 40.0% in 2009 from 50.2% in 2008. The decrease in gross profit was primarily due to a $0.6 million charge for inventory obsolescence.
Cost of services decreased by $1.8 million, or 51.8%, to $1.7 million in 2009 from $3.5 million in 2008. Gross profit for services was $2.2 million in 2009 compared to $3.5 million in 2008. As a percentage of service revenues, gross profit increased to 56.5% in 2009 from 50.2% in 2008. The gross margin increase was due to a mix in service revenue. During 2008, a higher percentage of our service revenue was for vehicle and infrastructure installations for the U.S. Postal Service. Those services are performed by subcontractors and have lower gross margins than training and support services performed by our own field staff. Also, maintenance revenue, which has higher margins, increased by $568,000, or 77%, in 2009 compared to 2008.
SELLING, GENERAL AND ADMINISTRATIVE EXPENSES. Selling, general and administrative expenses decreased $217,000, or 1.3%, to $16.5 million in 2009 compared to $16.8 million in 2008. This decrease was primarily attributable to decreases in non-payroll selling expenses of $428,000, recruiting costs of $110,000, bonuses of $184,000, commissions of $330,000, travel and entertainment expenses of $114,000, stock-based compensation of $713,000, payroll related expenses of $277,000 as a result of staff reductions in April 2009, no management incentive compensation and cost reduction initiatives partially offset by increases in acquisition costs of $1.3 million and other professional fees of $651,000. As a percentage of revenues, selling, general and administrative expenses increased to 160.4% in 2009 from 62.0% in 2008 due to a decrease in revenue.
RESEARCH AND DEVELOPMENT EXPENSES. Research and development expenses decreased $279,000, or 9.7%, to $2.6 million in 2009 from $2.9 million in 2008. The decrease was primarily attributable to decreases in payroll-related and stock compensation expenses of $333,000, offset by an increase in consulting expenses of $113,000. As a percentage of revenues, research and development expenses increased to 25.2% in 2009 from 10.7% in 2008 due primarily to a decrease in revenue in 2009 in comparison to 2008, as discussed above.
INTEREST INCOME. Interest income decreased $1,293,000, or 58.1%, to $933,000 in 2009 from $2.2 million in 2008. This decrease was attributable primarily to the decrease in interest rates earned on the Company’s investments.
INTEREST EXPENSE Interest expense increased by $130,000 in 2009 from $0 in 2008. This increase was due to interest expense incurred on the Company’s line of credit borrowing facility which was not in place during 2008.
OTHER INCOME. Other income of $390,000 in 2009 principally reflects the change in the fair value of the Company’s investment in auction-rate securities and the auction rate securities right.
NET LOSS. Net loss was $13.2 million, or $(1.20) per basic and diluted share, in 2009 as compared to net loss of $4.2 million, or $(0.38) per basic and diluted share, in 2008. The increase in net loss was due primarily to the reasons described above.
37
Liquidity and Capital Resources
Historically, except for our line of credit borrowing of $12.9 million in the first quarter of 2009, our capital requirements have been funded primarily from the net proceeds from the issuance of our securities, including any issuances of our common stock upon the exercise of options and warrants. As of December 31, 2010, we had cash and marketable securities of $28.4 million and working capital of $24.8 million, compared to cash and marketable securities of $60.1 million and working capital of $47.7 million as of December 31, 2009.
At December 31, 2009 and 2010, the Company held approximately $19.4 million and $-0- fair value in ARS and ARSR, respectively. These ARS represented interests in collateralized pools of student loan receivables issued by agencies established by counties, cities, states and other municipal entities within the United States. Liquidity for these ARS is typically provided by an auction process that resets the applicable interest rate at pre-determined intervals. Starting in February 2008 and continuing through 2010, these securities failed to sell at auction. These failed auctions represented liquidity risk exposure and are not defaults or credit events. As a holder of the securities, the Company continued to receive interest on the ARS until the ARS were sold or repurchased.
The Company purchased all of the ARS it held from UBS AG (“UBS”). In October 2008, the Company received a non-transferable offer (the “Offer”) from UBS for a put right (the “ARSR”) permitting the Company to sell to UBS at par value all ARS previously purchased from UBS at a future date (any time during a two-year period beginning June 30, 2010). The Offer also included a commitment to loan the Company 75% of the UBS-determined value of the ARS at any time until the put is exercised at a variable interest rate equal to the lesser of: (i) the applicable reference rate plus a spread set forth in the applicable credit agreement and (ii) the then-applicable weighted-average interest or dividend rate paid to the Company by the issuer of the ARS that is pledged to UBS as collateral. In November 2008, the Company accepted the Offer. In exchange for the Offer, the Company provided UBS with a general release of claims (other than certain consequential damages claims) concerning our ARS and granted UBS the right to purchase the Company’s ARS at any time for full par value. In June 2010, the Company exercised its right under the ARSR to put back the ARS to UBS. During June and July 2010, UBS repurchased all of the outstanding ARS at par value. The Company no longer holds any ARS.
Business Acquisitions
On April 18, 2008, we acquired the assets of PowerKey, the industrial vehicle monitoring products division of International Electronics, Inc., a manufacturer of access control and security equipment, for approximately $573,000, which includes approximately $73,000 of direct acquisition costs. The tangible assets acquired include inventory (totaling approximately $191,000) and fixed assets (totaling approximately $4,000).
Allocation of the purchase price of the intangible assets consists of the following: goodwill (totaling approximately $200,000), trademarks and trade names (totaling approximately $74,000), and a customer list (totaling approximately $104,000).
On October 19, 2009, we acquired Didbox Ltd. (“Didbox”), a privately held manufacturer and marketer of vehicle operator identification systems based in the United Kingdom (“UK”). The transaction was valued at approximately $660,000 and was structured with $534,000 paid up front in cash and contingent consideration of $110,000 due in 12 months based upon and subject to achievement of certain revenue and operating profit targets. We originally recorded $110,000 of contingent consideration based on the expected revenue and operating profits of Didbox during the measurement period applicable to the contingent consideration. The contingent consideration was reversed to other income during the third quarter of 2010, as we did not expect Didbox to meet the revenue and operating profit targets. The Company incurred acquisition-related expenses of approximately $43,000, which are included in selling, general and administrative expenses in the consolidated statement of operations for the year ended December 31, 2009. The Didbox business compliments the Company’s existing businesses with access to OEM dealer network in the UK, and the ability to add the I.D. Systems solution set to its product line. In addition, the acquisition is expected to provide the Company with access to a broader base of customers in Europe.
The assets and liabilities of the acquired businesses are accounted for under the purchase method of accounting and recorded at their estimated fair values at the dates of acquisition. The excess of the purchase price over the estimated fair values of the net assets acquired was recorded as goodwill. The goodwill is not expected to be deductible for tax purposes. The allocation of the Didbox purchase price consists of the following:
|
|
|
|
|
|
|
Current assets |
|
$ |
93,000 |
|
|
Other assets |
|
|
36,000 |
|
|
Current liabilities |
|
|
(104,000 |
) |
|
Goodwill |
|
|
419,000 |
|
|
Trademarks and tradenames |
|
|
61,000 |
|
|
Customer list |
|
|
56,000 |
|
|
Other intangibles |
|
|
83,000 |
|
|
|
|
|
|
|
|
Fair value of assets acquired |
|
$ |
644,000 |
|
|
|
|
|
|
|
38
The fair value of the current assets acquired includes trade accounts receivables with a fair value of $56,000. The gross amount due is $56,000, which is expected to be collected. The results of operations of acquired businesses have been included in the consolidated statement of operations as of the effective date of acquisition. Pro forma results of operations have not been presented because the effects of the acquisitions were not material.
On January 7, 2010, the Company entered into a Membership Interest Purchase Agreement (the “Purchase Agreement”) with General Electric Capital Corporation (“GECC”) and GE Asset Intelligence, LLC (“ GEAI ”), pursuant to which the Company acquired GEAI’s telematics business (the “GEAI Business”) through the purchase of 100% of the membership interests of Asset Intelligence, LLC (“AI”), a newly formed, wholly owned subsidiary of GEAI into which substantially all of the assets, including intellectual property, and liabilities of the GEAI Business had been transferred immediately prior to the closing. Effective with the closing of the transaction on January 7, 2010, AI became a wholly owned subsidiary of the Company. In connection with the transaction, AI offered employment to all of the former employees of the GEAI Business. The AI business compliments the Company’s existing businesses, as AI’s focus on trucking, rail, marine and intermodal applications significantly expands the scope of assets addressed by I.D. Systems’ product solutions. In addition, the acquisition is expected to provide the Company with access to a broader base of customers.
AI combines web-based software technologies with satellite and cellular communications to deliver data-driven telematics solutions for supply chain asset management. These solutions help secure and optimize the performance of trailers, railcars, containers, and the freight they carry, enabling shippers and carriers to maximize security and efficiency throughout their supply chains.
AI’s VeriWise™ product platform provides comprehensive real-time data for faster, more informed decision-making in multiple supply chain applications:
|
|
|
|
|
|
• |
Asset Optimization—combining web-based asset visibility and advanced telemetry data to monitor the condition of fleet assets, streamline asset deployment, optimize utilization, and maximize return on investment. |
|
|
|
|
|
|
• |
Cold Chain Management—maintaining the condition and quality of temperature-sensitive cargo from point A to point B, and all the points in between. |
|
|
|
|
|
|
• |
Fleet Maintenance—utilizing sensor technologies, real-time data and a wealth of transportation maintenance knowledge to help control maintenance costs, improve preventative maintenance practices, increase asset up-time, extend asset life, and reduce overall cost of ownership. |
|
|
|
|
|
|
• |
Fuel Management—monitoring key factors in fuel consumption, such as tire pressure and engine idle time, to help optimize fuel performance and reduce transportation costs. |
|
|
|
|
|
|
• |
Security & Safety—protecting valuable assets and cargo throughout the supply chain. |
39
Under the terms of the Purchase Agreement, the Company paid consideration of $15 million in cash at closing. In addition, the Company would have been required to pay additional cash consideration of up to $2 million in or about February 2011, contingent upon the number of new units of telematics equipment sold or subject to a binding order to be sold by AI during the year ending December 31, 2010. However, the applicable units targets were not achieved and therefore none of the additional contingent consideration was earned.
The Company incurred acquisition-related expenses of approximately $1,355,000, of which $1,241,000 are included in selling, general and administrative expenses in 2009 and $114,000 in 2010.
The acquisition was accounted for using the acquisition method of accounting and the purchase price was assigned to the net assets acquired based on the fair value of such assets and liabilities at the date of acquisition. The Company originally recorded in the preliminary purchase price allocation $1,017,000 of contingent consideration based on the estimated number of new units of telematics equipment to be sold in 2010. The contingent consideration was estimated using a probability weighted calculation of the number of new units of telematics equipment expected to be sold in 2010. The contingent consideration was reversed during the second quarter of 2010 based on revised forecasts which indicated AI would not meet the required number of new unit sales during the measurement period for the contingent consideration. The following table summarizes the final allocation of the AI purchase price to the assets acquired and liabilities assumed at the date of acquisition:
|
|
|
|
|
|
|
Current assets, excluding inventory |
|
$ |
4,709,000 |
|
|
Inventory |
|
|
5,236,000 |
|
|
Other assets, net |
|
|
3,218,000 |
|
|
Current liabilities |
|
|
(5,746,000 |
) |
|
Intangibles |
|
|
6,365,000 |
|
|
Goodwill |
|
|
1,218,000 |
|
|
|
|
|
|
|
|
|
|
|
|
|
|
Fair value of assets acquired |
|
$ |
15,000,000 |
|
|
|
|
|
|
|
The goodwill arising from the acquisition consists largely of the synergies and cost reductions through economies of scale expected from combining the operations of the Company and AI. The goodwill is expected to be fully deductible for tax purposes.
40
Operating Activities
Net cash used in operating activities was $3.6 million for the year ended December 31, 2010, compared to net cash used in operating activities of $6.9 million for the year ended December 31, 2009. The net cash used in operating activities for the year ended December 31, 2010 reflects a net loss of $12.6 million and includes non-cash charges of $1.6 million for stock-based compensation and $2.4 million for depreciation and amortization expense. Changes in working capital items, net of $4.2 million of working capital acquired in the AI transaction, included:
|
|
|
|
|
|
• |
a decrease in accounts receivable of $0.6 million resulting from increased cash collections; |
|
|
|
|
|
|
• |
an increase in deferred costs, prepaid expenses and other assets of $3.3 million; |
|
|
|
|
|
|
• |
an increase in deferred revenue of $4.5 million; |
|
|
|
|
|
|
• |
a decrease in inventory of $2.4 million; and |
|
|
|
|
|
|
• |
an increase in accounts payable and accrued expenses of $1.6 million, primarily due to the timing of payments to our vendors. |
Net cash used in operating activities was $6.9 million for the year ended December 31, 2009, compared to net cash used in operating activities of $4.9 million for the year ended December 31, 2008. The net cash used in operating activities for the year ended December 31, 2009 reflects a net loss of $13.2 million and includes non-cash charges of $2.2 million for stock-based compensation, $0.6 million for inventory reserves and $0.5 million for depreciation and amortization expense. Changes in working capital items included:
|
|
|
|
• |
a decrease in accounts receivable of $5.0 million resulting from the cash collections related to receivables outstanding at December 31, 2008 and the overall decrease in revenue; |
|
• |
an increase in inventory of $1.8 million; and |
|
• |
a decrease in accounts payable and accrued expenses of $0.4 million primarily due to the timing of payments to our vendors. |
Investing Activities
Net cash provided by investing activities was $10.3 million for the year ended December 31, 2010, compared to net cash provided by investing activities of $2.2 million for the year ended December 31, 2009. The change was due primarily to net redemptions of investments of $26.8 million, partially offset by $15.0 million used for the purchase of AI and $1.5 million in fixed asset additions.
Net cash provided by investing activities was $2.2 million for the year ended December 31, 2009, compared to net cash provided by investing activities of $15.4 million for the year ended December 31, 2008. The change was due primarily to an increase in the maturities of investments, which was partially offset by fewer purchases of investments and the business acquisition of Didbox Ltd.
Financing Activities
Net cash used in financing activities was $11.7 million for the year ended December 31, 2010, compared to net cash provided by financing activities of $11.6 million for the year ended December 31, 2009. The decrease was principally due to principal payments on the UBS line of credit from the redemption of the ARS of $11.6 million in 2010 and the borrowing of $12.9 million from the UBS line of credit facility in 2009.
Net cash provided by financing activities was $11.6 million for the year ended December 31, 2009, compared to net cash used in financing activities of $3.0 million for the year ended December 31, 2008. The increase was due to the borrowing of $12.9 million from the UBS line of credit facility.
Capital Requirements
We believe that with the proceeds received from our public offering that was completed by us in March 2006, the cash we have on hand and operating cash flows we expect to generate, we will have sufficient funds available to cover our capital requirements for at least the next 12 months.
Our capital requirements depend on a variety of factors, including, but not limited to, the length of the sales cycle, the rate of increase or decrease in our existing business base, the success, timing, and amount of investment required to bring new products to market, revenue growth or decline and potential acquisitions. Failure to generate positive cash flow from operations will have a material adverse effect on our business, financial condition and results of operations. We may determine in the future that we require additional funds to meet our long-term strategic objectives, including for the completion of potential acquisitions. Any additional equity financing may be dilutive to stockholders, and debt financing, if available, may involve significant restrictive covenants, and we cannot assure you that such financing will be extended on terms acceptable to us or at all.
41
Term Loan
In January 2003, we closed on a five-year term loan for $1,000,000 with a financial institution. Interest at the 30-day LIBOR plus 1.75% and principal are payable monthly. To hedge the loan’s floating interest expense, we entered into an interest rate swap contemporaneously with the closing of the loan and fixed the rate of interest at 5.28% for the five-year term. At December 31, 2007, the outstanding balance on the loan was $19,000. In February 2008, we paid off the remaining principal balance on the loan which was $0 at December 31, 2008. The term-loan expired in 2008.
Line of Credit
In October 2008, the Company received an offer (the “Offer”) from UBS for a put right (the “ARSR”) permitting the Company to sell to UBS at par value all auction-rate securities (“ARS”) held by the Company, all of which were purchased by the Company from UBS, at a future date (any time during a two-year period beginning June 30, 2010). Included as part of the Offer, the Company received a commitment to obtain a loan for 75% of the UBS-determined value of the ARS at any time until the put option is exercised at a variable interest rate (1.24% at December 31, 2009) equal to the lesser of: (i) the applicable reference rate plus a spread set forth in the applicable credit agreement and (ii) the then-applicable weighted average interest or dividend rate paid to the Company by the issuer of the ARS that is pledged to UBS as collateral. The Company accepted the Offer in November 2008. In March 2009, the Company borrowed $12,900,000 (which amount was equal to 75% of the UBS-determined value of the ARS) against this credit facility. Principal payments reduced the Company’s obligation to $11,638,000 at December 31, 2009. This line of credit facility was payable on demand. The line of credit facility was repaid in July 2010 from the redemption of the ARS. Upon the redemption of the ARS, the line of credit expired.
Contractual Obligations and Commitments
The following table summarizes our significant contractual obligations and commitments as of December 31, 2010:
|
|
|
|
|
|
|
|
|
|
|
|
|
|
|
|
|
|
|
|
|
Payment due by Period |
|
|||||||||||||
|
|
|
|
|
|||||||||||||
|
|
|
Total |
|
Less than |
|
1 to 3 years |
|
3 to 5 years |
|
After 5 |
|
|||||
|
|
|
|
|
|
|
|
|
|
|
|
|
|||||
|
Operating leases |
|
$ |
4,946,000 |
|
$ |
634,000 |
|
$ |
1,315,000 |
|
$ |
943,000 |
|
$ |
2,054,000 |
|
Purchase orders or contracts for the purchase of raw materials and other goods and services are not included in the table above. We are not able to determine the aggregate amount of such purchase orders that represent contractual obligations, as purchase orders may represent authorizations to purchase rather than binding agreements. Although we have entered into contracts for services, the obligations under these contracts were not significant and the contracts generally contain clauses allowing for cancellation without significant penalty.
The expected timing or payment of obligations discussed above is estimated based on current information. Timing of payments and actual amounts paid may be different depending on changes to agreed upon amounts for some obligations.
Inflation
We believe our operations have not been and, in the foreseeable future, will not be, materially and adversely affected by inflation or changing prices.
Off-Balance Sheet Arrangements
We do not have any off-balance sheet arrangements that have or are reasonably likely to have a current or future effect on our financial condition, changes in financial condition, revenues or expenses, results of operations, liquidity, capital expenditures or capital resources that is material to investors.
42
Recently Issued Accounting Pronouncements
In June 2009, the Financial Accounting Standards Board (the “FASB”) issued a standard which provides guidance to improve the relevance, representational faithfulness, and comparability of the information that a reporting entity provides in its financial statements about a transfer of financial assets; the effects of a transfer on its financial position, financial performance, and cash flows; and a transferor’s continuing involvement, if any, in transferred financial assets. The standard is effective as of the beginning of each reporting entity’s first annual reporting period that begins after November 15, 2009, for interim periods within that first annual reporting period and for interim and annual reporting periods thereafter. The adoption of this guidance did not have a material impact on the Company’s consolidated financial position or results of operations.
In October 2009, the FASB issued a standard which establishes the accounting and reporting guidance for arrangements including multiple revenue-generating activities. This standard provides amendments to the criteria for separating deliverables, measuring and allocating arrangement consideration to one or more units of accounting. The amendments in this standard also establish a selling price hierarchy for determining the selling price of a deliverable. Significantly enhanced disclosures are also required to provide information about a vendor’s multiple-deliverable revenue arrangements, including information about the nature and terms, significant deliverables, and its performance within arrangements. The amendments also require providing information about the significant judgments made and changes to those judgments and about how the application of the relative selling-price method affects the timing or amount of revenue recognition. The amendments in this standard are effective prospectively for revenue arrangements entered into or materially modified in fiscal years beginning on or after June 15, 2010. Early application is permitted. The adoption of this guidance is not expected to have a material impact on the Company’s consolidated results of operations or financial position.
In October 2009, the FASB issued a standard which changes the accounting model for revenue arrangements that include both tangible products and software elements that are “essential to the functionality” and scopes these products out of current software revenue guidance. The new guidance will include factors to help companies determine what software elements are considered “essential to the functionality.” The amendments will now subject software-enabled products to other revenue guidance and disclosure requirements, such as guidance surrounding revenue arrangements with multiple deliverables. The amendments in this standard are effective prospectively for revenue arrangements entered into or materially modified in the fiscal years beginning on or after June 15, 2010. Early application is permitted. The adoption of this guidance is not expected to have a material impact on the Company’s consolidated results of operations or financial position.
In January 2010, the FASB issued additional guidance for improving disclosures about fair value measurement. Under this guidance, two new disclosures are required: (i) significant transfers in and out of Level 1 and 2 measurements and the reasons for the transfers and (ii) a gross presentation of activity within the Level 3 rollforward. The guidance is effective for interim and annual reporting periods beginning after December 15, 2009, except for the disclosures about purchases, sales, issuances, and settlements in the rollforward of activity in Level 3 fair value measurements. Those disclosures are effective for fiscal years beginning after December 15, 2010. The adoption of this guidance did not have and is not expected to have a material impact on the Company’s consolidated results of operations or financial position.
In December 2010, the FASB issued an amendment which effects entities that have recognized goodwill and have one or more reporting units whose carrying amounts for the purposes of Step 1 of the goodwill impairment test is zero or negative. The amendment modifies Step 1 so that for those reporting units, the entity is required to perform Step 2 of the goodwill impairment test if it is more likely than not that a goodwill impairment exists. In determining whether it is more likely than not that a goodwill impairment exists, an entity should consider whether there are adverse qualitative factors, including the examples provided in ASC paragraph 350-20-35-30, in determining whether an interim goodwill impairment test between annual test dates is necessary. The standard allows an entity to use either the equity or enterprise valuation premise to determine the carrying amount of a reporting unit. This standard is effective for the Company for fiscal years, and interim periods within those years, beginning after December 15, 2010. The Company is currently evaluating the impact that the adoption of this standard will have on its consolidated financial statements.
In December 2010, the FASB issued an amendment which specifies that if a public entity presents comparative financial statements, the entity should disclose revenue and earnings of the combined entity as though the business combination(s) that occurred during the current year had occurred as of the beginning of the comparable prior annual reporting period only. The amendment also expands the supplemental pro forma disclosures under Topic 805 to include a description of the nature and amount of material, nonrecurring pro forma adjustments directly attributable to the business combination included in the reported pro forma revenue and earnings. The amendment is effective prospectively for business combinations for which the acquisition date is on or after the beginning of the first annual reporting period beginning on or after December 15, 2010.
43
Item 7A. Quantitative and Qualitative Disclosures About Market Risk
We are subject to market risks in the form of changes in corporate income tax rates, which risks are currently immaterial to us.
We also are subject to market risk from changes in interest rates which could affect our future results of operations and financial condition. We manage our exposure to these risks through our regular operating and financing activities. As of December 31, 2010, we had cash, cash equivalents and investments of $28.4 million.
As of December 31, 2010, the carrying value of our cash and cash equivalents approximated fair value. In a declining interest rate environment, as short-term investments mature, reinvestment occurs at less favorable market rates, negatively impacting future investment income. We maintain our cash and cash equivalents with major financial institutions; however, our cash and cash equivalent balances with these institutions exceed the Federal Deposit Insurance Corporation (“FDIC”) insurance limits. While we monitor on a systematic basis the cash and cash equivalent balances in the operating accounts and adjust the balances as appropriate, these balances could be impacted if one or more of the financial institutions with which we deposit our cash and cash equivalents fails or is subject to other adverse conditions in the financial or credit markets. To date, we have experienced no loss of principal or lack of access to our invested cash or cash equivalents; however, we can provide no assurance that access to our invested cash and cash equivalents will not be affected if the financial institutions in which we hold our cash and cash equivalents fail or the financial and credit markets continue to deteriorate.
At December 31, 2009, we held approximately $19.4 million fair value in investments in ARS and ARSR. The Company purchased all the ARS it held from UBS. These ARS represented interests in collateralized pools of student loan receivables issued by agencies established by counties, cities, states and other municipal entities within the United States. Liquidity for these ARS is typically provided by an auction process that resets the applicable interest rate at pre-determined intervals. In February 2008 and continuing into 2009, these securities failed to sell at auction. Holders of the securities continue to receive interest on the investments, and the securities continue to be auctioned at the pre-determined intervals (typically every 28 days) until the auction succeeds, the issuer calls the securities, or they mature. These failed auctions represent liquidity risk exposure and are not defaults or credit events. A decline in the value of these securities that is not temporary could have materially adversely affected our liquidity and income; however, all of the securities have been redeemed, as described below.
In October 2008, we received a non-transferable offer (the “Offer”) from UBS for a put right permitting us to sell to UBS at par value all ARS previously purchased from UBS at a future date (any time during a two-year period beginning June 30, 2010). The Offer also included a commitment to loan us 75% of the UBS-determined value of the ARS at any time until the put is exercised at a variable interest rate equal to the lesser of: (i) the applicable reference rate plus a spread set forth in the applicable credit agreement and (ii) the then-applicable weighted average interest or dividend rate paid to the Company by the issuer of the ARS that is pledged to UBS as collateral. In November 2008, the Company accepted the Offer. In exchange for the Offer, we provided UBS with a general release of claims (other than certain consequential damages claims) concerning our ARS and granted UBS the right to purchase our ARS at any time for full par value. Our right under the Offer was in substance a put right (with the strike price equal to the par value of the ARS) which we recorded as an asset, measured at its fair value with the resultant gain recognized in earnings. We initially recorded the put right at a fair value of $2.0 million and recognized the gain and a $2.3 million loss in the fair value of the ARS in operations. As we had classified the ARS as trading securities, the change in fair value of the ARS was charged to operations. The unrealized (loss) gain charged to operations in 2008, 2009 and 2010 was $(338,000), $338,000 and $-0-, respectively, which is included in other expense. The fair value of the put right was based on an approach in which the present value of all expected future cash flows were subtracted from the current fair market value of the security and the resultant value was calculated as a future value at an interest rate reflective of counterparty risk. The ARS and ARSR were redeemed by July 2010 and we no longer hold any ARS.
44
Item 8. Financial Statements and Supplementary Data
INDEX TO CONSOLIDATED FINANCIAL STATEMENTS
45
REPORT OF INDEPENDENT REGISTERED PUBLIC ACCOUNTING FIRM
Board of Directors and Stockholders of
I.D. Systems, Inc.
We have audited the accompanying consolidated balance sheets of I.D. Systems, Inc. and subsidiaries as of December 31, 2009 and 2010, and the related consolidated statements of operations, changes in stockholders’ equity and cash flows for each of the years in the three-year period ended December 31, 2010. Our audits also include the consolidated financial statement schedule II – Valuation and Qualifying Accounts for each of the years in the three-year period ended December 31, 2010 listed in Item 15.(a)(2) in the accompanying index. These consolidated financial statements and schedule are the responsibility of the Company’s management. Our responsibility is to express an opinion on these financial statements and schedule based on our audits.
We conducted our audits in accordance with the standards of the Public Accounting Oversight Board (United States). Those standards require that we plan and perform the audit to obtain reasonable assurance about whether the financial statements are free of material misstatement. We were not engaged to perform an audit of the Company’s internal control over financial reporting. Our audits of the financial statements include consideration of internal control over financial reporting as a basis for designing audit procedures that are appropriate in the circumstances, but not for the purpose of expressing an opinion on the effectiveness of the Company’s internal control over financial reporting. Accordingly, we express no such opinion. An audit includes examining, on a test basis, evidence supporting the amounts and disclosures in the financial statements. An audit also includes assessing the accounting principles used and significant estimates made by management, as well as evaluating the overall financial statement presentation. We believe that our audits provide a reasonable basis for our opinion.
In our opinion, the consolidated financial statements referred to above present fairly, in all material respects, the financial position of I.D. Systems, Inc. and subsidiaries as of December 31, 2009 and 2010, and the results of their consolidated operations and their consolidated cash flows for each of the years in the three-year period ended December 31, 2010, in conformity with accounting principles generally accepted in the United States. Also, in our opinion, the consolidated financial statement schedule referred to above, when considered in relation to the basic consolidated financial statements, taken as a whole, presents fairly, in all material respects, the information stated therein.
As described in Note 2 to the consolidated financial statements, the Company adopted the accounting guidance related to business combinations, effective for business combinations entered into on or after January 1, 2009.
/s/ EisnerAmper LLP
New York, New York
March 29, 2011
46
|
|
|
I.D. SYSTEMS, INC. AND SUBSIDIARIES |
|
|
|
|
|
|
|
|
|
|
|
|
As of December 31, |
|
||||
|
|
|
2009 |
|
2010 |
|
||
|
|
|
|
|
|
|
||
|
ASSETS |
|
|
|
|
|
|
|
|
Current assets: |
|
|
|
|
|
|
|
|
Cash and cash equivalents |
|
$ |
19,481,000 |
|
$ |
14,491,000 |
|
|
Investments – short term |
|
|
33,909,000 |
|
|
4,565,000 |
|
|
Accounts receivable, net of allowance for doubtful accounts of $106,000 and $161,000 in 2009 and 2010, respectively |
|
|
3,252,000 |
|
|
7,044,000 |
|
|
Notes and sales-type lease receivable - current |
|
|
— |
|
|
353,000 |
|
|
Inventory, net |
|
|
4,487,000 |
|
|
7,295,000 |
|
|
Interest receivable |
|
|
97,000 |
|
|
53,000 |
|
|
Deferred costs - current |
|
|
— |
|
|
1,159,000 |
|
|
Prepaid expenses and other current assets |
|
|
686,000 |
|
|
1,211,000 |
|
|
|
|
|
|
|
|
|
|
|
|
|
|
|
|
|
|
|
|
Total current assets |
|
|
61,912,000 |
|
|
36,171,000 |
|
|
|
|
|
|
|
|
|
|
|
Investments –long term |
|
|
6,752,000 |
|
|
9,364,000 |
|
|
Notes and sales-type lease receivable – less current portion |
|
|
|
|
|
839,000 |
|
|
Deferred costs – less current portion |
|
|
|
|
|
2,978,000 |
|
|
Fixed assets, net |
|
|
917,000 |
|
|
3,853,000 |
|
|
Goodwill |
|
|
619,000 |
|
|
1,837,000 |
|
|
Intangible assets, net |
|
|
375,000 |
|
|
5,571,000 |
|
|
Other assets |
|
|
— |
|
|
272,000 |
|
|
|
|
|
|
|
|
|
|
|
|
|
|
|
|
|
|
|
|
|
|
$ |
70,575,000 |
|
$ |
60,885,000 |
|
|
|
|
|
|
|
|
|
|
|
|
|
|
|
|
|
|
|
|
LIABILITIES |
|
|
|
|
|
|
|
|
Current liabilities: |
|
|
|
|
|
|
|
|
Accounts payable and accrued expenses |
|
$ |
2,094,000 |
|
$ |
9,141,000 |
|
|
Line of credit |
|
|
11,638,000 |
|
|
— |
|
|
Deferred revenue |
|
|
501,000 |
|
|
2,186,000 |
|
|
|
|
|
|
|
|
|
|
|
|
|
|
|
|
|
|
|
|
Total current liabilities |
|
|
14,233,000 |
|
|
11,327,000 |
|
|
|
|
|
|
|
|
|
|
|
Deferred rent |
|
|
— |
|
|
199,000 |
|
|
Deferred revenue |
|
|
461,000 |
|
|
4,614,000 |
|
|
|
|
|
|
|
|
|
|
|
|
|
|
|
|
|
|
|
|
|
|
|
14,694,000 |
|
|
16,140,000 |
|
|
|
|
|
|
|
|
|
|
|
Commitments and Contingencies (Note 21) |
|
|
|
|
|
|
|
|
|
|
|
|
|
|
|
|
|
STOCKHOLDERS’ EQUITY |
|
|
|
|
|
|
|
|
Preferred stock; authorized 5,000,000 shares, $0.01 par value; none issued |
|
|
— |
|
|
— |
|
|
Common stock; authorized 50,000,000 shares, $0.01 par value; 12,284,000 and 12,491,000 shares issued at December 31, 2009 and 2010, respectively; shares outstanding, 11,075,000 and 11,242,000 at December 31, 2009 and 2010, respectively |
|
|
120,000 |
|
|
121,000 |
|
|
Additional paid-in capital |
|
|
103,596,000 |
|
|
105,156,000 |
|
|
Accumulated deficit |
|
|
(36,859,000 |
) |
|
(49,470,000 |
) |
|
Accumulated other comprehensive income |
|
|
(60,000 |
) |
|
(37,000 |
) |
|
|
|
|
|
|
|
|
|
|
|
|
|
66,797,000 |
|
|
55,770,000 |
|
|
|
|
|
|
|
|
|
|
|
Treasury stock; 1,209,000 shares and 1,249,000 shares at cost at December 31, 2009 and 2010, respectively |
|
|
(10,916,000 |
) |
|
(11,025,000 |
) |
|
|
|
|
|
|
|
|
|
|
Total stockholders’ equity |
|
|
55,881,000 |
|
|
44,745,000 |
|
|
|
|
|
|
|
|
|
|
|
Total liabilities and stockholders’ equity |
|
$ |
70,575,000 |
|
$ |
60,885,000 |
|
|
|
|
|
|
|
|
|
|
SEE ACCOMPANYING NOTES TO CONSOLIDATED FINANCIAL STATEMENTS
47
|
|
|
I.D. SYSTEMS, INC. AND SUBSIDIARIES |
|
|
|
|
|
|
|
|
|
|
|
|
|
|
|
Year Ended December 31, |
|
|||||||
|
|
|
|
|
|||||||
|
|
|
2008 |
|
2009 |
|
2010 |
|
|||
|
|
|
|
|
|
|
|
|
|||
|
|
|
|
|
|
|
|
|
|
|
|
|
Revenues: |
|
|
|
|
|
|
|
|
|
|
|
Products |
|
$ |
20,072,000 |
|
$ |
6,470,000 |
|
$ |
9,483,000 |
|
|
Services |
|
|
6,974,000 |
|
|
3,846,000 |
|
|
16,378,000 |
|
|
|
|
|
|
|
|
|
|
|
|
|
|
|
|
|
27,046,000 |
|
|
10,316,000 |
|
|
25,861,000 |
|
|
Cost of Revenues: |
|
|
|
|
|
|
|
|
|
|
|
Cost of products |
|
|
9,996,000 |
|
|
3,882,000 |
|
|
5,077,000 |
|
|
Cost of services |
|
|
3,470,000 |
|
|
1,672,000 |
|
|
6,363,000 |
|
|
|
|
|
|
|
|
|
|
|
|
|
|
|
|
|
13,466,000 |
|
|
5,554,000 |
|
|
11,440,000 |
|
|
|
|
|
|
|
|
|
|
|
|
|
|
Gross Profit |
|
|
13,580,000 |
|
|
4,762,000 |
|
|
14,421,000 |
|
|
|
|
|
|
|
|
|
|
|
|
|
|
Operating expenses: |
|
|
|
|
|
|
|
|
|
|
|
Selling, general and administrative expenses |
|
|
16,760,000 |
|
|
16,543,000 |
|
|
23,326,000 |
|
|
Research and development expenses |
|
|
2,883,000 |
|
|
2,604,000 |
|
|
4,429,000 |
|
|
|
|
|
|
|
|
|
|
|
|
|
|
|
|
|
|
|
|
|
|
|
|
|
|
|
|
|
19,643,000 |
|
|
19,147,000 |
|
|
27,755,000 |
|
|
|
|
|
|
|
|
|
|
|
|
|
|
|
|
|
|
|
|
|
|
|
|
|
|
Loss from operations |
|
|
(6,063,000 |
) |
|
(14,385,000 |
) |
|
(13,334,000 |
) |
|
Interest income |
|
|
2,226,000 |
|
|
933,000 |
|
|
675,000 |
|
|
Interest expense |
|
|
— |
|
|
(130,000 |
) |
|
(56,000 |
) |
|
Other (loss) income |
|
|
(338,000 |
) |
|
390,000 |
|
|
104,000 |
|
|
|
|
|
|
|
|
|
|
|
|
|
|
|
|
|
|
|
|
|
|
|
|
|
|
Net loss |
|
$ |
(4,175,000 |
) |
$ |
(13,192,000 |
) |
$ |
(12,611,000 |
) |
|
|
|
|
|
|
|
|
|
|
|
|
|
|
|
|
|
|
|
|
|
|
|
|
|
Net loss per share – basic and diluted |
|
$ |
(0.38 |
) |
$ |
(1.20 |
) |
$ |
(1.12 |
) |
|
|
|
|
|
|
|
|
|
|
|
|
|
|
|
|
|
|
|
|
|
|
|
|
|
Weighted average common shares outstanding – basic and diluted |
|
|
10,887,000 |
|
|
10,991,000 |
|
|
11,239,000 |
|
|
|
|
|
|
|
|
|
|
|
|
|
SEE ACCOMPANYING NOTES TO CONSOLIDATED FINANCIAL STATEMENTS
48
I.D. SYSTEMS, INC.
Consolidated Statements of Changes in Stockholders’
Equity
|
|
|
|
|
|
|
|
|
|
|
|
|
|
|
|
|
|
|
|
|
|
|
|
|
|
Common Stock |
|
Additional |
|
Accumulated |
|
Accumulated |
|
Treasury |
|
Stockholders’ |
|
||||||||
|
|
|
|
|
|
|
|
|
|
|||||||||||||
|
|
|
Number of |
|
Amount |
|
|
|
|
|
|
|||||||||||
|
|
|
|
|
|
|
|
|
|
|
|
|
|
|
|
|
||||||
|
Balance at January 1, 2008 |
|
11,561,000 |
|
$ |
115,000 |
|
$ |
97,076,000 |
|
$ |
(19,492,000 |
) |
|
11,000 |
|
$ |
(6,040,000 |
) |
$ |
71,670,000 |
|
|
Net loss |
|
|
|
|
|
|
|
|
|
|
(4,175,000 |
) |
|
|
|
|
|
|
|
(4,175,000 |
) |
|
Comprehensive loss - unrealized gain on investments |
|
|
|
|
|
|
|
|
|
|
|
|
|
35,000 |
|
|
|
|
|
35,000 |
|
|
|
|
|
|
|
|
|
|
|
|
|
|
|
|
|
|
||||||
|
Total comprehensive loss |
|
|
|
|
|
|
|
|
|
|
|
|
|
|
|
|
|
|
|
(4,140,000 |
) |
|
|
|
|
|
|
|
|
|
|
|
|
|
|
|
|
|
||||||
|
Shares issued pursuant to exercise of stock options |
|
505,000 |
|
|
5,000 |
|
|
1,372,000 |
|
|
|
|
|
|
|
|
|
|
|
1,377,000 |
|
|
Shares repurchased |
|
|
|
|
|
|
|
|
|
|
|
|
|
|
|
|
(4,387,000 |
) |
|
(4,387,000 |
) |
|
Shares withheld pursuant to stock issuance |
|
|
|
|
|
|
|
|
|
|
|
|
|
|
|
|
(424,000 |
) |
|
(424,000 |
) |
|
Issuance of restricted stock |
|
16,000 |
|
|
|
|
|
|
|
|
|
|
|
|
|
|
|
|
|
|
|
|
Stock based compensation – restricted stock |
|
|
|
|
|
|
|
513,000 |
|
|
|
|
|
|
|
|
|
|
|
513,000 |
|
|
Stock based compensation performance shares |
|
|
|
|
|
|
|
292,000 |
|
|
|
|
|
|
|
|
|
|
|
292,000 |
|
|
Stock based compensation - options |
|
|
|
|
|
|
|
2,184,000 |
|
|
|
|
|
|
|
|
|
|
|
2,184,000 |
|
|
|
|
|
|
|
|
|
|
|
|
|
|
|
|
|
|
|
|
|
|
|
|
|
|
|
|
|
|
|
|
|
|
|
|
|
|
|
|
|
|
|
|
|
|
|
|
Balance at December 31, 2008 |
|
12,082,000 |
|
$ |
120,000 |
|
$ |
101,437,000 |
|
$ |
(23,667,000 |
) |
$ |
46,000 |
|
$ |
(10,851,000 |
) |
$ |
67,085,000 |
|
|
|
|
|
|
|
|
|
|
|
|
|
|
|
|
|
|
|
|
|
|
|
|
|
|
|
|
|
|
|
|
|
|
|
|
|
|
|
|
|
|
|
|
|
|
|
|
Net loss |
|
|
|
|
|
|
|
|
|
|
(13,192,000 |
) |
|
|
|
|
|
|
|
(13,192,000 |
) |
|
Foreign currency translation adjustment |
|
|
|
|
|
|
|
|
|
|
|
|
|
1,000 |
|
|
|
|
|
1,000 |
|
|
Comprehensive income- unrealized loss on investments |
|
|
|
|
|
|
|
|
|
|
|
|
|
(107,000 |
) |
|
|
|
|
(107,000 |
) |
|
|
|
|
|
|
|
|
|
|
|
|
|
|
|
|
|
||||||
|
Total comprehensive loss |
|
|
|
|
|
|
|
|
|
|
|
|
|
|
|
|
|
|
|
(13,298,000 |
) |
|
|
|
|
|
|
|
|
|
|
|
|
|
|
|
|
|
||||||
|
Shares issued pursuant to exercise of stock options |
|
1,000 |
|
|
|
|
|
2,000 |
|
|
|
|
|
|
|
|
|
|
|
2,000 |
|
|
Shares withheld pursuant to issuance of restricted and performance shares |
|
|
|
|
|
|
|
|
|
|
|
|
|
|
|
|
(65,000 |
) |
|
(65,000 |
) |
|
Issuance of restricted and performance stock |
|
201,000 |
|
|
|
|
|
|
|
|
|
|
|
|
|
|
|
|
|
|
|
|
Stock based compensation – restricted stock |
|
|
|
|
|
|
|
205,000 |
|
|
|
|
|
|
|
|
|
|
|
205,000 |
|
|
Stock based compensation performance shares |
|
|
|
|
|
|
|
15,000 |
|
|
|
|
|
|
|
|
|
|
|
15,000 |
|
|
Stock based compensation - options |
|
|
|
|
|
|
|
1,937,000 |
|
|
|
|
|
|
|
|
|
|
|
1,937,000 |
|
|
|
|
|
|
|
|
|
|
|
|
|
|
|
|
|
|
|
|
|
|
|
|
|
|
|
|
|
|
|
|
|
|
|
|
|
|
|
|
|
|
|
|
|
|
|
|
Balance at December 31, 2009 |
|
12,284,000 |
|
$ |
120,000 |
|
$ |
103,596,000 |
|
$ |
(36,859,000 |
) |
$ |
(60,000 |
) |
$ |
(10,916,000 |
) |
$ |
55,881,000 |
|
|
|
|
|
|
|
|
|
|
|
|
|
|
|
|
|
|
|
|
|
|
|
|
|
|
|
|
|
|
|
|
|
|
|
|
|
|
|
|
|
|
|
|
|
|
|
|
Net loss |
|
|
|
|
|
|
|
|
|
|
(12,611,000 |
) |
|
|
|
|
|
|
|
(12,611,000 |
) |
|
Foreign currency translation adjustment |
|
|
|
|
|
|
|
|
|
|
|
|
|
(23,000 |
) |
|
|
|
|
(23,000 |
) |
|
Comprehensive income – unrealized gain on investments |
|
|
|
|
|
|
|
|
|
|
|
|
|
46,000 |
|
|
|
|
|
46,000 |
|
|
|
|
|
|
|
|
|
|
|
|
|
|
|
|
|
|
||||||
|
Total comprehensive loss |
|
|
|
|
|
|
|
|
|
|
|
|
|
|
|
|
|
|
|
(12,588,000 |
) |
|
|
|
|
|
|
|
|
|
|
|
|
|
|
|
|
|
||||||
|
Shares issued pursuant to exercise of stock options |
|
1,000 |
|
|
1,000 |
|
|
2,000 |
|
|
|
|
|
|
|
|
|
|
|
3,000 |
|
|
Shares repurchased |
|
|
|
|
|
|
|
|
|
|
|
|
|
|
|
|
(99,000 |
) |
|
(99,000 |
) |
|
Shares withheld pursuant to issuances of restricted and performance stock |
|
|
|
|
|
|
|
|
|
|
|
|
|
|
|
|
(10,000 |
) |
|
(10,000 |
) |
|
Issuance of restricted and performance stock |
|
206,000 |
|
|
|
|
|
|
|
|
|
|
|
|
|
|
|
|
|
|
|
|
Stock based compensation – restricted stock |
|
|
|
|
|
|
|
273,000 |
|
|
|
|
|
|
|
|
|
|
|
273,000 |
|
|
Stock based compensation – performance shares |
|
|
|
|
|
|
|
35,000 |
|
|
|
|
|
|
|
|
|
|
|
35,000 |
|
|
Stock based compensation - options |
|
|
|
|
|
|
|
1,250,000 |
|
|
|
|
|
|
|
|
|
|
|
1,250,000 |
|
|
|
|
|
|
|
|
|
|
|
|
|
|
|
|
|
|
|
|
|
|
|
|
|
|
|
|
|
|
|
|
|
|
|
|
|
|
|
|
|
|
|
|
|
|
|
|
Balance at December 31, 2010 |
|
12,491,000 |
|
$ |
121,000 |
|
$ |
105,156,000 |
|
$ |
(49,470,000 |
) |
$ |
(37,000 |
) |
$ |
(11,025,000 |
) |
$ |
44,745,000 |
|
|
|
|
|
|
|
|
|
|
|
|
|
|
|
|
|
|
|
|
|
|
|
|
SEE ACCOMPANYING NOTES TO CONSOLIDATED FINANCIAL STATEMENTS
49
I.D. SYSTEMS, INC.
Consolidated Statements of Cash Flows
|
|
|
|
|
|
|
|
|
|
|
|
|
|
|
Year Ended December 31, |
|
|||||||
|
|
|
|
|
|||||||
|
|
|
2008 |
|
2009 |
|
2010 |
|
|||
|
|
|
|
|
|
|
|
|
|||
|
Cash flows from operating activities: |
|
|
|
|
|
|
|
|
|
|
|
Net loss |
|
$ |
(4,175,000 |
) |
$ |
(13,192,000 |
) |
$ |
(12,611,000 |
) |
|
Adjustments to reconcile net loss to cash provided by (used in) operating activities: |
|
|
|
|
|
|
|
|
|
|
|
Inventory reserve |
|
|
126,000 |
|
|
621,000 |
|
|
— |
|
|
Accrued interest income |
|
|
(75,000 |
) |
|
120,000 |
|
|
44,000 |
|
|
Stock based compensation |
|
|
2,989,000 |
|
|
2,157,000 |
|
|
1,558,000 |
|
|
Depreciation and amortization |
|
|
540,000 |
|
|
533,000 |
|
|
2,435,000 |
|
|
Deferred rent expense |
|
|
(22,000 |
) |
|
(22,000 |
) |
|
188,000 |
|
|
Change in fair value of investments |
|
|
338,000 |
|
|
(338,000 |
) |
|
— |
|
|
Bad debt reserve |
|
|
— |
|
|
— |
|
|
65,000 |
|
|
Changes in: |
|
|
|
|
|
|
|
|
|
|
|
Restricted cash |
|
|
(230,000 |
) |
|
230,000 |
|
|
— |
|
|
Accounts receivable |
|
|
(5,370,000 |
) |
|
5,049,000 |
|
|
(611,000 |
) |
|
Notes and lease receivable |
|
|
|
|
|
|
|
|
199,000 |
|
|
Unbilled receivables |
|
|
412,000 |
|
|
168,000 |
|
|
— |
|
|
Inventory |
|
|
1,212,000 |
|
|
(1,815,000 |
) |
|
2,428,000 |
|
|
Prepaid expenses and other assets |
|
|
10,000 |
|
|
(320,000 |
) |
|
105,000 |
|
|
Deferred costs |
|
|
|
|
|
|
|
|
(3,442,000 |
) |
|
Deferred revenue |
|
|
197,000 |
|
|
307,000 |
|
|
4,454,000 |
|
|
Accounts payable and accrued expenses |
|
|
(843,000 |
) |
|
(369,000 |
) |
|
1,593,000 |
|
|
|
|
|
|
|
|
|
|
|
|
|
|
Net cash used in operating activities |
|
|
(4,891,000 |
) |
|
(6,871,000 |
) |
|
(3,595,000 |
) |
|
|
|
|
|
|
|
|
|
|
|
|
|
|
|
|
|
|
|
|
|
|
|
|
|
Cash flows from investing activities: |
|
|
|
|
|
|
|
|
|
|
|
Purchase of fixed assets |
|
|
(188,000 |
) |
|
(358,000 |
) |
|
(1,459,000 |
) |
|
Business acquisition |
|
|
(573,000 |
) |
|
(518,000 |
) |
|
(15,000,000 |
) |
|
Purchase of investments |
|
|
(28,513,000 |
) |
|
(59,408,000 |
) |
|
(15,330,000 |
) |
|
Maturities of investments |
|
|
44,649,000 |
|
|
62,439,000 |
|
|
42,107,000 |
|
|
|
|
|
|
|
|
|
|
|
|
|
|
Net cash provided by investing activities |
|
|
15,375,000 |
|
|
2,155,000 |
|
|
10,318,000 |
|
|
|
|
|
|
|
|
|
|
|
|
|
|
|
|
|
|
|
|
|
|
|
|
|
|
Cash flows from financing activities: |
|
|
|
|
|
|
|
|
|
|
|
Repayment of term loan |
|
|
(19,000 |
) |
|
— |
|
|
— |
|
|
Proceeds from exercise of stock options |
|
|
1,377,000 |
|
|
2,000 |
|
|
3,000 |
|
|
Collection of officer loan |
|
|
— |
|
|
— |
|
|
— |
|
|
Borrowings on line of credit |
|
|
— |
|
|
12,900,000 |
|
|
— |
|
|
Principal payments on line of credit |
|
|
— |
|
|
(1,262,000 |
) |
|
(11,638,000 |
) |
|
Purchase of treasury shares |
|
|
(4,387,000 |
) |
|
— |
|
|
(99,000 |
) |
|
|
|
|
|
|
|
|
|
|
|
|
|
Net cash (used in) provided by financing activities |
|
|
(3,029,000 |
) |
|
11,640,000 |
|
|
(11,734,000 |
) |
|
|
|
|
|
|
|
|
|
|
|
|
|
|
|
|
|
|
|
|
|
|
|
|
|
Effect of foreign exchange rate changes on cash and cash equivalents |
|
|
— |
|
|
(1,000 |
) |
|
21,000 |
|
|
Net increase (decrease) in cash and cash equivalents |
|
|
7,455,000 |
|
|
6,923,000 |
|
|
(4,990,000 |
) |
|
Cash and cash equivalents - beginning of period |
|
|
5,103,000 |
|
|
12,558,000 |
|
|
19,481,000 |
|
|
|
|
|
|
|
|
|
|
|
|
|
|
Cash and cash equivalents - end of period |
|
$ |
12,558,000 |
|
$ |
19,481,000 |
|
$ |
14,491,000 |
|
|
|
|
|
|
|
|
|
|
|
|
|
|
Supplemental disclosure of cash flow information: |
|
|
|
|
|
|
|
|
|
|
|
Cash paid for: |
|
|
|
|
|
|
|
|
|
|
|
Interest |
|
$ |
— |
|
$ |
130,000 |
|
$ |
56,000 |
|
|
|
|
|
|
|
|
|
|
|
|
|
|
Non-cash investing and financing activities include: |
|
|
|
|
|
|
|
|
|
|
|
Shares withheld pursuant to stock issuance |
|
$ |
424,000 |
|
$ |
65,000 |
|
$ |
10,000 |
|
|
|
|
|
|
|
|
|
|
|
|
|
|
Unrealized (loss) gain on investments |
|
$ |
(35,000 |
) |
$ |
(107,000 |
) |
$ |
46,000 |
|
|
|
|
|
|
|
|
|
|
|
|
|
|
|
|
|
|
|
|
|
|
|
|
|
Accrual of contingent consideration and accrued expenses |
|
$ |
— |
|
$ |
110,000 |
|
$ |
— |
|
|
|
|
|
|
||||||
|
|
|
|
|
|
|
|
|
|
|
|
Acquisition: |
|
|
|
|
|
|
|
|
|
|
|
Fair value of assets acquired |
|
|
|
|
$ |
748,000 |
|
$ |
20,746,000 |
|
|
Liabilities assumed |
|
|
|
|
|
(104,000 |
|
|
(5,746,000 |
) |
|
Less: contingent consideration |
|
|
|
|
|
(110,000 |
) |
|
— |
|
|
Less: cash acquired |
|
|
|
|
|
(16,000 |
) |
|
— |
|
|
|
|
|
|
|
|
|
|
|
|
|
|
Net cash paid |
|
|
|
|
$ |
518,000 |
|
$ |
15,000,000 |
|
|
|
|
|
|
|
|
|
|
|
|
|
SEE ACCOMPANYING NOTES TO CONSOLIDATED FINANCIAL STATEMENTS
50
I.D. SYSTEMS,
INC.
NOTES TO CONSOLIDATED FINANCIAL STATEMENTS
DECEMBER 31, 2009 and 2010
NOTE 1 - THE COMPANY
I.D. Systems, Inc. and its subsidiaries (the “Company,” “we,” “our” or “us”) develop, market and sell wireless solutions for managing and securing high-value enterprise assets. These assets include industrial vehicles, including forklifts, airport ground support equipment, rental vehicles and transportation assets, such as dry van trailers, refrigerated trailers, railcars and containers. The Company’s patented wireless asset management system addresses the needs of organizations to control, track, monitor and analyze their assets. The Company’s solutions enable customers to achieve tangible economic benefits by making timely, informed decisions that increase the security, productivity and efficiency of their operations. The Company outsources its hardware manufacturing operations to contract manufacturers.
On January 7, 2010, the Company entered into a Membership Interest Purchase Agreement (the “Purchase Agreement”) with General Electric Capital Corporation (“GECC”) and GE Asset Intelligence, LLC (“GEAI”), pursuant to which the Company acquired GEAI’s telematics business (the “GEAI Business”) through the purchase of 100% of the membership interests of Asset Intelligence, LLC (“AI”), a newly formed, wholly owned subsidiary of GEAI into which substantially all of the assets, including intellectual property, and liabilities of the GEAI Business had been transferred immediately prior to the closing. Effective with the closing of the transaction, AI became a wholly owned subsidiary of the Company. See Note 10 to the Consolidated Financial Statements.
Prior to the AI acquisition, the Company operated in a single reportable segment, which consisted of the historical operations of I.D. Systems (“IDS”). Subsequent thereto, the Company has determined that it has two reportable segments organized by product line: IDS and AI. The IDS operating segment includes the Company’s core wireless asset management systems operations: I.D. Systems, Inc., I.D. Systems, GmbH, and Didbox Ltd. This core business develops, markets and sells wireless solutions for managing and securing high-value enterprise assets such as industrial trucks. The AI operating segment, which consists of Asset Intelligence, LLC, provides data-driven telematics solutions for tracking and managing supply chain assets such as trailers and containers.
I.D. Systems, Inc. was incorporated in Delaware in 1993 and commenced operations in January 1994.
NOTE 2 - SUMMARY OF SIGNIFICANT ACCOUNTING POLICIES
|
|
|
|
|
[A] |
|
Principles of consolidation: |
|
|
|
|
|
|
|
The consolidated financial statements include the accounts of I.D. Systems, Inc. (the “Company”) and its wholly owned subsidiaries Asset Intelligence LLC, (“AI”), I.D. Systems, GmbH (“GmbH”) and Didbox Ltd. (“Didbox”). All material intercompany balances and transactions have been eliminated in consolidation. |
|
|
|
|
|
[B] |
|
Use of estimates: |
|
|
|
|
|
|
|
The preparation of financial statements in conformity with accounting principles generally accepted in the United States of America (“U.S. GAAP”) requires management to make estimates and assumptions that affect the reported amounts of assets and liabilities and disclosure of contingent assets and liabilities at the date of the financial statements and the reported amounts of revenues and expenses during the reporting period. The Company continually evaluates estimates used in the preparation of the financial statements for reasonableness. The most significant estimates relate to stock-based compensation arrangements, acquisition accounting, contingent consideration, realization of deferred tax assets, the impairment of tangible and intangible assets, inventory reserves, bad debt and warranty reserves and deferred revenue and costs. Actual results could differ from those estimates. |
|
|
|
|
|
[C] |
|
Cash and cash equivalents: |
|
|
|
|
|
|
|
The Company considers all highly liquid debt instruments with an original maturity of three months or less when purchased to be cash equivalents unless they are legally or contractually restricted. The Company’s cash and cash equivalent balances exceeded FDIC limits. |
51
|
|
|
|
|
[D] |
|
Investments: |
|
|
|
|
|
|
|
The Company’s investments include debt securities, U.S. Treasury Notes, government and state agency bonds, corporate bonds, and mutual funds, which are classified as either available for sale, held to maturity or trading, depending on management’s investment intentions relating to these securities. Available for sale securities are marked to market based on quoted market values of the securities, with the unrealized gain and (losses), reported as comprehensive income or (loss). Investments categorized as held to maturity are carried at amortized cost because the Company has both the intent and the ability to hold these investments until they mature. The Company has classified as short-term those securities that mature within one year, and all other securities are classified as long-term. |
|
|
|
|
|
|
|
The Company’s investments at December 31, 2009 also included auction rate securities (“ARS”) and an auction rate securities right (“ARSR”). The Company had classified its ARS and ARSR investments as trading securities. Trading securities are carried at fair value, with unrealized holding gains and losses included in other income (expense) on the Company’s consolidated statements of operations. The investment in ARS and ARSR were redeemed by July 2010. |
|
|
|
|
|
[E] |
|
Accounts receivable: |
|
|
|
|
|
|
|
Accounts receivable are recorded at the invoiced amount and do not bear interest. Amounts collected on trade accounts receivable are included in net cash provided by operating activities in the consolidated statements of cash flows. The Company maintains reserves against its accounts receivable for potential losses. Allowances for uncollectible accounts are estimated based on the Company’s periodic review of accounts receivable balances. In establishing the required allowance, management considers our customers’ financial condition, the amount of receivables in dispute, and the current receivables aging and current payment patterns. Account balances are charged off against the allowance after all means of collection have been exhausted and the potential for recovery is considered remote. Accounts receivable are net of an allowance for doubtful accounts in the amount of $106,000 and $161,000 in 2009 and 2010, respectively. |
|
|
|
|
|
[F] |
|
Revenue recognition: |
|
|
|
|
|
|
|
The Company’s product revenue is derived from: (i) sales of our industrial and rental fleet wireless asset management systems and services, which includes training and technical support; (ii) sale of our remote asset wireless asset management systems and spare parts sold to customers (for which title transfers on date of customer receipt) and from the related communication services under contracts that generally provide for service over periods ranging from one to five years; (iii) from post-contract maintenance and support agreements; and (iv) periodically, from leasing arrangements. |
|
|
|
|
|
|
|
Our industrial and rental fleet wireless asset management systems consists of on-asset hardware, communication infrastructure and software. Revenue derived from the sale of our industrial and rental fleet wireless asset management systems is allocated to each element based upon vendor specific objective evidence (VSOE) of the fair value of the element. VSOE of the fair value is based upon the price charged when the element is sold separately. Revenue is recognized as each element is earned based on the selling price of each element, and when there are no undelivered elements that are essential to the functionality of the delivered elements. The Company’s system is typically implemented by the customer or a third party and, as a result, revenue is recognized when title and risk of loss passes to the customer, which usually is upon delivery of the system, persuasive evidence of an arrangement exists, sales price is fixed and determinable, collectability is reasonably assured and contractual obligations have been satisfied. In some instances, we are also responsible for providing installation services. The additional installation services, which could be performed by third parties, are considered another element in a multi-element deliverable and revenue for installation services is recognized at the time the installation is provided. Training and technical support revenue are recognized at time of performance. |
|
|
|
|
|
|
|
The Company recognizes revenues from the sale of remote asset wireless management systems and spare parts when persuasive evidence of an arrangement exists, delivery has occurred, the price is fixed or determinable, and collectability is reasonably assured. These criteria include requirements that the delivery of future products or services under the arrangement is not required for the delivered items to serve their intended purpose. The Company has determined that the revenue derived from the sale of remote asset wireless management systems does not have stand alone value to the customer separate from the communication services provided and therefore the arrangements constitute a single unit of accounting. Under these provisions, all of the Company’s billings for equipment and the related cost are deferred, recorded, and classified as a current and long-term liability and a current and long-term asset, respectively. Deferred revenue and cost are recognized over the service contract life, beginning at the time that a customer acknowledges acceptance of the equipment and service. The customer service contracts typically range from one to five years. |
|
|
|
|
|
|
|
The service revenue for our remote asset monitoring equipment relates to charges for monthly messaging usage and value-added features charges. The usage fee is a monthly fixed charge based on the expected utilization according to the rate plan chosen by the customer. Service revenue generally commences upon equipment installation and customer acceptance, and is recognized over the period such services are provided. |
|
|
|
|
|
|
|
Spare parts sales are reflected in product revenues and recognized on the date of customer receipt of the part. Revenue from remote asset monitoring equipment activation fees is deferred and amortized over the life of the contract. |
|
|
|
|
|
|
|
The Company also derives revenue under leasing arrangements of remote asset monitoring equipment. Such arrangements provide for monthly payments covering the system sale, maintenance, support and interest. These arrangements meet the criteria to be accounted for as sales-type leases. Accordingly, an asset is established for the “sales-type lease receivable” and revenue is deferred and recognized over the service contract as described above. Maintenance revenues and interest income are recognized monthly over the lease term. |
|
|
|
|
|
|
|
The Company also enters into post-contract maintenance and support agreements for its wireless asset management systems. Revenue is recognized over the service period and the cost of providing these services is expensed as incurred. |
|
|
|
|
52
|
|
|
|
|
[G] |
|
Inventory: |
|
|
|
|
|
|
|
Inventory, which primarily consists of finished goods and components used in the Company’s products, is stated at the lower of cost or market using the first-in first-out (FIFO) method. |
|
|
|
|
|
|
|
Inventory valuation reserves are established in order to report inventories at the lower of cost or market value in the consolidated balance sheet. The determination of inventory valuation reserves requires management to make estimates and judgments on the future salability of inventories. Valuation reserves for obsolete and slow-moving inventory are estimated by comparing the inventory levels to historical usage rates and both future sales forecasts and production requirements. Other factors that management considers in determining these reserves include whether inventory parts meet current specifications or can be used as a service part. |
|
|
|
|
|
[H] |
|
Fixed assets and depreciation: |
|
|
|
|
|
|
|
Fixed assets are recorded at cost and depreciated using the straight-line method over the estimated useful lives of the assets, which range from three to ten years. Leasehold improvements are amortized using the straight-line method over the terms of the respective leases, or their estimated useful lives, whichever is shorter. |
|
|
|
|
|
[I] |
|
Long-lived assets: |
|
|
|
|
|
|
|
Long-lived assets are reviewed for impairment whenever events or changes in circumstances indicate that the carrying amount of an asset may not be recoverable. Recoverability of assets to be held and used is measured by a comparison of the carrying amount of the assets to the future undiscounted net cash flows expected to be generated by the asset. If such assets are considered to be impaired, the impairment to be recognized is measured by the amount by which the carrying amount of the assets exceeds the fair value of the assets and would be charged to earnings. For the years ended December 31, 2008, 2009 and 2010, the Company has not incurred an impairment charge. |
|
|
|
|
|
[J] |
|
Acquisitions, goodwill and other intangible assets: |
|
|
|
|
|
|
|
In December 2007, the FASB issued new accounting standards establishing principles and requirements for how an acquirer recognizes and measures in its financial statements the identifiable assets acquired, including goodwill, the liabilities assumed and any noncontrolling interest in the acquiree. This accounting standard was effective for business combinations for which the acquisition date is on or after January 1, 2009. Accordingly, all business combinations that we complete are accounted for under this new accounting standard. |
|
|
|
|
|
|
|
Goodwill represents costs in excess of fair values assigned to the underlying net assets of acquired businesses. Goodwill and intangible assets deemed to have indefinite lives are not amortized. Intangible assets other than goodwill are amortized over their useful lives unless the lives are determined to be indefinite. Intangible assets are carried at cost, less accumulated amortization. Intangible assets consist of trademarks and trade name, patents, customer relationships and other intangible assets. The Company tests goodwill and other intangible assets annually, or when a triggering event occurs between annual impairment tests, to determine if impairment exists and if the use of indefinite lives is currently applicable. At December 31, 2009 and 2010, the Company determined that no impairment existed to the goodwill, customer relationships, trademark and trade name, patents and other intangible assets. The Company also determined that the use of indefinite lives for the customer list and trademark and trade name remains applicable at December 31, 2009 and 2010 and the Company expects to derive future benefits from these intangible assets. |
|
|
|
|
|
[K] |
|
Product warranties: |
|
|
|
|
|
|
|
The Company’s AI segment provides a one-year warranty on its products. Estimated future warranty costs are accrued in the period that the related revenue is recognized. These estimates are derived from historical data and trends of product reliability and costs of repairing and replacing defective products. |
|
|
|
|
|
[L] |
|
Research and development: |
|
|
|
|
|
|
|
Research and development costs are charged to expense as incurred. |
|
|
|
|
|
[M] |
|
Patent costs: |
|
|
|
|
|
|
|
Costs incurred in connection with acquiring patent rights are charged to expense as incurred. |
|
|
|
|
|
[N] |
|
Benefit plan: |
|
|
|
|
|
|
|
The Company maintains a retirement plan under Section 401(k) of the Internal Revenue Code, which covers all eligible employees. All employees with U.S. source income are eligible to participate in the plan immediately upon employment. The Company did not make any contributions to the plan during the years ended December 31, 2008, 2009 and 2010. |
53
|
|
|
|
|
[O] |
|
Rent expense: |
|
|
|
|
|
|
|
Expense related to the Company’s facility lease is recorded on a straight-line basis over the lease term. The difference between rent expense incurred and the amounts required to be paid in accordance with the lease term is recorded as deferred rent and is amortized over the lease term. |
|
|
|
|
|
[P] |
|
Stock-based compensation: |
|
|
|
|
|
|
|
The Company accounts for stock-based employee compensation for all share-based payments, including grants of stock options as an operating expense, based on their fair values on grant date. The Company recorded stock-based compensation expense of $2,989,000, $2,157,000 and $1,558,000 for the years ended December 31, 2008, 2009 and 2010, respectively. |
|
|
|
|
|
|
|
The Company estimates the fair value of share-based payment awards on the grant date using an option pricing model. The value of the portion of the award that is ultimately expected to vest is recognized as expense over the requisite service period in the Company’s consolidated statement of operations. The Company estimates forfeitures at the time of grant in order to estimate the amount of share- based awards that will ultimately vest. The estimate is based on the Company’s historical rates of forfeitures. Estimated forfeitures are revised, if necessary, in subsequent periods if actual forfeitures differ from those estimates. |
|
|
|
|
|
[Q] |
|
Income taxes: |
|
|
|
|
|
|
|
The Company uses the asset and liability method of accounting for deferred income taxes. Deferred income taxes are measured by applying enacted statutory rates to net operating loss carryforwards and to the differences between the financial reporting and tax bases of assets and liabilities. Deferred tax assets are reduced, if necessary, by a valuation allowance if it is more likely than not that some portion or all of the deferred tax assets will not be realized. |
|
|
|
|
|
|
|
Effective January 1, 2007, the Company adopted authoritative guidance that clarifies the uncertainty in income taxes recognized in the financial statements by prescribing a recognition threshold and measurement attribute for financial statement recognition and measurement of a tax position taken or expected to be taken in a tax return. As required by the guidance, the Company applied the “more-likely-than-not” recognition threshold to all tax positions, commencing at the adoption date, which resulted in no unrecognized tax benefits as of such date. Additionally, there have been no unrecognized tax benefits subsequent to adoption. Accordingly, the adoption of the guidance had no effect on the Company’s financial statements. The Company has opted to classify interest and penalties that would accrue according to the provisions of relevant tax law as selling, general, and administrative expenses, in the consolidated statement of operations. For the years ended December 31, 2008, 2009 and 2010, there was no such interest or penalty. |
|
|
|
|
|
|
|
The Company files federal income tax returns and separate income tax returns in various states. For federal and certain states, the 2007 through 2010 tax years remain open for examination by the tax authorities under the normal three-year statute of limitations. For certain other states, the 2006 through 2010 tax years remain open for examination by the tax authorities under a four-year statute of limitations. |
54
|
|
|
|
|
[R] |
|
Fair value of financial instruments: |
|
|
|
|
|
|
|
The carrying amounts of cash equivalents, accounts receivable, and investments in securities are carried at fair value and accounts payable, line of credit, and other liabilities approximate their fair values due to the short period to maturity of these instruments. At December 31, 2009, the fair value of the ARS was determined utilizing a discounted cash flow approach and market evidence with respect to the ARS’ collateral, ratings and insurance to assess default risk, credit spread risk and downgrade risk. |
|
|
|
|
|
[S] |
|
Advertising and marketing expense: |
|
|
|
|
|
|
|
Advertising and marketing costs are expensed as incurred. Advertising and marketing expense for the years ended December 31, 2008, 2009 and 2010 amounted to $379,000, $271,000 and $341,000, respectively. |
|
|
|
|
|
[T] |
|
Recently issued accounting pronouncements: |
55
In June 2009, the Financial Accounting Standards Board (the “FASB”) issued a standard which provides guidance to improve the relevance, representational faithfulness, and comparability of the information that a reporting entity provides in its financial statements about a transfer of financial assets; the effects of a transfer on its financial position, financial performance, and cash flows; and a transferor’s continuing involvement, if any, in transferred financial assets. The standard is effective as of the beginning of each reporting entity’s first annual reporting period that begins after November 15, 2009, for interim periods within that first annual reporting period and for interim and annual reporting periods thereafter. The adoption of this guidance did not have a material impact on the Company’s consolidated financial position or results of operations.
In October 2009, the FASB issued a standard which establishes the accounting and reporting guidance for arrangements including multiple revenue-generating activities. This standard provides amendments to the criteria for separating deliverables, measuring and allocating arrangement consideration to one or more units of accounting. The amendments in this standard also establish a selling price hierarchy for determining the selling price of a deliverable. Significantly enhanced disclosures are also required to provide information about a vendor’s multiple-deliverable revenue arrangements, including information about the nature and terms, significant deliverables, and its performance within arrangements. The amendments also require providing information about the significant judgments made and changes to those judgments and about how the application of the relative selling-price method affects the timing or amount of revenue recognition. The amendments in this standard are effective prospectively for revenue arrangements entered into or materially modified in fiscal years beginning on or after June 15, 2010. Early application is permitted. The adoption of this guidance is not expected to have a material impact on the Company’s consolidated results of operations or financial position.
In October 2009, the FASB issued a standard which changes the accounting model for revenue arrangements that include both tangible products and software elements that are “essential to the functionality” and scopes these products out of current software revenue guidance. The new guidance will include factors to help companies determine what software elements are considered “essential to the functionality.” The amendments will now subject software-enabled products to other revenue guidance and disclosure requirements, such as guidance surrounding revenue arrangements with multiple deliverables. The amendments in this standard are effective prospectively for revenue arrangements entered into or materially modified in the fiscal years beginning on or after June 15, 2010. Early application is permitted. The adoption of this guidance is not expected to have a material impact on the Company’s consolidated results of operations or financial position.
In January 2010, the FASB issued additional guidance for improving disclosures about fair value measurement. Under this guidance, two new disclosures are required: (i) significant transfers in and out of Level 1 and 2 measurements and the reasons for the transfers and (ii) a gross presentation of activity within the Level 3 rollforward. The guidance is effective for interim and annual reporting periods beginning after December 15, 2009, except for the disclosures about purchases, sales, issuances, and settlements in the rollforward of activity in Level 3 fair value measurements. Those disclosures are effective for fiscal years beginning after December 15, 2010. The adoption of this guidance did not have and is not expected to have a material impact on the Company’s consolidated results of operations or financial position.
In December 2010, the FASB issued an amendment which Affects entities that have recognized goodwill and have one or more reporting units whose carrying amounts for the purposes of Step 1 of the goodwill impairment test is zero or negative. The amendment modifies Step 1 so that for those reporting units, the entity is required to perform Step 2 of the goodwill impairment test if it is more likely than not that a goodwill impairment exists. In determining whether it is more likely than not that a goodwill impairment exists, an entity should consider whether there are adverse qualitative factors, including the examples provided in ASC paragraph 350-20-35-30, in determining whether an interim goodwill impairment test between annual test dates is necessary. The standard allows an entity to use either the equity or enterprise valuation premise to determine the carrying amount of a reporting unit. This standard is effective for the Company for fiscal years, and interim periods within those years, beginning after December 15, 2010. The Company is currently evaluating the impact that the adoption of this standard will have on its consolidated financial statements.
In December 2010, the FASB issued an amendment which specifies that if a public entity presents comparative financial statements, the entity should disclose revenue and earnings of the combined entity as though the business combination(s) that occurred during the current year had occurred as of the beginning of the comparable prior annual reporting period only. The amendment also expands the supplemental pro forma disclosures under Topic 805 to include a description of the nature and amount of material, nonrecurring pro forma adjustments directly attributable to the business combination included in the reported pro forma revenue and earnings. The amendment is effective prospectively for business combinations for which the acquisition date is on or after the beginning of the first annual reporting period beginning on or after December 15, 2010.
56
NOTE 3 – INVESTMENTS AND FAIR VALUE MEASUREMENTS
At December 31, 2010, the Company’s investments include U.S. Treasury Notes, government and state agency bonds, mutual funds, corporate bonds and commercial paper, which are classified as either available for sale, held to maturity or trading, depending on management’s investment intentions relating to these securities. Available for sale securities are marked-to-market based on quoted market values of the securities, with the unrealized gain and (losses) reported as comprehensive income or (loss). For the years ended December 31, 2008, 2009 and 2010, the Company reported unrealized gain (loss) of $35,000, $(107,000) and $46,000, respectively, on available for sale securities in comprehensive loss. Investments categorized as held to maturity are carried at amortized cost because the Company has both the intent and the ability to hold these investments until they mature. Realized gains and losses from the sale of available for sale securities are determined on a specific-identification basis. During September 2010, the Company transferred approximately $10.3 million of debt securities classified as held to maturity to available for sale. The Company has classified as short-term those securities that mature within one year, and all other securities are classified as long-term.
The following table summarizes the estimated fair value of investment securities designated as available for sale classified by the contractual maturity date of the security as of December 31, 2010:
|
|
|
|
|
|
|
|
|
Fair Value |
|
|
|
|
|
|
|
|
|
Due within one year |
|
$ |
2,078,000 |
|
|
Due one year through three years |
|
|
9,364,000 |
|
|
Due after three years |
|
|
— |
|
|
|
|
|
|
|
|
|
|
|
|
|
|
|
|
$ |
11,442,000 |
|
|
|
|
|
|
|
At December 31, 2009, the Company’s investments also included auction-rate securities (“ARS”) and an auction-rate securities right (“ARSR”), each as described below. The investments in ARS and ARSR were redeemed by July 2010.
The Company had classified its ARS investments and ARSR as trading securities. Trading securities are carried at fair value, with unrealized holding gains and losses included in other income (expense) on the Company’s consolidated statements of operations.
At December 31, 2009 and 2010, the Company held approximately $19.4 million and $-0- fair value in ARS and ARSR, respectively. These ARS represented interests in collateralized pools of student loan receivables issued by agencies established by counties, cities, states and other municipal entities within the United States. Liquidity for these ARS is typically provided by an auction process that resets the applicable interest rate at pre-determined intervals. Starting in February 2008 and continuing through 2010, these securities failed to sell at auction. These failed auctions represented liquidity risk exposure and are not defaults or credit events. As a holder of the securities, the Company continued to receive interest on the ARS until they were sold or redeemed.
57
The Company purchased all of the ARS it held from UBS AG (“UBS”). In October 2008, the Company received a non-transferable offer (the “Offer”) from UBS for a put right (the “ARSR”) permitting the Company to sell to UBS at par value all ARS previously purchased from UBS at a future date (any time during a two-year period beginning June 30, 2010). The Offer also included a commitment to loan the Company 75% of the UBS-determined value of the ARS at any time until the put is exercised at a variable interest rate equal to the lesser of: (i) the applicable reference rate plus a spread set forth in the applicable credit agreement and (ii) the then-applicable weighted-average interest or dividend rate paid to the Company by the issuer of the ARS that is pledged to UBS as collateral. In November 2008, the Company accepted the Offer. In exchange for the Offer, the Company provided UBS with a general release of claims (other than certain consequential damages claims) concerning our ARS and granted UBS the right to purchase the Company’s ARS at any time for full par value. In June 2010, the Company exercised its right under the ARSR to put back the ARS to UBS. During June and July 2010, UBS repurchased the outstanding ARS at par value.
The Company’s right under the ARSR was in substance a put option with the strike price equal to the par value of the ARS which was recorded as an asset, measured at fair value with the resultant gain (loss) recognized in earnings. The Company classified the ARS as trading securities. The Company recognized the following gain or (loss) in the consolidated statement of operations for the years ended December 31, 2009 and 2010 from the change in the fair value of these instruments:
|
|
|
|
|
|
|
|
|
|
|
|
|
|
|
|
Year ended December 31, 2010 |
|
Fair Value at |
|
Net |
|
Unrealized |
|
Fair Value at |
|
||||
|
|
|
|
|
|
|
|
|
|
|
||||
|
Auction Rate Securities |
|
$ |
17,876,000 |
|
$ |
(17,876,000 |
) |
$ |
— |
|
$ |
— |
|
|
Auction Rate Securities – Rights |
|
|
1,499,000 |
|
|
(1,499,000 |
) |
|
— |
|
|
— |
|
|
|
|
|
|
|
|
|
|
|
|
|
|
|
|
|
|
|
$ |
19,375,000 |
|
$ |
(19,375,000 |
) |
$ |
— |
|
$ |
— |
|
|
|
|
|
|
|
|
|
|
|
|
|
|
|
|
|
|
|
|
|
|
|
|
|
|
|
|
|
|
|
|
Year ended December 31, 2009 |
|
Fair Value at |
|
Net |
|
Unrealized |
|
Fair Value at |
|
||||
|
|
|
|
|
|
|
|
|
|
|
|
|
|
|
|
Auction Rate Securities |
|
$ |
18,117,000 |
|
$ |
(1,050,000 |
) |
$ |
809,000 |
|
$ |
17,876,000 |
|
|
Auction Rate Securities – Rights |
|
|
1,970,000 |
|
|
— |
|
|
(471,000 |
) |
|
1,499,000 |
|
|
|
|
|
|
|
|
|
|
|
|
|
|
|
|
|
|
|
$ |
20,087,000 |
|
$ |
(1,050,000 |
) |
$ |
338,000 |
|
$ |
19,375,000 |
|
|
|
|
|
|
|
|
|
|
|
|
|
|
|
|
The fair value of the ARSR was based on an approach in which the present value of all expected future cash flows was subtracted from the current fair market value of the security and the resultant value was calculated as a future value at an interest rate reflective of counterparty risk.
58
The cost, gross unrealized gains (losses) and fair value of available for sale, held to maturity and trading to maturity securities by major security type at December 31, 2009 and 2010 were as follows:
|
|
|
|
|
|
|
|
|
|
|
|
|
|
|
|
December 31, 2010 |
|
Cost |
|
Unrealized |
|
Unrealized |
|
Fair |
|
||||
|
|
|
|
|
|
|
|
|
|
|
||||
|
Investments – short term |
|
|
|
|
|
|
|
|
|
|
|
|
|
|
Available for sale |
|
|
|
|
|
|
|
|
|
|
|
|
|
|
Government agency bonds |
|
$ |
521,000 |
|
$ |
— |
|
$ |
— |
|
$ |
521,000 |
|
|
Mutual funds |
|
|
2,515,000 |
|
|
— |
|
|
(28,000 |
) |
|
2,487,000 |
|
|
Corporate bonds and commercial paper |
|
|
1,549,000 |
|
|
8,000 |
|
|
— |
|
|
1,557,000 |
|
|
|
|
|
|
|
|
|
|
|
|
|
|
|
|
|
Total available for sale – short term |
|
|
4,585,000 |
|
|
8,000 |
|
|
(28,000 |
) |
|
4,565,000 |
|
|
|
|
|
|
|
|
|
|
|
|
|
|
|
|
|
|
|
|
|
|
|
|
|
|
|
|
|
|
|
|
Investments – long term |
|
|
|
|
|
|
|
|
|
|
|
|
|
|
Available for sale |
|
|
|
|
|
|
|
|
|
|
|
|
|
|
U.S. Treasury Notes |
|
|
5,079,000 |
|
|
|
|
|
(10,000 |
) |
|
5,069,000 |
|
|
Government agency bonds |
|
|
2,232,000 |
|
|
|
|
|
|
|
|
2,232,000 |
|
|
Corporate bonds and commercial paper |
|
|
2,048,000 |
|
|
24,000 |
|
|
(9,000 |
) |
|
2,063,000 |
|
|
|
|
|
|
|
|
|
|
|
|
|
|
|
|
|
Total available for sale – long term |
|
|
9,359,000 |
|
|
24,000 |
|
|
(19,000 |
) |
|
9,364,000 |
|
|
|
|
|
|
|
|
|
|
|
|
|
|
|
|
|
|
|
|
|
|
|
|
|
|
|
|
|
|
|
|
Total investments |
|
$ |
13,944,000 |
|
$ |
32,000 |
|
$ |
(47,000 |
) |
$ |
13,929,000 |
|
|
|
|
|
|
|
|
|
|
|
|
|
|
|
|
59
|
|
|
|
|
|
|
|
|
|
|
|
|
|
|
|
December 31, 2009 |
|
Cost |
|
Unrealized |
|
Unrealized |
|
Fair |
|
||||
|
|
|
|
|
|
|
|
|
|
|
||||
|
Investments – short term |
|
|
|
|
|
|
|
|
|
|
|
|
|
|
Available for sale |
|
|
|
|
|
|
|
|
|
|
|
|
|
|
Government agency bonds |
|
$ |
10,848,000 |
|
$ |
— |
|
$ |
(61,000 |
) |
$ |
10,787,000 |
|
|
|
|
|
|
|
|
|
|
|
|
|
|
|
|
|
Total available for sale |
|
|
10,848,000 |
|
|
— |
|
|
(61,000 |
) |
|
10,787,000 |
|
|
|
|
|
|
|
|
|
|
|
|
|
|
|
|
|
|
|
|
|
|
|
|
|
|
|
|
|
|
|
|
Held to maturity securities |
|
|
|
|
|
|
|
|
|
|
|
|
|
|
US Treasury Notes |
|
|
763,000 |
|
|
— |
|
|
— |
|
|
763,000 |
|
|
Government agency bonds |
|
|
1,949,00 |
|
|
|
|
|
|
|
|
1,949,000 |
|
|
Corporate bonds |
|
|
1,035,000 |
|
|
|
|
|
|
|
|
1,035,000 |
|
|
|
|
|
|
|
|
|
|
|
|
|
|
|
|
|
Total held to maturity |
|
|
3,747,000 |
|
|
|
|
|
|
|
|
3,747,000 |
|
|
|
|
|
|
|
|
|
|
|
|
|
|
|
|
|
|
|
|
|
|
|
|
|
|
|
|
|
|
|
|
Trading securities |
|
|
|
|
|
|
|
|
|
|
|
|
|
|
Auction rate securities |
|
|
19,375,000 |
|
|
|
|
|
(1,499,000 |
) |
|
17,876,000 |
|
|
Auction rate securities – rights |
|
|
|
|
|
1,499,000 |
|
|
|
|
|
1,499,000 |
|
|
|
|
|
|
|
|
|
|
|
|
|
|
|
|
|
Total trading securities |
|
|
19,375,000 |
|
|
1,499,000 |
|
|
(1,499,000 |
) |
|
19,375,000 |
|
|
|
|
|
|
|
|
|
|
|
|
|
|
|
|
|
|
|
|
|
|
|
|
|
|
|
|
|
|
|
|
Total investments – short term |
|
|
33,970,000 |
|
|
1,499,000 |
|
|
(1,560,000 |
) |
|
33,909,000 |
|
|
|
|
|
|
|
|
|
|
|
|
|
|
|
|
|
|
|
|
|
|
|
|
|
|
|
|
|
|
|
|
Investments – long term |
|
|
|
|
|
|
|
|
|
|
|
|
|
|
Held to maturity securities |
|
|
|
|
|
|
|
|
|
|
|
|
|
|
US Treasury Notes |
|
|
770,000 |
|
|
|
|
|
|
|
|
770,000 |
|
|
Government agency bonds |
|
|
2,349,000 |
|
|
— |
|
|
— |
|
|
2,349,000 |
|
|
Corporate bonds |
|
|
3,633,000 |
|
|
— |
|
|
— |
|
|
3,633,000 |
|
|
|
|
|
|
|
|
|
|
|
|
|
|
|
|
|
Total investments – long term |
|
|
6,752,00 |
|
|
— |
|
|
— |
|
|
6,752,000 |
|
|
|
|
|
|
|
|
|
|
|
|
|
|
|
|
|
|
|
|
|
|
|
|
|
|
|
|
|
|
|
|
Total investments |
|
$ |
40,722,000 |
|
$ |
1,499,000 |
|
$ |
(1,560,000 |
) |
$ |
40,661,000 |
|
|
|
|
|
|
|
|
|
|
|
|
|
|
|
|
The Company utilizes a fair value hierarchy that prioritizes the inputs to valuation techniques used to measure fair value into three broad levels. The following is a brief description of those levels:
|
|
|
|
|
|
§ |
Level 1: Unadjusted quoted prices in active markets for identical assets or liabilities. |
|
|
|
|
|
|
§ |
Level 2: Inputs other than quoted prices that are observable for the asset or liability, either directly or indirectly. These include quoted prices for similar assets or liabilities in active markets and quoted prices for identical or similar assets or liabilities in markets that are not active. |
|
|
|
|
|
|
§ |
Level 3: Unobservable inputs that reflect the reporting entity’s own assumptions. |
At December 31, 2010, the Company’s investments described above are classified as Level 1 for fair value measurement.
The table below includes a roll forward of the Company’s investments in ARS and ARSR from January 1, 2010 to December 31, 2010:
|
|
|
|
|
|
|
Fair value, January 1, 2010 |
|
$ |
19,375,000 |
|
|
Net redemptions |
|
|
(19,375,000 |
) |
|
|
|
|
|
|
|
Fair value, December 31, 2010 |
|
$ |
— |
|
|
|
|
|
|
|
60
NOTE 4 — REVENUE RECOGNITION
|
|
|
|
|
The Company’s product revenue is derived: (i) from sales of our industrial and rental fleet wireless asset management systems, which includes training and technical support; (ii) from remote asset wireless asset management systems and spare parts sold to customers (for which title transfers on date of customer receipt) and from the related communication services under contracts that generally provide for service over periods ranging from one to five years; (iii) from post-contract maintenance and support agreements; and (iv) periodically, from leasing arrangements. |
|
|
|
|
|
The Company has determined that the revenue derived from the sale of remote asset wireless management systems does not have stand alone value to the customer separate from the communication services provided and the arrangements constitute a single unit of accounting. Under the applicable accounting guidance, all of the Company’s billings for equipment and the related cost are deferred, recorded, and classified as a current and long-term liability and a current and long-term asset, respectively. Deferred revenue and cost are recognized over the service contract life, beginning at the time that a customer acknowledges acceptance of the equipment and service. The customer service contracts typically range from one to five years. During the year ended December 31, 2010, the Company amortized deferred equipment revenue of $696,000. |
|
|
|
|
|
The Company also enters into post-contract maintenance and support agreements for its wireless asset management systems. Revenue is recognized over the service period and the cost of providing these services is expensed as incurred. Deferred revenue also includes prepayment of extended maintenance and support contracts. |
|
|
|
|
|
Revenue from activation fees are deferred and amortized over the life of the contract. |
|
|
|
|
|
Deferred revenue as of December 31, 2009 and December 31, 2010 consists of the following: |
|
|
|
|
|
|
|
|
|
|
|
|
December 31, |
|
||||
|
|
|
2009 |
|
2010 |
|
||
|
|
|
|
|
|
|
||
|
Deferred activation fees |
|
$ |
— |
|
$ |
96,000 |
|
|
Deferred industrial equipment installation revenue |
|
|
|
|
|
367,000 |
|
|
Deferred maintenance revenue |
|
|
962,000 |
|
|
798,000 |
|
|
Deferred remote asset management product revenue |
|
|
— |
|
|
5,539,000 |
|
|
|
|
|
|
|
|
|
|
|
|
|
|
962,000 |
|
|
6,800,000 |
|
|
Less: Current portion |
|
|
501,000 |
|
|
2,186,000 |
|
|
|
|
|
|
|
|
|
|
|
|
|
|
|
|
|
|
|
|
Deferred revenue – less current portion |
|
$ |
461,000 |
|
$ |
4,614,000 |
|
|
|
|
|
|
|
|
|
|
|
|
|
|
|
Sales taxes collected from customers and remitted to governmental authorities are accounted for on a net basis and therefore are excluded from revenues in the consolidated statements of operations. |
NOTE 5 — NOTE RECEIVABLE AND SALES-TYPE LEASE RECEIVABLE
|
|
|
|
|
|
[A] |
Note receivable: |
|
|
|
|
|
|
Notes receivable of $330,000 at December 31, 2010 relate to product financing arrangements that exceed one year and bear interest at approximately 8%. Interest is recognized over the life of the notes. The notes receivable are collateralized by the equipment being financed. The Company has not sold and does not intend to sell these receivables. Amounts collected on the notes receivable are included in net cash provided by operating activities in the consolidated statements of cash flows. Unearned interest income is amortized to interest income over the life of the notes using the effective-interest method. The revenue derived from the sale of monitoring equipment and the related costs are deferred (See Notes 4 and 6 to the Consolidated Financial Statements). Deferred revenue and cost are recognized over the service contract life, beginning at the time that a customer acknowledges acceptance of the equipment and service. |
|
|
|
|
|
|
|
|
Notes receivable |
|
$ |
330,000 |
|
|
Less: Current portion |
|
|
137,000 |
|
|
|
|
|
|
|
|
Notes receivable - less current portion |
|
$ |
193,000 |
|
|
|
|
|
|
|
61
|
|
|
|
|
|
[B] |
Sales-type lease receivable: |
|
|
|
|
|
|
Present value of net investment in sales-type lease of $862,000 is for a five-year lease of the Company’s product and is reflected net of unearned income of approximately $132,000 discounted at 8%. |
|
|
|
|
|
|
|
Scheduled maturities of minimum lease payments outstanding as of December 31, 2010 are as follows: |
|
|
|
|
|
|
|
|
Year ending December 31: |
|
|
|
|
|
|
|
|
|
|
|
2011 |
|
$ |
216,000 |
|
|
2012 |
|
|
234,000 |
|
|
2013 |
|
|
253,000 |
|
|
2014 |
|
|
159,000 |
|
|
2015 |
|
|
— |
|
|
|
|
|
|
|
|
|
|
|
|
|
|
Total |
|
$ |
862,000 |
|
|
|
|
|
|
|
NOTE 6 — DEFERRED COSTS
During 2009, the Company entered into a contract with a customer pursuant to which the Company’s rental fleet management system will be implemented on a portion of the customer’s fleet of vehicles. The term of the agreement is for five years. The customer is entitled to terminate the contract after 22 months subject to a performance clause and early termination fees. The Company will be entitled to issue sixty monthly invoices of up to $57,000 per month based on the number of active vehicle management systems installed in the customer’s fleet of vehicles. Costs directly attributable to this contract, consisting principally of engineering and manufacturing costs, are being deferred until implementation of the system is completed. The deferred costs will be charged to cost of revenue in accordance with the cost recovery method, pursuant to which the deferred contract costs will be reduced in each period by an amount equal to the revenue recognized until all the capitalized costs are recovered, at which time the Company will recognize a gross profit, if any. During 2010, the Company capitalized $783,000 of such contract costs and expects to incur additional costs until the installation is complete. As of December 31, 2009, the Company deferred $63,000 of such contract costs, which were included in prepaid expenses and other current assets. The Company amortized $152,000 of such costs for the year ended December 31, 2010.
Deferred costs at December 31, 2010 consists of the following:
|
|
|
|
|
|
|
Deferred contract costs |
|
$ |
694,000 |
|
|
Deferred product costs (see Note 4) |
|
|
3,443,000 |
|
|
|
|
|
|
|
|
|
|
|
4,137,000 |
|
|
Less: Current portion |
|
|
1,159,000 |
|
|
|
|
|
|
|
|
|
|
|
|
|
|
Deferred costs – less current portion |
|
$ |
2,978,000 |
|
|
|
|
|
|
|
The Company will continue to evaluate the realizability of the carrying amount of the deferred contract costs on a quarterly basis. To the extent the carrying value of the deferred contract costs exceed the contract revenue, an impairment loss will be recognized.
NOTE 7 - INVENTORIES
Inventories as of December 31, 2009 and 2010 consist of the following:
|
|
|
|
|
|
|
|
|
|
|
|
December 31, |
|
||||
|
|
|
2009 |
|
2010 |
|
||
|
Components |
|
$ |
898,000 |
|
$ |
4,282,000 |
|
|
Finished goods |
|
|
4,519,000 |
|
|
3,885,000 |
|
|
|
|
|
|
|
|
|
|
|
|
|
|
5,417,000 |
|
|
8,167,000 |
|
|
Less: Inventory reserves |
|
|
(930,000 |
) |
|
(872,000 |
) |
|
|
|
|
|
|
|
|
|
|
|
|
|
|
|
|
|
|
|
|
|
$ |
4,487,000 |
|
$ |
7,295,000 |
|
|
|
|
|
|
|
|
|
|
62
NOTE 8 - FIXED ASSETS
Fixed assets are stated at cost, less accumulated depreciation and amortization, and at December 31, 2009 and 2010, are summarized as follows:
|
|
|
|
|
|
|
|
|
|
|
|
December 31, |
|
||||
|
|
|
2009 |
|
2010 |
|
||
|
Equipment |
|
$ |
1,011,000 |
|
$ |
1,026,000 |
|
|
Computer software |
|
|
414,000 |
|
|
2,982,000 |
|
|
Computer hardware |
|
|
774,000 |
|
|
1,751,000 |
|
|
Furniture and fixtures |
|
|
184,000 |
|
|
329,000 |
|
|
Automobiles |
|
|
80,000 |
|
|
47,000 |
|
|
Leasehold improvements |
|
|
514,000 |
|
|
246,000 |
|
|
|
|
|
|
|
|
|
|
|
|
|
|
|
|
|
|
|
|
|
|
|
2,977,000 |
|
|
6,381,000 |
|
|
Accumulated depreciation and amortization |
|
|
(2,060,000 |
) |
|
(2,528,000 |
) |
|
|
|
|
|
|
|
|
|
|
|
|
|
|
|
|
|
|
|
|
|
$ |
917,000 |
|
$ |
3,853,000 |
|
|
|
|
|
|
|
|
|
|
Depreciation expense was $540,000, $530,000 and $1,265,000 for the years ended December 31, 2008, 2009 and 2010, respectively. This includes amortization of costs associated with computer software and website development for the years ended December 31, 2008, 2009 and 2010 of $132,000 $121,000 and $581,000, respectively.
The Company capitalizes in fixed assets the costs of software development and website development. Specifically, the assets comprise an implementation of Oracle Enterprise Resource Planning (ERP) software, enhancements to the Veriwise ® systems, and a customer interface website (which is the primary tool used to provide data to our customers). The website employs updated web architecture and improved functionality and features, including, but not limited to, customization at the customer level, enhanced security features, custom virtual electronic geofencing of landmarks, global positioning system (“GPS”) based remote mileage reporting, and richer mapping capabilities. The Company capitalized the costs incurred during the “development” and “enhancement” stages of the software and website development. Costs incurred during the “planning” and “post-implementation/operation” stages of development were expensed. The Company capitalized $-0- and $868,000 for website enhancements for the years ended December 31, 2009 and 2010, respectively.
NOTE 9 – ACQUISITIONS, GOODWILL AND OTHER INTANGIBLE ASSETS
On October 19, 2009, the Company acquired Didbox Ltd. (“Didbox”), a privately held manufacturer and marketer of vehicle operator identification systems based in the United Kingdom (“UK”). The transaction was valued at approximately $660,000 and was structured with $534,000 paid up front in cash and contingent consideration of $110,000 due in 12 months based upon achievement of certain revenue and operating profit targets. The Company originally recorded $110,000 of contingent consideration based on the expected revenue and operating profits of Didbox during the measurement period applicable to the contingent consideration. The contingent consideration was reversed during the third quarter of 2010, as the Company did not expect Didbox to meet the revenue and operating profit targets. The reversal of $110,000 of contingent consideration is included in other income in the consolidated statement of operations. The Company incurred acquisition-related expenses of approximately $43,000, which were included in selling, general and administrative expenses in the consolidated statement of operations during the year ended December 31, 2009. The Didbox business complements the Company’s existing businesses by allowing access to the original equipment manufacturer (OEM) dealer network in the UK, and offers the ability to add the I.D. Systems solution set to its product line. In addition, the acquisition is expected to provide the Company with access to a broader base of customers in Europe.
63
The Company has accounted for the Didbox transaction under the acquisition method of accounting and recorded the assets and liabilities of the acquired business at their estimated fair values at the date of acquisition. The excess of the purchase price over the estimated fair values of the net assets acquired was recorded as goodwill. The goodwill is not expected to be deductible for tax purposes. The allocation of the Didbox purchase price consists of the following:
|
|
|
|
|
|
|
Current assets |
|
$ |
93,000 |
|
|
Other assets |
|
|
36,000 |
|
|
Current liabilities |
|
|
(104,000 |
) |
|
Goodwill |
|
|
419,000 |
|
|
Trademarks and tradenames |
|
|
61,000 |
|
|
Customer list |
|
|
56,000 |
|
|
Other intangibles |
|
|
83,000 |
|
|
|
|
|
|
|
|
|
|
|
|
|
|
Fair value of assets acquired |
|
$ |
644,000 |
|
|
|
|
|
|
|
The results of operations of Didbox have been included in the consolidated statement of operations as of the effective date of the acquisition. Pro forma results of operations have not been presented because the effects of the acquisition were not material.
On January 7, 2010, the Company entered into a Membership Interest Purchase Agreement (the “Purchase Agreement”) with General Electric Capital Corporation (“GECC”) and GE Asset Intelligence, LLC (“GEAI”), pursuant to which the Company acquired GEAI’s telematics business (the “GEAI Business”) through the purchase of 100% of the membership interests of Asset Intelligence, LLC (“AI”), a newly formed, wholly owned subsidiary of GEAI into which substantially all of the assets, including intellectual property, and liabilities of the GEAI Business had been transferred immediately prior to the closing. Effective with the closing of the transaction, AI became a wholly owned subsidiary of the Company. In connection with the transaction, AI offered employment to all of the former employees of the GEAI Business. The focus of AI’s business is in trucking, rail, marine and intermodal applications. The acquisition is expected to provide the Company with access to a broader base of customers.
Under the terms of the Purchase Agreement, the Company paid consideration of $15 million in cash at closing. In addition, the Company would have been required to pay additional cash consideration of up to $2 million in or about February 2011, contingent upon the number of new units of telematics equipment sold or subject to a binding order to be sold by AI during the year ending December 31, 2010. The Company originally recorded in the preliminary purchase price allocation $1,017,000 of contingent consideration based on the estimated number of new units of telematics equipment expected to be sold in 2010. The contingent consideration was estimated using a probability weighted calculation of the number of new units of telematics equipment expected to be sold in 2010 discounted at 20.5%, which represents the Company’s weighted-average discount rate. The contingent consideration was reversed during the second quarter of 2010 based on revised forecasts which indicated AI would not meet the required number of new unit sales during the measurement period for the contingent consideration.
The Company incurred acquisition-related expenses of approximately $1,355,000, of which $1,241,000 and $114,000 were included in selling, general and administrative expenses in 2009 and 2010, respectively.
The transaction was accounted for using the acquisition method of accounting and the purchase price was assigned to the net assets acquired based on the fair value of such assets and liabilities at the date of acquisition. The following table summarizes the final allocation of the AI purchase price to the assets acquired and liabilities assumed at the date of acquisition:
|
|
|
|
|
|
|
Current assets, excluding inventory |
|
$ |
4,709,000 |
|
|
Inventory |
|
|
5,236,000 |
|
|
Other assets, net |
|
|
3,218,000 |
|
|
Current liabilities |
|
|
(5,746,000 |
) |
|
Intangibles |
|
|
6,365,000 |
|
|
Goodwill |
|
|
1,218,000 |
|
|
|
|
|
|
|
|
|
|
|
|
|
|
Fair value of assets acquired |
|
$ |
15,000,000 |
|
|
|
|
|
|
|
64
The goodwill arising from the acquisition consists largely of the synergies and cost reductions through economies of scale expected from combining the operations of the Company and AI. The goodwill is expected to be fully deductible for tax purposes.
The fair value of the current assets acquired includes trade accounts receivable with a fair value of $3,272,000. The gross amount due is $3,966,000, of which $694,000 is expected to be uncollectible.
The results of operations of AI have been included in the consolidated statement of operations as of the effective date of the acquisition.
The Company does not allocate indirect expenses, such as compensation to executives and corporate personnel, professional fees, finance, stock based compensation expense, and certain other operating costs, to AI. These costs are included in the IDS operating segment. The following revenues and operating loss of AI were included in the Company’s consolidated results of operations for the year ended December 31, 2010:
|
|
|
|
|
|
|
|
|
Year Ended |
|
|
|
|
|
|
|
|
|
|
|
|
|
|
|
Revenues |
|
$ |
15,155,000 |
|
|
Operating loss |
|
|
(3,277,000 |
) |
The following table represents the combined pro forma revenue and earnings for the years ended December 31, 2008, 2009 and 2010:
|
|
|
|
|
|
|
|
|
|
|
|
|
|
|
Year Ended |
|
Year Ended |
|
Year Ended |
|
|||
|
|
|
|
|
|
|
|
|
|||
|
|
|
(Unaudited) |
|
(Unaudited) |
|
(Unaudited) |
|
|||
|
|
|
|
|
|
|
|
|
|
|
|
|
Revenue |
|
$ |
49,680,000 |
|
$ |
37,626,000 |
|
$ |
26,103,000 |
|
|
Net loss |
|
|
(48,841,000 |
) |
|
(28,773,000 |
) |
|
(12,542,000 |
) |
|
Net loss per share — basic and diluted |
|
|
(4.49 |
) |
|
(2.62 |
) |
|
(1.12 |
) |
The combined pro forma revenue and earnings for the years ended December 31, 2008, 2009 and 2010 were prepared as if the acquisition had occurred as of January 1, 2008, 2009 and 2010, respectively. The pro forma results do not include any anticipated cost synergies or other effects of the planned integration of AI. Accordingly, this summary is not necessarily indicative of what the results of operations would have been had this business acquisition occurred during such period, nor does it purport to represent results of operations for any future periods.
The changes in the carrying amount of goodwill from January 1, 2009 to December 31, 2010 are as follows:
|
|
|
|
|
|
|
|
|
|
|
|
|
|
|
IDS |
|
AI |
|
Total |
|
|||
|
|
|
|
|
|
|
|
|
|||
|
Balance of as January 1, 2009 |
|
$ |
200,000 |
|
|
— |
|
$ |
200,000 |
|
|
Didbox acquisition |
|
|
419,000 |
|
|
|
|
|
419,000 |
|
|
|
|
|
|
|
|
|
|
|
|
|
|
Balance at December 31, 2009 |
|
|
619,000 |
|
|
|
|
|
619,000 |
|
|
Asset Intelligence acquisition |
|
|
— |
|
$ |
1,218,000 |
|
|
1,218,000 |
|
|
|
|
|
|
|
|
|
|
|
|
|
|
|
|
|
|
|
|
|
|
|
|
|
|
Balance as of December 31, 2010 |
|
$ |
619,000 |
|
$ |
1,218,000 |
|
$ |
1,837,000 |
|
|
|
|
|
|
|
|
|
|
|
|
|
65
Identifiable intangible assets are comprised of the following:
|
|
|
|
|
|
|
|
|
|
|
|
|
|
|
|
December 31, 2010 |
|
Useful |
|
Gross |
|
Accumulated |
|
Net |
|
||||
|
|
|
|
|
|
|
|
|
|
|
||||
|
Amortized: |
|
|
|
|
|
|
|
|
|
|
|
|
|
|
Patents |
|
11 |
|
$ |
1,489,000 |
|
$ |
(135,000 |
) |
$ |
1,354,000 |
|
|
|
Tradename |
|
5 |
|
|
200,000 |
|
|
(40,000 |
) |
|
160,000 |
|
|
|
Non-competition agreement |
|
3 |
|
|
234,000 |
|
|
(78,000 |
) |
|
156,000 |
|
|
|
Technology |
|
5 |
|
|
50,000 |
|
|
(12,000 |
) |
|
38,000 |
|
|
|
Workforce |
|
5 |
|
|
33,000 |
|
|
(8,000 |
) |
|
25,000 |
|
|
|
Customer relationships |
|
5 |
|
|
4,499,000 |
|
|
(900,000 |
) |
|
3,599,000 |
|
|
|
|
|
|
|
|
|
|
|
|
|
|
|
|
|
|
|
|
|
|
|
|
|
|
|
|
|
|
|
|
|
|
|
|
|
|
|
6,505,000 |
|
|
(1,173,000 |
) |
|
5,332,000 |
|
|
|
|
|
|
|
|
|
|
|
|
|
|
|
|
|
|
|
|
|
|
|
|
|
|
|
|
|
|
|
|
Unamortized: |
|
|
|
|
|
|
|
|
|
|
|
|
|
|
Customer list |
|
|
|
|
|
104,000 |
|
|
— |
|
|
104,000 |
|
|
Trademark and Tradename |
|
|
|
|
|
135,000 |
|
|
— |
|
|
135,000 |
|
|
|
|
|
|
|
|
|
|
|
|
|
|
|
|
|
|
|
|
|
|
|
|
|
|
|
|
|
|
|
|
|
|
|
|
|
|
239,000 |
|
|
— |
|
|
239,000 |
|
|
|
|
|
|
|
|
|
|
|
|
|
|
|
|
|
|
|
|
|
|
|
|
|
|
|
|
|
|
|
|
Total |
|
|
|
|
$ |
6,744,000 |
|
$ |
(1,173,000 |
) |
$ |
5,571,000 |
|
|
|
|
|
|
|
|
|
|
|
|
|
|
|
|
|
|
|
|
|
|
|
|
|
|
|
|
|
|
|
|
December 31, 2009 |
|
Useful |
|
Gross |
|
Accumulated |
|
Net |
|
||||
|
|
|
|
|
|
|
|
|
|
|
||||
|
Amortized: |
|
|
|
|
|
|
|
|
|
|
|
|
|
|
Technology |
|
5 |
|
$ |
50,000 |
|
$ |
(2,000 |
) |
$ |
48,000 |
|
|
|
Workforce |
|
5 |
|
|
33,000 |
|
|
(1,000 |
) |
|
32,000 |
|
|
|
Customer relationships |
|
5 |
|
|
56,000 |
|
|
— |
|
|
56,000 |
|
|
|
|
|
|
|
|
|
|
|
|
|
|
|
|
|
|
|
|
|
|
|
|
|
|
|
|
|
|
|
|
|
|
|
|
|
|
|
139,000 |
|
|
(3,000 |
) |
|
136,000 |
|
|
|
|
|
|
|
|
|
|
|
|
|
|
|
|
|
|
|
|
|
|
|
|
|
|
|
|
|
|
|
|
Unamortized: |
|
|
|
|
|
|
|
|
|
|
|
|
|
|
Customer list |
|
|
|
|
|
104,000 |
|
|
— |
|
|
104,000 |
|
|
Trademark and Tradename |
|
|
|
|
|
135,000 |
|
|
— |
|
|
135,000 |
|
|
|
|
|
|
|
|
|
|
|
|
|
|
|
|
|
|
|
|
|
|
|
|
|
|
|
|
|
|
|
|
|
|
|
|
|
|
239,000 |
|
$ |
— |
|
|
239,000 |
|
|
|
|
|
|
|
|
|
|
|
|
|
|
|
|
|
|
|
|
|
|
|
|
|
|
|
|
|
|
|
|
Total |
|
|
|
|
$ |
378,000 |
|
|
(3,000 |
) |
$ |
375,000 |
|
|
|
|
|
|
|
|
|
|
|
|
|
|
|
|
The Company tests the goodwill and other intangible assets on an annual basis in the fourth quarter or more frequently if the Company believes indicators of impairment exist. At December 31, 2010, the Company determined that no impairment existed to the goodwill, customer list and trademark and trade name of its acquired intangible assets. The Company also determined that the use of indefinite lives for the customer list and trademark and trade name remains applicable at December 31, 2010, as the Company expects to derive future benefits from these intangible assets.
66
Amortization expense for the years ended December 31, 2008, 2009 and 2010 was $-0-, $3,000 and $1,170,000, respectively. Future amortization expense for these intangible assets is as follows:
|
|
|
|
|
|
|
Year ending December 31: |
|
|
|
|
|
|
|
|
|
|
|
2011 |
|
$ |
1,170,000 |
|
|
2012 |
|
|
1,170,000 |
|
|
2013 |
|
|
1,091,000 |
|
|
2014 |
|
|
1,086,000 |
|
|
2015 |
|
|
135,000 |
|
67
NOTE 10 – LINE OF CREDIT
In October 2008, the Company received an offer (the “Offer”) from UBS for a put right (the “ARSR”) permitting the Company to sell to UBS at par value all ARS held by the Company, all of which were purchased by the Company from UBS, at a future date (any time during a two-year period beginning June 30, 2010). Included as part of the Offer, the Company received a commitment to obtain a loan for 75% of the UBS-determined value of the ARS at any time until the put option is exercised at a variable interest rate equal to the lesser of: (i) the applicable reference rate plus a spread set forth in the applicable credit agreement and (ii) the then-applicable weighted-average interest or dividend rate paid to the Company by the issuer of the ARS that is pledged to UBS as collateral. The Company accepted the Offer in November 2008. In March 2009, the Company borrowed $12,900,000 (which amount was equal to 75% of the UBS-determined value of the ARS) against this credit facility. Principal payments reduced the Company’s obligation to $11,638,000 at December 31, 2009. The line of credit facility was payable on demand. The line of credit facility was repaid in July 2010 from the redemption of the ARS. Upon the redemption of the ARS, the line of credit expired.
NOTE 11 – NET LOSS PER SHARE
|
|
|
|
|
|
|
|
|
|
|
|
|
|
|
December 31, |
|
|||||||
|
|
|
|
|
|||||||
|
Basic and diluted loss per share |
|
2008 |
|
2009 |
|
2010 |
|
|||
|
|
|
|
|
|
|
|
|
|||
|
|
|
|
|
|
|
|
|
|
|
|
|
Net loss |
|
$ |
(4,175,000 |
) |
$ |
(13,192,000 |
) |
$ |
(12,611,000 |
) |
|
|
|
|
|
|
|
|
|
|
|
|
|
|
|
|
|
|
|
|
|
|
|
|
|
Weighted average common shares outstanding – basic and diluted |
|
|
10,887,000 |
|
|
10,991,000 |
|
|
11,239,000 |
|
|
|
|
|
|
|
|
|
|
|
|
|
|
|
|
|
|
|
|
|
|
|
|
|
|
Net loss per share – basic and diluted |
|
$ |
(0.38 |
) |
$ |
(1.20 |
) |
$ |
(1.12 |
) |
|
|
|
|
|
|
|
|
|
|
|
|
Basic loss per share is calculated by dividing net loss by the weighted-average number of common shares outstanding during the period. Diluted loss per share reflects the potential dilution assuming common shares were issued upon the exercise of outstanding options and the proceeds thereof were used to purchase outstanding common shares. For the years ended December 31, 2008, 2009 and 2010, the basic and diluted weighted-average shares outstanding are the same, since the effect from the potential exercise of outstanding stock options of 2,601,000, 2,659,000, and 2,666,000, respectively, would have been anti-dilutive.
NOTE 12 – STOCK-BASED COMPENSATION
|
|
|
|
[A] |
Stock options: |
|
|
|
|
|
The Company adopted the 1995 Stock Option Plan, pursuant to which the Company had the right to grant options to purchase up to an aggregate of 1,250,000 shares of common stock. The Company also adopted the 1999 Stock Option Plan, pursuant to which the Company had the right to grant stock awards and options to purchase up to 2,813,000 shares of common stock. The Company also adopted the 1999 Director Option Plan, pursuant to which the Company had the right to grant options to purchase up to an aggregate of 600,000 shares of common stock. The 1995 Stock Option Plan expired during 2005 and the 1999 Stock and Director Option Plans expired during 2009 and the Company cannot issue additional options under these plans. |
|
|
|
|
|
The Company adopted the 2007 Equity Compensation Plan, pursuant to which the Company may grant options to purchase up to an aggregate of 2,000,000 shares of common stock. The Company also adopted the 2009 Non-Employee Director Equity Compensation Plan, pursuant to which the Company may grant options to purchase up to an aggregate of 300,000 shares of common stock. The plans are administered by the Compensation Committee of the Company’s Board of Directors, which has the authority to determine, among other things, the term during which an option may be exercised (not more than 10 years), the exercise price of an option and the vesting provisions. |
|
|
|
|
|
A summary of the status of the Company’s stock option plans as of December 31, 2008, 2009 and 2010 and changes during the years then ended, is presented below: |
68
|
|
|
|
|
|
|
|
|
|
|
|
|
|
|
|
|
|
|
|
|
|
|
|
2008 |
|
2009 |
|
2010 |
|
||||||||||||
|
|
|
|
|
|
|
|
|
||||||||||||
|
|
|
Number of |
|
Weighted |
|
Number of |
|
Weighted |
|
Number of |
|
Weighted |
|
||||||
|
|
|
|
|
|
|
|
|
|
|
|
|
|
|
||||||
|
|
|
|
|
|
|
|
|
|
|
|
|
|
|
|
|
|
|
|
|
|
Outstanding at beginning of year |
|
|
2,761,000 |
|
$ |
9.57 |
|
|
2,601,000 |
|
$ |
9.81 |
|
|
2,659,000 |
|
$ |
8.88 |
|
|
Granted |
|
|
602,000 |
|
|
6.66 |
|
|
349,000 |
|
|
3.61 |
|
|
668,000 |
|
|
2.96 |
|
|
Exercised |
|
|
(505,000 |
) |
|
2.73 |
|
|
(1,000 |
) |
|
2.31 |
|
|
(1,000 |
) |
|
2.31 |
|
|
Expired |
|
|
— |
|
|
|
|
|
(22,000 |
) |
|
4.13 |
|
|
(232,000 |
) |
|
7.48 |
|
|
Forfeited |
|
|
(257,000 |
) |
|
13.74 |
|
|
(268,000 |
) |
|
11.44 |
|
|
(428,000 |
) |
|
10.05 |
|
|
|
|
|
|
|
|
|
|
|
|
|
|
|
|
|
|
|
|
|
|
|
|
|
|
|
|
|
|
|
|
|
|
|
|
|
|
|
|
|
|
|
|
Outstanding at end of year |
|
|
2,601,000 |
|
$ |
9.81 |
|
|
2,659,000 |
|
$ |
8.88 |
|
|
2,666,000 |
|
$ |
7.34 |
|
|
|
|
|
|
|
|
|
|
|
|
|
|
|
|
|
|
|
|
|
|
|
|
|
|
|
|
|
|
|
|
|
|
|
|
|
|
|
|
|
|
|
|
Exercisable at end of year |
|
|
1,485,000 |
|
$ |
9.37 |
|
|
1,662,000 |
|
$ |
9.51 |
|
|
1,522,000 |
|
$ |
9.60 |
|
|
|
|
|
|
|
|
|
|
|
|
|
|
|
|
|
|
|
|
|
|
The following table summarizes information about stock options at December 31, 2010:
|
|
|
|
|
|
|
|
|
|
|
|
|
|
|
|
|
|
|
|
|
|
|
|
|
|
|
Options Outstanding |
|
Options Exercisable |
|
|||||||||||||||||
|
|
|
|
|
|
|
|||||||||||||||||
|
Exercise |
|
Number |
|
Weighted |
|
Weighted |
|
Aggregate |
|
Number |
|
Weighted |
|
Aggregate |
|
|||||||
|
|
|
|
|
|
|
|
|
|
|
|
|
|
|
|
|
|||||||
|
|
|
|
|
|
|
|
|
|
|
|
|
|
|
|
|
|
|
|
|
|
|
|
|
1.97 – 3.81 |
|
|
916,000 |
|
|
9 years |
|
$ |
3.11 |
|
|
|
|
|
61,000 |
|
$ |
2.87 |
|
|
|
|
|
3.82 – 7.40 |
|
|
884,000 |
|
|
4 years |
|
|
5.83 |
|
|
|
|
|
725,000 |
|
|
6.03 |
|
|
|
|
|
7.41 – 14.15 |
|
|
630,000 |
|
|
5 years |
|
|
10.55 |
|
|
|
|
|
527,000 |
|
|
10.92 |
|
|
|
|
|
14.16 – 19.94 |
|
|
73,000 |
|
|
5 years |
|
|
17.30 |
|
|
|
|
|
71,000 |
|
|
17.34 |
|
|
|
|
|
19.95 – 25.38 |
|
|
163,000 |
|
|
5 years |
|
|
22.37 |
|
|
|
|
|
138,000 |
|
|
22.43 |
|
|
|
|
|
|
|
|
|
|
|
|
|
|
|
|
|
|
|
|
|
|
|
|
|
|
|
|
|
|
|
|
|
|
|
|
|
|
|
|
|
|
|
|
|
|
|
|
|
|
|
|
|
|
|
|
2,666,000 |
|
|
6 years |
|
$ |
7.34 |
|
$ |
262,000 |
|
|
1,522,000 |
|
$ |
9.60 |
|
$ |
32,000 |
|
|
|
|
|
|
|
|
|
|
|
|
|
|
|
|
|
|
|
|
|
|
|
|
|
|
|
|
|
|
|
|
|
|
|
|
|
|
|
|
|
|
|
Number |
|
Weighted |
|
Aggregate |
|
Weighted |
|
||||
|
|
|
|
|
|
|
|
|
|
|
||||
|
|
|
|
|
|
|
|
|
|
|
|
|
|
|
|
Options exercisable at December 31, 2010 |
|
|
1,522,000 |
|
$ |
9.60 |
|
$ |
32,000 |
|
|
3.88 |
|
|
|
|
|
|
|
|
|
|
|
|
|
|
|
|
|
Vested and expected to vest at December 31, 2010 |
|
|
2,666,000 |
|
$ |
7.34 |
|
$ |
262,000 |
|
|
5.93 |
|
69
The fair value of each option grant on the date of grant is estimated using the Black-Scholes option-pricing model reflecting the following weighted-average assumptions:
|
|
|
|
|
|
|
|
|
|
|
|
|
|
|
December 31, |
|
|||||||
|
|
|
|
|
|||||||
|
|
|
2008 |
|
2009 |
|
2010 |
|
|||
|
|
|
|
|
|
|
|
|
|||
|
|
|
|
|
|
|
|
|
|
|
|
|
Expected volatility |
|
|
58.4% - 75.8 |
% |
|
54.1% - 75.6 |
% |
|
52.5% - 58.9 |
% |
|
Expected life of options |
|
|
4.0 – 5.0 years |
|
|
3.0- 5.0 years |
|
|
3.0 – 5.0 years |
|
|
Risk free interest rate |
|
|
3 |
% |
|
2 |
% |
|
1.7 |
% |
|
Dividend yield |
|
|
0 |
% |
|
0 |
% |
|
0 |
% |
|
Weighted average fair value of options granted during the year |
|
$ |
3.87 |
|
$ |
1.85 |
|
$ |
1.31 |
|
Expected volatility is based on historical volatility of the Company’s stock and the expected life of options is based on historical data with respect to employee exercise periods.
For the years ended December 31, 2008, 2009 and 2010, the Company recorded $2,184,000, $1,937,000 and $1,250,000, respectively, of stock-based compensation expense in connection with the stock option grants. The total intrinsic value of options exercised during the years ended December 31, 2008, 2009 and 2010 was $2,476,000, $2,000 and $1,000, respectively.
The fair value of options vested during the years ended December 31, 2008, 2009 and 2010 was $2,209,000, $2,178,000 and $1,677,000, respectively. As of December 31, 2010, there was $1,817,000 of total unrecognized compensation costs related to non-vested options granted under the Company’s stock option plans. That cost is expected to be recognized over a weighted-average period of 1.76 years.
70
|
|
|
|
[B] |
Restricted Stock Awards: |
|
|
|
|
|
In 2006, Company began granting restricted stock to employees, whereby the employees are contractually restricted from transferring the shares until they are vested. The stock is unvested at the time of grant and, upon vesting, there are no legal restrictions on the stock. The fair value of each share is based on the Company’s closing stock price on the date of the grant. A summary of the non-vested shares for the years ended December 31, 2008, 2009 and 2010 is as follows: |
|
|
|
|
|
|
|
|
|
|
|
|
Number of |
|
Weighted |
|
||
|
|
|
|
|
|
|
||
|
|
|
|
|
|
|
|
|
|
Non-vested at January 1, 2008 |
|
|
65,000 |
|
$ |
17.40 |
|
|
Granted |
|
|
21,000 |
|
|
7.41 |
|
|
Vested |
|
|
(50,000 |
) |
|
17.96 |
|
|
Forfeited |
|
|
(5,000 |
) |
|
18.89 |
|
|
|
|
|
|
|
|
|
|
|
|
|
|
|
|
|
|
|
|
Non-vested at December 31, 2008 |
|
|
31,000 |
|
$ |
9.49 |
|
|
Granted |
|
|
162,000 |
|
|
3.54 |
|
|
Vested |
|
|
(21,000 |
) |
|
10.55 |
|
|
Forfeited |
|
|
— |
|
|
|
|
|
|
|
|
|
|
|
|
|
|
|
|
|
|
|
|
|
|
|
Non-vested at December 31, 2009 |
|
|
172,000 |
|
$ |
3.78 |
|
|
Granted |
|
|
206,000 |
|
|
2.73 |
|
|
Vested |
|
|
(20,000 |
) |
|
5.62 |
|
|
Forfeited |
|
|
(39,000 |
) |
|
3.15 |
|
|
|
|
|
|
|
|
|
|
|
|
|
|
|
|
|
|
|
|
Non-vested at December 31, 2010 |
|
|
319,000 |
|
$ |
3.07 |
|
|
|
|
|
|
|
|
|
|
|
|
|
|
|
For the years ended December 31, 2008, 2009 and 2010, the Company recorded $513,000, $205,000 and $273,000, respectively, of stock-based compensation expense in connection with the restricted stock grants. As of December 31, 2010, there was $645,000 of total unrecognized compensation cost related to non-vested shares. That cost is expected to be recognized over a weighted-average period of 1.90 years. |
|
|
|
|
[C] |
Performance Shares: |
|
|
|
|
|
In January 2007, the Compensation Committee granted 62,500 performance shares to key employees pursuant to the 1999 Stock Option Plan. The issuance of the shares of the Company’s common stock underlying the performance shares is subject to the achievement of revenue and gross margin levels during a two-year performance period. If the performance criteria are not met during that two-year period, then the performance shares will not vest and will automatically be returned to the plan. If the performance triggers are met, then the shares will be issued to the employees. For the years ended December 31, 2007 and 2008, the performance criteria were not met, and 62,500 shares were returned to the plan. |
|
|
|
|
|
In January 2008, the Compensation Committee granted 52,500 performance shares to key employees pursuant to the 1999 Stock Option Plan. The issuance of the shares of the Company’s common stock underlying the performance shares is subject to the achievement of revenue levels during a one-year performance period. If the performance criteria are not met during that one-year period, then the performance shares will not vest and will automatically be returned to the plan. If the performance triggers are met, then the shares will be issued to the employees. For the year ended December 31, 2008, the performance criteria were met for 39,375 shares, which were issued in 2009, and 13,125 shares were returned to the plan. For the year ended December 31, 2008, the Company recorded $292,000 of stock-based compensation expense in connection with the performance shares. |
|
|
|
|
|
In June 2009, the Compensation Committee granted 233,000 performance shares to key employees pursuant to the 2007 Equity Compensation Plan. The issuance of the shares of the Company’s common stock underlying the performance shares is subject to the achievement of stock price targets of the Company’s common stock at the end of a three-year measurement period ending in January 2012, with the ability to achieve prorated performance shares during interim annual measurement periods from January 31, 2009 to January 31, 2012. January of each year from 2009 to 2012 is used as the interim measurement date, since it is assumed that earnings announcements will take place in January with respect to the preceding year end. If the performance triggers are not met, the performance shares will not vest and will automatically be returned to the plan. If the performance triggers are met, then the shares will be issued to the employees. For the years ended December 31, 2009 and 2010, the Company recorded $15,000 and $30,000, respectively, of stock-based compensation expense in connection with the performance shares. As of December 31, 2010, there was $44,000 of total unrecognized compensation expense. That cost is expected to be recognized over a weighted-average period of 1.2 years. |
|
|
|
|
|
In February 2010 and October 2010, the Compensation Committee granted 44,000 and 50,000 performance shares to key employees pursuant to the 2007 Equity Compensation Plan. The issuance of the shares of the Company’s common stock underlying the performance shares is subject to the achievement of stock price targets of the Company’s common stock at the end of a three-year measurement period ending in October 2013, with the ability to achieve prorated performance shares during interim annual measurement periods from January 31, 2010 to January 31, 2013. January of each year from 2010 to 2013 is used as the interim measurement date, since it is assumed that earnings announcements will take place in January with respect to the preceding year end. If the performance triggers are not met, the performance shares will not vest and will automatically be returned to the plan. If the performance triggers are met, then the shares will be issued to the employees. For the year ended December 31, 2010, the Company recorded $5,000 of stock-based compensation expense in connection with the performance shares. As of December 31, 2010, there was $20,000 of total unrecognized compensation expense. That cost is expected to be recognized over a weighted-average period of 2.4 years. |
71
NOTE 13 — ACCOUNTS PAYABLE AND ACCRUED EXPENSES
Accounts payable and accrued expenses consists of the following:
|
|
|
|
|
|
|
|
|
|
|
|
December 31, |
|
December 31, |
|
||
|
|
|
|
|
|
|
||
|
Accounts payable |
|
$ |
1,824,000 |
|
$ |
6,816,000 |
|
|
Accrued warranty |
|
|
— |
|
|
2,069,000 |
|
|
Accrued contingent consideration |
|
|
110,000 |
|
|
— |
|
|
Other current liabilities |
|
|
160,000 |
|
|
256,000 |
|
|
|
|
|
|
|
|
|
|
|
|
|
|
|
|
|
|
|
|
|
|
$ |
2,094,000 |
|
$ |
9,141,000 |
|
|
|
|
|
|
|
|
|
|
The accrued contingent consideration that was recorded in 2009 in connection with the Didbox acquisition was reversed during the third quarter of 2010, as the Company does not expect Didbox to meet the revenue and operating profit targets required to be met in order for the contingent consideration to be payable.
The Company’s AI segment warrants its products against defects in materials and workmanship for a period of 12 months from the date of acceptance of the product by the customer. The customers may purchase an extended warranty providing coverage up to a maximum of 60 months. A provision for estimated future warranty costs is recorded for expected or historical warranty matters related to equipment shipped.
The following table summarizes warranty activity during the year ended December 31, 2010:
|
|
|
|
|
|
|
|
|
December 31, |
|
|
|
|
|
|
|
|
|
|
|
|
|
|
|
Accrued warranty reserve, January 7, 2010 (date of acquisition) |
|
$ |
2,657,000 |
|
|
Accrual for product warranties issued |
|
|
294,000 |
|
|
Product replacements and other warranty expenditures |
|
|
(736,000 |
) |
|
Expiration of warranties |
|
|
(146,000 |
) |
|
|
|
|
|
|
|
|
|
|
|
|
|
Accrued warranty reserve, end of period |
|
$ |
2,069,000 |
|
|
|
|
|
|
|
NOTE 14 – CONCENTRATION OF CUSTOMERS
One customer accounted for 26% of the Company’s revenue and 13% of the Company’s accounts receivable during the year ended and as of December 31, 2010.
Four customers accounted for 20%, 15%, 15% and 14%, respectively, of the Company’s revenue during the year ended December 31, 2009. Two of these customers accounted for 40% and 13% of the Company’s accounts receivable and unbilled receivables at December 31, 2009.
Two customers accounted for 42% and 41%, respectively, of the Company’s revenue during the year ended December 31, 2008. These two customers accounted for 28% and 48%, respectively, of the Company’s accounts receivable and unbilled receivables at December 31, 2008.
72
NOTE 15 - STOCKHOLDERS’ EQUITY
|
|
|
|
[A] |
Preferred stock: |
|
|
|
|
|
The Company is authorized to issue 5,000,000 shares of preferred stock, par value $0.01 per share. The Company’s Board of Directors has the authority to issue shares of preferred stock and to determine the price and terms of those shares. No shares of preferred stock are issued and outstanding. |
|
|
|
|
[B] |
Stock repurchase program: |
|
|
|
|
On November 3, 2010, the Company’s Board of Directors authorized the repurchase of issued and outstanding shares of the Company’s common stock having an aggregate value of up to $3,000,000 pursuant to a share repurchase program. The repurchases under the share repurchase program will be made from time to time in the open market or in privately negotiated transactions and will be funded from the Company’s working capital. The amount and timing of such repurchases will be dependent upon the price and availability of shares, general market conditions and the availability of cash, as determined at the discretion of the Company’s management. All shares of common stock repurchased under the Company’s share repurchase program are held as treasury stock. As of December 31, 2010, the Company has purchased approximately 36,000 shares of its common stock in open market transactions under the stock repurchase program for an aggregate purchase price of approximately $99,000, or an average cost of $2.71 per share. |
|
|
|
|
In addition, on May 3, 2007, the Company previously had announced that its Board of Directors had authorized the repurchase of issued and outstanding shares of our common stock having an aggregate value of up to $10,000,000 pursuant to a share repurchase program (the “2007 Repurchase Program“). The Company did not purchase any shares of its common stock under the 2007 Repurchase Program during the years ended December 31, 2009 or 2010. As of December 31, 2010, the Company had purchased approximately 1,075,000 shares of its common stock in open market transactions under the 2007 Repurchase Program for an aggregate purchase price of approximately $9,970,000, or an average cost of $9.27 per share. The repurchases were funded from the Company’s working capital, and the amount and timing of such repurchases depended upon the price and availability of shares, general market conditions and the availability of cash, as determined at the discretion of our management. The 2007 Repurchase Program does not have an expiration date, and the Company may discontinue or suspend the 2007 Repurchase Program at any time. All shares of common stock repurchased under the 2007 Repurchase Program are held as treasury stock. |
|
|
|
73
|
|
|
|
[C] |
Rights plan: |
|
|
|
|
|
In July 2009, the Company amended its Amended and Restated Certificate of Incorporation in order to create a new series of preferred stock, to be designated the “Series A Junior Participating Preferred Stock” (hereafter referred to as “Preferred Stock”). Shareholders of the Preferred Stock will be entitled to certain minimum quarterly dividend rights, voting rights, and liquidation preferences. Because of the nature of the Series A Preferred Stock’s dividend, liquidation and voting rights, the value of a share of Preferred Stock is expected to approximate the value of one share of the Company’s common stock. |
|
|
|
|
|
In July 2009, the Company also adopted a shareholder rights plan (the “Rights Plan”), which entitles the holders of the rights to purchase from the Company 1/1,000th (subject to prospective anti-dilution adjustments) of a share of Preferred Stock of the Company at a purchase price of $19.47 (a “Right”). The Rights Plan has a three-year term with the possibility of two separate three-year renewals. Until a Right is exercised or exchanged in accordance with the provisions of the rights agreement governing the Rights Plan, the holder thereof, as such, will have no rights as a stockholder of the Company, including, without limitation, the right to vote for the election of directors or upon any matter submitted to stockholders of the Company or to receive dividends or subscription rights. The Rights were registered with the Securities and Exchange Commission in July 2009. |
|
|
|
|
|
On June 29, 2009, the Board of Directors of the Company declared a dividend of one Right for each outstanding share of common stock. The dividend was paid on July 13, 2009 to the stockholders of record on that date. |
|
|
|
|
[D] |
Shares withheld: |
|
|
|
|
|
During the year ended December 31, 2008, 51,000 shares of the Company’s common stock were withheld to satisfy tax withholding obligations and to pay the exercise price of such awards in the aggregate amount of $424,000 in connection with the vesting of restricted shares and the exercise of stock options. |
|
|
|
|
|
During the year ended December 31, 2009, 20,000 shares of the Company’s common stock were withheld to satisfy tax withholding obligations and to pay the exercise price of such awards in the aggregate amount of $65,000 in connection with the vesting of restricted shares and the exercise of stock options. |
|
|
|
|
|
During the year ended December 31, 2010, 4,000 shares of the Company’s common stock were withheld to satisfy tax withholding obligations and to pay the exercise price of such awards in the aggregate amount of $10,000 in connection with the vesting of restricted shares and the exercise of stock options. |
|
|
|
|
NOTE 16 - INCOME TAXES |
|
|
|
|
|
|
At December 31, 2010, the Company had an aggregate net operating loss carryforward of approximately $44,170,000 for U.S. federal income tax purposes, of which $7,509,000 relates to stock options for which there were no compensation charges for financial reporting. Accordingly, any future tax benefit upon utilization of that net operating loss would be credited to additional paid-in capital. The Company has not included this amount in deferred tax assets. At December 31, 2010, the Company had an aggregate net operating loss carryforward of approximately $33,726,000 for state income tax purposes and a foreign net operating loss carryforward of approximately $437,000. Substantially all of the net operating loss carryforwards expire from 2021 through 2030 for federal purposes and from 2011 through 2017 for state purposes. The net operating loss carryforwards may be limited to use in any particular year based on Internal Revenue Code sections related to change of ownership restrictions. In addition, future stock issuances may subject the Company to annual limitations on the utilization of its net operating loss carryforwards under the same Internal Revenue Code provision. |
|
|
|
|
|
The Company has net deferred tax assets of approximately $13,459,000 and $17,782,000 at December 31, 2009 and 2010, respectively. The increase in the deferred tax asset is primarily attributable to net operating losses. The Company had other temporary differences between financial and tax reporting for stock-based compensation, fixed asset depreciation expense, deferred revenue, deferred expenses and acquisition-related expenses. |
|
|
|
|
|
The Company has elected to use the incremental approach for financial statement purposes. Under this approach, the Company will utilize net operating loss carryforwards before utilizing excess benefit from exercise of options during the current year. The Company has provided a valuation allowance against the full amount of its deferred tax asset, since the likelihood of realization cannot be determined. The valuation allowance increased in 2008, 2009 and 2010 by $535,000, $4,592,000 and $4,323,000, respectively. |
74
Loss before income taxes consists of the following:
|
|
|
|
|
|
|
|
|
|
|
|
|
|
|
Year Ended December 31, |
|
|||||||
|
|
|
|
|
|||||||
|
|
|
2008 |
|
2009 |
|
2010 |
|
|||
|
|
|
|
|
|
|
|
|
|||
|
|
|
|
|
|
|
|
|
|
|
|
|
U.S. operations |
|
$ |
(4,175,000 |
) |
$ |
(13,120,000 |
) |
$ |
(12,310,000 |
) |
|
Foreign operations |
|
|
— |
|
|
(72,000 |
) |
|
(301,000 |
) |
|
|
|
|
|
|
|
|
|
|
|
|
|
|
|
|
|
|
|
|
|
|
|
|
|
|
|
$ |
(4,175,000 |
) |
$ |
(13,192,000 |
) |
$ |
(12,611,000 |
) |
|
|
|
|
|
|
|
|
|
|
|
|
The difference between income taxes at the statutory federal income tax rate and income taxes reported in the statements of operations is attributable to the following:
|
|
|
|
|
|
|
|
|
|
|
|
|
|
|
Year Ended December 31, |
|
|||||||
|
|
|
|
|
|||||||
|
|
|
2008 |
|
2009 |
|
2010 |
|
|||
|
|
|
|
|
|
|
|
|
|||
|
|
|
|
|
|
|
|
|
|
|
|
|
Income tax benefit at the federal statutory rate |
|
$ |
(1,419,000 |
) |
$ |
(4,485,000 |
) |
$ |
(4,283,000 |
) |
|
State and local income taxes, net of effect on federal taxes |
|
|
(248,000 |
) |
|
(792,000 |
) |
|
(824,000 |
) |
|
Increase (decrease) in valuation allowance |
|
|
535,000 |
|
|
4,592,000 |
|
|
4,323,000 |
|
|
Fixed assets accumulated book/tax difference - prior year |
|
|
(196,000 |
) |
|
— |
|
|
|
|
|
ISO grants and restricted shares |
|
|
990,000 |
|
|
655,000 |
|
|
484,000 |
|
|
Expiration of state net operating loss |
|
|
254,000 |
|
|
129,000 |
|
|
141,000 |
|
|
Other |
|
|
84,000 |
|
|
(99,000 |
) |
|
159,000 |
|
|
|
|
|
|
|
|
|
|
|
|
|
|
|
|
|
|
|
|
|
|
|
|
|
|
|
|
$ |
— |
|
$ |
— |
|
$ |
— |
|
|
|
|
|
|
|
|
|
|
|
|
|
The tax effects of temporary differences that give rise to significant portions of the deferred tax assets and deferred tax liabilities at December 31, 2009 and 2010 are presented below:
|
|
|
|
|
|
|
|
|
|
|
|
December 31, |
|
||||
|
|
|
|
|
||||
|
|
|
2009 |
|
2010 |
|
||
|
|
|
|
|
|
|
||
|
|
|
|
|
|
|
|
|
|
Deferred tax assets: |
|
|
|
|
|
|
|
|
Net operating loss carryforwards |
|
$ |
11,745,000 |
|
$ |
14,122,000 |
|
|
Fixed assets, depreciation |
|
|
207,000 |
|
|
70,000 |
|
|
Stock-based compensation |
|
|
994,000 |
|
|
1,120,000 |
|
|
Acquisition related expenses |
|
|
513,000 |
|
|
513,000 |
|
|
Deferred revenue |
|
|
— |
|
|
2,035,000 |
|
|
Intangibles, amortization |
|
|
— |
|
|
240,000 |
|
|
Inventories |
|
|
— |
|
|
728,000 |
|
|
Other deductible temporary differences |
|
|
— |
|
|
143,000 |
|
|
|
|
|
|
|
|
|
|
|
|
|
|
|
|
|
|
|
|
Total gross deferred tax assets |
|
|
13,459,000 |
|
|
18,971,000 |
|
|
Less: Valuation allowance |
|
|
(13,459,000 |
) |
|
(17,782,000 |
) |
|
|
|
|
|
|
|
|
|
|
|
|
|
|
|
|
1,189,000 |
|
|
Deferred tax liabilities |
|
|
|
|
|
|
|
|
Deferred expenses |
|
|
— |
|
|
(1,189,000 |
) |
|
|
|
|
|
|
|
|
|
|
Net deferred tax assets |
|
$ |
— |
|
$ |
— |
|
|
|
|
|
|
|
|
|
|
75
NOTE 17 – WHOLLY OWNED FOREIGN SUBSIDIARIES
In May 2009, the Company formed an entity in Germany called I.D. Systems, GmbH (the “GmbH”). This foreign entity is wholly owned by I.D. Systems, Inc. The GmbH financial statements are consolidated with the financial statements of I.D. Systems, Inc.
The net revenue and net loss for the GmbH included in the consolidated statement of operations are as follows:
|
|
|
|
|
|
|
|
|
|
|
|
|
|
|
Year Ended December 31, |
|
|||||||
|
|
|
|
|
|||||||
|
|
|
2008 |
|
2009 |
|
2010 |
|
|||
|
|
|
|
|
|
|
|
|
|||
|
|
|
|
|
|
|
|
|
|
|
|
|
Net revenue |
|
$ |
— |
|
$ |
363,000 |
|
$ |
1,111,000 |
|
|
|
|
|
|
|
|
|
|
|
|
|
|
Net loss |
|
|
— |
|
|
(103,000 |
) |
|
(185,000 |
) |
Total assets of the GmbH were $555,000 and $1,051,000 as of December 31, 2009 and 2010, respectively. The GmbH operates in a local currency environment using the Euro as its functional currency.
Existing European sales orders/contracts prior to the formation of the GmbH and related accounting activity will remain in I.D. Systems, Inc. until settled or completed. Existing European employees and contractors and their related agreements were transferred to the GmbH in August 2009.
In October 2009, the Company acquired Didbox Ltd. (“Didbox”). This foreign entity is wholly owned by I.D. Systems, Inc. and is headquartered in the United Kingdom. The Didbox financial statements are consolidated with the financial statements of I.D. Systems, Inc. as of the effective date of acquisition.
The net revenue and net loss for Didbox included in the consolidated statement of operations are as follows:
|
|
|
|
|
|
|
|
|
|
|
|
|
|
|
Year Ended December 31, |
|
|||||||
|
|
|
|
|
|||||||
|
|
|
2008 |
|
2009 |
|
2010 |
|
|||
|
|
|
|
|
|
|
|
|
|||
|
|
|
|
|
|
|
|
|
|
|
|
|
Net revenue |
|
$ |
— |
|
$ |
142,000 |
|
$ |
395,000 |
|
|
|
|
|
|
|
|
|
|
|
|
|
|
Net loss |
|
|
— |
|
|
31,000 |
|
|
(116,000 |
) |
Didbox’s total assets were $782,000 and $719,000 as of December 31, 2009 and 2010, respectively. Didbox operates in a local currency environment using the British Pound as its functional currency.
Income and expense accounts of foreign operations are translated at actual or weighted-average exchange rates during the period. Assets and liabilities of foreign operations that operate in a local currency environment are translated to U.S. dollars at the exchange rates in effect at the balance sheet date, with the related translation gains or losses reported as components of accumulated other comprehensive income/loss in consolidated stockholders’ equity. Net exchange gains or losses resulting from the translation of foreign financial statements and the effect of exchange rate changes on intercompany transactions of a long-term investment nature with GmbH resulted in a translation gain (loss) of $1,000 and $(23,000) at December 31, 2009 and 2010, respectively, which is included in comprehensive loss in the consolidated statement of changes in stockholders’ equity.
Gains and losses resulting from foreign currency transactions are included in determining net income or loss. Foreign currency transaction gains (losses) for the years ended December 31, 2009 and 2010 of $9,000 and ($20,000) are included in selling, general and administrative expenses in the consolidated statement of operations.
76
NOTE 18 - COMPREHENSIVE LOSS
Comprehensive loss includes net loss and unrealized gains or losses on available-for-sale investments and foreign currency translation gains and losses. Cumulative unrealized gains and losses on available-for-sale investments are reflected as accumulated other comprehensive loss in stockholders’ equity on the Company’s consolidated balance sheet. The components of our comprehensive income are as follows:
|
|
|
|
|
|
|
|
|
|
|
|
|
|
|
Year Ended December 31, |
|
|||||||
|
|
|
|
|
|||||||
|
|
|
2008 |
|
2009 |
|
2010 |
|
|||
|
|
|
|
|
|
|
|
|
|||
|
Net loss |
|
$ |
(4,175,000 |
) |
$ |
(13,192,000 |
) |
$ |
(12,611,000 |
) |
|
Unrealized gain (loss) on available-for-sale marketable securities |
|
|
35,000 |
|
|
(107,000 |
) |
|
46,000 |
|
|
Foreign currency translation |
|
|
— |
|
|
1,000 |
|
|
(23,000 |
) |
|
|
|
|
|
|
|
|
|
|
|
|
|
|
|
|
|
|
|
|
|
|
|
|
|
Total other comprehensive loss |
|
$ |
(4,140,000 |
) |
$ |
(13,298,000 |
) |
|
(12,588,000 |
) |
|
|
|
|
|
|
|
|
|
|
|
|
The accumulated balances for each classification of other comprehensive loss are as follows:
|
|
|
|
|
|
|
|
|
|
|
|
|
|
|
Foreign |
|
Unrealized |
|
Accumulated |
|
|||
|
|
|
|
|
|
|
|
|
|||
|
Balance at January 1, 2008 |
|
$ |
— |
|
$ |
11,000 |
|
$ |
11,000 |
|
|
Net current period change |
|
|
|
|
|
35,000 |
|
|
35,000 |
|
|
Reclassification adjustments for gains (losses) reclassified into income |
|
|
— |
|
|
— |
|
|
— |
|
|
|
|
|
|
|
|
|
|
|
|
|
|
|
|
|
|
|
|
|
|
|
|
|
|
Balance at December 31, 2008 |
|
$ |
— |
|
$ |
46,000 |
|
$ |
46,000 |
|
|
|
|
|
|
|
|
|
|
|
|
|
|
|
|
|
|
|
|
|
|
|
|
|
|
Net current period change |
|
|
1,000 |
|
|
(107,000 |
) |
|
(106,000 |
) |
|
Reclassification adjustments for gains (losses) reclassified into income |
|
|
— |
|
|
— |
|
|
— |
|
|
|
|
|
|
|
|
|
|
|
|
|
|
|
|
|
|
|
|
|
|
|
|
|
|
Balance at December 31, 2009 |
|
$ |
1,000 |
|
$ |
(61,000 |
) |
$ |
(60,000 |
) |
|
|
|
|
|
|
|
|
|
|
|
|
|
|
|
|
|
|
|
|
|
|
|
|
|
Net current period change |
|
|
(23,000 |
) |
|
46,000 |
|
|
23,000 |
|
|
Reclassification adjustments for gains (losses) reclassified into income |
|
|
— |
|
|
— |
|
|
— |
|
|
|
|
|
|
|
|
|
|
|
|
|
|
|
|
|
|
|
|
|
|
|
|
|
|
Balance at December 31, 2010 |
|
$ |
(22,000 |
) |
$ |
(15,000 |
) |
$ |
(37,000 |
) |
|
|
|
|
|
|
|
|
|
|
|
|
NOTE 19 - OPERATING SEGMENTS
Prior to the Asset Intelligence (“AI”) acquisition in January 2010, the Company operated in a single reportable segment, consisting of the historical operations of I.D. Systems, Inc. (“IDS”). Subsequent thereto, the Company has determined that it has two reportable segments organized by product line: IDS and AI. The IDS operating segment includes the Company’s core wireless asset management systems operations: I.D. Systems, Inc., I.D. Systems, GmbH, and Didbox Ltd. This core business develops, markets and sells wireless solutions for managing and securing high-value enterprise assets such as industrial trucks. The AI operating segment, which consists of Asset Intelligence, LLC, provides data-driven telematics solutions for tracking and managing supply chain assets such as trailers and containers.
The Company does not allocate indirect expenses, such as compensation to executives and corporate personnel, professional fees, finance, stock-based compensation expense, and certain other operating costs, to the individual segments. These costs are included in the IDS operating segment. The total assets of each segment are comprised of the assets of the subsidiaries operating in that segment.
A summary of segment information as of and for the years ended December 31, 2008, 2009 and 2010 is presented below:
|
|
|
|
|
|
|
|
|
|
|
|
|
|
|
|
|
|
|
|
|
|
|
|
|
|
|
|
|
|
|
|
|
December 31, 2008 |
|
December 31, 2009 |
|
December 31, 2010 |
|
|||||||||||||||||||||
|
|
|
IDS |
|
AI |
|
Total |
|
IDS |
|
AI |
|
Total |
|
IDS |
|
AI |
|
Total |
|
|||||||||
|
|
|
|
|
|
|
|
|
|
|
|
|
|
|
|
|
|
|
|
|
|||||||||
|
Revenues |
|
$ |
27,046,000 |
|
$ |
— |
|
$ |
27,046,000 |
|
$ |
10,316,000 |
|
$ |
— |
|
$ |
10,316,000 |
|
$ |
10,706,000 |
|
$ |
15,155,000 |
|
$ |
25,861,000 |
|
|
Depreciation and amortization |
|
|
540,000 |
|
|
— |
|
|
540,000 |
|
|
533,000 |
|
|
— |
|
|
533,000 |
|
|
494,000 |
|
|
1,941,000 |
|
|
2,435,000 |
|
|
Operating loss |
|
|
(6,063,000 |
) |
|
— |
|
|
(6,063,000 |
) |
|
(14,385,000 |
) |
|
— |
|
|
(14,385,000 |
) |
|
(10,057,000 |
) |
|
(3,277,000 |
) |
|
(13,334,000 |
) |
|
Capital expenditures |
|
|
188,000 |
|
|
— |
|
|
188,000 |
|
|
518,000 |
|
|
— |
|
|
518,000 |
|
|
447,000 |
|
|
1,012,000 |
|
|
1,459,000 |
|
|
Total assets |
|
$ |
69,948,000 |
|
$ |
— |
|
$ |
69,948,000 |
|
$ |
70,575,000 |
|
$ |
— |
|
$ |
70,575,000 |
|
$ |
35,735,000 |
|
$ |
25,150,000 |
|
$ |
60,885,000 |
|
|
|
|
|
|
|
|
|
|
|
|
|
|
|
|
|
|
|
|
|
|
|
|
|
|
|
|
|
|
|
NOTE 20 — REDUCTION IN WORK FORCE
As a result of the integration of AI, the Company eliminated 39 positions during 2010, representing approximately 32% of our total personnel. In order to earn a severance payment, affected employees were required to complete their transition duties and execute a general release agreement. Total severance costs incurred during the year ended December 31, 2010 were $487,000, of which $100,000 is included in research and development expenses and $387,000 is included in selling, general and administrative expenses in the consolidated statement of operations. As of December 31, 2010, these costs have been paid.
77
NOTE 21 – COMMITMENTS AND CONTINGENCIES
Except for normal operating leases, the Company is not currently subject to any material commitments.
|
|
|
|
[A] |
Contingencies: |
|
|
|
|
|
The Company is not currently subject to any material commitments and legal proceedings, nor, to management’s knowledge, is any material legal proceeding threatened against the Company. |
|
|
|
|
[B] |
Severance agreements: |
|
|
|
|
|
The Company entered into severance agreements with five of its executive officers. The severance agreements, each of which is substantially identical in form, provide each executive with certain severance and change in control benefits upon the occurrence of a “Trigger Event,” as defined in the severance agreements. As a condition to the Company’s obligations under the severance agreements, each executive has executed and delivered to the Company a restrictive covenants agreement. |
|
|
|
|
|
Under the terms of the severance agreements, each executive is entitled to the following: (i) a cash payment at the rate of the executive’s annual base salary as in effect immediately prior to the Trigger Event for a period of 12 or 18 months, depending on the executive, (ii) continued healthcare coverage during the severance period, (iii) partial accelerated vesting of the executive’s previously granted stock options and restricted stock awards, and (iv) an award of “Performance Shares” under the Restricted Stock Unit Award Agreement previously entered into between the Company and the executive. |
|
|
|
|
[C] |
Operating leases: |
|
|
|
|
|
The Company is obligated under operating leases for its facilities and offices. The Company’s operating leases provide for minimum annual rental payments as follows: |
|
|
|
|
|
|
Year Ending |
|
|
|
|
|
|
|
|
|
|
|
|
|
|
2011 |
|
$ |
634,000 |
|
2012 |
|
|
429,000 |
|
2013 |
|
|
439,000 |
|
2014 |
|
|
447,000 |
|
2015 |
|
|
466,000 |
|
Thereafter |
|
|
2,531,000 |
|
|
|
|
|
|
|
|
|
|
|
|
|
$ |
4,946,000 |
|
|
|
|
|
The office lease for the Company’s executive offices in Woodcliff Lake, New Jersey, which expires in February 2021, also provides for escalations relating to increases in real estate taxes and certain operating expenses. In addition, the Company leases sales and administrative offices in Plano, Texas, Basingstoke, United Kingdom and Dusseldorf, Germany.
Minimum rent payments under operating leases are recognized on a straight-line basis over the term of the lease including any periods of free rent. Rental expense for operating leases was approximately $568,000, $596,000 and $596,000 for the years ended December 31, 2008, 2009 and 2010, respectively.
78
NOTE 22 - QUARTERLY SELECTED FINANCIAL DATA (UNAUDITED)
The following tables contain selected quarterly financial data for each quarter for the years ended December 31, 2009 and 2010. We believe the following information reflects all normal recurring adjustments necessary for a fair presentation of the information for the periods presented. The operating results for any period are not necessarily indicative of results for any future periods.
|
|
|
|
|
|
|
|
|
|
|
|
|
|
|
|
|
|
Year Ended December 31, 2010 |
|
||||||||||
|
|
|
|
|
||||||||||
|
|
|
1st Quarter |
|
2nd Quarter |
|
3rd Quarter |
|
4th Quarter |
|
||||
|
|
|
|
|
|
|
|
|
|
|
||||
|
Revenue: |
|
|
|
|
|
|
|
|
|
|
|
|
|
|
Products |
|
$ |
2,023,000 |
|
$ |
1,829,000 |
|
$ |
2,542,000 |
|
$ |
3,089,000 |
|
|
Services |
|
|
4,101,000 |
|
|
4,184,000 |
|
|
3,948,000 |
|
|
4,145,000 |
|
|
|
|
|
|
|
|
|
|
|
|
|
|
|
|
|
|
|
|
6,124,000 |
|
|
6,013,000 |
|
|
6,490,000 |
|
|
7,234,000 |
|
|
|
|
|
|
|
|
|
|
|
|
|
|
|
|
|
Cost of revenue: |
|
|
|
|
|
|
|
|
|
|
|
|
|
|
Cost of products |
|
|
975,000 |
|
|
865,000 |
|
|
1,507,000 |
|
|
1,730,000 |
|
|
Cost of services |
|
|
1,764,000 |
|
|
1,532,000 |
|
|
1,595,000 |
|
|
1,472,000 |
|
|
|
|
|
|
|
|
|
|
|
|
|
|
|
|
|
|
|
|
2,739,000 |
|
|
2,397,000 |
|
|
3,102,000 |
|
|
3,202,000 |
|
|
|
|
|
|
|
|
|
|
|
|
|
|
|
|
|
Gross Profit |
|
|
3,385,000 |
|
|
3,616,000 |
|
|
3,388,000 |
|
|
4,032,000 |
|
|
|
|
|
|
|
|
|
|
|
|
|
|
|
|
|
Selling, general and administrative expenses |
|
|
6,474,000 |
|
|
6,689,000 |
|
|
4,424,000 |
|
|
5,739,000 |
(a) |
|
Research and development expenses |
|
|
1,154,000 |
|
|
1,119,000 |
|
|
1,089,000 |
|
|
1,067,000 |
|
|
Other income, net |
|
|
180,000 |
|
|
166,000 |
|
|
267,000 |
|
|
110,000 |
|
|
|
|
|
|
|
|
|
|
|
|
|
|
|
|
|
|
|
|
|
|
|
|
|
|
|
|
|
|
|
|
Net loss |
|
$ |
(4,063,000 |
) |
$ |
(4,026,000 |
) |
$ |
(1,858,000 |
) |
$ |
(2,664,000 |
) |
|
|
|
|
|
|
|
|
|
|
|
|
|
|
|
|
|
|
|
|
|
|
|
|
|
|
|
|
|
|
|
Net loss per share – basic and diluted |
|
$ |
(0.36 |
) |
$ |
(0.36 |
) |
$ |
(0.17 |
) |
$ |
(0.24 |
) |
|
|
|
|
|
|
|
|
|
|
|
|
|
|
|
|
|
|
|
|
|
|
|
|
|
|
|
|
|
|
|
|
|
Year Ended December 31, 2009 |
|
||||||||||
|
|
|
|
|
||||||||||
|
|
|
1st Quarter |
|
2nd Quarter |
|
3rd Quarter |
|
4th Quarter |
|
||||
|
|
|
|
|
|
|
|
|
|
|
||||
|
Revenue: |
|
|
|
|
|
|
|
|
|
|
|
|
|
|
Products |
|
$ |
1,378,000 |
|
$ |
1,771,000 |
|
$ |
1,218,000 |
|
$ |
2,103,000 |
|
|
Services |
|
|
1,556,000 |
|
|
913,000 |
|
|
623,000 |
|
|
754,000 |
|
|
|
|
|
|
|
|
|
|
|
|
|
|
|
|
|
|
|
|
2,934,000 |
|
|
2,684,000 |
|
|
1,841,000 |
|
|
2,857,000 |
|
|
|
|
|
|
|
|
|
|
|
|
|
|
|
|
|
Cost of revenue: |
|
|
|
|
|
|
|
|
|
|
|
|
|
|
Cost of products |
|
|
798,000 |
|
|
890,000 |
|
|
603,000 |
|
|
1,591,000 |
|
|
Cost of services |
|
|
547,000 |
|
|
323,000 |
|
|
339,000 |
|
|
463,000 |
|
|
|
|
|
|
|
|
|
|
|
|
|
|
|
|
|
|
|
|
1,345,000 |
|
|
1,213,000 |
|
|
942,000 |
|
|
2,054,000 |
|
|
|
|
|
|
|
|
|
|
|
|
|
|
|
|
|
Gross profit |
|
|
1,589,000 |
|
|
1,471,000 |
|
|
899,000 |
|
|
803,000 |
|
|
|
|
|
|
|
|
|
|
|
|
|
|
|
|
|
Selling, general and administrative expenses |
|
|
4,211,000 |
|
|
3,764,000 |
|
|
3,644,000 |
|
|
4,924,000 |
|
|
Research and development expenses |
|
|
689,000 |
|
|
691,000 |
|
|
642,000 |
|
|
582,000 |
|
|
Other income, net |
|
|
239,000 |
|
|
660,000 |
|
|
350,000 |
|
|
(56,000 |
) |
|
|
|
|
|
|
|
|
|
|
|
|
|
|
|
|
|
|
|
|
|
|
|
|
|
|
|
|
|
|
|
Net loss |
|
$ |
(3,072,000 |
) |
$ |
(2,324,000 |
) |
$ |
(3,037,000 |
) |
$ |
(4,759,000 |
) |
|
|
|
|
|
|
|
|
|
|
|
|
|
|
|
|
|
|
|
|
|
|
|
|
|
|
|
|
|
|
|
Net loss per share – basic and diluted |
|
$ |
(0.28 |
) |
$ |
(0.21 |
) |
$ |
(0.27 |
) |
$ |
(0.43 |
) |
|
|
|
|
|
|
|
|
|
|
|
|
|
|
|
|
|
|
|
(a) |
Includes $384,000 compensation charge for performance bonuses and additional amortization expense $493,000 due to a change in the Asset Intelligence purchase price allocation. |
79
|
|
|
|
Item 9. |
Changes In and Disagreements with Accountants on Accounting and Financial Disclosure |
None.
|
|
|
|
Item 9A. |
Evaluation of Disclosure Controls and Procedures
During the fourth quarter of our fiscal year ended December 31, 2010, our management, including the principal executive officer and principal financial officer, evaluated our disclosure controls and procedures (as defined in Rules 13a-15(e) and 15d-15(e) under the Exchange Act) related to the recording, processing, summarization, and reporting of information in our reports that we file with the SEC. These disclosure controls and procedures have been designed to ensure that material information relating to us is made known to our management, including these officers, by other of our employees, and that this information is recorded, processed, summarized, evaluated and reported, as applicable, within the time periods specified in the SEC’s rules and forms. Due to the inherent limitations of control systems, not all misstatements may be detected. These inherent limitations include the realities that judgments in decision-making can be faulty and that breakdowns can occur because of simple error or mistake. Additionally, controls can be circumvented by the individual acts of some persons, by collusion of two or more people, or by management override of the control. Our controls and procedures can only provide reasonable, not absolute, assurance that the above objectives have been met.
I.D. Systems, Inc. acquired Asset Intelligence, LLC, during January 2010. Management has excluded Asset Intelligence, LLC from its assessment of internal control over financial reporting as of December 31, 2010 due to the acquisition occurring during the first quarter of 2010. Total assets and total revenues of Asset Intelligence, LLC represent approximately 41% (approximately $25,150,000) and 59% (approximately $15,155,000), respectively, of the related consolidated financial statement amounts as of and for the year ended December 31, 2010.
Based on their evaluation of our disclosure controls and procedures (as defined in Rules 13a-15(e) and 15d-15(e) under the Exchange Act) as of December 31, 2010, our principal executive officer and principal financial officer have concluded that our disclosure controls and procedures (as defined in Rules 13a-15(e) and 15d-15(e) under the Exchange Act) are effective as of December 31, 2010 to reasonably ensure that the information required to be disclosed by us in the reports that we file or submit under the Exchange Act, is recorded, processed, summarized and reported within the time periods specified in the SEC’s rules and forms and that information required to be disclosed by us in the reports we file or submit under the Exchange Act is accumulated and communicated to our management, including our principal executive and principal financial officers, or persons performing similar functions, as appropriate to allow timely decisions regarding required disclosure.
Management’s Report on Internal Control Over Financial Reporting
Our management is responsible for establishing and maintaining adequate internal control over financial reporting, as such term is defined in Exchange Act Rules 13a-15(f) and 15d-15(f). Under the supervision and with the participation of our management, including our principal executive officer and principal financial officer, we conducted an evaluation of the effectiveness of our internal control over financial reporting based on the framework in Internal Control – Integrated Framework issued by the Committee of Sponsoring Organizations of the Treadway Commission. Based on our evaluation under this framework, our management concluded that our internal control over financial reporting was effective as of December 31, 2010.
|
|
|
|
Item 9B. |
None.
80
Item 10. Directors, Executive Officers and Corporate Governance
The Company incorporates by reference herein information to be set forth in its definitive proxy statement for its 2011 annual meeting of stockholders that is responsive to the information required with respect to this Item 10; provided, however, that such information shall not be incorporated herein:
|
|
|
|
|
|
• |
if the information that is responsive to the information required with respect to this Item 10 is provided by means of an amendment to this Annual Report on Form 10-K filed with the SEC prior to the filing of such definitive proxy statement; or |
|
|
|
|
|
|
• |
if such proxy statement is not mailed to stockholders and filed with the SEC within 120 days after the end of the Company’s most recently completed fiscal year, in which case the Company will provide such information by means of an amendment to this Annual Report on Form 10-K filed with the SEC within such 120-day period. |
Item 11. Executive Compensation
The Company incorporates by reference herein information to be set forth in its definitive proxy statement for its 2011 annual meeting of stockholders that is responsive to the information required with respect to this Item 11; provided, however, that such information shall not be incorporated herein:
|
|
|
|
|
|
• |
if the information that is responsive to the information required with respect to this Item 11 is provided by means of an amendment to this Annual Report on Form 10-K filed with the SEC prior to the filing of such definitive proxy statement; or |
|
|
|
|
|
|
• |
if such proxy statement is not mailed to stockholders and filed with the SEC within 120 days after the end of the Company’s most recently completed fiscal year, in which case the Company will provide such information by means of an amendment to this Annual Report on Form 10-K filed with the SEC. |
Item 12. Security Ownership of Certain Beneficial Owners and Management and Related Stockholder Matters
The Company incorporates by reference herein information to be set forth in its definitive proxy statement for its 2011 annual meeting of stockholders that is responsive to the information required with respect to this Item 12; provided, however, that such information shall not be incorporated herein:
|
|
|
|
|
|
• |
if the information that is responsive to the information required with respect to this Item 12 is provided by means of an amendment to this Annual Report on Form 10-K filed with the SEC prior to the filing of such definitive proxy statement; or |
|
|
|
|
|
|
• |
if such proxy statement is not mailed to stockholders and filed with the SEC within 120 days after the end of the Company’s most recently completed fiscal year, in which case the Company will provide such information by means of an amendment to this Annual Report on Form 10-K filed with the SEC within such 120-day period. |
81
Item 13. Certain Relationships and Related Transactions, and Director Independence
The Company incorporates by reference herein information to be set forth in its definitive proxy statement for its 2011annual meeting of stockholders that is responsive to the information required with respect to this Item 13; provided, however, that such information shall not be incorporated herein:
|
|
|
|
|
|
• |
if the information that is responsive to the information required with respect to this Item 13 is provided by means of an amendment to this Annual Report on Form 10-K filed with the SEC prior to the filing of such definitive proxy statement; or |
|
|
|
|
|
|
• |
if such proxy statement is not mailed to stockholders and filed with the SEC within 120 days after the end of the Company’s most recently completed fiscal year, in which case the Company will provide such information by means of an amendment to this Annual Report on Form 10-K filed with the SEC within such 120-day period. |
Item 14. Principal Accounting Fees and Services
The Company incorporates by reference herein information to be set forth in its definitive proxy statement for its 2011 annual meeting of stockholders that is responsive to the information required with respect to this Item 14; provided, however, that such information shall not be incorporated herein:
|
|
|
|
|
|
• |
if the information that is responsive to the information required with respect to this Item 14 is provided by means of an amendment to this Annual Report on Form 10-K filed with the SEC prior to the filing of such definitive proxy statement; or |
|
|
|
|
|
|
• |
if such proxy statement is not mailed to stockholders and filed with the SEC within 120 days after the end of the Company’s most recently completed fiscal year, in which case the Company will provide such information by means of an amendment to this Annual Report on Form 10-K filed with the SEC within such 120-day period. |
82
Item 15. Exhibits, Financial Statement Schedules
(a) List of Financial Statements, Financial Statement Schedules, and Exhibits.
|
|
|
|
|
|
(1) |
Financial Statements. The following financial statements of I.D. Systems, Inc. are included in Item 8 of Part II of this |
|
|
Annual Report on Form 10-K: |
|
|
|
|
|
|
|
|
Report of Independent Registered Public Accounting Firm |
|
|
|
|
|
|
|
Consolidated Balance Sheets as of December 31, 2009 and 2010 |
|
|
|
|
|
|
|
Consolidated Statements of Operations for the Years Ended December 31, 2008, 2009 and 2010 |
|
|
|
|
|
|
|
Consolidated Statements of Changes in Stockholders’ Equity for the Years Ended December 31, 2008, 2009 and 2010 |
|
|
|
|
|
|
|
Consolidated Statements of Cash Flows for the Years Ended December 31, 2008, 2009 and 2010 |
|
|
|
|
|
|
|
Notes to the Consolidated Financial Statements |
|
|
|
|
|
|
(2) |
Financial Statement Schedules. |
|
|
|
|
|
|
|
Schedule II - Valuation and Qualifying Accounts |
|
|
|
|
|
|
All other financial statement schedules are omitted from this Annual Report on Form 10-K, as they are not required or applicable or the required information is included in the financial statements or notes thereto. |
|
|
|
|
|
|
|
(3) |
Exhibits. The following exhibits are filed with this Annual Report on Form 10-K or are incorporated herein by reference, as |
|
|
indicated. |
|
|
|
|
|
|
|
|
|
|
2.1 |
|
Membership Interest Purchase Agreement, dated as of January 7, 2010, by and among I.D. Systems, Inc., General Electric Capital Corporation and GE Asset Intelligence, LLC (incorporated by reference to Exhibit 2.1 to the Current Report on Form 8-K of I.D. Systems, Inc. (File No. 001-15087) filed with the SEC on January 13, 2010). |
|
|
|
|
|
|
|
|
|
3.1.1 |
|
Restated Certificate of Incorporation of I.D. Systems, Inc., as amended (incorporated by reference to Exhibit 3.1 to Amendment No. 3 to the Registration Statement on Form SB-2 of I.D. Systems, Inc. (File No. 333-76947) filed with the SEC on June 28, 1999). |
|
|
|
|
|
|
|
|
|
3.1.2 |
|
Certificate of Designation for the Series A Junior Participating Preferred Stock (incorporated by reference to Exhibit 3.3 to the Current Report on Form 8-K of I.D. Systems, Inc. (File No. 001-15087) filed with the SEC on July 8, 2009). |
|
|
|
|
|
|
|
|
|
3.2 |
|
Restated By-Laws of I.D. Systems, Inc. (incorporated by reference to Exhibit 3.2 to Amendment No. 3 to the Registration Statement on Form SB-2 of I.D. Systems, Inc. (File No. 333-76947) filed with the SEC on June 28, 1999). |
|
|
|
|
|
|
|
|
|
4.1 |
|
Specimen Certificate of I.D. Systems, Inc.’s Common Stock (incorporated by reference to Exhibit 4.1 to Amendment No. 3 to the Registration Statement on Form SB-2 of I.D. Systems, Inc. (File No. 333-76947) filed with the SEC on June 28, 1999). |
|
|
|
|
|
|
|
|
|
4.2 |
|
Rights Agreement, dated as of July 1, 2009, between I.D. Systems, Inc. and American Stock Transfer & Trust Company, LLC, as Rights Agent (incorporated by reference to Exhibit 4.2 to the Current Report on Form 8-K of I.D. Systems, Inc. (File No. 001-15087) filed with the SEC on July 8, 2009). |
|
|
|
|
|
|
|
|
|
10.1 |
|
1995 Non-Qualified Stock Option Plan (incorporated by reference to Exhibit 10.5 to the Registration Statement on Form SB-2 of I.D. Systems, Inc. (File No. 333-76947) filed with the SEC on April 23, 1999).* |
|
|
|
|
|
|
|
|
|
10.2 |
|
1999 Stock Option Plan (incorporated by reference to Exhibit 10.6 to the Registration Statement on Form SB-2 of I.D. Systems, Inc. (File No. 333-76947) filed with the SEC on April 23, 1999).* |
83
|
|
|
|
|
|
|
10.3 |
|
1999 Director Option Plan (incorporated by reference to Exhibit 10.10 to Amendment No. 2 to the Registration Statement on Form SB-2 of I.D. Systems, Inc. (File No. 333-76947) filed with the SEC on June 8, 1999).* |
|
|
|
|
|
|
|
10.4 |
|
2007 Equity Compensation Plan (incorporated by reference to Exhibit 4.4 to Amendment No. 2 to the Registration Statement on Form S-8 of I.D. Systems, Inc. (File No. 333-144709) filed with the SEC on July 19, 2007).* |
|
|
|
|
|
|
|
10.5 |
|
2009 Non-Employee Director Equity Compensation Plan (incorporated by reference to Exhibit 10.5 to the Quarterly Report on Form 10-Q of I.D. Systems, Inc. (File No. 001-15087) filed with the SEC on November 6, 2009).* |
|
|
|
|
|
|
|
10.6 |
|
Office Lease, dated November 4, 1999, between I.D. Systems, Inc. and Venture Hackensack Holding, Inc. (incorporated by reference to Exhibit 10.9 to the Annual Report on Form 10-KSB of I.D. Systems, Inc. for the fiscal year ended December 31, 1999 filed with the SEC on March 29, 2000). |
|
|
|
|
|
|
|
10.7 |
|
Severance Agreement, dated September 11, 2009, by and between I.D. Systems, Inc. and Jeffrey Jagid (incorporated by reference to Exhibit 10.1 to the Quarterly Report on Form 10-Q of I.D. Systems, Inc. for the fiscal quarter ended September 30, 2009 (File No. 001-15087) filed with the SEC on November 6, 2009).* |
|
|
|
|
|
|
|
10.8 |
|
Severance Agreement, dated September 11, 2009, by and between the Company and Ned Mavrommatis (incorporated by reference to Exhibit 10.2 to the Quarterly Report on Form 10-Q of I.D. Systems, Inc. for the fiscal quarter ended September 30, 2009 (File No. 001-15087) filed with the SEC on November 6, 2009).* |
|
|
|
|
|
|
|
10.9 |
|
Severance Agreement, dated September 11, 2009, by and between the Company and Kenneth Ehrman (incorporated by reference to Exhibit 10.3 to the Quarterly Report on Form 10-Q of I.D. Systems, Inc. for the fiscal quarter ended September 30, 2009 (File No. 001-15087) filed with the SEC on November 6, 2009).* |
|
|
|
|
|
|
|
10.10 |
|
Severance Agreement, dated September 11, 2009, by and between the Company and Michael Ehrman (incorporated by reference to Exhibit 10.4 to the Quarterly Report on Form 10-Q of I.D. Systems, Inc. for the fiscal quarter ended September 30, 2009 (File No. 001-15087) filed with the SEC on November 6, 2009).* |
|
|
|
|
|
|
|
10.11 |
|
Office Lease Agreement, dated as of May 10, 2010, by and between IPC New York Properties, LLC, as Landlord, and I.D. Systems, Inc., as Tenant (incorporated by reference to Exhibit 10.1 to the Quarterly Report on Form 10-Q of I.D. Systems, Inc. (File No. 001-15087) filed with the SEC on May 17, 2010). |
|
|
|
|
|
|
|
10.12 |
|
Severance Agreement, dated December 14, 2010, by and between the Company and Darryl Miller (filed herewith).* |
|
|
|
|
|
|
|
21.1 |
|
List of Subsidiaries (filed herewith). |
|
|
|
|
|
|
|
23.1 |
|
Consent of EisnerAmper LLP (filed herewith). |
|
|
|
|
|
|
|
31.1 |
|
Certification of Chief Executive Officer Pursuant to Section 302 of the Sarbanes-Oxley Act of 2002 (filed herewith). |
|
|
|
|
|
|
|
31.2 |
|
Certification of Chief Financial Officer Pursuant to Section 302 of the Sarbanes-Oxley Act of 2002 (filed herewith). |
|
|
|
|
|
|
|
32.1 |
|
Certification of Chief Executive Officer Pursuant to 18 U.S.C. Section 1350, as Adopted Pursuant to Section 906 of the Sarbanes-Oxley Act of 2002 (filed herewith). |
|
|
|
|
|
|
|
32.2 |
|
Certification of Chief Financial Officer Pursuant to 18 U.S.C. Section 1350, as Adopted Pursuant to Section 906 of the Sarbanes-Oxley Act of 2002 (filed herewith). |
* Management contract or compensatory plan or arrangement.
(b) Exhibits. The exhibits required by Item 601 of Regulation S-K are filed herewith or incorporated herein by reference. Please see the Index to Exhibits to this Annual Report on Form 10-K, which is incorporated into this Item 15(b) by reference.
84
SIGNATURES
Pursuant to the requirements of Section 13 or 15(d) of the Securities Exchange Act of 1934, as amended, the registrant has duly caused this report to be signed on its behalf by the undersigned, thereunto duly authorized.
Date: March 30, 2011
|
|
|
|
|
|
I.D. SYSTEMS, INC. |
|
|
|
|
|
|
|
By: |
/s/ Jeffrey M. Jagid |
|
|
|
|
|
|
|
Jeffrey M. Jagid |
|
|
|
Chief Executive Officer |
|
|
|
(Principal Executive Officer) |
|
|
|
|
|
|
By: |
/s/ Ned Mavrommatis |
|
|
|
|
|
|
|
Ned Mavrommatis |
|
|
|
Chief Financial Officer |
|
|
|
(Principal Financial and Accounting Officer) |
Pursuant to the requirements of the Securities Exchange Act of 1934, this report is signed below by the following persons on behalf of the registrant and in the capacities and on the dates indicated.
|
|
|
|
|
|
|
Signature |
|
Title |
|
Date |
|
|
|
|
|
|
|
/s/ Jeffrey M. Jagid |
|
Chief Executive Officer and Director |
|
March 30, 2011 |
|
|
|
(Principal Executive Officer) |
|
|
|
Jeffrey M. Jagid |
|
|
|
|
|
|
|
|
|
|
|
/s/ Kenneth S. Ehrman |
|
President and Director |
|
March 30, 2011 |
|
|
|
|
|
|
|
Kenneth S. Ehrman |
|
|
|
|
|
|
|
|
|
|
|
/s/ Ned Mavrommatis |
|
Chief Financial Officer |
|
March 30, 2011 |
|
|
|
(Principal Financial and Accounting Officer) |
|
|
|
Ned Mavrommatis |
|
|
|
|
|
|
|
|
|
|
|
/s/ Lawrence S. Burstein |
|
Director |
|
March 30, 2011 |
|
|
|
|
|
|
|
Lawrence Burstein |
|
|
|
|
|
|
|
|
|
|
|
/s/ Harold D. Copperman |
|
Director |
|
March 30, 2011 |
|
|
|
|
|
|
|
Harold D. Copperman |
|
|
|
|
|
|
|
|
|
|
|
/s/ Michael P. Monaco |
|
Director |
|
March 30, 2011 |
|
|
|
|
|
|
|
Michael Monaco |
|
|
|
|
|
|
|
|
|
|
85
I.D. SYSTEMS, INC.
SCHEDULE II - VALUATION AND QUALIFYING ACCOUNTS
(In thousands)
|
|
|
|
|
|
|
|
|
|
|
|
|
|
|
|
Description |
|
Balance at |
|
Charged to |
|
Other Additions |
|
Balance at |
|
||||
|
|
|
|
|
|
|
|
|
|
|
||||
|
Inventory reserve |
|
|
|
|
|
|
|
|
|
|
|
|
|
|
|
|
|
|
|
|
|
|
|
|
|
|
|
|
|
Year ended December 31, 2010 |
|
$ |
930 |
|
$ |
(58 |
) |
|
— |
|
$ |
872 |
|
|
|
|
|
|
|
|
|
|
|
|
|
|
|
|
|
Year ended December 31, 2009 |
|
$ |
748 |
|
$ |
182 |
|
|
— |
|
$ |
930 |
|
|
|
|
|
|
|
|
|
|
|
|
|
|
|
|
|
Year ended December 31, 2008 |
|
$ |
642 |
|
$ |
126 |
|
|
— |
|
$ |
748 |
|
|
|
|
|
|
|
|
|
|
|
|
|
|
|
|
|
Description |
|
Balance at |
|
Charged to |
|
Other Additions |
|
Balance at |
|
||||
|
|
|
|
|
|
|
|
|
|
|
||||
|
Allowance for doubtful accounts |
|
|
|
|
|
|
|
|
|
|
|
|
|
|
|
|
|
|
|
|
|
|
|
|
|
|
|
|
|
Year ended December 31, 2010 |
|
$ |
106 |
|
$ |
65 |
|
|
(10 |
) |
$ |
161 |
|
|
|
|
|
|
|
|
|
|
|
|
|
|
|
|
|
Year ended December 31, 2009 |
|
$ |
239 |
|
$ |
(133 |
) |
|
— |
|
$ |
106 |
|
|
|
|
|
|
|
|
|
|
|
|
|
|
|
|
|
Year ended December 31, 2008 |
|
$ |
239 |
|
$ |
— |
|
|
— |
|
$ |
239 |
|
INDEX TO EXHIBITS
|
|
|
|
2.1 |
Membership Interest Purchase Agreement, dated as of January 7, 2010, by and among I.D. Systems, Inc., General Electric Capital Corporation and GE Asset Intelligence, LLC (incorporated by reference to Exhibit 2.1 to the Current Report on Form 8-K of I.D. Systems, Inc. (File No. 001-15087) filed with the SEC on January 13, 2010). |
|
|
|
|
3.1.1 |
Restated Certificate of Incorporation of I.D. Systems, Inc., as amended (incorporated by reference to Exhibit 3.1 to Amendment No. 3 to the Registration Statement on Form SB-2 of I.D. Systems, Inc. (File No. 333-76947) filed with the SEC on June 28, 1999). |
|
|
|
|
3.1.2 |
Certificate of Designation for the Series A Junior Participating Preferred Stock (incorporated by reference to Exhibit 3.3 to the Current Report on Form 8-K of I.D. Systems, Inc. (File No. 001-15087) filed with the SEC on July 8, 2009). |
|
|
|
|
3.2 |
Restated By-Laws of I.D. Systems, Inc. (incorporated by reference to Exhibit 3.2 to Amendment No. 3 to the Registration Statement on Form SB-2 of I.D. Systems, Inc. (File No. 333-76947) filed with the SEC on June 28, 1999). |
|
|
|
|
4.1 |
Specimen Certificate of I.D. Systems, Inc.’s Common Stock (incorporated by reference to Exhibit 4.1 to Amendment No. 3 to the Registration Statement on Form SB-2 of I.D. Systems, Inc. (File No. 333-76947) filed with the SEC on June 28, 1999). |
|
|
|
|
4.2 |
Rights Agreement, dated as of July 1, 2009, between I.D. Systems, Inc. and American Stock Transfer & Trust Company, LLC, as Rights Agent (incorporated by reference to Exhibit 4.2 to the Current Report on Form 8-K of I.D. Systems, Inc. (File No. 001-15087) filed with the SEC on July 8, 2009). |
|
|
|
|
10.1 |
1995 Non-Qualified Stock Option Plan (incorporated by reference to Exhibit 10.5 to the Registration Statement on Form SB-2 of I.D. Systems, Inc. (File No. 333-76947) filed with the SEC on April 23, 1999).* |
|
|
|
|
10.2 |
1999 Stock Option Plan (incorporated by reference to Exhibit 10.6 to the Registration Statement on Form SB-2 of I.D. Systems, Inc. (File No. 333-76947) filed with the SEC on April 23, 1999).* |
|
|
|
|
10.3 |
1999 Director Option Plan (incorporated by reference to Exhibit 10.10 to Amendment No. 2 to the Registration Statement on Form SB-2 of I.D. Systems, Inc. (File No. 333-76947) filed with the SEC on June 8, 1999).* |
|
|
|
|
10.4 |
2007 Equity Compensation Plan (incorporated by reference to Exhibit 4.4 to Amendment No. 2 to the Registration Statement on Form S-8 of I.D. Systems, Inc. (File No. 333-144709) filed with the SEC on July 19, 2007).* |
|
|
|
|
10.5 |
2009 Non-Employee Director Equity Compensation Plan (incorporated by reference to Exhibit 10.5 to the Quarterly Report on Form 10-Q of I.D. Systems, Inc. (File No. 001-15087) filed with the SEC on November 6, 2009).* |
|
|
|
|
10.6 |
Office Lease, dated November 4, 1999, between I.D. Systems, Inc. and Venture Hackensack Holding, Inc. (incorporated by reference to Exhibit 10.9 to the Annual Report on Form 10-KSB of I.D. Systems, Inc. for the fiscal year ended December 31, 1999 filed with the SEC on March 29, 2000). |
|
|
|
|
10.7 |
Severance Agreement, dated September 11, 2009, by and between I.D. Systems, Inc. and Jeffrey Jagid (incorporated by reference to Exhibit 10.1 to the Quarterly Report on Form 10-Q of I.D. Systems, Inc. for the fiscal quarter ended September 30, 2009 (File No. 001-15087) filed with the SEC on November 6, 2009).* |
|
|
|
|
10.8 |
Severance Agreement, dated September 11, 2009, by and between the Company and Ned Mavrommatis (incorporated by reference to Exhibit 10.2 to the Quarterly Report on Form 10-Q of I.D. Systems, Inc. for the fiscal quarter ended September 30, 2009 (File No. 001-15087) filed with the SEC on November 6, 2009).* |
|
|
|
|
10.9 |
Severance Agreement, dated September 11, 2009, by and between the Company and Kenneth Ehrman (incorporated by reference to Exhibit 10.3 to the Quarterly Report on Form 10-Q of I.D. Systems, Inc. for the fiscal quarter ended September 30, 2009 (File No. 001-15087) filed with the SEC on November 6, 2009).* |
|
|
|
|
10.10 |
Severance Agreement, dated September 11, 2009, by and between the Company and Michael Ehrman (incorporated by reference to Exhibit 10.4 to the Quarterly Report on Form 10-Q of I.D. Systems, Inc. for the fiscal quarter ended September 30, 2009 (File No. 001-15087) filed with the SEC on November 6, 2009).* |
|
|
|
|
10.11 |
Office Lease Agreement, dated as of May 10, 2010, by and between IPC New York Properties, LLC, as Landlord, and I.D. Systems, Inc., as Tenant (incorporated by reference to Exhibit 10.1 to the Quarterly Report on Form 10-Q of I.D. Systems, Inc. (File No. 001-15087) filed with the SEC on May 17, 2010). |
|
|
|
|
10.12 |
Severance Agreement, dated December 14, 2010, by and between the Company and Darryl Miller (filed herewith).* |
|
|
|
|
21.1 |
List of Subsidiaries (filed herewith). |
|
|
|
|
23.1 |
Consent of EisnerAmper LLP (filed herewith). |
|
|
|
|
31.1 |
Certification of Chief Executive Officer Pursuant to Section 302 of the Sarbanes-Oxley Act of 2002 (filed herewith). |
|
|
|
|
31.2 |
Certification of Chief Financial Officer Pursuant to Section 302 of the Sarbanes-Oxley Act of 2002 (filed herewith). |
|
|
|
|
32.1 |
Certification of Chief Executive Officer Pursuant to 18 U.S.C. Section 1350, as Adopted Pursuant to Section 906 of the Sarbanes-Oxley Act of 2002 (filed herewith). |
|
|
|
|
32.2 |
Certification of Chief Financial Officer Pursuant to 18 U.S.C. Section 1350, as Adopted Pursuant to Section 906 of the Sarbanes-Oxley Act of 2002 (filed herewith). |