Attached files
| file | filename |
|---|---|
| EX-23.2 - GLOBAL AXCESS CORP | v216430_ex23-2.htm |
| EX-32.2 - GLOBAL AXCESS CORP | v216430_ex32-2.htm |
| EX-31.2 - GLOBAL AXCESS CORP | v216430_ex31-2.htm |
| EX-32.1 - GLOBAL AXCESS CORP | v216430_ex32-1.htm |
| EX-23.1 - GLOBAL AXCESS CORP | v216430_ex23-1.htm |
| EX-31.1 - GLOBAL AXCESS CORP | v216430_ex31-1.htm |
| EX-10.21 - GLOBAL AXCESS CORP | v216430_ex10-21.htm |
UNITED STATES
SECURITIES AND EXCHANGE COMMISSION
Washington, D.C. 20549
FORM 10-K
(Mark One)
x ANNUAL REPORT PURSUANT TO SECTION 13 OR 15(d) OF THE SECURITIES EXCHANGE ACT OF 1934
For the fiscal year ended December 31, 2010
OR
¨ TRANSITION REPORT PURSUANT TO SECTION 13 OR 15(d) OF THE SECURITIES EXCHANGE ACT OF 1934
For the transition period from ___________ to ___________
|
000-17874
(Commission file number)
GLOBAL AXCESS CORP
(Exact name of registrant as specified in its charter)
|
|
NEVADA
|
88-0199674
|
|
(State or other jurisdiction of incorporation or organization)
|
(I.R.S. Employer Identification No.)
|
|
7800 BELFORT PARKWAY, Suite 165
|
|
|
JACKSONVILLE, FLORIDA
|
32256
|
|
(Address of principal executive offices)
|
(Zip Code)
|
(904) 280-3950
(Registrant's telephone number, including area code)
Securities registered pursuant to Section 12(b) of the Act: None
Securities registered pursuant to Section 12(g) of the Act: Common Stock, $0.001 par value
Indicate by check mark if the registrant is a well-known seasoned issuer, as defined in Rule 405 of the Securities Act. ¨ Yes x No
Indicate by check mark if the registrant is not required to file reports pursuant to Section 13 or Section 15(d) of the Act. ¨ Yes x No
Indicate by check mark whether the registrant (1) has filed all reports required to be filed by Section 13 or 15(d) of the Securities Exchange Act of 1934 during the preceding 12 months (or for such shorter period that the registrant was required to file such reports), and (2) has been subject to such filing requirements for the past 90 days. xYes ¨ No
Indicate by checkmark whether the registrant has submitted electronically and posted on its corporate website, if any, every Interactive Data File required to be submitted and posted pursuant to Rule 405 of Regulation S-T during the proceeding 12 months (or for such shorter period that the registrant was required to submit and post such files). ¨ Yes ¨ No
Indicate by check mark if disclosure of deliquent filers pursuant to Item 405 of Regulation S-K is not contained herein, and will not be contained, to the best of registrant’s knowledge, in definitive proxy or information statements incorporated by reference in Part III of this Form 10-K or any amendment to this Form 10-K. ¨
Indicate by check mark whether the registrant is a large accelerated filer, an accelerated filer, a non-accelerated filer or a smaller reporting company. See definitions of “large accelerated filer,” “accelerated filer,” and “smaller reporting company” in Rule 12b-2 of the Exchange Act.
|
Large accelerated Filer ¨
|
Accelerated Filer ¨
|
|
Non-accelerated Filer ¨ (Do not check if smaller reporting company)
|
Smaller reporting company x
|
Indicate by check mark whether the registrant is a shell company (as defined in Rule 12b-2 of Exchange Act). o Yes x No
As of June 30, 2010, the aggregate market value of the registrant’s common stock held by non-affiliates of the registrant was $17,586,833.
As of March 28, 2011, the registrant had 22,544,726 shares outstanding of the common stock ($0.001 par value).
TABLE OF CONTENTS
|
Page No.
|
||
|
PART I
|
4
|
|
|
Item 1.
|
Business
|
4
|
|
Item 1A.
|
Risk Factors
|
15
|
|
Item 1B.
|
Unresolved Staff Comments
|
25
|
|
Item 2.
|
Properties
|
26
|
|
Item 3.
|
Legal Proceedings
|
27
|
|
Item 4.
|
[Removed and Reserved]
|
27
|
|
PART II
|
27
|
|
|
Item 5.
|
Market for Registrant’s Common Equity, Related Stockholder Matters and Issuer Purchases of Equity Securities
|
27
|
|
Item 6.
|
Selected Financial Data
|
30
|
|
Item 7.
|
Management's Discussion and Analysis of Financial Condition and Results of Operations
|
31
|
|
Item 7A.
|
Quantitative and Qualitative Disclosures about Market Risk
|
42
|
|
Item 8.
|
Financial Statements and Supplementary Data
|
43
|
|
Item 9.
|
Changes in and Disagreements with Accountants on Accounting and Financial Disclosure
|
43
|
|
Item 9A.
|
Controls and Procedures
|
43
|
|
Item 9B.
|
Other Information
|
44
|
|
PART III
|
44
|
|
|
Item 10.
|
Directors, Executive Officers and Corporate Governance
|
44
|
|
Item 11.
|
Executive Compensation
|
49
|
|
Item 12.
|
Security Ownership of Certain Beneficial Owners and Management and Related Stockholder Matters
|
55
|
|
Item 13.
|
Certain Relationships and Related Transactions, and Director Independence
|
56
|
|
Item 14.
|
Principal Accounting Fees and Services
|
56
|
|
PART IV
|
58
|
|
|
Item 15.
|
Exhibits and Financial Statement Schedules
|
58
|
|
SIGNATURES
|
61
|
Page 2
Forward-Looking Statements
Unless the context indicates otherwise, all references in this document to “we,” “us” and “our” refer to Global Axcess Corp and its subsidiaries.
In addition to historical information, this Annual Report on Form 10-K contains forward-looking statements that involve risks and uncertainties that could cause actual results to differ materially. Factors that might cause or contribute to such differences include, but are not limited to, those discussed in the sections entitled "Management's Discussion and Analysis of Financial Condition and Results of Operations" and “Risk Factors.” You should carefully review the risks described in other documents we file from time to time with the Securities and Exchange Commission (the “SEC”), including the Quarterly Reports on Form 10-Q to be filed in 2011. When used in this report, the words "expects," "anticipates," "intends," "plans," "believes," "seeks," "targets," "estimates," and similar expressions are generally intended to identify forward-looking statements. You should not place undue reliance on the forward-looking statements, which speak only as of the date of this Annual Report on Form 10-K. We undertake no obligation to publicly release any revisions to the forward-looking statements or reflect events or circumstances after the date of this document. Estimates of future financial results are inherently unreliable.
From time to time, representatives of Global Axcess Corp (the “Company”) may make public predictions or forecasts regarding the Company's future results, including estimates regarding future revenues, expense levels, earnings or earnings from operations. Any forecast regarding the Company's future performance reflects various assumptions. These assumptions are subject to significant uncertainties, and, as a matter of course, many of them will prove to be incorrect. Further, the achievement of any forecast depends on numerous factors (including those described in this discussion), many of which are beyond the Company's control. As a result, there can be no assurance that the Company's performance will be consistent with any of management’s forecasts or that the variation from such forecasts will not be material and adverse. Investors are cautioned not to base their entire analysis of the Company's business and prospects upon isolated predictions, but instead are encouraged to utilize the entire available mix of historical and forward-looking information made available by the Company, and other information affecting the Company and its products, when evaluating the Company's prospective results of operations.
In addition, representatives of the Company may occasionally comment publicly on the perceived reasonableness of published reports by independent analysts regarding the Company's projected future performance. Such comments should not be interpreted as an endorsement or adoption of any given estimate or range of estimates or the assumptions and methodologies upon which such estimates are based. Undue reliance should not be placed on any comments regarding the conformity, or lack thereof, of any independent estimates with the Company's own present expectations regarding its future results of operations. The methodologies employed by the Company in arriving at its own internal projections and the approaches taken by independent analysts in making their estimates are likely different in many significant respects. Although the Company may presently perceive a given estimate to be reasonable, changes in the Company's business, market conditions or the general economic climate may have varying effects on the results obtained through the use of differing analyses and assumptions. The Company expressly disclaims any continuing responsibility to advise analysts or the public markets of its view regarding the current accuracy of the published estimates of outside analysts. Persons relying on such estimates should pursue their own independent investigation and analysis of their accuracy and the reasonableness of the assumptions on which they are based.
Page 3
PART I
|
ITEM 1.
|
BUSINESS
|
History
Headquartered in Jacksonville, Florida, Global Axcess Corp (referred to herein as the “Company,” “we,” “our” or “us”) is a Nevada corporation organized in 1984. Unless the context otherwise requires, all references to the Company include the Company’s subsidiary corporations.
Global Axcess Corp was reorganized in 2001 by principals with backgrounds in network-based electronic commerce and financial transaction processing, with a mission to emerge as the leading independent provider of self-service kiosk services in the United States. The Company’s objective is to expand through internal growth and through the offering of enhanced self-service kiosk products or services. The Company is evaluating the attractiveness of possible acquisitions, its current strategy is to grow via acquisitions and organic growth.
Overview
The Company operates one of the United States’ largest networks of self-service kiosks. Our core offerings are in automated teller machines (“ATM”s) ("ATM Services" segment) and our DVD business, where consumers can rent movies from self-service kiosks ("DVD Services" segment). These solutions include ATM and DVD kiosk management and support services focused on serving the self-service kiosk needs of merchants, grocers, retailers and financial institutions nationwide. It is a one-stop gateway for unattended self-service kiosk management services.
Additional Company Information
General information about us can be found at http://www.globalaxcess.biz. We file annual, quarterly, and other reports as well as other information with the SEC under the Securities Exchange Act of 1934, as amended (the “Exchange Act”). Our Annual Reports on Form 10-K, Quarterly Reports on Form 10-Q, Current Reports on Form 8-K, and amendments to those reports are available free of charge on our website as soon as reasonably practicable after the reports are filed or furnished electronically with the SEC. You may also request a copy of these filings at no cost by writing or telephoning us at the following address: Global Axcess Corp, Attention: Investor Relations, 7800 Belfort Parkway, Suite 165, Jacksonville, Florida 32256, (904) 280-3950. Information on our website is not incorporated into this Annual Report on Form 10-K or our other securities filings.
Nationwide Money Services, Inc.
Nationwide Money Services, Inc., a wholly owned subsidiary of the Company, is engaged in the business of operating a network of ATMs. The ATMs provide debit and credit cardholders with access to cash, account information and other services at locations and times convenient to the cardholder. Debit and credit cards are principally issued by banks and credit card companies. Our ATM network currently includes approximately 4,700 ATMs, principally in regional chains and individual merchant locations. Approximately 1,998 of the ATMs we operate are Company-owned (full placement), 2,566 are merchant-owned and 137 are under a service-only agreement. Our high-traffic retail locations and national footprint make us an attractive partner for regional and national financial institutions that are seeking to increase their market penetration. We provide proprietary ATM branding and processing services for approximately 45 financial institutions that have approximately 438 branded sites under contract with the Company nationwide. We provide network processing for an average of approximately 1.5 million ATM financial transactions per month.
To promote usage of ATMs in our network, we have relationships with national and regional card organizations (also referred to as networks) which enable the holder of a card issued by one network to use another network’s ATM to process a transaction. These relationships are provided through processing providers: Elan Financial Services (“Elan”), First Data Retail ATM Services (“First Data”), and Columbus Data Services (“Columbus Data”).
ATMs. We deploy and operate ATMs primarily under the following two programs:
|
|
·
|
Full placement program. Under a full placement arrangement, the Company owns or leases the ATM and is responsible for controlling substantially all aspects of its operation including maintenance, cash management and loading, supplies, signage and telecommunications services. The Company is generally responsible for almost all of the expenses related to the operation of the ATM with the exception of power and, on occasion, telecommunications. The Company typically uses this program for major national and regional merchants, as well as, for its Financial Institution Outsourcing service.
|
Page 4
|
|
·
|
Merchant-owned program. Under a merchant-owned arrangement, the merchant (or, for a merchant using lease financing, its lease finance provider) typically buys the ATM from the Company and the merchant is responsible for most of the operating expenses such as maintenance, cash management and loading, supplies and telecommunication services. The Company typically provides all transaction processing services, and the merchants use the Company’s maintenance services from time to time.
|
Most of our new ATMs feature advanced functionality, diagnostics and ease of use including color displays, personal computer-based operating systems, thermal printing, dial-up and remote monitoring capabilities, and upgrade and capacity-expansion capability. All machines can perform basic cash dispensing and balance inquiry transactions, transmit on-screen marketing, dispense coupons and conduct marketing surveys. Most of our equipment is modular in design, which allows us to be flexible and accommodating to the needs of our clients as technology advances.
ATM Relationships. We purchase our ATMs primarily from Hyosung (America), Inc and Triton Systems. We believe that the large quantity of ATMs we purchase from these manufacturers enables us to receive favorable pricing. In addition, we maintain close working relationships with these manufacturers in the course of our business, allowing us to stay informed regarding product updates and to minimize technical problems with purchased equipment.
Merchant Customers. We have contracts with national and regional merchants and with numerous independent store operators. The terms of our merchant contracts vary as a result of negotiations at the time of execution. In the case of our full placement programs, the contract terms for contracts currently in place typically include:
|
|
·
|
an initial term of at least five to seven years;
|
|
|
·
|
ATM exclusivity at locations where we install an ATM and, in many cases, a right of first refusal for all other locations;
|
|
|
·
|
a requirement that the merchant provide a highly visible space for the ATM and signage;
|
|
|
·
|
protection for us against underperforming locations by permitting us to increase the withdrawal fee or remove ATMs; and
|
|
|
·
|
provisions making the merchant’s fee variable depending on the number of ATM transactions and milestones.
|
New contracts under our merchant-owned or rental arrangements typically include seven year terms with other terms similar to our full placement contracts, as well as the following additional terms:
|
|
·
|
provisions imposing an obligation on the merchant to ensure the ATM is operational at all times its store is open to the public; and
|
|
|
·
|
provisions that require a merchant to use its best efforts to have any purchaser of the merchant’s store assume our contract.
|
Revenue Sources – ATM Services
Transaction Fees. Our revenue is recurring in nature and principally derived from two types of fees that we charge for processing transactions on our ATM network.
Interchange Fees. We receive an interchange fee from the issuer of the credit or debit card for processing a transaction when a cardholder uses an ATM in our network. In addition, in many cases, we receive a surcharge/convenience fee from the cardholder when the cardholder makes a cash withdrawal from an ATM in our network. See the “Overview” section in Item 7 “Management's Discussion and Analysis of Financial Condition and Results of Operations.”
Page 5
Surcharge/Convenience Fees. National debit and credit card organizations permit the imposition of surcharge/convenience fees on cash withdrawals from ATMs. Our business is substantially dependent upon our ability to impose surcharge/convenience fees. Any changes in laws or card association rules materially limiting our ability to impose surcharge/convenience fees would have a material adverse effect on our financial results. See "Government and Industry Regulation - Surcharge Regulation." Since April 1996, we have expanded the number of ATMs in our network and have expanded our practice of imposing surcharge/convenience fees on cash withdrawals from ATMs.
ATM Network Management Services. In addition to revenues derived from interchange and surcharge/convenience fees, we also derive revenues from providing ATM network management services to banks and other third-party owners of ATMs included in our ATM network. These services include 24-hour transaction processing, monitoring and notification of ATM status and cash condition, notification of ATM service interruptions, in some cases dispatch of field service personnel for necessary service calls, and cash settlement and reporting services. Banks may choose whether to limit transactions on their ATMs to cards issued by the bank or to permit acceptance of all cards accepted on our network. See the “Overview” section in Item 7 “Management's Discussion and Analysis of Financial Condition and Results of Operations.”
Seasonality – ATM Services
We have traditionally experienced higher transaction volumes per machine in the second and third quarters than in the first and fourth quarters. The increased volumes in the summer months coincide with increased vacation travel in the United States.
Recent Events – ATM Services
Revenue Trends - The interchange rates paid to independent ATM deployers, such as ourselves, are set by the various Electronic Financial Transfer (EFT) networks over which the underlying transactions are routed. Recently, certain networks have reduced the net interchange fees paid to ATM deployers for transactions routed through their networks. For example, effective April 1, 2010, a global network brand reduced the interchange rates it pays to domestic ATM deployers for ATM transactions routed across its debit network. As a result, we have recently seen certain financial institutions migrate their volume away from other networks to take advantage of the lower pricing offered by these networks. Such rate change is has reduced our ATM operating gross profits by approximately $30,000 - $35,000 a month beginning April 1, 2010. Furthermore, if additional financial institutions move to take advantage of this lower pricing, or if additional networks reduce the interchange rates they currently pay to ATM deployers, our future revenues and gross profits would be negatively impacted. For additional details on this rate change and other risks associated with interchange revenues, see Part II, Item 1A. “Risk Factors”.
Financial Regulatory Reform in the United States - The Dodd-Frank Wall Street Reform and Consumer Protection Act (the “Act”), which contains broad measures aimed at overhauling existing financial regulations within the United States, was signed into law on July 21, 2010. Among many other things, the Act includes provisions that (i) call for the establishment of a new Bureau of Consumer Financial Protection, (ii) limit the activities that banking entities may engage in, and (iii) give the Federal Reserve the authority to regulate interchange transaction fees charged by electronic funds transfer networks for electronic debit transactions. Many of the detailed regulations required under the Act have yet to be finalized and will likely not be finalized for some time. Accordingly, at this point, we do not believe that the regulations that are likely to arise from the Act will have a material impact on our operations. However, based on the current language contained within the Act, it is uncertain whether the regulation of interchange fees for electronic debit transactions will apply to ATM cash withdrawal transactions. If ATM cash withdrawal transactions were to fall under the proposed regulatory framework, and the related interchange fees were reduced from their current levels, such change would likely have a negative impact on our future revenues and operating profits. Conversely, additional proposed regulations contained within the Act are aimed at providing merchants with additional flexibility in terms of allowing certain point-of-sale transactions to be paid for in cash rather than with debit or credit cards. Such a change would likely result in the increased use of cash at the point-of-sale for some merchants, and thus, could positively impact our future revenues and operating profits (through increased transaction levels at our ATMs).
Nationwide Ntertainment Services, Inc.
Through our wholly-owned subsidiary, Nationwide Ntertainment Services, Inc., we are also engaged in the business of operating a network of DVD rental kiosks. We offer self-service DVD rentals through kiosks where consumers can rent or purchase movies or games. Our current DVD kiosks are installed primarily at grocery stores. Our DVD kiosks, through our brand InstaFlix, serve as a mini video rental store and occupy an area of less than ten square feet. Consumers use a touch screen to select their DVD, swipe a valid credit or debit card, and rent movies or games in some kiosks. The process is designed to be fast, efficient and fully automated with no upfront or membership fees.
Page 6
Revenue Sources – DVD Services
Typically, the DVD rental price is a flat fee plus tax for one night and if the consumer chooses to keep the DVD for additional nights, they are automatically charged for the additional fee. We generate revenue primarily through fees charged to rent or purchase a DVD, and pay our retail partners a percentage of our revenue.
Net revenue from DVD movie rentals is recognized on a ratable basis during the term of a consumer's rental transaction. On rental transactions for which the related DVDs have not yet been returned to the kiosk at month-end, revenue is recognized with a corresponding receivable recorded in the balance sheet. We record revenue net of sales taxes and refunds to consumers.
Seasonality – DVD Services
Through our limited operating history in DVD Services, we have experienced seasonality in our revenue from our DVD Services segment. The summer months have historically been high rental months for our DVD Services segment followed by lower revenue in September and October, due in part to the beginning of the school year and the introduction of the new television season. We expect our lowest quarterly revenue for the DVD services business in the first quarter and our highest quarterly revenue and earnings in the second and third quarters.
Our Corporate Strategy
Our strategy is to enhance our position as a leading independent provider of self service kiosk services in the United States and to position the Company as a preferred service provider to financial institutions. We are currently a “return-and-profit” driven company whose current primary focus is on the achievement of increased profitability and increased positive cash flow. Key objectives of our strategy include:
Expanding our existing customer base. We believe our experience combined with our dedication to enhance our existing customer relationships will enable us to expand our customer base. We believe in creating loyal customers by providing a superior experience at a great value. We are committed to providing “hassle-free” consistent products and services based on standards-based technology and processes, and outperforming the competition with value and a superior customer experience, particularly in the financial services markets.
Expanding our existing product offerings. We believe we can achieve distribution leverage by acquiring distribution rights to complimentary products and services which can be sold to our existing customers.
Attaining operational excellence. We believe we can attain operational excellence along with a corresponding market identity by standardizing product offerings and delivery processes.
Increasing and expanding our geographic presences. We believe we can achieve economies of scale by increasing and expanding our geographic market concentration. By achieving economies of scale, we can reduce our cost basis on expenses such as maintenance, vault cash, telecommunications, replenishment, ATMs and ATM supplies.
Our Strengths
Leading Market Position. We operate one of the largest networks of ATMs in the United States. Our network currently includes approximately 4,700 ATMs located throughout the United States. Our size and diversity of products and services give us significant economies of scale and the ability to provide attractive and efficient solutions to national, regional and local financial institutions and retailers.
Diverse Network of Retail Merchants Under Multi-Year Contracts. We have developed significant relationships with regional and local merchants within the United States. These merchants typically operate high-traffic locations, which we have found to result in increased ATM activity and profitability. Our contracts with our merchant customers are typically multi-year arrangements with initial terms of five to seven years. These long-term relationships can provide opportunities to deploy additional ATMs in new locations.
Page 7
Recurring and Stable Revenue and Operating Cash Flow. The long-term contracts that we enter into with our merchant customers provide us with access to customer traffic and relatively stable, recurring revenue. Our recurring and stable revenue base, relatively low and predictable maintenance capital expenditure requirements, and minimal working capital requirements allow us to generate relatively predictable and consistent operating cash flows.
Low-Cost Provider. We believe the size of our network combined with our operating infrastructure allows us to be among the low-cost providers in our industry. We believe our operating costs per ATM are significantly lower than the operating costs incurred by bank ATM operators. Our scale provides us with a competitive advantage both in operating our ATM fleet and the potential to offer cost effective outsourcing services to financial institutions.
Fiscal Year 2010 Developments in Our Company
During 2010 we:
|
|
·
|
Closed a financing agreement with Fifth Third Bank, extending a $17 million total line of credit to the Company;
|
|
|
·
|
Closed a subsequent financing agreement with Fifth Third Bank, extending a $1.65 million total line of credit to the Company to be used for acquisition targets;
|
|
|
·
|
Signed our first major client for DVD kiosks and deployed over 300 DVD kiosks at client locations;
|
|
|
·
|
Acquired an ATM portfolio for 140 ATM locations;
|
|
|
·
|
Signed a definitive agreement to acquire Tejas, a DVD kiosk company servicing Army and Air Force military bases. Acquisition closed effective January 1, 2011;
|
|
|
·
|
Closed new ATM placement deals for a combined 225 new ATMs.
|
Breach of Contracts
Although our merchant-owned ATM customers have multi-year contracts with us for transaction processing services, due to competition, some of these customers may leave us for our competitors prior to the expiration of their contracts, or may not renew their contracts upon their expiration. Additionally, some merchants may sell or close their stores or are unable to load cash into their ATMs due to cash flow issues. When these events occur, we pursue these customers to continue to utilize our processing services or alternatively, in the event they terminate their relationship with us prior to the expiration of their contacts, we seek payment of damages under a breach of contract clause in our contracts. The Company lost 46 ATM locations during 2010 as a result of breached contracts. The Company recognizes revenue on breached contracts when cash is received.
Our ATM Network
General. Our network ATMs are located primarily in the south and on the east coast, and our concentration as of December 31, 2010 is in the ten states listed below:
|
STATE
|
NUMBER OF ATMs
|
|
|
GA
|
868
|
|
|
TX
|
688
|
|
|
NY
|
668
|
|
|
VA
|
586
|
|
|
FL
|
466
|
|
|
NC
|
248
|
|
|
NM
|
228
|
|
|
MD
|
128
|
|
|
OH
|
127
|
|
|
SC
|
113
|
Page 8
The operation of our network involves the performance of many complementary tasks and services, including principally:
|
|
·
|
acquiring ATMs to be utilized by us and our customers;
|
|
|
·
|
selecting ATM locations and entering into leases for access to those locations;
|
|
|
·
|
in the case of third party merchants, establishing relationships with these merchants for processing transactions on their ATMs;
|
|
|
·
|
the sale of our Branded Cash services to local and regional banks or credit unions;
|
|
|
·
|
establishing relationships with national and regional card organizations and credit card issuers to promote usage of our network ATMs;
|
|
|
·
|
processing ATM transactions;
|
|
|
·
|
supplying ATMs with cash and monitoring cash levels for re-supply;
|
|
|
·
|
monitoring ATM operations and managing the service needs of ATMs; and
|
|
|
·
|
managing the collection of fees generated by our network operations.
|
ATM Locations. We believe that the profitable operation of any ATM is largely dependent upon the ATM’s location. Thus, we devote significant effort to selecting locations that we believe will generate high cardholder utilization. Additionally, we believe the availability of attractive sites is a principal factor affecting our ability to achieve further market penetration. We attempt to identify locations where pedestrian traffic is high, people need quick access to cash, and use of the ATM is convenient and secure. In addition, we believe such locations also provide a convenience to the retailer who may wish to avoid the financial exposure and added overhead of offering check-cashing services to their customers. Key target locations for our ATMs include the following:
|
|
·
|
grocery stores;
|
|
|
·
|
convenience stores and combination convenience stores and gas stations;
|
|
|
·
|
major regional and national retailers:
|
|
|
·
|
hotels;
|
|
|
·
|
shopping malls;
|
|
|
·
|
airports;
|
|
|
·
|
colleges;
|
|
|
·
|
amusement parks;
|
|
|
·
|
sports arenas;
|
|
|
·
|
bars/clubs;
|
|
|
·
|
theaters; and
|
|
|
·
|
bowling alleys.
|
Our goal is to secure key locations in advance of our competitors as we believe cardholders generally establish a pattern of continued usage of a particular ATM. Further, we believe such patterned usage will continue unless there are frequent problems with the location, such as a machine being out of service.
Page 9
We enter into leases for our ATM locations, which generally provide for payment to the lessor of either a portion of the fees generated by use of the ATM or a fixed monthly rent. Most of our leases have initial five to seven year terms and include various renewable time periods (typically the site owner renews under the lease). We generally have the right to terminate a lease if the ATM does not meet certain performance standards. The lessor generally has the right to terminate a lease before the end of the lease term if we breach the lease agreement or become the debtor in a bankruptcy proceeding.
Typical ATM Transaction. In a typical ATM transaction in our network, a debit or credit cardholder inserts a credit or debit card into an ATM to withdraw funds or obtain a balance inquiry. The transaction is routed from the ATM to a processing center at Elan, First Data or Columbus Data by dedicated dial-up communication links. The processing center computers identify the card issuer by the bank identification number contained within the card's magnetic strip. The transaction is then switched to the local issuing bank or card organization (or its designated processor) for authorization. Once the authorization is received, the authorization message is routed back to the ATM and the transaction is completed.
Authorization of ATM transactions. Transactions processed on our network ATMs are the responsibility of the card issuer. We are not liable in the event of an error in dispensing cash if we receive a proper authorization message from a card issuer.
Transaction Volumes. We monitor the number of transactions that are made by cardholders on ATMs in our network. The transaction volumes processed on any given ATM are affected by a number of factors, including location of the ATM, the amount of time the ATM has been installed at that location, seasonality and market demographics. Our experience is that transaction volume on a newly installed ATM is initially very low and increases for a period of three to six months as consumers become familiar with the machine location. We processed a total of approximately 17,670,000 transactions in fiscal 2010 and 17,090,000 transactions on our network in fiscal 2009.
ATM transactions. During 2010, compared to 2009, the Company experienced an approximate 2% decrease in the average number of surcharged transactions per ATM. We suspect that the decrease in the average number of surcharged transactions per ATM from 2010 to 2009 is mainly due to the fallout from current economic environment.
Acquisition Strategy
The Company is evaluating the attractiveness of possible acquisitions and its current strategy is to grow via a combination of accretive acquisitions and organic growth.
Business Continuity Plan
The Company’s business continuity plan includes the following two main components:
|
|
·
|
a plan to ensure the continuous operation of the Company’s core information technology infrastructure; and
|
|
|
·
|
a plan to minimize disruption of the remainder of its business functions.
|
Information Technology Infrastructure
The Company hosts its IT infrastructure at Peak 10, the largest independent data center operator and managed services provider in the United States, to utilize Peak 10’s managed collocation, communications, and security services out of its Jacksonville, Florida data center facility. The Company and Peak 10 maintain Universal Power Systems and diesel generators for back-up power in the event of temporary and extended power outages. In the event of a longer-term business interruption, our Business Continuity Plan directs the process by which all core IT infrastructure needs are re-routed to the Company’s back-up site at SunGard Availability Services (“SunGard”), an international leader in business continuity services. The Company’s back-up site is located in Carlstadt, New Jersey.
Intellectual Property
Our success depends in part on our proprietary rights and technology. We rely on a combination of patent, copyright, trademark and trade secret laws, employee and third-party non-disclosure agreements and other methods to protect our proprietary rights. For our registered and active trademarks, as well as our trademark applications pending, the duration of such intellectual property is unlimited provided that such marks continue to be in use. The Company has no other intellectual property that is subject to limited duration.
Page 10
Other Business Functions
The Company has a Business Continuity Plan for the remainder of its business functions consisting of 4 elements: prevention, event management, event mitigation, and event recovery. The plan addresses events such as vendor service interruption, natural disasters, and issues with our internal systems. In the event of a catastrophic event, the Company also maintains alternate sites for office operations through an arrangement with SunGard. These alternate sites, which are located in Lake Mary, Florida and Atlanta, Georgia, provide immediate access to the technical and office facilities required for failover. We have also converted our desktop environment to a mobile environment; therefore, when an emergency occurs, users can take their laptops and reach our network from either the alternate site or a safe location with power and internet. In addition, we maintain copies of our software and critical business information off-site.
Competition – ATM Services
Individuals seeking ATM-related services have a variety of choices at banking locations and within retail establishments. The convenience cash delivery and balance inquiry market is, and we expect it to remain, highly competitive due to the fact that there are few barriers to entry into the business. Our principal competition arises from other independent sales organizations, or ISOs, similar to the Company including Access To Money, Payment Alliance International and Cardtronics, Inc. We also compete with numerous national and regional banks that operate ATMs at their branches and at other non-branch locations. In addition, we believe that there will be continued consolidation in the ATM industry in the United States. Accordingly, new competitors may emerge and quickly acquire significant market share.
Competitive factors in our business include network availability and response time, price to both the card issuer and to our customers, and ATM locations. Our principal competitors are national ATM companies that have a dominant share of the market. These companies have greater sales, financial, production, distribution and marketing resources than ours.
We have identified the following categories of ATM network operators:
|
|
·
|
Financial Institutions. Banks have been traditional deployers of ATMs, which have customarily been located at their banking facilities. In addition, the present trend is for many banks to place ATMs in retail environments when the bank has an existing relationship with the retailer. This practice presents both a threat and an opportunity. It is a threat if the financial institution chooses to manage this program on its own, whereby it would limit the ATM locations available to the Company. On the other hand, it may be an opportunity if the financial institution chooses to outsource the management of this type of program to companies such as us.
|
|
|
·
|
Credit Card Processors. Several credit card processors have diversified their business by taking advantage of existing relationships with merchants to place ATMs at sites with those merchants.
|
|
|
·
|
Third Party Operators. This category includes data processing companies that have historically provided ATM services to financial institutions.
|
|
|
·
|
Companies that have the capability to provide both back-office services and ATM management services.
|
|
|
·
|
Consolidator networks. Consolidator networks such as Access To Money and Cardtronics, whose United States operations consist of approximately 10,000 ATMs and 35,000 ATMs, respectively.
|
Management believes that many of the above providers, with the exception of Cardtronics and TRM, deploy ATMs to diversify their operations and that the operation of the ATM network provides a secondary income source to a primary business.
We experience increased competition, both from existing ATM network operators and new companies entering the industry. There can be no assurance that we will compete successfully with national ATM companies. A continued increase in competition could adversely affect our margins and may have a material adverse effect on our financial condition and results of operations.
Page 11
Competition – DVD Services
Our DVD Services business faces competition from many other providers, including those using other distribution channels, having more experience, greater or more appealing inventory, better financing, and better relationships with those in the movie industry, than we have, including:
|
|
·
|
mail-delivery and online retailers, like Netflix;
|
|
|
·
|
other DVD kiosk businesses, like Redbox and NCR;
|
|
|
·
|
traditional video retailers;
|
|
|
·
|
other retailers and chain stores selling DVDs;
|
|
|
·
|
cable, satellite, and telecommunications providers;
|
|
|
·
|
general competition from other forms of entertainment such as movie theaters, television, sporting events and video gaming.
|
ATM Network Technology
Most of the ATMs in our network are manufactured by Triton and Tranax/Hyosung. In addition, we own several other ATM brands such as Wincor, WRG, Greenlink, NCR EasyPoint (formerly Tidel), and others. Due to the wide range of advanced technology available, we are able to supply our customers with state-of-the-art ATMs providing electronic features and reliability through sophisticated diagnostics and self-testing routines. The various machine types perform functions ranging from the basic routines, which include dispensing cash, displaying account information, and providing a receipt to the user, to more sophisticated routines such as dispensing stamps or coupons and providing advertising revenue through the use of monochrome or color monitor graphics. Many of our ATMs are modular and upgradeable so we may adapt them to provide additional services in response to changing technology and consumer demand. Our field services staff tests each ATM prior to placing it in service.
Vault Cash
Currently, we rent cash (“vault cash”) for approximately 1,560 of our ATMs through agreements with various banks, which are located throughout the United States. The vault cash is replenished periodically based upon cash withdrawals. In addition, our branded cash partners provide cash for 438 ATMs covered under our Branded Cash program. For the remaining 2,703 ATMs in our network, such as merchant-owned ATMs, ATMs owned by other third party owners and ATMs that are only processed under our contract with Elan, we do not supply the vault cash. See the “Liquidity and Capital Resources” section of Item 7 “Management's Discussion and Analysis of Financial Condition and Results of Operations”.
Significant Relationships
We have agreements with a retailer and one of its affiliated companies for whom approximately 692 and 105 ATMs, respectively, are installed at their locations as of December 31, 2010. The aggregate revenues from this significant customer accounted for approximately 22.3% and 3.4% of our revenues from operations in fiscal year 2010, respectively.
Government and Industry Regulation
Our business is generally not subject to significant government regulation, although we are subject to certain industry regulations. Our failure to comply with applicable regulations could result in restrictions on our ability to provide our services.
Page 12
Surcharge Regulation. The imposition of surcharge fees is not currently subject to federal regulation. However, several states in which we currently have no operations have banned companies from imposing such fees, generally as a result of activities of consumer advocacy groups that believe that transaction fees are unfair to users. There have been, however, various state and local efforts in the United States to ban or limit transaction fees. We are not aware of any existing bans or limits on transaction fees applicable to us in any of the jurisdictions in which we currently do business. However, some states, particularly Tennessee, Nebraska, Connecticut, Delaware, New Mexico, West Virginia, Wyoming, and Iowa, require us to obtain a bank sponsor in order to charge withdrawal fees. As a result, in these states we must make arrangements with a local bank to act as a sponsor of our ATMs, which typically involves additional documentation costs and payment of a fee to the bank. Additionally, states such as Illinois and New Jersey limit or ban withdrawal fees on electronic benefit card usage, which has had virtually no impact on our financial statements. Nevertheless, we cannot guarantee that transaction fees will not be banned or limited in the jurisdictions in the United States in which we operate. Such a ban or limit could materially limit or reduce our ATM revenues.
Our ATM business is subject to government and industry regulations, which we describe below. This regulatory environment is subject to change and various proposals have been made which, if finalized, could affect our ATM operations. Our failure to comply with existing or future laws and regulations pertaining to our ATM business could result in restrictions on our ability to provide our products and services, as well as the imposition of civil fines.
Dodd-Frank Act. The Dodd-Frank Wall Street Reform and Consumer Protection Act (the “Dodd-Frank Act”), which contains broad measures aimed at overhauling existing financial regulations within the United States, was signed into law on July 21, 2010. Among many other things, the Act includes provisions that (1) call for the establishment of a new Bureau of Consumer Financial Protection, (2) limit the activities that banking entities may engage in, and (3) give the Federal Reserve the authority to regulate interchange transaction fees charged by electronic funds transfer networks for electronic debit transactions. Many of the detailed regulations required under the Dodd-Frank Act have yet to be finalized but are currently required to be finalized on or before July 31, 2011. However, based on the interpretations of the current language contained within the Dodd-Frank Act, it appears that the regulation of interchange fees for electronic debit transactions will not apply to ATM cash withdrawal transactions. Accordingly, at this point, we do not believe that the regulations that are likely to arise from the Dodd-Frank Act will have a material impact on our operations. However, if ATM cash withdrawal transactions were to fall under the proposed regulatory framework, and the related interchange fees were reduced from their current levels, such change would likely have a negative impact on our future revenues and operating profits. Conversely, additional proposed regulations contained within the Dodd-Frank Act are aimed at providing merchants with additional flexibility in terms of allowing certain point-of-sale transactions to be paid for in cash rather than with debit or credit cards. Such a change could result in the increased use of cash at the point-of-sale for some merchants, and thus, could positively impact our future revenues and operating profits (through increased transaction levels at our ATMs). Finally, the Dodd-Frank Act requires debit cards to be recognized (or authorized) over at least two non-affiliated networks and provides for rules that would allow merchants greater flexibility in routing transactions across networks that are more economical for the merchant. The Federal Reserve requested comments as to whether these network and routing provisions should apply to ATM transactions. If the final rules provide that the network exclusivity and routing rules do apply to ATM transactions, we and other ATM operators may be able to conduct ATM transactions in a more economically beneficial manner.
Electronic Funds Transfer Act. The United States Electronic Funds Transfer Act, commonly known as “Regulation E”, while directed principally at banks and other financial institutions, also has provisions that apply to us. In particular, the act requires ATM operators that impose withdrawal fees to notify a customer of the withdrawal fee before the customer completes a withdrawal and incurs the fee. Notification must be made through signs placed at or on the ATM and by notification either on the ATM screen or through a print-out from the ATM. All of our ATMs provide both types of notification.
Americans with Disabilities Act. The Americans with Disabilities Act (“ADA”) ADA requires that ATMs be accessible to and independently usable by individuals with disabilities, such as visually-impaired or wheel-chair bound persons. The U.S. Department of Justice has issued new accessibility regulations under the ADA that become effective in March 2012. We have been preparing for these new regulations for several years by ensuring that the ATMs that we purchase and deploy are compliant with these proposed regulations. For that reason, we do not believe that these new guidelines will have a material adverse effect on our business regarding Company-owned machines. However, some of the merchant-owned ATMs that we service do not comply with these new regulations. There is an economic hardship exemption to the regulations that some of our merchants who operate small retail establishments may claim. In any event, we are developing a strategy to meet these new regulations.
Page 13
Rehabilitation Act. On December 1, 2006, a United States District Court judge ruled that the United States’ currencies violate the Rehabilitation Act, a law that prohibits discrimination in government programs on the basis of disability, as the paper currencies issued by the United States are identical in size and color, regardless of denomination. Under the current ruling, the United States Treasury Department has been ordered to develop ways in which to differentiate paper currencies such that an individual who is visually-impaired would be able to distinguish between the different denominations. In response to the November 26, 2006 ruling, the Department of Justice filed an appeal with the United States Court of Appeals for the District of Columbia Circuit requesting that the decision be overturned on the grounds that varying the size of denominations could cause significant burdens on the vending machine industry and cost the Bureau of Engraving and Printing an initial investment of $178.0 million and up to $50.0 million in new printing plates. While it is still uncertain at this time what the outcome of the appeals process will be, in the event the current ruling is not overturned, we, along with other participants in the ATM industry, may be forced to incur significant costs to upgrade current machines’ hardware and software components.
Anti-fraud Initiatives. Because of reported instances of fraudulent use of ATMs, legislation was passed that requires state or federal licensing and background checks of ATM operators. We completed the U.S. Patriot Act-mandated merchant underwriting process on all of our ATMs. Additionally, there are proposals pending in some jurisdictions, including New York and New Jersey, which would require merchants that are not financial institutions to be licensed in order to maintain an ATM on their premises. There are other jurisdictions that currently require such licensing. New licensing requirements could increase our cost of doing business in those markets.
Electronic Financial Transactions Network Regulations. Electronic Financial Transactions Networks (“EFTN”) has adopted extensive regulations that are applicable to various aspects of our operations and the operations of other ATM operators. These regulations include the encryption standards described more fully below and limitations on the maximum amount of cash that can be withdrawn from each machine. As described in the “Triple DES” section below, we needed to convert our ATMs to the new encryption standards by their compliance dates. With respect to all other EFTN regulations, we believe that we are in compliance with the regulations that are currently in effect and, if any deficiencies were discovered, we would be able to correct them before they had a material adverse impact on our business.
Encrypting Pin Pad and Triple-Data Encryption Standards. Data encryption makes ATMs more tamper-resistant. Two of the more recently developed advanced data encryption methods are commonly referred to as Encrypting Pin Pad (“EPP”) and the Triple Data Encryption Standard (“Triple-DES”). In 2005, we adopted a policy that any new ATMs we acquire from a manufacturer must be both EPP and Triple-DES compliant. As of December 31, 2007, we had substantially completed our Triple-DES upgrade efforts related to our Company-owned and merchant-owned machines, and all of our machines are EPP compliant.
Network Regulations. National and regional networks are subject to extensive regulations that are applicable to various aspects of our operations and the operations of other ATM network operators. We believe that we are in material compliance with all such regulations.
Employees
At December 31, 2010, the Company had 61 full-time employees working in the following entities:
|
Global Axcess Corp
|
5 | |||
|
Nationwide Ntertainment Services, Inc.
|
13 | |||
|
Nationwide Money Services, Inc.
|
43 | |||
| 61 |
Our business is highly automated and we outsource specialized, repetitive functions such as cash delivery and security. As a result, our labor requirements for the operation of our network are relatively modest and are centered on monitoring activities to ensure service quality and cash reconciliation and control. None of our employees are represented by a labor union or covered by a collective bargaining agreement. We have not experienced work stoppages and consider our employee relations to be good.
Page 14
|
ITEM 1A.
|
RISK FACTORS
|
We operate in a rapidly changing business environment that involves substantial risk and uncertainty. The following discussion addresses some of the risks and uncertainties that could cause, or contribute to cause, actual results to differ materially from expectations. We caution all readers to pay particular attention to the descriptions of risks and uncertainties described below, in other sections of this report and in our other filings with the SEC.
If any of the following risks actually occur, our business, financial condition or results of operations could be materially and adversely affected. In such case, the trading price of our common stock could decline and we may be forced to consider strategic alternatives with regards to current operations.
This Annual Report on Form 10-K contains forward-looking statements that involve risks and uncertainties. Our actual results could differ materially from those anticipated in the forward-looking statements as a result of certain factors, including the risks described below and elsewhere in this Annual Report on Form 10-K.
Risks Relating to Our Business
|
|
·
|
Our sales depend on transaction fees from our network of ATMs. A decline in either transaction volume or the level of transaction fees could reduce our sales and harm our operating results.
|
|
|
·
|
Transaction fees for our network of ATMs produce substantially all of our sales. Consequently, our future operating results will depend on both transaction volume and the amount of the transaction fees we receive. Our transaction volume and fees will depend principally upon:
|
|
|
·
|
our ability to find replacement sites in the event of merchant turnover;
|
|
|
·
|
competition, which can result in over-served markets, pressure to reduce existing fee structures and increase sales discounts to merchants, and reduced opportunities to secure merchant or other placements of our machines;
|
|
|
·
|
our ability to service, maintain and repair ATMs in our network promptly and efficiently;
|
|
|
·
|
continued market acceptance of our services; and
|
|
|
·
|
government regulation and network adjustment of our fees.
|
|
|
·
|
Changes in payment technologies and customer preferences could reduce the use of ATMs and, as a result, reduce our sales. New technology such as Radio Frequency Identification (“RFID”) and other contact-less payment systems that eliminate the need for ATMs may result in the existing machines in our networks becoming obsolete, requiring us, or the merchants in our networks who own their machines, to either replace or upgrade our existing machines. Any replacement or upgrade program to machines that we own or that we must upgrade or replace under contracts with merchant owners would involve substantial expense. A failure to either replace or upgrade obsolete machines could result in customers using other alternative payment methods, thereby reducing our sales and reducing or eliminating any future operating margins.
|
The use of debit cards by consumers has been growing. Consumers use debit cards to make purchases from merchants, with the amount of the purchase automatically deducted from the consumers' checking accounts. An increasing number of merchants are accepting debit cards as a method of payment and are also permitting consumers to use the debit cards to obtain cash. The increasing use of debit cards to obtain cash may reduce the number of cash withdrawals from our ATMs and may adversely affect our revenues from surcharge/convenience fees. A continued increase in the use and acceptance of debit cards could have a material adverse effect on our business, results of operations and financial condition.
Additionally, the growth in the use of surcharge-free ATM networks by consumers may reduce the number of cash withdrawals from our ATMs and may adversely affect our revenues from surcharge/convenience fees. A continued increase in surcharge-free ATM networks could have a material adverse effect on our business, results of operations and financial condition.
Page 15
|
|
·
|
We depend on third party vendors to provide many services on which we rely. Our ATM business requires close coordination of merchant relationships, service company relationships, cash management activities and telecommunication services. In an effort to reduce costs and improve our service levels, we entered into agreements with third party vendors pursuant to which they will provide many of these services to us as well as transaction processing services. As a result, we depend on these third party vendors to provide many services that are necessary to the operations of our ATM business. At some point these third party vendors may be unable or unwilling to provide all of these services at a level that we consider necessary. In that event, if we are unable to terminate our relationship with them or are unable to obtain replacement services in a timely manner, our transaction volume could be reduced and our relationships with our merchants or financial institutions could deteriorate.
|
|
|
·
|
Changes in laws or card association rules affecting our ability to impose surcharge/convenience fees and continued customer willingness to pay surcharge/convenience fees. Consumer activists have from time to time attempted to impose local bans or limits on surcharge fees. Even in the few instances where these efforts have passed the local governing body (such as with an ordinance adopted by the city of Santa Monica, California), federal courts have overturned these local laws on federal preemption grounds. However, those efforts may resurface and, should the federal courts abandon their adherence to the federal preemption doctrine in these contexts, those efforts could receive more favorable consideration than in the past. Any successful legislation banning or limiting surcharge fees could result in a substantial loss of revenues and significantly curtail our ability to continue our operations as currently configured.
|
|
|
·
|
Interchange fees, which comprise a substantial portion of our transaction revenues, may be lowered at the discretion of the various EFT networks through which our transactions are routed, or through potential regulatory changes, thus reducing our future revenues. Interchange fees, which represented approximately 32% of our total ATM operating revenues for the year ended December 31, 2010, are set by the various EFT networks through which transactions conducted on our devices are routed. Interchange fees are set by each network and typically vary from one network to the next. Accordingly, if some or all of the networks through which our ATM transactions are routed were to reduce the interchange rates paid to us or increase their transaction fees charged to us for routing transactions across their network, or both, our future transaction revenues could decline.
|
Recently, certain networks have reduced the net interchange fees paid to ATM deployers for transactions routed through their networks. For example, effective April 1, 2010, a global network brand reduced the interchange rates it pays to domestic ATM deployers for ATM transactions routed across its debit network. As a result, we have recently seen certain financial institutions migrate their volume away from other networks to take advantage of the lower pricing offered by these networks. Such rate change has reduced our ATM operating gross profits by approximately $30,000-$40,000 a month beginning April 1, 2010. Furthermore, if additional financial institutions move to take advantage of this lower pricing, or if additional networks reduce the interchange rates they currently pay to ATM deployers, our future revenues and gross profits would be negatively impacted.
|
|
·
|
Our ability to form new strategic relationships and maintain existing relationships with issuers of credit cards and national and regional card organizations. We have a significant number of customer and vendor relationships with financial institutions in all of our key markets, including relationships in which those financial institutions pay us for the right to place their brands on our devices. Additionally, we rely on a small number of financial institution partners to provide us with the cash that we maintain in our ATMs. Turmoil in the global credit markets in the future, such as the one recently experienced, may have a negative impact on those financial institutions and our relationships with them. In particular, if the liquidity positions of the financial institutions with which we conduct business deteriorate significantly, these institutions may be unable to perform under their existing agreements with us. If these defaults were to occur, we may not be successful in our efforts to identify new branding partners and cash providers, and the underlying economics of any new arrangements may not be consistent with our current arrangements. Furthermore, if our existing bank branding partners or cash providers are acquired by other institutions with assistance from the Federal Deposit Insurance Corporation (“FDIC”), or placed into receivership by the FDIC, it is possible that our agreements may be rejected in part or in their entirety. If these situations were to occur, and we were unsuccessful in our efforts to enter into similar agreements, our future financial results would be negatively impacted.
|
Page 16
|
|
·
|
Our ability to expand our ATM based business. Persons seeking ATM services have numerous choices. These choices include ATMs offered by banks or other financial institutions and ATMs offered by Independent Sales Organizations (“ISOs”) such as us. Some of our competitors offer services directly comparable to ours while others are only indirect competitors. We believe that there will be continued consolidation in the ATM industry in the United States. New competitors could emerge and acquire significant market share. This competition could prevent us from obtaining or maintaining desirable locations, reduce the transaction volume on our machines, affect the transaction fee levels we charge or require us to increase our merchants’ share of transaction fees thus lowering our profit margin. The occurrence of any of these factors could limit our growth or reduce our sales and income.
|
|
|
·
|
The availability of financing at reasonable rates for vault cash and for other corporate purposes, including funding our ATM expansion plans. In the future, we may need financing to obtain vault cash (which we use to fill ATMs), to fund new purchases of ATMs or for other corporate purposes. If we are unable to obtain such financing, or are unable to obtain it at reasonable rates, operations of certain ATMs or our ability to expand our ATM network could be adversely affected and our operating results would be negatively impacted.
|
|
|
·
|
Our ability to keep our ATMs at other existing locations and to place additional ATMs in preferred locations at reasonable rental rates. The loss of any of our largest merchants or a decision by any one of them to reduce the number of our devices placed in their locations would result in a decline in our revenues. Furthermore, if their financial condition were to deteriorate in the future and, as a result, one of more of these merchants was required to close a significant number of their domestic store locations, our revenues would be significantly impacted. Additionally, these merchants may elect not to renew their contracts when they expire. Even if such contracts are renewed, the renewal terms may be less favorable to us than the current contracts. If, for these reasons, we are unable to maintain existing favorable locations for our ATMs, or if we are unable to secure preferred locations at favorable rental rates for future placement of our ATMs with existing or new customers, it could result in a decline in our revenues and gross profits.
|
|
|
·
|
The extent and nature of competition from financial institutions, credit card processors and third party operators, many of whom have substantially greater resources. Clients seeking ATM services have numerous choices. These choices include ATMs offered by banks or other financial institutions and ATMs offered by ISOs (independent sales organizations) such as us. The banks and financial institutions and larger ISO’s may have more available financial resources that we do which may afford them to offer more competitive bids to acquire additional market share. This competition could prevent us from obtaining or maintaining desirable locations, reduce the transaction volume on our machines, affect the transaction fee levels we charge or require us to increase our merchants’ share of transaction fees thus lowering our profit margin. The occurrence of any of these factors could limit our growth or reduce our sales and income.
|
|
|
·
|
Our ability to maintain our ATMs and information systems technology without significant system failures or breakdowns. Our ability to provide reliable service largely depends on the efficient and uninterrupted operations of our transaction processors, Electronic Financial Transactions Networks (“EFTNs”) and other service providers. Any significant interruptions could severely harm our business and reputation and result in a loss of sales. If we cause any such interruption, we could lose the confidence of merchants under contract with us and or damage our relationships with them. Our systems and operations, and those of our transaction processors, EFTNs and other service providers, could be exposed to damage or interruption from fire, natural disaster, unlawful acts, terrorist attacks, power loss, telecommunications failure, unauthorized entry and computer viruses. We cannot be certain that any measures we and our service providers have taken to prevent system failures will be successful or that we will not experience service interruptions. Further, our property and business interruption insurance may not be adequate to compensate us for all losses or failures that may occur.
|
|
·
|
We maintain a significant amount of cash within our Company-owned ATMs, which is subject to potential loss due to theft or other events, including natural disasters.. As of December 31, 2010, there was approximately $37 million in vault cash held in our ATMs. Although legal and equitable title to such cash is held by the cash providers, any loss of such cash from our ATMs through theft or other means is typically our responsibility. We typically require that our cash service providers maintain adequate insurance coverage in the event cash losses occur as a result of misconduct or negligence on the part of such providers. However, we also maintain our own insurance policies to cover a significant portion of any losses that may occur that may ultimately not be covered by the insurance policies maintained by our service providers. In the event we incur losses that are covered by our insurance carriers, we will be required to fund a portion of those losses through the payment of any related deductible amounts under those policies. Furthermore, any increase in the frequency and/or amounts of such thefts and losses could negatively impact our operating results as a result of higher deductible payments and increased insurance premiums.
|
Page 17
|
|
·
|
Our ability to develop new products and enhance existing products to be offered through ATMs, and our ability to successfully market these products. Should the ATM industry decline, our future success depends in part on offering new products and services to our existing client base. Should we not be able to offer new products or additional services, our future results from operations could be materially impacted.
|
|
|
·
|
Our entrance into the DVD services business could continue to contribute negative earnings. Our DVD services business has a very limited operating history and faces many of the risks inherent to a new business. Redbox, the largest player in the DVD services business, incurred a net operating loss each year since it began operations in 2002 through 2007. As a result of its limited operating history, it is difficult to accurately forecast our potential revenue and operating results from our new DVD kiosk business. If we are unable to attract customers to our DVD rental kiosks, our operations and financial condition will be adversely affected. Because of our limited operating history in this business line and because the DVD rental kiosk market and our business model for DVD services is rapidly evolving, we have very limited data for predicting kiosk and market performance in future periods. As a result, we may make errors in predicting and reacting to relevant business trends which could have a material adverse effect on our business, financial condition and results of operations. During fiscal 2010, we reported a net loss of approximately $2.1 million in the DVD services business.
|
|
|
·
|
Our entrance into the DVD services business could be cash dilutive. We plan to expand our operations in the DVD kiosk business. While we have had success in generating positive cash flow from our ATM business, our DVD model requires significant rental transaction volumes to make it economically feasible to purchase and deploy DVD kiosks. Should we not be successful in achieving the rental transaction volumes to generate positive cash flow, the DVD kiosk business could materially impact the cash flows of the Company. During fiscal 2010, we reported a net loss of approximately $2.1 million in the DVD services business.
|
|
|
·
|
We depend upon third-party manufacturers of our DVD rental kiosks and related software. We depend upon third-party manufacturers to manufacture our kiosks. We intend to continue expanding our installed base in the U.S. and such expansion may be limited by the manufacturing capacity of the third-party manufacturers who may not be able to meet our manufacturing needs in a satisfactory and timely manner. Furthermore, we are reliant on the third-party manufacturer for the development of its core software technology. Any failure by them to develop, produce and manufacture functional DVD rental kiosks and related software could harm our business, financial condition and results of operations.
|
|
|
·
|
We depend upon third parties for the maintenance and servicing of our kiosks and the fulfillment of our DVD titles. We depend upon a third-party distributors for the fulfillment of our DVD titles, third-party providers for payment processing and third-party service providers for the maintenance and servicing of our kiosks. Any failure by us to maintain these existing relationships or to establish new relationships on a timely basis or on acceptable terms could harm our business, financial condition and results of operations.
|
|
|
·
|
Any significant disruption in our computer systems or equipment could result in a loss of users. The operation of our DVD rental kiosks is dependent on their ability to connect to our back-end platform running in our datacenters. Our reputation and ability to attract, retain and serve our users are dependent upon the reliable performance of our network infrastructure and fulfillment processes. Interruptions in these systems could hinder our ability to process transactions, which could diminish the attractiveness of our service to existing and potential users.
|
|
|
·
|
If we are unable to build our brand, our ability to attract and retain users may be adversely affected. We are still developing our brand identity, InstaFlix, and we must build strong brand identity to compete successfully. To succeed, will have to compete for users against other brands that have greater recognition, such as Redbox and NCR/Blockbuster Express. To the extent dissatisfaction with our service is not adequately addressed, our brand may be adversely impacted. If our efforts to promote and maintain our brand are not successful, our operating results and our ability to attract and retain users of our service may be adversely affected.
|
Page 18
|
|
·
|
If we do not manage our DVD inventory effectively, our business, financial condition and results of operations could be materially and adversely affected. If we do not acquire sufficient copies of popular DVDs, we may not satisfy user demand, and our user satisfaction and results of operations could be adversely affected. Conversely, if we attempt to mitigate this risk and acquire more copies than needed to satisfy our user demand, our inventory utilization would become less effective and our gross margins would be adversely affected. Our ability to accurately predict user demand may impact our ability to acquire appropriate quantities of certain DVDs.
|
|
|
·
|
Our ability to retain senior management and other key personnel. Our future success depends in part on the performance of our executive officers and key employees. The loss of the services of any of our executive officers or other key employees could have a material adverse effect on our business, operating results and financial condition.
|
|
|
·
|
The current global economic downturn could adversely impact our ATM services business;
|
Our sales are dependent upon the availability and access to cash for ATM users. The current global economic downturn may have a negative impact on availability and accessibility to or the affordability of fees imposed by our ATMs. Accordingly, a pronounced and sustained economic downturn could have a material, adverse effect on our business, financial condition and results of operations. Additionally, the current global economic downturn may have a negative impact on the merchants with which we do business, thus leading to increased store closures or lack of cash to replenish their ATMs.
|
|
·
|
Our business can be adversely affected by severe weather, natural disasters and other events beyond our control, such as earthquakes, fires, power failures, telecommunication loss and terrorist attacks.
|
A catastrophic event that results in the destruction or disruption of any of our critical business or information technology systems could harm our ability to conduct normal business operations and our operating results. While we have taken steps to protect the security of critical business processes and systems and have established certain back-up systems and disaster recovery procedures, any disruptions, whether due to inadequate back-up or disaster recovery planning, failures of information technology systems, interruptions in the communications network, or other factors, could seriously harm our business, financial condition and results of operations.
In addition, our operational and financial performance is a direct reflection of consumer use of and the ability to operate and service the ATMs and DVD kiosks used in our business. Severe weather, natural disasters and other events beyond our control can, for extended periods of time, significantly reduce consumer use of our products and services as well as interrupt the ability of our employees and third-party providers to operate and service our equipment and machines. In some cases, severe weather, natural disasters and other events beyond our control may result in extensive damage to, or destruction of, our infrastructure and equipment, including loss of machines used to provide our products and services, which losses may not be fully covered by insurance.
|
|
·
|
Changes in general economic conditions.
|
The ATM markets are highly competitive, which could limit our growth or reduce our sales. While our principal competition comes from national and regional banks, we are also experiencing increased competition from independent ATM companies. All of these competitors offer services similar to or substantially the same as those services offered by us. We expect that competition will intensify as consolidation within the financial services industry continues. In addition, the majority of these competitors are larger, more established and have greater financial, technical, and marketing resources, greater name recognition, and a larger installed customer base than the Company. Such competition could prevent us from obtaining or maintaining desirable locations for our machines or could cause us to reduce user fees generated by our ATMs, which could cause our profits to decline.
In addition to our current competitors, we expect substantial competition from new companies. We cannot assure that the Company will be able to compete effectively against current and future competitors. Increased competition could result in price reductions, reduced gross profits or loss of market share.
Page 19
Our failure to achieve and maintain adequate internal controls, in an industry that is relatively new and complex, could result in a loss of investor confidence regarding our financial reports and have an adverse effect on our business, financial condition, results of operations and stock price. Pursuant to Section 404 of the Sarbanes-Oxley Act of 2002, we are required to furnish a report of management’s assessment of the design and effectiveness of our internal control over financial reporting as part of our Annual Report on Form 10-K filed with the SEC. Our independent auditors are not required to attest to, and report on, management’s assessment and the effectiveness of internal control over financial reporting. Our management is also required to report on the effectiveness of our disclosure controls and procedures. Any material weakness and deficiencies in the effectiveness of internal control over financial reporting could result in inaccurate financial statements or other disclosures or fail to prevent fraud, which could have an adverse effect on our business, financial condition or results of operations. Further, if we do not remediate any material weakness, we could be subject to sanctions or investigation by regulatory authorities, such as the SEC, we could fail to timely meet our regulatory reporting obligations, or investor perceptions could be negatively affected; each of these potential consequences could have an adverse effect on our business, financial condition or results of operations.
If merchant-owned ATM customers terminate their relationships with us prior to the termination of their contracts or do not renew their contracts upon their expiration, it could reduce our ATM sales. Although our merchant-owned ATM customers have multi-year contracts with us for transaction processing services, due to competition, some of these customers may leave us for our competitors prior to the expiration of their contracts, or may not renew their contracts upon their expiration. When these contracts expire, we pursue these customers to remain processing with us. In the event they terminate their relationship with us prior to the expiration of their contacts, we seek payment of damages under a breach of contract clause in our contracts. If a substantial number of merchant-owned ATM customers end their relationships with us, it could cause a reduction in our ATM sales.
Increases in interest rates will increase our expenses. We have credit and vault cash facilities that carry variable interest rates. Consequently, a rise in interest rates would increase our operating costs and expenses.
Our ATM business operates in a changing and unpredictable regulatory environment. ATM withdrawal transactions involve the electronic transfer of funds through Electronic Financial Transactions Networks (EFTNs). The United States Electronic Funds Transfer Act provides the basic framework establishing the rights, liabilities and responsibilities of participants in EFTNs. In addition, there have been various state and local efforts to ban, limit or otherwise regulate ATM transaction fees, which make up a large portion of our sales for our full placement ATMs and the principal source of ATM revenues for merchants with merchant-owned ATMs in our network. For example, in Tennessee, Nebraska, Connecticut, Delaware, New Mexico, West Virginia, Wyoming, and Iowa only bank-sponsored ATMs can impose withdrawal fees. As a result, in these states we must make arrangements with a local bank to act as a sponsor of ATMs in our networks, which typically involves additional documentation costs and payment of a fee to the bank.
Because of reported instances of fraudulent use of ATMs, legislation is pending that would require state or federal licensing and background checks of ATM operators. There are proposals pending in some jurisdictions, including New York and New Jersey, which would require merchants that are not financial institutions to be licensed in order to maintain an ATM on their premises; other jurisdictions currently require such licensing. New licensing requirements could increase our cost of doing business in those markets.
New government and industry standards will increase our costs and, if we cannot meet compliance deadlines, could require us to remove non-compliant machines from service. The Americans with Disabilities Act (“ADA”) ADA requires that ATMs be accessible to and independently usable by individuals with disabilities, such as visually-impaired or wheel-chair bound persons. The U.S. Department of Justice has issued new accessibility regulations under the ADA that become effective in March 2012. We have been preparing for these new regulations for several years by ensuring that the ATMs that we purchase and deploy are compliant with these then proposed regulations. For that reason, we do not believe that these new guidelines will have a material adverse effect on our business regarding Company-owned machines. However, some of the merchant-owned ATMs that we service do not comply with these new regulations. There is an economic hardship exemption to the regulations that some of our merchants who operate small retail establishments may claim. In any event, we are developing a strategy to meet these new regulations.
If ATMs in our network are not compliant with any applicable ADA guidelines by the respective deadlines and we cannot obtain compliance waivers, we may have to remove the non-compliant ATMs from service and, as a result, our ATM revenues could be materially reduced during the period of time necessary to become compliant.
Page 20
If we, our transaction processors, our EFTNs or our other service providers experience system failures, the ATM products and services we provide could be delayed or interrupted, which would harm our business. Our ability to provide reliable service largely depends on the efficient and uninterrupted operations of our transaction processors, EFTNs and other service providers. Any significant interruptions could severely harm our business and reputation and result in a loss of sales. Additionally, if we cause any such interruption, we could lose the affected merchants or damage our relationships with them. Our systems and operations, and those of our transaction processors, EFTNs and other service providers, could be exposed to damage or interruption from fire, natural disaster, unlawful acts, terrorist attacks, power loss, telecommunications failure, unauthorized entry and computer viruses. We cannot be certain that any measures we and our service providers have taken to prevent system failures will be successful or that we will not experience service interruptions.
We rely on EFTNs and transaction processors; if we cannot renew our agreements with them, if they are unable to perform their services effectively or if they decrease the level of the transaction fees we receive, it could harm our business. We rely on several EFTNs and transaction processors to provide card authorization, data capture and settlement services to us and our merchant customers. Any inability on our part to renew our agreements with these or similar service providers or their failure to provide their services efficiently and effectively may damage our relationships with our merchants and may permit those merchants to terminate their agreements with us.
Our ATM revenues depend to a significant extent upon the transaction fees we receive through EFTNs. If one or more of the EFTNs in which we participate reduces the transaction fees it pays to us, and we are unable to route transactions to other EFTNs to replace them, our ATM revenues would be reduced. Our ATMs do not meet all of the requirements for first tier status. As a means of mitigating the impact of the lower interchange rates paid by Visa/Plus we have had our processing agents adjust priority routing tables to, whenever possible, move transactions through EFTNs whose interchange rates are higher than those paid by the Visa/Plus EFTN.
Risks Relating to Our Common Stock
The price of our common stock has been highly volatile due to factors that will continue to affect the price of our stock. Since January 2001, our common stock has traded as high as $13.75 and as low as $0.10 per share (after giving effect to the 1-for-5 reverse stock split of our common stock that occurred on April 28, 2005). Historically, the over-the-counter markets for securities such as our common stock have experienced extreme price fluctuations. Some of the factors leading to this volatility include:
|
|
·
|
fluctuations in our quarterly revenues and operating results;
|
|
|
·
|
litigation against the Company;
|
|
|
·
|
announcements of product releases or new services by us or our competitors;
|
|
|
·
|
announcements of acquisitions and/or partnerships by us or our competitors.
|
There is no assurance that the price of our common stock will not continue to be volatile in the future.
A significant portion of our total outstanding shares of common stock may be sold in the market in the near future. As of March 2, 2011, approximately 6.9 million or 30.52% of registered securities are beneficially owned by 5 persons or groups. Sales of substantial amounts of these securities, when sold, could reduce the market price of our common stock. This could cause the market price of our common stock to drop significantly, even if our business is doing well. Sales of a substantial number of shares of our common stock in the public market could occur at any time. These sales, or the perception in the market of such sales, may have a material adverse effect on the market price of our common stock.
Page 21
We do not plan to declare dividends on our common stock. We do not plan to declare dividends on our common stock for the foreseeable future and, in any event, under the terms of our credit facility with Fifth Third Bank, are prohibited from doing so.
Risk Relating to Our Operating Results
Our business is subject to numerous factors affecting our operating results. In addition to the risk factors discussed above, our operating results may be affected by:
We have an operating history which may not be an indicator of our future results. As a result of our operating history, our plan for growth, and the increasingly competitive nature of the markets in which we operate, our historical financial data may not be a good indicator of our future revenues and operating expenses. Our planned expense levels will be based in part on expectations concerning future revenues, which is difficult to forecast accurately based on current plans of expansion and growth. We may be unable to adjust spending in a timely manner to compensate for any unexpected shortfall in revenues.
Our future operating results may fluctuate. Our future operating results will depend significantly on our ability to continue to drive new and repeated usage of our ATMs and DVD kiosks and to control our costs in doing so. Our operating results may fluctuate based upon many factors, including:
|
|
·
|
fluctuations in revenue generated by our ATM and DVD services businesses;
|
|
|
·
|
fluctuations in direct operating expenses, such as the amortization of our DVD library, cash costs, maintenance costs, merchandising and cash replenishment costs, amongst others;
|
|
|
·
|
our ability to establish or maintain relationships with significant retailers and suppliers;
|
|
|
·
|
the amount of residual commission fees that we pay to our retailers;
|
|
|
·
|
the surcharge fees we charge on our ATMs and transaction fees we charge consumers to use our DVD services;
|
|
|
·
|
fluctuation in consumer spending patterns and uses of cash;
|
|
|
·
|
fluctuations in consumer rental patterns, including the number of movies rented per visit, the type of DVDs they want to rent and for how long, and the level of DVD migration between kiosks;
|
|
|
·
|
the successful operation of our network;
|
|
|
·
|
the level of product and price competition;
|
|
|
·
|
fluctuations in interest rates, which affects our debt service obligations;
|
|
|
·
|
the timing of, and our ability to develop and successfully commercialize, new or enhanced products and services;
|
|
|
·
|
activities of and acquisitions or announcements by competitors; and
|
|
|
·
|
the impact from any impairment of inventory, goodwill, fixed assets or intangibles related to our acquisitions.
|
In addition, we have historically experienced seasonality in our revenue from our ATM services business and through our limited operational history, have seen seasonality in our DVD services business as well.
If we incur operating losses, we may be unable to continue our current operations. We incurred significant operating losses during the two fiscal years of 2005 and 2006. Even though we reported net income during fiscal year 2007 through fiscal 2009, we have reported a net operating loss for fiscal 2010 and have an accumulated deficit of $7.2 million as of December 31, 2010. If we continue to incur operating losses in the future, we may be unable to continue our current operations. Our future profitability depends on our ability to retain current customers, obtain new customers, respond to competition, introduce new products and services, and successfully market and support our products. We cannot assure that this will be achieved.
Page 22
We must adhere to bank financial covenants. Our credit facility with Fifth Third Bank requires that we meet certain financial covenants, including a maximum senior funded indebtedness to EBITDA ratio, a minimum debt service coverage ratio, and a minimum cash balance to maintain in accounts at Fifth Third. All of these bank covenants are defined in the credit facility. If any of these financial covenants are not met or any other event of default occurs under the revolving credit facility, our lenders would be entitled to declare our indebtedness immediately due and payable and exercise other remedies.
If we cannot raise adequate financing in the future, we may be unable to continue to expand our ATM and DVD portfolios. In the future, we may need to raise financing to fund new purchases of ATMs and DVD rental kiosks. Funding from financing sources may not be available when needed or on favorable terms. If we cannot raise adequate financing to satisfy our capital requirements, we may have to limit, delay, scale-back or eliminate future growth.
The termination of our contract with our major customers could negatively impact our results of operations and may result in a significant impact to revenues. As of December 31, 2010, we have in service approximately 761 ATM sites with a major customer and one of its affiliated companies. The sites constitute approximately 16.2% of our total sites and approximately 25.7% of our total revenues. Historically, these sites have generated average revenue per site in excess of other sites. The loss of, or any further reduction in business from, this major customer could have a material adverse impact on our working capital and future results of operations.
The proliferation of payment options other than cash, including credit cards, debit cards, and stored-value cards, could result in a reduced need for cash in the marketplace and a resulting decline in the usage of our ATMs. The United States has seen a shift in consumer payment trends with more customers now opting for electronic forms of payment (e.g., credit cards and debit cards) for their in-store purchases over traditional paper-based forms of payment (e.g., cash and checks). Additionally, merchants are now offering free cash back at the point-of-sale for customers that utilize debit cards for their purchases, thus providing an additional incentive for consumers to use these cards. According to the Nilson Report issued in December 2010, cash transaction counts declined from approximately 37% of all payment transactions in 2005 to approximately 34% in 2009, with declines also seen in check usage as credit, debit and stored-value card transactions increased. However, in terms of absolute dollar value, the volume of cash used in payment transactions actually increased from $1.4 trillion in 2005 to $1.6 trillion in 2009. The continued growth in electronic payment methods could result in a reduced need for cash in the marketplace and ultimately, a decline in the usage of our ATMs and a continued increase in the use and acceptance of debit cards could have a material adverse effect on our business, results of operations and financial condition.
Any regulation or elimination of surcharge/convenience or interchange fees could have a material adverse impact on our results of operations. There have been various efforts by both consumer groups and various legislators to eliminate surcharge/convenience fees, which comprised $12.6 million, or 58.7%, of our ATM revenues in fiscal 2010. In the event that surcharge/convenience fees are eliminated, the revenues generated from cash withdrawal transactions would be significantly reduced, which would have a material adverse impact on our working capital and results of operations. There have also been efforts by various legislators to eliminate interchange fees. Although this would have an immediate, negative impact, we believe that the industry will respond by increasing surcharge/convenience fees to make up the loss in interchange fees. In the event that the loss of interchange fees could not be passed through by increasing surcharge/convenience fees, the elimination of interchange fees would have a material adverse impact on our working capital and results of operations.
If banks decrease the surcharge/convenience fees they charge, we may need to reduce the surcharge/convenience fees we charge. While we experience competition from independent ATM companies, our principal competition comes from national and regional banks. Should these national and regional banks decrease the surcharge/convenience fees they charge, in order to remain competitive, we may also need to reduce the surcharge/convenience fees we charge, which may adversely affect our revenues.
Mergers, acquisitions and personnel changes at financial institutions, Electronic Funds Transfer Networks, and Independent Sales Organizations may adversely affect our business, financial condition and results of operations. Currently, the banking industry is consolidating, causing the number of financial institutions and ATM networks to decline. This consolidation could cause us to lose:
|
|
·
|
current and potential customers;
|
Page 23
|
|
·
|
market share if the combined entity determines that it is more efficient to develop in-house products and services similar to ours or use our competitors' products and services; and
|
|
|
·
|
revenues if the combined institution is able to negotiate a greater volume discount for, or discontinue the use of, our products and services.
|
If our computer network and data centers were to suffer a significant interruption, our business and customer reputation could be adversely impacted and result in a loss of customers. Our ability to provide reliable service largely depends on the efficient and uninterrupted operations of our computer network systems and third party data centers. Any significant interruptions could severely harm our business and reputation and result in a loss of customers. Our systems and operations could be exposed to damage or interruption from fire, natural disaster, power loss, telecommunications failure, unauthorized entry and computer viruses. Although we and the third party data centers have taken steps to prevent a system failure, we cannot be certain that the measures will be successful and that we will not experience system failures. Further, our property and business interruption insurance may not be adequate to compensate us for all losses or failures that may occur.
We have negative working capital. At December 31, 2010 we had negative working capital of $3,490,856. Our business plan calls for us to achieve sufficient revenue, margin, EBITDA (earnings before interest, taxes, depreciation and amortization) and positive cash flows to meet our current and future obligations. Achieving that business plan is contingent upon being successful in securing new profitable ATM and DVD clients as well as maintaining profitability on existing ATM locations and achieving profitability on existing DVD locations. If that business plan is achieved, the Company will have sufficient working capital to meet our 2011 obligations. If our business plan is not achieved, the Company may need to raise additional funds through debt or equity offerings. There can be no assurance as to the availability of any needed funding and, if available, that the source of funds would be available on terms and conditions acceptable to management.
If we experience impairments of our merchant contracts or other intangible assets, we will be required to record a charge to earnings, which may be significant. We have $15.1 million of merchant contracts and intangible assets on our balance sheet as of December 31, 2010, and we are required to perform periodic assessments for any possible impairment for accounting purposes. We periodically evaluate the recoverability and the amortization period of our merchant contracts and intangible assets under accounting principles generally accepted in the United States ("U.S. GAAP"). Some of the factors that we consider to be important in assessing whether or not impairment exists include the performance of the related assets relative to the expected historical or projected future operating results, significant changes in the manner of our use of the assets or the strategy for our overall business, and significant negative industry or economic trends. These factors, assumptions, and any changes in them could result in an impairment of our goodwill and other intangible assets. In the event, if we determine our merchant contracts and/or intangible assets are impaired, we may be required to record a significant charge to earnings in our financial statements, which would negatively impact our results of operations and that impact could be material.
We may be unable to protect our intellectual property rights, which could have a negative impact on our results of operations. Despite our efforts to protect our intellectual property rights, third parties may infringe or misappropriate our intellectual property rights, or otherwise independently develop substantially equivalent products and services. The loss of intellectual property protection or the inability to secure or enforce intellectual property protection could harm our business and ability to compete. We rely on a combination of trademark and copyright laws, trade secret protection, and confidentiality and license agreements to protect our trademarks, software and know-how. We may find it necessary to spend significant resources to protect our trade secrets and monitor and police our intellectual property rights.
Third parties may assert infringement claims against us in the future. In particular, there has been a substantial increase in the issuance of patents for Internet-related business processes, which may have broad implications for all participants in Internet commerce. Claims for infringement of these patents are becoming an increasing source of litigation. If we become subject to an infringement claim, we may be required to modify our products, services and technologies or obtain a license to permit our continued use of those rights. We may not be able to do either of these things in a timely manner or upon reasonable terms and conditions. Failure to do so could seriously harm our business and operating results. In addition, future litigation relating to infringement claims could result in substantial costs to us and a diversion of management resources. Adverse determinations in any litigation or proceeding could also subject us to significant liabilities and could prevent our use of certain of our products, services or technologies.
Page 24
|
ITEM 1B.
|
UNRESOLVED STAFF COMMENTS
|
Not Applicable.
Page 25
|
ITEM 2.
|
PROPERTIES
|
The Company does not own any real property. The following table sets forth certain information about the Company’s leased properties as of December 31, 2010.
|
Location
|
Approximate
Square Footage |
Lease Term
|
Use
|
|||
|
Jacksonville, Florida
|
5,841 sq. ft.
|
July, 2012
|
General office use; operations, accounting, sales, and related administration.
|
|||
|
West Columbia, South Carolina
|
3,600 sq. ft.
|
Month to Month
|
General warehouse use, equipment storage, and maintenance operations.
|
|||
|
Jacksonville, Texas
|
5,000 sq. ft.
|
Month to Month
|
General office and warehouse use, equipment storage, customer service, and maintenance operations.
|
In general, all facilities are leased under operating leases and are in good condition. Commencing in May 2007, the Company entered into a lease for their Jacksonville, Florida office. The term of this lease is for a period of 62 months. The Company entered into an office lease in Jacksonville, Texas which, effective February 1, 2009, became a month to month lease. The Company also leases a warehouse facility in South Carolina which is a month to month lease.
Page 26
|
ITEM 3.
|
LEGAL PROCEEDINGS
|
Information regarding legal proceedings is contained in Financial Footnote #15 ”Legal Proceedings” to the consolidated financial statements contained in this report and is incorporated herein by reference.
|
ITEM 4.
|
[REMOVED AND RESERVED]
|
PART II
ITEM 5. MARKET FOR REGISTRANT’S COMMON EQUITY, RELATED STOCKHOLDER MATTERS AND ISSUER PURCHASES OF EQUITY SECURITIES
Price Range
Our common stock is currently quoted on the Over-the-Counter Bulletin Board ("OTCBB") under the symbol "GAXC." As of March 28, 2011, there were 22,697,751 shares of the Company’s common stock ($0.001 par value) issued and 22,544,726 shares outstanding.
We are currently authorized to issue a total of 45,000,000 shares of common stock ($0.001 par value) and 5,000,000 shares of preferred stock ($0.001 par value). The Company does not currently have any shares of its preferred stock outstanding. The following table sets forth the high and low closing price per share of our common stock. The quotations reflect inter-dealer prices, without mark-up, mark-down or commission, and may not represent actual transactions.
|
Price Range
|
||||||||
|
High
|
Low
|
|||||||
|
Fiscal 2011:
|
||||||||
|
First Quarter through March 23rd
|
$ | 0.56 | 0.42 | |||||
|
Fiscal 2010:
|
||||||||
|
First Quarter
|
$ | 1.06 | 0.85 | |||||
|
Second Quarter
|
1.03 | 0.71 | ||||||
|
Third Quarter
|
0.79 | 0.52 | ||||||
|
Fourth Quarter
|
0.65 | 0.48 | ||||||
|
Fiscal Year
|
1.06 | 0.48 | ||||||
|
Fiscal 2009:
|
||||||||
|
First Quarter
|
$ | 0.22 | 0.10 | |||||
|
Second Quarter
|
0.44 | 0.20 | ||||||
|
Third Quarter
|
0.99 | 0.40 | ||||||
|
Fourth Quarter
|
0.90 | 0.58 | ||||||
|
Fiscal Year
|
0.99 | 0.10 | ||||||
Dividends
We have not historically declared or paid any dividends on our common stock and we currently plan to retain future earnings to fund the development and growth of our business. The declaration of future dividends, whether in cash or in-kind, is within the discretion of the Board of Directors and will depend upon business conditions, our results of operations, our financial condition, and other factors. In addition, under the terms of our credit facility we are prohibited from declaring dividends.
Page 27
Shareholders
On March 28, 2011, there were 234 registered holders of record of our common stock. Because many of such shares are held by brokers and other institutions on behalf of stockholders, we are unable to estimate the total number of stockholders represented by these record holders.
Securities authorized for issuance under equity compensation plans
As of December 31, 2010, we had the following securities authorized for issuance under the equity compensation plans (as adjusted for the one-for-five reverse split that occurred on April 28, 2005):
|
Plan Category
|
Number of
securities to
be issued upon exercise of outstanding options, warrants and rights |
Weighted-
average exercise
price of outstanding options, warrants and rights |
Number of
securities remaining available for future issuance under equity compensation plans (excluding securities reflected in first column) |
|||||||||
|
|
|
|||||||||||
|
Equity compensation plans approved by security holders
|
|
|
|
|||||||||
|
Stock Options
|
2,893,513 | $ | 0.40 | 999,539 | ||||||||
|
Warrants
|
30,000 | $ | 0.20 | — | ||||||||
|
Equity compensation plans not approved by security holders
|
— | — | — | |||||||||
|
Total
|
2,923,513 | $ | 0.40 | 999,539 | ||||||||
Recent Sales of Unregistered Securities
None.
Stock Performance Graph
The following stock performance graph does not constitute soliciting material, and should not be deemed filed or incorporated by reference into any other Company filing under the Securities Act of 1933, as amended, or the Exchange Act, except to the extent the Company specifically incorporates this stock performance graph by reference therein.
The following performance graph compares the cumulative total stockholder return on our common stock to the cumulative total return on the NASDAQ Composite Index and the weighted average return of our ATM peer group (described below) for the five years ended December 31, 2010, assuming an initial investment of $100 and the reinvestment of all dividends.
Our current ATM peer group consists of the following: Cardtronics Inc. and Access to Money.
Page 28
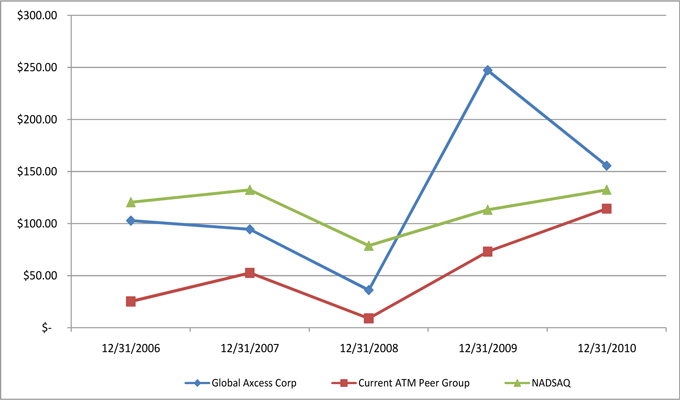
|
12/31/2006
|
12/31/2007
|
12/31/2008
|
12/31/2009
|
12/31/2010
|
||||||||||||||||
|
Global Axcess Corp
|
$ | 102.78 | $ | 94.44 | $ | 36.11 | $ | 247.22 | $ | 155.56 | ||||||||||
|
Current ATM Peer Group
|
$ | 25.09 | $ | 52.64 | $ | 8.88 | $ | 73.09 | $ | 114.32 | ||||||||||
|
NADSAQ
|
$ | 120.56 | $ | 132.39 | $ | 78.72 | $ | 113.27 | $ | 132.42 | ||||||||||
Page 29
|
ITEM 6.
|
SELECTED FINANCIAL DATA
|
Summary Statement of Operations Data
|
For the Year Ended December 31,
|
||||||||||||||||||||
|
2010
|
2009
|
2008
|
2007
|
2006
|
||||||||||||||||
|
(In thousands except gross profit percentage and per share data)
|
||||||||||||||||||||
|
Revenues
|
$ | 22,743 | $ | 21,495 | $ | 22,171 | $ | 21,751 | $ | 21,437 | ||||||||||
|
Gross profit
|
9,388 | 10,178 | 9,823 | 9,045 | 9,032 | |||||||||||||||
|
Gross profit %
|
41.3 | % | 47.4 | % | 44.3 | % | 41.6 | % | 42.1 | % | ||||||||||
|
Operating income (loss) from continuing operations
|
(434 | ) | 2,655 | 2,193 | 1,511 | (3,510 | ) | |||||||||||||
|
Net income (loss) from continuing operations
|
$ | (854 | ) | $ | 2,813 | $ | 1,170 | $ | 256 | $ | (4,588 | ) | ||||||||
|
Income (loss) from discontinued operations
|
$ | - | $ | - | $ | - | $ | 175 | $ | (276 | ) | |||||||||
|
Net Income (loss)
|
$ | (854 | ) | $ | 2,813 | $ | 1,170 | $ | 431 | $ | (4,864 | ) | ||||||||
|
Income (loss) per common share - basic:
|
||||||||||||||||||||
|
Income (loss) from continuing operations
|
$ | (0.04 | ) | $ | 0.13 | $ | 0.06 | $ | 0.01 | $ | (0.22 | ) | ||||||||
|
Income (loss) from discontinued operations
|
$ | - | $ | - | $ | - | $ | 0.01 | $ | (0.01 | ) | |||||||||
|
Net Income (loss) per common share
|
$ | (0.04 | ) | $ | 0.13 | $ | 0.06 | $ | 0.02 | $ | (0.23 | ) | ||||||||
|
Income (loss) per common share - diluted:
|
||||||||||||||||||||
|
Income (loss) from continuing operations
|
$ | (0.04 | ) | $ | 0.12 | $ | 0.06 | $ | 0.01 | $ | (0.22 | ) | ||||||||
|
Income (loss) from discontinued operations
|
$ | - | $ | - | $ | - | $ | 0.01 | $ | (0.01 | ) | |||||||||
|
Net Income (loss) per common share
|
$ | (0.04 | ) | $ | 0.12 | $ | 0.06 | $ | 0.02 | $ | (0.23 | ) | ||||||||
|
Weighted average common shares outstanding:
|
||||||||||||||||||||
|
Basic
|
21,980,369 | 21,654,554 | 20,973,924 | 20,988,348 | 20,996,013 | |||||||||||||||
|
Diluted
|
21,980,369 | 22,845,241 | 20,973,924 | 20,988,348 | 20,996,013 | |||||||||||||||
|
Summary Balance Sheet Data
|
||||||||||||||||||||
|
At December 31,
|
||||||||||||||||||||
| 2010 | 2009 | 2008 | 2007 | 2006 | ||||||||||||||||
|
(In thousands)
|
||||||||||||||||||||
|
Total current assets
|
$ | 4,048 | $ | 4,412 | $ | 3,466 | $ | 1,842 | $ | 2,797 | ||||||||||
|
Total assets
|
30,405 | 26,117 | 23,648 | 24,001 | 26,091 | |||||||||||||||
|
Total current liabilities
|
7,538 | 5,776 | 3,938 | 4,968 | 6,343 | |||||||||||||||
|
Total liabilities
|
14,461 | 9,551 | 10,184 | 11,866 | 14,462 | |||||||||||||||
|
Working Capital
|
(3,491 | ) | (1,364 | ) | (472 | ) | (3,127 | ) | (3,546 | ) | ||||||||||
|
Total stockholders' equity
|
15,944 | 16,566 | 13,464 | 12,134 | 11,629 | |||||||||||||||
|
Cash and cash equivalents
|
$ | 1,744 | $ | 2,008 | $ | 1,561 | $ | 540 | $ | 754 | ||||||||||
|
Resticted cash
|
- | 800 | - | - | - | |||||||||||||||
|
Total cash, cash equivalents and restricted cash
|
$ | 1,744 | $ | 2,808 | $ | 1,561 | $ | 540 | $ | 754 | ||||||||||
|
Short-term and long-term debt
|
$ | 9,857 | $ | 6,317 | $ | 7,381 | $ | 8,505 | $ | 10,070 | ||||||||||
|
Warrant valuation discounts
|
- | - | 307 | 473 | 639 | |||||||||||||||
|
Total debt
|
$ | 9,857 | $ | 6,317 | $ | 7,688 | $ | 8,978 | $ | 10,709 | ||||||||||
Page 30
|
ITEM 7.
|
MANAGEMENT'S DISCUSSION AND ANALYSIS OF FINANCIAL CONDITION AND RESULTS OF OPERATIONS
|
The following discussion should be read in conjunction with the consolidated financial statements and notes thereto.
In addition to historical information, this Annual Report on Form 10-K contains forward-looking statements that involve risks and uncertainties that could cause actual results to differ materially. Factors that might cause or contribute to such differences include, but are not limited to, those discussed below. You should carefully review the risks described in other documents we file from time to time with the SEC, including the Quarterly Reports on Form 10-Q to be filed in 2011. When used in this report, the words "expects," "anticipates," "intends," "plans," "believes," "seeks," "targets," "estimates," "looks for," "looks to," and similar expressions are generally intended to identify forward-looking statements. You should not place undue reliance on these forward-looking statements, which speak only as of the date of this Annual Report on Form 10-K. We undertake no obligation to publicly release any revisions to the forward-looking statements or reflect events or circumstances after the date of this document.
Overview
Global Axcess Corp, through its wholly owned subsidiaries, owns or leases, operates or manages Automated Teller Machines ("ATM"s) and DVD kiosks with locations primarily in the eastern and southwestern United States of America.
ATM Business Services
Our revenues are principally derived from two types of fees, which we charge for processing transactions on our ATM network. We receive an interchange fee from the issuer of the credit or debit card for processing a transaction when a cardholder uses an ATM in our network. In addition, in most cases we receive a surcharge/convenience fee from the cardholder when the cardholder makes a cash withdrawal from an ATM in our network.
Interchange fees are processing fees that are paid by the issuer of the credit or debit card used in a transaction. Interchange fees vary for cash withdrawals, balance inquiries, account transfers or uncompleted transactions, which are the primary types of transactions that are currently processed on ATMs in our network. The maximum amount of the interchange fees is established by the national and regional card organizations and credit card issuers with whom we have a relationship. We receive interchange fees for transactions on ATMs that we own, but sometimes we rebate a portion of the fee to the owner of the ATM location under the applicable lease for the ATM site. We also receive the interchange fee for transactions on ATMs owned by third party vendors included within our network, but we rebate all or a portion of each fee to the third party vendor based upon negotiations between us. The interchange fees received by us vary from network to network and, to some extent, from issuer to issuer, but generally range from $0.15 to $0.55 per cash withdrawal. Interchange fees for balance inquiries, account transfers and denied transactions are generally substantially less than fees for cash withdrawals. The interchange fees received by us from the card issuer are independent of the service fees charged by the card issuer to the cardholder in connection with ATM transactions. Service fees charged by card issuers to cardholders in connection with transactions through our network range from zero to $2.50 per transaction. We do not receive any portion of these service fees.
In most markets we impose a surcharge/convenience fee for cash withdrawals. Surcharge/convenience fees are a substantial additional source of revenue for us and other ATM network operators. The surcharge/convenience fee for most of the ATMs in our network ranges between $1.50 and $2.75 per withdrawal. The surcharge/convenience fee for other ATMs in our network ranges between $0.50 and $7.50 per withdrawal. We receive the full surcharge/convenience fee for cash withdrawal transactions on ATMs that we own, but often we rebate a portion of the fee to the owner of the ATM location under the applicable lease for the ATM site. We also receive the full surcharge/convenience fee for cash withdrawal transactions on ATMs owned by third party vendors included within our network, but we rebate all or a portion of each fee to the third party vendor based upon a variety of factors, including transaction volume and the party responsible for supplying vault cash to the ATM and only record earned revenues based upon the Company’s contracts with the third party vendors.
In addition to revenues derived from interchange and surcharge/convenience fees, we also derive revenues from providing network management services to third parties owning ATMs included in our ATM network. These services include 24 hour transaction processing, monitoring and notification of ATM status and cash condition, notification of ATM service interruptions, in some cases dispatch of field service personnel for necessary service calls and cash settlement and reporting services. The fees for these services are paid by the owners of the ATMs.
Page 31
Interchange fees are credited to us by networks and credit card issuers on a monthly basis and are paid to us in the following month between the 5th and 15th business day. Surcharge/convenience fees are charged to the cardholder and credited to us by networks and credit card issuers on a daily basis. We rebate the portion of these fees to ATM owners and owners of ATM locations as commission payments as per their contractual terms. Fees for network management services are generally paid to us on a monthly basis.
We compete in a fragmented industry, in which no one firm has a significant market share and can strongly influence the industry outcome. Our industry is populated by a large number of financial institutions and Independent Sales Organizations (“ISOs”) which deploy ATMs. Our industry is also characterized by essentially undifferentiated services.
There are underlying economic causes as to why our industry is fragmented. For example:
|
|
·
|
Low overall entry barriers;
|
|
|
·
|
Absence of national economies of scale;
|
|
|
·
|
Seasonal and geographic volume fluctuations;
|
|
|
·
|
The need for local presence in some market segments; and
|
|
|
·
|
The need for low overhead.
|
Additionally, our industry is showing increasing signs of being an industry in decline. Reasons for this market decline include:
|
|
·
|
Emergence of debit cards, “pay pass” machines and RFID as substitutes for cash in making purchases;
|
|
|
·
|
Increasing acceptance of debit cards by younger demographics; and
|
|
|
·
|
Market saturation of prime ATM locations in the United States.
|
Should the signs of industry decline come to fruition, it could negatively impact our results of operations by decreasing revenues and placing downward pressure on earnings. It could also make the availability of capital resources more difficult to obtain and could negatively impact our ability to more aggressively pay down debt, both of which could affect our results of operations.
The demand for our ATM services is primarily a function of population growth and new business creation to serve that population growth. In addition, opportunities exist:
|
|
·
|
As our competitors seek to exit the business;
|
|
|
·
|
As our competitors encounter financial and regulatory difficulties; and
|
|
|
·
|
As financial institutions seek to reduce their costs of managing an ATM channel during a period of decreasing ATM usage.
|
Opportunities may also exist to leverage our existing customer base by selling additional products and services to them.
DVD Business Services
Nationwide Ntertainment Services, Inc., a wholly owned subsidiary of the Company formed during fiscal 2009, is engaged in the business of operating a network of DVD rental kiosks. We offer self-service DVD rentals through kiosks where consumers can rent or purchase movies or games. Our current DVD kiosks are installed primarily at grocery stores. Our DVD kiosks, through our brand InstaFlix, serve as a mini video rental store and occupy an area of less than ten square feet. Consumers use a touch screen to select their DVD, swipe a valid credit or debit card, and rent movies or games in some kiosks. The process is designed to be fast, efficient and fully automated with no upfront or membership fees. Typically, the DVD rental price is a flat fee plus tax for one night and if the consumer chooses to keep the DVD for additional nights, they are automatically charged for the additional fee. We generate revenue primarily through fees charged to rent or purchase a DVD, and pay our retail partners a percentage of our revenue.
Page 32
Results of Operations
The following tables set forth certain consolidated statement of operations data as a percentage of revenues for the periods indicated. Percentages may not add due to rounding.
|
For the year ended
|
For the year ended
|
For the year ended
|
||||||||||
|
December 31, 2010
|
December 31, 2009
|
December 31, 2008
|
||||||||||
|
|
||||||||||||
|
Revenues
|
100.0 | % | 100.0 | % | 100.0 | % | ||||||
|
Cost of revenues
|
58.7 | % | 52.6 | % | 55.7 | % | ||||||
|
Gross profit
|
41.3 | % | 47.4 | % | 44.3 | % | ||||||
|
Depreciation expense
|
7.0 | % | 5.5 | % | 6.4 | % | ||||||
|
Amortization of intangible merchant contracts
|
3.8 | % | 3.7 | % | 3.5 | % | ||||||
|
Impairment of long-lived assets
|
2.1 | % | 0.0 | % | 0.0 | % | ||||||
|
Selling, general and administrative
|
29.3 | % | 25.3 | % | 23.9 | % | ||||||
|
Stock compensation expense
|
0.9 | % | 0.6 | % | 0.7 | % | ||||||
|
Total operating expenses
|
43.2 | % | 35.1 | % | 34.5 | % | ||||||
|
Operating income from operations
|
||||||||||||
|
before items shown below
|
(1.9 | )% | 12.3 | % | 9.8 | % | ||||||
|
Interest expense, net
|
(2.3 | )% | (3.0 | )% | (4.7 | )% | ||||||
|
Gain on disposal of assets
|
0.0 | % | 0.0 | % | 0.1 | % | ||||||
|
Loss on early extinguishment of debt
|
(0.4 | )% | (2.2 | )% | 0.0 | % | ||||||
|
Income tax benefit
|
0.9 | % | 5.9 | % | 0.0 | % | ||||||
|
Net income (loss)
|
(3.8 | )% | 13.1 | % | 5.3 | % | ||||||
|
EBITDA (1)
|
8.4 | % | 19.3 | % | 19.8 | % | ||||||
(1) See “—EBITDA” section in ”Comparison of Results of Operations for the Fiscal Years Ended December 31, 2010 and 2009”.
Comparison of Results of Operations for the Fiscal Years Ended December 31, 2010 and 2009
Revenues
Our revenues from operations increased 5.8% to $22,743,335 for the fiscal year ended December 31, 2010 ("fiscal 2010") from $21,494,867 for the fiscal year ended December 31, 2009 ("fiscal 2009"). This increase was mainly due to revenue derived from our DVD services business.
Revenue from our ATM services business was up slightly from fiscal 2009. We ended fiscal 2010 with 218 more ATMs than we ended fiscal 2009, however 140 of that increase was related to an acquisition we consummated in December 2010. ATM transactions increased 3% year over year. Even though we had more ATMs and more transactions year over year, we only showed a slight increase in ATM revenue year over year due to the reduced interchange fees we received since April 2010 (see “Recent Events” in Part I, Item I Business section of this filing.) For fiscal 2010, we earned approximately $320,000 less interchange fees than we earned in fiscal 2009.
Revenue from our DVD services business was up approximately $1.2 million from fiscal 2009. We deployed our first major client in the DVD services business during the summer of 2010 and the $1.2 million of revenue for fiscal 2010 was primarily earned from August through December. Revenues prior to deployment of major DVD client were approximately $140,000 for the period January 2010 through July 2010, compared to revenues of $1.1 million for the post deployment period of August 2010 through December 2010. Revenue for this client for fiscal 2010 was lower than expected due to operational issues with the DVD kiosks. The operational issues with the DVD kiosks were resolved, mostly during December 2010.
Page 33
Cost of Revenues
Our total cost of revenues from operations increased by approximately 18.0% to $13,355,741 in fiscal 2010 from $11,316,919 in fiscal 2009. Total cost of revenues as a percentage of revenues from operations was approximately 58.7% in fiscal 2010 and 52.6% in fiscal 2009.
The principal components of cost of revenues in the ATM services business are retailer, merchant and distributor commissions (or revenue share), cost of cash, cash replenishment, ATM vault cash insurance, field maintenance, transaction processing charges, telecommunication costs and equipment costs on related equipment sales. Cost of revenues in our ATM services business increased 2.3% in fiscal 2010 mainly due to increased ATM insurance fees, due to increased first line and second line maintenance costs and higher cash costs. In September 2010, we received notice of an increase in our ATM vault cash insurance costs due to alleged criminal activity at a Northeastern U.S. armored carrier. While we suffered no losses as a result of this crime, our vault cash insurance rates increased by approximately $14,000 per month beginning September 1, 2010. Our cost of cash and cash replenishment costs increased during fiscal 2010 from fiscal 2009 mainly due to the increased number of company-owned ATMs during 2010 as compared to 2009. We ended 2010 with approximately 285 more company-owned ATMs than we ended in 2009, and even though 140 of that increase was the result of the acquisition of the FMi portfolio (see Financial Footnote # 3 “Acquisition of Assets” for information regarding this acquisition), the remaining increase of 145 ATMs incurred additional cost of cash and cash replenishment expenses. First line and second line maintenance fees also increased due to the increase in company-owned ATMs as well as due to more aggressive billings by our ATM maintenance vendor.
The principal components of cost of revenues in the DVD services business are retailer and merchant commissions (or revenue share), amortization of our DVD library, DVD replenishment, field maintenance, credit card processing charges and telecommunication costs. During fiscal 2010, the company signed and deployed its first major client in the DVD services business, and as such, all costs during fiscal 2010 were substantially higher than the costs in the DVD services business for fiscal 2009. We incurred higher than anticipated cost of revenues due to operational issues with the kiosks. Specifically, with respect these types of higher-than-expected costs, the cost of revenues increased in field maintenance, telecommunication costs and DVD replenishment. The operational issues with the DVD kiosks were resolved, mostly during December 2010.
Gross Profit
Gross profit from operations as a percentage of revenues was approximately 41.3% in fiscal 2010 and approximately 47.4% in fiscal 2009. The decreased gross profit and gross profit percentage for the fiscal year ended December 31, 2010 versus the same period in 2009 was mainly attributable to the increased costs discussed above.
Gross profit in the ATM services business for fiscal 2010 was 45.2%, which is lower than the 47.4% gross profit for fiscal 2009. Even though gross profit was 45.2% for fiscal 2010, it was 43.8% and 42.4% during the third quarter and fourth quarter of 2010, respectively. The decrease in gross profit in the latter quarters of fiscal 2010 were attributable to the increased cost of revenues discussed above.
The DVD services business had negative gross margin during fiscal 2010 due to the low revenue and high costs as a result of the operational issues of the DVD kiosks.
Operating Expenses
Our total operating expenses from operations increased to $9,821,267, or approximately 43.2% of revenues, in fiscal 2010 from $7,522,912, or approximately 35.1% of revenues in fiscal 2009. The principal components of operating expenses are general and administrative expenses such as professional and legal fees, administrative salaries and benefits, consulting and audit fees, occupancy costs, sales and marketing expenses and administrative expenses. Operating expenses also include depreciation, amortization of intangible merchant contracts, impairment of long-lived assets and stock compensation expenses.
To aid in the understanding of our discussion and analysis of our operating expenses, the following table summarizes the amount and percentage change in the amounts from the previous year for certain operating expense line items:
Page 34
|
For the year ended
|
For the year ended
|
2009 to 2010
|
2009 to 2010
|
|||||||||||||
|
December 31, 2010
|
December 31, 2009
|
$ Change
|
% Change
|
|||||||||||||
|
|
||||||||||||||||
|
Depreciation expense
|
$ | 1,597,333 | $ | 1,178,927 | $ | 418,406 | 35.5 | % | ||||||||
|
Amortization of intangible merchant contracts
|
854,685 | 786,173 | 68,512 | 8.7 | % | |||||||||||
|
Impairment of long-lived assets
|
481,993 | - | 481,993 | 100.0 | % | |||||||||||
|
Selling, general and administrative
|
6,671,443 | 5,437,624 | 1,233,819 | 22.7 | % | |||||||||||
|
Stock compensation expense
|
215,813 | 120,188 | 95,625 | 79.6 | % | |||||||||||
|
Total operating expenses
|
$ | 9,821,267 | $ | 7,522,912 | $ | 2,298,355 | 30.6 | % | ||||||||
See explanation of operating expenses below:
Depreciation Expense
Depreciation expense increased in fiscal 2010 to $1,597,333 from $1,178,927 in fiscal 2009. This increase in depreciation expense was mainly due to depreciation expenses relating to our DVD services business. We ended fiscal 2010 with approximately 350 installed DVD kiosks as compared to approximately 30 DVD kiosks in fiscal 2009.
Depreciation expense in the ATM services business slightly increased in fiscal 2010 as compared to fiscal 2009, increasing from $1.9 million in fiscal 2009 to $2.0 million in fiscal 2010.
Depreciation expense in the DVD services business increased from approximately $20,000 in fiscal 2009 to approximately $418,000 in fiscal 2010.
Amortization of Intangible Merchant Contracts
Amortization of intangible merchant contracts increased in fiscal 2010 to $854,685 from $786,173 in fiscal 2009. The increase in amortization expense was mainly due to the additional amortization from the capitalized merchant contracts relating to newly acquired business in fiscal 2010.
See Financial Statement Footnotes #2 “Summary of Significant Accounting Policies” and #8 “Intangible Assets and Merchant Contracts,” regarding the amortization of intangible merchant contracts.
Impairment of Long-Lived assets
During fiscal 2010, we incurred impairment of long-lived assets charges of $481,993. See Financial Statement Footnotes #24 “Impairment of Long-Lived Assets” regarding the details of these charges.
Selling, General and Administrative (SG&A) Expenses
Our total SG&A expenses from operations increased to $6,671,443 in fiscal 2010 from $5,437,624 in fiscal 2009. SG&A expenses represented 29.3% of revenues for the year ended December 31, 2010 compared to 25.3% of revenues for the year ended December 31, 2009. The increase in SG&A expenses was mainly due to approximately $917,000 of SG&A expenses incurred in connection with our DVD rental kiosk initiative. Such DVD-related expenses included the costs of hired consultants and employees with industry expertise to spearhead our efforts in this line of business, travel expenses and other typical SG&A expenses such as marketing, professional fees, shipping, etc.
Due to operational issues with the DVD kiosks, we incurred additional SG&A expenses during fiscal 2010 than we would have incurred had we not had the operational issues. These operational issues caused increased expenses for temporary help in monitoring our DVD kiosks, increased temporary consumer support personnel to field calls from our DVD customers, increased consulting expenses, increased costs associated with our data center operator as we incurred additional managed services and increased back-end and other Information Technology expenses to resolve the operational issues. The operational issues with the DVD kiosks were resolved, mostly during December 2010.
Page 35
Also contributing to the increase in SG&A expenses year over year are investor relations expenses, expenses relating to the hiring of an investment banking firm to evaluate possible merger and acquisitions, increases in headcount-related expenses and increased state sales taxes.
Stock Compensation Expense
In fiscal 2010, we recorded stock compensation expenses of $215,813 mainly relating to executive and director stock option grants (see Financial Footnote #2 “Summary of Significant Accounting Policies” and # 20 “Stock Options and Warrants”) during fiscal years 2007, 2008, 2009 and 2010. During the fiscal year ended December 31, 2009 we recorded stock compensation expenses of $120,188.
Interest Expense
Interest expense decreased to $522,083, or 2.3% of revenues, for the fiscal year ended December 31, 2010 compared to $645,758, or 3.0% of revenues, in fiscal 2009. The decrease was partly due to the reduced interest rates on senior lenders’ debt as a result of the refinancing of debt on June 18, 2010. See Financial Footnote #12 “Senior Lenders’ Notes Payable” regarding the details of the June 18, 2010 financing. During the fiscal period ended December 31, 2009, we recorded a reduction of interest expense of $7,921 relating to the change in fair value of an interest rate swap agreement we entered into with our former senior lender. The interest rate swap had not been designated as a hedging instrument and our policy is to record the change in fair value as an increase or decrease to interest expense in our consolidated statements of income.
|
For the year ended
|
For the year ended
|
|||||||
|
December 31, 2010
|
December 31, 2009
|
|||||||
|
|
|
|||||||
|
Interest expense, net
|
$ | 522,083 | $ | 595,692 | ||||
|
Accretion of discount on notes payable
|
- | 50,066 | ||||||
|
Total interest expense, net
|
$ | 522,083 | $ | 645,758 | ||||
Loss on Early Extinguishment of Debt
During fiscal 2010 and fiscal 2009, we recorded expenses of $102,146 and $474,960, respectively, relating to the payoff of debt balances with a senior lender and notes payable. See Financial Footnote #23 “Loss on Early Extinguishment of Debt” for detail of these charges.
Income Tax Benefit
Income tax benefit was $204,334 for fiscal year 2010 and $1,278,888 for 2009. The income tax benefit was $204,334 for 2010 due to additional deferred tax assets recognized from the increase of net operating loss and the difference in expensing impairment of fixed assets between GAAP accounting and tax accounting. The income tax benefit of $1,278,888 for fiscal year 2009 was due to the reversal of a portion of the valuation allowance as the Company expected to utilize the net operating losses against future taxable income. At December 31, 2010, the Company has a Net Operating Loss (“NOL”) carryforward of approximately $23.6 million available. The NOL is due to expire during fiscal years 2011-2029.
As of December 31, 2010, 2009 and 2008, the Company’s gross deferred tax assets are reduced by a valuation allowance of $2,709,680, $2,709,680 and $3,798,830, respectively, due to negative evidence, primarily previous years operating losses, indicating that a valuation allowance is required under GAAP. In assessing the realizability of the deferred tax assets, management considers whether it is more likely than not, that some portion or all of the deferred tax assets will not be realized. The valuation allowance at December 31, 2010 is related to deferred tax assets arising from net operating loss carryforwards. Management believes that based upon its projection of future taxable income for the foreseeable future, it is more likely than not that the Company will not be able to realize the full benefit of the net operating loss carryforwards before they expire due to the amortization and depreciation losses from the projected acquisition assets. During 2009, the Company reduced the valuation allowance related to the remaining deferred tax assets by approximately $1,100,000. This reduction reflects the Company’s expectation that it is more than likely than not that it will generate future taxable income to utilize this amount of net deferred tax assets. While management’s projection of future taxable income for the foreseeable future does not provide sufficient positive evidence that the entire balance of valuation allowance should be eliminated (as previously mentioned), management does believe it is more likely than not this $1,100,000 reduction in valuation allowance is substantiated by its projection of future taxable income. The benefit from this reduction was recorded as income tax benefit in the accompanying statement of income.
Page 36
Net Income (loss)
We had a net loss of $853,568 during the fiscal year ended December 31, 2010 compared to net income of $2,813,206 for the fiscal year ended December 31, 2009.
EBITDA
EBITDA (a non-GAAP measure) is defined as earnings before net interest, taxes, depreciation and amortization. EBITDA has some inherent limitations in measuring operating performance due to the exclusion of certain financial elements such as depreciation and is not necessarily comparable to other similarly titled captions of other companies due to potential inconsistencies in the method of calculation. Furthermore, EBITDA is not intended to be a substitute for cash flows from operating activities, as a measure of liquidity, or an alternative to net income in determining our operating performance in accordance with accounting principles generally accepted in the United States of America. Our use of EBITDA should be considered within the following context:
|
|
·
|
We acknowledge that our depreciable assets are necessary to earn revenue based on our current business.
|
|
|
·
|
Our use of EBITDA as a measure of operating performance is not based on our belief about the reasonableness of excluding depreciation when measuring financial performance.
|
|
|
·
|
Our use of EBITDA is supported by the importance of EBITDA to the following key stakeholders:
|
|
|
·
|
Analysts — who estimate our projected EBITDA and other EBITDA-based metrics in their independently developed financial models for investors;
|
|
|
·
|
Creditors — who evaluate our operating performance based on compliance with certain EBITDA-based debt covenants;
|
|
|
·
|
Investment Bankers — who use EBITDA and other EBITDA-based metrics in their written evaluations and comparisons of companies within our industry; and
|
|
|
·
|
Board of Directors and Executive Management — who use EBITDA as an essential metric for evaluating management performance relative to our operating budget and bank covenant compliance, as well as our ability to service debt and raise capital for growth opportunities which are a critical component to our strategy.
|
The following table sets forth a reconciliation of net income from operations to EBITDA for each period included herein:
|
For the Twelve Months Ended
|
||||||||||||
|
December 31, 2010
|
December 31, 2009
|
December 31, 2008
|
||||||||||
|
|
|
|||||||||||
|
Net income (loss) from operations
|
$ | (853,568 | ) | $ | 2,813,206 | $ | 1,170,237 | |||||
|
Income tax benefit
|
(204,334 | ) | (1,278,888 | ) | - | |||||||
|
Interest expense, net
|
522,083 | 645,758 | 1,046,287 | |||||||||
|
Depreciation expense
|
1,597,333 | 1,178,927 | 1,411,360 | |||||||||
|
Amortization of intangible merchant contracts
|
854,685 | 786,173 | 770,270 | |||||||||
|
EBITDA from operations
|
$ | 1,916,199 | $ | 4,145,176 | $ | 4,398,154 | ||||||
Our EBITDA from operations decreased to $1,916,199 for fiscal 2010 from $4,145,176 for fiscal 2009. EBITDA from operations as a percentage of revenues decreased to 8.4% for fiscal 2010 from 19.3% for fiscal 2009. The decrease in EBITDA from operations was primarily due to the $1,720,738 negative EBITDA contributed by our DVD services business for fiscal 2010. See Financial Footnote #19 “Business Segment Information” for financial details of our DVD services business segment.
Page 37
The following table sets forth a reconciliation of net income from operations to “Adjusted EBITDA” from operations. Adjusted EBITDA is defined as earnings before net interest, taxes, depreciation, amortization, stock compensation expense, impairment of long-lived assets and loss on early extinguishment of debt for each period included herein:
|
For the Twelve Months Ended
|
||||||||||||
|
December 31, 2010
|
December 31, 2009
|
December 31, 2008
|
||||||||||
|
|
|
|||||||||||
|
Net income (loss) from operations
|
$ | (853,568 | ) | $ | 2,813,206 | $ | 1,170,237 | |||||
|
Income tax benefit
|
(204,334 | ) | (1,278,888 | ) | - | |||||||
|
Interest expense, net
|
522,083 | 645,758 | 1,046,287 | |||||||||
|
Depreciation expense
|
1,597,333 | 1,178,927 | 1,411,360 | |||||||||
|
Amortization of intangible merchant contracts
|
854,685 | 786,173 | 770,270 | |||||||||
|
Impairment of long-lived assets
|
481,993 | - | - | |||||||||
|
Stock compensation expense
|
215,813 | 120,188 | 159,840 | |||||||||
|
Loss on early extinguishment of debt
|
102,146 | 474,960 | - | |||||||||
|
Adjusted EBITDA from operations
|
$ | 2,716,151 | $ | 4,740,324 | $ | 4,557,994 | ||||||
Our Adjusted EBITDA from operations decreased to $2,716,151 for fiscal 2010 from $4,740,324 for fiscal 2009. Adjusted EBITDA from operations as a percentage of revenues decreased to 11.9% for fiscal 2010 from 22.1% for fiscal 2009.
LIQUIDITY AND CAPITAL RESOURCES
Financial Condition
|
For the year ended
|
For the year ended
|
2009 to 2010
|
2009 to 2010
|
|||||||||||||
|
December 31, 2010
|
December 31, 2009
|
$ Change
|
% Change
|
|||||||||||||
|
|
||||||||||||||||
|
Net cash provided by operating activities
|
$ | 2,428,122 | $ | 4,444,097 | $ | (2,015,975 | ) | (45.4 | )% | |||||||
|
Net cash used in investing activities
|
(6,612,680 | ) | (1,172,154 | ) | (5,440,526 | ) | 464.1 | % | ||||||||
|
Net cash provided by (used in) financing activities
|
3,920,260 | (2,824,993 | ) | 6,745,253 | (238.8 | )% | ||||||||||
|
Increase (decrease) in cash
|
$ | (264,298 | ) | $ | 446,950 | $ | (711,248 | ) | ||||||||
Operating Activities
During fiscal 2010, we funded our operations through operating activities. Net cash provided by continuing operating activities amounted to $2,428,122 as compared to $4,444,097during fiscal 2009, a decrease of 45.4%. The decrease in cash provided by operating activities was primarily due to the operating loss of $433,673 in fiscal 2010 versus operating income of $2,655,036 in fiscal 2009, less the increase in accounts payable and accrued liabilities of $1,476,254 from fiscal 2009.
Investing Activities
Net cash used in investing activities from operations for fiscal 2010 was $6,612,680. The increase from the $1,172,154 used for fiscal 2009 was due mainly for net purchases of DVD rental kiosks and ATMs as well as cash used in an acquisition of an ATM portfolio.
Financing Activities
Net cash provided by financing activities was $3,920,260 due to drawdowns from the Loan Agreement (discussed in Financial Footnote #12 “Senior Lenders’ Notes Payable,”) offset by paying back senior lender notes and capital leases during fiscal 2010. This compared to funds used in financing activities of $2,824,993 for fiscal 2009. During the fiscal period ended December 31, 2010, we deposited $800,000 into our cash account from a restricted cash deposit account pursuant to the previous Credit Agreement with SunTrust Bank.
Page 38
Working Capital
As of December 31, 2010, the Company had current assets of $ 4,047,601 and current liabilities of $7,538,457, which results in negative working capital of $3,490,856. This compares to a working capital deficit of $1,364,074 that existed at December 31, 2009. Despite the negative working capital, we believe that if we achieve our 2011 business plan, we will have sufficient working capital to meet our current obligations during 2011. Our business plan calls for the Company to achieve sufficient revenue, margin, EBITDA (earnings before interest, taxes, depreciation and amortization) and positive cash flows to meet our current and future obligations. Achieving that business plan is contingent upon being successful in securing new profitable ATM and DVD clients as well as maintaining profitability on existing ATM locations and achieving profitability on existing DVD locations. If that business plan is achieved, the Company will have sufficient working capital to meet our 2011 obligations. If our business plan is not achieved, the Company may need to raise additional funds through debt or equity offerings. There can be no assurance as to the availability of any needed funding and, if available, that the source of funds would be available on terms and conditions acceptable to management.
Additional Funding Sources
We currently have bank lines available for our short-term growth needs. We estimate the Company will be required to draw down approximately $900,000 on its existing bank lease financing to fund new purchases of ATMs; will be required to draw down approximately $3,100,000 on its existing bank lease financing to fund new purchases DVD kiosks and will be required to draw down approximately $400,000 on its existing bank lease financing to fund new purchases of back office equipment.
Our business plan for our DVD business is capital intensive. Equipment costs for DVD kiosks are much higher than the equipment costs for ATMs. If we achieve our business plan in the DVD business and as we sign new clients, we will need capital resources in order to purchase the kiosk equipment. On June 18, 2010, we entered into a Loan and Security Agreement with Fifth Third Bank which is intended to provide capital resources for growth in both our DVD business and ATM business. If we cannot raise adequate financing to satisfy our capital requirements, we may have to limit, delay, scale-back or eliminate future growth, which could negatively affect our results of operations.
The Company does not use its own funds for vault cash, but rather relies upon third party sources. The Company in general rents the vault cash from financial institutions and pays a negotiated interest rate for the use of the money. The vault cash is never in the possession of, controlled or directed by the Company, but rather cycles from the bank to the armored car carrier and to the ATM. Each day’s withdrawals are settled back to the owner of the vault cash on the next business day. Both Nationwide and its customers (the merchants) sign a document stating that the vault cash belongs to the financial institution and that neither party has any legal rights to the funds. The required vault cash is obtained under the following arrangements:
|
|
·
|
Wilmington Savings Fund Society. Beginning in September 2004, the Company has an arrangement with Wilmington Savings Fund Society allowing us to obtain up to $20,000,000 in vault cash. The WSFS contract may be terminated by WSFS at any time upon breach by us and upon the occurrence of certain other events. Under this arrangement, we are required to pay a monthly service fee on the outstanding amount equal to the prime rate of interest, plus a specified percentage, and must pay monthly "bank" and insurance fees. We are also required to maintain insurance on the vault cash. The contract currently in place with WSFS expires on October 31, 2011, with a one year automatic renewal period unless one party gives 60 days notice of their intention not to renew. As of December 31, 2010, the Company had 6 ATMs funded by WSFS with a vault cash outstanding balance of approximately $138,000 in connection with this arrangement.
|
|
|
·
|
Elan (formerly GenPass Technologies). On November 24, 2006, we signed a Cash Provisioning Agreement with Elan allowing us to obtain up to $30,000,000 in vault cash. The Elan contract may be terminated by Elan at any time upon breach by us and upon the occurrence of certain other events. Under this arrangement, we are required to pay a monthly service fee on the average terminal balance plus a load factor. In addition, we are required to maintain insurance on the vault cash. The contract currently in place with Elan expires on August 11, 2011, with a one year automatic renewal period unless one party gives 180 days notice of their intention not to renew. As of December 31, 2010, the Company had 1,550 ATMs funded by Elan with a vault cash outstanding balance of about approximately $36,658,000.
|
Page 39
|
|
·
|
Various Branded Cash Partners. Nationwide has partnered with numerous banks and credit unions to market specific Nationwide ATMs to the cardholders of these institutions. We add signage and marketing material to the ATM so that the ATM is easily identified as being associated with the bank or credit union, and the cardholders of these institutions receive surcharge free transactions at the designated ATMs. This provides the bank or credit union additional marketing power and another point of access to funds for their cardholders. In return for this benefit, the bank or credit union, provide and manage the vault cash in the specified ATM(s), as well as provide and pay for cash replenishment and first line maintenance. The advantage to Nationwide is that this reduces the costs associated with vault cash, cash replenishment and first line maintenance by approximately 50%. Another advantage is that with a branded ATM, transactions volumes traditionally increase more than at non-branded ATMs. As of December 31, 2010, Nationwide had 45 branded financial partners, which funded 438 ATMs.
|
Contractual Obligations
Our ability to fund our capital needs is also impacted by our overall capacity to acquire favorable financing terms in our acquisition of ATMs. Our contractual obligations, including commitments for future payments under non-cancelable lease arrangements and short and long-term debt arrangements, are summarized below and are fully disclosed in Financial Footnotes #10 “Notes Payable – Related Parties”, #12 “Senior Lenders’ Notes Payable,” #13 “Capital Lease Obligations” and #14 “Commitments and Contingencies” to our consolidated financial statements. We do not participate in, nor secure financings for, any unconsolidated, limited or special purpose entities.
We have previously leased our ATMs and other equipment through capital lease agreements that expire in 2013 and provide for lease payments at interest rates averaging approximately 10.04% per annum. In 2010, we acquired $434,792 of new lease financing for ATMs and other equipment. See Financial Footnote #13 “Capital Lease Obligations” to our consolidated financial statements. We have the following payment obligations under current financing and leasing arrangements:
|
Total
|
Less than 1 year
|
1-2 Years
|
2-9 Years
|
|||||||||||||
|
Notes payable- related parties (*)
|
$ | 82,750 | $ | 36,000 | $ | 36,000 | $ | 10,750 | ||||||||
|
Notes payable (*)
|
85,324 | 27,601 | 27,601 | 30,122 | ||||||||||||
|
Senior lender notes (*)
|
9,977,818 | 2,864,934 | 3,447,353 | 3,665,531 | ||||||||||||
|
Capital lease obligations (*)
|
699,568 | 490,348 | 179,477 | 29,743 | ||||||||||||
|
Operating leases
|
246,294 | 135,314 | 87,105 | 23,875 | ||||||||||||
|
Total contractual cash obligations
|
$ | 11,091,754 | $ | 3,554,197 | $ | 3,777,536 | $ | 3,760,021 | ||||||||
(*) Includes interest in future periods
Critical Accounting Policies
The preparation of financial statements and related disclosures in conformity with accounting principles generally accepted in the United States of America requires management to make judgments, assumptions and estimates that affect the amounts reported in our consolidated financial statements and accompanying notes. We base our estimates and judgments on historical experience and various other assumptions that we believe are reasonable under the circumstances. However, future events are subject to change, and the best estimates and judgments routinely require adjustment. The amounts of assets and liabilities reported in our consolidated balance sheet, and the amounts of revenues and expenses reported for each of our fiscal periods, are affected by estimates and assumptions that are used for, but not limited to, the accounting for allowance for doubtful accounts, depreciation and amortization, fixed assets, goodwill and intangible asset impairments, stock-based compensation and income taxes. Actual results could differ from these estimates. The following critical accounting policies are significantly affected by judgments, assumptions and estimates used in the preparation of our consolidated financial statements.
Revenue Recognition Policies
We recognize revenues as ATM card holders use ATMs or as services are rendered to customers. Revenues are adjusted with positive and negative processing accruals occurring in the operation of the Company's ATM network in the ordinary course of business. It is our policy to book as revenue all surcharge and interchange fees we receive and have earned based on contracts, whether for company-owned ATMs or for those we manage. In the case of managed ATMs, the Company then books as commission expense all monies paid to the owners of the ATMs. Surcharge/convenience fees are fees assessed directly to the consumer utilizing the ATM terminals owned by the Company. The surcharge/convenience fees assessed mostly range from $1.50 to $2.95 based upon a cash withdrawal transaction from the ATM terminals.
Page 40
Interchange fees are fees assessed directly to the card issuer of the consumer. The interchange fees are comprised of two fees: (1) an interchange fee ranging from approximately $0.40 to $0.55 based upon each cash withdrawal transaction; and (2) an interchange fee ranging from approximately $0.15 to $0.25 based upon an account inquiry by the consumer.
Management fees are charged and recognized monthly to various companies or individuals that use the services of Nationwide to operate their ATMs. These fees are for services such as cash management, project management and account management.
The Company recognizes revenues on breached contracts when cash is received.
Revenue from movie DVD rentals is recognized ratably over the term of a consumer's rental transaction. Revenue from a direct sale out of the kiosk of previously rented movies is recognized at the time of sale. On rental transactions for which the related movies have not yet been returned to the kiosk at month-end, revenue is recognized with a corresponding receivable recorded in the balance sheet. We record revenue, net of refunds and applicable sales taxes collected from consumers.
Allowance of Uncollectible Accounts Receivable
Accounts receivable have been reduced by an allowance for amounts that may become uncollectible in the future. This estimated allowance is based on historical experience, credit evaluations, specific customer collection issues and the length of time a receivable is past due. The Company records an allowance for doubtful accounts for any billed invoice aged past 60 days. When the Company deems the receivable to be uncollectible, the Company charges the receivable against the allowance for doubtful accounts.
Fixed assets
ATM, DVD kiosks and computer equipment comprises a significant portion of our total assets. Changes in technology or changes in our intended use of these assets may cause the estimated period of use or the value of these assets to change. We perform annual internal studies to confirm the appropriateness of estimated economic useful lives for each category of current equipment. Estimates and assumptions used in setting depreciable lives require significant judgment.
Stock-based compensation
The Company uses fair value recognition provisions of GAAP which requires that all stock based compensation be recognized as an expense in the financial statements and that such cost be measured at the fair value of the award. The stock based compensation expense is included in operating expenses in the consolidated statements of income.
Impairment of Long-Lived Assets
The Company reviews long-lived assets for impairment under GAAP. Long-lived assets to be held and used are reviewed for impairment whenever events or changes in circumstances indicate that the carrying amount of an asset may not be recoverable. The carrying amount of a long-lived asset is not recoverable if it exceeds the estimated sum of the undiscounted cash flows expected to result from the use and eventual disposition of the asset. Long-lived assets to be disposed of are reported at the lower of carrying amount or fair value less cost to sell.
Deferred Income Tax Assets
The Company had net deferred tax assets of approximately $1,974,490 at December 31, 2010. Deferred tax assets and liabilities are recognized for the future tax consequences attributable to differences between financial statement carrying amounts of existing assets and liabilities and their respective tax bases. Deferred tax assets and liabilities are measured using enacted tax rates expected to be applied to taxable income in the years in which those temporary differences are expected to be recovered or settled.
The ultimate realization of the deferred income tax assets are primarily dependent on generating sufficient future taxable income or being able to carryback any taxable losses and claim refunds against previously paid income taxes. Even though the Company incurred a loss in fiscal 2010, it had taxable income for the last three years and believes that based upon its business plan, a portion of its net deferred income tax assets at December 31, 2010, are realizable. If future operating results generate taxable losses, it may be necessary to increase valuation allowances to reduce the amount of the deferred income tax assets to realizable value.
Page 41
Recent Accounting Pronouncements
See Financial Footnotes #2 “Summary of Significant Accounting Policies” regarding the impact of recently issued accounting pronouncements.
|
ITEM 7A.
|
QUANTITATIVE AND QUALITATIVE DISCLOSURES ABOUT MARKET RISK
|
Impact of Inflation and Changing Prices. Our results of operations were impacted by decreasing interest rates as noted below:
Increases in interest rates will increase our cost of cash expenses. We have vault cash agreements with various financial institutions that supply cash to our ATMs for fees based on variable interest rates. Vault cash obtained under these programs remains the property of the financial institution and, as such, is not reflected on our consolidated balance sheets. During 2010, amounts we accessed each month ranged from $28 million to $40 million and we paid cash fees for the fiscal year totaling approximately $716 thousand for use of the cash. During 2009, amounts we accessed each month ranged from $23.0 million to $28.0 million and we paid cash fees totaling approximately $515 thousand for use of the cash. Such fees are related to the bank’s interest rates. If such rates were to increase by 100 basis points, our gross profit would decline by approximately $280,000 to $400,000 on a pre-tax basis.
Interest Rate Impact. We paid an average interest rate of approximately 2.01% for our vault cash fees in fiscal 2010 compared to an average interest rate of 2.04% in fiscal 2009.
Page 42
|
ITEM 8.
|
FINANCIAL STATEMENTS AND SUPPLEMENTARY DATA
|
Our consolidated financial statements required by this item are incorporated herein by reference to the consolidated financial statements beginning on Page F-1 immediately following the signature page.
|
|
ITEM 9.
|
CHANGES IN AND DISAGREEMENTS WITH ACCOUNTANTS ON ACCOUNTING AND FINANCIAL DISCLOSURE
|
None.
|
ITEM 9A.
|
CONTROLS AND PROCEDURES
|
Evaluation of Disclosure Controls and Procedures
As required by Rule 13a-15 under the Exchange Act, as of the end of the period covered by this report, we have carried out an evaluation of the effectiveness of the design and operation of our Company’s disclosure controls and procedures. Under the direction of our Chief Executive Officer and Chief Financial Officer, we evaluated our disclosure controls and procedures and internal control over financial reporting and concluded that our disclosure controls and procedures were effective as of December 31, 2010.
Disclosure controls and procedures and other procedures are designed to ensure that information required to be disclosed in our reports or submitted under the Securities Exchange Act of 1934 is recorded, processed, summarized and reported within the time period specified in the Securities and Exchange Commission’s rules and forms. Disclosure controls and procedures include, without limitation, controls and procedures designed to ensure that information required to be disclosed in our reports filed under the Securities Exchange Act of 1934 is accumulated and communicated to management, including our principal executive and principal financial officers, as appropriate to allow timely decisions regarding required disclosure.
Management’s Responsibility for Financial Statements
Our management is responsible for the integrity and objectivity of all information presented in this Annual Report on Form 10-K. The consolidated financial statements were prepared in conformity with accounting principles generally accepted in the United States of America and include amounts based on management’s best estimates and judgments. Management believes the consolidated financial statements fairly reflect the form and substance of transactions and that the financial statements fairly represent the Company’s financial position and results of operations.
The Audit Committee of the Board of Directors, which is composed solely of independent directors, meets regularly with the Company’s independent registered public accounting firm and representatives of management to review accounting, financial reporting, internal control and audit matters, as well as the nature and extent of the audit effort. The Audit Committee is responsible for the engagement of the independent registered public accounting firm. The independent registered public accounting firm has free access to the Audit Committee.
Management’s Report on Internal Control Over Financial Reporting
The Company’s management is responsible for establishing and maintaining adequate internal control over financial reporting, as such term is defined in Exchange Act Rule 13a-15(f). The Company’s management, including its principal executive officer and principal financial officer, conducted an evaluation of the effectiveness of its internal control over financial reporting based on the framework in “Internal Control—Integrated Framework” issued by the Committee of Sponsoring Organizations of the Treadway Commission. The scope of management’s assessment of the effectiveness of internal control over financial reporting includes all of our businesses. Based on its evaluation under the framework in “Internal Control—Integrated Framework,” the Company’s management concluded that the Company’s internal control over financial reporting was effective as of December 31, 2010.
All internal control systems, no matter how well designed, have inherent limitations. Therefore, even those systems determined to be effective can provide only reasonable assurance with respect to financial statement preparation and presentation. Also, projections of any evaluation of effectiveness to future periods are subject to the risk that controls may become inadequate because of changes in conditions.
Page 43
This annual report does not include an attestation report of the Company's registered public accounting firm regarding internal control over financial reporting. Management's report was not subject to attestation by the Company's registered public accounting firm pursuant to rules of the SEC that permit the Company to provide only management's report in this annual report.
Changes in Internal Control Over Financial Reporting
There were no changes during the quarter ended December 31, 2010 in our internal control over financial reporting or in other factors that materially affected, or are reasonably likely to materially affect, our internal controls over financial reporting.
|
ITEM 9B.
|
OTHER INFORMATION
|
None.
PART III
|
ITEM 10.
|
DIRECTORS, EXECUTIVE OFFICERS AND CORPORATE GOVERNANCE
|
The Company's executive officers, directors and key employees and their ages and positions as of December 31, 2010 are as follows:
|
Name
|
Age
|
Positions
|
||
|
Marc Caramuta
|
45
|
Chief Operating Office
|
||
|
William Costa
|
49
|
Chief Information Office
|
||
|
Michael L. Connolly
|
54
|
Director
|
||
|
Walter A. Howell
|
60
|
Director
|
||
|
Lock Ireland
|
67
|
Vice Chairman, Director
|
||
|
Sharon Jackson
|
53
|
Secretary
|
||
|
Robert Landis
|
51
|
Director
|
||
|
Michael J. Loiacono
|
44
|
Chief Financial Officer, Chief Accounting Officer
|
||
|
Joseph M. Loughry, III
|
65
|
Chairman, Director
|
||
|
George A. McQuain
|
55
|
President, CEO and Director
|
||
|
Alan Rossiter
|
|
65
|
|
Director
|
The following is a brief description of each officer and director listed above:
Marc Caramuta, Chief Operating Officer
Mr. Caramuta is experienced in the financial industry and has over 10 years experience in international manufacturing. He previously served as President of Proficio Mortgage Ventures, LLC, a wholly owned subsidiary of Proficio Bank, from February, 2010 to his appointment as Chief Operating Officer of the Company. In this position, he was responsible for managing all facets of operations and production. Prior to and concurrently with that position, he held the position of Chief Information Officer/Chief Information Security Officer at Proficio Bank – Proficio Mortgage from August, 2009 to June 2010. He also held the position of Manager of Corporate and Operational Projects at Proficio Mortgage Ventures, LLC from October, 2008 to August, 2009. Prior to working with the Proficio group, Mr. Caramuta served as a consultant to JP Morgan Chase and Macquarie Mortgages from February, 2008 to October, 2008, and a Risk Manager for Icon Residential Capital from June, 2007 to November, 2007. He is a graduate of Franklin & Marshall College with a degree in Business Administration and Spanish language.
William Costa, Chief Information Officer
Mr. Costa brings more than 27 years of experience in the Information Technology field spanning several industries. Prior to joining Global Axcess, Mr. Costa served as an Assistant to the Chief Information Officer for the City of Jacksonville. In this position, he was responsible for all systems architecture, data center operations supporting over 500 mission critical servers, and service desk and desktop support for over 7000 users. Before the City of Jacksonville, Mr. Costa served as a CIO with Compcare, Integra Health, Craig Insurance Services, and Financial Insurance Management Corporation. Mr. Costa joined Global Axcess in August, 2010, and he is responsible for all strategic and operational aspects of the Technology Infrastructure supporting Corporate operations as well as our self service kiosk products. He is a graduate of Rutgers University with a degree in Information Technology and Business Administration.
Page 44
Michael I. Connolly, Director
Mr. Connolly is the founder and currently the Chief Executive Officer of Mount Juliet Ventures. He has served in this capacity since 1990. Mount Juliet Ventures is a private company dedicated to helping management and owners of companies to create shareholder value. Mr. Connolly has helped to create value for several private and public national companies including Blockbuster, Jamba Juice, Great Clips for Hair, Chilis, Supercuts, SoftBrands, ElderLife, BuyerZone, Insignia Systems, ElderCarelink, and The Hotel Donaldson. Mr. Connolly was also founder and President of the Tax and Business Services Division at American Express, Inc. from 1984-1989, as well as Chief Operating Officer of Trammell Crow Company’s North Central Region from 1989-1990, one of the nation’s leading developers and investors in real estate. Mr. Connolly also serves on the board of directors of Table Trac, Inc., a publically traded company engaged in the provision of technology related to the operation and management of casino game tables, a role he has filled since 2010. Mr. Connolly holds a BA in History from Pomona College and an MBA with honors from the Harvard Business School. As a member of our board of directors, Mr. Connolly brings extensive experience in working with a variety of financial and managerial issues that face public companies of different sizes including capitalization, leadership development, profit optimization tactics and exit strategies. Mr. Connolly joined us as a director in December 2010 and his current term expires on the date of the next shareholder meeting. On February 28, 2011, Mr. Connolly was appointed Interim Co-Chief Executive Officer of the Company.
Walter A. Howell, Director
Mr. Howell is currently Senior Vice President, Americas Business Development for CSC (formerly Computer Sciences Corporation), a leading technology services company. Previously, he spent 15 years as an executive in the technology industry focused on financial services with CA (formerly Computer Associates), IBM and American Management Systems and 20 years in commercial banking with Riggs Bank NA. Mr. Howell originally joined the Company as a director in September 2007 and his current term expires on the date of the next shareholder meeting.
Lock Ireland, Vice Chairman, Director
Mr. Ireland is the recent past Chairman of the Board for Proficio Bank Chartered in Utah of which he was a founding Director in 2005. Prior to this he was the President and CEO for Resource Corporate Management, Inc. (RCMI) from 1994 to 2002, until which time he sold the company. RCMI was a company that promoted new products and services with community banks via the Bankers' Banks across the United States. Mr. Ireland has held numerous positions from COO to CEO and/or Chairman of the Board with the following Banks: Bankers Trust of South Carolina, 1st Performance Bank, Republic National Bank and Resource Bancshares. His current affiliations include being a Board Member of the Jacksonville Economic Company and previous Board Governor for the Jacksonville Chamber of Commerce. Mr. Ireland brings many affiliations and much experience in the banking and financial industries to the Company. Mr. Ireland originally joined the Company as a director in July 2003 and his current term expires on the date of the next shareholder meeting. On February 28, 2011, Mr. Ireland was appointed Interim Co-Chief Executive Officer of the Company.
Sharon Jackson, Secretary
Ms. Jackson has served as the Company’s Director of Corporate Development and Assistant Secretary from 2004 to 2006 and then as the Director of Corporate Operations and Corporate Secretary from 2006 to present. Prior to 2004, Ms. Jackson served as the Director of Marketing and Client Services for Nationwide Money Services, Inc.
Robert Landis, Director
Mr. Landis is currently the Chief Financial Officer and Chief Accounting Officer of Comprehensive Care Corporation, a publicly traded company that provides managed behavioral healthcare services. He has been with Comprehensive Care for over 5 years, working directly with all operations, financial and SEC filings. Prior to this, Mr. Landis was with Maxicare Health Plans, Inc., a health maintenance organization, as its Treasurer from 1983-1998. Mr. Landis, a Certified Public Accountant, received a Bachelor’s Degree in Business Administration from the University of Southern California and a Master’s Degree in Business Administration from California State University at Northridge. Mr. Landis brings strong financial, operational and SEC experience to the Company, and is Chairman of the Audit Committee for the Company. Mr. Landis originally joined Global Axcess as a director in July and his current term expires on the date of the next shareholder meeting.
Page 45
Michael J. Loiacono, Chief Financial Officer and Chief Accounting Officer
Mr. Loiacono brings more than 20 years of professional experience working with both public and private companies within the telecommunications and software industries. Prior to joining Global Axcess in March 2006, Mr. Loiacono served as Vice President of Finance for InfiniRoute Networks Inc., which was acquired by TNS, Inc. At InfiniRoute, Mr. Loiacono managed their financial strategies to support the company's growth, and oversaw the day-to-day financial operations, including budget planning, accounting, billing, and financial reporting. Before his role at InfiniRoute, Mr. Loiacono served roles as VP of Finance at Reach Services, USA. and Controller and Director of Finance for ITXC Corp, which was acquired by Teleglobe, Inc. He has also held financial management positions at Voxware, Inc. and Dendrite International, Inc., two publicly traded companies. Mr. Loiacono holds a Bachelor of Science degree from Rutgers University. Mr. Loiacono is responsible for: financing the operations of the Company and its subsidiaries; financing the internal growth of the Company; strategic, legal and risk analysis for the Company; and SEC filings of the Company.
Joseph M. Loughry, III, Chairman, Director
Mr. Loughry has had successful hands-on experience in creating shareholder value in public and privately held processing services and software companies with sales ranging from $15 million to $300 million annually. In September 2007, Mr. Loughry was named President and Chief Executive Officer of Persystent Technologies Corporation, a privately-owned Tampa, Florida software company which provides enterprise laptop and desktop standard configuration management and desired state enforcement capabilities to corporations and government agencies. Previously, as President and CEO of HTE, Inc. (listed on NASDAQ) he engineered the turnaround of a public software company that provides integrated application solutions to mid-tier county and city governments throughout the nation. HTE, Inc. was eventually sold to SunGard Data Systems. His background includes almost a decade at General Electric Information Services where he was involved in general management, sales & marketing, product management and product development. He also served as President and CEO of QuestPoint Holdings, Inc., a financial transaction processing services business and as CEO of Nationwide Remittance Centers, Inc. a venture funded lock-box services business, which was acquired by CoreStates Bank. Mr. Loughry graduated from the University of Maryland with a degree in Business Administration in 1967. Mr. Loughry originally joined Global Axcess as a director in December 2005 and his current term expires on the date of the next shareholder.
George A. McQuain, President, CEO and Director
Mr. McQuain was Chief Executive Officer for Nationwide Money Services, Inc ("NMS"), a Global Axcess Corp subsidiary, prior to his appointment as CEO and President of Global Axcess Corp. He joined Global Axcess Corp as a Vice President of Operations in July 2002. Prior to his association with NMS, Mr. McQuain served as President and Chief Executive Officer of Ntercept Communications, where he decisively improved sales, marketing and product implementation. Prior to Ntercept, Mr. McQuain led First Union National Bank’s nationwide lockbox operations. Prior to First Union, Mr. McQuain was Chief Operating Officer of QuestPoint Holdings, a subsidiary of CoreStates Financial Corporation. Mr. McQuain received his MBA in Finance and Management from George Mason University in Fairfax, Virginia. Mr. McQuain became a director of the Company in September 2006 and his current term expired on the date of the next shareholder meeting which has not yet been scheduled. On February 28, 2011, the Company and George McQuain, the Company’s Chief Executive Officer, agreed to a mutual separation of Mr. McQuain’s employment. As of February 28, 2011, Mr. McQuain is no longer employed as Chief Executive Officer, or in any other capacity, by the Company or any of its subsidiaries.
Alan W. Rossiter, Director
Since July of 2002, Mr. Rossiter has served as President of Springboard Capital Management, Inc., based in Jacksonville, Florida. Springboard Capital Management manages the activities of two early-stage venture capital investment funds, Springboard Capital I, LLC and Springboard Capital II, LLC. Additionally, since 1996 he has served as the President and CEO of Enterprise North Florida Corporation, which provides emerging technology companies with extensive business, technical and financial services. Mr. Rossiter served for 27 years as a career Officer in the United States Navy specializing in the field of aviation logistics management and maintenance. Mr. Rossiter received a Bachelors degree in History from Denison University in 1967, graduated from the Naval Aviation Candidate School at Pensacola, Florida in 1969 and graduated from the National University of San Diego with a Masters of Business Administration in Financial Management and Information Systems in 1983. Mr. Rossiter originally joined Global Axcess as a director in December 2005 and his current term expires on the date of the next shareholder meeting.
Page 46
CORPORATE GOVERNANCE AND BOARD MATTERS
Leadership Structure of the Board of Directors
In 2006, our board of directors separated the positions of Chairman and Chief Executive Officer, and elected Joseph M. Loughry, III, a non-employee independent director, as our Chairman and appointed George A. McQuain as our President and Chief Executive Officer. Separating these positions allows our Chief Executive Officer to focus on day-to-day business and strategic decisions, while allowing the Chairman to lead our board in its fundamental role of providing advice to and independent oversight of management. Our board of directors recognizes the time, effort and energy that the Chief Executive Officer is required to devote to his position in the current business environment, as well as the commitment that is required to serve as our Chairman, particularly as the board’s oversight responsibilities continue to grow. While our bylaws and corporate governance guidelines do not require that our Chairman and Chief Executive Officer positions be separate, our board of directors believes that having separate positions and having an independent outside director serve as our Chairman is the appropriate leadership structure for us at this time and demonstrates our commitment to good corporate governance. Our board also created the position of Vice Chairman and elected Lock Ireland, a non-employee independent director to serve in that capacity. Our Vice Chairman supplements the Chairman’s leadership role and in the Chairman’s absence leads our board in the performance of its duties. In addition, the independent members of our board meet during every board meeting in separate executive session without any member of management present. Our Chairman presides over these meetings.
Meetings of the Board of Directors
In 2010, our board of directors met 12 times. Our board of directors adopted various resolutions pursuant to seven unanimous written consents in lieu of a meeting during the year ended December 31, 2010. Two of the directors attended 100% of the aggregate of (i) meetings of our board of directors during the year and (ii) the total number of meetings of all committees on our board of directors on which the incumbent directors served. The other remaining directors attended 94% of the aggregate of (i) the meetings of our board of directors during the year and (ii) the total number of meetings of all committees of our board of directors on which the incumbent directors served.
Board Independence
At the end of 2010, there were six non-employee directors and one employee director serving on our board of directors. Our board of directors has determined that the six non-employee directors are “independent” based on the Nasdaq Stock Market definition of independent.
Shareholder Communications with the Board of Directors
Our Corporate Governance Guidelines provide that our Chairman and our Chief Executive Officer are responsible for establishing effective communications with our shareholders. Our board of directors has implemented a process for shareholders to send communications to our board of directors and to specific individual directors. Any shareholder desiring to communicate with our board of directors, or with specific individual directors, may do so by writing to our Secretary at 7800 Belfort Parkway, Suite 165, Jacksonville, Florida 32256. Our Secretary will promptly forward all such sealed communications to our board of directors or such individual directors, as applicable.
Committees of the Board of Directors
Our board of directors has three standing committees – the audit committee, the compensation committee, and the nominating and corporate governance committee, and one additional committee – the mergers and acquisitions committee. Each of our committees operates pursuant to a written charter which, as in effect from time to time, may be found on our website at www.globalaxcess.biz. Each of the committees is composed solely of independent directors, consistent with the independence standards defined by the SEC and NASDAQ. Each committee has the right to retain its own legal and other advisors.
Audit Committee
Our audit committee, which is comprised solely of independent directors, consists of Robert J. Landis, as chairman, Lock Ireland and Joseph M. Loughry III. Our board of directors has determined that Mr. Landis qualifies as an “audit committee financial expert,” as defined in the rules of the SEC. Our audit committee met five times in fiscal year 2010. Responsibilities of our audit committee include the following: reviewing our consolidated financial statements and consulting with the independent auditors concerning our consolidated financial statements, accounting and financial policies, and internal controls; reviewing the scope of the independent auditors’ activities and the fees of the independent auditor; and reviewing the independence of the auditors.
Page 47
Compensation Committee
Our compensation committee, which is comprised solely of independent directors, consists of Lock Ireland, as chairman, Robert J. Landis and Alan Rossiter. Our compensation committee met eight times in fiscal year 2010. Our compensation committee is responsible for approving stock plans and option grants, and reviewing and making recommendations to the full board of directors regarding executive compensation and benefits. Our compensation committee is responsible for reviewing salary recommendations for our executives and then approving such recommendations with any modifications it deems appropriate. The independent members of our board of directors are then responsible for approving such salary recommendations with any modifications they deem appropriate. The annual salary recommendations for our named executive officers, other than our Chief Executive Officer, are made by our Chief Executive Officer and by the chairman of our compensation committee for our Chief Executive Officer.
Nominating and Corporate Governance Committee
Our nominating and corporate governance committee, which is comprised solely of independent directors, consists of Walter A. Howell, as chairman, Robert Landis and Alan Rossiter. Our nominating and corporate governance committee met twice in fiscal year 2010. During fiscal year 2010, the nominating and governance committee nominated, and the board of directors approved, Michael I. Connolly, to serve as a director for a term expiring in 2011. Our nominating and corporate governance committee is responsible for the following: identifying individuals qualified to become members of our board of directors; approving and recommending director candidates to our board of directors; developing and recommending to our board of directors, and updating as necessary, corporate governance principles and policies; and monitoring compliance with such principles and policies.
Our nominating and corporate governance committee is responsible for reviewing with the full board of directors, on an annual basis, the size, function and needs of our board of directors so ensure that our board, as a whole, collectively possess a broad range of skills, expertise, industry and other knowledge, and business and other experience useful to the effective oversight of our business. Our board of directors also seeks members of diverse backgrounds (including diversity of age, gender, industry experience and business experience) to ensure that our board of directors consists of members with a broad spectrum of experience, expertise and a reputation of integrity. We look for directors who hold positions with a high degree of responsibility, who are leaders in companies or institutions, and who can make contributions to our business. In considering candidates for nomination, our nominating and corporate governance committee may, at the request of our board, review the appropriate skills and characteristics, including diversity, required of board members in the context of the current makeup of our board. The committee applies the same standards in considering director candidates recommended by the shareholders as it applies to other candidates. See “Shareholder Nominations” for information with regard to the consideration of any director candidates recommended by security holders.
Mergers and Acquisitions Committee
Our mergers and acquisitions committee, which is comprised solely of independent directors, consists of Alan Rossiter, as chairman, Lock Ireland and Walter A. Howell. Our mergers and acquisitions committee met four times during fiscal year 2010. The function of the mergers and acquisitions committee is to explore alternative ways to enhance shareholder value, including joint ventures, mergers, stock sales or a potential sale of company assets, and make recommendations to our board of directors.
Role in Risk Oversight
Our board of directors oversees our stockholders’ and other stakeholders’ interest in our long-term health and overall success and financial strength. Risk is inherent with every business, and how well a business manages risk can ultimately determine is success. We face a number of risks, including economic risks, environmental and regulatory risks, and others, such as the impact of competition. Management is responsible for the day-to-day management of risks, while our board of directors, as a whole and through its committees, has the responsibility of satisfying itself that the risk management processes designed and implemented by management are adequate and functioning as designed.
Page 48
Our board of directors believes that establishing the right “tone at the top” and that full and open communication between management and our board of directors are essential for effective risk management and oversight. Our Chairman meets with our Chief Executive Officer and other senior officers to discuss strategy and risks facing us. In addition, senior management regularly attends board meetings and is available to address any questions or concerns raised by our board on risk management-related and other matters. Bi-monthly our board of directors receives presentations from senior management on strategic matters involving our operations. Our board also holds strategic planning sessions with senior management to discuss strategies, key challenges, and risks and opportunities.
While our entire board of directors is ultimately responsible for risk oversight, our board committees assist our board of directors in fulfilling its oversight responsibilities in certain areas of risk. Our audit committee assists our board in the areas of financial reporting, internal controls and compliance with legal and regulatory requirements and discusses policies with respect to risk assessment and risk management. Risk assessment reports are provided annually by management to our audit committee. Our compensation committee assists our board with respect to the management of risk arising from our compensation policies and programs. Our nominating and corporate governance committee assists our board with respect to the management of risk associated with board organization, membership and structure, succession planning for our directors and executive officers, and corporate governance. Our mergers and acquisitions committee assists with respect to risk associated with exploring potential merger and acquisition opportunities.
Shareholder Nominations
Our nominating and corporate governance committee will consider candidates recommended by shareholders. To recommend director candidates, shareholders should submit their suggestions in writing to the chairman of the nominating and corporate governance committee, c/o our Secretary, providing the candidate’s name, biographical data and other relevant information, together with consent from the suggested candidate to serve on our board of directors if nominated and elected.
Code of Ethics
We have adopted a code of ethics and business conduct that applies to all of our officers, directors and employees. This code of ethics is publicly available on our website at www.globalaxcess.biz. If we make substantial amendments to the code of ethics or grant any waiver, including an implicit waiver, we will disclose the nature of such amendment or waiver on our website or in a current report on Form 8-K within four business days of such amendment or waiver.
Section 16(a) Beneficial Ownership Reporting Compliance
Section 16(a) of the Exchange Act requires our directors and executive officers and persons who own more than 10% of our outstanding common stock to file with the SEC reports of changes in ownership of our common stock held by such persons. Executive officers, directors and greater than 10% shareholders are also required to furnish us with copies of all forms they file under this regulation. To our knowledge, based solely on a review of the copies of such reports furnished to us and representations that no other reports were required, during the fiscal year ended December 31, 2010, our executive officers, directors and greater than 10% shareholders complied with all Section 16(a) filing requirements applicable to them.
Although it is not our obligation to make filings pursuant to Section 16 of the Exchange Act, we have adopted a policy requiring all Section 16 reporting persons to report to our Chief Executive Officer or Chief Financial Officer prior to engaging in any transactions in our common stock.
|
ITEM 11.
|
EXECUTIVE COMPENSATION
|
The following table provides certain information for the fiscal years ended December 31, 2009 and 2010 concerning compensation earned for services rendered in all capacities by our principal executive officer, principal financial officer and all other executive officers whose total compensation exceeds $100,000.
Page 49
SUMMARY COMPENSATION TABLE
|
Name & Principal Position
|
Year
|
Salary ($)
|
Bonus
($)
|
Stock
Awards
($)
|
Option
Awards
($) (1)
|
Non-Equity
Incentive Plan
Compensation
($)
|
Change in
Pension Value
and Non-
Qualified
Deferred
Compensation
Earnings ($)
|
All Other
Compensation ($)
|
Total ($)
|
||||||||||||||||||||||||||
|
Marc Caramuta - COO
|
2010
|
$ | 28,846 | $ | 0 | - | $ | 1,264 |
(2)
|
- | - | $ | 30,110 | ||||||||||||||||||||||
|
William Costa - CIO
|
2010
|
$ | 40,877 | $ | 0 | - | $ | 2,743 |
(3)
|
- | - | $ | 43,620 | ||||||||||||||||||||||
|
George A. McQuain -
|
2010
|
$ | 265,368 | $ | 34,951 | - | $ | 64,055 |
(4),(5),(6),(7)
|
- | - | $ | 364,374 | ||||||||||||||||||||||
| President and CEO |
2009
|
$ | 271,133 | $ | 30,956 | - | $ | 49,052 |
(4),(5),(6),(7)
|
- | - | $ | 351,141 | ||||||||||||||||||||||
|
Michael J. Loiacono - CFO
|
2010
|
$ | 170,368 | $ | 21,729 | - | $ | 38,608 |
(4),(8),(9),(10),(11),(12)
|
- | - | - | $ | 230,705 | |||||||||||||||||||||
| and CAO |
2009
|
$ | 172,475 | $ | 21,478 | - | $ | 27,288 |
(4),(8),(9),(10),(11),(12)
|
- | - | - | $ | 221,241 | |||||||||||||||||||||
|
Heather Webb Carrouth -
|
2010
|
$ | 69,637 | $ | 0 | - | $ | 4,879 |
(13),(14),(15),(16)
|
- | - | $ | 74,516 | ||||||||||||||||||||||
| VP New Business Development |
2009
|
$ | 119,699 | $ | 10,089 | - | $ | 7,304 |
(13),(14),(15),(16)
|
- | - | $ | 137,092 | ||||||||||||||||||||||
|
(1)
|
The option awards were valued using the Black-Scholes option pricing model assuming up to 5 year lives, no expected dividend payments, volatility average of approximately 131%, forfeiture rate of 0% and a risk free rate of 5%. These option awards were computed based on such awards’ aggregate grant date fair value pursuant to FASB ASC Topic 718.
|
|
(2)
|
11,667 shares vest under this option on October 4, 2011 and October 4, 2012 and 11,666 shares on October 4, 2013.
|
|
(3)
|
11,667 shares vest under this option on August 9, 2011 and August 9, 2012 and 11,666 shares on August 9, 2013.
|
|
(4)
|
On April 2, 2007, the Board of Directors approved Executive Stock Option grants with respect to 25% of the shares are based on a performance based vesting, 25% are based on a market condition, 12.5% vest on October 2, 2007, 12.5% vest on April 2, 2008, 12.5% vest on April 2, 2009 and 12.5% vest on April 2, 2010.
|
|
(5)
|
57,166 shares vest under this option on March 20, 2009 and March 20, 2010 and 57,167 shares on March 20, 2011.
|
|
(6)
|
66,666 shares vest under this option on March 27, 2010 and March 27, 2011 and 66,667 shares on March 27, 2012.
|
|
(7)
|
43,000 shares vest under this option on December 18, 2010, December 18, 2011 and December 18, 2012.
|
|
(8)
|
The option is exercisable during the term of Michael Loiacono's employment with respect to 25% of the shares six months from the option grant date and the remaining shares thereafter in three equal installments on the anniversary of the option grant date.
|
|
(9)
|
9,000 shares vest under this option on February 28, 2009, February 28, 2010 and February 28, 2011.
|
|
(10)
|
40,000 shares vest under this option on March 20, 2009, March 20, 2010 and March 20, 2011.
|
|
(11)
|
50,000 shares vest under this option on March 27, 2010, March 20, 2011 and March 20, 2012.
|
|
(12)
|
25,000 shares vest under this option on December 18, 2010, December 18, 2011 and December 18, 2012.
|
|
(13)
|
4,333 shares vest under this option on February 28, 2009 and February 28, 2010 and 4,334 shares on February 28, 2011.
|
|
(14)
|
25,000 shares vest under this option on March 20, 2009, March 20, 2010 and March 20, 2011.
|
|
(15)
|
8,333 shares vest under this option on March 27, 2010 and March 20, 2011 and 8,334 shares on March 20, 2012.
|
|
(16)
|
3,333 shares vest under this option on December 18, 2010, December 18, 2011 and 3,334 shares on December 18, 2012.
|
Performance Based 401k Contribution Plan
Effective fiscal years 2007 through 2009, we implemented a performance based incentive program matching 401k contributions. For each quarter, during fiscal years 2007 through 2009, we matched up to 50% of the first 6% of an employee’s 401k contributions during that respective quarter upon the Company achieving our net income budget. For fiscal 2010, the 401k contribution plan was not a performance based incentive program and was not tied to our achievement any financial goals or metrics. We recorded $47,858, $21,050 and $44,741 of expenses relating to this plan during the fiscal years ended December 31, 2010, 2009 and 2008, respectively.
Performance Based Incentive Bonus Plan
Effective fiscal 2008, we implemented a performance based incentive program for employees and management of the company. A quarterly cash bonus pool is funded by the Company’s achievement of net profits. During the fiscal years ended December 31, 2010, 2009 and 2008, we recorded $19,589, $214,083 and $178,927, respectively, of expenses relating to this plan.
Stock-based compensation
We have established a 2002 Stock Incentive Plan (the “2002 Plan”), a 2004 Stock Incentive Plan (the “2004 Plan”) and a 2010 Stock Incentive Plan (the “2010 Plan”), which provide the granting of options to officers, employees, directors, and consultants of the Company. As of December 31, 2010, options to purchase 18,675 shares of common stock were available for future grants under the 2002 Plan, 15,864 shares of common stock were available for future grants under the 2004 Plan, and 965,000 shares of common stock were available for future grants under the 2010 Plan. As of December 31, 2010, 999,539 shares of common stock were reserved for future stock option grants and no shares were reserved for warrants to purchase common stock.
Page 50
Options granted under our 2002 Plan, 2004 Plan and 2010 Plan generally have a three-year vesting period and expire five years after grant. Most of our stock options vest ratably during the vesting period, as opposed to awards that vest at the end of the vesting period. We recognize compensation expense for options using the straight-line basis, reduced by estimated forfeitures. Upon exercise of stock options, we issue new shares of our common stock (as opposed to using treasury shares). All options granted pursuant to the plans shall be exercisable at a price not less than the fair market value of the common stock on the date of grant.
The Plans are administered by the Company's Board of Directors. The Board of Directors has the authority to select individuals to receive awards, to determine the time and type of awards, the number of shares covered by the awards, and the terms and conditions of such awards in accordance with the terms of the plans. In making such determinations, the Board of Directors may take into account the recipient's current and potential contributions and any other factors the Board of Directors considers relevant. The Board of Directors is authorized to establish rules and regulations and make all other determinations that may be necessary or advisable for the administration of the Plan.
Employment Agreements
George A. McQuain
On June 26, 2008, our board of directors approved an employment agreement with George McQuain. The employment agreement is effective as of July 1, 2008, provides for a one-year term, and provides that, if the employment agreement is not otherwise terminated, it will be automatically extended for successive periods of one year at the end of each calendar year.
The employment agreement further provides that, during the term of the agreement and for a period of one year and six months after the termination of the agreement for any reason, Mr. McQuain will not directly or indirectly employ or solicit our employees, compete with us for our customers in any state where we do business, interfered with our relationships, or provide information about us to our competitors.
The employment agreement provides that, if Mr. McQuain is terminated by us without cause and provided he complies with the restrictive covenants of the employment agreement and signs a release agreement, he will continue to receive his base salary for the following time period: (1) if the termination occurs during the initial term of the employment agreement, for the remaining portion of such initial term or for one year after the date of termination of his employment, whichever is longer; or (2) if the termination occurs after the initial term, for one year after the date of termination of his employment. In addition, Mr. McQuain will continue to receive benefits for the applicable time period and we will pay him for any bonuses earned by the date of termination. The employment agreement further provides that if there is a “change of control,” Mr. McQuain will be entitled to receive the same benefits that he would be entitled to receive if he were terminated without cause by us.
On October 21, 2010, we entered into an amendment with Mr. McQuain. The amendment amends certain terms of the employment agreement.
The amendment altered the employment agreement in several aspects. First, it lengthened the period for which Mr. McQuain is entitled to severance pay should his employment be terminated without cause from one year to eighteen months. Second, it provides that Mr. McQuain must execute a release agreement” in a form acceptable to the Company within 60 days of any such termination, in order to be entitled to such severance. Third, it modifies the non-compete provisions of the McQuain Employment Agreement by clarifying that the restricted business is business of that we are engaged in after the date of expiration or termination of the agreement. Fourth, it modifies the change of control provisions of the employment agreement by limiting Mr. McQuain’s diminution of duties termination right to six months, changing the severance period for termination following a change of control from one year to two years, and requiring the execution of a release agreement in the same time period as a termination without cause. Finally, the amendment contains clarifying provisions related to change of control and termination of service for compliance purposes with Internal Revenue Code Section 409A.
On February 28, 2011, the Company and George McQuain agreed to a mutual separation of Mr. McQuain’s employment. As of February 28, 2011, Mr. McQuain is no longer employed as Chief Executive Officer, or in any other capacity, by the Company or any of its subsidiaries. The Company intends to pay Mr. McQuain the severance payments detailed in his employment agreement.
Page 51
Michael J. Loiacono
Our board of directors approved an employment agreement with Michael Loiacono. The employment agreement is effective as of October 1, 2010, provides for a one-year term, and provides that, if the employment agreement is not otherwise terminated, it will be automatically extended for successive periods of one year at the end of each calendar year.
The employment agreement further provides that, during the term of the agreement and for a period of one year and six months after the termination of the agreement for any reason, Mr. Loiacono will not directly or indirectly employ or solicit our employees, compete with us for our customers in any state where we do business, interfered with our relationships, or provide information about us to our competitors.
The employment agreement provides that, if Mr. Loiacono is terminated by us without cause and provided he complies with the restrictive covenants of the employment agreement and signs a release agreement, he will continue to receive his base salary for the following time period: (1) if the termination occurs during the initial term of the employment agreement, for the remaining portion of such initial term or for nine months after the date of termination of his employment, whichever is longer; or (2) if the termination occurs after the initial term, for nine months after the date of termination of his employment. In addition, Mr. Loiacono will continue to receive benefits for the applicable time period and we will pay him for any bonuses earned by the date of termination. The employment agreement further provides that if there is a “change of control,” Mr. Loiacono will be entitled to receive the severance benefits for a period of one year.
Deductibility of Executive Compensation
As part of its role, our compensation committee reviews and considers the deductibility of executive compensation under Section 162(m) of the Internal Revenue Code of 1986, as amended, which provides that we may not deduct compensation of more than $1,000,000 that is paid to certain individuals. Qualifying performance-based compensation will not be subject to the deduction limitation if certain requirements are met. We believe that compensation paid under our incentive plans is generally fully deductible for federal income tax purposes. However, in certain circumstances, our compensation committee may approve compensation that will not meet these requirements in order to ensure competitive levels of total compensation for our executive officers.
Page 52
OUTSTANDING EQUITY AWARDS AT FISCAL YEAR END DECEMBER 31, 2010
|
Option Awards
|
Stock Awards
|
|||||||||||||||||||||||||||||||||||
|
Equity Incentive
|
||||||||||||||||||||||||||||||||||||
|
Equity
|
Plan Awards:
|
|||||||||||||||||||||||||||||||||||
|
Incentive
|
Market or Payout
|
|||||||||||||||||||||||||||||||||||
|
Equity
|
Plan Awards:
|
Value
|
||||||||||||||||||||||||||||||||||
|
Incentive
|
Number
|
of
|
||||||||||||||||||||||||||||||||||
|
Plan
|
Market
|
of
|
Unearned
|
|||||||||||||||||||||||||||||||||
|
Number
|
Number
|
Awards:
|
Number
|
Value of
|
Unearned
|
Shares,
|
||||||||||||||||||||||||||||||
|
of
|
of
|
Number
|
of Shares
|
Shares or
|
Shares,
|
Units or
|
||||||||||||||||||||||||||||||
|
Securities
|
Securities
|
of
|
or Units
|
Units of
|
Units or
|
Other
|
||||||||||||||||||||||||||||||
|
Underlying
|
Underlying
|
Securities
Underlying
|
of Stock
|
Stock
|
Other Rights
|
Rights
|
||||||||||||||||||||||||||||||
|
Unexercised
|
Unexercised
|
Unexercised
|
Option
|
That Have
|
That Have
|
That Have
|
That Have
|
|||||||||||||||||||||||||||||
|
Options
|
Options
|
Unearned
|
Exercise
|
Option
|
Not
|
Not
|
Not
|
Not
|
||||||||||||||||||||||||||||
| (#) | (#) |
Options
|
Price
|
Expiration
|
Vested
|
Vested
|
Vested
|
Vested
|
||||||||||||||||||||||||||||
|
Name
|
Year
|
Exercisable
|
Unexercisable
|
(#) |
($)
|
Date
|
(#) |
($)
|
(#) |
($)
|
||||||||||||||||||||||||||
|
Marc Caramuta - COO
|
2010
|
- | - |
(1)
|
35,000 | $ | 0.525 |
10/4/2015
|
- | - | - | - | ||||||||||||||||||||||||
|
William Costa - CIO
|
2010
|
- | - |
(2)
|
35,000 | $ | 0.680 |
8/9/2015
|
- | - | - | - | ||||||||||||||||||||||||
|
George A. McQuain - President and CEO,
|
2009
|
- | - |
(3)
|
129,000 | $ | 0.81 |
12/18/2014
|
- | - | - | - | ||||||||||||||||||||||||
| COO |
2009
|
- | - |
(4)
|
200,000 | $ | 0.15 |
3/27/2014
|
- | - | - | - | ||||||||||||||||||||||||
|
2008
|
- | - |
(5)
|
171,500 | $ | 0.25 |
3/20/2013
|
- | - | - | - | |||||||||||||||||||||||||
|
2007
|
125,000 | 125,000 |
(6)
|
250,000 | $ | 0.32 |
(6)
|
- | - | - | - | |||||||||||||||||||||||||
|
Michael J. Loiacono - CFO and CAO
|
2009
|
- | - |
(7)
|
75,000 | $ | 0.81 |
12/18/2014
|
- | - | - | - | ||||||||||||||||||||||||
|
2009
|
- | - |
(8)
|
150,000 | $ | 0.15 |
3/27/2014
|
- | - | - | - | |||||||||||||||||||||||||
|
2008
|
- | - |
(9)
|
120,000 | $ | 0.25 |
3/20/2013
|
- | - | - | - | |||||||||||||||||||||||||
|
2008
|
- | - |
(10)
|
27,000 | $ | 0.25 |
2/28/2013
|
- | - | - | - | |||||||||||||||||||||||||
|
2007
|
62,500 | 62,500 |
(11)
|
125,000 | $ | 0.32 |
(11)
|
- | - | - | - | |||||||||||||||||||||||||
|
2006
|
- | - |
(12)
|
20,000 | $ | 0.76 |
3/31/2011
|
- | - | - | - | |||||||||||||||||||||||||
|
Heather Webb Carrouth - VP New
|
2009
|
- | - |
(13)
|
10,000 | $ | 0.81 |
12/18/2014
|
- | - | - | - | ||||||||||||||||||||||||
| Business Development |
2009
|
- | - |
(14)
|
25,000 | $ | 0.15 |
3/27/2014
|
- | - | - | - | ||||||||||||||||||||||||
|
2008
|
- | - |
(15)
|
75,000 | $ | 0.25 |
3/20/2013
|
- | - | - | - | |||||||||||||||||||||||||
|
2008
|
- | - |
(16)
|
13,000 | $ | 0.25 |
2/28/2013
|
- | - | - | - | |||||||||||||||||||||||||
Except as set forth above, no other named executive officer has received an equity award.
|
(1)
|
On October 4, 2010, Marc Caramuta received a stock option to purchase 35,000 shares of common stock, which vest cumulatively as follows: 33 1/3% on October 4, 2011; 33 1/3% on October 4, 2012; 33 1/3% on October 4, 2013.
|
|
(2)
|
On August 9, 2010, William Costa received a stock option to purchase 35,000 shares of common stock, which vest cumulatively as follows: 33 1/3% on August 9, 2011; 33 1/3% on August 9, 2012; 33 1/3% on August 9, 2013.
|
|
(3)
|
On December 18, 2009, George McQuain received a stock option to purchase 129,000 shares of common stock, which vest cumulatively as follows: 33 1/3% on December 18, 2010; 33 1/3% on December 18, 2011; 33 1/3% on December 18, 2012.
|
|
(4)
|
On March 27, 2009, George McQuain received a stock option to purchase 200,000 shares of common stock, which vest cumulatively as follows: 33 1/3% on March 27, 2010; 33 1/3% on March 27, 2011; 33 1/3% on March 27, 2012.
|
|
(5)
|
On March 20, 2008, George McQuain received a stock option to purchase 171,500 shares of common stock, which vest cumulatively as follows: 33 1/3% on March 20, 2009; 33 1/3% on March 20, 2010; 33 1/3% on March 20, 2011.
|
|
(6)
|
On April 2, 2007, George McQuain received a stock option to purchase 500,000 shares of common stock, which vest based on employment and performance criteria. On October 10, 2007, 62,500 shares of common stock vested under the stock option and expire on April 2, 2010. The remaining 437,500 vest as follows if employment and performance criteria are met: 62,500 on April 2, 2008 and expire on April 2, 2011; 62,500 on April 2, 2009 and expire on April 2, 2012; 62,500 on April 2, 2010 and expire on April 2, 2013; 125,000 on May 15, 2008 and expire on April 2, 2011; 125,000 on April 2, 2011 and expire on April 2, 2015.
|
|
(7)
|
On December 18, 2009, Michael J. Loiacono received a stock option to purchase 75,000 shares of common stock, which vest cumulatively as follows: 33 1/3% on December 18, 2010; 33 1/3% on December 18, 2011; 33 1/3% on December 18, 2012.
|
|
(8)
|
On March 27, 2009, Michael J. Loiacono received a stock option to purchase 150,000 shares of common stock, which vest cumulatively as follows: 33 1/3% on March 27, 2010; 33 1/3% on March 27, 2011; 33 1/3% on March 27, 2012.
|
|
(9)
|
On March 20, 2008, Michael J. Loiacono received a stock option to purchase 120,000 shares of common stock, which vest cumulatively as follows: 33 1/3% on March 20, 2009; 33 1/3% on March 20, 2010; 33 1/3% on March 20, 2011.
|
|
(10)
|
On February 29, 2008, Michael J. Loiacono received a stock option to purchase 27,000 shares of common stock, which vest cumulatively as follows: 33 1/3% on February 28, 2009; 33 1/3% on February 28, 2010; 33 1/3% on February 28, 2011.
|
|
(11)
|
On April 2, 2007, Michael J. Loiacono received a stock option to purchase 250,000 shares of common stock, which vest based on employment and performance criteria. On October 10, 2007, 31,250 shares of common stock vested under the stock option and expire on April 2, 2010. The remaining 218,750 vest as follows if employment and performance criteria are met: 31,250 on April 2, 2008 and expire on April 2, 2011; 31,250 on April 2, 2009 and expire on April 2, 2012; 31,250 on April 2, 2010 and expire on April 2, 2013; 62,500 on May 15, 2008 and expire on April 2, 2011; 62,500 on April 2, 2011 and expire on April 2, 2015.
|
|
(12)
|
On March 31, 2006, Michael J. Loiacono received a stock option to purchase 20,000 shares of common stock, which vest cumulatively as follows: 25% on March 31, 2007; 33 1/3% on March 31, 2008; 33 1/3% on March 31, 2009 and 25% on March 31, 2010.
|
|
(13)
|
On December 18, 2009, Heather Webb Carrouth received a stock option to purchase 10,000 shares of common stock, which vest cumulatively as follows: 33 1/3% on December 18, 2010; 33 1/3% on December 18, 2011; 33 1/3% on December 18, 2012.
|
|
(14)
|
On March 27, 2009, Heather Webb Carrouth received a stock option to purchase 25,000 shares of common stock, which vest cumulatively as follows: 33 1/3% on March 27, 2010; 33 1/3% on March 27, 2011; 33 1/3% on March 27, 2012.
|
|
(15)
|
On March 20, 2008, Heather Webb Carrouth received a stock option to purchase 75,000 shares of common stock, which vest cumulatively as follows: 33 1/3% on March 20, 2009; 33 1/3% on March 20, 2010; 33 1/3% on March 20, 2011.
|
|
(16)
|
On February 29, 2008, Heather Webb Carrouth received a stock option to purchase 13,000 shares of common stock, which vest cumulatively as follows: 33 1/3% on February 28, 2009; 33 1/3% on February 28, 2010; 33 1/3% on February 28, 2011.
|
Page 53
Director Compensation Table
The following table provides certain information concerning compensation for each director during the fiscal year ended December 31, 2010.
|
Name (1)
|
Year
|
Fees Earned
or Paid in
Cash ($)
|
Stock Awards
($)
|
Option
Awards ($)
(2)
|
Non-Equity
Incentive Plan
Compensation
($)
|
Change in Pension Value
and Nonqualified
Deferred Compensation
Earnings
|
All Other
Compensation
($)
|
Total
($)
|
|||||||||||||||||||||||
|
Michael I. Connolly
|
2010
|
$ | 0 | - | $ | 0 | - | - | - | $ | 0 | ||||||||||||||||||||
|
Walter A. Howell
|
2010
|
$ | 9,500 | - | $ | 9,084 |
(3),(4),(5),(11)
|
- | - | - | $ | 18,584 | |||||||||||||||||||
|
Lock Ireland
|
2010
|
$ | 37,100 | - | $ | 11,785 |
(4),(6),(7),(8),(12)
|
- | - | - | $ | 48,885 | |||||||||||||||||||
|
Robert Landis
|
2010
|
$ | 15,500 | - | $ | 7,855 |
(4),(6),(8),(12)
|
- | - | - | $ | 23,355 | |||||||||||||||||||
|
Joseph Loughry, III
|
2010
|
$ | 51,500 | - | $ | 7,236 |
(4),(9),(10),(13)
|
- | - | - | $ | 58,736 | |||||||||||||||||||
|
Alan Rossiter
|
2010
|
$ | 9,500 | - | $ | 7,236 |
(4),(9),(10),(13)
|
- | - | - | $ | 16,736 | |||||||||||||||||||
|
(1)
|
George A. McQuain, who is a member of our board of directors, has been omitted from this table since he receives no compensation for serving on our board of directors.
|
|
(2)
|
The option awards were valued using the Black-Scholes option pricing model assuming up to 5 year lives, no expected dividend payments, volatility average of approximately 131%, forfeiture rate of 0% and a risk free rate of 5%. These option awards were computed based on such awards’ aggregate grant date fair value pursuant to FASB ASC Topic 718.
|
|
(3)
|
5,000 shares vest under this option on August 30, 2009, August 30, 2010, August 30, 2011 and August 30, 2012.
|
|
(4)
|
16,666 shares vest under this option on June 26, 2009 and June 26, 2010 and 16,667 shares on June 26, 2011.
|
|
(5)
|
5,000 shares vest under this option on August 30, 2010, August 30, 2011, August 30, 2012 and August 30, 2013.
|
|
(6)
|
5,000 shares vest under this option on July 10, 2009, July 10, 2010, July 10, 2011 and July 10, 2012.
|
|
(7)
|
33,333 shares vest under this option on March 27, 2010 and March 27, 2011 and 33,334 shares on March 27, 2012.
|
|
(8)
|
5,000 shares vest under this option on July 10, 2009, July 10, 2010, July 10, 2011 and July 10, 2012.
|
|
(9)
|
5,000 shares vest under this option on December 16, 2009, December 16, 2010, December 16, 2011 and December 16, 2012.
|
|
(10)
|
5,000 shares vest under this option on December 16, 2010, December 16, 2011, December 16, 2012 and December 16, 2013.
|
|
(11)
|
5,000 shares vest under this option on August 30, 2011, August 30, 2012, August 30, 2013 and August 30, 2014.
|
|
(12)
|
5,000 shares vest under this option on July 12, 2011, July 12, 2012, July 12, 2013 and July 12, 2014.
|
|
(13)
|
5,000 shares vest under this option on December 16, 2011, December 16, 2012, December 16, 2013 and December 16, 2014.
|
During 2010, 120,000 stock options were granted to non-employee directors as follows:
|
Name
|
Number of Options
|
Grant Date and Fair Value of Granted Options
|
||
|
Connolly, Michael I.
|
20,000
|
20,000 options granted on December 27, 2010 with a fair value of $8,917
|
||
|
Howell, Walter A.
|
20,000
|
20,000 options granted on August 30, 2010 with a fair value of $9,149
|
||
|
Ireland, Lock
|
20,000
|
20,000 options granted on July 10, 2010 with a fair value of $12,604
|
||
|
Landis, Robert
|
20,000
|
20,000 options granted on July 10, 2010 with a fair value of $12,604
|
||
|
Loughry, Joseph
|
20,000
|
20,000 options granted on December 16, 2010 with a fair value of $9,908
|
||
|
Rossiter, Alan
|
20,000
|
20,000 options granted on December 16, 2010 with a fair value of $9,908
|
The following table sets forth the aggregate number of options outstanding and exercisable at December 31, 2010 for each of our directors.
|
Name
|
Total options outstanding
|
Total options exercisable
|
||
|
Connolly, Michael I.
|
20,000
|
-
|
||
|
Howell, Walter A.
|
130,000
|
68,300
|
||
|
Ireland, Lock
|
230,000
|
101,600
|
||
|
Landis, Robert
|
130,000
|
68,300
|
||
|
Loughry, Joseph
|
130,000
|
68,300
|
||
|
McQuain, George A.
|
1,000,500
|
536,276
|
||
|
Rossiter, Alan
|
|
130,000
|
|
71,620
|
Page 54
Discussion of Director Compensation
Our non-employee directors receive cash compensation for their service as a director and, where applicable, as a chair of a committee. Effective June 1, 2010, the Board of Directors increased the director compensation. The chairman of our board of directors receives $4,500 per month with no additional compensation for chairing or membership on a board committee and the vice chairman of our board of directors receives $3,300 per month with no additional compensation for chairing or membership on a board committee. The chairman of our audit committee receives $1,500 per month and all other non-employee directors receive $1,000 per month. Our non-employee directors are also compensated with stock options in accordance with the terms of our Stock Option Plan. Our Stock Option Plan provides for an initial grant of 20,000 stock options upon the election or appointment to our board of directors and annual grants of 20,000 stock options for each year of service thereafter. All non-employee directors are reimbursed for expenses incurred in attending meeting of our board of directors and committees.
On June 30, 2009, our board of directors approved equity ownership guidelines for our non-employee directors, which require each non-employee director to own a minimum amount of stock equal to two times the annual dollar amount each non-employee director receives in director’s fees for serving on our board. Each non-employee director is required to be in compliance with these equity ownership guidelines within two years of becoming a director.
|
ITEM 12.
|
SECURITY OWNERSHIP OF CERTAIN BENEFICIAL OWNERS AND MANAGEMENT AND RELATED STOCKHOLDER MATTERS
|
The following table sets forth certain information regarding the beneficial ownership of our common stock as of March 2, 2011 by each person known by us to be the beneficial owner of more than 5% of our outstanding common stock, each of our directors, each of our director nominees, each of our named executive officers, and all of our directors and executive officers as a group.
|
Name of Beneficial Owner
|
Number of Shares
Beneficially Owned (1)
|
Percent of Shares
Outstanding (2)
|
|||||||
|
Marc Caramuta
|
- | - | |||||||
|
Michael I. Connolly
|
- | - | |||||||
|
William Costa
|
- | - | |||||||
|
Walter A. Howell
|
106,300 | 0.47 | % |
(3)
|
|||||
|
Lock Ireland
|
315,607 | 1.40 | % |
(4)
|
|||||
|
Sharon Jackson
|
54,660 | 0.24 | % |
(5)
|
|||||
|
Robert Landis
|
108,300 | 0.48 | % |
(6)
|
|||||
|
Michael Loiacono
|
394,015 | 1.75 | % |
(7)
|
|||||
|
Joseph M. Loughry, III
|
264,440 | 1.17 | % |
(8)
|
|||||
|
Alan Rossiter
|
86,120 | 0.38 | % |
(9)
|
|||||
|
All executive officers and directors as a group (10 persons)
|
1,329,442 | 5.90 | % | ||||||
|
5% owners:
|
|||||||||
|
BFS U.S. Special Opportunities Trust PLC
|
1,353,333 | 6.00 | % |
(10)
|
|||||
|
Rennaissance U.S. Growth Investment Trust PLC
|
1,553,333 | 6.89 | % |
(11)
|
|||||
|
Rennaissance Capital Growth & Income Fund III, Inc.
|
953,333 | 4.23 | % |
(12)
|
|||||
|
Doucet Capital, LLC
|
1,464,606 | 6.50 | % |
(13)
|
|||||
|
MidSouth Investor Fund LP
|
1,556,840 | 6.91 | % |
(14)
|
|||||
|
All 5% owners
|
6,881,445 | 30.52 | % | ||||||
|
Total
|
8,210,887 | 36.42 | % | ||||||
Page 55
|
(1)
|
Beneficial ownership includes shares for which an individual, directly or indirectly, has or shares voting or investment power, or both, and also includes options that are exercisable as of March 2, 2011. Unless otherwise indicated, all of the listed persons have sole voting and investment power over the shares listed opposite their names. Beneficial ownership as reported in the above table has been determined in accordance with Rule 13d-3 of the Securities Exchange Act of 1934, as amended, referred to in this statement as the Exchange Act. Pursuant to the rules of the Securities and Exchange Commission, referred to in this statement as the SEC, certain shares of our common stock that a beneficial owner has the right to acquire pursuant to the exercise of stock options or warrants are deemed to be outstanding for the purpose of computing the percentage ownership of such owner, but are not deemed outstanding for the purpose of computing the percentage ownership of any other person. Information contained in the table with respect to the holdings of 5% beneficial owners is taken from filings made with the SEC by the reporting beneficial owners on Schedule 13D and/or Schedule 13G, and any amendments thereto.
|
|
(2)
|
Based on 22,545,326 shares of common stock outstanding as of March 2, 2011.
|
|
(3)
|
Includes 38,000 shares of common stock and 68,300 options to purchase common stock.
|
|
(4)
|
Includes 214,007 shares of common stock and 101,600 options to purchase common stock.
|
|
(5)
|
Includes 14,200 shares of common stock and 40,460 options to purchase common stock.
|
|
(6)
|
Includes 40,000 shares of common stock and 68,300 options to purchase common stock.
|
|
(7)
|
Includes 44,938 shares of common stock and 349,077 options to purchase common stock.
|
|
(8)
|
Includes 196,140 shares of common stock and 68,300 options to purchase common stock.
|
|
(9)
|
Includes 14,500 shares of common stock and 71,620 options to purchase common stock.
|
|
(10)
|
Includes 1,353,333 shares of common stock. The principal business address of BFS U.S. Special Opportunities Trust PLC is 8080 North Central Expressway, Suite 210-LB, Dallas, Texas 75206-1857. Russell Cleveland, Renaissance Capital Group, Inc. - Investment Adviser
|
|
(11)
|
Includes 1,553,333 shares of common stock. The principal business address of Rennaissance U.S. Growth Investment Trust PLC is 8080 North Central Expressway, Suite 210-LB, Dallas, Texas 75206-1857. Russell Cleveland, Renaissance Capital Group, Inc. - Investment Adviser
|
|
(12)
|
Includes 953,333 shares of common stock. The principal business address of Rennaissance Capital Growth & Income Fund III, Inc. is 8080 North Central Expressway, Suite 210-LB, Dallas, Texas 75206-1857. Russell Cleveland, Renaissance Capital Group, Inc. - Investment Manager
|
|
(13)
|
Includes 1,464,606 shares of common stock. The principal business address of Doucet Capital, LLC is 2204 Lakeshore Drive, Suite 218, Birmingham, Alabama 35209. Chris Doucet, Doucet Capital, LLC - Investment Manager
|
|
(14)
|
Includes 1,556,840 shares of common stock. The principal business address of MidSouth Investor Fund LP is 201 4th Avenue, North Suite 1950, Nashville, Tennessee 37219. Lyman Heidtke, MidSouth Capital, Inc. – General Partner
|
|
ITEM 13.
|
CERTAIN RELATIONSHIPS AND RELATED TRANSACTIONS, AND DIRECTOR INDEPENDENCE
|
In accordance with our audit committee charter, our audit committee is responsible for reviewing and approving all related party transactions. Any financial transaction with any officer or director, or any immediate family member of any officer or director, would need to be approved by our audit committee prior to our company entering into such transaction. On an ongoing basis, all potential related party transactions are reported directly to the chairman of our audit committee. To assist us in identifying any related party transactions, each year we submit and require our directors and officers to complete questionnaires identifying any transactions with us in which the directors or officers, or their immediate family members, have an interest.
|
ITEM 14.
|
PRINCIPAL ACCOUNTING FEES AND SERVICES
|
Audit Fees
The aggregate fees billed by Mayer Hoffman McCann P.C., formerly Kirkland, Russ, Murphy & Tapp, P.A. for professional services rendered for the audit of our consolidated financial statements for the year ended December 31, 2010 and for the reviews of our consolidated financial statements included in our Quarterly Reports on Form 10-Q during the fiscal year 2010 were $31,500. Total unbilled fess by Kirkland, Russ, Murphy & Tapp, P.A. for professional services rendered for the audit of our consolidated financial statements for the year ended December 31, 2010 were $70,500. The aggregate fees billed by Kirkland, Russ, Murphy & Tapp, P.A. for professional services rendered for the audit of our consolidated financial statements for the year ended December 31, 2009 and for the reviews of our consolidated financial statements included in our Quarterly Reports on Form 10-Q during the fiscal year 2009 were $105,000.
Tax Fees
During the fiscal years ended December 31, 2010 and 2009, there were no fees billed by CBIZ Kirkland, Russ, Murphy & Tapp for tax related services.
Page 56
All Other Fees
During the fiscal year ended December 31, 2010, there was $3,000 of fees billed by Mayer Hoffman McCann P.C., formerly Kirkland, Russ, Murphy & Tapp, P.A. for work related to the evaluation of a possible interest rate hedge. During the fiscal year ended December 31, 2009, there was $5,564 of fees billed by Kirkland, Russ, Murphy & Tapp, P.A. for work related to the Sarbanes-Oxley Act of 2002 and for review of our Registration Statements on Form S-1.
Audit Committee Pre-Approval Policy
The services performed by our independent accountants in 2010 were pre-approved by our audit committee. Our audit committee’s policy is to pre-approve all audit and permissible non-audit services provided by the independent registered public accounting firm. These services may include audit services, audit-related services, tax services and other services. Pre-approval is generally provided for up to one year, and any pre-approval is detailed as to the particular service or category of services and is generally subject to a specific budget. The independent auditor and management are required to report periodically to our audit committee regarding the extent of services provided by the independent auditor in accordance with such pre-approval, and the fees for the services performed to date. Our audit committee may also pre-approve particular services on a case by case basis.
Page 57
PART IV
|
ITEM 15.
|
EXHIBITS AND FINANCIAL STATEMENT SCHEDULES
|
(a) INDEX TO EXHIBITS
|
Exhibit
Number
|
Exhibit Description
|
|
|
3.1
|
Articles of Incorporation – Restated and Amended May 30, 2001 (incorporated by reference to form 10-KSB, filed with the SEC on March 31, 2003).
|
|
|
3.2
|
ByLaws of Global Axcess Corp. – As Amended (incorporated by reference to Form 10-KSB, filed with the SEC on March 31, 2003).
|
|
|
3.3
|
Amendment to the Articles of Incorporation (incorporated by reference to Form 10-K/A, filed with the SEC on January 28, 2011).
|
|
|
4.1
|
Securities Purchase Agreement dated October 27, 2005 entered by and between the Company and the Investor (incorporated by reference to Form 10-K/A, filed with the SEC on January 28, 2011).
|
|
|
4.2
|
Common Stock Purchase Warrant dated October 27, 2005 issued by the Company to the Investor (incorporated by reference to Form 10-K/A, filed with the SEC on January 28, 2011).
|
|
|
4.3
|
Registration Rights Agreement dated October 27, 2005 entered by and between the Company and the Investor (incorporated by reference to Form 10-K/A, filed with the SEC on January 28, 2011).
|
|
|
4.4
|
Subsidiary Guarantee dated October 27, 2005 (incorporated by reference to Form 10-K/A, filed with the SEC on January 28, 2011).
|
|
|
4.5
|
Security Agreement dated October 27, 2005 entered by and between the Company and the Investor (incorporated by reference to Form 10-K/A, filed with the SEC on January 28, 2011).
|
|
|
10.1
|
Agreement entered into with Food Lion, LLC and Nationwide Money Services, Inc dated October 5, 2001 (incorporated by reference to Form 10-K/A, filed with the SEC on January 28, 2011).
|
|
|
10.2
|
Distributor ATM Processing Agreement between Nationwide Money Services and Genpass Technologies LLC dated December 15, 2005 (incorporated by reference to Form 8-K filed with the SEC on December 20, 2005).
|
|
|
10.3
|
Cash Provisioning Agreement, dated June 1, 2009, by and between U.S. Bank, a national association doing business as Elan Financial Services, Nationwide Money Services, Inc. and Pendum, LLC (incorporated by reference to Form 10-K/A, filed with the SEC on January 28, 2011).
|
|
|
10.4
|
Office Lease with Surburban Owner LLC (incorporated by reference to Form 10-K/A, filed with the SEC on January 28, 2011).
|
|
|
10.5
|
Employment Agreement dated July 1, 2008 by and between the Company and George McQuain (incorporated by reference to Form 10-K/A, filed with the SEC on January 28, 2011) (Management compensation plan or arrangement).
|
|
|
10.6
|
Director Compensation Arrangements (incorporated by reference to Form 10-Q filed August 7, 2008) (Management compensation plan or arrangement).
|
Page 58
|
Exhibit
Number
|
Exhibit Description
|
|
|
10.7
|
2002 Stock Incentive Plan (incorporated by reference to Form S-8 filed December 10, 2003).
|
|
|
10.8
|
First Amendment to 2002 Stock Incentive Plan (incorporated by reference to Form 10-K/A, filed with the SEC on January 28, 2011).
|
|
|
10.9
|
2004 Stock Incentive Plan (originally filed on Form S-8 with the SEC on June 25, 2004).
|
|
|
10.10
|
First Amendment to 2004 Stock Incentive Plan. (incorporated by reference to Form 10-K/A, filed with the SEC on January 28, 2011).
|
|
|
10.11
|
Mediated Settlement Agreement, dated January 22, 2009, by and between the Company and Sidney Michael Cole (incorporated by reference to Form 10-K/A, filed with the SEC on January 28, 2011) (This agreement has been redacted pursuant to a confidential treatment request filed with the SEC on the date hereof).
|
|
|
10.12
|
Settlement Agreement, effective as of March 17, 2009, between Global Axcess Corp. and CAMOFI Master LDC (incorporated by reference to Form 10-K/A, filed with the SEC on January 28, 2011).
|
|
|
10.13
|
Net Enterprise Value Special Transaction Plan (incorporated by reference to Form 8-K filed with the SEC on April 6, 2010).
|
|
|
10.14
|
Loan and Security Agreement, dated as of June 18, 2010, by and among Global Axcess Corp. (and subsidiaries) and Fifth Third Bank (incorporated by reference to Form 8-K filed with the SEC on June 22, 2010).
|
|
|
10.15
|
Term Promissory Note, dated June 18, 2010, issued by Global Axcess Corp. to Fifth Third Bank (incorporated by reference to Form 8-K filed with the SEC on June 22, 2010).
|
|
|
10.16
|
Draw Promissory Note, dated June 18, 2010, issued by Global Axcess Corp. to Fifth Third Bank (incorporated by reference to Form 8-K filed with the SEC on June 22, 2010).
|
|
|
10.17
|
Master Equipment Lease Agreement, dated June 18, 2010, by and among Global Axcess Corp. and Fifth Third Bank (incorporated by reference to Form 8-K filed with the SEC on June 22, 2010).
|
|
|
10.18
|
Amendment One to Employment Agreement, dated October 21, 2010, by and among the Company and George A. McQuain (incorporated by reference to Form 8-K filed with the SEC on October 26, 2010).
|
|
|
10.19
|
Employment Agreement, dated October 21, 2010, by and between the Company and Michael J. Loiacono (incorporated by reference to Form 8-K filed with the SEC on October 26, 2010).
|
|
|
10.20
|
Asset Purchase Agreement by and between the Company and Tejas Video Partners, LTD, dated November 10, 2010 (incorporated by reference to Form 8-K, filed with the SEC on November 12, 2010).
|
|
|
10.21
|
Asset Purchase Agreement by and between the Company and FMiATM, Inc., dated December 1, 2010.*
|
|
|
10.22
|
First Amendment to Loan and Security Agreement, dated as of December 17, 2010, by and among Global Axcess Corp. (and subsidiaries) and Fifth Third Bank (incorporated by reference to Form 8-K, filed with the SEC on December 23, 2010).
|
Page 59
|
Exhibit
Number
|
Exhibit Description
|
|
|
10.23
|
2010 Stock Incentive Plan (originally filed as part of the Company’s Schedule 14A Proxy Statement with the SEC on April 16, 2010).
|
|
|
21.1
|
List of Subsidiaries:
Nationwide Money Services, Inc., a Nevada corporation
Nationwide Ntertainment Services, Inc., a Nevada corporation
EFT Integration, Inc., a Florida corporation
|
|
|
23.1
|
Consent of Kirkland, Russ, Murphy & Tapp, P.A.*
|
|
|
23.2
|
Consent of Mayer Hoffman McCann P.C.*
|
|
|
31.1
|
Certification of the Chief Executive Officer of Global Axcess Corp. pursuant to Section 302 of the Sarbanes-Oxley Act of 2002.*
|
|
|
31.2
|
Certification of the Chief Financial Officer of Global Axcess Corp. pursuant to Section 302 of the Sarbanes-Oxley Act of 2002.*
|
|
|
32.1
|
Certification of the Chief Executive Officer of Global Axcess Corp. pursuant to Section 906 of the Sarbanes-Oxley Act of 2002.*
|
|
|
32.2
|
Certification of the Chief Financial Officer of Global Axcess Corp. pursuant to Section 906 of the Sarbanes-Oxley Act of 2002.*
|
* Filed herewith.
Page 60
SIGNATURES
Pursuant to the requirements of the Securities Exchange Act of 1934, as of March 30 2011 the Registrant has duly caused this report to be signed on its behalf by the undersigned, thereunto duly authorized.
GLOBAL AXCESS CORP
By: /s/ Michael I. Connolly
Michael I. Connolly
Interim President and Interim Co-Chief Executive Officer
(interim principal executive officer)
Pursuant to the requirements of the Securities Exchange Act of 1934, this report has been signed below by the following persons on behalf of the Registrant and in the capacities indicated on March 30, 2011.
|
Signature
|
Title
|
|
|
/S/ Michael J. Loiacono
|
Chief Financial Officer and Chief Accounting Officer
|
|
|
Michael J. Loiacono
|
(principal financial officer and principal accounting officer)
|
|
|
/S/ Michael I. Connolly
|
Interim President, Interim Co-CEO and Director
|
|
|
Michael I. Connolly
|
(interim principal executive officer)
|
|
|
/S/ Walter A. Howell
|
||
|
Walter A. Howell
|
Director
|
|
|
/S/ Lock Ireland
|
||
|
Lock Ireland
|
Interim Co-CEO, Vice Chairman and Director
|
|
|
/S/ Robert Landis
|
||
|
Robert Landis
|
Director
|
|
|
/S/ Joseph Loughry
|
||
|
Joseph Loughry
|
Chairman and Director
|
|
|
/S/ Alan Rossiter
|
||
|
Alan Rossiter
|
Director
|
Page 61
GLOBAL AXCESS CORP AND SUBSIDIARIES
CONSOLIDATED FINANCIAL STATEMENTS
TABLE OF CONTENTS
|
PAGE NO.
|
|
|
Report of Independent Registered Public Accounting Firm - 2010
|
1
|
|
Report of Independent Registered Public Accounting Firm - 2009
|
2
|
|
Consolidated financial statements
|
|
|
Consolidated balance sheets as of December 31, 2010 and 2009
|
3
|
|
Consolidated statements of income for the years ended December 31, 2010, 2009 and 2008
|
4
|
|
Consolidated statements of stockholders’ equity for the years ended December 31, 2010, 2009 and 2008
|
5
|
|
Consolidated statements of cash flows for the years ended December 31, 2010, 2009 and 2008
|
6
|
|
Notes to consolidated financial statements as of December 31, 2010
|
8
|
Page 62
Report Of Independent Registered Public Accounting Firm
Board of Directors and Stockholders of
Global Axcess Corp & Subsidiaries:
We have audited the accompanying consolidated balance sheet of Global Axcess Corp and Subsidiaries as of December 31, 2010 and the related consolidated statements of income, stockholders’ equity and cash flows for the year then ended. The Company’s management is responsible for these consolidated financial statements. Our responsibility is to express an opinion on these consolidated financial statements based on our audit.
We conducted our audit in accordance with the standards of the Public Company Accounting Oversight Board (United States). Those standards require that we plan and perform the audit to obtain reasonable assurance about whether the consolidated financial statements are free of material misstatement. The Company is not required to have, nor were we engaged to perform, an audit of its internal control over financial reporting. Our audit included consideration of internal control over financial reporting as a basis for designing audit procedures that are appropriate in the circumstances, but not for the purpose of expressing an opinion on the effectiveness of the Company’s internal control over financial reporting. Accordingly, we express no such opinion. An audit includes examining, on a test basis, evidence supporting the amounts and disclosures in the consolidated financial statements, assessing the accounting principles used and significant estimates made by management, as well as evaluating the overall financial statement presentation. We believe that our audit provides a reasonable basis for our opinion.
In our opinion, the consolidated financial statements referred to above present fairly, in all material respects, the consolidated financial position of the Company as of December 31, 2010, and the results of its operations and its cash flows for the year then ended in conformity with accounting principles generally accepted in the United States of America.
/s/ MAYER HOFFMAN MCCANN P.C.
Clearwater, Florida
March 29, 2011
1
Report Of Independent Registered Public Accounting Firm
Board of Directors and Stockholders of
Global Axcess Corp:
We have audited the accompanying consolidated balance sheets of Global Axcess Corp and Subsidiaries as of December 31, 2009 and the related consolidated statements of income, stockholders’ equity and cash flows for the years ended December 31, 2009 and 2008. These consolidated financial statements are the responsibility of the Company’s management. Our responsibility is to express an opinion on these consolidated financial statements based on our audits.
We conducted our audits in accordance with the standards of the Public Company Accounting Oversight Board (United States). Those standards require that we plan and perform the audit to obtain reasonable assurance about whether the consolidated financial statements are free of material misstatement. The Company is not required to have, nor were we engaged to perform, an audit of its internal control over financial reporting. Our audit included consideration of internal control over financial reporting as a basis for designing audit procedures that are appropriate in the circumstances, but not for the purpose of expressing an opinion on the effectiveness of the Company’s internal control over financial reporting. Accordingly, we express no such opinion. An audit includes examining, on a test basis, evidence supporting the amounts and disclosures in the consolidated financial statements. An audit also includes assessing the accounting principles used and significant estimates made by management, as well as evaluating the overall financial statement presentation. We believe that our audits provide a reasonable basis for our opinion.
In our opinion, the consolidated financial statements referred to above present fairly, in all material respects, the consolidated financial position of Global Axcess Corp and Subsidiaries as of December 31, 2009 and the results of its operations and its cash flows for the years ended December 31, 2009 and 2008 in conformity with accounting principles generally accepted in the United States of America.
/s/ KIRKLAND, RUSS, MURPHY & TAPP, P.A.
Clearwater, Florida
March 2, 2010
2
GLOBAL AXCESS CORP AND SUBSIDIARIES
CONSOLIDATED BALANCE SHEETS
|
As of December 31,
|
||||||||
|
2010
|
2009
|
|||||||
|
ASSETS
|
||||||||
|
Current assets
|
||||||||
|
Cash and cash equivalents
|
$ | 1,743,562 | $ | 2,007,860 | ||||
|
Automated teller machine vault cash
|
- | 250,000 | ||||||
|
Accounts receivable, net of allowance of $4,354 in 2010 and $12,616 in 2009
|
410,956 | 845,000 | ||||||
|
Inventory, net of allowance for obsolescence of $182,572 in 2010 and $94,572 in 2009
|
1,389,606 | 308,031 | ||||||
|
Deferred tax asset - current
|
363,926 | 868,848 | ||||||
|
Prepaid expenses and other current assets
|
139,551 | 132,100 | ||||||
|
Total current assets
|
4,047,601 | 4,411,839 | ||||||
|
Fixed assets, net
|
9,581,561 | 5,299,661 | ||||||
|
Other assets
|
||||||||
|
Merchant contracts, net
|
10,879,029 | 10,665,613 | ||||||
|
Intangible assets, net
|
4,219,216 | 4,095,911 | ||||||
|
Deferred tax asset - non-current
|
1,611,285 | 813,618 | ||||||
|
Restricted cash
|
- | 800,000 | ||||||
|
Other assets
|
66,807 | 30,307 | ||||||
|
Total assets
|
$ | 30,405,499 | $ | 26,116,949 | ||||
|
LIABILITIES AND STOCKHOLDERS' EQUITY
|
||||||||
|
Current liabilities
|
||||||||
|
Accounts payable and accrued liabilities
|
$ | 4,604,837 | $ | 2,983,583 | ||||
|
Automated teller machine vault cash payable
|
- | 250,000 | ||||||
|
Notes payable - related parties - current portion, net
|
29,740 | 26,722 | ||||||
|
Notes payable - current portion
|
21,777 | 19,803 | ||||||
|
Senior lenders' notes payable - current portion, net
|
2,426,915 | 1,828,572 | ||||||
|
Capital lease obligations - current portion
|
455,188 | 667,233 | ||||||
|
Total current liabilities
|
7,538,457 | 5,775,913 | ||||||
|
Long-term liabilities
|
||||||||
|
Notes payable - related parties - long-term portion, net
|
43,694 | 72,690 | ||||||
|
Notes payable - long-term portion
|
51,476 | 73,120 | ||||||
|
Senior lenders' notes payable - long-term portion, net
|
6,622,539 | 3,300,000 | ||||||
|
Capital lease obligations - long-term portion
|
205,275 | 329,314 | ||||||
|
Total liabilities
|
14,461,441 | 9,551,037 | ||||||
|
Stockholders' equity
|
||||||||
|
Preferred stock; $0.001 par value; 5,000,000 shares authorized, no shares issued and outstanding
|
- | - | ||||||
|
Common stock; $0.001 par value; 45,000,000 shares authorized, 22,292,469 and 21,931,786 shares issued and 22,139,444 and 21,883,924 shares outstanding at December 31, 2010 and December 31, 2009, respectively
|
22,188 | 21,932 | ||||||
|
Additional paid-in capital
|
23,202,338 | 22,900,880 | ||||||
|
Accumulated deficit
|
(7,198,502 | ) | (6,344,934 | ) | ||||
|
Treasury stock; 153,025 and 47,862 shares of common stock at cost at December 31, 2010 and December 31, 2009, respectively
|
(81,966 | ) | (11,966 | ) | ||||
|
Total stockholders' equity
|
15,944,058 | 16,565,912 | ||||||
|
Total liabilities and stockholders' equity
|
$ | 30,405,499 | $ | 26,116,949 | ||||
See Accompanying Independent Registered Public Accounting Firm’s Report and Notes to Consolidated Financial Statements
3
GLOBAL AXCESS CORP AND SUBSIDIARIES
CONSOLIDATED STATEMENTS OF INCOME
|
For the Fiscal Years Ended December 31,
|
||||||||||||
|
2010
|
2009
|
2008
|
||||||||||
|
Revenues
|
$ | 22,743,335 | $ | 21,494,867 | $ | 22,171,072 | ||||||
|
Cost of revenues
|
13,355,741 | 11,316,919 | 12,347,991 | |||||||||
|
Gross profit
|
9,387,594 | 10,177,948 | 9,823,081 | |||||||||
|
Operating expenses
|
||||||||||||
|
Depreciation expense
|
1,597,333 | 1,178,927 | 1,411,360 | |||||||||
|
Amortization of intangible merchant contracts
|
854,685 | 786,173 | 770,270 | |||||||||
|
Impairment of long-lived assets
|
481,993 | - | - | |||||||||
|
Selling, general and administrative
|
6,671,443 | 5,437,624 | 5,288,959 | |||||||||
|
Stock compensation expense
|
215,813 | 120,188 | 159,840 | |||||||||
|
Total operating expenses
|
9,821,267 | 7,522,912 | 7,630,429 | |||||||||
|
Operating income (loss) from operations before items shown below
|
(433,673 | ) | 2,655,036 | 2,192,652 | ||||||||
|
Interest expense, net
|
(522,083 | ) | (645,758 | ) | (1,046,287 | ) | ||||||
|
Gain on sale or disposal of assets
|
- | - | 23,872 | |||||||||
|
Loss on early extinguishment of debt
|
(102,146 | ) | (474,960 | ) | - | |||||||
|
Income (loss) from operations before income tax benefit
|
(1,057,902 | ) | 1,534,318 | 1,170,237 | ||||||||
|
Income tax benefit
|
204,334 | 1,278,888 | - | |||||||||
|
Net income (loss)
|
$ | (853,568 | ) | $ | 2,813,206 | $ | 1,170,237 | |||||
|
Income (loss) per common share - basic:
|
||||||||||||
|
Net income (loss) per common share
|
$ | (0.04 | ) | $ | 0.13 | $ | 0.06 | |||||
|
Income (loss) per common share - diluted:
|
||||||||||||
|
Net income (loss) per common share
|
$ | (0.04 | ) | $ | 0.12 | $ | 0.06 | |||||
|
Weighted average common shares outstanding:
|
||||||||||||
|
Basic
|
21,980,369 | 21,654,554 | 20,973,924 | |||||||||
|
Diluted
|
21,980,369 | 22,845,241 | 20,973,924 | |||||||||
See Accompanying Independent Registered Public Accounting Firm’s Report and Notes to Consolidated Financial Statements
4
GLOBAL AXCESS CORP AND SUBSIDIARIES
CONSOLIDATED STATEMENTS OF STOCKHOLDERS' EQUITY
FOR THE YEARS ENDED DECEMBER 31, 2010, 2009 AND 2008
|
|
Additional
|
Total
|
||||||||||||||||||||||
|
Common Stock
|
Paid-in
|
Accumulated
|
Treasury
|
Stockholders'
|
||||||||||||||||||||
|
Shares
|
Amount
|
Capital
|
Deficit
|
Stock
|
Equity
|
|||||||||||||||||||
|
Balances, December 31, 2007
|
20,973,924 | $ | 21,022 | $ | 22,453,584 | $ | (10,328,377 | ) | $ | (11,966 | ) | $ | 12,134,263 | |||||||||||
|
Stock compensation expense
|
- | - | 159,840 | - | - | 159,840 | ||||||||||||||||||
|
Net income
|
- | - | - | 1,170,237 | - | 1,170,237 | ||||||||||||||||||
|
Balances, December 31, 2008
|
20,973,924 | $ | 21,022 | $ | 22,613,424 | $ | (9,158,140 | ) | $ | (11,966 | ) | $ | 13,464,340 | |||||||||||
|
Stock compensation expense
|
- | - | 120,188 | - | - | 120,188 | ||||||||||||||||||
|
Stock options issued to consultants in lieu of cash compensation
|
- | - | 23,999 | - | - | 23,999 | ||||||||||||||||||
|
Stock expense relating to early extinguishment of debt
|
- | - | 135,079 | - | - | 135,079 | ||||||||||||||||||
|
Stock warrants excercised
|
910,000 | 910 | 8,190 | - | - | 9,100 | ||||||||||||||||||
|
Net income
|
- | - | - | 2,813,206 | - | 2,813,206 | ||||||||||||||||||
|
Balances, December 31, 2009
|
21,883,924 | $ | 21,932 | $ | 22,900,880 | $ | (6,344,934 | ) | $ | (11,966 | ) | $ | 16,565,912 | |||||||||||
|
Stock compensation expense
|
- | - | 215,813 | - | - | 215,813 | ||||||||||||||||||
|
Stock warrants exercised, cashless
|
128,571 | 129 | 39,871 | - | (40,000 | ) | - | |||||||||||||||||
|
Stock options exercised, cashless
|
60,016 | 60 | 29,940 | - | (30,000 | ) | - | |||||||||||||||||
|
Exercise of stock options
|
66,933 | 67 | 15,834 | - | - | 15,901 | ||||||||||||||||||
|
Net loss
|
- | - | - | (853,568 | ) | - | (853,568 | ) | ||||||||||||||||
|
Balances, December 31, 2010
|
22,139,444 | $ | 22,188 | $ | 23,202,338 | $ | (7,198,502 | ) | $ | (81,966 | ) | $ | 15,944,058 | |||||||||||
See Accompanying Independent Registered Public Accounting Firm’s Report and Notes to Consolidated Financial Statements
5
GLOBAL AXCESS CORP AND SUBSIDIARIES
CONSOLIDATED STATEMENTS OF CASH FLOWS
|
For the Fiscal Years Ended December 31,
|
||||||||||||
|
2010
|
2009
|
2008
|
||||||||||
|
Cash flows from operating activities:
|
||||||||||||
|
Income (loss) from operations
|
$ | (853,568 | ) | $ | 2,813,206 | $ | 1,170,237 | |||||
|
Adjustments to reconcile net income (loss) from operations to net cash provided by operating activities:
|
||||||||||||
|
Stock based compensation
|
215,813 | 120,188 | 159,840 | |||||||||
|
Stock options issued to consultants in lieu of cash compensation
|
- | 23,999 | - | |||||||||
|
Loss on early extinguishment of debt
|
61,508 | 474,960 | - | |||||||||
|
Depreciation expense
|
1,597,333 | 1,178,927 | 1,411,360 | |||||||||
|
Amortization of intangible merchant contracts
|
854,685 | 786,173 | 770,270 | |||||||||
|
Amortization of capitalized loan fees
|
43,930 | 26,756 | 46,431 | |||||||||
|
Impairment of long-lived assets
|
481,993 | - | - | |||||||||
|
Allowance for doubtful accounts
|
9,492 | 2,883 | (14,201 | ) | ||||||||
|
Allowance for inventory obsolescence
|
88,000 | 40,539 | 54,033 | |||||||||
|
Non-cash interest (income) expense on swap agreement with senior lender
|
- | (7,921 | ) | 40,985 | ||||||||
|
Accretion of discount on notes payable
|
- | 50,066 | 165,988 | |||||||||
|
(Gain) loss on sale or disposal of assets
|
- | - | (23,872 | ) | ||||||||
|
Changes in operating assets and liabilities, net of effects of acquisition of FMiATM:
|
||||||||||||
|
Change in automated teller machine vault cash
|
250,000 | (250,000 | ) | - | ||||||||
|
Change in accounts receivable
|
424,552 | 490 | 90,457 | |||||||||
|
Change in inventory
|
(1,406,431 | ) | (112,270 | ) | 116 | |||||||
|
Change in prepaid expenses and other current assets
|
(7,451 | ) | 26,468 | (23,620 | ) | |||||||
|
Change in other assets
|
(36,500 | ) | (21,075 | ) | 5,907 | |||||||
|
Change in intangible assets, net
|
(228,743 | ) | (80,734 | ) | 634 | |||||||
|
Change in deferred taxes
|
(292,745 | ) | (1,342,666 | ) | - | |||||||
|
Change in accounts payable and accrued liabilities
|
1,476,254 | 464,108 | (875,224 | ) | ||||||||
|
Change in automated teller machine vault cash payable
|
(250,000 | ) | 250,000 | - | ||||||||
|
Net cash provided by operating activities
|
2,428,122 | 4,444,097 | 2,979,341 | |||||||||
|
Cash flows from investing activities:
|
||||||||||||
|
Proceeds from sale of equipment
|
24,550 | - | - | |||||||||
|
Cash paid for FMiATM acquisition
|
(914,571 | ) | - | - | ||||||||
|
Insurance proceeds on disposal of fixed assets
|
- | - | 72,681 | |||||||||
|
Costs of acquiring merchant contracts
|
(379,916 | ) | (120,660 | ) | (43,758 | ) | ||||||
|
Purchase of property and equipment
|
(5,342,743 | ) | (1,051,494 | ) | (290,304 | ) | ||||||
|
Net cash used in investing activities
|
(6,612,680 | ) | (1,172,154 | ) | (261,381 | ) | ||||||
|
Cash flows from financing activities:
|
||||||||||||
|
Proceeds from issuance of common stock
|
15,901 | 9,100 | - | |||||||||
|
Proceeds from senior lenders' notes payable
|
10,039,655 | 6,200,000 | 39,028 | |||||||||
|
Proceeds from notes payable
|
710,532 | 69,905 | - | |||||||||
|
Change in restricted cash
|
800,000 | (800,000 | ) | - | ||||||||
|
Principal payments on senior lenders' notes payable
|
(6,118,773 | ) | (6,171,429 | ) | (704,177 | ) | ||||||
|
Principal payments on notes payable
|
(730,201 | ) | (11,833 | ) | (25,000 | ) | ||||||
|
Principal payments on notes payable - related parties
|
(25,978 | ) | (1,248,186 | ) | (20,695 | ) | ||||||
|
Principal payments on capital lease obligations
|
(770,876 | ) | (872,550 | ) | (986,367 | ) | ||||||
|
Net cash provided by (used in) financing activities
|
3,920,260 | (2,824,993 | ) | (1,697,211 | ) | |||||||
|
Increase (decrease) in cash
|
(264,298 | ) | 446,950 | 1,020,749 | ||||||||
|
Cash, beginning of year
|
2,007,860 | 1,560,910 | 540,161 | |||||||||
|
Cash, end of the year
|
$ | 1,743,562 | $ | 2,007,860 | $ | 1,560,910 | ||||||
|
Cash paid for interest
|
$ | 486,889 | $ | 555,969 | $ | 786,697 | ||||||
See Accompanying Independent Registered Public Accounting Firm’s Report and Notes to Consolidated Financial Statements
6
GLOBAL AXCESS CORP AND SUBSIDIARIES
CONSOLIDATED STATEMENTS OF CASH FLOWS
|
For the Fiscal Years Ended December 31,
|
||||||||||||
|
SUPPLEMENTAL CASH FLOW INFORMATION
|
2010
|
2009
|
2008
|
|||||||||
|
The significant non-cash investing and financing activities of the Company were as follows:
|
||||||||||||
|
Operating activities:
|
||||||||||||
|
Accretion of asset retirement obligation
|
$ | 25,000 | $ | - | $ | - | ||||||
|
Net transfer of de-installed net fixed assets to (from) inventory
|
(236,856 | ) | (40,431 | ) | 95,283 | |||||||
|
Total non-cash operating activities
|
$ | (211,856 | ) | $ | (40,431 | ) | $ | 95,283 | ||||
|
Investing activities:
|
||||||||||||
|
Purchase of assets under capital lease obligations
|
$ | 434,792 | $ | 663,525 | $ | 407,404 | ||||||
|
Net transfer of de-installed net fixed assets (to) from inventory
|
236,856 | 40,431 | (95,283 | ) | ||||||||
|
Total non-cash investing activities
|
$ | 671,648 | $ | 703,956 | $ | 312,121 | ||||||
|
Acquisition of assets of FMiATM:
|
||||||||||||
|
Automated teller machines
|
$ | 346,386 | $ | - | $ | - | ||||||
|
Merchant contracts
|
688,185 | - | - | |||||||||
|
Assets acquired
|
1,034,571 | - | - | |||||||||
|
Accounts payable and accrued liabilities
|
(120,000 | ) | - | - | ||||||||
| $ | 914,571 | $ | - | $ | - | |||||||
|
Financing activities:
|
||||||||||||
|
Settlement of stock option and warrant exercises through issuance of treasury stock:
|
||||||||||||
|
Repurchase of treasury stock, 105,163 shares of common stock at cost
|
$ | (70,000 | ) | $ | - | $ | - | |||||
|
Total non-cash financing activities
|
$ | (70,000 | ) | $ | - | $ | - | |||||
See Accompanying Independent Registered Public Accounting Firm’s Report and Notes to Consolidated Financial Statements
7
GLOBAL AXCESS CORP AND SUBSIDIARIES
NOTES TO CONSOLIDATED FINANCIAL STATEMENTS
AS OF DECEMBER 31, 2010
|
|
1.
|
DESCRIPTION OF THE COMPANY’S BUSINESS AND BASIS OF PRESENTATION
|
Global Axcess Corp (the “Company”), is a Nevada corporation organized in 1984. The Company, primarily through its wholly owned subsidiaries, Nationwide Money Services, Inc., Nationwide Ntertainment Services, Inc. and EFT Integration Inc., is an independent provider of self-service kiosk services. Nationwide Ntertainment Services, Inc. was formed during fiscal 2009. These solutions include ATM and DVD kiosk management and support services focused on serving the self-service kiosk needs of merchants, grocers, retailers and financial institutions nationwide. It is a one-stop gateway for unattended self-service kiosk management services. The Company’s fiscal year ended December 31, 2010.
|
|
2.
|
SUMMARY OF SIGNIFICANT ACCOUNTING POLICIES
|
Cash Equivalents
The Company considers all highly-liquid investments with a maturity of three months or less when purchased to be cash equivalents.
Concentration of Credit Risk
Financial instruments that potentially subject the Company to concentration of credit risk consist primarily of temporary cash investments. The Company has several bank accounts maintained with one financial institution and amounts on deposit may, at times, exceed federally insurable amounts.
Principles of consolidation
The consolidated financial statements include the accounts of Global Axcess Corp and its subsidiaries. The Company has the following subsidiaries: Nationwide Money Services, Inc., Nationwide Ntertainment Services, Inc. and EFT Integration, Inc. All significant inter-company balances and transactions have been eliminated in consolidation.
Reclassifications
Certain amounts in the fiscal year 2009 consolidated financial statements have been reclassified to conform to the fiscal year 2010 presentation. Such reclassifications had no effect on the net income or shareholders’ equity as previously reported.
Merchant contract concentration
The Company contracts the locations for its ATMs with various merchants. As of December 31, 2010, the Company has approximately 4,700 active ATMs, of which approximately 692 machines are contracted through a single merchant. Revenues from this merchant were approximately 22.9%, 22.8% and 24.1% of total revenues for the fiscal years ended December 31, 2010, 2009 and 2008, respectively.
Use of estimates
The preparation of the consolidated financial statements in conformity with accounting principles generally accepted in the United States of America requires management to make estimates and assumptions that affect the amounts reported in the consolidated financial statements and accompanying notes. Actual results could differ from these estimates.
Revenue recognition
Transaction service and processing fees are recognized in the period that the service is performed. The Company receives two types of fees: surcharge/convenience fees paid by consumers utilizing certain ATMs owned or managed by the Company; and interchange fees paid by their banks. Processing fees are generally charged on a per transaction basis, depending on the contractual arrangement with the client. ATM sales revenue is recognized when the ATM is shipped and installed. Revenue from managing ATMs for others is recognized each month when the services are performed.
8
Branding fees are generated by the Company’s bank branding arrangements, under which financial institutions pay a fixed monthly fee per ATM to the Company to have their brand name on selected ATMs within the Company’s ATM portfolio. In return for such fees, the bank’s customers can use those branded ATMs without paying a surcharge fee. Branding fees are recognized in the period that the service is performed. None of the branding fees are subject to escalation clauses. Should the Company include escalation clauses in its future branding contracts, pursuant to Generally Accepted Accounting Principles (”GAAP”) guidelines for revenue recognition, the monthly per ATM branding fees, which would be subject to escalation clauses within the agreements, would be recognized as revenues on a straight-line basis over the term of the agreement. In most of its branding agreements, the Company does not receive any one-time set-up fees in addition to the monthly branding fees. The Company has received immaterial one-time set-up fees per ATM. This set-up fee is separate from the recurring, monthly branding fees and is meant to compensate the Company for the burden incurred related to the initial set-up of a branded ATM versus the on-going monthly services provided for the actual branding. Since any and all one-time set up fees have been immaterial to date, the Company has recorded the fee upon contract signing. Should any future branding agreements contain material set-up fees, in accordance with GAAP, the Company would defer these set-up fees (as well as the corresponding costs associated with the initial set-up) and recognize such amounts as revenue (and expense) over the terms of the underlying bank branding agreements.
Additionally, the Company recognizes revenue on breached contracts when cash is received. During the fiscal year ended December 31, 2010, the Company did not record any revenue on breached contracts.
In connection with the Company’s merchant-owned ATM operating/processing arrangements, the Company typically pays the surcharge fees that it earns to the merchant as fees for providing, placing, and maintaining the ATM unit. In accordance with GAAP, the Company has recorded such payments as a direct reduction of revenue.
The Company follows GAAP in reporting revenue gross as a principal versus net as an agent for its merchant contracts. In accordance with GAAP, if the company performs as an agent or broker without assuming the risks and rewards of ownership of the goods, sales should be and are reported on a net basis.
The Company is not exposed to similar financial obligations and risks on merchant-owned ATM contracts as it is on its company-owned ATM contracts. For example, under a merchant-owned arrangement, the merchant is responsible for most of the operating expenses of the ATM such as maintenance, cash management and loading, supplies, signage and telecommunication services. As such, the Company reports the surcharge/convenience fees relating to merchant-owned ATM arrangements on a net basis.
Through our wholly-owned subsidiary, Nationwide Ntertainment Services, Inc., we are also engaged in the business of operating a network of DVD rental kiosks. We offer self-service DVD rentals through kiosks where consumers can rent or purchase movies or games. Our current DVD kiosks are installed primarily at grocery stores. Our DVD kiosks, through our brand InstaFlix, serve as a mini video rental store and occupy an area of less than ten square feet. Consumers use a touch screen to select their DVD, swipe a valid credit or debit card, and rent movies or games in some kiosks. The process is designed to be fast, efficient and fully automated with no upfront or membership fees. Typically, the DVD rental price is a flat fee plus tax for one night and if the consumer chooses to keep the DVD for additional nights, they are automatically charged for the additional fee. We generate revenue primarily through fees charged to rent or purchase a DVD, and pay our retail partners a percentage of our revenue.
Net revenue from DVD movie rentals is recognized on a ratable basis during the term of a consumer's rental transaction. On rental transactions for which the related DVDs have not yet been returned to the kiosk at month-end, revenue is recognized with a corresponding receivable recorded in the balance sheet, net of a reserve for potentially uncollectible amounts. We record revenue net of refunds to consumers.
During the fiscal year ended December 31, 2010, revenues generated from our DVD rental kiosks were $1,252,229.
9
Total Revenue and Total Cost of Revenues Presentation
The Company presents “Revenues” and “Cost of revenues” as single line items in the consolidated statements of income. The following tables set forth the revenue and cost of revenues sources included in the single line items presented for the fiscal years ended December 31, 2010, 2009 and 2008:
Revenues:
|
For the year ended
|
For the year ended
|
For the year ended
|
||||||||||
|
December 31, 2010
|
December 31, 2009
|
December 31, 2008
|
||||||||||
|
|
|
|||||||||||
|
ATM Surcharge / Convenience Fee revenue
|
$ | 12,617,673 | $ | 11,975,275 | $ | 11,782,306 | ||||||
|
ATM Interchange revenue
|
6,933,821 | 7,252,177 | 7,806,372 | |||||||||
|
ATM Processing revenue
|
175,044 | 210,329 | 286,914 | |||||||||
|
ATM Sales revenue
|
362,563 | 458,759 | 519,861 | |||||||||
|
Other ATM revenue
|
1,402,005 | 1,560,258 | 1,775,619 | |||||||||
|
DVD Rental revenue
|
1,252,229 | 38,069 | - | |||||||||
|
Total revenue
|
$ | 22,743,335 | $ | 21,494,867 | $ | 22,171,072 | ||||||
|
For the year ended
|
For the year ended
|
For the year ended
|
||||||||||
|
December 31, 2010
|
December 31, 2009
|
December 31, 2008
|
||||||||||
|
|
||||||||||||
|
ATM Operating revenue
|
$ | 21,128,543 | $ | 20,998,039 | $ | 21,651,211 | ||||||
|
ATM Sales revenue
|
362,563 | 458,759 | 519,861 | |||||||||
|
DVD Operating revenue
|
1,252,229 | 38,069 | - | |||||||||
|
Total revenue
|
$ | 22,743,335 | $ | 21,494,867 | $ | 22,171,072 | ||||||
Cost of Revenues:
|
For the year ended
|
For the year ended
|
For the year ended
|
||||||||||
|
December 31, 2010
|
December 31, 2009
|
December 31, 2008
|
||||||||||
|
|
|
|||||||||||
|
ATM Merchant residual / commission costs
|
$ | 6,392,182 | $ | 6,480,422 | $ | 7,051,263 | ||||||
|
ATM Cost of cash
|
2,201,353 | 1,738,813 | 2,025,680 | |||||||||
|
ATM Processing costs
|
1,056,710 | 860,910 | 848,428 | |||||||||
|
ATM Communication costs
|
557,940 | 593,642 | 562,030 | |||||||||
|
ATM Sales costs
|
360,844 | 434,693 | 486,901 | |||||||||
|
Other ATM cost of revenues
|
1,212,998 | 1,157,529 | 1,373,689 | |||||||||
|
DVD operating costs
|
1,573,714 | 50,910 | - | |||||||||
|
Total cost of revenues
|
$ | 13,355,741 | $ | 11,316,919 | $ | 12,347,991 | ||||||
|
For the year ended
|
For the year ended
|
For the year ended
|
||||||||||
|
December 31, 2010
|
December 31, 2009
|
December 31, 2008
|
||||||||||
|
|
|
|||||||||||
|
Cost of ATM Operating revenue
|
$ | 11,421,183 | $ | 10,831,316 | $ | 11,861,090 | ||||||
|
ATM Sales costs
|
360,844 | 434,693 | 486,901 | |||||||||
|
Cost of DVD Operating revenue
|
1,573,714 | 50,910 | - | |||||||||
|
Total cost of revenues
|
$ | 13,355,741 | $ | 11,316,919 | $ | 12,347,991 | ||||||
10
Accounts Receivable
The Company reviews the accounts receivable on a regular basis to determine the collectibility of each account. The Company maintains allowances for doubtful accounts for estimated losses resulting from the failure of its customers to make required payments. At each reporting period, the Company evaluates the adequacy of the allowance for doubtful accounts and calculates the appropriate allowance based on historical experience, credit evaluations, specific customer collection issues and the length of time a receivable is past due. The Company records an allowance for doubtful accounts for a percentage of any billed invoice aged past 60 days. When the Company deems the receivable to be uncollectible, the Company charges the receivable against the allowance for doubtful accounts. As of December 31, 2010 and 2009, the Company reserved $4,354 and $12,616 as an allowance for doubtful accounts against the accounts receivable of $415,310 and $857,616, respectively.
Inventory
Inventory is stated at the lower of cost (first-in, first-out method) or market. Inventory consists primarily of ATMs, DVD rental kiosks and related parts and equipment. Parts relating to upgrading ATMs to become Triple DES compliant were recorded to fixed assets when the part was placed into service, if the ATM is company-owned. Parts relating to upgrading ATMs to become Triple DES compliant were recorded to Merchant Contracts when the part was placed into service, if the ATM is merchant-owned and the merchant signed a term extension to an existing contract. The cost of the part was subsequently amortized over the life of the contract extension. Parts relating to upgrading ATMs to become Triple DES compliant were expensed when the part was placed into service, if the Company upgraded the merchant-owned ATMs at no charge to the merchant with no contract extension. ATMs and parts available for sale are classified as inventory until such time as the machine or part is sold or installed and in service. Once the ATM or part is sold, it is relieved to cost of revenues.
Also included in inventory is the library of DVDs in the Company’s DVD rental kiosks. DVDs are initially recorded at cost and are amortized into cost of sales over an assumed useful life to their estimated salvage value and substantially all of the amortization expense is recognized within one year of the assumed life of the DVDs.
The Company reserves for inventory obsolescence based upon physical inventory count and evaluations of how long items remain in inventory combined with historical usage of respective items. At December 31, 2010 and 2009, the Company's inventory, net of an allowance for obsolescence of $182,572 and $94,572, totaled $1,389,606 and $308,031, respectively.
Fixed assets
Fixed assets are stated at cost, less accumulated depreciation and amortization. Leasehold improvements are amortized on a straight-line basis over the shorter of the lease term or the life of the asset. The cost of repairs and maintenance is charged to expense as incurred. Expenditures for property improvements and renewals are capitalized, if they extend the useful life of the related asset. Upon the sale or other disposition of a depreciable asset, cost and accumulated depreciation are removed from the accounts and any gain or loss is reflected in gain (loss) on sale of assets.
The Company periodically evaluates whether events and circumstances have occurred that may warrant revision of the estimated useful life of fixed assets or whether the remaining balance of fixed assets should be evaluated for possible impairment. The Company uses an estimate of the related undiscounted cash flows over the remaining life of the fixed assets in measuring their recoverability, as well as historical age, to estimate useful economic lives and values. In fiscal 2010, the Company recognized an impairment charge of $481,993 relating to certain DVD kiosk assets. Refer to Financial Footnote # 24 “Impairment of Long-Lived Assets” for further information.
Depreciation is recognized using the straight-line method over the following approximate useful lives.
|
Useful Life
|
|
|
ATMs
|
10 years
|
|
DVD kiosks
|
5 years
|
|
Computers and software
|
3-5 years
|
|
Office furniture and equipment
|
5 years
|
|
Vehicles
|
5 years
|
|
Leasehold improvements
|
shorter of lease term or useful
|
|
life of improvement
|
11
Lease Committments
The Company is party to various operating leases relating to office facilities and certain other equipment with various expiration dates. All leasing arrangements contain normal leasing terms without unusual purchase options or escalation clauses. Rental expense under operating leases aggregated $229,818, $206,068 and $218,379 for the years ended December 31, 2010, 2009 and 2008, respectively. The Company is also party to various capital leases for ATMs and related components. The assets associated with these capital leases are recorded as fixed assets and depreciated accordingly. The capital lease obligation is recorded and amortized over the life the of the lease.
Asset Retirement Obligations
The Company estimates the fair value of future retirement costs associated with its ATMs and DVD rental kiosks and recognizes this amount as a liability in the period in which it is incurred, on a pooled basis based on estimated deinstallation dates, and can be reasonably estimated. The Company’s estimates of fair value involve discounted future cash flows. Subsequent to recognizing the initial liability, the Company recognizes an ongoing expense for changes in such liabilities due to the passage of time (i.e., accretion expense), which is recorded in the depreciation expense line in the accompanying consolidated financial statements. As the liability is not revalued on a recurring basis, it is annually reevaluated based on current information. Upon settlement of the liability, the Company recognizes a gain or loss for any difference between the settlement amount and the liability recorded. As of December 31, 2010 and 2009, the Company had accrued $88,074 and $63,074, respectively for asset retirement obligations included in accounts payable and accrued liabilities on the consolidated balance sheets.
Merchant Contracts and Intangible Assets, including Goodwill
In June 2001, the Financial Accounting Standards Board issued guidance on goodwill and other intangible assets. The guidance established accounting and reporting standards for goodwill and intangible assets resulting from business combinations. The guidance included provisions discontinuing the periodic amortization of, and requiring the assessment of, the potential impairments of goodwill (and intangible assets deemed to have indefinite lives). As the guidance replaced the measurement guidelines for goodwill impairment, goodwill not considered impaired under previous accounting literature may now be considered impaired under GAAP. The guidance also required that the Company complete a two-step goodwill impairment test. The first step compares the fair value of each reporting unit to its carrying amount, including goodwill. If the fair value of a reporting unit exceeded its carrying amount, goodwill is not considered to be impaired and the second step is not required. The guidance required completion of this first step within the first nine months of initial adoption and annually thereafter. If the carrying amount of a reporting unit exceeded its fair value, the second step is performed to measure the amount of impairment loss. The second step compared the implied fair value of goodwill to the carrying value of a reporting unit's goodwill. The implied fair value of goodwill is determined in a manner similar to accounting for a business combination with the allocation of the assessed fair value determined in the first step to the assets and liabilities of the reporting unit. The excess of the fair value of the reporting unit over the amounts assigned to the assets and liabilities is the implied fair value of goodwill. This allocation process is only performed for purposes of evaluating goodwill impairment and does not result in an entry to adjust the value of any assets or liabilities. An impairment loss is recognized for any excess in the carrying value of goodwill over the implied fair value of goodwill.
In June 2001, the Company acquired 100% of the outstanding capital stock of Nationwide Money Services, Inc. in consideration of 3,874,000 shares of the Company's common stock, including 149,000 shares for a finder's fee. This acquisition was recorded using the purchase method of accounting under GAAP and as such, the Company accounted for its 100% ownership interest in Nationwide. The results of operations for the acquired company have been included in the consolidated financial results of the Company from the date of such transaction forward.
The purchase price amount in excess of fair value of net assets was allocated to merchant account contracts totaling $1,020,000, which is being amortized on a straight-line basis primarily over the estimated useful lives of 21 years, and goodwill totaling $1,311,195.
Additionally, the Company purchased 900 Merchant ATM contracts in February 2004. The purchase price was $3,900,000 and was reflected in Merchant Contracts. During September 2004, the Company made two additional acquisitions: one for 111 ATM contracts, and another for 745 ATM contracts. The prices for those acquisitions were $918,000 and $7,000,000, respectively. In these two acquisitions, the Company also acquired ATM machines with the fair value of $166,500 and $1,200,000, respectively.
12
When the Company acquires another company’s assets, GAAP requires the Company to estimate the fair value of the other company's tangible assets and liabilities and identifiable intangible assets. Any unallocated purchase price has been recorded as goodwill. The Company applies GAAP to review for impairment to the intangible goodwill and merchant contracts. As of September 2004, the Company had relied on the reported values of the assets acquired from the seller to estimate fair value. In reviewing the seller's balances, current fair values in the market, discounted cash flow analysis of the merchant contracts; and after considering the outlay of cash for maintenance and capital costs along with the projected income from the future income stream from the contracts, the Company allocated $2,878,450 of the ATM Network's asset purchase to goodwill, as of December 31, 2004, all other acquisitions assets had fair values equal or greater than the acquisition price. To date, the Company’s testing has indicated that there is no impairment of its goodwill.
Intangible assets with finite lives and merchant contracts are stated at cost, net of accumulated amortization, and are subject to impairment testing under certain circumstances in accordance with GAAP. These assets are amortized on the straight-line method over their estimated useful lives or period of expected benefit. These assets are subject to periodic impairment testing in accordance with GAAP.
The Company’s merchant contracts are made up of contracts with automatic renewable lives. The Company has determined after review of its contracts that the economic life of the contracts is extended and estimated primarily over 21 years (or three times renewal) based on historical and expected useful lives of similar assets. The Company amortizes the merchant contracts over their estimated useful lives of 21 years. The Company uses a two step valuation process to determine if there has been any impairment on the value of the merchant contract assets. Additionally, when the Company gives away an ATM part to induce a contract extension from the merchant, the Company records the value of the ATM part to Merchant Contracts and amortizes the value of the part over the life of the contract extension.
The first step in impairment testing is to periodically assess the remaining contract lives, including expected renewals. If the periodic assessment results in a determination that the economic lives of the merchant contracts are less than 21 years, the Company adjusts the remaining amortization lives of the merchant contracts. The Company’s merchant contracts have an average initial term of approximately seven years. While the Company has historically experienced a higher turnover rate among its merchant-owned clients than with its company-owned portfolio, the Company is currently experiencing an average of 2.2 renewals on its current merchant-owned contracts acquired. In accordance with GAAP, an entity shall consider its own historical experience about renewal or extension used to determine the useful life of a recognized intangible asset. Until such time when the Company’s historical experience does not support the useful and economic life of the merchant contracts, the Company concludes that the current economic life of 21 years is appropriate.
The second step is to compare the estimated future undiscounted cash flows of each reporting unit to the carrying amount of the merchant contracts, thus testing the impairment of the value of the contracts. An impairment loss is recognized for any excess in the carrying value of merchant contracts over the assessed fair value of merchant contracts. To date, the Company’s testing has indicated that there is no impairment of its goodwill and merchant contracts.
Impairment of Long-Lived Assets
In accordance with GAAP, the Company reviews its long-lived assets, including property and equipment and capitalized software development, for impairment whenever events or changes in circumstances indicate that the carrying amount of the assets may not be fully recoverable. To determine recoverability of its long-lived assets, the Company evaluates the probability that future undiscounted net cash flows will be less than the carrying amount of the assets. If future estimated undiscounted cash flows are less than the carrying amount of long-lived assets, then such assets are written down to their estimated fair value. During the fiscal year ended December 31, 2010, the Company recorded $481,993 of impairment. During the fiscal years ended December 31 2009 and 2008, the Company recorded no impairment charges of long-lived assets.
13
Fair value of financial instruments
The carrying amounts of the Company’s long-term liabilities approximate the estimated fair values at December 31, 2010 and 2009, based upon the Company’s ability to acquire similar debt at similar maturities. The carrying values of all other financial instruments approximate their fair value, because of the short-term maturities of these instruments.
Earnings per share
In calculating basic income per share, net income is divided by the weighted average number of common shares outstanding for the period. Diluted income per share reflects the assumed exercise or conversion of all dilutive securities, such as options and warrants. No such exercise or conversion is assumed where the effect is anti-dilutive, such as when there is a net loss from operations or when the exercise price of the potentially dilutive securities is less than the market value of the Company’s stock.
Income taxes
The Company accounts for its income taxes in accordance with GAAP which requires recognition of deferred tax assets and liabilities for future tax consequences attributable to differences between the financial statement carrying amounts of existing assets and liabilities and their respective tax basis and tax credit carry-forwards. Deferred tax assets and liabilities are recognized for the future tax consequences attributable to differences between financial statement carrying amounts of existing assets and liabilities and their respective tax bases. Deferred tax assets and liabilities are measured using enacted tax rates expected to be applied to taxable income in the years in which those temporary differences are expected to be recovered or settled. A valuation allowance is recorded to reduce the Company’s deferred tax assets to the amount that is more likely than not to be realized.
Pursuant to GAAP, when establishing a valuation allowance, the Company considers future sources of taxable income such as “future reversals of existing taxable temporary differences, future taxable income exclusive of reversing temporary differences and carryforwards” and “tax planning strategies.” GAAP defines a tax planning strategy as “an action that: is prudent and feasible; an enterprise ordinarily might not take, but would take to prevent an operating loss or tax credit carryforward from expiring unused; and would result in realization of deferred tax assets.” In the event the Company determines that the deferred tax assets will not be realized in the future, the valuation adjustment to the deferred tax assets is charged to earnings in the period in which the Company makes such a determination. If it is later determined that it is more likely than not that the deferred tax assets will be realized, the Company will release the valuation allowance to current earnings.
The amount of income taxes the Company pays is subject to ongoing audits by federal, state and foreign tax authorities. The Company’s estimate of the potential outcome of any uncertain tax issue is subject to management’s assessment of relevant risks, facts, and circumstances existing at that time, pursuant to GAAP. GAAP requires a more-likely-than-not threshold for financial statement recognition and measurement of tax positions taken or expected to be taken in a tax return. The Company records a liability for the difference between the benefit recognized and measured pursuant to GAAP and tax position taken or expected to be taken on the tax return. To the extent that the Company’s assessment of such tax positions changes, the change in estimate is recorded in the period in which the determination is made. Regarding interest and penalties associated with uncertain tax positions, the Company’s policy is to recognize such amounts under this standard as a component of tax expense.
Repairs and maintenance costs
Repairs and maintenance costs are expensed as incurred. Repairs and maintenance pertaining to the Company’s ATMs and DVD kiosks are recorded in cost of revenues. The Company records repairs and maintenance costs relating to general office and backend related equipment to general and administrative costs.
Performance Based 401k Contribution Plan
Effective fiscal years 2007 through 2009, the Company implemented a performance based incentive program matching 401k contributions. For each quarter, during fiscal years 2007 through 2009, the Company matched up to 50% of the first 6% of an employee’s 401k contributions during that respective quarter upon the Company achieving its net income budget. For fiscal 2010, the 401k contribution plan was not a performance based incentive program and was not tied to the Company achieving any financial goals or metrics therefore the Company matched up to 50% of the first 6% of an employee’s 401k contribution. The Company recorded $47,858, $21,050 and $44,741 of expenses relating to this plan during the fiscal years ended December 31, 2010, 2009 and 2008, respectively.
14
Performance Based Incentive Bonus Plan
Effective fiscal 2008, the Company implemented a performance based incentive program for employees and management of the Company. A quarterly cash bonus pool is funded by the Company’s achievement of net profits. During the fiscal years ended December 31, 2010, 2009 and 2008, the Company recorded $19,589, $214,083 and $178,927, respectively, of expenses relating to this plan.
Stock-based compensation
The Company calculates the fair value of stock-based instruments awarded to employees on the date of grant and recognizes the calculated fair value as compensation cost over the requisite service period. For additional information on the Company’s stock-based compensation, see Financial Footnote # 20 “Stock-Based Compensation.”
Off Balance Sheet Arrangements
We have no off balance sheet arrangements, obligations under any guarantee contracts or contingent obligations.
Recent accounting pronouncements
In June 2009, the FASB issued new accounting guidance for determining whether an entity is a variable interest entity and requires an enterprise to perform an analysis to determine whether the enterprise’s variable interest or interests give it a controlling financial interest in a variable interest entity. This guidance also requires an enterprise to assess whether it has an implicit financial responsibility to ensure that a variable interest entity operates as designed when determining whether it has power to direct the activities of the variable interest entity that most significantly impacts the entity’s economic performance. This guidance also requires ongoing assessments of whether an enterprise is the primary beneficiary of a variable interest entity, requires enhanced disclosures and eliminates the scope exclusion for qualifying special-purpose entities. This guidance is effective for annual reporting periods beginning after November 15, 2009. The adoption of this guidance did not have a material impact on our consolidated financial statements.
In June 2009, the FASB issued new accounting guidance to improve the relevance, representational faithfulness, and comparability of the information that a reporting entity provides in its financial statements about a transfer of financial assets; the effects of a transfer on its financial position, financial performance, and cash flows; and a transferor’s continuing involvement, if any, in transferred financial assets. Additionally, on and after the effective date, the concept of a qualifying special-purpose entity is no longer relevant for accounting purposes. This guidance is effective for annual reporting periods beginning after November 15, 2009. The adoption of this guidance is did not have a material impact on our consolidated financial statements.
In January 2010, the Financial Accounting Standards Board (“FASB”) issued Accounting Standards Update No. 2010-06 (“ASU 2010-06”), Improving Disclosures about Fair Value Measurements. ASU 2010-06 provides amendments to FASB ASC 820-10 that requires new fair value disclosures and clarifies existing fair value disclosures required under FASB ASC 820-10. The new disclosures and clarifications of existing disclosures are effective for interim and annual reporting periods beginning after December 15, 2009, except for certain disclosures about purchases, sales, issuances, and settlements in the roll forward activity in Level 3 fair value measurements. Those disclosures are effective for fiscal years beginning after December 15, 2010, and for interim periods within those fiscal years. The adoption of the new provisions within ASU 2010-06 is not expected to have an impact on our consolidated financial position, results of operations, cash flows, or disclosures.
In December 2010, the FASB issued ASU 2010-28, Intangibles – Goodwill and Other (Topic 350): When to Perform Step 2 of the Goodwill Impairment Test for Reporting Units with Zero or Negative Carrying Amounts . The ASU does not prescribe a specific method of calculating the carrying value of a reporting unit in the performance of step 1 of the goodwill impairment test (i.e. equity-value-based method or enterprise-value-based method). However, it requires entities with a zero or negative carrying value to assess, considering qualitative factors such as those used to determine whether a triggering event would require an interim goodwill impairment test (listed in ASC 350-20-35-30, Intangibles – Goodwill and Other – Subsequent Measurement ), whether it is more likely than not that a goodwill impairment exists and perform step 2 of the goodwill impairment test if so concluded. ASU 2010-28 is effective for the Company beginning January 1, 2011 and early adoption is not permitted. The Company does not expect the adoption of ASU 2010-28 to have a material impact on its consolidated financial position or results of operations.
15
|
|
3.
|
ACQUISITIONS OF ASSETS
|
Effective December 1, 2010, the Company acquired certain assets of FMiATM, Inc. (“FMi”), an owner and operator of unattended ATMs. Under the terms of the agreement, the Company acquired 140 ATMs and certain contractual rights with customers of FMi, for a total purchase price of approximately $1,034,571. The purchase price consists of $914,571 in cash within five days of December 17, 2010, $60,000 in cash to be paid on or before January 17, 2011 and $60,000 in cash to be paid on or before February 17, 2011. To the extent that a certain assigned contract is cancelled by the customer, up to approximately $182,000 of the purchase price is subject to clawback by the Company after closing. In the event the customer cancels the contract before the end of the current contract, which expires in February 2013, FMi will refund the Company the sum of $7,000 for every month (or partial thereof) the contract is not held to its full term.
The allocation of the purchase price is based upon estimates of the assets acquired in accordance with the relevant accounting guidance. The acquisition of FMi is based on management’s consideration of past and expected future performance. The allocation of the aggregate purchase price of this acquisition is as follows:
|
Automated teller machines
|
$ | 346,386 | ||
|
Merchant contracts
|
688,185 | |||
|
Assets acquired
|
$ | 1,034,571 |
The assets acquired in the FMi acquisition serve as collateral for borrowings as discussed in Financial Footnote # 12 “Senior Lenders’ Notes Payable.”
16
|
|
4.
|
QUARTERLY INFORMATION (IN THOUSANDS EXCEPT PER SHARE DATA):
|
|
Fiscal 2010 (unaudited)
|
||||||||||||||||
|
First
|
Second
|
Third
|
Fourth
|
|||||||||||||
|
Quarter
|
Quarter
|
Quarter
|
Quarter
|
|||||||||||||
|
Revenues
|
$ | 5,380 | $ | 5,507 | $ | 5,779 | $ | 6,077 | ||||||||
|
Gross profit
|
2,522 | 2,511 | 2,305 | 2,049 | ||||||||||||
|
Operating income from operations
|
440 | 332 | 42 | (1,248 | ) | |||||||||||
|
Net income (loss)
|
$ | 319 | $ | 121 | $ | (96 | ) | $ | (1,197 | ) | ||||||
|
Income (loss) per common share - basic:
|
||||||||||||||||
|
Net income (loss) per common share
|
$ | 0.02 | $ | 0.01 | $ | (0.00 | ) | $ | (0.05 | ) | ||||||
|
Income (loss) per common share - diluted:
|
||||||||||||||||
|
Net income (loss) per common share
|
$ | 0.01 | $ | 0.01 | $ | (0.00 | ) | $ | (0.05 | ) | ||||||
|
Weighted average common shares outstanding:
|
||||||||||||||||
|
Basic
|
21,892,152 | 21,943,940 | 21,954,030 | 22,129,040 | ||||||||||||
|
Diluted
|
23,758,755 | 23,751,471 | 21,954,030 | 22,129,040 | ||||||||||||
|
Fiscal 2009 (unaudited)
|
||||||||||||||||
|
First
|
Second
|
Third
|
Fourth
|
|||||||||||||
|
Quarter
|
Quarter
|
Quarter
|
Quarter
|
|||||||||||||
|
Revenues
|
$ | 5,414 | $ | 5,369 | $ | 5,315 | $ | 5,396 | ||||||||
|
Gross profit
|
2,559 | 2,555 | 2,527 | 2,537 | ||||||||||||
|
Operating income from operations
|
777 | 707 | 623 | 548 | ||||||||||||
|
Net income
|
$ | 97 | $ | 557 | $ | 476 | $ | 1,683 | ||||||||
|
Income per common share - basic:
|
||||||||||||||||
|
Net income per common share
|
$ | 0.01 | $ | 0.03 | $ | 0.02 | $ | 0.08 | ||||||||
|
Income per common share - diluted:
|
||||||||||||||||
|
Net income per common share
|
$ | 0.01 | $ | 0.03 | $ | 0.02 | $ | 0.07 | ||||||||
|
Weighted average common shares outstanding:
|
||||||||||||||||
|
Basic
|
20,973,924 | 21,873,924 | 21,883,924 | 21,883,924 | ||||||||||||
|
Diluted
|
20,973,924 | 22,321,389 | 23,471,284 | 23,606,552 | ||||||||||||
17
|
5.
|
ACCOUNTS RECEIVABLE
|
The components of accounts receivable for the periods presented are as follows:
|
December 31, 2010
|
December 31, 2009
|
|||||||
|
Trade accounts receivable, billed
|
$ | 104,111 | $ | 183,052 | ||||
|
Trade accounts receivable, unbilled
|
311,199 | 674,564 | ||||||
| 415,310 | 857,616 | |||||||
|
Less: allowance for doubtful accounts
|
4,354 | 12,616 | ||||||
|
Accounts receivable, net
|
$ | 410,956 | $ | 845,000 | ||||
|
6.
|
INVENTORY
|
The components of inventory for the periods presented are as follows:
|
December 31, 2010
|
December 31, 2009
|
|||||||
|
ATM Parts and supplies
|
$ | 127,495 | $ | 221,320 | ||||
|
Automated teller machines
|
202,482 | 120,679 | ||||||
|
DVD rental kiosks
|
222,942 | 60,604 | ||||||
|
DVD library
|
1,019,259 | - | ||||||
| 1,572,178 | 402,603 | |||||||
|
Less: reserve for inventory obsolescence
|
182,572 | 94,572 | ||||||
|
Inventory, net
|
$ | 1,389,606 | $ | 308,031 | ||||
|
|
7.
|
FIXED ASSETS
|
The components of fixed assets for the periods presented are as follows:
|
December 31, 2010
|
December 31, 2009
|
|||||||
|
Automated teller machines (A)
|
$ | 11,142,698 | $ | 10,094,375 | ||||
|
DVD rental kiosks
|
4,196,905 | 311,925 | ||||||
|
Furniture and fixtures
|
450,820 | 443,922 | ||||||
|
Computers, equipment and software (A)
|
3,174,977 | 2,356,724 | ||||||
|
Automobiles
|
456,622 | 412,322 | ||||||
|
Leasehold equipment
|
72,533 | 72,533 | ||||||
| 19,494,555 | 13,691,801 | |||||||
|
Less: accumulated depreciation and amortization (B)
|
9,912,994 | 8,392,140 | ||||||
|
Fixed assets, net
|
$ | 9,581,561 | $ | 5,299,661 | ||||
|
|
(A)
|
See Financial Footnote #13 “Capital Lease Obligations” for ATMs and computers held under capital leases.
|
|
|
(B)
|
Depreciation expense from operations for the years ended December 31, 2010, 2009 and 2008 was $1,597,333, $1,178,927 and $1,411,360, respectively.
|
18
|
|
8.
|
INTANGIBLE ASSETS AND MERCHANT CONTRACTS
|
The following table summarizes intangible assets and merchant contracts at December 31, 2010:
|
Gross Carrying Value
|
Accumulated
Amortization
|
Net
|
||||||||||
|
Goodwill
|
$ | 4,189,645 | $ | 168,286 | $ | 4,021,359 | ||||||
|
Other Intangible Assets
|
222,561 | 24,704 | 197,857 | |||||||||
|
Merchant contracts
|
15,853,061 | 4,974,032 | 10,879,029 | |||||||||
|
Total Intangible assets and merchant contracts
|
$ | 20,265,267 | $ | 5,167,022 | $ | 15,098,245 | ||||||
The following table summarizes intangible assets and merchant contracts at December 31, 2009:
|
Gross Carrying Value
|
Accumulated
Amortization
|
Net
|
||||||||||
|
Goodwill
|
$ | 4,189,645 | $ | 168,286 | $ | 4,021,359 | ||||||
|
Other Intangible Assets
|
89,701 | 15,149 | 74,552 | |||||||||
|
Merchant contracts
|
14,818,294 | 4,152,681 | 10,665,613 | |||||||||
|
Total Intangible assets and merchant contracts
|
$ | 19,097,640 | $ | 4,336,116 | $ | 14,761,524 | ||||||
The Company recorded amortization expense related to merchant contracts of $854,685, $786,173 and $770,270, for the years ended December 31, 2010, 2009 and 2008, respectively. The Company records the amortization of loan costs in interest expense.
Aggregate amortization over the next five years for merchant contracts, is expected to be as follows:
|
2011
|
$ | 951,562 | ||
|
2012
|
$ | 940,346 | ||
|
2013
|
$ | 859,021 | ||
|
2014
|
$ | 780,182 | ||
|
2015
|
$ | 763,642 |
The Company has no intangible assets, other than goodwill, that are not subject to amortization.
19
|
|
9.
|
ACCOUNTS PAYABLE AND ACCRUED LIABILITIES
|
The components of accounts payable and accrued liabilities for the periods presented are as follows:
|
December 31, 2010
|
December 31, 2009
|
|||||||
|
Accounts payable
|
$ | 1,688,818 | $ | 624,874 | ||||
|
Accrued commissions/residual payments
|
1,216,266 | 1,223,734 | ||||||
|
Accrued cost of cash and cash replenishment expenses
|
303,027 | 440,043 | ||||||
|
Accrued payroll
|
204,086 | 332,117 | ||||||
|
Accrued audit fees
|
84,500 | 84,000 | ||||||
|
Accrued interest
|
22,995 | - | ||||||
|
Accrued legal fees
|
54,056 | - | ||||||
|
Asset retirement obligation
|
88,074 | 63,074 | ||||||
|
Accrued taxes
|
226,336 | 64,500 | ||||||
|
Other
|
716,679 | 151,241 | ||||||
|
Accounts payable and accrued liabilities
|
$ | 4,604,837 | $ | 2,983,583 | ||||
|
|
10.
|
NOTES PAYABLE – RELATED PARTIES
|
The components of notes payable – related parties for the periods presented are as follows:
|
December 31, 2010
|
December 31, 2009
|
|||||||
|
Promissory note in the original amount of $243,981 to a stockholder, unsecured, payable in monthly principal and interest installments of $3,000, bearing an annual interest rate of 11%, and due June 2013
|
$ | 73,434 | $ | 99,412 | ||||
| 73,434 | 99,412 | |||||||
|
Less: current portion
|
29,740 | 26,722 | ||||||
|
Long-term portion, net of notes payable – related parties
|
$ | 43,694 | $ | 72,690 | ||||
As of December 31, 2010, principal payments due on the notes payable – related parties are as follows:
|
2011
|
$ | 29,740 | ||
|
2012
|
33,100 | |||
|
2013
|
10,594 | |||
| $ | 73,434 |
|
|
11.
|
NOTES PAYABLE
|
The components of notes payable for the periods presented are as follows:
|
December 31, 2010
|
December 31, 2009
|
|||||||
|
Various auto loans
|
$ | 73,253 | $ | 92,923 | ||||
| 73,253 | 92,923 | |||||||
|
Less: current portion
|
21,777 | 19,803 | ||||||
|
Long-term portion, net of notes payable
|
$ | 51,476 | $ | 73,120 | ||||
20
As of December 31, 2010, principal payments due on the notes payable are as follows:
|
2011
|
$ | 21,777 | ||
|
2012
|
23,575 | |||
|
2013
|
18,940 | |||
|
2014
|
8,961 | |||
|
Total
|
$ | 73,253 |
|
|
12.
|
SENIOR LENDERS’ NOTES PAYABLE
|
The components of senior lenders’ notes payable for the periods presented are as follows:
|
December 31, 2010
|
December 31, 2009
|
|||||||
|
Fifth Third Bank, term loan
|
$ | 4,166,668 | $ | - | ||||
|
Fifth Third Bank, equipment lease line
|
3,725,158 | - | ||||||
|
Fifth Third Bank, draw loan
|
824,567 | - | ||||||
|
Fifth Third Bank, $1.65 million draw loan
|
333,061 | - | ||||||
|
SunTrust Bank
|
- | 5,128,572 | ||||||
| 9,049,454 | 5,128,572 | |||||||
|
Less: current portion
|
2,426,915 | 1,828,572 | ||||||
|
Long-term portion, net of senior lenders' notes payable
|
$ | 6,622,539 | $ | 3,300,000 | ||||
On June 18, 2010, the Company, entered into a $17.0 million credit facility with Fifth Third Bank ("Fifth Third"). The credit facility consists of three components: (i) a term loan of $5.0 million, (ii) a draw loan of up to $2.0 million, and (iii) an equipment finance line of up to $10.0 million.
The term loan and the draw loan are covered by a Loan and Security Agreement, dated as of June 18, 2010 (the "Loan Agreement"), among the Company, Nationwide Money Services, Inc., Nationwide Ntertainment Services, Inc., EFT Integration, Inc. (all subsidiaries of the Company) and Fifth Third.
On the day of closing of the Loan Agreement, the Company issued a promissory note (the "Term Promissory Note") in the amount of $5.0 million to Fifth Third covering the amount disbursed pursuant to the term loan. The Term Promissory Note was available to the Company as a single principal advance. Principal and interest payable under the Term Promissory Note shall be paid in the amount borrowed over 36 months, beginning July 1, 2010, with 36 monthly principal payments plus accrued interest, with the final payment to be made on May 31, 2013. The Term Promissory Note carries interest of LIBOR plus up to 400 basis points based on a ratio of the Company’s indebtedness to EBITDA or 5.5%, whichever is greater. As of December 31, 2010, Term Promissory Note had an outstanding principal balance of $4,166,668 and an interest rate of 5.5%.
Upon entering into the Loan Agreement, the Company repaid in full all outstanding borrowings under and terminated its (1) Credit and Security Agreement, dated as of December 23, 2009, with SunTrust Bank ("SunTrust") (the "First Prior Loan Agreement"), and (2) Loan and Security Agreement, dated as of December 29, 2009 (the "Second Prior Loan Agreement"), with Proficio Bank (“Proficio”). See Financial Footnote #23 “Loss on Early Extinguishment of Debt” for detail of the charges relating to the extinguishment of these debts.
Also on the day of the closing of the Loan Agreement, the Company issued a promissory note (the "Draw Promissory Note") to Fifth Third covering any amounts which might be disbursed pursuant to the draw loan, which can be a maximum of $2.0 million. The Company can request disbursement from the draw loan in $200,000 increments at any time after the delivery of the Draw Promissory Note. The Company will repay any amounts borrowed pursuant to the Draw Promissory Note over 18 months, beginning on the first day of the month following any draw, with 18 monthly principal payments plus accrued interest. The Draw Promissory Note carries interest of LIBOR plus up to 400 basis points based on a ratio of the Company’s indebtedness to EBITDA or 5.5%, whichever is greater. The proceeds of any amounts disbursed pursuant to the draw loan will be used to purchase DVD inventory for the Company’s DVD kiosk business line. As of December 31, 2010, the Company had drawn down a total of $981,436 against the Draw Promissory Note and had an outstanding principal balance of $824,567 and an interest rate of 5.5%.
21
The equipment finance line is covered by a Master Equipment Lease Agreement, dated as of June 18, 2010 (the "Lease Agreement"), among the Company, Nationwide Money Services, Inc., Nationwide Ntertainment Services, Inc., and Fifth Third. The Lease Agreement and the corresponding equipment finance line available from Fifth Third, will be used to fund the purchases of up to $10.0 million of equipment (ATM and DVD kiosks), from time to time, and is available to the Company over a five year period. The line is secured by any equipment that is purchased pursuant to the line. The equipment line may also be used to support IT infrastructure. Borrowings made by the Company pursuant to this equipment line carry a term of one-year interest-only followed by an amortization of three years subsequent to each closing of a drawdown schedule. During an interim period between drawdowns and the closing of a drawdown schedule, the line carries interest-only payments. Currently, the interest rate on this line is calculated on the same formula as that in the Term Promissory Note and the Draw Promissory Note, but the Company anticipates entering into a SWAP agreement to lock in the interest rate on the equipment line upon the closing of each lease schedule created within the Lease Agreement. As of December 31, 2010, the Company had drawn down $3,725,158 against the Lease Agreement and is still in an interim interest-only period and anticipates closing this drawdown schedule in March or April 2011. The interest rate on the balances under the Lease Agreement at December 31, 2010 was 5.5%.
The Loan Agreement contains customary representations, warranties and covenants, including covenants on the following: (1) due authorization; (2) compliance with laws; (3) absence of breach; (4) collateral ownership and limitation of liens; (5) preparation of financial statements; (6) litigation and taxes; (7) events of default; (8) ERISA obligations; (9) use of loan proceeds; (10) limitations on indebtedness, liens and certain investments; (11) limitations on changes in ownership structure; (12) dividends; (13) repurchases of shares; and (14) maintenance of certain accounts with Fifth Third. The Loan Agreement, Term Promissory Note, and Draw Promissory Note also include customary default provisions, including, without limitation, payment defaults, cross-defaults to other material indebtedness, and bankruptcy and insolvency. In general, upon an event of default, Fifth Third may, among other things, declare the outstanding principal and interest immediately due and payable.
Pursuant to the terms of the Loan Agreement and the Lease Agreement, the Company granted Fifth Third a security interest in all of its assets, and the agreements are cross-collateralized.
On December 17, 2010, the Company and Fifth Third entered into a First Amendment (the “Amendment”) to the Loan Agreement. Pursuant to the Amendment, the Company and Fifth Third modified the draw loan aspect of the Loan Agreement to permit for additional financing in the amount of $1,650,000 under the terms of the draw loan for the purposes of purchasing certain assets and customer contracts connected with recent acquisition agreements. The Amendment increased the maximum aggregate credit availability pursuant to the Loan Agreement from $17.0 million to $18.65 million. The draw loan maturity date is the earlier of 36 months (December 15, 2013) or the expiration or earlier termination of the customer agreements that were acquired with the proceeds of the draw loan. As security for the loan to be extended under the Amendment, in addition to that which was granted under the Loan Agreement, the Company granted security interests in the assets to be acquired pursuant to the recent acquisition agreements. The Amendment carries interest of LIBOR plus up to 400 basis points based on a ratio of the Company’s indebtedness to EBITDA or 5.5%, whichever is greater. As of December 31, 2010, the Company had drawn down $333,061 against the Amendment. The interest rate on the balances under the Amendment at December 31, 2010 was 5.5%.
As of December 31, 2010, the Company was in compliance with all applicable covenants and ratios under the Loan Agreement with Fifth Third.
On March 27, 2009, the Company entered into a credit and security agreement (the “Credit Agreement”) with SunTrust Bank (“SunTrust”). The Credit Agreement provided for a maximum term loan of up to $5 million. On March 27, 2009, the Company borrowed $5 million under the Credit Agreement and issued a promissory note in such amount to SunTrust. The proceeds were used to repay a debt holder in connection with the settlement agreement, effective as of March 17, 2009, between the Company and debt holder, and to repay the outstanding principal balance under a loan agreement with Wachovia Bank. Upon entering into the Credit Agreement, the Company repaid in full all outstanding borrowings under and terminated (1) its Fourth Amended and Restated Loan Agreement, entered into as of September 28, 2007 (the “Prior Loan Agreement”), by and between the Company and Wachovia Bank, and (2) its Consolidated Renewal Promissory Note issued on September 28, 2007 (the “Renewal Note”) to Wachovia Bank. See Financial Footnote #23 “Loss on Early Extinguishment of Debt” for detail of the charges relating to the extinguishment of these debts.
22
As of December 31, 2010, principal payments due on the senior lenders’ notes payable are as follows:
|
2011
|
$ | 2,426,915 | ||
|
2012
|
3,122,109 | |||
|
2013
|
2,189,983 | |||
|
2014
|
1,310,447 | |||
| $ | 9,049,454 |
|
|
13.
|
CAPITAL LEASE OBLIGATIONS
|
The Company is obligated under various capital leases for automated teller machines and computer equipment. For financial reporting purposes, minimum lease payments relating to this equipment have been capitalized. Capital lease obligations, excluding interest, totaling $660,462 require minimum monthly lease payments ranging from approximately $874 to $6,680 with interest rates ranging between 0% and 19.53%. The existing capital lease agreements as of December 31, 2010 are at an average interest rate of 10.04%. The future minimum lease payments required under capital lease obligations as of December 31, 2010 are as follows:
|
2011
|
$ | 490,348 | ||
|
2012
|
179,477 | |||
|
2013
|
29,743 | |||
| 699,568 | ||||
|
Less: amount representing interest
|
39,105 | |||
|
Present value of minimum lease payments
|
660,463 | |||
|
Less: current portion of capital lease obligations
|
455,188 | |||
| $ | 205,275 |
Equipment leased under capital leases as of December 31, 2010 and 2009, totaled $5,412,779 and $4,977,987, which is net of accumulated depreciation of $2,960,245 and $2,476,532, respectively.
|
|
14.
|
COMMITMENTS AND CONTINGENCIES
|
Leased facilities
Commencing May 2007, the Company entered into a lease for their Jacksonville, Florida office. The term of the lease is for a period of 62 months and the rent expense on a monthly basis for the first year is $7,545, for the second year is $7,773, for the third year is $8,007, for the fourth year is $8,246 and for the final period through the end of the term is $8,494. The Company entered into a new office lease in Jacksonville, Texas which, effective February 1, 2009, became a month to month lease. The agreement provides for minimum monthly base rental payments of approximately $4,406. The Company also leases a warehouse facility in South Carolina which is a month to month lease. The Company also has various operating leases for computers and equipment. Rental expense under operating leases aggregated $229,818, $206,068 and $218,379 for the years ended December 31, 2010, 2009 and 2008, respectively.
23
The following is a schedule by years of future minimum rental payments required under operating leases that have initial or remaining non-cancelable lease terms in excess of one year as of December 31, 2010:
|
2011
|
$ | 135,314 | ||
|
2012
|
87,105 | |||
|
2013
|
17,743 | |||
|
2014
|
6,132 | |||
|
Total
|
$ | 246,294 |
|
|
15.
|
LEGAL PROCEEDINGS
|
From time to time, the Company and its subsidiaries may be parties to, and their property is subject to, ordinary, routine litigation incidental to their business. We know of no material, active or pending legal proceedings against the Company, nor are we involved as a plaintiff in any material proceeding or pending litigation. There are no proceedings in which any of our directors, officers or affiliates, or any registered or beneficial shareholder, is an adverse party or has a material interest adverse to our interest.
|
|
16.
|
EMPLOYMENT AGREEMENTS
|
George A. McQuain
During the fiscal year ended December 31, 2008, the Company entered into a one-year employment agreement with Mr. George A. McQuain. The contract was for one year beginning April 1, 2008. The contract provides for a one-year employment term, and provides that if the employment agreement is not otherwise terminated, it will be automatically extended for successive periods of one year at the end of each calendar year and as such was extended on April 1, 2010.
The agreement provides that during the term of the contract and for a period of one year and six months after the termination of the employment agreement for any reason, Mr. McQuain will not directly or indirectly employ or solicit employees of the Company, compete with the Company for its customers in any state where the Company does business, interfere with relationships of the Company, or provide information about the Company to competitors of the Company.
The contract also provides that if Mr. McQuain is terminated by the Company without cause, and provided he complies with the restrictive covenants of the employment agreement and signs a release agreement provided by the Company, he will continue to receive his base salary for the following time period: (1) if the termination occurs during the initial term, for the remaining portion of such initial term, or for one year after the date of termination of his employment, whichever is longer, or (2) if the termination occurs after the initial term, for one year after the date of termination of his employment. In addition, Mr. McQuain will continue to receive benefits for the applicable time period, and the Company will pay him for any bonuses earned by the date of termination. The employment agreement further provides that if there is a “change in control,” Mr. McQuain will be entitled to receive the same benefits that he would be entitled to receive if he were terminated without cause by the Company.
On October 21, 2010, the Company entered into an Amendment One (the “Amendment”) with Mr. McQuain. The Amendment amends certain terms of the Employment Agreement, dated April 1, 2008.
The Amendment altered the McQuain Employment Agreement in several aspects. First, it lengthened the period for which Mr. McQuain is entitled to severance pay should his employment be terminated without cause from one year to eighteen months. Second, the Amendment provides that Mr. McQuain must execute a “Release Agreement” in a form acceptable to the Company within 60 days of any such termination, in order to be entitled to such severance. Third, the Amendment modifies the non-compete provisions of the McQuain Employment Agreement by clarifying that the “Restricted Business” is business of that the Company is engaged in after the date of expiration or termination of the agreement. Fourth, the Amendment modifies the change of control provisions of the McQuain Employment Agreement by limiting Mr. McQuain’s diminution of duties termination right to six months, changing the severance period for termination following a change of control from one year to two years, and requiring the execution of a Release Agreement in the same time period as a termination without cause. Finally, the Amendment contains clarifying provisions related to change of control and termination of service for compliance purposes with Internal Revenue Code Section 409A.
24
On February 28, 2011, the Company and George McQuain, the Company’s Chief Executive Officer, agreed to a mutual separation of Mr. McQuain’s employment. As of February 28, 2011, Mr. McQuain is no longer employed as Chief Executive Officer, Director or in any other capacity, by the Company or any of its subsidiaries. The Company intends to pay Mr. McQuain the severance payments detailed in his Employment Agreement.
Michael J. Loiacono
During the fiscal year ended December 31, 2010, the Company entered into a one-year employment agreement with Mr. Michael J. Loiacono. The contract was for one year beginning October 1, 2010. The contract provides for a one-year employment term, and provides that if the employment agreement is not otherwise terminated, it will be automatically extended for successive periods of one year at the end of each calendar year.
The agreement provides that during the term of the agreement and for a period of one year and six months after the termination of the agreement for any reason, Mr. Loiacono will not directly or indirectly employ or solicit employees of the Company, compete with the Company for its customers in any state where the Company does business, interfere with relationships of the Company, or provide information about the Company to competitors of the Company.
The contract also provides that if Mr. Loiacono is terminated by the Company without cause, and provided he complies with the restrictive covenants of the Employment Agreement and signs a release agreement provided by the Company, he will continue to receive his base salary for the following time period: (1) if the termination occurs during the initial term, for the remaining portion of such initial term, or for nine months after the date of termination of his employment, whichever is longer, or (2) if the termination occurs after the initial term, for nine months after the date of termination of his employment. In addition, Mr. Loiacono will continue to receive benefits for the applicable time period, and the Company will pay him for any bonuses earned by the date of termination. The Loiacono Employment Agreement further provides that if there is a “change in control,” Mr. Loiacono will be entitled to receive the same benefits that he would be entitled to receive if he were terminated without cause by the Company, provided, however, that the severance pay period would be one year instead of nine months.
|
|
17.
|
INCOME TAXES
|
Deferred income taxes arise from the temporary differences in reporting assets and liabilities for income tax and financial reporting purposes. These temporary differences primarily resulted from net operating losses and different amortization and depreciation methods used for financial and tax purposes.
25
|
The components of the provision for income taxes are as follows:
|
||||||||||||
|
2010
|
2009
|
2008
|
||||||||||
|
Current:
|
||||||||||||
|
Federal
|
$ | - | $ | - | $ | - | ||||||
|
State
|
88,411 | 64,500 | - | |||||||||
|
Federal and state deferred tax assets
|
(292,745 | ) | (253,516 | ) | 1,614,873 | |||||||
|
Valuation allowance
|
- | (1,089,150 | ) | (1,614,873 | ) | |||||||
|
Provision for income taxes
|
$ | (204,334 | ) | $ | (1,278,166 | ) | $ | - | ||||
|
The provision (benefit) for income taxes shown above varies from statutory federal income tax rates for those periods as follows:
|
||||||||||||
|
Federal Income Tax Rate
|
-34.00 | % | -34.00 | % | -34.00 | % | ||||||
|
State Income Tax Rate, net of
|
||||||||||||
|
federal tax effect
|
4.67 | % | 3.47 | % | -3.96 | % | ||||||
|
Deferred tax asset revaluation
|
10.72 | % | ||||||||||
|
Permanent items
|
0.51 | % | 0.24 | % | -0.69 | % | ||||||
|
Change in valuation allowance
|
0.00 | % | -26.95 | % | ||||||||
|
Other, net
|
-1.22 | % | -25.76 | % | 38.65 | % | ||||||
|
Effective tax rate
|
-19.32 | % | -83.00 | % | 0.00 | % | ||||||
|
The components of the net deferred tax assets and the deferred tax liabilities are shown below.
|
||||||||||||
| 2010 | 2009 | 2008 | ||||||||||
|
Deferred tax assets (liabilities)
|
||||||||||||
|
Current portion
|
||||||||||||
|
Arising from operating loss and credit carryforwards
|
$ | 363,926 | $ | 868,848 | $ | 615,332 | ||||||
|
Total
|
$ | 363,926 | $ | 868,848 | $ | 615,332 | ||||||
|
Long term portion
|
||||||||||||
|
Arising from operating loss and credit carryforwards
|
7,464,411 | 6,591,736 | $ | 8,298,145 | ||||||||
|
Arising from temporary differences in fixed and intangible assets
|
(3,143,446 | ) | (3,068,438 | ) | (4,774,847 | ) | ||||||
|
Total
|
4,320,965 | 3,523,298 | 3,523,298 | |||||||||
|
Valuation allowance
|
(2,709,680 | ) | (2,709,680 | ) | (3,798,830 | ) | ||||||
|
Total
|
$ | 1,611,285 | $ | 813,618 | $ | (275,532 | ) | |||||
As of December 31, 2010, 2009 and 2008, the Company’s gross deferred tax assets are reduced by a valuation allowance of $2,709,680, $2,709,680 and $3,798,830, respectively, due to negative evidence, primarily previous years operating losses, indicating that a valuation allowance is required under GAAP. In assessing the realizability of the deferred tax assets, management considers whether it is more likely than not, that some portion or all of the deferred tax assets will not be realized. The valuation allowance at December 31, 2010 is related to deferred tax assets arising from net operating loss carryforwards. Management believes that based upon its projection of future taxable income for the foreseeable future, it is more likely than not that the Company will not be able to realize the full benefit of the net operating loss carryforwards before they expire due to the amortization and depreciation losses from the projected acquisition assets. During 2009, the Company reduced the valuation allowance related to the remaining deferred tax assets by approximately $1,100,000. This reduction reflects the Company’s expectation that it is more than likely than not that it will generate future taxable income to utilize this amount of net deferred tax assets. While management’s projection of future taxable income for the foreseeable future does not provide sufficient positive evidence that the entire balance of valuation allowance should be eliminated (as previously mentioned), management does believe it is more likely than not this $1,100,000 reduction in valuation allowance is substantiated by its projection of future taxable income. The benefit from this reduction was recorded as income tax benefit in the accompanying statement of income.
In July 2006, the FASB issued guidance which clarifies the accounting for uncertainty in income taxes recognized in an entity's financial statements in accordance with GAAP and prescribes a recognition threshold and measurement attributes for financial statement disclosure of tax positions taken or expected to be taken on a tax return. Under GAAP, the impact of an uncertain income tax position on the income tax return must be recognized at the largest amount that is more-likely-than-not to be sustained upon audit by the relevant taxing authority. An uncertain income tax position will not be recognized if it has less than a 50% likelihood of being sustained. Additionally, GAAP provides guidance on derecognition, classification, interest and penalties, accounting in interim periods, disclosure and transition.
26
For the period ended December 31, 2008, the Company increased its unrecognized tax benefits for certain positions taken in the amount of $1,147,200 that resulted in a decrease to the deferred tax asset. The entire amount of this unrecognized tax benefit, if recognized, would result in a decrease to the deferred tax asset valuation allowance, and would not have an impact on the effective tax rate.
A reconciliation of the beginning and ending amount of unrecognized tax benefits for fiscal 2008, 2009 and 2010 is as follows:
|
Balance at January 1, 2008
|
$ | - | ||
|
Additions based on tax positions related to the current year
|
1,147,200 | |||
|
Additions for tax positions of prior years
|
- | |||
|
Reductions for tax positions of prior years
|
- | |||
|
Settlements
|
- | |||
|
Total adjustments at December 31, 2008
|
$ | 1,147,200 | ||
|
Balance at January 1, 2009
|
$ | 1,147,200 | ||
|
Additions based on tax positions related to the current year
|
- | |||
|
Additions for tax positions of prior years
|
- | |||
|
Reductions for tax positions of prior years
|
- | |||
|
Settlements
|
- | |||
|
Total adjustments at December 31, 2009
|
$ | 1,147,200 | ||
|
Balance at January 1, 2010
|
$ | 1,147,200 | ||
|
Additions based on tax positions related to the current year
|
- | |||
|
Additions for tax positions of prior years
|
- | |||
|
Reductions for tax positions of prior years
|
- | |||
|
Settlements
|
- | |||
|
Total adjustments at December 31, 2010
|
$ | 1,147,200 |
At December 31, 2010, the Company has net operating loss carryforwards remaining of approximately $23.6 million that may be offset against future taxable income through 2030.
The Company’s income tax returns for all tax years remain open to examination by federal and state taxing authorities due to the Company’s net operating loss carryforwards. There were no income tax audits during the year ended December 31, 2010. With limited exception, the Company’s federal and state tax returns are open for examination for the tax year ending 2006, and all subsequent years.
|
|
18.
|
NET INCOME PER COMMON SHARE
|
Basic net income per share is computed based on the weighted average number of common shares outstanding during the period. Diluted net income per common share is computed based on the weighted average number of common shares outstanding during the period increased by the effect of dilutive stock options and stock purchase warrants using the treasury stock method. No such conversion is assumed where the effect is anti-dilutive, such as when there is a net loss from operations or when the exercise price of the potentially dilutive securities is less than the market value of the Company’s stock. The following table sets forth the computation of basic and diluted net income per common share:
27
|
Fiscal Year Ended
December 31, 2010
|
Fiscal Year Ended
December 31, 2009
|
Fiscal Year Ended
December 31, 2008
|
||||||||||
|
Numerator
|
||||||||||||
|
Income (loss) from operations
|
$ | (853,568 | ) | $ | 2,813,206 | $ | 1,170,237 | |||||
|
Numerator for diluted income (loss) per share
|
||||||||||||
|
available to common stockholders
|
$ | (853,568 | ) | $ | 2,813,206 | $ | 1,170,237 | |||||
|
Denominator
|
||||||||||||
|
Weighted average shares
|
21,980,369 | 21,654,554 | 20,973,924 | |||||||||
|
Effect of dilutive securities:
|
||||||||||||
|
Treasury method, effect of employee stock options & warrants
|
- | 1,190,687 | - | |||||||||
|
Denominator for diluted income (loss) per share adjusted
|
||||||||||||
|
weighted shares after assumed exercises
|
21,980,369 | 22,845,241 | 20,973,924 | |||||||||
|
Income (loss) per common share - basic:
|
||||||||||||
|
Net Income (loss) per common share
|
$ | (0.04 | ) | $ | 0.13 | $ | 0.06 | |||||
|
Income (loss) per common share - diluted:
|
||||||||||||
|
Net Income (loss) per common share
|
$ | (0.04 | ) | $ | 0.12 | $ | 0.06 | |||||
The year ended December 31, 2010 did not include stock options and warrants to purchase 1,459,716 common shares of stock as their effect would be anti-dilutive. For the years ended December 31, 2009 and 2008, there were stock options and warrants outstanding to acquire 671,200 and 7,614,204 shares, respectively, of the Company’s common stock which were excluded from the calculation of its diluted earnings per share as their effect would be anti-dilutive.
|
|
19.
|
BUSINESS SEGMENT INFORMATION
|
FASB requires that companies report separately in the financial statements certain financial and descriptive information about segment revenues, income and assets. The method for determining what information is reported is based on the way that management organizes the operating segments for making operational decisions and assessments of financial performance. In computing operating loss and net loss for the DVD services business, no allocations of general corporate expenses have been made and therefore these are included in the ATM services business as the DVD services business only includes expenses directly related to its business. Likewise, loss on early extinguishment of debt chanrges and income tax benefits reside in the ATM services business. The Company only had one segment in fiscal 2008.
The following table summarizes our revenue, gross profit, SG&A, depreciation and amortization, impairment of long-lived assets, operating income, net income and EBITDA by segment for the periods indicated below.
EBITDA (a non-GAAP measure) is defined as earnings before net interest, taxes, depreciation and amortization.
28
|
For the Twelve Months Ended
|
||||||||
|
December 31, 2010
|
December 31, 2009
|
|||||||
|
|
||||||||
|
Revenue:
|
||||||||
|
ATM Services
|
$ | 21,491,106 | $ | 21,456,798 | ||||
|
DVD Services
|
1,252,229 | 38,069 | ||||||
|
Consolidated revenue
|
$ | 22,743,335 | $ | 21,494,867 | ||||
|
Gross profit:
|
||||||||
|
ATM Services
|
$ | 9,709,079 | $ | 10,190,789 | ||||
|
DVD Services
|
(321,485 | ) | (12,841 | ) | ||||
|
Consolidated gross profit
|
$ | 9,387,594 | $ | 10,177,948 | ||||
|
SG&A:
|
||||||||
|
ATM Services
|
$ | 5,754,183 | $ | 5,304,616 | ||||
|
DVD Services
|
917,260 | 133,008 | ||||||
|
Consolidated SG&A
|
$ | 6,671,443 | $ | 5,437,624 | ||||
|
Depreciation & Amortization:
|
||||||||
|
ATM Services
|
$ | 2,033,989 | $ | 1,944,646 | ||||
|
DVD Services
|
418,029 | 20,454 | ||||||
|
Consolidated depreciation & amortization
|
$ | 2,452,018 | $ | 1,965,100 | ||||
|
Impairment of long-lived assets
|
||||||||
|
ATM Services
|
$ | - | $ | - | ||||
|
DVD Services
|
481,993 | - | ||||||
|
Consolidated impairment of long-lived assets
|
$ | 481,993 | $ | - | ||||
|
Operating income (loss):
|
||||||||
|
ATM Services
|
$ | 1,705,094 | $ | 2,821,339 | ||||
|
DVD Services
|
(2,138,767 | ) | (166,303 | ) | ||||
|
Consolidated operating income (loss)
|
$ | (433,673 | ) | $ | 2,655,036 | |||
|
Net income (loss):
|
||||||||
|
ATM Services
|
$ | 1,285,199 | $ | 2,979,509 | ||||
|
DVD Services
|
(2,138,767 | ) | (166,303 | ) | ||||
|
Consolidated net income (loss)
|
$ | (853,568 | ) | $ | 2,813,206 | |||
|
EBITDA:
|
||||||||
|
ATM Services
|
$ | 3,636,937 | $ | 4,291,025 | ||||
|
DVD Services
|
(1,720,738 | ) | (145,849 | ) | ||||
|
Consolidated EBITDA
|
$ | 1,916,199 | $ | 4,145,176 | ||||
29
The following table summarizes total assets by segment for the periods indicated:
|
December 31
|
December 31
|
|||||||
|
2010
|
2009
|
|||||||
|
Assets:
|
||||||||
|
ATM Services
|
$ | 24,944,071 | $ | 25,627,067 | ||||
|
DVD Services
|
5,461,428 | 489,882 | ||||||
|
Consolidated assets
|
$ | 30,405,499 | $ | 26,116,949 | ||||
|
|
20.
|
STOCK-BASED COMPENSATION
|
As noted in Financial Footnote #2 “Summary of Significant Accounting Policies”, the Company accounts for its stock-based compensation by recognizing the grant date fair value of stock-based awards, net of estimated forfeitures, as compensation expense on a straight-line basis over the underlying requisite service periods of the related awards. The following table reflects the total stock-based compensation expense amounts included in the accompanying consolidated statements of operations:
Stock options
The Company established a 2002 Stock Incentive Plan (the “2002 Plan”), a 2004 Stock Incentive Plan (the “2004 Plan”) and a 2010 Stock Incentive Plan (the “2010 Plan”), which provide the granting of options to officers, employees, directors, and consultants of the Company. As of December 31, 2010, options to purchase 18,675 shares of common stock were available for future grants under the 2002 Plan, 15,864 shares of common stock were available for future grants under the 2004 Plan, and 965,000 shares of common stock were available for future grants under the 2010 Plan. As of December 31, 2010, 999,539 shares of common stock were reserved for future stock option grants and no shares were reserved for warrants to purchase common stock.
Options granted under our 2002 Plan, 2004 Plan and 2010 Plan generally have a three-year vesting period and expire five years after grant. Most of our stock options vest ratably during the vesting period, as opposed to awards that vest at the end of the vesting period. We recognize compensation expense for options using the straight-line basis, reduced by estimated forfeitures. Upon exercise of stock options, we issue new shares of our common stock (as opposed to using treasury shares). All options granted pursuant to the plans shall be exercisable at a price not less than the fair market value of the common stock on the date of grant.
The Plans are administered by the Company's Board of Directors. The Board of Directors has the authority to select individuals to receive awards, to determine the time and type of awards, the number of shares covered by the awards, and the terms and conditions of such awards in accordance with the terms of the plans. In making such determinations, the Board of Directors may take into account the recipient's current and potential contributions and any other factors the Board of Directors considers relevant. The Board of Directors is authorized to establish rules and regulations and make all other determinations that may be necessary or advisable for the administration of the Plan.
During the years ended December 31, 2010 and 2009, the Company granted stock options totaling 422,855 and 979,000 shares of its common stock, with a weighted average strike price of $0.79 and $0.39 per share, respectively. Certain stock options were exercisable upon grant and have a life ranging from four months to five years. As of December 31, 2010, total unrecognized compensation cost related to non-vested stock-based compensation plans was approximately $429,000. This unrecognized compensation is expected to be recognized over a weighted average period of 2.3 years.
30
The following table summarizes the Company’s stock options activity under compensation plans:
|
Number of
|
Weighted Average
|
Weighted Average
|
Aggregate
|
|||||||||||||
|
Options
|
Exercise Price
|
Contractual Term (years)
|
Intrinsic Value
|
|||||||||||||
|
Balance, December 31, 2008
|
2,197,700 | $ | 0.50 | |||||||||||||
|
Options granted
|
979,000 | 0.39 | ||||||||||||||
|
Options cancelled
|
- | - | ||||||||||||||
|
Options expired
|
(287,000 | ) | 1.18 | |||||||||||||
|
Options exercised
|
- | - | ||||||||||||||
|
Balance, December 31, 2009
|
2,889,700 | $ | 0.40 | |||||||||||||
|
Options granted
|
422,855 | 0.79 | ||||||||||||||
|
Options cancelled
|
- | - | ||||||||||||||
|
Options expired
|
(258,359 | ) | 1.12 | |||||||||||||
|
Options exercised*
|
(160,683 | ) | 0.29 | |||||||||||||
|
Balance, December 31, 2010
|
2,893,513 | $ | 0.40 | 2.67 | $ | 169,895 | ||||||||||
|
Options vested and exercisable
|
||||||||||||||||
|
as of December 31, 2010
|
1,429,716 | $ | 0.32 | 2.07 | $ | 26,831 | ||||||||||
*Includes 71,429 of stock options exercised pursuant to the cashless exercise provision that were included in treasury stock.
For the years ended December 31, 2010, 2009 and 2008, the total fair value of stock options vested was $229,042, $247,060 and $475,829, respectively.
The following table summarizes information about options outstanding and exercisable at December 31, 2010:
|
Weighted Average
|
|||||||||||||||||||||
|
Shares Underlying
|
Remaining
|
Weighted Average
|
Shares Underlying
|
Weighted Average
|
|||||||||||||||||
|
Exercise Price
|
Options Outstanding
|
Contractual Life Years
|
Exercise Price
|
Options Excercisible
|
Exercise Price
|
||||||||||||||||
| <$ 0.56 | 2,241,750 | 2.16 | $ | 0.28 | 1,316,794 | $ | 0.28 | ||||||||||||||
| $0.56 | - | - | - | - | - | ||||||||||||||||
| .>$0.56-$0.92 | 651,763 | 4.07 | $ | 0.82 | 112,922 | $ | 0.80 | ||||||||||||||
|
Totals
|
2,893,513 | $ | 0.40 | 1,429,716 | $ | 0.32 | |||||||||||||||
|
Exercise Price Equals,
|
||||||||||||||
|
Number of Remaining
|
Exceeds or is Less than
|
Weighted Average
|
Range of
|
Weighted Average
|
||||||||||
|
Options Granted
|
Market Value as of 12/31/10
|
Exercise Price
|
Exercise Price
|
Fair Value
|
||||||||||
| 2,241,750 |
Less than
|
$ | 0.28 | <$0.56 | $ | 0.23 | ||||||||
| - |
Equals
|
$ | - | $0.56 | $ | - | ||||||||
| 651,763 |
Exceeds
|
$ | 0.82 | .>$0.56-$0.92 | $ | 0.69 | ||||||||
| 2,893,513 | ||||||||||||||
For the years ended December 31, 2010, 2009 and 2008, the total intricsic value of stock options exercised was $7,500, $0 and $0, respectively.
31
A summary of the status of the Company’s nonvested options as of December 31, 2010 and changes during the year then ended is presented below:
|
Weighted Average
|
||||||||
|
Options
|
Grant-Date
|
|||||||
|
Outstanding
|
Fair Value
|
|||||||
|
Nonvested options outstanding as of December 31, 2009
|
1,828,688 | $ | 0.30 | |||||
|
Granted
|
422,855 | $ | 0.66 | |||||
|
Vested
|
(787,746 | ) | $ | 0.27 | ||||
|
Forfeited
|
- | $ | - | |||||
|
Nonvested options outstanding as of December 31, 2010
|
1,463,797 | $ | 0.42 | |||||
Stock warrants
The following table summarizes the Company’s stock warrant activity:
|
Number of
|
Weighted Average
|
|||||||
|
Warrants
|
Exercise Price
|
|||||||
|
Balance, December 31, 2008
|
6,645,004 | $ | 2.58 | |||||
|
Warrants granted
|
230,000 | 0.20 | ||||||
|
Warrants cancelled
|
- | - | ||||||
|
Warrants expired
|
(5,600,004 | ) | 2.87 | |||||
|
Warrants exercised
|
(910,000 | ) | 0.01 | |||||
|
Balance, December 31, 2009
|
365,000 | $ | 0.59 | |||||
|
Warrants granted
|
- | - | ||||||
|
Warrants cancelled
|
- | - | ||||||
|
Warrants expired
|
(135,000 | ) | 1.25 | |||||
|
Warrants exercised*
|
(200,000 | ) | 0.20 | |||||
|
Balance, December 31, 2010
|
30,000 | $ | 0.20 | |||||
*Includes 33,734 of stock warrants exercised pursuant to the cashless exercise provision that were included in treasury stock.
The following table summarizes information about warrants outstanding and exercisable at December 31, 2010:
|
Weighted Average
|
||||||||||||||||||||||
|
Shares Underlying
|
Remaining
|
Weighted Average
|
Shares Underlying
|
Weighted Average
|
||||||||||||||||||
|
Exercise Price
|
Warrants Outstanding
|
Contractual Life Years
|
Exercise Price
|
Warrants Excercisible
|
Exercise Price
|
|||||||||||||||||
| $ | 0.20 | 30,000 | 3.3 | $ | 0.20 | 30,000 | $ | 0.20 | ||||||||||||||
| 30,000 | $ | 0.20 | 30,000 | $ | 0.20 | |||||||||||||||||
|
|
21.
|
RELATED PARTY TRANSACTIONS
|
None other than what has been already disclosed in Financial Footnote #10 “Notes Payable - Related Parties.”
32
|
|
22.
|
FAIR VALUE MEASUREMENT
|
On January 1, 2008, we adopted FASB guidance regarding fair value measurements which defines fair value, establishes a framework for using fair value to measure assets and liabilities, and expands disclosures about fair value measurements. The statement applies whenever other statements require or permit assets or liabilities to be measured at fair value. The guidance is effective for fiscal years beginning after November 15, 2007, except for nonfinancial assets and liabilities that are recognized or disclosed at fair value in the financial statements on a nonrecurring basis for which application has been deferred for one year.
The guidance established the following fair value hierarchy that prioritizes the inputs used to measure fair value:
Level 1: Quoted prices are available in active markets for identical assets or liabilities as of the reporting date. Active markets are those in which transactions for the asset or liability occur in sufficient frequency and volume to provide pricing information on an ongoing basis. Level 1 primarily consists of financial instruments such as exchange-traded derivatives, listed equities and U.S. government treasury securities.
Level 2: Pricing inputs are other than quoted prices in active markets included in Level 1, which are either directly or indirectly observable as of the reporting date. Level 2 includes those financial instruments that are valued using models or other valuation methodologies. These models are primarily industry-standard models that consider various assumptions, including quoted forward prices for commodities, time value, volatility factors, and current market and contractual prices for the underlying instruments, as well as other relevant economic measures. Substantially all of these assumptions are observable in the marketplace throughout the full term of the instrument, can be derived from observable data or are supported by observable levels at which transactions are executed in the marketplace. Instruments in this category include non-exchange-traded derivatives such as over the counter forwards, options and repurchase agreements.
Level 3: Pricing inputs include significant inputs that are generally less observable from objective sources. These inputs may be used with internally developed methodologies that result in management’s best estimate of fair value. At each balance sheet date, we perform an analysis of all instruments subject in accordance with GAAP and include in Level 3 all of those whose fair value is based on significant unobservable inputs.
The following table presents our financial assets and liabilities that were accounted for at fair value on a recurring basis as of December 31, 2010 by level within the fair value hierarchy:
|
Fair Value Measurements Using
|
||||||||||||||||
|
Total
|
Level 1
|
Level 2
|
Level 3
|
|||||||||||||
|
Assets
|
$ | - | $ | - | $ | - | $ | - | ||||||||
|
Liabilities:
|
||||||||||||||||
|
Derivative financial instruments
|
$ | - | $ | - | $ | - | $ | - | ||||||||
Our derivative financial instruments are interest rate swap agreements, which are observable at commonly quoted intervals for the full term of the derivatives and therefore considered a level 2 input. During the year ended December 31, 2009, we recorded $7,921 of income relating to the interest rate swap which is included in the interest expense, net in our consolidated statements of operations.
In the accompanying consolidated balance sheets, we have recorded an asset retirement obligation. As discussed above, the application of the guidance regarding fair value measurements for these non-recurring items has been deferred.
|
|
23.
|
LOSS ON EARLY EXTINGUISHMENT OF DEBT
|
As discussed in Financial Footnote #12 “Senior Lenders’ Notes Payable,” on June 18, 2010 the Company entered into the Loan Agreement with Fifth Third Bank. The proceeds were used to repay outstanding principal balances under loan agreements with SunTrust and Proficio.
33
Also, as discussed in Financial Footnote #12 “Senior Lenders’ Notes Payable” on March 27, 2009 the Company entered into the Credit Agreement with SunTrust Bank. The proceeds were used to repay CAMOFI in connection with a settlement agreement, effective as of March 17, 2009, between the Company and CAMOFI, and to repay the outstanding principal balance under a loan agreement with Wachovia Bank.
In accordance with GAAP, the net carrying amount of the extinguished debt should be recognized currently in income of the period of extinguishment as losses or gains and identified as a separate item.
The following summarizes the amounts charged to loss on early extinguishment of debt for the years ended December 31, 2010 and December 31, 2009:
|
For the Twelve Months Ended
|
||||||||
|
Item description
|
December 31, 2010
|
December 31, 2009
|
||||||
|
Accelerated accretion of discount on senior lenders' notes payable
|
$ | - | $ | 256,988 | ||||
|
Accelerated amortization of capitalized loan fees
|
$ | 61,508 | $ | 76,493 | ||||
|
Accelerated expense of prepaid loan fees
|
$ | - | $ | 6,400 | ||||
|
Stock expense relating to repriced warrants on debt settlement
|
$ | - | $ | 107,025 | ||||
|
Stock expense relating to warrants issued to subordinated note holders
|
$ | - | $ | 28,054 | ||||
|
Prepayment fees on debt settlement
|
$ | 40,638 | $ | - | ||||
|
Total loss on early extinguishment of debt
|
$ | 102,146 | $ | 474,960 | ||||
|
|
24.
|
IMPAIRMENT OF LONG-LIVED ASSETS
|
As discussed in Financial Footnote #2 “Summary of Significant Accounting Policies”, the Company accounts for the impairment of long-lived assets in accordance with GAAP. The following impairment was recognized during the fourth quarter of 2010.
When the Company entered into the DVD services business line in 2009, it acquired DVD rental kiosks and related software from a certain manufacturer and placed those kiosks at merchant locations. During the first and second quarters of 2010, the Company concluded that the manufacturers’ DVD rental kiosk would not be able to meet the future growth demands of the Company, and as such, the Company decided to purchase future DVD rental kiosks from an alternate manufacturer, thus running its DVD services business with two distinct and different hardware and software platforms. During the fourth quarter of 2010, the Company made the decision that operating both DVD platforms would not be an operationally efficient manner to run the DVD services business, and as such, decided that by the end of fiscal 2011, the Company would migrate any business from the original platform to its new platform and would attempt to find a buyer for the 49 DVD rental kiosks and related software operating under the original platform. Upon evaluation and research, the Company concluded that the carrying amount of these assets may not be fully recoverable and during fiscal 2010, the following amounts were charged to impairment of long-lived assets:
34
|
Net Book
|
Estimated proceeds
|
Impairment
|
||||||||||
|
Long-lived asset description
|
Value
|
from disposition
|
Charge
|
|||||||||
|
DVD rental kiosks and related software
|
$ | 604,493 | $ | 122,500 | $ | 481,993 | ||||||
| $ | 481,993 | |||||||||||
|
|
25.
|
SUBSEQUENT EVENTS
|
Effective January 1, 2011, the Company acquired substantially all of the assets of Tejas Video Partners, LTD, an owner and operator of unattended DVD rental kiosks. Under the terms of the agreement, the Company will acquire substantially all of Tejas’ assets for approximately $1,487,000. The purchase price consists of approximately $1,375,000 in cash (with $875,000 paid at closing and $500,000 payable by April 15, 2011) and approximately $112,000 in shares of the Company’s restricted common stock. In addition to the base purchase price, for a period of five years following the closing, the Company will pay an additional purchase price (“Earn-out”) to Tejas of $3,500 for each new DVD kiosk site that is (i) installed by the Company pursuant to an acquired customer agreement, and (ii) which site generates $2,000 or more of gross revenues for any calendar month (the “Earn-out Threshold”). The Earn-out will be paid by the Company on an annual basis, within forty-five days of each of the first five anniversaries following the closing. Each annual payment will be calculated based on newly installed kiosks that met the Earn-out Threshold during the twelve month period ending on the preceding anniversary of the closing. The Company is in the process of completing the purchase accounting related to this acquisition.
On February 28, 2011, the Company and George McQuain, the Company’s Chief Executive Officer, agreed to a mutual separation of Mr. McQuain’s employment. As of February 28, 2011, Mr. McQuain is no longer employed as Chief Executive Officer, Director or in any other capacity, by the Company or any of its subsidiaries. The Company intends to pay Mr. McQuain the severance payments detailed in his Employment Agreement.
On February 28, 2011, the board of directors of the Company appointed Lock Ireland, Vice Chairman of the board of directors of the Company, and Michael I. Connolly, a director of the Company, to serve as co-interim chief executive officers of the Company. Mr. Connolly will serve as interim President of the Company.
35