Attached files
Table of Contents
Index to Financial Statements
UNITED STATES
SECURITIES AND EXCHANGE COMMISSION
WASHINGTON, D.C. 20549
Form 10-K
(Mark One)
| x | ANNUAL REPORT PURSUANT TO SECTION 13 OR 15(d) OF THE SECURITIES EXCHANGE ACT OF 1934 |
For the fiscal year ended December 31, 2010
OR
| ¨ | TRANSITION REPORT PURSUANT TO SECTION 13 OR 15(d) OF THE SECURITIES EXCHANGE ACT OF 1934 |
Commission file number 333-150853-4
Forbes Energy Services Ltd.
(Exact name of registrant as specified in its charter)
| Bermuda | 98-0581100 | |
| (State or other jurisdiction of incorporation or organization) |
(I.R.S. Employer Identification No.) | |
| 3000 South Business Highway 281 Alice, Texas |
78332 | |
| (Address of principal executive offices) | (Zip Code) | |
Registrant’s telephone number, including area code: (361) 664-0549
Securities registered pursuant to Section 12(b) or Section 12(g) of the Act: None
Indicate by check mark if the registrant is a well-known seasoned issuer, as defined in Rule 405 of the Securities Act. ¨ Yes x No
Indicate by check mark if the registrant is not required to file reports pursuant to Section 13 or Section 15(d) of the Act. ¨ Yes x No
Indicate by check mark whether the registrant (1) has filed all reports required to be filed by Section 13 or 15(d) of the Securities Exchange Act of 1934 during the preceding 12 months (or for such shorter period that the registrant was required to file such reports), and (2) has been subject to such filing requirements for the past 90 days. x Yes ¨ No
Indicate by check mark whether the registrant has submitted electronically and posted on its corporate website, if any, every Interactive Data File required to be submitted and posted pursuant to Rule 405 of Regulation S-T during the preceding 12 months (or for such shorter period that the registrant was required to submit and post such files). ¨ Yes ¨ No
Indicate by check mark if disclosure of delinquent filers pursuant to Item 405 of Regulation S-K is not contained herein and will not be contained, to the best of the registrant’s knowledge, in definitive proxy or information statements incorporated by reference in Part III of this Form 10-K or any amendment to this Form 10-K. ¨
Indicate by check mark whether the registrant is a large accelerated filer, an accelerated filer, a non-accelerated filer or a smaller reporting company. See the definitions of “large accelerated filer,” “accelerated filer” and “smaller reporting company” in Rule 12b-2 of the Exchange Act.
| Large Accelerated Filer | ¨ | Accelerated Filer | ¨ | |||
| Non-Accelerated Filer | x | Smaller Reporting Company | ¨ | |||
Indicate by check mark whether the registrant is a shell company (as defined in Exchange Act Rule 12b-2). ¨ Yes x No
The aggregate market value of the stock held by non-affiliates of the registrant as of the last business day of the most recently completed second fiscal quarter, June 30, 2010, was approximately USD 24,699,600 based on the closing sales price of the registrant’s common stock as reported by the Toronto Stock Exchange on June 30, 2010 of USD $0.4227 per share, converted from CDN$ to USD$ based on the exchange rate on June 30, 2010 of CDN $1.00 equaling USD $0.9393 as reported in the Wall Street Journal.
Indicate the number of common shares outstanding of each of the registrant’s classes of common shares, as of the latest practicable date.
At March 28, 2011, there were 83,673,700 common shares outstanding.
Table of Contents
Index to Financial Statements
FORBES ENERGY SERVICES LTD. AND SUBSIDIARIES (a/k/a the “Forbes Group”)
TABLE OF CONTENTS
| Page | ||||||
| PART I | ||||||
| Item 1. |
1 | |||||
| Item 1A. |
10 | |||||
| Item 1B. |
21 | |||||
| Item 2. |
21 | |||||
| Item 3. |
22 | |||||
| Item 4. |
22 | |||||
| PART II | ||||||
| Item 5. |
23 | |||||
| Item 6. |
25 | |||||
| Item 7. |
Management’s Discussion and Analysis of Financial Condition and Results of Operations |
27 | ||||
| Item 7A. |
43 | |||||
| Item 8. |
44 | |||||
| Item 8A. |
45 | |||||
| Item 9. |
Changes in or Disagreements with Accountants on Accounting and Financial Disclosure |
83 | ||||
| Item 9A. |
83 | |||||
| Item 9B. |
85 | |||||
| PART III | ||||||
| Item 10. |
85 | |||||
| Item 11. |
85 | |||||
| Item 12. |
Security Ownership of Certain Beneficial Owners and Management and Related Stockholder Matters |
85 | ||||
| Item 13. |
Certain Relationships and Related Transaction, and Director Independence |
85 | ||||
| Item 14. |
85 | |||||
| PART IV | ||||||
| Item 15. |
86 | |||||
Table of Contents
Index to Financial Statements
This Annual Report on Form 10-K and any oral statements made in connection with it include certain forward-looking statements within the meaning of the federal securities laws. You can generally identify forward-looking statements by the appearance in such a statement of words like “anticipate,” “believe,” “continue,” “could,” “estimate,” “expect,” “intend,” “may,” “plan,” “potential,” “predict,” “project,” or “should” or other comparable words or the negative of these words. When you consider our forward-looking statements, you should keep in mind the risk factors we describe and other cautionary statements we make in this Annual Report on Form 10-K. Our forward-looking statements are only predictions based on expectations that we believe are reasonable. Our actual results could differ materially from those anticipated in, or implied by, these forward-looking statements as a result of known risks and uncertainties set forth below and elsewhere in this Annual Report on Form 10-K. These factors include or relate to the following:
| • | supply and demand for oilfield services and industry activity levels; |
| • | potential for excess capacity; |
| • | spending by the oil and natural gas industry given the continuing worldwide economic downturn; |
| • | our level of indebtedness in the current depressed market; |
| • | possible impairment of our long-lived assets; |
| • | our ability to maintain stable pricing; |
| • | competition; |
| • | substantial capital requirements; |
| • | significant operating and financial restrictions under our indentures; |
| • | technological obsolescence of operating equipment; |
| • | dependence on certain key employees; |
| • | concentration of customers; |
| • | substantial additional costs of compliance with reporting obligations, the Sarbanes-Oxley Act and indenture covenants; |
| • | material weaknesses in internal controls over financial reporting; |
| • | seasonality of oilfield services activity; |
| • | collection of accounts receivable; |
| • | environmental and other governmental regulation, including potential climate change legislation; |
| • | the potential disruption of business activities caused by the physical effects , if any, of climate change; |
| • | risks inherent in our operations; |
| • | market response to global demands to curtail use of oil and natural gas; |
| • | ability to fully integrate future acquisitions; |
| • | variation from projected operating and financial data; |
| • | variation from budgeted and projected capital expenditures; |
| • | volatility of global financial markets; |
| • | risks associated with our foreign operations; and |
| • | the other factors discussed under “Risk Factors” on page 10 of this Annual Report on Form 10-K. |
We undertake no obligation to update or revise any forward-looking statements, whether as a result of new information, future events or otherwise. To the extent these risks, uncertainties and assumptions give rise to events that vary from our expectations, the forward-looking events discussed in this Annual Report on Form 10-K may not occur. All forward-looking statements attributable to us are qualified in their entirety by this cautionary statement.
Available Information
Information regarding Forbes Energy Services Ltd. and its subsidiaries can be found on our internet website at http://www.forbsenergyservices.com. In addition, our annual reports on Form 10-K, quarterly reports on Form 10-Q and amendments to those reports filed or furnished in accordance with Sections 13 or 15(d) of the Securities Exchange Act of 1934, as amended, or the Exchange Act, are made available free of charge on our internet website as soon as reasonably practicable after these reports have been electronically filed with, or furnished to, the Securities and Exchange Commission, or the SEC. Information filed with the SEC may be read or copied at the SEC’s Public Reference Room at 100 F Street, N.E., Washington, D.C. 20549. Information on operation of the Public Reference Room may be obtained by calling the SEC at 1-800-SEC-0330. The SEC also maintains an internet website (http://www.sec.gov) that contains reports, proxy and information statements, and other information regarding issuers that file electronically.
Table of Contents
Index to Financial Statements
| Item 1. | Business |
Overview
Forbes Energy Services Ltd., or FES Ltd, and its domestic subsidiaries, Forbes Energy Services LLC, or FES LLC, Forbes Energy Capital Inc., or FES CAP, C.C. Forbes, LLC, or CCF, TX Energy Services, LLC, or TES, Superior Tubing Testers, LLC, or STT, and Forbes Energy International, LLC, or FEI, are headquartered in Alice, Texas and conduct business primarily in Texas, Mississippi, Pennsylvania and Mexico. On October 15, 2008, FES LLC and FEI formed Forbes Energy Services México, S. de R.L. de C.V., or FES Mexico Subsidiary, a Mexican limited liability company, (sociedad de responsabilidad limitada de capital variable), to conduct operations in Mexico. On December 3, 2008, Forbes Energy Services Mexico Servicios de Personal, S. de R.L de C. V., or FES Mexico Servicios, a Mexican limited liability company, was formed to provide employee services to FES Mexico Subsidiary, and on June 8, 2009, FES LTD formed a branch in Mexico. The Mexican branch of FES Ltd and the two Mexican limited liability companies are hereinafter referred to, collectively, as “FES Mexico.”
As used in this Annual Report on Form 10-K, the “Company,” the “Forbes Group,” “we,” and “our” mean FES Ltd and its subsidiaries on and after May 29, 2008; FES LLC and its subsidiaries from January 1, 2008 to May 28, 2008; CCF, TES and STT from June 29, 2007 to December 31, 2007; and C.C. Forbes, L.P., Texas Energy Services, L.P. and Superior Tubing Testers L.P., prior to June 29, 2007.
All historical financial data contained in this Annual Report on Form 10-K as of and for the year ended December 31, 2007 and prior periods are of the Forbes Group on a combined basis, and are identified herein as Predecessor – Combined, and shall be identified as such. This financial information is presented on a combined basis because the operating subsidiaries were under common management prior to the reorganization under a common Delaware parent, Forbes Energy Services LLC. All financial statements and other financial data contained in this Annual Report on Form 10-K for all periods after January 1, 2008 are of the Forbes Group on a consolidated basis, or Successor – Consolidated, whether or not specifically identified as such.
We are an independent oilfield services contractor that provides a wide range of well site services to oil and natural gas drilling and producing companies to help develop and enhance the production of oil and natural gas. These services include fluid hauling, fluid disposal, well maintenance, completion services, workovers and recompletions, plugging and abandonment, and tubing testing. Our operations are concentrated in the major onshore oil and natural gas producing regions of Texas, with locations in Baxterville and Laurel, Mississippi; Indiana, Pennsylvania; and Poza Rica, Mexico.
We believe that our broad range of services listed in the preceding paragraph, which extends from initial drilling, through production, to eventual abandonment, is fundamental to establishing and maintaining the flow of oil and natural gas throughout the life cycle of our customers’ wells.
Since our inception in September 2003, we have grown organically from a small South Texas operational base with two well servicing rigs and eight vacuum trucks to a major regional provider of an integrated offering of production and well services. During the period from 2007 to 2009, we successfully executed an aggressive organic growth strategy focused on fleet expansion with the construction of new equipment in a segment of the oilfield services industry characterized by competitors with aging fleets. We believe that our new well servicing rigs and equipment, with an average age of less than four years, significantly differentiate us from our competitors.
We currently provide a wide range of services to a diverse group of over 1,115 companies. Our blue-chip customer base includes ConocoPhillips Company, Apache Corporation, Chesapeake Energy Corporation, Devon Energy Corporation, Dominion Resources, Inc., EOG Resources, Inc., Penn Virginia Corporation, and Petróleos Mexicanos, or PEMEX, among others. John E. Crisp and Charles C. Forbes, our senior management team, have cultivated deep and ongoing relationships with these customers during their average of over 30 years of experience in the oilfield services industry. For the year ended December 31, 2010, we generated revenues of approximately $334.1 million.
We currently conduct our operations through the following two business segments:
| • | Well Servicing. The well servicing segment accounted for 46.5% of our consolidated revenues for the year ended December 31, 2010. At December 31, 2010, our well servicing segment utilized our modern fleet of 173 owned or leased well servicing rigs, which included 162 workover rigs and 11 swabbing rigs, and related assets and equipment. These assets are used to provide (i) well maintenance, including remedial repairs and removal and replacement of downhole production equipment, (ii) well workovers, including significant downhole repairs, re-completions and re-perforations, (iii) completion and swabbing activities, and (iv) plugging and abandoning services. In addition, we have a fleet of nine tubing testing units that are used to conduct pressure testing of oil and natural gas production tubing. |
1
Table of Contents
Index to Financial Statements
| • | Fluid Logistics and Other. The fluid logistics segment accounted for 53.5% of our consolidated revenues for the year ended December 31, 2010. Our fluid logistics segment utilizes our fleet of owned or leased fluid transport trucks and related assets, including specialized vacuum, high-pressure pump and tank trucks, frac tanks, water wells, salt water disposal wells and facilities, and related equipment. These assets are used to provide, transport, store, and dispose of a variety of drilling and produced fluids used in, and generated by, oil and natural gas production. These services are required in most workover and completion projects and are routinely used in daily operations of producing wells. Beginning in the fiscal year 2010, the Company began providing additional services in which Wolverine Construction, Inc., a related party, completed such services as a sub-contractor. These services involve site preparation and are complementary to the traditional services offered by the Company. |
We believe that our two business segments are complementary and create synergies in terms of selling opportunities. Our multiple lines of service are designed to capitalize on our existing customer base to grow within existing markets, generate more business from existing customers, and increase our operating performance. By offering our customers the ability to reduce the number of vendors they use, we believe that we help improve our customers’ efficiency. This is demonstrated by the fact that 74.2% of our revenues for the year ended December 31, 2010 were from customers that utilized services of both of our business segments. Further, by having multiple service offerings that span the life cycle of the well, we believe that we have a competitive advantage over smaller competitors offering more limited services.
The following table summarizes the major components of our equipment fleet at the dates indicated.
| December 31, | ||||||||||||||||||||||||
| Successor-Consolidated | Predecessor- Combined |
|||||||||||||||||||||||
| 2010 | 2009 | 2008 | 2007 | 2006 | ||||||||||||||||||||
| Locations |
26 | 28 | 27 | 18 | 12 | |||||||||||||||||||
| Well Servicing Segment |
||||||||||||||||||||||||
| Workover rigs (1) |
162 | 162 | 162 | 95 | 41 | |||||||||||||||||||
| Swabbing rigs |
11 | 9 | 8 | 6 | 2 | |||||||||||||||||||
| Tubing testing units |
9 | 6 | 6 | 6 | 4 | |||||||||||||||||||
| Fluid Logistics Segment |
||||||||||||||||||||||||
| Vacuum trucks(1) |
285 | 290 | 294 | 205 | 147 | |||||||||||||||||||
| High-pressure pump trucks |
19 | 19 | 19 | 14 | 7 | |||||||||||||||||||
| Other heavy trucks |
57 | 57 | 57 | 43 | 25 | |||||||||||||||||||
| Frac tanks(1) |
1,368 | 1,369 | 1,370 | 951 | 568 | |||||||||||||||||||
| Salt water disposal wells |
15 | 18 | 14 | 14 | 9 | |||||||||||||||||||
| (1) | At December 31, 2010, 16 of the vacuum trucks, 10 of the workover rigs, 3 swab rigs and 143 of the frac tanks were leased. |
Reorganizations
Effective January 1, 2008, the members of each of CCF, TES and STT (which included Messrs., John Crisp and Charles Forbes and Ms. Janet Forbes) transferred all of the membership interests they held in such companies to FES LLC in exchange for all of the outstanding membership interests in FES LLC, or the Delaware Reorganization.
In connection with a reorganization completed on May 29, 2008, or the Bermuda Reorganization, each of these members transferred 63% of their respective membership interests in FES LLC to FES Ltd in exchange for Class B shares of FES Ltd. Of the proceeds from the Canadian initial public offering and simultaneous U.S. private placement of 24,644,500 common shares by FES Ltd in May 2008, or the Initial Equity Offering, $120 million was contributed by FES Ltd as additional capital to FES LLC and used to pay the cash consideration for the repurchase by FES LLC of the remaining membership interests held by the individuals who were members of such company. The purchase price for such transaction was determined on the basis of the price per common share under the initial public offering. Mr. John E. Crisp, the Chairman of the Board, President and Chief Executive Officer of FES Ltd, Mr. Charles C. Forbes, the Executive Vice President and Chief Operating Officer of FES Ltd, and Ms. Janet L. Forbes, a director of FES Ltd, each received approximately $36 million from FES LLC upon the repurchase of their remaining membership interests, or approximately 20.9% each of the gross proceeds of the Initial Equity Offering.
In connection with the Bermuda Reorganization, John E. Crisp, our President and Chief Executive Officer, Charles C. Forbes, our Executive Vice President and Chief Operating Officer, and Janet L. Forbes, one of our directors, who were the founders of the Forbes Group and were also the three largest owners of each of the entities comprising the original Forbes Group, along with all of the other members of FES LLC, received Class B shares of FES Ltd. The Class B shares were convertible at any time at the discretion of each holder into common shares and were converted into common shares by the Class B holders in May 2010.
2
Table of Contents
Index to Financial Statements
Upon completion of the Bermuda Reorganization, FES LLC became the wholly owned subsidiary of FES Ltd. Our headquarters and executive offices are located at 3000 South Business Hwy 281, Alice, Texas 78332. We can be reached by phone at (361) 664-0549.
Our Competitive Strengths
We believe that the following competitive strengths position us well within the oilfield services industry:
| • | Young and Modern Fleet. We believe we operate one of the youngest and most modern fleets of well servicing rigs among the large well-servicing companies, based on an average age of well servicing rigs. Approximately 87.9% of our 173 well servicing rigs at December 31, 2010 were built in the last five years. Many of our customers tell us that a younger and more modern fleet is more attractive to them because newer well servicing rigs require less down time for maintenance and generally are more reliable than older equipment. As part of our strategy, we have undertaken to enhance our design specifications to improve the operational and safety characteristics of our equipment compared with older equipment. |
| • | Exposure to Revenue Streams Throughout the Life Cycle of the Well. Our maintenance and workover services expose us to demand from our customers throughout the life cycle of a well, from drilling through production and eventual abandonment. Each new well that is drilled provides us a potential multi-year stream of well services revenue, as our customers attempt to maximize and maintain a well’s productivity. Accordingly, demand for our services is generally driven by the total number of producing wells in a region and is generally less volatile than demand for new well drilling services. |
| • | High Level of Customer Retention with a Blue Chip Customer Base. Our top customers include many of the largest integrated and independent oil and natural gas companies operating onshore in the United States and the government owned energy company, PEMEX, in Mexico. We believe we have been successful in growing in our existing markets as well as expanding to new markets with existing customers due to the quality of our well servicing rigs, our personnel and our safety record. Members of our senior management have maintained excellent working relationships with our top customers in the United States during their average of over 30 years of experience in the oilfield services industry. We believe the complementary nature of our two business segments also helps retain customers because of the efficiency we offer a customer that has multiple needs at the wellsite. Notably, 74.2% of our revenues from the year ended December 31, 2010 were from customers that utilize services of both of our business segments. |
| • | Industry-Leading Safety Record. For 2010, we had approximately 88.0 % fewer reported incidents than the industry average. Our customers tell us that our safety record and reputation are critical factors to purchasing and operations managers in their decision-making process. Over several years, we have developed a strong safety culture based on our training programs and safety seminars for our employees and customers. For example, for several years, members of our senior management have played an integral part in monthly joint safety training meetings with customer personnel. In addition, our deployment of new well servicing rigs with enhanced safety features has contributed to our strong safety record and reputation. |
| • | Experienced Senior Management Team and Operations Staff. Our senior management team of John E. Crisp and Charles C. Forbes has over 65 years of combined experience within the oilfield services industry. In addition, our next level of management, which includes our location managers, has an average of approximately 24 years of experience in the industry. |
Our Business Strategy
Our strategy is to continue to do the following:
| • | Maintain maximum asset utilization. We constantly monitor asset usage and industry trends in order to maximize utilization. We accomplish this through moving assets from regions with less activity to those with more activity or that are increasing in activity. In the current economic environment, we are focusing on basins that are either predominantly oil or contain natural gas with high liquids content, such as the Eagle Ford basin in South Texas, as these areas are forecast to experience substantial growth for the foreseeable future. |
3
Table of Contents
Index to Financial Statements
| • | Focus on Proven and Established Oil and Natural Gas Basins. We focus our operations on customers that operate in well-established basins which have proven production histories and that have maintained a higher level of activity throughout various oil and natural gas pricing environments. We believe that this creates a more stable revenue stream for us as the production related services we provide our customers are tied more to ongoing production from proven wells and less to exploratory activity that was negatively influenced by the recent precipitous decreases in oil and natural gas prices throughout 2009. Our experience shows that production-related services have generally withstood the current depressed economic conditions better than exploratory services. |
| • | Establish and Maintain Leadership Position in Core Operating Areas. Based on our estimates, we believe that we have a significant market share in well servicing and fluid logistics in South Texas. We strive to establish and maintain market leadership positions within all of our core operating areas. To achieve this goal, we maintain close customer relationships and offer high-quality services and the newest equipment for our customers. In addition, our significant presence in our core operating areas facilitates employee retention and hiring, and brand recognition. |
| • | Maintain a Disciplined Growth Strategy. Through the third quarter of 2008, we grew our business by following our customers to new locations which have been in reasonably close proximity to our existing locations. In 2007, we expanded from our initial presence in the Cotton Valley with a location in Marshall to Kilgore and Carthage, Texas. We have followed the same strategy in the Permian Basin, where we established an initial presence in Ozona and subsequently expanded to San Angelo, Monahans, Odessa and Big Spring, Texas. In 2008 we expanded to Mexico, acquiring a presence in the city of Poza Rica. We believe that this growth strategy allows us to create synergies in geographic areas and then permits us to expand profitably from those geographic areas in which we have created a critical mass. During 2009, we severely curtailed our expansion due to the severe downturn in the industry, expanding into only two new locations in Franklin, Texas and Indiana, Pennsylvania, while closing one location in Denver City, Texas. During the fourth quarter of 2009 and throughout 2010, we began to experience an upturn in the industry resulting in higher utilization of our assets. During 2010, in response to customer demand, we opened new rig yards in Laurel, Mississippi, and Lamesa, Texas as well as moving our Pennsylvania rig yard from Washington, Pennsylvania to Indiana, Pennsylvania. We also closed four yards. We exited North Texas with the closing of our Godley well service yard. We also closed three additional yards and absorbed those assets into existing yards; Edinburg, Texas, Liberty, Texas, and Franklin, Texas. Given our limited working capital and restrictive covenants under our indentures, we plan to continue to delay new asset additions for the near term. It is anticipated that new capital requirements, as limited by the restrictive covenants under our indentures, in the near term will be met through cash flow from operations, operating leases or equipment rentals. In prior filings, we disclosed that we were working on an agreement for the use of two workover rigs in Colombia. At the present time, it does not appear that this transaction will be completed. |
Corporate Structure
FES Ltd is a Bermuda exempt company created on April 9, 2008 to serve as the holding company for FES LLC and its subsidiaries. FES LLC is a Delaware limited liability company and the U.S. holding company for our operating entities. We operate primarily through the following four subsidiaries which are all Delaware limited liability companies directly owned by FES LLC - CCF, TES, STT and FEI. FEI was formed to hold the equity securities of FES Mexico Subsidiary and FES Mexico Servicios, Mexican limited liability companies that were originally formed to hold our Mexican operations. Subsequently Mexican operations were moved to the Mexican branch of FES Ltd. FES LLC also holds the equity securities of FES CAP, a Delaware corporation created solely to be a co-issuer of our senior secured notes. The following chart graphically illustrates our current structure:
4
Table of Contents
Index to Financial Statements
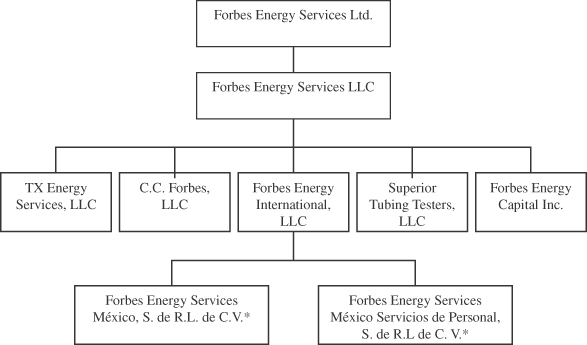
| * | Forbes Energy Services México, S. de R.L. de C.V. and Forbes Energy Services Mexico Servicios de Personal, S. de C.V. are each 99.99% owned by Forbes Energy International, LLC and 0.01% owned by Forbes Energy Services LLC. |
Description of Business Segments
Well Servicing Segment
Through a modern fleet of 173 well servicing rigs, as of December 31, 2010, situated in 21 operational areas across Texas, two in Mississippi, one in Pennsylvania, and one in Mexico, we provide a comprehensive offering of well servicing activities to oil and natural gas companies in Texas and our other locations, including completions of newly drilled oil and natural gas wells, wellbore maintenance, workovers and re-completions, tubing testing, and plugging and abandonment services. Our well servicing rig fleet has an average age of less than four years. As part of our operational strategy, we enhanced our design specifications to improve the operational and safety characteristics of our well servicing rigs compared with older well servicing rigs operated by others in the industry. These include increased derrick height and weight ratings, and increased mud pump horsepower. We believe these enhanced features translate into increased demand for our equipment and services along with better pricing for our equipment and personnel. In addition, we augment our well servicing rig fleet with auxiliary equipment, such as mud pumps, power swivels, mud plants, mud tanks, blow-out preventers, lighting plants, generators, pipe racks and tongs, which results in incremental rental revenue and increases the profitability of a typical well service job.
We provide the following services in our well servicing segment:
| • | Completions. Utilizing our well servicing rig fleet, we perform completion services, which involve perforating and/or stimulating a wellbore to allow it to flow oil or natural gas, along with swabbing operations that are utilized to clean a wellbore prior to production. Completion operations are generally shorter term in nature and involve our equipment operating on a site for a period of two to three days. |
| • | Maintenance. Through our fleet of well servicing rigs, we provide for the removal and repair of sucker rods, downhole pumps and other production equipment, the repair of failed production tubing, and the removal of sand, paraffin and other downhole production-related byproducts that impair well productivity. These operations typically involve our well servicing rigs operating on a wellsite for five to seven days. |
| • | Workovers and Re-completions. We provide workover and re-completion services for existing wellbores. These services are designed to significantly enhance productivity by re-perforating to initiate or re-establish productivity from an oil or natural gas wellbore. In addition, we provide major downhole repairs such as casing repair, production tubing replacement, and deepening and sidetracking operations used to extend a wellbore laterally or vertically. These operations are typically longer term in nature and involve our well servicing rigs operating on a wellsite for one to two weeks at a time. |
5
Table of Contents
Index to Financial Statements
| • | Tubing Testing. Through a fleet of nine downhole testing units, we provide downhole tubing testing services that allow operators to verify tubing integrity. Tubing testing services are performed as production tubing is run into a new wellbore or on older wellbores as production tubing is replaced during a workover operation. Tubing testing services are complementary to our other service offerings and provide a significant opportunity for cross-selling. |
| • | Plugging and Abandonment. Our well servicing rigs are also used in the process of permanently closing oil and natural gas wells that are no longer capable of producing in economic quantities. Plugging and abandonment work can be performed with a well servicing rig along with wireline and cementing equipment; however, this service is typically provided by companies that specialize in plugging and abandonment work. Many well operators bid this work on a “turnkey” basis, requiring the service company to perform the entire job, including the sale or disposal of equipment salvaged from the well as part of the compensation received, and complying with state regulatory requirements. We perform plugging and abandonment work in conjunction with equipment provided by other service companies. In January 2011 we hired several experienced plugging and abandonment employees and plan to expand our presence in this segment. |
Fluid Logistics Segment
Our fluid logistics segment provides an integrated array of oilfield fluid sales, transportation, storage, and disposal services that are required on most workover, drilling, and completion projects and are routinely used in daily operation of producing wells by oil and natural gas producers. We have a substantial operational footprint with 16 fluid logistics locations across Texas as of December 31, 2010, and an extensive fleet of transportation trucks, high-pressure pump trucks, frac tanks, and salt water disposal wells. This combination of services enables us to provide a one-stop source for oil and natural gas companies. We believe that the vast majority of our smaller competitors in this segment can provide some, but not all, of the equipment and services required by customers, thereby requiring them to use several companies to meet their requirements and increasing their administrative burden. In addition, by pursuing an integrated approach to service, we experience increased asset utilization rates, as multiple assets are usually required to provide a given service.
We provide the following services in our fluid logistics segment:
| • | Fluid Hauling. At December 31, 2010, we owned or leased 361 fluid service vacuum trucks, trailers, and other hauling trucks equipped with a fluid hauling capacity of up to 150 barrels per unit. Each fluid service truck unit is equipped to pump fluids from or into wells, pits, tanks, and other on-site storage facilities. The majority of our fluid service truck units are also used to transport water to fill frac tanks on well locations, including frac tanks provided by us and others, to transport produced salt water to disposal wells, including injection wells owned and/or operated by us, and to transport drilling and completion fluids to and from well locations. In conjunction with the rental of frac tanks, we use fluid service trucks to transport water for use in fracturing operations. Following completion of fracturing operations, our fluid service trucks are used to transport the flowback produced as a result of the fracturing operations from the wellsite to disposal wells. |
| • | Disposal Services. Most oil and natural gas wells produce varying amounts of salt water throughout their productive lives. Under Texas law, oil and natural gas wastes and salt water produced from oil and natural gas wells are required to be disposed of in authorized facilities, including permitted salt water disposal wells. Injection wells are licensed by state authorities and are completed in permeable formations below the fresh water table. At December 31, 2010, we operated 15 disposal wells in 13 locations across Texas, with an aggregate injection capacity of approximately 115,500 barrels per day, that are permitted to dispose of salt water, and incidental non-hazardous oil and natural gas wastes throughout our operational bases in Texas. Our transport trucks frequently transport fluids that are disposed of in these salt water disposal wells. The salt water disposal wells are strategically located in close proximity to the producing wells of our customers. We maintain separators at all 15 disposal wells, which permits us to salvage residual crude oil that is used in operations or later sold. |
| • | Equipment Rental. At December 31, 2010, we owned or leased a fleet of 1,368 fluid storage tanks that can store up to 500 barrels of fluid each or an aggregate storage capacity of approximately 684,000 barrels. This equipment is used by oilfield operators to store various fluids at the wellsite, including fresh water, brine and acid for frac jobs, flowback, temporary production, and mud storage. We transport the tanks with our trucks to well locations that are usually within a 75-mile radius of our nearest location. Frac tanks are used during all phases of the life of a producing well. A typical fracturing operation can be completed within four days using five to 25 or more frac tanks. We believe we maintain one of the youngest frac tank fleets in the industry with an average equipment age of less than four years. |
| • | Fluid Sales. We sell and transport a variety of fluids used in drilling, completion and workover operations for oil and natural gas wells. Although a relatively small percentage of our overall business, the provision of these fluids drives asset utilization rates and revenue from associated equipment. Through these services, we provide fresh water used in fracturing fluid, completion fluids, cement, and drilling mud. In addition, we provide potassium chloride for completion fluids, brine water, and water-based drilling mud. |
| • | Site Preparation Services. In the fiscal year 2010, the Company began providing site preparation services that are complementary to the traditional services offered by the Company. Wolverine Construction, Inc., a related party, completed such services as a sub-contractor. We billed the cost to the customer with a margin of between 5%-10%. |
6
Table of Contents
Index to Financial Statements
Financial Information about Segments and Geographic Areas
See Item 7 “Management’s Discussion and Analysis of Financial Condition and Results of Operations” and Note 14 to our consolidated financial statements for the year ended December 31, 2010 included in this Annual Report on Form 10-K for further discussion regarding financial information by segment and geographic location. For a discussion of the risks associated with our foreign operations, please see Item 1A “Risk Factors – Our international operations could be adversely affected” and “Our operations in Mexico are subject to risks associated with contract bidding” on page 19 of this Annual Report on Form 10-K.
Seasonality
Our operations are impacted by seasonal factors. Please see Item 1A “Risk Factors – Activity in the oilfield services industry is seasonal and may affect our revenues during certain periods” on page 16 of this Annual Report on Form 10-K for additional information.
Sales and Marketing
Sales and marketing functions are performed at two levels: at the field level and through our sales representatives and executives. At the field level, our operations and rig supervisors are in constant contact with their counterparts at our customers. This contact includes working closely in the field, problem resolution efforts, and 24-hour availability. Employees of our customers become accustomed to working closely with and depending on our personnel for assistance, guidance, advice and in other areas where teams typically interact. Our objective is for our customers to see our employees as an extension of the customers’ employees and resources. These relationships not only secure business long-term, but also generate additional business as new opportunities arise.
Our sales representatives and executives perform more traditional sales activities such as calling on customers, sending proposals, and following up on jobs to ensure customer satisfaction. This includes heavy participation in customer safety programs where our executives and sales staff either participate in or teach safety classes at various customer locations. From a sales standpoint, this close involvement and support is key to establishing and maintaining long-term relationships with the major oil and natural gas companies.
We operate a decentralized sales and marketing organization, where local management teams are largely responsible for developing stronger relationships with customers at the field level. Our customers typically are relationship driven, and make decisions at the local level.
We cross-market our well servicing rigs along with our fluid logistics services, thereby offering our customers the ability to minimize vendors, which we believe improves the efficiency of our customers. This is demonstrated by the fact that 74.2% of our revenues for the year ended December 31, 2010 were from customers that utilized services of both of our business segments.
Employees
At December 31, 2010, we had 1,893 employees. We provide comprehensive employee training, and implement recognized standards for health and safety. None of our employees are represented by a union or employed pursuant to a collective bargaining agreement or similar arrangement. We have not experienced any strikes or work stoppages, and we believe we have good relations with our employees. As of December 31, 2010, we had increased our overall workforce by approximately 18.2% or 291 employees when compared to December 31, 2009. This is a direct result of the current positive industry trends which have resulted in the need for additional personnel to service the increased activity levels.
Continued retention of existing qualified management and field employees and availability of additional qualified management and field employees will be a critical factor in our continued success as we work to ensure that we have adequate levels of experienced personnel to service our customers. Given industry trends, this continues to be increasingly challenging.
Competition
Our competition includes small regional service providers as well as larger companies with operations throughout the continental United States and internationally. Our four largest competitors are Basic Energy Services, Inc., Complete Production Services, Inc., Key Energy Services, Inc. and Nabors Industries Ltd. We believe that these larger competitors primarily have centralized management teams that direct their operations and decision-making primarily from corporate and regional headquarters. In addition, because of their size, these companies market a large portion of their work to the major oil and natural gas companies. We compete primarily on the basis of the young age and quality of our equipment, our safety record, the quality and expertise of our employees and our responsiveness to customer needs.
7
Table of Contents
Index to Financial Statements
Customers
We served in excess of 1,115 customers during the year ended December 31, 2010. For the years ended December 31, 2010, 2009 and 2008, our largest customer, PEMEX, comprised approximately 13.7%, 11.7%, and 8.6% of our consolidated revenues, our five largest customers comprised approximately 35.9%, 37.7%, and 30.3% of our consolidated revenues, and our ten largest customers comprised approximately 51.9%, 49.8%, and 42.9% of our consolidated revenues. During 2010, PEMEX comprised 13.7% of our consolidated revenues. During 2009, PEMEX and ConocoPhillips comprised of 11.7% and 11.1% of our consolidated revenues, respectively. During 2008 no customers comprised greater than 10.0% of our consolidated revenues. We had been expanding our market base and adding new customers until the decrease in activity in the oil and gas industry that began in the fourth quarter of 2008. Activity in the oil and gas industry began to improve in the last half of 2010 through the current period and we are again expanding revenues within our existing customer base. Nevertheless, the loss of our top customer or of several of the customers in the top ten would materially adversely affect our revenues and results of operations. We believe that customers lost could be replaced with other customers, but there can be no assurance that lost revenues could be replaced in a timely manner or at all, especially given the market competitiveness.
Our business segments charge customers by the hour, day or project for services, equipment and personnel.
We have master service agreements in place with most of our customers, under which jobs or projects are awarded on the basis of price, type of service, location of equipment, and the experience level of work crews.
Suppliers
Historically, we have purchased or leased our well servicing rigs from several third-party or related party suppliers. During the year ended December 31, 2010, we leased 2 swab units, and purchased no well service rigs or swab units.
We purchase well servicing chemicals, drilling fluids, and related supplies from various third-party suppliers. We purchase potassium chloride from two suppliers Agri-Empresa, Inc. and Tetra Technologies, Inc. For all other well servicing products, such as barite, surfactants, and drilling fluids, we purchase from various suppliers of well servicing products when needed.
Although we do not have written agreements with any of our suppliers (other than leases with respect to certain of our rigs and equipment), we have not historically suffered from an inability to purchase or lease equipment or purchase raw materials.
Insurance
Our operations are subject to risks inherent in the oilfield services industry, such as equipment defects, malfunctions, failures and natural disasters. In addition, hazards such as unusual or unexpected geological formations, pressures, blow-outs, fires or other conditions may be encountered in drilling and servicing wells, as well as the transportation of fluids and our assets between locations. We have obtained insurance coverage against certain of these risks which we believe is customary in the industry, including $1 million in general liability per occurrence, $25 million in umbrella coverage and $50 million of excess liability coverage. Such insurance is subject to coverage limits and exclusions and may not be available for all of the risks and hazards to which we are exposed. In addition, no assurance can be given that such insurance will be adequate to cover our liabilities or will be generally available in the future or, if available, that premiums will be commercially justifiable. If we incur substantial liability and such damages are not covered by insurance or are in excess of policy limits, or if we incur such liability at a time when we are not able to obtain liability insurance, our business, results of operations and financial condition could be materially and adversely affected.
Environmental Regulations
Our operations are subject to various federal, state and local laws and regulations in the United States and Mexico pertaining to health, safety and the environment. Laws and regulations protecting the environment have become more stringent over the years, and in certain circumstances may impose strict liability, rendering us liable for environmental damage without regard to negligence or fault on our part. Moreover, cleanup costs, penalties and other damages arising as a result of new, or changes to existing, environmental laws and regulations could be substantial and could have a material adverse effect on our financial condition, results of operations and cash flows. We believe that we conduct our operations in substantial compliance with current United States and Mexican federal, state and local requirements related to health, safety and the environment.
8
Table of Contents
Index to Financial Statements
The following is a summary of the more significant existing environmental, health and safety laws and regulations to which our operations are subject and for which compliance may have a material adverse effect on our results of operation or financial position. See Item 1A “Risk Factors—Due to the nature of our business, we may be subject to environmental liability” on page 16 of this Annual Report on Form 10-K for further details.
Hazardous Substances and Waste
The Comprehensive Environmental Response, Compensation, and Liability Act, as amended, or CERCLA, and comparable state laws in the United States impose liability without regard to fault or the legality of the original conduct on certain defined persons, including current and prior owners or operators of the site where a release of hazardous substances occurred and entities that disposed or arranged for the disposal of the hazardous substances found at the site. Under CERCLA, these responsible persons may be liable for the costs of cleaning up the hazardous substances, for damages to natural resources, and for the costs of certain health studies. In the course of our operations, we generate materials that are regulated as hazardous substances and, as a result, may incur CERCLA liability for cleanup costs. Also, claims may be filed for personal injury and property damage allegedly caused by the release of hazardous substances or other pollutants.
We also generate solid wastes that are subject to the requirements of the Resource Conservation and Recovery Act, as amended, or RCRA, and comparable state statutes. Certain materials generated in the exploration, development, or production of crude oil and natural gas are excluded from RCRA’s hazardous waste regulation, but these wastes, which include wastes currently generated during our operations, could be designated as “hazardous wastes” in the future and become subject to more rigorous and costly disposal requirements. Any such changes in the laws and regulations could have a material adverse effect on our operating expenses.
Although we have used operating and disposal practices that were standard in the industry at the time, hydrocarbons or other wastes may have been released at properties owned or leased by us now or in the past, or at other locations where these hydrocarbons and wastes were taken for treatment or disposal. Under CERCLA, RCRA and analogous state laws, we could be required to clean up contaminated property (including contaminated groundwater), perform remedial activities to prevent future contamination, or pay for associated natural resource damages.
In Mexico, hazardous wastes must be handled in accordance with the provisions of the General Law for the Prevention and Integral Management of the Wastes and its Regulations. This law requires, among other things, that persons who generate hazardous waste (i) register the amount and kind of hazardous waste generated; (ii) label, package and store the hazardous waste in a prescribed manner; (iii) maintain duly completed manifests regarding generation, transportation and final disposition of the hazardous waste; (iv) obtain a registration from Mexican authorities; (v) ensure that all subcontractors dealing with the transportation, treatment and final disposition of the hazardous waste have the proper registration issued by Mexican authorities; and (vi) avoid soil contamination and/or spills.
Water Discharges
We operate facilities that are subject to requirements of the Clean Water Act, as amended, or CWA, and analogous state laws that impose restrictions and controls on the discharge of pollutants into navigable waters. Pursuant to these laws, permits must be obtained to discharge pollutants into state waters or waters of the United States, including to discharge storm water runoff from certain types of facilities. Spill prevention, control, and countermeasure requirements under the CWA require implementation of measures to help prevent the contamination of navigable waters in the event of a hydrocarbon spill. The CWA can impose substantial civil and criminal penalties for non-compliance.
Employee Health and Safety
We are subject to the requirements of the federal Occupational Safety and Health Act, as amended, or OSHA, and comparable state laws that regulate the protection of employee health and safety. OSHA’s hazard communication standard requires that information about hazardous materials used or produced in our operations be maintained and provided to employees, state and local government authorities and citizens. We believe that our operations are in substantial compliance with OSHA requirements.
Climate Change Regulation
The U.S. Congress has been considering legislation to reduce the emissions of certain gases, commonly referred to as “greenhouse gases,” including carbon dioxide and methane, which, according to certain scientific studies, might contribute to the warming of the Earth’s atmosphere and other climatic changes. On June 26, 2009, the U.S. House of Representatives passed the American Clean Energy and Security Act of 2009, or ACESA, which would establish an economy-wide cap-and-trade program to reduce U.S. emissions of these greenhouse gases. ACESA would require a 17% reduction in greenhouse gas emissions from 2005 levels by 2020 and just over an 80% reduction of such emissions by 2050. Under the ACESA, the Environmental Protection Agency, or the EPA, would issue a capped and steadily declining number of tradable emissions allowances to major sources of greenhouse gas emissions permitting such sources to continue to emit greenhouse gases into the atmosphere. The cost of these allowances would be expected to increase significantly over time. ACESA would impose increasing costs on the combustion of carbon-based fuels such as oil and natural gas. The U.S. Senate began work on its own legislation for restricting domestic greenhouse gas emissions and President Obama has indicated his support of legislation to reduce greenhouse gas emissions through an emission allowance system. Although it is not currently possible to predict when or if the Senate may act on climate change legislation or how any such bill would be reconciled with ACESA, any future federal laws or implementing regulations that may be adopted to address the emission of greenhouse gases could adversely affect demand for our services by reducing demand for the oil and natural gas produced by our customers. Such legislation could also increase our operating costs.
9
Table of Contents
Index to Financial Statements
Additionally, on December 7, 2009, the EPA announced its finding that greenhouse gas emissions presented an endangerment to human health and the environment. This endangerment finding allows the EPA to proceed with the adoption and implementation of regulations that would restrict emissions of greenhouse gases under existing provisions of the federal Clean Air Act. In September 2009, the EPA proposed regulations in anticipation of finalizing its endangerment finding that would require a reduction in greenhouse gas emissions from motor vehicles and, could also trigger permit review for greenhouse gas emissions from certain stationary sources. On October 30, 2009, the EPA published a final rule requiring the reporting of greenhouse gas emissions from specified large greenhouse gas emission sources in the United States beginning in 2011 for emissions occurring in 2010. On November 30, 2010, the EPA issued regulations that expanded reporting requirements to include onshore and offshore petroleum and natural gas production; natural gas processing, distribution and storage; and facilities that inject and store carbon dioxide underground for the purposes of geologic sequestration or enhanced oil and gas recovery. Reporting requirements under these new regulations are mandatory beginning in 2012 for emissions occurring in 2011.
In Mexico, emissions generated as a result of the development of oil and other petrochemicals, including work related to oil wells, are governed by Mexican regulation which requires a license issued by Mexican authorities. The license must be updated annually by filing an annual operation report.
The adoption and implementation of additional regulations that would impose reporting obligations on, or limiting emissions of greenhouse gases from, our equipment and operations and the equipment and operations of our customers could require us to incur increased operating costs and could adversely affect demand for crude oil and natural gas produced by our customers, which would adversely affect demand for our services. The potential increase in the costs of our operations and the operations of our customers could include additional costs to operate and maintain equipment and facilities, install new emission controls on equipment and facilities, acquire allowances to authorize greenhouse gas emissions, pay any taxes related to greenhouse gas emissions and administer and manage a greenhouse gas emissions program. While we may be able to include some or all of such increased operating costs in the rates we charge for our services, any recovery of such costs is uncertain. Even if such legislation is not adopted at the national level, a number of states, acting either individually or through multi-state regional initiatives, have already begun implementing legal measures to reduce emissions of greenhouse gases. While no such legislation is currently being considered in Texas, many of our customers operate nationally and would be adversely affected by the requirements of such legislation. Any one of these climate change regulatory and legislative initiatives could have a material adverse effect on our business, financial condition and results of operations.
Other Laws and Regulations
We operate salt water disposal wells that are subject to the CWA, Safe Drinking Water Act, and state and local laws and regulations, including those established by the Environmental Protection Agency’s Underground Injection Control Program which establishes the minimum program requirements. Our salt water disposal wells are located in Texas, which requires us to obtain a permit to operate each of these wells. We have such permits for each of our salt water disposal wells. The Texas regulatory agency may suspend or modify any of these permits if such well operation is likely to result in pollution of fresh water, substantial violation of permit conditions or applicable rules, or leaks to the environment. We maintain insurance against some risks associated with our well service activities, but there can be no assurance that this insurance will continue to be commercially available or available at premium levels that justify its purchase by us. The occurrence of a significant event that is not fully insured or indemnified could have a materially adverse effect on our financial condition and operations.
In Mexico, all work related to the development of oil and other petrochemicals, including work related to oil wells, must be authorized by Mexican authorities, that require an environmental impact statement related to such work.
| Item 1A. | Risk Factors |
The following information describes certain significant risks and uncertainties inherent in our business. You should take these risks into account in evaluating us. This section does not describe all risks applicable to us, our industry or our business, and it is intended only as a summary of known material risks that are specific to the company. You should carefully consider such risks and uncertainties together with the other information contained in this Form 10-K. If any of such risks or uncertainties actually occurs, our business, financial condition or operating results could be harmed substantially and could differ materially from the plans and other forward-looking statements included in Item 7 “Management’s Discussion and Analysis of Financial Condition and Results of Operations” on page 26 of this Annual Report on Form 10-K and elsewhere herein.
10
Table of Contents
Index to Financial Statements
RISKS RELATING TO OUR COMMON SHARES
The dividend, liquidation and redemption rights of the holders of our Series B Senior Convertible Preferred Shares may adversely affect our financial position and the rights of the holders of our common shares.
The Company has Series B Senior Convertible Preferred Shares, or the Series B Preferred Shares, outstanding. The Forbes Group will have the obligation to pay to the holders of its Series B Preferred Shares quarterly dividends of five percent per annum of the original issue price, payable quarterly in cash or in-kind. No dividends may be paid to holders of common shares while accumulated dividends remain unpaid on the Series B Preferred Shares. Currently, dividends for the quarterly periods ended November 28, 2010 and February 28, 2011 have not been paid on the Series B Preferred Shares. Therefore, the Company is prohibited at this time from issuing dividends on its common shares. The Company has not paid this dividend in cash due to certain restrictions in the Company’s indentures and has not paid this dividend in-kind because the Toronto Stock Exchange has taken the position that, in light of the market price of the Company’s common shares, the issuance of additional Series B Preferred Shares as a dividend in-kind would violate Toronto Stock Exchange rules regarding the issuance of discounted shares, unless the Company receives shareholder approval for such an issuance. The Company intends to seek shareholder approval for a pool of Series B Preferred Shares to be issued as in-kind dividends for this particular quarterly period and for future quarterly periods. Should the shareholders not approve these dividend payments in-kind, as contemplated under the Certificate of Designation of the Series B Senior Convertible Preferred Shares, the Company could be required to delist from the Toronto Stock Exchange.
Further, the Company is required, at the seventh anniversary of the issuance of the Series B Preferred Shares on May 28, 2017, to redeem any such outstanding shares at their original issue price, plus any accumulated and unpaid dividends, to be paid, at the election of the Company, in cash or common shares. The payment of the redemption price in cash is expected to result in reduced capital resources available to the Company. The payment of the redemption price in common shares would directly dilute the common shareholders. The payment of dividends in-kind would also have a dilutive effect on the common shareholders (as any Series B Preferred Shares issued as dividends will be themselves convertible into common shares). In the event that the Company is liquidated while Series B Preferred Shares are outstanding, holders of the Series B Preferred Shares will be entitled to receive a preferred liquidation distribution, plus any accumulated and unpaid dividends, before holders of common shares receive any distributions.
Holders of the Series B Preferred Shares have certain voting and other rights that may adversely affect holders of our common shares, and the holders of our Series B Preferred Shares may have different interests from, and vote their shares in a manner deemed adverse to, holders of our common shares.
As mentioned in the preceding risk factor, the Company has not paid a dividend on its Series B Preferred Shares for the quarterly periods ended November 28, 2010 and February 28, 2011. In the event that we fail to pay dividends, in cash or in-kind, on the Series B Preferred Shares for an aggregate of at least eight quarterly dividend periods (whether or not consecutive), the holders of the Series B Preferred Shares will be entitled to vote at any meeting of the shareholders with the holders of the common shares and to cast the number of votes equal to the number of whole common shares into which the Series B Preferred Shares held by such holders are then convertible. If the holders of the current Series B Preferred Shares were able to vote pursuant to this provision at this time or converted the Series B Preferred Shares into common shares, we believe that those holders would be entitled to an aggregate of 15,005,799 votes resulting from their ownership of Series B Preferred Shares. This together with common shares already held by these shareholders (as reported to the Company by such shareholders), would entitle these shareholders to just under 20%, in the aggregate, of the voting power of the Company. Further, the holders of Series B Preferred Shares may have certain voting rights with respect to the approval of amendments to the organizational documents of the Company or certain transactions between the Company and affiliate shareholders.
The holders of Series B Preferred Shares may have different interests from the holders of our common shares and could vote their shares in a manner deemed adverse to the holders of common shares.
RISKS RELATING TO OUR BUSINESS
The industry in which we operate is highly volatile, and there can be no assurance that demand for our services will continue to improve from previous depressed levels.
The demand, pricing and terms for oilfield services in our existing or future service areas largely depend upon the level of exploration and development activity for both crude oil and natural gas in the United States. Oil and natural gas industry conditions are influenced by numerous factors over which we have no control, including oil and natural gas prices, expectations about future oil and natural gas prices, levels of consumer demand, the cost of exploring for, producing and delivering oil and natural gas, the expected rates of current production, the discovery rates of new oil and natural gas reserves, available pipeline and other oil and natural gas transportation capacity, weather conditions, political, regulatory and economic conditions, and the ability of oil and natural gas companies to raise equity capital or debt financing.
11
Table of Contents
Index to Financial Statements
In the fourth quarter 2008 and during 2009, the level of activity in the oil and natural gas industry in the United States experienced a severe downturn. The industry decline resulted in the reduction of oil and natural gas prices. Although oil prices and our utilization trends improved during 2010, there can be no assurance that depressed natural gas prices will improve or that the current improving trend in oil prices or our utilization will continue. We expect that a continuation of the recent severe reduction in natural gas prices or a reduction in oil prices would have a negative effect on oil and natural gas production levels and therefore affect the demand for drilling and well services by oil and natural gas companies. Any addition to, or elimination or curtailment of, government incentives for companies involved in the exploration for and production of oil and natural gas could have a significant effect on the oilfield services industry in the United States. Lower oil and natural gas prices could also cause our customers to seek to terminate, renegotiate or fail to honor our services contracts. It could affect the fair market value of our equipment fleet which, under specific circumstances, in turn could trigger a write down of our assets for accounting purposes. Lower oil and natural gas prices could also affect our ability to retain skilled oilfield services personnel and our ability to obtain access to capital to fund and grow our business. A reversal in the current trend of improving industry activity and pricing at current levels could have a material adverse effect on our business, financial condition, results of operations and cash flows.
We may be adversely affected by uncertainty in the global financial markets and the continuing worldwide economic downturn.
Our future results may be impacted by the continuing worldwide economic downturn, continued volatility or deterioration in the debt and equity capital markets, inflation, deflation, or other adverse economic conditions that may negatively affect us or parties with whom we do business resulting in their non-payment or inability to perform obligations owed to us such as the failure of customers to honor their commitments, or the failure of major suppliers to complete orders. Additionally, credit market conditions may change slowing our collection efforts as customers may experience increased difficulty in obtaining requisite financing, potentially leading to lost revenue and higher than normal accounts receivable. This could result in greater expense associated with collection efforts and increased bad debt expense.
The current global economic environment may adversely impact our ability to issue additional debt. A continuation of the economic uncertainty may cause institutional investors to respond to their customers by increasing interest rates, enacting tighter lending standards or refusing to refinance existing debt upon maturity or on terms similar to expiring debt. Even with the net proceeds of the December 2009 common equity offering and our May 2010 preferred equity offering, we may require additional capital in the future. However, due to the above listed factors, we cannot be certain that additional funding will be available if needed and, to the extent required, on acceptable terms.
Our business depends on domestic spending by the oil and natural gas industry, and this spending and our business may be adversely affected by industry and financial market conditions that are beyond our control.
We depend on our customers’ willingness to make operating and capital expenditures to explore, develop and produce oil and natural gas in the United States. Current low natural gas prices, a decline in oil prices and global economic uncertainty may reduce the availability of capital for operating and capital expenditures and may curtail spending thereby reducing demand for our services and equipment.
Industry conditions are influenced by numerous factors over which we have no control, such as the supply of and demand for oil and natural gas, domestic and worldwide economic conditions, political instability in oil and natural gas producing countries and merger and divestiture activity among oil and natural gas producers. The volatility of the oil and natural gas industry and the consequent impact on exploration and production activity could adversely impact the level of drilling and workover activity by some of our customers. Any such reduction may cause a decline in the demand for our services or adversely affect the price of our services. In addition, reduced discovery rates of new oil and natural gas reserves in our market areas also may have a negative long-term impact on our business, even in an environment of stronger oil and natural gas prices, to the extent existing production is not replaced and the number of producing wells for us to service declines.
During 2009, adverse changes in capital markets caused a number of oil and natural gas producers to announce reductions in capital budgets for future periods. In the fourth quarter of 2009 and in 2010, several of these producers announced increased capital budgets relative to their lows in mid-2009. Even so, limitations on the availability of capital, or higher costs of capital, for financing expenditures may cause these and other oil and natural gas producers to limit capital budgets in the future even if commodity prices remain at historically high levels.
12
Table of Contents
Index to Financial Statements
These same economic factors impact our customers’ ability to pay amounts due to us on a timely basis. During 2009, this impacted a significant number of our customers resulting in several million dollars in uncollectable accounts receivable. While the severity of the negative financial impact of the industry downturn has subsided, there can be no assurances that another slowdown or downturn may not occur creating additional significant levels of uncollectable accounts receivable.
Our indebtedness could restrict our operations and make us more vulnerable to adverse economic conditions.
As of December 31, 2010, our long-term debt, including current portions, was $219.4 million. In the event the current industry upward trend reverses and we experience a decline in activity as we experienced in 2009, our level of indebtedness may adversely affect operations and limit our growth. Our level of indebtedness may affect our operations in several ways, including the following:
| • | by increasing our vulnerability to general adverse economic and industry conditions; |
| • | due to the fact that the covenants that are contained in the indentures governing our indebtedness limit our ability to borrow funds, dispose of assets, pay dividends, make certain investments and make certain capital expenditures; |
| • | due to the fact that any failure to comply with the covenants of our indentures (including failure to make the required interest payments) could result in an event of default, which could result in some or all of our indebtedness under our indentures becoming immediately due and payable; and |
| • | due to the fact that our level of debt may impair our ability to obtain additional financing in the future for working capital, capital expenditures, acquisitions or other general corporate purposes. |
These restrictions could have a material adverse effect on our business, financial position, results of operations and cash flows and the ability to satisfy the obligations under our indentures. Further, due to cross-default provisions in the indenture governing our 11% senior secured notes, or Second Priority Notes, and the indenture governing our first lien floating rate notes, or First Priority Notes, a default and acceleration of outstanding debt under one indenture would result in the default and possible acceleration of outstanding debt under our other indenture. Accordingly, an event of default could result in all or a portion of our outstanding debt under our indentures becoming immediately due and payable. If this occurred, we might not be able to obtain waivers or secure alternative financing to satisfy all of our obligations simultaneously which might even force us to seek bankruptcy protection.
Impairment of our long-term assets may adversely impact our financial position and results of operations.
We evaluate our long-term assets including property, equipment, and identifiable intangible assets in accordance with generally accepted accounting principles in the U.S. We use estimated future cash flows in assessing recoverability of our long-lived assets. The cash flow projections are based on our current estimates and judgmental assessments. We perform this assessment whenever facts and circumstances indicate that the carrying value of the net assets may not be recoverable due to various external or internal factors, termed a “triggering event.” Based on our evaluation for the year ended December 31, 2010, no impairment was recorded.
We may be unable to maintain pricing on our core services.
As a result of pressures stemming from deteriorating market conditions and falling commodity prices, we entered 2009 with rapidly dropping pricing. Although pricing has increased in 2010 and the first two months of 2011, there can be no assurances that we can maintain these increases in the event of an industry decline such as the one experienced in 2009. We have and will likely continue to face pricing pressure from our customers and our competitors. The inability to maintain prices at the current levels would have a material negative impact on our financial position, operating results, and cash flows.
Industry capacity may adversely affect our business.
As a result of the worldwide economic downturn and decline in U.S. onshore exploration and production activities experienced in 2008 and 2009, and in spite of the improving conditions experienced in 2010, demand in the industry is much lower than in the past which also means that neither we nor our competitors are fully utilizing our respective rig fleets and related equipment. Lower utilization of our fleet has led to reduced pricing for our services from historical levels. Capacity that exceeds current demand in the industry has further exacerbated the pricing pressure for our services. In light of such conditions, the excess capacity could cause us to experience continued pressure on the pricing for our services and our utilization. This could have a material negative impact on our financial position, operating results, and cash flows.
13
Table of Contents
Index to Financial Statements
The industry in which we operate is highly competitive.
The oilfield services industry is highly competitive and we compete with a substantial number of companies, some of which have greater technical and financial resources than we have. Our four largest competitors are Basic Energy Services, Inc., Complete Production Services, Inc., Key Energy Services Inc. and Nabors Industries Ltd. Our ability to generate revenues and earnings depends primarily upon our ability to win bids in competitive bidding processes and to perform awarded projects within estimated times and costs. There can be no assurance that competitors will not substantially increase the resources devoted to the development and marketing of products and services that compete with ours, or that new or existing competitors will not enter the various markets in which we are active. In certain aspects of our business, we also compete with a number of small and medium-sized companies that, like us, have certain competitive advantages such as low overhead costs and specialized regional strengths. In addition, reduced levels of activity in the oil and natural gas industry could intensify competition and the pressure on competitive pricing and may result in lower revenues or margins to us.
The indentures governing the Second Priority Notes and the First Priority Notes impose significant operating and financial restrictions on us that may prevent us from pursuing certain business opportunities and restrict or limit our ability to operate our business.
The indentures governing the Second Priority Notes and the First Priority Notes contain covenants that restrict or limit our ability to take various actions, such as
| • | incurring or guaranteeing additional indebtedness or issuing disqualified capital stock; |
| • | creating or incurring liens; |
| • | engaging in business other than our current business and reasonably related extensions thereof; |
| • | making loans and investments; |
| • | paying certain dividends, distributions, redeeming subordinated indebtedness or making other restricted payments; |
| • | incurring dividend or other payment restrictions affecting certain subsidiaries; |
| • | transferring or selling assets; |
| • | entering into transactions with affiliates; |
| • | making capital expenditures; |
| • | entering into sale/lease-back transactions; |
| • | consummating a merger, consolidation or sale of all or substantially all of our assets; and |
| • | moving assets outside of the United States. |
The restrictions contained in the indentures could also limit our ability to plan for or react to market conditions, meet capital needs or otherwise restrict our activities or business plans and adversely affect our ability to fund our operations, enter into acquisitions or to engage in other business activities that would be in our interest.
We are subject to the risk of technological obsolescence.
We anticipate that our ability to maintain our current business and win new business will depend upon continuous improvements in operating equipment, among other things. There can be no assurance that we will be successful in our efforts in this regard or that we will have the resources available to continue to support this need to have our equipment remain technologically up to date and competitive. Our failure to do so could have a material adverse effect on us. No assurances can be given that competitors will not achieve technological advantages over us.
We are highly dependent on certain of our officers and key employees.
Our success is dependent upon our key management, technical and field personnel, especially John E. Crisp, our President and Chief Executive Officer, and Charles C. Forbes, our Executive Vice President and Chief Operating Officer. Any loss of the services of any one of such officers or a sufficient number of other employees could have a material adverse effect on our business and operations. Our ability to expand our services is dependent upon our ability to attract and retain additional qualified employees. The ability to secure the services of additional personnel may be constrained in times of strong industry activity.
14
Table of Contents
Index to Financial Statements
Our customer base is concentrated within the oil and natural gas production industry and loss of a significant customer could cause our revenue to decline substantially.
We served in excess of 1,115 and 985 customers for the year ended December 31, 2010 and 2009, respectively. For those same time period, our largest customer comprised approximately 13.7% and 11.7%, respectively, of our consolidated revenues, our five largest customers comprised approximately 35.9% and 37.7%, respectively, of our consolidated revenues, and our top ten customers comprised approximately 51.9% and 49.8%, respectively, of our consolidated revenues. These customers currently represent a large portion of our consolidated revenues. The loss of our top customer or of several of our top customers would adversely affect our revenues and results of operations. We may be able to replace customers lost with other customers, but there can be no assurance that lost revenues could be replaced in a timely manner, with the same margins or at all.
We expect that we will continue to incur significant costs as a result of being obligated to comply with Exchange Act reporting requirements, the Sarbanes-Oxley Act, Canadian reporting requirements and indenture covenants and that our management will be required to devote substantial time to compliance matters.
Under our indenture, we are required to comply with several covenants, including requirements to maintain liens on collateral, deliver certain opinions and certificates, and file reports under the Exchange Act with the SEC. We plan on registering our common stock under Section 12 of the Exchange Act in the near future. As a result of this we expect that we will have increased reporting requirements under the Exchange Act. In addition, the Sarbanes-Oxley Act of 2002, and rules subsequently implemented by the SEC, have imposed various requirements on public companies, including the establishment and maintenance of effective disclosure controls and procedures, internal controls and corporate governance practices. We are also required to comply with the rules and regulations applicable to public companies in Canada and to file reports with the Canadian securities administrators. Accordingly, we expect to continue to incur significant legal, accounting and other expenses. We anticipate that our management and other personnel will continue to devote a substantial amount of time and resources to comply with these requirements.
The Sarbanes-Oxley Act of 2002 requires, among other things, that we maintain effective internal controls for financial reporting and disclosure. We have performed and will perform system and process evaluation and testing of our internal control over financial reporting to allow management to report on the effectiveness of our internal controls over financial reporting, as required by section 404 of the Sarbanes-Oxley Act of 2002. Our future testing may reveal deficiencies in our internal control over financial reporting that are deemed to be material weaknesses or significant deficiencies in addition to the one discussed below that was revealed in our most recent evaluation. We expect to continue to incur significant expense and devote substantial management effort toward ensuring compliance in particular with Section 404. Moreover, if we are not able to comply with the requirements of Section 404 in a timely manner, if we or our independent registered public accounting firm identifies possible future deficiencies in our internal controls in addition to the ones discussed below that are deemed to be material weaknesses or if we fail to adequately address existing and future deficiencies, we could be subject to sanctions or investigations by the SEC or other regulatory authorities, which would entail expenditure of additional financial and management resources.
We face several risks relating to a material weakness in our internal control over financial reporting.
In connection with the preparation of the Forbes Group’s consolidated financial statements for the year ended December 31, 2010, we identified control deficiencies that constitute a material weakness in the design and operation of our internal control over financial reporting. The following material weakness was present at December 31, 2010.
| • | We did not design or maintain effective controls over the billing process to ensure timely recognition of revenue. Specifically, we identified field tickets, which represented completed but unbilled revenue that had not been entered resulting in a post-closing adjustment. |
This control deficiency could result in a future material misstatement to the annual or interim consolidated financial statements that would not be prevented or detected. Accordingly, we have determined that the above control deficiency represents a material weakness.
Internal control deficiencies could cause investors to lose confidence in our reported financial information. In addition, even if we are successful in strengthening our controls and procedures, our controls and procedures may not be adequate to prevent or identify irregularities or errors or to facilitate the fair presentation of our financial statements. We can give no assurance that the measures we have taken to date, or any future measures we may take, will remediate the material weakness identified or that any additional material weaknesses and significant deficiencies or restatements of financial results will not arise in the future due to a failure to implement and maintain adequate internal control over financial reporting or circumvention of these controls. Please see Item 9A. “Controls and Procedures” on page 83 of the Annual Report on Form 10-K for a description of certain measures we have undertaken to remediate our deficiencies.
We engage in transactions with related parties and such transactions present possible conflicts of interest that could have an adverse effect on the Company.
The Company has entered into a significant number of transactions with related parties. The details of certain of these transactions are set forth in Note 9 to our consolidated financial statements for the year ended December 31, 2010 included in this Annual Report on Form 10-K. Related party transactions create the possibility of conflicts of interest with regard to the Company’s management. Such a conflict could cause an individual in the Company’s management to seek to advance his or her economic interests above those of the Company. Further, the appearance of conflicts of interest created by related party transactions could impair the confidence of our investors. The board of directors regularly reviews these transactions and, as required by the Company’s indentures, seeks the approval of the disinterested board members when such a transaction exceeds an aggregate consideration of $500,000 and an opinion regarding the fairness of such transaction from an outside firm when such a transaction exceeds an aggregate consideration of $2.5 million. Notwithstanding this, it is possible that a conflict of interest could have a material adverse effect on our business, financial condition, results of operations and cash flows.
15
Table of Contents
Index to Financial Statements
Activity in the oilfield services industry is seasonal and may affect our revenues during certain periods.
Our operations are impacted by seasonal factors. Historically, our business has been negatively impacted during the winter months due to inclement weather, fewer daylight hours and holidays. Our well servicing rigs are mobile, and we operate a significant number of oilfield vehicles. During periods of heavy snow, ice or rain, we may not be able to move our equipment between locations, thereby reducing our ability to generate rig or truck hours. In addition, the majority of our well servicing rigs work only during daylight hours. In the winter months when daylight time becomes shorter, this reduces the amount of time that the well servicing rigs can work and therefore has a negative impact on total hours worked. Finally, we historically have experienced significant slowdown during the Thanksgiving and Christmas holiday seasons.
We rely heavily on our suppliers and do not maintain written agreements with any such suppliers.
Our ability to compete and grow will be dependent on our access to equipment, including well servicing rigs, parts and components, among other things, at a reasonable cost and in a timely manner. We do not maintain written agreements with any of our suppliers (other than operating leases for certain equipment), and we are, therefore, dependent on the relationships we maintain with them. Failure of suppliers to deliver such equipment, parts and components at a reasonable cost and in a timely manner would be detrimental to our ability to maintain existing customers and obtain new customers. No assurance can be given that we will be successful in maintaining our required supply of such items.
We rely heavily on two suppliers, Agri-Empresa, Inc. and Tetra Technologies, Inc., for potassium chloride, a principal raw material that is critical for our operations. While the materials are generally available, if we were to have a problem sourcing raw materials or transporting these materials from one of these two vendors, our ability to provide some of our services could be limited. Alternate suppliers exist for all other raw materials. The source and supply of materials has been consistent in the past, however, in periods of high industry activity, periodic shortages of certain materials have been experienced and costs have been affected. We do not have contracts with, but we do maintain relationships with, a number of suppliers in an attempt to mitigate this risk. However, if current or future suppliers are unable to provide the necessary raw materials, or otherwise fail to deliver products in the quantities required, any resulting delays in the provision of services to our customers could have a material adverse effect on our business, results of operations, financial condition and cash flows.
We do not maintain written agreements with respect to some of our salt water disposal wells.
Our ability to continue to provide well maintenance services depends on our continued access to salt water disposal wells. Four of our 15 salt water disposal wells are located on the premises of third parties who have not entered into a written lease with us. We do not maintain written surface leases or right of way agreements with these third parties and we are, therefore, dependent on the relationships we maintain with them. Failure to maintain relationships with these third parties could impair our ability to access and maintain the applicable salt water disposal wells and any well servicing equipment located on their property. If that occurred, we would increase the levels of fluid injection at our remaining salt water disposal wells. However, our permits to inject fluid into the salt water disposal wells is subject to maximum pressure limitations and if multiple salt water disposal wells became unavailable, this might adversely impact our operations.
We extend credit to our customers which presents a risk of non-payment.
A substantial portion of our accounts receivable are with customers involved in the oil and natural gas industry, whose revenues may be affected by fluctuations in oil and natural gas prices. Collection of these receivables could be influenced by economic factors affecting this industry. We do not have significant exposure to any individual customer other than our top customer, PEMEX, which accounted for approximately 13.7% and 11.7% (or $45.9 million and $25.1 million) of the revenues for the year ended December 31, 2010 and 2009, respectively. Collection exposure is increased as this customer is a foreign entity owned by a foreign government which limits our collection options. The remaining top five customers are all U.S. customers and amounted to 22.1% and 26.1% of our revenues for the year ended December 31, 2010 and 2009, respectively.
Due to the nature of our business, we may be subject to environmental liability.
Our business operations and ownership of real property are subject to numerous United States and Mexican federal, state and local environmental and health and safety laws and regulations, including those relating to emissions to air, discharges to water, treatment, storage and disposal of regulated materials, and remediation of soil and groundwater contamination. The nature of our business, including operations at our current and former facilities by prior owners, lessors or operators, exposes us to risks of liability under these laws and regulations due to the production, storage, use, transportation and disposal of materials that can cause contamination or personal injury if released into the environment. Environmental laws and regulations may have a significant effect on the costs of transportation and storage of raw materials as well as the costs of the transportation, treatment, storage and disposal of wastes. We believe we are in material compliance with applicable environmental and worker health and safety requirements. However, we may incur substantial costs, including fines, damages, criminal or civil sanctions, remediation costs, or experience interruptions in our operations for violations or liabilities arising under these laws and regulations. Although we may have the benefit of insurance maintained by our customers or by other third parties or by us such insurances may not cover every expense. Further, we may become liable for damages against which we cannot adequately insure or against which we may elect not to insure because of high costs or other reasons.
16
Table of Contents
Index to Financial Statements
Our customers are subject to similar environmental laws and regulations, as well as limits on emissions to the air and discharges into surface and sub-surface waters. Although regulatory developments that may occur in subsequent years could have the effect of reducing industry activity, we cannot predict the nature of any new restrictions or regulations that may be imposed. We may be required to increase operating expenses or capital expenditures in order to comply with any new restrictions or regulations.
Climate change legislation or regulations restricting emissions of “greenhouse gases” could result in increased operating costs and reduced demand for our services.
The U.S. Congress has been considering legislation to reduce the emissions of certain gases, commonly referred to as “greenhouse gases,” including carbon dioxide and methane, which according to certain scientific studies, might contribute to the warming of the Earth’s atmosphere and other climatic changes. On June 26, 2009, the U.S. House of Representatives passed the American Clean Energy and Security Act of 2009, or ACESA, which would establish an economy-wide cap-and-trade program to reduce U.S. emissions of these greenhouse gases. ACESA would require a 17% reduction in greenhouse gas emissions from 2005 levels by 2020 and just over an 80% reduction of such emissions by 2050. Under this legislation, the EPA would issue a capped and steadily declining number of tradable emissions allowances to major sources of greenhouse gas emissions so that such sources could continue to emit greenhouse gases into the atmosphere. These allowances would be expected to increase significantly in cost over time. ACESA would impose increasing costs on the combustion of carbon-based fuels such as oil and natural gas. The U.S. Senate began work on its own legislation for restricting domestic greenhouse gas emissions and President Obama has indicated his support of legislation to reduce greenhouse gas emissions through an emission allowance system. Although it is not currently possible to predict when and if the Senate may act on climate change legislation or how any bill passed by the Senate would be reconciled with ACESA, any future federal laws or implementing regulations that may be adopted to address the emission of greenhouse gases could adversely affect demand for our services by reducing demand for the oil and natural gas produced by our customers. Such legislation could also increase our operating costs.
Additionally, on December 7, 2009, the EPA announced its finding that greenhouse gas emissions presented an endangerment to human health and the environment. These findings allow the EPA to proceed with the adoption and implementation of regulations that would restrict emissions of greenhouse gases under existing provisions of the federal Clean Air Act. In September 2009, the EPA proposed regulations in anticipation of finalizing its endangerment finding that would require a reduction in greenhouse gas emissions from motor vehicles and, could also trigger permit review for greenhouse gas emissions from certain stationary sources. On October 30, 2009, the EPA published a final rule requiring the reporting of greenhouse gas emissions from specified large greenhouse gas emission sources in the United States beginning in 2011 for emissions occurring in 2010. On November 30, 2010, the EPA issued regulations that expanded reporting requirements to include onshore and offshore petroleum and natural gas production; natural gas processing, distribution and storage; and facilities that inject and store carbon dioxide underground for the purposes of geologic sequestration or enhanced oil and gas recovery. Reporting requirements under these new regulations are mandatory beginning in 2012 for emissions occurring in 2011.
The adoption and implementation of any regulations imposing reporting obligations on, or limiting emissions of greenhouse gases from, our equipment and operations and the equipment and operations of our customers could require us to incur increased operating costs and could adversely affect demand for crude oil and natural gas produced by our customers, which would adversely affect demand for our services. The potential increase in the costs of our operations and the operations of our customers could include additional costs to operate and maintain equipment and facilities, install new emission controls on equipment and facilities, acquire allowances to authorize greenhouse gas emissions, pay any taxes related to greenhouse gas emissions and administer and manage a greenhouse gas emissions program. While we may be able to include some or all of such increased operating costs in the rates we charge for our services, any recovery of such costs is uncertain.
Even if such legislation is not adopted at the national level, a number of states, acting either individually or through multi-state regional initiatives, have already begun implementing legal measures to reduce emissions of greenhouse gases. While no such legislation is currently being considered in Texas, many of our customers operate nationally and would be adversely affected by the requirements of such legislation. Any one of these climate change regulatory and legislative initiatives could have a material adverse effect on our business, financial condition and results of operations.
17
Table of Contents
Index to Financial Statements
Significant physical effects of climatic change, if they should occur, have the potential to damage oil and natural gas facilities, disrupt production activities and could cause us or our customers to incur significant costs in preparing for or responding to those effects.
In an interpretative guidance on climate change disclosures, the SEC indicates that climate change could have an effect on the severity of weather (including hurricanes and floods), sea levels, the arability of farmland, and water availability and quality. If any such effects were to occur, they could have an adverse effect on our assets and operations or the assets and operations of our customers. We may not be able to recover through insurance some or any of the damages, losses or costs that may result should the potential physical effects of climate change occur. Unrecovered damages and losses incurred by our customers could result in decreased demand for our services.
Increasing trucking regulations may increase our costs and negatively affect our results of operations.
In connection with the services we provide, we operate as a motor carrier and therefore are subject to regulation by the U.S. Department of Transportation, or U.S. DOT, and by various state agencies. These regulatory authorities exercise broad powers, governing activities such as the authorization to engage in motor carrier operations and regulatory safety. There are additional regulations specifically relating to the trucking industry, including testing and specification of equipment and product handling requirements. The trucking industry is subject to possible regulatory and legislative changes that may affect the economics of the industry by requiring changes in operating practices or by changing the demand for common or contract carrier services or the cost of providing truckload services. Some of these possible changes include increasingly stringent environmental regulations and changes in the regulations that govern the amount of time a driver may drive in any specific period, onboard black box recorder devices, or limits on vehicle weight and size.
Interstate motor carrier operations are subject to safety requirements prescribed by the U.S. DOT. To a large degree, intrastate motor carrier operations are subject to state safety regulations that mirror federal regulations. Such matters as weight and dimension of equipment are also subject to federal and state regulations.
From time to time, various legislative proposals are introduced, including proposals to increase federal, state, or local taxes, including taxes on motor fuels, that may increase our costs or adversely affect the recruitment of drivers. Management cannot predict whether, or in what form, any increase in such taxes applicable to us will be enacted. We may be required to increase operating expenses or capital expenditures in order to comply with any new restrictions or regulations.
We are subject to extensive additional governmental regulation.
In addition to environmental and trucking regulations, our operations are subject to a variety of other United States and Mexico federal, state and local laws, regulations and guidelines, including laws and regulations relating to health and safety, the conduct of operations, and the manufacture, management, transportation, storage and disposal of certain materials used in our operations. Also, we may become subject to such regulation in any new jurisdiction in which we may operate. We believe that we are in compliance with such laws, regulations and guidelines.
Although we continue to enhance our infrastructure, we have invested financial and managerial resources to comply with applicable laws, regulations and guidelines and expect to continue to do so in the future. Although regulatory expenditures have not, historically, been material to us, such laws, regulations and guidelines are subject to change. Accordingly, it is impossible for us to predict the cost or effect of such laws, regulations or guidelines on our future operations.
Our ability to use net operating loss carryforwards may be subject to limitations under Section 382 of the Internal Revenue Code.
As of January 1, 2011, we had U.S. federal tax net operating loss carryforwards of approximately $84.2 million. Generally, net operating loss (“NOL”) carryforwards, may be used to offset future taxable income and thereby reduce or eliminate U.S. federal income taxes. If we were to experience a change in ownership within the meaning of Section 382 of the Internal Revenue Code of 1986, as amended, or the Code, however, our ability to utilize our NOLs might be significantly limited or possibly eliminated. A change of ownership under Section 382 is defined as a cumulative change of 50% or more in the ownership positions of certain stockholders owning 5% or more of the company’s stock over a three-year period.
Based on our review of the issue, we don’t believe that we have experienced an ownership change under Section 382 of the Code. However, the issuance of additional equity in the future may result in an ownership change pursuant to Section 382 of the Code. In addition, an ownership change under Section 382 could be caused by circumstances beyond the Company’s control, such as market purchases of our stock. Thus, there can be no assurance that the Company will not experience an ownership change that would limit our application of our net operating loss carryforwards in calculating future federal tax liabilities.
18
Table of Contents
Index to Financial Statements
Our operations are inherently risky, and insurance may not always be available in amounts sufficient to fully protect us.
We have an insurance and risk management program in place to protect our assets, operations and employees. We also have programs in place to address compliance with current safety and regulatory standards. However, our operations are subject to risks inherent in the oilfield services industry, such as equipment defects, malfunctions, failures, accidents and natural disasters. In addition, hazards such as unusual or unexpected geological formations, pressures, blow-outs, fires or other conditions may be encountered in drilling and servicing wells, as well as the transportation of fluids and company assets between locations. These risks and hazards could expose us to substantial liability for personal injury, loss of life, business interruption, property damage or destruction, pollution and other environmental damages.
Although we have obtained insurance against certain of these risks, such insurance is subject to coverage limits and exclusions and may not be available for the risks and hazards to which we are exposed. In addition, no assurance can be given that such insurance will be adequate to cover our liabilities or will be generally available in the future or, if available, that premiums will be commercially justifiable. If we were to incur substantial liability and such damages were not covered by insurance or were in excess of policy limits, or if we were to incur such liability at a time when we are not able to obtain liability insurance, our business, results of operations and financial condition could be materially adversely affected.
The market for oil and natural gas may be adversely affected by global demands to curtail use of such fuels.
Fuel conservation measures, alternative fuel requirements, increasing consumer demand for alternatives to oil and natural gas and technological advances in fuel economy and energy generation devices could reduce the demand for oil and other liquid hydrocarbons. We cannot predict the effect of changing demand for oil and natural gas products, and any major changes may have a material adverse effect on our business, financial condition, results of operations and cash flows.
Our international operations could be adversely affected by war, civil disturbance, or political or economic turmoil, fluctuation in currency exchange rates and local import and export controls.
In late 2008, we began operations in Mexico. We may continue to grow our business in Mexico or other foreign jurisdictions. Foreign operations are subject to various risks, including the risk of war, civil disturbances and governmental activities that may limit or disrupt markets, restrict the movement of funds or result in the deprivation of contract rights or the taking of property without fair compensation. In Mexico and other foreign jurisdictions, our operations may be subject to additional risks associated with such jurisdictions’ political relations with the United States, currency values and exchange controls, prevailing worker wages, the ability to identify, hire, train and retain qualified personnel and operating management in such jurisdictions, difficulty in enforcing agreements due to differences in the legal and regulatory regimes compared to those of the United States, communication and translation errors due to language barriers, our ability to maintain the legal authority of the Company to own and operate its business in Mexico or such other jurisdictions, and our compliance with foreign laws and regulations governing the operation and taxation of our business and the import and export of our equipment. These risks could adversely affect the results of our future operations.
Our operations in Mexico are subject to risks associated with contract bidding.
Our operations in Mexico are performed for PEMEX, pursuant to a contract. The failure by us to renew this contract could have a material adverse effect on our financial condition, results of operations and cash flows. In March 2011, we completed amendments to the PEMEX contract which extended the term of the contract to December 31, 2011 and increased the dollar value available under the contract.
This contract is subject to competitive bid for renewal and there can be no assurances that we will be able to extend the contract beyond December 31, 2011, or increase the amounts available thereunder, or that we will be awarded other contracts by PEMEX. Failure to continue our relationship with PEMEX could negatively impact the Company as services performed for PEMEX have generated approximately USD $5.6 million in net income and USD $45.9 million in revenues for the year ended December 31, 2010.
We cannot predict how an exit by any of our principal equity investors could affect our operations or business.
As of March 28, 2011, John E. Crisp, Charles C. Forbes and Janet L. Forbes owned 9.87%, 10.31%, and 9.44%, respectively, of our common shares. Our principal equity investors may transfer their interests in us or engage in other business combination transactions with a third party that could result in a change in ownership or a change of control of us. Any transfer of an equity interest in us or a change of control could affect our governance. We cannot be certain that our equity investors will not sell, transfer or otherwise modify their ownership interest in us, whether in transactions involving third parties or other investors, nor can we predict how a change of equity investors or change of control would affect our operations or business.
19
Table of Contents
Index to Financial Statements
Our principal equity investors control important decisions affecting our governance and our operations, and their interests may differ from those of the other shareholders and noteholders.
Circumstances may arise in which the interest of our principal equity investors could be in conflict with those of the other shareholders and/or noteholders. In particular, our principal equity investors may have an interest in pursuing certain strategies or transactions that, in their judgment, enhance the value of their investment in us even though these strategies or transactions may involve risks to other shareholders and noteholders. Further conflicts of interest may arise between noteholders and our principal equity investors when we are faced with decisions that could have different implications for noteholders and our principal equity investors, including financial budgets, potential competition, the issuance or disposition of securities, the payment of distributions by us, regulatory and legal positions and other matters. Because our principal equity investors control us, these conflicts may be resolved in a manner adverse to, or that imposes more risks on, the noteholders.
In addition, conflicts of interest may arise between us and one or more of our principal equity investors when we are faced with decisions that could have different implications for us and our principal equity investors. Although our bye-laws provide certain procedural protections and require that any business combination (as defined therein) between us and an interested shareholder (as defined therein) be approved by the board of directors and 66 2/3% of our outstanding voting shares, this does not address all conflicts of interest that may arise. For example, our principal equity investors and their affiliates are not prohibited from competing with us. Because our principal equity investors control us, conflicts of interest arising because of competition between us and a principal equity investor could be resolved in a manner adverse to us. It is possible that there will be situations where our principal equity investors’ interests are in conflict with our interests, and our principal equity investors acting through the board of directors or through our executive officers could resolve these conflicts in a manner adverse to us.
We have anti-takeover provisions in our current bye-laws and elsewhere that may discourage a change of control.
Our bye-laws contain provisions that could make it more difficult for a third party to acquire us without the consent of the board of directors. These provisions provide for the following:
| • | restrictions on the time period in which directors may be nominated; |
| • | the ability of the board of directors to determine the powers, preferences and rights of the preference shares and to issue such shares without shareholder approval; and |
| • | requirements that a majority of the board of directors to approve certain corporate transactions. |
We also have a shareholder rights plan which makes it very difficult for anyone to accumulate more than a certain percentage of our outstanding equity without approval of the board of directors. These provisions could make it more difficult for a third party to acquire us, even if the third party’s offer may be considered beneficial by many shareholders. As a result, shareholders may be limited in their ability to obtain a premium for their shares.
Future legal proceedings could adversely affect us and our operations.
Given the nature of our business, we are involved in litigation from time to time in the ordinary course of business. While we are not presently a party to any material legal proceedings, legal proceedings could be filed against us in the future. No assurance can be given as to the final outcome of any legal proceedings or that the ultimate resolution of any legal proceedings will not have a material adverse effect on us.
We may not be able to fully integrate future acquisitions.
We may undertake future acquisitions of businesses and assets in the ordinary course of business. Achieving the benefits of acquisitions depends in part on having the acquired assets perform as expected, successfully consolidating functions, retaining key employees and customer relationships, and integrating operations and procedures in a timely and efficient manner. Such integration may require substantial management effort, time and resources and may divert management’s focus from other strategic opportunities and operational matters, and ultimately we may fail to realize anticipated benefits of acquisitions.
20
Table of Contents
Index to Financial Statements
Federal and state legislative and regulatory initiatives relating to hydraulic fracturing could result in increased cost and additional operating restrictions or delays.
Hydraulic fracturing is an important and common practice that is used to stimulate production of hydrocarbons, particularly natural gas, from tight formations. The process involves the injection of water, sand, and chemicals under pressure into the formation to fracture the surrounding rock and stimulate production. The process is typically regulated by state oil and gas commissions but is not subject to regulation at the federal level. The U.S. Environmental Protection Agency, or the EPA, has commenced a study of the potential environmental impacts of hydraulic fracturing activities, and a committee of the U.S. House of Representatives is also conducting an investigation of hydraulic fracturing practices. Legislation has been introduced before Congress to provide for federal regulation of hydraulic fracturing and to require disclosure of the chemicals used in the fracturing process. In addition, some states are considering adopting regulations that could restrict hydraulic fracturing in certain circumstances. If new laws or regulations that significantly restrict hydraulic fracturing are adopted, such laws could make it more difficult or costly for producers to perform fracturing to stimulate production from tight formations. In addition, if hydraulic fracturing is regulated at the federal level, fracturing activities could become subject to additional permitting requirements, and also to attendant permitting delays and potential increases in costs.
| Item 1B. | Unresolved Staff Comments |
Not applicable.
| Item 2. | Properties |
The following sets forth the principal locations from which the Company conducts its operations. The Company leases or rents all of the properties set forth below, except for the Alice rig yard, San Ygnacio truck yard and a portion of the property in Poza Rica, Mexico, which are owned by the Company. In order to secure the First Priority Notes and Second Priority Notes, mortgages have been filed with respect to the Alice rig yard and San Ygnacio truck yard and a leasehold mortgage has been filed with respect to salt water disposal well leases in Marshall County and Zapata County. A description of the lien securing the Second Priority Notes and First Priority Notes is set forth in Item 7 “Management’s Discussion and Analysis of Financial Condition and Results of Operations on page 27 of this Annual Report on Form 10-K.”
| Location |
Date in Service |
Service Offering | ||
| South Texas |
||||
| Alice – truck location |
9/1/2003 | Fluid Logistics | ||
| Alice – rig location |
9/1/2003 | Well Servicing | ||
| Freer |
9/1/2003 | Fluid Logistics | ||
| Laredo |
10/1/2003 | Fluid Logistics | ||
| San Ygnacio |
4/1/2004 | Fluid Logistics | ||
| Goliad |
8/1/2005 | Fluid Logistics | ||
| Bay City |
9/1/2005 | Fluid Logistics | ||
| Edna |
2/1/2006 | Well Servicing/Fluid Logistics | ||
| Three Rivers |
8/1/2006 | Fluid Logistics | ||
| Carrizo Springs |
12/1/2006 | Fluid Logistics | ||
| West Texas |
||||
| Ozona |
3/1/2006 | Fluid Logistics | ||
| San Angelo |
7/1/2006 | Well Servicing/Fluid Logistics | ||
| Monahans |
8/31/2007 | Well Servicing/Fluid Logistics | ||
| Odessa |
9/30/2007 | Well Servicing/Fluid Logistics | ||
| Big Spring |
10/15/2007 | Well Servicing | ||
| Big Lake |
7/16/2008 | Well Servicing/Fluid Logistics | ||
| Andrews |
8/27/2008 | Well Servicing | ||
| Lamesa |
7/1/2010 | Well Servicing | ||
| East Texas |
||||
| Marshall |
12/1/2005 | Fluid Logistics | ||
| Carthage |
3/1/2007 | Well Servicing | ||
| Kilgore |
11/1/2007 | Well Servicing | ||
| Nacogdoches |
6/5/2008 | Fluid Logistics | ||
| Mississippi |
||||
| Baxterville |
3/20/2008 | Well Servicing | ||
| Laurel |
7/1/2010 | Well Servicing | ||
| Mexico |
||||
| Poza Rica |
12/01/2008 | Well Servicing | ||
| Pennsylvania |
||||
| Indiana |
7/9/2009 | Well Servicing | ||
21
Table of Contents
Index to Financial Statements
| Item 3. | Legal Proceedings |
There are no pending material legal proceedings, and the Forbes Group is not aware of any material threatened legal proceedings, to which the Forbes Group is a party or to which its property is subject, other than in the ordinary course of business.
| Item 4. | Removed and Reserved |
22
Table of Contents
Index to Financial Statements
| Item 5. | Market for Registrant’s Common Equity, Related Stockholder Matters and Issuer Purchases of Equity Securities |
Price Range of Common Shares
Our common shares began trading on the Toronto Stock Exchange, or TSX, under the symbol “FRB.TO” immediately after the completion of our initial public offering in Canada on May 29, 2008. On, June 24, 2008, our common shares began to be quoted in the United States in U.S. dollars on the “Pink Sheets” over-the-counter market under the symbol “FESLF.PK.” The following table sets forth, for the periods indicated, the high and low sales prices reported on the TSX (in Canadian dollars) and the Pink Sheets for our common shares for the years ended December 31, 2010 and 2009. The prices reported on the Pink Sheets represent quotations between dealers without adjustment for retail mark-up, markdown or commission and may not represent actual transactions.
| TSX | Pink Sheets | |||||||||||||||
| High | Low | High | Low | |||||||||||||
| Fiscal Year 2010: |
||||||||||||||||
| Fourth Quarter |
CDN $ | 1.40 | CDN $ | 0.66 | USD $ |
1.42 |
|
USD $ | 0.64 | |||||||
| Third Quarter |
CDN $ | 0.74 | CDN $ | 0.43 | USD $ | 0.70 | USD $ | 0.42 | ||||||||
| Second Quarter |
CDN $ | 0.62 | CDN $ | 0.44 | USD $ | 0.61 | USD $ | 0.42 | ||||||||
| First Quarter |
CDN $ | 0.90 | CDN $ | 0.58 | USD $ | 0.83 | USD $ | 0.59 | ||||||||
| Fiscal Year 2009: |
||||||||||||||||
| Fourth Quarter |
CDN $ | 1.08 | CDN $ | 0.75 | USD $ | 1.02 | USD $ | 0.77 | ||||||||
| Third Quarter |
CDN $ | 1.15 | CDN $ | 0.51 | USD $ | 0.92 | USD $ | 0.50 | ||||||||
| Second Quarter |
CDN $ | 1.37 | CDN $ | 0.73 | USD $ | 1.22 | USD $ | 0.63 | ||||||||
| First Quarter |
CDN $ | 1.82 | CDN $ | 0.34 | USD $ | 1.54 | USD $ | 0.24 | ||||||||
As of March 28, 2011, the last reported sales price of our common shares on the TSX and Pink Sheets was CDN $1.70 and USD $1.75 per share, respectively. As of March 28, 2011, we had 83,673,700 common shares issued and outstanding, held by approximately 40 stockholders of record. All common shares held in street name are recorded in the Company’s stock register as being held by one stockholder.
The Company has never declared a cash dividend on its common shares and has no plans of doing so now or in the foreseeable future. The indentures governing our Second Priority Notes and First Priority Notes restrict the Company’s ability to pay dividends on our equity interests, except dividends payable in equity interests, unless, among other things, the Company is able to incur at least $1.00 of additional Indebtedness (as defined in the indentures) pursuant to the Fixed Charge Coverage Ratio set forth in such indentures. At this time, the Company is not able to incur additional Indebtedness pursuant to these ratios.
Further, the Company is currently prohibited from paying dividends on its common shares by the Certificate of Designation of the Series B Preferred Shares, as there are accumulated and unpaid dividends on the Series B Preferred Shares. The Company has not paid its dividends in cash due to the indenture restrictions set forth above and, has not paid its dividends due in November 2010 and February 2011 in-kind because the Toronto Stock Exchange has taken the position that, in light of the market price of the Company’s common shares, the issuance of additional Series B Preferred Shares as a dividend in-kind would violate Toronto Stock Exchange rules regarding the issuance of discounted shares, unless the Company receives shareholder approval for such an issuance. The Company intends to seek shareholder approval for a pool of Series B Preferred Shares to be issued as in-kind dividends for these particular quarterly periods and for future quarterly periods.
The Series B Preferred Shares accrue dividends at a rate of $1.25 per share per year, which, at our discretion, is payable in-kind. Other than these dividends, the Board of Directors presently intends to retain all earnings for use in the Company's business and, therefore, does not anticipate paying any other cash dividends in the foreseeable future. The declaration of dividends on common equity, if any, in the future would be subject to the discretion of the Board of Directors, which may consider factors such as the Company's results of operations, financial condition, capital needs and acquisition strategy, among others. Additionally, the certificate of designation of the Series B Preferred Shares prohibit the Company from paying a dividend on the common shares if dividends on the Series B Preferred Shares are not paid through the respective quarterly payment date. Further, if the aggregate cash payment of dividends on the common shares over a twelve month period exceeds five percent of the fair market value of the common shares, then we are required under the certificate of designation of the Series B Preferred Shares to pay the holders of such shares that amount that they would be entitled to receive had such holders converted their shares to common shares prior to the record date of such dividends.
23
Table of Contents
Index to Financial Statements
In connection with the reorganization in which FES Ltd, a Bermuda exempt company, became the direct parent of FES LLC, or the Bermuda Reorganization, the board of directors adopted and the Company’s sole shareholder at the time approved the 2008 Incentive Compensation Plan, or the Incentive Plan. The Incentive Plan is an unfunded plan that provides for the granting of incentive stock options, nonstatutory stock options, stock appreciation rights, restricted stock, and other stock-based incentive compensation, collectively referred to as the Awards, to employees, directors and consultants of the Company or an affiliate. The board of directors believes that the Incentive Plan strengthens the Company’s ability to attract, retain, and reward employees, directors, and consultants by enabling such persons to acquire or increase a proprietary interest in the Company, strengthening the mutuality of interests between such persons and the Company’s shareholders, and providing such persons with performance incentives to expend their maximum efforts in the creation of shareholder value. The Incentive Plan provides for a reserve equal to 5,220,000 Common Shares. In August 2010, the compensation committee granted options to purchase a total of 2,540,000 common shares to employees and directors. As of March 25, 2011, no shares remain available for issuance under the Incentive Compensation Plan.
The following table provides information as of December 31, 2010, regarding compensation plans (including individual compensation arrangements) under which equity securities are authorized for issuance:
| Plan category | Number of securities to be issued upon exercise of options, warrants and rights |
Weighted- of outstanding options, rights |
Number of securities remaining available for future issuance under equity compensation
plans in the First column) |
|||||||||
| Equity compensation plans approved by shareholders(1) |
5,220,000 | $ | 3.91 | — | ||||||||
| Equity compensation plans not approved by shareholders |
— | — | — | |||||||||
| Total |
5,220,000 | $ | 3.91 | — | ||||||||
| (1) | Consists of common shares available for issuance under our Incentive Compensation Plan. |
24
Table of Contents
Index to Financial Statements
| Item 6. | Selected Financial Data |
The following statement of operations data for the years ended December 31, 2010, 2009, and 2008 and the balance sheet data as of December 31, 2010 and 2009, have been derived from our audited consolidated financial statements included elsewhere in this Annual Report on Form 10-K. The statement of operations data for the years ended December 31, 2007 and 2006 and the balance sheet data as of December 31, 2008, 2007 and 2006 have been derived from our audited combined/consolidated financial statements not included in this Annual Report on Form 10-K (each for the Predecessor – Combined, except for the December 31, 2008 balance sheet data). Our historical results are not necessarily indicative of results to be expected for any future period. The data presented below have been derived from financial statements that have been prepared in accordance with accounting principles generally accepted in the United States and should be read with our financial statements, including notes, and with Item 7 “Management’s Discussion and Analysis of Financial Condition and Results of Operations” on page 27 of this Annual Report on Form 10-K.
| Year Ended December 31, | ||||||||||||||||||||||||
| Successor-Consolidated | Predecessor-Combined | |||||||||||||||||||||||
| 2010 | 2009 | 2008 | 2007 | 2006 | ||||||||||||||||||||
| (dollars in thousands) | ||||||||||||||||||||||||
| Statement of Operations Data: |
||||||||||||||||||||||||
| Revenues: |
||||||||||||||||||||||||
| Well servicing |
$ | 155,273 | $ | 106,097 | $ | 189,980 | $ | 103,601 | $ | 58,574 | ||||||||||||||
| Fluid logistics and other |
178,797 | 109,823 | 170,949 | 103,405 | 74,141 | |||||||||||||||||||
| Total revenues |
334,070 | 215,920 | 360,929 | 207,006 | 132,715 | |||||||||||||||||||
| Expenses: |
||||||||||||||||||||||||
| Well servicing |
123,332 | 96,826 | 128,614 | 60,570 | 32,453 | |||||||||||||||||||
| Fluid logistics and other |
138,079 | 87,263 | 117,940 | 69,887 | 49,620 | |||||||||||||||||||
| General and administrative |
23,373 | 21,229 | 17,700 | 8,824 | 6,026 | |||||||||||||||||||
| Depreciation and amortization |
39,960 | 39,472 | 33,724 | 15,342 | 7,410 | |||||||||||||||||||
| Impairment of goodwill |
— | — | 4,364 | — | — | |||||||||||||||||||
| Total expenses |
324,744 | 244,790 | 302,342 | 154,623 | 95,509 | |||||||||||||||||||
| Operating income (loss) |
9,326 | (28,870 | ) | 58,587 | 52,383 | 37,206 | ||||||||||||||||||
| Other income (expense): |
||||||||||||||||||||||||
| Interest income |
119 | 15 | 6 | 7 | 7 | |||||||||||||||||||
| Interest expense |
(27,273 | ) | (26,934 | ) | (25,798 | ) | (8,350 | ) | (5,081 | ) | ||||||||||||||
| Other income |
17 | 1,314 | 32 | 237 | 141 | |||||||||||||||||||
| Income (loss) before income taxes |
(17,811 | ) | (54,475 | ) | 32,827 | 44,277 | 32,273 | |||||||||||||||||
| Income tax expense (benefit) (1) |
(6,501 | ) | (25,144 | ) | 62,574 | 683 | — | |||||||||||||||||
| Net income (loss) |
$ | (11,310 | ) | $ | (29,331 | ) | $ | (29,748 | ) | $ | 43,594 | $ | 32,273 | |||||||||||
| Preferred share dividends |
(1,041 | ) | — | — | — | — | ||||||||||||||||||
| Net gain(loss) attributable to common shareholders |
$ | (12,351 | ) | $ | (29,331 | ) | $ | (29,748 | ) | $ | 43,594 | $ | 32,273 | |||||||||||
| Loss per share of Common Stock Basic and diluted |
$ | (0.15 | ) | $ | (0.47 | ) | $ | (0.65 | ) | |||||||||||||||
| Pro forma information giving effect to the Bermuda Reorganization (2) |
||||||||||||||||||||||||
| Net Income |
20,681 | 20,978 | 7,841 | |||||||||||||||||||||
| Basic and diluted weighted average common shares |
55,995 | 54,145 | 54,145 | |||||||||||||||||||||
| Basic and diluted earnings per shares |
$ | 0.37 | $ | 0.52 | $ | 0.39 | ||||||||||||||||||
| (1) | On May 29, 2008, in connection with the reorganization under a Bermuda parent, Forbes Energy Services Ltd., the Forbes Group became a taxable entity, which resulted in $52.8 million of income tax expense that was recorded as a one-time, deferred income tax charge to recognize the conversion to a taxable entity. Prior to that time, the entities comprising the Forbes Group were flow through entities for federal income tax purposes and the only tax obligations of the entity were the Texas margin tax which was applicable after June 29, 2007. |
25
Table of Contents
Index to Financial Statements
| (2) | Historical net income per share was not presented for 2007 and prior since we were structured as a limited liability company, had limited member units and had no equity interests that were convertible in common stock or a common stock equivalent. The unaudited pro forma net income and net income per share gives effect to the reorganization in which FES Ltd., a Bermuda exempt company became the direct parent of FES LLC and, as a result, the indirect parent of the operating entity for federal income tax purposes to a “C” corporation, the issuance of our common stock in connection with our Canadian initial public offering and simultaneous U.S. private placement on May 29, 2008, and an assumed effective tax rate of 37%, as though the Bermuda Reorganization and Canadian initial public offering had occurred on January 1, 2008, January 1, 2007 and January 1, 2006, respectively. |
| Year Ended December 31, | ||||||||||||||||||||||||
| Successor-Consolidated | Predecessor-Combined | |||||||||||||||||||||||
| 2010 | 2009 | 2008 | 2007 | 2006 | ||||||||||||||||||||
| Operating Data: |
||||||||||||||||||||||||
| Well servicing rigs (end of periods) |
173 | 171 | 170 | 101 | 43 | |||||||||||||||||||
| Rig hours |
377,073 | 273,395 | 378,657 | 180,700 | 90,941 | |||||||||||||||||||
| Heavy trucks (end of period) (1) |
361 | 366 | 370 | 262 | 179 | |||||||||||||||||||
| Trucking hours |
1,135,227 | 863,506 | 1,115,593 | 711,171 | 514,082 | |||||||||||||||||||
| Salt water disposal wells (end of period) |
15 | 18 | 14 | 14 | 9 | |||||||||||||||||||
| Locations (end of period) |
26 | 28 | 27 | 18 | 12 | |||||||||||||||||||
| Frac tanks (end of period) |
1,368 | 1,369 | 1,370 | 951 | 568 | |||||||||||||||||||
|
(1) Includes vacuum trucks, high pressure pump trucks and other heavy trucks. |
| |||||||||||||||||||||||
| Year Ended December 31, | ||||||||||||||||||||||||
| Successor-Consolidated | Predecessor-Combined | |||||||||||||||||||||||
| 2010 | 2009 | 2008 | 2007 | 2006 | ||||||||||||||||||||
| (dollars in thousands) | ||||||||||||||||||||||||
| Balance Sheet Data: |
||||||||||||||||||||||||
| Cash and cash equivalents |
$ | 30,458 | $ | 28,425 | $ | 23,469 | $ | 5,209 | $ | 7,650 | ||||||||||||||
| Property and equipment, net |
274,231 | 308,560 | 330,951 | 204,132 | 92,131 | |||||||||||||||||||
| Total assets |
451,830 | 457,432 | 482,801 | 259,995 | 128,518 | |||||||||||||||||||
| Total long-term debt |
212,915 | 214,465 | 205,378 | 107,458 | 56,188 | |||||||||||||||||||
| Total liabilities |
299,764 | 310,925 | 324,383 | 189,536 | 89,718 | |||||||||||||||||||
| Temporary equity-preferred shares |
15,270 | — | — | — | — | |||||||||||||||||||
| Shareholders’ equity/Members’ equity/Partners’ capital |
136,795 | 146,507 | 158,418 | 70,459 | 38,801 | |||||||||||||||||||
26
Table of Contents
Index to Financial Statements
| Item 7. | Management’s Discussion and Analysis of Financial Condition and Results of Operations |
The following discussion and analysis of our financial condition and results of operations should be read in conjunction with the accompanying consolidated financial statements and related notes included elsewhere in this Annual Report on Form 10-K. This discussion and analysis contains forward-looking statements within the meaning of the federal securities laws, including statements using terminology such as “anticipate,” “believe,” “continue,” “could,” “estimate,” “expect,” “intend,” “may,” “plan,” “potential,” “predict,” “project” or “should” or other comparable words or the negative of these words. Forward-looking statements involve various risks and uncertainties. Any forward-looking statements made by or on our behalf are made pursuant to the safe harbor provisions of the Private Securities Litigation Reform Act of 1995. Readers are cautioned that such forward-looking statements involve risks and uncertainties in that the actual results may differ materially from those projected in the forward-looking statements. Important factors that could cause actual results to differ include risks set forth in “Part I-Item 1A. Risk Factors” included on page 10 herein.
Overview
Forbes Energy Services Ltd., or FES Ltd, and its domestic subsidiaries, Forbes Energy Services LLC, or FES LLC, Forbes Energy Capital Inc., or FES CAP, C.C. Forbes, LLC, or CCF, TX Energy Services, LLC, or TES, Superior Tubing Testers, LLC, or STT, and Forbes Energy International, LLC, or FEI, are headquartered in Alice, Texas and conduct business primarily in Texas, Mississippi, Pennsylvania and Mexico. On October 15, 2008, FES LLC and FEI formed Forbes Energy Services México, S. de R.L. de C.V., or FES Mexico Subsidiary, a Mexican limited liability company, (sociedad de responsabilidad limitada de capital variable), to conduct operations in Mexico. On December 3, 2008, Forbes Energy Services Mexico Servicios de Personal, S. de R.L de C. V., or FES Mexico Servicios, a Mexican limited liability company, was formed to provide employee services to FES Mexico Subsidiary, and on June 8, 2009, FES LTD formed a branch in Mexico. The Mexican branch of FES Ltd and the two Mexican limited liability companies are hereinafter referred to, collectively, as “FES Mexico.”
As used in this Annual Report on Form 10-K, the “Company,” the “Forbes Group,” “we,” and “our” mean FES Ltd and its subsidiaries on and after May 29, 2008; FES LLC and its subsidiaries from January 1, 2008 to May 28, 2008; CCF, TES and STT from June 29, 2007 to December 31, 2007; and C.C. Forbes, L.P., Texas Energy Services, L.P. and Superior Tubing Testers LP, prior to June 29, 2007.
All historical financial statements and other financial data contained in this filing as of and for the year ended December 31, 2007 and prior periods are of the Forbes Group on a combined basis, and are identified herein as Predecessor – Combined, and shall be identified as such. This financial information is presented on a combined basis because the operating subsidiaries were under common management prior to the reorganization under a common Delaware parent, Forbes Energy Services LLC. All financial statements and other financial data contained in this filing for all periods after January 1, 2008 are of the Forbes Group on a consolidated basis, or Successor – Consolidated, whether or not specifically identified as such.
We are an independent oilfield services contractor that provides a wide range of well site services to oil and natural gas drilling and producing companies to help develop and enhance the production of oil and natural gas. These services include fluid hauling, fluid disposal, well maintenance, completion services, workovers and recompletions, plugging and abandonment, and tubing testing. Our operations are concentrated in the major onshore oil and natural gas producing regions of Texas, with locations in each of Baxterville and Laurel, Mississippi; Indiana, Pennsylvania; and Poza Rica, Mexico.
We currently conduct our operations through the following two business segments:
| • | Well Servicing. Our well servicing segment comprised 46.5% of consolidated revenues for the year ended December 31, 2010. At December 31, 2010, our well servicing segment utilized our modern fleet of 173 owned or leased well servicing rigs, which included 162 workover rigs and 11 swabbing rigs, and related assets and equipment. These assets are used to provide (i) well maintenance, including remedial repairs and removal and replacement of downhole production equipment, (ii) well workovers, including significant downhole repairs, re-completions and re-perforations, (iii) completion and swabbing activities, and (iv) plugging and abandoning services. In addition, we have a fleet of nine tubing testing units that are used to conduct pressure testing of oil and natural gas production tubing. |
| • | Fluid Logistics and Other. Our fluid logistics segment comprised 53.5% of consolidated revenues for the year ended December 31, 2010. Our fluid logistics segment utilized our fleet of owned or leased fluid transport trucks and related assets, including specialized vacuum, high-pressure pump and tank trucks, frac tanks, water wells, salt water disposal wells and facilities, and related equipment. These assets are used to provide, transport, store, and dispose of a variety of drilling and produced fluids used in, and generated by, oil and natural gas production. These services are required in most workover and completion projects and are routinely used in daily operations of producing wells. Beginning in the fiscal year 2010, the Company began providing additional services in which Wolverine Construction, Inc., a related party, completed such services as a sub-contractor. These services involve site preparation and are complementary to the traditional services offered by the Company. We pay Wolverine for their services and materials and then bill the cost to the customer with a margin of between 5% - 10%. The amount of revenue associated with the sub-contractor work totaled approximately $12.0 million for the year ending December 31, 2010. The following table provides a breakout of revenues, expenses and gross margin for our fluid logistics and other segment for the year-end: |
| 2010 | ||||||||||||||||
| Gross Profit | ||||||||||||||||
| Revenues | Cost | Amount | % of Revenues |
|||||||||||||
| Fluid Logistics |
$ | 166,826 | $ | 126,774 | $ | 40,052 | 24.0 | % | ||||||||
| Sub contractor services |
11,971 | 11,305 | 666 | 5.6 | % | |||||||||||
| Total fluid logistics and other |
$ | 178,797 | $ | 138,079 | $ | 40,718 | 22.8 | % | ||||||||
We believe that our two business segments are complementary and create synergies in terms of selling opportunities. Our multiple lines of service allow us to capitalize on our existing customer base to grow within existing markets, generate more business from existing customers, and increase our operating profits. By offering our customers the ability to reduce the number of vendors they use, we believe we help improve our customers’ efficiency. This is demonstrated by the fact that 74.2% of our revenues for the year ended December 31, 2010 were from customers that utilized services of both of our business segments. Further, by having multiple service offerings that span the life cycle of the well, we believe we have a competitive advantage over smaller competitors offering more limited services.
27
Table of Contents
Index to Financial Statements
Factors Affecting Results of Operations
Oil and Natural Gas Prices
Demand for well servicing and fluid logistics services is generally a function of the willingness of oil and natural gas companies to make operating and capital expenditures to explore for, develop and produce oil and natural gas, which in turn is affected by current and anticipated levels of oil and natural gas prices. Exploration and production spending is generally categorized as either operating expenditures or capital expenditures. Activities by oil and natural gas companies designed to add oil and natural gas reserves are classified as capital expenditures, and those associated with maintaining or accelerating production, such as workover and fluid logistics services, are categorized as operating expenditures. Operating expenditures are typically more stable than capital expenditures and are less sensitive to oil and natural gas price volatility. In contrast, capital expenditures by oil and natural gas companies for drilling are more directly influenced by current and expected oil and natural gas prices and generally reflect the volatility of commodity prices.
Workover Rig Rates
Our well servicing segment revenues are dependent on the prevailing market rates for workover rigs. Market day rates for workover rigs increased from 2003 through the first half of 2008, as high oil and natural gas prices and declining domestic production resulted in a substantial growth of drilling activity and demand for workover services that are used primarily to maintain or enhance production levels of existing producing wells. During the fourth quarter of 2008, all of 2009, and the majority of the first quarter of 2010, we experienced pricing pressure that resulted from the general economic decline and, more specifically, the precipitous decline in oil and natural gas prices. However, during the year-ended December 31, 2010, utilization began to increase allowing us to increase rates in certain markets beginning in March 2010 and continuing through March 2011. During the second half of 2010, our average revenue per rig hour increased approximately five percent. During the first two months of 2011 our average revenue per rig hour increased an additional six percent.
Fluid Logistics Rates
Our fluid logistics segment revenues are dependent on the prevailing market rates for fluid transport trucks and the related assets, including specialized vacuum, high-pressure pump and tank trucks, frac tanks and salt water disposal wells. Prior to the general economic decline that commenced in the latter half of 2008, higher oil and natural gas prices resulted in growing demand for drilling and our services. The economic decline initially resulted in lower oil and natural gas prices which in reduced demand for drilling and our services. Required disposal of fluids produced from wells and the high level of drilling activity through the first three quarters of 2008 led to a higher demand for fluid logistics services. In the second half of 2008, throughout 2009 and through much of the first quarter of 2010, fluid logistics rates were under significant downward pressure. While natural gas price remain low, recent increases in oil prices beginning in 2010 have increased the demand for some of our services. During the year-ended December 31, 2010 utilization began to increase allowing us to increase rates in certain markets beginning March 2010 and continuing through March 2011, particularly in the Eagle Ford shale formation in South Texas where drilling activity has increased substantially in the last twelve months.
Operating Expenses
Prior to the general economic decline, a strong oil and natural gas environment resulted in a higher demand for operating personnel and oilfield supplies and caused increases in the cost of those goods and services. In the second half of 2008 and throughout 2009 and through much of the first quarter of 2010, a weaker oil and natural gas environment has resulted in lower demand for operating personnel and oilfield supplies which allowed us to decrease our costs, thereby offsetting a portion of the price decreases granted to our customers. As utilization and demand started to increase in 2010, we are again experiencing cost pressures in areas such as labor, where we have incurred additional costs in the form of increased pay rates. Future earnings and cash flows will be dependent on our ability to manage our overall cost structure and either maintain our existing prices or obtain price increases from our customers as our operating costs increase.
Capital Expenditures and Debt Service Obligations
As a general matter, our capital expenditures to maintain our assets have been relatively limited. Historically, we have incurred indebtedness to invest in new assets to grow our business. As a result, the indebtedness we incurred for our capital expenditures has significantly increased our debt service obligations. Most of our new assets were acquired through bank borrowings subsequently refinanced through our Second Priority Notes, short-term equipment vendor financings, cash flows from operations and other permitted financings. In the near term, we expect our capital expenditures will be minimal and subject to the constraints of our cash flow and the covenants under our indentures.
28
Table of Contents
Index to Financial Statements
Capital Expenditures and Operating Income Margins
The well servicing segment typically has had higher operating income margins along with higher capital expenditures when compared with the fluid logistics segment, which has had lower operating margins but also lower capital expenditure requirements. However, with the recent industry downturn, we have experienced less margin pressure on our fluid logistics segment relative to the well servicing segment. This is due to the fact that a large portion of the fluids business is not discretionary , but required for wells to continue producing.
Renewal of PEMEX Contract
Our operations in Mexico are performed for PEMEX, pursuant to a contract. The failure by us to renew this contract could have a material adverse effect on our financial condition, results of operations and cash flows. In March 2011, we completed amendments to the PEMEX contract which extended the term of the contract to December 31, 2011 and increased the total amount available under the PEMEX contract to MXN $893.4 million plus USD $119.8 million, which amount is available to the Company and Merco Ingenieria Industrial S.A. de C.V., who is also a party to the PEMEX contract. The amounts available under this contract are allocated based on the work performed by the Company and Merco. Historically, the Company has performed all but a small portion of the services to be performed under the contract. For more information on the PEMEX contract and related amendments see the discussion of recent events on page 42 of this Annual Report on Form 10-K.
This contract is subject to competitive bid for renewal and there can be no assurances that we will be able to extend the contract beyond December 31, 2011 or increase the amounts available thereunder, or that we will be awarded other contracts by PEMEX. Failure to continue our relationship with PEMEX could negatively impact the Company as services performed for PEMEX have generated approximately USD $5.6 million in net income and USD $45.9 million in revenues for the year ended December 31, 2010.
Presentation
The following discussion and analysis is presented on a consolidated basis to reflect the results of operations and financial condition of the Forbes Group. The financial information as of and for the years ended December 31, 2010, 2009 and 2008 is presented on a consolidated basis for FES LLC and its subsidiaries from and after January 1, 2008 to May 28, 2008, because of the completion of the reorganization in which FES LLC, a Delaware limited liability company, became the parent of the operating subsidiaries, or the Delaware Reorganization, and on a consolidated basis for FES Ltd and its subsidiaries from and after May 29, 2008, because of the completion of the reorganization in which FES Ltd, a Bermuda exempt company, became the direct parent of FES LLC and, as a result, the indirect parent of the operating subsidiaries, or the Bermuda Reorganization.
Finally, we note that the limited liability companies and their predecessor entities that comprised the Forbes Group prior to January 1, 2008, were not, and until May 29, 2008, FES LLC and its subsidiaries were not, subject to federal income tax. All of the income, losses, credit, and deductions of these entities were passed through to the equity owners for purposes of their individual income tax returns, which is why these are referred to as “flow through entities” for federal income tax purposes. Accordingly, no provision for income taxes is included in the following discussion and analysis of our historical operations through May 28, 2008. As of May 29, 2008, in conjunction with the Canadian initial public offering and simultaneous U.S. private placement of FES Ltd’s common shares and the related Bermuda Reorganization, the Forbes Group became subject to U.S. federal income tax.
Results of Operations
Comparison of Years Ended December 31, 2010 and December 31, 2009
Revenues. For the year ended December 31, 2010, revenues increased by $118.2 million, or 54.7%, to $334.1 million when compared to the same period in the prior year. The fourth quarter of 2009 was the bottom of the recent industry decline for Forbes Group resulting in lower revenues and profits as compared to the year-ended 2010 where the energy services industry has experienced a turn-around with increasing utilization and pricing.
Well Servicing — Revenues from the well servicing segment increased $49.2 million for the year, or 46.3% to $155.3 million compared to the prior year. Of this increase, approximately 16.2% was due to increased prices and 83.8% was due to increased rig hours for well services. We utilized 173 and 171 well service rigs as of December 31, 2010 and 2009, respectively. Of the 173 rigs available as of December 31, 2010, 11 were allocated to Mexico operations. The average rate charged per hour during the year-ended December 31, 2010 as compared to the same period in 2009 was essentially flat due to the fact that prices were steadily decreasing during the 2009 period while the reverse was true during the same period in 2010, when prices were increasing. Average utilization of our well service rigs during the year-ended December 31, 2010 and 2009 was 65.4% and 48.9%, respectively, based on a twelve hour day, working five days a week, except holidays in the U.S. and seven days a week, 24 hours a day in Mexico, except holidays and approximately two weeks in September where Pemex suspended operations for most all service providers in Mexico. This suspension resulted in a loss estimated to be approximately USD $1 million in gross revenue. Our contract with Pemex provides that we can invoice Pemex our cost during a Pemex imposed suspension. Accordingly, in the third quarter of 2010, we accrued revenues equal to a portion of our estimated costs of approximately USD $500,000. During the fourth quarter of 2010, we recovered approximately USD $710,000 from Pemex.
29
Table of Contents
Index to Financial Statements
Fluid Logistics and Other— Revenues from the fluid logistics segment for the year ended December 31, 2010 increased $69.0 million, or 62.8%, to $178.8 million compared to the prior year, as a result of the general industry increase in pricing, activity and additional services we provided our customers through sub-contractor services. The revenue breakout for the $178.8 million consists of $166.8 million for the fluid logistics operations and $12.0 million for the sub-contractor services operations. Beginning in the fiscal year 2010, the Company began providing additional services in which Wolverine Construction, Inc., one of our related parties, completed such services as a sub-contractor. These services involve site preparation and are outside of the scope of the traditional services offered by the Company. We pay Wolverine for their services and materials and then bill the cost to the customer with a margin of between 5% - 10%. Of the total increase of $69.0 million, approximately 50.1% was due to an increase in hours worked, approximately 32.5% due to customer price increases and approximately 17.4% was due to the additional services we provided. An increase in hours of approximately 31.5% between the two years resulted in an increase in utilization from approximately 69.2% for the year ended December 31, 2009 to approximately 94.3% for the year ended December 31, 2010. Rates also increased approximately 23.8% for the year ended December 31, 2010 as compared with the year ended December 31, 2009. Our principal fluid logistics assets at December 31, 2010 and December 31, 2009 were as follows:
| As of December 31, | %
Increase (Decrease) |
|||||||||||
| Asset |
2010 | 2009 | ||||||||||
| Vacuum trucks |
285 | 290 | (1.72 | )% | ||||||||
| High-pressure pump trucks |
19 | 19 | 0.0 | % | ||||||||
| Other heavy trucks |
57 | 57 | 0.0 | % | ||||||||
| Frac tanks (includes leased) |
1,368 | 1,369 | (0.1 | )% | ||||||||
| Salt water disposal wells |
15 | 18 | (16.7 | )% | ||||||||
Consolidated Operating Expenses. Our operating expenses increased to $261.4 million for the year ended December 31, 2010, from $184.1 million for the year ended December 31, 2009, an increase of $77.3 million or 42.0%. Operating expenses as a percentage of revenues were 78.3% for the year ended December 31, 2010, compared to 85.3% for the year ended December 31, 2009. This decrease in operating expense as a percentage of our revenues is generally attributable to the general industry decline that was taking place in 2009 as compared to the uptrend experienced in 2010. During the 2009 decline companies, including Forbes, were not able to reduce costs as fast as revenues were declining. As industry activity began to stabilize in late 2009 and improve in 2010, revenues increased as the result of increased customer pricing and higher utilization. During this same time period, operating costs as a percentage of revenues declined not only as a result of increased revenues but also from the costs cuts introduced in 2009 and fixed operating expenses that did not increase in the same proportion as revenues.
Well Servicing — Operating expenses from the well servicing segment increased by $26.5 million, or 27.4%, to $123.3 million. Well servicing operating expenses as a percentage of well servicing revenues were 79.4% for the year ended December 31, 2010, compared to 91.3% for the year ended December 31, 2009, a decrease of 11.9%. This decrease in operating expense as a percentage of revenue was due to an increase in utilization to 65.4% for the year ended December 31, 2010 from 48.9% for the year ended December 31, 2009, which allowed the Company to spread its fixed costs over greater revenues, thereby increasing the gross margin. This increase in utilization consisted of 83.8% of the change. The remaining 16.2% was due to price increases of approximately 5.3% in average billing rates between the two years. Rates increased from the first quarter 2010 to the fourth quarter of 2010 by approximately 22.7%.
The dollar increase in well servicing costs between the two years was due to in large part to the increase in labor costs of $9.8 million or 22.4% for the year ended December 31, 2010 compared to the prior year. The employee count at December 31, 2010 was 1,103, compared to 896 employees as of December 31, 2009. Labor costs as a percentage of revenue were 34.7% and 41.5% for the years ended December 31, 2010 and 2009, respectively. Product and chemical costs increased $5.9 million, or 91.3%, for the year ended December 31, 2010, when compared to the prior year due to increased prices for such items as a result of the higher demand for drilling and well services driven by the increase of oil and natural gas prices. Product and chemical cost as a percentage of revenues were 7.9% and 6.1% for the year ended, December 31, 2010 and December 31, 2009, respectively. Repairs and equipment maintenance cost increased $4.0 million, or 46.4% to $12.5 million as a result of activity increases. Rig hours increased 37.9% and decreased 27.8% for the years ended December 31, 2010 and 2009, respectively. Repairs and equipment maintenance cost as a percentage of revenues was 8.0% and 8.0% for or the year ended December 31, 2010 and 2009, respectively. Out of town expenses increased $2.1 million, or 44.4%, for the year ended December 31, 2010, when compared to the prior year. Out of town expenses as of percentage of revenues was 4.5% and 4.6% for the year ended December 31, 2010 and 2009, respectively. Supplies and parts, fuel costs, rent equipment and safety expenses increased by $1.7 million, $1.5 million, $1.4 million and $0.8 million, respectively. These expenses were offset by approximately $0.8 million in realized foreign currency gains. The remaining $0.1 million was made up of various expenses in line with our expectations and were consistent with the rapidly changing industry.
30
Table of Contents
Index to Financial Statements
Fluid Logistics and Other — Operating expenses from the fluid logistics segment increased by $50.8 million, or 58.2%, to $138.1 million. The expense breakout for the $138.1 million consists of $126.8 million for the logistics operations and $11.3 million for the sub-contractor services operations. Fluid logistics operating expenses as a percentage of fluid logistics revenues were 77.2% for the year ended December 31, 2010, compared to 79.5% for the year ended December 31, 2009. This decrease in operating expense as a percentage of revenue was due to an increase in utilization to 94.3% for the year ended December 31, 2010 from 69.2% for the year ended December 31, 2009, which allowed the Company to spread its fixed costs over greater revenues, thereby increasing the gross margin.
The increase in fluid logistics operating expenses of $50.8 million was due in large part to an increase in contract services costs of $18.2 million, or 781.8%, for the year ended December 31, 2010, when compared to the same period in the prior year, as a direct result of higher activity in the general industry and the need to utilize outside services to satisfy customer demand in South Texas. The largest vendor in contract services is Wolverine Construction, Inc., a related party, who allowed us to provide additional billable services to our customers. The cost associated with their sub-contracted services was approximately $11.3 million of the $18.2 million increase year over year. Contract services cost as a percentage of revenues was 11.5% and 2.1% for the year ended December 31, 2010 and 2009, respectively. Labor costs increased by $9.9 million, or 32.8% to $40.2 million partially as result of workforce headcount increases. Labor costs as a percentage of revenues were 22.5% and 27.6% for the year ended December 31, 2010 and 2009, respectively. The employee count at December 31, 2010 was 790, as compared with 706 employees as of December 31, 2009. Fuel costs increased $7.1 million, or 45.8%, for the year ended December 31, 2010, when compared to the same period in the prior year due to fuel price increase of 21.6% and higher activity in drilling and well services. Fuel cost as a percentage of revenues was 12.7% and 14.1% for the year ended December 31, 2010 and 2009, respectively. Repairs and equipment maintenance cost increased $6.6 million, or 93.1% to $13.7 million as a result of activity increases. Truck hours increased 31.5% for the year ended December 31, 2010 and 2009, respectively. Repairs and equipment maintenance cost as a percentage of revenues was 7.7% and 6.5% for or the year ended December 31, 2010 and 2009, respectively. Equipment rental cost increased $3.8 million, or 123.1% to $6.9 million. Equipment rental cost as a percentage of revenues was 3.9% and 2.8% for the year ended December 31, 2010 and 2009, respectively. Saltwater disposal cost increased $1.8 million, or 39.5% to $6.3 million. Saltwater disposal cost as a percentage of revenues was 3.5% and 4.1% for the year ended December 31, 2010 and 2009, respectively. Product and chemical cost increase $2.2 million, or 34.5%, for the year ended December 31, 2010, when compared to the prior year due to the higher demand for drilling and well services driven by the increase of oil and natural gas prices. Product and chemical cost as a percentage of revenues was 4.9 % and 5.9% for the year ended December 31, 2010 and 2009, respectively. Tire repair cost increased $0.8 million, or 49.8% to $2.5 million. Tire repair cost as a percentage of revenues was 1.4% and 1.5% for the year ended December 31, 2010 and 2009, respectively. The remaining $0.4 million change is related to various expenses that were consistent with the higher activity of the business.
General and Administrative Expenses. General and administrative expenses from the consolidated operations increased by approximately $2.1 million, or 10.1%, to $23.4 million. General and administrative expense as a percentage of revenues were 7.0% and 9.8% for the year ended December 31, 2010 and 2009, respectively. Labor cost increased by approximately $1.9 million or 36.0%. This increase was due to the addition in employee count and increase of corporate staff, including an internal auditor, director of financial reporting and a tax accountant. Equipment rental also increased approximately $0.4 million due to the increase in hours and production. The remaining $0.1 million changes related to various expenses.
Depreciation and Amortization. Depreciation and amortization expenses increased by $0.5 million, or 1.2%, to $40.0 million. The slight increase is related to our increase in capital expenditures. Capital expenditures incurred for the year ended December 31, 2010 were $3.5 million compared to $16.3 million for the year ended December 31, 2009.
Interest and Other Expenses. Interest and other expenses were $27.1 million in the year ended December 31, 2010, compared to $25.6 million in the year ended December 31, 2009, an increase of $1.5 million, or 6.0%. This increase is primarily due to additional interest associated with the First Priority Notes issued on October 2, 2009, which was offset in part by a decrease in interest expense associated with the repurchase of certain of our 11% Senior Secured Notes due 2015, or the Second Priority Notes, in 2010.
Income Taxes. We recognized income tax benefit of $6.5 million and $25.1 million for the year ended December 31, 2010 and 2009, respectively, due to the losses recognized during the year of $11.3 million and $29.3. For the year-ended December 31, 2010 and 2009 the effective tax benefit rate was 36.5% and 46.2%, respectively.
Comparison of Years Ended December 31, 2009 and December 31, 2008
Revenues. For the year ended December 31, 2009, revenues decreased by $145.0 million, or 40.2%, to $215.9 million when compared to the same period in the prior year. During the fourth quarter 2008 and during 2009 we experienced declines in demand and significant pricing pressure that is a result of the general economic decline.
31
Table of Contents
Index to Financial Statements
Well Servicing — Revenues from the well servicing segment decreased $83.9 million for the year, or 44.2% to $106.1 million compared to the prior year. The decrease was largely due to the decreased demand for oil and natural gas and the decline in oil and natural gas prices which resulted in a reduced demand for our well services. Of the decrease, approximately 65.0% was due to a reduction in hours worked with the remaining approximately 35.0% due to customer price reductions. A decrease in hours of 27.8% between the two periods resulted in a drop in utilization from 86.0% for the year ended December 31, 2008 to 49.0% for the year ended December 31, 2009. Rates also decreased 21.0% for the year ended December 31, 2009 as compared with the year ended December 31, 2008. We had 171 well servicing rigs available as of December 31, 2009, compared to 170 well servicing rigs at December 31, 2008, a 0.6% increase. Of the 171 rigs available as of December 31, 2009, 11 were allocated to Mexico operations. Of the 160 in the U.S. at December 31, 2009, utilization was approximately 48.0% due to the general industry decline. Of the 11 allocated to Mexico operations, utilization was approximately 90.9%.
Fluid Logistics and Other — Revenues from the fluid logistics segment for the year ended December 31, 2009 decreased $61.1 million, or 35.8%, to $109.8 million compared to the prior year, as a result of the general industry decline in pricing and activity. Of this decrease, approximately 63.0% was due to a reduction in hours worked with the remaining approximately 37.0% due to customer price reductions. A decrease in hours of approximately 23% between the two years resulted in a drop in utilization from approximately 100% for the year ended December 31, 2008 to approximately 69% for the year ended December 31, 2009. Rates also decreased approximately 17% for the year ended December 31, 2009 as compared with the year ended December 31, 2008. Our principal fluid logistics assets at December 31, 2009 and December 31, 2008 were as follows:
| As of December 31, | %
Increase (Decrease) |
|||||||||||
| Asset |
2009 | 2008 | ||||||||||
| Vacuum trucks |
290 | 294 | (1.36 | )% | ||||||||
| High-pressure pump trucks |
19 | 19 | 0.0 | % | ||||||||
| Other heavy trucks |
57 | 57 | 0.0 | % | ||||||||
| Frac tanks (includes leased) |
1,369 | 1,370 | (0.07 | )% | ||||||||
| Salt water disposal wells |
18 | 14 | 28.6 | % | ||||||||
Operating Expenses. Our operating expenses decreased to $184.1 million for the year ended December 31, 2009, from $246.5 million for the year ended December 31, 2008, a decrease of $62.4 million or 25.3%. Operating expenses as a percentage of revenues were 85.3% for the year ended December 31, 2009, compared to 68.3% for the year ended December 31, 2008. This increase in operating expense as a percentage of our revenues is generally attributable to lower utilization of our equipment, and a significant reduction in the rates we are able to invoice our customers, which has been partially offset by reductions in labor costs (rates and hours) and fuel price decreases, as discussed below.
Well Servicing — Operating expenses from the well servicing segment decreased by $31.8 million, or 24.7%, to $96.8 million. Well servicing operating expenses as a percentage of well servicing revenues were 91.3% for the year ended December 31, 2009, compared to 67.7% for the year ended December 31, 2008, a decrease of 23.6%. This can be attributed primarily to a decrease of approximately 21.0% in average billing rates per well service rig between the two periods. In addition to declining rates from our customers, average well service rig utilization decreased to 49.0% for the year ended December 31, 2009 from 86.0% for the year ended December 31, 2008. Rent expenses increased by $3.8 million primarily due to an additional well service equipment operating leases entered into during 2008. Product & chemicals, repairs & maintenance, freight charges, and property taxes and also increased by $5.5 million, $1.6 million, $1.6 million and $0.3 million, respectively. Our bad debts expense increased by $1.2 million related to bad debts in Mexico created as a result of collectibility issues, which was offset by a decrease of $0.2 million in bad debts expense in the U.S. Product and chemicals, freight charges, and professional fees all increased due to operations in Mexico. Labor costs decreased by $24.9 million or 36.1% of which approximately 77% was attributable to pay reductions and approximately 23% was attributable to headcount reductions. The employee count at December 31, 2009 was 896, as compared with 977 employees as of December 31, 2008. Other expenses that decreased included supplies and parts, fuel and oil expense, insurance, out of town expense, contract labor, auto and truck, safety, professional fees–other and uniforms decreased by $7.1 million, $4.0 million, $3.4 million, $3.3 million, $1.0 million, $0.6 million, $0.5 million $0.4 and $0.4 million, respectively. These decreases were the result of more aggressive cost management. The changes in expenses and decreases in revenues were in line with management’s expectations and were consistent with the rapidly changing industry.
32
Table of Contents
Index to Financial Statements
Fluid Logistics and Other — Operating expenses from the fluid logistics segment decreased by $30.7 million, or 26.0%, to $87.3 million. Fluid logistics operating expenses as a percentage of fluid logistics revenues were 79.5% for the year ended December 31, 2009, compared to 69.0% for the year ended December 31, 2008. This was primarily attributable to a decrease in average utilization of approximately 63.0% and an approximately 37.0% decline in average customer billing rates that are a result of the general economic decline. The decrease in fluid logistics operating expenses of $30.7 million was due in large part to a decrease in fuel costs of $10.5 million, or 40.3%, for the year ended December 31, 2009, when compared to the same period in the prior year due to fuel price decreases of 36.6%. Fuel cost as a percentage of revenues was 14.1% and 15.2% for the year ended December 31, 2009 and 2008, respectively. Labor costs decreased by $10.2 million, or 27.0% to $28.1 million of which approximately 70.0% was attributable to workforce headcount decreases and approximately 30.0% was attributable to pay reductions throughout the company. Labor costs as a percentage of revenues were 27.6% and 24.3% for the year ended December 31, 2009 and 2008, respectively. The employee count at December 31, 2009 was 706, as compared with 868 employees as of December 31, 2008. Product and chemical cost decreased $3.7 million, or 36.6%, for the year ended December 31, 2009, when compared to the prior year due to the lower demand for drilling and well services driven by the decrease of oil and natural gas prices. Product and chemical cost as a percentage of revenues was 5.9 % and 6.0% for the year ended December 31, 2009 and 2008, respectively. Contract services cost decreased $2.4 million, or 51.1% to $2.3 million. Contract services cost as percentage of fluid logistics revenues were 2.1% for the year ended December 31, 2009, compared to 2.8% for the year ended December 31, 2008 as a direct result of lower activity in the general industry. The remaining $3.9 million change is related to various expenses that were consistent with the lower activity of the business.
General and Administrative Expenses. General and administrative expenses from the consolidated operations increased by approximately $3.5 million, or 19.9%, to $21.2 million. General and administrative expense as a percentage of revenues were 9.8% and 4.9% for the year ended December 31, 2009 and 2008, respectively. The change in percentage is primarily the result of the significant decrease in revenues. Professional fees for accounting and legal services increased by $2.4 million primarily related to the costs associated with obtaining a consent from our bond holders, establishing operations in Mexico, and costs of public reporting. Mexico expenses increased by an additional $1.6 million (excluding certain federal taxes) as the Mexico location became fully operational in 2009. A portion of these expenses where one-time expenses related to the start-up of our Mexico location. The Company had an increase in non-cash, stock-based compensation expense of $1.0 million related to stock options issued in May 2008 upon the initial public offering of the company’s common stock. Wages, and various other expenses decreased by approximately $0.8 million, and $0.1 million, respectively, due to the decrease in activity.
Depreciation and Amortization. Depreciation and amortization expenses increased by $5.9 million, or 17.5%, to $39.6 million, primarily due to new equipment acquired throughout 2008 that incurred a full year of depreciation in 2009, and to a lesser extent, due to new equipment acquired in 2009. Capital expenditures incurred for the year ended December 31, 2009 were $16.3 million compared to $142.0 million for the year ended December 31, 2008.
Interest and Other Expenses. Interest and other expenses were $25.6 million in the year ended December 31, 2009, compared to $25.8 million in the year ended December 31, 2008. This decrease was due in part to the repurchase of bonds in the first quarter of 2009.
Income Taxes. We recognized income tax expense of $62.6 million for the year ended December 31, 2008 due to FES Ltd becoming subject to U.S. federal taxes on May 29, 2008 as a result of our Bermuda Reorganization. Prior to that time, the entities comprising the Forbes Group were flow through entities for federal income tax purposes and the only income tax obligation of the Forbes Group was the Texas margin tax. We recognized an income tax benefit of $25.1 million for the year ended December 31, 2009 with an effective rate of 46.2%. The difference between the statutory rate of 35% and the effective rate relates to bonus depreciation on fixed assets prior to the Bermuda Reorganization which was not taken during the preparation of the 2008 tax returns for tax planning purposes.
Liquidity and Capital Resources
Overview
As of December 31, 2009, we had concluded that approximately $15.0 million of additional funding would be required during 2010 in order to meet our working capital requirements. In May 2010, we received $14.2 million as the net proceeds from the issuance of preferred stock, which we deemed sufficient at the time to meet our working capital requirements delineated as of December 31, 2009. As discussed elsewhere herein, our industry has been experiencing an upturn and, currently, we project that our current available working capital plus cash flows generated from our operations will be adequate to meet our working capital requirements over at least the next twelve months.
For the twelve months ended December 31, 2010, cash provided by operating activities amounted to $2.4 million. This was a decrease of $12.9 million as compared to the twelve months ended December 31, 2009. This was mainly due to an increase in accounts receivable of $30.6 million, a decrease in accrued liabilities of $2.3 million, offset by an increase in related party payables of $7.2 million, respectively. During December 2010, we collected approximately $18.0 million in accounts receivable from our Mexico operations, of which the majority was disbursed to Mexico vendors by December 31, 2010.
33
Table of Contents
Index to Financial Statements
Nevertheless, there can be no assurance that the current upward trends will continue. A reversal of such trends could require the Company to seek funding to meet working capital requirements. Further, although the Company feels it has adequate working capital for the foreseeable future, its projected liquidity is not at a level that the Company would prefer relative to its size. Therefore, the Company may elect to seek additional funding in order to increase its liquidity. Additionally, in the event that management elects to incur capital expenditures in excess of the levels incurred in 2010 or pursue other capital intensive activities, additional capital may be required to fund these activities. As discussed in more detail below, our ability to seek additional financing may be restricted by certain of our debt covenants.
As discussed in Note 8 of our Notes to Consolidated Financial Statements for the year ended December 31, 2010, in October 2009 we repaid and terminated our revolving credit facility with Citibank, N.A., or the Credit Facility, using the proceeds from the issuance of the First Priority Notes. Notwithstanding the termination of the Credit Facility, the indenture governing our Second Priority Notes, or the Second Priority Indenture, and the indenture governing our First Priority Notes, or the First Priority Indenture, and the debt outstanding thereunder impose significant restrictions on us and increase our vulnerability to adverse economic and industry conditions that could limit our ability to obtain additional or replacement financing. For example, both indentures only allow the Company to incur indebtedness, other than certain specific types of permitted indebtedness, if such indebtedness is unsecured and if the Fixed Charge Coverage Ratio (as defined in each indenture) for the most recently completed four full fiscal quarters is at least 3.0 to 1.0 for years beginning As of December 31, 2010, the Company could incur no additional debt under the Fixed Charge Coverage Ratio test and only limited debt under other expressly permitted categories of debt. As a result of this, in the event that the Company needs to seek financing, it may not be able to do so, unless the Company first receives consent from its bondholders. Our inability to satisfy our obligations under these indentures could constitute an event of default. An event of default could result in all or a portion of our outstanding debt becoming immediately due and payable. If this should occur, we might not be able to obtain waivers or secure alternative financing to satisfy all of our obligations simultaneously. Given the state of global events, our ability to access the capital markets or to consummate any asset sales might be restricted at a time when we would like or need to raise capital. These events could have a material adverse effect on our business, financial position, results of operations and cash flows and our ability to satisfy the obligations under our indentures.
Within certain constraints, we can conserve capital by reducing or delaying capital expenditures, deferring non-regulatory maintenance expenditures and further reducing operating and administrative costs.
We have historically funded our operations, including capital expenditures, with bank borrowings, vendor financings, cash flow from operations, the issuance of our Second Priority Notes and First Priority Notes and the proceeds from our Initial Canadian public offering and simultaneous U.S. private placement, or our Initial Equity Offering, our October 2008 and December 2009 common share offerings, and our May 2010 Series B Preferred Share private placement.
As of December 31, 2010, we had $219.4 million in debt outstanding (including the Second Priority Notes based on $192.5 million aggregate principal amount at an issue price of 97.635% of par and the First Priority Notes based on $20.0 million aggregate principal amount at an issue price of 100% of par). As of December 31, 2010, we had $15.3 million in Series B Senior Convertible Preferred Stock redeemable for cash or common stock at 95% of the fair market value of the common stock as determined in accordance with the Certificate of Designation of the Series B Preferred Shares in May 2017.
As of December 31, 2010, we had $30.5 million in cash and cash equivalents, $212.9 million in long-term debt outstanding, $6.5 million in short-term debt outstanding, and $0.2 million of short-term equipment vendor financings for well servicing rigs and other equipment included in accounts payable. Our $6.5 million of short-term debt consisted of $1.8 million payable to an equipment lender under various installment notes, and $4.6 million payable to spread the cost of our insurance premiums over the year of such coverage. For the year ended December 31, 2010, we incurred $3.5 million in capital expenditures, which included equipment related to rigs (primarily for our Mexico operations), saltwater disposal wells, and pickup trucks. We financed these purchases with cash flow from operations, and certain short-term vendor financings.
As of December 31, 2009, we had $28.4 million in cash and cash equivalents, $214.5 million in long-term debt outstanding, $12.4 million in short-term debt outstanding, and $7.5 million of short-term equipment vendor financings for well servicing rigs and other equipment included in accounts payable. Our $12.4 million of short-term debt consisted of $6.75 million to be used to repurchase Second Priority Notes pursuant to a covenant entered into in connection with previous consent, $1.7 million payable to an equipment lender under various installment notes, and $4.0 million payable to First Insurance Funding to spread the cost of our insurance premiums over the year of such coverage. Our $7.5 million of vendor financing was comprised of $7.1 million payable to our well service rig and vacuum trailer supplier, with the balance due to several smaller vendors. In the year ended December 31, 2009, we incurred $16.3 million in capital expenditures, which included equipment related to rigs (primarily for our Mexico operations), saltwater disposal wells and pickup trucks. We financed these purchases with cash flow from operations, and certain short-term vendor financings.
34
Table of Contents
Index to Financial Statements
Cash Flows
Our cash flows depend, to a large degree, on the level of spending by oil and gas companies’ development and production activities. Sustained increases or decreases in the price of natural gas or oil could have a material impact on these activities, and could also materially affect our cash flows. Certain sources and uses of cash, such as the level of discretionary capital expenditures, purchases and sales of investments, issuances and repurchases of debt and of our common shares are within our control and are adjusted as necessary based on market conditions.
Cash Flows from Operating Activities
Net cash provided by operating activities totaled $2.4 million for the year ended December 31, 2010, compared to net cash provided by operating activities of $15.4 million for the year ended December 31, 2009, a decrease of $13.0 million. This $13.0 decrease resulted from increases in calculated cash flow related to a reduction in the net loss from 2009 to 2010 of $18.0 million due to improved results of operations, an increase in various non-cash items between the periods of $17.9 million, and an increase in related party accounts payable of $6.6 million related primarily to Wolverine Construction, Inc. These increases in cash flow were offset by cash flow decreases as the result of an increase in accounts receivable between the two periods of $38.5 million resulting from our increased levels of activity from 2009 to 2010 as discussed elsewhere herein, a decrease in trade accounts payable of $8.1 million primarily as the result of a reduction in our Mexico trade payables as of December 31, 2010 corresponding to substantial Mexico collections in December 2010, a decrease between the two periods of $4.8 million in accrued expenses related primarily to our Mexico operations which began in early 2009 and ramped up through 2010, prepaid expenses which decreased $4.9 million between 2009 and 2010 in the normal course of business, and other net increases in cash flow resulting from changes in operating assets and liabilities of $0.3 million are in line with normal operation activities.
Cash Flows Used in Investing Activities
Net cash used in investing activities for the year ended December 31, 2010 amounted to $5.8 million (primarily related to principal payments on various equipment notes) compared to $37.7 million for the year ended December 31, 2009. The significant capital expenditures in 2009 were reflective of the expansion of business during 2008 and 2009. Capital expenditures for the year ended December 31, 2010 were primarily for payment of costs associated with yard improvements at three locations and a saltwater disposal well.
Net cash used in investing activities for the year ended December 31, 2009 amounted to $37.7 million compared to $176.9 million for the year ended December 31, 2008. The significant capital expenditures in 2008 were reflective of the expansion of business during 2008. Capital expenditures for the year ended December 31, 2009 were primarily for Mexico operations and payment for capital expenditures incurred in prior periods that were included in accounts payable at December 31, 2008.
Cash Flows from Financing Activities
Net cash provided by financing activities decreased to $5.4 million for the year ended December 31, 2010, compared to $27.3 million for the year ended December 31, 2009. In the May 2010 we issued 580,800 shares of Series B Senior Convertible Preferred Shares for net proceeds of $14.2 million (see Note 16 to the condensed consolidated financial statements included herein). In June 2010, we re-purchased and retired $7.3 million of Second Priority Notes for $6.8 million, which represented a discounted price of approximately 93.5% of par value. In addition, in 2009, we repurchased $5.3 million in Second Priority Notes for $3.4 million or at an average discount price of approximately 65% of par value.
Second Priority Notes
On February 12, 2008, we issued an aggregate of $205.0 million of 11.0% Senior Secured Notes, or the Second Priority Notes. Pursuant to the requirements of the indenture governing the Second Priority Notes, we have repurchased 12.5 million in aggregate principal amount of Second Priority Notes, including $7.3 million of principal amount of Second Priority Notes repurchased in the quarter ended June 30, 2010.
The Second Priority Notes are our senior secured obligations. The Second Priority Notes are and will be guaranteed on a senior secured basis by FES Ltd, as well as each of our existing and future domestic restricted subsidiaries. The Second Priority Notes and the guarantees are secured by second priority liens on substantially all of our assets, subject to certain exceptions and permitted liens. As with the First Priority Notes, the two foreign subsidiaries of FES Ltd have not guaranteed the Second Priority Notes, however, the Forbes Group has granted a security interest in 65% of the equity interests of these foreign subsidiaries to secure the Second Priority Notes and First Priority Notes. The Second Priority Notes are subject to redemption and to requirements that we offer to purchase the Second Priority Notes upon a change of control, following certain asset sales, and if we have excess cash flow for any fiscal year. The Second Priority Indenture governing the Second Priority Notes limits our and our restricted subsidiaries’ ability to, among other things, transfer or sell assets; pay dividends; redeem subordinated indebtedness; make investments or make other restricted payments; incur or guarantee additional indebtedness or issue disqualified capital stock; make capital expenditures that exceed certain amounts; create, incur or suffer to exist liens; incur dividend or other payment restrictions affecting certain subsidiaries; consummate a merger, consolidation or sale of all or substantially all of our assets; enter into transactions with affiliates; designate subsidiaries as unrestricted subsidiaries; engage in a business other than a business that is the same or similar to our current business and reasonably related businesses; and take or omit to take any actions that would adversely affect or impair in any material respect the liens in respect of the collateral securing the Second Priority Notes.
35
Table of Contents
Index to Financial Statements
Details of three of the more significant restrictive covenants in the Second Priority Indenture are set forth below:
| • | Limitation on the Incurrence of Additional Debt—In addition to certain indebtedness defined in the Second Priority Indenture as “Permitted Debt,” we may only incur additional debt if it is unsecured and if the Fixed Charge Coverage Ratio (as defined in the Second Priority Indenture) for the most recently completed four full fiscal quarters is at least 3.0 to 1.0 for years beginning after December 31, 2009. As of December 31, 2010, we could incur no additional debt as Permitted Debt and under this Fixed Charge Coverage Ratio test. |
| • | Limitations on Capital Expenditures—Subject to certain adjustments and exceptions, permitted capital expenditures that may be made by us are limited to $115 million for the fiscal year ending December 31, 2011, plus or minus the amount by which Consolidated Cash Flow (as defined in the Second Priority Indenture) for the year ended December 31, 2010 exceeds or falls below $160 million. Currently, based on our calculation of Consolidated Cash Flow for the year ended December 31, 2010 we anticipate being able to make only nominal capital expenditures under this provision. Under the Second Priority Indenture, we are permitted to carry over into 2011, $10 million as permitted capital expenditures, which were permitted but unused in 2010. Further subject to the limitations under the First Priority Indenture, we are permitted under the Second Priority Indenture to make additional permitted capital expenditures based, in part, on the amount of aggregate net cash proceeds received from equity issuances since the issue date of the Second Priority Indenture, February 12, 2008. |
| • | Limitation on Restricted Payments—Subject to certain limited exceptions, we are prohibited from (i) declaring or paying dividends or other distributions on our equity securities (other than dividends or distributions payable in equity securities), (ii) purchasing or redeeming any of the Company’s equity securities, (iii) making any payment on indebtedness contractually subordinated to the Second Priority Notes, except a payment of interest or principal at the stated maturity thereof, or (iv) making any investment defined as a “Restricted Investment,” unless, at the time of and after giving effect to such payment, the Company is not in default and the Company is able to incur at least $1.00 of additional Indebtedness pursuant to the Fixed Charge Coverage Ratio (as defined in the Second Priority Indenture). Further, the amount of such payment plus all other such payments made by the Company since the issuance of the Second Priority Notes must be less than the aggregate of (a) 50% of Consolidated Net Income (as defined in the Second Priority Indenture) since the issuance of the Second Priority Notes (or 100% if such figure is a deficit), (b) 100% of the aggregate net cash proceeds from equity offerings since the issuance of the Second Priority Notes, (c) if any Restricted Investments have been sold for cash, the proceeds from such sale (or the original cash investment if that amount is lower); and (d) 50% of any dividends received by the Company. |
First Priority Notes
On October 2, 2009, FES LLC and FES CAP issued to Goldman, Sachs & Co. $20 million in aggregate principal amount of First Priority Floating Rate Notes due 2014, or the First Priority Notes, in a private placement in reliance on an exemption from registration under the Securities Act of 1933, as amended. After offering expenses, the Forbes Group realized net proceeds of approximately $18.8 million which was used to repay and terminate its Credit Facility with Citibank, N.A. The First Priority Notes mature on August 1, 2014, and require semi-annual interest payments on February 1 and August 1 of each year until maturity at a rate per annum, reset semi-annually, equal to the greater of four percent or six month LIBOR, plus 800 basis points. The interest rate is currently 12%. No principal payments are due until maturity. The First Priority are senior obligations and rank equally in right of payment with other existing and future senior indebtedness, including the Second Priority Notes, and senior in right of payment to any subordinated indebtedness that may be incurred by the Forbes Group in the future.
The First Priority Notes are our senior secured obligations and are and will be guaranteed by FES Ltd, as well as our existing and future domestic restricted subsidiaries of FES Ltd. Each of these restricted domestic subsidiaries guarantees the securities on a full and unconditional and joint and several basis. The First Priority Notes and the guarantees are secured by first priority liens on substantially all of our assets, subject to certain exceptions and permitted liens. As with the Second Priority Notes, the two foreign subsidiaries of FES Ltd have not guaranteed the First Priority Notes, however, the Forbes Group has granted a security interest in 65% of the equity interests of these foreign subsidiaries to secure the First Priority Notes and the Second Priority Notes. The Forbes Group may, at its option, redeem all or part of the First Priority Notes from time to time at specified redemption prices and subject to certain conditions required by the First Priority Indenture governing the First Priority Notes. The Forbes Group is required to make an offer to purchase the notes and to repurchase any notes for which the offer is accepted at 101% of their principal amount, plus accrued and unpaid interest, if there is a change of control or if the Forbes Group has excess cash flow. The Forbes Group is required to make an offer to repurchase the notes and to repurchase any notes for which the offer is accepted at 100% of their principal amount, plus accrued and unpaid interest, following certain asset sales.
36
Table of Contents
Index to Financial Statements
The First Priority Indenture contains certain covenants similar to those in the Second Priority Indenture, including provisions that limit or restrict the Forbes Group’s and certain future subsidiaries’ abilities to incur additional debt; to create, incur or permit to exist certain liens on assets; to make payments on certain subordinated indebtedness; to pay dividends or certain other payments to equity holders; to engage in mergers, consolidations or other fundamental changes; to change the nature of its business; to engage in transactions with affiliates or to make capital expenditures in excess of certain amounts based on the year in which such expenditures are made. The First Priority Indenture also provides for certain limitations and restrictions on the Forbes Group’s ability to move collateral outside the United States or dispose of assets. These covenants are subject to a number of important limitations and exceptions. Further, each of the First Priority Indenture and Second Priority Indenture provides for events of default, which, if any of them occur, would, in certain circumstances, permit or require the principal, premium, if any, and interest on all the then outstanding First Priority Notes or Second Priority Notes, respectively, to be due and payable immediately. Additionally, in certain circumstances an event of default under the First Priority Indenture would cause an event of default under the cross-default provision of the Second Priority Indenture and vice versa. The rights of the trustee and collateral agent under the First Priority Indenture vis-à-vis the trustee and collateral agent under the Second Priority Indenture are governed by an intercreditor agreement among the Forbes Group, Wilmington Trust FSB, the trustee and collateral agent under the First Priority Indenture, and Wells Fargo Bank, National Association, the trustee and collateral agent under the Second Priority Indenture.
Details of three of the more significant restrictive covenants in the First Priority Indenture are set forth below:
| • | Limitation on the Incurrence of Additional Debt—In addition to certain indebtedness defined in the First Priority Indenture as “Permitted Debt,” we may only incur additional debt if it is unsecured and if the Fixed Charge Coverage Ratio (as defined in the First Priority Indenture) for the most recently completed four full fiscal quarters is at least 2.5 to 1.0 until December 31, 2009, and 3.0 to 1.0 thereafter. As of December 31, 2010, we could incur no additional debt under this Fixed Charges Coverage Ratio test. |
| • | Limitations on Capital Expenditures—Subject to certain adjustments and exceptions, permitted capital expenditures that may be made by us are limited to $115 million for the fiscal year ending December 31, 2011, plus or minus the amount by which Consolidated Cash Flow (as defined in the First Priority Indenture) for the year ended December 31, 2010 exceeds or falls below $160 million. Currently, based on our estimation of Consolidated Cash Flow for the year ended December 31, 2010, we anticipate being able to make only nominal capital expenditures under this provision. Under the First Priority Indenture, we are permitted to carry over into 2011, $10 million as permitted capital expenditures, which were permitted but unused in 2010. Further, we are permitted under the First Priority Indenture to make additional permitted capital expenditures based, in part, on the amount of aggregate net cash proceeds received from equity issuances since the issue date of the First Priority Indenture, October 2, 2009. |
| • | Limitation on Restricted Payments—Subject to certain limited exceptions, We are prohibited from (i) declaring or paying dividends or other distributions on our equity securities (other than dividends or distributions payable in equity securities), (ii) purchasing or redeeming any of the Company’s equity securities, (iii) making any payment on indebtedness other than First Priority Notes, except a payment of interest or principal at the stated maturity thereof, or (iv) making any investment defined as a “Restricted Investment,” unless, at the time of and after giving effect to such payment, the Company is not in default and the Company is able to incur at least $1.00 of additional Indebtedness pursuant to the Fixed Charge Coverage Ratio (as defined in the First Priority Indenture). Further, the amount of such payment plus all other such payments made by the Company since the issuance of the First Priority Notes must be less than the aggregate of (a) 50% of Consolidated Net Income (as defined in the First Priority Indenture) since the issuance of the First Priority Notes (or 100% if such figure is a deficit), (b) 100% of the aggregate net cash proceeds from equity offerings since the issuance of the First Priority Notes, (c) if any Restricted Investments have been sold for cash, the proceeds from such sale (or the original cash investment if that amount is lower); and (d) 50% of any dividends received by the Company. |
There are no significant restrictions on FES Ltd’s ability or the ability of any guarantor to obtain funds from its subsidiaries by such means as a dividend or loan. See Note 16 to the condensed consolidated financial statements for the year-ended December 31, 2010 included herein for consolidated information required by Rule 3-10 of Regulation S-X.
37
Table of Contents
Index to Financial Statements
Initial Public Offering and Simultaneous U.S. Private Placement
On May 29, 2008, FES Ltd completed the Initial Equity Offering. In the Initial Equity Offering, FES Ltd sold 24,644,500 common shares for CDN $7.00 per share and the common shares were listed on the Toronto Stock Exchange. Gross proceeds from the Initial Equity Offering were CDN $172,511,500, and net proceeds from the Initial Equity Offering after expenses were $162,465,730.
FES Ltd is a Bermuda company formed effective April 9, 2008 to act as the holding company for FES LLC and its subsidiaries. At the time of FES Ltd’s organization, 200 common shares were issued. On May 29, 2008, in conjunction with the Initial Equity Offering, the Forbes Group was reorganized, referred to herein as the Bermuda Reorganization, pursuant to which all of the members of FES LLC assigned approximately 63% of their membership interests in FES LLC to FES Ltd in exchange for 29,500,000 shares of FES Ltd’s Class B non-voting stock. Upon consummation of the Initial Equity Offering, FES Ltd contributed $120,000,000 cash as additional capital to FES LLC and FES LLC used the funds to redeem the remaining outstanding membership interests held by those members of FES LLC other than FES Ltd. The result was that FES LLC and its subsidiaries became wholly owned subsidiaries of FES Ltd.
Equity Offerings Subsequent to the Initial Equity Offering
In October 2008, FES Ltd completed a U.S. private placement of 7,966,500 of its common shares at a price per share of CDN $4.00 for an aggregate purchase price in the amount of USD $30,000,000 based on the exchange rate between U.S. dollars and Canadian dollars then in effect of $1.00 to CDN$1.0622. The Company received net proceeds of USD $29,841,637 after legal fees and other offering costs of $238,028.
On December 22, 2009, FES Ltd completed a Canadian public offering and simultaneous U.S. private placement of 21,562,500 of its common shares at a price per share of CDN $0.80 for gross proceeds of USD $16,260,232 (CDN $17,250,000), based on the exchange rate between U.S. dollars and Canadian dollars then in effect of $1.00 to CDN $0.94. Offering costs including underwriter commission, auditors and legal fees amounted to USD $1,332,527 for net proceeds to the company of USD $14,927,705. Of the total shares offered, 750,000 shares were sold to U.S. residents in private placement in reliance on exemption from registration.
On May 28, 2010, the Company completed a private placement of 580,800 Series B Preferred Shares for total gross proceeds of $14,520,000, in reliance on exemptions from registration provided by Regulation D and Regulation S promulgated under the Securities Act of 1933, as amended. In connection with the private placement, the Company paid the investors who purchased the Series B Preferred Shares a closing fee of $290,400 and legal fees and other offering costs of $401,395. The Common Shares into which the Series B Preferred Shares are convertible have certain demand and “piggyback” registration rights.
The private placement pursuant to which the Series B Preferred Shares were issued, and the listing of the common shares issuable upon conversion of the initially issued Series B Preferred Shares, was approved by the Toronto Stock Exchange, or the TSX, which reviewed the Certificate of Designation in respect of the Series B Preferred Shares prior to granting such approval. On August 28, 2010, we issued 7,259 Series B Preferred Shares as an in-kind dividend in satisfaction of its obligations under the Certificate of Designation of the Series B Preferred Shares, and the TSX has conditionally approved the listing of the common shares issuable upon conversion of these Series B Preferred Shares, subject to compliance with the listing requirements of the TSX. However, the TSX has informed the Company that the approval by the TSX of all future issuances of Series B Preferred Shares issued in payment of in-kind dividends will be subject to certain restrictions imposed by the rules of the TSX upon the issuance of listed stock at a discount. Under these rules, the payment of in-kind dividends may contravene the rules of the TSX if the effective conversion price of the common shares underlying such Series B Preferred Shares represents a discount to the market price of the common shares at the time of payment of such dividend exceeding the maximum discount permissible under the rules of the TSX, unless the Company receives shareholder approval for such an issuance. As the trading price of the Company’s common shares has increased substantially from the time of the initial issuance of Series B Preferred Shares, the application of the rules of the TSX in this manner prohibits the Company from issuing Series B Preferred Shares as an in-kind dividend at this time because the effective conversion price of the underlying common shares represents a greater discount to the current trading price of the common shares on the TSX than is permissible under the rules of the TSX without shareholder approval. For this reason, as permitted in the Certificate of Designation for the Series B Preferred Shares, the Company refrained from making the in-kind dividend payment it had planned to make on November 28, 2010. In the event that the Company fails to pay dividends on the Series B Preferred Shares outstanding for eight or more quarterly periods, the holders of the Series B Preferred Shares will be entitled to vote with the holders of common shares, on an as converted basis. Nevertheless, the TSX has indicated that in-kind dividends of Series B Preferred Shares can be issued, regardless of the price of the Company’s common shares, if the Company receives shareholder approval. Therefore, the Company intends to seek shareholder approval for a pool of Series B Preferred Shares equal to the maximum number of such shares which may be issued as in-kind dividends for this particular quarterly period and for all future quarterly periods. Should the shareholders not approve these dividend payments in-kind, as contemplated under the Certificate of Designation of the Series B Senior Convertible Preferred Shares, the Company could be required to delist from the Toronto Stock Exchange.
38
Table of Contents
Index to Financial Statements
On January 18, 2011, the holders of the Series B Preferred Shares approved an amendment to the Certificate of Designation of the Series B Preferred Shares designed to allow the Company to pay cash in lieu of issuing fractional shares created as a result of a reverse stock split of share consolidation. On January 20, 2011, this amendment was approved by the Company’s board of directors and became effective. As the Company has not paid dividends on the Series B Preferred Shares through the most recent quarterly payment date due to the issues described above, the Company is subject to certain restrictions in the Certificate of Designation of the Series B Preferred Shares, include a prohibition on purchasing or otherwise acquiring for consideration any shares junior to the Series B Preferred Shares. The amendment adopted by the holders of the Series B Preferred Shares creates an exception for the purchase by the Company of, or the payment of cash in lieu of the issuance of, fractional shares of any of the Company’s capital stock arising out of any bonus issue of shares, share consolidations or subdivisions, stock dividends, splits or combinations or business combinations.
Contractual Obligations and Financing
The table below provides estimated timing of future payments for which we were obligated as of December 31, 2010.
| Actual |
Total | 1 Year or Less |
2-3 Years |
4-5 Years |
More than 5 years |
|||||||||||||||
| (in thousands) | ||||||||||||||||||||
| Maturities of long-term debt, including current portion (1) |
$ | 222,051 | $ | 6,464 | $ | 3,087 | $ | 212,500 | $ | — | ||||||||||
| Operating lease commitments |
17,194 | 6,649 | 9,800 | 745 | — | |||||||||||||||
| Interest on long-term debt |
115,983 | 23,885 | 47,345 | 44,753 | — | |||||||||||||||
| Total |
$ | 355,228 | $ | 36,998 | $ | 60,232 | $ | 257,998 | $ | — | ||||||||||
| (1) | In June 2010, we repurchased and retired $7.3 million of Second Priority Notes for $6.8 million, which represented a discounted price of approximately 93.5% of par value. |
We have obligations to pay to the holders of our Series B Preferred Shares quarterly dividends of five percent per annum of the original issue price, payable in cash or in-kind.
Currently, dividends for the quarterly periods ended November 28, 2010 and February 28, 2011 have not been paid on the Series B Preferred Shares. The Company has not paid these dividends in cash due to certain restrictions in the Company’s indentures described on pages 75. It has not paid these dividends in-kind because, as described in greater detail on page 75, the Toronto Stock Exchange has taken the position that, in light of the market price of the Company’s common shares, the issuance of additional Series B Preferred Shares as a dividend in-kind would violate Toronto Stock Exchange rules regarding the issuance of discounted shares, unless the Company receives shareholder approval for such an issuance. The Company intends to seek shareholder approval for a pool of Series B Preferred Shares to be issued as in-kind dividends for this particular quarterly period and for future quarterly periods.
On May 28, 2017, the Company is required to redeem any of its Series B Preferred Shares then outstanding. Such mandatory redemption may, at the Company’s election, be paid in cash or Common Shares (valued for such purpose at 95% of the then fair market value of the Common Shares). As of December 31, 2010, we had 588,059 Series B Preferred Shares outstanding.
Seasonality
Our operations are impacted by seasonal factors. Historically, our business has been negatively impacted during the winter months due to inclement weather, fewer daylight hours, and holidays. Our well servicing rigs are mobile, and we operate a significant number of oilfield vehicles. During periods of heavy snow, ice or rain, we may not be able to move our equipment between locations, thereby reducing our ability to generate rig or truck hours. In addition, the majority of our well servicing rigs work only during daylight hours. In the winter months when daylight time becomes shorter, this reduces the amount of time that the well servicing rigs can work and, therefore, has a negative impact on total hours worked. Finally, during the fourth quarter, we historically have experienced significant slowdowns during the Thanksgiving and Christmas holiday seasons.
39
Table of Contents
Index to Financial Statements
Critical Accounting Policies and Estimates
The preparation of our consolidated financial statements in accordance with GAAP requires management to make estimates and assumptions that affect the reported amounts of assets and liabilities and the disclosure of contingent assets and liabilities as of the dates of the financial statements and the reported amounts of revenue and expenses during the applicable reporting periods. On an ongoing basis, management reviews its estimates, particularly those related to depreciation and amortization methods, useful lives and impairment of long-lived assets, and asset retirement obligations, using currently available information. Changes in facts and circumstances may result in revised estimates, and actual results could differ from those estimates.
Estimated Depreciable Lives
A substantial portion of our total assets is comprised of equipment. Each asset included in equipment is recorded at cost and depreciated using the straight-line method, which deducts equal amounts of the cost of such assets from earnings every year over the asset’s estimated economic useful life. As a result of these estimates of economic useful lives, net equipment as of December 31, 2010 totaled $274.2 million which represented 60.7% of total assets. Depreciation expense for the year ended December 31, 2010 totaled $37.1 million which represented 11.4% of total operating expenses. Given the significance of equipment to our financial statements, the determination of an asset’s economic useful life is considered to be a critical accounting estimate. The estimated economic useful life is monitored by management to determine its continued appropriateness.
Impairments
Long-lived assets, which include property, equipment, and finite lived intangible assets subject to amortization, comprise a significant amount of our total assets. We review the carrying values of these assets for impairment periodically, or whenever events or changes in circumstances indicate that the carrying amounts may not be recoverable. An impairment loss is recorded in the period in which it is determined that the carrying amount is not recoverable. This requires us to make judgments regarding long-term forecasts of future revenues and costs related to the assets subject to review. These forecasts include assumptions related to the rates we bill our customers, equipment utilization, equipment additions, debt borrowings and repayments, staffing levels, pay rates, and other expenses. In turn, these forecasts are uncertain in that they require assumptions about demand for our products and services, future market conditions and technological developments. Significant and unanticipated changes to these assumptions could require a provision for impairment in a future period. Given the nature of these evaluations and their application to specific assets and specific times, it is not possible to reasonably quantify the impact of changes in these assumptions. Based on our analysis as of December 31, 2008, we concluded that goodwill was impaired and recorded a $4.4 million impairment charge. Since then, we have regularly, assessed our long-lived assets for impairment and concluded that no such impairment writedown was necessary.
Allowance for Doubtful Accounts
The determination of the collectability of amounts due from our customers requires us to use estimates and make judgments regarding future events and trends, including monitoring our customers’ payment history and current credit worthiness to determine that collectability is reasonably assured, as well as consideration of the overall business climate in which our customers operate. Inherently, these uncertainties require us to make frequent judgments and estimates regarding our customers’ ability to pay amounts due to us in order to determine the appropriate amount of valuation allowances required for doubtful accounts. Provisions for doubtful accounts are recorded when it becomes evident that the customer will not make the required payments at either contractual due dates or in the future. At December 31, 2010 and 2009, allowance for doubtful accounts totaled $6.4 million, or 6.9%, and $5.3 million, or 9.2%, of gross accounts receivable, respectively. We believe that our allowance for doubtful accounts is adequate to cover potential bad debt losses under current conditions; however, uncertainties regarding changes in the financial condition of our customers, either adverse or positive, could impact the amount and timing of any additional provisions for doubtful accounts that may be required. A five percent change in the allowance for doubtful accounts would have had an impact on income from continuing operations before income taxes of approximately $0.3 million in 2010.
Revenue Recognition
Well Servicing — Well servicing consists primarily of maintenance services, workover services, completion services, plugging and abandonment services, and tubing testing. We price well servicing by the hour of service performed.
Fluid Logistics and Other — Fluid logistics consists primarily of the sale, transportation, storage, and disposal of fluids used in drilling, production, and maintenance of oil and natural gas wells. We price fluid logistics by the job, by the hour, or by the quantities sold, disposed, or hauled.
40
Table of Contents
Index to Financial Statements
We recognize revenue when services are performed, collection of the relevant receivables is probable, persuasive evidence of an arrangement exists, and the price is fixed or determinable.
Income Taxes
As of May 29, 2008, in conjunction with the initial Equity Offering and the related Bermuda Reorganization, the Forbes Group became subject to U.S. federal income tax. For the period ended December 31, 2010 and 2009, the Forbes Group had an income tax benefit of $6.5 million and $25.1 million, respectively. For the years ended December 31, 2010 and 2009, $249,000 and $0 in state tax expense was recorded and $0.2 million and $0 in foreign income tax expense, respectively. As of December 31, 2010 and 2009, $29.7 million and $36.6 million in deferred U.S. federal income tax was reflected in the FES Ltd’s balance sheet, respectively.
Current and deferred tax liabilities, net are recorded in accordance with enacted tax laws and rates. Valuation allowances are established to reduce deferred tax assets when it is more likely than not that some portion or all of the deferred tax assets will not be realized. In determining the need for valuation allowances, we have considered and made judgments and estimates regarding estimated future taxable income and ongoing prudent and feasible tax planning strategies. These estimates and judgments include some degree of uncertainty and changes in these estimates and assumptions could require us to adjust the valuation allowances for our deferred tax assets.
Deferred taxes have not been provided for on the majority of undistributed earnings of foreign subsidiaries since substantially all of these earnings are expected to be permanently reinvested in our foreign operations. A deferred tax liability is recognized when we expect that we will recover those undistributed earnings in a taxable manner, such as through receipt of dividends or sale of the investments. Determination of the amount of the unrecognized U.S. income tax liability on undistributed earnings is not practical because of the complexities of the hypothetical calculation
Environmental
We are subject to extensive federal, state, and local environmental laws and regulations. These laws, which are constantly changing, regulate the discharge or release of materials into the environment and may require us to remove or mitigate the adverse environmental effects of the disposal or release of petroleum, chemical or other hazardous substances at various sites. Environmental expenditures are expensed or capitalized depending on their future economic benefit. Expenditures that relate to an existing condition caused by past operations and that have no future economic benefits are expensed. Liabilities for expenditures of a non-capital nature are recorded when environmental assessment and/or remediation is probable and the costs can be reasonably estimated. We believe, on the basis of presently available information, that regulation of known environmental matters will not materially affect our liquidity, capital resources or consolidated financial condition. However, there can be no assurances that future costs and liabilities will not be material.
Recently Issued Accounting Pronouncements
The Financial Accounting Standards Board, or FASB, issued ASU No. 2010-13, Compensation—Stock Compensation (Topic 718): Effect of Denominating the Exercise Price of a Share-Based Payment Award in the Currency of the Market in Which the Underlying Equity Security Trades. This ASU codifies the consensus reached in EITF Issue No. 09-J, “Effect of Denominating the Exercise Price of a Share-Based Payment Award in the Currency of the Market in Which the Underlying Equity Security Trades.” The amendments to the Codification clarify that an employee share-based payment award with an exercise price denominated in the currency of a market in which a substantial portion of the entity’s equity shares trades should not be considered to contain a condition that is not a market, performance, or service condition. Therefore, an entity would not classify such an award as a liability if it otherwise qualifies as equity. The adoption of ASU 2010-13 is effective for fiscal years on or after December 15, 2010 and is not expected to have a material impact on the Company’s consolidated financial statements.
41
Table of Contents
Index to Financial Statements
The FASB issued ASU No. 2010-06, Fair Value Measurements and Disclosures (Topic 820): Improving Disclosures about Fair Value Measurements. This ASU requires some new disclosures and clarifies some existing disclosure requirements about fair value measurement as set forth in Codification Subtopic 820-10. The FASB’s objective is to improve these disclosures and, thus, increase the transparency in financial reporting. Specifically, ASU 2010-06 amends Codification Subtopic 820-10 to now require:
| • | A reporting entity should disclose separately the amounts of significant transfers in and out of Level 1 and Level 2 fair value measurements and describe the reasons for the transfers; and |
| • | In the reconciliation for fair value measurements using significant unobservable inputs, a reporting entity should present separately information about purchases, sales, issuances, and settlements. |
In addition, ASU 2010-06 clarifies the requirements of the following existing disclosures:
| • | For purposes of reporting fair value measurement for each class of assets and liabilities, a reporting entity needs to use judgment in determining the appropriate classes of assets and liabilities; and |
| • | A reporting entity should provide disclosures about the valuation techniques and inputs used to measure fair value for both recurring and nonrecurring fair value measurements. |
ASU 2010-06 is effective for interim and annual reporting periods beginning after December 15, 2009, except for the disclosures about purchases, sales, issuances, and settlements in the roll forward of activity in Level 3 fair value measurements. Those disclosures are effective for fiscal years beginning after December 15, 2010, and for interim periods within those fiscal years. The adoption of this ASU did not have a material impact on the Company’s consolidated financial statements.
Impact of Inflation on Operations
We are of the opinion that inflation has not had a significant impact on our business.
Off-Balance Sheet Arrangements
We have no off-balance sheet arrangements that have or are reasonably likely to have a current or future effect on our financial condition, changes in financial condition, revenues or expenses, results of operations, liquidity, capital expenditures or capital resources that is material to investors.
Recent Events
On January 25, 2011, the Company filed Amendment No. 1 to its Registration Statement on Form S-4 that was originally filed on November 19, 2010. While this registration statement has been filed, it has not yet been declared effective. Upon its effectiveness, the registration statement will register the exchange of common shares (and Series A Junior Participating Preferred Share purchase rights attached thereto) associated with the Company’s proposed conversion from a Bermuda exempt company to a Texas corporation, or the Conversion. In connection with the Conversion, the Company has submitted an application to list its common equity on the NASDAQ Global Market. If this application is successful, the Company plans to dual list its common equity on both the NASDAQ Global Market and the Toronto Stock Exchange. Nevertheless, there can be no assurances that the NASDAQ listing application will be accepted.
In connection with the conversion, the Company plans to conduct a ten-to-one consolidation of its common shares, or the Share Consolidation. In order to facilitate the Share Consolidation, on January 18, 2011, the holders of the Company’s Series B Preferred Shares consented to amend and restate the Certificate of Designation of the Series B Senior Convertible Preferred Shares in order to allow the Company to pay cash in lieu of issuing fractional shares created as a result of stock dividends, splits or combinations or business combinations. On January 20, 2011, this amendment was approved by Company’s board of directors and became effective.
Further, in connection with the Company’s proposed listing on the NASDAQ Global Market, the Company has executed an amended and restated nominating and voting agreement between the Company, John E. Crisp, Charles C. Forbes and Janet Forbes. Under the terms of the original agreement, Mr. Crisp, Mr. Forbes, Ms. Forbes and their respective successors or assigns, or the Founders, were granted the right to designate a majority of members of the board of directors of the Company for election. In connection with the Company’s proposed listing of its common stock on NASDAQ, the Company and the Founders decided to amend certain provisions of this agreement in order to tie the Founders’ nomination rights more closely to their combined ownership percentage of the Company’s voting stock. On March 9, 2011, the Company and the Founders executed an amended and restated nominating and voting agreement to become effective as of the date of the Conversion. Pursuant to this restated agreement, effective as of the Conversion, for as long as the Founders own greater than 25% in the aggregate of the total outstanding common stock of the Company (or other stock that at such time votes with the Common Stock with respect to the election of directors), they will have the right to designate for election such number of members of the board of directors, rounded up to the greatest whole number, commensurate with their aggregate ownership percentage of such stock. Notwithstanding the foregoing, the Founders will not have the right to designate for election a majority of the board of directors unless the Founders own a majority of the voting stock of the Company. To the extent that the Founders are unable to mutually agree upon which individuals shall be the board designees, the Founders agree to use good-faith best efforts to nominate Mr. Crisp, Mr. Forbes and Ms. Forbes as board designees, provided that if the number of board designees is less than three, then the Founders agree to use good-faith best efforts to nominate the individuals with the higher ownership percentage of the Company’s voting stock to the available designee positions.
42
Table of Contents
Index to Financial Statements
Similar to the original agreement, pursuant to the restated agreement, to the extent that the Founders hold any shares of the Company entitled to vote, such parties have agreed to vote their shares in favor of the designees nominated by the Founders to the Board of Directors. Such parties have also agreed to vote any shares of the Company entitled to vote, and to instruct their designees on the Board of Directors to vote, so as to provide that each subsidiary has at least one manager or director who is also designee of the Founder. Unless 100% of the Founders are in agreement, the parties are contractually bound to instruct their designees to vote against (i) the issuance, reduction, redemption, or alteration of rights of any equity or debt securities of the Company or any other capitalization of the Company; (ii) the formation or sale of any subsidiary, the issuance, reduction, redemption, sale, disposition, or alteration of rights of any equity or debt securities of any subsidiary; and (iii) any decision to increase or decrease the number of directors. The Nominating and Voting Agreement will terminate upon (i) the bankruptcy or dissolution of the Company, (ii) the ownership by the Founders of all the then issued and outstanding share capital of the Company, (iii) the execution of a written instrument of termination by all applicable parties, and (iv) ten years following the date of execution of the restated agreement. The Nominating and Voting Agreement applies to the Founders as owners of common shares of the Company following the conversion by the Founders of their Class B shares into common shares in May 2010.
As stated previously, the Company performs services for PEMEX in Mexico pursuant to a contract. This contract was entered into in September 2008 and provides that the Company and Merco Ingenieria Industrial S.A. de C.V., or Merco, jointly perform well maintenance and repair work with regard to PEMEX’s Altamira Asset Package in Poza Rica, Mexico. Pursuant to the contract, Merco performs site preparation services, including road construction, and the Company performs well servicing and repair work. The term of the original contract expired on September 26, 2008 and the total amount available under the original contract, for both the Company and Merco, was approximately MXN $234.3 million plus USD $48.8 million. The amounts available under this contract are allocated based on the work performed by the Company and Merco. Historically, the Company has performed all but a small portion of the services to be performed under the contract. Pursuant to the contract, the Company agreed to post a performance bond, be liable for defects arising from the work completed under the contract and maintain insurance policies that cover the work performed under the contract. Pursuant to the contract, both the Company and Merco agree to be jointly and severally liable for each other’s obligations under the contract.
In December 2009, the Company, Merco and PEMEX entered into an amendment to the original contract which increased the scope of the work performed under the contract to include the PEMEX’s Gulf Tertiary Oil Project. Further, this first amendment increased the amounts available under the original contract (for both the Company and Merco) to a total of approximately MXN $275.3 million plus USD $69.8 million. In connection with this increase, the Company agreed to increase the size of its performance bond.
In September 2010, the Company, Merco and PEMEX entered into a second amendment whereby they agreed to extend to the term of the original contract to December 31, 2010. In October 2010, a third amendment was entered into, whereby the parties agreed to add some services, including services related to chemical injection, to the list of permitted services to be performed under the contract.
In March 2011, the Company, Merco and PEMEX entered into a fourth amendment to the original PEMEX contract that extends the term of the agreement to December 31, 2011. Further, pursuant to this amendment, the Company and Merco agree to provide PEMEX with an 8% discount, from the pricing schedule set forth in the original agreement, on all invoices submitted during the portion of the term extended by the fourth amendment.
On March 24, 2011, the Company, Merco and PEMEX entered into a fifth amendment to the original PEMEX contract that increased the amounts available under the original contract (for both the Company and Merco) to a total of approximately MXN $893.4 million plus USD $119.8 million. In connection with this increase, the Company agreed to increase the size of its performance bond. Prior to this amendment, the Company and Merco had exhausted all amounts available under the contract.
| Item 7A. | Quantitative and Qualitative Disclosures About Market Risk |
In addition to the risks inherent in our operations, we are exposed to financial, market and economic risks. Changes in interest rates may result in changes in the fair market value of our financial instruments, interest income and interest expense. Our financial instruments that are exposed to interest rate risk are long-term borrowings. The following discussion provides information regarding our exposure to the risks of changing interest rates and fluctuating currency exchange rates.
Our primary debt obligations are the outstanding Second Priority Notes and the First Priority Notes. Changes in interest rates do not affect interest expense incurred on our Second Priority Notes as such notes bear interest at a fixed rate. However, changes in interest rates would affect their fair values. Generally, the fair market value of debt with a fixed interest rate will increase as interest rates fall. Conversely, the fair market value of debt will decrease as interest rates rise. A hypothetical change in interest rates of 10% relative to interest rates as of December 31, 2010 would have no impact on our interest expense for the Second Priority Notes.
The First Priority Notes have a variable interest rate and, therefore, are subject to interest rate risk. A 100 basis point increase in interest rates on our variable rate debt would result in approximately $200,000 in additional annual interest expense after exceeding the interest rate floor of 12% based on the balance outstanding as of December 31, 2010 in the amount of $20 million.
Historically, we have not been exposed to significant foreign currency fluctuation; however, as we have expanded operations in Mexico, we have become exposed to certain risks typically associated with foreign currency fluctuation as we collect revenues and pay expenses in Mexico in the local currency. Effective July 1, 2010, we changed the functional currency of our Mexican operations from the U.S. dollar to the Mexican peso in response to the growing volume of business required to be transacted in the local currency. Nevertheless, as of December 31, 2010, a 10% unfavorable change in the Mexican Peso-to-U.S. Dollar exchange rate would not materially impact our consolidated balance sheet. To date, we have not taken any action to hedge against any foreign currency rate fluctuations; however, we continually monitor the currency exchange risks associated with conducting foreign operations.
We have not entered into any derivative financial instrument transactions to manage or reduce market risk or for speculative purposes.
43
Table of Contents
Index to Financial Statements
| Item 8. | Consolidated Financial Statements and Supplementary Data |
Forbes Energy Services Ltd and Subsidiaries (A/K/A The “Forbes Group”)
Consolidated Financial Statements
44
Table of Contents
Index to Financial Statements
| Item 8A. | Reports of Independent Registered Public Accounting Firms |
Report of Independent Registered Public Accounting Firm
Board of Directors and Shareholders
Forbes Energy Services Ltd.
Alice, TX
We have audited the accompanying consolidated balance sheets of Forbes Energy Services, Ltd and Subsidiaries as of December 31, 2010 and 2009 and the related consolidated statements of operations, changes in shareholders’ equity and comprehensive loss and cash flows for the years then ended. These financial statements are the responsibility of the Company’s management. Our responsibility is to express an opinion on these financial statements based on our audits.
We conducted our audits in accordance with the standards of the Public Company Accounting Oversight Board (United States). Those standards require that we plan and perform the audit to obtain reasonable assurance about whether the financial statements are free of material misstatement. The Company is not required to have, nor were we engaged to perform, an audit of its internal control over financial reporting. Our audit included consideration of internal control over financial reporting as a basis for designing audit procedures that are appropriate in the circumstances, but not for the purpose of expressing an opinion on the effectiveness of the Company’s internal control over financial reporting. Accordingly, we express no such opinion. An audit includes examining, on a test basis, evidence supporting the amounts and disclosures in the financial statements, assessing the accounting principles used and significant estimates made by management, as well as evaluating the overall financial statement presentation. We believe that our audits provide a reasonable basis for our opinion.
In our opinion, the consolidated financial statements referred to above present fairly, in all material respects, the financial position of Forbes Energy Services Ltd and Subsidiaries at December 31, 2010 and 2009, and the results of its operations and its cash flows for the years then ended in conformity with accounting principles generally accepted in the United States of America.
/s/ BDO USA, LLP
March 29, 2011
Houston, TX
45
Table of Contents
Index to Financial Statements
Report of Independent Registered Public Accounting Firm
To the Board of Directors and
Shareholders of Forbes Energy Services Ltd.:
In our opinion, the consolidated statements of operations, changes in shareholders’ equity and cash flows for the year ended December 31, 2008 present fairly, in all material respects, the results of their operations and cash flows of Forbes Energy Services, Ltd. and its subsidiaries (the “Company”) for the year ended December 31, 2008, in conformity with accounting principles generally accepted in the United States of America. These financial statements are the responsibility of the Company’s management. Our responsibility is to express an opinion on these financial statements based on our audit. We conducted our audit of these statements in accordance with the standards of the Public Company Accounting Oversight Board (United States). Those standards require that we plan and perform the audit to obtain reasonable assurance about whether the financial statements are free of material misstatement. An audit includes examining, on a test basis, evidence supporting the amounts and disclosures in the financial statements, assessing the accounting principles used and significant estimates made by management, and evaluating the overall financial statement presentation. We believe that our audit provides a reasonable basis for our opinion.
/s/ PricewaterhouseCoopers LLP
March 31, 2009
Houston, Texas
46
Table of Contents
Index to Financial Statements
Forbes Energy Services Ltd. and Subsidiaries (a/k/a the “Forbes Group”)
Consolidated Balance Sheets
| December 31, 2010 |
December 31, 2009 |
|||||||
| Assets |
||||||||
| Current assets |
||||||||
| Cash and cash equivalents |
$ | 30,458,457 | $ | 28,425,367 | ||||
| Restricted cash |
— | 2,932,279 | ||||||
| Accounts receivable–trade, net of allowance of $6.4 million and $5.3 million for 2010 and 2009, respectively |
85,682,475 | 52,765,601 | ||||||
| Accounts receivable – related parties |
178,174 | 168,940 | ||||||
| Accounts receivable – other |
2,985,052 | 5,159,324 | ||||||
| Prepaid expenses |
5,733,664 | 3,857,527 | ||||||
| Other current assets |
839,192 | 879,167 | ||||||
| Total current assets |
125,877,014 | 94,188,205 | ||||||
| Property and equipment, net |
274,231,466 | 308,559,885 | ||||||
| Other intangible assets, net |
33,737,585 | 36,598,781 | ||||||
| Deferred financing costs, net of accumulated amortization of $5.7 million and $3.5 million for 2010 and 2009, respectively |
8,907,520 | 11,453,830 | ||||||
| Restricted cash |
9,043,246 | 6,560,225 | ||||||
| Other assets |
33,036 | 71,970 | ||||||
| Total assets |
$ | 451,829,867 | $ | 457,432,896 | ||||
| Liabilities and Shareholders’ Equity |
||||||||
| Current liabilities |
||||||||
| Current portions of long-term debt |
$ | 6,463,820 | $ | 12,432,900 | ||||
| Accounts payable – trade |
20,719,691 | 23,375,729 | ||||||
| Accounts payable – related parties |
8,106,960 | 899,102 | ||||||
| Income taxes payable |
249,022 | — | ||||||
| Accrued interest payable |
9,028,812 | 8,928,970 | ||||||
| Accrued expenses |
12,595,848 | 14,201,278 | ||||||
| Total current liabilities |
57,164,153 | 59,837,979 | ||||||
| Long-term debt, less unamortized discount on senior secured notes and current portions of long-term debt |
212,914,685 | 214,465,329 | ||||||
| Deferred tax liability |
29,685,339 | 36,622,111 | ||||||
| Total liabilities |
299,764,177 | 310,925,419 | ||||||
| Commitments and contingencies (Note 10) |
||||||||
| Temporary equity |
||||||||
| Series B senior convertible preferred shares |
15,270,293 | — | ||||||
| Shareholders’ equity |
||||||||
| Preference shares, $.01 par value, 10,000,000 shares authorized, none issued and outstanding at December 31, 2010 and December 31, 2009 |
— | — | ||||||
| Common shares, $.01 par value, 450,000,000 shares authorized, 83,673,700 and 54,173,700 shares issued and outstanding at December 31, 2010 and 2009, respectively |
836,737 | 541,737 | ||||||
| Class B shares, $.01 par value, 40,000,000 shares authorized, none and 29,500,000 shares issued and outstanding at December 31, 2010 and 2009 |
— | 295,000 | ||||||
| Additional paid-in capital |
185,134,992 | 183,880,128 | ||||||
| Accumulated other comprehensive income |
342,974 | — | ||||||
| Accumulated deficit |
(49,519,306 | ) | (38,209,388 | ) | ||||
| Total shareholders’ equity |
136,795,397 | 146,507,477 | ||||||
| Total liabilities and shareholders’ equity |
$ | 451,829,867 | $ | 457,432,896 | ||||
The accompanying notes are an integral part of these consolidated financial statements.
47
Table of Contents
Index to Financial Statements
Forbes Energy Services Ltd. and Subsidiaries (a/k/a the “Forbes Group”)
Consolidated Statements of Operations
| Years Ended December 31, | ||||||||||||
| 2010 | 2009 | 2008 | ||||||||||
| Revenues |
||||||||||||
| Well servicing |
$ | 155,273,276 | $ | 106,097,280 | $ | 189,980,242 | ||||||
| Fluid logistics and other |
178,796,699 | 109,822,640 | 170,949,057 | |||||||||
| Total revenues |
334,069,975 | 215,919,920 | 360,929,299 | |||||||||
| Expenses |
||||||||||||
| Well servicing |
123,332,501 | 96,825,911 | 128,614,600 | |||||||||
| Fluid logistics and other |
138,078,555 | 87,263,351 | 117,940,153 | |||||||||
| General and administrative |
23,373,046 | 21,228,819 | 17,700,341 | |||||||||
| Depreciation and amortization |
39,960,295 | 39,471,755 | 33,724,218 | |||||||||
| Goodwill impairment |
— | — | 4,363,369 | |||||||||
| Total expenses |
324,744,397 | 244,789,836 | 302,342,681 | |||||||||
| Operating income (loss) |
9,325,578 | (28,869,916 | ) | 58,586,618 | ||||||||
| Interest income |
118,924 | 15,001 | 6,064 | |||||||||
| Interest expense |
(27,273,125 | ) | (26,933,518 | ) | (25,797,663 | ) | ||||||
| Other income, net |
17,573 | 1,313,857 | 31,883 | |||||||||
| Income (loss) before taxes |
(17,811,050 | ) | (54,474,576 | ) | 32,826,902 | |||||||
| Income tax expense (benefit) |
(6,501,132 | ) | (25,143,867 | ) | 62,574,492 | |||||||
| Net loss |
(11,309,918 | ) | (29,330,709 | ) | (29,747,590 | ) | ||||||
| Preferred shares dividends |
(1,040,693 | ) | — | — | ||||||||
| Net loss attributable to common shareholders |
$ | (12,350,611 | ) | $ | (29,330,709 | ) | $ | (29,747,590 | ) | |||
| Loss per share of common stock (Note 13) |
||||||||||||
| Basic and diluted |
$ | (0.15 | ) | $ | (0.47 | ) | $ | (0.65 | ) | |||
| Weighted average number of shares outstanding |
||||||||||||
| Basic and diluted |
83,673,700 | 62,642,878 | 45,894,557 | |||||||||
| Pro forma earnings per share (Note 13) |
||||||||||||
| Basic and diluted |
$ | — | $ | — | $ | 0.37 | ||||||
| Pro forma weighted average number of shares outstanding |
||||||||||||
| Basic and diluted |
— | — | 55,994,843 | |||||||||
The accompanying notes are an integral part of these consolidated financial statements.
48
Table of Contents
Index to Financial Statements
Forbes Energy Services Ltd. and Subsidiaries (a/k/a the “Forbes Group”)
Consolidated Statements of Changes in Shareholders’ Equity and Comprehensive Loss
| Common Shares | Preferred Shares | Additional Paid-In |
Accumulated Comprehensive |
Accumulated | Total Members’ |
Total Shareholders’ |
||||||||||||||||||||||||||||||
| Shares | Amount | Shares | Amount | Capital | Income | Deficit | Equity | Equity | ||||||||||||||||||||||||||||
| Balance December 31, 2007 |
— | $ | — | — | $ | — | $ | — | $ | — | $ | — | $ | 70,459,267 | $ | — | ||||||||||||||||||||
| January 1, 2008 Delaware reorganization-conversion of CCF |
— | — | — | — | — | — | — | 35,603,182 | 35,603,182 | |||||||||||||||||||||||||||
| Acquisition of TES and STT |
— | — | — | — | — | — | — | 96,067,739 | 96,067,739 | |||||||||||||||||||||||||||
| Distribution |
— | — | — | — | — | — | — | (14,734,271 | ) | (14,734,271 | ) | |||||||||||||||||||||||||
| Class B shares issued in connection with Bermuda Reorganization |
29,500,000 | 295,000 | — | — | 95,772,739 | — | 20,868,911 | (116,936,650 | ) | — | ||||||||||||||||||||||||||
| Common shares issued in Initial Equity Offering, net |
24,664,700 | 246,447 | — | — | 39,691,348 | — | — | — | 39,937,795 | |||||||||||||||||||||||||||
| Additional common shares issued |
7,966,500 | 79,665 | — | — | 29,761,972 | — | — | — | 29,841,637 | |||||||||||||||||||||||||||
| Share-based compensation |
— | — | — | — | 1,449,995 | — | — | 1,449,995 | ||||||||||||||||||||||||||||
| Net loss and comprehensive loss |
— | — | — | — | — | — | (29,747,590 | ) | — | (29,747,590 | ) | |||||||||||||||||||||||||
| Balance December 31, 2008 |
62,111,200 | 621,112 | — | — | 166,676,054 | — | (8,878,679 | ) | — | 158,418,487 | ||||||||||||||||||||||||||
| Share-based compensation |
— | — | — | — | 2,491,994 | — | — | — | 2,491,994 | |||||||||||||||||||||||||||
| Net loss and comprehensive loss |
— | — | — | — | — | — | (29,330,709 | ) | — | (29,330,709 | ) | |||||||||||||||||||||||||
| Common shares issued in Equity Offering, net |
21,562,500 | 215,625 | — | — | 14,712,080 | — | — | — | 14,927,705 | |||||||||||||||||||||||||||
| Balance December 31, 2009 |
83,673,700 | 836,737 | — | — | 183,880,128 | — | (38,209,388 | ) | — | 146,507,477 | ||||||||||||||||||||||||||
| Share-based compensation |
— | — | — | — | 2,696,952 | — | — | — | 2,696,952 | |||||||||||||||||||||||||||
| Preferred stock issuance |
— | — | 580,800 | 14,229,600 | — | — | — | — | ||||||||||||||||||||||||||||
| Comprehensive loss: |
||||||||||||||||||||||||||||||||||||
| Net loss |
— | — | — | — | — | — | (11,309,918 | ) | — | (11,309,918 | ) | |||||||||||||||||||||||||
| Foreign currency translation adjustment |
— | — | — | — | — | 342,974 | — | — | 342,974 | |||||||||||||||||||||||||||
| Comprehensive loss |
— | — | — | — | — | — | — | — | (10,966,944 | ) | ||||||||||||||||||||||||||
| Preferred shares dividends, accretion, and offering costs |
— | — | 7,259 | 1,040,693 | (1,442,088 | ) | — | — | — | (1,442,088 | ) | |||||||||||||||||||||||||
| Balance December 31, 2010 |
83,673,700 | $ | 836,737 | 588,059 | $ | 15,270,293 | $ | 185,134,992 | $ | 342,974 | $ | (49,519,306 | ) | $ | — | $ | 136,795,397 | |||||||||||||||||||
The accompanying notes are an integral part of these consolidated financial statements.
49
Table of Contents
Index to Financial Statements
Forbes Energy Services Ltd. and Subsidiaries (a/k/a the “Forbes Group”)
Consolidated Statements of Cash Flows
| Years Ended December 31, | ||||||||||||
| 2010 | 2009 | 2008 | ||||||||||
| Cash flows from operating activities: |
||||||||||||
| Net loss |
$ | (11,309,918 | ) | $ | (29,330,709 | ) | $ | (29,747,590 | ) | |||
| Adjustments to reconcile net loss to net cash provided by operating activities |
||||||||||||
| Depreciation expense |
37,099,099 | 36,715,074 | 30,863,020 | |||||||||
| Amortization expense |
2,861,196 | 2,861,196 | 2,861,198 | |||||||||
| Amortization of Second Priority Notes OID |
778,813 | 682,316 | 610,289 | |||||||||
| Stock-based compensation |
2,696,952 | 2,491,994 | 1,449,995 | |||||||||
| Goodwill impairment |
— | — | 4,363,369 | |||||||||
| Deferred tax expense (benefit) |
(6,936,774 | ) | (25,446,509 | ) | 61,568,620 | |||||||
| (Gain)/Loss on disposal of assets, net |
(87,316 | ) | (23,334 | ) | 682,851 | |||||||
| Gain on extinguishment of debt |
(18,591 | ) | (1,421,750 | ) | — | |||||||
| Bad debt expense |
1,116,933 | 3,861,773 | 2,739,473 | |||||||||
| Amortization of deferred financing cost |
2,199,399 | 2,078,765 | 5,976,131 | |||||||||
| Changes in operating assets and liabilities: |
||||||||||||
| Accounts receivable |
(30,619,696 | ) | 7,914,749 | (28,937,814 | ) | |||||||
| Accounts receivable – related party |
(9,234 | ) | (71,268 | ) | 54,004 | |||||||
| Prepaid expenses and other current assets |
(1,144,718 | ) | 3,737,221 | (1,908,610 | ) | |||||||
| Accounts payable - trade |
661,228 | 8,771,774 | 4,110,765 | |||||||||
| Accounts payable - related party |
7,214,655 | 621,949 | (3,154,547 | ) | ||||||||
| Accrued expenses |
(2,287,574 | ) | 2,501,623 | 4,626,861 | ||||||||
| Income taxes payable |
249,022 | (1,005,872 | ) | 1,005,872 | ||||||||
| Accrued interest payable |
(14,367 | ) | 440,410 | 8,046,179 | ||||||||
| Net cash provided by operating activities |
2,449,109 | 15,379,402 | 65,210,066 | |||||||||
| Cash flows from investing activities: |
||||||||||||
| Proceeds from sale of property and equipment |
748,313 | — | 50,017 | |||||||||
| Restricted cash |
449,258 | (9,492,504 | ) | — | ||||||||
| Purchases of property and equipment |
(6,951,297 | ) | (30,024,471 | ) | (176,940,028 | ) | ||||||
| Insurance proceeds |
— | 1,783,832 | — | |||||||||
| Net cash used in investing activities |
(5,753,726 | ) | (37,733,143 | ) | (176,890,011 | ) | ||||||
| Cash flows from financing activities: |
||||||||||||
| Payments for debt issuance costs |
— | (1,236,638 | ) | (16,502,030 | ) | |||||||
| Proceeds from issuance of common stock |
— | 14,927,705 | 189,779,432 | |||||||||
| Proceeds from issuance of preferred stock |
14,229,600 | — | — | |||||||||
| Purchase outstanding interest in Forbes Energy Services LLC |
— | — | (120,000,000 | ) | ||||||||
| Repayments of related party debt |
— | — | (7,048,075 | ) | ||||||||
| Proceeds from borrowings on debt |
— | 32,000,000 | 226,775,441 | |||||||||
| Repayments of debt |
(1,696,200 | ) | (14,966,026 | ) | (128,330,830 | ) | ||||||
| Purchase and Retirement of Second Priority Notes |
(6,778,750 | ) | (3,415,000 | ) | — | |||||||
| Distributions to members |
— | — | (14,734,271 | ) | ||||||||
| Other |
(392,969 | ) | — | — | ||||||||
| Net cash provided by financing activities |
5,361,681 | 27,310,041 | 129,939,667 | |||||||||
| Effect of currency translation on cash and cash equivalents |
(23,974 | ) | — | — | ||||||||
| Net increase in cash and cash equivalents |
2,033,090 | 4,956,300 | 18,259,722 | |||||||||
| Cash and cash equivalents |
||||||||||||
| Beginning of year |
28,425,367 | 23,469,067 | 5,209,345 | |||||||||
| End of year |
$ | 30,458,457 | $ | 28,425,367 | $ | 23,469,067 | ||||||
The accompanying notes are an integral part of these consolidated financial statements.
50
Table of Contents
Index to Financial Statements
Forbes Energy Services Ltd. and Subsidiaries (a/k/a the “Forbes Group”)
Notes to Consolidated Financial Statements
1. Organization and Nature of Operations
Nature of Business
Forbes Energy Services Ltd. (“FES Ltd”) and its subsidiaries, Forbes Energy Services LLC (“FES LLC”), Forbes Energy Capital Inc. (“FES CAP”), C.C. Forbes, LLC (“CCF”), TX Energy Services, LLC (“TES”), Superior Tubing Testers, LLC (“STT”) and Forbes Energy International, LLC (“FEI”) are headquartered in Alice, Texas, and conduct business primarily in the state of Texas. On October 15, 2008, FES LLC and FEI formed Forbes Energy Services México, S. de R.L. de C.V. (“FES Mexico Subsidiary”), a Mexican limited liability company (sociedad de responsabilidad limitada de capital variable), to conduct operations in Mexico. On December 3, 2008, Forbes Energy Services Mexico Servicios de Personal, S. de R.L de C. V., a Mexican limited liability company, was formed to provide employee services to FES Mexico Subsidiary, and on June 8, 2009, FES LTD formed a branch in Mexico. The Mexican branch of FES Ltd and the two Mexican limited liability companies are hereinafter referred to, collectively, as FES Mexico.
As used in these consolidated financial statements, the “Company,” the “Forbes Group,” “we,” or “our” means FES Ltd and all subsidiaries on and after May 29, 2008 (the date of the Bermuda Reorganization (discussed below)); FES LLC and its subsidiaries from January 1, 2008 to May 28, 2008; CCF, TES and STT from June 29, 2007 to December 31, 2007; and C.C. Forbes, L.P., Texas Energy Services, L.P. and Superior Tubing Testers, L.P. prior to June 29, 2007.
The Forbes Group is an independent oilfield services contractor that provides a wide range of well site services to oil and natural gas drilling and producing companies to help develop and enhance the production of oil and natural gas. These services include fluid hauling, fluid disposal, well maintenance, completion services, workovers and recompletions, plugging and abandonment, and tubing testing. The Forbes Group’s operations are concentrated in the major onshore oil and natural gas producing regions of Texas, with an area of operation in each of Baxterville and Laurel, Mississippi; Indiana, Pennsylvania; and Poza Rica, Mexico.
FES LLC is a Delaware limited liability company formed effective January 1, 2008 to act as the holding company for the three wholly-owned operating companies, CCF, TES, and STT. In the reorganization (the “Delaware Reorganization”), ownership of each of the three operating subsidiaries comprising our business at the time was transferred to FES LLC by their equity investors in exchange for equity interests in FES LLC. There was common ownership among CCF, TES and STT; however, they were not considered to be under common control for accounting purposes. As such, the Delaware Reorganization was treated as a business combination, and although FES LLC was the legal acquirer, CCF was considered the acquirer for accounting purposes. As a result, the net assets of CCF remain at their historical cost of $35.6 million and additional paid in capital of $1.5 million was presented separately similar to a change in reporting entity and a reorganization due to the change from a LLC to a corporation for the periods when the entities were under common control (effective January 1, 2008). Purchase accounting was applied to TES and STT. Consideration (in the form of FES LLC equity) was issued to purchase STT and TES in a business combination for approximately $94.5 million which was presented as additional paid in capital on the Consolidated Statement of Changes in Shareholders’/Members’ Equity. Amounts allocated to identifiable tangible and intangible assets acquired and liabilities assumed were based on valuations. FES LLC allocated $14.5 million as a step-up in book value to property and equipment of TES, $4.4 million to goodwill, and $42.3 million to other intangible assets (see Note 4 regarding impairment writedown). Total value added to the assets and shareholders equity was $61.1 million as a result of the Delaware Reorganization. The amount of $96.0 million reported as “Acquisition of TES and STT” under “Total Members Equity” represents the $94.5 million associated with TES and STT in addition to the $1.5 million associated with historical contributions into CCF. This amount is reduced by $0.3 million ($295,000 par value of Class B shares) in arriving at the $95.7 million reported on the “Class B stock issued in connection with Bermuda Reorganization” line under “Additional Paid-In Capital”. Since FES LLC was the legal parent entity until May 29, 2008, the Company reported all equity activity under “Members’ Equity” on the Consolidated Statement of Changes in Members’/Shareholders’ Equity until the Bermuda Reorganization as disclosed below.
| Members’ Equity | ||||
| Delaware Reorganization |
$ | 35,603,182 | ||
| Historical Equity of TES & STT |
33,369,896 | |||
| Historical Contributions – CCF |
1,486,189 | |||
| Opening Balance – January 1, 2008 |
70,459,267 | |||
| Step-Up associated with TES & STT |
61,211,654 | |||
| Member distributions prior to conversion from LLC to C Corporation |
(14,734,271 | ) | ||
| Change of Parent from LLC to a C Corporation on May 29, 2008 |
(116,936,650 | ) | ||
| Ending Balance of members’ equity – December 31, 2008 |
$ | — | ||
51
Table of Contents
Index to Financial Statements
| Additional Paid in Capital |
||||
| Class B stock issued in exchange for membership interests in FES LLC: |
||||
| Historical Equity of TES & STT |
$ | 33,369,896 | ||
| Historical Contributions – CCF |
1,486,189 | |||
| Step-Up associated with TES |
61,211,654 | |||
| Less: Par Value of Class B shares |
(295,000 | ) | ||
| $ | 95,772,739 | |||
FES Ltd is a Bermuda corporation formed effective April 9, 2008 to act as the holding company for FES LLC and its subsidiaries. At the time of FES Ltd’s organization, 200 common shares were issued. On May 29, 2008, concurrent with the Initial Equity Offering, all of the members of FES LLC assigned 63% of their membership interests in FES LLC to FES Ltd in exchange for 29,500,000 shares of FES Ltd’s Class B non-voting stock. Upon consummation of the Initial Equity Offering, FES Ltd contributed $120 million cash as additional capital to FES LLC, and FES LLC used the funds to redeem the remaining outstanding membership interests held by the members of FES LLC, other than FES Ltd. The result was that FES LLC and its subsidiaries became wholly-owned subsidiaries of FES Ltd. The foregoing is referred to herein as the “Bermuda Reorganization.” This transaction was accounted for as a transaction between entities under common control and deemed to be effective for accounting purposes as of January 1, 2008.
On May 29, 2008, FES Ltd completed its Canadian initial public offering and simultaneous U.S. private placement of its common shares (the “Initial Equity Offering”). In the Initial Equity Offering, FES Ltd sold 24,644,500 common shares for CDN $7.00 per share. The common shares are listed on the Toronto Stock Exchange under the symbol FRB.TO. Gross proceeds from the Initial Equity Offering were CDN $172,511,500 (USD $173,920,254) and net proceeds from the Initial Equity Offering after expenses were CDN $162,465,730 (USD $163,792,449).
Common stock issued in connection with Initial Equity Offering:
| Gross Proceeds in US dollars |
$ | 173,920,254 | ||
| Less: 6% commission |
(10,127,805 | ) | ||
| Net proceeds received after commission |
163,792,449 | |||
| Purchase outstanding membership interest in FES LLC |
(120,000,000 | ) | ||
| Less: Stock issuance costs |
(3,854,654 | ) | ||
| Less: Par value of common stock |
(246,447 | ) | ||
| $ | 39,691,348 | |||
The net proceeds from this issuance after purchase of FES LLC membership interests, commissions and issuance costs were $39,937,795 which is the sum of the Capital Stock amount of $246,447 ($.01 par value of the 24,644,700 common shares) and the Additional Paid-In Capital amount of $39,691,348 reported on the Consolidated Statement of Changes in Members’/Shareholders’ Equity.
52
Table of Contents
Index to Financial Statements
Equity Offerings Subsequent to the Initial Equity Offering
In October 2008, FES Ltd completed a U.S. private placement of 7,966,500 of its common shares at a price per share of CDN $4.00 for an aggregate purchase price in the amount of USD $30,000,000 based on the exchange rate between U.S. dollars and Canadian dollars then in effect of $1.00 to CDN$1.0622. The Company received net proceeds of USD $29,841,637 after legal fees and other offering costs of $238,028.
On December 22, 2009, FES Ltd completed a Canadian public offering and simultaneous U.S. private placement of 21,562,500 of its common shares at a price per share of CDN $0.80 for gross proceeds of USD $16,250,232 (CDN $17,250,000), based on the exchange rate between U.S. dollars and Canadian dollars then in effect of $1.00 to CDN $0.94. Offering costs including underwriter commission, accounting, and legal fees amounted to USD $1,332,527 for net proceeds to the company of USD $14,927,705. Of the total shares offered, 750,000 shares were sold to U.S. residents in private placement in reliance on exemption from registration.
On May 28, 2010, FES Ltd completed a U.S. private placement of 580,800 convertible preferred shares at a price per share of CAD $26.37 for an aggregate purchase price in the amount of USD $14,520,000 based on the exchange rate between U.S. dollars and Canadian dollars then in effect of $1.00 to CDN $1.0547. The Company received net proceeds of USD $13,828,205 after closing fee paid to investors of $290,400 and legal fees and other offering costs of $401,395. This is presented as temporary equity on the balance sheet.
2. Risk and Uncertainties
As an independent oilfield services contractor that provides a broad range of drilling-related and production-related services to oil and natural gas companies, primarily onshore in Texas, our revenue, profitability, cash flows and future rate of growth are substantially dependent on our ability to (1) maintain adequate equipment utilization, (2) maintain adequate pricing for the services we provide, and (3) maintain a trained work force. Failure to do so could adversely affect our financial position, results of operations, and cash flows.
Because our revenues are generated primarily from customers who are subject to the same factors generally impacting the oil and natural gas industry, our operations are also susceptible to market volatility resulting from economic, cyclical, weather related or other factors related to such industry. Changes in the level of operating and capital spending in the industry, decreases in oil and natural gas prices, or industry perception about future oil and natural gas prices could materially decrease the demand for our services, adversely affecting our financial position, results of operations and cash flows.
3. Summary of Significant Accounting Policies
Principles of Consolidation
The Forbes Group’s consolidated financial statements as of and for the year ended December 31, 2010, 2009, and 2008 include the accounts of FES Ltd and all of its wholly owned, direct and indirect, and consolidated subsidiaries from May 29, 2008 to December 31, 2010, and FES LLC and all of its wholly owned and consolidated subsidiaries from January 1, 2008 through May 28, 2008. All significant intercompany balances and transactions have been eliminated in the consolidation.
Use of Estimates
The preparation of consolidated financial statements in conformity with Accounting Principles Generally Accepted in the United States of America (“GAAP”) requires management to make estimates and assumptions that affect the reported amounts of assets and liabilities and disclosure of contingent assets and liabilities at the date of the consolidated balance sheets and the reported amounts of revenues and expenses during the reporting period. Actual results could materially differ from those estimates. Management believes that these estimates and assumptions provide a reasonable basis for the fair presentation of the consolidated financial statements.
Revenue Recognition
Well Servicing–Well servicing consists primarily of maintenance services, workover services, completion services, plugging and abandonment services and tubing testing. The Forbes Group prices well servicing by the hour of service performed.
53
Table of Contents
Index to Financial Statements
Fluid Logistics–Fluid logistics consists primarily of the sale, transportation, storage, and disposal of fluids used in drilling, production, and maintenance of oil and natural gas wells. The Forbes Group prices fluid logistics services by the job, by the hour, or by the quantities sold, disposed, or hauled.
The Forbes Group recognizes revenue when services are performed, collection of the relevant receivables is probable, persuasive evidence of an arrangement exists, and the price is fixed or determinable. In accordance with Financial Accounting Standards Board (“FASB”) Accounting Standards Codification (“ASC”) Topic 605-45 “Principal Agent Considerations” (“ASC 605-45”) revenues are presented net of any sales taxes collected by the Forbes Group from its customers that are remitted to governmental authorities.
Income Taxes
The Forbes Group was not subject to federal income tax until May 29, 2008 upon completion of the Initial Equity Offering and related Bermuda Reorganization. Prior to May 29, 2008, all income, losses, credits and deductions of the Forbes Group were passed through to the members. Subsequent to May 29, 2008 and in conjunction with the initial public offering of FES Ltd’s common shares and the related Bermuda Reorganization, the Forbes Group became subject to U.S. federal income tax. As part of this reorganization, in 2008 $52.8 million in deferred U.S. federal income taxes was recorded as income tax expense in accordance with Financial Accounting Standards ASC Topic 740 “Income Taxes,” which required that the tax effect of recognizing deferred tax items upon a change in tax status be included in 2008 operations.
Effective May 29, 2008 the Forbes Group recognized deferred tax assets and liabilities for the future tax consequences attributable to differences between the financial statement carrying amounts of existing assets and liabilities and their respective tax bases. Deferred tax assets and liabilities are measured using statutory tax rates expected to apply to taxable income in the years in which those temporary differences are expected to be recovered or settled. The effect on deferred tax assets and liabilities of a change in tax rate is recognized in the period that includes the statutory enactment date. A valuation allowance for deferred tax assets is recognized when it is more likely than not that the benefit of deferred tax assets will not be realized.
Cash and Cash Equivalents
The Forbes Group considers all highly liquid investments purchased with an original maturity of three months or less to be cash equivalents.
Restricted Cash
Restricted cash is serving as collateral for certain outstanding letters of credit. $9.0 million of restricted cash is classified as a long-term asset as it collateralizes certain long-term insurance notes and bonds issued pursuant to a customer contract.
Foreign Currency Gains and Losses
Effective July 1, 2010, our international location in Mexico changed its functional currency from the U.S. dollar to the Mexican pesos in response to the growing volume of business required to be transacted in pesos. A significant portion of our contract revenue being collected is also in pesos. Assets and liabilities are translated using the spot rate on the balance sheet date, while income and expense items are translated at average rates of exchange during the period. The resulting gains or losses arising from the translation of accounts from the functional currency to the U.S. Dollar are included as a separate component of shareholders’ equity in accumulated other comprehensive income. If our foreign entity enters into transactions that are denominated in currencies other than their functional currency, these transactions are initially recorded in the functional currency based on the applicable exchange rate in effect on the date of the transaction. At the end of each month, these transactions are remeasured to an equivalent amount of the functional currency based on the applicable exchange rates in effect at that time. Any adjustment required to remeasure a transaction to the equivalent amount of the functional currency at the end of the month is recorded in the income or loss of the foreign entity as a component of other income and expense.
54
Table of Contents
Index to Financial Statements
Earnings per Share
The Company presents basic and diluted earnings per share “EPS” data for its common shares. Basic EPS is calculated by dividing the net income attributable to shareholders of the Company by the weighted average number of common shares outstanding during the period. Diluted EPS is determined by adjusting the profit or loss attributable to shareholders and the weighted average number of common shares outstanding for the effects of all dilutive potential common shares, which comprise of options granted. Class B shares are treated as common for basic and diluted purposes. Preferred stock is a participating security under ASC 260 which means the security may participate in undistributed earnings with common stock. In accordance with ASC 260, securities are deemed to not be participating in losses if there is no obligation to fund such losses. Since the Company reported a loss from operations for the year ended December 31, 2010, the Series B Preferred Stock was not deemed to be participating.
Fair Value of Financial Instruments
The following is a summary of the carrying amounts and estimated fair values of our financial instruments as of December 31, 2010 and 2009. Fair value is defined as the amount that would be received to sell an asset or paid to transfer a liability in an orderly transaction between market participants at the measurement date.
The carrying amounts of cash and cash equivalents, restricted cash, trade accounts receivable, accounts receivable-related parties, accounts payable, prepaid expenses and accrued expenses approximate fair value because of the short maturity of these instruments. The carrying amount of our First Priority Notes approximates fair value due to the fact that the underlying instruments include provisions to adjust interest rates.
| December 31, 2010 | December 31, 2009 | |||||||||||||||
| Carrying Amount | Fair Value | Carrying Amount | Fair Value | |||||||||||||
| 11.0% Second Priority Notes |
$ | 192,500 | $ | 188,650 | $ | 199,750 | $ | 185,768 | ||||||||
The fair value of our Second Priority Notes is based upon the quoted market prices at December 31, 2010 and December 31, 2009.
Accounts Receivable and Allowance for Doubtful Accounts
Accounts receivable is based on earned revenues. The Forbes Group provides an allowance for doubtful accounts, which is based upon a review of outstanding receivables, historical collection information, and existing economic conditions. Provisions for doubtful accounts are recorded when it becomes evident that the customer will not make the required payments at either contractual due dates or in the future. At December 31, 2010 and 2009, the allowance for doubtful accounts totaled $6.4 million and $5.3 million, respectively.
The following is a rollforward of the allowance for doubtful accounts
| Balance as of January 1, 2008 |
$ | 55,455 | ||
| Provision |
2,739,473 | |||
| Bad debt write-off |
(38,523 | ) | ||
| Balance as of December 31, 2008 |
2,756,405 | |||
| Provision |
3,861,773 | |||
| Bad debt write-off |
(1,292,501 | ) | ||
| Balance as of December 31, 2009 |
5,325,677 | |||
| Provision |
1,116,933 | |||
| Bad debt write-off |
(48,024 | ) | ||
| Balance as of December 31, 2010 |
$ | 6,394,586 | ||
55
Table of Contents
Index to Financial Statements
Property and Equipment
Property and equipment are recorded at cost. Improvements or betterments that extend the useful life of the assets are capitalized. Expenditures for maintenance and repairs are charged to expense when incurred. The costs of assets retired or otherwise disposed of and the related accumulated depreciation are eliminated from the accounts in the period of disposal. Gains or losses resulting from property disposals are credited or charged to operations currently. Depreciation is recorded using the straight-line method over the estimated useful lives of the assets. Depreciation expense was $37.1 million, $36.7 million, and $30.9 million for the years ended December 31, 2010, 2009, and 2008, respectively. For tax purposes, property and equipment are depreciated under appropriate methods prescribed by the Internal Revenue Code of 1986, as amended, and the regulations promulgated thereunder.
Goodwill and Other Intangibles
Goodwill results from business acquisitions and represents the excess of acquisition costs over the fair value of the net assets acquired. We account for goodwill and other intangible assets under the provisions of ASC Topic 350 “Intangibles – Goodwill and Other” (“ASC 350”). Goodwill and other intangible assets not subject to amortization are tested for impairment annually as of December 31, or more frequently if events or changes in circumstances indicate that the asset might be impaired. ASC 350 requires a two-step process for testing impairment. First, the fair value of each reporting unit is compared to its carrying value to determine whether an indication of impairment exists. If impairment is indicated, then the fair value of the reporting unit’s goodwill is determined by allocating the unit’s fair value to its assets and liabilities (including any unrecognized intangible assets) as if the reporting unit had been acquired in a business combination. The amount of impairment for goodwill is measured as the excess of its carrying value over its fair value. The Forbes Group evaluated its intangible asset group in accordance with ASC 350 which resulted in no impairment for the years ended December 31, 2010 and 2009. The Forbes Group recorded $4.4 million of goodwill in connection with the Delaware Reorganization effective January 1, 2008. An impairment charge of $4.4 million was recorded in the fourth quarter of 2008 which reduced the goodwill in our balance sheet to zero as of December 31, 2008.
Impairments
In accordance with ASC Topic 360 “Property, Plant and Equipment” (“ASC 360”), long-lived assets, such as property, and equipment, and finite-lived intangibles subject to amortization, are reviewed for impairment at a minimum annually, or whenever, in management’s judgment events or changes in circumstances indicate that the carrying amount of such assets may not be recoverable. Recoverability of assets to be held and used is measured by a comparison of the carrying amount of such assets to estimated undiscounted future cash flows expected to be generated by the assets. Expected future cash flows and carrying values are aggregated at their lowest identifiable level. If the carrying amount of such assets exceeds their estimated future cash flows, an impairment charge is recognized in the amount by which the carrying amount of such assets exceeds the fair value of the assets. The Forbes Group evaluated its asset group (other than goodwill) in accordance with ASC 360 which resulted in no impairment for the years ended December 31, 2010, 2009 and 2008.
Environmental
The Forbes Group is subject to extensive federal, state, and local environmental laws and regulations. These laws, which are constantly changing, regulate the discharge of materials into the environment and may require the Forbes Group to remove or mitigate the adverse environmental effects of the disposal or release of petroleum or chemical substances at various sites. Environmental expenditures are expensed or capitalized depending on their future economic benefit. Expenditures that relate to an existing condition caused by past operations and that have no future economic benefits are expensed. Liabilities for expenditures of a non-capital nature are recorded when environmental assessment and/or remediation is probable and the costs can be reasonably estimated.
Deferred Financing Costs
Deferred financing costs are amortized over the period of the loan agreement on an effective interest basis, as a component of interest expense. For the twelve months ended December 31, 2010, 2009, 2008 amortization of deferred financing costs was $2.2 million, $2.1 million, and $6.0 million, respectively.
Share-Based Compensation
The Company accounts for share-based compensation in accordance with ASC Topic 718 “Compensation – Stock Compensation”, (“ASC 718”). Upon adoption of ASC 718, the Company selected the Black-Scholes option pricing model as the most appropriate model for determining the estimated fair value for stock-based awards. The Company measures share-based compensation cost as of the grant date based on the estimated fair value of the award less an estimated rate for pre-vesting forfeitures, and recognizes compensation expense on a straight-line basis over the vesting period. Compensation expense is recognized with an off-setting credit to additional paid-in capital. When the award is distributed or the option is exercised, an entry is made to additional paid-in capital with the off-set to common stock equal to the par value times the number of shares. Consideration received on the exercise of stock options is also credited to additional paid-in capital.
56
Table of Contents
Index to Financial Statements
Differences Between US GAAP and Canadian GAAP
The financial statements in this report have been prepared in accordance with generally accepted accounting principles in the United States, or GAAP, and the reporting currency is the U.S. dollar. GAAP conforms in most respects to generally accepted accounting principles in Canada, or Canadian GAAP except for the following:
| • | In accordance with GAAP, debt issuance costs are classified as other assets on the consolidated balance sheet of the Company. Under Canadian GAAP, debt issuance costs are netted with debt in the balance sheet. For GAAP and Canadian GAAP, debt issuance costs are amortized over the period of the loan agreement as a component of interest expense and any differences in the calculation are immaterial. |
| • | In accordance with GAAP, the $15.3 million of Series B Senior Convertible Preferred Shares are classified as temporary equity on the consolidated balance sheet of the Company. Under Canadian GAAP, the value of Series B Preferred Shares would be bifurcated, allocating the fair value of the conversion feature of the Series B Preferred Shares, estimated by the Company as $2.8 million, to Shareholders’ Equity, and the remaining balance, of $12.5 million to long-term liability. The liability portion would then be accreted each period, using the effective interest rate method, in amounts which will increase the liability to its full face amount of the convertible instrument as of the maturity date, with the accretion recorded as interest expense. These estimates are after the quarterly preferred dividend for the period ending November 28, 2010 and the estimated December 31, 2010 portion of the February 28, 2011 preferred dividends that are expected to be paid-in-kind after shareholder approval. This difference would not have material impact on the operations or cash flows of the consolidated financial statements of the Company in this report. |
Recent Accounting Pronouncements
The FASB issued ASU No. 2010-13, Compensation—Stock Compensation (Topic 718): Effect of Denominating the Exercise Price of a Share-Based Payment Award in the Currency of the Market in Which the Underlying Equity Security Trades. This ASU codifies the consensus reached in EITF Issue No. 09-J, “Effect of Denominating the Exercise Price of a Share-Based Payment Award in the Currency of the Market in Which the Underlying Equity Security Trades.” The amendments to the Codification clarify that an employee share-based payment award with an exercise price denominated in the currency of a market in which a substantial portion of the entity’s equity shares trades should not be considered to contain a condition that is not a market, performance, or service condition. Therefore, an entity would not classify such an award as a liability if it otherwise qualifies as equity. The adoption of ASU 2010-13 is effective for fiscal years beginning on or after December 15, 2010 and is not expected to have a material impact on the Company’s consolidated financial statements.
The FASB issued ASU No. 2010-06, Fair Value Measurements and Disclosures (Topic 820): Improving Disclosures about Fair Value Measurements. This ASU requires some new disclosures and clarifies some existing disclosure requirements about fair value measurement as set forth in Codification Subtopic 820-10. The FASB’s objective is to improve these disclosures and, thus, increase the transparency in financial reporting. Specifically, ASU 2010-06 amends Codification Subtopic 820-10 to now require:
| • | A reporting entity should disclose separately the amounts of significant transfers in and out of Level 1 and Level 2 fair value measurements and describe the reasons for the transfers; and |
| • | In the reconciliation for fair value measurements using significant unobservable inputs, a reporting entity should present separately information about purchases, sales, issuances, and settlements. |
In addition, ASU 2010-06 clarifies the requirements of the following existing disclosures:
| • | For purposes of reporting fair value measurement for each class of assets and liabilities, a reporting entity needs to use judgment in determining the appropriate classes of assets and liabilities; and |
| • | A reporting entity should provide disclosures about the valuation techniques and inputs used to measure fair value for both recurring and nonrecurring fair value measurements. |
ASU 2010-06 is effective for interim and annual reporting periods beginning after December 15, 2009, except for the disclosures about purchases, sales, issuances, and settlements in the roll forward of activity in Level 3 fair value measurements. Those disclosures are effective for fiscal years beginning after December 15, 2010, and for interim periods within those fiscal years. The adoption of this ASU is not expected to have a material impact on the Company’s consolidated financial statements.
57
Table of Contents
Index to Financial Statements
4. Goodwill and Other Intangible Assets
ASC 350 eliminates the amortization of goodwill and other intangible assets with indefinite lives. Intangible assets with lives restricted by contractual, legal, or other means will continue to be amortized over their useful lives. Goodwill and other intangible assets not subject to amortization are tested for impairment annually or more frequently if events or changes in circumstances indicate that the asset might be impaired. ASC 350 requires a two-step process for testing impairment. First, the fair value of each reporting unit is compared to its carrying value to determine whether an indication of impairment exists. If impairment is indicated, then the fair value of the reporting unit’s goodwill is determined by allocating the unit’s fair value to its assets and liabilities (including any unrecognized intangible assets) as if the reporting unit had been acquired in a business combination. The fair value for goodwill is measured as the difference between the fair value of the reporting unit’s assets (excluding goodwill) and its fair value.
In step one of the annual impairment test of goodwill at December 31, 2008, and due to the adverse equity market conditions affecting our common stock price and the declines in oil and natural gas prices in the fourth quarter of 2008 and continuing into 2009, we tested our fluid services business unit for goodwill impairment. The first step was to estimate the fair value of the fluid services segment using a weighting of the discounted cash flow method, the public company guideline method, and the guideline transaction method, weighted 45%, 45% and 10%, respectively. The discounted cash flow method and public company guideline method provided the strongest indication of value due to their ability to incorporate the current state of the oil field services industry as well as the recent changes in the credit and equity markets. The guideline transaction method involved considering private transactions that were relevant but were considered to a lesser degree. In order to validate the reasonableness of the estimated fair value obtained for this reporting unit, a reconciliation of fair value for all the major reporting units to our market capitalization was performed. For purposes of reconciliation to the Company’s market capitalization, a control premium was applied. The control premium used in the reconciliation was derived from a market transaction data study. In addition, for purposes of calculating fair value, the market value of our debt as of December 31, 2008 was used. The measurement date for the stock price for the reconciliation was the 30-day average closing price, centered on December 31, 2008. The results of the fair value analysis for step one showed the carrying value of the fluid services business above the fair value as of December 31, 2008.
Based on the results of step one, impairment of goodwill for the fluid unit was indicated. The Company performed step two by allocating the estimated fair value to the tangible and intangible assets, which indicated that the entire value of the goodwill in the fluids services unit of $4.4 million was impaired. Based on this, an impairment charge of $4.4 million was recorded in the consolidated statement of operations for the year ended December 31, 2008, resulting in goodwill of $0 as of December 31, 2008. The goodwill, which was associated with the Delaware Reorganization had no tax basis, and accordingly, there was no tax benefit derived from recording the impairment charge.
Additionally in conjunction with the Delaware Reorganization effective January 1, 2008, the Forbes Group’s purchase price allocation assigned $42.3 million to other intangible assets with finite lives. Our major classes of intangible assets subject to amortization under ASC 350 consist of our customer relationships, trade name, safety training program and dispatch software. The Company expenses costs associated with extensions or renewals of intangibles assets. There were no such extensions or renewals in the years ended December 31, 2010, 2009 or 2008. Amortization expense is calculated using the straight-line method over the period indicated. Amortization expense for the twelve months ended December 31, 2010, 2009, and 2008 was $ 2.9 million, $2.9 million, and $2.9 million, respectively. Estimated amortization expense for each of the five succeeding fiscal years is $2.9 million per year. The weighted average amortization period remaining for intangible assets is 11.8 years.
The following sets forth the identified intangible assets by major asset class:
| As of December 31, 2010 | As of December 31, 2009 | |||||||||||||||||||||||||
| Useful Life (years) |
Gross Carrying Value |
Accumulated Amortization |
Net Book Value |
Gross Carrying Value |
Accumulated Amortization |
Net Book Value |
||||||||||||||||||||
| Customer relationships |
15 | $ | 31,895,919 | $ | 6,379,184 | $ | 25,516,735 | $ | 31,895,919 | $ | 4,252,789 | $ | 27,643,130 | |||||||||||||
| Trade names |
15 | 8,049,750 | 1,609,950 | 6,439,800 | 8,049,750 | 1,073,300 | 6,976,450 | |||||||||||||||||||
| Safety training program |
15 | 1,181,924 | 236,385 | 945,539 | 1,181,924 | 157,590 | 1,024,334 | |||||||||||||||||||
| Dispatch software |
10 | 1,135,282 | 340,585 | 794,697 | 1,135,282 | 227,055 | 908,227 | |||||||||||||||||||
| Other |
10 | 58,300 | 17,486 | 40,814 | 58,300 | 11,660 | 46,640 | |||||||||||||||||||
| $ | 42,321,175 | $ | 8,583,590 | $ | 33,737,585 | $ | 42,321,175 | $ | 5,722,394 | $ | 36,598,781 | |||||||||||||||
58
Table of Contents
Index to Financial Statements
5. Share-Based Compensation
General
The Forbes Group’s 2008 Incentive Compensation Plan is a long-term retention plan that is intended to attract, retain and provide incentives for talented employees, including officers, and non-employee directors, and to align shareholder and employee interests. The Company believes its 2008 Incentive Compensation Plan is critical to its operations and productivity.
2008 Incentive Compensation Plan
From time to time, the Company grants stock options to its employees, including executive officers, and directors from its 2008 Incentive Compensation Plan. Stock options issued in 2008 generally vest over a three-year period, with approximately one third vesting on the first, second and third anniversaries of the date of grant. For the 2010 stock option issuances, the standard option vests over a two year period, with one fourth vesting on the six month anniversary of the award date and one fourth vesting every six months thereafter, until fully vested. For most grantees, options expire at the earlier of either one year after the termination of grantee’s employment by reason of death, disability or retirement, ninety days after termination of the grantee’s employment other than upon grantee’s death, disability or retirement, or ten years after the date of grant. There are currently no options available for issuance under this plan.
Stock Option Activities
The following table presents a summary of the Company’s stock option activity for the year ended December 31, 2010:
| Shares | Weighted- Average Exercise Price |
Weighted- Average Remaining Contractual Term |
Aggregate Intrinsic Value |
|||||||||||||
| Options outstanding at December 31, 2008 |
2,770,000 | $ | 7.00 | |||||||||||||
| Stock options: |
||||||||||||||||
| Granted |
— | — | ||||||||||||||
| Exercised |
— | — | ||||||||||||||
| Forfeited |
(90,000 | ) | 7.00 | |||||||||||||
| Options outstanding at December 31, 2009: |
2,680,000 | 7.00 | ||||||||||||||
| Stock options: |
||||||||||||||||
| Granted |
2,540,000 | 0.65 | ||||||||||||||
| Exercised |
— | — | ||||||||||||||
| Forfeited |
— | — | ||||||||||||||
| Options outstanding at December 31, 2010: |
5,220,000 | $ | 3.91 | 8.49 years | $ | 1,905,000 | ||||||||||
| Vested and expected to vest at December 31, 2010 |
1,786,667 | $ | 7.00 | 7.41 years | $ | — | ||||||||||
| Exercisable at December 31, 2009 |
893,334 | $ | 7.00 | 8.41 years | — | |||||||||||
| Exercisable at December 31, 2010 |
1,786,667 | $ | 7.00 | 7.41 years | $ | — | ||||||||||
Stock-Based Compensation Expense
During the years ended December 31, 2010, 2009 and 2008, the Company recorded total stock-based compensation expense of $2.7 million, $2.5 million and $1.4 million, respectively. No stock-based compensation costs were capitalized as of December 31, 2010, 2009 or 2008. As of December 31, 2010, total unrecognized stock-based compensation cost amounted to $2.1 million, (net of estimated forfeitures) and is expected to be recorded over a weighted-average period of 1.04 years.
At December 31, 2010, outstanding options had a weighted average remaining contractual term of 8.49 years. The amount of unrecognized stock-based compensation will be affected by any future stock option grants and any termination of employment by any employee that has received stock option grants that are unvested as of their termination date.
At December 31, 2010, the Company has assumed an annualized forfeiture rate of approximately 3% for options granted during the year. Under the true-up provisions of ASC 718, the Company will record additional expense if the actual forfeiture rate is lower than estimated, and will record a recovery of prior expense if the actual forfeiture is higher than estimated.
59
Table of Contents
Index to Financial Statements
Assumptions for Estimating Fair Value of Stock Option Grants
Upon adoption of ASC 718, the Company selected the Black-Scholes option pricing model as the most appropriate model for determining the estimated fair value for stock-based awards. The use of the Black-Scholes model requires the use of extensive actual employee exercise behavior data and the use of a number of complex assumptions including expected volatility and expected term.
The following table summarizes the assumptions used to value options granted during the year ended:
| 2008 | 2010 | |||||||
| Expected term |
6 years | 6 years | ||||||
| Risk-free interest rate |
4.12 | % | 2.07 | % | ||||
| Volatility |
34.82 | % | 108.36 | % | ||||
| Dividend yield |
0.00 | % | 0.00 | % | ||||
| Grant date fair value per share |
$ | 2.91 | $ | 0.54 | ||||
The expected term of employee stock options represents the weighted-average period that the stock options are expected to remain outstanding. The expected term was determined by taking the weighted-average of the vesting period plus the expiration term divided by two. The risk-free interest rate is based on the U.S. Treasury constant maturity interest rate with a term consistent with the expected life of the options. Because the Forbes Group was a newly formed public company when the 2008 options were granted, the expected term approved and the expected volatility was based on the price of comparable company’s common stock in the same industry over a historical period which approximates the expected term of the options granted. For the 2010 options, the Company’s historical common stock was used to calculate the expected volatility. The dividend yield assumption is based on the Company’s expectation of no dividend payouts.
6. Property and Equipment
Property and equipment at December 31, 2010, and 2009, consisted of the following:
| December 31, | ||||||||||||
| Estimated Life in Years |
2010 | 2009 | ||||||||||
| Well servicing equipment |
3-15 years | $ | 291,227,182 | $ | 290,709742 | |||||||
| Autos and trucks |
5-10 years | 81,982,319 | 81,778,316 | |||||||||
| Disposal wells |
5-15 years | 11,446,624 | 10,774,874 | |||||||||
| Building and improvements |
5-30 years | 6,735,728 | 5,993,249 | |||||||||
| Furniture and fixtures |
3-10 years | 2,360,180 | 2,212,539 | |||||||||
| Land |
581,242 | 581,242 | ||||||||||
| Other |
3-15 years | 34,874 | 39,250 | |||||||||
| 394,417,883 | 392,089,212 | |||||||||||
| Accumulated depreciation |
(120,186,417 | ) | (83,529,327 | ) | ||||||||
| $ | 274,231,466 | $ | 308,559,885 | |||||||||
7. Accounts Payable and Accrued Liabilities
Accrued expenses and accounts payable at December 31, 2010 and 2009, consisted of the following:
| December 31, | ||||||||
| 2010 | 2009 | |||||||
| Accrued wages |
$ | 2,695,112 | $ | 1,834,741 | ||||
| Accrued payroll taxes |
1,973,429 | 1,786,171 | ||||||
| Accrued insurance |
2,878,457 | 2,410,930 | ||||||
| Accrued property tax |
— | 2,519,722 | ||||||
| Accrued sales tax - Mexico |
2,735,982 | 2,822,901 | ||||||
| Accrued sales tax - US |
426,339 | 2,476,401 | ||||||
| Other accrued expenses |
1,886,529 | 350,412 | ||||||
| Total accrued expenses |
$ | 12,595,848 | $ | 14,201,278 | ||||
| Accounts payable – vendor financings |
$ | 4,000,724 | $ | 7,519,937 | ||||
| Accounts payable – other |
16,718,967 | 15,855,792 | ||||||
| Total accounts payable – trade |
$ | 20,719,691 | $ | 23,375,729 | ||||
60
Table of Contents
Index to Financial Statements
8. Long-Term Debt
Debt at December 31, 2010 and December 31, 2009, consisted of the following:
| December 31, | ||||||||
| 2010 | 2009 | |||||||
| Second Priority Notes, gross |
$ | 192,500,000 | $ | 199,750,000 | ||||
| Less: Unamortized original issue discount |
(2,672,317 | ) | (3,451,130 | ) | ||||
| Second Priority Notes, net |
189,827,683 | 196,298,870 | ||||||
| First Priority Notes |
20,000,000 | 20,000,000 | ||||||
| Paccar notes |
4,916,659 | 6,612,859 | ||||||
| Insurance notes |
4,634,163 | 3,241,896 | ||||||
| 219,378,505 | 226,898,229 | |||||||
| Less: Current portion |
(6,463,820 | ) | (12,432,900 | ) | ||||
| Total long-term debt |
$ | 212,914,685 | $ | 214,465,329 | ||||
Aggregate maturities of long-term debt as of December 31, 2010 are as follows:
| 2011 |
$ | 6,463,820 | ||
| 2012 |
1,973,381 | |||
| 2013 |
1,113,621 | |||
| 2014 |
20,000,000 | |||
| 2015 |
192,500,000 | |||
| Thereafter |
— | |||
| Total |
$ | 222,050,822 | ||
Second Priority Notes
On February 12, 2008, FES LLC and FES CAP issued $205.0 million in principal amount of 11% senior secured notes (together with notes issued in exchange therefor, the “Second Priority Notes”). The Forbes Group reflects $189.8 million of debt outstanding in its balance sheet as of December 31, 2010, which recognizes the original issue discount as the Second Priority Notes were issued at 97.635% of par and the repurchase of certain Second Priority Notes as described below. The Second Priority Notes mature on February 15, 2015, and require semi-annual interest payments at an annual rate of 11% on February 15 and August 15 of each year until maturity. The Forbes Group was required to spend $6.6 million in cash to repurchase Second Priority Notes by June 30, 2010 after which no principal payments are due until maturity. The Second Priority Notes are senior obligations and rank equally in right of payment with other existing and future senior indebtedness and senior in right of payment to any subordinated indebtedness that may be incurred by the Forbes Group in the future.
The Second Priority Notes are guaranteed by FES Ltd, the parent company of FES LLC and FES CAP, as well as the domestic subsidiaries (the “Guarantor Subs”) of FES LLC, which includes CCF, TES, STT and FEI. All of the Guarantor Subs are 100% owned and each guarantees the securities on a full and unconditional and joint and several basis. FES Ltd has two 100% owned indirect subsidiaries, FES Mexico and a related employment company (the “Non-Guarantor Subs”) that have not guaranteed the Second Priority Notes. As contemplated by the indenture governing the Second Priority Notes (the “Second Priority Indenture”), however, the Forbes Group has granted a security interest in 65% of the equity interests of the Non-Guarantor Subs to secure the Second Priority Notes. FES Ltd has a branch office in Mexico and conducts operations independent of the Non-Guarantor Subs. The Guarantor Subs represent the majority of the Company’s operations.
61
Table of Contents
Index to Financial Statements
The Second Priority Indenture, as amended, required the Forbes Group to pay $2.0 million in cash during the first quarter of 2009 and required the Forbes Group to pay an additional $8.0 million in cash by the end of the second quarter of 2010 to repurchase Second Priority Notes upon specified terms and conditions. Pursuant to this requirement, in the quarter ended March 31, 2009, the Forbes Group paid $2.0 million in cash to repurchase, at a discount, $3.25 million of Second Priority Notes. Additionally, in the quarter ended June 30, 2009, the Forbes Group paid $1.4 million cash to repurchase, at a discount, $2.0 million of Second Priority Notes. In connection with these repurchases, the Forbes Group realized a net gain of approximately $1.4 million after writing down a portion of the original issue discount and writing off a portion of the deferred financing costs. In the quarter- ended June 30, 2010, the Forbes Group paid $6.8 million in cash to repurchase, at a discount, $7.3 million of Second Priority Notes. In connection with this repurchase, the Forbes Group recognized a nominal net gain after writing down a portion of the original bond discount and writing off a portion of the deferred financing costs.
The Forbes Group may, at its option, redeem all or part of the Second Priority Notes from time to time at specified redemption prices and subject to certain conditions required by the Second Priority Indenture governing the Second Priority Notes. The Forbes Group is required to make an offer to purchase the notes and to repurchase any notes for which the offer is accepted at 101% of their principal amount, plus accrued and unpaid interest, if there is a change of control or if the Forbes Group has excess cash flow. The Forbes Group is required to make an offer to repurchase the notes and to repurchase any notes for which the offer is accepted at 100% of their principal amount, plus accrued and unpaid interest, following certain asset sales.
The Forbes Group is permitted under the terms of the Second Priority Indenture to incur additional indebtedness in the future, provided that certain financial conditions set forth in the Second Priority Indenture are satisfied. The Forbes Group is subject to certain covenants contained in the Second Priority Indenture, including provisions that limit or restrict the Forbes Group’s and certain future subsidiaries’ abilities to incur additional debt, to create, incur or permit to exist certain liens on assets, to make certain dispositions of assets, to make payments on certain subordinated indebtedness, to pay dividends or certain other payments to equity holders, to engage in mergers, consolidations or other fundamental changes, to change the nature of its business, to engage in transactions with affiliates or to make capital expenditures in excess of certain amounts based on the year in which such expenditures are made.
Details of three of the more significant restrictive covenants in the Second Priority Indenture are set forth below:
| • | Limitation on the Incurrence of Additional Debt—In addition to certain indebtedness defined in the Second Priority Indenture as “Permitted Debt,” we may only incur additional debt if it is unsecured and if the Fixed Charge Coverage Ratio (as defined in the Second Priority Indenture) for the most recently completed four full fiscal quarters is at least 3.0 to 1.0 for years beginning after December 31, 2009. As of December 31, 2010, we could incur no additional debt as Permitted Debt and under this Fixed Charge Coverage Ratio test. |
| • | Limitations on Capital Expenditures—Subject to certain adjustments and exceptions, permitted capital expenditures that may be made by us are limited to $115 million for the fiscal year ending December 31, 2011, plus or minus the amount by which Consolidated Cash Flow (as defined in the Second Priority Indenture) for the year ended December 31, 2010 exceeds or falls below $160 million. Currently, based on our calculation of Consolidated Cash Flow for the year ended December 31, 2010 we anticipate being able to make only nominal capital expenditures under this provision. Under the Second Priority Indenture, we are permitted to carry over into 2011, $10 million as permitted capital expenditures, which were permitted but unused in 2010. Further subject to the limitations under the First Priority Indenture, we are permitted under the Second Priority Indenture to make additional permitted capital expenditures based, in part, on the amount of aggregate net cash proceeds received from equity issuances since the issue date of the Second Priority Indenture, February 12, 2008. |
| • | Limitation on Restricted Payments—Subject to certain limited exceptions, we are prohibited from (i) declaring or paying dividends or other distributions on our equity securities (other than dividends or distributions payable in equity securities), (ii) purchasing or redeeming any of the Company’s equity securities, (iii) making any payment on indebtedness contractually subordinated to the Second Priority Notes, except a payment of interest or principal at the stated maturity thereof, or (iv) making any investment defined as a “Restricted Investment,” unless, at the time of and after giving effect to such payment, the Company is not in default and the Company is able to incur at least $1.00 of additional Indebtedness pursuant to the Fixed Charge Coverage Ratio (as defined in the Second Priority Indenture). Further, the amount of such payment plus all other such payments made by the Company since the issuance of the Second Priority Notes must be less than the aggregate of (a) 50% of Consolidated Net Income (as defined in the Second Priority Indenture) since the issuance of the Second Priority Notes (or 100% if such figure is a deficit), (b) 100% of the aggregate net cash proceeds from equity offerings since the issuance of the Second Priority Notes, (c) if any Restricted Investments have been sold for cash, the proceeds from such sale (or the original cash investment if that amount is lower); and (d) 50% of any dividends received by the Company. |
62
Table of Contents
Index to Financial Statements
Revolving Credit Facility
On April 10, 2008, the Forbes Group entered into a revolving credit facility (the “Credit Facility”). As discussed below, on October 2, 2009, the Forbes Group repaid and terminated the Credit Facility, using the proceeds from the issuance of the First Priority Notes. Borrowings under the Credit Facility accrued interest, at the option of the Forbes Group, at either (i) the greater of the Federal Funds Effective Rate in effect on such day plus 0.5% and the “prime rate” announced from time to time by Citibank, N.A., plus a margin of up to 1.25%, or (ii) the London Interbank Offered Rate, plus a margin of 1.75% to 2.25%. Unpaid interest accrued on outstanding loans was payable quarterly. The Credit Facility was secured by first priority security interests in substantially all of the Forbes Group’s assets, including those of all of the domestic subsidiaries that rank senior to the security interest granted to the holders of the Second Priority Notes. The credit agreement governing the Credit Facility (the “Credit Agreement”) also contained customary representations, warranties and covenants for the type and nature of the Credit Facility, including certain limitations or restrictions on the Forbes Group’s and certain future subsidiaries’ ability to incur additional debt, guarantee others’ obligations, create, incur or permit to exist liens on assets; make investments or acquisitions, make certain dispositions of assets, make payments on certain subordinated indebtedness, pay dividends or other payments to equity holders, engage in mergers, consolidations or other fundamental changes, sell assets, change the nature of its business and engage in transactions with affiliates. The Credit Agreement also contained restrictive financial covenants requiring us to maintain a certain Net Worth and certain ratios of Consolidated EBITDA to Consolidated Interest Expense, Senior Funded Debt to Consolidated Net Worth, and Consolidated Senior Funded Debt to Consolidated EBITDA. The Credit Agreement also contained a provision that would have made the occurrence of any Material Adverse Change an event of default (the capitalized terms used in this and the previous sentence have the meaning set forth in the Credit Agreement).
First Priority Notes
On October 2, 2009, FES LLC and FES CAP issued to Goldman, Sachs & Co. $20 million in aggregate principal amount of First Lien Floating Rate Notes due 2014 (the “First Priority Notes”), in a private placement in reliance on an exemption from registration under the Securities Act of 1933, as amended. After offering expenses, the Forbes Group realized net proceeds of approximately $18.8 million which was used, in part, to repay and terminate the Revolving Credit Facility. The First Priority Notes mature on August 1, 2014, and require semi-annual interest payments on February 1 and August 1 of each year until maturity at a rate per annum, reset semi-annually, equal to the greater of 4% or six month LIBOR, plus 800 basis points, which was 12% as of December 31, 2010. No principal payments are due until maturity. The First Priority are senior obligations and rank equally in right of payment with other existing and future senior indebtedness, including the Second Priority Notes, and senior in right of payment to any subordinated indebtedness that may be incurred by the Forbes Group in the future.
The First Priority Notes are guaranteed by FES Ltd, as well as the Guarantor Subs. Each of the Guarantor Subs guarantees the securities on a full and unconditional and joint and several basis. The two Non-Guarantor Subs have not guaranteed the First Priority Notes, however, the Forbes Group has granted a security interest in 65% of the equity interests of the Non-Guarantor Subs to secure the First Priority Notes. The Forbes Group may, at its option, redeem all or part of the First Priority Notes from time to time at specified redemption prices and subject to certain conditions required by the First Priority Indenture. The Forbes Group is required to make an offer to purchase the notes and to repurchase any notes for which the offer is accepted at 101% of their principal amount, plus accrued and unpaid interest, if there is a change of control or if the Forbes Group has excess cash flow. The Forbes Group is required to make an offer to repurchase the notes and to repurchase any notes for which the offer is accepted at 100% of their principal amount, plus accrued and unpaid interest, following certain asset sales.
The First Priority Indenture contains certain covenants similar to those in the Second Priority Indenture, including provisions that limit or restrict the Forbes Group’s and certain future subsidiaries’ abilities to incur additional debt; to guarantee other obligations; to create, incur or permit to exist certain liens on assets, to make investments or acquisitions, to make certain dispositions of assets, to make payments on certain subordinated indebtedness, to pay dividends or certain other payments to equity holders, to engage in mergers, consolidations or other fundamental changes, to change the nature of its business, to engage in transactions with affiliates or to make capital expenditures in excess of certain amounts based on the year in which such expenditures are made. The First Priority Indenture also provides for certain limitations and restrictions on the Forbes Group’s ability to move collateral outside the United States or to dispose of assets. These covenants are subject to a number of important limitations and exceptions.
Details of three of the more significant restrictive covenants in the First Priority Indenture are set forth below:
| • | Limitation on the Incurrence of Additional Debt—In addition to certain indebtedness defined in the First Priority Indenture as “Permitted Debt,” we may only incur additional debt if it is unsecured and if the Fixed Charge Coverage Ratio (as defined in the First Priority Indenture) for the most recently completed four full fiscal quarters is at least 2.5 to 1.0 until December 31, 2009, and 3.0 to 1.0 thereafter. As of December 31, 2010, we could incur no additional debt under this Fixed Charges Coverage Ratio test. |
63
Table of Contents
Index to Financial Statements
| • | Limitations on Capital Expenditures—Subject to certain adjustments and exceptions, permitted capital expenditures that may be made by us are limited to $115 million for the fiscal year ending December 31, 2011, plus or minus the amount by which Consolidated Cash Flow (as defined in the First Priority Indenture) for the year ended December 31, 2010 exceeds or falls below $160 million. Currently, based on our calculation of Consolidated Cash Flow for the year ended December 31, 2010, we anticipate being able to make only nominal capital expenditures under this provision. Under the First Priority Indenture, we are permitted to carry over into 2011, $10 million as permitted capital expenditures, which were permitted but unused in 2010. Further, we are permitted under the First Priority Indenture to make additional permitted capital expenditures based, in part, on the amount of aggregate net cash proceeds received from equity issuances since the issue date of the First Priority Indenture, October 2, 2009. |
| • | Limitation on Restricted Payments—Subject to certain limited exceptions, We are prohibited from (i) declaring or paying dividends or other distributions on our equity securities (other than dividends or distributions payable in equity securities), (ii) purchasing or redeeming any of the Company’s equity securities, (iii) making any payment on indebtedness other than First Priority Notes, except a payment of interest or principal at the stated maturity thereof, or (iv) making any investment defined as a “Restricted Investment,” unless, at the time of and after giving effect to such payment, the Company is not in default and the Company is able to incur at least $1.00 of additional Indebtedness pursuant to the Fixed Charge Coverage Ratio (as defined in the First Priority Indenture). Further, the amount of such payment plus all other such payments made by the Company since the issuance of the First Priority Notes must be less than the aggregate of (a) 50% of Consolidated Net Income (as defined in the First Priority Indenture) since the issuance of the First Priority Notes (or 100% if such figure is a deficit), (b) 100% of the aggregate net cash proceeds from equity offerings since the issuance of the First Priority Notes, (c) if any Restricted Investments have been sold for cash, the proceeds from such sale (or the original cash investment if that amount is lower); and (d) 50% of any dividends received by the Company. |
Each of the First Priority Indenture and Second Priority Indenture provides for events of default, which, if any of them occur, would, in certain circumstances, permit or require the principal, premium, if any, and interest on all the then outstanding First Priority Notes or Second Priority Notes, respectively, to be due and payable immediately. Additionally, in certain circumstances an event of default under the First Priority Indenture would cause an event of default under the cross-default provision of the Second Priority Indenture and vice versa. We are in compliance with the covenants of our First and Second Priority Indentures at December 31, 2010.
There are no significant restrictions under either indenture on FES Ltd’s ability or the ability of any guarantor to obtain funds from its subsidiaries by such means as a dividend or loan. See Note 16 for consolidating information required by Rule 3-10 of Regulation S-X.
Paccar Notes
During 2008, the Forbes Group financed the purchase of certain vehicles and equipment through commercial loans with Paccar Financial Group, with aggregate principal amounts outstanding as of December 31, 2010 and 2009 of approximately $4.9 million and $6.6 million, respectively. These loans are repayable in 60 monthly installments with the maturity dates ranging from May 2013 to October 2013. Interest accrues at rates ranging from 7.5% to 7.6% and is payable monthly. The loans are collateralized by equipment purchased with the proceeds of such loans.
Insurance Notes
During 2009 and 2010, the Forbes Group entered into a promissory note with First Insurance Funding for the payment of insurance premiums in an aggregate principal amount outstanding as of December 31, 2010 and December 31, 2009 of approximately $4.6 million and $4.0 million, respectively during the period of the insurance coverage. These notes are or were payable in twelve monthly installments with maturity dates of September 15, 2010 and September 15, 2009. Interest accrues or accrued at a rate of approximately 3.6% and 4.1% for 2010 and 2009, respectively, and is payable monthly. The amount outstanding could be substantially offset by the cancellation of the related insurance coverage.
64
Table of Contents
Index to Financial Statements
9. Related Party Transactions
The Forbes Group enters into transactions with related parties in the normal course of conducting business. Accounts receivable–related parties and Accounts payable–related parties result from transactions with related parties which the company believes are at terms consistent with those available to third-party customers and from third-party vendors.
Messrs. John E. Crisp and Charles C. Forbes Jr., executive officers and directors of FES Ltd, are also owners and managers of Alice Environmental Holdings, Ltd and indirect owners and managers of Alice Environmental Services, LP, a wholly owned subsidiary of Alice Environmental Holdings, Ltd, collectively referred to as AES. The Forbes Group has entered into the following transactions with AES:
| • | AES owns aircraft that the Forbes Group uses on a regular basis. |
| • | The Forbes Group has also entered into long-term operating leases with AES for well service rigs, vacuum trucks and related equipment. |
| • | The Forbes Group has entered into long-term real property leases, disposal well leases and disposal well operating agreements with AES. |
In October 2008, the Forbes Group entered into a five year, operating lease agreement with AES to lease ten workover rigs and related support equipment. The gross lease amount of this agreement is approximately $15.2 million with monthly payments of approximately $0.3 million. The Forbes Group has the option to purchase the equipment at the end of the term for a purchase price of approximately $5.3 million.
In October 2010, the Forbes Group entered into an operating lease agreement effective January 2011 with AES to lease certain well servicing equipment, including trucks, tanks, swab units and other equipment. Previously this equipment was being rented month-to-month until certain conditions, which at this time have been satisfied, were met, upon which the term became four years. The gross agreement amount is approximately $3.2 million with monthly payments of approximately $67,000. The Forbes Group has the option to purchase the equipment at the end of the four year term for a purchase price of approximately $1.2 million.
The Forbes Group rents or leases twelve separate properties from AES for separate parcels of land and buildings. Ten of the leases were entered into at various dates subsequent to December 31, 2006. Each lease has a five-year term with the Forbes Group having the option to extend from between one and five years. Two of the leases are oral. Aggregate amounts paid for the twelve rentals and leases were $1.3 million, $1.3 million, and $0.9 million for the year-ended December 31, 2010, 2009 and 2008, respectively.
The Forbes Group entered into a waste water disposal operating agreement dated January 1, 2007, with AES pursuant to which AES leases its rights in a certain well bore and receives payments in the form of a minimum fee of $5,000 per month plus $0.15 per barrel for any barrel injected over 50,000 barrels. Under this agreement, AES also receives a “skim oil” payment of 20% of the amount realized by the Forbes Group for all oil and hydrocarbons removed from liquids injected into the premises. The agreement term is for three years and is renewable for successive three year terms as long as AES has rights to the well.
The Forbes Group entered into a waste water disposal lease agreement dated April 1, 2007, with AES. Under the agreement, the Forbes Group is entitled to use the leased land for the disposal of waste water for a term of five years with three successive three year renewal periods. The Forbes Group pays a monthly rental of $2,500 per month plus $.05 per barrel for any barrel over 50,000 barrels of waste water injected per month. Additionally, the Forbes Group pays an amount equal to 10% of all oil or other hydrocarbons removed from liquids injected or any skim oil.
Other expenses related to the items discussed above, were approximately $2.0 million, $2.3 million and $1.5 million related to aircraft and equipment rental, approximately $1.6 million, $1.2 million and $1.4 million related to disposal of waste water and approximately $0, $0 and $0.8 million related to other various expenses for the years-ended December 31, 2010, 2009, and 2008, respectively.
For the year-ended December 31, 2010, 2009, and 2008 Forbes Group recognized revenue from AES of approximately $0, $0 and $11,000, respectively, total expenses of approximately $9.3 million, $8.4 million and $5.5 million, respectively, and capital expenditures $0, $0, and $2.4 million respectively. Accounts payable to AES as of December 31, 2010 and 2009, resulting from such transactions were $406,000 and $683,000 respectively. The Forbes Group had no accounts receivable from AES as of December 31, 2010 and 2009, respectively.
Dorsal Services, Inc. is a trucking service provider that provides services to the Forbes Group. Mr. Crisp, an executive officer and director of FES Ltd, is a partial owner of Dorsal Services, Inc. The Forbes Group recognized revenues of $9,000 $58,000, and $58,000 related to trucking services, equipment rental, and wash out activities; expenses of approximately $795,000, $198,000 and $1.4 million; and capital expenditures of approximately $38,000, $0, and $29,000 from transactions with Dorsal Services, Inc. for the years ended December 31, 2010, 2009, and 2008, respectively. The Forbes Group had accounts receivable from Dorsal Services, Inc. of $110,000 and $162,000 as of December 31, 2010 and 2009, respectively resulting from such transactions. The Forbes Group had accounts payable to Dorsal Services, Inc. of $77,000 and $144,000 as of December 31, 2010 and 2009, respectively, resulting from such transactions.
65
Table of Contents
Index to Financial Statements
Tasco Tool Services, Inc. is a down-hole tool company that is partially owned and managed by a company that is owned by Messrs. Crisp and Forbes, both executive officers and directors of FES Ltd. Tasco rents and sells tools to the Forbes Group from time to time. The Forbes Group had revenues from Tasco of $4,000, $1,000 and $0 and recognized expenses of approximately $85,000, $68,000 and $314,000 and capital expenditures of $0, $130,000, and $50,000 related to transactions with Tasco for the years ended December 31, 2010, 2009, and 2008, respectively. Accounts payable to Tasco as of December 31, 2010, and 2009 were $10,000 and $20,000, respectively, resulting from these transactions.
FCJ Management, or FCJ, is a corporation that leases land and facilities to the Forbes Group and is owned by Messrs. Crisp and Forbes and Robert Jenkins, a manager of one of the subsidiaries of FES Ltd. The Forbes Group recognized expenses of $36,000, $23,000 and $18,000 for the year ended December 31, 2010, 2009 and 2008, respectively. No revenues have been recognized from FCJ for any period. The Forbes Group had no accounts receivable from FCJ or accounts payable to FCJ as of December 31, 2010 and 2009, respectively.
C&F Partners is an entity that is owned by Messrs. Crisp and Forbes. The Forbes Group recognizes no revenues, expenses of approximately $531,000, $457,000, and $130,000 and no capital expenditures for the years ended December 31, 2010, 2009 and 2008, respectively. All expenses are related to aircraft rental. There were no accounts receivable, and accounts payable were $45,000 and $0 as of December 31, 2010 and 2009, respectively.
Resonant Technology Partners is a computer networking group that provides services to the Forbes Group. A director of the Forbes Group has an interest in the computer networking company. The Forbes Group recognized expenses of approximately $278,000, $242,000, and $0, and capital expenditures of approximately $28,000, $0 and $0 for the year-ended December 31, 2010, 2009, and 2008, respectively. The Forbes Group had accounts payable of approximately $0 and $34,000 as of December 31, 2010 and 2009, respectively.
Wolverine Construction, Inc is a construction and site preparation services company that is owned by a son of Mr. Crisp, an executive officer and director of FES Ltd. Mr. Crisp’s son is also a fulltime employee of The Forbes Group. The Forbes Group provided additional services to customers in the fiscal year 2010 that was sub-contracted to Wolverine Construction, Inc.
The Forbes Group recognized capital expenditures of approximately $0, $119,000 and $60,000, revenues of approximately $62,000, $11,000 and $3,000 and expenses of approximately $12.2 million, $915,000 and $177,000 for the years ended December 31, 2010, 2009, and 2008, respectively. The Forbes Group had accounts receivable from Wolverine as of December 31, 2010 and 2009 of approximately $67,000 and $6,000 respectively. The Forbes Group had accounts payable due to Wolverine of approximately $7.5 million and $19,000 as of December 31, 2010 and 2009, respectively.
Testco is a company that provides valve and gathering system testing services to the Forbes Group. Messrs. Crisp and Forbes, executive officers and directors of FES Ltd, along with a son of Mr. Crisp are partial owners of Testco. The Forbes Group recognized revenues of approximately $4,000, $0 and $423,000, and expenses of approximately $7,000, $12,400 and $0 for the years ended December 31, 2010, 2009, and 2008, respectively. The Forbes Group had no accounts receivable from and no accounts payable to Testco as December 31, 2010 and 2009, respectively.
CJ Petroleum Service LLC, or CJ Petroleum is a company that owns saltwater disposal wells and is owned by Messrs. Crisp and Forbes, two sons of Mr. Crisp, and Janet Forbes, a director of the FES Ltd. In 2010, we began paying CJ Petroleum to use their disposal wells. The Forbes group recognized no revenue, expenses of approximately $174,000 and no capital expenditures for the year ended December 31, 2010. We had no accounts receivable from CJ Petroleum as of December 31, 2010. We had accounts payable of $24,000 to CJ Petroleum as of December 31, 2010.
LA Contractors Ltd. is a bulk material hauling company partially owned by Mr. Crisp, Janet Forbes, directors of FES Ltd. and a son of Mr. Forbes. The Forbes Group recognized revenue of $0, $2,000 and $0, expenses of approximately $195,000, $34,000, and $8,000 and capital expenditures of approximately $348,000, $26,000 and $24,000 for the year ended December 31, 2010, 2009, and 2008, respectively. We had no accounts receivable from LA Contractors as of December 31, 2010 and 2009, respectively. We had accounts payable to LA Contractors of $8,000 and $3,000 as of December 31, 2010 and 2009, respectively.
Energy Fishing and Rentals, Inc., or EFR is a specialty oilfield tool company that is partially owned by Messrs. Crisp and Forbes. EFR rents and sells tools to the Forbes Group from time to time. The Forbes Group recognized revenue of $1,000 from EFR for the year ended December 31, 2010, and recognized expenses of approximately $38,000, $38,000 and $41,000 and capital expenditures of $11,000, $336,000 and $0 for the years ended December 31, 2010, 2009 and 2008, respectively. We had no accounts receivable from EFR as of December 31, 2010 and 2009, respectively. Accounts payable to EFR as of December 31, 2010 and 2009 were $9,000 and $18,000, respectively, resulting from these transactions.
66
Table of Contents
Index to Financial Statements
JITSU, Inc. is a trucking service provider that, since October 2010, provides services to the Forbes Group. Janet Forbes and Mr. Crisp are owners of JITSU. For the year-ended December 31, 2010, the Forbes Group recognized no revenues; expenses of approximately $101,000 and no capital expenditures from transactions with JITSU, Inc. At December 31, 2010, the company had no accounts receivable from or accounts payable to JITSU.
Texas Quality Gate Guard, Inc. is an entity owned by Messrs. Crisp and Forbes that since October 2010 has provided security services to the Forbes Group. For the year ended December 31, 2010, the Forbes Group recognized no revenues; expenses of approximately $105,000 and no capital expenditures from transactions with Texas Quality Gate Guard, Inc. At December 31, 2010, the company had no accounts receivable and accounts payable to Texas Quality Gate Guard, Inc. of approximately $68,000.
Animas Holding, Inc., or Animas, is a property and disposal company that is owned by the two sons of Mr. Crisp and three children of Mr. Forbes. As of April 26, 2010, TES entered into a waste water disposal operating agreement with Animas whereby TES agrees to pay a monthly operational fee of $4,000 per month, plus $0.08 per barrel over 50,000 barrel per month. Animas agrees to pay TES ten percent of all skim oil payments obtained from this waste water disposal. The Forbes Group also has an oral agreement with Animas for the rental of two truck yards. The Company pays Animas $8,500 per month for the use of the two properties. For the year-ended December 31, 2010, the Forbes Group recognized no revenues; expenses of approximately $260,000 and no capital expenditures from transactions with Animas Holding, Inc. At December 31, 2010, the company had no accounts receivable or accounts payable to Animas Holding, Inc.
The Forbes Group has a relationship with Texas Champion Bank. Travis Burris, one of the directors, is also the President, Chief Executive Officer, and director of Texas Champion Bank. Mr. Crisp, our President and Chief Executive Officer, serves on the board of directors of Texas Champion Bank. As of December 31, 2010, 2009, and 2008, the Forbes Group had $11.0 million, $7.2 million, and $10.6 million, respectively, on deposit with this bank.
Messrs. Crisp and Forbes are directors and shareholders of Brush Country Bank, an institution with which the Company conducts business. As of December 31, 2010 and 2009, the Forbes Group had $3.3 million and $1.3 million on deposit with this bank.
We believe all of the terms with companies described above are comparable to terms that were and are available to us in arm’s –length transaction with non-related parties.
10. Commitments and Contingencies
Concentrations of Credit Risk
Financial instruments which subject the Forbes Group to credit risk consist primarily of cash balances maintained in excess of federal depository insurance limits and trade receivables. All of our non-interest bearing cash balances were fully insured at December 31, 2010 due to a temporary federal program in effect from December 31, 2010 through December 31, 2012. Under the program, there is no limit to the amount of insurance for eligible accounts. Beginning 2013, insurance coverage will revert to $250,000 per depositor at each financial institution, and our non-interest bearing cash balances may again exceed federally insured limits. The Forbes Group restricts investment of temporary cash investments to financial institutions with high credit standings. The Forbes Group’s customer base consists primarily of multi-national and independent oil and natural gas producers. The Forbes Group does not require collateral on its trade receivables. For the year ended December 31, 2010 Forbes Group’s largest customer, five largest customers, and ten largest customers constituted 13.7%, 35.9%, and 51.9% of revenues, respectively. For the year ended December 31, 2009 Forbes Group’s largest customer, five largest customers, and ten largest customers constituted 11.7%, 37.7%, and 49.8% of revenues, respectively. For the year ended December 31, 2008 the Forbes Group’s largest customer, five largest, and ten largest customers constituted 8.6%, 30.3%, and 42.9% of revenues respectively. The loss of any one of our top five customers would have a significant negative impact on the revenues and profits of the company. Further, our trade accounts receivable are from companies within the oil and natural gas industry and as such Forbes Group is exposed to normal industry credit risks. The Forbes Group continually evaluates its reserves for potential credit losses and establishes reserves for such losses .
Major Customers
The Forbes Group had one individual customer that represented 13.7% of total consolidated revenues for the year ended December 31, 2010.The Forbes Group had two individual customers that represented 11.7% and 11.1% of total consolidated revenues for the year ended December 31, 2009. The Forbes Group had no individual customers that represented greater that 10% of total consolidated revenues for the year ended December 31, 2008.
67
Table of Contents
Index to Financial Statements
Employee Benefit Plan
In 2005, the Forbes Group implemented a 401(k) retirement plan for substantially all of its employees based on certain eligibility requirements. The Forbes Group may provide profit sharing contributions to the plan at the discretion of management. No such discretionary contributions have been made since inception of the plan.
Self-Insurance
The Forbes Group is self-insured under its Employee Group Medical Plan for the first $125,000 per individual plus a $235,000 aggregate specific deductible. In October 2009 the Forbes Group eliminated the self insured portion of worker’s compensation, general liability and automobile liability. Incurred and unprocessed claims as of December 31, 2010 and 2009 amount to approximately $2.8 and $2.1 million, respectively. These claims are unprocessed, therefore their values are estimated and included in accrued expenses in the accompanying consolidated balance sheets. In addition, to accruals for the self-insured portion of the Employee Group Medical Benefits Plan, the liability for incurred and unprocessed claims also includes estimated “run off” liabilities payable at future dates related to the worker’s compensation, general liability and automobile liability self-insurance program that was eliminated in October 2009.
Litigation
The Forbes Group is subject to various other claims and legal actions that arise in the ordinary course of business. We do not believe that any of these claims and actions, separately or in the aggregate, will have a material adverse effect on our business, financial condition, results of operations or cash flows, although we cannot guarantee that a material adverse effect will not occur.
Leases
Future minimum lease payments under non-cancellable operating leases as of December 31, 2010 are as follows:
| Related Party | Other | Total | ||||||||||
| 2011 |
$ | 4,135,020 | $ | 2,514,109 | $ | 6,649,129 | ||||||
| 2012 |
3,542,020 | 1,905,054 | 5,447,074 | |||||||||
| 2013 |
2,487,764 | 1,865,450 | 4,353,214 | |||||||||
| 2014 |
— | 745,367 | 745,367 | |||||||||
| 2015 |
— | — | — | |||||||||
| Thereafter |
— | — | — | |||||||||
| Total |
$ | 10,164,804 | $ | 7,029,980 | $ | 17,194,784 | ||||||
Rent expense for the years ended December 31, 2010, 2009 and 2008 totaled approximately $16.9 million, $11.4 million and $5.0 million, respectively.
11. Supplemental Cash Flow Information
| Years Ended December 31, | ||||||||||||
| 2010 | 2009 | 2008 | ||||||||||
| Cash paid for |
||||||||||||
| Interest |
$ | 24,782,114 | $ | 23,010,276 | $ | 17,026,761 | ||||||
| Income tax |
— | 500,000 | 850,000 | |||||||||
| Supplemental schedule of non-cash investing and financing activities |
||||||||||||
| Seller-financed purchases of property and equipment |
$ | — | $ | — | $ | 8,185,907 | ||||||
| Financing of insurance notes |
5,712,430 | 4,935,006 | 3,933,469 | |||||||||
| Changes in accounts payable related to capital expenditures |
(3,519,212 | ) | (13,682,564 | ) | (41,954,237 | ) | ||||||
68
Table of Contents
Index to Financial Statements
12. Income Taxes
In conjunction with the Initial Equity Offering of FES Ltd’s common shares on May 29, 2008 and the related Bermuda Reorganization, the Forbes Group became subject to U.S. federal income tax. As part of this reorganization, $52.8 million in deferred income taxes were recorded as income tax expense in accordance with ASC Topic 740 “Income Taxes”, “(ASC 740)”, which requires that the tax effect of recognizing deferred tax items upon a change in tax status be included in current year operations. In preparing tax returns for the short period ended May 29, 2008, the Bermuda Reorganization, the company elected to not take bonus depreciation on the fixed assets which resulted in a deferred tax benefit of $7.1 million being recorded as a change in estimate in 2009 related to the 2008 deferred tax due to change in tax status in the effective rate reconciliation.
In addition, the Forbes Group is subject to the Texas Franchise tax. The Texas Franchise tax is a tax equal to one percent of Texas-sourced revenue reduced by the greater of (a) cost of goods sold (as defined by Texas law), (b) compensation (as defined by Texas law) or (c) 30% of the Texas-sourced revenue. The Forbes Group accounts for the Texas Franchise tax as an income tax in accordance with ASC 740, as the tax is derived from a taxable base that consists of income less deductible expenses. For the years ended December 31, 2010, 2009 and 2008 the Forbes Group incurred current franchise tax expense of $0.2 million, $0 and $1 million, respectively. As of December 31, 2010 and 2009, the Forbes Group reflected on its balance sheet a franchise tax liability of $0.2 million and $0, respectively.
Income tax expense for the year ended December 31, 2010 includes approximately $0 of current federal income tax expense, approximately $0.2 million of Texas Franchise tax expense and approximately $0.2 million of foreign income tax expense.
The Forbes Group was not subject to U.S. federal income tax until May 29, 2008. Prior to May 29, 2008 all income, losses, credits, and deductions of the Forbes Group were passed through to the members. Accordingly, no provision for U.S. federal income taxes is included in the accompanying consolidated financial statements through May 29, 2008 which is reflected as an item in our effective tax rate reconciliation of $4.8 million. A reconciliation of federal statutory income taxes to our effective tax expense follows.
The domestic and foreign components of income (loss) before income taxes were as follows:
| 2010 | 2009 | 2008 | ||||||||||
| Domestic |
$ | (23,627,787 | ) | $ | (52,008,685 | ) | $ | 34,023,599 | ||||
| Foreign |
5,816,737 | (2,465,891 | ) | (1,196,697 | ) | |||||||
| $ | (17,811,050 | ) | $ | (54,474,576 | ) | $ | 32,826,902 | |||||
The components of the provision for income taxes consisted of:
| 2010 | 2009 | 2008 | ||||||||||
| Current: |
||||||||||||
| Federal |
$ | — | $ | 491,446 | $ | — | ||||||
| State |
249,022 | (188,804 | ) | 1,005,872 | ||||||||
| Foreign |
186,620 | — | — | |||||||||
| Total current income tax provision |
435,642 | 302,642 | 1,005,872 | |||||||||
| Deferred: |
||||||||||||
| Federal |
(6,955,580 | ) | (25,648,232 | ) | 61,425,508 | |||||||
| State |
18,806 | 201,723 | 143,112 | |||||||||
| Foreign |
— | — | — | |||||||||
| Total deferred income tax provision |
(6,936,774 | ) | (25,446,509 | ) | 61,568,620 | |||||||
| Total income tax (benefit) expense |
$ | (6,501,132 | ) | $ | (25,143,867 | ) | $ | 62,574,492 | ||||
| Effective Tax Rate Reconciliation: |
||||||||||||
| Income taxes at statutory rate |
$ | (6,233,868 | ) | $ | (19,066,102 | ) | $ | 11,489,416 | ||||
| Non-deductible expenses |
584,413 | 216,722 | 324,282 | |||||||||
| State income taxes, net of federal benefit |
161,864 | (11,749 | ) | 775,850 | ||||||||
| Change in deferred tax valuation allowance |
(1,025,525 | ) | 690,450 | 335,075 | ||||||||
| Deferred taxes due to change in tax status |
— | — | 52,835,075 | |||||||||
| Change in estimate-bonus depreciation |
419,157 | (7,145,800 | ) | — | ||||||||
| Foreign rate difference |
(407,173 | ) | 172,612 | 83,768 | ||||||||
| Goodwill Impairment |
— | — | 1,527,179 | |||||||||
| Tax pass through entity earnings |
— | — | (4,796,153 | ) | ||||||||
| $ | (6,501,132 | ) | $ | (25,143,867 | ) | $ | 62,574,492 | |||||
69
Table of Contents
Index to Financial Statements
At December 31, significant components of our deferred tax assets and liabilities were:
| 2010 | 2009 | |||||||
| Deferred tax assets: |
||||||||
| Net operating loss carryforwards |
$ | 29,333,629 | $ | 24,294,846 | ||||
| Foreign tax credits |
796,363 | — | ||||||
| Other |
5,344,669 | 4,131,589 | ||||||
| Total deferred tax assets |
35,474,661 | 28,426,435 | ||||||
| Valuation allowance for deferred tax assets |
— | (1,025,525 | ) | |||||
| Deferred tax liabilities: |
||||||||
| Tax over book depreciation |
(53,354,294 | ) | (51,213,448 | ) | ||||
| Intangible assets |
(11,805,706 | ) | (12,809,573 | ) | ||||
| Total deferred tax liabilities |
(65,160,000 | ) | (64,023,021 | ) | ||||
| Net deferred tax liabilities |
$ | (29,685,339 | ) | $ | (36,622,111 | ) | ||
We had a U.S. net operating loss carryforward at December 31, 2010 of approximately $84.2 million which is subject to expiration in various amounts from 2028 to 2030. Realization of deferred tax assets associated with net operating loss carryforwards is dependent upon generating sufficient taxable income in the appropriate jurisdiction prior to their expiration. Management believes it is more likely than not that the U.S. deferred tax asset will be realized through future taxable income or reversal of temporary differences. Additionally, at December 31, 2010 we determined an overall foreign loss position is no longer expected to exist, thereby reversing the valuation allowance recorded as of December 31, 2009. Also we recorded a foreign tax credit of approximately $800,000 that we expect to be able to fully utilize in future years. The foreign tax credit is subject to expiration in 2020.
Deferred taxes have not been provided for on the majority of undistributed earnings of foreign subsidiaries since substantially all of these earnings are expected to be permanently reinvested in our foreign operations. A deferred tax liability is recognized when we expect that we will recover those undistributed earnings in a taxable manner, such as through receipt of dividends or sale of the investments. Determination of the amount of the unrecognized U.S. income tax liability on undistributed earnings is not practical because of the complexities of the hypothetical calculation
In July 2006, the FASB issued FASB Interpretation No. 48, “Accounting for Uncertainty in Income Taxes—an interpretation of FASB Statement No. 109” (“FIN 48”), which was later codified into ASC 740. This interpretation clarified the accounting and disclosure for uncertainty in tax positions, as defined. ASC 740 seeks to reduce the diversity in practice associated with certain aspects of the recognition and measurement related to accounting for income taxes. The Company was subject to the provisions of ASC 740 after June 27, 2008 when it became subject to filing under the Securities Exchange Act of 1934. Prior to that date, the entity was a flow-through entity for tax purposes; therefore, the former owners are responsible for any tax adjustments related to prior years, although Management believes no uncertainties exist related to those prior years. The Forbes Group has analyzed filing positions in all of the federal and state jurisdictions where it is required to file income tax returns and is unaware of any uncertain tax positions. The Company files tax returns in the U.S., Texas, and Mexico. In addition, the Company was not required to record a cumulative effect adjustment related to the adoption of ASC 740.
The Company’s policy for recording interest and penalties associated with uncertain tax positions is to record such items as a component of tax expense.
The Company files U.S. federal, U.S. state, and foreign tax returns, and is generally no longer subject to tax examinations for fiscal years prior to 2008.
70
Table of Contents
Index to Financial Statements
13. Loss per Share
Basic net loss per share is computed by dividing net loss available to common shareholders by the weighted average common shares outstanding during the period (including for the periods prior to May 28, 2010 the Class B Shares convertible into common shares). Diluted net loss per share takes into account the potential dilution that could occur if securities or other contracts to issue common shares, such as warrants, options and convertible preference shares, were exercised and converted into Common shares. Potential common stock equivalents that have been issued by the Forbes Group relate to outstanding stock options, which are determined using the treasury stock method, and the Series B Senior Convertible Preferred Shares, which are determined using the “if converted” method. In applying the if-converted method, conversion is not assumed for purposes of computing diluted EPS if the effect would be antidilutive. As of December 31, 2010 and 2009, there were 5,220,000 and 2,680,000 options to purchase common shares outstanding, and 588,059 and 0 Series B Senior Convertible Preferred Shares outstanding, respectively. The preferred stock is convertible at a rate of 36 common shares to one. We did not include any common shares issuable upon the exercise of options or the conversion of the Series B Preferred Shares in the calculation of diluted loss per share during any period presented as they would be antidilutive.
The Company has determined that the Series B Preferred Stock is a participating security under ASC 260. Under ASC 260, a security is considered a participating security if the security may participate in undistributed earnings with common stock, whether the participation is conditioned upon the occurrence of a specified event or not. In accordance with ASC260, a company is required to use the two-class method when computing EPS when a company has a security that qualifies as a “participating security.” The two-class method is an earnings allocation formula that determines EPS for each class of common stock and participating security according to dividends declared (or accumulated) and participation rights in undistributed earnings. A participating security is included in the computation of basic EPS using the two-class method. Under the two-class method, basic EPS for the Company’s Common Stock is computed by dividing net income applicable to common stock by the weighted-average common shares outstanding during the period. Diluted EPS for the Company’s Common Stock is computed using the more dilutive of the two-class method or the if-converted method.
In accordance with ASC 260, securities deemed to not be participating in losses if there is no obligation to fund such losses. Since the Company reported a loss from operations for the year ended December 31, 2010, the Series B Preferred Stock was not deemed to be a participating security for the year-ended December 31, 2010 pursuant to ASC 260.
Concurrent with the Equity Offering on May 29, 2008, the Company began conducting its business through, a newly formed Bermuda corporation and holding company. The unaudited pro forma net income per share gives effect to the Bermuda Reorganization pursuant to which our parent entity changed from a flow through entity for federal income tax purposes to a “C” corporation, the issuance of our common stock in connection with our Initial Equity Offering on May 29, 2008, and an assumed effective tax rate of 37%, as though the Bermuda Reorganization and Initial Equity Offering had occurred on January 1, 2008.
The following table sets forth the computation of basic and diluted earnings per share:
| Year Ended December 31, | ||||||||||||
| 2010 | 2009 | 2008 | ||||||||||
| Basic and diluted: |
||||||||||||
| Net loss |
$ | (11,309,918 | ) | $ | (29,330,709 | ) | $ | (29,747,590 | ) | |||
| Accumulated preferred stock dividends and accretion |
(1,040,693 | ) | — | — | ||||||||
| Net loss attributable to common stockholders |
$ | (12,350,611 | ) | (29,330,709 | ) | (29,747,590 | ) | |||||
| Weighted-average common shares |
83,673,700 | 62,642,878 | 45,894,557 | |||||||||
| Basic and diluted loss per share |
$ | (0.15 | ) | $ | (0.47 | ) | $ | (0.65 | ) | |||
The following table sets forth the computation of unaudited pro forma basic and diluted earnings per share:
| Year Ended December 31, 2008 |
||||
| Pro Forma |
||||
| Basic and diluted: |
||||
| Net income |
$ | 20,680,948 | ||
| Weighted-average common shares |
55,994,843 | |||
| Basic and diluted earnings per share |
$ | 0.37 | ||
14. Business Segment Information
The Forbes Group has determined that it has two reportable segments organized based on its products and services—well servicing and fluid logistics and other. The accounting policies of the segments are the same as those described in the summary of significant accounting policies.
Well Servicing
The well servicing segment consists of operations in the U.S. and Mexico that provide (i) well maintenance, including remedial repairs and removal and replacement of downhole production equipment, (ii) well workovers, including significant downhole repairs, re-completions and re-perforations, (iii) completion and swabbing activities, and (iv) plugging and abandoning services. In addition, the Forbes Group has tubing testing units that are used to conduct pressure testing of oil and natural gas production tubing.
71
Table of Contents
Index to Financial Statements
Fluid Logistics and Other
The fluid logistics and other segment consists of operations in the U.S., which provide, transport, store and dispose of a variety of drilling and produced fluids used in and generated by oil and natural gas production activities. These services are required in most workover and completion projects and are routinely used in daily producing well operations. In the fiscal year 2010, the Company began providing site preparation services which are complementary to the traditional services offered by the company. Wolverine Construction, Inc., a related party, was sub-contracted to completed such services.
The following table sets forth certain financial information with respect to Forbes Group’s reportable segments (amounts in 000’s):
| Well Servicing |
Fluid Logistics and Other |
Total | ||||||||||
| Year Ended December 31, 2010 |
||||||||||||
| Operating revenues |
$ | 155,273 | $ | 178,797 | $ | 334,070 | ||||||
| Direct operating costs |
123,332 | 138,079 | 261,411 | |||||||||
| Segment profits |
$ | 31,941 | $ | 40,718 | $ | 72,659 | ||||||
| Depreciation and amortization |
$ | 22,027 | $ | 17,933 | $ | 39,960 | ||||||
| Capital expenditures |
1,756 | 1,770 | 3,526 | |||||||||
| Total assets |
374,327 | 282,448 | 656,775 | |||||||||
| Year Ended December 31, 2009 |
||||||||||||
| Operating revenues |
$ | 106,097 | $ | 109,823 | $ | 215,920 | ||||||
| Direct operating costs |
96,826 | 87,263 | 184,089 | |||||||||
| Segment profits |
$ | 9,271 | $ | 22,560 | $ | 31,831 | ||||||
| Depreciation and amortization |
$ | 21,746 | $ | 17,726 | $ | 39,472 | ||||||
| Capital expenditures |
14,488 | 1,854 | 16,342 | |||||||||
| Total assets |
368,926 | 249,660 | 618,586 | |||||||||
| Year Ended December 31, 2008 |
||||||||||||
| Operating revenues |
$ | 189,980 | $ | 170,949 | $ | 360,929 | ||||||
| Direct operating costs |
128,615 | 117,940 | 246,555 | |||||||||
| Segment profits |
$ | 61,365 | $ | 53,009 | $ | 114,374 | ||||||
| Depreciation and amortization |
$ | 18,253 | $ | 15,471 | $ | 33,724 | ||||||
| Capital expenditures |
106,016 | 36,017 | 142,033 | |||||||||
| Year Ended December 31, | ||||||||||||
| Reconciliation of Forbes Group Operating Income (Loss) As Reported: |
2010 | 2009 | 2008 | |||||||||
| Segment profits |
$ | 72,659 | $ | 31,831 | $ | 114,374 | ||||||
| General and administrative expense |
23,373 | 21,229 | 17,700 | |||||||||
| Depreciation and amortization |
39,960 | 39,472 | 33,724 | |||||||||
| Goodwill impairment |
— | — | 4,363 | |||||||||
| Operating income (loss) |
9,326 | (28,870 | ) | 58,587 | ||||||||
| Other income and expenses, net |
(27,137 | ) | (25,605 | ) | (25,760 | ) | ||||||
| Income (loss) before income taxes |
$ | (17,811 | ) | $ | (54,475 | ) | $ | 32,827 | ||||
| Year Ended December 31, | ||||||||||||
| Reconciliation of the Forbes Group Assets as Reported |
2010 | 2009 | ||||||||||
| Total reportable segments |
$ | 656,775 | $ | 618,586 | ||||||||
| Elimination of internal transaction |
(801,930 | ) | (716,571 | ) | ||||||||
| Parent |
596,985 | 555,418 | ||||||||||
| Total assets |
$ | 451,830 | $ | 457,433 | ||||||||
72
Table of Contents
Index to Financial Statements
Financial information about geographic areas
Revenues from the Company’s non-U.S. operations, which are located exclusively in Mexico, were $45.9 million, $26.2 million and $0 for the years ended December 31, 2010, 2009, and 2008 respectively. All other revenue was generated by the Company’s U.S. operations. The Company generates no revenues from Bermuda, the country of domicile of FES Ltd. Long-lived assets located in Mexico were approximately $13.4 million, $12.4 million and $0.3 million as of December 31, 2010, 2009, and 2008, respectively.
15. Equity Securities
Common Shares
Holders of common shares have no pre-emptive, redemption, conversion, or sinking fund rights. Holders of Common Shares are entitled to one vote per share on all matters submitted to a vote of holders of Common Shares. Unless a different majority is required by law or by the Bye-laws, resolutions to be approved by holders of Common Shares require approval by a simple majority of votes cast at a meeting at which a quorum is present. In the event of the liquidation, dissolution, or winding up of the Company, the holders of common shares are entitled to share equally and ratably in the Company’s assets, if any, remaining after the payment of all of its debts and liabilities, subject to any liquidation preference on any issued and outstanding Preference Shares.
Class B Shares
On May 28, 2010, in connection with the issuance of the Series B Preferred Shares, holders of Class B Shares holding greater than 66 2/3% of the Class B Shares then issued and outstanding elected to convert their Class B Shares into an equal number of the Company’s Common Shares, pursuant to Section 4.3 of the Company’s Bye-laws. This resulted in the automatic conversion of all issued and outstanding Class B Shares into the Company’s Common Shares, on a one-for-one basis. There are no Class B Shares currently issued and outstanding.
Prior to the conversion, holders of Class B shares had the right to be present at annual shareholder meetings, but, except as otherwise provided in the Companies Act 1981 of Bermuda (“CAB”) and the Company’s bye-laws, had no right to vote on any matters at such meetings. Under the bye-laws, the holders of the Class B shares were permitted to vote with the common shares on an as-converted basis for the following actions:
| • | any increase or decrease in the authorized number of common shares or preference shares; |
| • | any agreement by the Company or its shareholders regarding a “business combination” (as defined in the bye-laws); |
| • | any increase of decrease in the authorized number of members of the board of directors; |
| • | the liquidation, dissolution or winding up of the Company; and |
| • | voluntary placement of the Company into receivership proceedings in any relevant jurisdiction. |
In addition, the following actions required the approval of holders of 75% of the Class B shares:
| • | any increase or decrease in the authorized number and any issuance of Class B shares; |
| • | any alteration or waiver of any provision of the bye-laws in a manner adverse to the holders of the Class B shares; and |
| • | any authorization or any designation, whether by reclassification or otherwise, of any new class or series of shares or any other securities convertible into equity securities of the Company having voting rights or ranking on a parity with or senior to the Class B shares in right of redemption, liquidation preference, or dividend rights, or any increase in the authorized or designated number of any such new class or series. |
In addition to the rights above, holders of Class B shares, or the common shares into which they were converted in May 2010, had the right to nominate a majority of the board of directors for election for as long as such holders own at least a majority of the capital stock of the Company. In the event that such holders owned between 25% and 50% of the capital stock of the Company, they had the right to nominate that number of directors commensurate with their percentage ownership of the Company, with such number being not less than two.
Series B Senior Convertible Preferred Shares
Under our Certificate of Designation, we are authorized to issue 825,000 shares of Series B Senior Convertible Preferred Shares (the “Series B Preferred Shares”), par value $0.01 per share. On May 28, 2010 the Company completed a private placement of 580,800 Series B Preferred Shares for total gross proceeds of $14,520,000. In connection with the private placement, the Company paid the investors who purchased the Series B Preferred Shares a closing fee of $290,400 and incurred legal fees and other costs of $401,395. The Common Shares into which the Series B Preferred Shares are convertible have certain demand and “piggyback” registration rights.
73
Table of Contents
Index to Financial Statements
The terms of the Series B Preferred Shares are as follows:
Rank – The Series B Preferred Shares rank senior in right of payment to the Common Shares and any class or series of capital stock that is junior to the Series B Preferred Shares, and pari passu with any series of the Company’s preferred stock that by its terms ranks pari passu in right of payment as to dividends and liquidation with the Series B Preferred Shares.
Conversion – The Series B Preferred Shares are convertible into the Company’s common shares at an initial rate of 36 common shares per Series B Preferred Shares (subject to adjustment). If all such Series B Preferred Shares are converted, at the initial conversion rate, 20,908,800 Common Shares (representing 19.99% of the outstanding common shares outstanding at the time of the issuance of the Series B Preferred Shares after such conversion) will be issued to the holders of the Series B Preferred Shares. Pursuant to Certificate of Designation, no holder of the Series B Preferred Shares is entitled to effect a conversion of Series B Preferred Shares if such conversion would result in the holder (and affiliates) beneficially owning 20% or more of the Company’s Common Shares. Redeemable preferred stock (and, if ever, any other redeemable financial instrument we may enter into) is initially evaluated for possible classification as a liability or equity pursuant to ASC 480—Distinguishing Liabilities from Equity. Redeemable preferred stock that does not, in its entirety, require liability classification is evaluated for embedded features that may require bifurcation and separate classification as derivative liabilities. In determining the appropriate accounting for the conversion feature for the Series B Preferred Stock, the Company determined that the conversion feature does not require bifurcation, and as a result is not considered a derivative under the provisions of ASC 815—Derivatives and Hedging.
Dividends Rights – The Series B Preferred Shares are entitled to receive preferential dividends equal to five percent (5%) per annum of the original issue price per share, payable quarterly in February, May, August and November of each year. Such dividends may be paid by the Company in cash or in kind (in the form of additional Series B Preferred Shares). In the event that the payment in cash or in kind of any such dividend would cause the Company to violate a covenant under its debt agreements, the obligation to pay, in cash or in kind, will be suspended until the earlier to occur of (i) and only to the extent any restrictions under the debt agreements lapse or are no longer applicable or (ii) February 16, 2015. During any such suspension period, the preferential dividends shall continue to accrue and accumulate. As shares of the Series B Preferred Shares are convertible into shares of our common stock, each dividend paid in kind will have a dilutive effect on our shares of common stock.
Liquidation – Upon any voluntary or involuntary liquidation, dissolution or winding up of the Company, no distribution shall be made as follows:
| (i) | to the holders of shares ranking junior to the Series B Preferred Shares unless the holders of Series B Preferred Shares shall have received an amount equal to the original issue price per share of the Series B Preferred Shares (subject to adjustment) plus an amount equal to accumulated and unpaid dividends and distributions thereon to the date of such payment, and |
| (ii) | to the holders of shares ranking on a parity with the Series B Preferred Shares, unless simultaneously therewith distributions are made ratably on the Series B Preferred Shares and all other such parity stock in proportion to the total amounts to which the holders of Series B Preferred Shares are entitled. |
Voting Rights – The holders of Series B Preferred Shares are not entitled to any voting rights except as provided in the following sentence in the Company’s Bye-laws or otherwise under the Company Act of 1981 of Bermuda. If the preferential dividends on the Series B Preferred Shares have not been declared and paid in full in cash or in kind for eight or more quarterly dividend periods (whether or not consecutive), the holders of the Series B Preferred Shares shall be entitled to vote at any meeting of shareholders with the holders of Common Shares and to cast the number of votes equal to the number of whole Common Shares into which the Series B Preferred Shares held by such holders are then convertible.
Redemption – All or any number of the Series B Preferred Shares may be redeemed by the Company at any time after May 28, 2013 at a redemption price determined in accordance with the Certificate of Designation plus accrued and unpaid dividends and provided that the current equity value of our common stock exceeds specified levels. On May 28, 2017, the Company is required to redeem any Series B Preferred Shares then outstanding at a redemption price determined in accordance with the Certificate of Designation plus accrued but unpaid dividends. Such mandatory redemption may, at the Company’s election, be paid in cash or in common shares (valued for such purpose at 95% of the then fair market value of the common shares). In the event certain corporate transactions occur (such as a reorganization, recapitalization, reclassification, consolidation or merger) under which the Company’s common shares (but not the Series B Preferred Shares) are converted into or exchanged for securities, cash or other property, then following such transaction, each Series B Preferred Share shall thereafter be convertible into the same kind and amount of securities, cash or other property.
Certain of the redemption features are outside of the Company’s control, and as a result, the Series B Preferred Shares have been reflected in the consolidated balance sheet as temporary equity.
74
Table of Contents
Index to Financial Statements
Dividends
Preferred stock dividends are recorded at their fair value. If paid in cash, the amount paid represents fair value. If paid in kind, the fair value of the preferred stock dividends is determined using valuation techniques that include a component representing the intrinsic value of the dividends (which represents the fair value of the common stock into which the preferred shares could be converted) and an option component (which is determined using a Black-Scholes Option Pricing Model). Management currently expects to pay dividends in-kind. As we have not paid dividends in cash or in-kind for two quarterly periods and are in an accumulated deficit position, these dividends are treated as a reduction of additional paid-in capital.
The Series B Preferred Shares are not redeemable as of December 31, 2010. The Company paid a closing fee to the Investors of $290,400 which is netted with the proceeds from the sale of the Series B Preferred Shares in temporary equity on the consolidated balance sheet. The value of the Series B Preferred Shares, for accounting purposes, is being accreted up to redemption value from the date of issuance to the earliest redemption date of the instrument using the effective interest rate method. If the Series B Preferred Shares had been redeemed as of December 31, 2010, the redemption amount would have been approximately $15.3 million.
16. Guarantor and Non-Guarantor Consolidating Financial Statements
The Company has certain foreign significant subsidiaries that do not guarantee the Second Priority Notes and the First Priority Notes discussed in Note 8 and is required to present the following condensed consolidating financial information pursuant to Rule 3-10 of Regulation S-X. These schedules are presented using the equity method of accounting for all periods presented. Under this method, investments in subsidiaries are recorded at cost and adjusted for the Company’s share in the subsidiaries’ cumulative results of operations, capital contributions and distributions and other changes in equity. Elimination entries relate primarily to the elimination of investments in subsidiaries and associated intercompany balances and transactions.
Supplemental financial information for Forbes Energy Services Ltd., the parent, Forbes Energy Services LLC and Forbes Energy Capital, Inc., the issuers, our combined subsidiary guarantors and our non-guarantor subsidiaries is presented below. The December 31, 2008 supplemental information has not been included because the parent company had no independent assets or operations, and the then existing non-guarantor was deemed to be minor as of and for the period ending that date.
75
Table of Contents
Index to Financial Statements
Consolidating Balance Sheet
As of December 31, 2010
| Parent | Issuers | Guarantors | Non- Guarantors |
Eliminations | Consolidated | |||||||||||||||||||
| Assets |
||||||||||||||||||||||||
| Current assets |
||||||||||||||||||||||||
| Cash and cash equivalents |
$ | 7,101,006 | $ | 1,853,717 | $ | 21,388,712 | $ | 115,022 | — | $ | 30,458,457 | |||||||||||||
| Accounts receivable |
13,797,552 | — | 81,508,832 | 12,423,295 | (18,883,978 | ) | 88,845,701 | |||||||||||||||||
| Other current assets |
284,146 | 305,593 | 5,982,520 | 597 | — | 6,572,856 | ||||||||||||||||||
| Total current assets |
21,182,704 | 2,159,310 | 108,880,064 | 12,538,914 | (18,883,978 | ) | 125,877,014 | |||||||||||||||||
| Property and equipment, net |
658,901 | — | 272,825,909 | 746,656 | — | 274,231,466 | ||||||||||||||||||
| Investments in affiliates |
15,556,856 | 105,347,628 | (2,622,006 | ) | — | (118,282,478 | ) | — | ||||||||||||||||
| Intercompany receivables |
95,785,698 | 114,836,363 | — | — | (210,622,061 | ) | — | |||||||||||||||||
| Intercompany note receivable |
902,261 | — | — | — | (902,261 | ) | — | |||||||||||||||||
| Intangible assets, net |
— | — | 33,737,585 | — | — | 33,737,585 | ||||||||||||||||||
| Deferred financing costs, net |
— | 8,907,520 | — | — | — | 8,907,520 | ||||||||||||||||||
| Restricted cash |
— | 9,043,246 | — | — | — | 9,043,246 | ||||||||||||||||||
| Other assets |
13,392 | — | 8,983 | 10,661 | — | 33,036 | ||||||||||||||||||
| Total assets |
$ | 134,099,812 | $ | 240,294,067 | $ | 412,830,535 | $ | 13,296,231 | $ | (348,690,778 | ) | $ | 451,829,867 | |||||||||||
| Liabilities and Shareholders’ Equity |
||||||||||||||||||||||||
| Current liabilities |
||||||||||||||||||||||||
| Accounts payable |
$ | 12,360,888 | $ | 922,471 | $ | 26,066,715 | $ | 18,040 | $ | (10,541,463 | ) | $ | 28,826,651 | |||||||||||
| Accrued liabilities |
2,797,613 | 9,351,896 | 6,872,793 | 2,332,805 | 518,575 | 21,873,682 | ||||||||||||||||||
| Current portion of long-term debt |
— | 4,634,163 | 1,829,657 | — | — | 6,463,820 | ||||||||||||||||||
| Total current liabilities |
15,158,501 | 14,908,530 | 34,769,165 | 2,350,845 | (10,022,888 | ) | 57,164,153 | |||||||||||||||||
| Long-term debt |
— | 209,827,683 | 3,087,002 | — | — | 212,914,685 | ||||||||||||||||||
| Intercompany payables |
— | — | 206,705,062 | 12,778,099 | (219,483,161 | ) | — | |||||||||||||||||
| Intercompany note payable |
— | — | — | 902,261 | (902,261 | ) | — | |||||||||||||||||
| Deferred tax liability (benefit) |
(33,124,373 | ) | — | 62,922,417 | (112,705 | ) | — | 29,685,339 | ||||||||||||||||
| Total liabilities |
(17,965,872 | ) | 224,736,213 | 307,483,646 | 15,918,500 | (230,408,310 | ) | 299,764,177 | ||||||||||||||||
| Series B Convertible Preferred Shares |
15,270,293 | — | — | — | — | 15,270,293 | ||||||||||||||||||
| Shareholders’ equity |
136,795,391 | 15,557,854 | 105,346,889 | (2,622,269 | ) | (118,282,468 | ) | 136,795,397 | ||||||||||||||||
| Total liabilities and shareholders’ equity |
$ | 134,099,812 | $ | 240,294,067 | $ | 412,830,535 | $ | 13,296,231 | $ | (348,690,778 | ) | $ | 451,829,867 | |||||||||||
76
Table of Contents
Index to Financial Statements
Consolidating Balance Sheet
As of December 31, 2009
| Parent | Issuers | Guarantors | Non-Guarantors | Eliminations | Consolidated | |||||||||||||||||||
| Assets |
||||||||||||||||||||||||
| Current assets |
||||||||||||||||||||||||
| Cash and cash equivalents |
$ | 12,577,404 | $ | 7,860,204 | $ | 7,973,636 | $ | 14,123 | $ | — | $ | 28,425,367 | ||||||||||||
| Restricted cash |
— | 2,932,279 | — | — | — | 2,932,279 | ||||||||||||||||||
| Accounts receivable |
20,747,276 | 9,078 | 40,203,774 | 15,992,327 | (18,858,590 | ) | 58,093,865 | |||||||||||||||||
| Other current assets |
(14,107 | ) | 401,021 | 4,231,170 | 118,610 | — | 4,736,694 | |||||||||||||||||
| Total current assets |
$ | 33,310,573 | $ | 11,202,582 | $ | 52,408,580 | $ | 16,125,060 | $ | (18,858,590 | ) | $ | 94,188,205 | |||||||||||
| Property and equipment, net |
546,107 | — | 307,115,247 | 898,531 | — | 308,559,885 | ||||||||||||||||||
| Investments in affiliates |
40,712,544 | 97,919,974 | 680,424 | — | (139,312,942 | ) | — | |||||||||||||||||
| Intercompany receivables |
63,984,843 | 143,549,204 | — | — | (207,534,047 | ) | — | |||||||||||||||||
| Intercompany note receivable |
5,013,405 | — | — | — | (5,013,405 | ) | — | |||||||||||||||||
| Intangible assets, net |
— | — | 36,598,781 | — | — | 36,598,781 | ||||||||||||||||||
| Deferred financing costs, net |
— | 11,453,830 | — | — | — | 11,453,830 | ||||||||||||||||||
| Restricted cash |
— | 6,560,225 | — | — | — | 6,560,225 | ||||||||||||||||||
| Other assets |
1,890 | 27,500 | 31,436 | 11,144 | — | 71,970 | ||||||||||||||||||
| Total assets |
$ | 143,569,362 | $ | 270,713,315 | $ | 396,834,468 | $ | 17,034,735 | $ | (370,718,984 | ) | $ | 457,432,896 | |||||||||||
| Liabilities and Shareholders’ Equity |
||||||||||||||||||||||||
| Current liabilities |
||||||||||||||||||||||||
| Accounts payable |
$ | 21,340,568 | $ | 445,376 | $ | 16,706,926 | $ | 5,137,388 | $ | (19,355,427 | ) | $ | 24,274,831 | |||||||||||
| Accrued liabilities |
1,041,085 | 9,269,026 | 9,269,096 | 3,074,506 | 476,535 | 23,130,248 | ||||||||||||||||||
| Current portion of long-term debt |
— | 10,736,500 | 1,696,400 | — | — | 12,432,900 | ||||||||||||||||||
| Total current liabilities |
22,381,653 | 20,450,902 | 27,672,422 | 8,211,894 | (18,878,892 | ) | 59,837,979 | |||||||||||||||||
| Long-term debt |
— | 209,548,870 | 4,916,459 | — | — | 214,465,329 | ||||||||||||||||||
| Intercompany payables |
— | — | 204,384,800 | 3,128,945 | (207,513,745 | ) | — | |||||||||||||||||
| Intercompany note payable |
— | — | — | 5,013,405 | (5,013,405 | ) | — | |||||||||||||||||
| Deferred tax liability (benefit) |
(25,319,770 | ) | — | 61,941,881 | — | — | 36,622,111 | |||||||||||||||||
| Total liabilities |
(2,938,117 | ) | 229,999,772 | 298,915,562 | 16,354,244 | (231,406,042 | ) | 310,925,419 | ||||||||||||||||
| Shareholders’ equity |
146,507,479 | 40,713,543 | 97,918,906 | 680,491 | (139,312,942 | ) | 146,507,477 | |||||||||||||||||
| Total liabilities and shareholders’ equity |
$ | 143,569,362 | $ | 270,713,315 | $ | 396,834,468 | $ | 17,034,735 | $ | (370,718,984 | ) | $ | 457,432,896 | |||||||||||
77
Table of Contents
Index to Financial Statements
For the Year Ended December 31, 2010
Consolidating Statement of Operations
| Parent | Issuers | Guarantors | Non- Guarantors |
Eliminations | Consolidated | |||||||||||||||||||
| Revenues |
||||||||||||||||||||||||
| Well servicing |
$ | 45,885,273 | $ | — | $ | 112,143,046 | $ | 15,975,781 | $ | (18,730,824 | ) | $ | 155,273,276 | |||||||||||
| Fluid logistics |
— | — | 178,796,699 | — | — | 178,796,699 | ||||||||||||||||||
| Total revenues |
45,885,273 | — | 290,939,745 | 15,975,781 | (18,730,824 | ) | 334,069,975 | |||||||||||||||||
| Expenses |
||||||||||||||||||||||||
| Well servicing |
35,869,202 | 89,657,036 | 13,959,543 | (16,153,280 | ) | 123,332,501 | ||||||||||||||||||
| Fluid logistics |
— | — | 138,078,555 | — | — | 138,078,555 | ||||||||||||||||||
| General and administrative |
6,819,412 | 5,919,630 | 11,536,373 | 1,674,958 | (2,577,327 | ) | 23,373,046 | |||||||||||||||||
| Depreciation and amortization |
140,955 | — | 39,566,366 | 252,974 | — | 39,960,295 | ||||||||||||||||||
| Total expenses |
42,829,569 | 5,919,630 | 278,838,330 | 15,887,475 | (18,730,607 | ) | 324,744,397 | |||||||||||||||||
| Operating income (loss) |
3,055,704 | (5,919,630 | ) | 12,101,415 | 88,306 | (217 | ) | 9,325,578 | ||||||||||||||||
| Interest income (expense), net |
28,728 | (26,871,539 | ) | (281,812 | ) | (31,152 | ) | 1,574 | (27,154,201 | ) | ||||||||||||||
| Equity in income (loss) of affiliates |
(22,022,016 | ) | 10,747,943 | (70,642 | ) | — | 11,344,715 | — | ||||||||||||||||
| Other income (loss), net |
3,645 | 21,210 | (10,216 | ) | 4,291 | (1,357 | ) | 17,573 | ||||||||||||||||
| Income (loss) before taxes |
(18,933,939 | ) | (22,022,016 | ) | 11,738,745 | 61,445 | 11,344,715 | (17,811,050 | ) | |||||||||||||||
| Income tax expense (benefit) |
(7,624,021 | ) | — | 990,795 | 132,094 | — | (6,501,132 | ) | ||||||||||||||||
| Net income (loss) |
$ | (11,309,918 | ) | $ | (22,022,016 | ) | $ | 10,747,950 | $ | (70,649 | ) | $ | 11,344,715 | $ | (11,309,918 | ) | ||||||||
,
78
Table of Contents
Index to Financial Statements
Consolidating Statement of Operations
For the Year Ended December 31, 2009
| Parent | Issuers | Guarantors | Non- Guarantors |
Eliminations | Consolidated | |||||||||||||||||||
| Revenues |
||||||||||||||||||||||||
| Well servicing |
$ | 26,285,577 | — | $ | 85,420,185 | $ | 9,435,085 | $ | (15,043,567 | ) | $ | 106,097,280 | ||||||||||||
| Fluid logistics |
— | — | 109,822,640 | — | — | 109,822,640 | ||||||||||||||||||
| Total revenues |
26,285,577 | — | 195,242,825 | 9,435,085 | (15,043,567 | ) | 215,919,920 | |||||||||||||||||
| Expenses |
||||||||||||||||||||||||
| Well servicing |
25,638,378 | 138 | 77,344,249 | 5,274,041 | (11,430,895 | ) | 96,825,911 | |||||||||||||||||
| Fluid logistics |
— | — | 87,263,351 | — | — | 87,263,351 | ||||||||||||||||||
| General and administrative |
7,225,894 | 5,890,640 | 9,822,892 | 1,921,404 | (3,632,011 | ) | 21,228,819 | |||||||||||||||||
| Depreciation and amortization |
33,552 | — | 39,143,261 | 294,942 | — | 39,471,755 | ||||||||||||||||||
| Total expenses |
32,897,824 | 5,890,778 | 213,573,753 | 7,490,387 | (15,062,906 | ) | 244,789,836 | |||||||||||||||||
| Operating income (loss) |
(6,612,247 | ) | (5,890,778 | ) | (18,330,928 | ) | 1,944,698 | 19,339 | (28,869,916 | ) | ||||||||||||||
| Interest income (expense), net |
29,775 | (26,133,136 | ) | (775,310 | ) | (26,955 | ) | (12,891 | ) | (26,918,517 | ) | |||||||||||||
| Equity in income (loss) of affiliates |
(38,073,710 | ) | (7,471,913 | ) | 1,917,501 | — | 43,628,122 | — | ||||||||||||||||
| Other income (loss), net |
(138,191 | ) | 1,422,117 | 36,430 | (51 | ) | (6,448 | ) | 1,313,857 | |||||||||||||||
| Income (loss) before taxes |
(44,794,373 | ) | (38,073,710 | ) | (17,152,307 | ) | 1,917,692 | 43,628,122 | (54,474,576 | ) | ||||||||||||||
| Income tax expense (benefit) |
(15,463,664 | ) | — | (9,680,203 | ) | — | — | (25,143,867 | ) | |||||||||||||||
| Net income (loss) |
$ | (29,330,709 | ) | $ | (38,073,710 | ) | $ | (7,472,104 | ) | $ | 1,917,692 | $ | 43,628,122 | $ | (29,330,709 | ) | ||||||||
79
Table of Contents
Index to Financial Statements
Consolidating Statement of Cash Flows
For the Year Ended December 31, 2010
| Parent | Issuers | Guarantors | Non- Guarantors |
Eliminations | Consolidated | |||||||||||||||||||
| Cash flows from operating activities |
||||||||||||||||||||||||
| Net cash provided by operating activities |
$ | (19,642,041 | ) | $ | 323,005 | $ | 21,643,272 | $ | 124,873 | — | $ | 2,449,109 | ||||||||||||
| Cash flows from investing activities |
||||||||||||||||||||||||
| Restricted cash |
— | 449,258 | — | — | — | 449,258 | ||||||||||||||||||
| Purchase of property and equipment |
— | — | (6,202,984 | ) | — | (6,202,984 | ) | |||||||||||||||||
| Net cash used in investing activities |
— | 449,258 | (6,202,984 | ) | — | (5,753,726 | ) | |||||||||||||||||
| Cash flows from financing activities |
||||||||||||||||||||||||
| Other |
— | — | (392,969 | ) | — | — | (392,969 | ) | ||||||||||||||||
| Proceeds from stock offering, net |
14,229,600 | — | — | — | — | 14,229,600 | ||||||||||||||||||
| Borrowings under debt agreements |
— | — | — | — | — | — | ||||||||||||||||||
| Repayments of debt |
— | (6,778,750 | ) | (1,696,200 | ) | — | — | (8,474,950 | ) | |||||||||||||||
| Net cash provided by (used in) financing activities |
14,229,600 | (6,778,750 | ) | (2,089,169 | ) | — | — | 5,361,681 | ||||||||||||||||
| Effect of currency translation on cash |
— | — | — | (23,974 | ) | — | (23,974 | ) | ||||||||||||||||
| Net increase/(decrease) in cash and cash equivalents |
(5,412,441 | ) | (6,006,487 | ) | 13,351,119 | 100,899 | — | 2,033,090 | ||||||||||||||||
| Cash and cash equivalents |
||||||||||||||||||||||||
| Beginning of period |
12,577,404 | 7,860,204 | 7,973,636 | 14,123 | — | 28,425,367 | ||||||||||||||||||
| End of period |
$ | 7,164,936 | $ | 1,853,717 | $ | 21,324,755 | $ | 115,022 | — | $ | 30,458,457 | |||||||||||||
80
Table of Contents
Index to Financial Statements
Consolidating Statement of Cash Flows
For the Year Ended December 31, 2009
| Parent | Issuers | Guarantors | Non- Guarantors |
Eliminations | Consolidated | |||||||||||||||||||
| Cash flows from operating activities |
||||||||||||||||||||||||
| Net cash provided by operating activities |
$ | (2,487,192 | ) | $ | 20,570,970 | $ | (3,602,204 | ) | $ | 897,828 | — | $ | 15,379,402 | |||||||||||
| Cash flows from investing activities |
||||||||||||||||||||||||
| Restricted cash |
— | (9,492,504 | ) | — | — | — | (9,492,504 | ) | ||||||||||||||||
| Insurance proceeds |
— | — | 1,783,832 | — | — | 1,783,832 | ||||||||||||||||||
| Purchase of property and equipment |
— | — | (29,120,985 | ) | (903,486 | ) | — | (30,024,471 | ) | |||||||||||||||
| Net cash used in investing activities |
— | (9,492,504 | ) | (27,337,153 | ) | (903,486 | ) | — | (37,733,143 | ) | ||||||||||||||
| Cash flows from financing activities |
||||||||||||||||||||||||
| Payment for debt issuance costs |
— | — | (1,236,638 | ) | — | — | (1,236,638 | ) | ||||||||||||||||
| Proceeds from stock offering, net |
14,927,705 | — | — | — | — | 14,927,705 | ||||||||||||||||||
| Borrowings under debt agreements |
— | — | 32,000,000 | — | — | 32,000,000 | ||||||||||||||||||
| Repayments of debt |
— | (3,415,000 | ) | (14,966,026 | ) | — | — | (18,381,026 | ) | |||||||||||||||
| Net cash provided by (used in) financing activities |
14,927,705 | (3,415,000 | ) | 15,797,336 | — | — | 27,310,041 | |||||||||||||||||
| Net increase/(decrease) in cash and cash equivalents |
12,440,513 | 7,663,466 | (15,142,021 | ) | (5,658 | ) | — | 4,956,300 | ||||||||||||||||
| Cash and cash equivalents |
||||||||||||||||||||||||
| Beginning of period |
136,891 | 196,738 | 23,115,657 | 19,781 | — | 23,469,067 | ||||||||||||||||||
| End of period |
$ | 12,577,404 | $ | 7,860,204 | $ | 7,973,636 | $ | 14,123 | — | $ | 28,425,367 | |||||||||||||
81
Table of Contents
Index to Financial Statements
17. Subsequent Events
On January 25, 2011, the Company filed Amendment No. 1 to its Registration Statement on Form S-4 that was originally filed on November 19, 2010. While this registration statement has been filed, it has not yet been declared effective. Upon its effectiveness, the registration statement will register the exchange of common shares (and Series A Junior Participating Preferred Share purchase rights attached thereto) associated with the Company’s proposed conversion from a Bermuda exempt company to a Texas corporation, or the Conversion. In connection with the Conversion and Share Consolidation, the Company has submitted an application to list its common equity on the NASDAQ Global Market. If this application is successful, the Company plans to dual list its common equity on both the NASDAQ Global Market and the Toronto Stock Exchange. Nevertheless, there can be no assurance that the NASDAQ listing application will be accepted.
In connection with the conversion, the Company plans to conduct a ten-to-one consolidation of its common shares, or the Share Consolidation. In order to facilitate the Share Consolidation, on January 18, 2011, the holders of the Company’s Series B Preferred Shares consented to amend and restate the Certificate of Designation of the Series B Senior Convertible Preferred Shares in order to allow the Company to pay cash in lieu of issuing fractional shares created as a result of stock dividends, splits or combinations or business combinations. On January 20, 2011, this amendment was approved by Company’s board of directors and became effective.
Further, in connection with the Company’s proposed listing on the NASDAQ Global Market, the Company has executed an amended and restated the nominating and voting agreement between the Company, John E. Crisp, Charles C. Forbes and Janet Forbes. Under the terms of the original agreement, Mr. Crisp, Mr. Forbes, Ms. Forbes and their respective successors or assigns, or the Founders, were granted the right to designate a majority of members of the board of directors of the Company for election. In connection with the Company’s proposed listing of its common stock on NASDAQ, the Company and the Founders decided to amend certain provisions of this agreement in order to tie the Founders’ nomination rights more closely to their combined ownership percentage of the Company’s voting stock. On March 9, 2011, the Company and the Founders executed an amended and restated nominating and voting agreement to become effective as of the date of the Conversion. Pursuant to this restated agreement, effective as of the Conversion, for as long as the Founders own greater than 25% in the aggregate of the total outstanding common stock of the Company (or other stock that at such time votes with the Common Stock with respect to the election of directors), they will have the right to designate for election such number of members of the board of directors, rounded up to the greatest whole number, commensurate with their aggregate ownership percentage of such stock. Notwithstanding the foregoing, the Founders will not have the right to designate for election a majority of the board of directors unless the Founders own a majority of the voting stock of the Company. To the extent that the Founders are unable to mutually agree upon which individuals shall be the board designees, the Founders agree to use good-faith best efforts to nominate Mr. Crisp, Mr. Forbes and Ms. Forbes as board designees, provided that if the number of board designees is less than three, then the Founders agree to use good-faith best efforts to nominate the individuals with the higher ownership percentage of the Company’s voting stock to the available designee positions. Similar to the original agreement, pursuant to the restated agreement, to the extent that the Founders hold any shares of the Company entitled to vote, such parties have agreed to vote their shares in favor of the designees nominated by the Founders to the Board of Directors. Such parties have also agreed to vote any shares of the Company entitled to vote, and to instruct their designees on the Board of Directors to vote, so as to provide that each subsidiary has at least one manager or director who is also designee of the Founder. Unless 100% of the Founders are in agreement, the parties are contractually bound to instruct their designees to vote against (i) the issuance, reduction, redemption, or alteration of rights of any equity or debt securities of the Company or any other capitalization of the Company; (ii) the formation or sale of any subsidiary, the issuance, reduction, redemption, sale, disposition, or alteration of rights of any equity or debt securities of any subsidiary; and (iii) any decision to increase or decrease the number of directors. The Nominating and Voting Agreement will terminate upon (i) the bankruptcy or dissolution of the Company, (ii) the ownership by the Founders of all the then issued and outstanding share capital of the Company, (iii) the execution of a written instrument of termination by all applicable parties, and (iv) ten years following the date of execution of the restated agreement. The Nominating and Voting Agreement applies to the Founders as owners of common shares of the Company following the conversion by the Founders of their Class B shares into common shares in May 2010.
As stated previously, the Company performs services for PEMEX in Mexico pursuant to a contract. This contract was entered into in September 2008 and provides that the Company and Merco Ingenieria Industrial S.A. de C.V., or Merco, jointly perform well maintenance and repair work with regard to PEMEX’s Altamira Asset Package in Poza Rica, Mexico. Pursuant to the contract, Merco performs site preparation services, including road construction, and the Company performs well servicing and repair work. The term of the original contract expired on September 26, 2008 and the total amount available under the original contract, for both the Company and Merco, was approximately MXN $234.3 million plus USD $48.8 million. Pursuant to the contract, the Company agreed to post a performance bond, be liable for defects arising from the work completed under the contract and maintain insurance policies that cover the work performed under the contract. Pursuant to the contract, both the Company and Merco agree to be jointly and severally liable for each other’s obligations under the contract.
On March 24, 2011, the Company, Merco and PEMEX entered into a fifth amendment to the original PEMEX contract that increased the amounts available under the original contract.
Subsequent events have been evaluated through the issuance of this filing.
18. Supplemental Financial Information Quarterly Financial Data (Unaudited)
| First Quarter | Second Quarter | Third Quarter | Fourth Quarter | |||||||||||||
| 2010 : |
||||||||||||||||
| Revenues(2) |
$ | 67,263,727 | $ | 80,043,788 | $ | 83,976,513 | $ | 102,785,947 | ||||||||
| Operating income (loss) |
(5,232,639 | ) | 2,838,694 | 3,456,802 | 8,262,721 | |||||||||||
| Net income (loss) |
(8,171,517 | ) | (2,241,346 | ) | (2,081,650 | ) | 1,184,595 | |||||||||
| Preferred shares dividends |
— | (63,957 | ) | (278,432 | ) | (698,304 | ) | |||||||||
| Net income (loss) attributable to common shares |
(8,171,517 | ) | (2,305,303 | ) | (2,360,082 | ) | 486,291 | |||||||||
| Earnings (loss) per share: |
||||||||||||||||
| Basic and diluted |
$ | (0.10 | ) | $ | (0.03 | ) | $ | (0.03 | ) | $ | 0.00 | |||||
| 2009 (1) : |
||||||||||||||||
| Revenues |
$ | 63,431,382 | $ | 49,752,577 | $ | 50,472,206 | $ | 52,263,755 | ||||||||
| Operating (loss) |
(1,661,199 | ) | (7,567,920 | ) | (8,836,273 | ) | (10,804,524 | ) | ||||||||
| Net loss |
(4,535,490 | ) | (9,037,736 | ) | (9,609,721 | ) | (6,147,762 | ) | ||||||||
| Loss per share: |
||||||||||||||||
| Basic and diluted |
$ | (0.07 | ) | $ | (0.15 | ) | $ | (0.15 | ) | $ | (0.10 | ) | ||||
| (1) | During the quarter ended December 31, 2009, the Company discovered that certain transactions reported in its quarters ending March 31, June 30, and September 30, 2009 consolidated financial statements were recorded incorrectly. The Company identified accounting errors related to understatement of payroll expenses, payroll taxes, and costs related to its Mexico operations, the calculation of the self-insured portion of its workers compensation insurance, double recording overstatement of revenue accruals and accounts receivable related to unbilled revenues, and the understatement of interest expense and accrued interest payable on the Company’s Second Priority Notes. All of these errors were identified and recorded as out-of-period adjustments in the quarter ended December 31, 2009. In the aggregate, the effect of correcting those errors as out-of-period adjustments understated net loss and loss per share for the three months ended December 31, 2009 by approximately $0.8 million and $0.01, respectively. The correction of the errors is not material to the financial statements as of and for the quarters ended March 31, June 30, September 30, and December 31, 2009. |
Additionally, during the three months ended September 30, 2009, the Company recorded an out-of-period adjustment to correct an error related to its billing system that occurred during the last two quarters of 2008 and the quarter ended March 31, 2009 which resulted in an overstatement of revenues and trade accounts receivable, and another error related to the recording of revenues and expenses in its Mexico operations for the quarters ended March 31, 2009 and June 30, 2009 which resulted in a misstatement of revenue and operating expenses for those periods. In the aggregate, these two accounting errors, after giving effect to a statutory federal tax rate of 35%, understated net loss and loss per share for the year ended December 31, 2008 by approximately $0.4 million and $0.01, respectively, and the effect of correcting those errors as an out-of-period adjustment overstated net loss and loss per share for the nine months ended September 30, 2009 by $0.4 million and $0.01, respectively. The correction of the errors is not material to the financial statements as of and for the year ended December 31, 2008 and for the nine months ended September 30, 2009.
The following table reflects the effect of errors noted during the quarters and the cumulative effect of correction of errors in the third and fourth quarters ended September 30, 2009 and December 31, 2009 after giving effect to a statutory federal tax rate of 35%:
82
Table of Contents
Index to Financial Statements
| Unaudited Quarterly Data |
Effect of errors on quarter-ended March 31, 2009 |
Effect of errors
on quarter-ended June 30, 2009 |
Effect of errors
on quarter-ended September 30, 2009, and correction of out of period adjustments from December 31, 2008, March 31, 2009 and June 30, 2009 |
Effect on
Quarter-ended December 31, 2009 for correction of out of period adjustments from March 31, 2009, June 30, 2009 and September 30, 2009 |
||||||||||||
| Total revenues (over)/understated |
$ | (45,024 | ) | $ | (713,717 | ) | $ | 983,254 | $ | 472,744 | ||||||
| Total expenses over/(understated) |
(1,564,384 | ) | 643,377 | 1,195,112 | (274,105 | ) | ||||||||||
| Interest expense, net over/(understated) |
— | — | (988,177 | ) | 988,177 | |||||||||||
| Loss before taxes over/(under)stated |
1,609,408 | 70,340 | (1,190,189 | ) | (1,186,816 | ) | ||||||||||
| Net loss over/(under)stated |
1,046,115 | 45,721 | (773,623 | ) | (771,431 | ) | ||||||||||
| Loss per share over/(under)stated |
0.02 | — | (0.01 | ) | (0.01 | ) | ||||||||||
The Company evaluated the correction of these errors based on historical operating results for the quarter ended September 30, 2008, the year ended December 31, 2008, the quarters ended March 31, 2009, June 30, 2009, September 30, 2009 and for the year ended December 31, 2009 in accordance with Accounting Standards Codification 250-10-45-27 “Materiality Determination for Correction of an Error” and Staff Accounting Bulletin No. 99, “Materiality”. The amount of the adjustments when compared to the operating results for these periods or on any trend of profits or losses, is not considered by management to be material. In addition, the Company believes that investors would not consider the amount of the adjustments to be material, and therefore, would not have significantly impacted their investment decisions about the Company.
| (2) | During the quarter ended June 30, 2010, the Company discovered and corrected an accounting error related to the recording of revenues and expenses in its Mexico operations during the quarters ended December 31, 2009 and March 31, 2010. The error resulted in a misstatement of revenue and operating expenses with corresponding errors in accounts receivable – trade, net and accrued liabilities. The cumulative correction was recorded during the quarter ended June 30, 2010 and decreased revenue and accounts receivable by $1.2 million and decreased operating expense and accrued liabilities by approximately $0.9 million resulting in a net impact of approximately $0.3 million of pre-tax loss. |
The Company evaluated the correction of these errors based on the expected operating results for the year ending December 31, 2010 and based on historical operating results for the year ended December 31, 2009 in accordance with Accounting Standards Codification 250-10-45-27 “Materiality Determination for Correction of an Error” and Staff Accounting Bulletin No.99, Materiality. The amount of the adjustments, when compared to the operating results for the year ended December 31, 2009, or on any trend of losses, is not considered by management to be material. In addition, the Company believes that investors would not consider the amount of the adjustments to be material and, therefore, would not have significantly impacted their investment decisions about the Company.
| Item 9. | Changes in or Disagreements with Accountants on Accounting and Financial Disclosure |
Not applicable.
| Item 9A. | Controls and Procedures |
Evaluation of Disclosure Controls and Procedures
Our management, with the participation of our chief executive officer and chief financial officer, evaluated the effectiveness of our disclosure controls and procedures as of December 31, 2010. The term “disclosure controls and procedures,” as defined in Rules 13a-15(e) and 15d-15(e) under the Securities Exchange Act of 1934, as amended or the Exchange Act, means controls and other procedures of a company that are designed to ensure that information required to be disclosed by a company in the reports that it files or submits under the Exchange Act is recorded, processed, summarized and reported, within the time periods specified in the SECs rules and forms. Disclosure controls and procedures include, without limitation, controls and procedures designed to ensure that information required to be disclosed by a company in the reports that it files or submits under the Exchange Act is accumulated and communicated to the company’s management, including its principal executive and principal financial officers, as appropriate to allow timely decisions regarding required disclosure. Management recognizes that any controls and procedures, no matter how well designed and operated, can provide only reasonable assurance of achieving their objectives and management necessarily applies its judgment in evaluating the cost-benefit relationship of possible controls and procedures. Based on the evaluation of our disclosure controls and procedures as of December 31, 2010, our chief executive officer and chief financial officer concluded that, as of such date, our internal control over financial reporting disclosure controls and procedures were not effective. See “Material Weaknesses” below.
83
Table of Contents
Index to Financial Statements
Changes in Internal Control over Financial Reporting, including Remediation of Certain Material Weaknesses
Management of the Company is responsible for establishing and maintaining adequate internal control over financial reporting, as such term is defined in Rule 13(a)-15(f) or Rule15d-15(f) under the Exchange Act. Internal control over financial reporting is a process to provide reasonable assurance regarding the reliability of our financial reporting for external purposes in accordance with U.S. generally accepted accounting principles. Internal control over financial reporting includes maintaining records that, in reasonable detail, accurately and fairly reflect our transactions; providing reasonable assurance that transactions are recorded as necessary for preparation of our financial statements in accordance with U.S. generally accepted accounting principles; providing reasonable assurance that receipts and expenditures of company assets are made in accordance with authorizations of the Company’s management and board of directors; and providing reasonable assurance that unauthorized acquisition, use or disposition of company assets that could have a material effect on our financial statements would be prevented or detected on a timely basis. Our management conducted an evaluation of the effectiveness of internal control over financial reporting based on the Internal Control—Integrated Framework issued by the Committee of Sponsoring Organizations of the Treadway Commission. Based on the evaluation of our internal control over financial reporting as of December 31, 2010, our chief executive officer and chief financial officer concluded that, as of such date, our internal control over financial reporting is not effective.
A material weakness is a deficiency, or a combination of deficiencies, in internal control over financial reporting, such that there is a reasonable possibility that a material misstatement of the company’s annual or interim financial statements will not be prevented or detected on a timely basis. We had identified various material weaknesses as of December 31, 2009 primarily related to internal accounting controls. We believe that many of these were attributable to our transition from a private company to a public reporting company. In connection with the preparation of our consolidated financial statements as of and for the year ended December 31, 2010 included in this Form 10-K and our assessment of the effectiveness of our disclosure controls and procedures, we have concluded that we successfully remediated the following specific control deficiencies, which represented material weaknesses in our internal control over financial reporting as of December 31, 2009:
| • | Prior to our effective remediation, we did not maintain an appropriate accounting and financial reporting organizational structure to support the activities of the Forbes Group. Specifically, we did not maintain a sufficient complement of personnel with an appropriate level of accounting knowledge, experience and training to ensure the proper selection, application and implementation of GAAP. This resulted in errors during the quarters ended March 31, 2009; June 30, 2009; September 30, 2009; which were corrected during the quarter ended December 31, 2009. |
In order to remediate the above material weakness, in 2010 we hired a consulting firm to assist with internal audits, and for assistance with various accounting matters.
| • | Prior to our effective remediation, we did not design or maintain effective controls over the recording of revenue and expenses in our Mexico operations. Specifically, effective controls were not designed and in place to ensure that revenues and expenses were recorded at the correct amounts in the appropriate period. This resulted in errors during the quarters ended March 31, 2009 and June 30, 2009, and September 30, 2009 which were corrected during the quarter ended December 31, 2009. |
In order to remediate the above material weakness, in mid-November 2009 we hired a controller with international accounting experience. The new controller hired an assistant controller in early 2010. Based on performance, in the second quarter of 2010 we terminated the new controller and promoted the assistant controller to the controller position. We also changed consultants during the second quarter of 2010. Working as a team, the new consultants and former assistant controller replaced or hired new accounting staff appropriate for our needs. The combination of promoting the assistant controller and the change to a different consulting firm, allowed us to address our material weakness in Mexico.
| • | Prior to our effective remediation, we did not design and maintain effective controls over the review of the accuracy and completeness of the income tax provision. This material weakness resulted in the Forbes Group restating its unaudited condensed consolidated financial statements issued and filed for the quarters ended June 30, 2008 and September 30, 2008. |
In order to remediate the above material weakness, in 2009 we engaged a third party to assist with tax calculations, review, and to provide assistance with complex tax matters. In 2010 we also hired a tax accountant to further supplement the work of the consultant.
84
Table of Contents
Index to Financial Statements
During the year ended December 31, 2010, management performed its assessment of internal control processes and procedures. Other than changes and remediation measures described in this section, no change in our internal control over financial reporting (as defined in Rules 13a-15(f) and 15d-15(f) under the Exchange Act) occurred during the year ended December 31, 2010 that has materially affected, or is reasonably likely to materially affect, our internal control over financial reporting.
Material Weakness
In connection with the preparation of the Forbes Group’s consolidated financial statements for the year ended December 31, 2010, we identified control deficiencies that constitute a material weakness in the design and operation of our internal control over financial reporting. The following material weakness was present at December 31, 2010.
| • | We did not design or maintain effective controls over the billing process to ensure timely recognition of revenue. Specifically, we identified field tickets, which represented completed but unbilled revenue that had not been entered resulting in a post-closing adjustment. |
This control deficiency could result in a future material misstatement to the annual or interim combined financial statements that would not be prevented or detected. Accordingly, we have determined that the above control deficiency represents a material weakness.
Remediation
As mentioned above, we have identified a material weakness that existed as of December 31, 2010 in our internal control over the billing cycle.
We have implemented, or are in the process of implementing and continue to implement, remedial measures to address the above deficiency on a going-forward basis. Specifically, we have engaged a consulting firm to document and assess the current policies and procedures related to our revenue cycle to ensure timely reporting of revenue. Once completed, the consulting firm will perform monthly tests to ensure compliance.
| Item 9B. | Other Information |
None.
| Item 10. | Directors, Executive Officers and Corporate Governance |
The information required under this item will be filed in a Form 10-K/A or definitive proxy statement within 120 days after December 31, 2010 pursuant to General Instruction G(3) of Form 10-K.
| Item 11. | Executive Compensation |
The information required under this item will be filed in a Form 10-K/A or definitive proxy statement within 120 days after December 31, 2010 pursuant to General Instruction G(3) of Form 10-K.
| Item 12. | Security Ownership of Certain Beneficial Owners and Management and Related Stockholder Matters |
The information required under this item will be filed in a Form 10-K/A or definitive proxy statement within 120 days after December 31, 2010 pursuant to General Instruction G(3) of Form 10-K.
| Item 13. | Certain Relationships and Related Transaction, and Director Independence |
The information required under this item will be filed in a Form 10-K/A or definitive proxy statement within 120 days after December 31, 2010 pursuant to General Instruction G(3) of Form 10-K.
| Item 14. | Principal Accounting Fees and Services |
The information required under this item will be filed in a Form 10-K/A or definitive proxy statement within 120 days after December 31, 2010 pursuant to General Instruction G(3) of Form 10-K.
85
Table of Contents
Index to Financial Statements
| Item 15. | Exhibits, Financial Statement Schedules |
| (a) | The following items are filed as part of this report: |
| 1. | Financial Statements. The financial statements and information required by Item 8 appear on pages 44 through 83 of this report. The Index to Consolidated Financial Statements appears on page 44. |
| 2. | Financial Statement Schedules. All schedules are omitted because they are not applicable or the required information is shown in the financial statements or the notes thereto. |
| 3. | Exhibits. |
| Number |
Description of Exhibits | |||
| 1.1 |
— | Letter Agreement dated December 1, 2009, by and among the underwriter and Forbes Energy Services Ltd. (incorporated by reference to Exhibit 1.1 to the Company’s Current Report on Form 8-K dated December 7, 2009). | ||
| 1.2 |
— | Underwriting Agreement dated December 4, 2009, by and among the underwriter and Forbes Energy Services Ltd. (incorporated by reference to Exhibit 1.2 to the Company’s Current Report on Form 8-K dated December 7, 2009). | ||
| 2.1 |
— | Agreement and Plan of Reorganization effective January 1, 2008 among Forbes Energy Services LLC and the respective members of C.C. Forbes, LLC, TX Energy Services, LLC and Superior Tubing Testers, LLC (incorporated by reference to Exhibit 2.1 to the Company’s Registration Statement on Form S-4/A filed June 27, 2008, Registration No. 333-150853). | ||
| 2.2 |
— | Agreement and Plan of Reorganization effective May 29, 2008 among Forbes Energy Services Ltd. and the members of Forbes Energy Services LLC (incorporated by reference to Exhibit 2.2 to the Company’s Registration Statement on Form S-4/A filed June 27, 2008, Registration No. 333-150853). | ||
| 3.1 |
— | Memorandum of Association of Forbes Energy Services Ltd. (incorporated by reference to Exhibit 3.11 to the Company’s Registration Statement on Form S-4/A filed June 27, 2008, Registration No. 333-150853). | ||
| 3.2 |
— | Amended and Restated Bye-laws of Forbes Energy Services Ltd. (incorporated by reference to Exhibit 3.12 to the Company’s Registration Statement on Form S-4/A filed June 27, 2008, Registration No. 333-150853). | ||
| 4.1 |
— | Indenture, dated as of February 12, 2008 among Forbes Energy Services LLC and Forbes Energy Capital Inc., as issuers, the guarantors party thereto and Wells Fargo Bank, National Association, as trustee (incorporated by reference to Exhibit 4.1 to the Company’s Annual Report on Form 10-K for the year ended December 31, 2008). | ||
| 4.2 |
— | Supplemental Indenture (First Supplemental Indenture), dated as of May 29, 2008 among Forbes Energy Services Ltd., Forbes Energy Services LLC, Forbes Energy Capital Inc., the other Guarantors (as defined in the Indenture referred to therein) and Wells Fargo Bank, National Association, as trustee (incorporated by reference to Exhibit 4.2 to the Company’s Quarterly Report on Form 10-Q for the quarter ended June 30, 2008). | ||
| 4.3 |
— | Supplemental Indenture (Second Supplemental Indenture, dated as of October 6, 2008 among Forbes Energy Services Ltd., Forbes Energy Services LLC, Forbes Energy Capital Inc., the other Guarantors (as defined in the Indenture referred to therein) and Wells Fargo Bank, National Association, as trustee (incorporated by reference to Exhibit 4.1 to the Company’s Annual Report on Form 10-K for the year ended December 31, 2008). | ||
| 4.4 |
— | Third Supplemental Indenture, dated as of February 6, 2009 among Forbes Energy Services Ltd., Forbes Energy Services LLC, Forbes Energy Capital Inc., the other Guarantors (as defined in the Indenture referred to therein) and Wells Fargo Bank, National Association, as trustee (incorporated by reference to Exhibit 4.1 to the Company’s Current Report on Form 8-K dated February 6, 2009). | ||
| 4.5 |
— | Indenture dated as of October 2, 2009, by and among Forbes Energy Services LLC and Forbes Energy Capital Inc., as issuers, the guarantors party thereto and Wilmington Trust FSB, as trustee (incorporated by reference to Exhibit 4.1 to the Company’s Current Report on Form 8-K dated October 10, 2009). | ||
| 4.6 |
— | Notation of Guarantee from Forbes Energy Services Ltd. (incorporated by reference to Exhibit 4.5 to the Company’s Annual Report on Form 10-K for the year ended December 31, 2008). | ||
| 4.7 |
— | Notation of Guarantee from Forbes Energy International, LLC (incorporated by reference to Exhibit 4.6 to the Company’s Annual Report on Form 10-K for the year ended December 31, 2008). | ||
86
Table of Contents
Index to Financial Statements
| Number |
Description of Exhibits | |||
| 4.9 |
— | Specimen 144A Global 11% Senior Secured Exchange Note due 2015 (incorporated by reference to Exhibit 4.5 to the Company’s Registration Statement on Form S-4/A filed June 27, 2008, Registration No. 333-150853). | ||
| 4.10 |
— | Rights Agreement dated as of May 19, 2008 between Forbes Energy Services Ltd. and CIBC Mellon Trust Company, as Rights Agent, which includes as Exhibit A the Certificate of Designations of Series A Junior Participating Preferred Shares, as Exhibit B the form of Right Certificate and as Exhibit C the form of Summary of Rights to Purchase Shares (incorporated by reference to Exhibit 4.8 to the Company’s Registration Statement on Form S-4/A filed June 27, 2008, Registration No. 333-150853). | ||
| 4.11 |
— | Certificate of Designation of the Series B Senior Convertible Preferred Shares (incorporated by reference to Exhibit 4.1 to the Company’s Current Report on Form 8-K filed May 28, 2010). | ||
| 4.12 |
— | Amended and Restated Certificate of Designation of the Series B Senior Convertible Preferred Shares (incorporated by reference to Exhibit 4.1 to the Company’s Current Report on Form 8-K filed January 25, 2011). | ||
| 9.1 |
— | Nominating and Voting Agreement dated as of May 29, 2008, by and among John E. Crisp, Charles C. Forbes, Jr., Janet Forbes and Forbes Energy Services Ltd. (incorporated by reference to Exhibit 9.1 to the Company’s Registration Statement on Form S-4 filed November 19, 2010, Registration No. 333-170741). | ||
| 9.2* |
— | Amended and Restated Nominating and Voting Agreement dated as of March 9, 2011, by and among John E. Crisp, Charles C. Forbes, Jr., Janet Forbes and Forbes Energy Services Ltd. | ||
| 10.1 |
— | Credit Agreement dated as of April 10, 2008 among C.C. Forbes, LLC, TX Energy Services, LLC and Superior Tubing Testers, LLC, as borrowers, Forbes Energy Services LLC, as guarantor, and Citibank, N.A., as lender, governing the Credit Facility (incorporated by reference to Exhibit 4.1 to the Company’s Annual Report on Form 10-K for the year ended December 31, 2008). | ||
| 10.2 |
— | Third Amendment to Credit Agreement dated effective as of July 10, 2009 among C.C. Forbes, LLC, TX Energy Services, LLC and Superior Tubing Testers, LLC, as borrowers, Forbes Energy Services LLC, as guarantor, and Citibank, N.A., as lender (incorporated by reference to Exhibit 10.1 to the Company’s Current Report on Form 8-K filed July 15, 2009). | ||
| 10.3 |
— | Guaranty dated April 10, 2008, among Forbes Energy Services LLC and Forbes Energy Capital Inc., including the Guaranty Supplement, dated effective May 29, 2008, executed January 5, 2009, among Forbes Energy Services Ltd. and Citibank, N.A. (incorporated by reference to Exhibit 10.1 to the Company’s Current Report on Form 8-K dated January 8, 2009). | ||
| 10.4 |
— | Forbes Energy Services Ltd. Incentive Compensation Plan effective May 19, 2008 (incorporated by reference to Exhibit 10.1 to the Company’s Registration Statement on Form S-4/A filed June 27, 2008, Registration No. 333-150853). | ||
| 10.5 |
— | Employment Agreement effective May 1, 2008 by and between John E. Crisp and Forbes Energy Services LLC (incorporated by reference to Exhibit 10.2 to the Company’s Registration Statement on Form S-4/A filed June 27, 2008, Registration No. 333-150853). | ||
| 10.6 |
— | Employment Agreement effective May 1, 2008 by and between Charles C. Forbes and Forbes Energy Services LLC (incorporated by reference to Exhibit 10.3 to the Company’s Registration Statement on Form S-4/A filed June 27, 2008, Registration No. 333-150853). | ||
| 10.7 |
— | Employment Agreement effective May 1, 2008 by and between L. Melvin Cooper and Forbes Energy Services LLC (incorporated by reference to Exhibit 10.4 to the Company’s Registration Statement on Form S-4/A filed June 27, 2008, Registration No. 333-150853). | ||
| 10.8 |
— | Form of Indemnification Agreement for directors, officers and key employees (incorporated by reference to Exhibit 10.5 to the Company’s Registration Statement on Form S-4/A filed June 27, 2008, Registration No. 333-150853). | ||
| 10.9 |
— | Form of Executive Non-Qualified Stock Option Agreement (incorporated by reference to Exhibit 10.6 to the Company’s Registration Statement on Form S-4/A filed June 27, 2008, Registration No. 333-150853). | ||
| 10.10 |
— | Form of Director Non-Qualified Stock Option Agreement (incorporated by reference to Exhibit 10.7 to the Company’s Registration Statement on Form S-4/A filed June 27, 2008, Registration No. 333-150853). | ||
| 10.11 |
— | Commercial Equipment Lease Agreement, dated October 15, 2008 among Forbes Energy Services LLC and Alice Environmental Services, LP. (incorporated by reference to Exhibit 10.1 to the Company’s Quarterly Report on Form 10-Q for the quarter ended September 30, 2008). | ||
87
Table of Contents
Index to Financial Statements
| Number |
Description of Exhibits | |||
| 10.12 |
— | Notes Purchase Agreement dated September 25, 2009, by and among Forbes Energy Services LLC, Forbes Energy Capital Inc., C.C. Forbes, LLC, TX Energy Services, Superior Tubing Testers, LLC, Forbes Energy International, LLC, Forbes Energy Services Ltd. and Goldman, Sachs & Co. (incorporated by reference to Exhibit 10.1 to the Company’s Current Report on Form 8-K dated September 28, 2009). | ||
| 10.13 |
— | Translation of Unit Price Public Works Contract No. 424048860 dated September 26, 2008, including Agreement No. 1 Inclusion of Project and New Concepts with Additional Increase of Contract Amount 424048860 dated December 4, 2009, entered into by and between PEMEX Exploración y Producción, Merco Ingenieria Industrial S.A. de C.V. and Forbes Energy Services Ltd. (incorporated by reference to the Company’s Quarterly Report on 10-Q for the quarter ended March 31, 2010). | ||
| 10.14* |
— | Translation of Additional Agreement No. 4 for Extension of Term dated as of December 31, 2010, entered into by and between PEMEX Exploración y Producción, Merco Ingenieria Industrial S.A. de C.V. and Forbes Energy Services Ltd. | ||
| 10.15* |
— | Translation of Additional Agreement No. 5 for Extension of Term dated as of December 31, 2010, signed on March 24, 2011, entered into by and between PEMEX Exploración y Producción, Merco Ingenieria Industrial S.A. de C.V. and Forbes Energy Services Ltd. | ||
| 10.16 |
— | Subscription Agreement dated as of May 17, 2010, by and among Forbes Energy Services Ltd., West Face Long Term Opportunities Limited Partnership, West Face Long Term Opportunities (USA) Limited Partnership and West Face Long Term Opportunities Master Fund L.P, including the Form of Certificate of Designation of Series B Senior Convertible Preferred Shares and Form of Registration Rights Agreement attached as exhibits thereto (incorporated by reference to Exhibit 10.14 to the Company’s Quarterly Report on Form 10-Q for the quarter ended March 31, 2010). | ||
| 10.17 |
— | Registration Rights Agreement dated as of May 28, 2010 between Forbes Energy Services Ltd. and the Shareholders listed therein (incorporated by reference to Exhibit 10.1 to the Company’s Current Report on Form 8-K filed May 28, 2010). | ||
| 16.1 |
— | Letter from PricewaterhouseCoopers, LLP to the Securities and Exchange Commission dated June 26, 2009 (incorporated by reference to Exhibit 16.1 to the Company’s Current Report on Form 8-K dated June 26, 2009). | ||
| 21.1* |
— | Subsidiaries of Forbes Energy Services Ltd. | ||
| 31.1* |
— | Certification of Chief Executive Officer pursuant to Rule 13a-14(a)/15d-14(a). | ||
| 31.2* |
— | Certification of Chief Financial Officer pursuant to Rule 13a-14(a)/15d-14(a). | ||
| 32.1* |
— | Certification of Chief Executive Officer Pursuant to Section 18 U.S.C. Section 1350, as Adopted Pursuant to Section 906 of the Sarbanes-Oxley Act of 2002. | ||
| 32.2* |
— | Certification of Chief Financial Officer Pursuant to Section 18 U.S.C. Section 1350, as Adopted Pursuant to Section 906 of the Sarbanes-Oxley Act of 2002. | ||
| * | Filed herewith. |
88
Table of Contents
Index to Financial Statements
SIGNATURES
Pursuant to the requirements of Section 13 or 15(d) of the Securities Exchange Act of 1934, as amended, the registrant has duly caused this report to be signed on its behalf by the undersigned, thereunto duly authorized, in the City of Alice, the State of Texas, on March 29, 2010.
| FORBES ENERGY SERVICES LTD. | ||
| By: | /S/ JOHN E. CRISP | |
| John E. Crisp | ||
| President and Chief Executive Officer | ||
Pursuant to the requirements of the Securities Exchange Act of 1934, as amended, this report has been signed by the following persons on behalf of the registrant and in the capacities and on the dates indicated.
| Signature |
Title |
Date | ||
| /S/ JOHN E. CRISP (John E. Crisp) |
Chairman of the Board, President, Chief Executive Officer and Director (Principal Executive Officer) | March 29, 2011 | ||
| /S/ L. MELVIN COOPER (L. Melvin Cooper) |
Senior Vice President, Chief Financial Officer and Secretary (Principal Financial and Accounting Officer) | March 29, 2011 | ||
| /S/ CHARLES C. FORBES (Charles C. Forbes) |
Director | March 29, 2011 | ||
| /S/ DALE BOSSERT (Dale Bossert) |
Director | March 29, 2011 | ||
| /S/ TRAVIS H. BURRIS (Travis H. Burris) |
Director | March 29, 2011 | ||
| /S/ JANET L. FORBES (Janet L. Forbes) |
Director | March 29, 2011 | ||
| /S/ WILLIAM W. SHERRILL (William W. Sherrill) |
Director | March 29, 2011 | ||
89
Table of Contents
Index to Financial Statements
EXHIBIT INDEX
| Number |
Description of Exhibits | |||
| 1.1 |
— | Letter Agreement dated December 1, 2009, by and among the underwriter and Forbes Energy Services Ltd. (incorporated by reference to Exhibit 1.1 to the Company’s Current Report on Form 8-K dated December 7, 2009). | ||
| 1.2 |
— | Underwriting Agreement dated December 4, 2009, by and among the underwriter and Forbes Energy Services Ltd. (incorporated by reference to Exhibit 1.2 to the Company’s Current Report on Form 8-K dated December 7, 2009). | ||
| 2.1 |
— | Agreement and Plan of Reorganization effective January 1, 2008 among Forbes Energy Services LLC and the respective members of C.C. Forbes, LLC, TX Energy Services, LLC and Superior Tubing Testers, LLC (incorporated by reference to Exhibit 2.1 to the Company’s Registration Statements on Form S-4/A filed June 27, 2008, Registration No. 333-150853). | ||
| 2.2 |
— | Agreement and Plan of Reorganization effective May 29, 2008 among Forbes Energy Services Ltd. and the members of Forbes Energy Services LLC (incorporated by reference to Exhibit 2.2 to the Company’s Registration Statements on Form S-4/A filed June 27, 2008, Registration No. 333-150853). | ||
| 3.1 |
— | Memorandum of Association of Forbes Energy Services Ltd. (incorporated by reference to Exhibit 3.11 to the Company’s Registration Statements on Form S-4/A filed June 27, 2008, Registration No. 333-150853). | ||
| 3.2 |
— | Amended and Restated Bye-laws of Forbes Energy Services Ltd. (incorporated by reference to Exhibit 3.12 to the Company’s Registration Statements on Form S-4/A filed June 27, 2008, Registration No. 333-150853). | ||
| 4.1 |
— | Indenture, dated as of February 12, 2008 among Forbes Energy Services LLC and Forbes Energy Capital Inc., as issuers, the guarantors party thereto and Wells Fargo Bank, National Association, as trustee (incorporated by reference to Exhibit 4.1 to the Company’s Annual Report on Form 10-K for the year ended December 31, 2008). | ||
| 4.2 |
— | Supplemental Indenture (First Supplemental Indenture), dated as of May 29, 2008 among Forbes Energy Services Ltd., Forbes Energy Services LLC, Forbes Energy Capital Inc., the other Guarantors (as defined in the Indenture referred to therein) and Wells Fargo Bank, National Association, as trustee (incorporated by reference to Exhibit 4.2 to the Company’s Quarterly Report on Form 10-Q for the quarter ended June 30, 2008). | ||
| 4.3 |
— | Supplemental Indenture (Second Supplemental Indenture, dated as of October 6, 2008 among Forbes Energy Services Ltd., Forbes Energy Services LLC, Forbes Energy Capital Inc., the other Guarantors (as defined in the Indenture referred to therein) and Wells Fargo Bank, National Association, as trustee (incorporated by reference to Exhibit 4.1 to the Company’s Annual Report on Form 10-K for the year ended December 31, 2008). | ||
| 4.4 |
— | Third Supplemental Indenture, dated as of February 6, 2009 among Forbes Energy Services Ltd., Forbes Energy Services LLC, Forbes Energy Capital Inc., the other Guarantors (as defined in the Indenture referred to therein) and Wells Fargo Bank, National Association, as trustee (incorporated by reference to Exhibit 4.1 to the Company’s Current Report on Form 8-K dated February 6, 2009). | ||
| 4.5 |
— | Indenture dated as of October 2, 2009, by and among Forbes Energy Services LLC and Forbes Energy Capital Inc., as issuers, the guarantors party thereto and Wilmington Trust FSB, as trustee (incorporated by reference to Exhibit 4.1 to the Company’s Current Report on Form 8-K dated October 10, 2009). | ||
| 4.6 |
— | Notation of Guarantee from Forbes Energy Services Ltd. (incorporated by reference to Exhibit 4.5 to the Company’s Annual Report on Form 10-K for the year ended December 31, 2008). | ||
| 4.7 |
— | Notation of Guarantee from Forbes Energy International, LLC (incorporated by reference to Exhibit 4.6 to the Company’s Annual Report on Form 10-K for the year ended December 31, 2008). | ||
| 4.8 |
— | Guaranty dated as of April 10, 2008, among Forbes Energy Services LLC, Forbes Energy Capital, Inc. and Citibank, N.A., including Guaranty Supplement, dated effective May 29, 2008, executed January 5, 2009, among Forbes Energy Services Ltd. and Citibank, N.A. (incorporated by reference to Exhibit 10.1 to the Company’s Current Report on Form 8-K filed January 8, 2009). | ||
| 4.9 |
— | Specimen 144A Global 11% Senior Secured Exchange Note due 2015 (incorporated by reference to Exhibit 4.5 to the Company’s Registration Statement on Form S-4/A filed June 27, 2008, Registration No. 333-150853). | ||
| 4.10 |
— | Rights Agreement dated as of May 19, 2008 between Forbes Energy Services Ltd. and CIBC Mellon Trust Company, as Rights Agent, which includes as Exhibit A the Certificate of Designations of Series A Junior Participating Preferred Shares, as Exhibit B the form of Right Certificate and as Exhibit C the form of Summary of Rights to Purchase Shares (incorporated by reference to Exhibit 4.8 to the Company’s Registration Statement on Form S-4/A filed June 27, 2008, Registration No. 333-150853). | ||
| 4.11 |
— | Certificate of Designation of the Series B Senior Convertible Preferred Shares (incorporated by reference to Exhibit 4.1 to the Company’s Current Report on Form 8-K filed May 28, 2010). | ||
| 4.12 |
— | Amended and Restated Certificate of Designation of the Series B Senior Convertible Preferred Shares (incorporated by reference to Exhibit 4.1 to the Company’s Current Report on Form 8-K filed January 25, 2011). | ||
| 9.1 |
— | Nominating and Voting Agreement dated as of May 29, 2008, by and among John E. Crisp, Charles C. Forbes, Jr., Janet Forbes and Forbes Energy Services Ltd. (incorporated by reference to Exhibit 9.1 to the Company’s Registration Statement on Form S-4 filed November 19, 2010, Registration No. 333-170741). | ||
| 9.2* |
— | Amended and Restated Nominating and Voting Agreement dated as of March 9, 2011, by and among John E. Crisp, Charles C. Forbes, Jr., Janet Forbes and Forbes Energy Services Ltd. | ||
90
Table of Contents
Index to Financial Statements
| Number |
Description of Exhibits | |||
| 10.1 | — | Credit Agreement dated as of April 10, 2008 among C.C. Forbes, LLC, TX Energy Services, LLC and Superior Tubing Testers, LLC, as borrowers, Forbes Energy Services LLC, as guarantor, and Citibank, N.A., as lender, governing the Credit Facility (incorporated by reference to Exhibit 4.1 to the Company’s Annual Report on Form 10-K for the year ended December 31, 2008). | ||
| 10.2 | — | Third Amendment to Credit Agreement dated effective as of July 10, 2009 among C.C. Forbes, LLC, TX Energy Services, LLC and Superior Tubing Testers, LLC, as borrowers, Forbes Energy Services LLC, as guarantor, and Citibank, N.A., as lender (incorporated by reference to Exhibit 10.1 to the Company’s Current Report on Form 8-K filed July 15, 2009). | ||
| 10.3 | — | Guaranty dated April 10, 2008, among Forbes Energy Services LLC and Forbes Energy Capital Inc., including the Guaranty Supplement, dated effective May 29, 2008, executed January 5, 2009, among Forbes Energy Services Ltd. and Citibank, N.A. (incorporated by reference to Exhibit 10.1 to the Company’s Current Report on Form 8-K filed January 8, 2009). | ||
| 10.4 | — | Forbes Energy Services Ltd. Incentive Compensation Plan effective May 19, 2008 (incorporated by reference to Exhibit 10.1 to the Company’s Registration Statement on Form S-4/A filed June 27, 2008, Registration No. 333-150853). | ||
| 10.5 | — | Employment Agreement effective May 1, 2008 by and between John E. Crisp and Forbes Energy Services LLC (incorporated by reference to Exhibit 10.2 to the Company’s Registration Statement on Form S-4/A filed June 27, 2008, Registration No. 333-150853). | ||
| 10.6 | — | Employment Agreement effective May 1, 2008 by and between Charles C. Forbes and Forbes Energy Services LLC (incorporated by reference to Exhibit 10.3 to the Company’s Registration Statement on Form S-4/A filed June 27, 2008, Registration No. 333-150853). | ||
| 10.7 | — | Employment Agreement effective May 1, 2008 by and between L. Melvin Cooper and Forbes Energy Services LLC (incorporated by reference to Exhibit 10.4 to the Company’s Registration Statement on Form S-4/A filed June 27, 2008, Registration No. 333-150853). | ||
| 10.8 | — | Form of Indemnification Agreement for directors, officers and key employees (incorporated by reference to Exhibit 10.5 to the Company’s Registration Statement on Form S-4/A filed June 27, 2008, Registration No. 333-150853). | ||
| 10.9 | — | Form of Executive Non-Qualified Stock Option Agreement (incorporated by reference to Exhibit 10.6 to the Company’s Registration Statement on Form S-4/A filed June 27, 2008, Registration No. 333-150853). | ||
| 10.10 | — | Form of Director Non-Qualified Stock Option Agreement (incorporated by reference to Exhibit 10.7 to the Company’s Registration Statement on Form S-4/A filed June 27, 2008, Registration No. 333-150853). | ||
| 10.11 | — | Commercial Equipment Lease Agreement, dated October 15, 2008 among Forbes Energy Services LLC and Alice Environmental Services, LP. (incorporated by reference to Exhibit 10.1 to the Company’s Quarterly Report on Form 10-Q for the quarter ended September 30, 2008). | ||
| 10.12 | — | Notes Purchase Agreement dated September 25, 2009, by and among Forbes Energy Services LLC, Forbes Energy Capital Inc., C.C. Forbes, LLC, TX Energy Services, Superior Tubing Testers, LLC, Forbes Energy International, LLC, Forbes Energy Services Ltd. and Goldman, Sachs & Co. (incorporated by reference to Exhibit 10.1 to the Company’s Current Report on Form 8-K dated September 28, 2009). | ||
| 10.13 | — | Translation of Unit Price Public Works Contract No. 424048860 dated September 26, 2008, including Agreement No. 1 Inclusion of Project and New Concepts with Additional Increase of Contract Amount 424048860 dated December 4, 2009, entered into by and between PEMEX Exploración y Producción, Merco Ingenieria Industrial S.A. de C.V. and Forbes Energy Services Ltd. (incorporated by reference to the Company’s Quarterly Report on Form 10-Q for the quarter ended March 31, 2010). | ||
| 10.14* | — | Translation of Additional Agreement No. 4 for Extension of Term dated as of December 31, 2010, entered into by and between PEMEX Exploración y Producción, Merco Ingenieria Industrial S.A. de C.V. and Forbes Energy Services Ltd. | ||
| 10.15* | — | Translation of Additional Agreement No. 5 for Extension of Term dated as of December 31, 2010, signed on March 24, 2011, entered into by and between PEMEX Exploración y Producción, Merco Ingenieria Industrial S.A. de C.V. and Forbes Energy Services Ltd. | ||
| 10.16 | — | Subscription Agreement dated as of May 17, 2010, by and among Forbes Energy Services Ltd., West Face Long Term Opportunities Limited Partnership, West Face Long Term Opportunities (USA) Limited Partnership and West Face Long Term Opportunities Master Fund L.P, including the Form of Certificate of Designation of Series B Senior Convertible Preferred Shares and Form of Registration Rights Agreement attached as exhibits thereto (incorporated by reference to the Company’s Quarterly Report on Form 10-Q for the quarter ended March 31, 2010). | ||
| 10.17 | — | Registration Rights Agreement dated as of May 28, 2010 between Forbes Energy Services Ltd. and the Shareholders listed therein (incorporated by reference to Exhibit 10.1 to the Company’s Current Report on Form 8-K filed May 28, 2010). | ||
| 16.1 | — | Letter from PricewaterhouseCoopers, LLP to the Securities and Exchange Commission dated June 26, 2009 (incorporated by reference to Exhibit 16.1 to the company’s Current Report on Form 8-K dated June 26, 2009). | ||
| 21.1* | — | Subsidiaries of Forbes Energy Services Ltd. | ||
91
Table of Contents
Index to Financial Statements
| Number |
Description of Exhibits | |||
| 31.1* | — | Certification of Chief Executive Officer pursuant to Rule 13a-14(a)/15d-14(a). | ||
| 31.2* | — | Certification of Chief Financial Officer pursuant to Rule 13a-14(a)/15d-14(a). | ||
| 32.1* | — | Certification of Chief Executive Officer Pursuant to Section 18 U.S.C. Section 1350, as Adopted Pursuant to Section 906 of the Sarbanes-Oxley Act of 2002. | ||
| 32.2* | — | Certification of Chief Financial Officer Pursuant to Section 18 U.S.C. Section 1350, as Adopted Pursuant to Section 906 of the Sarbanes-Oxley Act of 2002. | ||
| * | Filed herewith. |
92