Attached files
UNITED STATES
SECURITIES AND EXCHANGE COMMISSION
Washington, D.C. 20549
FORM 10-K
x ANNUAL REPORT PURSUANT TO SECTION 13 OR 15(d) OF THE SECURITIES EXCHANGE ACT OF 1934
For the fiscal year ended December 31, 2010
or
¨ TRANSITION REPORT PURSUANT TO SECTION 13 OR 15(d) OF THE SECURITIES EXCHANGE ACT OF 1934
For the transition period from to
Commission file No. 333-136559
EXOPACK HOLDING CORP.
(Exact name of registrant as specified in its charter)
|
|
|
|
Delaware |
76-0678893 |
|
(State or other jurisdiction of incorporation or organization) |
(I.R.S. Employer Identification No.) |
|
|
|
|
3070 Southport Road, Spartanburg, SC |
29302 |
|
(Address of principal executive offices) |
(Zip Code) |
Registrant’s telephone number, including area code: (864) 596-7140
Securities registered pursuant to Section 12(b) of the Act: None
Securities registered pursuant to Section 12(g) of the Act: None
Indicate by check mark if the registrant is a well-known seasoned issuer, as defined in Rule 405 of the Securities Act.
Yes ¨ No x
Indicate by check mark if the registrant is not required to file reports pursuant to Section 13 or Section 15(d) of the Act.
Yes ¨ No x
Indicate by check mark whether the registrant (1) has filed all reports required to be filed by Section 13 or 15(d) of the Securities Exchange Act of 1934 during the preceding 12 months (or for such shorter period that the registrant was required to file such reports) and (2) has been subject to such filing requirements for the past 90 days.
Yes x No ¨
Indicate by check mark whether the registrant has submitted electronically and posted on its corporate Web site, if any, every Interactive Data File required to be submitted and posted pursuant to Rule 405 of Regulation S-T during the preceding 12 months (or for such shorter period that the registrant was required to submit and post such files).
Yes ¨ No ¨ (Not yet applicable to registrant)
Indicate by check mark if disclosure of delinquent filers pursuant to Item 405 of Regulation S-K is not contained herein, and will not be contained, to the best of registrant’s knowledge, in definitive proxy or information statements incorporated by reference in Part III of this Form 10-K or any amendment to this Form 10-K. ¨
Indicate by check mark whether the registrant is a large accelerated filer, an accelerated filer, a non-accelerated filer or a smaller reporting company. See definitions of “large accelerated filer,” “accelerated filer” and “smaller reporting company” in Rule 12b-2 of the Exchange Act. (check one):
Large accelerated filer ¨ Accelerated filer ¨ Non-accelerated filer x Smaller reporting company ¨
(Do not check if a smaller reporting company)
Indicate by check mark whether the registrant is a shell company (as defined in Rule 12b-2 of the Exchange Act).
Yes ¨ No x
The aggregate market value of the voting and non-voting common equity held by non-affiliates is zero. The registrant is a privately held corporation.
As of March 30, 2011, one share of the registrant’s common stock was outstanding.
EXOPACK HOLDING CORP.
TABLE OF CONTENTS
FORM 10-K
PART I
|
|
|
|
|
|
|
Page
|
|
Item 1 |
Business |
1 |
|
Item 1A |
Risk Factors |
13 |
|
Item 1B |
Unresolved Staff Comments |
20 |
|
Item 2 |
Properties |
20 |
|
Item 3 |
Legal Proceedings |
20 |
|
| ||
|
PART II | ||
|
|
|
|
|
Item 5 |
Market for the Registrant’s Common Equity, Related Stockholder Matters and Issuer Purchases of Equity Securities |
21 |
|
Item 6 |
Selected Financial Data |
21 |
|
Item 7 |
Management’s Discussion and Analysis of Financial Condition and Results of Operations |
23 |
|
Item 7A |
Quantitative and Qualitative Disclosures about Market Risk |
35 |
|
Item 8 |
Financial Statements and Supplementary Data |
35 |
|
Item 9 |
Changes in and Disagreements with Accountants on Accounting and Financial Disclosure |
35 |
|
Item 9A |
Controls and Procedures |
35 |
|
Item 9B |
Other Information |
36 |
|
|
|
|
|
|
|
|
|
| ||
|
PART III | ||
|
|
|
|
|
Item 10 |
Directors, Executive Officers and Corporate Governance |
36 |
|
Item 11 |
Executive Compensation |
38 |
|
Item 12 |
Security Ownership of Certain Beneficial Owners and Management and Related Stockholder Matters |
50 |
|
Item 13 |
Certain Relationships and Related Transactions, and Director Independence |
50 |
|
Item 14 |
Principal Accountant Fees and Services |
51 |
|
| ||
|
PART IV | ||
|
|
|
|
|
Item 15 |
Exhibits and Financial Statement Schedules |
F-1 |
i
CAUTIONARY NOTE REGARDING FORWARD-LOOKING STATEMENTS
This annual report on Form 10-K of Exopack Holding Corp. (the “Company”) for the fiscal year ended December 31, 2010, including the “Management’s Discussion and Analysis of Financial Condition and Results of Operation” section in Item 7 of this annual report, contains forward-looking statements within the meaning of the Private Securities Litigation Reform Act of 1995. These statements include, but are not limited to, any statement that may predict, forecast, indicate or imply future results, performance, achievements or events. These forward-looking statements address matters that involve risks and uncertainties. Accordingly, there are or will be important factors that could cause our actual results to differ materially from those indicated in these statements. We believe that these factors include but are not limited to the following: intense competition in the flexible packaging markets; the price and availability of polyethylene resin and paper and our ability to pass those prices on to our customers; global economic factors including risks associated with a recession and our customers’ access to credit; our customers’ inability to satisfy their obligations to us; financial difficulties experienced by our vendors, suppliers and other business partners; increases in our pension costs resulting from equity market fluctuations; increases in energy prices; our ability to adapt to technological advances in the packaging industry; our ability to protect our proprietary technology from infringement; environmental costs and liabilities; our ability to obtain funding, if needed, in light of the deterioration of the capital and credit markets; risks relating to our international operations; problems in our labor relations; a loss of transportation providers or increases in fuel prices; equipment failures; the control of our Company by an affiliate of Sun Capital Partners, Inc.; our ability to comply with Section 404 of the Sarbanes-Oxley Act; a loss of key individuals involved in our Company; changes in interest rates; our substantial indebtedness and our ability to incur additional indebtedness; our ability to generate cash to service our indebtedness; restrictions in the indenture governing our outstanding notes; our ability to successfully complete, integrate, transition the business and realize expected cost savings for acquisitions; and various factors that we cannot control.
You can identify these and other forward-looking statements by the use of words such as “may,” “will,” “could,” “would,” “should,” “expects,” “plans,” “anticipates,” “estimates,” “intends,” “potential,” “projected,” “continue,” or the negative of such terms, or other comparable terminology. Forward-looking statements also include the assumptions underlying or relating to any of the foregoing statements.
These statements are based on current expectations and assumptions regarding future events and business performance and involve known and unknown risks, uncertainties and other factors that may cause industry trends or our actual results, level of activity, performance or achievements to be materially different from any future results, levels of activity, performance or achievements expressed or implied by these statements. These factors include those set forth in the following discussion and within “Part I. Item 1A. Risk Factors” of this annual report and elsewhere within this annual report.
Although we believe that expectations reflected in the forward-looking statements are reasonable, we cannot guarantee future results, levels of activity, performance or achievements. We do not assume and will not assume any obligation to update any of the forward-looking statements after the date of this annual report to conform these statements to actual results or changes in our expectations, except as required by law. You should not place undue reliance on these forward-looking statements, which apply only as of the date of this annual report. You should carefully review the risk factors described in other documents that we file from time to time with the U.S. Securities and Exchange Commission (the “SEC”).
ii
PART I
ITEM 1. BUSINESS
This annual report contains certain information about our Company. You should read the annual report carefully, including Item 1A entitled “Risk Factors” and our consolidated financial statements, included as Item 8, together with the accompanying notes. Except as otherwise indicated, references to “we,” “our,” “us,” and “our Company” refer to Exopack Holding Corp. and our subsidiaries.
Our Company
We are a provider of flexible packaging, film products, and specialty substrates based in North America and Europe. We design, manufacture and supply plastic and paper based flexible packaging, film products and precision coated substrates to approximately 1,200 customers in a variety of industries, including the food, medical, pet food, chemicals, beverages, personal care and hygiene, lawn and garden and building materials industries, among others. We have 19 manufacturing facilities in the United States, Canada and the United Kingdom. We provide packaging and films products for many of the world’s most well-known brands. Our primary strategy is to use a technologically advanced manufacturing platform coupled with excellent customer service in order to help our customers distinguish their brands and improve product shelf life.
The many products that we produce can be divided into four separate segments: (i) pet food and specialty packaging, (ii) consumer food and specialty packaging, (iii) performance packaging and (iv) coated products. Typically, customers decide whether to use paper or plastic packaging on the basis of end-use application, presentation considerations and the demands of particular filling processes. Such decisions may also be influenced by the relative importance of package size, sealability, shelf-appeal, durability, functionality and printability. Our pet food and specialty packaging segment produces products used in applications such as pet food, lawn and garden, charcoal, and popcorn packaging. The consumer food and specialty packaging segment produces products used in applications such as fresh meat, natural cheese and dairy products, beverage, frozen foods, confectionary, breakfast foods, personal care and unprinted films. The performance packaging segment produces products used in applications such as building materials, chemicals, agricultural products and food ingredient packaging. The coated products segment produces precision coated films, foils, fabrics and other substrates for imaging, electronics, medical and optical technologies.
Our History
Transactions Relating to Our Formation
A predecessor company with our same name was formed as a Delaware corporation on July 27, 2001 for the purpose of acquiring substantially all of the assets and assuming certain liabilities of the flexible packaging division of International Paper Company. This acquisition was completed on August 7, 2001. On September 30, 2003, the predecessor company, Exopack Holding Corp., purchased all of the assets and assumed certain liabilities of Plassein International of Thomasville, Inc. and Plassein International of Newmarket, Inc.
Cello-Foil Products, Inc. (“Cello-Foil”) was founded in 1949 as a privately-held, family-owned company headquartered in Battle Creek, Michigan. Cello-Foil began as a printing company and, through the years, developed expertise in flexible packaging manufacturing, laminating and printing. In 1990, Cello-Foil expanded its production capacity and built a second plant in Albany, Georgia. Cello-Foil’s relationship with our Company is discussed below.
The Packaging Group (“TPG”) was founded in Canada in 1990. Between 1990 and 2003, TPG grew through the acquisition of several companies in the flexible packaging industry, including PackageMasters and Plicon Canada (subsequently renamed Condor Co-Extrusions), Barrier Packaging, Inc., Golden State Equipment and Alcoa U.S. In 2005, after experiencing financial difficulties, TPG was placed under receivership in Canada. TPG’s relationship with our Company is discussed below.
Between July and October of 2005, Sun Capital Partners, Inc. (“Sun Capital”), through an affiliate, sponsored a series of transactions involving Cello-Foil, TPG and Exopack, LLC (“Exopack”) that resulted in the ultimate formation of our Company. Specifically, Cello-Foil Holding Corp., an affiliate of Sun Capital, acquired Cello-Foil and certain assets of TPG on July 14, 2005 and September 7, 2005, respectively. On October 13, 2005, in accordance with the terms of a merger agreement entered into on October 5, 2005, an affiliate of Sun Capital acquired Exopack, which became our wholly-owned subsidiary. Concurrently with our acquisition of Exopack, Cello-Foil Holding Corp. became our wholly-owned subsidiary, and we refinanced the then outstanding indebtedness of Exopack, Cello-Foil and TPG. We refer to our acquisitions of Exopack, Cello-Foil and TPG as the “Consolidation.” The net cost of the Consolidation and related transactions, including the refinancing of Exopack, Cello-Foil and TPG debt and the payment of related fees, commissions and expenses, was $312.6 million, net of cash acquired.
1
2007 Acquisitions
During 2007, we completed two acquisitions, as described below and referred to in this annual report as the “2007 Acquisitions.” On August 6, 2007, we acquired 100% of the membership interests of Intelicoat Technologies Image Products Matthews, LLC and 100% of the outstanding shares of its affiliate, Intelicoat Technologies EF Holdco, Ltd. (collectively, the “Electronic and Engineered Films Business,” or “EEF”), and also acquired certain assets and assumed certain liabilities of other EEF entities (the “EEF Acquisition”). We financed the EEF Acquisition primarily through borrowings under our senior revolving credit facility (referred to in this annual report as our “Senior Credit Facility” and further described in Note 4 to our consolidated financial statements included elsewhere in this annual report). EEF, through its parent companies prior to the EEF Acquisition, was previously controlled by an affiliate of Sun Capital.
We subsequently renamed the acquired EEF business Exopack Advanced Coatings (“EAC”). EAC is engaged in researching, developing, manufacturing, distributing, marketing, and selling precision coated films and specialty substrates for imaging, electronics, medical and optical technologies. EAC conducts its operations from our locations in the state of North Carolina and in North Wales, United Kingdom.
On November 28, 2007, we acquired certain assets and assumed certain liabilities of DuPont Liquid Packaging System’s performance films business segment (“Liqui-Box”), including its Whitby, Ontario, Canada operating facility (the “EPF Acquisition”). There was no material relationship between our Company and Liqui-Box prior to the commencement of matters relating to the EPF Acquisition.
We subsequently renamed the acquired Liqui-Box business Exopack Performance Films (“EPF”). EPF is engaged in researching, developing, manufacturing, distributing, marketing, and selling value-added films used primarily in the food and industrial markets.
2010 Acquisition
On July 13, 2010, we completed the acquisition of certain assets and liabilities of a packaging business previously operated by Bemis Company, Inc. The acquired business, which is referred to in this report as Exopack Meat, Cheese and Specialty (“EMCS”) involves the manufacture and sale of certain packaging products primarily in the United States and Canada, including flexible-packaging rollstock used for chunk, sliced and shredded natural cheeses packaged for retail sale and flexible-packaging shrink bags used for fresh meat. EMCS is included within our consumer food and specialty packaging segment (see Note 11 to our consolidated financial statements included elsewhere in this annual report). The acquisition of EMCS provided us with a leading market position in the flexible packaging market for meat and cheese and expanded our technology base and product offerings in the consumer food and specialty packaging segment.
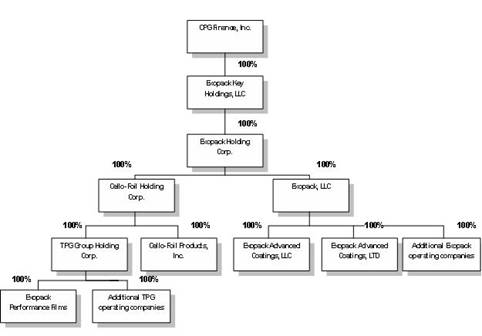
Our Corporate Structure
CPG Finance, Inc. is a subsidiary of an affiliate of Sun Capital. Exopack Key Holdings, LLC is a wholly-owned subsidiary of CPG Finance, Inc., and is the parent company of Exopack Holding Corp. Exopack Holding Corp. is a holding company that conducts substantially all of its operations through Exopack, LLC, Cello-Foil Holding Corp. and their respective subsidiaries. The current ownership structure of our parent companies and subsidiaries is set forth in the diagram below.
2
Sun Capital
We and our parent companies are controlled by an affiliate of Sun Capital. Sun Capital is a private investment firm focused on leveraged buyouts, equity, debt and other investments in market-leading companies that can benefit from Sun Capital’s in-house operating professionals and experience. Affiliates of Sun Capital have invested in and managed more than 250 companies worldwide with consolidated annual sales in excess of $40.0 billion since Sun Capital’s inception in 1995. Sun Capital has offices in Boca Raton, Los Angeles and New York and affiliates with offices in Frankfurt, London, Luxembourg, Paris, Shanghai and Shenzhen, China, focused on identifying opportunities that will provide operating synergies for Sun Capital’s affiliated portfolio companies.
Our Strategy
We have developed a business strategy targeted at increasing future revenue, earnings and cash flow performance. The key components of this strategy are:
Leveraging Our Customer Relationships. We enjoy long-standing relationships with many of our customers. One of our top priorities has been to integrate our product offerings into our customers’ operations by providing high quality, cost-effective products that are tailored to our customers’ specific needs. We seek to offer enhanced service and support, anticipating customer needs and providing value-added solutions to customer problems. We have undertaken joint product development efforts with many of our customers, allowing us to manage our research and development expenditures and increase incentives for customers to remain loyal to us over the long term.
The Consolidation and subsequent acquisitions have provided us with additional opportunities to cross-sell our products to our customer base. We offer our diverse array of paper and plastic packaging products, including multi-wall bags, printed and laminated roll stock, stand-up pouches and coated films, in the following end markets, among others:
• Food
• Medical
• Pet Food
• Personal Care and Hygiene
• Chemicals
• Beverages
• Cheese and Dairy
• Fresh Meat
• Lawn & Garden Products
• Building Materials
• Electronics
3
Efficiently Managing Our Raw Material Supply. We have multiple supply sources for paper, plastics and films and have maintained the majority of those relationships for over a decade. As one of the largest flexible packaging converters in the United States, we believe we are often able to use our increased size to secure volume pricing from our suppliers and expand our procurement reach.
We are currently focusing on efficiently managing the costs of raw materials, packaging and freight. To further these objectives, we are working to develop highly efficient procurement functions and innovative approaches to raw materials sourcing, including global sourcing arrangements. We continue to leverage purchasing across our organization and standardize the use of raw materials across facilities.
Continuing to Focus on Enhancing Our Product Mix Through State-of-the-Art Technology. Our production facilities have allowed us to improve our production flexibility and dependability. We use high-performance machinery and a broad range of state-of-the-art technologies. Recent investments include printing presses that can print up to ten colors, high efficiency pasted valve machines, co-extruded blown film extruders, heat sealable paper bag line and stand-up re-sealable pouch machines. We believe that a key factor that differentiates our services from those of our competitors is the state-of-the-art graphics and technical capabilities of our Customer Resource Center, located at our Spartanburg, South Carolina headquarters. In addition, to enhance the convenience that we strive to provide to our customers, we have continued to add features such as handles and advanced package re-closure systems.
We view our array of facilities and ongoing commitment to state-of-the-art technology as key drivers in our ability to provide an exceptional combination of service, performance and value. Strategically, we plan to grow our revenue base by providing customized packaging solutions and benefiting from an overall trend toward flexible, rather than rigid, packaging.
Realizing Operational Efficiencies and Synergies. We strive to cultivate safe, efficient manufacturing by focusing on quality and operational practices. Our efficiency initiatives include establishing common operating and reporting procedures, streamlining production, optimizing asset utilization, rationalizing product mix and making strategic capital expenditures.
Our Strengths
We believe we have the following competitive strengths:
Established Relationships with Blue Chip Customers. We maintain strong relationships with a diverse base of customers in a wide array of businesses. We have approximately 1,200 customers, and even with recent market consolidations, most of our customers individually represent less than 5% of our net sales. No customer exceeded 10% of our net sales for 2010.
Cost Savings Opportunities. Part of our strategy consists of combining the functions shared by our acquired businesses and extracting synergies. We believe that we can achieve cost savings by in-sourcing manufacturing of certain films and other materials, improving procurement (through increased purchasing volume and efficiencies of scale in freight), and eliminating operational redundancies (through reducing headcount, restructuring certain facilities and consolidating information technology programs). For example, in 2008, we moved the EAC business operations conducted at Intelicoat’s South Hadley, Massachusetts facility to the EAC facility we acquired in Matthews, North Carolina. Similarly, we integrated the Whitby, Canada plant we purchased from DuPont into the Exopack business. The integration of the Whitby facility allowed us to produce certain films that we previously purchased from outside vendors. We also now process certain print jobs that were outsourced by the EPF business.
Position within the Industry. According to the Flexible Packaging Association (“FPA”), the size of the domestic flexible packaging industry was estimated to be approximately $25.5 billion in annual sales in 2010, of which “value-added” products accounted for an estimated $19.7 billion in sales. The “value-added” segment does not include retail shopping bags, consumer storage bags and wraps, or trash bags.
The flexible packaging market is fragmented, with an estimated 407 manufacturers operating in North America. A significant number of these manufacturers are relatively small, with the average converter generating annual sales of approximately $60.0 million to $65.0 million in 2009, according to the FPA. We believe that as a result of customer consolidation certain sectors and customers are underserved by smaller manufacturers. We believe our Company can take advantage of this market opportunity.
We believe there are several key drivers in the industry, including: the growing importance of convenience, functionality and shelf-appeal; technological developments; a trend toward flexible rather than rigid packaging; globalization; raw material cost volatility; the impact of sustainable packaging; and pressures to consolidate. We believe we are well-positioned to compete and expand our business due to our broad product mix, substrate expertise, customer service, award winning printing technology, global presence and technologically advanced manufacturing capabilities. Our global presence and capabilities are supported by Global Packaging Linx (“GPL”).
4
GPL is a strategic initiative we developed to leverage relationships with global packaging manufacturers. We believe GPL is a unique initiative in our industry. The goal of GPL is to procure flexible packaging solutions from a select network of global packaging manufacturers when it provides value to our customers or potential customers. We aim to take advantage of GPL while maintaining Exopack's standards for quality, service, and innovation. Through GPL, we believe we will be able to further identify and develop opportunities within our multinational customer base that will allow us to provide value through our own mix of domestic converted packaging solutions, as well as through offshore packaging technologies provided by our global alliance partners.
As part of the GPL initiative, Exopack signed a joint venture agreement with Lebanon-based packaging manufacturer INDEVCO Group (“INDEVCO”) to manufacture co-extruded polyethylene film in the Middle East under the name CEDEX Plastics Flexible Packaging (“CEDEX”). The joint venture represents the strengthening of a long-term relationship between Exopack and INDEVCO to support global customers. During 2010, the joint venture brought the first cost-effective films from the Middle East to customers in North America. We intend to expand our relationship with INDEVCO to take advantage of the new polymer manufacturing capacity coming on line in the Middle East, which is primarily due to the increased economic advantage of ethylene production in this region of the world. The CEDEX film is distributed by Exopack as part of the Company’s family of film products.
Highly Experienced Management Team. We have an experienced management team with an average of more than 20 years of industry experience. Our Chairman and Chief Executive Officer, Jack E. Knott, has over 30 years of experience in the packaging industry, during which he served as Chief Executive Officer of Pliant Corporation, Chairman of the FPA, President and Chief Operating Officer of Huntsman Packaging Corporation (the predecessor to Pliant Corporation) and President of Rexene Products (a petrochemical and polymer manufacturer). We also benefit from highly-motivated and experienced managers in key functional areas, including sales and marketing, operations, procurement and accounting and finance. Each of our key business unit managers has significant experience in the packaging and related industries.
Ability to Pass Through Raw Material Price Increases Within a Short Period of Time. Although most of our customers have contracts that prevent us from passing through raw material price increases immediately, historically, we have been able to pass through raw material price increases to our customers within a relatively short period of time, maintaining a relatively stable spread between selling price and raw material purchase price. More than 75% of our sales volume generated is under agreements that typically allow us to pass through raw material price increases/decreases every 30 to 90 days to customers that purchase plastic based packaging products and every 90 to 180 days to customers that purchase paper based packaging products. The remainder of our business is transactional, which permits us to pass through price increases/decreases to customers on an order-by-order basis.
Diversified Raw Material Supplier Base. We have relationships with multiple vendors in our pet food and specialty, consumer food and specialty, performance and coated products segments. We currently purchase our raw materials from more than 10 paper suppliers, more than 12 plastics suppliers, and more than 15 suppliers to our coated products segment. We are generally able to switch suppliers without sacrificing quality. We do not believe we are dependent on any single supplier to operate efficiently and profitably.
Diverse Mix of Paper Packaging, Plastic Packaging and Coated Products. We offer a diverse array of plastic packaging, paper packaging, films and coated products. We believe that we are well-positioned to meet customer needs in these three principal sectors. We believe we offer a high quality and diversified product line. Typically, our flexible packaging products are customized to fit particular customer specifications. We believe the multi-wall construction capabilities of our paper packaging segment are among the best in the industry. Our paper packaging products include a wide range of weights, run volumes and end-use applications, such as pinch bags, two- and three-ply pasted valve bags, sewn-open-mouth bags, self-opening sacks and specialty bags, among other products. Our plastic packaging and films products consist of a variety of film structures, printing, EB treatments and a number of converting styles. Our plastic packaging and films products include barrier films, high-clarity printed shrink films, shipping sacks, quad seal bags, stand-up pouches and laminated roll stock with a wide variety of printing options. Our coated products consist of a variety of laminations, coatings and other treatments. Our coated products include optical films, microfilm, medical products, conductive films and foils, ink jet receptive products and phototool products.
Proprietary Brands, Products and Processes. We believe we have established a reputation for developing innovative products, improving the shelf-appeal of our customers’ products and enhancing product performance. For example, we have developed our RAVE™ brand of plastic-laminated and converted plastic bags with easy to open and reclose features for the pet food and lawn and garden markets, specialty packaging for feminine care products, eXpress pv®two-ply cement bags for our cement and packaged concrete customers and paper bags with reclosable zippers for popular pet food brands. The acquisition of the EMCS facilities has added recognizable brands such as Clearshield® , Maraflex® , and Halo™ for the meat and cheese market segments. We also hold numerous patents, have other patent applications pending, and possess a number of proprietary constructions, compositions and manufacturing processes. In addition to our expertise in developing innovative products, our in-house graphics center has earned several industry awards for print quality and innovation.
5
Industry Overview
General. The flexible packaging and coating industry manufactures a broad range of consumer and industrial packaging for use in diverse end markets. Multi-layer flexible polymer/paper structures and barrier laminates are used for food, medical, agricultural and personal care products, as well as other consumer and industrial uses, and are used in a variety of products that generally include plastic film, paper or a combination of the two.
Plastic films, which account for the largest share of market demand in the industry, have been increasingly popular in recent years and offer strong barrier performance, re-closeability and outstanding print characteristics. Plastic has been used to reduce packaging weight when switching from rigid packaging applications. Paper products are versatile and support vibrant graphics and color schemes, while simultaneously offering durability and freshness retention as necessary. Moreover, paper products are increasingly appealing to consumers who place emphasis on environmental concerns and value the ability to use renewable resources and the option to recycle such products.
According to the FPA, the domestic flexible packaging market accounted for an estimated $25.5 billion in sales in 2010, the annual growth rates for the industry are projected to be approximately 3%. The flexible packaging industry is highly fragmented, as demonstrated by the estimated 407 flexible packaging manufacturers in North America.
End Markets. With its versatility, favorable cost profile and considerable shelf-appeal compared to traditional packaging configurations, flexible packaging has made, and continues to make, inroads in a wide variety of consumer and industrial markets. The focus on sustainable packaging also favors the reduced packaging material weight of flexible packaging. According to the 2009 FPA report, approximately 85% of end market applications for domestic flexible packaging are consumer and institution oriented, while approximately 8% of the overall flexible packaging market stems from industrial uses for flexible packaging, particularly in the agricultural, building and chemical industries. Retail and institutional food and beverage markets account for approximately 56% of all flexible packaging applications. In addition, medical and pharmaceutical markets account for approximately 7% of flexible packaging applications. Various other applications, such as personal care products and retail and institutional non-food products, account for approximately 29% of the flexible packaging industry.
Industry Forecast. Growth in the flexible packaging industry is expected to be driven by a number of trends, including:
• increasing importance of convenience, portability, functionality and shelf-appeal;
• technological developments leading to enhancements in packaging product performance capabilities;
• ongoing industry conversion from rigid to flexible packaging;
• impact of sustainable packaging; and
• globalization.
We believe that larger producers are particularly well situated to take advantage of the current industry trends given their ability to reliably service larger, national customers by offering large-scale production capacity, enhanced product development capabilities, broad product offerings and competitive pricing. Additionally, larger producers have relatively greater purchasing leverage than smaller producers and have greater access to resources necessary to pursue substantial acquisition strategies. We believe that our Consolidation in 2005 and acquisitions in 2007 and 2010 provide us with the potential to benefit from such size-related advantages.
Competition
The business of supplying flexible packaging products is extremely competitive, and we face competition from companies that sell similar and substitute packaging products. We compete principally with a limited number of manufacturers of flexible packaging products who offer a broad range of products and maintain production and marketing facilities domestically and internationally. Our major domestic competition includes Bemis Company, Inc., Sealed Air, Inc., Printpack, Inc., Hood Packaging Group, Graphic Packaging Corp., Sonoco Products Company and Coating Excellence International. Our international competitors include Nordenia International AG, Peel Plastic Products Ltd., Mondi Group, Bischof and Klein and UFlex.
Segments
Our business is divided into four primary product segments: pet food and specialty packaging, consumer food and specialty packaging, performance packaging and coated products. The overall product capabilities and production capacity of these segments allow us to serve as a full-service packaging provider to our customers.
Pet Food and Specialty Segment. This market segment includes packaging products we sell to producers of products such as pet food, lawn and garden, charcoal, microwave popcorn and pet care products. We offer a wide range of packaging styles, graphics, special features and coatings that help our customers maximize product appeal to their target markets. We offer our customers custom-engineered paper for graphics and proprietary coatings for additional barrier protection, depending on each customer’s particular safety requirements and convenience concerns. In addition, our plastic offering supports both high fidelity graphics for large format packaging as well as barrier materials for more sensitive product needs. We continue to invest in state-of-the-art converting equipment to provide the most desirable packaging formats with consumer features such as slider zipper reclosures.
6
Consumer Food and Specialty Segment. The consumer food and specialty segment includes packaging and films products we sell to producers of fresh bone-in and boneless meats, natural chunk, sliced and shredded cheese, breakfast foods, frozen foods, beverages, coffee, candy, paper towels and tissue, healthcare products and other consumer goods. We offer a wide range of packaging styles, graphics, special features and coatings to suit particular customer needs and maximize product shelf-appeal.
Performance Packaging Segment. For this segment, the primary performance of the package is to protect and transport goods in a safe, reliable and cost effective manner and graphics are relied upon primarily to communicate product use. We produce industrial-strength paper packaging products used by the agricultural, building products, food ingredient, diary and processed minerals industries, among others. Our plastic products are additionally used to package resin pellets, chemicals, salt, building materials and agricultural products, among others. Many of these end-use sectors are also marketing products into big box retailers where product crossover occurs from industrial customers to retail consumers. Our amplified printing capabilities can improve the package appeal for products sold through this channel.
Coated Products Segment. Our coated products segment includes coated products we sell to the medical, electronic, optical, security, conductives and printing markets. Typical end uses for coated products include white boards, LCD screens, digital printing, electrical cars and breathable wound care applications. We offer branded products, proprietary products developed under partnerships and OEM labeled products.
See Note 11 to our consolidated financial statements included elsewhere in this annual report for additional information regarding our segments.
Products
We produce a wide variety of value-added, flexible, paper-based and plastic-based packaging and film products, including multi-wall bags, heavy duty shipping sacks and multi-layer laminated products.
Our key paper-based packaging products include:
Pinch Bags. Pinch bags offer presentation and functionality advantages for consumer applications that require packaging which lies flat or stands upright and is sift resistant. Typically, pinch bags are used by manufacturers and distributors of light products, such as sugar, flour, pet food, livestock feed and smaller lawn and garden products. Due to their multi-layer constructions, this style of bag is also used for chemical products where specific barriers are required. Pinch bags are left unsealed at one end after production and offer convenient filling and sealing features for our customers and end users. Pinch bags typically are formed using multiple layers of paper, film and other barrier materials to include laminated film-to-paper composites.
Pasted Valve Bags. Pasted valve bags, constructed of heavy-gauge, multi-wall paper, are most often used in industrial and construction markets. Pasted valve products are extremely durable and strong enough to hold significant weights and volume for such products as cement, clay, chemicals and sand. In general, pasted valve products lay flat for storage and are easily stackable in mass quantities. The attached valve is designed to work with specific filling equipment. We produce a two-ply line of pasted valve products, which provide what we believe to be efficient, superior performance. We also offer UN/DOT testing, which is required for all packaging used to carry hazardous materials.
Self-Opening Sacks. Self-opening sacks, most commonly used for smaller consumer applications, utilize a variety of multi-wall construction combinations to suit performance requirements. Paper and plastic layers are often combined to provide outstanding barrier performance for content containment, as well as moisture or oxygen resistance. Moreover, self-opening sacks are easily re-closable by the end consumer and are particularly convenient for smaller pet food, charcoal, animal litter, coffee, sugar and flour packaging products.
Sewn-Open-Mouth Bags. Sewn-open-mouth bags provide packaging solutions for livestock feed, seed and flour applications. Sewn bags are preferred in many applications because of the ease with which they can be opened. Sewn closed at one end, the bags are filled with content by the customer and sewn shut with heavy-gauge filament. Sewn-open-mouth bags are constructed to lie flat and are designed to carry heavy loads. We provide a wide variety of printing and combined substrate choices for sewn-open-mouth bags. In addition to multi-wall, kraft and film, we use woven polypropylene in the construction to enhance the strength of the bag.
Multi-Wall and Specialty Bags. We manufacture technically complex specialty bags capable of providing protection against oil, grease, chemicals and moisture. These bags are used to package pet food, microwave popcorn and charcoal, among other products.
Market Print. Market print is primarily used for building insulation backing, or as wrap for roofing shingles. Constructed from one-ply, unbleached kraft paper, market print is often printed with one or two colors on one side and delivered to customers on large rolls.
7
Our key plastic-based packaging and films products include:
Shipping Sacks. Our shipping sacks are used for difficult packaging applications, such as insulation, salt, plastic, resin, sand, gravel, soil, seed and other industrial, chemical and agricultural materials and products. Typically constructed of heavy-gauge plastic, our shipping sacks are extruded in a tube and heat or adhesive-sealed, thereby creating a weld designed to withstand harsh industrial environments.
Rollstock. We manufacture a variety of tubular and single-wound sheet rollstock products tailored to individual customer preferences. Extruded film is available in several varieties, including mono-layer, co-extrusion or laminated film, and can be delivered plain or with printing. Rollstock is often utilized for resin, food, beverage and lawn and garden wraps.
Flexible Overwrap Packaging. Overwrap packaging consists of specially co-extruded film with high-performance characteristics. Such products are used for tissue products, such as toilet paper, bundle packs of bar soap and pharmaceutical products. We can accommodate orders for thin gauge extensible films, as thin as .5 millimeters and with as many as 10 colors.
Multi-Layer Laminations. Multi-layer lamination products provide complex, customized flexible packaging structures to personal care, food, dairy and pet food producers. These products offer strength, machinability, above-average barrier protection and shelf life characteristics, and can be made easy open and/or tamper evident.
Printed Shrink Film. Shrink films are used in the personal care, beverage, cereal, convenience foods and canned goods markets, offering product protection and clear graphics at relatively low prices.
Dartek ® Nylon Cast Films. Cast films can be used as thermoforming films that require high barrier and excellent optics properties and are also used in pouches and bags.
Sclairfilm®. Sclair sealant films consist of mono and coex blown polyethylene-based products designed for laminations to other materials. These films feature toughness and durability, barrier properties, superior tensile and puncture strength and excellent sealability.
Stand-Up Pouches. Pouches provide an alternative to traditional rigid packaging, providing increased versatility and convenience. Pouches also feature a large surface area which allows for more eye-catching graphics. Additionally, the relatively thin, light nature of flexible pouches facilitates product storage and reduces shipping costs. Our stand-up pouches are suited for a wide range of applications and can be customized to a variety of specifications.
Edge Seam. Edge seam bags are primarily used by seed, fertilizer and chemical manufacturers due to their laminated construction and ability to provide eye catching graphics. These bags are made from rollstock and are gusseted and sealed on one side. Our management believes that our additional features for edge seam bags (such as handles, 10-color printability and custom-engineered constructions and laminations) distinguish our edge seam bags from those of our competitors.
Quad Style Bags and Pouches. Quad style bags are much like an edge seam bag with all four edges sealed to give a box like appearance to the filled bag. These bags lend themselves to high fidelity graphics, consumer convenience features and allow for a wide range of substrate choices. This is often the plastic version of the paper pinch-style bag.
Shrink Vacuum Bags and/or Tubestock. Used primarily in fresh meat products, a packaging film produced from plastic resins is extruded via a tubular process. The film is cooled and then reheated and stretched at a temperature near its melting point. The film is made to shrink around a product to be packaged by the customer through the application of a thermal treatment. Alternatively, a layer of an oxygen barrier material can be included to manufacture a barrier shrink film product. This film is then further converted through printing and sold as either tubestock or further fabricated into a finished bag form.
Our key coated products include:
Coated/Laminated Substrates: Precise manufacturing methods and conditions are required for the process of applying complex coatings to these products, which include a variety of films and foils.
Breathable Polyurethane Films and Foams: These products are used in professional wound dressings, often incorporating anti-microbial silver properties.
Coated Polyester Film: These products consist of hard-coats, which are used in window-safety film, anti-graffiti material and scratch resistant high gloss furniture foil.
Coated and Laminate Flexible Materials: Used in the electronics market, we manufacture substrates used in the printed circuit, batteries and advanced fuel cells segment.
8
Specialty Coatings: We are able to use our extensive expertise to develop and produce high precision coatings for a wide variety of critical applications.
Operations and Manufacturing
We maintain an expansive array of packaging machinery at our various facilities, which collectively produced approximately 240 million pounds of paper packaging and approximately 190 million pounds of plastic packaging and films for the year ended December 31, 2010. Our machinery includes numerous presses, tubers, bottomers, sewing lines, self-opening square bottom and two-ply pasted valve bag machines, multiple extrusion lines, flexo and roto presses, pouch machines, coating machines and laminators. This wide variety of machinery and specialized equipment enables us to increase our product offerings and maintain a high degree of flexibility in meeting customer demands.
Product conformance is continually monitored and maintained by our supervisors and our key equipment and critical operations are administered by trained, experienced operators. Investments in equipment are driven by industry trends, developing technologies, customer needs and cost containment.
Due to the high degree of specialization at each of our facilities and the fact that our production is often customer-driven, we primarily distribute our products directly to our customers. We ship all of our products based on agreements with individual customers, typically using third-party shipping sources to deliver our products. Given our diverse customer base our business does not typically experience significant seasonal variation.
We produce our paper packaging, plastic packaging and films and coated products through three distinct but similar manufacturing processes. In some cases we may cross between manufacturing platforms to produce composite products which contain both paper and film technologies. Each of the business unit market segments controls or has access to the following manufacturing platforms.
Paper Packaging. The manufacture of paper packaging involves several processes, including printing, tubing and bottoming.
• Printing. Flat form paper products are printed using either rotogravure or flexographic print methods. The rotogravure method consists of pressing etched steel plates against flat form paper, using a rotary press to transfer the prints or graphics from the steel plates to the paper. During this process, the desired image is etched onto a steel cylinder creating small recesses, known as cells, which carry ink. The etched surface of the rotating cylinder is then dipped into an ink pan which fills the cells with ink. Surplus ink is wiped off the cylinder surface, leaving ink only in the cells. A second rotating cylinder then presses paper onto the cylinder, and the ink is transferred onto the paper. The flexographic print method is similar to the rotogravure method described above but utilizes flexible plates that are drawn through a roller to apply ink and graphics to paper. Once printed, the paper then undergoes tubing and bottoming processes.
• Tubing. Printed paper is converted to tube form by rolling and seaming the paper along one side. Tubing is critical to the production process, as many value-added features are added to the product at this stage, including the combination of multiple film layers, barriers and laminations. Film layers help provide tubed paper packaging with graphics and specific end-use features. The tubing process is finalized when the seamed paper is cut by machine into individual bags.
• Bottoming. Bottoming of the paper packaging completes the manufacturing process. At this stage, a paper tube is sealed at one end with heat or pressure-applied adhesives. Sewn-open mouth bags are customarily sealed with heavy-gauge filament that is sewn through the packaging.
Plastic Packaging and Films. The manufacture of plastic packaging and films also involves several processes, including extrusion, printing, slitting and pouching.
• Extrusion. Extrusion results in the creation of plastic film, the basis of flexible plastic packaging products. Appropriate machinery and technical knowledge are required to create a consistently high quality product. To begin, plastic resins with various properties are blended with additives to create a specified performance compound, the nature of which is primarily dependent on end-market use and customer preference. Blended resin compounds are then shaped under heat and pressure to create a thin plastic film. Many manufacturing dynamics, including the combination of resin and extrusion methods, produce variations in color, clarity, tensile strength, toughness, thickness, shrinkability, surface friction, transparency, sealability and permeability. Extruded plastic film can be used in a wide range of applications. We do not, however, extrude all of our plastic films, such as polyethylene terephalate (“PET”) and oriented polypropylene (“OPP”) films. Extruded product may result in sheet or tubular form.
• Printing. Extruded plastic film can be printed. Exopack utilizes either a rotogravure or flexographic printing process, similar to the ones used to print paper packaging.
• Lamination. In many circumstances, a product needs the protection of more than a single plastic film. In these instances, additional layers are bonded to the plastic film, with the added layers consisting of materials, such as oriented polyester, a polyethylene based sealant or OPP. These materials are stiffer, harder to tear and heat sealable. The film layers are brought together by applying an adhesive or by extruding a layer of molten polyethylene to bind two film layers into one. The lamination process allows us to meet the protection requirements for a variety of different end uses.
9
• Slitting. Finished plastic film can be placed in razor and shear-cut slitting machines that tailor the film to sizes and widths specified by the customer. Several of our machines are able to store key machine settings for specific products, which results in a high level of consistency and manufacturing efficiency.
• Pouch/bag converting. Printed and/or laminated films can be converted into a variety of styles with re-closable features, handles or other required package elements.
Coated Products. The manufacture of coated products also involves several processes, including coating and lamination.
• Coating. Extruded plastic film, foil, and paper can be coated using slot die, direct gravure, reverse gravure and proprietary coating methods, using liquid crystal, exotic filled ceramics and polyamides. Energy cured coatings can be used over printed products for gloss, print protection or surface dynamic control.
In order to optimize these processes and increase efficiencies, we share production-related best practices among our facilities and closely monitor numerous quality control and production analysis metrics. As a result of such practices, we believe that we have considerably improved our efficiency and quality. Other efficiency and productivity initiatives are underway in order to optimize processes and productive capacity, including:
• establishing company-wide a systematic management process in each segment and plant;
• further streamlining production to focus each facility’s core equipment and manufacturing strengths;
• optimizing asset utilization at each plant; and
• strategically making capital expenditures to enhance efficiencies.
Management believes that these initiatives should enable us to improve our overall efficiency and enhance profitability.
Materials
We use polyethylene resin and barrier films, paper, inks, adhesives and chemicals, including coated and un-coated woven polypropylene, polyester and nylon films in the manufacture of our products. We purchase our raw materials from a variety of suppliers and do not depend on any one supplier for our raw material needs. We also purchase finished goods through our GPL relationships.
We negotiate pricing and contract terms with each supplier. We attempt to purchase raw materials with the best possible terms and pricing, and we believe that we have good relationships with each of our suppliers, several of which have supplied raw materials to us for decades.
We are currently focusing on increasing the efficiency of our raw materials procurement process. To this end, we are working to develop highly efficient procurement methods and have adopted innovative approaches to raw materials sourcing, such as developing additional global and internal sourcing arrangements. In addition, we have programs in place to leverage raw materials procurement and standardize raw material usage across our Company.
Technology and Research and Development
Our technology development is primarily focused on providing paper, plastic and coatings expertise to suit our customers’ development requirements.
We are able to use our broad product offerings and state-of-the-art technology to transfer technological innovations from one market to another. For example, our expertise in producing zippered stand-up pouches for the food industry has helped us to develop and commercialize a patented re-closeable feature on multi-wall bags for pet food. We have also successfully developed our RAVETM composite line of premade bags. Through unique substrate combinations these robust bags offer less damage to the retailer and lower overall cost for the packaged goods company.
Many of our customers work with our technical representatives to deliver more competitive products. We have enhanced our relationships with such customers by providing the technical service required to support the commercialization of new products and by helping such customers improve operational efficiency and quality throughout the life cycle of their products. In order to ensure product quality and consistency for their own customers, our customers typically do not change suppliers often, as supplier changes can be risky, expensive and time-consuming.
During the latter part of 2010, Exopack centralized its research and development team in a new research and development center in Menasha, Wisconsin to capitalize on the core competencies of the more than 50 engineers and scientists currently working within our various business units. The focus of this research and development team is to develop and bring to market the latest cutting-edge flexible packaging products. In addition to the Menasha research and development center, we maintain research and development specialists and product testing laboratories at our corporate headquarters in Spartanburg, South Carolina as well as within our Matthews, North Carolina and Wrexham, North Wales, United Kingdom facilities.
10
In addition, we formed a long term innovation team to search for new technologies that can be translated into packaging or coating products. This team is charged with finding technology platforms that have the potential to be commercialized in a 3-5 year time horizon.
For additional information related to our research and development costs, please see Note 2 to our consolidated financial statements included elsewhere in this annual report.
Sales and Marketing
Overview. Our overall sales and marketing strategy is to deliver levels of quality, consistency, innovation, reliability and customer service that are competitive in the industry and to leverage our resources to position us as a trusted partner and leading solutions provider in value-added market segments. In addition to the ability to provide innovative and customized products to customers regardless of whether they require paper or plastic configurations, our critical differentiators include strong technical resources, customer service and support capabilities, broad geographic reach and large-scale production resources. We believe that our full service, “one-stop” resources enable us to provide industry-leading services and products to a wide range of customers, including national blue chip companies and smaller, regional accounts.
We strive to maintain close relationships with our customers, collaborating on technological advancements and demand planning. Our sales representatives are trained to focus on specific product categories, while maintaining a general familiarity with all of our products in order to take advantage of cross-selling opportunities. As a result, we believe that our sales personnel have developed a deep understanding of our product lines, in addition to the specific operations and needs of the individual customers that each representative services. We believe that this expertise enables us to cultivate new business, develop highly-effective partnering initiatives with key customers, meet or exceed customer needs and expectations as to product quality and innovation, and differentiate our products from those of our competitors.
Sales Organization. Approximately 65 sales personnel are organized around our business segments. Within each segment, sales representatives are divided between regional and national accounts. Regional representatives target smaller accounts, while national representatives focus on customers requiring service from multiple facilities. Typically, we maintain a single sales personnel and customer service contact with each customer, which we believe facilitates clear communication and fosters close personal relationships.
In addition to a base salary, our sales personnel have an incentive plan according to the profitability of the products they sell or to the amount of cash their sales generate. Accordingly, our sales representatives have an incentive to sell high-value products. We devote significant resources on an ongoing basis to product and sales technique training programs, which inform sales representatives about each of our products, their functionality, potential applications and value-added selling techniques. We believe that these efforts have resulted in a highly knowledgeable and motivated sales force, capable of specifically addressing a broad range of customer requirements.
Marketing Initiatives. We actively seek to identify and pursue developing opportunities with customers, leveraging our technical expertise to meet customer needs, regardless of segment or packaging configuration. We believe these efforts enhance our ability to pursue cross-selling opportunities with existing and potential customers. Market and product-focused professionals have reinforced our business with our major customers by developing expertise and enhancing recognition of Exopack products and services. In addition, there has been a renewed focus on branded products to enhance customer experience. We believe that brands such as Maraflex® , Clearshield® , Halo™ , AquaCrystal®, eXpress plv®, Sclairfilm®, Dartek®, StratFX™, Reflex®, RAVETM, Duratool®, InspireTM, and ShurSealTM have become trusted names in our product portfolio.
Customer Service
We believe our commitment to customer service and support is reflected in our long-term customer relationships and new customer retention. Customer service is critical to our ability to differentiate our Company from our competition and reinforce our market position. Accordingly, we maintain a strong focus on our customers by emphasizing an attentive approach to customer needs and by providing value-added services that complement products designed and printed to customer specifications.
Our approach to service emphasizes four primary objectives:
• delivering quality products on-time;
11
• responding to customer questions, concerns and problems, and closely collaborating with customers to promptly address any such questions, concerns or problems;
• customizing and designing innovative products that conform to our customers’ exact specifications; and
• using specialized manufacturing and information technology to provide customers with rapid processing and service alternatives.
In addition, we actively promote our broad network of production facilities in order to attract and maintain customers that require production from multiple locations.
Customers and Order Backlog
We have a diversified customer base of more than 1,200 customers. Our customers range in size from Fortune 100 companies to smaller regional businesses, and come from a variety of industries, including food, chemical, medical, pet food, building materials, beverages, electronics, lawn and garden and personal care and hygiene products.
Sales arrangements with our customers vary by customer and product supplied, and may include purchase order arrangements or long-term agreements and contracts. Contractual terms typically stipulate product prices, potential raw material price increase/decrease pass-through, on-hand inventory or production availability and payment and freight terms. Contractual terms range in length from one-time sales to three or more years and typically contain cost pass-through provisions.
The time between receipt of orders and shipment generally averages between four to six weeks. As a result, backlog is not significant.
For information regarding a summary of our significant accounting policies for revenue recognition, please see Note 2 to our consolidated financial statements included elsewhere in this annual report.
Employees
At December 31, 2010, we had 2,435 employees, of which 501 were covered by five separate collective bargaining agreements. In our Battle Creek, Michigan facility, 127 employees, including production and maintenance employees, quality control inspectors and drivers, are covered by a collective bargaining agreement that was recently negotiated to replace a collective bargaining agreement that expired on February 1, 2011. The new Battle Creek collective bargaining agreement expires on February 4, 2016. In our Tomah, Wisconsin facility, 110 employees are covered by a collective bargaining agreement that expires on February 28, 2012. In our Matthews, North Carolina facility, 69 employees are covered by a collective bargaining agreement that expires on June 27, 2012. In our Menasha, Wisconsin facility, 195 employees are covered by two separate collective bargaining agreements; the Graphics Communications Workers are covered by a collective bargaining agreement that expires on June 30, 2013 and the United Steelworkers are covered by a collective bargaining agreement that expires on February 28, 2012.
Patents and Trademarks
We have proprietary rights to a number of trademarks important to our business, including, but not limited to, Exopack®, eXpress plv® , Sclairfilm®, Dartek® , Maraflex® , ClearShield® , Halo® , AquaCrystal®and Shur Seal®. We also hold approximately 96 U.S. and foreign patents relating to our products, manufacturing processes and equipment and numerous patent applications are currently pending in the United States and certain foreign jurisdictions.
Regulatory Matters
Our business is subject to numerous federal, state, local and foreign laws and regulations relating to the protection of human health and the environment. These domestic environmental laws and regulations include the Clean Air Act, the Clean Water Act, the Resource Conservation and Recovery Act and the Comprehensive Environmental Response, Compensation and Liability Act and relate to such things as the storage, release and remediation of hazardous substances. In addition, we are subject to similar state laws.
Exopack’s North Wales facility is subject to European Union and U.K. legislation covering similar areas of human health and environmental protection. These include the Clean Air Act 1993, the Pollution Prevention and Control (England and Wales) regulations 2000, the Water Resources Act 1991, the Water Protection Zone (River Dee Catchment) Regulations 1999, the Environmental Protection Duty of Care Regulations 1991, the Hazardous Waste Regulations 2005, the Producer Responsibility Obligations (Packaging Waste) Regulations 2005 and the Landfill Regulations 2002.
Exopack’s Canadian facilities are subject to Canadian legislation covering similar areas of human health and environmental protections. Our facilities are subject to one or more of the following regulations: the Canadian Environmental Protection Act (CEPA) which includes the National Pollutant Reporting Inventory regulation, the Kyoto Protocol, the Fisheries Act, the New Substance Notification Regulations, Transportation of Dangerous Goods, the Workplace Hazardous Materials Information System, the Ontario Environmental Protection Act, Ontario Air Regulations 419 & 127, Ontario Waste Regulation 347, “3Rs” Regulations, the Ontario Water Resources Act, municipal water by-laws and Municipal-Industrial Strategy for Abatement laws and the Ontario Regulation 63/95 for Effluent Monitoring and Effluent Limits - Organic Chemical Manufacturing Sector law.
12
These laws are constantly evolving, with a trend towards increasing stringency. The ultimate impact of complying with existing laws and regulations is not always clearly known or determinable, because certain implementing regulations for some of the laws described above have not yet been promulgated or in certain instances are undergoing revisions. These environmental laws and regulations could result in increased capital, operating and compliance costs.
Geographic Areas
For a discussion of our consolidated net sales and long-lived assets based on geographic area please see Note 11 to our consolidated financial statements included elsewhere in this annual report.
Available Information
We maintain an Internet website at http://www.exopack.com. The information on our website does not constitute a part of this annual report and the reference to our website is intended as an inactive textual reference only. Our annual reports on Form 10-K, quarterly reports on Form 10-Q, current reports on Form 8-K and amendments to these reports are available free of charge through our website as soon as reasonably practicable after we file this material with the SEC. We will also provide electronic or paper copies of our SEC filings free of charge upon request.
ITEM 1A. RISK FACTORS
Our business operations and the implementation of our business strategy are subject to significant risks inherent in our business, including, without limitation, the risks and uncertainties described below. The occurrence of any one or more of the risks or uncertainties described below could have a material adverse effect on our consolidated financial condition, results of operations and cash flows and could cause actual results to differ materially from the results contemplated by the forward-looking statements contained in this annual report. While we believe we have identified and discussed below the key risk factors affecting our business, there may be additional risks and uncertainties that are not presently known or that are not currently believed to be significant that may adversely affect our business, operations, industry, financial position and financial performance in the future. Because of the following risks and uncertainties, as well as other variables affecting our operating results, past financial performance should not be considered a reliable indicator of future performance and historical trends may not be consistent with results or trends in future periods. Our consolidated financial statements and the notes thereto and the other information contained in this annual report should be read in connection with the risk factors discussed below.
Intense competition in the flexible packaging markets may adversely affect our operating results.
The business of supplying flexible packaging products is extremely competitive. We face intense competition from many domestic and international competitors, some of which have extensive production facilities, well developed sales and marketing staffs and greater financial resources than we have. Competitive products are also available from a number of local manufacturers specializing in the production of a limited group of products, which they market nationally. This results in competition that is extremely price sensitive. We also compete on the basis of quality, service, timely delivery and differentiation of our products. This competition could result in additional pricing pressures, reduced sales and lower margins. An increase in competition could result in material selling price reductions or loss of market share, which would adversely affect our operating results and financial condition.
The profitability of our business depends on the price and availability of polyethylene resin and paper, two of our principal raw materials, and our ability to pass on polyethylene resin and paper price increases to customers.
The principal raw materials that we use in the production of our products are polyethylene resin and paper. Our ability to operate profitably depends, in large part, on the price and availability for these raw materials. The price for polyethylene resin fluctuates substantially as a result of changes in petroleum and natural gas prices, demand and the capacities of the companies that produce polyethylene resin to meet market needs. Prices for paper depend on the industry’s capacity utilization and the costs of raw materials.
Historically, we have been able to relatively quickly pass through to our customers substantially all increases and decreases in the cost of polyethylene resin and paper through contractual provisions in our long-term agreements and standard industry practice. If we are not able to promptly pass cost increases through in the future and there are substantial increases in polyethylene resin or paper prices, our operating margins could be affected adversely. Furthermore, natural disasters such as hurricanes, in addition to terrorist activity and governmental regulation of environmental emissions, or a substantial increase in oil or natural gas prices, may negatively impact the production or delivery capacity of our raw materials suppliers in the chemical and paper industries. This could result in increased raw material costs or supply shortages, which may have a negative impact on our profitability if we are unable to pass along the increased costs in our selling prices or, in the case of a shortage, secure raw materials from alternative sources.
13
Our business is affected by global economic factors including risks associated with a recession and our customers' access to credit.
Our financial results are substantially dependent upon the overall economic conditions globally and in the locations where we do business, including in the United States, the United Kingdom and Canada. A recession in any of these locations or globally—or public perceptions that result in declining economic conditions—could substantially decrease the demand for our products and adversely affect our business. Indeed, as a result of the economic downturn that commenced in late 2008 and continued into 2010, we have experienced decreased demand for some of our products. Moreover, many of our customers rely on access to credit to fund their operations. The inability of our customers to access credit facilities may adversely affect our business by reducing our sales, increasing our exposure to accounts receivable bad debts and reducing our profitability.
The recent negative worldwide economic conditions and market instability also make it increasingly difficult for us, our customers and our suppliers to forecast demand trends. A continued decline in demand could place further financial pressure on our results of operations. The timing and extent of any changes to currently prevailing market conditions is uncertain and supply and demand may be unbalanced at any time. As a consequence, we are unable to accurately predict the extent or duration of business cycles or their effect on our financial condition or results of operations, and can give no assurances as to the timing, extent or duration of the current or future business cycles.
We are subject to the risk of loss resulting from nonpayment or nonperformance by our customers.
As a result of the recent economic downturn and continued weak economic conditions, some of our customers may be unable to satisfy their obligations to us when they become due and may initiate bankruptcy proceedings. Our credit procedures and policies may not be adequate to eliminate customer credit risk. Our customers may experience financial difficulties, including bankruptcies, restructurings and liquidations. These and other financial problems that may be experienced by our customers, as well as potential financial weakness in our industry and in the economy generally may increase our risk in extending trade credit to customers. A significant adverse change in a customer relationship or in a customer's financial position could cause us to limit or discontinue business with that customer, require us to assume more credit risk relating to that customer's receivables or limit our ability to collect accounts receivable from that customer, all of which could have a material adverse effect on our business, results of operations, financial condition and liquidity.
Financial difficulties and related problems at our vendors, suppliers and other business partners could result in a disruption to our operations and have a material adverse effect on our business.
We rely on numerous vendors and suppliers and collaborations with other industry participants to provide us with polyethylene resin, paper, packaging materials and other raw materials, along with energy sources and, in certain cases, facilities, that we need to operate our business. We believe that certain of our business partners may be experiencing or may experience cash flow problems, which could be further aggravated by recessionary industry conditions. Due to the recent economic downturn and continued weak economic conditions, some of these companies may be forced to reduce their output, shut down their operations or file for bankruptcy protection. Financial difficulties or solvency problems at companies on which we rely could materially adversely affect their ability to provide us with the raw materials, energy sources or facilities that we need, which could disrupt our operations, including the production of certain of our products. In addition, it could be difficult to find replacements for certain of our business partners without incurring significant delays or cost increases.
Fluctuations in the equity market will likely adversely affect our pension plan assets and our future cash flows.
In connection with the Consolidation, we assumed certain pension assets and obligations of pension plans of Exopack, LLC, referred to in this annual report as the pension plans, as described in more detail in Note 5 to our consolidated financial statements included elsewhere in this annual report. Continued disruption in global credit and financial markets could adversely affect the market value of our pension plan assets, which would likely increase our pension costs and cause a corresponding decrease in our cash flow. Our pension costs are dependent upon numerous factors resulting from actual plan experience and assumptions of future experience. Pension plan assets are primarily made up of equity and fixed income investments. Accordingly, fluctuations in actual equity market returns as well as changes in general interest rates may result in increased or decreased pension costs in future periods. In addition, changes in assumptions regarding current discount rates and expected rates of return on plan assets could also increase or decrease pension costs. We expect to make contributions of approximately $3.0 million to one of our pension plans in 2011. However, a decline in our pension plan assets as a result of volatile equity market returns would significantly increase future minimum required pension contributions in 2012 and future years which would have an adverse impact on our cash flows and our availability under our Senior Credit Facility.
14
Energy price increases could adversely affect the results of our operations.
Our manufacturing operations require the use of substantial amounts of electricity and natural gas. Energy prices, in particular prices relating to oil and natural gas, have been extremely volatile in recent years. Increases in oil and natural gas prices have a corresponding effect on our production costs. Higher energy costs may also affect our costs of operation by increasing our costs for the raw materials that we use to manufacture our products. The price of polyethylene resin, one of our principal raw materials, fluctuates substantially as a result of changes in petroleum and natural gas prices.
The recent political upheaval in Northern Africa and the Middle East involving Egypt, Libya and other countries has significantly increased uncertainties with respect to energy prices, and the volatility of oil prices has increased significantly during the first two months of 2011. If these events continue or expand to other countries in the region, energy prices could continue to increase rapidly, which could adversely affect our business.
We must adapt to technological advances in the packaging industry.
We compete in an industry that requires advanced technology to deliver state-of-the-art specialty packaging and coating solutions to customers whose packaging needs are constantly evolving. Our success may depend on our ability to adapt to technological changes in the industry. If we are unable to adapt to technological change, timely develop and introduce new products, or enhance existing products in response to changing market conditions or customer requirements or demands, our business and results of operations could be materially and adversely affected. We may not be able to replace outdated technologies, replace them as quickly as our competitors or develop and market new and better products in the future.
We may be unable to protect our proprietary technology from infringement.
We rely on a combination of patents and trademarks, licensing agreements and unpatented proprietary know-how and trade secrets to establish and protect our intellectual property rights. We generally enter into confidentiality agreements with customers, vendors, employees, consultants and potential acquisition candidates as necessary to protect our know-how, trade secrets and other proprietary information. However, these measures and our patents and trademarks may not afford complete protection of our intellectual property, and it is possible that third parties may copy or otherwise obtain and use our proprietary information and technology without authorization or otherwise infringe on our intellectual property rights. Our competitors may also independently develop equivalent or superior know-how, trade secrets or production methods. If we are unable to maintain the proprietary nature of our technologies, our profit margins could be reduced as competitors imitating our products could compete aggressively against us in the pricing of certain products and our business, results of operations and financial condition may be materially adversely affected.
We are involved in litigation from time to time in the ordinary course of our business to protect and enforce our intellectual property rights, and third parties from time to time may initiate litigation against us asserting that our business infringes or violates their intellectual property rights. Our intellectual property rights may not have the value that we believe them to have and our products may be found to infringe upon the intellectual property rights of others. Further, we may not prevail in any such litigation and the results or costs of any such litigation may have a material adverse effect on our business. Any litigation concerning intellectual property is inherently unpredictable, could be protracted and costly and could have a material adverse effect on our business, results of operations and cash flows, regardless of its outcome.
Our operations could expose us to substantial environmental costs and liabilities.
We are subject to a variety of federal, state, foreign, provincial and local laws and regulations that impose limitations and prohibitions on the discharge and emission of, and establish standards for the use, disposal and management of, regulated materials and waste. These laws and regulations impose liability for the costs of investigation and clean-up of, and damage resulting from, present and past spills, disposals or other releases of hazardous substances or materials. These domestic and international environmental laws can be complex and may change often. The compliance expenses can be significant, and violations may result in substantial fines and penalties. In addition, environmental laws, such as the Comprehensive Environmental Response, Compensation and Liability Act of 1980, as amended, also known as “Superfund,” in the United States, impose strict, and in some cases joint and several, liability on specified responsible parties for the investigation and cleanup of contaminated soil, groundwater and buildings, and liability for damages to natural resources at a wide range of properties, sometimes without regard to fault. As a result, we may be liable for contamination at properties that we currently own or operate, as well as at our former properties or off-site properties where we may have sent hazardous substances. As a manufacturer that uses and has used and generated large quantities of hazardous substances, we have an inherent risk of liability under environmental laws, both with respect to ongoing operations and with respect to known and potential contamination related to our properties or as a result of our operations. We could, in the future, incur a material liability resulting from the costs of complying with environmental laws, environmental permits or any claims concerning noncompliance, or liability from contamination.
We cannot predict what environmental legislation or regulations will be enacted in the future, how existing or future laws or regulations will be administered or interpreted or what environmental conditions may be found to exist at our facilities or at third-party sites for which we are liable. Enactment of stricter laws or regulations, stricter interpretations of existing laws and regulations or the requirement to undertake the investigation or remediation of currently unknown environmental contamination at our own or third-party sites may require us to make additional expenditures, some of which could be material.
15
In addition, a number of governmental authorities, both in the United States and abroad, have considered, or are expected to consider, legislation aimed at reducing the amount of plastic wastes. Programs have included, for example, mandating certain rates of recycling and/or the use of recycled materials, imposing deposits or taxes on plastic packaging material and requiring retailers or manufacturers to take back packaging used for their products. Legislation, as well as voluntary initiatives similarly aimed at reducing the level of plastic wastes, could reduce the demand for certain plastic packaging, result in greater costs for plastic packaging manufacturers or otherwise impact our business. Some consumer products companies, including some of our customers, have responded to these governmental initiatives and to perceived environmental concerns of consumers by using containers made in whole or in part of recycled plastic. Future legislation and initiatives could adversely affect us in a manner that could be material.
Although we believe we currently have sufficient liquidity, we may not be able to obtain funding if needed because of the deterioration of the credit and capital markets.
Global financial markets and economic conditions have been, and continue to be, disrupted and volatile, which has caused a substantial deterioration in the credit and capital markets. In particular, the cost of raising money in the debt and equity capital markets has increased substantially while the availability of funds from those markets generally has diminished significantly. Also, as a result of concerns about the stability of financial markets generally and the solvency of counterparties specifically, the cost of obtaining money from the credit markets generally has increased as many lenders and institutional investors have increased interest rates, enacted tighter lending standards, refused to refinance existing debt at maturity on terms that are similar to existing debt, and reduced, or in some cases ceased, to provide funding to borrowers.
We do not currently believe that we have a need to obtain additional financing beyond our current financing arrangements described in “Item 7. Management’s Discussion and Analysis of Financial Condition and Results of Operations―Liquidity and Capital Resources.” However, our need for additional financing may change at any time based on unexpected market conditions, unexpected actions by the lenders under our Senior Credit Facility, changes to our growth strategy, or other factors. If the capital and credit markets continue to experience volatility and the availability of funds remains limited, our ability to obtain any such additional financing on favorable terms, if at all, could be severely limited. Our inability to secure additional financing on favorable terms to us, or at all, in the event that we need to seek such financing would constrain our ability to operate or grow our business and could require us to pursue actions that could materially adversely affect our financial condition, results of operations and cash flows.
We are subject to risks related to our international operations.
We have manufacturing and distribution facilities in Canada and the United Kingdom and a joint venture operation in the Middle East. Our international operations are subject to various risks that could have a material adverse effect on those operations, including, but not limited to, exposure to local economic conditions over which we have no control and, currency exchange rate fluctuations, political instability and foreign laws, such as environmental and labor laws.
The recent political upheaval in Northern Africa and the Middle East involving Egypt, Libya and other countries has increased political instability in the region. Our joint venture with INDEVCO, as well as our plans to expand our relationship with INDEVCO to take advantage of the new polymer manufacturing capacity coming on line in the Middle East, could be adversely affected by the uncertain political environment in Northern Africa and the Middle East.
We may, from time to time, experience problems in our labor relations.
At December 31, 2010, we had 2,435 employees, of which 501 were covered by five separate collective bargaining agreements. In our Battle Creek, Michigan facility, 127 employees, including production and maintenance employees, quality control inspectors and drivers, are covered by a collective bargaining agreement that was recently negotiated to replace a collective bargaining agreement that expired on February 1, 2011. The new Battle Creek collective bargaining agreement expires on February 4, 2016. In our Tomah, Wisconsin facility, 110 employees are covered by a collective bargaining agreement that expires on February 28, 2012. In our Matthews, North Carolina facility, 69 employees are covered by a collective bargaining agreement that expires on June 27, 2012. In our Menasha, Wisconsin facility, 195 employees are covered by two separate collective bargaining agreements; the Graphics Communications Workers are covered by a collective bargaining agreement that expires on June 30, 2013 and the United Steelworkers are covered by a collective bargaining agreement that expires on February 28, 2012. Our failure to renew these agreements on acceptable terms could result in labor disruptions and increased labor costs, which could materially adversely affect our financial condition, results of operations and cash flows. Furthermore, we may experience strikes, work stoppages or slowdowns in the future. Any such events could have a material adverse effect on our financial condition, results of operations and cash flows.
16
Loss of third-party transportation providers upon whom we depend or increases in fuel prices could increase our costs or cause a disruption in our operations.
We depend upon third-party transportation providers to deliver our products to our customers. Strikes, slowdowns, transportation disruptions or other conditions in the transportation industry, such as increases in fuel prices, could increase our costs and disrupt our operations and our ability to meet our customers’ timing requirements.
Unexpected equipment failures may lead to production curtailments or shutdowns.
Our manufacturing processes depend on critical pieces of equipment, which may, on occasion, be out of service as a result of unanticipated failures. Interruptions in our production capabilities will inevitably increase our production costs and reduce our sales and earnings for the affected period. In addition to equipment failures, our facilities are subject to the risk of catastrophic loss due to unanticipated events, such as fires, explosions or violent weather conditions. Moreover, any interruption in production capability may require us to make significant capital expenditures, which could have a negative effect on our profitability and cash flows. We may also sustain revenue losses in excess of any recoveries we make under any applicable business interruption insurance coverage we may have. In addition to such revenue losses, longer-term business disruption could result in a loss of customers, which could adversely affect our business, financial condition, results of operations and cash flows.
An affiliate of Sun Capital controls us and may have conflicts of interest with us in the future.
An affiliate of Sun Capital indirectly controls our sole stockholder. Such affiliate of Sun Capital, therefore, has the power to take actions that affect us, including appointing management and approving mergers, a sale of substantially all of our assets and other extraordinary transactions. For example, such affiliate of Sun Capital could cause us to make acquisitions that increase the amount of our indebtedness or to sell revenue-generating assets, impairing our ability to make payments under our debt agreements. Such affiliate of Sun Capital could also receive certain fees in connection with such acquisitions and other corporate events under a management services agreement with us. Additionally, such affiliate of Sun Capital is in the business of making investments in companies and may, from time to time, acquire and hold interests in businesses that compete directly or indirectly with us. Such affiliate of Sun Capital may also pursue acquisition opportunities that may be complementary to our business, and as a result, those acquisition opportunities may not be available to us.
We are required to comply with Section 404 of the Sarbanes-Oxley Act, and there can be no assurance that we will be able to establish, maintain and apply effective internal control over financial reporting under applicable SEC rules promulgated under Section 404.
We are required to comply with Section 404 of the Sarbanes-Oxley Act. Our compliance with Section 404 will require that we incur substantial accounting expense, which may be higher than we expect, and that we expend significant management efforts.
The effectiveness of our controls and procedures may in the future be limited by a variety of factors, including:
• faulty human judgment and simple errors, omissions or mistakes;
• fraudulent action of an individual or collusion of two or more people;
• inappropriate management override of procedures; and
• the possibility that any enhancements to controls and procedures may still not be adequate to assure timely and accurate financial information.
If we are not able to comply with the requirements of Section 404 in a timely manner we may face restricted access to the capital markets and may be subject to sanctions.
Loss of key individuals could disrupt our operations and harm our business.
Our success depends, in part, on the efforts of certain key individuals and members of our senior management team, including Jack E. Knott, our Chairman and Chief Executive Officer. The loss of the services of any of our executive officers or key employees could disrupt our operations and have a material adverse effect on our business. Additionally, we do not carry “key man” life insurance coverage for our senior management.
We may be adversely affected by interest rate changes.
Our financial position is affected, in part, by fluctuations in interest rates. Borrowings under our Senior Credit Facility are subject to variable interest rates. Increased interest rates may adversely affect our earnings and cash flows by increasing the amount of interest expense that we are obligated to pay on borrowings under our Senior Credit Facility.
Interest rates are highly sensitive to many factors, including governmental monetary policies, domestic and international economic and political conditions and other factors beyond our control. A significant increase in interest rates could have a material adverse affect on our financial position, results of operations and cash flows.
17
Numerous other factors over which we may have limited or no control may affect our performance and profitability.
Other factors that may influence our earnings include: legal and administrative cases and proceedings (whether civil, such as environmental or product related, or criminal), settlements, judgments, and investigations; developments or assertions by or against us relating to intellectual property rights and intellectual property licenses; adoption of new, or changes in, accounting policies or practices and the application of such policies and practices; changes in business mix; customer and supplier business reorganizations or combinations; increase in cost of debt; ability to retain adequate levels of insurance coverage at acceptable rates; fluctuations in pension and employee benefit costs; loss of significant contracts; risks and uncertainties relating to investment in development activities and new facilities; timely development and successful market acceptance of new products; pricing of competitive products; disruptions in transportation networks; increased participation in potentially less stable emerging markets; reliability of utility services; impact of computer viruses; general or specific economic conditions and the ability and willingness of purchasers to substitute other products for the products that we manufacture; financial condition and inventory strategies of customers and suppliers; credit risks; changes in customer order patterns; employee work stoppages at plants; increased competition; changes in government regulations and the impact of changes in the world political environment, including the ability to estimate the impact of foreign currency exchange rates on financial results; the impact of epidemiological events on the economy and on our customers and suppliers; and acts of war, terrorism, weather, and other natural disasters.
Our substantial indebtedness could adversely affect our financial health and prevent us from fulfilling our obligations under our outstanding Notes.
We have a significant amount of indebtedness. As of December 31, 2010, we had outstanding indebtedness of $389.3 million, $320.0 million of which consisted of our outstanding 11.25% Senior Notes due 2014 (the “Notes”), $56.9 million of which consisted of borrowings under our Senior Credit Facility, $12.4 million of which consisted of capital lease obligations for manufacturing equipment and real estate, and less than $0.1 million of which consisted of borrowings under a subordinated term loan. After consideration of $56.9 million of outstanding borrowings and outstanding letters of credit of $4.2 million under our $125.0 million Senior Credit Facility, we had an additional $58.0 million available to be borrowed under our Senior Credit Facility as of December 31, 2010.
Our substantial indebtedness could have important consequences to holders of the Notes. For example, it could:
• limit our flexibility in planning for, and reacting to, changes in our business and in our industry, which could make us more vulnerable to adverse changes in general economic, industry and competitive conditions, including the current economic downturn, and adverse changes in government regulations;
• make it more difficult for us to satisfy our obligations with respect to the Notes;
• make it more difficult for us to meet all of our obligations to creditors, who could then require us, among other things, to restructure our indebtedness, sell assets or raise additional debt or equity capital;
• require us to dedicate a substantial portion of our cash flows from operations to payments on our indebtedness, which will reduce the availability of our cash flows to fund acquisitions, working capital, capital expenditures, research and development efforts and other general corporate purposes;
• limit our ability to borrow additional amounts for working capital, capital expenditures, debt service requirements, execution of our growth strategy or general corporate purposes;
• place us at a competitive disadvantage compared to our competitors that have less debt; and
• limit our ability to make future acquisitions.
One or a combination of these factors could adversely affect our financial condition and prevent us from fulfilling our obligations under the Notes.
Despite current indebtedness levels, we and our subsidiaries may still be able to incur substantially more debt. This could further exacerbate the risks described above.
We and our subsidiaries may be able to incur substantial additional indebtedness in the future. The terms of the indenture governing the Notes do not fully prohibit us or our subsidiaries from doing so. As of December 31, 2010, we had $58.0 million available to be borrowed under our Senior Credit Facility. If new debt is added to our subsidiaries’ current debt levels, the related risks that we now face could intensify. See “Management’s Discussion and Analysis of Financial Condition and Results of Operations—Liquidity and Capital Resources—Capital Resources.”
18
To service our indebtedness, we will require a significant amount of cash. Our ability to generate cash depends on many factors beyond our control.
Our ability to make payments on and to refinance our indebtedness, including the Notes, and to fund capital expenditures, acquisitions and research and development efforts, will depend on our ability to generate cash. A number of factors that affect our ability to generate cash are beyond our control. These factors include economic, financial, competitive, legislative, regulatory and other factors, such as changes in packaging designs, adverse weather conditions and acts of God, all of which are beyond our control. The current economic downturn may present particular challenges in our ability to generate cash due, among other things, to decreased demand for our products.
We may not successfully implement our business strategy and may not generate sufficient cash flows from operations to enable us to pay our indebtedness, including the Notes, or to fund our other liquidity needs. If our future cash flows from operating activities and other capital resources are insufficient to pay our obligations as they mature or to fund our liquidity needs, we may be forced to reduce or delay our business activities, sell assets, obtain additional debt or equity capital or restructure or refinance all or a portion of our debt, including the Notes, on or before maturity. We may not be able to implement any of these alternatives on a timely basis or on satisfactory terms, if at all. In addition, the terms of our existing and future indebtedness, including the Notes, may limit our ability to pursue any of these alternatives.
The indenture governing the Notes and our Senior Credit Facility restricts our operations.
The indenture governing the Notes restricts our ability to, among other things:
• sell or transfer assets and issue capital stock of restricted subsidiaries;
• incur additional debt, incur liens or issue preferred stock;
• pay dividends or make other distributions or repurchase or redeem our stock or subordinated indebtedness;
• make certain investments or acquisitions;
• enter into agreements restricting our subsidiaries’ ability to pay dividends; and
• engage in certain transactions with subsidiaries and affiliates.
The indenture and our Senior Credit Facility also require us to comply with certain covenants and financial conditions. These restrictions may limit our ability to obtain financing and may interfere with our ability to engage in other necessary or desirable business activities.
If we cannot comply with the requirements of our indenture or our Senior Credit Facility, we may be required to repay immediately all of the outstanding debt under them. If our debt payments are accelerated, our assets might not be sufficient to fully repay our debt. Our lenders may require us to use all of our available cash to repay our debt, foreclose upon their collateral or prevent us from making payments to other creditors on certain portions of our outstanding debt.
We may not be able to obtain a waiver of these provisions or refinance our debt, if needed. In such a case, our financial condition, liquidity and results of operations could suffer.
We may not successfully complete the integration of Exopack Meat, Cheese and Specialty (“EMCS”).
We acquired EMCS in July of 2010. Since this business was previously operated separately by Bemis Company, Inc. (“Bemis”), there are a number of risks related to this acquisition, including, but not limited to:
· demands on management related to the increase in the size of the business for which they are responsible;
· diversion of management’s attention from the management of daily operations to the integration of the acquired business;
· management of employee relations across facilities;
· difficulties in the assimilation of different corporate cultures and practices, the integration of dispersed operations and the assimilation and retention of personnel;
· difficulties and unanticipated expenses related to the integration of manufacturing facilities, departments, systems (including accounting systems), technologies, books and records, procedures and controls (including internal accounting controls, procedures and policies), as well as in maintaining uniform standards, including environmental management systems; and
· expenses of any undisclosed or potential liabilities.
19
The successful integration of our operations with the operations of EMCS will depend on our ability to manage the combined operations, to realize opportunities for revenue growth presented by broader product offerings and expanded geographic coverage and to eliminate redundant and excess costs. If our continued integration efforts are not successful, we may not be able to maintain the levels of revenues, earnings or operating efficiency that we and EMCS might have achieved separately.
We may be unable to realize the expected cost savings and other synergies from the EMCS acquisition into our business and operations.
Even if we are fully able to successfully integrate the operations of EMCS into our operations, this integration may not result in the cost savings, synergies or revenue enhancements that we expect or these benefits may not be achieved within the timeframe that we expect. The cost savings and other synergies from the acquisition may be offset by costs incurred in integrating EMCS’s operations into our operations, as well as by increases in other expenses, by operating losses or by problems with the EMCS business unrelated to the acquisition.
Our increased debt obligations incurred to finance the EMCS acquisition could adversely affect our business and limit our ability to plan for or respond to changes in our business.
We issued $100.0 million of additional 11.25% senior notes due 2014 to repay certain borrowings we incurred to finance the EMCS acquisition. Our increased debt obligations could have important consequences to our business. For example:
· we may be more vulnerable to general adverse economic and industry conditions;
· we may be required to dedicate a substantial portion of our cash flow to payments on our indebtedness, thereby reducing the availability of our cash flow for other purposes, including business development efforts;
· our flexibility in planning for, or reacting to, changes in our business and the industry in which we operate may be limited, thereby placing us at a competitive disadvantage compared to our competitors that have less indebtedness.
We may be unable to successfully or timely complete the transition of equipment and business related to the EMCS acquisition to our existing facilities.
We acquired certain manufacturing equipment located at a Bemis manufacturing facility and Bemis will toll manufacture certain products for up to one year from the acquisition date of July 13, 2010. The successful and timely transition of this equipment and business to our existing facilities will depend on difficulties encountered in the transition and unanticipated expenses and delays that may occur. We may not be able to maintain the levels of revenues, earnings or operational efficiency achieved through the toll arrangement.
ITEM 1B. UNRESOLVED STAFF COMMENTS
Not applicable.
ITEM 2. PROPERTIES
Our corporate headquarters are located in Spartanburg, South Carolina. We operate 19 manufacturing facilities located throughout the United States, United Kingdom and Canada. We operate four manufacturing facilities in the pet food and specialty packaging segment, all of which are owned properties. We operate seven manufacturing facilities in the consumer food and specialty segment, of which we lease two, including one manufacturing facility in Ontario, Canada, and own the remaining five facilities. We operate six manufacturing facilities in the performance packaging segment, of which we lease two and own the remaining four facilities. We operate two manufacturing facilities in the coated products segment, both of which we lease, including one manufacturing facility in North Wales, United Kingdom.
We believe that our plants, which vary in size and age, are suitable for our operations and believe our manufacturing facilities have sufficient capacity to meet our production needs for the foreseeable future.
ITEM 3. LEGAL PROCEEDINGS
From time to time, we are party to various disputes and legal proceedings arising in the ordinary course of business, none of which are expected to have a material adverse effect on our Company.
20
PART II
ITEM 5. MARKET FOR THE REGISTRANT’S COMMON EQUITY, RELATED STOCKHOLDER MATTERS AND ISSUER PURCHASES OF EQUITY SECURITIES
Our common stock is privately held and there is no established public trading market for our common stock. As of the date of this filing, we had one share of common stock outstanding, which is held by Exopack Key Holdings, LLC.
On January 31, 2006, we completed an unregistered private offering of $220.0 million aggregate principal amount of 11.25% Senior Notes due 2014. Pursuant to an exchange offer in December 2006, we exchanged all of the 11.25% Senior Notes for 11.25% Senior Notes registered under the Securities Act (the “Existing Notes”).
On September 24, 2010, we completed the private placement of $100.0 million in principal amount of 11.25% Senior Notes due 2014 (the “Additional Notes”). The Additional Notes were issued as additional notes under the indenture pursuant to which the Company issued the Existing Notes. The Additional Notes are treated as a single series with the Existing Notes under the indenture and have the same terms as the Existing Notes. On November 30, 2010, the Company completed an offer to exchange registered notes for the Additional Notes as required by the terms of a registration rights agreement related to the Additional Notes. Approximately $1.0 million in principal amount of 11.25% Senior Notes due 2014 were not tendered for exchange and, remain private, unregistered notes. The Existing Notes, together with the Additional Notes and the private unregistered notes are referred to in this annual report as the “Notes.”
The indenture governing the Notes and our Senior Credit Facility each separately impose restrictions on our ability to pay dividends and we have not paid any dividends to our sole stockholder during either of the years ended December 31, 2010 or December 31, 2009. See “Item 7. Management’s Discussion and Analysis of Financial Condition and Results of Operations–Liquidity and Capital Resources” and Note 4 to our consolidated financial statements included elsewhere in this annual report for a description of restrictions on our ability to pay dividends.
ITEM 6. SELECTED FINANCIAL DATA
The following tables set forth selected financial data as of and for the years ended December 31, 2010, 2009, 2008, 2007 and 2006. The selected financial data as of December 31, 2010 and 2009 and for the years ended December 31, 2010, 2009 and 2008, have been derived from our audited consolidated financial statements, which are included elsewhere in this annual report and are qualified in their entirety by reference to, and should be read in conjunction with, such audited consolidated financial statements. The selected financial data as of December 31, 2008, 2007 and 2006 and for the years ended December 31, 2007 and 2006 have been derived from our audited consolidated financial statements, which are not included in this annual report.
21
|
Year Ended |
Year Ended |
Year Ended |
Year Ended |
Year Ended | ||||||
|
December 31, |
December 31, |
December 31, |
December 31, |
December 31, | ||||||
|
2010 |
2009 |
2008 |
2007 |
2006 | ||||||
|
(dollar amounts in thousands) | ||||||||||
|
Consolidated Statement of Operations |
||||||||||
|
Data: |
||||||||||
|
Net sales |
$ 785,086 |
$ 673,733 |
$ 781,732 |
$ 676,073 |
$ 655,423 | |||||
|
Cost of sales |
684,168 |
596,764 |
699,524 |
603,675 |
583,346 | |||||
|
Gross profit |
100,918 |
76,969 |
82,208 |
72,398 |
72,077 | |||||
|
Operating expenses(1) |
66,491 |
55,894 |
57,179 |
49,508 |
48,024 | |||||
|
Operating income |
34,427 |
21,075 |
25,029 |
22,890 |
24,053 | |||||
|
Interest expense |
36,379 |
28,592 |
30,991 |
28,884 |
27,262 | |||||
|
Loss on early extinguishment of debt(2) |
- |
- |
- |
- |
4,002 | |||||
|
Other expense (income), net(3) |
(1,035) |
(468) |
1,371 |
(1,548) |
27 | |||||
|
Net other expense |
35,344 |
28,124 |
32,362 |
27,336 |
31,291 | |||||
|
Loss before income taxes |
(917) |
(7,049) |
(7,333) |
(4,446) |
(7,238) | |||||
|
Income tax expense (benefit) |
1,857 |
(1,114) |
(1,215) |
(541) |
(2,347) | |||||
|
Net loss |
$ (2,774) |
$ (5,935) |
$ (6,118) |
$ (3,905) |
$ (4,891) | |||||
|
Consolidated Statement of Cash Flows |
||||||||||
|
Data: |
||||||||||
|
Net cash provided by (used in): |
||||||||||
|
Operating activities(4) |
$ 29,595 |
$ 25,978 |
$ 12,959 |
$ 12,809 |
$ 9,671 | |||||
|
Investing activities(5) |
$ (100,296) |
$ (19,740) |
$ (19,026) |
$ (71,786) |
$ (17,481) | |||||
|
Financing activities(6) |
$ 72,704 |
$ (6,921) |
$ 5,149 |
$ 59,388 |
$ (694) | |||||
|
Capital expenditures |
$ 24,996 |
$ 26,421 |
$ 19,149 |
$ 23,244 |
$ 17,454 | |||||
|
Consolidated Balance Sheet Data (at |
||||||||||
|
period end): |
||||||||||
|
Cash |
$ 2,508 |
$ 633 |
$ 1,712 |
$ 1,308 |
$ 485 | |||||
|
Working capital(7) |
$ 21,331 |
$ 1,299 |
$ 4,600 |
$ 5,923 |
$ 51,418 | |||||
|
Property, plant, and equipment |
$ 214,293 |
$ 174,055 |
$ 173,757 |
$ 186,393 |
$ 145,772 | |||||
|
Total assets(8) |
$ 609,808 |
$ 481,464 |
$ 498,632 |
$ 519,109 |
$ 451,129 | |||||
|
Long-term debt, less current portion(9) |
$ 330,501 |
$ 220,034 |
$ 220,082 |
$ 220,130 |
$ 220,177 | |||||
|
Total debt(9) |
$ 389,316 |
$ 288,637 |
$ 294,574 |
$ 291,057 |
$ 230,249 | |||||
|
Stockholder's equity |
$ 39,995 |
$ 44,499 |
$ 42,732 |
$ 65,008 |
$ 65,957 | |||||
|
Other Data: |
||||||||||
|
Ratio of earnings to fixed charges(10) |
$ - |
$ - |
$ - |
$ - |
$ - | |||||
(1) Operating expenses for the year ended December 31, 2010 included $6.0 million in expenses related to acquisition costs and the start-up and integration of EMCS operations into our business, $5.0 million in other selling, general and administrative costs acquired with the EMCS Acquisition, $3.5 million in professional services related to process improvement consulting, $2.7 million in severance costs, and $2.5 million in incentive bonus related to our management incentive plan bonus (“MIP”). Operating expenses for the year ended December 31, 2009 included $3.3 million in incentive bonus related to our MIP, $3.1 million in severance costs, $1.7 million in professional services related to process improvement consulting, and approximately $831,000 related to the closure of one of our Canadian facilities. Operating expenses for the year ended December 31, 2008 included $3.4 million in start-up and transition costs related to the EEF and EPF Acquisitions, $8.5 million in other selling, general and administrative expenses due to a full year of EEF and EPF operations in 2008, $2.0 million in severance costs, and approximately $567,000 related to a lease obligation to consolidate operations at one of our Canadian facilities. Operating expenses for the year ended December 31, 2007 included $1.3 million of accelerated amortization related to the reduction of the useful life of the Cello-Foil trademark and trade name, $1.3 million (excluding certain severance charges included in severance costs below) related to costs associated with continued efforts to combine and streamline certain operations of our consumer food and specialty packaging Canadian facilities, $2.0 million in severance costs, $1.5 million in start-up and transition expenses related to the EEF and EPF Acquisitions and $2.6 million in other selling, general and administrative costs related to the EEF and EPF Acquisitions.
(2) Represents a charge to earnings during the year ended December 31, 2006 to write-off the deferred financing costs related to our former senior credit facility and subordinated term loans. This debt was refinanced in January 2006.
(3) Other income for the year ended December 31, 2010 was primarily related to insurance proceeds of approximately $1.0 million received in 2010 related to a press fire at one of our consumer food and specialty packaging facilities in the third quarter of 2009. Includes primarily $432,000 in exchange gains related to an intercompany note with our United Kingdom operations as a result of the strengthening of the British pound against the U.S. dollar during the year ended December 31, 2009. Includes primarily $1.7 million in exchange loss related to an intercompany note with our United Kingdom operations as a result of the weakening of the British pound against the U.S. dollar during the year ended December 31, 2008. Includes primarily $1.8 million in proceeds received during the year ended December 31, 2007 from the settlement of a business interruption insurance claim related to the 2005 hurricane season.
22
(4) Includes primarily an increase in receivables, inventory, and accounts payable and accrued liabilities as a result of the EMCS acquisition for the year ended December 31, 2010. Includes primarily a decrease in receivables and inventory, partially offset by a decrease in accounts payable and accrued liabilities for the year ended December 31, 2009.
(5) Includes primarily $82.1 million related to the acquisition of EMCS and $25.0 million related to the purchase of property, plant and equipment partially offset by $7.2 million in proceeds from sales of property, plant and equipment for the year ended December 31, 2010. Includes primarily $26.4 million related to the purchase of property, plant and equipment partially offset by $7.1 million in proceeds from sales of property, plant and equipment for the year ended December 31, 2009. Includes primarily $19.1 million related to the purchase of property, plant and equipment for the year ended December 31, 2008. Includes primarily the acquisition costs of EAC and EPF, totaling $48.9 million and $23.2 million related to the purchase of property, plant and equipment for the year ended December 31, 2007. During the year ended December 31, 2006, an additional $346,000 of acquisition costs was paid related to the 2005 acquisition of Cello-Foil, TPG and Exopack, an additional $6.2 million had been estimated to be payable to the former stockholders of Exopack under tax-related provisions contained in the Exopack purchase agreement, and the amount estimated to be payable to the former stockholders of Cello-Foil under tax-related provisions contained in the Cello-Foil purchase agreement was reduced by $163,000, resulting in a total cost of the acquired companies of $312.6 million.
(6) Includes approximately $100.0 million related to issuance of Additional Notes, $12.9 million in deferred financing costs related to the Additional Notes and the re-negotiation of the Senior Credit Facility and $11.9 million in net repayments under our Senior Credit Facility for the year ended December 31, 2010 (excluding the impact of foreign currency fluctuations). Includes approximately $6.9 million related to net repayments under our Senior Credit Facility for the year ended December 31, 2009 (excluding the impact of foreign currency fluctuations). Includes approximately $5.4 million related to net borrowings under our Senior Credit Facility for the year ended December 31, 2008 (excluding the impact of foreign currency fluctuations). Includes approximately $48.9 million related to borrowings under our Senior Credit Facility to fund the 2007 Acquisitions for the year ended December 31, 2007.
(7) Significant increase in 2010 is primarily the result of the EMCS acquisition. Significant decrease in 2007 primarily the result of borrowings under our Senior Credit Facility to fund the 2007 Acquisitions.
(8) Total assets increased in 2010 primarily as a result of the EMCS acquisition. Total assets decreased in 2009 due to reductions in accounts receivables and inventory, primarily as a result of reduced sales volume. Total assets of our foreign subsidiaries were reported at lower amounts at December 31, 2008 due to the weakening of the British pound and Canadian dollar relative to the U.S. dollar. Total assets increased significantly in 2007 due to the 2007 Acquisitions.
(9) Long-term and total debt increased in 2010 primarily due to issuance of $100.0 million in Additional Notes to finance the EMCS acquisition and $10.5 million in capital lease obligations.
(10) Loss used in computing the ratio of earnings to fixed charges consists of loss before income taxes plus fixed charges. Fixed charges consist of interest expense on debt, the amortization of deferred financing costs, and the portion of rental expense that management believes is representative of the interest component of rental expense. For the years ended December 31, 2010, 2009, 2008, 2007 and 2006, our earnings were insufficient to cover our fixed charges by $917,000, $7.0 million, $7.3 million, $4.4 million and $7.2 million, respectively.
ITEM 7. MANAGEMENT’S DISCUSSION AND ANALYSIS OF FINANCIAL CONDITION AND RESULTS OF OPERATIONS
Overview
This Management’s Discussion and Analysis of Financial Condition and Results of Operations should be read together with our consolidated financial statements, including the notes thereto, included elsewhere in this annual report.
We generate revenues, earnings and cash flows from the sale of flexible packaging,films and coated products primarily in the United States, Canada, and Europe. Management views net sales and operating income as the primary indicators of our financial performance.
Transactions Relating to Our Formation
Between July and October of 2005, Sun Capital, through an affiliate, sponsored a series of transactions involving three flexible packaging businesses consisting of Cello-Foil, TPG and Exopack that resulted in the ultimate formation of our Company. On July 14, 2005, in accordance with a stock purchase agreement entered into on June 10, 2005, Cello-Foil Holding Corp., an affiliate of Sun Capital, acquired all of the outstanding capital stock of Cello-Foil for $35.5 million, net of cash acquired. On September 7, 2005, in accordance with an asset purchase agreement entered into on August 19, 2005, Cello-Foil Holding Corp. acquired certain assets of TPG for $12.5 million, net of cash acquired. Pursuant to the terms of the asset purchase agreement, Cello-Foil Holding Corp. purchased all of the Concord, Ontario and Corona, California assets used in the conduct of TPG’s flexible packaging business. As a result of these two transactions, Cello-Foil Holding Corp. became the parent of both Cello-Foil and TPG. On October 13, 2005, in accordance with the terms of a merger agreement entered into on October 5, 2005, an affiliate of Sun Capital acquired Exopack for $264.6 million, net of cash acquired, and Exopack became our wholly-owned subsidiary. Concurrently with our acquisition of Exopack, Cello-Foil Holding Corp. became our wholly-owned subsidiary, and we refinanced the then outstanding indebtedness of Exopack, Cello-Foil and TPG. We refer to our acquisitions of Exopack, Cello-Foil and TPG as the “Consolidation.” The net cost of the Consolidation and related transactions, including the refinancing of Exopack, Cello-Foil and TPG debt and the payment of related fees, commissions and expenses, was approximately $312.6 million, net of cash acquired.
23
2007 Acquisitions
On August 6, 2007, we acquired 100% of the membership interests of Intelicoat Technologies Image Products Matthews, LLC and 100% of the outstanding shares of its affiliate, Intelicoat Technologies EF Holdco, Ltd. (collectively, the “Electronic and Engineered Films Business,” or “EEF”), and also acquired certain assets and assumed certain liabilities of other EEF entities (the “EEF Acquisition”). We financed the EEF Acquisition primarily through borrowings under our Senior Credit Facility (further described in Note 4 to our consolidated financial statements included elsewhere in this report). EEF, through its parent companies prior to the EEF Acquisition, was previously controlled by an affiliate of Sun Capital.
We subsequently renamed this acquired EEF business Exopack Advanced Coatings (“EAC”). EAC is engaged in researching, developing, manufacturing, distributing, marketing, and selling precision coated films and specialty substrates for imaging, electronics, medical and optical technologies. EAC conducts its operations from our locations in the state of North Carolina and in North Wales, United Kingdom.
On November 28, 2007, we acquired certain assets and assumed certain liabilities of DuPont Liquid Packaging System Inc.’s performance films business segment (“Liqui-Box”), including its Whitby, Ontario, Canada operating facility (the “EPF Acquisition”). There was no material relationship between our Company and Liqui-Box prior to the commencement of matters relating to the EPF Acquisition.
We subsequently renamed the acquired Liqui-Box business Exopack Performance Films (“EPF”). EPF is engaged in researching, developing, manufacturing, distributing, marketing, and selling value-added films used primarily in the food and industrial markets.
2010 Acquisition
On July 13, 2010, we completed the acquisition of certain assets and liabilities of a packaging business previously operated by Bemis Company, Inc. The acquired business, which is referred to in this annual report as Exopack Meat, Cheese and Specialty (“EMCS”) involves the manufacture and sale of certain packaging products primarily in the United States and Canada, including flexible-packaging rollstock used for chunk, sliced and shredded natural cheeses packaged for retail sale and flexible-packaging shrink bags used for fresh meat. EMCS is included within our consumer food and specialty packaging segment (see Note 11 to our consolidated financial statements included elsewhere in this annual report). The acquisition of EMCS provided us with a leading market position in the flexible packaging market for meat and cheese and expanded our technology base and product offerings in the consumer food and specialty packaging segment.
Reportable Segments
Through 2007, we reported in two operating segments; however, as a result of the 2007 acquisitions of EAC and EPF being integrated during 2008, we began reporting in three segments effective October 1, 2008. Effective July 1, 2009, we implemented an internal organizational change to move from a concentration on product lines to a concentration on markets. As a result of this change, we reassessed our segment reporting in the third quarter of 2009 and determined that our operations consist of four reportable segments: (i) pet food and specialty packaging, (ii) consumer food and specialty packaging, (iii) performance packaging and (iv) coated products. The pet food and specialty packaging segment produces products used in applications such as pet food, lawn and garden, charcoal, and popcorn packaging. The consumer food and specialty packaging segment produces products used in applications such as fresh meat, natural cheese and dairy foods, beverages, personal care, frozen foods, confectionary, breakfast foods, and films. The performance packaging segment produces products used in applications such as building materials, chemicals, agricultural products and food ingredient packaging. The coated products segment produces precision coated films, foils, fabrics and other substrates for imaging, electronics, medical and optical technologies. We evaluate segment performance based on operating income or loss. Segment data for prior periods have been restated to conform to this change.
Severance Expenses
During the years ended December 31, 2010, 2009 and 2008, we terminated the employment of certain employees and eliminated their positions. During 2010 and 2009 we also extended a voluntary early retirement option to certain salaried employees and a voluntary separation option to certain hourly employees at one of our food and specialty packaging segment facilities. In connection with these terminations we recorded employee termination costs of approximately $2.7 million, $3.1 million (excluding severance costs associated with the closure of a facility discussed below) and $2.0 million for the years ended December 31, 2010, 2009 and 2008, respectively, which were included in “Selling, general and administrative expenses” in our consolidated statements of operations included elsewhere in this annual report. Of the approximately $2.0 million in severance accrued at December 31, 2009 and approximately $2.7 million in costs incurred in 2010, we paid approximately $4.3 million through December 31, 2010, so that approximately $419,000 remained accrued for employee termination benefits at December 31, 2010, which will be paid in 2011.
24
Exit and Disposal Activities
In accordance with the Financial Accounting Standards Board (“FASB”) guidance related to accounting for costs associated with exit and disposal activities, we recognize a liability for exit or disposal activities when the related costs are incurred.
During the year ended December 31, 2008, we consolidated the operations of one of our Canadian food and specialty packaging facilities from two buildings into one building. In conjunction with the consolidation and subsequent sublease of the building to a third party, we recorded a discounted lease obligation of approximately $567,000 during the year ended December 31, 2008. This charge is reflected in “Selling, general and administrative expenses” in our consolidated statement of operations for the year ended December 31, 2008 included elsewhere in this annual report. There were no exit costs incurred related to this facility during the years ended December 31, 2010 or 2009. We remain obligated to make payments under a facility lease through August 2015 and, in April 2009, we began receiving sublease income to help mitigate the cost of the remaining lease obligation. The remaining lease obligation related to this facility of approximately $416,000 is reflected in our consolidated balance sheet as of December 31, 2010 included elsewhere in this annual report.
During the year ended December 31, 2007, we ceased using a significant portion of one of our leased Canadian food and specialty packaging facilities and recorded a charge to pre-tax earnings of approximately $699,000 for the pro-rata portion of the remaining lease payments to be made through the lease term ending December 2009 for the unused area of the facility. We did not renew the lease on this facility upon its expiration in December of 2009. During the year ended December 31, 2009, we recorded $831,000 in closure costs, of which $378,000 was recorded in the fourth quarter, including $404,000 in severance costs related to the closure of this facility and this charge is reflected in “Selling, general and administrative expenses” in our consolidated statement of operations for the year ended December 31, 2009 included elsewhere in this annual report. There were no exit costs incurred related to this facility during the year ended December 31, 2010. There was no remaining severance liability related to this closed facility as of December 31, 2010.
Critical Accounting Policies and Estimates
The preparation of our consolidated financial statements requires management to make estimates and judgments that affect the reported amounts of assets, liabilities, revenues and expenses, and related disclosure of contingent assets and liabilities. On an ongoing basis, we evaluate estimates, including those related to the estimate of uncollectible accounts receivable, the estimate of reserve for shipments on FOB destination shipping terms, and the estimate of excess and obsolete inventories. We base our estimates on historical experience and on various other assumptions that management believes to be reasonable under the circumstances, the results of which form the basis for making judgments about the carrying values of assets and liabilities that are not readily apparent from other sources. Actual results may differ from these estimates under different assumptions or conditions.
We believe the following accounting policies and estimates are critical to understanding our results and affect the more significant judgments and estimates used in the preparation of the consolidated financial statements:
Revenue Recognition. We recognize sales revenue when all of the following conditions are met: persuasive evidence of an agreement exists, delivery has occurred, our price to the buyer is fixed and determinable and collectability is reasonably assured. Sales and related cost of sales are principally recognized upon transfer of title to the customer, which generally occurs upon shipment of products. Our stated shipping terms are generally FOB shipping point, unless otherwise noted in the customer contract. Sales to certain customers are on consignment and revenue is recognized when the customer uses the products. Provisions for estimated returns and allowances and customer rebates are recorded when the related products are sold.
Accounts Receivable. Accounts receivable are stated net of the reserves for uncollectible accounts receivable. The estimated reserve for uncollectible accounts receivable is calculated based upon an analysis of all accounts receivable greater than 90 days past due, consideration of customers experiencing financial difficulty, historical loss experience and other factors, such as estimated returns and discounts and allowances.
Inventories. At December 31, 2010 and 2009, inventories are stated at the lower of cost or market with cost determined on the first-in, first-out (“FIFO”) method. Inventories are stated net of the reserve for excess and obsolete inventories. The estimated reserve for excess and obsolete inventories is calculated based on an analysis of all inventory aged greater than one year and other specifically identified excess or obsolete inventories.
25
Self-Insurance Reserves. The reserves for self-insurance of medical and workers’ compensation claims are estimated by considering a number of factors, including historical experience and claims development under third-party claims administration.
Pension and Postretirement Benefit Obligations. We account for our defined benefit pension plans in accordance with FASB guidance related to employer’s accounting for pensions, which requires that amounts recognized in the financial statements be determined on an actuarial basis. This FASB guidance requires us to recognize the overfunded or underfunded status of the pension plans on our consolidated balance sheet included in our consolidated financial statements contained elsewhere in this annual report. The actuarial valuations employ key assumptions, which are particularly important when determining our projected liabilities for pension and other postretirement benefits.
In connection with the Consolidation, we assumed the pension assets and obligations of the Retirement Plan of Exopack, LLC (the “Retirement Plan”) and the pension obligations of the Exopack, LLC Pension Restoration Plan for Salaried Employees (the “Restoration Plan”) (collectively, the “Pension Plans”) We also assumed certain obligations for healthcare benefits previously provided by Exopack, LLC, on a restricted basis, to certain employees pursuant to a collective bargaining agreement, which we refer to as the postretirement plan or the postretirement benefit plan. These pension and postretirement plans are described in more detail in Note 5 to our consolidated financial statements included elsewhere in this annual report.
In conjunction with the EMCS acquisition, we assumed a defined benefit pension plan for certain union employees at the Menasha, Wisconsin facility. Employees hired prior to March 1, 2010 were eligible to participate in the plan upon completion of 1,000 service hours. This plan was subsequently incorporated into the Retirement Plan of Exopack, LLC.
Key actuarial assumptions used in determining the projected benefit obligation, the accumulated benefit obligation, and net periodic benefit cost (income) for pension and other postretirement benefit plans for the year ended December 31, 2010 included: a discount rate of 5.4% to determine benefit obligations and a 5.9% rate to determine net periodic benefit cost (income), an expected long-term rate of return on plan assets of 8.0% and a health care cost trend rate beginning at 9.0% and grading uniformly to 5.0% over an eight-year period. Actuarial assumptions used for the year ended December 31, 2009 included: a discount rate of 5.9% to determine benefit obligations and a 6.1% rate to determine net periodic benefit cost (income), an expected long-term rate of return on plan assets of 8.0% and a health care cost trend rate beginning at 8.5% and grading uniformly to 5.0% over an eight-year period.
We set our discount rate annually in relationship to movements in published benchmark rates to match the timing of our benefit payments. The expected long-term rate of return assumption is based on our targeted asset allocation percentages, historical plan return performance and expected future returns. The ultimate health care cost trend rate of 5% represents our best estimate of the long-term average annual health care cost increase over the duration of the plan’s liabilities.
The allocation, by asset category, of assets of the Retirement Plan at December 31, 2010 was 66% equity securities and 34% fixed income securities. The allocation of assets of the Retirement Plan at December 31, 2009 was 70% equity securities and 30% fixed income securities.
During the year ended December 31, 2010, we had total pension and postretirement expense of $428,000, which includes interest expense of $3.3 million at the assumed rate of 5.9%, amortization of net actuarial losses of $120,000, severance cost of $374,000 related to the plan assumed in connection with the EMCS acquisition and $3.4 million of expected returns on plan assets at the assumed rate of 8.0%. During the year ended December 31, 2009, we had total pension and postretirement expense of $1.2 million, which includes interest expense of $3.2 million, at the assumed rate of 6.1%, amortization of net actuarial losses of $653,000 and $2.7 million of expected returns on plan assets at the assumed rate of 8.0%. During the years ended December 31, 2010 and 2009, we made contributions of $1.4 million and $1.2 million, respectively, to the Retirement Plan. Other than company contributions to fund benefit payments, no contributions were made to fund the postretirement benefit obligation during the years ended December 31, 2010 and 2009. We expect to make contributions of approximately $3.0 million to the Retirement Plan in 2011.
Unrecognized net actuarial losses were approximately $452,000 and $105,000 at December 31, 2010 and 2009, respectively, and are primarily the result of decreases in the discount rates due to decreased market interest rates. The amortization period for unrecognized losses/gains is approximately 10 years for the portion outside the 10% corridor at December 31, 2010 as defined by FASB guidance related to employer’s accounting for pensions.
The projected liability of these plans will be affected by assumptions regarding inflation, investment returns, market interest rates, changes in the number of plan participants and changes in the benefit obligations, and laws and regulations pertaining to benefit obligations. We annually reevaluate assumptions used in projecting the pension and postretirement liabilities and associated expense (income). These judgments, assumptions and estimates may affect the carrying value of pension plan assets and pension plan and postretirement plan liabilities and pension and postretirement plan expense (income) in our consolidated financial statements included elsewhere in this report.
At December 31, 2010, the fair value of the assets of the Pension Plans was $47.1 million, up from $42.2 million at December 31, 2009. The significant increase was mainly due to the continued rebound in global stock prices that occurred during 2010. Our minimum required contributions to our pension plans for fiscal year 2012 and thereafter may increase or decrease depending on volatility with respect to future global stock market valuations.
26
Based on current global stock market valuations, we expect to incur net periodic benefit costs of approximately $1.6 million in 2011.
See Note 5 to our consolidated financial statements included elsewhere in this annual report for additional information on our pension and postretirement plans.
Recovery of Long-Lived Assets. We review long-lived assets (including property, plant and equipment and intangible assets) for impairment whenever events or changes in circumstances indicate that the carrying amount of such long-lived assets may not be fully recoverable by undiscounted cash flows. Measurement of the impairment loss, if any, is based on the estimated fair value of the asset, which is generally determined by the discounting of future estimated cash flows, or in the case of real estate, determining market value. We evaluate the recovery of our long-lived assets by analyzing operating results and considering significant events or changes in the business environment that may have triggered impairment. See Note 2 to our consolidated financial statements included elsewhere in this annual report for additional information on our review of long-lived assets.
Goodwill and Indefinite-Lived Intangible Assets. Goodwill represents the excess of cost over the fair value of net assets acquired in business combinations. Under FASB guidance related to goodwill and other intangible assets, we do not amortize goodwill, but we review our goodwill balance for impairment at least once a year during the fourth quarter, or whenever events happen or circumstances change that would make it more likely than not that an impairment may have occurred. This review is conducted using business valuation methods required by the FASB guidance. These methods include the use of a weighted-average cost of capital to calculate the present value of the expected future cash flows of our reporting units. We have determined that we consist of five reporting units for the purpose of the goodwill impairment test under the FASB guidance. Future changes in the cost of capital, expected cash flows, or other factors may cause our goodwill and/or other intangible assets to be impaired, resulting in a non-cash charge against results of operations to write down these assets for the amount of impairment. If a significant write-down is required, the charge could have a material adverse effect on our reported results of operations and net worth. Indefinite lived intangible assets are tested for impairment by comparing the estimated fair value of the asset utilizing discounted future cash flows to the carrying value of the asset.
Other Intangible Assets. Contractual or separable intangible assets that have finite useful lives are being amortized against income using the straight-line method over their estimated useful lives of 10 to 21 years. The straight-line method of amortization reflects an appropriate allocation of the costs of the intangible assets to earnings in proportion to the amount of economic benefits obtained by us in each reporting period. We test finite-lived assets for impairment whenever there is an impairment indicator and indefinite lived assets for impairment on an annual basis. Finite lived intangible assets are tested for impairment by comparing anticipated related undiscounted future cash flows from operations to the carrying value of the asset.
Income Taxes. Income taxes are recorded under the asset and liability method whereby deferred tax assets and liabilities are recognized for the future tax consequences attributable to differences between the financial statement carrying amounts of existing assets and liabilities and their respective tax basis. Deferred tax assets and liabilities are measured using enacted tax rates expected to apply to taxable income in the years in which those temporary differences are expected to be recovered or settled. We do not currently intend to repatriate earnings, if any, from our Canadian subsidiaries, and consider these earnings to be permanently invested outside the U.S. As a result, no deferred tax liability has been recognized for earnings from our Canadian subsidiaries. We have provided for deferred U.S. taxes on all undistributed earnings from our U.K. subsidiaries through December 31, 2010. Prior to 2010, we had not recognized a deferred tax liability for earnings from our U.K. subsidiaries because we considered these earnings to be permanently invested overseas. During the fourth quarter of 2010, we determined that these earnings should no longer be considered indefinitely invested as a result of the continued success of our U.K. operations and concurrent increase in the need for funds to service the additional indebtedness incurred for the EMCS acquisition and other business strategies. As a result, we recognized $1.2 million of tax expense providing for deferred U.S. taxes for earnings from these subsidiaries.
See Notes 2 and 9 to our consolidated financial statements included elsewhere in this annual report for additional information on our income taxes.
27
Results of Operations
The following presents an overview of our results of operations for the year ended December 31, 2010 compared to the year ended December 31, 2009, and for the year ended December 31, 2009 compared to the year ended December 31, 2008.
Year Ended December 31, 2010 Compared to the Year Ended December 31, 2009
|
Year Ended |
Year Ended | ||||||
|
December 31, 2010 |
December 31, 2009 | ||||||
|
$ |
% of Net Sales |
$ |
% of Net Sales | ||||
|
Statement of Operations Data: |
(dollar amounts in thousands) | ||||||
|
Net sales |
$ 785,086 |
100.0% |
$ 673,733 |
100.0% | |||
|
Cost of sales |
684,168 |
87.1% |
596,764 |
88.6% | |||
|
Selling, general and adminstrative expenses |
66,491 |
8.5% |
55,894 |
8.3% | |||
|
Interest expense |
36,379 |
4.6% |
28,592 |
4.2% | |||
|
Other income, net |
(1,035) |
-0.1% |
(468) |
-0.1% | |||
|
Loss before income taxes |
(917) |
-0.1% |
(7,049) |
-1.0% | |||
|
Provision for (benefit from) income taxes |
1,857 |
0.3% |
(1,114) |
-0.1% | |||
|
Net loss |
$ (2,774) |
-0.4% |
$ (5,935) |
-0.9% | |||
Net Sales. Net sales for the year ended December 31, 2010 increased by $111.4 million or approximately 16.5% compared with the same period in 2009. This increase is primarily attributable to additional net sales related to EMCS of approximately $74.3 million. Excluding EMCS, net sales increased $37.1 million, or 5.5%, due to an increase in volume of approximately 2.5% and an increase in average selling price of approximately 3%. The increase in average selling price would have been smaller if not for the favorable exchange rate impact of $6.0 million. The increase in sales volume was driven by increases across all segments, with the exception of the pet food and specialty packaging segment, and average selling prices increased across all segments.
Cost of Sales. Cost of sales for the year ended December 31, 2010 increased by $87.4 million, or approximately 14.6 %, over the same period in 2009. This increase is primarily attributable to cost of sales related to the increase in net sales associated with the EMCS acquisition of approximately $63.3 million. Excluding the effects of EMCS, cost of sales as a percentage of net sales decreased to 87.4% of net sales, or $620.9 million for the year ended December 31, 2010 from 88.6% of net sales, or $596.8 million for the year ended December 31, 2009. Cost of sales for the year ended December 31, 2010 was favorably impacted by operational efficiencies such as higher productivity and lower waste and favorable manufacturing overhead costs resulting from reduced incentive compensation and headcount reductions, and increased depreciation related to accelerated depreciation on certain property, plant and equipment.
Selling, General and Administrative (“SG&A”) Expenses. SG&A expenses for the year ended December 31, 2010 increased $10.6 million, or 19.0% compared to the same period in 2009. Excluding the increase in SG&A related to EMCS of approximately $5.0 million, SG&A expenses increased by approximately $5.6 million or 10.0%. The significant components of the total increase in SG&A expenses, excluding SG&A expenses attributable to EMCS, were $4.6 million of acquisition costs related to EMCS, an increase in startup and transition costs of $1.4 million, primarily related to the integration of EMCS, an increase of $1.9 million in professional services, primarily related to process improvement consulting, an increase of $505,000 in management fees, and other lesser increases totaling $1.0 million. These increased expenses were partially offset by a decrease in salaries and benefits of $1.2 million, primarily due to a decrease in incentive compensation under the management incentive plan, a decrease of $831,000 in expenses related to the closure of one of our Canadian facilities that occurred in 2009, a decrease of $645,000 in loss on the sale of property, plant and equipment, a decrease of $630,000 in startup and transition costs, and a decrease of $539,000 in severance costs.
Interest Expense. Interest expense for the year ended December 31, 2010 increased $7.8 million or approximately 27.2% compared to the same period in 2009 primarily due to interest expense associated with the new debt incurred during the last six months of 2010 in connection with the EMCS acquisition, amortization of deferred loan costs associated with the new debt and interest expense related to capital lease obligations.
Other Income, net. Other income for the year ended December 31, 2010 increased by approximately $567,000, or approximately 121.2%, compared to the same period in 2009. Excluding other income related to EMCS, other income increased by approximately $405,000. Other income for the year ended December 31, 2010, excluding EMCS, was comprised primarily of insurance proceeds of $1.0 million received in 2010 related to the third quarter 2009 press fire at one of our consumer food and specialty packaging facilities. Other income for the year ended December 31, 2009 was comprised primarily of net foreign exchange gains related to our Canadian and United Kingdom operations.
28
Income Tax (Benefit) Expense. We recorded income tax expense of $1.9 million for the year ended December 31, 2010, on a loss before income taxes of approximately $917,000. The income tax benefit recorded for the year ended December 31, 2009 was $1.1 million, based on a loss before income taxes of $7.0 million. During 2010, we provided for deferred U.S. taxes on all undistributed earnings from our U.K. subsidiaries through December 31, 2010. Prior to 2010, we had not recognized a deferred tax liability for earnings from our U.K. subsidiaries because we considered these earnings to be permanently invested overseas. During the fourth quarter of 2010, we determined that these earnings should no longer be considered indefinitely invested as a result of the continued success of our U.K. operations and concurrent increase in the need for funds to service the additional indebtedness incurred for the EMCS acquisition and other business strategies. As a result, we recognized $1.2 million of tax expense providing for deferred U.S. taxes for earnings from these subsidiaries. In addition, we recorded a valuation allowance of approximately $670,000 related to foreign losses in Canada for which we believe we will not receive a benefit.
Reportable Segments. Our pet food and specialty packaging segment had net sales of approximately $231.9 million and $233.2 million, and operating income of approximately $24.4 million and $26.1 million for the years ended December 31, 2010 and 2009, respectively. The decrease in net sales was primarily due to a 5% decrease in sales volume, primarily attributable to unfavorable sewn bag volume, a product line which we exited, partially offset by an increase in average selling price of approximately 4%. The decrease in operating income of $1.7 million, or 6%, was largely due to the decrease in sales, increased selling, general and administrative expenses, increased costs related to certain operational and business changes, accelerated depreciation expense and increased losses on sales and disposition of property, plant and equipment, partially offset by favorable incentive compensation.
Our consumer food and specialty packaging segment had net sales of approximately $304.4 million and $211.1 million, and operating income of $18.7 million and $4.2 million, for the years ended December 31, 2010 and 2009, respectively. The increase in net sales is primarily attributable to net sales related to EMCS of approximately $74.3 million. Excluding EMCS, net sales increased $19.0 million, or 9%, primarily due to an increase in volume of approximately 5% and favorable pricing of 4%, including favorable foreign exchange of $6.6 million. The increase in operating income of approximately $8.5 million, excluding operating income of $6.0 million related to EMCS, was due to the increased sales and favorable manufacturing overhead costs and operational efficiencies such as higher productivity and lower waste and selling, general and administrative expenses, partially offset by an increase in depreciation expense, primarily related to accelerated depreciation on certain property, plant and equipment replaced in the latter part of 2010.
Our performance packaging segment had net sales of $171.6 million and $163.6 million, and operating income of $12.1 million and $9.9 million, for the years ended December 31, 2010 and 2009, respectively. The increase in net sales was primarily due to increased sales volume of 3%, largely due to favorable conditions in the building materials and construction industry, as well as an increase in the average selling price of 2%. The increase in operating income of $2.2 million, or 23%, was primarily attributable to the increase in net sales and favorable manufacturing overhead resulting from headcount reductions, partially offset by an increase in depreciation expense related to assets placed in service and accelerated depreciation expense for certain equipment to be removed in 2011.
Our coated products segment had net sales of $77.2 million and $65.8 million, and operating income of $11.7 million and $5.5 million, for the years ended December 31, 2010 and 2009, respectively. The increase in net sales was primarily a result of increased volume across several markets, particularly in the optical films, medical, conductives, and commercial printing markets. The increase in operating income of $6.2 million, or 113%, was primarily the result of increased sales, favorable sales mix and to a lesser extent, favorable selling, general and administrative expenses.
Corporate operating loss, which includes certain unallocated corporate costs, increased approximately $8.0 million for the year ended December 31, 2010 as compared to the same period in 2009. The increase in corporate operating loss is largely attributable to increased startup and transition costs, primarily related to the EMCS acquisition and an increase in professional services, primarily related to process improvement consulting and increased management fees, partially offset by reduced incentive compensation under our management incentive plan and decreased severance costs. In addition, certain corporate costs were no longer allocated to a segment during 2010 due to the realignment of certain personnel.
29
Year Ended December 31, 2009 Compared to the Year Ended December 31, 2008
|
Year Ended |
Year Ended | ||||||
|
December 31, 2009 |
December 31, 2008 | ||||||
|
$ |
% of Net Sales |
$ |
% of Net Sales | ||||
|
Statement of Operations Data: |
(dollar amounts in thousands) | ||||||
|
Net sales |
$ 673,733 |
100.0% |
$ 781,732 |
100.0% | |||
|
Cost of sales |
596,764 |
88.6% |
699,524 |
89.5% | |||
|
Selling, general and administrative expenses |
55,894 |
8.3% |
57,179 |
7.3% | |||
|
Interest expense |
28,592 |
4.2% |
30,991 |
4.0% | |||
|
Other expense (income), net |
(468) |
-0.1% |
1,371 |
0.2% | |||
|
Loss before income taxes |
(7,049) |
-1.0% |
(7,333) |
-0.9% | |||
|
Benefit from income taxes |
(1,114) |
-0.1% |
(1,215) |
-0.1% | |||
|
Net loss |
$ (5,935) |
-0.9% |
$ (6,118) |
-0.8% | |||
Net Sales. Net sales for the year ended December 31, 2009 decreased by $108.0 million or approximately 13.8% compared with the same period in 2008. This decrease in net sales from 2008 was largely attributable to a decrease in total sales volume of 12%, primarily related to unfavorable economic conditions in several markets, especially in the building materials market, lower sales in the pet food market due to pet food customers launching new products and using up existing stock supplies, decreased pricing of 2% primarily driven by lower resin costs that were passed on to customers (see cost of sales discussion below) and unfavorable changes in foreign exchange rates.
Cost of Sales. Cost of sales for the year ended December 31, 2009 decreased by $102.8 million, or approximately 14.7%, over the same period in 2008. Cost of sales as a percentage of net sales decreased to 88.6% of net sales, or $596.8 million for the year ended December 31, 2009, as compared with 89.5% of net sales, or $699.5 million for the year ended December 31, 2008. This decrease in cost of sales as a percentage of net sales was primarily attributable to improved material margins due to decreased resin costs as compared to the same period in 2008. Resin prices experienced significant volatility during 2008 as evidenced by an increase of approximately $0.18/lb during the period from April 2008 through August 2008, followed by a decline of approximately $0.48/lb during the period from September 2008 through December 2008. Resin prices experienced an increase of approximately $0.17/lb during the period from January 2009 through December 2009, though the increase was not as significant and did not occur as quickly as resin prices came down in the latter part of 2008. We typically experience a lag in time before we can pass any raw material increases or decreases on to our customers, and accordingly, at the end of 2008, we had not realized the full benefit of the resin price decreases because higher priced resins remained in our inventory. During the first quarter of 2009, we were able to fully realize the benefit of these price decreases.
Selling, General and Administrative (“SG&A”) Expenses. SG&A expenses for the year ended December 31, 2009 decreased $1.3 million, or approximately 2.2% compared to the same period in 2008. The decrease in SG&A expense was largely due to a decrease of $3.2 million in startup and transition costs related to EAC and EPF, a decrease of approximately $675,000 in travel and entertainment expenses, a decrease of approximately $637,000 in bad debt expense, a decrease of approximately $473,000 in loss on sales and dispositions of property, plant and equipment, a decrease of $600,000 related to the consolidation of one of our Canadian facilities from two buildings into one, a decrease in customer commissions of $401,000 due to the reduction in sales, a decrease of $268,000 in amortization related to the write down of two patents in 2008 and a patent that became fully amortized during 2009, a decrease of $209,000 related to exit costs at one of our domestic pouch facilities, and other lesser decreases totaling $1.0 million across several cost categories. These decreased expenses were partially offset by an increase in salaries and benefits of $2.5 million, primarily attributable to increased incentive compensation under our MIP, an increase of $1.6 million in professional fees, primarily related to process improvement consulting incurred in the fourth quarter of 2009, an increase of $1.1 million in severance, an increase of $831,000 related to the closure of one of our Canadian facilities, and other lesser increases totaling approximately $195,000.
Interest Expense. Interest expense for the year ended December 31, 2009 decreased $2.4 million or approximately 7.7% compared to the same period in 2008 primarily due to a reduction in average borrowings during the period as well as a reduction in the average interest rate under our Senior Credit Facility.
Other (Income) Expense, net. Other income for the year ended December 31, 2009 increased by approximately $1.8 million compared to the same period in 2008. Other income is comprised primarily of foreign exchange gains and losses related to our Canadian and United Kingdom operations. The increase in other income is primarily due to an exchange gain recorded on our intercompany note with our United Kingdom operations during the year ended December 31, 2009 as a result of the overall strengthening of the British pound against the United States dollar compared to an exchange loss on our intercompany note with our United Kingdom operations for the year ended December 31, 2008 as a result of the overall weakening of the British pound against the United States dollar.
30
Income Tax (Benefit) Expense. Income tax benefit for the year ended December 31, 2009 resulted from a loss before income taxes of $7.0 million. Income tax benefit for the prior year period resulted from a loss before income taxes of $7.3 million. The effective tax rates for the years ended December 31, 2009 and 2008 were 16% and 17%, respectively, and these rates reflect certain foreign losses which we do not believe will result in a tax benefit. In addition, the 2009 period reflects the impact of a $0.6 million out of period non-cash charge for unfavorable return to provision true-ups primarily related to “deemed dividends” which were made in 2008 to the U.S. under Section 956 of the Internal Revenue Code. We have evaluated this out of period charge, which reduced deferred tax assets, and determined that it was not material to either 2009 or 2008. The jurisdictions in which earnings or deductions are realized may differ from our current estimates.
Reportable Segments. The pet food and specialty packaging segment had net sales of approximately $233.2 million and $267.5 million, and operating income of approximately $26.1 million and $27.2 million for the years ended December 31, 2009 and 2008, respectively. The decrease in net sales was primarily volume driven as well as due to certain customers in the pet food market launching new products and working through existing stock inventories. The decrease in operating income was due to the impact from lower volumes, increased incentive compensation under our MIP and the decrease in net sales, partially offset by improved operational efficiencies, such as higher productivity and lower waste.
The consumer food and specialty packaging segment had net sales of approximately $211.1 million and $236.2 million, and operating income of $4.2 million and $2.7 million, for the years ended December 31, 2009 and 2008, respectively. The decrease in net sales was due primarily to a 7% decrease in average selling price resulting from the contractual pass-through of resin price decreases in the first six months of 2009, a 4% decrease in sales volume, and to a lesser extent the impact of unfavorable exchange rates. The increase in operating income was due to improved material margins due to decreased resin costs as compared to 2008. Resin prices experienced volatility during 2008 as evidenced by an increase of approximately $0.18/lb during the period from April 2008 through August 2008, followed by a decline of approximately $0.48/lb during the period from September 2008 through December 2008. Resin prices experienced an increase of approximately $0.17/lb during the period from January 2009 through December 2009, though the increase was not as significant and did not occur as quickly as resin prices came down in the latter part of 2008. We typically experience a lag in time before we can pass any raw material increases or decreases on to our customers, and accordingly, at the end of 2008, we had not realized the full benefit of the resin price decreases because higher priced resins remained in our inventory. During the first quarter of 2009, we were able to fully realize the benefit of these price decreases. The increase in operating income period over period was also due, to a lesser extent, to improved operational efficiencies, such as higher productivity and lower waste, partially offset by increased incentive compensation under our MIP.
The performance packaging segment had net sales of $163.6 million and $202.2 million, and operating income of $9.9 million and $13.2 million, for the years ended December 31, 2009 and 2008, respectively. The decrease in net sales was largely comprised of a 15% decrease in volume primarily due to unfavorable economic conditions in the building materials market and to a lesser extent a decrease in selling price of 4% resulting from the contractual pass-through of resin price decreases. The decrease in operating income was primarily due to the decrease in sales.
The coated products segment had net sales of $65.8 million and $75.8 million, and operating income of $5.5 million and $6.0 million, for the years ended December 31, 2009 and 2008, respectively. The decrease in net sales was primarily a result of ongoing unfavorable economic conditions and the impact of unfavorable foreign exchange rates. The decrease in operating income of approximately $458,000 was primarily due to reduced sales and the impact of unfavorable foreign exchange rates, partially offset by reduced selling, general and administrative expenses.
Corporate operating loss, which includes certain unallocated corporate costs, increased to $24.6 million for the year ended December 31, 2009 as compared to $24.1 million for the same period in 2008. This increase in corporate operating loss is largely the result of increased incentive compensation under our MIP, increased professional services, primarily related to process improvement, consulting and increased severance, partially offset by reduced startup and transition costs related to EAC and EPF, decreased exit activity costs and favorable bad debt expense. See Note 11 to our consolidated financial statements included elsewhere in this annual report for further discussion of segment data.
Liquidity and Capital Resources
Cash Flows for the Year Ended December 31, 2010
Cash flows provided by operating activities for the year ended December 31, 2010 of $29.6 million consisted primarily of cash provided by earnings, which were partially offset by net unfavorable changes in working capital. Cash provided by earnings was $32.4 million (net loss of $2.8 million adjusted to exclude the effect of non-cash charges for depreciation and amortization of $33.7 million plus other non-cash items that net to approximately $1.5 million, including stock compensation expense, deferred income tax provision and loss on sales and disposition of property, plant and equipment). The net unfavorable working capital changes resulted from increases in inventories, trade accounts receivable and prepaid expenses, other receivables and other assets, partially offset by increases in accounts payable and accrued liabilities derived from existing operations and the purchased EMCS working capital. Inventories increased $10.5 million due largely to increased raw material costs and increased sales volume, trade accounts receivable increased $5.4 million due to increased sales volume, prepaid expenses, other receivables and other assets increased $2.6 million due to deposits made in conjunction with 2010 lease activity, accounts payable and accrued liabilities increased $15.8 million due primarily to an increase in accounts payable resulting from rising raw material costs and the EMCS acquisition.
31
Cash flows used in investing activities for the year ended December 31, 2010 were $100.3 million, primarily comprised of the purchase price associated with the EMCS acquisition and capital expenditures for property, plant and equipment.
Cash flows provided by financing activities for the year ended December 31, 2010 were $72.7 million, primarily comprised of $100.0 million related to the Additional Notes issued to repay borrowings incurred to fund the EMCS acquisition, partially offset by net repayments made under our Senior Credit Facility as well as deferred loan costs paid during the year of $12.9 million related to the 2010 financing activity.
The effect of exchange rate changes on assets and liabilities of our foreign subsidiaries used approximately $128,000 in cash for the year ended December 31, 2010.
Cash Flows for the Year Ended December 31, 2009
Cash flows provided by operating activities for the year ended December 31, 2009 of $26.0 million were primarily due to cash provided by earnings and positive working capital trends. Cash flows provided by earnings were $18.8 million (net loss of $5.9 million adjusted to exclude the effect of non-cash charges for depreciation and amortization of $25.5 million less other non-cash items that net to approximately $715,000, including stock compensation expense, deferred income tax provision and loss on sales and disposition of property, plant and equipment). The positive working capital trend was largely attributable to decreases in inventories of $13.4 million and trade accounts receivable of $6.7 million, as a result of the decrease in sales volume in 2009 and lower prices due to the pass through of lower resin prices. These items were partially offset by a decrease in accounts payable and accrued and other liabilities of $10.5 million, which were primarily comprised of decreases in accrued health benefits, accrued incentive benefits, accrued rebates, and accrued workers compensation, as well as other miscellaneous accrued liabilities and to a lesser extent, an increase of $2.6 million in prepaid assets, other receivables and other assets due to increases in foreign goods and services tax receivables.
Cash flows used in investing activities for the year ended December 31, 2009 were $19.7 million, primarily comprised of costs associated with capital expenditures for property, plant and equipment, partially offset by proceeds from sales of property, plant and equipment.
Cash flows used in financing activities for the year ended December 31, 2009 were $6.9 million, primarily comprised of net repayments made on our Senior Credit Facility.
The effect of exchange rate changes on assets and liabilities of our foreign subsidiaries used approximately $396,000 in cash for the year ended December 31, 2009.
Capital Resources
11.25% Senior Notes due 2014
On January 31, 2006, we completed an unregistered private offering of $220.0 million aggregate principal amount of 11.25% Senior Notes due 2014. Pursuant to an exchange offer in December 2006, we exchanged all of the 11.25% Senior Notes for 11.25% Senior Notes registered under the Securities Act of 1933 (the “Existing Notes”). On September 24, 2010, we completed the private placement of $100.0 million in principal amount of 11.25% Senior Notes due 2014 (the “Additional Notes”). The Additional Notes were issued as additional notes under the indenture pursuant to which the Company issued the Existing Notes. The Additional Notes are treated as a single series with the Existing Notes under the indenture and have the same terms as the Existing Notes. On November 30, 2010, the Company completed an offer to exchange registered notes for the Additional Notes as required by the terms of a registration rights agreement related to the Additional Notes. Approximately $1.0 million in principal amount of 11.25% Senior Notes due 2014 were not tendered for exchange and, remain private, unregistered notes. The Existing Notes together with the Additional Notes and the private unregistered notes are referred to in this annual report as the “Notes.”
The Notes mature on February 1, 2014 and bear interest at 11.25% per annum payable in semi-annual installments on February 1 and August 1 of each year.
The Notes are fully and unconditionally guaranteed on a senior unsecured basis by all of our existing and future domestic restricted subsidiaries. The Notes and the guarantees rank senior to all of our and our guarantors’ future subordinated indebtedness. The Notes and the guarantees are effectively subordinated to all of our and the guarantors’ secured indebtedness, including our Senior Credit Facility (see description below), to the extent of the value of the assets securing that indebtedness.
32
We may redeem the Notes, in whole or in part, at a redemption price equal to 100.0% of the principal amount, plus a premium declining ratably to par, plus accrued and unpaid interest to the date of redemption. If we experience a change of control, we may be required to offer to purchase the Notes at a purchase price equal to 101.0% of the principal amount, plus accrued and unpaid interest to the date of redemption.
The indenture governing the Notes contains covenants that limit our ability to, among other things: (1) incur additional indebtedness or issue preferred stock, (2) pay dividends or make other distributions or repurchase or redeem our stock or subordinated indebtedness, (3) make investments, (4) sell assets and issue capital stock of restricted subsidiaries, (5) incur liens, (6) enter into agreements restricting our subsidiaries’ ability to pay dividends, (7) enter into transactions with affiliates and (8) consolidate, merge or sell all or substantially all of our assets.
Senior Secured Asset-Based Revolving Credit Facility
On January 31, 2006, we entered into a senior secured revolving credit facility with a syndicate of financial institutions. On August 6, 2007, in order to help fund the EEF Acquisition, we amended this facility, which primarily provided for an increase in the maximum credit facility to $75.0 million and we included a Canadian dollar sub-facility available to our Canadian subsidiaries for up to $15.0 million (or the Canadian dollar equivalent). A reserve is established in the U.S. for the U.S. dollar equivalent of amounts outstanding under the Canadian sub-facility. On October 31, 2007, in order to help fund the EPF Acquisition, we again amended this facility, which primarily provided for an increase in the maximum credit facility to $110.0 million and amended certain borrowing base limitations. On July 2, 2010, the loan agreement related to this facility was amended and restated to provide for an increase in the maximum credit facility to $125.0 million (the “Senior Credit Facility”). The Senior Credit Facility also provides the Company’s domestic and Canadian subsidiaries with letter of credit sub-facilities. Availability under the Senior Credit Facility is subject to borrowing base limitations for both the U.S. and the Canadian subsidiaries, as defined in the loan agreement. Under the terms of our lockbox arrangement, remittances automatically reduce the revolving debt outstanding on a daily basis and therefore our Senior Credit Facility is classified as a current liability at December 31, 2010 and 2009 on the consolidated balance sheets included elsewhere in this annual report. Our Senior Credit Facility contains certain customary affirmative and negative covenants that restrict our ability to, among other things, incur additional indebtedness, grant liens, engage in mergers, acquisitions and asset sales, declare dividends and distributions, redeem or repurchase equity interests, incur contingent obligations, prepay certain subordinated indebtedness, make loans, certain payments and investments and enter into transactions with affiliates. Approximately $56.9 million and $68.6 million of borrowings under our Senior Credit Facility was outstanding as of December 31, 2010 and 2009, respectively, and approximately $58.0 million and $25.1 million, was available for borrowings under the Senior Credit Facility at December 31, 2010 and 2009, respectively. The outstanding amount in 2010 was primarily attributable to borrowings to fund operations, start-up and transition costs related to the EMCS acquisition and capital expenditures.
Liquidity and Capital Outlook
We fund our liquidity needs for capital expenditures, working capital and scheduled interest and principal payments through cash flow from operations and borrowings under our Senior Credit Facility. Since the second half of 2008 global financial markets have experienced significant liquidity challenges. Despite certain government intervention, capital market financing has become less available and more expensive. Notwithstanding the recent disruption of the capital and credit markets, we believe we have sufficient liquidity to meet our needs for the foreseeable future, although continued market disruption may result in increased borrowing costs associated with our Senior Credit Facility. Management continues to monitor events and the financial institutions associated with our Senior Credit Facility, including monitoring credit ratings and outlooks. In the event that we require additional liquidity beyond our cash flows and borrowings available under our Senior Credit Facility due to market conditions, unexpected actions by our lenders, changes to our growth strategy, or other factors, our ability to obtain any additional financing on favorable terms, if at all, could be severely limited.
We expect to incur approximately $40.6 million in interest expense related to the Notes in 2011, including amortization of related deferred financing costs and fees. In addition, we currently anticipate that our capital expenditures for 2011 will be approximately $37.8 million. To pay for the interest expense on the Notes and anticipated capital expenditures, we plan to utilize internally generated funds and funds available under our Senior Credit Facility. Approximately $56.9 million of borrowings were outstanding and $58.0 million was available for borrowings under our Senior Credit Facility as of December 31, 2010. Management believes that, based on current and anticipated financial performance, cash flows from operations and borrowings under our Senior Credit Facility will be adequate to meet anticipated requirements for capital expenditures, working capital and scheduled interest and principal payments for the coming year.
As noted above, both the indenture governing the Notes and the credit agreement governing our Senior Credit Facility contain certain covenants that, among other things, restrict our ability to borrow additional money, pay dividends, make investments, create liens, enter into transactions with affiliates and sell assets or enter into mergers with others. The Senior Credit Facility matures on November 2, 2013, and the Notes mature in 2014. We may not generate sufficient cash flow from operations or may not be able to obtain sufficient funding to satisfy all of our obligations, including those noted above. If we are unable to pay our obligations, we may be required to pursue one or more alternative strategies, such as selling assets, or refinancing or restructuring our indebtedness. Such alternative strategies may not be feasible or may not be adequate to satisfy our obligations.
33
Although we currently have no specific acquisitions planned, one of our potential growth strategies is growth through acquisitions, which may require additional funding. In such case, although we believe that we would be able to borrow additional funds beyond our current credit lines, there can be no assurance that such financing would be available or, if so, on terms that are acceptable to us, especially in light of the current liquidity crisis.
Our ability to pay dividends is subject to the terms of the indenture governing the Notes, the terms of our Senior Credit Facility, and the discretion of our Board of Directors. We currently have no plans to pay dividends.
Contractual Obligations
The following table summarizes the scheduled payments and obligations under our contractual and other commitments at December 31, 2010.
|
Payments Due by Period | ||||||||||
|
Contractual Obligations |
Total |
2011 |
2012-2013 |
2014-2015 |
Beyond 2015 | |||||
|
(dollar amounts in thousands) | ||||||||||
|
Long-term debt obligations: |
||||||||||
|
Senior Notes due 2014 |
$ 320,000 |
$ - |
$ - |
$ 320,000 |
$ - | |||||
|
Senior revolving credit facility(1) |
56,906 |
56,906 |
- |
- |
- | |||||
|
Capital lease obligations(2) |
16,773 |
2,859 |
5,368 |
3,516 |
5,030 | |||||
|
Term loan |
33 |
33 |
- |
- |
- | |||||
|
Total debt obligations |
393,712 |
59,798 |
5,368 |
323,516 |
5,030 | |||||
|
Pension funding obligations(3) |
21,228 |
3,008 |
8,398 |
6,456 |
3,366 | |||||
|
Operating lease obligations |
42,358 |
9,534 |
16,018 |
9,178 |
7,628 | |||||
|
Purchase commitments(4) |
20,200 |
10,100 |
10,100 |
- |
- | |||||
|
Interest payments (5) |
126,000 |
36,000 |
72,000 |
18,000 |
- | |||||
|
Total contractual obligations |
$ 603,498 |
$ 118,440 |
$ 111,884 |
$ 357,150 |
$ 16,024 | |||||
(1) Under the terms of the lockbox arrangement, remittances automatically reduce the revolving debt outstanding on a daily basis and therefore the entire amount outstanding under our Senior Credit Facility is classified as a current liability. As a result, the entire amount is presented as a payment due in 2011, even though the Senior Credit Facility does not mature until November 2, 2013.
(2) Includes principal and interest payments on capital leases.
(3) Represents currently estimated amounts.
(4) Represents purchase obligations related to an ink supplier.
(5) Includes payments on outstanding fixed-rate, long-term debt obligations.
Off-Balance Sheet Arrangements
During 2009, we entered into a joint venture agreement with INDEVCO Group, a Lebanese-based manufacturer (“INDEVCO”). We determined that the joint venture is a variable interest entity (“VIE”) under FASB guidance related to accounting for variable interest entities and that we are not the primary beneficiary of the VIE. The VIE consists of a manufacturing operation, located within an existing manufacturing facility owned by INDEVCO in Lebanon, used to co-extrude polyethylene film for use in flexible packaging. During the year ended December 31, 2010, the VIE purchased and installed the necessary extrusion equipment and production commenced in the third quarter of 2010. Our maximum exposure to loss as a result of our involvement with the unconsolidated VIE is limited to our recorded investment in this VIE, which was approximately $768,000 at December 31, 2010. We recognized approximately $57,000 as our share of the joint venture’s loss from operations during the year ended December 31, 2010 and approximately $425,000 was invested during the year ended December 31, 2010. We may be subject to additional losses to the extent of any financial support we provide in the future.
Recently Issued Accounting Pronouncements
In June 2009, the FASB issued SFAS No. 167, Amendments to FASB Interpretation No. 46(R), a grandfathered standard under the FASB’s Accounting Standards Codification. SFAS No. 167 amends the consolidation guidance that applies to variable interest entities to require an enterprise to perform an analysis to determine whether the enterprise’s variable interest or interests give it a controlling financial interest in a variable interest entity. The standard requires ongoing reassessments of whether an enterprise is the primary beneficiary of a variable interest entity. The standard is effective as of the beginning of a reporting entity’s first annual reporting period that begins after November 15, 2009, and for interim periods within that first annual reporting period. The adoption of this guidance for the year ended December 31, 2010 did not have a material impact on our financial position, results of operations or cash flows.
34
No other significant new accounting guidance became effective for us during the year ended December 31, 2010. As of December 31, 2010, there was no issued guidance pending future adoption that is expected to have a significant impact on our financial statements when adopted.
ITEM 7A. QUANTITATIVE AND QUALITATIVE DISCLOSURES ABOUT MARKET RISK
We are exposed to various market risks as described below. Market risk is the potential loss arising from adverse changes in market prices and rates. We do not enter into derivative or other financial instruments for trading or speculative purposes.
Interest Rates. We are exposed to market risk in the form of interest rate risk related to borrowings under our Senior Credit Facility. Borrowings under the U.S. portion of our Senior Credit Facility accrue interest at a variable annual rate equal to the U.S. Index Rate (as determined in accordance with the loan agreement related to our Senior Credit Facility) plus 2.0% or, upon our prior notice, at a variable annual rate equal to LIBOR plus 3.0% (as determined in accordance with the loan agreement related to our Senior Credit Facility). Borrowings under the Canadian sub-facility portion of our Senior Credit Facility accrue interest at a variable annual rate equal to the Canadian Index Rate (as determined in accordance with the loan agreement related to our Senior Credit Facility) plus 2.0% or, upon our prior notice, at a variable annual rate equal to the BA Rate (as determined in accordance with the loan agreement related to our Senior Credit Facility) plus 3.0%. Because these rates may increase or decrease at any time, we are subject to the risk that they may increase, thereby increasing the interest rates applicable to our borrowings under the Senior Credit Facility. Increases in the applicable rates would increase our interest expense and reduce our net income or increase our net loss. We do not have any instruments in place, such as interest rate swaps or caps, which would mitigate our exposure to interest rate risk related to these borrowings. As of December 31, 2010, $56.9 million was outstanding under the Senior Credit Facility and accruing interest at a weighted average rate of approximately 3.5% per annum. Based on this amount of borrowings under the Senior Credit Facility, the effect of a hypothetical one percent increase in interest rates would increase our annual interest expense by approximately $569,000.
Commodity Prices. We purchase commodities, such as paper, resin, films, energy, and various fuels which are subject to price fluctuations. We do not currently engage in the hedging of commodities. Commodities are generally purchased at market or fixed prices that are established by the vendor as part of the purchase process for quantities expected to be consumed in the ordinary course of business. Although the average selling prices of resin-based products in our consumer food and specialty packaging and performance packaging segments generally increase or decrease as the cost of resins increases or decreases, the impact of a change in resin prices is more immediately reflected in our raw material costs than in our selling prices. We monitor the correlation between commodity prices and our selling prices and will continue to consider hedging alternatives in the future to reduce the effect of price fluctuations.
Currency and Exchange Rates. The majority of our revenues, operating expenses and significant capital expenditures are denominated in U.S. dollars; however we do have some exposure to foreign currency risk related to our operations in the United Kingdom and Canada, our Canadian sub-facility and interactions with our foreign subsidiaries. Transactions in other currencies are translated into U.S. dollars using the rates in effect as of the date of such transactions. We have not entered into any foreign currency forward contracts or similar arrangements to limit our exposure to foreign exchange rate fluctuations, but we may consider such arrangements in the future.
ITEM 8. FINANCIAL STATEMENTS AND SUPPLEMENTARY DATA
Our consolidated financial statements required by this item are included on the pages immediately following the Index to Consolidated Financial Statements appearing on page F-1.
ITEM 9. CHANGES IN AND DISAGREEMENTS WITH ACCOUNTANTS ON ACCOUNTING AND FINANCIAL DISCLOSURE
None.
ITEM 9A. CONTROLS AND PROCEDURES
Evaluation of Disclosure Controls and Procedures
The Company’s management has established disclosure controls and procedures designed to ensure that information required to be disclosed by the Company in the reports that it files or submits under the Securities Exchange Act of 1934, as amended (the “Exchange Act”) is recorded, processed, summarized and reported within time periods specified in the SEC’s rules and forms. Such disclosure controls and procedures include, without limitation, controls and procedures designed to ensure that information required to be disclosed by the Company in the reports that it files or submits under the Exchange Act is accumulated and communicated to the Company’s management to allow timely decisions regarding required disclosure.
35
Based on management’s evaluation as of the end of the period covered by this Annual Report on Form 10-K, the Company’s Chief Executive Officer and Chief Financial Officer have concluded that the Company’s disclosure controls and procedures (as defined in Rules 13a-15(e) and 15d-15(e) promulgated under the Exchange Act) were effective as of the end of the period covered by this Annual Report on Form 10-K.
Management’s Report on Internal Control Over Financial Reporting
The Company’s management is responsible for establishing and maintaining adequate internal control over financial reporting for the Company, as such term is defined in Rule 13a-15(f) and Rule 15d-15(f) promulgated under the Exchange Act. Internal control over financial reporting is a process designed to provide reasonable assurance regarding the reliability of financial reporting and the preparation of financial statements for external purposes in accordance with accounting principles generally accepted in the United States of America. Internal control over financial reporting includes those policies and procedures that (i) pertain to the maintenance of records that, in reasonable detail, accurately and fairly reflect the transactions and dispositions of the Company’s assets; (ii) provide reasonable assurance that transactions are recorded as necessary to permit preparation of the financial statements in accordance with accounting principles generally accepted in the United States of America, and that receipts and expenditures are being made only with proper authorizations; and (iii) provide reasonable assurance regarding prevention or timely detection of unauthorized acquisition, use or disposition of the Company’s assets that could have a material effect on the financial statements.
Because of its inherent limitations, internal control over financial reporting may not prevent or detect misstatements. Also, projections of any evaluation of effectiveness to future periods are subject to the risk that controls may become inadequate because of changes in conditions, or that the degree of compliance with the policies or procedures may deteriorate.
The Company’s management, under the supervision of and with the participation of the Chief Executive Officer and the Chief Financial Officer, assessed the effectiveness of the Company’s internal control over financial reporting as of December 31, 2010 based on the criteria and framework for effective control over financial reporting described in Internal Control — Integrated Framework issued by the Committee of Sponsoring Organizations of the Treadway Commission. Based on this assessment, the Company’s management concluded that its internal control over financial reporting was effective as of December 31, 2010.
Changes in Internal Control Over Financial Reporting
There was no change in the Company’s internal control over financial reporting that occurred during the quarter ended December 31, 2010 that has materially affected, or is reasonably likely to materially affect, the Company’s internal control over financial reporting (as defined in Rule 13a-15(f) and 15d-15(f) under the Exchange Act).
This annual report does not include an attestation report of the Company’s registered public accounting firm regarding internal control over financial reporting. Management’s report was not subject to attestation by the Company’s registered public accounting firm pursuant to the rules of the Securities and Exchange Commission that permit the Company to provide only management’s report in this annual report.
ITEM 9B. OTHER INFORMATION
None.
PART III
ITEM 10. DIRECTORS, EXECUTIVE OFFICERS AND CORPORATE GOVERNANCE
Our amended and restated certificate of incorporation and bylaws provide that our business is to be managed by, or under the direction of, our Board of Directors. Our bylaws provide that directors are elected at our annual meeting to serve until the subsequent annual meeting of our stockholders or until their earlier resignation or removal. There are currently four vacancies on our Board of Directors. Pursuant to our bylaws, the Board of Directors may fill these vacancies or, alternatively, may reduce the size of the board to eliminate these vacancies. As of the date of this annual report, the Board of Directors has not taken any action with respect to these vacancies. Our officers serve at the pleasure of our Board of Directors.
The names of the persons, who now serve as our directors and executive officers, as well as other key employees, are set forth below:
|
|
|
| |
|
Name
|
Age
|
Position
| |
|
Executive Officers |
|
| |
|
Jack E. Knott |
56 |
Chairman, Chief Executive Officer and Secretary | |
|
Tom Vale |
49 |
President and Chief Financial Officer | |
|
|
|
| |
|
Other Key Employees |
|
| |
|
Robert H. Arvanites |
45 |
Senior Vice President and General Manager | |
|
Jeffrey S. Ross |
53 |
Senior Vice President and General Manager | |
|
Gene Welsh |
47 |
Senior Vice President and General Manager | |
|
|
|
| |
|
Other Directors |
|
| |
|
Michael E. Alger |
54 |
Director | |
|
Clarence E. Terry |
64 |
Director | |
|
Mark Brody |
49 |
Director | |
36
Presented below is information with respect to each of our executive officers, key employees and directors. The information presented for each director includes the specific experience, qualifications, attributes and skills that led us to the conclusion that such director should serve on our Board of Directors in light of our business and structure.
Jack E. Knott was named the Chairman of our Board of Directors, and Chief Executive Officer in October 2005. From August 2003 until joining us, Mr. Knott served as a manager of Ronin Partners, LLC. From 1997 to August 2003, Mr. Knott served in various executive positions at Huntsman Packaging Corp. and as the Chief Executive Officer of Pliant Corporation, its successor. Mr. Knott has over 30 years of experience in the packaging industry, including serving in numerous senior management positions, including Chairman of the Flexible Packaging Association, President of Rexene Products and President of CT Films, among other positions. We believe Mr. Knott’s important role in the history and management of our Company and its affiliates and his extensive knowledge about the flexible packaging industry and business and leadership skills, including his current position as our Chief Executive Officer, support the conclusion that he should serve as one of our directors.
Tom Vale was named our Chief Operating Officer on February 15, 2008 and was subsequently named President and Chief Financial Officer on September 30, 2010. Prior to joining us, Mr. Vale served as a manager for TMV Consulting, LLC, a private consulting services firm, from June 2007 to February 2008. Prior to that, Mr. Vale was employed by DeLuxe Media Services, a manufacturer and distributor of entertainment products for film, music and game companies and a wholly-owned subsidiary of The Rank Group, from March 2000 to May 2007. Mr. Vale served as President and Chief Executive Officer of DeLuxe Media Services from August 2004 to May 2007.
Robert H. Arvanites has been with Exopack since its inception in August 2001 and currently serves as Senior Vice President and General Manager. Prior to joining us, Mr. Arvanites held various sales positions with Union Camp Corporation, including Consumer Group Sales Manager from 1997 to July 2001 and Sales Manager for its St. Louis, Missouri facility from 1995 to 1997.
Jeffrey S. Ross has been with Exopack since its inception in 2001 and currently serves as Senior Vice President and General Manager. Prior to joining us, Mr. Ross held various sales and marketing positions with Union Camp Corporation and International Paper, including Director of Sales and Operations Planning, Sales Manager- Industrial Packaging and Vice President and General Manager Plastics U.S.
Gene Welsh has been with Exopack since October 1, 2010 and currently serves as Senior Vice President and General Manager. Prior to joining us Mr. Welsh held various positions in sales and operations with Alcan Packaging, including three years as Vice President and General Manager of the meat, dairy and rigid container business.
Michael E. Alger was elected to our Board of Directors in October 2007. Mr. Alger has been employed by Sun Capital Partners, Inc. since October 2007, and currently serves as a Vice President at Sun Capital. Mr. Alger has over 29 years of experience in senior finance and operations management roles. Prior to joining Sun Capital, Mr. Alger served as the Chief Financial Officer for Indalex Aluminum Solutions (“Indalex”), a Sun Capital portfolio company, from 2000 to 2007. Prior to Indalex, he served as Vice President of Finance for Favorite Brands, a large multi-brand confection company, and as Chief Financial Officer for Jel Sert and Olds Products, both food companies, from 1993 through 1998. Prior to that, he held a number of senior finance positions with Kraft General Foods and Baxter International. He started his professional career as an auditor for PricewaterhouseCoopers LLP. In addition to Mr. Alger’s employment by an affiliate of our sole stockholder, we believe that Mr. Alger’s significant executive-level financial expertise and his background in food-based companies gives him an in-depth understanding of our food and specialty packaging segment, all of which support the conclusion that he should serve as one of our directors. Mr. Alger also serves as a director for several private companies. Mr. Alger is the Chairman of our Audit Committee.
Clarence E. (“Bud”) Terry was elected to our Board of Directors in February 2009. Mr. Terry has been employed by Sun Capital Partners, Inc. since September 1999, and currently serves as a Managing Director and Group Chief Financial Officer. Mr. Terry has over 37 years of operating experience. Prior to joining Sun Capital, Mr. Terry served as Vice President at Rain Bird Sprinkler Manufacturing, Inc. Mr. Terry has been responsible for all areas of operations, including manufacturing, foreign sourcing, sales and marketing, and general management. In addition to Mr. Terry’s employment by an affiliate of our sole stockholder, we believe that Mr. Terry’s extensive experience in manufacturing and operations and his extensive board and executive-level management experience and proven leadership and business capabilities provide the Board with a unique perspective on streamlining operations at our facilities and support the conclusion that he should serve as one of our directors. Within the last five years, Mr. Terry has also served as a director of LOUD Technologies, Inc., Catalina Lighting, Inc., Georgia Gulf Corporation and a number of private companies.
37
Mark Brody was elected to our Board of Directors in April 2008. Mr. Brody has been employed by Sun Capital Partners, Inc since 2006, and currently serves as Operations Senior Vice President. Mr. Brody has 27 years of senior finance and executive management experience. Prior to joining Sun Capital, Mr. Brody served from 2001 to 2006 as Chief Financial Officer for Flight Options. Prior to his employment with Flight Options, Mr. Brody served as Chief Financial Officer or Vice President, Finance for a number of manufacturing-related public companies, including Sudbury, Inc., Essef Corporation, Anthony & Sylvan Pools and Waterlink, Inc. In addition to Mr. Brody’s employment by an affiliate of our sole stockholder, we believe that Mr. Brody’s background in finance at manufacturing companies, substantial financial experience, experience with acquisitions, extensive board and executive-level management experience and proven leadership and business capabilities all support the conclusion that he should serve as one of our directors. Mr. Brody started his career as an auditor with Ernst and Young LLP. Within the last five years, Mr. Brody has also served as a director of Catalina Lighting, Inc. Mr. Brody is a member of our Audit Committee.
There are no family relationships among any of our directors, executive officers, or key employees.
Audit Committee
The audit committee of our Board of Directors is currently composed of two members, Michael E. Alger and Mark Brody. We are not required by the rules of the United States Securities and Exchange Commission to have an audit committee comprised of independent directors nor are we required to designate an audit committee financial expert. Nevertheless, our Board of Directors may designate a member of its audit committee to be an audit committee financial expert in the future should it be deemed appropriate. Neither Mr. Alger nor Mr. Brody satisfies the independence requirements for audit committee members under Rule 10A-3 of the Exchange Act.
Our Board of Directors currently does not have any other committees.
Code of Ethics
Our Board of Directors has adopted a Code of Ethics for Senior Financial Employees that applies to our Chief Executive Officer, Chief Financial Officer, principal accounting officer or controller, or persons performing similar functions. A copy of the Code of Ethics for Senior Financial Employees will be made available to any person, without charge, by contacting Tom Vale, our President and Chief Financial Officer, at (864) 596-7140, or through a written request to 3070 Southport Road, Spartanburg, South Carolina, 29302. If we waive any material provision of our code of ethics or substantively change the code, we may disclose that fact on our website (http://www.exopack.com) within four business days as an alternative to disclosure on Form 8-K.
ITEM 11. EXECUTIVE COMPENSATION
Compensation Discussion and Analysis
This section provides information regarding the compensation program in place for our executive officers and certain key employees, including: Jack E. Knott, our Chief Executive Officer; Tom Vale, our President and Chief Financial Officer and the three most highly-compensated executive officers or key employees other than Mr. Knott, Mr. Heard and Mr. Vale employed at the end of 2010, consisting of Robert H. Arvanites, Jeffrey S. Ross and Gene Welsh. We refer to these five officers, along with Jonathan Heard, our former Chief Financial Officer who was no longer employed by us at the end of 2010, as the “Named Executive Officers.” This section includes information regarding, among other things, the overall objectives of our compensation program and each element of compensation that we provide.
Compensation Philosophy and Objectives and Compensation Process
Leadership and motivation of our executive officers and key employees are critical to our long-term success. Our executive officer and key employee compensation program is intended to enable us to attract, retain, develop and reward executive officers and key employees who are primarily responsible for our long-term success. Our compensation program enhances our ability to attract and retain the talent to compete in our industry and deliver the superior products and service our customers demand. Our compensation program also seeks to align these officers’ compensation with our operating performance profitability.
The elements of our compensation program allow our executive officers and key employees to focus primarily on attaining business objectives. Incentives and variable compensation provide motivation to meet and exceed individual and group expectations and increase the value of the business. Our compensation program is guided by the following fundamental principles:
• provide a base level of compensation and benefits at a level sufficient to attract and retain high quality executives and key employees;
• provide incentives to achieve short-term and long-term profitability growth within the business operations for which a given executive officer or key employee is responsible; and
• allow us to compete with other organizations nationwide for executive talent.
38
All executive officer and key employee compensation decisions at Exopack are ultimately made by our Board of Directors. We do not currently have a compensation committee because our common stock is privately-held by one stockholder and we believe it is beneficial to have our entire Board of Directors participate in discussions and decision-making concerning executive compensation. In addition, we are not subject to United States Securities and Exchange Commission rules that would require us to have a compensation committee comprised of independent directors. Therefore, each member of our Board of Directors participates in discussions and decisions relating to compensation of executives and key employees. Each year the Board of Directors reviews and evaluates each element of the compensation paid to our executive officers and key employees. Annually, the Board of Directors determines the base salary for each executive officer and key employee. In addition, each year or other performance period deemed appropriate by our Board of Directors, the Board establishes a bonus target percentage (expressed as a percentage of base salary) for each executive officer and key employee, as described in more detail below under “Elements of Compensation –Short Term Incentive Compensation – MIP.” Finally, the Board of Directors also meets when required during the year to determine the number of stock options, if any, to be granted to executive officers and key employees.
In determining the total compensation for our Chief Executive Officer, our Board of Directors considers industry, internal and local market compensation data and its own assessment of the Chief Executive Officer’s performance, the Chief Executive Officer’s own expectations and other factors it deems relevant, including the compensation packages for the principal executive officers of the peer companies listed above.
The Board of Directors believes that our executive compensation program has been appropriately designed to provide a level of incentives that do not encourage our executive officers to take unnecessary risks in managing their respective business divisions or functions. As discussed below, a meaningful portion of our executive officers' compensation is performance-based, consistent with our approach to executive compensation. Our MIP is designed to reward annual performance in areas considered critical to the short and long-term success of our Company, and typically features a cap on the maximum amount that can be earned in any single year. We believe this discourages risk-taking that focuses excessively on short-term profits at the sacrifice of the long-term health of our Company. Likewise, our long-term equity incentive awards are directly aligned with long-term stockholder interests through their link to the value of our stock and multi-year ratable vesting schedules. In combination, the Board of Directors believes that the various elements of our executive compensation program sufficiently tie our executives' compensation opportunities to our focus on sustained long-term growth and performance.
Elements of Compensation
The elements of our compensation program for executive officers consist of:
• a base salary component;
• a short-term incentive component, consisting of quarterly bonuses under our MIP; and
• a long-term incentive component, consisting of stock options that vest 20% per year over a five-year period.
The use and weight of each compensation element is based on a subjective determination by the Board of Directors of the importance of each in meeting our overall objectives. In general, we seek to put a significant amount of each executive officer’s total potential compensation “at risk” by making future payout or realization of value dependent on corporate and business unit performance. If we and/or an individual fails to meet minimum levels of performance, he or she will not earn any “at risk” compensation. In addition, stock options provide long-term incentives to increase company profitability, as well as a retention mechanism for highly-valued executive officers. In general, our Board of Director’s intention is to grant a meaningful portion of total compensation in the form of equity compensation awards in order to reinforce the ownership culture within our leadership. We do not currently maintain specific stock ownership guidelines for our Named Executive Officers. The Board of Directors may consider prior compensation outcomes, including equity incentive compensation gains, in setting future compensation levels.
Base Salary
The first element of our cash compensation program for Named Executive Officers is an annual base salary. When determining salaries for a Named Executive Officer, the Board of Directors takes into account industry, internal and local market compensation data, as well as each individual’s job responsibility, experience level, individual performance, the amount and nature of the other compensation paid to the officer and the officer’s own expectations. The Board of Directors generally reviews and approves base salaries for officers annually in December or January, and in connection with promotions or changes in responsibilities. Adjustments may be made when appropriate, at the discretion of the Board of Directors, to reflect competitive market factors and the individual factors described above.
39
Short-Term Incentive Compensation – MIP
General Structure and Operation of MIP. The second element of our cash compensation program for Named Executive Officers is cash bonuses payable under our MIP. Our MIP is designed to attract, retain, motivate and reward officers and key employees of the Company by providing them with the opportunity to earn competitive incentive compensation directly linked to the achievement of business objectives with respect to performance periods that may be designated by the Board.
Historically, our Board of Directors has generally adopted and approved a new MIP at the beginning of each year, including the pre-determined earnings before interest, taxes, depreciation, amortization and certain other adjustments (“Adjusted EBITDA”) targets for that year and each Named Executive Officer’s bonus opportunity set as a fixed percentage of such Named Executive Officer’s base annual or quarterly salary, referred to as a “bonus target.”
MIP. On March 23, 2010, the Board adopted the MIP under which the Board may designate future performance periods and establish performance goals and award opportunities for such periods. The officers that may be eligible to participate in the MIP for any future designated performance period include the Named Executive Officers currently employed by the Company. With respect to each performance period regularly designated under the MIP, the Board will establish the performance goals that must be satisfied by the Company or any subsidiary, division, segment or other unit of the Company (“Business Unit”) during such performance period as a condition to the payment or accrual of a cash bonus for each participant based on performance in such performance period. The performance goals for each performance period will be one or more targeted levels of performance with respect to one or more of the following objective measures with respect to the Company or any Business Unit, with individual weightings as approved by the Board: EBITDA, Adjusted EBITDA, operating income, revenues, bookings, operating expenses and fixed cost reductions. With respect to each performance period, the Board will establish or approve the amounts, or the formula for determining the amounts, of cash bonuses to be paid based upon achievement of the applicable performance goals. For each performance period, the Board will establish or approve the timing of payment and any other conditions to payment of cash bonuses earned under the MIP. The MIP also includes a bonus recoupment policy providing that (i) if any of the financial or operating results of the Company are restated or otherwise adjusted (whether materially or immaterially) and (ii) after taking any such restatement or adjustment into account, the amount of any bonus award paid to any current or former employee within the preceding three years would have been reduced, then the Company may require such current or former employee to return to the Company all or any portion of the bonus award in excess of the amount which would have been paid after taking into account such restatement or adjustment. The Board has broad discretion to determine whether and to what extent to require any current or former employee to return any bonus awards under the bonus recoupment policy. The bonus recoupment policy set forth in the MIP applies to any bonus award made to any current or former employee under any cash bonus plan or MIP of the Company at any time in the preceding three years.
Gene Welsh joined the Company effective October 1, 2010 as a Senior Vice President and General Manager. During the fourth quarter of 2010, Mr. Welsh participated in a management incentive compensation program in conjunction with the EMCS acquisition. This incentive program pays out bonuses as a percentage of the EMCS Plan relating to the five and one-half months that EMCS was a part of the Company in 2010. For the year ending December 31, 2010, each participant in the plan had a prorated annual bonus based on the number of months that the participant worked for the Company. Mr. Welsh worked for the Company for the last three months of 2010 and therefore, Mr. Welsh’s bonus was based on one quarter of an annual bonus and was paid based on a five and one-half month plan versus annual results. In order for Mr. Welsh to earn the maximum possible quarterly bonus, we needed to achieve approximately 150% of the applicable Adjusted EBITDA target established for the fourth quarter of 2010 for EMCS. In order for Mr. Welsh to earn 100% of the target quarterly bonus, we needed to achieve 100% of the applicable Adjusted EBITDA target for the fourth quarter of 2010. Anything below 100% of the Adjusted EBITDA target would result in no payout. Mr. Welsh will participate in the MIP program beginning January 1, 2011.
The following table summarizes for each of our Named Executive Officers the threshold, target and maximum bonus percentages (expressed as a percentage of salary attributable to the applicable quarterly period), the performance components upon which each Named Executive Officer’s bonus opportunity is based, and the corresponding weightings for such performance components, for each of the quarterly periods during 2010. Each Named Executive Officer had a separate bonus opportunity for each period, but all four periods are presented in one table because the bonus percentages, the performance components and the corresponding weightings were the same for each period (with the exception of Mr. Arvanites and Mr. Ross, who had different weightings for the fourth quarter of 2010).
40
|
Bonus Target Percentages, Performance Components and Weightings for Q1 2010 Period,Q2 2010 Period, Q3 2010 Period and the Q4 2010 Period | |||||
|
Executive Officer |
Threshold Incentive Award (% of Base Salary) |
Target Incentive Award (% of Base Salary) |
Maximum Incentive Award (% of Base Salary) |
Performance Components |
Weightings |
|
|
| ||||
|
Jack E. Knott |
27.8% |
55.0% |
110.0% |
Total Company Adjusted EBITDA(1) |
100% |
|
|
| ||||
|
Tom Vale |
22.7% |
45.0% |
90.0% |
Total Company Adjusted EBITDA(1) |
100% |
|
|
| ||||
|
Jonathan Heard(2) |
20.2% |
40.0% |
80.0% |
Total Company Adjusted EBITDA(1) |
100% |
|
|
| ||||
|
Robert H. Arvanites |
20.2% |
40.0% |
80.0% |
Pet Food & Specialty Division Adjusted EBITDA |
75% |
|
|
Total Company Adjusted EBITDA(1) |
25% | |||
|
|
Total Company Adjusted EBITDA (4th Quarter)(1) |
100% | |||
|
|
| ||||
|
Jeffrey S. Ross |
20.2% |
40.0% |
80.0% |
Performance Packaging/Consumer Food & Specialty Divisions Adjusted EBITDA(1) |
75% |
|
|
Total Company Adjusted EBITDA(1) |
25% | |||
|
|
Total Company Adjusted EBITDA (4th Quarter)(1) |
100% | |||
|
|
| ||||
|
Gene Welsh(3) |
0.0% |
40.0% |
60.0% |
Meat, Cheese & Specialty Adjusted EBITDA |
100% |
|
|
|
|
|
|
|
(1) Total Company Adjusted EBITDA and consumer food and specialty packaging segment’s Adjusted EBITDA excludes the results of operations for EMCS.
(2) Mr. Heard resigned as Chief Financial Officer effective September 30, 2010. As a result, Mr. Heard was not eligible to receive a bonus for the fourth quarter of 2010.
(3) Mr. Welsh joined the Company effective October 1, 2010 as a Senior Vice President and General Manager. For the fourth quarter of 2010, Mr. Welsh participated in a management incentive compensation program applicable to the EMCS business.
For each quarter in 2010, in order for our Named Executive Officers to earn the maximum possible quarterly bonus for the overall Company Adjusted EBITDA component and, if applicable, the relevant divisional Adjusted EBITDA component, we were required to achieve approximately 115% of the applicable Adjusted EBITDA target established for the applicable quarter. In order for our Named Executive Officers to earn 100% of the target quarterly bonus for each of the applicable performance components, we needed to achieve 100% of the applicable Adjusted EBITDA target established for the applicable quarter. We needed to achieve 85% of the applicable Adjusted EBITDA target in order for any Named Executive Officer to be eligible for any bonus with respect to the applicable performance component. For each one percentage point that the applicable Adjusted EBITDA failed to achieve the relevant Adjusted EBITDA target (subject to a floor of 85% of the relevant Adjusted EBITDA target), each applicable Named Executive Officer’s bonus was reduced by 3.3%. For each one percentage point that the applicable Adjusted EBITDA exceeded the Adjusted EBITDA target (subject to a ceiling of approximately 115% of the relevant Adjusted EBITDA target), each applicable Named Executive Officer’s bonus was increased by 6.6%. The following table summarizes for each quarter in 2010 the Adjusted EBITDA targets that were established by the Board of Directors and our actual Adjusted EBITDA achievement, in each case for the overall Company, for the pet food and specialty, consumer food and specialty and performance packaging divisions for each quarter in 2010.
|
(in 000's) Adjusted EBITDA Targets and Actual Adjusted EBITDA Achievement for Each Quarter in 2010 |
|||||||||
|
|
Adjusted EBITDA Target for Total Company |
Actual Adjusted EBITDA for Total Company |
Adjusted EBITDA Target for Pet Food & Specialty Division |
Actual Adjusted EBITDA for Pet Food & Specialty Division |
Adjusted EBITDA Target for Consumer Food & Specialty Division |
Actual Adjusted EBITDA for Consumer Food & Specialty Division |
Adjusted EBITDA Target for Performance Packaging Division |
Actual Adjusted EBITDA for Performance Packaging Division |
|
|
Q1 2010 Period |
$ 17,967 |
$ 17,240 |
$ 8,887 |
$ 8,414 |
$ 5,467 |
$ 4,695 |
$ 4,880 |
$ 4,777 |
|
|
Q2 2010 Period |
$ 18,728 |
$ 18,109 |
$ 8,724 |
$ 7,118 |
$ 6,011 |
$ 5,364 |
$ 4,910 |
$ 5,263 |
|
|
Q3 2010 Period |
$ 20,804 |
$ 22,452 |
$ 9,785 |
$ 8,945 |
$ 7,194 |
$ 7,900 |
$ 4,660 |
$ 4,952 |
|
|
Q4 2010 Period |
$ 21,605 |
$ 21,382 |
$ 10,362 |
$ 9,386 |
$ 7,085 |
$ 6,700 |
$ 4,746 |
$ 4,436 |
|
41
aBased on the level of achievement of applicable Adjusted EBITDA targets summarized in the table immediately above and the bonus percentages and weightings of performance components summarized above, the following table sets forth the cash bonuses that we paid to each of our Named Executive Officers under the MIP for each quarter in 2010.
|
MIP Bonuses Earned by Named Executive Officers During 2010(1) |
||||||
|
|
Q1 2010 Period |
Q2 2010 Period |
Q3 2010 Period |
Q4 2010 Period (2) |
10% Additional(3) |
|
|
Jack E. Knott |
$59,675 |
$61,944 |
$100,513 |
$73,288 |
$29,542 |
|
|
Tom Vale |
$43,943 |
$45,613 |
$74,014 |
$53,966 |
$21,754 |
|
|
Jonathan Heard(4) |
$14,474 |
$15,024 |
$24,279 |
$0 |
$0 |
|
|
Robert H. Arvanites |
$21,925 |
$5,857 |
$23,212 |
$27,716 |
$7,871 |
|
|
Jeffrey S. Ross |
$18,449 |
$30,374 |
$34,734 |
$26,650 |
$7,708 |
|
|
Gene Welsh(5) |
$0 |
$0 |
$0 |
$37,500 |
$0 |
|
(1) The MIP provides for payout of 66.7% of each quarterly bonus earned in the month following the quarter in which the bonus was earned, and 33.3% is accrued and held back for payment once the annual audit is finalized. The 2010 MIP amounts held back for the executive officers were: Mr. Knott $98,374; Mr. Vale $72,439; Mr. Arvanites $26,210; and Mr. Ross $36,699. These amounts were paid in March 2011.
(2) The Q4 2010 Period bonuses were earned in the fourth quarter of 2010 but payable by their terms during the first quarter of 2011.
(3) Each participant in the MIP received an additional bonus equal to 10% of their respective quarterly MIP bonuses as a result of the Company achieving its 2010 annual Adjusted EBITDA target, excluding Mr. Heard and Mr. Welsh.
(4) Mr. Heard resigned as Chief Financial Officer effective September 30, 2010. As a result, Mr. Heard was not eligible to receive a bonus for the fourth quarter of 2010 and the additional bonus equal to 10% of respective quarterly MIP bonuses.
(5) Mr. Welsh joined the Company on October 1, 2010 as Senior Vice President and General Manager.
Adjusted EBITDA. The Board of Directors believes that Adjusted EBITDA is an appropriate measure for the primary financial goal of aligning the interests of management with the interests of the Company’s security holders. The Adjusted EBITDA measures used in connection with the MIP are adjusted on the same basis and for the same factors as disclosed in our quarterly Adjusted EBITDA reconciliation which can be found on our website (http://www.exopack.com). Specifically, Adjusted EBITDA is calculated by adjusting net income (loss) to exclude interest, income taxes, depreciation and amortization, severance, restructuring and plant closure costs, gains and losses on disposition of assets, transition costs related to acquisitions, management fees, stock compensation costs, certain process improvement consulting, costs associated with being a public company, pension expense and certain insurance recoveries. Adjusted EBITDA provides an indicator of general economic performance that is not affected by debt restructurings, fluctuations in interest rates or effective tax rates, or levels of depreciation or amortization. Accordingly, the Board of Directors and our management believe that this measurement is useful for comparing general operating performance from period to period.
Equity-Based or Long-Term Incentive Compensation
General Approach to Equity Incentives and Stock Option Grants. Equity-based incentives represent a direct link between compensation and company profitability. Equity incentives only become more valuable if the value of our common stock increases. In light of this, we believe that offering equity incentives to our executive officers and key employees provides an appropriate additional incentive for these individuals to work toward the goal of making our Company profitable.
Our Equity-Based Incentive Plan. CPG Finance, Inc. (“CPG Finance”), an affiliate of Sun Capital and the sole equity owner of Exopack Key Holdings, LLC, our sole stockholder, has a 2005 Stock Option Plan, which we sometimes refer to as our equity-based incentive plan. Our equity-based incentive plan is administered by the Board of Directors of CPG Finance (the “CPG Board”). Our equity-based incentive plan is designed to provide an incentive to key employees and consultants and Board members and to offer an additional inducement in obtaining the services of such persons. The plan provides for the grant of options to purchase shares of the non-voting common stock of CPG Finance. Subject to adjustments in certain events, the total number of shares of non-voting common stock for which options may be granted under the plan may not exceed 100,000 shares. The exercise price of the shares subject to each option is determined at the time the grant is made and set forth in the applicable agreement, but if the exercise price for any option is less than the fair market value of non-voting stock on the date of grant, the option must contain terms that permit the option to comply with, or to be exempt from, the requirements applicable to deferred compensation under Section 409A of the Internal Revenue Code. The term of each option granted under the plan may not exceed 10 years from the date of grant.
In order to determine the amount and nature of the equity incentives to be granted to an executive officer or key employee, the CPG Board considers, in addition to the factors described above, awards previously granted to each individual, each individual’s accumulated vested and unvested awards, the current value and potential value over time using stock appreciation assumptions for vested and unvested awards, the vesting schedule of the individual’s outstanding awards, comparison of individual awards between executive officers and key employees and in relation to other compensation elements and total accounting expense. The CPG Board generally sets the exercise price for options granted under our equity-based incentive plan to reflect the fair market value of our common stock based on the most recent common stock valuation.
42
Vesting. All of our equity incentives are subject to vesting. Stock options granted to executive officers generally vest over a period of five years, with the initial 20% vesting one year following the established vesting date and 20% vesting per year for the remaining four years on that established vesting date.
We believe the delayed vesting of our stock options provides a significant incentive for executive officers to remain with our Company through the vesting period, particularly if our stock value has increased since the incentive was granted and/or is anticipated to increase in the future.
Stock Option Granting Practices. Our practice has been, and is expected to continue to be, to grant equity incentives to executive officers and key non-executive employees. During 2010, CPG Finance granted 11,600 stock options under our equity-based incentive plan. Under our current policies, annual equity incentives are granted at the CPG Board’s regularly scheduled meetings. Individual grant amounts and all terms of the award are approved by the CPG Board at the meetings, and the exercise price per share for each stock option granted is generally the per share fair market value based on the most recent valuation of the underlying common stock. The CPG Board also periodically grants equity incentives to newly-hired executive officers and non-executive employees and, from time to time, in connection with promotions or for retention purposes.
The CPG Board has no program or practice to time equity incentive grants in connection with the release of material non-public information.
Stock Options Granted. In 2008, CPG Finance granted 5,000 stock options to Tom Vale in connection with his hire in February of 2008. Pursuant to the grant, 20% of the total options subject to the grants vested on February 18, 2009 for Mr. Vale, thereafter, an additional 20% of the total options subject to the grant either have vested or will vest on February 18 for each successive year for the following four years. In the event of a change of control (as defined in the applicable grant agreement), all of the options subject to the grant will vest immediately prior to the change of control. The vested portion of the options can be exercised only on the earliest of (i) February 18, 2018, (ii) the date of the consummation of a change of control, or (iii) 30 days following the date on which the applicable officer’s employment terminates for certain specified reasons.
In June 2008, CPG Finance granted 3,500 stock options to Gary McDaniel in connection with his hire in June of 2008. Pursuant to the grant, 20% of the total options subject to the grant vested on June 1, 2009. On December 2, 2009, the position held by Gary McDaniel, Senior Vice President and General Manager, was eliminated, and therefore, Mr. McDaniel separated from the Company at that time. In accordance with the terms of his stock option agreement, Mr. McDaniel forfeited his rights to the 3,500 options granted to him in 2008. Following such forfeiture, Mr. McDaniel’s stock options were cancelled.
The stock options granted to Mr. Vale and Mr. McDaniel were the only stock options granted to Named Executive Officers in 2008. There were no stock options granted to Named Executive Officers in 2009.
In 2010, CPG Finance granted 3,500 stock options to Gene Welsh in connection with his appointment as Senior Vice President and General Manager. Pursuant to the grant, 20% of the total options subject to the grant will vest on October 1, 2011 for Mr. Welsh, thereafter, an additional 20% of the total options subject to the grant will vest on October 1 for each successive year for the following four years. In the event of a change of control (as defined in the applicable grant agreement), all of the options subject to the grant will vest immediately prior to the change of control. The vested portion of the options can be exercised only on the earliest of (i) October 1, 2020, (ii) the date of the consummation of a change of control, or (iii) 30 days following the date on which the applicable officer’s employment terminates for certain specified reasons.
In 2010, CPG Finance granted 2,500 and 1,500 stock options to Tom Vale and Jeffrey S. Ross, respectively. Pursuant to the grant, 20% of the total options subject to the grant will vest on July 13, 2010 for Mr. Vale and Mr. Ross, thereafter, an additional 20% of the total options subject to the grant vested on July 13 for each successive year for the following four years. In the event of a change of control (as defined in the applicable grant agreement), all of the options subject to the grant will vest immediately prior to the change of control. The vested portion of the options can be exercised only on the earliest of (i) July 13, 2020 (ii) the date of the consummation of a change of control, or (iii) 30 days following the date on which the applicable officer’s employment terminates for certain specified reasons.
Benefits and Perquisites
We provide our Named Executive Officers with certain additional benefits and perquisites. Certain Named Executive Officers receive an automobile allowance and one member of executive management, the Senior Vice President and General Manager of our pet food and specialty packaging segment, received reimbursement for country club dues in the amounts of $5,775, $4,900 and $4,800 for the years ending December 31, 2010, 2009 and 2008, respectively. The primary reason for the club membership is for the development and fostering of customer relationships. In addition, our Named Executive Officers are eligible to participate, along with all of our employees, in our Savings Plans for the Companies of Exopack, which is a 401(k) defined contribution retirement plan that for 2010 matched 100% on the first two percent of employees’ contributions. Our Board of Directors determines all matching contributions to the 401(k) plan. Our Named Executive Officers are also eligible to participate, along with all of our employees, in our medical, dental, disability and life insurance plans.
43
Mr. Arvanites and Mr. Ross also participate in a frozen defined benefit pension plan that we assumed in connection with the Consolidation, as described in more detail under “—Pension Benefits” beginning on page 48.
Employment Agreements and Severance Arrangements
We do not have employment agreements with any of our Named Executive Officers, although each of our Named Executive Officers have Separation Benefit Agreements that provide for severance payments in the event of an involuntary termination for reasons other than for “cause” or in connection with a change in control involving CPG Finance. These severance payments generally consist of one year of base compensation paid on a monthly basis and a pro-rata payment of amounts earned under our MIP. See “—Separation Benefit Agreements and Other Covenants” beginning on page 49. We also have an arrangement with our Chief Executive Officer that may entitle him to a bonus in the event of a change in control involving CPG Finance. See “—Change in Control Bonus Opportunity for CEO” beginning on page 48. The Board of Directors believes that these severance compensation arrangements are an important part of overall compensation for our Named Executive Officers and help to secure the continued employment and dedication of our Named Executive Officers, notwithstanding any concern that they might have at such time regarding their own continued employment prior to or following a change of control of CPG Finance. The Board of Directors also believes that these agreements are important as a recruitment and retention device, as all or nearly all of the companies with which we compete for executive talent have similar agreements in place for their senior management. We do not have a severance agreement with Gene Welsh, Senior Vice President and General Manager, who joined the Company on October 1, 2010.
Tax and Accounting Considerations
Tax considerations play a role in the design of our compensation program. Section 409A of the Internal Revenue Code (“Code”) imposes taxes on certain non-qualified compensation arrangements that do not comply with its requirements. These requirements regulate an individual’s election to defer compensation and the individual’s selection of the timing and form of distribution of the deferred compensation. Section 409A also generally provides that distributions can only be made on or following the occurrence of certain events, including the individual’s separation from service, a predetermined date, a change in control, or the individual’s death or disability. For certain key officers, Section 409A requires that such individual’s distribution commence no earlier than six months after such officer’s separation from service. We strive to structure our executive compensation program with the intention that it comply with Section 409A of the Code.
Accounting considerations also play a role in the design of our executive compensation program. For example, FASB guidance related to share-based payments, requires that employee stock-based compensation be measured based on its fair value on the grant date and treated as an expense that is reflected in the financial statements over the related service period, which reduces the amount of our reported profits. Due to option expensing and the impact of dilution on our stockholder, we pay close attention to the number and value of the shares’ underlying stock option grants.
Compensation Committee Report
The Board of Directors of the Company has reviewed and discussed the Compensation Discussion and Analysis required by Item 402(b) of Regulation S-K with management and, based on such review and discussions, the Board of Directors has determined that the foregoing Compensation Discussion and Analysis be included in this annual report.
The foregoing report is provided by the undersigned Board of Directors.
Board of Directors:
Jack E. Knott (Chairman)
Michael E. Alger
Clarence E. Terry
Mark Brody
44
Summary Compensation Table
The following table sets forth the compensation earned by our Named Executive Officers in 2010, 2009 and 2008 for services rendered in all capacities to us and our subsidiaries. Effective September 30, 2010, Jonathan Heard, Chief Financial Officer, separated from the Company and Tom Vale, Chief Operating Officer, was appointed President and Chief Financial Officer.
|
Changes in |
|||||||||||||
|
Pension Value and |
|||||||||||||
|
Non-equity |
Non-qualified |
All |
|||||||||||
|
Option |
Incentive Plan |
Deferred Compensation |
Other |
||||||||||
|
Name and |
Awards(1) |
Compensation (2) |
Earnings(3) |
Compensation(4) |
Total | ||||||||
|
Principal Position |
Year |
Salary ($) |
($) |
($) |
($) |
($) |
($) | ||||||
|
Jack E. Knott |
2010 |
$ 500,000 |
$ - |
$ 324,961 |
N/A |
$ 9,802 |
$ 834,763 | ||||||
|
Chairman and |
2009 |
$ 495,810 |
$ - |
$ 383,025 |
N/A |
$ 13,748 |
$ 892,583 | ||||||
|
Chief Executive Officer |
2008 |
$ 500,000 |
$ - |
$ 87,875 |
N/A |
$ 11,822 |
$ 599,697 | ||||||
|
Jonathan Heard(5) |
2010 |
$ 185,897 |
$ - |
$ 53,877 |
$ 3,006 |
$ 16,337 |
$ 259,117 | ||||||
|
Former Senior Vice President |
2009 |
$ 247,905 |
$ - |
$ 135,881 |
$ 1,317 |
$ 10,624 |
$ 395,727 | ||||||
|
and Chief Financial Officer |
2008 |
$ 245,000 |
$ - |
$ 30,756 |
$ 299 |
$ 9,436 |
$ 285,491 | ||||||
|
Tom Vale |
2010 |
$ 456,875 |
$ 187,821 |
$ 239,289 |
N/A |
$ 10,740 |
$ 894,725 | ||||||
|
President and Chief Financial |
2009 |
$ 446,229 |
$ - |
$ 279,965 |
N/A |
$ 10,818 |
$ 737,012 | ||||||
|
Officer |
2008 |
$ 384,376 |
$ 400,300 |
$ 63,270 |
N/A |
$ 9,453 |
$ 857,399 | ||||||
|
Jeffrey S. Ross |
2010 |
$ 234,850 |
$ 112,692 |
$ 84,792 |
$ 29,329 |
$ 14,028 |
$ 475,691 | ||||||
|
Senior Vice President and |
2009 |
$ 227,874 |
$ - |
$ 63,248 |
$ 14,444 |
$ 34,037 |
$ 339,603 | ||||||
|
General Manager |
2008 |
$ 200,650 |
$ - |
$ 59,868 |
$ 5,706 |
$ 78,869 |
$ 345,093 | ||||||
|
Robert H. Arvanites |
2010 |
$ 260,000 |
$ - |
$ 86,579 |
$ 26,542 |
$ 14,418 |
$ 387,539 | ||||||
|
Senior Vice President and |
2009 |
$ 257,821 |
$ - |
$ 130,826 |
$ 12,043 |
$ 19,224 |
$ 419,914 | ||||||
|
General Manager |
2008 |
$ 257,100 |
$ - |
$ 51,131 |
$ 3,311 |
$ 19,197 |
$ 330,739 | ||||||
|
Gene Welsh(6) |
2010 |
$ 62,500 |
$ 262,949 |
$ 37,500 |
N/A |
$ 2,113 |
$ 365,062 | ||||||
|
Senior Vice President and |
2009 |
N/A |
N/A |
N/A |
N/A |
N/A |
N/A | ||||||
|
General Manager |
2008 |
N/A |
N/A |
N/A |
N/A |
N/A |
N/A | ||||||
(1) Reflects the grant date estimated fair value of stock option awards in each fiscal year, calculated in accordance with FASB guidance related to share-based payments. For all option awards, this includes the number of option grants multiplied by the estimated grant date fair value using the Black-Scholes option pricing model. All option grants have a vesting period of five years. See Notes 2 and 5 to our consolidated financial statements included elsewhere in this annual report for additional information related to our stock options.
(2) This column represents payments awarded to our Named Executive Officers under our MIP and for Mr. Welsh under the management incentive program in conjunction with the EMCS acquisition. Amounts earned in 2010 and 2009 were payable quarterly in the month following the quarter earned. The amounts reflected for 2008 were earned in 2008 but payable the following fiscal year. No discretionary bonuses were paid in 2010, 2009 or 2008.
(3) These amounts represent the change in value of accumulated benefits under the Retirement Plan of Exopack, LLC (the “Retirement Plan”). We assumed the Retirement Plan in connection with the Consolidation on October 13, 2005. The Retirement Plan was frozen on June 30, 2004, prior to the Consolidation; accordingly, the employees’ final benefit calculation under the Retirement Plan was the benefit they had earned under the plan as of June 30, 2004. Increases in value in 2010, 2009 and 2008 are primarily due to the accretion of interest on the accumulated benefit. For additional information about the Retirement Plan, see “–Pension Benefits” beginning on page 48 and Note 5 to our consolidated financial statements included elsewhere in this annual report.
(4) The amounts in the “All Other Compensation” column for 2010 consist of:
|
Auto |
|||||||||
|
401(k) Match |
Life Insurance |
Allowance |
Vacation |
Other | |||||
|
$ |
$ |
$ |
$ |
$ | |||||
|
Jack E. Knott |
$ 4,900 |
$ 4,902 |
$ - |
$ - |
$ - | ||||
|
Jonathan Heard |
$ 4,659 |
$ 405 |
$ - |
$ 10,416 |
$ 857 | ||||
|
Tom Vale |
$ 4,900 |
$ 1,530 |
$ 4,310 |
$ - |
$ - | ||||
|
Jeffrey S. Ross |
$ 4,900 |
$ 1,132 |
$ 7,496 |
$ - |
$ 500 | ||||
|
Robert H. Arvanites |
$ 4,900 |
$ 564 |
$ 8,954 |
$ - |
$ - | ||||
|
Gene Welsh |
$ - |
$ - |
$ 2,113 |
$ - |
$ - |
(5) On September 30, 2010, Jonathan Heard resigned as Chief Financial Officer of the Company. In accordance with the terms of his stock option agreement, Mr. Heard forfeited his rights to his vested stock options, representing 880 options, or 80% of the total options, granted to him on October 13, 2005 and 1,440 options, or 60% of the total options, granted to him on January 19, 2007. Following such forfeiture, all of Mr. Heard’s stock options were cancelled.
(6) For the period from July 14, 2010 through September 30, 2010, Mr. Welsh provided consulting services to Exopack in conjunction with the integration of the EMCS acquisition. Mr. Welsh was paid $84,650 for these services.
N/A Mr. Knott, Mr. Vale and Mr. Welsh became employees subsequent to the date at which entry into the Retirement Plan was frozen.
45
Grants of Plan-Based Awards in 2010
|
|
|
|
|
|
|
|
|
|
All other |
Grant | ||||
|
|
|
|
|
|
|
|
|
|
option awards: |
Exercise |
Date Fair | |||
|
|
|
|
|
Estimated future payouts under non- |
Number of |
or Base |
Value of | |||||||
|
|
|
|
|
equity incentive plan awards(3) |
Securities |
Price of |
Stock and | |||||||
|
|
|
|
|
|
|
|
|
|
Underlying |
Option |
Option | |||
|
Name |
|
Grant Date(1) |
|
Threshold |
|
Target |
|
Maximum |
Options |
Awards |
Awards | |||
|
|
|
|
|
$ |
|
$ |
|
$ |
(#) |
($/Sh) |
($/Sh) | |||
|
Jack E. Knott |
|
N/A |
|
$ 138,875 |
$ 275,000 |
$ 550,000 |
N/A |
N/A |
N/A | |||||
|
Jonathan Heard |
|
N/A |
|
$ 37,875 |
$ 75,000 |
$ 150,000 |
N/A |
N/A |
N/A | |||||
|
Tom Vale |
|
9/28/2010 |
|
$ 102,263 |
$ 202,500 |
$ 405,000 |
2,500 |
$ 139 |
$ 75.13 | |||||
|
Robert H. Arvanites |
|
N/A |
|
$ 52,520 |
$ 104,000 |
$ 208,000 |
N/A |
N/A |
N/A | |||||
|
Jeffrey S. Ross |
|
9/28/2010 |
|
$ 45,989 |
$ 91,068 |
$ 182,135 |
1,500 |
$ 139 |
$ 75.13 | |||||
|
Gene Welsh |
|
9/28/2010 |
|
$ - |
$ 25,000 |
$ 37,500 |
3,500 |
$ 139 |
$ 75.13 | |||||
(1) Grant Date Applies to option awards granted in 2010.
(2) Reflects the threshold, target and maximum potentially payable under the MIP for Mr. Knott, Mr. Heard, Mr. Vale, Mr. Arvanites and Mr. Ross. Amounts earned under the MIP for the year ended December 31, 2010 are reflected in “Non-equity Incentive Plan Information” in the Summary Compensation Table above. For additional information about awards under the MIP, see the discussion beginning on page 40 under “Compensation Discussion and Analysis—Elements of Compensation—Short-Term Incentive Compensation—MIP.”
(3) Reflects the threshold, target and maximum potentially payable under the management incentive program in conjunction with the EMCS acquisition for Mr. Welsh.
46
The following table sets forth information concerning outstanding options held by the Named Executive Officers at December 31, 2010. There are no restricted stock awards in place or outstanding at December 31, 2010.
|
Option Awards |
|||||||||||
|
Equity Incentive Plan Awards: |
|||||||||||
|
Number of Securities |
Number of Securities |
Number of Securities |
|||||||||
|
Underlying Unexercised |
Underlying Unexercised |
Underlying Unexercised |
Option Exercise |
||||||||
|
Options |
Options |
Unearned Options |
Price |
Option Expiration |
|||||||
|
Name |
(#) |
(#) (1) |
(#) |
($) |
Date |
||||||
|
Exercisable |
Unexercisable |
||||||||||
|
Jack E. Knott |
— |
30,000 |
— |
$72 |
7/14/2015 |
||||||
|
Chairman and |
|||||||||||
|
Chief Executive Officer |
|||||||||||
|
Jonathan Heard(2) |
— |
— |
— |
— |
— |
||||||
|
Former Chief Financial |
|||||||||||
| Officer | |||||||||||
|
Tom Vale |
— |
5,000 |
2,000 |
$140 |
02/18/2018 |
||||||
|
President and Chief |
2,500 |
2,500 |
$139 |
7/13/2020 |
|||||||
| Financial Officer | |||||||||||
|
Robert H. Arvanites |
— |
4,000 |
— |
$72 |
10/13/2015 |
||||||
|
Senior Vice President and |
500 |
100 |
$140 |
01/19/2017 |
|||||||
|
General Manager |
|||||||||||
|
Jeffrey S. Ross |
— |
600 |
— |
$72 |
10/13/2015 |
||||||
|
Senior Vice President |
— |
900 |
180 |
$130 |
07/1/2016 |
||||||
|
and General Manager |
— |
500 |
100 |
$140 |
01/19/2017 |
||||||
|
— |
1,500 |
1,500 |
$139 |
7/13/2020 |
|||||||
|
Gene Welsh |
— |
3,500 |
3,500 |
$139 |
10/1/2020 |
||||||
|
Senior Vice President |
|||||||||||
|
and General Manager |
|||||||||||
(1) (i) 20% of Mr. Knott's outstanding options vested on each of July 14, 2006, 2007, 2008, 2009, and 2010. (ii) Mr. Vale's outstanding options vest on two different dates: 20% of the 5,000 options granted on February 18, 2008 vested on each of February 18, 2009, 2010, and 2011 and 20% will vest on each of February 18, 2012 and 2013 and 20% of the 2,500 options granted on July 13, 2010 will vest on each of July 13, 2011, 2012, 2013, 2014 and 2015. (iii) Mr. Arvanites’ outstanding options vest on two different dates: 20% of the 4,000 options granted on October 13, 2005 vested on each of October 13, 2006, 2007, 2008, 2009 and 2010; and 20% of the 500 options granted on January 29, 2007 vested on each of January 19, 2008, 2009, 2010 and 2011 and 20% will vest on January 19, 2012. (iv) Mr. Ross’s outstanding options vest on four different dates: 20% of the 600 options granted on October 13, 2005 vested on each of October 13, 2006, 2007, 2008, 2009 and 2010; 20% of the 900 options granted on July 1, 2006 vested on each of July 1, 2007, 2008, 2009 and 2010, and 20% will vest on July 1, 2011; 20% of the 500 options granted on January 19, 2007 vested on each of January 19, 2008, 2009, 2010 and 2011, and 20% will vest on January 19, 2012; and 20% of the 1,500 options granted on July 13, 2010 will vest on each of July 13, 2011, 2012, 2013, 2014 and 2015. (v) 20% of the 3,500 outstanding options granted to Mr. Welsh on October 1, 2010 will vest on each of October 1, 2011, 2012, 2013, 2014 and 2015. For a discussion of when the vested portion of any options may be exercised, see the discussion beginning on page 43 under “―Compensation Discussion and Analysis―Elements of Compensation―Equity-Based or Long-Term Incentive Compensation—Stock Options Granted.”
(2) In accordance with the terms of his stock option agreement, Mr. Heard forfeited his rights to his vested stock options, as a result of his resignation as Chief Financial Officer of the Company on September 30, 2010. Following such forfeiture, all of Mr. Heard’s stock options were cancelled.
Option Exercises in 2010
There were no stock options exercised by our Named Executive Officers during the year ended December 31, 2010.
47
Pension Benefits
The following table sets forth information concerning pension benefits paid to and accumulated by the Named Executive Officers at December 31, 2010.
|
Number of |
Present Value of |
Payments During | ||||||
|
Years |
Accumulated Benefit |
Last Fiscal | ||||||
|
Credited Service |
($) |
Year | ||||||
|
Name |
Plan Name(1) |
(#) |
($) | |||||
|
|
|
|
|
| ||||
|
Jack E. Knott |
N/A |
N/A |
N/A |
N/A | ||||
|
Chairman and |
||||||||
|
Chief Executive Officer |
||||||||
|
Jonathan Heard (2) |
Retirement Plan |
2.6 |
$14,946 |
$0 | ||||
|
Former Chief Financial Officer |
of Exopack, LLC |
|||||||
|
Tom Vale |
N/A |
N/A |
N/A |
N/A | ||||
|
President and Chief Financial Officer |
||||||||
|
Robert H. Arvanites |
Retirement Plan |
15.2 |
$142,803 |
$0 | ||||
|
Senior Vice President and |
of Exopack, LLC |
|||||||
|
General Manager |
||||||||
|
Jeffery S. Ross |
Retirement Plan |
17.3 |
$189,900 |
$0 | ||||
|
Senior Vice President |
of Exopack, LLC |
|||||||
|
and General Manager |
||||||||
|
Gene Welsh |
N/A |
N/A |
N/A |
N/A | ||||
|
Senior Vice President |
||||||||
|
and General Manager |
(1) The Retirement Plan was assumed by us in connection with the Consolidation on October 13, 2005. The Retirement Plan was frozen on June 30, 2004, prior to the Consolidation; accordingly, the employees’ final benefit calculation under the Retirement Plan was the benefit they had earned under the plan as of June 30, 2004. Benefits under the retirement plan were determined by the highest five years of base salary and incentive compensation in the 10 years prior to June 30, 2004 and years of service as of June 30, 2004. No Named Executive Officer is currently eligible for early retirement under the Retirement Plan. There have been no changes to the Retirement Plan during the year ended December 31, 2010.
(2) On September 30, 2010, Jonathan Heard resigned as Chief Financial Officer of the Company and Tom Vale, Chief Operating Officer, was appointed President and Chief Financial Officer.
N/A Mr. Knott, Mr. Vale and Mr. Welsh became employees subsequent to the date at which entry into the Retirement Plan was frozen.
Nonqualified Deferred Compensation
There are no nonqualified deferred compensation agreements in place for our Named Executive Officers at December 31, 2010.
Change in Control Bonus Opportunity for CEO
Pursuant to an offer letter entered into with Mr. Knott, our Chief Executive Officer, on January 10, 2006, if Mr. Knott is employed with us through the date of a change in control involving CPG Finance, Mr. Knott will be entitled to receive a bonus upon such change in control that produces a qualifying internal rate of return for our stockholders. Any payments due to Mr. Knott pursuant to this arrangement will be in addition to any consideration Mr. Knott may be entitled to receive under his separation benefit agreement, as described below under “—Separation Benefit Agreements and Other Covenants.” Specifically, in the event of a change in control (as such term is defined below), Mr. Knott will receive a payment calculated as follows:
|
Internal Rate of Return |
Bonus Payment | |
|
Less than 40% |
$-0- | |
|
≥ 40% and < 50% |
0.9% of Stockholder Proceeds | |
|
≥ 50% and < 60% |
1.8% of Stockholder Proceeds | |
|
≥ 60% and < 70% |
2.7% of Stockholder Proceeds | |
|
≥ 70% and < 80% |
3.6% of Stockholder Proceeds | |
|
Greater than or equal to 80% |
4.5% of Stockholder Proceeds |
48
For purposes of this arrangement with Mr. Knott, “change in control” has the following meaning, subject to certain exceptions: (i) any consolidation, merger or other transaction involving CPG Finance as the party to such consolidation, merger or other transaction, in which CPG Finance is not the surviving entity or which results in the acquisition of all or substantially all of CPG Finance’s outstanding shares of common stock by a single person or entity or by a group of persons or entities acting in concert or (ii) any sale of CPG Finance’s assets, excluding any real-estate “sale-lease back” transaction or any transaction in which the consideration consists of less than 100% cash. In addition, pursuant to this arrangement with Mr. Knott, “internal rate of return” means, as of any measurement date, the interest rate (compounded annually) which, when used as the discount rate to calculate the net present value as of the date of the offer letter of the sum of (A) the aggregate amount of all stockholder proceeds and (B) the aggregate amount of all stockholder investments, causes such net present value to equal zero. For purposes of the net present value calculation, (1) stockholder proceeds must be positive numbers, (2) stockholder investments must be negative numbers, (3) the stockholder proceeds and stockholder investments will be deemed to have been received or made on the first date of the month nearest to the actual date of such receipt or payment and (4) the “aggregate amount of all stockholder proceeds” will be net of all fees and expenses of any kind and all bonus payments made to Mr. Knott under this arrangement. “Stockholder investments” means all debt, guaranties of debt to the extent that the guaranty is called and drawn, equity and working capital infused by the stockholders of CPG Finance into CPG Finance and its subsidiaries. “Stockholder proceeds” means the consideration received by the stockholders of CPG Finance in respect of the stockholder investments upon a change in control.
Separation Benefit Agreements and Other Covenants
We have entered into separation benefit agreements with our Named Executive Officers providing for severance benefits under certain circumstances, as described below.
On January 10, 2006, we entered into a separation benefit agreement (the “Knott Separation Agreement”) with Jack E. Knott, our Chairman, President and Chief Executive Officer and this separation benefit agreement was amended on January 22, 2008. A copy of the amendment is attached as an exhibit to this annual report. Pursuant to the Knott Separation Agreement, as amended, we agreed to pay Mr. Knott $560,000 over a one-year period in the event that we terminate Mr. Knott without cause or if we fail to retain Mr. Knott in a similar position within the period beginning 30 days prior to and ending 180 days after a change of control. For purposes of this agreement, “cause” means:
• conviction of any felony, or the conviction of a misdemeanor which involves moral turpitude or plea of nolo contendere to either;
• the commission of an act of dishonesty, theft, destruction of property, fraud, embezzlement or unethical business conduct with respect to the Company;
• any violation of Company policy;
• any uncured violation of any agreement with the Company or CPG Finance; and
• any failure to abide by any directive of the Company or CPG Finance.
In addition, for purposes of this agreement, “change of control” means the following, subject to certain exceptions:
• any consolidation, merger or other transaction in which CPG Finance is not the surviving entity or which results in the acquisition of all or substantially all of CPG Finance’s outstanding shares of common stock by a single person or entity or by a group of persons or entities acting in concert; or
• certain sales or transfers of all or substantially all of the assets of CPG Finance.
We also agreed to pay Mr. Knott’s health and welfare benefits for one year following termination. After such one-year period, we will provide Mr. Knott with health and welfare benefit availability under COBRA for a period of up to 18 additional months.
We have also entered into separation benefit agreements with our other Named Executive Officers, with the exception of Gene Welsh, Senior Vice President and General Manager, who joined the Company on October 1, 2010. Pursuant to these separation agreements, we agreed to pay the other Named Executive Officers their then-existing base salary over a one-year period, as well as the pro-rata amounts earned under the MIP, in the event that we terminate the Named Executive Officer without cause (see definition above) or if we fail to retain the Named Executive Officer in a similar position within the period beginning 30 days prior to and ending 180 days after a change of control (see definition above).
Pursuant to stock option grant agreements that CPG Finance has entered into with each of our Named Executive Officers, each has agreed to abide by certain covenants including:
• confidentiality covenants;
• a covenant not to solicit any person who has been one of our employees during the last 12 months, which survives for two years following termination of employment;
• a covenant not to solicit any of our clients, customer, or vendors, which survives for one year after termination of employment;
• a covenant not to disparage or defame us; and
• a covenant not to compete with us, which survives for one year after termination of employment.
49
Director Compensation
None of our directors are compensated for serving as a director. Directors are reimbursed for actual expenses incurred in attending board meetings.
Compensation Committee Interlocks and Insider Participations
We do not currently have a compensation committee. Jack E. Knott, our Chief Executive Officer and current Chairman of our Board of Directors, participated in deliberations with our Board of Directors concerning executive officer compensation.
ITEM 12. SECURITY OWNERSHIP OF CERTAIN BENEFICIAL OWNERS AND MANAGEMENT AND RELATED STOCKHOLDER MATTERS
Equity Compensation Plan Information
The following table provides information about the shares of our common stock that may be issued upon the exercise of options, warrants and rights under all of our existing equity compensation plans as of December 31, 2010:
|
(c) | ||||||
|
Number of securities | ||||||
|
remaining available for | ||||||
|
(a) |
(b) |
future issuance under | ||||
|
Number of securities to |
Weighted-average |
equity compensation | ||||
|
be issued upon exercise |
exercise price of |
plans (excluding | ||||
|
of outstanding options, |
outstanding options, |
securities reflected in | ||||
|
Plan Category |
warrants and rights |
warrants and rights |
column (a)) | |||
|
Equity compensation plans approved by security holder |
80,600 |
$107.19 per option |
19,400 | |||
|
Equity compensation plans not approved by the security holder |
N/A |
N/A |
N/A | |||
|
Total |
80,600 |
$107.19 per option |
19,400 |
For a discussion of the number of equity securities of CPG Finance, Inc., one of our parent companies, held by our directors and named executive officers, see the discussion under Item 11. Executive Compensation – Outstanding Equity Awards at December 31, 2010.
Security Ownership of Certain Beneficial Owners and Management
Upon completion of the Consolidation, Exopack Key Holdings, LLC became our sole stockholder. Exopack Key Holdings, LLC is 100.0% owned by CPG Finance, an affiliate of Sun Capital. On December 12, 2005, CPG Finance granted options to purchase 77,500 shares of its common stock to members of our management and certain key employees. Additionally, during 2010, 2009, 2008, 2007 and 2006, CPG Finance granted options to purchase 11,600, zero, 23,550, 12,750 and 3,950 shares, respectively, of its common stock to certain key employees of our Company and 7,400, 7,700, 7,600, 10,850 and 15,200 options, respectively, were forfeited. None of the options currently outstanding have been exercised.
ITEM 13. CERTAIN RELATIONSHIPS AND RELATED TRANSACTIONS, AND DIRECTOR INDEPENDENCE
Management Services Agreements
On October 13, 2005, when Cello-Foil Holding Corp. became our wholly-owned subsidiary, the management services agreement between Sun Capital Partners Management IV, LLC (“Sun Capital Management”) and Cello-Foil Holding Corp. was terminated and we entered into a new management services agreement with Sun Capital Management. The new management services agreement was amended on January 31, 2006.
Pursuant to the terms of the new management services agreement, as amended, Sun Capital Management provides financial and management consulting services to us, subject to the supervision of our Board of Directors. In exchange for these services, we pay Sun Capital Management an annual management fee equal to the greater of $1.0 million or 2.0% of EBITDA (as defined in the agreement and as amended on January 31, 2006). During the year ended December 31, 2010, we incurred approximately $938,000 in management services under the agreement for management services related to the EMCS acquisition. We will also reimburse Sun Capital Management for all out-of-pocket expenses incurred in the performance of services under the agreement. During the year ended December 31, 2010, we incurred approximately $234,000 in reimbursable expenses related to the EMCS acquisition. No such expenses were incurred during the year ended December 31, 2009 under this portion of the agreement. We incurred approximately $1.9 million and $1.4 million in management fees and other related expenses under the management services agreement for the years ended December 31, 2010 and 2009, respectively. In addition to this general management fee, in connection with any management services provided to us, our direct or indirect subsidiaries, or stockholders with respect to certain corporate transactions including, without limitation, re-financings, restructurings, equity or debt offerings, acquisitions, mergers, consolidations, business consolidations, sales and divestitures, Sun Capital Management is entitled to 1.0% of the aggregate consideration of the corporate transaction as well as any customary and reasonable fees. We incurred approximately $47,000 and $21,000 for certain consulting fees from Sun Capital Management during the years ended December 31, 2010 and 2009. The management services agreement terminates on October 13, 2015.
50
Other Transactions
From time to time, in the ordinary course of business, we may enter into transactions with entities in which affiliates of Sun Capital have an interest. Any such transaction would be subject to compliance with the covenants contained in the indenture governing the Notes and our Senior Credit Facility. We anticipate that any such transaction would be on arms’ length terms. In addition, as described in Item 11. Executive Compensation of this annual report, we have entered into agreements with our executive officers and key employees. From time to time, we may also indemnify executive officers, key employees and directors for actions taken in their capacities as such.
Director Independence
Because we do not have any securities listed on an exchange, we are not subject to any listing standards requiring any of our directors to be “independent.” However, applying director independence requirements set forth in section 303A.02 (b) of the NYSE listing standards, we believe that Messrs. Alger, Terry and Brody could reasonably be considered to be “independent,” due to the lack of a direct compensation paid to such persons by us and the fact that the management fees paid by us to Sun Capital did not exceed 2% of our consolidated net sales for any of the three most recent fiscal years.
Such directors would not, however, satisfy the independence standards for audit committees set forth in Rule 10A-3 under the Exchange Act.
ITEM 14. PRINCIPAL ACCOUNTANT FEES AND SERVICES
The following fees of PricewaterhouseCoopers LLP were incurred by the Company for services related to the years ended December 31, 2010 and 2009.
Audit Fees
Audit fees totaled approximately $791,000 for 2010 and $775,000 for 2009. These fees were for services associated with the audits and quarterly reviews of our consolidated financial statements.
Audit-Related Fees
Fees for audit-related services typically include due diligence in connection with acquisitions and related accounting consultations, compliance with financing arrangements and attest services not required by statue or regulation. Audit fees related to the EMCS acquisition and other attestation services were approximately $1.6 million for the year ended December 31, 2010. Audit-related fees attributable to the $100.0 million notes offering were approximately $200,000 for the year ended December 31, 2010. There were no audit-related fees incurred by the Company for 2009.
Tax Fees
Fees for tax services typically include tax compliance, tax advice and tax planning. There were no tax fees incurred by the Company during 2010 or 2009 for services rendered by PricewaterhouseCoopers LLP.
All Other Fees
All other fees would typically include services not included in audit fees, audit-related fees and tax fees. We incurred $508,000 in fees in 2010 for services rendered by PricewaterhouseCoopers LLP. We did not incur any other fees during 2009.
Audit Committee Pre-Approval Policies and Procedures a
Our Audit Committee pre-approves the services provided to us by PricewaterhouseCoopers LLP in connection with the audit of our annual consolidated financial statements and the review of our quarterly consolidated financial statements. If management proposes to engage PricewaterhouseCoopers LLP for other audit or permitted non-audit services, our Audit Committee pre-approves these services on a case-by-case basis. Our Audit Committee approved all the services provided to us by PricewaterhouseCoopers LLP described above.
51
PART IV
ITEM 15. EXHIBITS AND FINANCIAL STATEMENT SCHEDULES
The following documents are being filed as part of this annual report.
1. Consolidated Financial Statements
See Index to Consolidated Financial Statements on page F-1.
2. Financial Statement Schedules
The schedules for which provision is made in the applicable accounting regulations of the SEC are not required under the related instructions or are inapplicable and, therefore, have been omitted.
3. Exhibits
The list of exhibits in the Exhibit Index to this annual report is incorporated herein by reference.
52
SIGNATURES
Pursuant to the requirements of Section 13 or 15(d) of the Securities Exchange Act of 1934, the registrant has duly caused this report to be signed on its behalf by the undersigned, thereunto duly authorized.
|
|
|
|
|
|
|
|
|
Exopack Holding Corp. | ||
|
|
|
|
|
|
|
|
March 30, 2011 |
|
By: |
/s/ Jack E. Knott |
|
|
|
|
|
Jack E. Knott Chairman and Chief Executive Officer
|
Pursuant to the requirements of the Securities Exchange Act of 1934, this report has been signed below by the following persons on behalf of the registrant and in the capacities and on the dates indicated.
|
|
|
|
|
Signature
|
Capacity in Which Signed
|
Date
|
|
|
|
|
|
|
|
|
|
/s/ Jack E. Knott
Jack E. Knott |
Director, Chairman and Chief Executive Officer (Principal Executive Officer) |
March 30, 2011 |
|
|
|
|
|
|
|
|
|
/s/ Tom Vale
Tom Vale |
President and Chief Financial Officer (Principal Financial and Accounting Officer) |
March 30, 2011 |
|
|
|
|
|
|
|
|
|
/s/ Michael E. Alger
Michael E. Alger |
Director |
March 30, 2011 |
|
|
|
|
|
|
|
|
|
/s/ Clarence E. Terry
Clarence E. Terry |
Director |
March 30, 2011 |
|
|
|
|
|
|
|
|
|
/s/ Mark Brody
Mark Brody |
Director |
March 30, 2011 |
Supplemental Information to be furnished with reports filed pursuant to Section 15(d) of the Securities Act by registrants which have not registered securities pursuant to Section 12 of the Securities Act.
The registrant has not and will not provide an annual report for its last fiscal year to its security holders, other than this annual report on Form 10-K, and has not and will not send any proxy statement, form of proxy or other proxy soliciting material to more than 10 of the registrant’s security holders with respect to any annual or other meeting of security holders.
53
EXOPACK HOLDING CORP. AND SUBSIDIARIES
INDEX TO CONSOLIDATED FINANCIAL STATEMENTS
|
|
|
|
|
Page |
|
Report of Independent Registered Public Accounting Firm |
F-2 |
|
Consolidated Balance Sheets as of December 31, 2010 and 2009 |
F-3 |
|
Consolidated Statements of Operations for the Years Ended December 31, 2010, 2009 and 2008 |
F-4 |
|
Consolidated Statements of Stockholder’s Equity and Comprehensive Income (Loss) for the Years Ended December 31, 2010, 2009 and 2008 |
F-5 |
|
Consolidated Statements of Cash Flows for the Years Ended December 31, 2010, 2009 and 2008 |
F-6 |
|
Notes to Consolidated Financial Statements |
F-7 |
F-1
Report of Independent Registered Public Accounting Firm
To the Board of Directors and Stockholder:
In our opinion, the accompanying consolidated balance sheets and the related consolidated statements of operations, stockholder's equity and comprehensive income (loss), and cash flows present fairly, in all material respects, the financial position of Exopack Holding Corp. and its subsidiaries (the “Company”), at December 31, 2010 and December 31, 2009, and the results of their operations and their cash flows for each of the three years in the period ended December 31, 2010 in conformity with accounting principles generally accepted in the United States of America. These financial statements are the responsibility of the Company’s management. Our responsibility is to express an opinion on these financial statements based on our audits. We conducted our audits of these statements in accordance with the standards of the Public Company Accounting Oversight Board (United States). Those standards require that we plan and perform the audit to obtain reasonable assurance about whether the financial statements are free of material misstatement. An audit includes examining, on a test basis, evidence supporting the amounts and disclosures in the financial statements, assessing the accounting principles used and significant estimates made by management, and evaluating the overall financial statement presentation. We believe that our audits provide a reasonable basis for our opinion.
/s/ PricewaterhouseCoopers LLP
March 30, 2011
Raleigh, North Carolina
F-2
Exopack Holding Corp. and Subsidiaries
Consolidated Balance Sheets
|
December 31, |
December 31, | |||||||||
|
(in thousands of dollars, except for share and per share data) |
2010 |
2009 | ||||||||
|
Assets |
||||||||||
|
Current assets |
||||||||||
|
Cash |
$ 2,508 |
$ 633 | ||||||||
|
Trade accounts receivable (net of allowance for uncollectible |
||||||||||
|
accounts of $1,550 and $1,592 for 2010 and 2009, respectively) |
94,951 |
78,394 | ||||||||
|
Other receivables |
3,463 |
3,796 | ||||||||
|
Inventories |
103,728 |
79,972 | ||||||||
|
Deferred income taxes |
3,703 |
3,500 | ||||||||
|
Prepaid expenses and other current assets |
3,240 |
3,417 | ||||||||
|
Total current assets |
211,593 |
169,712 | ||||||||
|
Property, plant, and equipment, net |
214,293 |
174,055 | ||||||||
|
Deferred financing costs, net |
14,998 |
5,197 | ||||||||
|
Intangible assets, net |
92,984 |
65,207 | ||||||||
|
Goodwill |
69,642 |
64,438 | ||||||||
|
Other assets |
6,298 |
2,855 | ||||||||
|
Total assets |
$ 609,808 |
$ 481,464 | ||||||||
|
Liabilities and Stockholder's Equity |
|
|||||||||
|
Current liabilities |
|
|||||||||
|
Revolving credit facility and current portion of long-term debt |
$ 58,815 |
$ 68,603 | ||||||||
|
Accounts payable |
83,607 |
64,929 | ||||||||
|
Accrued liabilities |
46,868 |
33,779 | ||||||||
|
Income taxes payable |
972 |
1,102 | ||||||||
|
Total current liabilities |
190,262 |
|
168,413 | |||||||
|
Long-term liabilities |
|
|
| |||||||
|
Long-term debt, less current portion |
320,000 |
|
220,034 | |||||||
|
Capital lease obligations, less current portion |
10,501 |
|
- | |||||||
|
Deferred income taxes |
32,878 |
|
33,689 | |||||||
|
Other liabilities |
16,172 |
|
14,829 | |||||||
|
Total long-term liabilities |
379,551 |
|
268,552 | |||||||
|
Commitments and contingencies |
|
|||||||||
|
Stockholder's equity |
|
|||||||||
|
Preferred stock, par value, $0.001 per share - 100,000 shares |
|
|||||||||
|
authorized, no shares issued and outstanding at December 31, 2010 |
||||||||||
|
and 2009, respectively |
- |
- | ||||||||
|
Common stock, par value, $0.001 per share - 2,900,000 shares |
|
|||||||||
|
authorized, 1 share issued and outstanding at December 31, 2010 |
|
|||||||||
|
and 2009, respectively |
- |
- | ||||||||
|
Additional paid-in capital |
73,521 |
73,230 | ||||||||
|
Accumulated other comprehensive loss, net |
(7,095) |
(5,074) | ||||||||
|
Accumulated deficit |
(26,431) |
(23,657) | ||||||||
|
Total stockholder's equity |
39,995 |
44,499 | ||||||||
|
Total liabilities and stockholder's equity |
$ 609,808 |
$ 481,464 | ||||||||
|
|
||||||||||
|
|
||||||||||
|
The accompanying notes are an integral part of these consolidated financial statements. |
||||||||||
F-3
Exopack Holding Corp. and Subsidiaries
Consolidated Statements of Operations
|
Year |
Year |
Year | |||||||||||
|
Ended |
Ended |
Ended | |||||||||||
|
December 31, |
December 31, |
December 31, | |||||||||||
|
(in thousands of dollars) |
2010 |
2009 |
2008 | ||||||||||
|
|
| ||||||||||||
|
Net sales |
$ 785,086 |
$ 673,733 |
$ 781,732 | ||||||||||
|
Cost of sales |
684,168 |
596,764 |
699,524 | ||||||||||
|
Gross margin |
100,918 |
76,969 |
82,208 | ||||||||||
|
Selling, general and administrative expenses |
66,491 |
55,894 |
57,179 | ||||||||||
|
Operating income |
34,427 |
21,075 |
25,029 | ||||||||||
|
Other expenses (income) |
|||||||||||||
|
Interest expense |
36,379 |
28,592 |
30,991 | ||||||||||
|
Other (income) expense , net |
(1,035) |
(468) |
1,371 | ||||||||||
|
Net other expense |
35,344 |
28,124 |
32,362 | ||||||||||
|
Loss before income taxes |
(917) |
(7,049) |
(7,333) | ||||||||||
|
Provision for (benefit from) income taxes |
1,857 |
(1,114) |
(1,215) | ||||||||||
|
Net loss |
$ (2,774) |
$ (5,935) |
$ (6,118) | ||||||||||
The accompanying notes are an integral part of these consolidated financial statements.
F-4
Exopack Holding Corp. and Subsidiaries
Consolidated Statements of Stockholder’s Equity and Comprehensive Income (Loss)
|
Accumulated |
|||||||||||||||||||
|
Additional |
Other |
||||||||||||||||||
|
Common Stock |
Paid-in |
Comprehensive |
Accumulated |
Comprehensive | |||||||||||||||
|
(in thousands of dollars, except for share data) |
Shares |
Amount |
Capital |
Income (Loss) |
Deficit |
Total |
Income (Loss) | ||||||||||||
|
Balances at January 1, 2008 |
1 |
$ - |
$ 72,195 |
$ 4,417 |
$ (11,604) |
$ 65,008 |
|||||||||||||
|
Stock compensation expense |
- |
- |
616 |
- |
- |
616 |
|||||||||||||
|
Net loss |
- |
- |
- |
- |
(6,118) |
(6,118) |
$ (6,118) | ||||||||||||
|
Cumulative translation adjustment |
- |
- |
- |
(7,489) |
- |
(7,489) |
(7,489) | ||||||||||||
|
Pension liability (net of |
|||||||||||||||||||
|
income taxes of $5,691) |
- |
- |
- |
(9,285) |
- |
(9,285) |
(9,285) | ||||||||||||
|
Total comprehensive loss |
$ (22,892) | ||||||||||||||||||
|
Balances at December 31, 2008 |
1 |
- |
72,811 |
(12,357) |
(17,722) |
42,732 |
|||||||||||||
|
Stock compensation expense |
- |
- |
419 |
- |
- |
419 |
|||||||||||||
|
Net loss |
- |
- |
- |
- |
(5,935) |
(5,935) |
$ (5,935) | ||||||||||||
|
Cumulative translation adjustment |
- |
- |
- |
3,927 |
- |
3,927 |
3,927 | ||||||||||||
|
Pension liability (net of |
|||||||||||||||||||
|
income taxes of $2,370) |
- |
- |
- |
3,356 |
- |
3,356 |
3,356 | ||||||||||||
|
Total comprehensive income |
$ 1,348 | ||||||||||||||||||
|
Balances at December 31, 2009 |
1 |
- |
73,230 |
(5,074) |
(23,657) |
44,499 |
|||||||||||||
|
Stock compensation expense |
- |
- |
291 |
- |
- |
291 |
|||||||||||||
|
Net loss |
- |
- |
- |
- |
(2,774) |
(2,774) |
$ (2,774) | ||||||||||||
|
Cumulative translation adjustment |
- |
- |
- |
508 |
- |
508 |
508 | ||||||||||||
|
Pension liability (net of |
|||||||||||||||||||
|
income taxes of $1,484) |
- |
- |
- |
(2,529) |
- |
(2,529) |
(2,529) | ||||||||||||
|
Total comprehensive loss |
$ (4,795) | ||||||||||||||||||
|
Balances at December 31, 2010 |
1 |
$ - |
$ 73,521 |
$ (7,095) |
$ (26,431) |
$ 39,995 |
|||||||||||||
The accompanying notes are an integral part of these consolidated financial statements.
F-5
Exopack Holding Corp. and Subsidiaries
Consolidated Statements of Cash Flows
The accompanying notes are an integral part of these consolidated financial statements
F-6
Exopack Holding Corp. and Subsidiaries
Notes to Consolidated Financial Statements
1. Organization and Acquisitions
Exopack Holding Corp. and subsidiaries (the “Company”) was formed in October of 2005 through the acquisition and consolidation of three flexible packaging businesses, including Exopack Holding Corporation (“Exopack”), Cello-Foil Products, Inc. (“Cello-Foil”), and The Packaging Group (“TPG”). Following this acquisition and consolidation, the Company is wholly-owned by Exopack Key Holdings, LLC, which is a wholly-owned subsidiary of CPG Finance, Inc. (“CPG”), an affiliate of Sun Capital Partners, Inc. (“Sun Capital”).
The Company operates 19 manufacturing facilities located throughout the United States, United Kingdom and Canada. The Company operates four manufacturing facilities in the pet food and specialty packaging segment, all of which are owned properties. The Company operates seven manufacturing facilities in the consumer food and specialty packaging segment, of which the Company leases two, including one manufacturing facility in Ontario, Canada, and owns the remaining five facilities. The Company operates six facilities in the performance packaging segment, of which the Company leases two and owns the remaining four facilities. The Company operates two manufacturing facilities in the coated products segment, both of which the Company leases, including one manufacturing facility in North Wales, United Kingdom.
On August 6, 2007, the Company acquired 100% of the membership interests of InteliCoat Technologies Image Products Matthews, LLC and 100% of the outstanding shares of its affiliate, InteliCoat Technologies EF Holdco, Ltd. (collectively, the “Electronic and Engineered Films Business” or “EEF”), and also acquired certain assets and assumed certain liabilities of other EEF entities (the “EEF Acquisition”). EEF, through its parent companies prior to the EEF Acquisition, was previously controlled by an affiliate of Sun Capital. The Company subsequently renamed this acquired EEF business Exopack Advanced Coatings (“EAC”).
On November 28, 2007, the Company acquired certain assets and assumed certain liabilities of DuPont Liquid Packaging System Inc.’s performance films business segment (“Liqui-Box”), including its Whitby, Ontario, Canada operating facility. Prior to the acquisition, the Company used Liqui-Box as a vendor for one of its Canadian facilities. The Company subsequently renamed this acquired Liqui-Box business Exopack Performance Films (“EPF”).
Exopack Meat, Cheese and Specialty Acquisition
On July 13, 2010, the Company completed the acquisition of certain assets and liabilities of a packaging business previously operated by Bemis Company, Inc. The acquired business, which is referred to in this report as Exopack Meat, Cheese and Specialty (“EMCS”) involves the manufacture and sale of certain packaging products primarily in the United States and Canada, including flexible-packaging rollstock used for chunk, sliced or shredded natural cheeses packaged for retail sale and flexible-packaging shrink bags used for fresh meat. EMCS is included within the Company’s consumer food and specialty packaging segment (see Note 11). The acquisition of EMCS provided the Company the unique opportunity to gain a position in the meat and cheese packaging sector and expand the Company’s product offerings in the consumer food and specialty packaging segment. The purchase price paid by the Company was approximately $82.1 million. The Company expensed approximately $4.6 million of acquisition costs related to the EMCS acquisition during the year ended December 31, 2010, respectively.
The Company funded the purchase price with proceeds from a term loan that was repaid on September 24, 2010 using proceeds from the issuance of additional 11.25% senior notes due 2014 (see Note 4).
Third party net sales and operating income related to EMCS were approximately $74.3 million and $6.0 million, respectively, for the year ended December 31, 2010.
F-7
The net acquisition cost of $82.1 million has been accounted for under the provisions of the Financial Accounting Standards Board (“FASB”) guidance related to the purchase method of accounting and includes the following allocations:
|
|
(in thousands of dollars) |
EMCS Acquisition | |
|
Assets acquired: |
|||
|
Trade accounts receivable |
$ 10,927 | ||
|
Other receivables |
220 | ||
|
Inventories |
12,909 | ||
|
Other current assets |
122 | ||
|
Property, plant and equipment |
43,894 | ||
|
Intangible assets |
30,550 | ||
|
Goodwill |
5,226 | ||
|
Total assets acquired |
103,848 | ||
|
Liabilities assumed: |
|||
|
Accounts payable |
(8,141) | ||
|
Accrued liabilities |
(4,359) | ||
|
Capital lease obligations |
(9,224) | ||
|
Total liabilities assumed |
(21,724) | ||
|
Purchase price paid |
$ 82,124 | ||
Unaudited pro forma net sales and operating income have been calculated as though the EMCS acquisition date was at the beginning of the years presented. Unaudited pro forma net sales were approximately $863.9 million for the year ended December 31, 2010. Unaudited pro forma net loss was approximately $1.9 million for the year ended December 31, 2010. Pro forma net sales were approximately $830.2 million and for the year ended December 31, 2009. Unaudited pro forma net loss was approximately $4.0 million for the year ended December 31, 2009.
The unaudited pro forma financial information presented above does not purport to be indicative of the future results of operations of the combined businesses.
F-8
2. Summary of Significant Accounting Policies
Use of Estimates
The preparation of these consolidated financial statements in conformity with accounting principles generally accepted in the United States of America requires management to make estimates and judgments that affect the reported amounts of assets, liabilities, revenues, and expenses, and related disclosure of contingent assets and liabilities. These estimates and assumptions are reasonable based upon management’s best estimates and judgments. On an ongoing basis, the Company evaluates estimates, including those related to the estimate of uncollectible accounts receivable and the estimate of excess and obsolete inventories. The Company bases its estimates on historical experience and on various other factors (including the current economic environment), the results of which form the basis for making judgments about the carrying values of assets and liabilities that are not readily apparent from other sources. The Company adjusts such estimates and assumptions when facts and circumstances dictate. Volatility in the credit, equity and foreign currency markets and in the world markets for petroleum, and declines in consumer spending have combined to increase the uncertainty inherent in such estimates and assumptions. Actual results may differ from these estimates under different assumptions or conditions.
The following accounting policies significantly affect the preparation of the Company’s consolidated financial statements:
Principles of Consolidation
The consolidated financial statements include the accounts of all wholly-owned subsidiaries. All intercompany balances and transactions have been eliminated.
Foreign Currency Translation and Transactions
Translation of the financial statements of the Company’s foreign subsidiaries, whose functional currency is the Canadian dollar and British pound, occurs using the current exchange rate at year end for the balance sheet and the weighted-average exchange rate during the reporting period for results of operations. The resulting currency translation adjustment is accumulated and reported in “Accumulated other comprehensive income (loss)” on the accompanying consolidated balance sheets. Gains and losses on foreign currency transactions are included in the consolidated statements of operations for the period in which the transaction occurs. The consolidated statements of cash flows include the effect of foreign currency cash flows using the weighted-average exchange rate during the reporting period.
Cash
Cash includes cash on hand and in banks. The Company has no cash instruments which are considered to be cash equivalents. Accounts payable in the accompanying balance sheets includes approximately $9.8 million and $9.0 million in book cash overdrafts at December 31, 2010 and 2009, respectively.
Inventories
At December 31, 2010 and 2009, inventories are stated at the lower of cost or market with cost determined on the first-in, first-out (“FIFO”) method. Inventories are stated net of the reserve for excess and obsolete inventories.
Property, Plant, and Equipment
The Company records property, plant and equipment at cost and includes interest capitalized during the construction period, if material. Depreciation is computed using the straight-line method over the estimated useful lives of the assets. The estimated useful lives are 30 years for buildings and improvements, 10 years for machinery and equipment, and 3-7 years for other depreciable assets. The cost of property, plant and equipment and related accumulated depreciation are removed from the accounts upon the retirement or disposal of such assets and the resulting gain or loss is recognized at the time of disposition. Maintenance and repairs that do not improve efficiency or extend economic life are charged to expense as incurred. Depreciation expense for the years ended December 31, 2010, 2009 and 2008 were approximately $27.3 million, $21.3 million and $20.1 million, respectively. No interest was capitalized during any of the periods presented.
Deferred Financing Costs
Costs related to the issuance of debt are amortized as a component of interest expense over the term of the related debt using the straight-line method, which approximates the effective interest method. Deferred financing costs related to financing arrangements in place at December 31, 2010, 2009 and 2008, respectively, were approximately $15.0 million, $5.2 million and $6.7 million (net of accumulated amortization of approximately $8.6 million, $5.5 million and $4.0 million, respectively).
F-9
Capitalization of Software for Internal Use
The Company capitalizes costs associated with software developed or obtained for internal use when both the preliminary project stage is completed and management has authorized further funding for the project which it deems probable of completion for the intended use. Capitalization of these costs ceases at the point at which the project is substantially complete and ready for its intended purpose. Once completed, capitalized software is amortized over its estimated useful life of three years. Capitalized software is classified in “other assets” on the accompanying consolidated balance sheets and was approximately $761,000 and $1.3 million at December 31, 2010 and 2009, respectively. Amortization of capitalized software costs was approximately $645,000, $608,000 and $340,000, respectively, for the years ended December 31, 2010, 2009 and 2008, respectively.
Goodwill
Goodwill represents the excess of the purchase price over the fair value of net assets acquired in purchase business combinations. The Company had total goodwill of approximately $69.6 million and $64.4 million at December 31, 2010 and 2009, respectively, from the Consolidation in 2005, the EEF acquisition in 2007 and the EMCS acquisition in July 2010. During the year ended December 31, 2010, the Company decreased goodwill related to its coated products segment by approximately $21,000 as a result of foreign currency translation. During the year ended December 31, 2009, the Company increased goodwill related to its coated products segment by approximately $66,000 as a result of foreign currency translation. The Company has determined that it consists of five reporting units for the purpose of the goodwill impairment test under FASB guidance related to goodwill and other intangible assets. The Company performs its annual impairment analysis on December 31 of each year based on a comparison of each reporting unit’s estimated fair value compared to the reporting unit’s carrying amount on that date. Estimated fair value is determined based on a combination of discounted cash flows and industry multiples. As a result of the impairment analysis, no impairment of goodwill was noted at December 31, 2010 or 2009 as the estimated fair value of each reporting unit exceeded the carrying value.
At December 31, 2010, approximately $26.2 million, $19.2 million, $21.6 million and $2.6 million of goodwill was assigned to the pet food and specialty packaging segment, the consumer food and specialty packaging segment, the performance packaging segment and the coated products segment, respectively. Goodwill, with the exception of approximately $3.3 million and $1.9 million assigned to the Company’s consumer food and specialty and coated products segments, respectively, is not deductible for income tax purposes.
Intangible assets
Contractual or separable intangible assets that have finite useful lives are being amortized against income using the straight-line method over their estimated useful lives of 10 to 21 years. The straight-line method of amortization reflects an appropriate allocation of the costs of the intangible assets to earnings in proportion to the amount of economic benefits obtained by the Company in each reporting period. The Company tests finite-lived assets for impairment whenever there is an impairment indicator and indefinite lived assets for impairment on an annual basis. Finite lived intangible assets are tested for impairment by comparing anticipated related undiscounted future cash flows from operations to the carrying value of the asset. Indefinite lived intangible assets are tested for impairment by comparing the estimated fair value of the asset to the carrying value of the asset.
Impairment of Long-Lived Assets
The Company reviews long-lived assets, including goodwill and other intangible assets, for impairment whenever events or changes in business circumstances indicate that the carrying amount of the assets may not be fully recoverable. For property, plant and equipment and other long-lived assets, other than goodwill and indefinite-lived intangible assets, the Company performs undiscounted operating cash flow analyses to determine if impairment exists. If impairment is determined to exist, any related impairment loss is calculated based upon comparison of the estimated fair value to the net carrying value of the assets. Impairment losses on assets held for sale are based on the estimated proceeds to be received, less costs to sell.
During the year ended December 31, 2010, the Company recorded accelerated depreciation expense of approximately $4.4 million, based on changes in the estimated useful lives of several pieces of equipment, primarily in the consumer food and specialty packaging and pet food and specialty packaging segments. During the year ended December 31, 2009 the Company recorded accelerated depreciation expenses of approximately $1.8 million, based on changes in the estimated useful lives of several pieces of equipment, primarily in the consumer food and specialty packaging segment and to a lesser extent other operating segments. See discussion of the measurement methodology for potential impairment of goodwill and indefinite-lived intangible assets above.
During the year ended December 31, 2008, the Company reduced the useful life of two patents due to the loss of business from which the patents derived their value. The Company recorded approximately $393,000 of additional amortization expense during 2008 related to these patents which is included in “Selling, general and administrative expenses” in the accompanying consolidated statement of operations.
F-10
Comprehensive Income (Loss)
Comprehensive income (loss) consists of net loss, adjustments to the Company’s minimum pension liability and unrealized gains and losses on foreign currency translation. All elements of other comprehensive income (loss) have related tax effects.
The following table represents the components of accumulated other comprehensive income (loss):
|
|
Year |
Foreign Currency Translation Adjustments |
Pension and Post Retirement Plans Liability |
CumulativeTax Effect on Liability |
Accumulated Comprehensive Income (Loss) | ||||
|
Balance at |
|||||||||
|
December 31, 2008 |
$ (4,750) |
$ (12,269) |
$ 4,662 |
$ (12,357) | |||||
|
Change during 2009 |
|
3,927 |
|
5,726 |
|
(2,370) |
|
7,283 | |
|
Balance at |
|||||||||
|
December 31, 2009 |
(823) |
(6,543) |
2,292 |
(5,074) | |||||
|
Change during 2010 |
|
508 |
|
(4,013) |
|
1,484 |
|
(2,021) | |
|
Balance at |
|||||||||
|
December 31, 2010 |
|
$ (315) |
|
$ (10,556) |
|
$ 3,776 |
|
$ (7,095) | |
Revenue Recognition
The Company recognizes sales revenue when all of the following conditions are met: persuasive evidence of an agreement exists, delivery has occurred, the Company’s price to the buyer is fixed and determinable and collectability is reasonably assured. Sales and related cost of sales are principally recognized upon transfer of title to the customer, which generally occurs upon shipment of products. The Company’s stated shipping terms are generally FOB shipping point unless otherwise noted in the customer contract. Sales to certain customers are on consignment and revenue is recognized when the customer uses the products. Provisions for estimated returns and allowances and customer rebates are recorded when the related products are sold.
Shipping and Handling Costs
Shipping and handling fees billed to customers are included in net sales with the corresponding cost of such services recognized in cost of sales.
Research and Development Costs
Research and development costs are charged to “Selling, general, and administrative expenses” as incurred. For the years ended December 31, 2010, 2009 and 2008, research and development expense costs were approximately $6.1 million, $3.1 million and $3.0 million, respectively. The significant increase in research and development costs for the year ended December 31, 2010 is primarily related to the EMCS acquisition.
Income Taxes
Income taxes are recorded under the asset and liability method whereby deferred tax assets and liabilities are recognized for the future tax consequences attributable to differences between the financial statement carrying amounts of existing assets and liabilities and their respective tax basis. Deferred tax assets and liabilities are measured using enacted tax rates expected to apply to taxable income in the years in which those temporary differences are expected to be recovered or settled. The Company does not currently intend to repatriate earnings, if any, from its Canadian subsidiaries, and considers these earnings to be permanently invested outside the U.S. As a result, no deferred tax liability has been recognized for earnings from Canadian subsidiaries. The Company has provided for deferred U.S. taxes on all undistributed earnings from its U.K. subsidiaries through December 31, 2010. Prior to 2010, the Company had not recognized a deferred tax liability associated with earnings from its U.K. subsidiaries because it considered these earnings to be permanently invested overseas. During the fourth quarter of 2010, the Company determined that the earnings from its U.K. subsidiaries should no longer be considered indefinitely reinvested. As a result, the Company recognized approximately $1.2 million of tax expense providing for deferred U.S. taxes for earnings from these subsidiaries.
The Company adopted updated FASB guidance related to accounting for uncertainty in income taxes on January 1, 2007. This updated guidance clarifies the accounting and reporting for uncertainties in income tax law. This guidance prescribes a comprehensive model for the financial statement recognition, measurement, presentation and disclosure of uncertain tax positions taken or expected to be taken in income tax returns.
F-11
Pursuant to FASB guidance related to uncertainty of income tax, the Company has analyzed its tax positions and has determined that no reserves for uncertain income tax positions are needed. United States federal income tax return periods beginning as of January 1, 2005, Canadian income tax return periods beginning as of January 1, 2004 and United Kingdom income tax return periods beginning as of January 1, 2008 are open for examination. The IRS completed its examination of the tax year ended December 31, 2006 on November 6, 2009 with no further adjustments other than the immaterial temporary differences previously accounted for in the year ended December 31, 2008. The Company believes that its income tax filing positions and deductions will be sustained and does not anticipate any adjustments that will result in a material change to its financial position within the next twelve months.
The Company’s policy for recording interest and penalties associated with unrecognized tax benefits is to record such items as a component of income before taxes. Penalties are recorded in other expense (income), net and interest is recorded in interest expense, in the accompanying consolidated statements of operations. There were no significant interest and penalties associated with unrecognized tax benefits for the years ended December 31, 2010, 2009 or 2008.
During the years ended December 31, 2010 and 2009, the Company recorded a valuation allowance of approximately $670,000 and $1.9 million, respectively, as reflected in the income tax expense on the accompanying statements of operations, against net operating losses specifically related to the Company’s Canadian operations in accordance with the provisions of FASB guidance related to accounting for income taxes. The Company determined that a valuation allowance was necessary given the operating results of the Canadian operations and anticipates establishing a valuation allowance against future Canadian generated net operating losses; however, future determinations of the need for a valuation allowance will be impacted by Canadian operating results.
Stock-Based Compensation
Officers and certain key employees of the Company have been granted options to purchase non-voting common shares of CPG, the parent company of Exopack Key Holdings (the sole stockholder of the Company) under a stock-based compensation plan (the “Stock Option Plan”) which is administered by the Board of Directors (or a committee thereof) of CPG.
The Company recorded stock compensation expense of approximately $291,000, $419,000 and $616,000 related to options during the years ended December 31, 2010, 2009 and 2008, respectively.
The fair values of the options granted were estimated on the dates of grant using the Black-Scholes option pricing model with the following results and assumptions for the option grants which occurred in the years ended December 31, 2010 and 2008:
|
2010 |
2008 | ||||||||||
|
Grants |
Grants | ||||||||||
|
Weighted-average grant date fair value per share |
$ 77 |
$ 88 | |||||||||
|
Weighted-averaged expected lives (years) |
10 |
10 | |||||||||
|
Risk-free interest rate |
2.61% |
3.79% | |||||||||
|
Volatility |
40.0% |
40.0% | |||||||||
There were no options granted during the year ended December 31, 2009.
Environmental Liabilities
Various state and federal regulations relating to health, safety and the environment govern the flexible packaging and plastic films and coated products industries, and the Company has invested substantial effort to prepare for and meet these requirements. While these requirements are continually changing, the Company believes that its operations are in substantial compliance with applicable health, safety and environmental regulations.
Costs associated with cleaning up existing environmental contamination caused by past operations and costs which do not benefit future periods are expensed. The Company records undiscounted liabilities for environmental costs when a loss is probable and can be reasonably estimated. At December 31, 2010 and 2009, management believes there were no material obligations related to environmental matters. Environmental expenses incurred in all of the periods presented herein were insignificant.
Pension Plans
The Company records annual amounts relating to its pension plans based on calculations which include various actuarial assumptions, including discount rates, mortality rates and annual rates of return on plan assets. These estimates are highly susceptible to change from period to period based on the performance of plan assets, actuarial valuations and market conditions. The Company reviews its actuarial assumptions on an annual basis and makes modifications to the assumptions based on current rates and trends. The Company believes that the assumptions used in recording its pension obligation are reasonable based on its experience, market conditions and input from its third party actuary and investment advisor.
F-12
Fair Value of Financial Instruments
The fair value of financial instruments is the amount at which the instrument could be exchanged in a current transaction between willing parties. The Company’s financial instruments principally consists of cash, accounts receivable from customers, accounts payable to vendors, and borrowings under long-term debt agreements. The fair value of the Company’s borrowings under its Senior Credit Facility approximate their carrying value (approximately $56.9 million at December 31, 2010), as those borrowings accrue interest at variable market rates. The fair value of the Company’s borrowings under its $320.0 million of 11.25% senior notes due 2014 was approximately $330.0 million at December 31, 2010 based on the trading price of the notes at that date, and the fair value of the Company’s borrowings under its $220.0 million of 11.25% senior notes due 2014 was approximately $223.6 million at December 31, 2009 based on the trading price of the notes at that date. The fair values of all other financial instruments approximate their carrying value due to their short-term nature.
Concentrations of Credit Risk
Financial instruments that potentially subject the Company to significant concentrations of credit risk consist principally of trade accounts receivable. The Company controls credit risk through credit approvals, credit limits and monitoring procedures. The Company does not require collateral for trade accounts receivable. One customer, primarily within the Company’s pet food and specialty packaging segment, accounted for 10.9% and 12.0% of total accounts receivable as of December 31, 2010 and 2009, respectively.
Concentrations of credit risk with respect to trade receivables are limited due to the wide variety of customers and markets into which the Company’s products are sold, as well as their dispersion across many different geographic areas, primarily in North America. There were no individual customers that accounted for more than 10% of the Company’s net sales during the year ended December 31, 2010. One customer, primarily within the Company’s pet food and specialty packaging segment, accounted for 11.5% and 11.8% of the Company’s net sales during the years ended December 31, 2009 and 2008, respectively.
Variable Interest Entity
During 2009, the Company entered into a joint venture agreement with INDEVCO Group, a Lebanese-based manufacturer (“INDEVCO”). The Company determined that the joint venture is a variable interest entity (“VIE”) under FASB guidance related to accounting for variable interest entities and that the Company is not the primary beneficiary of the VIE. The VIE consists of a manufacturing operation, located within an existing manufacturing facility owned by INDEVCO in Lebanon, used to co-extrude polyethylene film for use in flexible packaging. During the year ended December 31, 2010, the VIE purchased and installed the necessary extrusion equipment and production commenced in the third quarter of 2010. The Company’s maximum exposure to loss as a result of its involvement with the unconsolidated VIE is limited to the Company’s recorded investment in this VIE, which was approximately $768,000 at December 31, 2010. The Company recognized approximately $57,000 as its share of the loss of the joint venture’s operations during the year ended December 31, 2010. The Company may be subject to additional losses to the extent of any financial support that the Company provides in the future.
Recently Issued Accounting Pronouncements
In June 2009, the FASB issued SFAS No. 167, Amendments to FASB Interpretation No. 46(R), a grandfathered standard under the FASB’s Accounting Standards Codification. SFAS No. 167 amends the consolidation guidance that applies to variable interest entities to require an enterprise to perform an analysis to determine whether the enterprise’s variable interest or interests give it a controlling financial interest in a variable interest entity. The standard requires ongoing reassessments of whether an enterprise is the primary beneficiary of a variable interest entity. The standard is effective as of the beginning of a reporting entity’s first annual reporting period that begins after November 15, 2009, and for interim periods within that first annual reporting period. The adoption of this guidance for the year ended December 31, 2010 did not have a material impact on the Company’s financial position, results of operations or cash flows.
No significant new accounting guidance became effective for the Company during the year ended December 31, 2010. As of December 31, 2010, there was no issued guidance pending future adoption that is expected to have a significant impact on the Company’s financial statements when adopted.
F-13
3. Balance Sheet Information
The major components of certain balance sheet accounts at December 31, 2010 and 2009 are as follows:
|
|
(in thousands of dollars) |
2010 |
2009 | ||||||||
|
|
Inventories |
||||||||||
|
Raw materials and supplies |
$ 42,812 |
$ 33,592 | |||||||||
|
Work in progress |
12,275 |
10,376 | |||||||||
|
Finished goods |
48,641 |
36,004 | |||||||||
|
Total inventories |
|
$ 103,728 |
$ 79,972 | ||||||||
|
|
Property, plant and equipment |
||||||||||
|
Land |
$ 6,249 |
$ 5,578 | |||||||||
|
Buildings and improvements |
55,148 |
41,840 | |||||||||
|
Machinery and equipment |
220,435 |
181,280 | |||||||||
|
Other |
4,960 |
3,785 | |||||||||
|
Construction in progress |
15,137 |
7,027 | |||||||||
|
Gross property, plant, and equipment |
|
301,929 |
239,510 | ||||||||
|
Less: Accumulated depreciation |
(87,636) |
(65,455) | |||||||||
|
Net property, plant, and equipment |
|
$ 214,293 |
$ 174,055 | ||||||||
|
|
Intangible assets |
||||||||||
|
Definite-lived intangible assets: |
|||||||||||
|
Customer lists (amortized over 10-21 years) |
$ 43,276 |
$ 17,089 | |||||||||
|
Patents (amortized over 2-15 years) |
7,163 |
4,262 | |||||||||
|
Trademarks and tradenames (amortized over 20 years) |
2,618 |
1,180 | |||||||||
|
53,057 |
22,531 | ||||||||||
|
Accumulated amortization |
|
(11,073) |
(8,324) | ||||||||
|
Definite-lived intangible assets |
|
41,984 |
14,207 | ||||||||
|
Indefinite-lived intangible assets - trademarks and tradenames |
51,000 |
51,000 | |||||||||
|
Net intangible assets |
|
$ 92,984 |
$ 65,207 | ||||||||
|
|
Accrued liabilities |
||||||||||
|
Interest |
$ 15,141 |
$ 10,342 | |||||||||
|
Vacation |
6,915 |
5,949 | |||||||||
|
Payroll and bonuses |
4,970 |
3,125 | |||||||||
|
Pension liability to be funded within one year (see Note 5) |
3,008 |
1,406 | |||||||||
|
Workers’ compensation |
1,534 |
1,584 | |||||||||
|
Medical insurance claims |
2,882 |
3,202 | |||||||||
|
Accrued severance (see Note 7) |
419 |
2,092 | |||||||||
|
Customer rebates |
6,527 |
1,377 | |||||||||
|
Property taxes |
1,920 |
1,327 | |||||||||
|
Accrued utilities |
1,293 |
1,042 | |||||||||
|
Accrued freight |
1,021 |
857 | |||||||||
|
Other |
1,238 |
1,476 | |||||||||
|
$ 46,868 |
$ 33,779 | ||||||||||
|
|
Other liabilities |
||||||||||
|
Liability for pension benefits (see Note 5) |
$ 14,445 |
$ 13,021 | |||||||||
|
Postretirement medical benefits (see Note 5) |
588 |
543 | |||||||||
|
Deferred compensation liability (see Note 5) |
321 |
377 | |||||||||
|
Deferred rent |
688 |
743 | |||||||||
|
Other |
130 |
145 | |||||||||
|
$ 16,172 |
$ 14,829 | ||||||||||
Amortization expense for definite-lived assets for the years ended December 31, 2010, 2009 and 2008 was approximately $2.8 million, $2.0 million and $2.1 million (excluding approximately $393,000 of amortization due to adjustment of useful life for two patents, see Note 2), respectively. Estimated future annual amortization for definite-lived customer lists, patents, and trademarks/trade names is approximately $3.8 million per year for 2011 through 2014 and is approximately $3.5 million for 2015.
F-14
4. Financing Arrangements
The balances due under debt agreements at December 31, 2010 and 2009 were as follows:
|
|
(in thousands of dollars) |
2010 |
2009 | |||||||||
|
Senior notes |
$ 320,000 |
$ 220,000 | ||||||||||
|
Senior credit facility |
56,906 |
68,555 | ||||||||||
|
Subordinated term loan |
33 |
82 | ||||||||||
|
Capital leases |
12,377 |
- | ||||||||||
|
Total debt |
|
389,316 |
288,637 | |||||||||
|
Less: Current portion |
58,815 |
68,603 | ||||||||||
|
Total long-term debt |
|
$ 330,501 |
$ 220,034 | |||||||||
Issuance of Senior Notes
On January 31, 2006, the Company completed an unregistered private offering of $220.0 million aggregate principal amount of 11.25% senior notes due 2014. Pursuant to an exchange offer, effective December 22, 2006, the Company exchanged all of the unregistered 11.25% senior notes due 2014 for new 11.25% senior notes due 2014 registered under the Securities Act of 1933 (the “Existing Notes”).
On September 24, 2010, the Company completed the private placement of $100.0 million in principal amount of 11.25% senior notes due 2014 (the “Additional Notes”). The Company used the proceeds from the offering of the Additional Notes and cash on hand to repay a $100.0 million term loan the Company incurred to fund the purchase price of the EMCS acquisition and to pay certain transaction and integration costs related thereto, as described in more detail below under “Credit and Guaranty Agreement.” The Additional Notes were issued as additional notes under the indenture pursuant to which the Company issued the Existing Notes. The Additional Notes are treated as a single series with the Existing Notes under the indenture and have the same terms as the Existing Notes. The Company completed an offer to exchange registered notes for the Additional Notes as required by the terms of a registration rights agreement related to the Additional Notes on November 30, 2010. Approximately $1.0 million in principal amount of 11.25% senior notes due 2014 were not tendered for exchange and remain private unregistered notes. The Existing Notes, together with the Additional Notes and the private unregistered notes are referred to in this report as the “Notes.”
Interest on the Notes is payable semi-annually in arrears on February 1 and August 1. The Notes mature on February 1, 2014, unless previously redeemed, and the Company will not be required to make any mandatory redemption or sinking fund payment prior to maturity except in connection with a change in ownership or in the event of a sale of certain assets. The Company may redeem all or a portion of the Notes at a redemption price equal to 100.0% of the principal amount of the Notes, plus a premium declining ratably to par (as defined in the indenture), plus accrued and unpaid interest to the date of redemption. The Company has no plans to redeem the Notes at this time.
The Company and all of its domestic restricted subsidiaries have fully and unconditionally guaranteed the Notes, which guarantees are fully secured by the assets of such guarantors. See Note 14 for consolidating financial information required by Rule 3-10 of Regulation S-X. The Notes place certain restrictions on the Company including, but not limited to, the Company’s ability to incur additional indebtedness, incur liens, pay dividends, make investments, consummate certain asset sales, enter into certain transactions with affiliates, merge or consolidate with any other person or sell or otherwise dispose of the assets of the Company and its subsidiaries. In connection with the acquisition of EMCS, the Company assumed indebtedness relating to acquired assets, including certain capital lease obligations in the amount of $9.2 million. Subsequent to the EMCS acquisition and prior to December 31, 2010, the Company re-negotiated the capital lease obligations related to manufacturing equipment assumed as part of the acquisition. As part of the re-negotiation, the Company cancelled one of the capital leases and purchased the asset. As a result of the renegotiation and purchase of one of the previously leased assets, indebtedness relating to acquired assets, including certain capital lease obligations were $7.8 million at December 31, 2010.
Credit and Guaranty Agreement
On July 13, 2010, in connection with the EMCS acquisition, the Company, Exopack Key Holdings, LLC, and certain subsidiaries of the Company, as guarantors, entered into a Credit and Guaranty Agreement (the “Credit Agreement”) with Goldman Sachs Lending Partners LLC (“GS Lending Partners”), as Sole Lead Arranger, Sole Lead Bookrunner, Administrative Agent, Syndication Agent and Documentation Agent. The Credit Agreement provided for a term loan in an amount of up to $100.0 million (the “Term Loan”). Immediately prior to the closing of the EMCS acquisition, the Company borrowed the full amount of the Term Loan to be used for (i) consideration in respect of the EMCS acquisition, (ii) certain transaction costs related to the EMCS acquisition and (iii) certain integration costs in connection with the EMCS acquisition in an amount not to exceed $5.0 million. The Company’s obligations under the Credit Agreement were guaranteed by the Company’s parent and certain subsidiaries of the Company set forth in the Credit Agreement.
F-15
The Term Loan was initially funded as a Base Rate Loan (as such term is defined in the Credit Agreement). As a Base Rate Loan, the Term Loan initially bore interest at a rate per annum equal to the Base Rate (as such term is defined in the Credit Agreement), which could not be less than 3.00% per annum, plus a margin of 8.25% per annum. The Company generally had the option under the Credit Agreement to convert all or part of the Term Loan to a Eurodollar Rate Loan. Any Eurodollar Rate Loan would bear interest at a rate per annum equal to the Adjusted Eurodollar Rate (as such term is defined in the Credit Agreement), which would not be less than 2.00% per annum, plus a margin of 9.25% per annum. In each case, interest on the unpaid principal amount of the Term Loan was at no time less than 12.00% per annum.
The Credit Agreement contained certain customary affirmative and negative covenants that restricted the Company’s and its subsidiaries’ ability to, among other things, incur additional indebtedness, grant liens, engage in mergers, acquisitions and asset sales, declare dividends and distributions, redeem or repurchase equity interests, make loans, certain payments and investments and enter into transactions with affiliates.
Under the Credit Agreement, the Company paid customary closing fees and other fees for a credit facility of this size and type.
The Company paid $11.6 million in deferred financing fees related to this agreement and the contemplated Additional Notes during the year ended December 31, 2010. These deferred financing fees were transferred to the Additional Notes and will be amortized over the term of the Additional Notes described above. The Term Loan and related accrued interest was repaid on September 24, 2010 using proceeds received from the Company’s issuance of the Additional Notes.
Senior Credit Facility
On January 31, 2006, the Company entered into a senior secured revolving credit facility with a syndicate of financial institutions. On August 6, 2007, the Company amended this facility to provide for an increase in the maximum credit facility to $75.0 million, which included a Canadian dollar sub-facility available to the Company’s Canadian subsidiaries for up to $15.0 million (or the Canadian dollar equivalent). A reserve has been established in the U.S. for the U.S. dollar equivalent of amounts outstanding under the Canadian sub-facility. On October 31, 2007, the Company amended this facility to provide for an increase in the maximum credit facility to $110.0 million, to provide for an increase in the Canadian dollar sub-facility to $25.0 million and to amend certain borrowing base limitations. On July 2, 2010, the loan agreement related to this facility was amended and restated to provide for an increase in the maximum credit facility to $125.0 million (the “Senior Credit Facility”). The Senior Credit Facility also provides the Company’s domestic and Canadian subsidiaries with letter of credit sub-facilities. Availability under the Senior Credit Facility is subject to borrowing base limitations for both the U.S. and the Canadian subsidiaries, as defined in the loan agreement. In general, in the absence of an event of default, the Senior Credit Facility matures at the earliest of (a) July 2, 2014 or (b) ninety (90) days prior to the stated maturity of the Notes. Under the terms of the Company’s lock box arrangement, remittances automatically reduce the revolving debt outstanding on a daily basis and therefore the Senior Credit Facility is classified as a current liability on the accompanying consolidated balance sheets at December 31, 2010 and 2009. At December 31, 2010, approximately $56.9 million was outstanding and approximately $58.0 million was available for additional borrowings under the Senior Credit Facility.
Under the Senior Credit Facility, in general, interest subsequent to July 2, 2010 accrues on amounts outstanding under the U.S. facility at a variable annual rate equal to the U.S. Index Rate (as defined in the loan agreement related to the Company’s Senior Credit Facility) plus 2.0%, or at the Company’s election, at an annual rate equal to the LIBOR Rate (as defined in the loan agreement related to the Company’s Senior Credit Facility) plus 3.0%. In general, interest accrues on amounts outstanding under the Canadian sub-facility at a variable rate equal to the Canadian Index Rate (as defined in the loan agreement related to the Company’s Senior Credit Facility) plus 2.0%, or at the Company’s election, at an annual rate equal to the BA Rate (as defined in the loan agreement related to the Company’s Senior Credit Facility) plus 3.0%. The weighted average interest rate on borrowings outstanding under the Senior Credit Facility at December 31, 2010 was approximately 3.5%. The Senior Credit Facility also includes unused facility and letter-of-credit fees which are reflected in interest expense in the accompanying consolidated statements of operations.
Under the Senior Credit Facility, in general, interest prior to July 2, 2010 accrued on amounts outstanding under the U.S. facility at a variable annual rate equal to the U.S. Index Rate (as defined in the prior loan agreement) plus 0.5% or, upon the Company’s prior notice, at an annual rate equal to LIBOR plus 1.5% (as defined in the prior loan agreement). Interest accrued on amounts outstanding under the Canadian facility at a variable annual rate equal to the Canadian Index Rate (as defined in the prior loan agreement) plus 0.5% or, upon the Company’s prior notice, at an annual rate equal to the BA Rate (as defined in the prior loan agreement) plus 1.5%.
F-16
The Senior Credit Facility is collateralized by substantially all of the Company's tangible and intangible property (other than real property and equipment). In addition, all of the Company's equity interests in its domestic subsidiaries and a portion of the equity interests in its foreign subsidiairies are pledged to collateralize the Senior Credit Facility.
The Senior Credit Facility places certain restrictions on the Company including, but not limited to, the Company’s ability to incur additional indebtedness, incur liens, pay dividends, make investments, consummate certain asset sales, enter into certain transactions with affiliates, merge or consolidate with any other person or sell or otherwise dispose of the assets of the Company and its subsidiaries. At December 31, 2010, the Company was in compliance with these restrictions.
The Company incurred approximately $1.3 million in deferred financing costs related to the amendment of the Senior Credit Facility during the year ended December 31, 2010, which will be amortized over the term of the Senior Credit Facility.
At December 31, 2010, there were outstanding letters of credit of approximately $4.2 million under the Senior Credit Facility.
Subordinated Term Loans
On August 3, 2006, the Company entered into a subordinated term loan agreement of approximately $238,000 requiring monthly payments of principal and interest of approximately $4,000 for a five-year period. The Company has determined interest on the loan using the lender’s annual implicit rate of 2.0%. The loan is collateralized by certain machinery and equipment of the Company. At December 31, 2010, approximately $33,000 is outstanding under this agreement.
5. Employee Benefit Plans
The measurement date for defined benefit plan assets and liabilities is December 31, the Company’s fiscal year end. A summary of the elements of key employee benefit plans is as follows:
Exopack, LLC Defined Benefit Plans
The pension assets and obligations of the Retirement Plan of Exopack, LLC (the “Retirement Plan”) and the pension obligations of the Exopack, LLC Pension Restoration Plan for Salaried Employees (the “Restoration Plan”) (collectively, the “Pension Plans”) were transferred to and assumed by the Company in connection with the Exopack Acquisition in 2005. Substantially all full-time employees of Exopack, LLC hired prior to June 30, 2003 were eligible to participate in the Retirement Plan. The Pension Plans were frozen prior to the Exopack Acquisition. Accordingly, the employees’ final benefit calculation under the Pension Plans was the benefit they had earned under the Pension Plans as of the date the Pension Plans were frozen. This benefit will not be diminished, subject to the terms and conditions of the Pension Plans, which will remain in effect.
In conjunction with the EMCS acquisition, the Company assumed a defined benefit pension plan for certain union employees at the Menasha, Wisconsin facility. Employees hired prior to March 1, 2010 were eligible to participate in the plan upon completion of 1,000 service hours. This plan was subsequently incorporated into the Retirement Plan of Exopack, LLC.
In 2009, the Company adopted FASB guidance related to additional disclosure for employer’s accounting for defined benefit, pension and other post retirement plans. The following sets forth the information related to the changes in the benefit obligations of the Pension Plans and change in plan assets of the Retirement Plan and a reconciliation of the funded status of the Pension Plans for the years ended December 31, 2010 and 2009.
F-17
|
December 31, |
December 31, | ||||||
|
|
(in thousands of dollars) |
2010 |
2009 | ||||
|
|
Change in benefit obligation |
||||||
|
Benefit obligation at beginning of year - January 1 |
$ 56,614 |
$ 53,737 | |||||
|
Service cost |
374 |
- | |||||
|
Interest cost |
3,291 |
3,207 | |||||
|
Actuarial loss |
5,899 |
1,142 | |||||
|
Benefits paid |
(1,666) |
(1,472) | |||||
|
Benefit obligation at end of year - December 31 |
|
$ 64,512 |
$ 56,614 | ||||
|
|
Change in plan assets |
||||||
|
Fair value of plan assets at beginning of year - January 1 |
$ 42,187 |
$ 33,494 | |||||
|
Actual return on plan assets |
5,132 |
8,928 | |||||
|
Employer contributions |
1,406 |
1,237 | |||||
|
Benefits paid |
(1,666) |
(1,472) | |||||
|
Fair value of plan assets at end of year - December 31 |
|
$ 47,059 |
$ 42,187 | ||||
|
|
Unfunded status of the plan |
$ (17,453) |
$ (14,427) | ||||
|
Accumulated and projected benefit obligation - December 31 |
$ 64,512 |
$ 56,614 | |||||
|
December 31, |
December 31, | ||||||
|
|
(in thousands of dollars) |
2010 |
2009 | ||||
|
Components of net periodic benefit costs |
|||||||
|
Service cost |
$ 374 |
$ - | |||||
|
Interest cost |
3,291 |
3,207 | |||||
|
Expected return on assets |
(3,357) |
(2,673) | |||||
|
Amortization of net actuarial loss |
120 |
653 | |||||
|
Net periodic pension benefit cost |
$ 428 |
$ 1,187 | |||||
|
Other changes in plan assets and benefit obligations recognized in |
|||||||
|
other comprehensive income |
|||||||
|
Other comprehensive income at beginning of period - January 1 |
$ 6,735 |
$ 12,502 | |||||
|
Net actuarial loss recognized during the period |
(120) |
(653) | |||||
|
Net (gain) loss during the period |
4,124 |
(5,113) | |||||
|
Unrecognized other comprehensive income at end of period - December 31 |
$ 10,739 |
$ 6,736 | |||||
|
Total recognized loss (gain) in other comprehensive income |
$ 4,004 |
$ (5,766) | |||||
|
Total recognized in net periodic benefit cost and other comprehensive income |
$ 4,432 |
$ (4,579) | |||||
The weighted-average discount rate used to determine the benefit obligation for the Pension Plans at December 31, 2010 and 2009 was 5.40% and 5.90%, respectively. The Company sets its discount rate annually in relationship to movements in published benchmark rates. Benefit accruals in the Pension Plan are either frozen or determined without regard to compensation so no weighted-average rate of compensation increase assumption is used in the determination of benefit obligation.
The accumulated benefit obligation for the Pension Plans was approximately $64.5 million and $56.6 million at December 31, 2010 and 2009, respectively. The resulting unfunded pension liability at December 31, 2010 and 2009 was approximately $17.5 million and $14.4 million, respectively. The cumulative decrease in other comprehensive income before tax was approximately $4.0 million for the year ended December 31, 2010.
F-18
Components of the net periodic pension benefit cost (income) for the years ended December 31, 2010, 2009 and 2008 are as follows:
|
December 31, |
December 31, |
December 31, | |||||||||||
|
|
(in thousands of dollars) |
2010 |
2009 |
2008 | |||||||||
|
Service cost |
$ 374 |
$ - |
$ - | ||||||||||
|
Interest cost |
3,291 |
3,207 |
3,110 | ||||||||||
|
Expected return on plan assets |
(3,357) |
(2,673) |
(3,667) | ||||||||||
|
Amortization of net actuarial loss |
120 |
653 |
- | ||||||||||
|
Net periodic pension benefit cost (income) |
$ 428 |
$ 1,187 |
$ (557) | ||||||||||
The weighted-average discount rate used to determine the benefit cost for the Pension Plans was 5.90%, 6.10% and 6.00% for the years ended December 31, 2010, 2009 and 2008, respectively. The expected rate of return on plan assets used to determine the benefit cost for the Retirement Plan was 8.0% for each of the years ended December 31, 2010, 2009 and 2008. Based on current global stock market valuations, the Company expects to incur net periodic benefit costs of approximately $1.6 million in 2011.
The Company expects approximately $452,000 in accumulated other comprehensive income to be reclassified into net period cost in 2011 related to unrecognized net actuarial gains and losses. There are no unrecognized prior service costs or transition obligations for the Pension Plans at December 31, 2010.
The Company’s overall investment strategy is to achieve a mix of investments for long-term growth and near-term benefit payments through diversification of asset types, fund strategies and fund managers. Investment risk is measured on an on-going basis through annual liability measurements, periodic asset/liability studies, and quarterly investment portfolio reviews. The Pension Plans invest in the following major asset categories: equity securities and fixed income securities. At December 31, 2010 and 2009, pension investments did not include any direct investments in the Company’s stock or the Company’s debt.
The weighted-average allocation of plan assets by asset category for the Retirement Plan at December 31, 2010 and 2009 was as follows:
|
2010 |
2009 | |||||||||
|
|
Asset category |
|||||||||
|
Equity securities |
66.0 % |
70.0 % | ||||||||
|
Fixed income securities |
34.0 % |
30.0 % | ||||||||
|
100.0 % |
100.0 % | |||||||||
For the years ended December 31, 2010 and 2009, the Company’s targeted allocation, by asset category were 65% for equity securities and 35% for fixed income securities. The Company establishes its weighted-average expected long-term return on plan assets considering various factors, which include the targeted asset allocation percentages, historical return performance and expected future returns.
F-19
The following table sets forth, by category and within the fair value hierarchy, the estimated fair value of the Company’s pension assets at December 31, 2010:
|
Fair Value Measurements at December 31, 2010 | ||||||||||||||
|
Quoted Prices in |
||||||||||||||
|
Active Markets |
Significant | |||||||||||||
|
for Identical |
Significant |
Unobservable | ||||||||||||
|
Assets |
Observable Inputs |
Inputs | ||||||||||||
|
Total |
(Level 1) |
(Level 2) |
(Level 3) | |||||||||||
|
Asset category |
||||||||||||||
|
Equity securities: |
||||||||||||||
|
Mutual funds(1) |
$ 28,945 |
$ 28,945 |
$ - |
$ - | ||||||||||
|
Management money - equity specialty(2) |
2,245 |
- |
2,245 |
- | ||||||||||
|
Fixed income securities: |
- |
|||||||||||||
|
Mutual funds(3) |
14,096 |
14,096 |
- |
- | ||||||||||
|
Commingled fund - fixed income specialty(4) |
1,773 |
- |
1,773 |
- | ||||||||||
|
$ 47,059 |
$ 43,041 |
$ 4,018 |
$ - | |||||||||||
(1) This class represents actively traded mutual funds of market equities.
(2) This class represents a managed account specifically for the pension asset trust that primarily consists of common stocks.
(3) This class represents actively traded mutual funds of fixed income securities.
(4) This class represents commingled funds actively managed by investment managers that focuses on fixed income securities.
The following table sets forth benefit payments expected to be paid by the Pension Plans for the period indicated:
|
(in thousands of dollars) |
||||||||
|
2011 |
$ 2,036 | |||||||
|
2012 |
$ 2,254 | |||||||
|
2013 |
$ 2,468 | |||||||
|
2014 |
$ 2,702 | |||||||
|
2015 |
$ 2,953 | |||||||
|
In aggregate during five-years thereafter |
$ 18,951 | |||||||
Contributions of approximately $3.0 million are expected to be made to the Retirement Plan in 2011, and no contributions are expected to be required or made to the Restoration Plan in 2011. At December 31, 2010, the fair value of the assets of the Pension Plans was $47.1 million, up from $42.2 million at December 31, 2009. The significant increase was mainly due to the continued rebound in global stock prices that occurred during 2010.
Retirement Plan for Employees for Exopack Performance Films, Inc.
On January 29, 2008, the Company adopted the Retirement Plan for Employees of Exopack Performance Films, Inc., retroactive to December 1, 2007. Exopack Performance Films’ employees at the Whitby location are eligible to participate in the plan. There are two portions of the plan, a defined contribution plan and a savings plan. In the defined contribution plan, contributions are made by the Company only, and are based on an age and service formula. The supplemental employer contribution to the defined contribution plan was guaranteed for a two-year period that began on December 1, 2007 and ended on November 30, 2009. The Company contributed a total of approximately $357,000 and $933,000 to the defined contribution plan during the years ended December 31, 2010 and 2009, respectively. None of the amount contributed to the defined contribution plan during the year ended December 31, 2010 was related to the supplemental employer contribution as the supplemental portion of the defined contribution plan ended on November 30, 2009. Of the amounts contributed during the year ended December 31, 2009, approximately $542,000 was related to the guaranteed supplemental employer contribution. In addition, employees can contribute to the savings plan and receive a match of 50% on the first 4% the employee defers to the plan. Employer contributions to the savings plan were discontinued as of March 1, 2010 and no further employer contributions will be made to the plan. Accordingly, total expense related to the savings plan was approximately $28,000 and $116,000 for the years ended December 31, 2010 and 2009, respectively. During the two-year transitional period, which ended November 30, 2009, the employees received a contribution of 2% in the savings plan regardless of their savings plan contribution. Total expense for employees who did not participate in the plan was approximately zero and $44,000 for the years ended December 31, 2010 and 2009, respectively.
F-20
Savings Plans for the Companies of Exopack
The Company has a 401(k) plan, which is a defined contribution plan that covers all full-time employees in the United States. The Company partially matches employee contributions which vest immediately. Expense totaled approximately $1.6 million, $2.8 million and $2.9 million for the years ended December 31, 2010, 2009 and 2008, respectively. The significant decrease in 2010 expense compared to 2009 is primarily related to a decrease in the employer matching contribution from 4% to 2% effective January 1, 2010, partially offset by the matching contribution related to the employees from the EMCS acquisition.
Profit-Sharing Plan
The Savings Plans for the Companies of Exopack provide for a profit-sharing contribution for certain employees, which is based on a percentage of income before income taxes (as defined by the plan), as well as current compensation earned by participants and years of service. Profit-sharing expense under these plans for the years ended December 31, 2010, 2009 and 2008 was approximately $115,000, $40,000, and $70,000, respectively. Employees vest in the Company’s profit sharing contributions over a six-year period, with 10% vesting per year during the first two years of service and 20% per year thereafter.
Postretirement Benefit Plan
The Company is obligated to provide healthcare benefits on a restricted basis, to certain employees pursuant to a collective bargaining agreement (the “Postretirement Plan”).
The following sets forth the information related to the change in the unfunded accumulated benefit obligation for the years ended December 31, 2010 and 2009:
The significant assumptions used to measure the expected cost of benefits are as follows:
Weighted-average assumed health care cost trend rate:
9.0% grading uniformly to 5.0% over an eight-year period for the year ending December 31, 2010.
8.5% grading uniformly to 5.0% over an eight-year period for the years ending December 31, 2009 and 2008
F-21
Weighted-average discount rates for obligation:
5.40% at December 31, 2010
5.90% at December 31, 2009
Discount rates for the net periodic benefit cost:
5.90% for the year ended December 31, 2010
6.10% for the year ended December 31, 2009
6.00% for the year ended December 31, 2008
The Company sets its discount rate annually in relationship to movements in published benchmark rates. The ultimate health care cost trend rate of 5% represents the Company’s best estimate of the long-term average annual health care cost increase over the duration of the postretirement benefit plan’s liabilities.
The effects of a 1% increase or decrease in assumed health care cost trend rates would have an insignificant effect on both the accumulated postretirement benefit obligation for health care benefits at December 31, 2010 and 2009 and the aggregate of net periodic postretirement health and benefit costs for the years ended December 31, 2010, 2009 and 2008.
Components of the net periodic postretirement benefit cost for the years ended December 31, 2010, 2009 and 2008 are as follows:
|
December 31, |
December 31, |
December 31, | |||||||||||
|
|
(in thousands of dollars) |
2010 |
2009 |
2008 | |||||||||
|
Components of net periodic benefit costs |
|||||||||||||
|
Service cost |
$ 22 |
$ 23 |
$ 21 | ||||||||||
|
Interest cost |
29 |
29 |
25 | ||||||||||
|
Amortization of net actuarial gains |
(16) |
(15) |
(16) | ||||||||||
|
Net periodic postretirement benefit cost |
$ 35 |
$ 37 |
$ 30 | ||||||||||
The Company expects approximately $10,000 in accumulated other comprehensive income to be reclassified into net period cost in 2011 related to unrecognized actuarial gains. There are no unrecognized prior service costs or transition obligations for the Postretirement Plan at December 31, 2010. The Company expects to incur net periodic benefit costs of approximately $40,000 in 2011.
The following table sets forth benefit payments expected to be paid for the periods indicated:
|
|
(in thousands of dollars) |
|||||||
|
2011 |
$ 15 | |||||||
|
2012 |
$ 27 | |||||||
|
2013 |
$ 39 | |||||||
|
2014 |
$ 43 | |||||||
|
2015 |
$ 47 | |||||||
|
In aggregate for the five-years thereafter |
$ 341 | |||||||
Other than Company contributions to fund annual benefit payments, no other contributions are expected to be required or made to fund the postretirement benefit obligation in 2011.
Stock Option Plan
In December 2005, CPG’s Board of Directors approved the establishment of the 2005 Stock Option Plan of CPG Finance, Inc. (the “2005 Stock Option Plan”), in which officers and certain key employees of the Company are able to participate, and reserved 100,000 shares of CPG’s non-voting common shares for the 2005 Stock Option Plan. Under the 2005 Stock Option Plan, options have a term of no longer than 10 years and vest ratably over a five-year period.
The FASB revised guidance related to share-based payments in December of 2004. This guidance requires nonpublic companies that have used the “minimum value method” under the previous guidance for either recognition or pro forma purposes to use the prospective method of the new guidance for transition. The prospective method allows companies to continue to account for previously issued awards that remain outstanding at the date of adopting the new guidance using pre-existing accounting standards and, accordingly, there will be no material compensation expense related to the options issued in December 2005. The pro forma impact of the December 2005 options would be immaterial for disclosure purposes during 2010, 2009 and 2008. The prospective method also requires nonpublic companies to record compensation cost in accordance with the guidance only for awards issued, modified, repurchased, or cancelled after the effective date. Compensation expense related to options issued subsequent to the adoption of the revised guidance is being recorded ratably over the vesting period of five years. The CPG Board granted 11,600 options to certain of the Company’s officers and key employees during the year ended December 31, 2010. The CPG Board did not issue any options during the year ended December 31, 2009. The CPG Board granted 23,550 options to certain of the Company’s officers and key employees during the year ended December 31, 2008. The Company recorded related compensation expense of approximately $291,000, $419,000 and $616,000 during the years ended December 31, 2010, 2009 and 2008, respectively. As of December 31, 2010, the total compensation cost related to non-vested awards not yet recognized was approximately $1.5 million. This compensation cost is expected to be recognized over the remaining weighted-average vesting period of 2.5 years.
F-22
The following table summarizes information about stock options outstanding at December 31, 2010 (there were zero shares exercisable at December 31, 2010):
|
Options Outstanding | ||||||
|
|
Weighted-average | |||||
|
Number |
Remaining | |||||
|
|
Exercise Price |
Outstanding |
Contractual Life | |||
|
$ 72 |
44,000 |
4.8 years | ||||
|
$ 130 |
1,500 |
5.5 years | ||||
|
$ 140 |
5,200 |
6.0 years | ||||
|
$ 184 |
1,550 |
6.4 years | ||||
|
$ 163 |
11,750 |
6.7 years | ||||
|
$ 140 |
5,000 |
7.1 years | ||||
|
$ 139 |
11,000 |
9.6 years | ||||
|
$ 198 |
600 |
9.7 years | ||||
|
80,600 |
6.5 years | |||||
|
Weighted-average | |||||||||||||
|
Weighted-average |
Aggregate |
Remaining | |||||||||||
|
Options |
Exercise |
Intrinsic |
Contractual | ||||||||||
|
Outstanding |
Price |
Value |
Life | ||||||||||
|
Options outstanding at December 31, 2009 |
76,400 |
$ 102.17 |
|||||||||||
|
Granted |
11,600 |
$ 142.05 |
|||||||||||
|
Forfeited |
(7,400) |
$ 110.04 |
|||||||||||
|
Options outstanding at December 31, 2010 |
80,600 |
$ 107.19 |
$13.4 million |
6.5 years | |||||||||
There were 19,400 options available for grant at December 31, 2010 under the 2005 Stock Option Plan.
Deferred Compensation Agreements
The Company has unfunded deferred compensation agreements, assumed in connection with the Cello-Foil acquisition. The Company is obligated to provide certain deferred compensation for these Cello-Foil employees over specified periods beginning at age 62. In addition, the Company has agreed to provide certain death benefits for the employees to be paid over a specified period. The Company is accruing its obligations over the estimated period of employment of the individuals to age 62. As of December 31, 2010 and 2009, the Company had two individuals under the agreements that were receiving benefits. The deferred compensation liability for these agreements was approximately $321,000 and $377,000 at December 31, 2010 and 2009, respectively (recorded in “other liabilities” in the accompanying consolidated balance sheets). Deferred compensation expense for the years ended December 31, 2010, 2009 and 2008 was insignificant.
Other Benefit Plans
The Company maintains a management incentive compensation plan that provides annual cash awards to eligible management personnel based on both Company and business unit performance against pre-defined targets. The Company recognized charges of approximately $3.2 million, $4.3 million and $957,000 for benefits under the management incentive compensation plan for the years ended December 31, 2010, 2009 and 2008, respectively.
In conjunction with the EMCS acquisition, the Company assumed a management incentive compensation plan that remained in place through the end of 2010. The Company recognized charges of approximately $596,000 for the year ended December 31, 2010 for benefits under this management incentive compensation plan.
6. Capital Structure
The Company is authorized to issue 2,900,000 shares of common stock, consisting of 1,200,000 shares of voting common stock (1 share issued and outstanding at December 31, 2010 and 2009) (“Voting Common Stock “) and 1,700,000 shares of non-voting common stock (no shares issued and outstanding at December 31, 2010 and 2009) (“Non-Voting Common Stock”), each with a par value of $0.001 per share. The Voting Common Stock and the Non-Voting Common Stock have identical rights, qualifications, limitations, restrictions, and privileges. However, the holders of the Non-Voting Common Stock have no right to vote on the matters to be voted on by the Company’s stockholders, except under a merger or consolidation of the Company into other entities or a recapitalization or reorganization of the Company in which shares of the Non-Voting Common Stock would be treated differently than the Voting Common Stock. The holders of Voting Common Stock and the holders of Non-Voting Common Stock are entitled to share equally, share for share, in any dividends declared and payable (see Note 4 with respect to restrictions placed on declarations and payments under financing arrangements). Each share of Voting Common stock is convertible at any time (except under certain conditions, as defined) into a share of Non-Voting Common Stock.
The Company is authorized to issue 100,000 shares of preferred stock with a par value of $0.001 per share. The rights, qualifications, limitations, restrictions, and privileges of such shares are determined by the Board of Directors at each preferred share issuance and may differ from those of any and all other series of preferred stock. There were no preferred shares issued and outstanding at December 31, 2010 and 2009.
F-23
7. Severance Expenses and Exit and Disposal Activities
Severance Expenses
During the years ended December 31, 2010, 2009 and 2008, the Company terminated certain employees and eliminated their positions. During 2010 and 2009, the Company also extended a voluntary early retirement option to certain salaried employees and a voluntary separation option to certain hourly employees at one of its consumer food and specialty packaging segment facilities. In connection with these terminations the Company recorded employee termination costs of approximately $2.7 million, $3.1 million (excluding severance costs associated with the closure of a facility discussed below) and $2.0 million for the years ended December 31, 2010, 2009 and 2008, respectively, which were included in “Selling, general and administrative expenses” in the consolidated statements of operations. Of the approximately $2.0 million in severance accrued at December 31, 2009 and approximately $2.7 million in costs incurred in 2010, the Company paid approximately $4.3 million through December 31, 2010, so that approximately $419,000 remained accrued for employee termination benefits at December 31, 2010, which will be paid in 2011.
Exit and Disposal Activities
In accordance with FASB guidance related to accounting for costs associated with exit and disposal activities, the Company recognizes a liability for exit or disposal activities when the related costs are incurred.
During the year ended December 31, 2008, the Company consolidated the operations of one of its Canadian consumer food and specialty packaging facilities from two buildings into one building. In conjunction with the consolidation and subsequent sublease of the building to a third party, the Company recorded a discounted lease obligation of approximately $567,000 during the year ended December 31, 2008. This charge is reflected in “Selling, general and administrative expenses” in the consolidated statement of operations for the year ended December 31, 2008. There were no exit costs incurred related to this facility during the years ended December 31, 2010 or 2009. The Company remains obligated to make payments under a facility lease through August 2015 and, in April 2009, the Company began receiving sublease income to help mitigate the cost of the remaining lease obligation. The remaining lease obligation related to this facility of approximately $416,000 is reflected in the consolidated balance sheet as of December 31, 2010.
During the year ended December 31, 2007, the Company ceased using a significant portion of one of its leased Canadian consumer food and specialty packaging facilities and recorded a charge to pre-tax earnings of approximately $699,000 for the pro-rata portion of the remaining lease payments to be made through the lease term ending December 2009 for the unused area of the facility. The Company did not renew the lease on this facility upon its expiration in December of 2009 and there was no remaining lease obligation related to this facility as of December 31, 2009. During the year ended December 31, 2009, the Company recorded $831,000 in closure costs, of which $378,000 was recorded in the fourth quarter, including $404,000 in severance costs related to the closure of this facility and this charge is reflected in “Selling, general and administrative expenses” in the consolidated statement of operations for the year ended December 31, 2009. There were no exit costs incurred related to this facility during the year ended December 31, 2010. There was no remaining severance liability related to this closed facility as of December 31, 2010.
F-24
8. Commitments and Contingencies
Operating Leases
The Company leases certain land, buildings, equipment, vehicles, warehouses, and office space under the terms of non-cancelable operating leases which expire through the year 2023.
Future annual payments on the operating leases as of December 31, 2010 are as follows:
|
(in thousands of dollars) |
|
|
|
| |
|
Year Ending December 31 |
|||||
|
2011 |
$ 9,534 | ||||
|
2012 |
8,695 | ||||
|
2013 |
7,323 | ||||
|
2014 |
5,746 | ||||
|
2015 |
3,432 | ||||
|
2016 and thereafter |
7,628 | ||||
|
Total |
$ 42,358 | ||||
Rent expense for all operating leases amounted to approximately $9.7 million, $8.7 million and $7.9 million (excluding the provision for future rental costs related to the exit from certain leased facilities) for the years ended December 31, 2010, 2009 and 2008, respectively.
Capital Leases
The Company leases certain buildings and equipment under the terms of non-cancelable capital leases which expire through the year 2019.
Future annual payments on the capital leases as of December 31, 2010 are as follows:
|
|
(in thousands of dollars) |
|
|
|
|
|
Year Ending December 31 |
|||||
|
2011 |
$ 2,859 | ||||
|
2012 |
2,684 | ||||
|
2013 |
2,684 | ||||
|
2014 |
2,420 | ||||
|
2015 |
1,096 | ||||
|
2016 and thereafter |
5,030 | ||||
|
Interest portion |
(4,396) | ||||
|
Total |
$ 12,377 | ||||
See Note 15 for additional information on the Company’s lease transactions.
Purchase Commitments
The Company was obligated under an agreement through December 31, 2009 with its major ink supplier to purchase annually the greater of $4.0 million of ink or 90% of all ink purchases by the Company from this supplier subject to certain rebates. This agreement expired on December 31, 2009 and was subsequently extended until June 30, 2010. A new agreement, which is in the process of being executed, covers the period from July 1, 2010 through December 31, 2012 and obligated the Company to purchase the greater of approximately $10.1 million or 90% of all ink purchases by the Company from this supplier subject to certain rebates. For the years ended December 31, 2010, 2009 and 2008, the Company purchased approximately $9.1 million, $5.7 million and $7.6 million, respectively, of ink from this supplier.
F-25
Capital Project Commitments Related to Property, Plant and Equipment
At December 31, 2010, the Company has various capital projects related to property, plant and equipment in progress with approximately $23.9 million in future estimated costs to complete the projects.
Legal Proceedings
From time to time, the Company becomes party to legal proceedings and administrative actions, which are of an ordinary or routine nature, incidental to the operations of the Company. Although it is difficult to predict the outcome of any legal proceeding, in the opinion of the Company’s management, such proceedings and actions should not, individually or in the aggregate, have a material adverse effect on the Company’s consolidated financial condition, results of operations or cash flows.
9. Income Taxes
The following tables present components of the (benefit from) provision for income taxes, the principal items of deferred taxes, and a reconciliation of the statutory U.S. Federal income tax rate to the effective income tax rate for the years or dates indicated, as applicable:
|
Year |
Year |
Year | |||||||||||
|
ended |
ended |
ended | |||||||||||
|
December 31, |
December 31, |
December 31, | |||||||||||
|
|
(in thousands of dollars) |
2010 |
2009 |
2008 | |||||||||
|
|
(Benefit from) provision for income taxes: |
||||||||||||
|
Current |
|||||||||||||
|
Federal |
$ - |
$ - |
$ - | ||||||||||
|
Foreign |
1,397 |
1,245 |
853 | ||||||||||
|
State |
(51) |
92 |
126 | ||||||||||
|
1,346 |
1,337 |
979 | |||||||||||
|
Deferred |
|||||||||||||
|
Federal |
768 |
(1,225) |
(1,862) | ||||||||||
|
Foreign |
(113) |
(90) |
(78) | ||||||||||
|
State |
(144) |
(1,136) |
(254) | ||||||||||
|
511 |
(2,451) |
(2,194) | |||||||||||
|
Net (benefit from) provision for |
|||||||||||||
|
income taxes |
$ 1,857 |
$ (1,114) |
$ (1,215) | ||||||||||
F-26
The components of deferred income tax assets and liabilities are summarized as follows at December 31, 2010 and 2009:
|
|
(in thousands of dollars) |
2010 |
2009 | |||||||
|
|
Gross deferred income tax assets |
|||||||||
|
Net operating loss carryforwards |
$ 20,174 |
$ 16,125 | ||||||||
|
Minimum pension liability |
8,504 |
7,036 | ||||||||
|
Accrued vacation |
2,080 |
1,660 | ||||||||
|
AMT credit carryforwards |
1,190 |
1,190 | ||||||||
|
Accrued workers' compensation liability |
558 |
573 | ||||||||
|
Deferred compensation and future stock option payments |
699 |
608 | ||||||||
|
Net accounts receivable basis difference |
397 |
476 | ||||||||
|
Accrual for medical claims incurred but not reported |
285 |
281 | ||||||||
|
State and other tax credit carryforwards |
444 |
444 | ||||||||
|
Net inventory basis difference |
762 |
590 | ||||||||
|
Other accruals and reserves |
874 |
1,178 | ||||||||
|
35,967 |
30,161 | |||||||||
|
|
Gross deferred income tax liabilities |
|||||||||
|
Net fixed asset basis difference |
(34,209) |
(33,550) | ||||||||
|
Goodwill and other intangible assets basis differences |
(20,208) |
(19,541) | ||||||||
|
Postretirement and pension accruals |
(2,364) |
(1,695) | ||||||||
|
Undistributed earnings of UK subsidiary |
(1,151) |
- | ||||||||
|
Other |
(1,495) |
(751) | ||||||||
|
(59,427) |
(55,537) | |||||||||
|
Gross deferred tax liabilities, net |
(23,460) |
(25,376) | ||||||||
|
Less: valuation allowance |
(5,715) |
(4,813) | ||||||||
|
Net deferred income tax liabilities |
$ (29,175) |
$ (30,189) | ||||||||
The net deferred income tax liability is recognized as follows in the accompanying consolidated balance sheets at December 31, 2010 and 2009:
|
December 31, |
December 31, | |||||||||
|
(in thousands of dollars) |
2010 |
2009 | ||||||||
|
Current deferred income tax asset |
$ 3,703 |
$ 3,500 | ||||||||
|
Long-term deferred income tax liability |
(32,878) |
(33,689) | ||||||||
|
$ (29,175) |
$ (30,189) | |||||||||
F-27
The reconciliation of the statutory U.S. Federal income tax rate to the effective income tax rate is summarized as follows:
|
Year ended |
Year ended |
Year ended | |||||||||||||||||
|
December 31, |
December 31, |
December 31, | |||||||||||||||||
|
|
(in thousands of dollars) |
2010 |
2009 |
2008 | |||||||||||||||
|
Domestic |
$ (1,767) |
193% |
$ (5,128) |
73% |
$ (5,798) |
79% | |||||||||||||
|
Foreign |
850 |
-93% |
(1,921) |
27% |
(1,535) |
21% | |||||||||||||
|
Total loss before income taxes |
$ (917) |
100% |
$ (7,049) |
100% |
$ (7,333) |
100% | |||||||||||||
|
Federal income tax (benefit) at the U.S. statutory rate |
$ (312) |
34% |
$ (2,397) |
34% |
$ (2,493) |
34% | |||||||||||||
|
Foreign rate differential |
(86) |
9% |
(69) |
1% |
(282) |
4% | |||||||||||||
|
State income tax (benefit), net of federal income |
|||||||||||||||||||
|
tax (benefit) |
(178) |
19% |
(349) |
5% |
(85) |
1% | |||||||||||||
|
Permanent differences |
145 |
-16% |
21 |
0% |
204 |
-3% | |||||||||||||
|
Valuation allowance |
670 |
-73% |
1,912 |
-27% |
1,124 |
-15% | |||||||||||||
|
Effect of deferred rate changes |
427 |
-46% |
(44) |
0% |
455 |
-6% | |||||||||||||
|
Change in undistributed earnings assertion for United Kingdom |
1,151 |
-126% |
- |
0% |
- |
0% | |||||||||||||
|
Adjustment related to prior year taxes |
40 |
-4% |
(188) |
3% |
(64) |
1% | |||||||||||||
|
Other |
- |
0% |
- |
0% |
(74) |
1% | |||||||||||||
|
$ 1,857 |
-203% |
$ (1,114) |
16% |
$ (1,215) |
17% | ||||||||||||||
At December 31, 2010, the Company had Federal net operating loss carryforwards of approximately $33.5 million, which begin to expire in 2024. The Company has recorded deferred taxes on $32.9 million related to the domestic net operating loss carryforwards. The difference is due to excess tax basis in goodwill acquired in a purchase business combination that will reduce the income taxes paid by the Company in future periods, and in accordance with FASB guidance related to accounting for income taxes, the Company will record a reduction to book goodwill as the future tax benefits are realized rather than recording a deferred tax asset for these benefits. The Company has alternative minimum tax credit carryforwards of approximately $1.2 million, which do not expire. The Company also had Canadian loss carryforwards of approximately $28.4 million, which begin to expire in 2010. The Company has placed a valuation allowance of approximately $5.3 million against the Canadian loss carryforwards net of the Canadian deferred tax liabilities. See Note 13 for the net change in the valuation allowance.
During 2009, the IRS completed its examination of the tax year ended December 31, 2006. During the course of that examination, the IRS made several adjustments to the net operating loss carryforwards which have been offset by establishing certain deferred items which will be deductible in the future. The examination was completed as of December 31, 2009 and no further adjustments were required. The Company has state tax credit carryforwards totaling approximately $444,000 which it does not expect to be able to utilize; accordingly, the Company has recorded a valuation allowance of this amount in its accompanying consolidated balance sheets at December 31, 2010 and 2009.
F-28
A reconciliation of the beginning and ending liabilities for income tax contingencies is as follows:
|
(in thousands of dollars) |
|||
|
|
Gross uncertain tax benefit at January 1, 2008 |
$ 72 | |
|
Gross decreases (expired statute) |
(36) | ||
|
Gross decreases (withdrawn determination) |
(16) | ||
|
Gross decreases (settled by cash payment with tax authorities) |
(20) | ||
|
Gross uncertain tax benefit at December 31, 2008 |
- | ||
|
Gross increases/decreases |
- | ||
|
Gross uncertain tax benefit at December 31, 2009 |
- | ||
|
Gross increases/decreases |
- | ||
|
Gross uncertain tax benefit at December 31, 2010 |
$ - | ||
None of the unrecognized tax benefits, if recognized, would affect the effective tax rate of December 31, 2010, 2009 or 2008.
10. Related Party Transactions
Transactions with Affiliates of Sun Capital
In 2005, the Company entered into a management services agreement with Sun Capital Partners Management IV, LLC, an affiliate of Sun Capital (“Sun Capital Management”). The management services agreement was amended on January 31, 2006. Pursuant to the terms of the agreement, as amended, Sun Capital Management has provided and will provide the Company with certain financial and management consulting services, subject to the supervision of the Company’s Board of Directors. In exchange for these services, the Company will pay Sun Capital Management an annual management fee equal to the greater of $1.0 million or 2% of EBITDA (as defined in the agreement).
In addition to this general management fee, in connection with any management services provided to the Company, its subsidiaries, or its stockholders with respect to certain corporate events, including, without limitation, refinancing, restructurings, equity or debt offerings, acquisitions, mergers, consolidations, business combinations, sales and divestitures, Sun Capital Management is entitled to 1.0% of the aggregate consideration paid (including liabilities assumed) in connection with the applicable corporate event as well as any customary and reasonable fees. During the year ended December 31, 2010, the Company incurred approximately $938,000 in management services under the agreement for management services related to the EMCS acquisition. The Company will also reimburse Sun Capital Management for all out-of-pocket expenses incurred in the performance of services under the agreement. During the year ended December 31, 2010, the Company incurred approximately $234,000 in reimbursable expenses related to the EMCS acquisition. No such expenses were incurred during the years ended December 31, 2009 and 2008 under this portion of the agreement.
During the years ended December 31, 2010, 2009 and 2008, the Company incurred management fees and other related expenses under the management services agreement of approximately $1.9 million, $1.4 million and $1.5 million, respectively.
The Company incurred approximately $47,000, $56,000 and $73,000 for the years ending December 31, 2010, 2009 and 2008, respectively, for certain consulting fees from Sun Capital Management.
11. Segments
The Company identifies its reportable segments in accordance with FASB guidance for disclosures about segments of an enterprise and related information, by reviewing the nature of products sold, nature of the production processes, type and class of customer, methods to distribute product and nature of regulatory environment. While all of these factors were reviewed, the Company believes that the most significant factors are the nature of its products, the nature of the production process and the type of customers served.
Prior to the Company’s fourth quarter of 2008, the Company determined that it operated in two reportable segments. After the 2007 acquisitions of EAC and EPF, the Company began integration of these acquired businesses and during 2008 reassessed its segment reporting. As of the fourth quarter of 2008, the Company determined that its operations consisted of three reportable segments: (i) paper packaging, (ii) plastic packaging and films, and (iii) coated products. Effective July 1, 2009, the Company implemented an internal organizational change to move from a concentration on product lines to a concentration on markets. As a result of this change, the Company reassessed its segment reporting in the third quarter of 2009 and determined that its operations consist of four reportable segments: (i) pet food and specialty packaging, (ii) consumer food and specialty packaging, (iii) performance packaging and (iv) coated products. The pet food and specialty packaging segment produces products used in applications such as pet food, lawn and garden, charcoal, and popcorn packaging. The consumer food and specialty packaging segment produces products used in applications such as fresh meat, natural cheese and dairy foods, beverages, personal care, frozen foods, confectionary, breakfast foods, and films. The performance packaging segment produces products used in applications such as building materials, chemicals, agricultural products and food ingredient packaging. The coated products segment produces precision coated films, foils, fabrics and other substrates for imaging, electronics, medical and optical technologies.
F-29
The EMCS acquisition, which primarily includes meat and cheese packaging products, is included in the consumer food and specialty packaging segment for the year ended December 31, 2010.
Identifiable assets by reportable segment include only those assets that are specifically identified with each segment’s operations. Corporate assets include primarily certain cash held at the corporate level, deferred financing costs, income tax assets, certain non-trade receivables, capitalized software costs, corporate property, and the carrying amount of indefinite-lived trade names acquired in the Exopack Acquisition.
The Company evaluates performance based on profit or loss from operations. During the years ended December 31, 2010, 2009 and 2008 segment data includes a charge allocating certain corporate costs to each of its segments, as summarized in the table below:
|
Year ended |
Year ended |
Year ended | |||||||
|
December 31, |
December 31, |
December 31, | |||||||
|
(in thousands of dollars) |
2010 |
2009 |
2008 | ||||||
|
Pet food and specialty packaging |
$ 6,146 |
$ 4,584 |
$ 3,794 | ||||||
|
Consumer food and specialty packaging |
5,330 |
9,487 |
8,724 | ||||||
|
Performance packaging |
5,025 |
5,036 |
5,363 | ||||||
|
Total allocations |
$ 16,501 |
$ 19,107 |
$ 17,881 | ||||||
Due to the autonomy of the coated products segment in relation to the other segments, no corporate costs were allocated to the coated products segment during the years ended December 31, 2010, 2009 and 2008.
While sales and transfers between segments are recorded at cost plus a reasonable profit, the effects of intersegment sales are excluded from the computations of segment operating income. Intercompany profit is eliminated in consolidation and is not significant for the periods presented.
Corporate operating losses consist principally of certain unallocated corporate costs.
The accounting policies for the individual segments are the same as the Company’s general accounting policies discussed in Note 2.
F-30
The table below presents information about the Company’s reportable segments for the years ended December 31, 2010, 2009 and 2008.
|
Year |
Year |
Year | |||||||
|
ended |
ended |
ended | |||||||
|
December 31, |
December 31, |
December 31, | |||||||
|
|
(in thousands of dollars) |
2010 |
2009 |
2008 | |||||
|
Revenues from external customers: |
|||||||||
|
Pet food and specialty packaging |
$ 231,933 |
$ 233,195 |
$ 267,520 | ||||||
|
Consumer food and specialty packaging |
304,382 |
211,082 |
236,152 | ||||||
|
Performance packaging |
171,616 |
163,641 |
202,213 | ||||||
|
Coated products |
77,155 |
65,815 |
75,847 | ||||||
|
Total |
$ 785,086 |
$ 673,733 |
$ 781,732 | ||||||
|
Intersegment revenues: |
|||||||||
|
Pet food and specialty packaging |
$ 310 |
$ 1,612 |
$ 1,693 | ||||||
|
Consumer food and specialty packaging |
18,358 |
19,012 |
10,053 | ||||||
|
Performance packaging |
708 |
1,270 |
1,896 | ||||||
|
Coated products |
- |
- |
- | ||||||
|
Total |
$ 19,376 |
$ 21,894 |
$ 13,642 | ||||||
|
Operating income (loss): |
|||||||||
|
Pet food and specialty packaging |
$ 24,423 |
$ 26,051 |
$ 27,245 | ||||||
|
Consumer food and specialty packaging |
18,671 |
4,197 |
2,706 | ||||||
|
Performance packaging |
12,122 |
9,861 |
13,240 | ||||||
|
Coated products |
11,750 |
5,523 |
5,981 | ||||||
|
Corporate |
(32,539) |
(24,557) |
(24,143) | ||||||
|
Total |
34,427 |
21,075 |
25,029 | ||||||
|
Interest expense - Corporate |
36,379 |
28,592 |
30,991 | ||||||
|
Other expense (income), net |
(1,035) |
(468) |
1,371 | ||||||
|
Loss before income taxes |
$ (917) |
$ (7,049) |
$ (7,333) | ||||||
|
Identifiable assets: |
|||||||||
|
Pet food and specialty packaging |
$ 139,488 |
$ 136,207 |
$ 143,885 | ||||||
|
Consumer food and specialty packaging |
236,714 |
124,862 |
123,739 | ||||||
|
Performance packaging |
110,887 |
112,843 |
123,892 | ||||||
|
Coated products |
44,078 |
41,302 |
41,738 | ||||||
|
Corporate |
78,641 |
66,250 |
65,378 | ||||||
|
Total |
$ 609,808 |
$ 481,464 |
$ 498,632 | ||||||
|
Depreciation and amortization: |
|||||||||
|
Pet food and specialty packaging |
$ 7,826 |
$ 6,757 |
$ 6,500 | ||||||
|
Consumer food and specialty packaging |
12,791 |
7,905 |
7,282 | ||||||
|
Performance packaging |
6,797 |
6,089 |
6,013 | ||||||
|
Coated products |
2,250 |
2,224 |
2,443 | ||||||
|
Corporate |
4,072 |
2,480 |
2,266 | ||||||
|
Total |
$ 33,736 |
$ 25,455 |
$ 24,504 | ||||||
|
Capital expenditures: |
|||||||||
|
Pet food and specialty packaging |
$ 2,980 |
$ 10,413 |
$ 5,587 | ||||||
|
Consumer food and specialty packaging |
17,226 |
9,474 |
4,245 | ||||||
|
Performance packaging |
1,835 |
5,046 |
7,240 | ||||||
|
Coated products |
1,274 |
934 |
1,494 | ||||||
|
Corporate |
1,681 |
554 |
583 | ||||||
|
Total |
$ 24,996 |
$ 26,421 |
$ 19,149 | ||||||
F-31
The following geographic information represents the Company’s net sales based on product shipment location for the years ended December 31, 2010, 2009 and 2008 and total long-lived assets based on physical location at December 31, 2010 and 2009:
Net Sales to Unaffiliated Customers
|
Year ended |
Year ended |
Year ended | ||||||||||||||
|
December 31, |
December 31, |
December 31, | ||||||||||||||
|
(in thousands) |
2010 |
2009 |
2008 | |||||||||||||
|
United States |
$ 678,674 |
$ 571,143 |
$ 648,033 | |||||||||||||
|
United Kingdom |
36,471 |
32,934 |
39,159 | |||||||||||||
|
Canada |
69,941 |
69,656 |
94,540 | |||||||||||||
|
$ 785,086 |
$ 673,733 |
$ 781,732 | ||||||||||||||
Total Property, Plant and Equipment
|
|
(in thousands) |
2010 |
2009 | |||||||||
|
United States |
$ 191,646 |
$ 149,429 | ||||||||||
|
Canada |
16,775 |
18,451 | ||||||||||
|
United Kingdom |
5,872 |
6,175 | ||||||||||
|
$ 214,293 |
$ 174,055 | |||||||||||
There were no individual customers that accounted for more than 10% of the Company’s net sales during the year ended December 31, 2010. One customer accounted for 11.5% and 11.8% of the Company’s net sales during the years ended December 31, 2009 and 2008, respectively. One customer, primarily within the Company’s pet food and specialty segment, accounted for 10.9% and 12.0% of total accounts receivable as of December 31, 2010 and 2009, respectively.
12. Insurance Proceeds
In September 2009, one of the Company’s facilities in the consumer food and specialty packaging segment experienced a fire that damaged a press. During the year ended December 31, 2010, the Company received insurance proceeds related to this claim of approximately $1.0 million. The $1.0 million in insurance proceeds is included in “Other (income) expense, net” on the accompanying consolidated statement of operations for the year ended December 31, 2010.
F-32
13. Valuation and Qualifying Accounts
(1) Represents amounts written off (recovered) during the period.
(2) During 2010, 2009 and 2008, the Company recorded a non-cash charge to establish a valuation allowance against net operating losses specifically related to the Company’s Canadian operations. See Note 2 for further discussion.
(3) Represents impact of foreign exchange rates during the period.
14. Consolidating Financial Information
The Notes are jointly, severally, fully and unconditionally guaranteed by the Company’s domestic restricted subsidiaries. Each guarantor subsidiary is 100% owned, directly or indirectly, by the Company within the meaning of Rule 3-10(h) of Regulation S-X. Following are consolidating financial statements of the Company, including the guarantors, provided pursuant to Rule 3-10 of Regulation S-X in lieu of separate financial statements of each subsidiary guaranteeing the Notes.
The following consolidating financial statements present the balance sheets as of December 31, 2010 and 2009, the statements of operations for the years ended December 31, 2010, 2009 and 2008, and the statements of cash flows for the years ended December 31, 2010, 2009 and 2008, of (i) Exopack Holding Corp. (the “Parent”), (ii) the domestic subsidiaries of Exopack Holding Corp. (the “Guarantor Subsidiaries”), (iii) the foreign subsidiaries of Exopack Holding Corp. (the “Nonguarantor Subsidiaries”), and (iv) the eliminations necessary to arrive at the information for the Company on a consolidated basis. The Parent and the Guarantor Subsidiaries have each reflected investments in their respective subsidiaries under the equity method of accounting. There are no restrictions limiting transfers of cash from Guarantor Subsidiaries and Nonguarantor Subsidiaries to the Parent. The consolidating financial statements should be read in conjunction with the accompanying consolidated financial statements of the Company.
F-33
CONSOLIDATING BALANCE SHEET AS OF DECEMBER 31, 2010
|
|
|
|
|
|
|
Guarantor |
Nonguarantor |
|
|
|
(in thousands of dollars) |
|
|
Parent |
Subsidiaries |
Subsidiaries |
Eliminations |
Consolidated | ||
|
|
|
|
|
|
|
|
|
|
|
|
Assets |
|
|
|
|
|
|
|
|
|
|
Current assets |
|
|
|
|
|
|
|
| |
|
|
Cash |
|
|
|
$ - |
$ 48 |
$ 2,460 |
$ - |
$ 2,508 |
|
|
Trade accounts receivable (net of allowance for uncollectible |
|
|
|
|
|
| ||
|
|
accounts of $1,550) |
|
|
- |
80,979 |
13,972 |
- |
94,951 | |
|
|
Other receivables |
|
|
- |
2,914 |
549 |
- |
3,463 | |
|
|
Inventories |
|
|
- |
91,727 |
12,001 |
- |
103,728 | |
|
|
Deferred income taxes |
|
|
- |
3,643 |
60 |
- |
3,703 | |
|
|
Prepaid expenses and other current assets |
|
- |
2,196 |
1,044 |
- |
3,240 | ||
|
|
|
Total current assets |
|
|
- |
181,507 |
30,086 |
- |
211,593 |
|
Property, plant, and equipment, net |
|
- |
191,646 |
22,647 |
- |
214,293 | |||
|
Deferred financing costs, net |
|
|
13,760 |
1,238 |
- |
- |
14,998 | ||
|
Intangible assets, net |
|
|
|
- |
92,383 |
601 |
- |
92,984 | |
|
Goodwill |
|
|
|
|
- |
68,943 |
699 |
- |
69,642 |
|
Investment in subsidiaries |
|
|
127,036 |
5,392 |
- |
(132,428) |
- | ||
|
Intercompany receivables |
|
|
35,640 |
24,817 |
(363) |
(60,094) |
- | ||
|
Other assets |
|
|
|
- |
5,962 |
336 |
- |
6,298 | |
|
|
|
Total assets |
|
|
$ 176,436 |
$ 571,888 |
$ 54,006 |
$ (192,522) |
$ 609,808 |
|
Liabilities and Stockholder's Equity |
|
|
|
|
|
| |||
|
Current liabilities |
|
|
|
|
|
|
|
| |
|
|
Revolving credit facility and current portion of long-term debt |
|
$ - |
$ 51,624 |
$ 7,191 |
$ - |
$ 58,815 | ||
|
|
Accounts payable |
|
|
- |
71,828 |
11,779 |
- |
83,607 | |
|
|
Accrued liabilities |
|
|
15,000 |
29,363 |
2,505 |
- |
46,868 | |
|
|
Income taxes payable |
|
|
- |
16 |
956 |
- |
972 | |
|
|
|
Total current liabilities |
|
|
15,000 |
152,831 |
22,431 |
- |
190,262 |
|
Long-term liabilities |
|
|
|
|
|
|
|
| |
|
|
Long-term debt, less current portion |
|
320,000 |
- |
- |
- |
320,000 | ||
|
|
Capital lease obligations, less current portion |
|
- |
10,501 |
- |
- |
10,501 | ||
|
|
Deferred income taxes |
|
|
(47,965) |
79,616 |
1,227 |
- |
32,878 | |
|
|
Intercompany payables |
|
(150,594) |
186,368 |
24,320 |
(60,094) |
- | ||
|
|
Other liabilities |
|
|
- |
15,536 |
636 |
- |
16,172 | |
|
|
|
Total long-term liabilities |
|
|
121,441 |
292,021 |
26,183 |
(60,094) |
379,551 |
|
Commitments and contingencies |
|
|
|
|
|
|
| ||
|
Stockholder's equity |
|
|
|
|
|
|
|
| |
|
|
|
Preferred stock, par value, $0.001 per share - 100,000 shares |
|
|
|
|
|
| |
|
|
|
authorized, no shares issued and outstanding |
|
- |
- |
- |
- |
- | |
|
|
|
Common stock, par value, $0.001 per share - 2,900,000 shares |
|
|
|
|
|
| |
|
|
|
authorized, 1 share issued and outstanding |
|
- |
- |
- |
- |
- | |
|
|
Additional paid-in capital |
|
73,521 |
73,521 |
23,897 |
(97,418) |
73,521 | ||
|
|
Accumulated other comprehensive loss, net |
|
(7,095) |
(7,095) |
(1,988) |
9,083 |
(7,095) | ||
|
|
Accumulated deficit |
|
|
(26,431) |
60,610 |
(16,517) |
(44,093) |
(26,431) | |
|
|
|
Total stockholder's equity |
|
|
39,995 |
127,036 |
5,392 |
(132,428) |
39,995 |
|
|
|
Total liabilities and stockholder's equity |
|
|
$ 176,436 |
$ 571,888 |
$ 54,006 |
$ (192,522) |
$ 609,808 |
F-34
CONSOLIDATING BALANCE SHEET AS OF DECEMBER 31, 2009
|
|
|
|
|
|
|
|
|
|
|
|
|
|
|
|
|
|
Guarantor |
Nonguarantor |
|
|
|
(in thousands of dollars) |
|
|
Parent |
Subsidiaries |
Subsidiaries |
Eliminations |
Consolidated | ||
|
|
|
|
|
|
|
|
|
|
|
|
Assets |
|
|
|
|
|
|
|
|
|
|
Current assets |
|
|
|
|
|
|
|
| |
|
|
Cash |
|
|
|
$ - |
$ 160 |
$ 473 |
$ - |
$ 633 |
|
|
Trade accounts receivable (net of allowance for uncollectible |
|
|
|
|
|
| ||
|
|
accounts of $1,592) |
|
|
- |
64,566 |
13,828 |
- |
78,394 | |
|
|
Other receivables |
|
|
- |
2,160 |
1,636 |
- |
3,796 | |
|
|
Inventories |
|
|
- |
65,398 |
14,910 |
(336) |
79,972 | |
|
|
Deferred income taxes |
|
|
- |
3,332 |
168 |
- |
3,500 | |
|
|
Prepaid expenses and other current assets |
|
- |
2,017 |
1,400 |
- |
3,417 | ||
|
|
|
Total current assets |
|
|
- |
137,633 |
32,415 |
(336) |
169,712 |
|
Property, plant, and equipment, net |
|
- |
149,429 |
24,626 |
- |
174,055 | |||
|
Deferred financing costs, net |
|
|
4,798 |
399 |
- |
- |
5,197 | ||
|
Intangible assets, net |
|
|
|
- |
64,533 |
674 |
- |
65,207 | |
|
Goodwill |
|
|
|
|
- |
63,718 |
720 |
- |
64,438 |
|
Investment in subsidiaries |
|
|
110,782 |
7,035 |
- |
(117,817) |
- | ||
|
Intercompany receivables |
|
|
35,640 |
24,863 |
(2,718) |
(57,785) |
- | ||
|
Other assets |
|
|
|
- |
2,253 |
602 |
- |
2,855 | |
|
|
|
Total assets |
|
|
$ 151,220 |
$ 449,863 |
$ 56,319 |
$ (175,938) |
$ 481,464 |
|
Liabilities and Stockholder's Equity |
|
|
|
|
|
| |||
|
Current liabilities |
|
|
|
|
|
|
|
| |
|
|
Revolving credit facility and current portion of long-term debt |
|
$ - |
$ 60,259 |
$ 8,344 |
$ - |
$ 68,603 | ||
|
|
Accounts payable |
|
|
- |
53,227 |
11,702 |
- |
64,929 | |
|
|
Accrued liabilities |
|
|
10,312 |
19,378 |
4,089 |
- |
33,779 | |
|
|
Income taxes payable |
|
|
- |
124 |
978 |
- |
1,102 | |
|
|
|
Total current liabilities |
|
|
10,312 |
132,988 |
25,113 |
- |
168,413 |
|
Long-term liabilities |
|
|
|
|
|
|
|
| |
|
|
Long-term debt, less current portion |
|
220,000 |
34 |
- |
- |
220,034 | ||
|
|
Deferred income taxes |
|
|
(38,186) |
70,385 |
1,490 |
- |
33,689 | |
|
|
Intercompany payables |
|
(85,405) |
121,180 |
22,010 |
(57,785) |
- | ||
|
|
Other liabilities |
|
|
- |
14,158 |
671 |
- |
14,829 | |
|
|
|
Total long-term liabilities |
|
|
96,409 |
205,757 |
24,171 |
(57,785) |
268,552 |
|
Commitments and contingencies |
|
|
|
|
|
|
| ||
|
Stockholder's equity |
|
|
|
|
|
|
|
| |
|
|
|
Preferred stock, par value, $0.001 per share - 100,000 shares |
|
|
|
|
|
| |
|
|
|
authorized, no shares issued and outstanding |
|
- |
- |
- |
- |
- | |
|
|
|
Common stock, par value, $0.001 per share - 2,900,000 shares |
|
|
|
|
|
| |
|
|
|
authorized, 1 share issued and outstanding |
|
- |
- |
- |
- |
- | |
|
|
Additional paid-in capital |
|
73,230 |
73,230 |
23,897 |
(97,127) |
73,230 | ||
|
|
Accumulated other comprehensive loss, net |
|
(5,074) |
(5,074) |
(1,373) |
6,447 |
(5,074) | ||
|
|
Accumulated deficit |
|
|
(23,657) |
42,962 |
(15,489) |
(27,473) |
(23,657) | |
|
|
|
Total stockholder's equity |
|
|
44,499 |
111,118 |
7,035 |
(118,153) |
44,499 |
|
|
|
Total liabilities and stockholder's equity |
|
|
$ 151,220 |
$ 449,863 |
$ 56,319 |
$ (175,938) |
$ 481,464 |
F-35
CONSOLIDATING STATEMENT OF OPERATIONS FOR THE YEAR ENDED DECEMBER 31, 2010
|
|
|
|
|
|
Guarantor |
Nonguarantor |
|
|
|
(in thousands of dollars) |
|
Parent |
Subsidiaries |
Subsidiaries |
Eliminations |
Consolidated | ||
|
|
|
|
|
|
|
|
|
|
|
Net sales |
|
|
|
$ - |
$ 679,451 |
$ 119,934 |
$ (14,299) |
$ 785,086 |
|
Cost of sales |
|
|
- |
590,141 |
108,663 |
(14,636) |
684,168 | |
|
|
|
Gross margin |
|
- |
89,310 |
11,271 |
337 |
100,918 |
|
Selling, general and administrative expenses |
|
291 |
57,937 |
8,263 |
- |
66,491 | ||
|
|
|
Operating income (loss) |
|
(291) |
31,373 |
3,008 |
337 |
34,427 |
|
Other expenses (income) |
|
|
|
|
|
| ||
|
|
Interest expense |
|
30,245 |
4,461 |
1,673 |
- |
36,379 | |
|
|
Other (income) expense, net |
|
- |
(2,114) |
485 |
594 |
(1,035) | |
|
|
|
Net other expense |
|
30,245 |
2,347 |
2,158 |
594 |
35,344 |
|
|
|
(Loss) income before income taxes |
(30,536) |
29,026 |
850 |
(257) |
(917) | |
|
(Benefit from) provision for income taxes |
|
(9,778) |
10,351 |
1,284 |
- |
1,857 | ||
|
|
|
Net (loss) income before equity in earnings of affiliates |
(20,758) |
18,675 |
(434) |
(257) |
(2,774) | |
|
Equity in earnings (loss) of affiliates |
|
17,984 |
(1,027) |
- |
(16,957) |
- | ||
|
|
|
Net (loss) income |
|
$ (2,774) |
$ 17,648 |
$ (434) |
$ (17,214) |
$ (2,774) |
CONSOLIDATING STATEMENT OF OPERATIONS FOR THE YEAR ENDED DECEMBER 31, 2009
|
|
|
|
|
|
Guarantor |
Nonguarantor |
|
|
|
(in thousands of dollars) |
|
Parent |
Subsidiaries |
Subsidiaries |
Eliminations |
Consolidated | ||
|
|
|
|
|
|
|
|
|
|
|
Net sales |
|
|
|
$ - |
$ 571,440 |
$ 121,315 |
$ (19,022) |
$ 673,733 |
|
Cost of sales |
|
|
- |
502,108 |
113,659 |
(19,003) |
596,764 | |
|
|
|
Gross margin |
|
- |
69,332 |
7,656 |
(19) |
76,969 |
|
Selling, general and administrative expenses |
|
419 |
47,405 |
8,070 |
- |
55,894 | ||
|
|
|
Operating income (loss) |
|
(419) |
21,927 |
(414) |
(19) |
21,075 |
|
Other expenses (income) |
|
|
|
|
|
| ||
|
|
Interest expense |
|
23,324 |
3,569 |
1,699 |
- |
28,592 | |
|
|
Other (income) expense, net |
|
- |
(277) |
(191) |
- |
(468) | |
|
|
|
Net other expense |
|
23,324 |
3,292 |
1,508 |
- |
28,124 |
|
|
|
(Loss) income before income taxes |
(23,743) |
18,635 |
(1,922) |
(19) |
(7,049) | |
|
(Benefit from) provision for income taxes |
|
(7,646) |
5,418 |
1,114 |
- |
(1,114) | ||
|
|
|
Net (loss) income before equity in earnings of affiliates |
(16,097) |
13,217 |
(3,036) |
(19) |
(5,935) | |
|
Equity in earnings (loss) of affiliates |
|
10,162 |
(3,036) |
- |
(7,126) |
- | ||
|
|
|
Net (loss) income |
|
$ (5,935) |
$ 10,181 |
$ (3,036) |
$ (7,145) |
$ (5,935) |
F-36
CONSOLIDATING STATEMENT OF OPERATIONS FOR THE YEAR ENDED DECEMBER 31, 2008
|
|
|
|
|
|
Guarantor |
Nonguarantor |
|
|
|
(in thousands of dollars) |
|
Parent |
Subsidiaries |
Subsidiaries |
Eliminations |
Consolidated | ||
|
|
|
|
|
|
|
|
|
|
|
Net sales |
|
|
|
$ - |
$ 648,431 |
$ 142,624 |
$ (9,323) |
$ 781,732 |
|
Cost of sales |
|
|
- |
577,528 |
131,027 |
(9,031) |
699,524 | |
|
|
|
Gross margin |
|
- |
70,903 |
11,597 |
(292) |
82,208 |
|
Selling, general and administrative expenses |
|
628 |
47,607 |
8,944 |
- |
57,179 | ||
|
|
|
Operating income (loss) |
|
(628) |
23,296 |
2,653 |
(292) |
25,029 |
|
Other expenses (income) |
|
|
|
|
|
| ||
|
|
Interest expense |
|
23,324 |
5,243 |
2,424 |
- |
30,991 | |
|
|
Other (income) expense, net |
|
- |
(393) |
1,764 |
- |
1,371 | |
|
|
|
Net other expense |
|
23,324 |
4,850 |
4,188 |
- |
32,362 |
|
|
|
(Loss) income before income taxes |
(23,952) |
18,446 |
(1,535) |
(292) |
(7,333) | |
|
(Benefit from) provision for income taxes |
|
(9,101) |
7,117 |
769 |
- |
(1,215) | ||
|
|
|
Net (loss) income before equity in earnings of affiliates |
(14,851) |
11,329 |
(2,304) |
(292) |
(6,118) | |
|
Equity in earnings (loss) of affiliates |
|
8,733 |
(2,304) |
- |
(6,429) |
- | ||
|
|
|
Net (loss) income |
|
$ (6,118) |
$ 9,025 |
$ (2,304) |
$ (6,721) |
$ (6,118) |
F-37
CONSOLIDATING STATEMENT OF CASH FLOWS FOR THE YEAR ENDED DECEMBER 31, 2010
|
|
|
|
|
|
|
Guarantor |
Nonguarantor |
|
|
|
(in thousands of dollars) |
|
|
Parent |
Subsidiaries |
Subsidiaries |
Eliminations |
Consolidated | ||
|
Cash flows from operating activities |
|
|
|
|
|
| |||
|
Net (loss) income |
|
|
|
$ (2,774) |
$ 17,648 |
$ (434) |
$ (17,214) |
$ (2,774) | |
|
Adjustments to reconcile net (loss) income to net cash provided by (used in) |
|
|
|
|
|
| |||
|
operating activities |
|
|
|
|
|
|
|
| |
|
|
Depreciation and amortization |
|
2,664 |
27,785 |
3,287 |
- |
33,736 | ||
|
|
Equity in (earnings) loss of affiliates |
|
(17,984) |
1,027 |
- |
16,957 |
- | ||
|
|
Deferred income tax (benefit) provision |
|
(9,779) |
10,401 |
(116) |
- |
506 | ||
|
|
Stock compensation expense |
|
291 |
291 |
- |
(291) |
291 | ||
|
|
Loss (gain) on sales and disposition of property, plant and equipment |
|
- |
737 |
(69) |
- |
668 | ||
|
|
Changes in operating assets and liabilities |
|
|
|
|
|
| ||
|
|
|
Receivables |
|
- |
(5,486) |
101 |
- |
(5,385) | |
|
|
|
Inventories |
|
- |
(13,419) |
3,211 |
(337) |
(10,545) | |
|
|
|
Prepaid expenses and other assets |
|
- |
(5,246) |
2,639 |
- |
(2,607) | |
|
|
|
Accounts payable and accrued and other liabilities |
|
4,688 |
12,581 |
(1,462) |
- |
15,807 | |
|
|
|
Income tax receivable/payable |
|
- |
(108) |
6 |
- |
(102) | |
|
|
|
|
Net cash provided by (used in) operating activities |
(22,894) |
46,211 |
7,163 |
(885) |
29,595 | |
|
Cash flows from investing activities |
|
|
|
|
|
| |||
|
Investment in joint venture |
|
|
|
(425) |
|
|
(425) | ||
|
Purchases of property, plant and equipment, including capitalized software |
|
- |
(22,852) |
(2,144) |
- |
(24,996) | |||
|
Proceeds from sales of property, plant and equipment |
- |
7,004 |
245 |
- |
7,249 | ||||
|
Acquisition of business, net of cash acquired |
|
- |
(82,124) |
- |
- |
(82,124) | |||
|
Investments in subsidiaries |
|
|
(291) |
- |
- |
291 |
- | ||
|
|
|
|
Net cash (used in) provided by investing activities |
(291) |
(98,397) |
(1,899) |
291 |
(100,296) | |
|
Cash flows from financing activities |
|
|
|
|
|
| |||
|
Repayment of subordinated term loans |
|
- |
(49) |
- |
- |
(49) | |||
|
Borrowings on term loan |
|
|
100,000 |
- |
- |
- |
100,000 | ||
|
Repayments on term loan |
|
|
(100,000) |
- |
- |
- |
(100,000) | ||
|
Issuance of additional notes |
|
|
100,000 |
- |
- |
- |
100,000 | ||
|
Repayment of capital lease obligations |
|
- |
(2,488) |
- |
- |
(2,488) | |||
|
Deferred financing costs paid on senior notes and senior credit facility |
|
(11,626) |
(1,255) |
- |
- |
(12,881) | |||
|
Borrowings under revolving credit facility |
|
- |
872,003 |
72,611 |
- |
944,614 | |||
|
Repayments of revolving credit facility |
|
- |
(882,499) |
(73,993) |
- |
(956,492) | |||
|
Intercompany borrowings (repayments) |
|
(65,189) |
65,236 |
(47) |
- |
- | |||
|
Dividends paid |
|
|
|
- |
- |
(594) |
594 |
- | |
|
|
|
|
Net cash provided by (used in) financing activities |
23,185 |
50,948 |
(2,023) |
594 |
72,704 | |
|
Effect of exchange rate changes on cash |
|
- |
1,126 |
(1,254) |
- |
(128) | |||
|
|
|
|
Increase (decrease) in cash |
|
- |
(112) |
1,987 |
- |
1,875 |
|
Cash |
|
|
|
|
|
|
|
|
|
|
Beginning of year |
|
|
|
- |
160 |
473 |
- |
633 | |
|
End of year |
|
|
|
$ - |
$ 48 |
$ 2,460 |
$ - |
$ 2,508 | |
F-38
CONSOLIDATING STATEMENT OF CASH FLOWS FOR THE YEAR ENDED DECEMBER 31, 2009
|
|
|
|
|
|
|
Guarantor |
Nonguarantor |
|
|
|
(in thousands of dollars) |
|
|
Parent |
Subsidiaries |
Subsidiaries |
Eliminations |
Consolidated | ||
|
Cash flows from operating activities |
|
|
|
|
|
| |||
|
Net (loss) income |
|
|
|
$ (5,935) |
$ 10,181 |
$ (3,036) |
$ (7,145) |
$ (5,935) | |
|
Adjustments to reconcile net (loss) income to net cash provided by (used in) |
|
|
|
|
|
| |||
|
operating activities |
|
|
|
|
|
|
|
| |
|
|
Depreciation and amortization |
|
1,175 |
21,035 |
3,245 |
- |
25,455 | ||
|
|
Equity in (earnings) loss of affiliates |
|
(10,162) |
3,036 |
- |
7,126 |
- | ||
|
|
Deferred income tax (benefit) provision |
|
(7,645) |
5,283 |
(85) |
- |
(2,447) | ||
|
|
Stock compensation expense |
|
419 |
419 |
- |
(419) |
419 | ||
|
|
Loss on sales and disposition of property, plant and equipment |
|
- |
1,049 |
264 |
- |
1,313 | ||
|
|
Changes in operating assets and liabilities: |
|
|
|
|
|
| ||
|
|
|
Receivables |
|
- |
2,417 |
4,294 |
- |
6,711 | |
|
|
|
Inventories |
|
- |
11,508 |
1,873 |
19 |
13,400 | |
|
|
|
Prepaid expenses and other assets |
|
- |
(1,448) |
(1,199) |
- |
(2,647) | |
|
|
|
Accounts payable and accrued and other liabilities |
|
(1) |
(8,658) |
(1,873) |
- |
(10,532) | |
|
|
|
Income tax receivable/payable |
|
- |
30 |
211 |
- |
241 | |
|
|
|
|
Net cash provided by (used in) operating activities |
(22,149) |
44,852 |
3,694 |
(419) |
25,978 | |
|
Cash flows from investing activities |
|
|
|
|
|
| |||
|
Investment in joint venture |
|
|
- |
(400) |
- |
- |
(400) | ||
|
Purchases of property, plant and equipment, including capitalized software |
- |
(22,773) |
(3,648) |
- |
(26,421) | ||||
|
Proceeds from sales of property, plant and equipment |
|
- |
6,973 |
108 |
- |
7,081 | |||
|
Investments in subsidiaries |
|
|
(419) |
- |
- |
419 |
- | ||
|
|
|
|
Net cash (used in) provided by investing activities |
(419) |
(16,200) |
(3,540) |
419 |
(19,740) | |
|
Cash flows from financing activities |
|
|
|
|
|
| |||
|
Repayment of subordinated term loans |
|
- |
(48) |
- |
- |
(48) | |||
|
Borrowings under revolving credit facility |
|
- |
684,725 |
39,382 |
- |
724,107 | |||
|
Repayments of revolving credit facility |
|
- |
(692,324) |
(38,656) |
- |
(730,980) | |||
|
Intercompany borrowings (repayments) |
|
22,568 |
(24,486) |
1,918 |
- |
- | |||
|
|
|
|
Net cash provided by (used in) financing activities |
22,568 |
(32,133) |
2,644 |
- |
(6,921) | |
|
Effect of exchange rate changes on cash |
|
- |
3,000 |
(3,396) |
- |
(396) | |||
|
|
|
|
Increase (decrease) in cash |
|
- |
(481) |
(598) |
- |
(1,079) |
|
Cash |
|
|
|
|
|
|
|
|
|
|
Beginning of year |
|
|
|
- |
641 |
1,071 |
- |
1,712 | |
|
End of year |
|
|
|
$ - |
$ 160 |
$ 473 |
$ - |
$ 633 | |
F-39
CONSOLIDATING STATEMENT OF CASH FLOWS FOR THE YEAR ENDED DECEMBER 31, 2008
|
|
|
|
|
|
|
Guarantor |
Nonguarantor |
|
|
|
(in thousands of dollars) |
|
|
Parent |
Subsidiaries |
Subsidiaries |
Eliminations |
Consolidated | ||
|
Cash flows from operating activities |
|
|
|
|
|
| |||
|
Net (loss) income |
|
|
|
$ (6,118) |
$ 9,025 |
$ (2,304) |
$ (6,721) |
$ (6,118) | |
|
Adjustments to reconcile net (loss) income to net cash provided by (used in) |
|
|
|
|
|
| |||
|
operating activities |
|
|
|
|
|
|
|
| |
|
|
Depreciation and amortization |
|
1,175 |
19,897 |
3,432 |
- |
24,504 | ||
|
|
Equity in (earnings) loss of affiliates |
|
(8,733) |
2,304 |
- |
6,429 |
- | ||
|
|
Deferred income tax (benefit) provision |
|
(9,102) |
6,986 |
(131) |
- |
(2,247) | ||
|
|
Stock compensation expense |
|
616 |
616 |
- |
(616) |
616 | ||
|
|
Loss (gain) on sales and disposition of property, plant and equipment |
|
- |
1,792 |
(35) |
- |
1,757 | ||
|
|
Changes in operating assets and liabilities: |
|
|
|
|
|
| ||
|
|
|
Receivables |
|
- |
(2,906) |
(5,775) |
- |
(8,681) | |
|
|
|
Inventories |
|
- |
768 |
(985) |
292 |
75 | |
|
|
|
Prepaid expenses and other assets |
|
- |
1,618 |
(242) |
- |
1,376 | |
|
|
|
Accounts payable and accrued and other liabilities |
|
1 |
(3,566) |
4,168 |
- |
603 | |
|
|
|
Income tax receivable/payable |
|
- |
476 |
598 |
- |
1,074 | |
|
|
|
|
Net cash provided by (used in) operating activities |
(22,161) |
37,010 |
(1,274) |
(616) |
12,959 | |
|
Cash flows from investing activities |
|
|
|
|
|
| |||
|
Purchases of property, plant and equipment,, including capitalized software |
|
- |
(16,444) |
(2,705) |
- |
(19,149) | |||
|
Proceeds from sales of property, plant and equipment |
|
- |
406 |
106 |
- |
512 | |||
|
Acquisition of business |
|
|
- |
542 |
(931) |
- |
(389) | ||
|
Investments in subsidiaries |
|
|
(616) |
- |
- |
616 |
- | ||
|
|
|
|
Net cash (used in) provided by investing activities |
(616) |
(15,496) |
(3,530) |
616 |
(19,026) | |
|
Cash flows from financing activities |
|
|
|
|
|
| |||
|
Repayment of subordinated term loans |
|
- |
(49) |
(64) |
- |
(113) | |||
|
Financing costs paid |
|
|
|
- |
(110) |
- |
- |
(110) | |
|
Borrowings under revolving credit facility |
|
- |
979,619 |
99,379 |
- |
1,078,998 | |||
|
Repayments of revolving credit facility |
|
- |
(978,409) |
(95,217) |
- |
(1,073,626) | |||
|
Intercompany borrowings (repayments) |
|
22,700 |
(18,016) |
(4,684) |
- |
- | |||
|
|
|
|
Net cash provided by (used in) financing activities |
22,700 |
(16,965) |
(586) |
- |
5,149 | |
|
Effect of exchange rate changes on cash |
|
- |
(4,214) |
5,536 |
- |
1,322 | |||
|
|
|
|
Increase (decrease) in cash |
|
(77) |
335 |
146 |
- |
404 |
|
Cash |
|
|
|
|
|
|
|
|
|
|
Beginning of year |
|
|
|
77 |
306 |
925 |
- |
1,308 | |
|
End of year |
|
|
|
$ - |
$ 641 |
$ 1,071 |
$ - |
$ 1,712 | |
F-40
15. Lease Transactions
During the year ended December 31, 2009, the Company completed two equipment sale/leaseback transactions with a third party that resulted in net proceeds of approximately $6.0 million, after fees and deposits. The equipment sold consisted of an extrusion asset and press that were purchased during 2009. These funds were subsequently used to reduce amounts outstanding under the Senior Credit Facility.
On July 12, 2010, the Company completed an equipment sale/leaseback transaction with a third party that resulted in net proceeds of approximately $4.9 million, after fees and deposits. These funds were subsequently used to reduce amounts outstanding under the Senior Credit Facility. The Company determined that this lease qualifies as a capital lease and accordingly recorded a capital lease obligation equal to the present value of the minimum lease payments, or approximately $5.2 million. The lease term is five years with a lease expiration date of July 2015. At December 31, 2010, $5.2 million of property, plant and equipment and approximately $515,000 of accumulated depreciation are recorded related to the capital lease on the accompanying consolidated balance sheet. At December 31, 2010, approximately $1.0 million and $3.6 million are included in the current portion of capital lease obligations and long-term capital lease obligations, less current portion, respectively, on the accompanying consolidated balance sheet. At December 31, 2010, approximately $1.7 million in security deposits refundable at lease expiration are included in other assets on the accompanying consolidated balance sheet.
In conjunction with the EMCS acquisition, the Company assumed one lease related to real estate and three leases related to extrusion equipment that the Company determined all qualify as capital leases. The Company recorded a total capital lease obligation equal to the present value of the minimum lease payments, or approximately $9.2 million. The leases expired over various periods with the real estate lease expiring in May 2019 and the three equipment leases expiring in May 2014, September 2014 and December 2017, respectively. Subsequent to the EMCS acquisition, the Company re-negotiated two of the equipment leases. The remaining equipment lease was cancelled and the equipment was purchased by the Company for approximately $1.5 million. The new equipment leases expire in September 2014. At December 31, 2010, approximately $4.4 million of property, plant and equipment and approximately $71,000 of accumulated depreciation related to the real estate and approximately $3.4 million of property, plant and equipment and approximately $476,000 of accumulated depreciation related to the extrusion equipment are recorded on the accompanying consolidated balance sheet. At December 31, 2010, approximately $77,000 and $4.3 million are included in the current portion of capital lease obligations and long-term capital lease obligations, less current portion, respectively, related to the assumed real estate lease. At December 31, 2010, approximately $796,000 and $2.6 million are included in the current portion of capital lease obligations and long-term capital lease obligations, less current portion, respectively, related to the equipment leases. At December 31, 2010, approximately $1.4 million in security deposits refundable at lease expiration are included in other assets in the accompanying consolidated balance sheet.
See Note 8 for a schedule of future annual lease payments.
F-50
|
|
Exhibit Index |
|
Number
|
Description
|
|
2.1 |
Purchase Agreement, among Intelicoat Technologies Image Products Holdco LLC, Image Products Group LLC, Exopack Advanced Coatings, LLC, Exopack Holdings UK, Ltd., and Exopack Holding Corp., dated August 6, 2007 (incorporated by reference to Exhibit 2.1 to our Current Report on Form 8-K filed on August 10, 2007). |
|
|
|
|
2.2*† |
Asset Purchase Agreement dated as of June 11, 2010 by and between Exopack Holding Corp. and Bemis Company, Inc. (incorporated by reference to Exhibit 2.1 to our Current Report on Form 8-K/A filed on September 17, 2010). |
|
|
|
|
3.1 |
Certificate of Incorporation of FPD Holdings Corp., dated April 12, 2001 (incorporated by reference to Exhibit 3.1 to our Registration Statement on Form S-4 (File No. 333-136559)). |
|
|
|
|
3.2 |
Certificate of Amendment to the Certificate of Incorporation of FPD Holdings Corp. (amending name to Exo-Tech Packaging Holding Corp.), dated July 26, 2001 (incorporated by reference to Exhibit 3.2 to our Registration Statement on Form S-4 (File No. 333-136559)). |
|
|
|
|
3.3 |
Certificate of Amendment to the Certificate of Incorporation of Exo-Tech Packaging Holding Corp., dated August 6, 2001 (incorporated by reference to Exhibit 3.3 to our Registration Statement on Form S-4 (File No. 333-136559)). |
|
|
|
|
3.4 |
Certificate of Amendment to the Certificate of Incorporation of Exo-Tech Packaging Holding Corp. (amending name to Exopack Holding Corp.), dated August 25, 2001 (incorporated by reference to Exhibit 3.4 to our Registration Statement on Form S-4 (File No. 333-136559)). |
|
|
|
|
3.5 |
Certificate of Merger of Exopack Integrated, Inc. with and into Exopack Holding Corp. (the surviving corporation), dated October 13, 2005 (incorporated by reference to Exhibit 3.5 to our Registration Statement on Form S-4 (File No. 333-136559)). |
|
|
|
|
3.6 |
Bylaws of FPD Holdings Corp., dated April 30, 2001 (incorporated by reference to Exhibit 3.6 to our Registration Statement on Form S-4 (File No. 333-136559)). |
|
|
|
|
3.7 |
Certificate of Incorporation of FPD Acquisition, Inc., dated April 12, 2001 (incorporated by reference to Exhibit 3.7 to our Registration Statement on Form S-4 (File No. 333-136559)). |
|
|
|
|
3.8 |
Certificate of Conversion of FPD Acquisition, Inc. into Exo-Tech Packaging, L.L.C. (with Exo-Tech, L.L.C. as the surviving entity), dated July 27, 2001 (incorporated by reference to Exhibit 3.8 to our Registration Statement on Form S-4 (File No. 333-136559)). |
|
|
|
|
3.9 |
Certificate of Formation of Exo-Tech Packaging, L.L.C., dated July 27, 2001 (incorporated by reference to Exhibit 3.9 to our Registration Statement on Form S-4 (File No. 333-136559)). |
|
|
|
|
3.10 |
Certificate of Amendment to the Certificate of Formation of Exo-Tech Packaging, L.L.C. (amending name to Exopack, LLC), dated August 28, 2001 (incorporated by reference to Exhibit 3.10 to our Registration Statement on Form S-4 (File No. 333-136559)). |
|
|
|
|
3.11 |
Limited Liability Company Agreement of Exo-Tech Packaging, L.L.C., dated July 27, 2001 (incorporated by reference to Exhibit 3.11 to our Registration Statement on Form S-4 (File No. 333-136559)). |
|
|
|
|
3.12 |
Certificate of Formation of Exopack-Thomasville, LLC, dated September 12, 2001 (incorporated by reference to Exhibit 3.12 to our Registration Statement on Form S-4 (File No. 333-136559)). |
|
|
|
|
3.13 |
Limited Liability Company Agreement of Exopack-Thomasville, LLC, dated September 27, 2003 (incorporated by reference to Exhibit 3.13 to our Registration Statement on Form S-4 (File No. 333-136559)). |
|
|
|
|
E-1 |
|
3.14 |
|
Certificate of Formation of SF&A Acquisition Company, L.L.C., dated September 23, 2002 (incorporated by reference to Exhibit 3.14 to our Registration Statement on Form S-4 (File No. 333-136559)). | |||
|
|
|
| |||
|
3.15 |
|
Certificate of Amendment to the Certificate of Formation of SF&A Acquisition, L.L.C., dated September 30, 2002 (incorporated by reference to Exhibit 3.15 to our Registration Statement on Form S-4 (File No. 333-136559)). | |||
|
|
|
| |||
|
3.16 |
|
Certificate of Amendment to the Certificate of Formation of Specialty Films & Associates, L.L.C (amending name to Exopack Hebron, L.L.C.), dated January 10, 2005 (incorporated by reference to Exhibit 3.16 to our Registration Statement on Form S-4 (File No. 333-136559)). | |||
|
|
|
| |||
|
3.17 |
|
Limited Liability Company Agreement of SF&A Acquisition Company, L.L.C., dated September 23, 2002 (incorporated by reference to Exhibit 3.17 to our Registration Statement on Form S-4 (File No. 333-136559)). | |||
|
|
|
| |||
|
3.18 |
|
Articles of Incorporation of Portsmouth Acquisition Co., dated July 19, 2003 (incorporated by reference to Exhibit 3.18 to our Registration Statement on Form S-4 (File No. 333-136559)). | |||
|
|
|
| |||
|
3.19 |
|
Certificate of Amendment of Articles of Incorporation of Portsmouth Acquisition Co. (amending name to Exopack-Ontario, Inc.), dated October 1, 2003 (incorporated by reference to Exhibit 3.19 to our Registration Statement on Form S-4 (File No. 333-136559)). | |||
|
|
|
| |||
|
3.20 |
|
Bylaws of Portsmouth Acquisition Co., dated July 22, 2003 (incorporated by reference to Exhibit 3.20 to our Registration Statement on Form S-4 (File No. 333-136559)). | |||
|
|
|
| |||
|
3.21 |
|
Certificate of Incorporation of Cello-Foil Holding Corp., dated March 22, 2005 (incorporated by reference to Exhibit 3.21 to our Registration Statement on Form S-4 (File No. 333-136559)). | |||
|
|
|
| |||
|
3.22 |
|
By-Laws of Cello-Foil Holding Corp., dated March 22, 2005 (incorporated by reference to Exhibit 3.22 to our Registration Statement on Form S-4 (File No. 333-136559)). | |||
|
|
|
| |||
|
3.23 |
|
Limited Liability Company Articles of Organization of Exopack-Technology, LLC, dated September 15, 2003 (incorporated by reference to Exhibit 3.23 to our Registration Statement on Form S-4 (File No. 333-136559)). | |||
|
|
|
| |||
|
3.24 |
|
Limited Liability Company Agreement of Exopack-Technology, LLC, dated September 29, 2003 (incorporated by reference to Exhibit 3.24 to our Registration Statement on Form S-4 (File No. 333-136559)). | |||
|
|
|
| |||
|
3.25 |
|
Articles of Incorporation of Cello-Foil Products, Inc., dated December 8, 1949 (incorporated by reference to Exhibit 3.25 to our Registration Statement on Form S-4 (File No. 333-136559)). | |||
|
|
|
| |||
|
3.26 |
|
Certificate of Amendment to the Articles of Incorporation of Cello-Foil Products, Inc., dated May 13, 1977 (incorporated by reference to Exhibit 3.26 to our Registration Statement on Form S-4 (File No. 333-136559)). | |||
|
|
|
| |||
|
3.27 |
|
Certificate of Amendment to the Articles of Incorporation of Cello-Foil Products, Inc., dated March 3, 1992 (incorporated by reference to Exhibit 3.27 to our Registration Statement on Form S-4 (File No. 333-136559)). | |||
|
|
|
| |||
|
3.28 |
|
Certificate of Amendment to the Articles of Incorporation of Cello-Foil Products, Inc., dated June 9, 2005 (incorporated by reference to Exhibit 3.28 to our Registration Statement on Form S-4 (File No. 333-136559)). | |||
|
|
|
| |||
|
3.29 |
|
Certificate of Amendment to the Articles of Incorporation of Cello-Foil Products, Inc., dated September 21, 2005 (incorporated by reference to Exhibit 3.29 to our Registration Statement on Form S-4 (File No. 333-136559)). | |||
|
|
|
| |||
|
3.30 |
|
Bylaws of Cello-Foil Products, Inc., dated December 8, 1949 (incorporated by reference to Exhibit 3.30 to our Registration Statement on Form S-4 (File No. 333-136559)). | |||
|
|
|
| |||
|
3.31 |
|
Certificate of Incorporation of TPG Group Holding Corp., dated August 19, 2005 (incorporated by reference to Exhibit 3.31 to our Registration Statement on Form S-4 (File No. 333-136559)). | |||
|
| |||||
|
E-2 | |||||
|
3.32 |
|
By-Laws of TPG Group Holding Corp., dated August 19, 2005 (incorporated by reference to Exhibit 3.32 to our Registration Statement on Form S-4 (File No. 333-136559)). |
|
|
|
|
|
3.33 |
|
Certificate of Incorporation of TPG Enterprises, Inc., dated August 24, 2005 (incorporated by reference to Exhibit 3.33 to our Registration Statement on Form S-4 (File No. 333-136559)). |
|
|
|
|
|
3.34 |
|
By-Laws of TPG Enterprises, Inc., dated August 24, 2005 (incorporated by reference to Exhibit 3.34 to our Registration Statement on Form S-4 (File No. 333-136559)). |
|
|
|
|
|
3.35 |
|
Certificate of Incorporation of TPG (US), Inc., dated August 24, 2005 (incorporated by reference to Exhibit 3.35 to our Registration Statement on Form S-4 (File No. 333-136559)). |
|
|
|
|
|
3.36 |
|
By-Laws of TPG (US), Inc., dated August 24, 2005 (incorporated by reference to Exhibit 3.36 to our Registration Statement on Form S-4 (File No. 333-136559)). |
|
|
|
|
|
3.37 |
|
Articles of Association of 3104623 Nova Scotia Company, dated August 26, 2005 (incorporated by reference to Exhibit 3.37 to our Registration Statement on Form S-4 (File No. 333-136559)). |
|
|
|
|
|
3.38 |
|
Certificate of Name Change of 3104623 Nova Scotia Company to The Packaging Group (Canada) Corporation, dated September 14, 2005 (incorporated by reference to Exhibit 3.38 to our Registration Statement on Form S-4 (File No. 333-136559)). |
|
|
|
|
|
4.1 |
|
Indenture dated January 31, 2006 among Exopack Holding Corp., the Guarantors party thereto, and The Bank of New York, as Trustee (incorporated by reference to Exhibit 4.1 to our Registration Statement on Form S-4 (File No. 333-136559)). |
|
|
|
|
|
4.2 |
|
Form of 11.25% Senior Note due 2014 (included as Exhibit A1 of Exhibit 4.1). |
|
|
|
|
|
4.3 |
|
Form of Guarantee relating to the 11.25% Senior Notes due 2014 (included as Exhibit E of Exhibit 4.1). |
|
|
|
|
|
4.4 |
|
Exchange and Registration Rights Agreement, dated as of January 31, 2006, by and among Exopack Holding Corp., the Guarantors party thereto, and Goldman, Sachs & Co., on behalf of the initial purchasers of the old notes (incorporated by reference to Exhibit 4.4 to our Registration Statement on Form S-4 (File No. 333-136559)). |
|
|
|
|
|
10.1 |
|
2005 Stock Option Plan of CPG Finance, Inc. (incorporated by reference to Exhibit 10.2 to our Registration Statement on Form S-4 (File No. 333-136559)). |
|
|
|
|
|
10.2 |
|
Stock Option Grant Agreement between CPG Finance, Inc. and Jack Knott, dated December 12, 2005 (incorporated by reference to Exhibit 10.3 to our Registration Statement on Form S-4 (File No. 333-136559)). |
|
|
|
|
|
10.3 |
|
Separation Benefit Agreement among Exopack, LLC, CPG Finance Inc. and Jack Knott, dated January 10, 2006 (incorporated by reference to Exhibit 10.6 to our Registration Statement on Form S-4 (File No. 333-136559)). |
|
|
|
|
|
10.4 |
|
Separation Benefit Agreement among Exopack, LLC, CPG Finance Inc. and Jon Heard, dated March 23, 2007 (incorporated by reference to Exhibit 10.7 to our Annual Report on Form 10-K for the year ended December 31, 2006). |
|
|
|
|
|
10.5 |
|
Stock Option Grant Agreement between CPG Finance, Inc. and Jon Heard, dated December 12, 2005 (incorporated by reference to Exhibit 10.8 to our Annual Report on Form 10-K for the year ended December 31, 2006). |
|
|
|
|
|
10.6 |
|
Separation Benefit Agreement among Exopack, LLC, CPG Finance Inc. and Bob Arvanites, dated December 12, 2005 (incorporated by reference to Exhibit 10.11 to our Annual Report on Form 10-K for the year ended December 31, 2006). |
|
| ||
|
E-3 |
|
10.7 |
|
Stock Option Grant Agreement between CPG Finance, Inc. and Bob Arvanites, dated December 12, 2005 (incorporated by reference to Exhibit 10.12 to our Annual Report on Form 10-K for the year ended December 31, 2006). |
|
|
|
|
|
10.8 |
|
Offer Letter between Jack Knott and Exopack Holding Corp. dated January 10, 2006 (incorporated by reference to Exhibit 10.13 to our Annual Report on Form 10-K for the year ended December 31, 2007). |
|
|
|
|
|
10.9 |
|
Stock Option Grant Agreement between CPG Finance, Inc. and Tom Vale, dated March 12, 2008 (incorporated by reference to Exhibit 10.14 to our Quarterly Report on Form 10-Q for the quarter ended September 30, 2008). |
|
|
|
|
|
10.10 |
|
Separation Benefit Agreement among Exopack, LLC, CPG Finance, Inc. and Tom Vale, dated November 11, 2008 (incorporated by reference to Exhibit 10.15 to our Quarterly Report on Form 10-Q for the quarter ended September 30, 2008). |
|
|
|
|
|
10.11 |
|
Stock Option Grant Agreement between CPG Finance, Inc. and Gary McDaniel, dated August 18, 2008 (incorporated by reference to Exhibit 10.16 to our Quarterly Report on Form 10-Q for the quarter ended September 30, 2008). |
|
|
|
|
|
10.12 |
|
Separation Benefit Agreement among Exopack LLC, CPG Finance, Inc. and Gary McDaniel, dated November 11, 2008 (incorporated by reference to Exhibit 10.17 to our Quarterly Report on Form 10-Q for the quarter ended September 30, 2008). |
|
|
|
|
|
10.13 |
|
Amended Separation Benefit Agreement among Exopack, LLC, CPG Finance Inc, and Jack Knott, dated January 22, 2008 (incorporated by reference to Exhibit 10.18 to our Annual Report on Form 10-K for the year ended December 31, 2008). |
|
|
|
|
|
10.14 |
|
Management Incentive Program of Exopack Holding Corporation (incorporated by reference to Exhibit 10.19 to our Current Report on Form 8-K filed on March 25, 2010). |
|
|
|
|
|
10.15 |
|
Separation Benefit Agreement among Exopack LLC, CPG Finance and Scott Ross, dated March 29, 2010. |
|
|
|
|
|
10.16 |
|
Stock Option Agreement between CPG Finance, Inc. and Scott Ross, dated December 12, 2005(incorporated by reference to Exhibit 10.16 to our Annual Report on Form 10-K filed on April 1, 2010 (File No. 333-136559)). |
|
|
|
|
|
10.17** |
|
Stock Option Agreement between CPG Finance, Inc. and Gene Welsh, dated September 28, 2010(incorporated by reference to Exhibit 10.17 to our Annual Report on Form 10-K filed on April 1, 2010 (File No. 333-136559)). |
|
|
|
|
|
10.18† |
|
Credit and Guaranty Agreement dated as of July 13, 2010 among the Exopack Holding Corp., Exopack Key Holdings, LLC, certain subsidiaries of Exopack Key Holding Corp., as guarantors, and Goldman Sachs Lending Partners LLC, as Sole Lead Arranger, Sole Lead Bookrunner, Administrative Agent, Syndication Agent and Documentation Agent (incorporated by reference to Exhibit 10.1 to our Quarterly Report on Form 10-Q/A for the quarter ended June 30, 2010). |
|
|
|
|
|
10.19 |
|
Second Amended and Restated Credit Agreement, dated as of January 31, 2006, as Amended and Restated as of October 31, 2007, as further Amended and Restated as of July 2, 2010, by and among Exopack, LLC, Cello-Foil Products, Inc., Exopack Performance Films Inc., and Exopack Newmarket, Ltd. as Borrowers, and the other persons party thereto that are designated as Credit Parties and General Electric Capital Corporation, as US Agent, US L/C Issuer and US Lender, and GE Canada Finance Holding Company, as Canadian Agent, Canadian L/C Issuer and Canadian Lender, and the other financial institutions party thereto, as Lenders (incorporated by reference to Exhibit 10.1 to our Current Report on Form 8-K filed on July 8, 2010). |
|
|
|
|
|
10.20 |
|
First Amendment to Second Amended and Restated Credit Agreement, dated as of July 8, 2010, by and among Exopack Holding Corp., Exopack, LLC, Cello-Foil Products, Inc., Exopack-Newmarket, Ltd., and Exopack Performance Films, Inc., as Borrowers, the other persons signatory thereto as Credit Parties, the Lenders signatory thereto, General Electric Capital Corporation and GE Canada Finance Holding Company (incorporated by reference to Exhibit 10.2 to our Quarterly Report on Form 10-Q for the quarter ended September 30, 2010). |
|
|
|
|
|
12.1** |
|
Statement Re: Computation of Ratio of Earnings to Fixed Charges. |
|
|
|
|
|
21.1** |
|
Subsidiaries of Exopack Holding Corp. |
|
|
|
|
|
31.1** |
|
Certification of Chief Executive Officer pursuant to Section 302 of the Sarbanes-Oxley Act of 2002. |
|
|
|
|
|
31.2** |
|
Certification of Chief Financial Officer pursuant to Section 302 of the Sarbanes-Oxley Act of 2002. |
|
|
|
|
|
32.1** |
|
Certification of Chief Executive Officer pursuant to Section 906 of the Sarbanes-Oxley Act of 2002. |
|
|
|
|
|
32.2** |
|
Certification of Chief Financial Officer pursuant to Section 906 of the Sarbanes-Oxley Act of 2002. |
|
|
|
|
|
* |
|
Schedules and certain exhibits to Exhibit 2.2 have been omitted pursuant to Item 601(b)(2) of Regulation S-K. Exopack Holding Corp. will furnish copies of the omitted schedules and exhibits to the Securities and Exchange Commission upon its request. |
|
† |
Confidential treatment has been requested for portions of this exhibit. These portions have been omitted and filed separately with the Securities and Exchange Commission. | |
|
** |
Filed herewith. | |
|
E-4 |