Attached files
| file | filename |
|---|---|
| 8-K - SUN HEALTHCARE GROUP INC | form8k.htm |
EXHIBIT 99.1
Investor Presentation
March 2011

1
Statements made in this Confidential Information Memorandum that are not historical facts are "forward-looking" statements (as
defined in the Private Securities Litigation Reform Act of 1995) that involve risks and uncertainties and are subject to change at any
time. These forward-looking statements may include, but are not limited to, statements containing words such as "anticipate,"
"believe," "plan," "estimate,” "expect,” "hope,” "intend,” "may” and similar expressions. Forward-looking statements in this
Confidential Information Memorandum also include all statements regarding expected financial position, results of operations, cash
flows, liquidity, financing plans, business strategy, growth opportunities, plans and objectives of management for future operations,
the impact of reductions in reimbursements and other changes in government reimbursement programs and the timing and impact of
the proposed restructuring transactions. Factors that could cause actual results to differ are identified in the public filings made by
Sun with the Securities and Exchange Commission and include changes in Medicare and Medicaid reimbursements; the impact that
healthcare reform legislation will have on Sun’s business; Sun’s ability to maintain the occupancy rates and payor mix at Sun’s
healthcare centers; potential liability for losses not covered by, or in excess of, Sun’s insurance; the effects of government
regulations and investigations; the significant amount of Sun’s indebtedness, covenants in Sun’s debt agreements that may restrict
Sun’s activities and Sun’s ability to make acquisitions, incur more indebtedness; the impact of the current economic downturn on
Sun’s business; the ability of Sun to collect its accounts receivable on a timely basis; increasing labor costs and the shortage of
qualified healthcare personnel; and Sun’s ability to receive increases in reimbursement rates from government payors to cover
increased costs. More information on factors that could affect Sun’s business and financial results are included in Sun’s public filings
made with the Securities and Exchange Commission, including Sun’s Annual Report on Form 10-K and Quarterly Reports on Form
10-Q, copies of which are available on Sun’s web site, www.sunh.com. There may be additional risks of which Sun is presently
unaware or that Sun currently deems immaterial.
The forward-looking statements involve known and unknown risks, uncertainties and other factors that are, in some cases, beyond
Sun’s control. Sun cautions that any forward-looking statements made by Sun are not guarantees of future performance. Sun
disclaims any obligation to update any such factors or to announce publicly the results of any revisions to any of the forward-looking
statements to reflect future events or developments.
References to “Sun” refer to Sun Healthcare Group, Inc. and its subsidiaries
Forward-Looking Statements

2
References are made in this presentation to Adjusted EBITDA, EBITDA, EBITDA margin, Adjusted EBITDAR, EBITDAR and
EBITDAR margin, which are non-GAAP financial measures. These non-GAAP financial measures are reconciled to the
corresponding GAAP financial measures in the Appendices included at the end of this presentation.
EBITDAR margin, which are non-GAAP financial measures. These non-GAAP financial measures are reconciled to the
corresponding GAAP financial measures in the Appendices included at the end of this presentation.
EBITDA is defined as net income before loss (gain) on discontinued operations, interest expense (net of interest income), income
tax expense (benefit) and depreciation and amortization. EBITDA margin is EBITDA as a percentage of revenue. EBITDAR is
EBITDA before rent expense and EBITDAR margin is EBITDAR as a percentage of revenue. The presentation of Adjusted EBITDA
is EBITDA adjusted for gain(loss) on sale of assets, restructuring costs and loss on extinguishment of debt. Adjusted EBITDAR is
adjusted EBITDA before rent expense. Sun believes that adjusted EBITDA, EBITDA, EBITDA margin, Adjusted EBITDAR,
EBITDAR and EBITDAR margin provide useful information regarding Sun’s operational performance because these financial
measures enhance the overall understanding of the financial performance and prospects for the future of Sun’s core business
activities, provide consistency in Sun’s financial reporting and provide a basis for the comparison of results of core business
operations between current, past and future periods. These measures are also some of the primary indicators Sun uses for planning
and forecasting in future periods, including trending and analyzing the core operating performance of its business from period to
period without the effect of GAAP expenses, revenues and gains that are unrelated to day-to-day performance.
Non-GAAP Financial Measures

3
Attractive industry fundamentals
§ Healthcare policy favors SNFs - effective clinical outcomes at lower costs
§ Favorable demographics - increasing senior population
§ Improving supply / demand dynamics - number of SNF beds has steadily declined
Diversified, growing platform
§ National platform with four business lines
§ Consistent revenue growth
Focus on high acuity and clinically complex patients
Proven and experienced management team
Investment Highlights

Sun Has a Dynamic History...
4
Sun has consistently increased revenue and EBITDAR through a mix of organic and
external growth, as well as operational improvements
external growth, as well as operational improvements
The 2005 and 2007 acquisitions of Peak Medical Corporation and Harborside Healthcare
along with the recent 2010 spin of Sun’s real estate assets have been transformative
transactions that have positioned the company for continued growth
along with the recent 2010 spin of Sun’s real estate assets have been transformative
transactions that have positioned the company for continued growth
Revenue
Normalized EBITDAR
Note: 2011E Revenue and EBITDAR estimates reflect midpoint of Guidance.
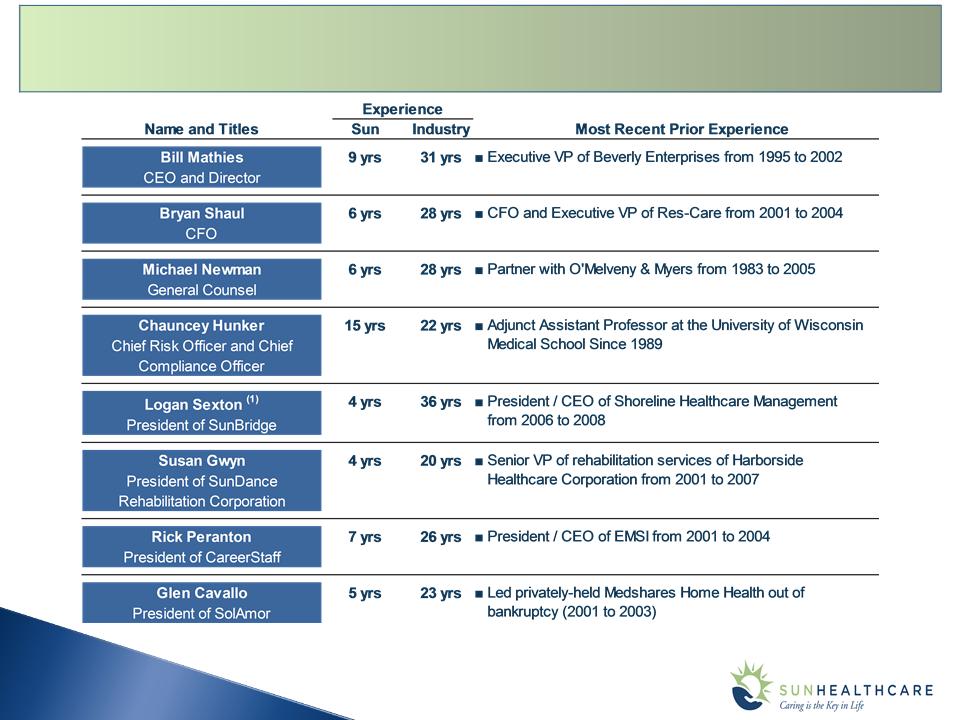
…Under Consistent Operating Management…
5
(1) Effective 01/17/11.

6
…And With Patient Care As Its Top Priority
Based on a recent independent survey, 86% of our current residents/patients would recommend our
center to others; 87% expressed overall satisfaction
center to others; 87% expressed overall satisfaction
Trend in Rehospitalizations
§ By responding to medical condition changes, return-to-
hospital rates are markedly lower than our peers
hospital rates are markedly lower than our peers
Quality Measures
§ Key quality metrics continue to improve and trend
better than national averages
better than national averages
The above graph represents the percent of patients rehospitalized within 20
days of admission to a skilled nursing center. Patients are more prone to
hospital readmissions within 20 days following acute hospitalization.
days of admission to a skilled nursing center. Patients are more prone to
hospital readmissions within 20 days following acute hospitalization.

7
Skilled Nursing Services (SunBridge)
§ 200 skilled nursing centers
§ 19,400 patients/residents
Hospice Services (SolAmor)
§ Growing business operating in 10 states with
20 offices with 4 startups
20 offices with 4 startups
Rehabilitation Therapy Services (SunDance)
§ Contract services, rehab agency,
management services
management services
§ 346 contracts with non-affiliated entities
§ Provides services to substantially all
SunBridge skilled nursing centers
SunBridge skilled nursing centers
Medical Staffing Services (CareerStaff)
§ Primarily hospital setting (also serves SNFs,
schools, prisons)
schools, prisons)
§ 60%+ of billings are for therapists (also
provide nursing and pharmacy services)
provide nursing and pharmacy services)
2010 Net Revenue = $1.9 billion
2010 Net Revenue = $1.9 billion
Note: Inpatient segment includes both the SunBridge & SolAmor business lines
Net Revenue by Line of Business
Net Revenue by Source
Sun Healthcare Today

8
Number of Centers Per State
States with Centers
IN 2005: Sun Operated 104 Inpatient Centers in 13 States
Sun’s Portfolio Diversification
Number of Centers Per State
States with Centers
TODAY (1): Sun Operates 200 Inpatient Centers in 25 States
Revenue ($M’s) $882.1
Normalized EBITDAR ($M’s) 60.6
Margin 6.9%
Inpatient Skilled Mix 16.1%
Length of Stay 37 Days
Revenue ($M’s) $1,906.9
Normalized EBITDAR ($M’s) 250.6
Margin 13.1%
Inpatient Skilled Mix 18.8%
Length of Stay 29 Days
(1) As of 12/31/2010
States with Centers and Hospices
7
7
22
1
1
11
9
5
7
9
8
10
7
5
5
11
15
1
1
9
1
9
7
2
20
3
18
10
1
15
2
17
7
9
8
8
9
7
SunBridge Healthcare Corporation
Centers include skilled nursing centers,
assisted living centers and independent living
centers
assisted living centers and independent living
centers
Provides services that:
§ Focus on higher acuity, short-term stay
patients
patients
§ Include specialty services that address local
market needs
market needs
68 centers have Rehab Recovery Suites
(“RRS”) with 1,992 beds as of December 31,
2010
(“RRS”) with 1,992 beds as of December 31,
2010
§ Specialize in Medicare / managed care
patients
patients
47 wings dedicated to Alzheimer’s
patients (Solana) with 1,836 beds as of
December 31, 2010
patients (Solana) with 1,836 beds as of
December 31, 2010
SunBridge
|
OPERATING PROFILE
as of December 31, 2010
|
|
|
Centers
States
|
200
25
|
|
Property Type:
Skilled Nursing
SNF/AL/IL
AL
Mental Health
IL
|
164 (82%)
16 (8%)
10 (5%)
8 (4%)
2 (1%)
|
|
Beds:
Licensed
Available
|
23,053
22,400
|
|
Occupancy % - YTD 2010
|
87.0%
|
|
SNF Skilled Mix:
% of Patient Days - YTD 2010
% of SNF Revenue - YTD 2010
|
18.8%
38.0%
|
9

SunDance Rehabilitation Corporation
Broad array of rehabilitation therapy services
for post acute patients provided in skilled
nursing centers and assisted living facilities
for post acute patients provided in skilled
nursing centers and assisted living facilities
Provides rehabilitation therapy services to 527
centers in 37 states (1)
centers in 37 states (1)
§ 346 centers operated by non-affiliated
parties
parties
§ 181 centers operated by affiliates (1)
Approximately 58% of revenue from non-
affiliated sources in 2010
affiliated sources in 2010
SunDance
10
Revenue
($ in millions)
Revenue Per Contract
($ in thousands)
(1) As of January 1, 2011

SolAmor Hospice Corporation
Provides hospice services in affiliated skilled
nursing centers, non-affiliated skilled nursing
centers and the patient’s home
nursing centers, non-affiliated skilled nursing
centers and the patient’s home
Operates in 10 states; 9 of which have
affiliated skilled nursing centers
affiliated skilled nursing centers
§ Synergistic service as 6% - 10% of patients
in SNFs eligible for hospice services
in SNFs eligible for hospice services
Historical growth due to de novo start-ups and
acquisitions
acquisitions
§ Holisticare in 2008
§ Allegiance in 2009
§ Countryside in 2010
Strong contributor to earnings
SolAmor
11
Revenue
Average Daily Census
($ in millions)
EBITDA and Margin
($ in millions)
7.0%
20.1%
20.1%

CareerStaff Unlimited, Inc.
Provides temporary medical staffing to
hospitals, skilled nursing facilities, schools and
prisons
hospitals, skilled nursing facilities, schools and
prisons
§ Approximately 60% of billings are for
therapists
therapists
Operates in 39 states
§ National network of 32 branches with 25
offices
offices
Diversified staffing approach:
§ Per diem, travel and permanent placement
§ Places a wide array of healthcare
professionals: therapists, nurses,
pharmacists, and physicians
professionals: therapists, nurses,
pharmacists, and physicians
Full-service human resources manager
CareerStaff
12
Revenue
EBITDA and margin
($ in millions)
($ in millions)
8.7%
9.2%
6.9%

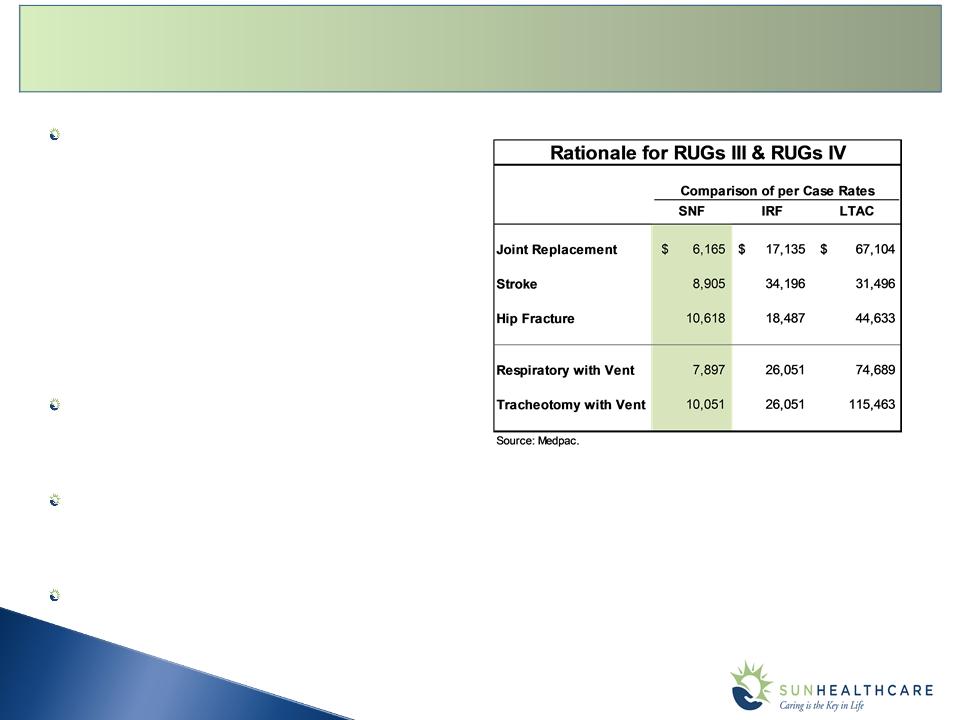
13
Resource Utilization Group (RUG) payment system
Payments to SNFs vary based on the intensity of clinical services provided to Medicare
patients
patients
Resource Utilization Group IV (RUG IV) system replaced existing RUG III system
effective October 1, 2010
effective October 1, 2010
The new RUG IV system:
§ Updated the RUG III system by changing and refining the 53 categories in RUG III to
create 66 categories that more accurately reflect the cost of services provided
create 66 categories that more accurately reflect the cost of services provided
§ 13 new RUGs categories focused on medical complexity
§ Eliminates the lookback period
§ Changes the reimbursement level for therapy delivered concurrently
RUG IV: What It Means
Positive Opportunity for Sun

14
Q4 2010 rate increased 12.6% over Q4 2009
1.7% was related to the Market Basket increase
Sun’s concurrent therapy experience is less than CMS estimates
§ There is an associated cost increase per unit of therapy delivered
§ Partially mitigated by group therapy
MDS 3.0 is creating additional expense
§ Increase in the number of MDS required
§ Additional completion time related to the new interview process
Financial Outcome of RUG-IV
Inpatient
SunDance
Consolidated SHG

Further Expansion of Product & Service Offering
15
Expand clinical products/services to
improve ability to capture clinically complex
patients
improve ability to capture clinically complex
patients
§ Upgrade complement of clinicians and
their skill sets
their skill sets
§ Focus on clinical competencies
• Tracheotomy care, HIV / Isolation,
advanced IV capabilities, etc.
advanced IV capabilities, etc.
§ Expand packaging and selling of clinical
service offerings
service offerings
Specialty unit development in markets that
provide unique opportunities (e.g. ventilator
program)
provide unique opportunities (e.g. ventilator
program)
Rehab Recovery Suites remain a relevant strategy to attract and care for short-term
high-acuity patients
high-acuity patients
§ Anticipate adding 600 new beds in 2011 or 31% growth in capacity
• 2,580 beds covering nearly 70% of the urban-based centers

16
Rehab Recovery Suites - Product Profile
Rehab Recovery Suites (RRS)
Separate and distinct units within a center
Enhanced therapy and clinical product
Hospitality services - dedicated concierge
Skilled Mix (Q4 ’10)
Rehab Utilization and Medicare Rates
% of Days
% of Revenue
Rehab
Medicare Rates
Number of centers: 68
Number of beds: 1,992
Average bed size: 25 beds per center
Cost / bed: $25,000
Development time: 6 - 9 months
RRS Metrics

Long-Term Asset Modernization Initiative
Long term capital investment strategy designed to
upgrade, reconfigure and fully renovate nursing
upgrade, reconfigure and fully renovate nursing
centers
§ Focus on privacy for patients, enhanced
amenities/public spaces, designated units with
specific purpose
amenities/public spaces, designated units with
specific purpose
§ Create improved work environment for staff and
attending physicians to enhance ability to deliver
care
attending physicians to enhance ability to deliver
care
§ Upgrade therapy and external environment to
enhance living experience and create unique
exercise venues
enhance living experience and create unique
exercise venues
Selection is dictated by market demographics,
competitive profile and return on investment
competitive profile and return on investment
Currently committed to renovate 17 centers
Partnering with landlords (REITs) to fund many of
these projects and paying a cost of capital add on to
rent
these projects and paying a cost of capital add on to
rent
17

18
External Growth
Sun utilizes a targeted acquisition strategy
of new skilled nursing centers and ancillary-
services providers that are attractive from
both financial and operational perspectives
services providers that are attractive from
both financial and operational perspectives
Ample liquidity to pursue acquisitions
§ Cash of $81.2 (1)
§ Undrawn revolver with capacity of $60.0M
Strong Free Cash Flow after CapEx
§ Low end of guidance: $18.7M
§ High end of guidance: $27.7M
Acquisitions
April 2007
December 2010
October 2009
September 2008
(1) As of December 31, 2010
April 2005

Acquisition Rationale:
Good geographic overlap to our
SunBridge portfolio
§ 7 existing offices / 4 startup offices -
growing or opening in 2011
growing or opening in 2011
§ Shares markets with 9 existing
SunBridge centers
SunBridge centers
§ Expands SolAmor platform to ten states
and approximately 1,050 patients daily
and approximately 1,050 patients daily
Opportunity to grow in SNF settings
(initially a home-based business)
New presence in 2 markets (AL & GA) with
barriers to entry:
barriers to entry:
§ Alabama is not issuing any new
provider licenses for Hospice unless
you are already a certified provider
provider licenses for Hospice unless
you are already a certified provider
Countryside Hospice Care, Inc. Acquisition
19
Sun center
Other Sun centers
Countryside
Countryside - Startup
Countryside - Alabama
Countryside - Georgia
Countryside Hospice Care

Focus on skilled nursing
growth
growth
Increase skilled nursing
revenue and contribution
revenue and contribution
by
§ Improving occupancy /
skilled mix
skilled mix
§ Continue focus on high
acuity and Medicare
patients
acuity and Medicare
patients
§ Expand product array for
clinically complex
patients
clinically complex
patients
§ Partnering with local
medical communities
medical communities
Seek growth in ancillary
businesses
businesses
Grow hospice operations
and leverage new acquisition
§ Synergistic to skilled
nursing business
Focus on rehabilitation
therapy business by
§ Expanding product
offerings
§ Improving labor
productivity and
profitability
Utilize Sun’s financial
flexibility
flexibility
Targeted acquisitions of
new skilled nursing
new skilled nursing
centers and ancillary-
services providers
Growth-oriented capital
spending
spending
§ RRS initiatives targeting
higher-acuity patients
higher-acuity patients
§ Modernization initiative
Sun’s Growth Strategy
20

21
Financial Overview

22
Sun 4th Quarter 2010 results

Sun 4th Quarter 2010 Segment Results
23
Inpatient
SolAmor (1)
SunDance
CareerStaff
(1) Included in Inpatient Segment
24
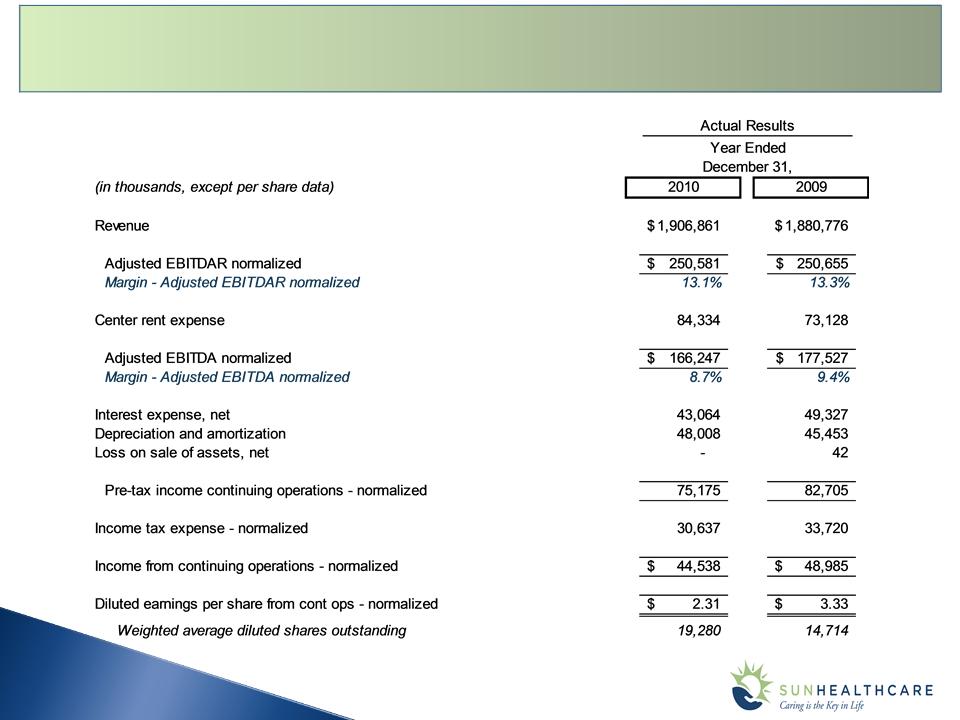
Sun Full Year 2010 results

25
2011 Guidance
2010 Normalized
Results
Results
2011 Full Year Guidance
(Dollars in millions, except per share data)

26
Medicare rates:
§ Net positive impact to average Medicare rates from
RUG-IV, partially offset by:
RUG-IV, partially offset by:
− Labor and other costs associated with higher-
acuity patients
acuity patients
− Elimination of concurrent therapy
− Impact of Medicare Part B Multiple Procedure
Payment Reduction (MPPR)
Payment Reduction (MPPR)
Medicaid rates, net of provider taxes, are expected to
be flat in 2011
be flat in 2011
2011 Guidance Parameters
Sun currently leases 86 formerly owned centers from
Sabra, resulting in an increased rent of $70.4 million
Sabra, resulting in an increased rent of $70.4 million
§ Operating leases
§ Traditional triple net leases
§ Lesser of CPI of 2.5% escalators
Reimbursement
Portfolio
Capital
Post-Restructuring with Sabra
No acquisitions or dispositions beyond the recently
announced purchase of Countryside Hospice Care, Inc.
announced purchase of Countryside Hospice Care, Inc.
Excludes results of operations of two nursing centers in
Oklahoma with leases expired at our option on
December 31, 2010 and one nursing center that we
expect to sell in 2011
Oklahoma with leases expired at our option on
December 31, 2010 and one nursing center that we
expect to sell in 2011
Capital expenditures in the range of $55 to $60 million
principally to support:
principally to support:
§ Routine maintenance and renovations for nursing
centers and IT systems
centers and IT systems
§ Build-out of more than 600 new beds for our
Rehab Recovery Suites, bringing our total to 2,580
and a 31% increase over 2010
Rehab Recovery Suites, bringing our total to 2,580
and a 31% increase over 2010
Interest of approximately $20 million reflecting an
average debt balance of $150 million at a blended
interest rate of 9%
average debt balance of $150 million at a blended
interest rate of 9%
§ $10 million required debt reduction
§ Includes $6.3 million related to Sun’s letter of credit
facility
facility
Effective tax rate of 41% and 2011 cash income taxes
paid between $12 million and $14 million
paid between $12 million and $14 million

27
Debt Table
(Dollars in millions)
Note: Leverage based on midpoint EBITDA of 2011 guidance

Cash Flows
28
(Dollars in millions)
(Dollars in millions)
|
2010 Pro Forma
|
|
|
|
||
|
|
Cash flows from operating activities 1
|
|
$ 79.9
|
|
|
|
|
Normalizing adjustments 3
|
|
42.0
|
|
|
|
|
Pro forma rent adjustment 3
|
|
(61.4)
|
|
|
|
|
Pro forma interest adjustment 4
|
|
29.7
|
|
|
|
|
|
Pro forma cash flows from operating activities
|
|
$ 90.2
|
|
|
|
|
Capital expenditures
|
|
(53.5)
|
|
|
|
|
Pro forma free cash flows
|
|
$ 36.7
|
|
|
|
|
|
|
|
|
|
2011 Estimated free cash flows 2
|
$20 to $25 range
|
||||
|
|
|
|
|
|
|
|
|
|
1 Includes $0.1 million of cash tax payments
|
|
|
|
|
|
|
2 Cash taxes are projected to be $12 to $14 million for 2011
|
|
|
|
|
|
|
3 Source: 2010 year-end earnings release
|
|
|
|
|
|
|
4 Adjusted for new capital structure post-spin
|
|
|
|

29
Appendix: Industry Fundamentals

Leveraging Opportunities in the Care Chain
30
Acute Care
LTAC
SNF
Assisted Living
Home Based Care
Sweet Spot - Lower Cost Provider to Higher Acuity Patients = Higher
Margins and Greater Opportunities
Margins and Greater Opportunities

31
65+ Population Projected to Increase 16% by 2015
85+ Population Projected to Increase 8% by 2015
Declining Number of Nursing Facilities
Attractive Industry Fundamentals
Source: U.S. Census Bureau.
Source: U.S. Census Bureau.
Source: AHCA.
32
SNFs Provide Lower Cost Setting
SNFs deliver effective clinical outcomes at
lower costs
lower costs
§ Increased Medicare funding for treatment of
high acuity patients
high acuity patients
§ Lower staffing requirements and associated
costs
costs
60% rule driving high acuity patients from in-
patient rehab facilities to SNFs
patient rehab facilities to SNFs
Short stay outlier policy shifting patients from
LTACs to SNFs
LTACs to SNFs
Shorter length of stays for SNFs
33
Near Term: RUG IV Medicare System Implementation
§ RUG IV continues to place emphasis on higher acuity patients
§ Requires centers to optimize therapy delivery using a combination of individual, group, concurrent and
nursing rehabilitation to increase efficiency
nursing rehabilitation to increase efficiency
§ New rate structure creates new opportunities for a broader array of clinically complex patients
Longer Term: Continued focus on post-acute care solutions
§ Accountable Care Organizations (ACO) will need to partner with high acuity SNFs to provide faster
discharges and lower levels of readmission
discharges and lower levels of readmission
SNFs will play an integral role in multi-provider systems
§ Cost savings are real and proven
§ Clinical capabilities continue to increase and broaden
Reimbursement Evolution Favors SNFs

34