Attached files
| file | filename |
|---|---|
| 8-K - FORM 8-K - CALGON CARBON Corp | l42277e8vk.htm |
Exhibit 99.1

| Investor Presentation Calgon Carbon Corporation Tuesday, March 29, 2011 Pittsburgh, PA |

| FORWARD-LOOKING INFORMATION SAFE HARBOR This presentation contains historical information and forward-looking statements. Forward- looking statements typically contain words such as "expect," "believe," "estimate," "anticipate," or similar words indicating that future outcomes are uncertain. Statements looking forward in time, including statements regarding future growth and profitability, price increases, cost savings, broader product lines, enhanced competitive posture and acquisitions, are included in the company's most recent Annual Report pursuant to the "safe harbor" provision of the Private Securities Litigation Reform Act of 1995. They involve known and unknown risks and uncertainties that may cause the company's actual results in future periods to be materially different from any future performance suggested herein. Further, the company operates in an industry sector where securities values may be volatile and may be influenced by economic and other factors beyond the company's control. Some of the factors that could affect future performance of the company are higher energy and raw material costs, costs of imports and related tariffs, labor relations, capital and environmental requirements, changes in foreign currency exchange rates, borrowing restrictions, validity of patents and other intellectual property, and pension costs. In the context of the forward-looking information provided in this presentation, please refer to the discussions of risk factors and other information detailed in, as well as the other information contained in the company's most recent Annual Report. |

| 2010 Revenue % Total ($MM) Revenue Carbon/Service 427.7 88.7% Granular, Powder, Pellets Coal, Coconut, Wood-based Reactivation On-site Service Equipment Technologies 46.0 9.5% Carbon Adsorption Odor Control Ultraviolet / Ballast Water Treatment Ion Exchange Consumer 8.6 1.8% Carbon Cloth *PreZerve(r) CALGON CARBON PRODUCTS AND SERVICES *Discontinued Product Line |

| 2010 CALGON CARBON DIVERSE MARKETS Drinking Water 26% (23% in 2009) Wastewater 17% (19% in 2009) Industrial Processes 14% (17% in 2009) Food 13% (16% in 2009) Air Pollution 19% (15% in 2009) Specialty 9% (8% in 2009) Consumer 2% (2% in 2009) |

| CCC'S OPERATIONS ARE GLOBAL |

| CALGON CARBON'S MAJOR COMPETITORS - Traditional Business Americas Europe Asia Carbon/Service Norit Carbon Importers Jacobi Siemens ADA-ES (PAC) WestvacoAlbermarle (PAC) Norit Carbon Importers Jacobi Desotec CECA Donau Carbotech PICA Norit Carbon Importers Jacobi Xinhua and other Chinese producers Equipment Siemens WesTech Danaher/Trojan (UV) ITT/Wedeco (UV) Danaher/Trojan (UV) ITT/Wedeco (UV) Danaher/Trojan (UV) ITT/Wedeco (UV) Consumer Blucher - DT Freudenberg - DT Blucher - DT Mast Carbon - ST Carbon Filter Technology - ST Freudenberg - DT Blucher - DT Freudenberg - DT DT = Different Technology ST = Same Technology |
| CCC FINANCIAL PERFORMANCE |

| CALGON CARBON FINANCIAL PERFORMANCE $MM 2008 2009 2010 Revenue $ 400.3 $ 411.9 $ 482.3 Operating Income $ 57.7(1) $ 53.4(2) $ 46.3(3) Debt $ 9.5 $ 0.0 $ 28.4(4) Total Shareholders' Equity $ 253.3 $ 307.1 $ 343.0 (1) Includes a legal settlement gain of $9.3MM (2) Includes litigation and contingency charges of $1.0MM (3) Includes litigation and contingency charges of $12.0MM (4) Relates to CCJ |
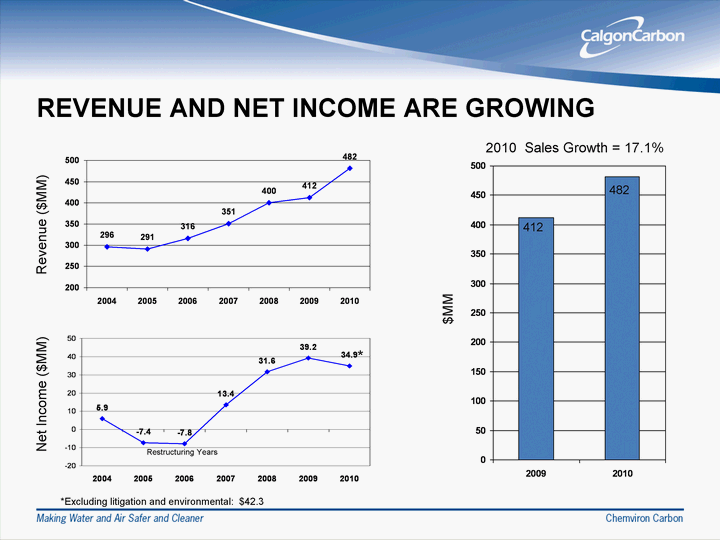
| REVENUE AND NET INCOME ARE GROWING 2004 2005 2006 2007 2008 2009 2010 Revenue 296 291 316 351 400 412 482 2004 2005 2006 2007 2008 2009 2010 Net Income 5.9 -7.4 -7.8 13.4 31.6 39.2 34.9 Revenue ($MM) Net Income ($MM) 2009 2010 East 412 482 412 482 Restructuring Years 2010 Sales Growth = 17.1% $MM *Excluding litigation and environmental: $42.3 * |

| 2010 ACCOMPLISHMENTS Financial Performance Significant improvement in CCC's YOY financial performance - excluding impact of non-recurring legal and environmental expenses ($12MM) YOY improvement in margins of traditional business Growing Opportunity - Disinfection Byproducts Maintained #1 share of market that grew 100% Potable react 13% of municipal water revenue in 2010 |

| 2010 MAJOR ACCOMPLISHMENTS (Cont'd) Ongoing Growth Opportunity - Mercury Removal Developed, tested and commercialized four new Fluepac(r) products Reduce PAC usage by 50% or more Negotiating multi-million dollar contract Four contracts obtained for traditional PAC products; three pending Immediate Opportunity - Reactivation Services "Commitments" from 13 U.S. customers for potable water reactivation Reactivation expansion in Feluy, Belgium New reactivation facility in Suzhou, China Customer "commitments" for Feluy and Suzhou plants exceeds goals |
| 2010 MAJOR ACCOMPLISHMENTS (Cont'd) Global Expansion Expansion in Latin America. Alliance with activated carbon reactivator in Mexico Safety Global, world-class OSHA recordable incidence rate - 0.7 Strategic Growth Three acquisitions: Fleming Zwicky (Carbon and Service) - Europe Hyde Marine (Ballast Water Treatment) - U.S. Increased Joint Venture ownership share from 49% to 80% - Calgon Carbon Japan (Carbon and Service - Asia) |
| ACTIVATED CARBON CAPACITY / DEMAND |

| Source: CCC Note: The Freedonia Report from June 2010 indicates demand at 98% of production capacity in 2009 and at 100% in 2014. |

| GLOBAL VIRGIN ACTIVATED CARBON MARKET Raw Material Source 2010 Annual Demand (MM lbs./yr.) Carbon Form/Shape Major Markets Served Bituminous Coal 956 Granular Powdered Pellets Water/Wastewater Treatment Air Purification Food/Sweetener Respirators Mercury/Fluegas Lignite Coal 99 Powdered Drinking Water Treatment Mercury/Fluegas Coconut Shell 333 Granular Powdered Gold Recovery Cigarette Filters Home Water Filters Respirators Water Treatment Wood Based 419 Powdered Pellets Automotive Pharmaceutical Water Treatment Other Pits/Nutshells 46 Granular Powdered Automotive Water Treatment Total 1,853 Note: CCC manufactures those products highlighted in "green" CCC distributes those products highlighted in "red" |
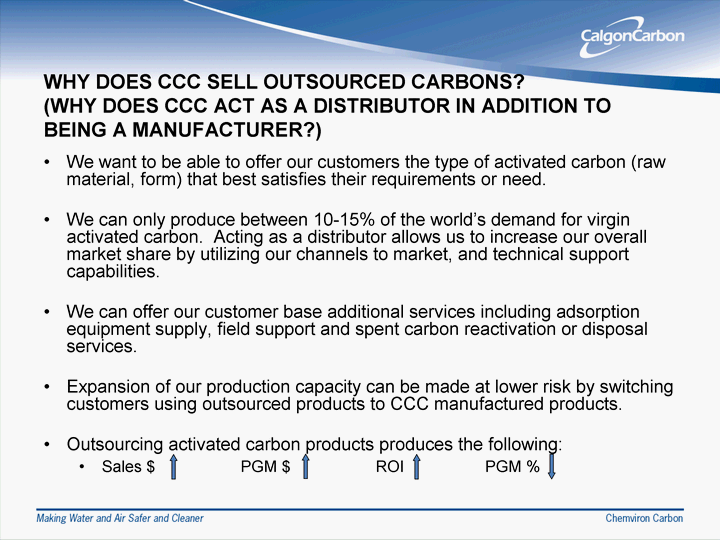
| WHY DOES CCC SELL OUTSOURCED CARBONS? (WHY DOES CCC ACT AS A DISTRIBUTOR IN ADDITION TO BEING A MANUFACTURER?) We want to be able to offer our customers the type of activated carbon (raw material, form) that best satisfies their requirements or need. We can only produce between 10-15% of the world's demand for virgin activated carbon. Acting as a distributor allows us to increase our overall market share by utilizing our channels to market, and technical support capabilities. We can offer our customer base additional services including adsorption equipment supply, field support and spent carbon reactivation or disposal services. Expansion of our production capacity can be made at lower risk by switching customers using outsourced products to CCC manufactured products. Outsourcing activated carbon products produces the following: Sales $ PGM $ ROI PGM % |

| CCC CURENT VIRGIN ACTIVATED CARBON PRODUCTION CAPACITY (MM LBS.) U.S. China Total All GAC 145 22 167 GAC / PAC 117 / 70 22 209 We expect that our capacity will be fully utilized in 2011. |

| EXPANDING PRODUCTION CAPACITY Optimize production of existing plants Additional 30MM lbs. GAC or 70MM lbs. PAC by 2012 Increase virgin GAC availability through customer conversions from virgin GAC to reactivated carbon Capacity improvement projects at existing facilities Options under consideration Expand capacity of Pearl River plant (Mississippi) Build greenfield plant |

| GROWTH OPPORTUNITIES |

| SHORT-TERM SALES GROWTH OPPORTUNITIES ($000's) 2010 2011 Acquisitions: Carbon and Service $40.0 Additional 3 Months for CCJ (Q1) Equipment (Hyde) 5.0 Backlog and New Orders Reactivation: Feluy Expansion - Beginning in Q2 Suzhou Plant - Beginning in Q4 Potable React from Virgin - Throughout the Year Price Increase - Announced Q4 2010 Mercury Removal 13.6 New Products + New Orders Potable Water 9.8 DBP Compliance F/X (3.2) TBD Other, Net 5.2 TBD $70.4 TBD |
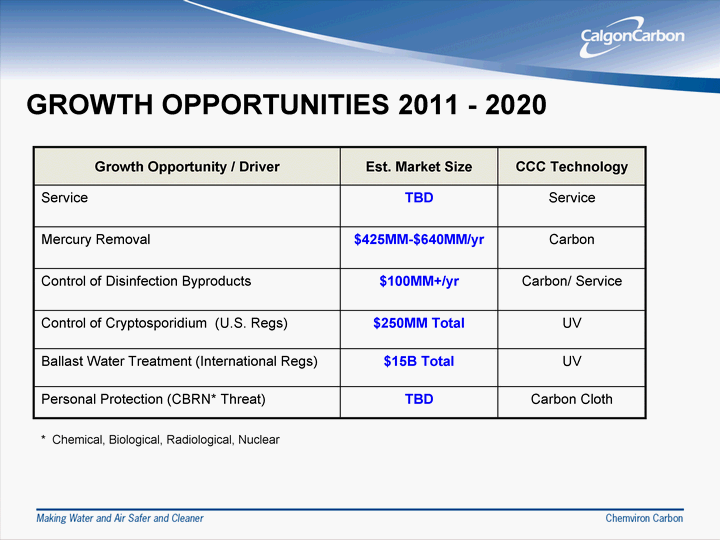
| GROWTH OPPORTUNITIES 2011 - 2020 Growth Opportunity / Driver Est. Market Size CCC Technology Service TBD Service Mercury Removal $425MM-$640MM/yr Carbon Control of Disinfection Byproducts $100MM+/yr Carbon/ Service Control of Cryptosporidium (U.S. Regs) $250MM Total UV Ballast Water Treatment (International Regs) $15B Total UV Personal Protection (CBRN* Threat) TBD Carbon Cloth * Chemical, Biological, Radiological, Nuclear |
| SERVICE |

| 2011: YEAR OF REACTIVATION Remove spent carbon Reactivation Furnace Original Virgin Carbon or Make-up Off-gas treatment Reactivated carbon transported to customer site Contaminants Destroyed Spent carbon transported To Reactivation center |

| REACTIVATION IS ATTRACTIVE ALTERNATIVE TO VIRGIN GAC Advantages to Customer Economic - Lower cost than virgin activated carbon Environmental - Reduces customer disposal requirements and liability Security of supply CCC is market leader (160MM lbs. current capacity) Trouble-free operation Full service from CCC (supply GAC, reactivate spent GAC, supply reactivated GAC and virgin GAC make-up) |

| REACTIVATION IS ATTRACTIVE ALTERNATIVE TO VIRGIN GAC (Cont'd) Advantages to CCC Highest margin business Lower production costs Reduces coal consumption by 90% vs. GAC production Reduces electricity consumption by 40% vs. GAC production Lower capital cost to construct react facility vs. "greenfield" GAC production facility Significant reduction in greenhouse gases vs. GAC production Long-term contracts = predictable earnings stream Increases availability of virgin GAC |

| REACTIVATION STRATEGY - GEOGRAPHIC EXPANSION |

| STATUS OF REACTIVATION EXPANSION Facility Number Lbs. Estimated Start-up Feluy 30 MM 2Q11 Suzhou 15 MM 4Q11 North Tonawanda 13 MM 2012 Subtotal *58 MM Current Capacity 160 MM Total 218 MM * Current customer "commitments" for Feluy and Suzhou >60% of capacity |

| MERCURY REMOVAL |

| MERCURY CONTROL REGULATIONS North America Regulations Under Consideration Date of Enactment Compliance Dates U.S. Coal-Fired Power Plant (Utility MACT) *November 2011 2014 - 2015 Canada Coal-Fired Power Plants (by Province) 2010 and Beyond 2010 and Beyond U.S. Cement Manufacturing August 2010 2013 U.S. Industrial Boilers February 2011 2014 U.S. Gold Mining/Processing December 2010 2013 - 2014 *As proposed by EPA |

| UPDATE: MERCURY REMOVAL FOR U.S. COAL-FIRED POWER PLANTS Proposed Mercury and Toxic Standards Rule (Utility MACT) issued by EPA 3/16/11 Requirements and timing as expected Prevent 91% of mercury contained in coal from release to air 60 day comment period Final Rule to be issued 11/16/11 Compliance: November 2014 with possible one-year extension |

| IMPLICATIONS FOR PAC USAGE UNDER EPA REGULATION* Carbon usage dictated by: Type of coal used by power plant Existing abatement equipment at power plant Other abatement requirements included in Rule: acid gases, non- mercury metals, and organic air toxics Transport Rule 93 GW will require ACI by 2015 (EPA estimate) Validates CCC's estimate of market size: 500MM - 750MM lbs. per year Orders for PAC expected could begin several months before compliance date *CCC estimates unless otherwise noted |

| CCC A LEADER IN MERCURY REMOVAL Added 70MM lbs. PAC capacity for Fluepac(r) carbons - 2009 FluePac PAC products currently used in 18 plants (> 9,000 MW generating capacity) Developing additional capacity via commercial strategy and manufacturing de-bottlenecking - now Awarded four contracts in 2010 Three outstanding bids |

| KEY MARKETING STRATEGY: DEVELOPINGINNOVATIVE PRODUCTS Substantial investment over two years to develop and test enhanced performance products for mercury removal 11 successful full-scale trials at power plants All tests conducted by independent testing services |

| ENHANCED PERFORMANCE CARBONS REDUCE CUSTOMER COSTS Carbon injection rates 50% lower than alternative products Fewer deliveries = lower transportation costs Lower particulate loading to ESP/baghouse Less PAC in fly ash = more "concrete friendly" |
| DISINFECTION BYPRODUCTS |

| WHAT ARE DISINFECTION BYPRODUCTS? Disinfection Byproducts (DBPs) form when disinfectants used to treat drinking water react with Naturally Occurring Materials (NOMs) in the water (e.g.; decomposing plant material). Trihalomethanes Chloroform Bromodichloro Methane NOMs + Cl2 Halo Acetic Acids Dichloroacetic Acid Trichloroacetic Acid |

| WHY ARE DBPs A PROBLEM? DBPs health risks. Cancer (bladder, anal, intestinal) Spontaneous abortion Birth defects Growth delay |
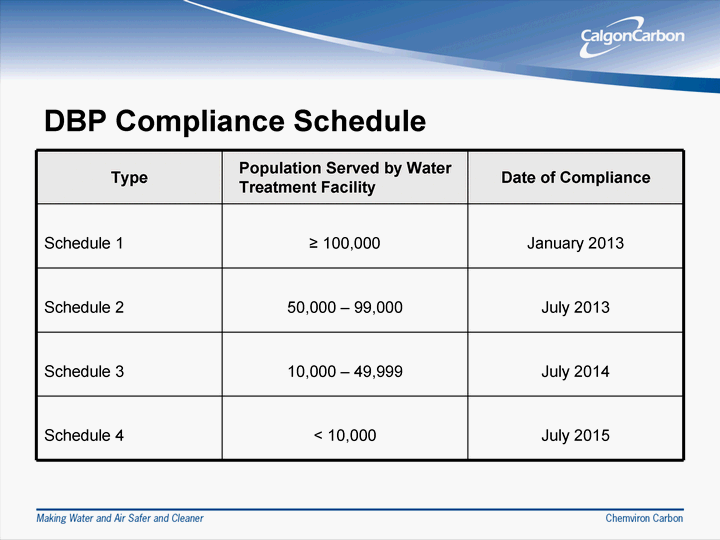
| DBP Compliance Schedule Type Population Served by Water Treatment Facility Date of Compliance Schedule 1 ^ 100,000 January 2013 Schedule 2 50,000 - 99,000 July 2013 Schedule 3 10,000 - 49,999 July 2014 Schedule 4 < 10,000 July 2015 |

| TREATMENT ALTERNATIVES FOR DBP COMPLIANCE Disinfectant Comparison vs. Chlorine Ozone Comparable disinfecting power Higher capital and operating cost Creates a new class of DBPs - No residual Chloramines Less effective disinfectant Comparable low cost Taste and corrosion issues Creates new class of DBPs Chlorine Dioxide Less effective disinfectant Comparable low cost Taste and corrosion issues Creates new class of DBPs Use of Alternative Disinfectant Removal of NOMs prior to Chlorine Addition Technology Technology Membranes Very expensive when used solely for DBP removal Enhanced Coagulation Limited applicability GAC Controls DBPs at very reasonable cost ($5/mo per household) Also: Controls Taste and Odors Protects against newly identify problem contaminants such as pharmaceuticals, endocrine disruptors |

| WHY DBP IS GROWTH OPPORTUNITY FOR CCC? GAC proven solution to prevent and/or eliminate DBPs Market Size: 100+ MM lbs. GAC per year (or equivalent) 2009 = 17MM lbs. 2010 = 32MM lbs. 2015 = 100+ MM lbs. CCC is market leader $35MM in contracts (2008 - 2010) Supports reactivation strategy Driver to convert municipalities to reactivation NSF certifications currently at two plants More virgin GAC available for other markets |

| UV TECHNOLOGIES |
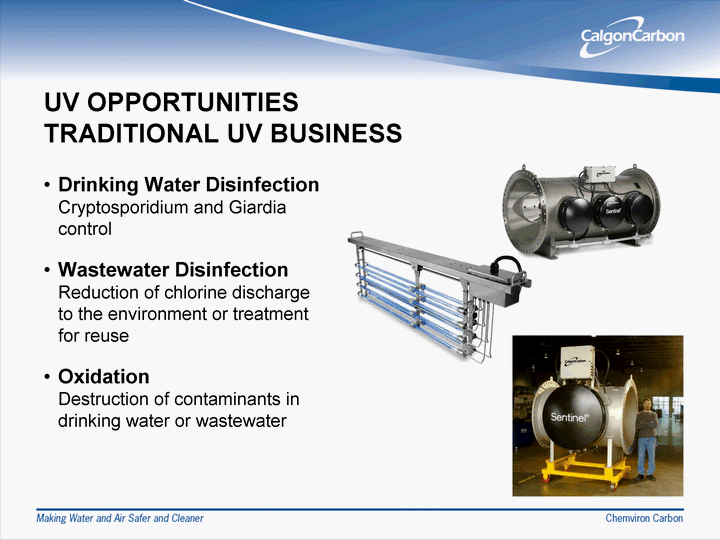
| UV OPPORTUNITIES TRADITIONAL UV BUSINESS Drinking Water Disinfection Cryptosporidium and Giardia control Wastewater Disinfection Reduction of chlorine discharge to the environment or treatment for reuse Oxidation Destruction of contaminants in drinking water or wastewater |

| MARKET DRIVERS - DRINKING WATER UV Disinfection - Regulations Cryptosporidium and Giardia EPA's LT2 Rule and WHO rules Oxidation - Water Scarcity Commonly used for algae taste and odor control Destruction of pollutants and/or pharmaceutical and personal care product residues |

| CCC DRINKING WATER UV VALUE PROPOSITION Sentinel(r): low cost disinfection and oxidation solution Fewer lamps than competition - smaller footprint, lower maintenance costs, and reduced pumping costs Robust components result in lower operating cost Cost competitive versus alternative technologies - ozone and membranes |

| SENTINEL INSTALLATION Indianapolis, Indiana - 48" Sentinels |

| MARKET DRIVERS - WASTEWATER UV |

| CCC WASTEWATER UV VALUE PROPOSITION C3 Series(tm) deliver ease of operation and reduced maintenance Fewer lamps results in smaller footprint, lower maintenance and installation costs C3 500(tm) Delta delivers step improvement in efficiency for reuse applications Patented configuration improves electrical efficiency by dramatically improving dose distribution Significant reduction in lamp count reduces installation cost Sentinel oxidation reactor third-party tested for taste and odor compound destruction |

| UV MARKET - MUNICIPAL WATER APPLICATIONS (dollars in millions) Drinking Water $62 $124 12% Wastewater* $192 $350 11% Reuse $41 $119 19% World Mkt. World Mkt Mkt. CAGR $295 $593 12% 2009 *Non reuse 2015 Projected |

| BALLAST WATER TREATMENT |

| WHY BALLAST WATER TREATMENT? The issue: Transfer of invasive species via ships' ballast water |

| NUMBER OF INVASIVE SPECIES ASSOCIATED WITH BALLAST WATER IS RISING |

| MARKET DRIVERS Regulations In February 2004, the International Maritime Organization (IMO) adopted the International Convention for the Control and Management of Ships' Ballast Water and Sediments (BWMC) Sets framework for legislation for 169 Member States (expected ratification 2011) U.S. Coast Guard finalizing proposed rule: Phase 1 similar to the IMO standard (anticipated April 2011) Phase 2 more stringent. Will be evaluated as an option. |

| MARKET DEMAND 2011 2014 2017 2019 2020 2022 Total Existing {<1,500 CM or >5,000 CM} 10,000 10,000 20,000 Existing {1,500 CM >=<5,000 CM} 5,000 5,000 10,000 New {>5,000 CM - constructed in 2009-2011} 1,200 1,200 2,400 New {>5,000 CM} 1,200 1,200 1,200 1,200 1,200 6,000 New {<5,000 CM} 540 540 540 540 540 540 3,240 Total 540 1,740 6,740 17,940 12,940 1,740 41,640 Estimated number of vessels affected by regulations: Source: CCC |

| BALLAST WATER TREATMENT COMPETITION Competitor Technology Alpha Laval - Sweden Filtration & UV/AOP OceanSaver - Norway De-oxygenation, cavitation, electrolysis Panasia - S. Korea Filtration & UV Optimarin - Norway Filtration & UV Severn Trent - U.S./UK Filtration & Electro- chlorination Techcross - S. Korea Electro-chlorination |

| HYDE GUARDIAN(r) Hyde Guardian Product Description Two stage treatment system Filtration - Modular stacked disk Disinfection - High intensity UV |

| MARKET POSITION - HYDE GUARDIAN IMO Type Approval System Low capital / installation / operating cost Straightforward and fully automated operation Chemical free disinfection Simple and effective filtration More than 80 systems sold |

| GUARDIAN(tm) VALUE PROPOSITION Filtration - Stacked Disk Technology Advantages over other separation technologies Less maintenance than screen filters Flexible footprint Cost competitive Disinfection - UV Advantages No chemicals required Suitable for fresh water applications |
| Leave Nothing But Your Wake |

| COAL AS RAW MATERIAL |

| U.S. COAL UTILIZATION Prime products - metallurgical-grade coal Fluepac(r) products - non-metallurgical grade coal Historical 60% of 2010 coal from one supplier 15-year contract expires 12/31/11 Escalation through life of contract (price increases have offset higher costs) Total U.S. coal expense for 2009 and 2010 has ranged from approximately $26.0MM - $29.0MM |

| COAL STRATEGY - 2012 Strategy Increase number of vendors for metallurgical coal Mitigate sole vendor risk Additional requirements for growth Identified several new coal sources for whom CCC coal business is very attractive Resume negotiating after Australian "coal crisis" is resolved Pass additional costs to customers Global price increases initiated November 2010 |
| WHY IS CCC A DESIRABLE COAL CUSTOMER? Big Sandy plant location in "Coal Country" Coal easily transported from mine to site by truck Coal handling system specially designed to handle a range of coal sizes Reliability CCC's markets do not fluctuate as steel markets do Smaller coal producers eager for steady demand |

| 2010 ACQUISITONS |

| THREE ACQUISITIONS COMPLETED IN Q1 2010 Acquisition/Technology (Location) Purpose Examples of Integration Items Outstanding Zwicky/Carbon and Service (Europe) Growth in Northern Europe Complete Calgon Carbon Japan/Carbon and Service (Japan and Asia) Growth in Japan and Asia Re-locate laboratory Integrate SAP Est. Completion: 3Q11 Hyde Marine/UV (Global) Growth through participation in new ballast water treatment market Expand UV facility Expand UV organization |

| CALGON CARBON JAPAN Predecessor company founded in 1979 Business = Activated Carbon and Reactivation Employees at 3/31/10 = 54 2010 Sales = $67.8MM |

| CALGON CARBON JAPAN PRODUCTS AND SERVICES Products Supplier Major Market(s) Market Share Comment Coal-Based GAC CCC Municipal Water, Municipal Wastewater, Food, Environmental Water, Chemicals #1 GAC from U.S. and China Pellets China DeSox/DeNox (Steel Industry) #1 PAC Outsourced Products Municipal Water (Taste & Odor) Coconut AC Outsourced Products Specialty Reactivation CCJ-owned plant (Japan) Specialty 6.6MM lb. capacity |
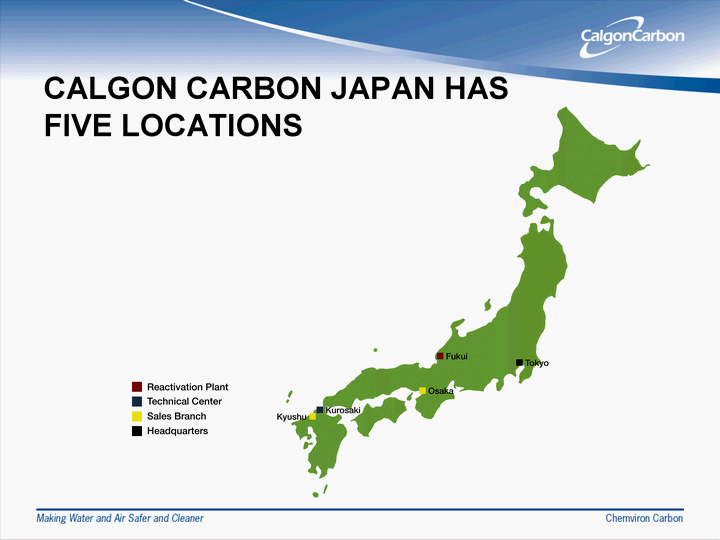
| CALGON CARBON JAPAN HAS FIVE LOCATIONS |
| CCJ COMPETITORS Kuraray Osaka Gas/JEC Imported Carbon Products |
| CCJ UPDATE Integration Scheduled for completion 3Q11 Impact of Earthquake/Tsunami No damage to facilities Slight adverse impact on sales in March Potential business opportunities from Earthquake/Tsunami Activated Carbon adsorbs radioactive iodine Wastewater treatment Longer term: New GAC installations |

| Thank You! |
