Attached files
Table of Contents
UNITED STATES
SECURITIES AND EXCHANGE COMMISSION
Washington, D.C. 20549
FORM 10-K
| þ | ANNUAL REPORT PURSUANT TO SECTION 13 OR 15(d) OF THE SECURITIES EXCHANGE ACT OF 1934 |
For the fiscal year ended December 31, 2010
OR
| ¨ | TRANSITION REPORT PURSUANT TO SECTION 13 OR 15 (d) OF THE SECURITIES EXCHANGE ACT OF 1934 |
For the transition period from to
Commission File Number: 0-26486
Auburn National Bancorporation, Inc.
(Exact name of registrant as specified in charter)
| Delaware | 63-0885779 | |
| (State or other jurisdiction of incorporation) |
(I.R.S. Employer Identification No.) |
| 100 N. Gay Street, Auburn, Alabama | 36830 | |
| (Address of principal executive offices) | (Zip Code) |
Registrant’s telephone number, including area code: (334) 821-9200
Securities registered pursuant to Section 12 (b) of the Act:
| Title of Each Class |
Name of Exchange on which Registered | |
| Common Stock, par value $0.01 | Nasdaq Global Market |
Securities registered to Section 12(g) of the Act: None
Indicate by check mark if the registrant is a well-known seasoned issuer, as defined in Rule 405 of the Securities Act. Yes ¨ No þ
Indicate by check mark if the registrant is not required to file reports pursuant to Section 13 or Section 15(d) of the Act. Yes ¨ No þ
Indicate by check mark whether the registrant (1) has filed all reports required to be filed by Section 13 or 15(d) of the Securities Exchange Act of 1934 during the preceding 12 months (or for such shorter period that the registrant was required to file such reports), and (2) has been subject to such filing requirements for the past 90 days. Yes þ No ¨
Indicate by check mark whether the registrant has submitted electronically and posted on its corporate Website, if any, every Interactive Data File required to be submitted and posted pursuant to Rule 405 of Regulation S-T (§ 232.405 of this chapter) during the preceding 12 months (or for such shorter period that the registrant was required to submit and post such files). YES ¨ NO ¨
Indicate by check mark if disclosure of delinquent filers pursuant to Item 405 of Regulation S-K (Section 229.405 of this chapter) is not contained herein, and will not be contained, to the best of registrant’s knowledge, in definitive proxy or information statements incorporated by reference in Part III of this Form 10-K or any amendment to this Form 10-K. þ
Indicate by check mark whether the registrant is a large accelerated filer, an accelerated filer, a non-accelerated filer, or a smaller reporting company. See the definitions of “large accelerated filer,” “accelerated filer” and “smaller reporting company” in Rule 12b-2 of the Exchange Act. (Check one):
| Large Accelerated filer ¨ | Accelerated filer ¨ | Non-accelerated filer þ | Smaller reporting company ¨ | |||
| (Do not check if a smaller reporting company) | ||||||
Indicate by check mark if the registrant is a shell company (as defined in Rule 12b-2 of the Act). Yes ¨ No þ
State the aggregate market value of the voting and non-voting common equity held by non-affiliates computed by reference to the price at which the common equity was last sold, or the average bid and asked price of such common equity as of the last business day of the registrant’s most recently completed second fiscal quarter: $43,742,280 as of June 30, 2010.
APPLICABLE ONLY TO CORPORATE REGISTRANTS
Indicate the number of shares outstanding of each of the registrant’s classes of common stock, as of the latest practicable date: 3,642,738 shares of common stock as of March 10, 2011.
DOCUMENTS INCORPORATED BY REFERENCE
Portions of the Proxy Statement for the Annual Meeting of Shareholders, scheduled to be held May 10, 2011, are incorporated breference into Part II, Item 5 and Part III of this Form 10-K.
Table of Contents
2
Table of Contents
PART I
SPECIAL CAUTIONARY NOTE REGARDING FORWARD-LOOKING STATEMENTS
Various of the statements made herein under the captions “Management’s Discussion and Analysis of Financial Condition and Results of Operations”, “Quantitative and Qualitative Disclosures about Market Risk”, “Risk Factors” and elsewhere, are “forward-looking statements” within the meaning and protections of Section 27A of the Securities Act of 1933 and Section 21E of the Securities Exchange Act of 1934, as amended (the “Exchange Act”).
Forward-looking statements include statements with respect to our beliefs, plans, objectives, goals, expectations, anticipations, assumptions, estimates, intentions and future performance, and involve known and unknown risks, uncertainties and other factors, which may be beyond our control, and which may cause the actual results, performance or achievements of the Company to be materially different from future results, performance or achievements expressed or implied by such forward-looking statements. You should not expect us to update any forward-looking statements.
All statements other than statements of historical fact are statements that could be forward-looking statements. You can identify these forward-looking statements through our use of words such as “may,” “will,” “anticipate,” “assume,” “should,” “indicate,” “would,” “believe,” “contemplate,” “expect,” “estimate,” “continue,” “further,” “plan,” “point to,” “project,” “could,” “intend,” “target” and other similar words and expressions of the future. These forward-looking statements may not be realized due to a variety of factors, including, without limitation:
| • | the effects of future economic, business and market conditions and changes, domestic and foreign, including seasonality; |
| • | governmental monetary and fiscal policies; |
| • | legislative and regulatory changes, including changes in banking, securities and tax laws, regulations and rules and their application by our regulators, including capital and liquidity requirements, and changes in the scope and cost of FDIC insurance and other coverage; |
| • | changes in accounting policies, rules and practices; |
| • | the risks of changes in interest rates on the levels, composition and costs of deposits, loan demand, and the values and liquidity of loan collateral, securities, and interest sensitive assets and liabilities, and the risks and uncertainty of the amounts realizable and the timing of dispositions of assets by the FDIC where we may have a participation or other interest; |
| • | changes in borrower credit risks and payment behaviors; |
| • | changes in the availability and cost of credit and capital in the financial markets, and the types of instruments that may be included as capital for regulatory purposes; |
| • | changes in the prices, values and sales volumes of residential and commercial real estate; |
| • | the effects of competition from a wide variety of local, regional, national and other providers of financial, investment and insurance services; |
| • | the failure of assumptions and estimates underlying the establishment of reserves for possible loan losses and other estimates; |
| • | the risks of mergers, acquisitions and divestitures, including, without limitation, the related time and costs of implementing such transactions, integrating operations as part of these transactions and possible failures to achieve expected gains, revenue growth and/or expense savings from such transactions; |
| • | changes in technology or products that may be more difficult, costly, or less effective than anticipated; |
3
Table of Contents
| • | the effects of war or other conflicts, acts of terrorism or other catastrophic events that may affect general economic conditions; |
| • | the failure of assumptions and estimates, as well as differences in, and changes to, economic, market and credit conditions, including changes in borrowers’ credit risks and payment behaviors from those used in our loan portfolio stress test; |
| • | the risks that our deferred tax assets could be reduced if estimates of future taxable income from our operations and tax planning strategies are less than currently estimated, and sales of our capital stock could trigger a reduction in the amount of net operating loss carry-forwards that we may be able to utilize for income tax purposes; and |
| • | other factors and risks described under “Risk Factors” herein and in any of our subsequent reports that we make with the Securities and Exchange Commission (the “Commission” or “SEC”) under the Exchange Act. |
All written or oral forward-looking statements that are made by us or are attributable to us are expressly qualified in their entirety by this cautionary notice. We have no obligation and do not undertake to update, revise or correct any of the forward-looking statements after the date of this report, or after the respective dates on which such statements otherwise are made.
| ITEM 1. | BUSINESS |
Auburn National Bancorporation, Inc. (the “Company”) is a bank holding company registered with the Board of Governors of the Federal Reserve System (the “Federal Reserve”) under the Bank Holding Company Act of 1956, as amended (the “BHC Act”). The Company was incorporated in Delaware in 1990, and in 1994 it succeeded its Alabama predecessor as the bank holding company controlling AuburnBank, an Alabama state member bank with its principal office in Auburn, Alabama (the “Bank”). The Company and its predecessor have controlled the Bank since 1984. As a bank holding company, the Company may diversify into a broader range of financial services and other business activities than currently are permitted to the Bank under applicable laws, regulations and rules. The holding company structure also provides greater financial and operating flexibility than is presently permitted to the Bank.
The Bank has operated continuously since 1907 and currently conducts its business primarily in East Alabama, including Lee County and surrounding areas. The Bank has been a member of the Federal Reserve System since April 1995 (the “Charter Conversion”). The Bank’s primary regulators are the Federal Reserve and the Alabama Superintendent of Banks (the “Alabama Superintendent”). The Bank has been a member of the Federal Home Loan Bank of Atlanta (the “FHLB”) since 1991.
General
The Company’s business is conducted primarily through the Bank and its subsidiaries. Although it has no immediate plans to conduct any other business, the Company may engage directly or indirectly in a number of activities that the Federal Reserve has determined to be so closely related to banking or managing or controlling banks as to be a proper incident thereto.
The Company’s principal executive offices are located at 100 N. Gay Street, Auburn, Alabama 36830, and its telephone number at such address is (334) 821-9200. The Company maintains an Internet website at www.auburnbank.com. The Company is not incorporating the information on that website into this report, and the website and the information appearing on the website are not included in, and are not part of, this report. The Company files annual, quarterly and current reports, proxy statements, and other information with the SEC. You may read and copy any document we file with the SEC at the SEC’s public reference room at 100 F Street, N.E., Washington, DC 20549. Please call the SEC at 1-800-SEC-0330 for more information on the operation of the public reference rooms. The SEC maintains an Internet site that contains reports, proxy, and other information Our SEC filings are also available to the public free of charge from the SEC’s web site at www.sec.gov.
The Company directly owns all the common equity in one statutory trust, Auburn National Bancorporation Capital Trust I, an Alabama statutory trust, which was formed in 2003 for the purpose of issuing $7.0 million of floating rate capital securities, with net proceeds being used for general corporate purposes, the purchase of investment securities, and the repurchase of the Company’s outstanding common shares.
Services
The Bank offers checking, savings, transaction deposit accounts and certificates of deposit, and is an active residential mortgage lender in its primary service area (“PSA”). The Bank’s PSA includes the cities of Auburn and Opelika,
4
Table of Contents
Alabama and nearby surrounding areas in East Alabama, primarily in Lee County. The Bank also offers commercial, financial, agricultural, real estate construction and consumer loan products and other financial services. The Bank is one of the largest providers of automated teller services in East Alabama and operates ATM machines in 12 locations in its PSA. The Bank offers Visa® Checkcards, which are debit cards with the Visa logo that work like checks but can be used anywhere Visa is accepted, including ATMs. The Bank’s Visa Checkcards can be used internationally through the Cirrus® network. The Bank offers online banking and bill payment services through its Internet website, www.auburnbank.com.
Competition
The banking business in East Alabama, including Lee County, is highly competitive with respect to loans, deposits, and other financial services. The area is dominated by a number of regional and national banks and bank holding companies that have substantially greater resources, and numerous offices and affiliates operating over wide geographic areas. The Bank competes for deposits, loans and other business with these banks, as well as with credit unions, mortgage companies, insurance companies, and other local and nonlocal financial institutions, including institutions offering services through the mail, by telephone and over the Internet. As more and different kinds of businesses enter the market for financial services, competition from nonbank financial institutions may be expected to intensify further.
Among the advantages that larger financial institutions have over the Bank are their ability to finance extensive advertising campaigns, to diversify their funding sources, and to allocate and diversify their assets among loans and securities of the highest yield in locations with the greatest demand. Many of the major commercial banks or their affiliates operating in the Bank’s service area offer services which are not presently offered directly by the Bank and they may also have substantially higher lending limits than the Bank.
Community banks also have experienced significant competition for deposits from mutual funds, insurance companies and other investment companies and from money center banks’ offerings of high-yield investments and deposits. Certain of these competitors are not subject to the same regulatory restrictions as the Bank.
Selected Economic Data
As described above, the Bank’s PSA is primarily in Lee County. The Bank also has mortgage loan production offices in Mountain Brook, a Birmingham suburb, Valley, Alabama and in Phenix City, Alabama. Lee County’s population was approximately 140,247 in 2010, and has increased approximately 21.9% from 2000 to 2010. In 2008, the Auburn-Opelika Metropolitan Statistical Area (“MSA”), which includes Lee County, was named one of the fastest growing small MSAs in the nation by Forbes Magazine. The largest employers in the area are Auburn University, East Alabama Medical Center, a Wal-Mart Distribution Center, and Briggs & Stratton.
Loans and Loan Concentrations
The Bank makes loans for commercial, financial and agricultural purposes, as well as for real estate mortgages, real estate acquisition, construction and development and consumer purposes. While there are certain risks unique to each type of lending, management believes that there is more risk associated with commercial, real estate acquisition, construction and development, agricultural and consumer lending than with residential real estate mortgage loans. To help manage these risks, the Bank has established underwriting standards used in evaluating each extension of credit on an individual basis, which are substantially similar for each type of loan. These standards include a review of the economic conditions affecting the borrower, the borrower’s financial strength and capacity to repay the debt, the underlying collateral and the borrower’s past credit performance. These standards are used to determine the creditworthiness of the borrower at the time a loan is made and are monitored periodically throughout the life of the loan. See “Legislative and Regulatory Changes” for a discussion of regulatory guidance on commercial real estate lending.
The Bank has loans outstanding to borrowers in all industries within its PSA. Any adverse economic or other conditions affecting these industries would also likely have an adverse effect on the local workforce, other local businesses, and individuals in the community that have entered into loans with the Bank. However, management believes that due to the diversified mix of industries located within the Bank’s PSA, adverse changes in one industry may not necessarily affect other area industries to the same degree or within the same time frame. The Bank’s PSA is also subject to both local and national economic conditions and fluctuations. While most loans are made within the PSA, residential mortgage loans are originated outside the PSA, and the Bank has from time to time purchased loans and loan participations from outside its PSA.
Employees
At December 31, 2010, the Company and its subsidiaries had 155 full-time equivalent employees, including 35 officers.
5
Table of Contents
Statistical Information
Certain statistical information is included in response to Item 7 of this Annual Report on Form 10-K. Certain statistical information is also included in response to Item 6, Item 7A and Item 8 of this Annual Report on Form 10-K.
SUPERVISION AND REGULATION
In addition to the generally applicable state and federal laws governing businesses and employers, the Company and the Bank are extensively regulated under federal and state law applicable to financial institutions. The supervision, regulation and examination of the Company and the Bank and their respective subsidiaries by the bank regulatory agencies are intended primarily for the maintenance of the safety and soundness of financial institutions and the federal deposit insurance system, as well as protection of depositors, rather than holders of Company capital stock and other securities. Any change in applicable law or regulation may have a material effect on the Company’s business. The following discussion is qualified in its entirety by reference to the particular statutory and regulatory provisions referred to below.
Bank Holding Company Regulation
The Company, as a bank holding company, is subject to supervision and regulation by the Federal Reserve under the BHC Act. Bank holding companies are generally limited to the business of banking, managing or controlling banks, and other activities that the Federal Reserve determines to be so closely related to banking or managing or controlling banks as to be a proper incident thereto. The Company is required to file with the Federal Reserve periodic reports and such other information as the Federal Reserve may request. The Federal Reserve examines the Company, and may examine its subsidiaries. The State of Alabama currently does not regulate bank holding companies.
The BHC Act requires prior Federal Reserve approval for, among other things, the acquisition by a bank holding company of direct or indirect ownership or control of more than 5% of the voting shares or substantially all the assets of any bank, or for a merger or consolidation of a bank holding company with another bank holding company. With certain exceptions, the BHC Act prohibits a bank holding company from acquiring direct or indirect ownership or control of voting shares of any company that is not a bank or bank holding company and from engaging directly or indirectly in any activity other than banking or managing or controlling banks or performing services for its authorized subsidiary. A bank holding company may, however, engage in or acquire an interest in a company that engages in activities that the Federal Reserve has determined by regulation or order to be so closely related to banking or managing or controlling banks as to be a proper incident thereto.
The Gramm-Leach-Bliley Act of 1999 (“the GLB Act”) revised the statutory restrictions separating banking activities from certain other financial activities. Under the GLB Act, bank holding companies that are “well-capitalized” and “well-managed,” as defined in Federal Reserve Regulation Y, and whose subsidiary banks have and maintain satisfactory or better ratings under the Community Reinvestment Act of 1977, as amended (the “CRA”), and meet certain other conditions can elect to become “financial holding companies.” Financial holding companies and their subsidiaries are permitted to acquire or engage in previously impermissible activities such as insurance underwriting, securities underwriting, travel agency activities, broad insurance agency activities, merchant banking and other activities that the Federal Reserve determines to be financial in nature or complementary thereto. In addition, under the merchant banking authority added by the GLB Act and Federal Reserve regulations, financial holding companies are authorized to invest in companies that engage in activities that are not financial in nature, as long as the financial holding company makes its investment with the intention of limiting the terms of its investment, does not manage the company on a day-to-day basis, and the investee company does not cross-market with any of the financial holding company’s controlled depository institutions. Financial holding companies continue to be subject to the oversight and supervision of the Federal Reserve, but the GLB Act applies the concept of functional regulation to the activities conducted by subsidiaries. For example, insurance activities would be subject to supervision and regulation by state insurance authorities. While the Company has not elected to become a financial holding company, in order to exercise the broader activity powers provided by the GLB Act, it may elect to do so in the future.
The BHC Act permits acquisitions of banks by bank holding companies, such that the Company and any other bank holding company, whether located in Alabama or elsewhere, may acquire a bank located in any other state, subject to certain deposit-percentage, age of bank charter requirements, and other restrictions. Federal law also permits national and state-chartered banks to branch interstate through acquisitions of banks in other states. Alabama permits interstate branching. Under the Alabama Banking Code, with the prior approval of the Alabama Superintendent, an Alabama bank, may establish, maintain and operate one or more banks in a state other than the State of Alabama pursuant to a merger transaction in which the Alabama bank is the resulting bank. In addition, one or more Alabama banks may enter into a merger transaction with one or more out-of-state banks, and an out-of-state bank resulting from such transaction may maintain and operate the branches of the Alabama bank that participated in such merger. As a result of the Dodd-Frank
6
Table of Contents
Wall Street Reform and Consumer Protection Act of 2010 (the “Dodd-Frank Act”), banks, including Alabama banks, may branch anywhere in the United States.
The Company is a legal entity separate and distinct from the Bank. Various legal limitations restrict the Bank from lending or otherwise supplying funds to the Company. The Company and the Bank are subject to Section 23A of the Federal Reserve Act and Federal Reserve Regulation W thereunder. Section 23A defines “covered transactions,” which include extensions of credit, and limits a bank’s covered transactions with any affiliate to 10% of such bank’s capital and surplus. All covered and exempt transactions between a bank and its affiliates must be on terms and conditions consistent with safe and sound banking practices, and banks and their subsidiaries are prohibited from purchasing low-quality assets from the bank’s affiliates. Finally, Section 23A requires that all of a bank’s extensions of credit to its affiliates be appropriately secured by acceptable collateral, generally United States government or agency securities. The Company and the Bank also are subject to Section 23B of the Federal Reserve Act, which generally requires covered and other transactions among affiliates to be on terms and under circumstances, including credit standards, that are substantially the same as or at least as favorable to the bank or its subsidiary as those prevailing at the time for similar transactions with unaffiliated companies.
Federal Reserve policy, as well as the Federal Deposit Insurance Act, as amended by the Dodd-Frank Act, requires a bank holding company to act as a source of financial and managerial strength to its bank subsidiaries and to take measures to preserve and protect its bank subsidiaries in situations where additional investments in a troubled bank may not otherwise be warranted. In addition, where a bank holding company has more than one bank or thrift subsidiary, each of the bank holding company’s subsidiary depository institutions are responsible for any losses to the Federal Deposit Insurance Corporation (“FDIC”) as a result of an affiliated depository institution’s failure. As a result, a bank holding company may be required to loan money to a bank subsidiary in the form of subordinate capital notes or other instruments which qualify as capital under bank regulatory rules. However, any loans from the holding company to such subsidiary banks likely will be unsecured and subordinated to such bank’s depositors and perhaps to other creditors of the bank.
The Federal Reserve has adopted guidelines for employee compensation to reduce incentives to take undue risks, and the FDIC has proposed further compensation guidelines under the Dodd-Frank Act.
Bank and Bank Subsidiary Regulation
The Bank is subject to supervision, regulation and examination by the Federal Reserve and the Alabama Superintendent, which monitor all areas of the operations of the Bank, including reserves, loans, mortgages, issuances of securities, payment of dividends, establishment of branches, capital adequacy and compliance with laws. The Bank is a member of the FDIC and, as such, its deposits are insured by the FDIC to the maximum extent provided by law. See “FDIC Insurance Assessments.”
Alabama law permits statewide branching by banks. The powers granted to Alabama-chartered banks by state law include certain provisions designed to provide such banks with competitive equality to the powers of national banks.
In 2007, the Alabama legislature amended the Alabama Banking Code to, among other things, strengthen the regulatory and enforcement authority of the Alabama State Banking Department and the Alabama Superintendent of Banks.
The Federal Reserve has adopted the Federal Financial Institutions Examination Council’s (“FFIEC”) updated rating system, which assigns each financial institution a confidential composite “CAMELS” rating based on an evaluation and rating of six essential components of an institution’s financial condition and operations including Capital Adequacy, Asset Quality, Management, Earnings, Liquidity and Sensitivity to market risk, as well as the quality of risk management practices. For most institutions, the FFIEC has indicated that market risk primarily reflects exposures to changes in interest rates. When regulators evaluate this component, consideration is expected to be given to: management’s ability to identify, measure; monitor and control market risk; the institution’s size; the nature and complexity of its activities and its risk profile, and the adequacy of its capital and earnings in relation to its level of market risk exposure. Market risk is rated based upon, but not limited to, an assessment of the sensitivity of the financial institution’s earnings or the economic value of its capital to adverse changes in interest rates, foreign exchange rates, commodity prices, or equity prices; management’s ability to identify, measure, monitor and control exposure to market risk; and the nature and complexity of interest rate risk exposure arising from nontrading positions.
The GLB Act and related regulations requires banks and their affiliated companies to adopt and disclose privacy policies, including policies regarding the sharing of personal information they obtain from customers with third parties. The GLB Act also permits bank subsidiaries to engage in “financial activities” similar to those permitted to financial holding companies.
7
Table of Contents
The FDIC updated its guidance on overdraft programs in late November 2010. Among other things, it requires banks to monitor accounts and to limit the use of overdrafts by customers as a form of short-term, high-cost credit, including, for example, giving customers who overdraw their accounts on more than six occasions where a fee is charged in a rolling 12 month period a reasonable opportunity to choose a less costly alternative and decide whether to continue with fee-based overdraft coverage. It also encourages the placing appropriate daily limits on overdraft fees, and asks banks to consider eliminating overdraft fees for transactions that overdraw an account by a de minimis amount.
Community Reinvestment Act
The Bank is subject to the provisions of the CRA and the Federal Reserve’s regulations thereunder. Under the CRA, all banks and thrifts have a continuing and affirmative obligation, consistent with their safe and sound operation, to help meet the credit needs for their entire communities, including low- and moderate-income neighborhoods. The CRA requires a depository institution’s primary federal regulator, in connection with its examination of the institution, to assess the institution’s record of assessing and meeting the credit needs of the community served by that institution, including low- and moderate-income neighborhoods. The bank regulatory agency’s assessment of the institution’s record is made available to the public. Further, such assessment is required of any institution which has applied to: (i) charter a national bank; (ii) obtain deposit insurance coverage for a newly-chartered institution; (iii) establish a new branch office that accepts deposits; (iv) relocate an office; or (v) merge or consolidate with, or acquire the assets or assume the liabilities of, a federally regulated financial institution. In the case of a bank holding company applying for approval to acquire a bank or other bank holding company, the Federal Reserve will assess the records of each subsidiary depository institution of the applicant bank holding company, and such records may be the basis for denying the application. A less than satisfactory CRA rating will slow, if not preclude branch expansion activities and may prevent a company from becoming a financial holding company.
As a result of the GLB Act, CRA agreements with private parties must be disclosed and annual CRA reports must be made to a bank’s primary federal regulator. No new activities authorized under the GLB Act may be commenced by a bank holding company or by a bank financial subsidiary if any of its bank subsidiaries received less than a “satisfactory” CRA rating in its latest CRA examination. The federal CRA regulations require that evidence of discriminatory, illegal or abusive lending practices be considered in the CRA evaluation.
The Bank is also subject to, among other things, the provisions of the Equal Credit Opportunity Act (the “ECOA”) and the Fair Housing Act (the “FHA”), both of which prohibit discrimination based on race or color, religion, national origin, sex and familial status in any aspect of a consumer or commercial credit or residential real estate transaction. The Department of Justice (the “DOJ”), and the federal bank regulatory agencies have issued an Interagency Policy Statement on Discrimination in Lending in order to provide guidance to financial institutions in determining whether discrimination exists, how the agencies will respond to lending discrimination, and what steps lenders might take to prevent discriminatory lending practices. The DOJ has increased its efforts to prosecute what it regards as violations of the ECOA and FHA.
Other Laws and Regulations
The GLB Act requires banks and their affiliated companies to adopt and disclose privacy policies regarding the sharing of personal information they obtain from their customers with third parties. The GLB Act also permits bank subsidiaries to engage in “financial activities” through subsidiaries similar to those permitted to financial holding companies. See the discussion regarding the GLB Act in “Bank Holding Company Regulation” above.
The International Money Laundering Abatement and Anti-Terrorism Funding Act of 2001 specifies new “know your customer” requirements that obligate financial institutions to take actions to verify the identity of the account holders in connection with opening an account at any U.S. financial institution. Bank regulators are required to consider compliance with this Act’s money laundering provisions in acting upon acquisition and merger proposals, and sanctions for violations of this Act can be imposed in an amount equal to twice the sum involved in the violating transaction, up to $1 million.
Under the Uniting and Strengthening America by Providing Appropriate Tools Required to Intercept and Obstruct Terrorism Act of 2001 (the “USA PATRIOT Act”), financial institutions are subject to prohibitions against specified financial transactions and account relationships as well as to enhanced due diligence and “know your customer” standards in their dealings with foreign financial institutions and foreign customers.
The USA PATRIOT Act requires financial institutions to establish anti-money laundering programs, and sets forth minimum standards for these programs, including:
| • | the development of internal policies, procedures, and controls; |
| • | the designation of a compliance officer; |
| • | an ongoing employee training program; and |
8
Table of Contents
| • | an independent audit function to test the programs. |
The Federal Reserve, the FDIC and the Alabama Superintendent monitor compliance with laws and regulations. Violations of laws and regulations, or other unsafe and unsound practices, may result in these agencies imposing fines or penalties, cease and desist orders, or taking other enforcement actions. Under certain circumstances, these agencies may enforce these remedies directly against officers, directors, employees and others participating in the affairs of a bank or bank holding company.
The Company is also required to comply with various corporate governance and financial reporting requirements under the Sarbanes-Oxley Act of 2002, as well as new rules and regulations adopted by the SEC, the Public Company Accounting Oversight Board and Nasdaq. In particular, the Company is required to report on internal controls as part of its annual report for the year ended December 31, 2010 pursuant to Section 404 of the Sarbanes-Oxley Act. The Company has evaluated its controls, including compliance with the SEC rules on internal controls, and has and expects to continue to spend significant amounts of time and money on compliance with these rules. If the Company’s fails to comply with these internal control rules, it may materially adversely affect its reputation, its ability to obtain the necessary certifications to its financial statements, and the values of its securities. The Company’s assessment of its financial reporting controls as of December 31, 2010 are included elsewhere in this report with no material weaknesses reported.
Payment of Dividends
The Company is a legal entity separate and distinct from the Bank. The Company’s primary source of cash is dividends from the Bank. Prior regulatory approval is required if the total of all dividends declared by a state member bank (such as the Bank) in any calendar year will exceed the sum of such bank’s net profits for the year and its retained net profits for the preceding two calendar years, less any required transfers to surplus.
During 2010, the Bank paid cash dividends of approximately $3.1 million to the Company.
In addition, the Company and the Bank are subject to various general regulatory policies and requirements relating to the payment of dividends, including requirements to maintain adequate capital above regulatory minimums. The appropriate federal and state regulatory authorities are authorized to determine the payment of dividends would be an unsafe or unsound practice, and may prohibit such dividends. The Federal Reserve has indicated that paying dividends that deplete a state member bank’s capital base to an inadequate level would be an unsafe and unsound banking practice. The Federal Reserve has indicated that depository institutions and their holding companies should generally pay dividends out of current year’s operating earnings.
Under a Federal Reserve policy adopted in 2010, the board of directors of a bank holding company must consider different factors to ensure that its dividend level is prudent relative to maintaining a strong financial position, and is not based on overly optimistic earnings scenarios, such as potential events that could affect its ability to pay, while still maintaining a strong financial position. As a general matter, the Federal Reserve has indicated that the board of directors of a bank holding company should consult with the Federal Reserve and eliminate, defer or significantly reduce the bank holding company’s dividends if:
| • | its net income available to shareholders for the past four quarters, net of dividends previously paid during that period, is not sufficient to fully fund the dividends; |
| • | its prospective rate of earnings retention is not consistent with its capital needs and overall current and prospective financial condition; or |
| • | it will not meet, or is in danger of not meeting, its minimum regulatory capital adequacy ratios. |
Capital
The Federal Reserve has risk-based capital guidelines for bank holding companies and state member banks, respectively. These guidelines currently require a minimum ratio of capital to risk-weighted assets (including certain off-balance sheet activities, such as standby letters of credit) of 8%. At least half of the total capital must consist of common equity, retained earnings and a limited amount of qualifying preferred stock, less goodwill and certain core deposit intangibles (“Tier 1 capital”). Voting common equity must be the predominant form of capital. The remainder may consist of non–qualifying preferred stock, qualifying subordinated, perpetual, and/or mandatory convertible debt, term subordinated debt and intermediate term preferred stock, up to 45% of pretax unrealized holding gains on available for sale equity securities with readily determinable market values that are prudently valued, and a limited amount of general loan loss allowance (“Tier 2 capital” and, together with Tier 1 capital, “Total Capital”). The Federal Reserve believes that Tier 1 voting common equity should be the predominant form of capital.
9
Table of Contents
In addition, the federal regulatory agencies have established minimum leverage ratio guidelines for bank holding companies and state member banks, which provide for a minimum leverage ratio of Tier 1 capital to adjusted average quarterly assets (“leverage ratio”) equal to 3%, plus an additional cushion of 1.0% to 2.0%, if the institution has less than the highest regulatory rating. The guidelines also provide that institutions experiencing internal growth or making acquisitions will be expected to maintain strong capital positions substantially above the minimum supervisory levels without significant reliance on intangible assets. Higher capital may be required in individual cases and depending upon a bank holding company’s risk profile. All bank holding companies and banks are expected to hold capital commensurate with the level and nature of their risks including the volume and severity of their problem loans. Lastly, the Federal Reserve’s guidelines indicate that the Federal Reserve will continue to consider a “tangible Tier 1 leverage ratio” (deducting all intangibles) in evaluating proposals for expansion or new activity. The Federal Reserve has not advised the Company or the Bank of any specific minimum leverage ratio or tangible Tier 1 leverage ratio applicable to them. Under Federal Reserve policies, bank holding companies are generally expected to operate with capital positions well above the minimum ratios. The Federal Reserve believes the risk-based ratios do not take into account the quality of capital and interest rate, liquidity, market and operational risks. Accordingly, supervisory assessments of capital adequacy may differ significantly from conclusions based solely on the level of an organization’s risk-based capital ratio.
The Federal Deposit Insurance Corporation Improvement Act of 1991 (“FDICIA”), among other things, requires the federal banking agencies to take “prompt corrective action” regarding depository institutions that do not meet minimum capital requirements. FDICIA establishes five capital tiers: “well capitalized,” “adequately capitalized,” “undercapitalized,” “significantly undercapitalized” and “critically undercapitalized.” A depository institution’s capital tier will depend upon how its capital levels compare to various relevant capital measures and certain other factors, as established by regulation.
All of the federal bank regulatory agencies have adopted regulations establishing relevant capital measures and relevant capital levels implementing the “prompt corrective action” standards. The relevant capital measures are the total capital ratio, Tier 1 risk-based capital ratio and the Tier 1 leverage capital ratio. Under the regulations, a state member bank will be: (i) well capitalized if it has a total risk-based capital ratio of 10% or greater, a Tier 1 capital ratio of 6% or greater, a Tier 1 leverage capital ratio of 5% or greater and is not subject to any written agreement, order, capital directive or prompt corrective action directive by a federal bank regulatory agency to maintain a specific capital level for any capital measure; (ii) “adequately capitalized” if it has a total risk-based capital ratio of 8% or greater, a Tier 1 risk-based capital ratio of 4% or greater, and generally has a Tier 1 leverage capital ratio of 4% or greater; (iii) “undercapitalized” if it has a total risk-based capital ratio of less than 8%, a Tier 1 risk-based capital ratio of less than 4% or generally has a Tier 1 leverage capital ratio of less than 2%; (iv) “significantly undercapitalized” if it has a total risk-based capital ratio of less than 6%, a Tier 1 risk-based capital ratio of less than 3% or a Tier 1 leverage capital ratio of less than 3%; or (v) “critically undercapitalized” if its tangible equity is equal to or less than 2% to total assets. The federal bank regulatory agencies have authority to require additional capital, and have been indicating that higher capital levels may be required in light of current market conditions and risk. In addition, changes may be proposed in the capital rules and new rules regarding liquidity also may be proposed.
The Dodd–Frank Act significantly modified the capital rules applicable to the Company and calls for increased capital, generally.
| • | The generally applicable prompt corrective action leverage and risk-based capital standards (the “generally applicable standards”), including the types of instruments that may be counted as Tier 1 capital, will be applicable on a consolidated basis to depository institution holding companies, as well as their bank and thrift subsidiaries. |
| • | The generally applicable standards in effect prior to the Dodd-Frank Act will be “floors” for the standards to be set by the regulators. |
| • | Bank and thrift holding companies with assets of less than $15 billion as of December 31, 2009, will be permitted to include trust preferred securities that were issued before May 19, 2010, as Tier 1 capital, but trust preferred securities issued by a bank holding company (other than those with assets of less than $500 million) after May 19, 2010, will no longer count as Tier 1 capital. |
| • | The Dodd-Frank Act also requires studies of the use of hybrid instruments as capital, and of “smaller” (consolidated assets of $5 billion or less) financial companies’ access to the capital markets. |
Information concerning the Company’s and the Bank’s regulatory capital ratios at December 31, 2010 is included in “Note 19 to the Consolidated Financial Statements.”
Depository institutions that are no longer “well capitalized” for bank regulatory purposes must receive a waiver from the FDIC prior to accepting or renewing brokered deposits. FDICIA generally prohibits a depository institution from making any capital distribution (including paying dividends) or paying any management fee to its holding company, if the depository institution would thereafter be undercapitalized. Institutions that are “undercapitalized” are subject to growth limitations and are required to submit a capital restoration plan for approval. A depository institution’s parent holding
10
Table of Contents
company must guarantee that the institution will comply with such capital restoration plan. The aggregate liability of the parent holding company is limited to the lesser of 5% of the depository institution’s total assets at the time it became undercapitalized and the amount necessary to bring the institution into compliance with applicable capital standards. If a depository institution fails to submit an acceptable plan, it is treated as if it is significantly undercapitalized. If the controlling holding company fails to fulfill its obligations under FDICIA and files (or has filed against it) a petition under the federal Bankruptcy Code, the claim against the holding company’s capital restoration obligation would be entitled to a priority in such bankruptcy proceeding over third party creditors of the bank holding company. Significantly undercapitalized depository institutions may be subject to a number of requirements and restrictions, including orders to sell sufficient voting stock to become adequately capitalized, requirements to reduce total assets, and cessation of receipt of deposits from correspondent banks. Critically undercapitalized institutions are subject to the appointment of a receiver or conservator. Because the Company and the Bank exceed applicable capital requirements, the respective managements of the Company and the Bank do not believe that the provisions of FDICIA have had or will have any material impact on the Company and the Bank or their respective operations.
Historically, the minimum risk-based capital requirements adopted by the federal banking agencies typically followed the Capital Accord of the Basel Committee on Banking Supervision. On December 16, 2010, the Basel Committee on Banking Supervision (the “Basel Committee”) issued the final text of a comprehensive update of the 2004 Basel II Accord (“Basel III”). On January 13, 2011, the Basel Committee issued an Annex to Basel III containing the final elements of reform to the definition of regulatory capital. Basel III seeks to significantly increase global capital and liquidity requirements, and adds leverage standards or an international basis. Basel III is not itself binding, but rather must be adopted into United States law or regulation before affecting banks supervised in the United States. Moreover, if adopted in the United States, Basil III likely would be subject to a multi-year transition period.
Basel III significantly revises the definitions of regulatory capital. In addition to higher minimum capital standards, Basel III also institutes new capital conservation and countercyclical buffers that could, if fully implemented, will require additional capital.
Basel III also introduces two measures of liquidity based on risk exposure, one based on a 30-day time horizon under an acute liquidity stress scenario and one designed to promote more medium and long-term funding of the assets and activities of banks over a one-year time horizon. Although United States banking regulators are expected to revise their capital standards in light of Basel III, no proposals have been published and the exact terms, effects and timing of the U.S. regulators’ implementation of Basel III cannot be predicted.
FDICIA
FDICIA also directs that each federal bank regulatory agency prescribe standards for depository institutions and depository institution holding companies relating to internal controls, information systems, internal audit systems, loan documentation, credit underwriting, interest rate exposure, asset growth composition, a maximum ratio of classified assets to capital, minimum earnings sufficient to absorb losses, a minimum ratio of market value to book value for publicly traded shares, and such other standards as the federal bank regulatory agencies deem appropriate.
Enforcement Policies and Actions
The Federal Reserve and the Alabama Superintendent monitor compliance with laws and regulations. Violations of laws and regulations, or other unsafe and unsound practices, may result in these agencies imposing fines or penalties, cease and desist orders, or taking other enforcement actions. Under certain circumstances, these agencies may enforce these remedies directly against officers, directors, employees and others participating in the affairs of a bank or bank holding company.
Fiscal and Monetary Policy
Banking is a business that depends on interest rate differentials. In general, the difference between the interest paid by a bank on its deposits and its other borrowings, and the interest received by a bank on its loans and securities holdings, constitutes the major portion of a bank’s earnings. Thus, the earnings and growth of the company and the Bank are subject to the influence of economic conditions generally, both domestic and foreign, and also to the monetary and fiscal policies of the United States and its agencies, particularly the Federal Reserve. The Federal Reserve regulates the supply of money through various means, including open market dealings in United States government securities, the discount rate at which banks may borrow from the Federal Reserve, and the reserve requirements on deposits.
Beginning in 2008, the Federal Reserve took various actions to increase market liquidity and reduce interest rates.
11
Table of Contents
The Federal Reserve lowered its target federal funds rate from 5.25% per annum on August 7, 2007 to 3.00% on January 30, 2008, and finally to 0-0.25% on December 16, 2008, where it remains today. The Federal Reserve’s discount rate, at 5.57% per annum on September 17, 2007, was steadily lowered to 4.75% on January 2, 2008, to 1.25% on October 28, 2008, and to 0.50% on December 16, 2008, where it remained until an increase on February 19, 2010 to 0.75%. The Federal Reserve has extended the term for which banks can borrow from the discount window to up to 90 days; and developed a program, called the Term Auction Facility, under which predetermined amounts of credit are auctioned to depository institutions for terms of up to 84 days. These innovations resulted in large increases in the amount of Federal Reserve credit extended to the banking system.
On April 30, 2010, the Federal Reserve Board amended Regulation D (Reserve Requirements of Depository Institutions) authorizing the Reserve Banks to offer term deposits to institutions certain institutions. Term deposits, which are deposits with specified maturity dates, will be offered through a Term Deposit Facility (TDF). Term deposits will be one of several tools that the Federal Reserve could employ to drain reserves when policymakers judge that it is appropriate to begin moving to a less accommodative stance of monetary policy.
Beginning October 6, 2008, the Federal Reserve began paying interest on depository institutions’ required and excess reserve balances. The payment of interest on excess reserve balances was expected to give the Federal Reserve greater scope to use its lending programs to address conditions in credit markets while also maintaining the federal funds rate close to the target rate established by the Federal Open Market Committee. The Federal Reserve has indicated that it may use this authority to implement a mandatory policy to reduce excess liquidity.
The nature and timing of any changes in such policies and their effect on the Company and the Bank cannot be predicted.
FDIC Insurance Assessments
Substantially all of the Bank’s deposits are insured up to applicable limits by the FDIC. The FDIC assesses an insured depository institution an amount for deposit insurance premiums equal to its deposit insurance assessment base times a risk-based assessment rate. Under the risk-based assessment system in effect during 2010, annualized deposit insurance premium assessments ranged from $.07 to $.775 for each $100 of assessable domestic deposits based on the institution’s risk category. This system will remain in effect for the first quarter of 2011. In 2009, the FDIC required insured depository institutions to prepay, on December 30, 2009, their estimated quarterly assessments for the fourth quarter of 2009, and for all of 2010, 2011, and 2012. The Bank’s FDIC deposit insurance assessment prepayment was $3.5 million. For 2010, our FDIC insurance assessment was approximately $1.0 million. As of December 31, 2010, the Bank had $2.3 million of prepaid FDIC insurance assessment that will be used to off-set FDIC deposit insurance assessments during future periods.
The Dodd-Frank Act requires the FDIC to expand the assessment base from domestic deposits to average consolidated total assets minus average tangible Tier 1 capital, and requires the FDIC’s Deposit Insurance Fund’s (“DIF”) designated reserve ratio as a percentage of insured deposits to increase to 1.35% by September 30, 2020, rather than 1.15% by December 31, 2016, as previously required. To implement these and other changes to the current deposit insurance assessment regime, the FDIC increased its minimum designated reserve ratio for DIF to 2.00%. On February 7, 2011, the FDIC adopted a final rule on FDIC deposit insurance assessments. Under the final rule, which is effective on April 1, 2011, the Bank’s annualized deposit insurance premium assessments would range from $.025 to $.45 for each $100 of its new assessment base, depending on its new risk categories incorporating the Bank’s regulatory rating, ability to withstand asset and funding related stress, and relative magnitude of potential losses to the FDIC in the event of the Bank’s failure.
All FDIC-insured depository institutions have been required through assessments collected by the FDIC to service the annual interest on certain 30-year noncallable bonds issued by the Financing Corporation (“FICO”) to fund losses incurred in the 1980s by the former Federal Savings and Loan Insurance Corporation. For 2010, the annualized FICO assessment rate ranged from $.0104 to $.0106 for each $100 of assessable domestic deposits.
Emergency Economic Stabilization Act of 2008; Small Business Lending Fund
EESA was enacted on October 3, 2008. EESA authorized the Treasury to use up to $700 billion to buy troubled assets, provide capital, or otherwise provide assistance to U.S. banks, thrifts and their holding companies (“TARP”). Pursuant to authority granted under EESA, the Secretary created the TARP Capital Purchase Program (the “CPP”) under which the Treasury will invest up to $250 billion in senior preferred stock of U.S. banks and savings associations or their holding companies. Qualifying financial institutions may issue senior preferred stock with a value equal to not less than 1% of risk-weighted assets and not more than the lesser of $25 billion or 3% of risk-weighted assets. On February 10, 2009, the
12
Table of Contents
Treasury announced the Financial Stability Plan, which earmarked the second $350 billion of TARP funds authorized under the EESA. Among other things, the Financial Stability Plan included a capital assistance program (“CAP”) that will invest in mandatory convertible preferred stock of certain qualifying institutions determined on a basis and through a process similar to the TARP CPP. We have elected not to participate in the TARP CPP and do not anticipate participating in the CAP although we believe we were eligible and would have been approved for the TARP CPP.
On September 27, 2010, the Small Business Jobs Act of 2010 was enacted. The Small Business Lending Fund (the “SBLF”), which is a part thereof, is a $30 billion fund that encourages lending to small businesses by providing Tier 1 capital to qualified community banks with assets of less than $10 billion. On December 21, 2010, the U.S. Treasury published the application form, term sheet and other guidance for participation in the SBLF. Under the terms of the SBLF, the Treasury will purchase shares of senior preferred stock from banks, bank holding companies, and other financial institutions that will qualify as Tier 1 capital for regulatory purposes and rank senior to a participating institution’s common stock. The application deadline for participating in the SBLF is March 31, 2011. Although we expect we could qualify, the Company does not expect to participate in the SBLF.
Lending Practices
The federal bank regulatory agencies released guidance in 2006 on “Concentrations in Commercial Real Estate Lending” (the “Guidance”). The Guidance defines commercial real estate (“CRE”) loans as exposures secured by raw land, land development and construction (including 1-4 family residential construction), multi-family property, and non-farm nonresidential property where the primary or a significant source of repayment is derived from rental income associated with the property (that is, loans for which 50% or more of the source of repayment comes from third party, non-affiliated, rental income) or the proceeds of the sale, refinancing, or permanent financing of this property. Loans to REITs and unsecured loans to developers that closely correlate to the inherent risks in CRE markets would also be considered CRE loans under the Guidance. Loans on owner occupied CRE are generally excluded.
The Guidance requires that appropriate processes be in place to identify, monitor and control risks associated with real estate lending concentrations. This could include enhanced strategic planning, CRE underwriting policies, risk management, internal controls, portfolio stress testing and risk exposure limits as well as appropriately designed compensation and incentive programs. Higher allowances for loan losses and capital levels may also be required. The Guidance is triggered when CRE loan concentrations exceed either:
| • | Total reported loans for construction, land development, and other land of 100% or more of a bank’s total capital; or |
| • | Total reported loans secured by multifamily and nonfarm nonresidential properties and loans for construction, land development, and other land of 300% or more of a bank’s total risk-based capital. |
The Guidance also applies when a bank has a sharp increase in CRE loans or has significant concentrations of CRE secured by a particular property type.
The Guidance did not apply to the Bank’s CRE lending activities at year-end 2010. At December 31, 2010, the Bank had outstanding $47.9 million in construction and land development loans and $134.8 million in total CRE loans (excluding owner occupied), which represent approximately 71.1% and 200.2%, respectively, of the Bank’s total risk-based capital at December 31, 2010. The Company has always had significant exposures to loans secured by commercial real estate due to the nature of its markets and the loan needs of both its retail and commercial customers. The Company believes its long term experience in CRE lending, underwriting policies, internal controls, and other policies currently in place, as well as improvements in its loan and credit monitoring and administration procedures, are generally appropriate to managing its concentrations as required under the Guidance. The federal bank regulators are looking more closely at the risks of various assets and asset categories and risk management, and the need for additional rules regarding liquidity, as well as capital rules that better reflect risk, and implement the Dodd-Frank Act and Basel III.
On February 18, 2009, the Homeowner Affordability and Stability Plan (“HASP”) was announced by President Obama. HASP is intended to support a recovery in the housing market and ensure that workers can continue to pay off their mortgages through the following elements:
• Provide access to low-cost refinancing for responsible homeowners suffering from falling home prices.
• A $75 billion homeowner stability initiative to prevent foreclosure and help responsible families stay in their homes.
• Support low mortgage rates by strengthening confidence in Fannie Mae and Freddie Mac.
13
Table of Contents
The Treasury has issued extensive guidance on the scope and mechanics of various components of HASP. We continue to monitor these developments and assess their potential impact on our business.
The Dodd-Frank Act
The Dodd-Frank Act was signed by the President on July 21, 2011. In addition to the capital, liquidity and FDIC deposit insurance changes discussed above, some of the provisions of the Dodd-Frank Act we believe may affect us are set forth below.
Financial Stability Oversight Council. The Dodd-Frank Act creates the Financial Stability Oversight Council or “FSOC”, which is chaired by the Secretary of the Treasury and composed of expertise from various financial services regulators. The FSOC has responsibility for identifying risks and responding to emerging threats to financial stability.
Executive Compensation. The Dodd-Frank Act provides for a say on pay for shareholders of all public companies. Under the Dodd-Frank Act, each company must give its shareholders the opportunity to vote on the compensation of its executives at least once every three years. The Dodd-Frank Act also adds disclosure and voting requirements for golden parachute compensation that is payable to named executive officers in connection with sale transactions.
The Dodd-Frank Act requires the SEC to issue rules directing the stock exchanges to prohibit listing classes of equity securities if a company’s compensation committee members are not independent. The Dodd-Frank Act also provides that a company’s compensation committee may only select a compensation consultant, legal counsel or other advisor after taking into consideration factors to be identified by the SEC that affect the independence of a compensation consultant, legal counsel or other advisor.
The SEC is required under the Dodd-Frank Act to issue rules obligating companies to disclose in proxy materials for annual meetings of shareholders information that shows the relationship between executive compensation actually paid to their named executive officers and their financial performance, taking into account any change in the value of the shares of a company’s stock and dividends or distributions.
The Dodd-Frank Act provides that the SEC must issue rules directing the stock exchanges to prohibit listing any security of a company unless the company develops and implements a policy providing for disclosure of the policy of the company on incentive-based compensation that is based on financial information required to be reported under the securities laws and that, in the event the company is required to prepare an accounting restatement due to the material noncompliance of the company with any financial reporting requirement under the securities laws, the company will recover from any current or former executive officer of the company who received incentive-based compensation during the three-years period preceding the date on which the company is required to prepare the restatement based on the erroneous data, any exceptional compensation above what would have been paid under the restatement.
The Dodd-Frank Act requires the SEC, by rule, to require that each company disclose in the proxy materials for its annual meetings whether an employee or board member is permitted to purchase financial instruments designed to hedge or offset decreases in the market value of equity securities granted as compensation or otherwise held by the employee or board member.
Section 956 of the Dodd-Frank Act prohibits incentive-based compensation arrangements that encourage inappropriate risk taking by covered financial institutions and are deemed to be excessive, or that may lead to material losses. Since it has less than $1 billion in assets the Company will not be subject currently to rules proposed by the federal bank regulators on February 7, 2011 to implement this provision of the Dodd-Frank Act. However, on June 21, 2010, the federal bank regulators adopted Guidance on Sound Incentive Compensation Policies, which is targeted to larger, more complex organizations than the Company, includes principles that have been applied to smaller organizations similar to the Company. This Guidance applies to incentive compensation to executives as well as employees, who, “individually or a part of a group, have the ability to expose the relevant banking organization to material amounts of risk.” Incentive compensation should:
• Provide employees incentives that appropriately balance risk and reward;
• Be compatible with effective controls and risk-management;
• Be supported by strong corporate governance, including active and effective oversight by the organization’s board of directors.
14
Table of Contents
Other. The Dodd-Frank Act requires approximately 240-300 rulemakings and an estimated 130 studies. Many of the rules have not yet been proposed, and many are complex and require consultation among a variety of agencies, and their effects upon us, whether directly, or indirectly on the regulation and cost imposed on the markets and on others with whom we do business cannot be predicted.
Corporate Governance. The Dodd-Frank Act clarifies that the SEC may, but is not required to, promulgate rules that would require that a company’s proxy materials include a nominee for the board of directors submitted by a shareholder.
The Dodd-Frank Act requires stock exchanges to have rules prohibiting their members from voting securities that they do not beneficially own (unless they have received voting instructions from the beneficial owner) with respect to the election of a member of the board of directors (other than an uncontested election of directors of an investment company registered under the Investment Company Act of 1940), executive compensation or any other significant matter, as determined by the SEC by rule.
Additionally, the Dodd-Frank Act includes a number of provisions that are targeted at improving the reliability of credit ratings. The SEC has been charged with adopting various rules in this regard.
Consumer Issues. The Dodd-Frank Act creates a new Bureau of Consumer Financial Protection (the “CFPB”) that will have the authority to implement regulations pursuant to numerous consumer protection laws and will have supervisory authority, including the power to conduct examination and take enforcement actions, with respect to depository institutions with more than $10 billion in consolidated assets. The federal bank regulators will examine and enforce compliance with the CFPB’s rules for institutions with $10 billion or fewer assets. The CFPB will also have new authority, among other things, to declare acts “unfair, deceptive or abusive” and to require certain consumer disclosures. The Act limits federal preemption of state consumer protection laws, and allows state enforcement of federal consumer protection rules.
Debit Card Interchange Fees. The Dodd-Frank Act provides for a set of new rules requiring that interchange transaction fees for electric debit transactions be “reasonable” and proportional to certain costs associated with processing the transactions. The FRB is given authority to establish standards for assessing whether interchange fees are reasonable and proportional.
Derivatives. The Dodd-Frank Act requires a new regulatory system for the U.S. market for swaps and other over-the counter derivatives, which includes strict capital and margin requirements, central clearing of standardized over-the-counter derivatives, and heightened supervision of over-the-counter derivatives dealers and major market participants. These rules could increase the costs and collateral required to utilize derivatives that we could find useful to reduce our interest rate and other risks.
Interstate Bank Branching. The Dodd-Frank Act includes provisions permitting and FDIC-insured banks to engage in de novo interstate branching.
Other Legislative and Regulatory Changes
Various legislative and regulatory proposals regarding substantial changes in banking, and the regulation of banks, thrifts and other financial institutions, compensation, and the regulation of financial markets and their participants and financial instruments, and the regulators of all of these, as well as the taxation of these entities, are being considered by the executive branch of the federal government, Congress and various state governments, including Alabama. Certain of these proposals, if adopted, could significantly change the regulation or operations of banks and the financial services industry. New regulations and statutes are regularly proposed that contain wide-ranging proposals for altering the structures, regulations and competitive relationships of the nation’s financial institutions.
| ITEM 1A. | RISK FACTORS |
Any of the following risks could harm our business, results of operations and financial condition and an investment in our stock. The risks discussed below also include forward-looking statements, and our actual results may differ substantially from those discussed in these forward-looking statements.
15
Table of Contents
There can be no assurance that recent legislation and administrative actions will improve the long term stability of the U.S. financial system.
Numerous actions by the U.S. Congress, the Federal Reserve, the Treasury, the FDIC, the SEC and other governmental authorities have been taken to address the liquidity and credit crisis that commenced in 2007. These measures include various actions described under “Supervision and Regulation.”
We cannot predict the actual effects of the Dodd-Frank Act, various governmental, regulatory, and fiscal and monetary initiatives, studies and rulemakings which have been and may be enacted, adopted or proposed will have on the financial markets, our competitors, counterparties and customers and on us. The terms and costs of these activities, or the failure of these actions to continue to stabilize the financial markets, asset prices, market liquidity or a worsening of current financial market and economic conditions could materially and adversely affect our business, financial condition, results of operations, and the trading prices of our common stock.
Difficult market conditions have adversely affected our industry.
We are exposed to downturns in the U.S. economy, although the local markets in which we operate in East Alabama have not been as adversely affected as various other areas of the country. Declines in the housing market over the past year, with falling home prices and increasing foreclosures, unemployment and under-employment, have negatively affected the credit performance of mortgage loans and resulted in significant write-downs of asset values by various financial institutions, including government-sponsored entities as well as major commercial and investment banks. This market turmoil and the tightening of available credit have led to increased levels of commercial and consumer delinquencies, reduced consumer confidence, increased market volatility and reductions in business activity. Failures have increased among financial services companies, and various companies, weakened by market conditions, have merged with other institutions. We do not expect that the difficult conditions in the financial markets are likely to improve in the near future, although our business has not been materially affected through December 31, 2010. A worsening of these conditions would likely increase the adverse effects of these difficult market conditions on us and other financial institutions. In particular:
| • | We expect to face further increased regulation of our industry as a result of the Dodd-Frank Act and other initiatives by the U.S. government. Compliance with such regulations may increase our costs, reduce our profitability, and limit our ability to pursue business opportunities. |
| • | Market developments may continue to affect consumer confidence levels and may cause adverse changes in payment behaviors and payment rates, causing increases in delinquencies and default rates, which could affect our charge-offs and provision for credit losses. |
| • | Our ability to assess the creditworthiness of our customers and those we do business with, and to estimate the values of our assets and collateral for loans may be impaired if the models and approaches we use become less predictive of future behaviors, valuations, assumptions or estimates. The process we use to estimate losses inherent in our credit exposure or estimate the value of certain assets requires difficult, subjective, and complex judgments, including forecasts of economic conditions and how these economic predictions might affect the ability of our borrowers to repay their loans or the value of assets. |
| • | Our ability to borrow from and engage in other business with other financial institutions on favorable terms or at all could be adversely affected by further disruptions in the capital markets or other events, including, among other things, deteriorating investor expectations and changes in regulations. |
| • | Our investments in trust preferred securities and securities backed by pools of trust preferred securities, issued by, and loans and loan participations purchased from other financial institutions, and financial institutions in which we have common stock or equity investments could be materially and adversely affected, if these institutions exercise or continue to exercise their rights to defer payment on their trust preferred securities, experience financial difficulties, defer payments on or reduce or eliminate dividends or distributions on their securities that we hold, are subject to regulatory enforcement actions, or fail. |
| • | Failures of other depository institutions in our markets and increasing consolidation of financial services companies as a result of current market conditions could increase our deposits and assets and necessitate additional capital, and could have unexpected adverse effects upon us and our business. |
The soundness of other financial institutions could adversely affect us.
Our ability to engage in routine investment and banking transactions, as well as the quality and values of our investments in equity securities and obligations of other financial institutions, could be adversely affected by the actions, financial condition, and profitability of such other financial institutions with which we deal, including, without limitation, the FHLB and our correspondent banks. At December 31, 2010, the amortized cost of the Bank’s investment in FHLB
16
Table of Contents
common stock, individual issuer trust preferred securities of financial institutions, and pooled trust preferred securities of other financial institutions was approximately $5.2 million, $2.3 million, and $0.2 million, respectively. In 2009, Silverton Bank, N.A., one of our correspondent banks, failed, which had a material adverse effect on our 2009 results of operations. Financial services institutions are interrelated as a result of trading, clearing, counterparty and other relationships. As a result, defaults by, or even rumors or questions about, one or more financial institutions, or the financial services industry generally, have led to market-wide liquidity problems, losses of depositor, creditor or counterparty confidence in certain institutions and could lead to losses or defaults by other institutions, and in some cases, failure of such institutions. Any losses, defaults by, or failures of, the institutions we do business with could adversely affect our holdings of the debt of and equity in, such other institutions, our participation interests in loans originated by other institutions, and our business, including our liquidity, financial condition and earnings.
Nonperforming assets take significant time to resolve and may adversely affect our results of operations and financial condition.
At December 31, 2010, our nonaccrual loans totaled $11.8 million, or 3.16% of the loan portfolio. In addition, we had approximately $8.1 million of other real estate owned at December 31, 2010. Our non-performing assets may adversely affect our net income in various ways. We do not record interest income on non-accrual loans or other real estate owned, thereby adversely affecting our income, and increasing our loan administration costs. Decreases in the value of these assets, or the underlying collateral, or in these borrowers’ performance or financial condition, whether or not due to economic and market conditions beyond our control, could adversely affect our business, results of operations and financial condition. In addition, the resolution of nonperforming assets requires commitments of time from management, which can be detrimental to the performance of their other responsibilities. There can be no assurance that we will not experience further increases in nonperforming loans in the future.
Our allowance for loan losses may prove inadequate or we may be negatively affected by credit risk exposures.
Our business depends on the creditworthiness of our customers. We periodically review our allowance for loan losses for adequacy considering economic conditions and trends, collateral values and credit quality indicators, including past charge-off experience and levels of past due loans and nonperforming assets. We cannot be certain that our allowance for loan losses will be adequate over time to cover credit losses in our portfolio because of unanticipated adverse changes in the economy, market conditions or events adversely affecting specific customers, industries or markets. If the credit quality of our customer base materially decreases, if the risk profile of a market, industry or group of customers changes materially or weaknesses in the real estate markets persist or worsen, borrower payment behaviors change, or if our allowance for loan losses is not adequate, our business, financial condition, including our liquidity and capital, and results of operations could be materially adversely affected.
Weaknesses in the real estate markets, including the secondary market for residential mortgage loans, may continue to adversely affect us.
The Lee County Association of Realtors (“LCAR”) of Alabama reported that the average median residential home price in Lee County for the quarter ended December 31, 2010 was $183,933, an increase of 13.0% from the same quarter a year earlier. Although the reported increase in home values in this market is a positive sign, the number of homes sold during the quarter ended December 31, 2010 declined by 17.2% from the same quarter a year ago. LCAR also reported that residential inventory at December 31, 2010 was 1,248 homes, an increase of 10.7% from a year earlier and the average number of days on the market for the quarter ended December 31, 2010 was 187 days, an increase of 12.7% from the same quarter last year. The effects of ongoing mortgage market challenges, combined with the ongoing correction in residential real estate market prices and reduced levels of home sales, could result in further price reductions in single family home values, further adversely affecting the liquidity and value of collateral securing commercial loans for residential acquisition, construction and development, as well as residential mortgage loans that we hold, mortgage loan originations and gains on sale of mortgage loans. Declining real estate prices and higher interest rates charged on mortgage loans have caused higher delinquencies and losses on certain mortgage loans, generally, particularly second lien mortgages and home equity lines of credit. Significant ongoing disruptions in the secondary market for residential mortgage loans have limited the market for and liquidity of most mortgage loans other than conforming Fannie Mae and Freddie Mac loans. These trends could continue. Continued declines in real estate values, home sales volumes and financial stress on borrowers as a result of job losses, interest rate resets on adjustable rate mortgage loans or other factors could have further adverse effects on borrowers that result in higher delinquencies and greater charge-offs in future periods, which would adversely affect our financial condition, including capital and liquidity, or our results of operations. In the event our allowance for loan losses is insufficient to cover such losses, our earnings, capital and liquidity could be adversely affected. Fannie Mae and Freddie Mac, the largest purchasers of residential mortgage loans remain in federal conservatorship and the timing and effects of their resolution cannot be predicted.
17
Table of Contents
Weaknesses in real estate markets may adversely affect the length of time required to dispose of, and the values realized from the sale of, our other real estate owned. We have no control over the sale of other real estate owned where the FDIC has the controlling interest as a result of the FDIC receivership of Silverton Bank.
Our real estate portfolios are exposed to general weaknesses in the markets and the overall state of the economy.
The declines in home prices, generally, along with the reduced availability of mortgage credit, have resulted in increases in delinquencies and losses in our portfolios of home equity lines and loans, and commercial loans related to residential real estate acquisition, construction and development. Further declines in home prices coupled with an economic recession and associated rises in unemployment levels could drive losses beyond that which is provided for in our allowance for loan losses. In that event, our earnings, financial condition, including our capital and liquidity, could be adversely affected.
Our concentration of commercial real estate loans could result in further increased loan losses.
Commercial real estate or CRE is cyclical and poses risks of possible loss due to concentration levels and risks of the assets being financed, which include loans for the acquisition and development of land and residential construction. We had 56.4% of our portfolio in CRE loans, as defined by the banking regulators, at year-end 2010 and 55.9% at year-end 2009. The banking regulators continue to give CRE lending greater scrutiny, and require banks with higher levels of CRE loans to implement improved underwriting, internal controls, risk management policies and portfolio stress testing, as well as higher levels of allowances for possible losses and capital levels as a result of CRE lending growth and exposures.
We may be contractually obligated to repurchase mortgage loans we sold to third parties on terms unfavorable to us.
As a routine part of its business, the Company originates mortgage loans that it subsequently sells in the secondary market, including to governmental agencies and government sponsored utilities such as Fannie Mae. In connection with the sale of these loans, the Company makes customary representations and warranties, the breach of which could result in the Company being required to repurchase the loan or loans. Furthermore, the amount paid may be greater than the fair value of the loan or loans at the time of the repurchase.
Servicing requirements may change and require us to incur additional costs and risks.
The United States Department of Justice and various state attorney generals are negotiating a proposed settlement with various large residential mortgage loan servicers over practices alleged to improper or unfair to consumers, including foreclosure practices. While the outcome of these negotiations cannot be predicted, they may affect mortgage servicing standards generally, and increase the compliance and other costs of servicing residential mortgage loans. This could reduce our income from servicing these types of loans and make it more difficult and costly to timely realize the value of collateral securing such loans upon a borrower default.
Costs of insuring our deposits remain high.
FDIC insurance premiums increased substantially in 2009 and we expect to pay significantly higher FDIC insurance premiums and guarantee fees in the future. Market developments have significantly depleted the FDIC’s DIF and reduced the FDIC’s ratio of reserves to insured deposits. The FDIC has also required all FDIC-insured institutions to prepay their estimated quarterly risk-based assessments for the fourth quarter of 2009 and for all of 2010, 2011 and 2012, which we paid on December 30, 2009, and has implemented a new risk-based assessment system upon all liabilities (not just insured deposits) and increased the DIF’s designated reserve ratio, as described more fully under “Supervision and Regulation – FDIC Insurance Assessments.”
We have experienced high levels of market volatility.
The capital and credit markets have experienced volatility and disruption since 2007. In some cases, the markets have produced downward pressure on stock prices and credit availability for certain issuers without regard to those issuers’ underlying financial condition or performance. Although market disruptions and volatility have stabilized, there can be no assurance that we will not experience future market conditions and volatility, which may have material adverse effects on our ability to access capital and on our business, financial condition and results of operations.
18
Table of Contents
Our ability to realize our deferred tax assets may be further reduced in the future if our estimates of future taxable income from our operations and tax planning strategies do not support this amount, and the amount of net operating loss carry-forwards realizable for income tax purposes may be reduced under Section 382 of the Internal Revenue Code by sales of our capital securities.
We are allowed to carry-back losses for five years for Federal income tax purposes as otherwise permitted generally under the Worker, Homeownership, and Business Assistance Act of 2009 which was signed into law on November 6, 2009. As of December 31, 2010, we had deferred tax assets of $5.8 million after we recorded $0.5 million of valuation allowance based on management’s estimation of the likelihood of those deferred tax assets being realized. These and future deferred tax assets may be further reduced in the future if our estimates of future taxable income from our operations and tax planning strategies do not support the amount of the deferred tax asset. The amount of net operating loss carry-forwards realizable for income tax purposes potentially could be further reduced under Section 382 of the Internal Revenue Code by a significant offering and/or other sales of our capital securities.
Our future success is dependent on our ability to compete effectively in highly competitive markets.
The East Alabama banking markets in which we do business are highly competitive and our future growth and success will depend on our ability to compete effectively in these markets. We compete for loans, deposits and other financial services in our markets with other local, regional and national commercial banks, thrifts, credit unions, mortgage lenders, and securities and insurance brokerage firms. Many of our competitors offer products and services different from us, and have substantially greater resources, name recognition and market presence than we do, which benefits them in attracting business. In addition, larger competitors may be able to price loans and deposits more aggressively than we are able to and have broader and more diverse customer and geographic bases to draw upon. The Dodd-Frank Act allows others to branch into our markets more easily from other states.
Our success depends on local economic conditions where we operate.
Our success depends on the general economic conditions in the geographic markets we serve in Alabama. The local economic conditions in our markets have a significant effect on our commercial, real estate and construction loans, the ability of borrowers to repay these loans and the value of the collateral securing these loans. Adverse changes in the economic conditions of the Southeastern United States in general, or in one or more of our local markets could negatively affect our results of operations and our profitability.
The oil spill in the Gulf of Mexico could negatively affect our local economies and property values in our coastal markets, which could have an adverse effect on our business or results of operations.
In late April 2010, an oil drilling platform exploded and sank in the Gulf of Mexico off the coast of Louisiana. A sizeable oil spill resulted in the Gulf of Mexico and substantial oil continued to flow daily from the well until it was capped early in August 2010. Clean-up efforts are continuing, but the oil spill has affected and may continue to affect the coast of Alabama and Northwest Florida. The oil spill or future spills could have direct negative effects on tourist and vacation spending in the area, the condition of waterfront properties and adversely affect the rental income from and value of beachfront and coastal properties and numerous industries within our coastal market areas. Although the oil spill has not had a material adverse effect upon us, this or similar events, including hurricanes, tornados and other natural disasters, could have a material adverse effect on our future financial condition, results of operations and stock price.
Our cost of funds may increase as a result of general economic conditions, interest rates, inflation and competitive pressures.
The Federal Reserve has taken aggressive actions to reduce interest rates generally, and the federal government has approved large spending increases. Our cost of funds may increase as a result of general economic conditions, interest rates and competitive pressures, and potential inflation resulting from government deficit spending. Traditionally, we have obtained funds principally through local deposits and borrowings from other institutional lenders. Generally, we believe local deposits are a cheaper and more stable source of funds than borrowings because interest rates paid for local deposits are typically lower than interest rates charged for borrowings from other institutional lenders. See “Fiscal and Monetary Policy”.
19
Table of Contents
The Federal Reserve has acknowledged the possibility of further recession and deflation. Should this occur, the financial services industry and our business could be adversely affected.
The recovery of the U.S. economy continues to progress slowly; consumer confidence remains low, unemployment remains high at 9.4% for December 2010, and the housing market remains an important downside risk, with prices expected to fall through much of this year. Given the concerns about the U.S. economy, U.S. employers continue to approach hiring with caution, and as a result unemployment may continue at high levels. Furthermore, the Federal Open Market Committee communicated in its December 2010 statement that measures of underlying inflation have continued to trend downward. Monetary and fiscal policy measures, including the two-year extension of the existing federal personal income tax rates, may be insufficient to strengthen the recovery, return unemployment to lower levels, and promote long-term stability in the financial markets. Furthermore, a shift from fiscal stimulus efforts to fiscal restraint to reduce government deficits, which could adversely affect the global economy and cause instability in the financial markets. Various governments in Europe have announced budget reductions and/or austerity measures as a means to limit fiscal budget deficits as a result of the economic crisis. Additionally, many state and local governments in the U.S. have also implemented budget reductions. These factors could weaken the U.S. economic recovery. Such economic factors could affect us in a variety of substantial and unpredictable ways, as well as affect our borrowers’ ability and willingness to meet their repayment obligations. These factors could have a material adverse effect on our results of operation and financial condition, liquidity and earnings.
Our profitability and liquidity may be affected by changes in interest rates and economic conditions.
Our profitability depends upon net interest income, which is the difference between interest earned on assets, and interest expense on interest-bearing liabilities, such as deposits and borrowings. Net interest income will be adversely affected if market interest rates change such that the interest we pay on deposits and borrowings increases faster than the interest earned on loans and investments. Interest rates, and consequently our results of operations, are affected by general economic conditions (domestic and foreign) and fiscal and monetary policies. Monetary and fiscal policies may materially affect the level and direction of interest rates. From June 2004 to mid-2006, the Federal Reserve raised the federal funds rate from 1.0% to 5.25%. Since then, beginning in September 2007, the Federal Reserve decreased the federal funds rate by 100 basis points to 4.25% over the remainder of 2007, and has since reduced the target federal funds rate by an additional 400 basis points to zero to 25 basis points in December 2008. Decreases in interest rates generally increase the market values of fixed-rate, interest-bearing investments and loans held, and increase the values of loan sales and mortgage loan activities. However, the production of mortgages and other loans and the value of collateral securing our loans, are dependent on demand within the markets we serve, as well as interest rates. The levels of sales, as well as the values of real estate in our markets, have declined. Declining rates reflect efforts by the Federal Reserve to stimulate the economy, but may not be effective, and thus may negatively affect our results of operations and financial condition, liquidity and earnings.
On February 18, 2010, the Federal Reserve raised the discount rate from 0.5% to 0.75%. Increases in interest rates generally decrease the market values of fixed-rate, interest-bearing investments and loans held and the production of mortgage and other loans and the value of collateral securing our loans, and therefore may adversely affect our liquidity and earnings.
Liquidity risks could affect operations and jeopardize our financial condition.
Liquidity is essential to our business. An inability to raise funds through deposits, borrowings, the sale of loans and other sources could have a substantial negative effect on our liquidity. Our funding sources include federal funds purchased, securities sold under repurchase agreements, core and non-core deposits, and short- and long-term debt. We are also members of the FHLB and the Federal Reserve Bank of Atlanta, where we can obtain advances collateralized with eligible assets. We maintain a portfolio of securities that can be used as a source of liquidity. There are other sources of liquidity available to the Company or the Bank should they be needed, including our ability to acquire additional non-core deposits. We may be able, depending upon market conditions, to issue and sell debt securities, and preferred or common securities in public or private transactions. Our access to funding sources in amounts adequate to finance or capitalize our activities or on terms which are acceptable to us could be impaired by factors that affect us specifically or the financial services industry or economy in general. Our ability to borrow could also be impaired by factors that are not specific to us, such as further disruption in the financial markets or negative views and expectations about the prospects for the financial services industry in light of the recent turmoil faced by banking organizations and the continued deterioration in credit markets, as well as the financial condition, liquidity and profitability of the financial institutions we deal with.
20
Table of Contents
We are subject to extensive regulation that could limit or restrict our activities and adversely affect our earnings.
We and our subsidiaries are regulated by several regulators, including the Federal Reserve, the Alabama Superintendent, the SEC and the FDIC. Our success is affected by state and federal regulations affecting banks and bank holding companies, and the securities markets, and our costs of compliance could adversely affect our earnings. Banking regulations are primarily intended to protect depositors, not shareholders. The financial services industry also is subject to frequent legislative and regulatory changes and proposed changes, the effects of which cannot be predicted. Federal bank regulatory agencies and the Treasury, as well as the Congress and the President, are evaluating the regulation of banks, other financial services providers and the financial markets and such changes, if any, could require us to maintain more capital and liquidity, and restrict our activities, which could adversely affect our growth, profitability and financial condition.
The Dodd-Frank Act substantially changes the regulation of the financial services industry and it could have a material adverse effect upon us.
The recent Dodd-Frank Act provides wide-ranging changes in the way banks and financial services firms generally are regulated and is likely to affect the way we and our customers and counterparties do business with each other. Among other things, it requires increased capital and regulatory oversight for banks and their holding companies, establishes the FSOC, which may cause systemically important financial institutions to be regulated in ways similar to bank holding companies, changes the deposit insurance assessment system, changes responsibilities among regulators, establishes the new CFPB, makes various changes in the securities laws and corporate governance that affect public companies, including us, and also effects changes in the regulation and supervision of insurance companies, the credit rating agencies, and many other things that may affect our business and those with whom we do business. The Dodd-Frank Act also requires numerous studies and regulations to related to its implementation. While we are evaluating the effects of the Dodd-Frank Act, the Dodd-Frank Act, together with implementing the regulations that will be proposed, could have an adverse effect on our costs, and on our results of operation and financial condition, and its various effects cannot be predicted.
Changes in accounting and tax rules applicable to banks could adversely affect our financial conditions and results of operations.
From time to time, the Financial Accounting Standards Board (the “FASB”) and the SEC change the financial accounting and reporting standards that govern the preparation of our financial statements. These changes can be hard to predict and can materially impact how we record and report our financial condition and results of operations. In some cases, we could be required to apply a new or revised standard retroactively, resulting in us restating prior period financial statements.
We are subject to internal control reporting requirements that increase compliance costs and failure to comply timely could adversely affect our reputation and the value of our securities.
We are required to comply with various corporate governance and financial reporting requirements under the Sarbanes-Oxley Act of 2002, as well as rules and regulations adopted by the SEC, the Public Company Accounting Oversight Board and Nasdaq. In particular, we are required to report on internal controls as part of our annual report on Form 10-K pursuant to Section 404 of the Sarbanes-Oxley Act. We expect to continue to spend significant amounts of time and money on compliance with these rules. Our failure to comply with these internal control rules may materially adversely affect our reputation, ability to obtain the necessary certifications to financial statements, and the value of our securities.
We are required to maintain capital to meet regulatory requirements, and if we fail to maintain sufficient capital, our financial condition, liquidity and results of operations would be adversely affected.
We and the Bank must meet regulatory capital requirements and maintain sufficient liquidity, including liquidity at the Company, as well as the Bank. If we fail to meet these capital and other regulatory requirements, our financial condition, liquidity and results of operations would be materially and adversely affected. Our failure to remain “well capitalized” and “well managed” for bank regulatory purposes could affect customer confidence, our ability to grow, our costs of funds and FDIC insurance, our ability to raise brokered deposits, our ability to pay dividends on common stock, our ability to make acquisitions, and we would no longer meet the requirements for becoming a financial holding company.
21
Table of Contents
The Dodd-Frank Act restricts our future issuance of trust preferred securities and cumulative preferred securities as eligible Tier 1 risk-based capital for purposes of the regulatory capital guidelines for bank holding companies.
Under the Dodd-Frank Act, while banks and thrift holding companies with assets of less than $15 billion as of December 31, 2009 will be permitted to include trust preferred securities that were issued before May 19, 2010 as Tier 1 capital, only bank holding companies with assets of less than $500 million will be permitted to continue to issue trust preferred securities and have them count as Tier 1 capital. Accordingly, should we determine it is advisable, or should our regulators require us, based upon new capital or liquidity regulations or otherwise, to raise additional Tier 1 risk-based capital, we would not be able to issue additional trust preferred securities, and would instead have to issue preferred stock or common equity. To the extent we issue new equity, it could result in dilution to our shareholders. To the extent we issue preferred stock, dividends on the preferred stock, unlike distributions paid on trust preferred securities, would not be tax deductible.
We may need to raise additional capital in the future, but that capital may not be available when it is needed or on favorable terms.
We anticipate that our current capital resources will satisfy our capital requirements for the foreseeable future. We may, however, need to raise additional capital to support our growth or currently unanticipated losses, or to meet the needs of our communities, resulting from failures or cutbacks by our competitors, and new capital rules being considered. Our ability to raise additional capital, if needed, will depend, among other things, on conditions in the capital markets at that time, which are currently disrupted and limited by events outside our control, and on our financial performance. If we cannot raise additional capital on acceptable terms when needed, our ability to further expand our operations through internal growth and acquisitions could be limited.
Future acquisitions and expansion activities may disrupt our business, dilute shareholder value and adversely affect our operating results.
We regularly evaluate potential acquisitions and expansion opportunities. To the extent that we grow through acquisitions, we cannot assure you that we will be able to adequately or profitably manage this growth. Acquiring other banks, branches, or businesses, as well as other geographic and product expansion activities, involve various risks including:
| • | risks of unknown or contingent liabilities; |
| • | unanticipated costs and delays; |
| • | risks that acquired new businesses will not perform consistent with our growth and profitability expectations; |
| • | risks of entering new markets or product areas where we have limited experience; |
| • | risks that growth will strain our infrastructure, staff, internal controls and management, which may require additional personnel, time and expenditures; |
| • | exposure to potential asset quality issues with acquired institutions; |
| • | difficulties, expenses and delays of integrating the operations and personnel of acquired institutions; |
| • | potential disruptions to our business; |
| • | possible loss of key employees and customers of acquired institutions; |
| • | potential short-term decreases in profitability; and |
| • | diversion of our management’s time and attention from our existing operations and business. |
We may engage in FDIC-assisted transactions, which could present additional risks to our business.
We may have opportunities to acquire the assets and liabilities of failed banks in FDIC-assisted transactions, which present the risks of acquisitions, although generally, as well as some risks specific to these transactions. Although these FDIC-assisted transactions typically provide for FDIC assistance to an acquiror to mitigate certain risks, which may include loss-sharing, where the FDIC absorbs most losses on covered assets and provides some indemnity, we would be subject to many of the same risks we would face in acquiring another bank in a negotiated transaction, without FDIC assistance, including risks associated with pricing such transactions, the risks of loss of deposits and maintaining customer relationships and failure to realize the anticipated acquisition benefits in the amounts and within the timeframes we expect.
22
Table of Contents
In addition, because these acquisitions provide for limited diligence and negotiation of terms, these transactions may require additional resources and time, servicing acquired problem loans and costs related to integration of personnel and operating systems, the establishment of processes to service acquired assets, require us to raise additional capital, which may be dilutive to our existing shareholders. If we are unable to manage these risks, FDIC-assisted acquisitions could have a material adverse effect on our business, financial condition and results of operations.
Attractive acquisition opportunities may not be available to us in the future.
While we seek continued organic growth, we also may consider the acquisition of other businesses. We expect that other banking and financial companies, many of which have significantly greater resources, will compete with us to acquire financial services businesses. This competition could increase prices for potential acquisitions that we believe are attractive. Also, acquisitions are subject to various regulatory approvals. If we fail to receive the appropriate regulatory approvals, we will not be able to consummate an acquisition that we believe is in our best interests. Among other things, our regulators consider our capital, liquidity, profitability, regulatory compliance and levels of goodwill and intangibles when considering acquisition and expansion proposals. Any acquisition could be dilutive to our earnings and shareholders’ equity per share of our common stock.
Technological changes affect our business, and we may have fewer resources than many competitors to invest in technological improvements.
The financial services industry is undergoing rapid technological changes with frequent introductions of new technology-driven products and services. In addition to serving clients better, the effective use of technology may increase efficiency and may enable financial institutions to reduce costs. Our future success will depend, in part, upon our ability to use technology to provide products and services that provide convenience to customers and to create additional efficiencies in operations. We may need to make significant additional capital investments in technology in the future, and we may not be able to effectively implement new technology-driven products and services. Many competitors have substantially greater resources to invest in technological improvements.
Severe weather, natural disasters, acts of war or terrorism or other external events could have significant effects on our business.
Severe weather, natural disasters, acts of war or terrorism or other external events could have a significant effect on our ability to conduct business. Such events could affect the stability of our deposit base, impair the ability of borrowers to repay outstanding loans, impair the value of collateral securing loans, cause significant property damage, result in loss of revenue and/or cause us to incur additional expenses. Although management has established disaster recovery policies and procedures, the occurrence of any such event could have a material adverse effect on our business, which, in turn, could have a material adverse effect on our financial condition and results of operations.
Our ability to continue to pay dividends to shareholders in the future is subject to profitability, capital, liquidity and regulatory requirements and these limitations may prevent us from paying dividends in the future.
Cash available to pay dividends to our shareholders is derived primarily from dividends paid to the Company by the Bank. The ability of the Bank to pay dividends, as well as our ability to pay dividends to our shareholders, will continue to be subject to and limited by the results of operations of our subsidiaries and our need to maintain appropriate liquidity and capital at all levels of our business consistent with regulatory requirements and the needs of our businesses. See “Supervision and Regulation”.
Our common stock is not traded in large volumes.
Although our common stock is listed for trading in the Nasdaq Global Market, the trading volume in our common stock is less than that of other larger financial services companies. A public trading market having the desired characteristics of depth, liquidity and orderliness depends on the presence in the marketplace of willing buyers and sellers of our common stock at any given time. This also depends on the individual decisions of investors and general economic and market conditions over which we have no control. Given the lower trading volume of our common stock, significant sales of our common stock, or the expectation of these sales, could cause our stock price to fall.
| ITEM 1B. | UNRESOLVED STAFF COMMENTS |
None.
23
Table of Contents
| ITEM 2. | DESCRIPTION OF PROPERTY |
The Bank conducts its business from its main office and nine full-service branches. The Bank also has three mortgage loan offices located in Mountain Brook, Phenix City and Valley, Alabama. The bank owns its main office building, which is located in downtown Auburn, Alabama, and has approximately 16,150 square feet of space. The original building was constructed in 1964, and an addition was completed in 1981. Portions of the building have been renovated to accommodate growth and changes in the Bank’s operational structure and to adapt to technological changes. The main office building has paved parking for 84 vehicles. The main office offers the full line of the Bank’s services and has two ATMs, including one walk-up ATM and one drive-through ATM. The Bank leases a drive-in facility located directly across the street from its main office. This drive-in facility has five drive-through lanes and a walk-up window.
The Bank’s Auburn Kroger branch was opened in August 1988 and is located in the Kroger supermarket in the Corner Village Shopping Center in Auburn, Alabama. The bank leases approximately 500 square feet of space for this branch. In September 2008, the Bank entered into a new lease agreement with the Kroger Corporation for five years with options for two 5-year extensions. This branch offers the full line of the Bank’s deposit and other services including an ATM, except safe deposit boxes.
The Opelika branch is located in Opelika, Alabama. This branch, built in 1991, is owned by the Bank and has approximately 4,000 square feet of space. This branch offers the full line of the Bank’s services and has drive-through windows and an ATM. This branch offers parking for approximately 36 vehicles.
The Bank’s Phenix City branch was opened in August 1998 in the Wal-Mart shopping center in Phenix City, Alabama, about 35 miles southeast of Auburn, Alabama. The bank leases approximately 500 square feet of space in the Wal-Mart. In September 2010, the Bank entered into a new three-year lease agreement. This branch offers the full line of the Bank’s deposit and other services including an ATM, except safe deposit boxes.
The Bank’s Hurtsboro branch was opened in June 1999. This branch is located in Hurtsboro, Alabama, about 35 miles south of Auburn, Alabama. The Bank owns this branch, which has approximately 1,000 square feet of space. The Bank leases the land for this branch from a third party. In June 2009, the Bank exercised its option to extend the lease for another five years. This branch offers the full line of the Bank’s services including safe deposit boxes, a drive-through window and an ATM. This branch offers parking for approximately 12 vehicles, including a handicapped ramp.
The Bank’s Auburn Wal-Mart Supercenter branch was opened in September 2000 inside the Wal-Mart shopping center on the south side of Auburn, Alabama. The lease is for approximately 700 square feet of space in the Wal-Mart. In September 2010, the Bank exercised its option to extend the lease for another five years. This branch offers the full line of the Bank’s deposit and other services, including an ATM, except safe deposit boxes.
The Bank’s Notasulga branch was opened in August 2001. This branch is located in Notasulga, Alabama, about 15 miles south of Auburn, Alabama. This branch is owned by the Bank and has approximately 1,344 square feet of space. The Bank leased the land for this branch from a third party. In May 2009, the Bank’s land lease renewed for another three year term. This branch offers the full line of the Bank’s services including safe deposit boxes and a drive-through window. This branch offers parking for approximately 11 vehicles, including a handicapped ramp.
In November 2002, the Bank opened a mortgage loan office in Phenix City. The mortgage office is located in Phenix City, Alabama, about 35 miles south of Auburn, Alabama. In November 2010, the Bank renewed its lease for another year. This office only offers mortgage loan services.
Also in July 2002, the Bank’s Opelika Wal-Mart Supercenter branch was opened inside the Wal-Mart shopping center in Opelika, Alabama. In July 2007, the Bank exercised its option to extend the lease for another five years. The lease is for approximately 700 square feet of space in the Wal-Mart. This branch offers the full line of the Bank’s deposits and other services including an ATM, except safe deposit boxes.
In September 2004, the Bank opened a mortgage loan office in Valley. The mortgage office is located in Valley, Alabama, about 30 miles northeast of Auburn, Alabama and has approximately 1,650 square feet of space. In January 2010, the Bank extended the lease agreement for another year. This office only offers mortgage loan services.
In December 2006, the Bank opened a mortgage loan office in Mountain Brook, part of the Birmingham, Alabama metropolitan area. This office contains approximately 1,300 square feet of space and is located off of Highway 280. In November 2010, the Bank extended the lease agreement for another year. This office only offers mortgage loan services.
In July 2007, the Bank opened a new branch located in the Kroger supermarket in the TigerTown retail center in Opelika, Alabama. The Bank entered into a lease agreement with the Kroger Corporation for five years with options for two 5-year extensions. The Branch offers the full line of bank deposit and other services including an ATM, except for safe deposit boxes.
24
Table of Contents
During 2006 and 2007, the Company completed purchases of multiple properties that adjoin the Bank’s main office location. These properties were acquired by the Company for purposes of future expansion.
In February 2009, the Bank opened a branch located on Bent Creek Road in Auburn, Alabama. This branch is owned by the Bank and has approximately 4,000 square feet of space. This branch offers the full line of the Bank’s services and has drive-through windows and a drive-up ATM. This branch offers parking for approximately 29 vehicles.
In addition, the Bank leases from the Company approximately 80% of the square footage in the AuburnBank Center (the “Center”), which is located next to the main office. This building, which has approximately 18,000 square feet of space, is also leased to outside third parties. Leases between the Bank and the Company are based on the same terms and conditions as leases to outside third parties leasing space in the same building. The Bank’s data processing activities, as well as other operations, are located in this leased space. The parking lot provides parking for approximately 120 vehicles.
Directly behind the Center is an older home that is also owned by the Company. This building is rented as housing to university students. The rear portion of this property is used as a parking area for approximately 20 vehicles of Bank employees. The Bank also owns a two-story building located directly behind the main office which is currently unoccupied.
The Company owns a commercial office building (the “Hudson Building”) located across the street from the main office in downtown Auburn. The Hudson Building has two floors and a basement which contain approximately 14,500 square feet of leasable space. This building is rented by unaffiliated third-party tenants.
| ITEM 3 | LEGAL PROCEEDINGS |
In the normal course of its business, the Company and the Bank from time to time are involved in legal proceedings. The Company’s management believe there are no pending or threatened legal proceedings that, upon resolution, are expected to have a material adverse effect upon the Company’s or the Bank’s financial condition or results of operations.
We have not incurred any penalties for failing to include on our tax returns any information required to be disclosed under Section 6011 of the Internal Revenue Code of 1988, as amended (the “Code”) with respect to a “reportable transaction” under the Code and that is required to be reported under Code Section 6707A(e).
| ITEM 4. | RESERVED |
25
Table of Contents
PART II
| ITEM 5. | MARKET FOR REGISTRANT’S COMMON EQUITY, RELATED STOCKHOLDER MATTERS AND ISSUER PURCHASES OF EQUITY SECURITIES |
The Company’s Common Stock is listed on the Nasdaq Global Market, under the symbol “AUBN”. As of March 10, 2011, there were approximately 3,642,738 shares of the Company’s Common Stock issued and outstanding, which were held by approximately 431 shareholders of record. The following table sets forth, for the indicated periods, the high and low closing sale prices for the Company’s Common Stock as reported on the Nasdaq Global Market, and the cash dividends paid to shareholders during the indicated periods.
|
Closing
Price |
Cash
Dividends |
|||||||||||
| High | Low | |||||||||||
| 2010 |
||||||||||||
| First Quarter |
$ | 21.93 | $ | 17.61 | $ | 0.195 | ||||||
| Second Quarter |
20.42 | 17.04 | 0.195 | |||||||||
| Third Quarter |
22.00 | 18.08 | 0.195 | |||||||||
| Fourth Quarter |
22.00 | 19.50 | 0.195 | |||||||||
| 2009 |
||||||||||||
| First Quarter |
$ | 26.40 | $ | 18.07 | $ | 0.19 | ||||||
| Second Quarter |
30.00 | 21.75 | 0.19 | |||||||||
| Third Quarter |
29.99 | 22.50 | 0.19 | |||||||||
| Fourth Quarter |
25.98 | 18.93 | 0.19 | |||||||||
| (1) The price information represents actual transactions. |
| |||||||||||
The Company has paid cash dividends on its capital stock since 1985. Prior to this time, the Bank paid cash dividends since its organization in 1907, except during the Depression years of 1932 and 1933. Holders of Common Stock are entitled to receive such dividends as may be declared by the Company’s Board of Directors. The amount and frequency of cash dividends will be determined in the judgment of the Company’s Board of Directors based upon a number of factors, including the Company’s earnings, financial condition, capital requirements and other relevant factors. Company management currently intends to continue its present dividend policies.
The amount of dividends payable by the Bank is limited by law and regulation. The need to maintain adequate capital in the Bank also limits dividends that may be paid to the Company. Federal Reserve policy could restrict future dividends on our Common Stock, depending on our earnings and capital position and likely needs. See “SUPERVISION AND REGULATION – Payment of Dividends” and “MANAGEMENT’S DISCUSSION AND ANALYSIS OF FINANCIAL CONDITION AND RESULTS OF OPERATIONS — CAPITAL ADEQUACY.”
26
Table of Contents
Performance Graph
The following performance graph and related information shall not be deemed “soliciting material” nor to be “filed” with the SEC, nor shall such information be incorporated by reference into any future filings under the Securities Act of 1933 or the Securities Exchange Act of 1934, each as amended, except to the extent we specifically incorporate it by reference into such filing.
The following line-graph compares the cumulative, total return on the Company’s Common Stock from December 31, 2005 to December 31, 2010, with that of the Nasdaq Composite Index and SNL Southeast Bank Index (assuming a $100 investment on December 31, 2005). Cumulative total return represents the change in stock price and the amount of dividends received over the indicated period, assuming the reinvestment of dividends.
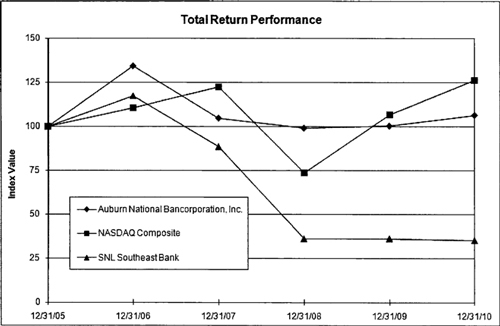
| Period Ending | ||||||||||||||||||||||||
| Index | 12/31/05 | 12/31/06 | 12/31/07 | 12/31/08 | 12/31/09 | 12/31/10 | ||||||||||||||||||
| Auburn National Bancorporation Inc. |
100.00 | 133.94 | 104.50 | 98.86 | 100.15 | 106.20 | ||||||||||||||||||
| Nasdaq Composite Index |
100.00 | 110.39 | 122.15 | 73.32 | 106.57 | 125.91 | ||||||||||||||||||
| SNL Southeast Bank Index |
100.00 | 117.26 | 88.33 | 35.76 | 35.90 | 34.86 | ||||||||||||||||||
27
Table of Contents
ISSUER PURCHASES OF EQUITY SECURITIES
| Period(1) | Total Number of Shares Purchased |
Average Price Paid per Share |
Total Number of Shares Purchased as Part of Publicly Announced Plans or Programs |
Maximum Number of Shares that May Yet Be Purchased Under the Plans or Programs | ||||||||||
|
October 1 – October 31, 2010 |
— | — | — | — | ||||||||||
|
November 1 – November 30, 2010 |
— | — | — | — | ||||||||||
|
December 1 – December 31, 2010 |
— | — | — | — | ||||||||||
| Total |
— | — | — | |||||||||||
(1) Based on trade date, not settlement date.
Securities Authorized for Issuance Under Equity Compensation Plans
See the information included under Part III, Item 12, which is incorporated in response to this item by reference.
| ITEM 6. | SELECTED FINANCIAL DATA |
See Table 2 “Selected Financial Data” and general discussion in Item 7, “MANAGEMENT’S DISCUSSION AND ANALYSIS OF FINANCIAL CONDITION AND RESULTS OF OPERATIONS”.
28
Table of Contents
| ITEM 7. | MANAGEMENT’S DISCUSSION AND ANALYSIS OF FINANCIAL CONDITION AND RESULTS OF OPERATIONS |
The following is a discussion of our financial condition at December 31, 2010 and 2009 and our results of operations for the years ended December 31, 2010, 2009, and 2008. The purpose of this discussion is to provide information about our financial condition and results of operations which is not otherwise apparent from the consolidated financial statements. The following discussion and analysis should be read along with our consolidated financial statements and the related notes included elsewhere herein. In addition, this discussion and analysis contains forward-looking statements, so you should refer to Item 1A, “Risk Factors” and “Special Cautionary Notice Regarding Forward-Looking Statements”.
Certain amounts reported in prior periods have been reclassified to conform to the current-period presentation. These reclassifications had no effect on the Company’s previously reported stockholders’ equity or net earnings during the periods involved.
OVERVIEW
The Company was incorporated in 1990 under the laws of the State of Delaware and became a bank holding company after it acquired its Alabama predecessor, which was a bank holding company established in 1984. The Bank, the Company’s principal subsidiary, is an Alabama state-chartered bank that is a member of the Federal Reserve System and has operated continuously since 1907. Both the Company and the Bank are headquartered in Auburn, Alabama. The Bank conducts its business primarily in East Alabama, including Lee County and surrounding areas. The Bank operates full-service branches in Auburn, Opelika, Hurtsboro and Notasulga, Alabama. In-store branches are located in the Auburn and Opelika Kroger stores, as well as Wal-Mart SuperCenter stores in Auburn, Opelika and Phenix City, Alabama. Mortgage loan offices are located in Phenix City, Valley, and Mountain Brook, Alabama.
Summary of Results of Operations
| Years ended December 31 | ||||||||||||
| (Dollars in thousands, except per share amounts) |
2010 |
2009 |
2008 |
|||||||||
| Net interest income (a) |
$ | 20,664 | $ | 20,448 | $ | 19,231 | ||||||
| Less: tax-equivalent adjustment |
1,765 | 1,633 | 1,361 | |||||||||
| Net interest income (GAAP) |
18,899 | 18,815 | 17,870 | |||||||||
| Noninterest income |
7,266 | 3,132 | 4,202 | |||||||||
| Total revenue |
26,165 | 21,947 | 22,072 | |||||||||
| Provision for loan losses |
3,580 | 5,250 | 870 | |||||||||
| Noninterest expense |
16,441 | 14,633 | 12,542 | |||||||||
| Income tax expense (benefit) |
798 | (340 | ) | 2,023 | ||||||||
| Net earnings |
$ | 5,346 | $ | 2,404 | $ | 6,637 | ||||||
| Basic and diluted earnings per share |
$ | 1.47 | $ | 0.66 | $ | 1.81 | ||||||
| (a) | Tax-equivalent. See “Table 1 - Explanation of Non-GAAP Financial Measures”. |
Financial Summary
The Company’s net earnings were $5.3 million, or $1.47 per share, for the full year 2010, compared to $2.4 million, or $0.66 per share, for the full year 2009.
Tax-equivalent net interest income increased 1% in 2010 from 2009 as improvement in the Company’s net interest margin offset a decrease in total interest earning assets during 2010. Average total interest earning assets decreased 2% in 2010 when compared to 2009 as cash proceeds from securities sold, called, and matured in 2010 were used to reduce short-term borrowings and higher cost long-term debt. Average loans of $377.2 million in 2010 were relatively stable when compared to 2009 despite weak loan demand and a challenging economic environment.
The impact of continuing economic distress, elevated net charge-offs and nonperforming loans were the primary reason for the level of provision expense in 2010. As a result, the Company increased its allowance for loan losses as a percentage of total loans during 2010. The provision for loan losses amounted to $3.6 million in 2010, compared to $5.3 million in 2009. The provision for loan losses declined in 2010 when compared to 2009 due to a decline in net charge-offs and nonperforming loan inflows. Net charge-offs as a percentage of average loans were 0.64% in 2010, compared to 0.84% in 2009.
29
Table of Contents
Noninterest income was $7.3 million in 2010, compared to $3.1 million in 2009. This increase primarily reflects a decline in other-than-temporary impairment charges of approximately $4.5 million in 2010 when compared to 2009.
Noninterest expense was $16.4 million in 2010, compared to $14.6 million in 2009. This increase primarily reflects an increase in net other real estate owned expense of $1.3 million and prepayment penalties of $0.7 million on long-term debt in 2010 when compared to 2009.
Income tax expense for 2010 was $0.8 million, compared to an income tax benefit of $0.3 million in 2009. The effective income tax rate was 12.99% in 2010, compared to an effective income tax benefit rate of 16.47% in 2009. This change was primarily due to a significant increase in the level of earnings before taxes in 2010 when compared to 2009.
In 2010, the Company paid cash dividends of $2.8 million, or $0.78 per share. The Company’s balance sheet remains strong and well capitalized under current regulatory guidelines with a total risk-based capital ratio of 15.82%, a tier one risk-based capital ratio of 14.57%, and a tier one leverage capital ratio of 8.47% at December 31, 2010.
CRITICAL ACCOUNTING POLICIES
The accounting and financial reporting policies of the Company conform with U.S. generally accepted accounting principles, or GAAP, and with general practices within the banking industry. In connection with the application of those principles, we have made judgments and estimates which, in the case of the determination of our allowance for loan losses, our assessment of other-than-temporary impairment, recurring and non-recurring fair value measurements, valuation of other real estate owned, and the valuation of deferred tax assets, were critical to the determination of our financial position and results of operations. Other policies also require subjective judgment and assumptions and may accordingly impact our financial position and results of operations.
Allowance for Loan Losses
The Company assesses the adequacy of its allowance for loan losses prior to the end of each calendar quarter. The level of the allowance is based upon management’s evaluation of the loan portfolios, past loan loss experience, current asset quality trends, known and inherent risks in the portfolio, adverse situations that may affect the borrower’s ability to repay (including the timing of future payment), the estimated value of any underlying collateral, composition of the loan portfolio, economic conditions, industry and peer bank loan quality indications and other pertinent factors, including regulatory recommendations. This evaluation is inherently subjective as it requires material estimates including the amounts and timing of future cash flows expected to be received on impaired loans that may be susceptible to significant change. Loan losses are charged off when management believes that the full collectability of the loan is unlikely. A loan may be partially charged-off after a “confirming event” has occurred which serves to validate that full repayment pursuant to the terms of the loan is unlikely. Allocation of the allowance may be made for specific loans, but the entire allowance is available for any loan that, in management’s judgment, is deemed to be uncollectible.
The Company deems loans impaired when, based on current information and events, it is probable that the Company will be unable to collect all amounts due according to the contractual terms of the loan agreement. Collection of all amounts due according to the contractual terms means that both the interest and principal payments of a loan will be collected as scheduled in the loan agreement.
An impairment allowance is recognized on impaired loans if the fair value of the loan is less than the recorded investment in the loan (recorded investment in the loan is the principal balance plus any accrued interest, net of deferred loan fees or costs and unamortized premium or discount). The impairment is recognized through the allowance. Loans that are impaired are recorded at the present value of expected future cash flows discounted at the loan’s effective interest rate, or if the loan is collateral dependent, impairment measurement is based on the fair value of the collateral, less estimated disposal costs. The Company believes it follows appropriate accounting and regulatory guidance in determining impairment and accrual status of impaired loans.
The level of allowance maintained is believed by management to be adequate to absorb probable losses inherent in the portfolio at the balance sheet date. The allowance is increased by provisions charged to expense and decreased by charge-offs, net of recoveries of amounts previously charged-off.
In assessing the adequacy of the allowance, the Company also considers the results of its ongoing independent loan review process. The Company’s loan review process assists in determining whether there are loans in the portfolio whose credit quality has weakened over time and evaluating the risk characteristics of the loan portfolio. The Company’s loan review process includes the judgment of management, the input from our independent loan reviewers, and reviews that may have been conducted by bank regulatory agencies as part of their examination process. The Company incorporates
30
Table of Contents
loan review results in the determination of whether or not it is probable that we will be able to collect all amounts due according to the contractual terms of a loan.
As part of the Company’s quarterly assessment of the allowance, management divides the loan portfolio into five segments: commercial and industrial loans, construction and land development loans, commercial real estate, residential real estate, and consumer installment loans. The Company analyzes each segment and estimates an allowance allocation for each loan segment.
The allocation of the allowance for loan losses begins with a process of estimating the probable losses inherent for these types of loans. The estimates for these loans are established by category and based on the Company’s internal system of credit risk ratings and historical loss data. The estimated loan loss allocation rate for the Company’s internal system of credit risk grades is based on its experience with similarly graded loans. For loan segments where the Company believes it does not have sufficient historical loss data, the Company may make adjustments based, in part, on loss rates of peer bank groups. At December 31, 2010, the Company adjusted its historical loss rates for the commercial real estate portfolio segment based, in part, on loss rates of peer bank groups. The related adjustments increased the allowance for loan losses for this portfolio segment at December 31, 2010.
The estimated loan loss allocation for all five loan portfolio segments is then adjusted for management’s estimate of probable losses for several “qualitative and environmental” factors. The allocation for qualitative and environmental factors is particularly subjective and does not lend itself to exact mathematical calculation. This amount represents estimated probable inherent credit losses which exist, but have not yet been identified, as of the balance sheet date, and are based upon quarterly trend assessments in delinquent and nonaccrual loans, credit concentration changes, prevailing economic conditions, changes in lending personnel experience, changes in lending policies or procedures and other influencing factors. These qualitative and environmental factors are considered for each of the five loan segments and the allowance allocation, as determined by the processes noted above, is increased or decreased based on the incremental assessment of these factors.
The Company maintains an unallocated amount for inherent factors that cannot be practically assigned to individual loan segments or categories. An example is the imprecision in the overall measurement process.
The Company constantly re-evaluates its practices in determining the allowance for loan losses. During 2010, the Company implemented certain refinements to its allowance for loan losses methodology, specifically the way that historical loss factors are calculated. Prior to September 30, 2010, the Company calculated average losses by loan segment using a rolling 12 quarter historical period. In order to better capture the effect of current economic conditions on the Company’s loan loss experience, the Company calculated average losses by loan segment using a rolling 6 quarter historical period beginning with the quarter ended September 30, 2010. Correspondingly, the Company reduced the level of adjustments made to historical losses for “qualitative and environmental factors” since the updated historical losses were more representative of current economic conditions. The net effect of these changes increased the Company’s calculated allowance for loan loss allocation and the related provision for loan losses by approximately $0.8 million for the quarter ended September 30, 2010.
Assessment for Other-Than-Temporary Impairment of Securities
On a quarterly basis, management makes an assessment to determine whether there have been events or economic circumstances to indicate that a security on which there is an unrealized loss is other-than-temporarily impaired. For equity securities with an unrealized loss, the Company considers many factors including the severity and duration of the impairment; the intent and ability of the Company to hold the security for a period of time sufficient for a recovery in value; and recent events specific to the issuer or industry. Equity securities on which there is an unrealized loss that is deemed to be other-than-temporary are written down to fair value with the write-down recorded as a realized loss in securities gains (losses).
For debt securities with an unrealized loss, an other-than-temporary impairment write-down is triggered when (1) the Company has the intent to sell a debt security, (2) it is more likely than not that the entity will be required to sell the debt security before recovery of its amortized cost basis, or (3) the entity does not expect to recover the entire amortized cost basis of the debt security. If the Company has the intent to sell a debt security or if it is more likely than not that that it will be required to sell the debt security before recovery, the other-than-temporary write-down is equal to the entire difference between the debt security’s amortized cost and its fair value. If the Company does not intend to sell the security or it is not more likely than not that it will be required to sell the security before recovery, the other-than-temporary impairment write-down is separated into the amount that is credit related (credit loss component) and the amount due to all other factors. The credit loss component is recognized in earnings, as a realized loss in securities gains (losses), and is the difference between the security’s amortized cost basis and the present value of its expected future cash flows. The
31
Table of Contents
remaining difference between the security’s fair value and the present value of future expected cash flows is due to factors that are not credit related and is recognized in other comprehensive income, net of applicable taxes.
The Company assesses impairment for pooled trust preferred securities using a cash flow model. The key assumptions include default probabilities of the underlying collateral and recoveries on collateral defaults. These assumptions may have a significant effect on the determination of the present value of expected future cash flows and the resulting amount of other-than-temporary impairment. As such, the use of different models and assumptions, as well as changes in market conditions, could result in materially different net earnings and retained earnings results.
Fair Value Determination
GAAP requires management to value and present at fair value certain of the Company’s assets and liabilities, including investments classified as available-for-sale and derivatives. FASB ASC 820, Fair Value Measurements and Disclosures, which defines fair value, establishes a framework for measuring fair value in U.S. generally accepted accounting principles and expands disclosures about fair value measurements. For more information regarding fair value measurements and disclosures, please refer to Note 16 of the consolidated financial statements that accompany this report.
Fair values are based on market prices when available. However, some of the Company’s transactions lack an available trading market characterized by frequent transactions between a willing buyer and seller. In these cases, such values are estimated using pricing models that use discounted cash flows and other pricing techniques. Pricing models and their underlying assumptions are based upon management’s best estimates for appropriate discount rates, default rates, prepayments, market volatility and other factors, taking into account current observable market data and experience.
These assumptions may have a significant effect on the reported fair values of assets and liabilities and the related income and expense. As such, the use of different models and assumptions, as well as changes in market conditions, could result in materially different net earnings and retained earnings results.
Other Real Estate Owned
Other real estate owned (“OREO”), consists of properties obtained through foreclosure or in satisfaction of loans, is reported at the lower of cost or fair value, less estimated costs to sell at the date acquired with any loss recognized as a charge-off through the allowance for loan losses. Additional OREO losses for subsequent valuation adjustments are determined on a specific property basis and are included as a component of other noninterest expense along with holding costs. Any gains or losses on disposal realized at the time of disposal are also reflected in noninterest expense. Significant judgments and complex estimates are required in estimating the fair value of other real estate owned, and the period of time within which such estimates can be considered current is significantly shortened during periods of market volatility, as experienced during 2010. As a result, the net proceeds realized from sales transactions could differ significantly from appraisals, comparable sales, and other estimates used to determine the fair value of other real estate owned.
Deferred Tax Asset Valuation
A valuation allowance is recognized for a deferred tax asset if, based on the weight of available evidence, it is more-likely-than-not that some portion or the entire deferred tax asset will not be realized. The ultimate realization of deferred tax assets is dependent upon the generation of future taxable income during the periods in which those temporary differences become deductible. Management considers the scheduled reversal of deferred tax liabilities, projected future taxable income and tax planning strategies in making this assessment. Based upon the level of taxable income over the last three years and projections for future taxable income over the periods in which the deferred tax assets are deductible, management believes it is more likely than not that the we will realize the benefits of these deductible differences at December 31, 2010. The amount of the deferred tax assets considered realizable, however, could be reduced in the near term if estimates of future taxable income during the future periods are reduced.
32
Table of Contents
Average Balance Sheet and Interest Rates
| Years ended December 31 | ||||||||||||||||||||||||
|
2010 |
2009 |
2008 |
||||||||||||||||||||||
| (Dollars in thousands) | Average
Balance |
Yield/
Rate |
Average
Balance |
Yield/
Rate |
Average
Balance |
Yield/
Rate |
||||||||||||||||||
| Loans and loans held for sale |
$ | 380,552 | 5.73% | $ | 380,434 | 5.75% | $ | 347,176 | 6.47% | |||||||||||||||
| Securities - taxable |
246,610 | 3.33% | 269,266 | 4.37% | 258,160 | 5.11% | ||||||||||||||||||
| Securities - tax-exempt |
81,256 | 6.39% | 74,794 | 6.42% | 62,801 | 6.37% | ||||||||||||||||||
| Total securities |
327,866 | 4.09% | 344,060 | 4.82% | 320,961 | 5.36% | ||||||||||||||||||
| Federal funds sold |
13,984 | 0.21% | 10,138 | 0.23% | 3,197 | 1.91% | ||||||||||||||||||
| Interest bearing bank deposits |
1,076 | 0.09% | 1,135 | 0.09% | 511 | 2.74% | ||||||||||||||||||
| Total interest-earning assets |
723,478 | 4.87% | 735,767 | 5.23% | 671,845 | 5.91% | ||||||||||||||||||
| Deposits: |
||||||||||||||||||||||||
| NOW |
88,070 | 0.69% | 90,794 | 0.95% | 75,461 | 2.08% | ||||||||||||||||||
| Savings and money market |
117,725 | 1.04% | 93,484 | 1.13% | 103,379 | 1.76% | ||||||||||||||||||
| Certificates of deposits less than $100,000 |
113,912 | 2.42% | 112,894 | 3.32% | 95,830 | 4.33% | ||||||||||||||||||
| Certificates of deposits and other time deposits of $100,000 or more |
197,387 | 2.76% | 221,028 | 3.39% | 172,592 | 4.37% | ||||||||||||||||||
| Total interest-bearing deposits |
517,094 | 1.94% | 518,200 | 2.54% | 447,262 | 3.37% | ||||||||||||||||||
| Short-term borrowings |
3,530 | 0.65% | 10,790 | 0.51% | 16,604 | 1.95% | ||||||||||||||||||
| Long-term debt |
112,312 | 4.02% | 120,248 | 4.01% | 123,108 | 4.14% | ||||||||||||||||||
| Total interest-bearing liabilities |
632,936 | 2.30% | 649,238 | 2.78% | 586,974 | 3.49% | ||||||||||||||||||
| Net interest income and margin (a) |
$ | 20,664 | 2.86% | $ | 20,448 | 2.78% | $ | 19,231 | 2.86% | |||||||||||||||
(a) Tax-equivalent. See “Table 1 - Explanation of Non-GAAP Financial Measures”.
RESULTS OF OPERATIONS
Net Interest Income and Margin
2010 vs. 2009 comparison
Tax-equivalent net interest income increased 1% in 2010 from 2009 as improvement in the Company’s net interest margin offset the decrease in total interest earning assets.
The tax-equivalent yield on total interest earning assets decreased 36 basis points in 2010 from 2009 to 4.87%. This decrease was primarily due to a decline of 104 basis points in the yield on taxable securities to 3.33%.
The cost of total interest-bearing liabilities decreased 48 basis points in 2010 from 2009, to 2.30%. This decrease was primarily due to a 60 basis point decrease in the cost of total interest-bearing deposits to 1.94%.
2009 vs. 2008 comparison
Tax-equivalent net interest income increased 6% in 2009 from 2008 due to balance sheet growth. Net interest margin decreased 8 basis points to 2.78%.
The tax-equivalent yield on total interest earning assets decreased 68 basis points in 2009 from 2008 to 5.23%. This decrease was comprised of a 72 basis point decrease in the yield on loans and loans held for sale to 5.75% and a 54 basis point decrease in the tax-equivalent yield on total securities to 4.82%.
The cost of total interest-bearing liabilities decreased 71 basis points in 2009 from 2008, to 2.78%. This decrease was comprised of an 83 basis point increase in the cost of total interest-bearing deposits to 2.54%, a 144 basis point decrease in the cost of short-term borrowings to 0.51% and a 13 basis point decrease in the cost of long-term debt to 4.01%.
33
Table of Contents
Provision for Loan Losses
The provision for loan losses represents a charge to earnings necessary to provide an allowance for loan losses that, in management’s evaluation, should be adequate to provide coverage for the probable losses on outstanding loans. The provision for loan losses amounted to $3.6 million, $5.3 million, and $0.9 million for the years ended December 31, 2010, 2009 and 2008, respectively.
The impact of continuing economic distress, elevated net charge-offs and nonperforming loans were the primary reason for the level of provision expense in 2010. As a result, the Company increased its allowance for loan losses as percentage of total loans during 2010. The provision for loan losses declined in 2010 when compared to 2009 due to a decline in net charge-offs and nonperforming loan inflows. Also, the provision for loan losses in 2009 was impacted by $2.8 million in impairments related to the deterioration of two construction and land development loans.
Based upon its assessment of the loan portfolio, management adjusts the allowance for loan losses to an amount it believes should be appropriate to adequately cover probable losses in the loan portfolio. The Company’s allowance for loan losses to total loans increased to 2.05% at December 31, 2010 from 1.73% at December 31, 2009. Based upon our evaluation of the loan portfolio, management believes the allowance for loan losses to be adequate to absorb our estimate of probable losses existing in the loan portfolio at December 31, 2010. While our policies and procedures used to estimate the allowance for loan losses, as well as the resultant provision for loan losses charged to operations, are believed adequate by management and are reviewed from time to time by our regulators, they are necessarily approximate and imprecise. There exist factors beyond our control, such as conditions in the local and national economy, a local real estate market or particular industry conditions which may negatively impact, materially, our asset quality and the adequacy of our allowance for loan losses and, thus, the resulting provision for loan losses.
Noninterest Income
| Years ended December 31 | ||||||||||||
| (Dollars in thousands) |
2010 |
2009 |
2008 |
|||||||||
| Service charges on deposit accounts |
$ | 1,280 | $ | 1,243 | $ | 1,252 | ||||||
| Mortgage lending |
3,042 | 4,048 | 1,694 | |||||||||
| Bank-owned life insurance |
452 | 424 | 470 | |||||||||
| Securities gains (losses), net |
1,423 | (3,703) | (1,168) | |||||||||
| Other |
1,069 | 1,120 | 1,954 | |||||||||
| Total noninterest income |
$ | 7,266 | $ | 3,132 | $ | 4,202 | ||||||
The Company’s income from mortgage lending is primarily attributable to the (1) origination and sale of new mortgage loans and (2) servicing of mortgage loans. Origination income is comprised of gains or losses from the sale of the mortgage loans originated, origination fees, underwriting fees and other fees associated with the origination of loans. The Company’s normal practice is to originate mortgage loans for sale in the secondary market and to either release or retain the associated mortgage servicing rights (“MSRs”) when the loan is sold. MSRs are recognized based on the fair value of the servicing right on the date the corresponding mortgage loan is sold. Subsequent to the date of transfer, the Company has elected to measure its MSRs under the amortization method. Servicing fee income is reported net of any related amortization expense.
The following table presents a breakdown of the Company’s mortgage lending income for 2010, 2009 and 2008:
| Years ended December 31 | ||||||||||||
| (Dollars in thousands) |
2010 |
2009 |
2008 |
|||||||||
| Origination income |
$ | 2,691 | $ | 3,701 | $ | 1,375 | ||||||
| Servicing fees, net |
351 | 347 | 319 | |||||||||
| Total mortgage lending income |
$ | 3,042 | $ | 4,048 | $ | 1,694 | ||||||
2010 vs. 2009 comparison
Mortgage lending income was $3.0 million in 2010, compared to $4.0 million in 2009. A significant decline in the level of mortgage refinance activity during 2010 when compared to the record levels experienced during 2009 contributed to the decrease in mortgage lending income. The Company’s income from mortgage lending typically fluctuates as mortgage interest rates change and is primarily attributable to origination and sale of new mortgage loans.
34
Table of Contents
The net gain on securities was $1.4 million in 2010, compared to a net loss of $3.7 million in 2009. Gross realized gains of $3.5 million in 2010 were offset by gross realized losses of $2.1 million. Gross realized losses in 2010 primarily related to other-than-temporary impairment charges for trust preferred securities and corporate debt securities. Gross realized losses of $6.6 million in 2009 primarily related to other-than-temporary impairment charges for trust preferred securities and an investment in the common stock of Silverton Financial Services, Inc. These losses were offset by gross realized gains of $2.9 million during the same period.
2009 vs. 2008 comparison
Mortgage lending income was $4.0 million in 2009, compared to $1.7 million in 2008. Significantly increased volume and better pricing during 2009 when compared to 2008 contributed to higher mortgage lending income during 2009.
The total net loss on securities was $3.7 million in 2009, compared to $1.2 million in 2008. Gross realized losses of $6.6 million in 2009 primarily related to other-than-temporary impairment charges for trust preferred securities and an investment in the common stock of Silverton Financial Services, Inc. These losses were offset by gross realized gains of $2.9 million during the same period. Gross realized losses of $1.6 million in 2008 primarily related to other-than-temporary impairment for one pooled trust preferred security. These losses were offset by gross realized gains of $0.4 million during the same period.
Other noninterest income was $1.1 million in 2009, compared to $2.0 million in 2008. The decrease is primarily due to nonrecurring items included in 2008 totals. In 2008, other noninterest income was impacted by a $1.1 million gain related to the sale of certain real property. This was offset by a $0.5 million pre-tax charge in 2008 related to the correction of an accounting error in prior periods. Information concerning the correction of an accounting error is included in Note 1 to the consolidated financial statements that accompany this report.
Noninterest Expense
| Years ended December 31 | ||||||||||||
| (Dollars in thousands) |
2010 |
2009 |
2008 |
|||||||||
| Salaries and benefits |
$ | 7,950 | $ | 7,819 | $ | 7,278 | ||||||
| Net occupancy and equipment |
1,450 | 1,500 | 1,314 | |||||||||
| Professional fees |
702 | 799 | 511 | |||||||||
| FDIC and other regulatory assessments |
1,092 | 1,322 | 358 | |||||||||
| Other real estate owned, net |
1,378 | 43 | 67 | |||||||||
| Prepayment penalty on long-term debt |
679 | — | — | |||||||||
| Other |
3,190 | 3,150 | 3,014 | |||||||||
| Total noninterest expense |
$ | 16,441 | $ | 14,633 | $ | 12,542 | ||||||
2010 vs. 2009 comparison
Salaries and benefits expense was $8.0 million in 2010, compared to $7.8 million in 2009. The increase in 2010 when compared to 2009 was primarily due to increased salaries expense and group medical insurance costs. Offsetting the increase in salaries expense and group medical insurance costs was a decrease in commissions paid to our mortgage originators as a result of decreased origination volume in 2010 when compared to 2009. No cash incentive awards were accrued for Company or Bank officers in 2010 or 2009.
FDIC and other regulatory assessments expense was $1.1 million in 2010, compared to $1.3 million in 2009. The decrease in 2010 when compared to 2009 was primarily due to the impact of the $0.4 million special assessment from the FDIC included in FDIC and other regulatory assessments expense in 2009.
Other real estate owned expense, net increased by $1.3 million in 2010 when compared to 2009. The increase was primarily due to write-downs of the carrying value of certain foreclosed properties due to deterioration in real estate values.
Prepayment penalties on long-term debt were approximately $0.7 million during 2010 compared to nil during 2009. As part of its strategy to reduce wholesale funding and interest expense, the Company repaid $10.0 million of securities sold under agreements to repurchase prior to their maturity that were included in long-term debt during 2010.
35
Table of Contents
2009 vs. 2008 comparison
Salaries and benefits expense was $7.8 million in 2009, compared to $7.3 million in 2008. The primary driver of the increase related to increases in commissions paid to our mortgage originators as a result of increased origination volume. Increases in normal annual officer and employee salaries and wages in 2009 were offset by a reduction in the payout related to the Company’s annual cash incentive awards. No cash incentive awards were accrued for Company and Bank officers in 2009.
Net occupancy and equipment expense was $1.5 million in 2009, compared to $1.3 million in 2008. The primary driver of the increase relates to start-up costs for a new branch that was opened in the first quarter of 2009 and the related increases in operating costs and depreciation expense.
Professional fees expense was $0.8 million in 2009, compared to $0.5 million in 2008. The increase primarily relates to increased costs of regulatory compliance, including Sarbanes-Oxley and other legislative and regulatory measures.
FDIC and other regulatory assessments expense was $1.3 million in 2009, compared to $0.4 million in 2008. This change was primarily a result of the significant increase in the Company’s FDIC insurance assessments in 2009, despite being assessed at the FDIC’s lowest rate. As a result of the requirement to increase the FDIC’s Deposit Insurance Fund (“DIF”) to statutory levels over a prescribed period of time and increased pressure on the fund’s reserves due to the increasing number of bank failures, annual FDIC insurance costs were significantly higher for all insured depository institutions. Also, during the second quarter of 2009, a special assessment from the FDIC of approximately $0.4 million was accrued to provide additional reserves for the FDIC’s DIF.
Income Tax Expense
2010 vs. 2009 comparison
In 2010, the Company recorded income tax expense of $0.8 million, compared to an income tax benefit of $0.3 million in 2009. This change was primarily due to an increase in the level of earnings before taxes. The effective income tax rate was 12.99% in 2010, compared to an effective income tax benefit rate of 16.47% in 2009. The increase in the effective tax rate from 2009 to 2010 was primarily due to a 198% increase in earnings before taxes. Also reflected in the Company’s effective income tax benefit rate for 2009 was a change in valuation allowance of $0.5 million related to nondeductible capital losses and an income tax benefit of $0.3 million related to the correction of an accounting error in prior periods. Information concerning the correction of an accounting error is included in “Note 1 to the Consolidated Financial Statements.”
2009 vs. 2008 comparison
In 2009, the Company recorded an income tax benefit of $0.3 million, compared to income tax expense of $2.0 million in 2008. This change was primarily due to a decrease in the level of earnings before taxes relative to tax-exempt sources of income in 2009 when compared to 2008. The effective income tax benefit rate was 16.47% in 2009, compared to an effective income tax rate of 23.36%. The decrease in the effective tax rate from 2008 to 2009 was primarily due to a 76% decrease in earnings before taxes while tax-exempt sources of income remained relatively consistent in both years.
BALANCE SHEET ANALYSIS
Securities
Securities available-for-sale were $315.2 million and $334.8 million as of December 31, 2010 and 2009, respectively. The decrease from December 31, 2009 primarily reflects management’s decision to utilize a portion of the cash proceeds from sales/calls/maturities of investment securities during 2010 to reduce short-term borrowings and higher cost long-term debt. Unrealized net losses on securities available-for-sale were $3.5 million as of December 31, 2010 compared to unrealized net gains of $0.2 million as of December 31, 2009. The increase in unrealized net losses of $3.7 million from December 31, 2009 was primarily due to changes in interest rates and increased credit spreads on municipal bonds. The average tax-equivalent yields earned on total securities were 4.09% in 2010 and 4.82% in 2009.
36
Table of Contents
The following table shows the carrying value and weighted average yield of securities available-for-sale as of December 31, 2010 according to contractual maturity. Actual maturities may differ from contractual maturities of mortgage-backed securities because the mortgages underlying the securities may be called or prepaid with or without penalty.
| December 31, 2010 | ||||||||||||||||||||
| (Dollars in thousands) | 1 year
or less |
1 to 5
years |
5 to 10
years |
After 10
years |
Total
Fair Value |
|||||||||||||||
| Agency obligations |
$ | — | — | 37,821 | 52,650 | 90,471 | ||||||||||||||
| Agency RMBS |
— | — | 9,976 | 133,168 | 143,144 | |||||||||||||||
| State and political subdivisions |
21 | 856 | 13,547 | 62,342 | 76,766 | |||||||||||||||
| Trust preferred securities |
— | — | — | 2,149 | 2,149 | |||||||||||||||
| Corporate debt |
— | 2,690 | — | — | 2,690 | |||||||||||||||
| Total available-for-sale |
$ | 21 | 3,546 | 61,344 | 250,309 | 315,220 | ||||||||||||||
| Weighted average yield: |
||||||||||||||||||||
| Agency obligations |
— | — | 2.54% | 2.43% | 2.48% | |||||||||||||||
| Agency RMBS |
— | — | 1.57% | 3.21% | 3.09% | |||||||||||||||
| State and political subdivisions |
5.25% | 4.72% | 4.16% | 4.25% | 4.24% | |||||||||||||||
| Trust preferred securities |
— | — | — | 1.40% | 1.40% | |||||||||||||||
| Corporate debt |
— | 6.93% | — | — | 6.93% | |||||||||||||||
| Total available-for-sale |
5.25% | 6.41% | 2.73% | 3.29% | 3.22% | |||||||||||||||
|
Loans
|
||||||||||||||||||||
| December 31 | ||||||||||||||||||||
| (In thousands) | 2010 | 2009 | 2008 | 2007 | 2006 | |||||||||||||||
| Commercial and industrial |
$ | 53,288 | 53,884 | 53,883 | 50,797 | 45,702 | ||||||||||||||
| Construction and land development |
47,850 | 56,820 | 67,420 | 45,724 | 24,683 | |||||||||||||||
| Commercial real estate |
166,241 | 156,928 | 132,818 | 120,789 | 109,774 | |||||||||||||||
| Residential real estate |
96,241 | 97,407 | 102,835 | 93,888 | 92,830 | |||||||||||||||
| Consumer installment |
10,676 | 11,236 | 12,463 | 11,525 | 9,328 | |||||||||||||||
| Total loans |
374,296 | 376,275 | 369,419 | 322,723 | 282,317 | |||||||||||||||
| Less: unearned income |
(81 | ) | (172 | ) | (257 | ) | (312 | ) | (334) | |||||||||||
| Loans, net of unearned income |
$ | 374,215 | 376,103 | 369,162 | 322,411 | 281,983 | ||||||||||||||
Total loans, net of unearned income, were $374.2 million as of December 31, 2010, a decrease of $1.9 million, or 1%, from $376.1 million at December 31, 2009. The loan portfolio decreased slightly in 2010 as new loans were unable to offset the impact of paydowns, charge-offs, foreclosures and other problem loan resolutions. Four loan categories represented the majority of the loan portfolio as December 31, 2010. Commercial real estate mortgage loans represented 44%, residential real estate mortgage loans represented 26%, commercial and industrial loans represented 14% and construction and land development loans represented 13% Company’s total loans at December 31, 2010. The primary change in the composition of the loan portfolio during 2010 is due to an increase in commercial real estate mortgage loans of $9.3 million and a decrease in construction and land development loans of $9.0 million.
Within the residential real estate mortgage portfolio, the Company had junior lien mortgages of approximately $24.3 million, or 6%, and $25.9 million, or 7%, of total loans, net of unearned income at December 31, 2010 and 2009, respectively. For residential real estate mortgage loans with a consumer purpose, approximately $4.1 million and $5.8 million required interest only payments at December 31, 2010 and 2009, respectively. The Company’s residential real estate mortgage portfolio does not include any option ARM loans, subprime loans, or any material amount of other high risk consumer mortgage products.
Purchased loan participations included in the Company’s loan portfolio were approximately $7.2 million and $9.4 million as of December 31, 2010 and 2009, respectively. All purchased loan participations are underwritten by the Company independent of the selling bank. In addition, all loans, including purchased participations, are evaluated for collectability during the course of the Company’s normal loan review procedures. If the Company deems a participation loan impaired, it applies the same accounting policies and procedures as described in “CRITICAL ACCOUNTING POLICIES.”
37
Table of Contents
The average yield earned on loans and loans held for sale was 5.73% in 2010 and 5.75% in the 2009.
The specific economic and credit risks associated with our loan portfolio include, but are not limited to, the impact of recessionary economic conditions on our borrowers’ cash flows, real estate market sales volumes, valuations, and availability and cost of financing for properties, real estate industry concentrations, deterioration in certain credits, interest rate fluctuations, reduced collateral values or non-existent collateral, title defects, inaccurate appraisals, financial deterioration of borrowers, fraud, and any violation of laws and regulations.
The Company attempts to reduce these economic and credit risks by adhering to loan to value (“LTV”) guidelines for collateralized loans, investigating the creditworthiness of borrowers and monitoring borrowers’ financial position. Also, we establish and periodically review our lending policies and procedures. Banking regulations limit our credit exposure by prohibiting unsecured loan relationships that exceed 10% of the capital accounts of the Bank; or 20% of the capital accounts if loans in excess of 10% are fully secured, which would approximate $13.5 million. Furthermore, we have an internal limit for aggregate credit exposure (loans outstanding plus unfunded commitments) to a single borrower of $12.1 million. Our loan policy requires that the Loan Committee of the Board of Directors approve any loan relationships that exceed this internal limit. At December 31, 2010, the Company had no loan relationships exceeding these limits.
We periodically analyze our commercial loan portfolio to determine if a concentration of credit risk exists in any one or more industries. We use broadly accepted industry classification systems in order to classify borrowers into various industry classifications. Loan concentrations to borrowers in the following industries exceeded 25% of the Bank’s total risk-based capital at December 31, 2010 (and related balances at December 31, 2009).
| December 31 | ||||||||
| (In thousands) | 2010 | 2009 | ||||||
| Lessors of 1-4 family residential properties |
$ | 38,679 | 34,961 | |||||
| Office buildings |
24,185 | 21,122 | ||||||
| Manufacturing/industrial facilities |
17,327 | 14,715 | ||||||
At December 31, 2010 the Company’s geographic loan distribution was concentrated primarily in Lee County, Alabama and surrounding areas. Although not a significant concentration, the Company has some exposure to geographic areas that could be affected by the oil spill in the Gulf of Mexico. In addition to the Gulf of Mexico being a popular vacation destination for borrowers located in our primary trade area, the Company also operated a loan production office in the Gulf Shores/Orange Beach, Alabama area from 2004 to 2008. Separately, the Company previously purchased participations in two construction and land development loans related to projects along the Florida Gulf Coast. Management will continue to monitor the Company’s exposure and prospective provisions for loan losses will incorporate any deterioration in affected loan segments as necessary.
The following table summarizes the Company’s total exposure to loans secured by real estate and other real estate owned in geographic areas that could be affected by the oil spill.
| December 31 | ||||||||
| (In thousands) | 2010 | 2009 | ||||||
| Construction and land development |
$ | 2,484 | 4,926 | |||||
| Residential real estate |
6,720 | 7,094 | ||||||
| Total loans |
9,204 | 12,020 | ||||||
| Other real estate owned |
3,559 | 4,329 | ||||||
| Total exposure |
$ | 12,763 | 16,349 | |||||
| as a % of total assets |
1.67% | 2.11% | ||||||
At December 31, 2010, the Company had approximately $6.7 million of loans secured by residential real estate in coastal counties along the Gulf of Mexico that could be affected by the oil spill. These locations include Baldwin County, Alabama, and Bay, Escambia, Okaloosa and Walton County, Florida.
At December 31, 2010, the carrying value related to one of the Company’s purchased participations was $2.5 million. At December 31, 2010, this loan was classified as a troubled-debt restructuring (“TDR”) and nonaccrual loan.
The other purchased participation loan defaulted and was foreclosed upon previously. At December 31, 2010, the
38
Table of Contents
carrying value of the Company’s interest in this foreclosed property was approximately $3.6 million and is included in other real estate owned which is discussed more fully under “Nonperforming Assets” below.
Allowance for Loan Losses
The Company maintains the allowance for loan losses at a level that management deems appropriate to adequately cover the Company’s estimate of probable losses in the loan portfolio. As of December 31, 2010 and 2009, respectively, the allowance for loan losses was $7.7 million and $6.5 million, respectively, which management deemed to be adequate at each of the respective dates. The judgments and estimates associated with the determination of the allowance for loan losses are described under “CRITICAL ACCOUNTING POLICIES”.
A summary of the changes in the allowance for loan losses and certain asset quality ratios for each of the five years in the five year period ended December 31, 2010 is presented below.
| Years ended December 31 | ||||||||||||||||||||
| (Dollars in thousands) | 2010 | 2009 | 2008 | 2007 | 2006 | |||||||||||||||
| Allowance for loan losses: |
||||||||||||||||||||
| Balance at beginning of period |
$ | 6,495 | 4,398 | 4,105 | 4,044 | 3,843 | ||||||||||||||
| Charge-offs: |
||||||||||||||||||||
| Commercial and industrial |
(537 | ) | (495 | ) | (454 | ) | (62 | ) | (37) | |||||||||||
| Construction and land development |
(1,487 | ) | (2,088 | ) | — | — | — | |||||||||||||
| Commercial real estate |
— | — | — | — | — | |||||||||||||||
| Residential real estate |
(552 | ) | (704 | ) | (153 | ) | (143 | ) | (106) | |||||||||||
| Consumer installment |
(111 | ) | (61 | ) | (98 | ) | (45 | ) | (46) | |||||||||||
| Total charge-offs |
(2,687 | ) | (3,348 | ) | (705 | ) | (250 | ) | (189) | |||||||||||
| Recoveries: |
||||||||||||||||||||
| Commercial and industrial |
63 | 47 | 102 | 14 | 13 | |||||||||||||||
| Construction and land development |
— | 50 | — | — | — | |||||||||||||||
| Commercial real estate |
54 | — | — | 69 | 7 | |||||||||||||||
| Residential real estate |
151 | 92 | 6 | 199 | 4 | |||||||||||||||
| Consumer installment |
20 | 6 | 20 | 6 | 36 | |||||||||||||||
| Total recoveries |
288 | 195 | 128 | 288 | 60 | |||||||||||||||
| Net (charge-offs) recoveries |
(2,399 | ) | (3,153 | ) | (577 | ) | 38 | (129) | ||||||||||||
| Provision for loan losses |
3,580 | 5,250 | 870 | 23 | 330 | |||||||||||||||
| Ending balance |
$ | 7,676 | 6,495 | 4,398 | 4,105 | 4,044 | ||||||||||||||
| as a % of loans |
2.05 | % | 1.73 | 1.19 | 1.27 | 1.43 | ||||||||||||||
| as a % of nonperforming loans |
65 | % | 69 | 99 | 918 | 5,617 | ||||||||||||||
| Net charge-offs as a % of average loans |
0.64 | % | 0.84 | 0.17 | (0.01 | ) | 0.05 | |||||||||||||
As noted in the Company’s critical accounting policies, management assesses the adequacy of the allowance prior to the end of each calendar quarter. The level of the allowance is based upon management’s evaluation of the loan portfolios, past loan loss experience, known and inherent risks in the portfolio, adverse situations that may affect the borrower’s ability to repay (including the timing of future payment), the estimated value of any underlying collateral, composition of the loan portfolio, economic conditions, industry and peer bank loan quality indications and other pertinent factors. This evaluation is inherently subjective as it requires various material estimates and judgments including the amounts and timing of future cash flows expected to be received on impaired loans that may be susceptible to significant change. The ratio of our allowance for loan losses to total loans outstanding was 2.05% at December 31, 2010, compared to 1.73% at December 31, 2009. In the future, the allowance to total loans outstanding ratio will increase or decrease to the extent the factors that influence our quarterly allowance assessment in their entirety either improve or weaken.
Net charge-offs were $2.4 million, or 0.64% of average loans, in 2010, compared to net charge-offs of $3.2 million, or 0.84%, in 2009. The decrease in net charge-offs during 2010 when compared to 2009 was primarily due to a decline in charge-offs in the construction and land development portfolio. Approximately $1.3 million and $1.5 million in charge-offs for the years ended December 31, 2010 and 2009, respectively, related to two construction and land development loans.
At December 31, 2010, the ratio of our allowance for loan losses as a percentage of nonperforming loans was 65%, compared to 69% at December 31, 2009. The decrease in this ratio was primarily due to an increase in
39
Table of Contents
nonperforming loans that the Company believes are well-collateralized based on current appraisals and other comparable sales data.
At December 31, 2010, the Company’s recorded investment in loans considered impaired was $11.7 million, with a corresponding valuation allowance (included in the allowance for loan losses) of $1.3 million. At December 31, 2009, the Company’s recorded investment in loans considered impaired was $9.7 million, with a corresponding valuation allowance (included in the allowance for loan losses) of $1.3 million.
In addition, our regulators, as an integral part of their examination process, will periodically review the Company’s allowance for loan losses, and may require the Company to make additional provisions to the allowance for loan losses based on their judgment about information available to them at the time of their examinations.
Nonperforming Assets
At December 31, 2010 the Company had $20.0 million in nonperforming assets compared to $16.6 million at December 31, 2009. Included in nonperforming assets were nonperforming loans of $11.8 million and $9.4 million at December 31, 2010 and 2009, respectively. Nonperforming assets increased during 2010 due to the impact of continuing economic distress. The majority of the balance in nonperforming assets at December 31, 2010 related to deterioration in the construction and land development loan portfolio.
The table below provides information concerning total nonperforming assets and certain asset quality ratios.
| December 31 | ||||||||||||||||||||
| (In thousands) |
2010 |
2009 |
2008 |
2007 |
2006 |
|||||||||||||||
| Nonperforming assets: |
||||||||||||||||||||
| Nonaccrual loans |
$ | 11,833 | 9,352 | 4,431 | 447 | 72 | ||||||||||||||
| Other nonperforming assets (primarily other real estate owned)
|
|
8,125
|
|
|
7,292
|
|
|
324
|
|
|
98
|
|
|
—
|
| |||||
| Total nonperforming assets |
$ | 19,958 | 16,644 | 4,755 | 545 | 72 | ||||||||||||||
| as a % of loans and foreclosed properties |
5.22 | % | 4.34 | 1.29 | 0.17 | 0.03 | ||||||||||||||
| as a % of total assets |
2.61 | % | 2.15 | 0.64 | 0.08 | 0.01 | ||||||||||||||
| Nonperforming loans as a % of total loans |
3.16 | % | 2.49 | 1.20 | 0.14 | 0.03 | ||||||||||||||
| Accruing loans 90 days or more past due |
$ | — | 5 | 104 | 4 | — | ||||||||||||||
The Lee County Association of Realtors (“LCAR”) of Alabama reported that the average median residential home price in Lee County for the quarter ended December 31, 2010 was $183,933, an increase of 13.0% from the same quarter a year earlier. Although the reported increase in home values is a positive sign, the number of homes sold during the quarter ended December 31, 2010 declined by 17.2% from the same quarter a year ago. LCAR also reported that residential inventory at December 31, 2010 was 1,248 homes, an increase of 10.7% from a year earlier and the average number of days on the market for the quarter ended December 31, 2010 was 187 days, an increase of 12.7% from the same quarter last year. Continued weakness in the residential real estate market and the overall economy could adversely affect the Company’s volume of nonperforming assets. For additional discussion of risk factors, see Part I “Item 1A. Risk Factors”.
The table below provides information concerning the composition of nonaccrual loans at December 31, 2010 and 2009, respectively.
| December 31 | ||||||||
| (In thousands) | 2010 | 2009 | ||||||
| Nonaccrual loans: |
||||||||
| Commercial and industrial |
$ | 521 | — | |||||
| Construction and land development |
4,102 | 7,542 | ||||||
| Commercial real estate |
4,735 | 961 | ||||||
| Residential real estate |
2,474 | 842 | ||||||
| Consumer installment |
1 | 7 | ||||||
| Total nonaccrual loans / nonperfoming loans |
$ | 11,833 | 9,352 | |||||
40
Table of Contents
The Company discontinues the accrual of interest income when (1) there is a significant deterioration in the financial condition of the borrower and full repayment of principal and interest is not expected or (2) the principal or interest is more than 90 days past due, unless the loan is both well-secured and in the process of collection. At December 31, 2010, the Company had $11.8 million in loans on nonaccrual, compared to $9.4 million at December 31, 2009. Total nonperforming loans increased in 2010 despite a decline in nonperforming loan inflows when compared to 2009. Increases in nonperforming commercial and residential real estate mortgage loans of $3.8 million and $1.6 million, respectively, were partially offset by a decrease in nonperforming construction and land development loans of $3.4 million.
Due to the weakening credit status of a borrower, the Company may elect to formally restructure certain loans to facilitate a repayment plan that minimizes the potential losses that we might incur. Restructured loans are classified as impaired loans, and if the loans are on nonaccrual status as of the date of restructuring, the loans are included in the nonaccrual loan balances noted above. Nonaccrual loan balances do not include loans that have been restructured that were performing as of the restructure date. At December 31, 2010 and 2009, respectively, the Company had no accruing restructured loans.
At December 31, 2010, there were no loans 90 days past due and still accruing interest. At December 31, 2009, the Company had $5 thousand in loans 90 days past due and still accruing interest.
The table below provides information concerning the composition of other real estate owned at December 31, 2010 and 2009, respectively.
| December 31 | ||||||||
| (In thousands) | 2010 | 2009 | ||||||
| Other real estate owned: |
||||||||
| Residential condo developments |
$ | 5,494 | 4,329 | |||||
| New construction |
369 | 490 | ||||||
| Developed lots |
136 | 136 | ||||||
| Undeveloped land |
1,746 | 2,210 | ||||||
| Other |
380 | 127 | ||||||
| Total other real estate owned |
$ | 8,125 | 7,292 | |||||
The Company owned $8.1 million in other real estate at December 31, 2010, which we had acquired from borrowers, compared to $7.3 million at December 31, 2009. Other real estate owned primarily relates to three properties with a total carrying value of $7.2 million at December 31, 2010. One of the properties is a completed condominium project on the Florida Gulf Coast. The Company had previously purchased a participation interest in the first lien mortgage loan on the condominium project on the Florida Gulf Coast from Silverton Bank. Subsequently, this loan defaulted and was foreclosed upon and the Company’s interest in the property is currently included in other real estate owned. Following Silverton Bank's failure on May 1, 2009, the FDIC has held this property as the receiver of Silverton Bank. CB Richard Ellis, a national real estate firm, has been managing this property and selling condominiums in the project as a FDIC contractor. The Company depends upon the FDIC and CB Richard Ellis for information regarding this property and its performance. Based upon the latest information available to us, including appraisals, current unit sales, and comparable sales, we believe that the fair value of the Company’s interest in these properties, less selling costs, exceeds the Company’s recorded investment. During the first quarter of 2011, the Company learned that the FDIC has approved a bulk sale of the condominiums and club amenities, which may speed the disposition of this property in which we hold an interest.
Potential Problem Loans
Potential problem loans represent those loans with a well-defined weakness and where information about possible credit problems of borrowers has caused management to have serious doubts about the borrower’s ability to comply with present repayment terms. Potential problem loans, which are not included in nonperforming assets, amounted to $13.2 million, or 3.5% of total loans outstanding, net of unearned income at December 31, 2010, compared to $16.8 million, or 4.5% of total loans outstanding, net of unearned income at December 31, 2009. Continued weakness in the residential real estate market and the overall economy has adversely affected the Company’s volume of potential problem loans, and these economic conditions are expected to persist for the foreseeable future.
41
Table of Contents
The table below provides information concerning the composition of potential problem loans at December 31, 2010 and 2009, respectively.
| December 31 | ||||||||
| (In thousands) | 2010 | 2009 | ||||||
| Potential problem loans: |
||||||||
| Commercial and industrial |
$ | 413 | 1,771 | |||||
| Construction and land development |
1,075 | 1,682 | ||||||
| Commercial real estate |
5,016 | 5,659 | ||||||
| Residential real estate |
6,600 | 7,502 | ||||||
| Consumer installment |
116 | 198 | ||||||
| Total potential problem loans |
$ | 13,220 | 16,812 | |||||
|
At December 31, 2010, approximately $1.3 million or 10.0% of total potential problem loans were past due at least 30 but less than 90 days. |
| |||||||
|
The following table is a summary of the Company’s performing loans that were past due at least 30 days but less than 90 days as of December 31, 2010 and 2009, respectively.
|
| |||||||
| December 31 | ||||||||
| (In thousands) | 2010 | 2009 | ||||||
| Performing loans past due 30 to 89 days: |
||||||||
| Commercial and industrial |
$ | 124 | 339 | |||||
| Construction and land development |
201 | 137 | ||||||
| Commercial real estate |
— | 1,048 | ||||||
| Residential real estate |
2,986 | 1,626 | ||||||
| Consumer installment |
29 | 46 | ||||||
| Total performing loans past due 30 to 89 days |
$ | 3,340 | 3,196 | |||||
| Deposits | ||||||||
| December 31 | ||||||||
| (Dollars in thousands) | 2010 | 2009 | ||||||
| Noninterest bearing demand |
$ | 87,660 | $ | 76,497 | ||||
| NOW |
82,817 | 84,297 | ||||||
| Money market |
107,193 | 82,433 | ||||||
| Savings |
23,344 | 21,302 | ||||||
| Certificates of deposit under $100,0000 |
115,836 | 114,399 | ||||||
| Certificates of deposit and other time deposits of $100,000 or more |
148,616 | 173,759 | ||||||
| Brokered certificates of deposit |
41,661 | 26,722 | ||||||
| Total deposits |
$ | 607,127 | $ | 579,409 | ||||
Total deposits were $607.1 million and $579.4 million at December 31, 2010 and 2009, respectively. The increase in total deposits of $27.7 million was primarily due to an increase in noninterest bearing demand deposits of $11.2 million and an increase in brokered certificates of deposit (“CDs”) of $14.9 million. The Company used brokered CDs, an alternative source of cost-effective funding, to replace certain FHLB advances that matured in 2010. The increase in money market account balances of $24.8 million and the decrease in certificates and other time deposits of $100,000 or more of $25.1 million reflect decreases in interest rates and related shifts as customers sought more yield in short-term instruments in a low interest rate environment.
The average rates paid on total interest-bearing deposits were 1.94% in 2010 and 2.54% in 2009. Noninterest bearing deposits were 14% and 13% of total deposits as of December 31, 2010 and 2009, respectively.
Other Borrowings
Other borrowings consist of short-term borrowings and long-term debt. Short-term borrowings consist of federal funds purchased, securities sold under agreements to repurchase, and other short-term borrowings. The Bank had available federal fund lines totaling $34.0 million with none outstanding at December 31, 2010, compared to $34.0 million with
42
Table of Contents
$12.5 million outstanding at December 31, 2009. The Company has reviewed all available sources of liquidity and believes the current level of available federal funds lines is sufficient. Securities sold under agreements to repurchase totaled $2.7 million at December 31, 2010, compared to $3.5 million at December 31, 2009.
The average rates paid on short-term borrowings were 0.65% in 2010 and 0.51% in 2009. Information concerning the average balances, weighted average rates, and maximum amounts outstanding for short-term borrowings during the three-year period ended December 31, 2010 is included in “Note 9 to the Consolidated Financial Statements.”
Long-term debt included FHLB advances with an original maturity greater than one year, securities sold under agreements to repurchase with an original maturity greater than one year, and subordinated debentures related to trust preferred securities. The Bank had $71.1 million and $86.1 million in long-term FHLB advances at December 31, 2010 and 2009, respectively. The Bank had $15.0 million and $25.0 million in securities sold under agreements to repurchase with an original maturity greater than one year December 31, 2010 and 2009, respectively. The Company had $7.2 million in junior subordinated debentures related to trust preferred securities outstanding at December 31, 2010 and 2009, respectively.
The average rates paid on long-term debt were 4.02% in 2010 and 4.01% in 2009.
CAPITAL ADEQUACY
The Company’s consolidated stockholders’ equity was $56.4 million and $56.2 million as of December 31, 2010 and 2009, respectively. The slight increase was a result of net earnings of $5.3 million offset by cash dividends of $2.8 million and an other comprehensive loss of $2.3 million due to changes in unrealized gains (losses) on securities available-for-sale, net.
The Company’s Tier 1 leverage ratio was 8.47 %, Tier 1 risk-based capital ratio was 14.57% and Total risk-based capital ratio was 15.82% at December 31, 2010. These ratios exceed the minimum regulatory capital percentages of 4.0% for Tier 1 leverage ratio, 4.0% for Tier 1 risk-based capital ratio and 8.0% for Total risk-based capital ratio. Based on current regulatory standards, the Company is classified as “well capitalized.”
MARKET AND LIQUIDITY RISK MANAGEMENT
Management’s objective is to manage assets and liabilities to provide a satisfactory, consistent level of profitability within the framework of established liquidity, loan, investment, borrowing, and capital policies. The Bank’s Asset Liability Management Committee (“ALCO”) is charged with the responsibility of monitoring these policies, which are designed to ensure acceptable composition of asset/liability mix. Two critical areas of focus for ALCO are interest rate risk and liquidity risk management.
Interest Rate Risk Management
In the normal course of business, the Company is exposed to market risk arising from fluctuations in interest rates. The Company is subject to interest rate risk because assets and liabilities may mature or reprice at different times. For example, if liabilities reprice faster than assets, and interest rates are generally rising, earnings will initially decline. In addition, assets and liabilities may reprice at the same time but by different amounts. For example, when the general level of interest rates is rising, the Company may increase rates paid on interest bearing demand deposit accounts and savings deposit accounts by an amount that is less than the general increase in market interest rates. Also, short-term and long-term market interest rates may change by different amounts. For example, a flattening yield curve may reduce the interest spread between new loan yields and funding costs. Further, the remaining maturity of various assets and liabilities may shorten or lengthen as interest rates change. For example, if long-term mortgage interest rates decline sharply, mortgage-backed securities in the securities portfolio may prepay significantly earlier than anticipated, which could reduce earnings. Interest rates may also have a direct or indirect effect on loan demand, loan losses, mortgage origination volume, the fair value of MSRs and other items affecting earnings.
ALCO measures and evaluates the interest rate risk so that we can meet customer demands for various types of loans and deposits. ALCO determines the most appropriate amounts of on-balance sheet and off-balance sheet items. Measurements used to help manage interest rate sensitivity include an earnings simulation and an economic value of equity model.
43
Table of Contents
Earnings simulation. Management believes that interest rate risk is best estimated by our earnings simulation modeling. On at least a quarterly basis, the following 12 month time period is simulated to determine a baseline net interest income forecast and the sensitivity of this forecast to changes in interest rates. The baseline forecast assumes an unchanged or flat interest rate environment. Forecasted levels of earning assets, interest-bearing liabilities, and off-balance sheet financial instruments are combined with ALCO forecasts of market interest rates for the next 12 months and other factors in order to produce various earnings simulations and estimates.
To limit interest rate risk, we have guidelines for earnings at risk which seek to limit the variance of net interest income to less than a 10 percent decline for a 200 basis point gradual change up or down in rates from management’s baseline net interest income forecast over the next twelve months. The following table reports the variance of net interest income over the next 12 months assuming a gradual change in interest rates of 200 basis points when compared to the baseline net interest income forecast at December 31, 2010.
| Changes in Interest Rates | Net Interest Income % Variance | |||
| 200 basis points |
1.15% | |||
| (200) basis points |
NM | |||
NM=not meaningful
The impact of rate shock scenarios assuming a downward 200 basis point change in interest rates was not considered meaningful because of the historically low interest rate environment.
At December 31, 2010, our earnings simulation model results indicated a slightly asset-sensitive position over the next twelve months, which could serve to improve net interest income during that time period if interest rates increased by 200 basis points. The actual realized change in net interest income would depend upon several factors, which could also serve to diminish, or eliminate the asset sensitivity noted above.
Economic Value of Equity. Economic value of equity (“EVE”) measures the extent that estimated economic values of our assets, liabilities and off-balance sheet items will change as a result of interest rate changes. Economic values are estimated by discounting expected cash flows from assets, liabilities and off-balance sheet items, which establishes a base case EVE. In contrast with our earnings simulation model which evaluates interest rate risk over a 12 month timeframe, EVE uses a terminal horizon which allows for the repricing of all assets, liabilities, and off-balance sheet items. Further, EVE is measured using values as of a point in time and does not reflect any actions that ALCO might take in responding to or anticipating changes in interest rates, or market and competitive conditions.
To help limit interest rate risk, we have a guideline stating that for a 200 basis point instantaneous change in interest rates up or down, EVE should not decrease by more than 30 percent. The following table reports the variance of EVE assuming an immediate change in interest rates of 200 basis points when compared to the base case EVE at December 31, 2010.
| Changes in Interest Rates | EVE % Variance | |||
| 200 basis points |
(30.56)% | |||
| (200) basis points |
NM | |||
NM=not meaningful
At December 31, 2010, the results of our EVE model would indicate that we are slightly above our Company guidelines. This slight variance results from a combination of factors, including a prolonged low interest rate environment in which a majority of our securities portfolio, which includes longer duration fixed-rate earning assets when compared to our loan portfolio, has repriced. The actual realized change in the economic value of equity would depend upon several factors, which could also serve to diminish, or eliminate the interest sensitivity noted above. Management is currently evaluating possible strategies that will bring the results of our EVE model within Company guidelines although no specific strategies have been proposed.
Earnings simulation and EVE are both modeling analyses, which change quarterly and consist of hypothetical estimates based upon numerous assumptions, including the interest rate levels, shape of the yield curve, prepayments on loans and securities, rates on loans and deposits, reinvestments of paydowns and maturities of loans, investments and deposits, and others. While assumptions are developed based on the current economic and market conditions, management cannot make any assurances as to the predictive nature of these assumptions, including how these estimates may be affected by customer preferences, competitors, or competitive conditions.
44
Table of Contents
In addition, each of the preceding analyses may not, on its own, be an accurate indicator of how our net interest income will be affected by changes in interest rates. Income associated with interest-earning assets and costs associated with interest-bearing liabilities may not be affected uniformly by changes in interest rates. In addition, the magnitude and duration of changes in interest rates may have a significant impact on net interest income. For example, although certain assets and liabilities may have similar maturities or periods of repricing, they may react in different degrees to changes in market interest rates, and other economic and market factors. Interest rates on certain types of assets and liabilities fluctuate in advance of changes in general market rates, while interest rates on other types may lag behind changes in general market rates. In addition, certain assets, such as adjustable rate mortgage loans, have features (generally referred to as “interest rate caps and floors”) which limit changes in interest rates. Prepayment and early withdrawal levels also could deviate significantly from those assumed in calculating the maturity of certain instruments. The ability of many borrowers to service their debts also may decrease during periods of rising interest rates or economic stress, which may differ across industries and economic sectors. Deposit and borrower behaviors also affect those relationships and results. ALCO reviews each of the above interest rate sensitivity analyses along with several different interest rate scenarios in seeking satisfactory, consistent levels of profitability within the framework of the Company’s established liquidity, loan, investment, borrowing, and capital policies.
The Company may also use derivative financial instruments to improve the balance between interest-sensitive assets and interest-sensitive liabilities and as one tool to manage interest rate sensitivity while continuing to meet the credit and deposit needs of our customers. From time to time, the Company may enter into interest rate swaps (“swaps”) to facilitate customer transactions and meet their financing needs. These swaps qualify as derivatives, but are not designated as hedging instruments. At December 31, 2010 and 2009, the Company had no derivative contracts to assist in managing interest rate sensitivity.
Liquidity Risk Management
Liquidity is the Company’s ability to convert assets into cash equivalents in order to meet daily cash flow requirements, primarily for deposit withdrawals, loan demand and maturing obligations. Without proper management of its liquidity, the Company could experience higher costs of obtaining funds due to insufficient liquidity, while excessive liquidity can lead to a decline in earnings due to the cost of foregoing alternative higher-yielding investment opportunities.
Liquidity is managed at two levels. The first is the liquidity of the Company. The second is the liquidity of the Bank. The management of liquidity at both levels is essential, because the Company and the Bank have different funding needs and sources, are separate legal entities, and each are subject to regulatory guidelines and requirements.
The primary source of funding and the primary source of liquidity for the Company includes dividends received from the Bank, and secondarily proceeds from the issuance of common stock or other securities. Primary uses of funds for the Company include dividends paid to shareholders, stock repurchases, and interest payments on junior subordinated debentures issued by the Company in connection with trust preferred securities. The junior subordinated debentures are presented as long-term debt in the Consolidated Balance Sheets and the related trust preferred securities are includible in Tier 1 Capital for regulatory capital purposes.
Primary sources of funding for the Bank include customer deposits, other borrowings, repayment and maturity of securities, and sale and repayment of loans. The Bank has access to federal funds lines from various banks and borrowings from the Federal Reserve discount window. In addition to these sources, the Bank has participated in the FHLB’s advance program to obtain funding for its growth. Advances include both fixed and variable terms and are taken out with varying maturities. As of December 31, 2010, the Bank had an available line of credit with the FHLB totaling $232.4 million, with $71.1 million outstanding. As of December 31, 2010, the Bank also had $34.0 million of federal funds lines, with none outstanding. Primary uses of funds include repayment of maturing obligations and growing the loan portfolio.
45
Table of Contents
The following table presents additional information about our contractual obligations as of December 31, 2010, which by their terms have contractual maturity and termination dates subsequent to December 31, 2010:
| Payments due by period | ||||||||||||||||||||
| 1 year | 1 to 3 | 3 to 5 | More than | |||||||||||||||||
| (Dollars in thousands) | Total | or less | years | years | 5 years | |||||||||||||||
| Contractual obligations: |
||||||||||||||||||||
| Deposit maturities (1) |
$ | 607,127 | 301,014 | 210,286 | 55,145 | 40,682 | ||||||||||||||
| Long-term debt |
93,331 | 8,018 | 15,036 | 38,036 | 32,241 | |||||||||||||||
| Operating lease obligations |
783 | 332 | 363 | 88 | — | |||||||||||||||
| Commitments to fund affordable housing investments |
4,378 | 4,378 | — | — | — | |||||||||||||||
| Total |
$ | 705,619 | 313,742 | 225,685 | 93,269 | 72,923 | ||||||||||||||
| (1) | Deposits with no stated maturity (demand, NOW, money market, and savings deposits) are presented in the less than one year category. |
Management believes that the Company and the Bank have adequate sources of liquidity to meet all known contractual obligations and unfunded commitments, including loan commitments and reasonable borrower, depositor, and creditor requirements over the next twelve months.
Off-Balance Sheet Arrangements
At December 31, 2010, the Bank had outstanding standby letters of credit of $7.8 million and unfunded loan commitments outstanding of $41.7 million. Because these commitments generally have fixed expiration dates and many will expire without being drawn upon, the total commitment level does not necessarily represent future cash requirements. If needed to fund these outstanding commitments, the Bank has the ability to liquidate federal funds sold or securities available-for-sale, or on a short-term basis to borrow and purchase federal funds from other financial institutions.
The Company also has commitments to fund certain affordable housing investments. The Company invests in various limited partnerships that sponsor affordable housing projects in its primary markets and surrounding areas as a means of supporting local communities. These investments are designed to generate a return primarily through the realization of federal tax credits. The Company typically provides financing during the construction and development of the properties; however, permanent financing is generally obtained from independent parties upon completion of a project. As of December 31, 2010, the Company had investments of $3.4 million, related to these projects, which are included in other assets on the Consolidated Balance Sheets. Total unfunded commitments outstanding for affordable housing investments were $4.4 million at December 31, 2010. When commitments to fund affordable housing investments are contingent upon a future event, a liability must be recognized when that contingent event becomes probable. As of December 31, 2010, the Company had $1.9 million of unfunded commitments related to affordable housing investments included in other liabilities. Additionally, the Company had outstanding loan commitments with certain of the partnerships totaling $11.4 million at December 31, 2010. The funded portion of these loans was approximately $8.9 million at December 31, 2010. The funded portions of these loans are included in loans, net of unearned income on the Consolidated Balance Sheets.
The Company also makes various customary representations and warranties to the purchasers, including government agencies and government sponsored utilities such as Fannie Mae, of mortgage loans that the Company originates and sells in the secondary market. These representations and warranties may include, among other things:
| • | ownership of the loan; |
| • | validity of the lien securing the loan; |
| • | the absence of delinquent taxes or liens against the property; |
| • | the process used to select the loan for inclusion in a transaction; |
| • | the loan’s compliance with any applicable loan criteria established by the buyer, including underwriting standards; |
| • | delivery of all required documents to the trust; and |
| • | the loan’s compliance with applicable federal, state and local laws. |
A breach of these presentations and warranties with respect to a particular mortgage loan or mortgage loans could result in the Company being required to repurchase the loan. During 2010 and 2009, no loans were repurchased by the Company. At December 31, 2010, no reserves have been deemed necessary for potential repurchase claims.
46
Table of Contents
Management believes that the Company’s foreclosure process related to mortgage loans continues to operate effectively, and reflects the Company’s interest in these loans and their status appropriately. Foreclosures are approved by Senior Vice Presidents and Division Managers in concert with collection personnel. All documents and activities related to the foreclosure process are completed by the Company’s outside attorneys.
Effects of Inflation and Changing Prices
The consolidated financial statements and related consolidated financial data presented herein have been prepared in accordance with U.S. generally accepted accounting principles and practices within the banking industry which require the measurement of financial position and operating results in terms of historical dollars without considering the changes in the relative purchasing power of money over time due to inflation. Unlike most industrial companies, virtually all the assets and liabilities of a financial institution are monetary in nature. As a result, interest rates have a more significant impact on a financial institution’s performance than the effects of general levels of inflation.
CURRENT ACCOUNTING DEVELOPMENTS
There are no current accounting pronouncements issued but not yet effective that would have a significant impact on the consolidated financial statements of the Company. See Note 1 to the consolidated financial statements that accompany this report for discussion of accounting standards adopted by the Company in 2010.
47
Table of Contents
Table 1 – Explanation of Non-GAAP Financial Measures
In addition to results presented in accordance with U.S. generally accepted accounting principles (GAAP), this annual report on Form 10-K includes certain designated net interest income amounts presented on a tax-equivalent basis, a non-GAAP financial measure, including the presentation of total revenue and the calculation of the efficiency ratio.
The Company believes the presentation of net interest income on a tax-equivalent basis provides comparability of net interest income from both taxable and tax-exempt sources and facilitates comparability within the industry. Although the Company believes these non-GAAP financial measures enhance investors’ understanding of its business and performance, these non-GAAP financial measures should not be considered an alternative to GAAP. The reconciliation of these non-GAAP financial measures from GAAP to non-GAAP are presented below.
| 2010 | 2009 | |||||||||||||||||||||||||||||||||||
| (in thousands) | Fourth Quarter |
Third Quarter |
Second Quarter |
First Quarter |
Fourth Quarter |
Third Quarter |
Second Quarter |
First Quarter |
||||||||||||||||||||||||||||
| Net interest income (GAAP) |
$ | 4,642 | 4,738 | 4,688 | 4,831 | 5,109 | 4,662 | 4,519 | 4,525 | |||||||||||||||||||||||||||
| Tax-equivalent adjustment |
441 | 449 | 438 | 437 | 438 | 432 | 404 | 359 | ||||||||||||||||||||||||||||
| Net interest income (Tax-equivalent) |
$ | 5,083 | 5,187 | 5,126 | 5,268 | 5,547 | 5,094 | 4,923 | 4,884 | |||||||||||||||||||||||||||
| Years ended December 31 | ||||||||||||||||||||||||||||||||||||
| (In thousands) | 2010 | 2009 | 2008 | 2007 | 2006 | |||||||||||||||||||||||||||||||
| Net interest income (GAAP) |
$ | 18,899 | 18,815 | 17,870 | 15,605 | 14,923 | ||||||||||||||||||||||||||||||
| Tax-equivalent adjustment |
1,765 | 1,633 | 1,361 | 1,123 | 1,033 | |||||||||||||||||||||||||||||||
| Net interest income (Tax-equivalent) |
$ | 20,664 | 20,448 | 19,231 | 16,728 | 15,956 | ||||||||||||||||||||||||||||||
48
Table of Contents
Table 2 - Selected Financial Data
| Years ended December 31 |
||||||||||||||||||||||||
| (Dollars in thousands, except per share amounts) | 2010 | 2009 | 2008 | 2007 | 2006 | |||||||||||||||||||
| Income statement |
||||||||||||||||||||||||
| Tax-equivalent interest income (a) |
$ | 35,237 | 38,467 | 39,722 | 38,670 | 35,601 | ||||||||||||||||||
| Total interest expense |
14,573 | 18,019 | 20,491 | 21,942 | 19,645 | |||||||||||||||||||
| Tax equivalent net interest income (a) |
20,664 | 20,448 | 19,231 | 16,728 | 15,956 | |||||||||||||||||||
| Provision for loan losses |
3,580 | 5,250 | 870 | 23 | 330 | |||||||||||||||||||
| Total noninterest income |
7,266 | 3,132 | 4,202 | 5,936 | 5,505 | |||||||||||||||||||
| Total noninterest expense |
16,441 | 14,633 | 12,542 | 12,360 | 11,201 | |||||||||||||||||||
| Net earnings before income taxes and tax-equivalent adjustment |
7,909 | 3,697 | 10,021 | 10,281 | 9,930 | |||||||||||||||||||
| Tax-equivalent adjustment |
1,765 | 1,633 | 1,361 | 1,123 | 1,033 | |||||||||||||||||||
| Income tax expense (benefit) |
798 | (340 | ) | 2,023 | 2,240 | 2,312 | ||||||||||||||||||
| Net earnings |
$ | 5,346 | 2,404 | 6,637 | 6,918 | 6,585 | ||||||||||||||||||
| Per share data: | ||||||||||||||||||||||||
| Basic and diluted net earnings |
$ | 1.47 | 0.66 | 1.81 | 1.86 | 1.74 | ||||||||||||||||||
| Cash dividends declared |
$ | 0.78 | 0.76 | 0.74 | 0.70 | 0.64 | ||||||||||||||||||
| Weighted average shares outstanding |
||||||||||||||||||||||||
| Basic |
3,642,851 | 3,644,691 | 3,674,384 | 3,716,427 | 3,777,721 | |||||||||||||||||||
| Diluted |
3,642,851 | 3,644,691 | 3,674,384 | 3,716,427 | 3,778,055 | |||||||||||||||||||
| Shares outstanding |
3,642,718 | 3,643,117 | 3,646,947 | 3,681,809 | 3,743,787 | |||||||||||||||||||
| Book value |
$ | 15.47 | 15.42 | 15.66 | 14.40 | 12.93 | ||||||||||||||||||
| Common stock price |
||||||||||||||||||||||||
| High |
$ | 22.00 | 30.00 | 25.00 | 30.00 | 28.89 | ||||||||||||||||||
| Low |
16.86 | 18.07 | 19.00 | 21.30 | 21.50 | |||||||||||||||||||
| Period-end |
$ | 20.06 | 19.69 | 20.10 | 21.95 | 28.89 | ||||||||||||||||||
| To earnings ratio |
13.74 | x | 29.39 | 11.10 | 11.80 | 16.60 | ||||||||||||||||||
| To book value |
130 | % | 128 | 128 | 152 | 223 | ||||||||||||||||||
| Performance ratios: | ||||||||||||||||||||||||
| Return on average equity |
9.00 | % | 4.23 | 12.18 | 13.50 | 14.66 | ||||||||||||||||||
| Return on average assets |
0.68 | % | 0.31 | 0.92 | 1.06 | 1.06 | ||||||||||||||||||
| Dividend payout ratio |
53.06 | % | 115.15 | 40.88 | 37.63 | 36.78 | ||||||||||||||||||
| Average equity to average assets |
7.61 | % | 7.21 | 7.59 | 7.88 | 7.20 | ||||||||||||||||||
| Asset Quality: | ||||||||||||||||||||||||
| Allowance for loan losses as a % of: |
||||||||||||||||||||||||
| Loans |
2.05 | % | 1.73 | 1.19 | 1.27 | 1.43 | ||||||||||||||||||
| Nonperforming loans |
65 | % | 69 | 99 | 918 | 5,617 | ||||||||||||||||||
| Nonperforming assets as a % of: |
||||||||||||||||||||||||
| Loans and foreclosed properties |
5.22 | % | 4.34 | 1.29 | 0.17 | 0.03 | ||||||||||||||||||
| Total assets |
2.61 | % | 2.15 | 0.64 | 0.08 | 0.01 | ||||||||||||||||||
| Nonperforming loans as % of loans |
3.16 | % | 2.49 | 1.20 | 0.14 | 0.03 | ||||||||||||||||||
| Net charge-offs (recoveries) as a % of average loans |
0.64 | % | 0.84 | 0.17 | (0.01 | ) | 0.05 | |||||||||||||||||
| Capital Adequacy: | ||||||||||||||||||||||||
| Tier 1 risk-based capital ratio |
14.57 | % | 13.73 | 14.23 | 15.09 | 15.59 | ||||||||||||||||||
| Total risk-based capital ratio |
15.82 | % | 14.98 | 15.22 | 16.12 | 16.68 | ||||||||||||||||||
| Tier 1 Leverage ratio |
8.47 | % | 8.13 | 8.75 | 9.02 | 9.22 | ||||||||||||||||||
| Other financial data: | ||||||||||||||||||||||||
| Net interest margin (a) |
2.86 | % | 2.78 | 2.86 | 2.76 | 2.73 | ||||||||||||||||||
| Effective income tax expense (benefit) rate |
12.99 | % | (16.47 | ) | 23.36 | 24.46 | 25.99 | |||||||||||||||||
| Efficiency ratio (b) |
58.87 | % | 62.06 | 53.52 | 54.54 | 52.19 | ||||||||||||||||||
| Selected period end balances: | ||||||||||||||||||||||||
| Securities |
$ | 315,220 | 334,762 | 302,656 | 318,373 | 301,937 | ||||||||||||||||||
| Loans, net of unearned income |
374,215 | 376,103 | 369,162 | 322,411 | 281,983 | |||||||||||||||||||
| Allowance for loan losses |
7,676 | 6,495 | 4,398 | 4,105 | 4,044 | |||||||||||||||||||
| Total assets |
763,829 | 773,382 | 745,970 | 688,659 | 635,126 | |||||||||||||||||||
| Total deposits |
607,127 | 579,409 | 550,843 | 492,585 | 469,648 | |||||||||||||||||||
| Long-term debt |
93,331 | 118,349 | 123,368 | 115,386 | 90,404 | |||||||||||||||||||
| Total stockholders’ equity |
56,368 | 56,183 | 57,128 | 53,018 | 48,418 | |||||||||||||||||||
| (a) | Tax-equivalent. See “Table 1 - Explanation of Non-GAAP Financial Measures”. |
| (b) | Efficiency ratio is the result of noninterest expense divided by the sum of noninterest income and tax-equivalent net interest income. |
49
Table of Contents
Table 3 - Selected Quarterly Financial Data
| 2010 | 2009 | |||||||||||||||||||||||||||||||
| (Dollars in thousands, except per share amounts) | Fourth | Third | Second | First | Fourth | Third | Second | First | ||||||||||||||||||||||||
| Income statement |
||||||||||||||||||||||||||||||||
| Tax-equivalent interest income (a) |
$ | 8,423 | 8,819 | 8,899 | 9,096 | 9,570 | 9,610 | 9,652 | 9,635 | |||||||||||||||||||||||
| Total interest expense |
3,340 | 3,632 | 3,773 | 3,828 | 4,023 | 4,516 | 4,729 | 4,751 | ||||||||||||||||||||||||
| Tax equivalent net interest income (a) |
5,083 | 5,187 | 5,126 | 5,268 | 5,547 | 5,094 | 4,923 | 4,884 | ||||||||||||||||||||||||
| Provision for loan losses |
650 | 730 | 750 | 1,450 | 2,900 | 1,100 | 700 | 550 | ||||||||||||||||||||||||
| Total noninterest income (loss) |
321 | 1,857 | 2,792 | 2,296 | 799 | 1,159 | 1,263 | (89) | ||||||||||||||||||||||||
| Total noninterest expense |
3,630 | 4,366 | 4,809 | 3,636 | 3,735 | 3,421 | 3,924 | 3,553 | ||||||||||||||||||||||||
| Net earnings before income taxes and tax-equivalent adjustment |
1,124 | 1,948 | 2,359 | 2,478 | (289) | 1,732 | 1,562 | 692 | ||||||||||||||||||||||||
| Tax-equivalent adjustment |
441 | 449 | 438 | 437 | 438 | 432 | 404 | 359 | ||||||||||||||||||||||||
| Income tax (benefit) expense |
(195) | 255 | 314 | 424 | (930) | 277 | 226 | 87 | ||||||||||||||||||||||||
| Net earnings | $ | 878 | 1,244 | 1,607 | 1,617 | 203 | 1,023 | 932 | 246 | |||||||||||||||||||||||
| Per share data: | ||||||||||||||||||||||||||||||||
| Basic and diluted net earnings |
$ | 0.24 | 0.34 | 0.44 | 0.44 | 0.06 | 0.28 | 0.26 | 0.07 | |||||||||||||||||||||||
| Cash dividends declared |
$ | 0.195 | 0.195 | 0.195 | 0.195 | 0.19 | 0.190 | 0.190 | 0.190 | |||||||||||||||||||||||
| Weighted average shares outstanding |
||||||||||||||||||||||||||||||||
| Basic and diluted |
3,642,718 | 3,642,701 | 3,642,877 | 3,643,116 | 3,643,395 | 3,644,097 | 3,644,491 | 3,646,827 | ||||||||||||||||||||||||
| Shares outstanding, at period end |
3,642,718 | 3,642,718 | 3,642,693 | 3,643,112 | 3,643,117 | 3,644,097 | 3,644,097 | 3,644,957 | ||||||||||||||||||||||||
| Book value |
$ | 15.47 | 16.73 | 16.21 | 15.86 | 15.42 | 16.03 | 14.53 | 15.14 | |||||||||||||||||||||||
| Common stock price |
||||||||||||||||||||||||||||||||
| High |
$ | 22.00 | 22.00 | 21.00 | 21.95 | 25.98 | 29.99 | 30.00 | 26.40 | |||||||||||||||||||||||
| Low |
19.50 | 18.08 | 16.86 | 17.61 | 18.93 | 22.50 | 21.75 | 18.07 | ||||||||||||||||||||||||
| Period-end |
$ | 20.06 | 20.35 | 18.80 | 20.65 | 19.69 | 24.40 | 28.50 | 21.00 | |||||||||||||||||||||||
| To earnings ratio |
13.74 | x | 15.78 | 15.41 | 19.86 | 29.39 | 28.05 | 25.22 | 15.22 | |||||||||||||||||||||||
| To book value |
130 | % | 122 | 116 | 130 | 128 | 152 | 196 | 139 | |||||||||||||||||||||||
| Performance ratios: | ||||||||||||||||||||||||||||||||
| Return on average equity |
5.68 | % | 8.31 | 10.96 | 11.31 | 1.37 | 7.64 | 6.63 | 1.70 | |||||||||||||||||||||||
| Return on average assets |
0.45 | % | 0.64 | 0.82 | 0.82 | 0.10 | 0.52 | 0.46 | 0.13 | |||||||||||||||||||||||
| Dividend payout ratio |
81.25 | % | 57.35 | 44.32 | 44.32 | 316.67 | 67.86 | 73.08 | 271.43 | |||||||||||||||||||||||
| Average equity to average assets |
8.00 | % | 7.68 | 7.47 | 7.30 | 7.63 | 6.78 | 7.00 | 7.45 | |||||||||||||||||||||||
| Asset Quality: | ||||||||||||||||||||||||||||||||
| Allowance for loan losses as a % of: |
||||||||||||||||||||||||||||||||
| Loans |
2.05 | % | 1.91 | 1.75 | 1.72 | 1.73 | 1.42 | 1.24 | 1.21 | |||||||||||||||||||||||
| Nonperforming loans |
65 | % | 82 | 72 | 60 | 69 | 64 | 720 | 100 | |||||||||||||||||||||||
| Nonperforming assets as a % of : |
||||||||||||||||||||||||||||||||
| Loans and foreclosed properties |
5.22 | % | 4.42 | 4.05 | 4.65 | 4.34 | 3.52 | 1.53 | 1.24 | |||||||||||||||||||||||
| Total assets |
2.61 | % | 2.18 | 1.98 | 2.28 | 2.15 | 1.75 | 0.72 | 0.58 | |||||||||||||||||||||||
| Nonperforming loans as % of loans |
3.16 | % | 2.34 | 2.43 | 2.87 | 2.49 | 2.20 | 0.17 | 1.21 | |||||||||||||||||||||||
| Net charge-offs as % of average loans |
0.16 | % | 0.14 | 0.76 | 1.48 | 1.95 | 0.31 | 0.63 | 0.45 | |||||||||||||||||||||||
| Capital Adequacy: | ||||||||||||||||||||||||||||||||
| Tier 1 risk-based capital ratio |
14.57 | % | 14.53 | 14.25 | 13.76 | 13.73 | 13.70 | 13.81 | 13.77 | |||||||||||||||||||||||
| Total risk-based capital ratio |
15.82 | % | 15.78 | 15.49 | 15.01 | 14.98 | 14.88 | 14.82 | 14.75 | |||||||||||||||||||||||
| Tier 1 Leverage ratio |
8.47 | % | 8.39 | 8.27 | 8.17 | 8.13 | 8.05 | 7.89 | 8.10 | |||||||||||||||||||||||
| Other financial data: | ||||||||||||||||||||||||||||||||
| Net interest margin (a) |
2.81 | % | 2.85 | 2.82 | 2.94 | 3.02 | 2.74 | 2.64 | 2.72 | |||||||||||||||||||||||
| Effective income tax rate |
NM | % | 17.01 | 16.35 | 20.77 | NM | 21.31 | 19.52 | 26.13 | |||||||||||||||||||||||
| Efficiency ratio (b) |
67.17 | % | 61.98 | 60.74 | 48.07 | 58.86 | 54.71 | 63.43 | 74.10 | |||||||||||||||||||||||
| Selected period end balances: | ||||||||||||||||||||||||||||||||
| Securities |
$ | 315,220 | 322,118 | 333,107 | 333,660 | 334,762 | 338,924 | 349,472 | 358,425 | |||||||||||||||||||||||
| Loans, net of unearned income |
374,215 | 375,098 | 376,624 | 380,619 | 376,103 | 385,448 | 373,221 | 374,185 | ||||||||||||||||||||||||
| Allowance for loan losses |
7,676 | 7,181 | 6,580 | 6,546 | 6,495 | 5,458 | 4,646 | 4,532 | ||||||||||||||||||||||||
| Total assets |
763,829 | 777,846 | 784,124 | 791,324 | 773,382 | 786,042 | 800,910 | 802,450 | ||||||||||||||||||||||||
| Total deposits |
607,127 | 602,508 | 605,755 | 608,588 | 579,409 | 597,591 | 616,442 | 609,206 | ||||||||||||||||||||||||
| Long-term debt |
93,331 | 108,335 | 113,340 | 118,345 | 118,349 | 118,355 | 118,358 | 123,363 | ||||||||||||||||||||||||
| Total stockholders’ equity |
56,368 | 60,937 | 59,042 | 57,778 | 56,183 | 58,405 | 52,948 | 55,180 | ||||||||||||||||||||||||
| (a) | Tax-equivalent. See “Table 1 - Explanation of Non-GAAP Financial Measures”. |
| (b) | Efficiency ratio is the result of noninterest expense divided by the sum of noninterest income and tax-equivalent net interest income. |
NM - not meaningful
50
Table of Contents
Table 4 - Average Balance and Net Interest Income Analysis
| Years ended December 31 | ||||||||||||||||||||||||||||||||||||||||||||
| 2010 | 2009 | 2008 | ||||||||||||||||||||||||||||||||||||||||||
| (Dollars in thousands) | Average Balance |
Interest Income/ Expense |
Yield/ Rate |
Average Balance |
Interest Income/ Expense |
Yield/ Rate |
Average Balance |
Interest Income/ Expense |
Yield/ Rate |
|||||||||||||||||||||||||||||||||||
| Interest-earning assets: | ||||||||||||||||||||||||||||||||||||||||||||
| Loans and loans held for sale (1) |
$ | 380,552 | $ | 21,809 | 5.73% | $ | 380,434 | $ | 21,864 | 5.75% | $ | 347,176 | $ | 22,447 | 6.47% | |||||||||||||||||||||||||||||
| Securities - taxable |
246,610 | 8,208 | 3.33% | 269,266 | 11,775 | 4.37% | 258,160 | 13,199 | 5.11% | |||||||||||||||||||||||||||||||||||
| Securities - tax-exempt (2) |
81,256 | 5,190 | 6.39% | 74,794 | 4,804 | 6.42% | 62,801 | 4,001 | 6.37% | |||||||||||||||||||||||||||||||||||
| Total securities |
327,866 | 13,398 | 4.09% | 344,060 | 16,579 | 4.82% | 320,961 | 17,200 | 5.36% | |||||||||||||||||||||||||||||||||||
| Federal funds sold |
13,984 | 29 | 0.21% | 10,138 | 23 | 0.23% | 3,197 | 61 | 1.91% | |||||||||||||||||||||||||||||||||||
| Interest bearing bank deposits |
1,076 | 1 | 0.09% | 1,135 | 1 | 0.09% | 511 | 14 | 2.74% | |||||||||||||||||||||||||||||||||||
| Total interest-earning assets |
723,478 | 35,237 | 4.87% | 735,767 | 38,467 | 5.23% | 671,845 | 39,722 | 5.91% | |||||||||||||||||||||||||||||||||||
| Cash and due from banks |
12,267 | 14,172 | 13,132 | |||||||||||||||||||||||||||||||||||||||||
| Other assets |
44,909 | 37,930 | 33,100 | |||||||||||||||||||||||||||||||||||||||||
| Total assets |
$ | 780,654 | $ | 787,869 | $ | 718,077 | ||||||||||||||||||||||||||||||||||||||
| Interest-bearing liabilities: | ||||||||||||||||||||||||||||||||||||||||||||
| Deposits: |
||||||||||||||||||||||||||||||||||||||||||||
| NOW |
$ | 88,070 | 612 | 0.69% | $ | 90,794 | 859 | 0.95% | $ | 75,461 | 1,569 | 2.08% | ||||||||||||||||||||||||||||||||
| Savings and money market |
117,725 | 1,228 | 1.04% | 93,484 | 1,054 | 1.13% | 103,379 | 1,819 | 1.76% | |||||||||||||||||||||||||||||||||||
| Certificates of deposits less than $100,000 |
113,912 | 2,758 | 2.42% | 112,894 | 3,743 | 3.32% | 95,830 | 4,147 | 4.33% | |||||||||||||||||||||||||||||||||||
| Certificates of deposits and other time deposits of $100,000 or more |
197,387 | 5,440 | 2.76% | 221,028 | 7,483 | 3.39% | 172,592 | 7,540 | 4.37% | |||||||||||||||||||||||||||||||||||
| Total interest-bearing deposits |
517,094 | 10,038 | 1.94% | 518,200 | 13,139 | 2.54% | 447,262 | 15,075 | 3.37% | |||||||||||||||||||||||||||||||||||
| Short-term borrowings |
3,530 | 23 | 0.65% | 10,790 | 55 | 0.51% | 16,604 | 324 | 1.95% | |||||||||||||||||||||||||||||||||||
| Long-term debt |
112,312 | 4,512 | 4.02% | 120,248 | 4,825 | 4.01% | 123,108 | 5,092 | 4.14% | |||||||||||||||||||||||||||||||||||
| Total interest-bearing liabilities |
632,936 | 14,573 | 2.30% | 649,238 | 18,019 | 2.78% | 586,974 | 20,491 | 3.49% | |||||||||||||||||||||||||||||||||||
| Noninterest-bearing deposits |
84,837 | 78,244 | 72,914 | |||||||||||||||||||||||||||||||||||||||||
| Other liabilities |
3,468 | 3,580 | 3,715 | |||||||||||||||||||||||||||||||||||||||||
| Stockholders’ equity |
59,414 | 56,807 | 54,474 | |||||||||||||||||||||||||||||||||||||||||
| Total liabilities and stockholders’ equity |
$ | 780,654 | $ | 787,869 | $ | 718,077 | ||||||||||||||||||||||||||||||||||||||
| Net interest income and margin |
$ | 20,664 | 2.86% | $ | 20,448 | 2.78% | $ | 19,231 | 2.86% | |||||||||||||||||||||||||||||||||||
| (1) | Average loan balances are shown net of unearned income and loans on nonaccrual status have been included in the computation of average balances. |
| (2) | Yields on tax-exempt securities have been computed on a tax-equivalent basis using an income tax rate of 34%. |
51
Table of Contents
Table 5 - Volume and Rate Variance Analysis
| Years ended December 31, 2010 vs. 2009 | Years ended December 31, 2009 vs. 2008 | |||||||||||||||||||||||||||
| Net Change |
Due to change in | Net Change |
Due to change in | |||||||||||||||||||||||||
| (Dollars in thousands) | Rate (2) | Volume (2) | Rate (2) | Volume (2) | ||||||||||||||||||||||||
| Interest Income: | ||||||||||||||||||||||||||||
| Loans and loans held for sale |
$ | (55 | ) | (62 | ) | 7 | $ | (583 | ) | (2,494 | ) | 1,911 | ||||||||||||||||
| Securities - taxable |
(3,567 | ) | (2,813 | ) | (754) | (1,424 | ) | (1,910 | ) | 486 | ||||||||||||||||||
| Securities - tax-exempt (1) |
386 | (27 | ) | 413 | 803 | 33 | 770 | |||||||||||||||||||||
| Total securities |
(3,181 | ) | (2,840 | ) | (341) | (621 | ) | (1,877 | ) | 1,256 | ||||||||||||||||||
| Federal funds sold |
6 | (2 | ) | 8 | (38 | ) | (54 | ) | 16 | |||||||||||||||||||
| Interest bearing bank deposits |
— | — | — | (13 | ) | (14 | ) | 1 | ||||||||||||||||||||
| Total interest income |
$ | (3,230 | ) | (2,904 | ) | (326) | $ | (1,255 | ) | (4,439 | ) | 3,184 | ||||||||||||||||
| Interest expense: | ||||||||||||||||||||||||||||
| Deposits: |
||||||||||||||||||||||||||||
| NOW |
$ | (247 | ) | (228 | ) | (19) | $ | (710 | ) | (855 | ) | 145 | ||||||||||||||||
| Savings and money market |
174 | (79 | ) | 253 | (765 | ) | (654 | ) | (111) | |||||||||||||||||||
| Certificates of deposits less than $100,000 |
(985 | ) | (1,009 | ) | 24 | (404 | ) | (970 | ) | 566 | ||||||||||||||||||
| Certificates of deposits and other time deposits of $100,000 or more |
(2,043 | ) | (1,392 | ) | (651) | (57 | ) | (1,697 | ) | 1,640 | ||||||||||||||||||
| Total interest-bearing deposits |
(3,101 | ) | (2,708 | ) | (393) | (1,936 | ) | (4,176 | ) | 2,240 | ||||||||||||||||||
| Short-term borrowings |
(32 | ) | 15 | (47) | (269 | ) | (240 | ) | (29) | |||||||||||||||||||
| Long-term debt |
(313 | ) | 6 | (319) | (267 | ) | (153 | ) | (114) | |||||||||||||||||||
| Total interest expense |
(3,446 | ) | (2,687 | ) | (759) | (2,472 | ) | (4,569 | ) | 2,097 | ||||||||||||||||||
| Net interest income |
$ | 216 | (217 | ) | 433 | $ | 1,217 | 130 | 1,087 | |||||||||||||||||||
| (1) | Yields on tax-exempt securities have been computed on a tax-equivalent basis using an income tax rate of 34%. |
| (2) | Changes that are not solely a result of volume or rate have been allocated to volume. |
52
Table of Contents
Table 6 - Loan Portfolio Composition
| December 31 | ||||||||||||||||||||
| (In thousands) | 2010 | 2009 | 2008 | 2007 | 2006 | |||||||||||||||
| Commercial and industrial |
$ | 53,288 | 53,884 | 53,883 | 50,797 | 45,702 | ||||||||||||||
| Construction and land development |
47,850 | 56,820 | 67,420 | 45,724 | 24,683 | |||||||||||||||
| Commercial real estate |
166,241 | 156,928 | 132,818 | 120,789 | 109,774 | |||||||||||||||
| Residential real estate |
96,241 | 97,407 | 102,835 | 93,888 | 92,830 | |||||||||||||||
| Consumer installment |
10,676 | 11,236 | 12,463 | 11,525 | 9,328 | |||||||||||||||
| Total loans |
374,296 | 376,275 | 369,419 | 322,723 | 282,317 | |||||||||||||||
| Less: unearned income |
(81 | ) | (172 | ) | (257 | ) | (312 | ) | (334) | |||||||||||
| Loans, net of unearned income |
374,215 | 376,103 | 369,162 | 322,411 | 281,983 | |||||||||||||||
| Less: allowance for loan losses |
(7,676 | ) | (6,495 | ) | (4,398 | ) | (4,105 | ) | (4,044) | |||||||||||
| Loans, net |
$ | 366,539 | 369,608 | 364,764 | 318,306 | 277,939 | ||||||||||||||
53
Table of Contents
Table 7 - Loan Maturities and Sensitivities to Changes in Interest Rates
| December 31, 2010 | ||||||||||||||||||||||||||||||
| (Dollars in thousands) | 1 year or less |
1 to 5 years |
After 5 years |
Total | Adjustable Rate |
Fixed Rate |
Total | |||||||||||||||||||||||
| Commercial and industrial |
$ | 5,993 | 42,184 | 5,111 | 53,288 | $ | 31,378 | 21,910 | 53,288 | |||||||||||||||||||||
| Construction and land development |
225 | 39,901 | 7,724 | 47,850 | 35,932 | 11,918 | 47,850 | |||||||||||||||||||||||
| Commercial real estate |
— | 127,429 | 38,812 | 166,241 | 47,633 | 118,608 | 166,241 | |||||||||||||||||||||||
| Residential real estate |
395 | 35,571 | 60,275 | 96,241 | 53,828 | 42,413 | 96,241 | |||||||||||||||||||||||
| Consumer installment |
463 | 8,667 | 1,546 | 10,676 | 1,337 | 9,339 | 10,676 | |||||||||||||||||||||||
| Total loans |
$ | 7,076 | 253,752 | 113,468 | 374,296 | $ | 170,108 | 204,188 | 374,296 | |||||||||||||||||||||
54
Table of Contents
Table 8 - Allowance for Loan Losses and Nonperforming Assets
| Years ended December 31 | ||||||||||||||||||||
| (Dollars in thousands) | 2010 | 2009 | 2008 | 2007 | 2006 | |||||||||||||||
| Allowance for loan losses: |
||||||||||||||||||||
| Balance at beginning of period |
$ | 6,495 | 4,398 | 4,105 | 4,044 | 3,843 | ||||||||||||||
| Charge-offs: |
||||||||||||||||||||
| Commercial and industrial |
(537 | ) | (495 | ) | (454 | ) | (62 | ) | (37) | |||||||||||
| Construction and land development |
(1,487 | ) | (2,088 | ) | — | — | — | |||||||||||||
| Commercial real estate |
— | — | — | — | — | |||||||||||||||
| Residential real estate |
(552 | ) | (704 | ) | (153 | ) | (143 | ) | (106) | |||||||||||
| Consumer installment |
(111 | ) | (61 | ) | (98 | ) | (45 | ) | (46) | |||||||||||
| Total charge-offs |
(2,687 | ) | (3,348 | ) | (705 | ) | (250 | ) | (189) | |||||||||||
| Recoveries: |
||||||||||||||||||||
| Commercial and industrial |
63 | 47 | 102 | 14 | 13 | |||||||||||||||
| Construction and land development |
54 | 50 | — | — | — | |||||||||||||||
| Commercial real estate |
— | — | — | 69 | 7 | |||||||||||||||
| Residential real estate |
151 | 92 | 6 | 199 | 4 | |||||||||||||||
| Consumer installment |
20 | 6 | 20 | 6 | 36 | |||||||||||||||
| Total recoveries |
288 | 195 | 128 | 288 | 60 | |||||||||||||||
| Net (charge-offs) recoveries |
(2,399 | ) | (3,153 | ) | (577 | ) | 38 | (129) | ||||||||||||
| Provision for loan losses |
3,580 | 5,250 | 870 | 23 | 330 | |||||||||||||||
|
Ending balance |
$ | 7,676 | 6,495 | 4,398 | 4,105 | 4,044 | ||||||||||||||
| as a % of loans |
2.05 | % | 1.73 | 1.19 | 1.27 | 1.43 | ||||||||||||||
| as a % of nonperforming loans |
65 | % | 69 | 99 | 918 | 5,617 | ||||||||||||||
| Net charge-offs as a % of average loans |
0.64 | % | 0.84 | 0.17 | (0.01 | ) | 0.05 | |||||||||||||
|
Nonperforming assets: |
||||||||||||||||||||
| Nonaccrual/nonperforming loans |
$ | 11,833 | 9,352 | 4,431 | 447 | 72 | ||||||||||||||
| Other nonperforming assets (primarily other real estate owned) |
8,125 | 7,292 | 324 | 98 | — | |||||||||||||||
| Total nonperforming assets |
$ | 19,958 | 16,644 | 4,755 | 545 | 72 | ||||||||||||||
| as a % of loans and foreclosed properties |
5.22 | % | 4.34 | 1.29 | 0.17 | 0.03 | ||||||||||||||
| as a % total assets |
2.61 | % | 2.15 | 0.64 | 0.08 | 0.01 | ||||||||||||||
| Nonperforming loans as a % of total loans |
3.16 | % | 2.49 | 1.20 | 0.14 | 0.03 | ||||||||||||||
| Accruing loans 90 days or more past due |
$ | — | 5 | 104 | 4 | — | ||||||||||||||
55
Table of Contents
Table 9 - Allocation of Allowance for Loan Losses
| Years ended December 31 | ||||||||||||||||||||||||||||||||||||||||
| 2010 | 2009 | 2008 | 2007 | 2006 | ||||||||||||||||||||||||||||||||||||
| (Dollars in thousands) | Amount | %* | Amount | %* | Amount | %* | Amount | %* | Amount | %* | ||||||||||||||||||||||||||||||
| Commercial and industrial |
$ | 973 | 13.9 | $ | 784 | 14.3 | $ | 417 | 14.6 | $ | 620 | 15.7 | $ | 555 | 16.2 | |||||||||||||||||||||||||
| Construction and land development |
2,223 | 12.5 | 2,063 | 15.1 | 873 | 18.3 | 613 | 14.2 | 360 | 8.7 | ||||||||||||||||||||||||||||||
| Commercial real estate |
2,893 | 43.4 | 1,264 | 41.7 | 1,175 | 36.0 | 1,237 | 37.4 | 1,367 | 38.9 | ||||||||||||||||||||||||||||||
| Residential real estate |
1,336 | 27.4 | 1,706 | 25.9 | 1,430 | 27.8 | 1,214 | 29.1 | 1,241 | 32.9 | ||||||||||||||||||||||||||||||
| Consumer installment |
141 | 2.8 | 227 | 3.0 | 166 | 3.4 | 118 | 3.6 | 91 | 3.3 | ||||||||||||||||||||||||||||||
| Unallocated |
110 | 451 | 337 | 303 | 430 | |||||||||||||||||||||||||||||||||||
| Total allowance for loan losses |
$ | 7,676 | 100.0 | $ | 6,495 | 100.0 | $ | 4,398 | 100.0 | $ | 4,105 | 100.0 | $ | 4,044 | 100.0 | |||||||||||||||||||||||||
| * | Loan balance in each category expressed as a percentage of total loans. |
56
Table of Contents
Table 10 - CDs and Other Time Deposits of $100,000 or More
| (Dollars in thousands) | December 31, 2010 | |||
| Maturity of: |
||||
| 3 months or less |
$ | 26,531 | ||
| Over 3 months through 6 months |
11,881 | |||
| Over 6 months through 12 months |
45,380 | |||
| Over 12 months |
106,485 | |||
| Total CDs and other time deposits of $100,000 or more(1) |
$ | 190,277 | ||
|
(1) includes brokered certificates of deposit |
||||
57
Table of Contents
| ITEM 7A. | QUANTITATIVE AND QUALITATIVE DISCLOSURES ABOUT MARKET RISK |
The information called for by ITEM 7A is set forth in ITEM 7 under the caption “MARKET AND LIQUIDITY RISK MANAGEMENT” and is incorporated herein by reference.
| ITEM 8. | FINANCIAL STATEMENTS AND SUPPLEMENTARY DATA |
See Financial Statements and Supplementary Data contained within this Annual Report on Form 10-K.
| ITEM 9. | CHANGES IN AND DISAGREEMENTS WITH ACCOUNTANTS ON ACCOUNTING AND FINANCIAL DISCLOSURE |
Not applicable.
| ITEM 9A. | CONTROLS AND PROCEDURES |
Evaluation of Disclosure Controls and Procedures
As required by Rule 13a-15(b) under the Securities Exchange Act of 1934 (the “Exchange Act”), the Company’s management, under the supervision and with the participation of its principal executive and principal financial officer, conducted an evaluation as of the end of the period covered by this report, of the effectiveness of the Company’s disclosure controls and procedures as defined in Rule 13a-15(e) under the Exchange Act. Based on that evaluation, and the results of the audit process described below, the Chief Executive Officer and Principal Financial and Accounting Officer concluded that the Company’s disclosure controls and procedures were effective, in all material respects, to ensure that information required to be disclosed in the Company’s reports under the Exchange Act is recorded, processed, summarized and reported within the time periods specified in the SEC’s rules and regulations, and that such information is accumulated and communicated to the Company’s management, including the Chief Executive Officer and the Principal Financial and Accounting Officer, as appropriate, to allow timely decisions regarding disclosure.
Management’s Report on Internal Control Over Financial Reporting
The Company’s management is responsible for establishing and maintaining adequate internal control over financial reporting. The Company’s internal control system was designed to provide reasonable assurance to the Company’s management and board of directors regarding the preparation and fair presentation of published financial statements. All internal control systems, no matter how well designed, have inherent limitations. Therefore, even those systems determined to be effective can provide only reasonable assurance with respect to financial statement preparation and presentation.
Under the direction of the Company’s Chief Executive Officer and Principal Financial and Accounting Officer, management has assessed the effectiveness of the Company’s internal control over financial reporting as of December 31, 2010 in accordance with the criteria established in Internal Control – Integrated Framework issued by the Committee of Sponsoring Organizations of the Treadway Commission (“COSO”). Based on this assessment, management has concluded that such internal control over financial reporting was effective as of December 31, 2010.
This annual report does not include an attestation report of the Company’s independent registered public accounting firm regarding internal control over financial reporting. Management’s report was not subject to attestation by the Company’s registered public accounting firm pursuant to the final rules of the Securities and Exchange Commission that permit the Company to provide only management’s report in this annual report.
Changes in Internal Control Over Financial Reporting
During the period covered by this report, there has not been any change in the Company’s internal controls over financial reporting that has materially affected, or is reasonably likely to materially affect, the Company’s internal controls over financial reporting.
| ITEM 9B. | OTHER INFORMATION |
None.
58
Table of Contents
Report of Independent Registered Public Accounting Firm
The Board of Directors and Shareholders
Auburn National Bancorporation, Inc.:
We have audited the accompanying consolidated balance sheets of Auburn National Bancorporation, Inc. and subsidiaries (the Company) as of December 31, 2010 and 2009, and the related consolidated statements of earnings, stockholders’ equity and comprehensive income, and cash flows for each of the years in the three-year period ended December 31, 2010. These consolidated financial statements are the responsibility of the Company’s management. Our responsibility is to express an opinion on these consolidated financial statements based on our audits.
We conducted our audits in accordance with the standards of the Public Company Accounting Oversight Board (United States). Those standards require that we plan and perform the audit to obtain reasonable assurance about whether the financial statements are free of material misstatement. An audit includes examining, on a test basis, evidence supporting the amounts and disclosures in the financial statements. An audit also includes assessing the accounting principles used and significant estimates made by management as well as evaluating the overall financial statement presentation. We believe that our audits provide a reasonable basis for our opinion.
In our opinion, the consolidated financial statements referred to above present fairly, in all material respects, the financial position of Auburn National Bancorporation, Inc. and subsidiaries as of December 31, 2010 and 2009, and the results of their operations and their cash flows for each of the years in the three-year period ended December 31, 2010 in conformity with U.S. generally accepted accounting principles.

Birmingham, Alabama
March 29, 2011
59
Table of Contents
AUBURN NATIONAL BANCORPORATION, INC. AND SUBSIDIARIES
Consolidated Balance Sheets
| December 31 | ||||||||
| (Dollars in thousands, except share data) |
2010 |
2009 | ||||||
| Assets: |
||||||||
| Cash and due from banks |
$ | 11,432 | $ | 11,567 | ||||
| Federal funds sold |
7,500 | — | ||||||
| Interest bearing bank deposits |
2,492 | 828 | ||||||
| Cash and cash equivalents |
21,424 | 12,395 | ||||||
| Securities available-for-sale |
315,220 | 334,762 | ||||||
| Loans held for sale |
4,281 | 4,881 | ||||||
| Loans, net of unearned income |
374,215 | 376,103 | ||||||
| Allowance for loan losses |
(7,676 | ) | (6,495 | ) | ||||
| Loans, net |
366,539 | 369,608 | ||||||
| Premises and equipment, net |
8,105 | 8,282 | ||||||
| Bank-owned life insurance |
16,171 | 15,719 | ||||||
| Other real estate owned |
8,125 | 7,292 | ||||||
| Other assets |
23,964 | 20,443 | ||||||
| Total assets |
$ | 763,829 | $ | 773,382 | ||||
| Liabilities: |
||||||||
| Deposits: |
||||||||
| Noninterest-bearing |
$ | 87,660 | $ | 76,497 | ||||
| Interest-bearing |
519,467 | 502,912 | ||||||
| Total deposits |
607,127 | 579,409 | ||||||
| Federal funds purchased and securities sold under agreements to repurchase |
2,685 | 15,960 | ||||||
| Long-term debt |
93,331 | 118,349 | ||||||
| Accrued expenses and other liabilities |
4,318 | 3,481 | ||||||
| Total liabilities |
707,461 | 717,199 | ||||||
| Stockholders’ equity: |
||||||||
| Preferred stock of $.01 par value; authorized 200,000 shares; |
— | — | ||||||
| Common stock of $.01 par value; authorized 8,500,000 shares; |
39 | 39 | ||||||
| Additional paid-in capital |
3,752 | 3,751 | ||||||
| Retained earnings |
61,421 | 58,917 | ||||||
| Accumulated other comprehensive (loss) income, net |
(2,201 | ) | 111 | |||||
| Less treasury stock, at cost - 314,417 shares and 314,018 shares for December 31, 2010 and 2009, respectively |
(6,643 | ) | (6,635 | ) | ||||
| Total stockholders’ equity |
56,368 | 56,183 | ||||||
| Total liabilities and stockholders’ equity |
$ | 763,829 | $ | 773,382 | ||||
See accompanying notes to consolidated financial statements
60
Table of Contents
AUBURN NATIONAL BANCORPORATION, INC. AND SUBSIDIARIES
Consolidated Statements of Earnings
| Years ended December 31 | ||||||||||||
| (Dollars in thousands, except share and per share data) |
2010 |
2009 | 2008 | |||||||||
| Interest income: |
||||||||||||
| Loans, including fees |
$ | 21,809 | $ | 21,864 | $ | 22,447 | ||||||
| Securities |
11,633 | 14,946 | 15,839 | |||||||||
| Federal funds sold and interest bearing bank deposits |
30 | 24 | 75 | |||||||||
| Total interest income |
33,472 | 36,834 | 38,361 | |||||||||
| Interest expense: |
||||||||||||
| Deposits |
10,038 | 13,139 | 15,075 | |||||||||
| Short-term borrowings |
23 | 55 | 324 | |||||||||
| Long-term debt |
4,512 | 4,825 | 5,092 | |||||||||
| Total interest expense |
14,573 | 18,019 | 20,491 | |||||||||
| Net interest income |
18,899 | 18,815 | 17,870 | |||||||||
| Provision for loan losses |
3,580 | 5,250 | 870 | |||||||||
| Net interest income after provision for loan losses |
15,319 | 13,565 | 17,000 | |||||||||
| Noninterest income: |
||||||||||||
| Service charges on deposit accounts |
1,280 | 1,243 | 1,252 | |||||||||
| Mortgage lending |
3,042 | 4,048 | 1,694 | |||||||||
| Bank-owned life insurance |
452 | 424 | 470 | |||||||||
| Other |
1,069 | 1,120 | 1,954 | |||||||||
| Securities gains (losses), net |
||||||||||||
| Realized gains, net |
3,451 | 2,847 | 357 | |||||||||
| Total other-than-temporary impairments |
(2,238 | ) | (6,807 | ) | (1,525 | ) | ||||||
| Non-credit portion of other-than-temporary impairments recognized in other comprehensive income |
210 | 257 | — | |||||||||
| Total securities gains (losses), net |
1,423 | (3,703 | ) | (1,168 | ) | |||||||
| Total noninterest income |
7,266 | 3,132 | 4,202 | |||||||||
| Noninterest expense: |
||||||||||||
| Salaries and benefits |
7,950 | 7,819 | 7,278 | |||||||||
| Net occupancy and equipment |
1,450 | 1,500 | 1,314 | |||||||||
| Professional fees |
702 | 799 | 511 | |||||||||
| FDIC and other regulatory assessments |
1,092 | 1,322 | 358 | |||||||||
| Other real estate owned, net |
1,378 | 43 | 67 | |||||||||
| Prepayment penalty on long-term debt |
679 | — | — | |||||||||
| Other |
3,190 | 3,150 | 3,014 | |||||||||
| Total noninterest expense |
16,441 | 14,633 | 12,542 | |||||||||
| Earnings before income taxes |
6,144 | 2,064 | 8,660 | |||||||||
| Income tax expense (benefit) |
798 | (340 | ) | 2,023 | ||||||||
| Net earnings |
$ | 5,346 | $ | 2,404 | $ | 6,637 | ||||||
| Net earnings per share: |
||||||||||||
| Basic and diluted |
$ | 1.47 | $ | 0.66 | $ | 1.81 | ||||||
| Weighted average shares outstanding: |
||||||||||||
| Basic and diluted |
3,642,851 | 3,644,691 | 3,674,384 | |||||||||
See accompanying notes to consolidated financial statements
61
Table of Contents
AUBURN NATIONAL BANCORPORATION, INC. AND SUBSIDIARIES
Consolidated Statements of Stockholders’ Equity and Comprehensive Income
|
Common Stock |
Additional paid-in capital |
Retained earnings |
Accumulated other comprehensive income (loss) |
Treasury stock |
Total | |||||||||||||||||||||||
| (Dollars in thousands, except share and per share data) | Shares | Amount | ||||||||||||||||||||||||||
| Balance, December 31, 2007 |
3,957,135 | $ | 39 | $ | 3,748 | $ | 55,362 | $ | (397 | ) | $ | (5,734 | ) | $ | 53,018 | |||||||||||||
| Comprehensive income: |
||||||||||||||||||||||||||||
| Net earnings |
— | — | — | 6,637 | — | — | 6,637 | |||||||||||||||||||||
| Other comprehensive income due to change in unrealized gain on securities available for sale, net |
— | — | — | — | 1,000 | — | 1,000 | |||||||||||||||||||||
| Total comprehensive income |
— | — | — | 6,637 | 1,000 | — | 7,637 | |||||||||||||||||||||
| Cash dividends paid ($0.74 per share) |
— | — | — | (2,716 | ) | — | — | (2,716) | ||||||||||||||||||||
| Stock repurchases (34,932 shares) |
— | — | — | — | — | (813 | ) | (813) | ||||||||||||||||||||
| Sale of treasury stock (70 shares) |
— | — | 1 | — | — | 1 | 2 | |||||||||||||||||||||
| Balance, December 31, 2008 |
3,957,135 | $ | 39 | $ | 3,749 | $ | 59,283 | $ | 603 | $ | (6,546 | ) | $ | 57,128 | ||||||||||||||
| Comprehensive income: |
||||||||||||||||||||||||||||
| Net earnings |
— | — | — | 2,404 | — | — | 2,404 | |||||||||||||||||||||
| Other comprehensive loss due to change in other-than-temporary impairment losses related to factors other than credit on available-for- sale, net |
— | — | — | — | (162 | ) | — | (162) | ||||||||||||||||||||
| Other comprehensive loss due to change in unrealized loss on securities available for sale, net |
— | — | — | — | (330 | ) | — | (330) | ||||||||||||||||||||
| Total comprehensive income |
— | — | — | 2,404 | (492 | ) | — | 1,912 | ||||||||||||||||||||
| Cash dividends paid ($0.76 per share) |
— | — | (2,770 | ) | — | (2,770) | ||||||||||||||||||||||
| Stock repurchases (3,955 shares) |
— | — | — | — | (90 | ) | (90) | |||||||||||||||||||||
| Sale of treasury stock (125 shares) |
— | 2 | — | — | 1 | 3 | ||||||||||||||||||||||
| Balance, December 31, 2009 |
3,957,135 | $ | 39 | $ | 3,751 | $ | 58,917 | $ | 111 | $ | (6,635 | ) | $ | 56,183 | ||||||||||||||
| Comprehensive income: |
||||||||||||||||||||||||||||
| Net earnings |
— | — | — | 5,346 | — | — | 5,346 | |||||||||||||||||||||
| Other comprehensive loss due to change in other-than-temporary impairment losses related to factors other than credit on available-for- sale, net |
— | — | — | — | (133 | ) | — | (133) | ||||||||||||||||||||
| Other comprehensive loss due to change in unrealized loss on securities available for sale, net |
— | — | — | (2,179 | ) | — | (2,179) | |||||||||||||||||||||
| Total comprehensive income |
— | — | 5,346 | (2,312 | ) | — | 3,034 | |||||||||||||||||||||
| Cash dividends paid ($0.78 per share) |
— | — | (2,842 | ) | — | — | (2,842) | |||||||||||||||||||||
| Stock repurchases (484 shares) |
— | — | — | — | (9 | ) | (9) | |||||||||||||||||||||
| Sale of treasury stock (85 shares) |
— | 1 | — | — | 1 | 2 | ||||||||||||||||||||||
| Balance, December 31, 2010 |
3,957,135 | $ | 39 | $ | 3,752 | $ | 61,421 | $ | (2,201 | ) | $ | (6,643 | ) | $ | 56,368 | |||||||||||||
See accompanying notes to consolidated financial statements
62
Table of Contents
AUBURN NATIONAL BANCORPORATION, INC. AND SUBSIDIARIES
Consolidated Statements of Cash Flows
| Years ended December 31 | ||||||||||||
| (In thousands) |
2010 |
2009 |
2008 |
|||||||||
| Cash flows from operating activities: |
||||||||||||
| Net earnings |
$ | 5,346 | $ | 2,404 | $ | 6,637 | ||||||
| Adjustments to reconcile net income to net cash provided by operating activities: |
||||||||||||
| Provision for loan losses |
3,580 | 5,250 | 870 | |||||||||
| Depreciation and amortization |
902 | 705 | 1,052 | |||||||||
| Premium amortization and discount accretion, net |
2,071 | 1,562 | 5 | |||||||||
| Deferred tax benefit |
(777 | ) | (2,190 | ) | (668) | |||||||
| Net (gain) loss on securities available for sale |
(1,423 | ) | 1,723 | 1,168 | ||||||||
| Net gain on sale of loans held for sale |
(2,691 | ) | (3,701 | ) | (606) | |||||||
| Net loss on nonmarketable equity investments |
— | 1,980 | — | |||||||||
| Net loss (gain) on other real estate owned |
1,217 | (64 | ) | 8 | ||||||||
| Loans originated for sale |
(100,721 | ) | (157,041 | ) | (79,947) | |||||||
| Proceeds from sale of loans |
103,488 | 158,766 | 79,712 | |||||||||
| Net loss (gain) on disposition of premises and equipment |
4 | — | (1,064) | |||||||||
| Increase in cash surrender value of bank owned life insurance |
(452 | ) | (424 | ) | (470) | |||||||
| Loss on prepayment of long-term debt |
679 | — | — | |||||||||
| Net increase in other assets |
(1,677 | ) | (4,409 | ) | (979) | |||||||
| Net increase (decrease) in accrued expenses and other liabilities |
837 | (240 | ) | 298 | ||||||||
| Net cash provided by operating activities |
10,383 | 4,321 | 6,016 | |||||||||
| Cash flows from investing activities: |
||||||||||||
| Proceeds from sales of securities available-for-sale |
180,206 | 146,966 | 67,431 | |||||||||
| Proceeds from maturities and calls of securities available-for-sale |
194,570 | 105,497 | 67,933 | |||||||||
| Purchase of securities available-for-sale |
(359,547 | ) | (288,633 | ) | (119,202) | |||||||
| Net increase in loans |
(3,221 | ) | (17,593 | ) | (47,975) | |||||||
| Net purchases of premises and equipment |
(146 | ) | (824 | ) | (2,210) | |||||||
| Proceeds from the sale of premises and equipment |
— | — | 1,606 | |||||||||
| Proceeds from sale of other real estate owned |
660 | 724 | 412 | |||||||||
| Improvements to other real estate owned |
— | (129 | ) | — | ||||||||
| Net decrease (increase) in FHLB stock |
227 | (107 | ) | (452) | ||||||||
| Net cash provided by (used in) investing activities |
12,749 | (54,099 | ) | (32,457) | ||||||||
| Cash flows from financing activities: |
||||||||||||
| Net increase (decrease) in noninterest-bearing deposits |
11,163 | (1,516 | ) | 7,772 | ||||||||
| Net increase in interest-bearing deposits |
16,555 | 30,082 | 50,486 | |||||||||
| Net (decrease) increase in federal funds purchased and securities sold under agreements to repurchase |
(13,275 | ) | 5,050 | (13,337) | ||||||||
| Proceeds from issuance of long-term debt |
— | — | 18,000 | |||||||||
| Repayments or retirement of long-term debt |
(25,697 | ) | (5,019 | ) | (10,018) | |||||||
| Stock repurchases |
(9 | ) | (90 | ) | (813) | |||||||
| Proceeds from sale of treasury stock |
2 | 3 | 2 | |||||||||
| Dividends paid |
(2,842 | ) | (2,770 | ) | (2,716) | |||||||
| Net cash (used in) provided by financing activities |
(14,103 | ) | 25,740 | 49,376 | ||||||||
| Net change in cash and cash equivalents |
9,029 | (24,038 | ) | 22,935 | ||||||||
| Cash and cash equivalents at beginning of period |
12,395 | 36,433 | 13,498 | |||||||||
| Cash and cash equivalents at end of period |
$ | 21,424 | $ | 12,395 | $ | 36,433 | ||||||
| Supplemental disclosures of cash flow information: |
||||||||||||
| Cash paid during the period for: |
||||||||||||
| Interest |
$ | 15,044 | $ | 18,560 | $ | 20,551 | ||||||
| Income taxes |
2,113 | 1,830 | 3,068 | |||||||||
| Supplemental disclosure of non-cash transactions: |
||||||||||||
| Real estate acquired through foreclosure |
2,710 | 7,499 | 647 | |||||||||
See accompanying notes to consolidated financial statements
63
Table of Contents
NOTE 1: SUMMARY OF SIGNIFICANT ACCOUNTING POLICIES
Nature of Business
Auburn National Bancorporation, Inc. (the “Company”) is a bank holding company whose primary business is conducted by its wholly-owned subsidiary, AuburnBank (the “Bank”). AuburnBank is a commercial bank located in Auburn, Alabama. The Bank provides a full range of banking services in its primary market area, Lee County, which includes the Auburn-Opelika Metropolitan Statistical Area.
Basis of Presentation
The consolidated financial statements include the accounts of the Company and its wholly-owned subsidiary, AuburnBank. Significant intercompany transactions are eliminated in consolidation.
Use of Estimates
The preparation of financial statements in conformity with U.S. generally accepted accounting principles requires management to make estimates and assumptions that affect the reported amounts of assets and liabilities and the disclosure of contingent assets and liabilities as of the balance sheet date and the reported amounts of income and expense during the reporting period. Actual results could differ from those estimates. Material estimates that are particularly susceptible to significant change in the near term include the determination of the allowance for loan losses, fair value measurements, valuation of other real estate owned, and valuation of deferred tax assets.
Correction of Accounting Errors
Income tax benefit for the year ended December 31, 2009 included a $281 thousand tax benefit related to the correction of an error in prior periods that resulted from the incorrect calculation of tax basis for certain available-for-sale securities, primarily related to periods prior to January 1, 2007. Other noninterest income for the year ended December 31, 2008 included a $452 thousand pre-tax charge ($285 thousand after-tax) related to the correction of an error in prior periods that resulted from the incorrect application of the equity method of accounting for an investment in an affordable housing limited partnership, primarily related to the years ended December 31, 2005, 2006 and 2007. Management believes the impact of these corrections are not material to current or prior period financial statements and the Company’s Audit Committee of the Board of Directors, based on information reviewed by management with the Audit Committee, concurs with management’s conclusion.
Reclassifications
Certain amounts reported in prior periods have been reclassified to conform to the current-period presentation. These reclassifications had no effect on the Company’s previously reported net earnings or total stockholders’ equity.
Accounting Standards Adopted in 2010
In the first quarter of 2010, the Company adopted new guidance related to the following Codification topics:
| • | Accounting Standards Update (“ASU”) 2009-16, Accounting for Transfers of Financial Assets; |
| • | ASU 2009-17, Improvements to Financial Reporting by Enterprises Involved with Variable Interest; |
| • | ASU 2010-06, Improving Disclosures about Fair Value Measurements; and |
| • | ASU 2010-10, Consolidation: Amendments for Certain Investment Funds. |
In the third quarter of 2010, the Company adopted new guidance related to the following Codification topic:
| • | ASU 2010-11, Derivatives and Hedging: Scope Exception Related to Embedded Credit Derivatives. |
64
Table of Contents
In the fourth quarter of 2010, the company adopted new guidance related to the following Codification topics:
| • | ASU 2010-20, Disclosures about the Credit Quality of Financing Receivables and the Allowance for Credit Losses; and |
| • | ASU 2011-01, Deferral of the Effective Date of Disclosures about Troubled Debt Restructurings in Update. |
Information about these pronouncements is described in more detail below.
ASU 2009-16, Accounting for Transfers of Financial Assets, modifies certain guidance contained in FASB Accounting Standards Codification (“ASC”) 860, Transfers and Servicing. This standard eliminates the concept of qualifying special purpose entities (QSPEs) and provides additional criteria transferors must use to evaluate transfers of financial assets. To determine if a transfer is to be accounted for as a sale, the transferor must assess whether it and all of the entities included in its consolidated financial statements have surrendered control of the assets. A transferor must consider all arrangements or agreements made or contemplated at the time of transfer before reaching a conclusion on whether control has been relinquished. The standard also addresses situations in which a portion of a financial asset is transferred. In such instances the transfer can only be accounted for as a sale when the transferred portion is considered to be a participating interest, as defined, and also requires that any assets or liabilities retained from a transfer accounted for as a sale be initially recognized at fair value. This standard was effective for the Company as of January 1, 2010, with adoption applied prospectively for transfers that occur on and after the effective date. Adoption of this standard did not have a significant impact on the consolidated financial statements of the Company.
ASU 2009-17, Improvements to Financial Reporting by Enterprises Involved with Variable Interest Entities, amends several key consolidation provisions related to variable interest entities (“VIEs”), which are included in FASB ASC 810, Consolidation. First, the scope of the standard includes entities that are currently designated as QSPEs. Second, the standard changes the approach companies use to identify the VIEs for which they are deemed to be the primary beneficiary and are required to consolidate. Under the former rules, the primary beneficiary is the entity that absorbs the majority of a VIE’s losses and receives the majority of the VIE’s returns. The new guidance identifies a VIE’s primary beneficiary as the entity that has the power to direct the VIE’s significant activities that effect the economic performance of the entity, and has an obligation to absorb losses or the right to receive benefits that could be potentially significant to the VIE. Third, the standard requires companies to continually reassess whether they are the primary beneficiary of a VIE. The former rules only require companies to reconsider primary beneficiary conclusions when certain triggering events have occurred. The standard was effective for the Company as of January 1, 2010, and applies to all current QSPEs and VIEs, and VIEs created after the effective date. Adoption of this standard did not have a significant impact on the consolidated financial statements of the Company.
ASU 2010-6, Improving Disclosures about Fair Value Measurements, amends AS 820, Fair Value Measurements and Disclosures. ASU 2010-6 requires expanded disclosures related to fair value measurements including (i) the amounts of significant transfers of assets or liabilities between Levels 1 and 2 of the fair value hierarchy and the reasons for the transfers, (ii) the reasons for transfers of assets or liabilities in or out of Level 3 of the fair value hierarchy, with significant transfers disclosed separately, (iii) the policy for determining when transfers between levels of the fair value hierarchy are recognized and (iv) for recurring fair value measurements of assets and liabilities in Level 3 of the fair value hierarchy, a gross presentation of information about purchases, sales, issuances and settlements. ASU 2010-6 further clarifies that (i) fair value measurement disclosures should be provided for each class of assets and liabilities (rather than major category), which would generally be a subset of assets or liabilities within a line item in the statement of financial position and (ii) companies should provide disclosures about the valuation techniques and inputs used to measure fair value for both recurring and nonrecurring fair value measurements for each class of assets and liabilities included in Levels 2 and 3 of the fair value hierarchy. The disclosures related to the gross presentation of purchases, sales, issuances and settlements of assets and liabilities included in Level 3 of the fair value hierarchy will be required for the Company beginning January 1, 2011. The remaining disclosure requirements and clarifications in ASU 2010-06 became effective for the Company on January 1, 2010. Adoption did not affect the Company’s consolidated financial results, since it amended only the disclosure requirements for fair value measurements. See Note 16 of the Consolidated Financial Statements.
ASU 2010-10, Consolidation: Amendments for Certain Investment Funds, which defers, for certain investment funds, the consolidation requirements resulting from the issuance of ASU 2009-17. Specifically, the deferral is applicable for a reporting entity’s interest in an entity (1) that has all the attributes of an investment company or (2) for which it is industry practice to apply measurement principles for financial reporting purposes that are consistent with those followed by investment companies. ASU 2010-10 was effective for periods beginning after November 15, 2009. Adoption of this standard did not have a significant impact on the consolidated financial statements of the Company.
65
Table of Contents
ASU 2010-11, Derivatives and Hedging: Scope Exception Related to Embedded Credit Derivatives, amends and clarifies the accounting for credit derivatives embedded in interests in securitized financial assets. ASU 2010-11 amends ASC 815 to provide clarifying language and examples of when an embedded credit derivative’s features are not considered “embedded derivatives subject to potential bifurcation and separate accounting”. The guidance was effective for the Company beginning in the third quarter 2010. Adoption of this standard did not have a significant impact on the consolidated financial statements of the Company.
ASU 2010-20, Disclosures about the Credit Quality of Financing Receivables and the Allowance for Credit Losses, requires enhanced disclosures for the allowance for credit losses and financing receivables, which include certain loans and long-term accounts receivable. Companies will be required to disaggregate credit quality information, including receivables on nonaccrual status, aging of past due receivables, and the roll forward of the allowance for credit losses, by portfolio segment or class of financing receivable. Portfolio segment is the level at which an entity evaluates credit risk and determines its allowance for credit losses, and class of financing receivable is generally a lower level of portfolio segment. This guidance was effective for the Company in the fourth quarter of 2010 with prospective application. Companies must also provide more granular information on the nature and extent of TDRs and their effect on the allowance for credit losses. Under ASU 2011-01, Deferral of the Effective Date of Disclosures about Troubled Debt Restructurings in Update No. 2010-20, these TDR disclosures have been deferred to coincide with a separate FASB TDR project, with an expected effective date in second quarter 2011. Adoption of this standard did not affect the Company’s consolidated financial results, since it amended only the disclosure requirements for the allowance for loan losses. See Note 5 of the Consolidated Financial Statements.
Cash Equivalents
Cash on hand, cash items in process of collection, amounts due from banks, and federal funds sold are included in cash and cash equivalents.
Securities
Securities are classified based on management’s intention at the date of purchase. At December 31, 2010, all of the Company’s securities were classified as available-for-sale. Securities available-for-sale are used as part of the Company’s interest rate risk management strategy, and they may be sold in response to changes in interest rates, changes in prepayment risks or other factors. All securities classified as available-for-sale are recorded at fair value with any unrealized gains and losses reported in accumulated other comprehensive loss, net of the deferred income tax effects. Interest and dividends on securities, including the amortization of premiums and accretion of discounts are calculated using a method that approximates the effective interest method over the anticipated life of the security, taking into consideration prepayment assumptions. Realized gains and losses from the sale of securities are determined using the specific identification method.
On a quarterly basis, management makes an assessment to determine whether there have been events or economic circumstances to indicate that a security on which there is an unrealized loss is other-than-temporarily impaired. For equity securities with an unrealized loss, the Company considers many factors including the severity and duration of the impairment; the intent and ability of the Company to hold the security for a period of time sufficient for a recovery in value; and recent events specific to the issuer or industry. Equity securities on which there is an unrealized loss that is deemed to be other-than-temporary are written down to fair value with the write-down recorded as a realized loss in securities gains (losses).
For debt securities with an unrealized loss, an other-than-temporary impairment write-down is triggered when (1) the Company has the intent to sell a debt security, (2) it is more likely than not that the entity will be required to sell the debt security before recovery of its amortized cost basis, or (3) the entity does not expect to recover the entire amortized cost basis of the debt security. If the Company has the intent to sell a debt security or if it is more likely than not that that it will be required to sell the debt security before recovery, the other-than-temporary write-down is equal to the entire difference between the debt security’s amortized cost and its fair value. If the Company does not intend to sell the security or it is not more likely than not that it will be required to sell the security before recovery, the other-than-temporary impairment write-down is separated into the amount that is credit related (credit loss component) and the amount due to all other factors. The credit loss component is recognized in earnings, as a realized loss in securities gains (losses), and is the difference between the security’s amortized cost basis and the present value of its expected future cash flows. The remaining difference between the security’s fair value and the present value of future expected cash flows is due to factors that are not credit related and is recognized in other comprehensive income, net of applicable taxes.
66
Table of Contents
Loans held for sale
Loans originated and intended for sale in the secondary market are carried at the lower of cost or estimated fair value as determined on an aggregated basis. Estimated fair value is determined on the basis of existing commitments or the current market value of similar loans. Loan sales are recognized when the transaction closes, the proceeds are collected, and ownership is transferred. Continuing involvement, through the sales agreement, consists of the right to service the loan for a fee for the life of the loan, if applicable. Gains on the sale of loans held for sale are recorded as part of mortgage lending income in the Consolidated Statements of Earnings.
In the course of conducting the Company’s mortgage lending activities of originating mortgage loans and selling those loans in the secondary market, various representations and warranties are made to the purchaser of the mortgage loans. Every loan closed by the Bank’s mortgage center is run through a government agency automated underwriting system. Any exceptions noted during this process are remedied prior to sale. These representations and warranties also apply to underwriting the real estate appraisal opinion of value for the collateral securing these loans. Under the representations and warranties, failure by the Company to comply with the underwriting and/or appraisal standards could result in the Company being required to repurchase the mortgage loan or to reimburse the investor for losses incurred (make whole requests) if such failure cannot be cured by the Company within the specified period following discovery. During 2010, no loans were repurchased and no reimbursements for investor losses were made by the Company.
Loans
Loans are reported at their outstanding principal balances, net of any unearned income, charge-offs, and any deferred fees or costs on originated loans. Interest income is accrued based on the principal balance outstanding. Loan origination fees, net of certain loan origination costs, are deferred and recognized as an adjustment to the related loan yield using a method that approximates the interest method. Loan commitment fees are generally deferred and amortized on a straight-line basis over the commitment period, which results in a recorded amount that approximates fair value.
The accrual of interest on loans is discontinued when there is a significant deterioration in the financial condition of the borrower and full repayment of principal and interest is not expected or the principal or interest is more than 90 days past due, unless the loan is both well-collateralized and in the process of collection. Generally, all interest accrued but not collected for loans that are placed on nonaccrual status are reversed against current interest income. Interest collections on nonaccrual loans are generally applied as principal reductions. The Company determines past due or delinquency status of a loan based on contractual payment terms.
A loan is considered impaired when it is probable the Company will be unable to collect all principal and interest payments due according to the contractual terms of the loan agreement. Individually identified impaired loans are measured based on the present value of expected payments using the loan’s original effective rate as the discount rate, the loan’s observable market price, or the fair value of the collateral if the loan is collateral dependent. If the recorded investment in the impaired loan exceeds the measure of fair value, a valuation allowance may be established as part of the allowance for loan losses. Changes to the valuation allowance are recorded as a component of the provision for loan losses.
Impaired loans also included troubled debt restructurings (“TDRs”). In the normal course of business, management grants concessions to borrowers, which would not otherwise be considered, where the borrowers are experiencing financial difficulty. The concessions granted most frequently for TDRs involve reductions or delays in required payments of principal and interest for a specified time, the rescheduling of payments in accordance with a bankruptcy plan or the charge-off of a portion of the loan. In most cases, the conditions of the credit also warrant nonaccrual status, even after the restructure occurs. As part of the credit approval process, the restructured loans are evaluated for adequate collateral protection in determining the appropriate accrual status at the time of restructure. TDR loans may be returned to accrual status if there has been at least a six-month sustained period of repayment performance by the borrower.
Allowance for Loan Losses
The allowance for loan losses is maintained at a level that management believes is adequate to absorb probable losses inherent in the loan portfolio. Loan losses are charged against the allowance when they are known. Subsequent recoveries are credited to the allowance. Management’s determination of the adequacy of the allowance is based on an evaluation of the portfolio, current economic conditions, growth, composition of the loan portfolio, homogeneous pools of loans, risk ratings of specific loans, historical loan loss factors, identified impaired loans and other factors related to the portfolio. This evaluation is performed quarterly and is inherently subjective, as it requires various material estimates that are susceptible to significant change, including the amounts and timing of future cash flows expected to be received on any impaired loans. In addition, regulatory agencies, as an integral part of their examination process, will periodically review the Company’s allowance for loan losses, and may require the Company to record additions to the allowance based on their judgment about information available to them at the time of their examinations.
67
Table of Contents
Premises and Equipment
Land is carried at cost. Buildings and equipment are carried at cost, less accumulated depreciation computed on a straight-line method over the useful lives of the assets or the expected terms of the leases, if shorter. Expected terms include lease option periods to the extent that the exercise of such options is reasonably assured.
Other Real Estate Owned
Other real estate owned (“OREO”) includes properties acquired through, or in lieu of, loan foreclosure that are held for sale and are initially recorded at the lower of the loan’s carrying amount or fair value less cost to sell at the date of foreclosure, establishing a new cost basis. Subsequent to foreclosure, valuations are periodically performed by management and the assets are carried at the lower of carrying value amount or fair value less cost to sell. Gains or losses realized upon sale of OREO and additional losses related to subsequent valuation adjustments are determined on a specific property basis and are included as a component of Other real estate owned, net, within noninterest expense.
Nonmarketable equity investments
Nonmarketable equity investments include equity securities that are not publicly traded and securities acquired for various purposes. The Bank is required to maintain certain minimum levels of equity investments with certain regulatory and other entities in which the Bank has an ongoing business relationship based on the common stock and surplus (Federal Reserve Bank) or outstanding borrowings (Federal Home Loan Bank of Atlanta) of the Bank. These securities are accounted for under the cost method and are included in other assets. For cost-method investments, on a quarterly basis, the Company evaluates whether an event or change in circumstances has occurred during the reporting period that may have a significant adverse effect on the fair value of the investment. If the Company determines that a decline in value is other-than-temporary, the Company will recognize the estimated loss in securities gains (losses), net.
Transfers of Financial Assets
Transfers of an entire financial asset (i.e. loan sales), a group of entire financial assets, or a participating interest in an entire financial asset (i.e. loan participations sold) are accounted for as sales when control over the assets have been surrendered. Control over transferred assets is deemed to be surrendered when (1) the assets have been isolated from the Company, (2) the transferee obtains the right (free of conditions that constrain it from taking that right) to pledge or exchange the transferred assets, and (3) the Company does not maintain effective control over the transferred assets through an agreement to repurchase them before their maturity.
Mortgage Servicing Rights
The Company recognizes as assets the rights to service mortgage loans for others, known as MSRs. The Company determines the fair value of MSRs at the date the loan is transferred. To determine the fair value of MSRs, the Company engages an independent third party. The independent third party’s valuation model calculates the present value of estimated future net servicing income using assumptions that market participants would use in estimating future net servicing income, including estimates of prepayment speeds, discount rate, default rates, cost to service, escrow account earnings, contractual servicing fee income, ancillary income, and late fees.
Subsequent to the date of transfer, the Company has elected to measure its MSRs under the amortization method. Under the amortization method, MSRs are amortized in proportion to, and over the period of, estimated net servicing income. The amortization of MSRs is analyzed monthly and is adjusted to reflect changes in prepayment speeds, as well as other factors. MSRs are evaluated for impairment based on the fair value of those assets. Impairment is determined by stratifying MSRs into groupings based on predominant risk characteristics, such as interest rate and loan type. If, by individual stratum, the carrying amount of the MSRs exceeds fair value, a valuation reserve is established through a charge to earnings. The valuation reserve is adjusted as the fair value changes. MSRs are included in the other assets category in the accompanying consolidated balance sheets.
Derivative Instruments
In accordance with FASB ASC Topic 815, Derivatives and Hedging, all derivative instruments are recorded on the consolidated balance sheet at their respective fair values.
The accounting for changes in fair value (i.e., gains or losses) of a derivative instrument depends on whether it has been designated and qualifies as part of a hedging relationship and, if so, on the reason for holding it. If the derivative instrument is not designated as part of a hedging relationship, the gain or loss on the derivative instrument is recognized in earnings in the period of change. None of the derivatives utilized by the Company have been designated as a hedge.
68
Table of Contents
Securities sold under agreements to repurchase
Securities sold under agreements to repurchase generally mature less than one year from the transaction date. Securities sold under agreements to repurchase are reflected as a secured borrowing in the accompanying consolidated balance sheets at the amount of cash received in connection with each transaction.
Income Taxes
Deferred tax assets and liabilities are the expected future tax amounts for the temporary differences between carrying amounts and tax bases of assets and liabilities, computed using enacted tax rates. A valuation allowance, if needed, reduces deferred tax assets to the amount expected to be realized. The net deferred tax asset is reflected as a component of Other Assets on the Consolidated Balance Sheets.
Income tax expense or benefit for the year is allocated among continuing operations and other comprehensive income (loss), as applicable. The amount allocated to continuing operations is the income tax effect of the pretax income or loss from continuing operations that occurred during the year, plus or minus income tax effects of (1) changes in certain circumstances that cause a change in judgment about the realization of deferred tax assets in future years, (2) changes in income tax laws or rates, and (3) changes in income tax status, subject to certain exceptions. The amount allocated to other comprehensive income (loss) is related solely to changes in the valuation allowance on items that are normally accounted for in other comprehensive income (loss) such as unrealized gains or losses on available-for-sale securities.
In accordance with ASC 740, a tax position is recognized as a benefit only if it is “more likely than not” that the tax position would be sustained in a tax examination, with a tax examination being presumed to occur. The amount recognized is the largest amount of tax benefit that is greater than 50% likely of being realized on examination. For tax positions not meeting the “more likely than not” test, no tax benefit is recorded. The adoption had no material affect on the Company’s financial statements. It is the Company’s policy to recognize interest and penalties related to income tax matters in income tax expense. The Company and its wholly-owned subsidiary file a consolidated income tax return.
Fair Value Measurements
FASB ASC 820, which defines fair value, establishes a framework for measuring fair value in U.S. generally accepted accounting principles and expands disclosures about fair value measurements. ASC 820 applies only to fair-value measurements that are already required or permitted by other accounting standards. The definition of fair value focuses on the exit price, i.e., the price that would be received to sell an asset or paid to transfer a liability in an orderly transaction between market participants at the measurement date, not the entry price, i.e., the price that would be paid to acquire the asset or received to assume the liability at the measurement date. The statement emphasizes that fair value is a market-based measurement; not an entity-specific measurement. Therefore, the fair value measurement should be determined based on the assumptions that market participants would use in pricing the asset or liability. For more information related to fair value measurements, please refer to Note 16.
Subsequent Events
The Company has evaluated the effects of events or transactions through the date of this filing that have occurred subsequent to December 31, 2010. The Company does not believe there are any material subsequent events that would require further recognition or disclosure.
Earnings Per Share
Basic net earnings per share are computed by dividing net earnings by the weighted average common shares outstanding for the year. Diluted net earnings per share reflect the potential dilution that could occur if the Company’s potential common stock was issued. As of December 31, 2010, 2009 and 2008, the Company had no options issued or outstanding and therefore no dilutive effect to consider for the diluted earnings per share calculation.
69
Table of Contents
A reconciliation of the numerator and denominator of the basic and diluted earnings per share computation for the years ended December 31, 2010, 2009 and 2008, respectively, is presented below.
| Years ended December 31 | ||||||||||||
| (Dollars in thousands, except share and per share data) |
2010 |
2009 |
2008 |
|||||||||
| Basic and diluted: |
||||||||||||
| Net earnings |
$ | 5,346 | $ | 2,404 | $ | 6,637 | ||||||
| Average common shares outstanding |
3,642,851 | 3,644,691 | 3,674,384 | |||||||||
| Earnings per share |
$ | 1.47 | $ | 0.66 | $ | 1.81 | ||||||
NOTE 2: VARIABLE INTEREST ENTITIES
The Company is involved in various entities that are considered to be VIEs, as defined by authoritative accounting literature. Generally, a VIE is a corporation, partnership, trust or other legal structure that does not have equity investors with substantive or proportional voting rights or has equity investors that do not provide sufficient financial resources for the entity to support its activities.
At December 31, 2010, the Company did not have any consolidated VIEs to disclose but did have certain nonconsolidated VIEs, discussed below.
Trust Preferred Securities
The Company owns the common stock of a subsidiary business trust, Auburn National Bancorporation Capital Trust I, which issued mandatorily redeemable preferred capital securities (“trust preferred securities”) in the aggregate of approximately $7.0 million at the time of issuance. This trust meets the definition of a VIE of which the Company is not the primary beneficiary; the trust’s only assets are junior subordinated debentures issued by the Company, which were acquired by the trust using the proceeds from the issuance of the trust preferred securities and common stock. The junior subordinated debentures of approximately $7.2 million are included in long-term debt and the Company’s equity interest in the business trust is included in other assets. Interest expense on the junior subordinated debentures is reported in interest expense on long-term debt. For regulatory reporting and capital adequacy purposes, the Federal Reserve Board has indicated that such trust preferred securities will continue to constitute Tier 1 Capital until further notice.
Affordable Housing Investments
Periodically, the Company may invest in various limited partnerships that sponsor affordable housing projects in its primary markets and surrounding areas as a means of supporting local communities. These investments are designed to generate a return primarily through the realization of federal tax credits. These projects are funded through a combination of debt and equity and the partnerships meet the definition of a VIE. While the Company’s investment as a limited partner in a single entity may at times exceed 50% of the outstanding equity interests, the Company does not consolidate the partnerships due to the nature of the management activities of the general partner and the performance guaranties provided by the project sponsors giving them the majority of the variability.
The Company typically provides financing during the construction and development of the properties; however, permanent financing is generally obtained from independent parties upon completion of a project. As of December 31, 2010 and 2009, the Company had limited parternship investments of $3.4 million and $0.3 million, respectively, related to these projects, which are included in Other assets on the Consolidated Balance Sheets.
When commitments to fund affordable housing investments are contingent upon a future event, a liability must be recognized when that contingent event becomes probable. At December 31, 2010, total unfunded commitments outstanding for affordable housing investments were $4.4 million, of which $1.9 million was included in other liabilities. At December 31, 2009, the Company had no unfunded commitments related to affordable housing investments.
Additionally, the Company had outstanding loan commitments with certain of the partnerships totaling $11.4 million at December 31, 2010 and 2009, respectively. The funded portion of these loans was approximately $8.9 million at December 31, 2010. There was no funded portion for any of the outstanding loan commitments with certain of the partnerships at December 31, 2009. The funded portions of these loans are included in loans, net of unearned income on the Consolidated Balance Sheets.
70
Table of Contents
The following table summarizes VIEs that are not consolidated by the Company as of December 31, 2010.
| (Dollars in thousands) | Maximum Loss Exposure |
Liability Recognized |
Classification | |||||||||
| Type: |
||||||||||||
| Affordable housing investments (a) |
$ | 5,877 | $ | 1,871 | Other assets | |||||||
| Trust preferred issuances |
N/A | 7,217 | Long-term debt | |||||||||
| (a) | Maximum loss exposure represents $3.4 million of current investments and $2.5 million of contractual funding commitments contingent upon future events. The current investment of $3.4 million includes undisbursed equity contributions of $1.9 million the Company was contractually obligated to pay at December 31, 2010. The accrued commitment amount was included in other liabilities. |
NOTE 3: RESTRICTED CASH BALANCES
Regulation D of the Federal Reserve Act requires that banks maintain reserve balances with the Federal Reserve Bank based principally on the type and amount of their deposits. At December 31, 2010 and 2009, the Bank did not have a required reserve balance at the Federal Reserve Bank.
NOTE 4: SECURITIES
At December 31, 2010 and 2009, respectively, all securities within the scope of FASB ASC 320, Investments – Debt and Equity Securities were classified as available-for-sale. The fair value and amortized cost for securities available-for-sale by contractual maturity at December 31, 2010 and 2009, respectively, are presented below.
| December 31, 2010 | ||||||||||||||||||||||||||||||||
| 1 year | 1 to 5 | 5 to 10 | After 10 | Fair | Gross Unrealized | Amortized | ||||||||||||||||||||||||||
| (Dollars in thousands) | or less | years | years | years | Value | Gains | Losses | cost | ||||||||||||||||||||||||
| Available-for-sale: |
||||||||||||||||||||||||||||||||
| Agency obligations (a) |
$ | — | — | 37,821 | 52,650 | 90,471 | 95 | 1,017 | 91,393 | |||||||||||||||||||||||
| Agency RMBS (a) |
— | — | 9,976 | 133,168 | 143,144 | 1,566 | 1,441 | 143,019 | ||||||||||||||||||||||||
| State and political subdivisions |
21 | 856 | 13,547 | 62,342 | 76,766 | 472 | 2,801 | 79,095 | ||||||||||||||||||||||||
| Trust preferred securities: |
||||||||||||||||||||||||||||||||
| Pooled |
— | — | — | 20 | 20 | — | 210 | 230 | ||||||||||||||||||||||||
| Individual issuer |
— | — | — | 2,129 | 2,129 | — | 153 | 2,282 | ||||||||||||||||||||||||
| Corporate debt |
— | 2,690 | — | — | 2,690 | — | — | 2,690 | ||||||||||||||||||||||||
| Total available-for-sale |
$ | 21 | 3,546 | 61,344 | 250,309 | 315,220 | 2,133 | 5,622 | 318,709 | |||||||||||||||||||||||
|
(a) Includes securities issued by U.S. government agencies or government sponsored entities. |
| |||||||||||||||||||||||||||||||
| December 31, 2009 | ||||||||||||||||||||||||||||||||
| 1 year | 1 to 5 | 5 to 10 | After 10 | Fair | Gross Unrealized | Amortized | ||||||||||||||||||||||||||
| (Dollars in thousands) | or less | years | years | years | Value | Gains | Losses | cost | ||||||||||||||||||||||||
| Available-for-sale: |
||||||||||||||||||||||||||||||||
| Agency obligations (a) |
$ | — | — | 42,626 | 47,594 | 90,220 | 363 | 630 | 90,487 | |||||||||||||||||||||||
| Agency RMBS (a) |
— | — | 5,261 | 153,381 | 158,642 | 3,264 | 380 | 155,758 | ||||||||||||||||||||||||
| State and political subdivisions |
— | 382 | 16,073 | 65,107 | 81,562 | 1,031 | 578 | 81,109 | ||||||||||||||||||||||||
| Trust preferred securities: |
||||||||||||||||||||||||||||||||
| Pooled |
— | — | — | 23 | 23 | — | 257 | 280 | ||||||||||||||||||||||||
| Individual issuer |
— | — | — | 1,440 | 1,440 | — | 2,010 | 3,450 | ||||||||||||||||||||||||
| Corporate debt |
— | 2,142 | 733 | — | 2,875 | — | 626 | 3,501 | ||||||||||||||||||||||||
| Total available-for-sale |
$ | — | 2,524 | 64,693 | 267,545 | 334,762 | 4,658 | 4,481 | 334,585 | |||||||||||||||||||||||
| (a) | Includes securities issued by U.S. government agencies or government sponsored entities. |
71
Table of Contents
Securities with aggregate fair values of $171.1 million and $203.4 million at December 31, 2010 and 2009, respectively, were pledged to secure public deposits, securities sold under agreements to repurchase, Federal Home Loan Bank (“FHLB”) advances, and for other purposes required or permitted by law.
Included in Other assets in the Consolidated Balance Sheets are cost-method investments. The carrying amounts of cost-method investments were $5.8 million and $6.0 million at December 31, 2010 and 2009, respectively. Cost-method investments primarily include nonmarketable equity investments, such as Federal Home Loan Bank (“FHLB”) of Atlanta stock and Federal Reserve Bank stock.
Gross Unrealized Losses and Fair Value
The fair values and gross unrealized losses on securities at December 31, 2010 and 2009, respectively, segregated by those securities that have been in an unrealized loss position for less than twelve months and twelve months or more are presented below.
| Less than 12 months | 12 months or longer | Total | ||||||||||||||||||||||
| (Dollars in thousands) | Fair Value |
Unrealized Losses |
Fair Value |
Unrealized Losses |
Fair Value |
Unrealized Losses |
||||||||||||||||||
| December 31, 2010: |
||||||||||||||||||||||||
| Agency obligations |
$ | 45,351 | 1,017 | — | — | 45,351 | 1,017 | |||||||||||||||||
| Agency RMBS |
89,840 | 1,441 | — | — | 89,840 | 1,441 | ||||||||||||||||||
| State and political subdivisions |
49,176 | 2,323 | 3,207 | 478 | 52,383 | 2,801 | ||||||||||||||||||
| Trust preferred securities: |
||||||||||||||||||||||||
| Pooled |
— | — | 20 | 210 | 20 | 210 | ||||||||||||||||||
| Individual issuer |
— | — | 847 | 153 | 847 | 153 | ||||||||||||||||||
| Total |
$ | 184,367 | 4,781 | 4,074 | 841 | 188,441 | 5,622 | |||||||||||||||||
|
December 31, 2009: |
||||||||||||||||||||||||
| Agency obligations |
$ | 46,219 | 630 | — | — | 46,219 | 630 | |||||||||||||||||
| Agency RMBS |
48,343 | 380 | — | — | 48,343 | 380 | ||||||||||||||||||
| State and political subdivisions |
18,868 | 351 | 2,837 | 227 | 21,705 | 578 | ||||||||||||||||||
| Trust preferred securities: |
||||||||||||||||||||||||
| Pooled |
13 | 37 | 10 | 220 | 23 | 257 | ||||||||||||||||||
| Individual issuer |
— | — | 1,440 | 2,010 | 1,440 | 2,010 | ||||||||||||||||||
| Corporate debt |
— | — | 2,876 | 626 | 2,876 | 626 | ||||||||||||||||||
| Total |
$ | 113,443 | 1,398 | 7,163 | 3,083 | 120,606 | 4,481 | |||||||||||||||||
The applicable dates for determining when securities are in an unrealized loss position are December 31, 2010 and 2009. As such, it is possible that a security had a market value that exceeded its amortized cost on other days during the past twelve-month period.
The Company recognized approximately $0.8 million in other-than-temporary impairment in 2010 related to corporate debt securities that management intended to sell at December 31, 2010. These securities were disposed of in January of 2011 and are not included in the above table, as any related unrealized losses were recognized in earnings. For the securities in the above table, the Company does not have the intent to sell and has determined for securities evaluated at December 31, 2010, it is not more likely-than-not that the Company will be required to sell the security before recovery of the amortized cost basis, which may be maturity. The Company has assessed each security for credit impairment. For debt securities, the Company evaluates, where necessary, whether credit impairment exists by comparing the present value of the expected cash flows to the securities’ amortized cost basis. For cost-method investments, the Company evaluates whether an event or change in circumstances has occurred during the reporting period that may have a significant adverse effect on the fair value of the investment.
In determining whether a loss is temporary, the Company considers all relevant information including:
| • | the length of time and the extent to which the fair value has been less than the amortized cost basis; |
| • | adverse conditions specifically related to the security, an industry, or a geographic area (for example, changes in the financial condition of the issuer of the security, or in the case of an asset-backed debt security, in the financial condition of the underlying loan obligors, including changes in technology or the discontinuance of a segment of the business that may affect the future earnings potential of the issuer or underlying loan obligors of the security or changes in the quality of the credit enhancement); |
72
Table of Contents
| • | the historical and implied volatility of the fair value of the security; |
| • | the payment structure of the debt security and the likelihood of the issuer being able to make payments that increase in the future; |
| • | failure of the issuer of the security to make scheduled interest or principal payments; |
| • | any changes to the rating of the security by a rating agency; and |
| • | recoveries or additional declines in fair value subsequent to the balance sheet date. |
To the extent the Company estimates future expected cash flows, the Company considered all available information in developing those expected cash flows. For asset-backed securities such as pooled trust preferred securities, such information generally included:
| • | remaining payment terms of the security (including as applicable, terms that require underlying obligor payments to increase in the future); |
| • | current delinquencies and nonperforming assets of underlying collateral; |
| • | expected future default rates; and |
| • | Subordination levels or other credit enhancements. |
Agency obligations
The unrealized losses associated with agency obligations are primarily driven by changes in interest rates and not due to the credit quality of the securities. These securities are issued by U.S. government agencies or government-sponsored entities and do not have any credit losses given the explicit or implicit government guarantee.
Agency residential mortgage-backed securities (“RMBS”)
The unrealized losses associated with Agency RMBS are primarily driven by changes in interest rates and not due to the credit quality of the securities. These securities are issued by U.S. government agencies or government-sponsored entities and do not have any credit losses given the explicit or implicit government guarantee.
Securities of U.S. states and political subdivisions
The unrealized losses associated with securities of U.S. states and political subdivisions are primarily driven by changes in interest rates and are not due to the credit quality of the securities. These securities will continue to be monitored as part of the Company’s quarterly impairment analysis, but are expected to perform even if the rating agencies reduce the credit rating of the bond insurers. As a result, the Company expects to recover the entire amortized cost basis of these securities.
Pooled trust preferred securities
The unrealized losses associated with pooled trust preferred securities are primarily driven by higher projected collateral losses and wider credit spreads. Pooled trust preferred securities primarily consist of securities issued by community banks and thrifts. The Company assesses impairment for these securities using a cash flow model. The key assumptions include default probabilities of the underlying collateral and recoveries on collateral defaults. Based upon the Company’s assessment of the expected credit losses for these securities, and given the performance of the underlying collateral compared to the Company’s credit enhancement, the Company expects to recover the remaining amortized cost basis of these securities.
Individual issuer trust preferred securities
The unrealized losses associated with individual issuer trust preferred securities are primarily related to securities backed by individual issuer community banks. For individual issuers, management evaluates the financial performance of the issuer on a quarterly basis to determine if it is probable that the issuer can make all contractual principal and interest payments. Based upon its evaluation, the Company expects to recover the remaining amortized cost basis of these securities.
Cost-method investments
At December 31, 2010, cost-method investments with an aggregate cost of $5.8 million were not evaluated for impairment because the Company did not identify any events or changes in circumstances that may have a significant adverse effect on the fair value of these cost-method investments.
The carrying values of the Company’s investment securities could decline in the future if the underlying performance of the collateral for pooled trust preferred securities, the financial condition of individual issuers of trust preferred securities, or the credit quality of other securities deteriorate and the Company determines it is probable that it will not recover the entire amortized cost basis for the security. As a result, there is a risk that significant other-than-temporary impairment charges may occur in the future.
73
Table of Contents
The following tables show the applicable credit ratings, fair values, gross unrealized losses, and life-to-date impairment charges for pooled and individual issuer trust preferred securities at December 31, 2010 and 2009, respectively, segregated by those securities that have been in an unrealized loss position for less than twelve months and twelve months or more.
Trust Preferred Securities as of December 31, 2010
| Unrealized losses | Life-to-date | |||||||||||||||||||||||||||
| Credit Rating | Fair value | Less than | 12 months | Impairment | ||||||||||||||||||||||||
| (Dollars in thousands) | Moody’s | Fitch | 12 months | or longer | Total | Charges | ||||||||||||||||||||||
| Pooled: |
||||||||||||||||||||||||||||
| ALESCO Preferred Funding XVII, Ltd. (a) |
Ca | C | $ | 20 | — | 210 | 210 | $ | 1,770 | |||||||||||||||||||
| Total pooled |
20 | — | 210 | 210 | 1,770 | |||||||||||||||||||||||
| Individual issuer (b): |
||||||||||||||||||||||||||||
| Carolina Financial Capital Trust I |
n/a | n/a | 312 | — | — | — | 138 | |||||||||||||||||||||
| Main Street Bank Statutory Trust I (c) |
n/a | n/a | 438 | — | 62 | 62 | — | |||||||||||||||||||||
| MNB Capital Trust I |
n/a | n/a | 152 | — | — | — | 348 | |||||||||||||||||||||
| PrimeSouth Capital Trust I |
n/a | n/a | 197 | — | — | — | 303 | |||||||||||||||||||||
| TCB Trust |
n/a | n/a | 409 | — | 91 | 91 | — | |||||||||||||||||||||
| United Community Capital Trust |
n/a | n/a | 621 | — | — | — | 379 | |||||||||||||||||||||
| Total individual issuer |
2,129 | — | 153 | 153 | 1,168 | |||||||||||||||||||||||
| Total trust preferred securities |
$ | 2,149 | $ | — | 363 | 363 | $ | 2,938 | ||||||||||||||||||||
n/a - not applicable, securities not rated.
| (a) | Class B Deferrable Third Priority Secured Floating Rate Notes. The underlying collateral is primarily composed of trust preferred securities issued by community banks and thrifts. |
| (b) | 144A Floating Rate Capital Securities. Underlying issuer is a community bank holding company. Securities have no excess subordination or overcollateralization. |
| (c) | Now an obligation of BB&T Corporation. |
74
Table of Contents
Trust Preferred Securities as of December 31, 2009
| Unrealized losses | Life-to-date | |||||||||||||||||||||||||||
| Credit Rating | Fair value |
Less than | 12 months | Impairment | ||||||||||||||||||||||||
| (Dollars in thousands) | Moody’s | Fitch | 12 months | or longer | Total | Charges | ||||||||||||||||||||||
| Pooled: |
||||||||||||||||||||||||||||
| ALESCO Preferred Funding XVII, Ltd. (a) |
Ca | B | $ | 10 | — | 220 | 220 | $ | 1,770 | |||||||||||||||||||
| U.S. Capital Funding IV, Ltd. (b) |
Ca | CC | 13 | 37 | — | 37 | 2,450 | |||||||||||||||||||||
| Total pooled |
23 | 37 | 220 | 257 | 4,220 | |||||||||||||||||||||||
| Individual issuer (c): |
||||||||||||||||||||||||||||
| Carolina Financial Capital Trust I |
n/a | n/a | 90 | — | 360 | 360 | — | |||||||||||||||||||||
| Main Street Bank Statutory Trust I (d) |
n/a | n/a | 275 | — | 225 | 225 | — | |||||||||||||||||||||
| MNB Capital Trust I |
n/a | n/a | 125 | — | 375 | 375 | — | |||||||||||||||||||||
| PrimeSouth Capital Trust I |
n/a | n/a | 125 | — | 375 | 375 | — | |||||||||||||||||||||
| TCB Trust |
n/a | n/a | 325 | — | 175 | 175 | — | |||||||||||||||||||||
| United Community Capital Trust |
n/a | n/a | 500 | — | 500 | 500 | — | |||||||||||||||||||||
| Total individual issuer |
1,440 | — | 2,010 | 2,010 | — | |||||||||||||||||||||||
| Total trust preferred securities |
$ | 1,463 | $ | 37 | 2,230 | 2,267 | $ | 4,220 | ||||||||||||||||||||
n/a - not applicable, securities not rated.
| (a) | Class B Deferrable Third Priority Secured Floating Rate Notes. The underlying collateral is primarily composed of trust preferred securities issued by community banks and thrifts. |
| (b) | Class B-2 Fixed/Floating Rate Senior Surbordinate Notes. The underlying collateral is primarily composed of trust preferred securities issued by community banks and thrifts. |
| (c) | 144A Floating Rate Capital Securities. Underlying issuer is a community bank holding company. Securities have no excess subordination or overcollateralization. |
| (d) | Now an obligation of BB&T Corporation. |
For pooled trust preferred securities, the Company estimated expected future cash flows of the security by estimating the expected future cash flows of the underlying collateral and applying those collateral cash flows, together with any credit enhancements such as subordination interests owned by third parties, to the security. The expected future cash flows of the underlying collateral are determined using the remaining contractual cash flows adjusted for future expected credit losses (which consider default probabilities derived from issuer credit ratings for the underlying collateral). The probability-weighted expected future cash flows of the security are then discounted at the interest rate used to recognize income on the security to arrive at a present value amount.
Excess subordination is defined as the amount of performing collateral that is in excess of what is needed to pay-off a specified class of securities and all classes senior to the specified class. Performing collateral is defined as total collateral minus all collateral that is currently deferring or currently in default. This definition assumes that all collateral that is currently deferring will default with a zero recovery rate. The underlying issuers can cure the deferral, or some portion greater than zero could be recovered on default of an underlying issuer. Excess subordination, as defined previously, does not consider any excess interest spread that is built into the structure of the security, which provides another source of repayment for the bonds.
At December 31, 2010 and 2009, respectively, there was no excess subordination for the Class B notes of ALESCO Preferred Funding XVII, Ltd.
Other-Than-Temporarily Impaired Securities
On a quarterly basis, management makes an assessment to determine whether there have been events or economic circumstances to indicate that a security on which there is an unrealized loss is other-than-temporarily impaired. For equity securities with an unrealized loss, the Company considers many factors including the severity and duration of the impairment; the intent and ability of the Company to hold the security for a period of time sufficient for a recovery in value; and recent events specific to the issuer or industry. Equity securities on which there is an unrealized loss that is deemed to be other-than-temporary are written down to fair value with the write-down recorded as a realized loss in securities gains (losses), net.
75
Table of Contents
For debt securities with an unrealized loss, an other-than-temporary impairment write-down is triggered when (1) the Company has the intent to sell a debt security, (2) it is more likely than not that the Company will be required to sell the debt security before recovery of its amortized cost basis, or (3) the Company does not expect to recover the entire amortized cost basis of the debt security. If the Company has the intent to sell a debt security or if it is more-likely-than-not that it will be required to sell the debt security before recovery, the other-than-temporary write-down is equal to the entire difference between the debt security’s amortized cost and its fair value. If the Company does not intend to sell the security or it is not more likely than not that it will be required to sell the security before recovery, the other-than-temporary impairment write-down is separated into the amount that is credit related (credit loss component) and the amount due to all other factors. The credit loss component is recognized in earnings, as a realized loss in securities gains (losses), and is the difference between the security’s amortized cost basis and the present value of its expected future cash flows. The remaining difference between the security’s fair value and the present value of future expected cash flows is due to factors that are not credit related and is recognized in other comprehensive income, net of applicable taxes.
The following table presents a roll-forward of the credit loss component of the amortized cost of debt securities that the Company has written down for other-than-temporary impairment and the credit component of the loss is recognized in earnings (referred to as “credit-impaired” debt securities). Other-than-temporary impairments recognized in earnings for the years ended December 31, 2010 and 2009 for credit-impaired debt securities are presented as additions in two components based upon whether the current year is the first time the debt security was credit-impaired (initial credit impairment) or is not the first time the debt security was credit-impaired (subsequent credit impairments). The credit loss component is reduced if the Company sells, intends to sell or believes it will be required to sell previously credit-impaired debt securities. Additionally, the credit loss component is reduced if the Company receives cash flows in excess of what it expected to receive over the remaining life of the credit-impaired debt security, the security matures or is fully written-down and deemed worthless. Changes in the credit loss component of credit-impaired debt securities were:
| Years ended December 31 | ||||||||
| (Dollars in thousands) | 2010 | 2009 | ||||||
| Balance, beginning of period |
$ | 4,570 | $ | — | ||||
| Additions: |
||||||||
| Initial credit impairments |
1,160 | 2,663 | ||||||
| Subsequent credit impairments |
58 | 1,907 | ||||||
| Reductions: |
||||||||
| Securities sold |
(975 | ) | — | |||||
| Securities fully written-down and deemed worthless |
(1,875 | ) | — | |||||
| Balance, end of period |
$ | 2,938 | $ | 4,570 | ||||
Other-Than-Temporary Impairment
The following table presents details of other-than-temporary impairment related to securities, including equity securities carried at cost, for the years ended December 31, 2010 and 2009.
| Years ended December 31 | ||||||||
| (Dollars in thousands) | 2010 | 2009 | ||||||
| Other-than-temporary impairment charges (included in earnings): |
||||||||
| Debt securities: |
||||||||
| Corporate debt securities |
$ | 810 | $ | — | ||||
| Pooled trust preferred securities |
50 | 2,695 | ||||||
| Individual issuer trust preferred securities |
1,168 | 1,875 | ||||||
| Total debt securities |
2,028 | 4,570 | ||||||
| Cost-method investments |
— | 1,980 | ||||||
| Total other-than-temporary impairment charges |
$ | 2,028 | $ | 6,550 | ||||
| Other-than-temporary impairment on debt securities: |
||||||||
| Recorded as part of gross realized losses: |
||||||||
| Credit-related |
$ | 1,218 | 4,570 | |||||
| Securities with intent to sell |
810 | — | ||||||
| Recorded directly to other comprehensive income for non-credit related impairment |
210 | 257 | ||||||
| Total other-than-temporary impairment on debt securities |
$ | 2,238 | $ | 4,827 | ||||
76
Table of Contents
Realized Gains and Losses
The following table presents the gross realized gains and losses on securities, including cost-method investments. Realized losses include other-than-temporary impairment charges.
| Years ended December 31 | ||||||||||||
| (Dollars in thousands) | 2010 | 2009 | 2008 | |||||||||
| Gross realized gains |
$ | 3,496 | $ | 2,881 | $ | 406 | ||||||
| Gross realized losses |
(2,073 | ) | (6,584 | ) | (1,574) | |||||||
| Net realized gains (losses) |
$ | 1,423 | $ | (3,703 | ) | $ | (1,168) | |||||
NOTE 5: LOANS AND ALLOWANCE FOR LOAN LOSSES
Loan Portfolio
| December 31 | ||||||||
| (In thousands) | 2010 | 2009 | ||||||
| Commercial and industrial |
$ | 53,288 | $ | 53,884 | ||||
| Construction and land development |
47,850 | 56,820 | ||||||
| Commercial real estate: |
||||||||
| Owner occupied |
76,252 | 78,695 | ||||||
| Other |
89,989 | 78,233 | ||||||
| Total commercial real estate |
166,241 | 156,928 | ||||||
| Residential real estate: |
||||||||
| Consumer mortgage |
57,562 | 62,259 | ||||||
| Investment property |
38,679 | 35,148 | ||||||
| Total residential real estate |
96,241 | 97,407 | ||||||
| Consumer installment |
10,676 | 11,236 | ||||||
| Total loans |
374,296 | 376,275 | ||||||
| Less: unearned income |
(81 | ) | (172) | |||||
| Loans, net of unearned income |
$ | 374,215 | $ | 376,103 | ||||
Loans secured by real estate were approximately 82.9% of the total loan portfolio at December 31, 2010. Due to declines in economic indicators and real estate values, loans secured by real estate may have a greater risk of non-collection than other loans. At December 31, 2010, the Company’s geographic loan distribution was concentrated primarily in Lee County, Alabama and surrounding areas.
In accordance with ASC 310, a portfolio segment is defined as the level at which an entity develops and documents a systematic method for determining its allowance for loan losses. The Company’s loan portfolio is disaggregated into the following portfolio segments: commercial and industrial, construction and land development, commercial real estate, residential real estate and consumer installment. The Company’s loan portfolio segments were determined based on collateral type. Where appropriate, the Company’s loan portfolio segments are further disaggregated into classes. A class is generally determined based on the initial measurement attribute, risk characteristics of the loan, and an entity’s method for monitoring and determining credit risk.
The following describe the risk characteristics relevant to each of the portfolio segments.
Commercial and Industrial (“C&I”)— includes loans to finance business operations, equipment purchases, or other needs for small and medium-sized commercial customers. Also included in this category are loans to finance agricultural production. Generally the primary source of repayment is the cash flow from business operations and activities of the borrower.
Construction and land development (“C&D”)— includes both loans and credit lines for the purpose of purchasing, carrying and developing land into commercial developments or residential subdivisions. Also included are loans and lines for construction of residential, multi-family and commercial buildings. Generally the primary source of repayment is dependent upon the sale or refinance of the real estate collateral.
77
Table of Contents
Commercial real estate(“CRE”) — includes loans disaggregated into two classes: (1) owner occupied and (2) other.
| • | Owner occupied – includes loans secured by business facilities to finance business operations, equipment and owner-occupied facilities primarily for small and medium-sized commercial customers. Generally the primary source of repayment is the cash flow from business operations and activities of the borrower, who owns the property. |
| • | Other – primarily includes loans to finance income-producing commercial and multi-family properties. Loans in this class include loans for neighborhood retail centers, hotels, medical and professional offices, single retail stores, industrial buildings, warehouses and apartments leased generally to local businesses and residents. Generally the primary source of repayment is dependent upon income generated from the real estate collateral. The underwriting of these loans takes into consideration the occupancy and rental rates as well as the financial health of the borrower. |
Residential real estate (“RRE”) — includes loans disaggregated into two classes: (1) consumer mortgage and (2) investment property.
| • | Consumer mortgage – primarily include first lien, or second lien mortgages and home equity lines to consumers that are secured by a primary residence or second home. These loans are underwritten in accordance with the Bank’s general loan policies and procedures which require, among other things, proper documentation of each borrower’s financial condition, satisfactory credit history and property value. |
| • | Investment property – primarily includes loans to finance income-producing 1-4 family residential properties. Generally the primary source of repayment is dependent upon income generated from leasing the property securing the loan. The underwriting of these loans takes into consideration the rental rates as well as the financial health of the borrower. |
Consumer installment — includes loans to individuals both secured by personal property and unsecured. Loans include personal lines of credit, automobile loans, and other retail loans. These loans are underwritten in accordance with the Bank’s general loan policies and procedures which require, among other things, proper documentation of each borrower’s financial condition, satisfactory credit history, and if applicable, property value.
The following is a summary of current, accruing past due and nonaccrual loans by portfolio class as of December 31, 2010.
| December 31, 2010 | ||||||||||||||||||||||||
| Accruing 30-89 Days Past Due |
Accruing Greater than 90 days |
Total Accruing Loans |
Non- Accrual |
Total Loans |
||||||||||||||||||||
| (In thousands) | Current | |||||||||||||||||||||||
| Commercial and industrial |
$ | 52,643 | 124 | — | 52,767 | 521 | $ | 53,288 | ||||||||||||||||
| Construction and land development |
43,547 | 201 | — | 43,748 | 4,102 | 47,850 | ||||||||||||||||||
| Commercial real estate: |
||||||||||||||||||||||||
| Owner occupied |
73,419 | — | — | 73,419 | 2,833 | 76,252 | ||||||||||||||||||
| Other |
88,087 | — | — | 88,087 | 1,902 | 89,989 | ||||||||||||||||||
| Total commercial real estate |
161,506 | — | — | 161,506 | 4,735 | 166,241 | ||||||||||||||||||
| Residential real estate: |
||||||||||||||||||||||||
| Consumer mortgage |
53,225 | 2,219 | — | 55,444 | 2,118 | 57,562 | ||||||||||||||||||
| Investment property |
37,556 | 767 | — | 38,323 | 356 | 38,679 | ||||||||||||||||||
| Total residential real estate |
90,781 | 2,986 | — | 93,767 | 2,474 | 96,241 | ||||||||||||||||||
| Consumer installment |
10,646 | 29 | — | 10,675 | 1 | 10,676 | ||||||||||||||||||
| Total |
$ | 359,123 | 3,340 | — | 362,463 | 11,833 | $ | 374,296 | ||||||||||||||||
At December 31, 2010 and 2009, nonaccrual loans amounted to $11.8 million and $9.4 million, respectively. The gross interest income which would have been recorded under the original terms of those loans had they been accruing interest, amounted to approximately $346 thousand, $161 thousand, and $199 thousand for the years ended December 31, 2010, 2009, and 2008, respectively. At December 31, 2010 there were no loans 90 days past due and still accruing interest. At December 31, 2009, loans 90 days past due and still accruing interest amounted to $5 thousand.
78
Table of Contents
Allowance for Loan Losses
The allowance for loan losses as of and for the years ended December 31, 2010, 2009 and 2008, is presented below.
| Years ended December 31 |
||||||||||||
| (Dollars in thousands) | 2010 | 2009 | 2008 | |||||||||
| Balance at beginning of period |
$ | 6,495 | 4,398 | 4,105 | ||||||||
| Charge-offs |
(2,687) | (3,348) | (705) | |||||||||
| Recoveries |
288 | 195 | 128 | |||||||||
| Net charge-offs |
(2,399) | (3,153) | (577) | |||||||||
| Provision for loan losses |
3,580 | 5,250 | 870 | |||||||||
| Ending balance |
$ | 7,676 | 6,495 | 4,398 | ||||||||
The Company assesses the adequacy of its allowance for loan losses prior to the end of each calendar quarter. The level of the allowance is based upon management’s evaluation of the loan portfolios, past loan loss experience, current asset quality trends, known and inherent risks in the portfolio, adverse situations that may affect the borrower’s ability to repay (including the timing of future payment), the estimated value of any underlying collateral, composition of the loan portfolio, economic conditions, industry and peer bank loan quality indications and other pertinent factors, including regulatory recommendations. This evaluation is inherently subjective as it requires material estimates including the amounts and timing of future cash flows expected to be received on impaired loans that may be susceptible to significant change. Loan losses are charged off when management believes that the full collectability of the loan is unlikely. A loan may be partially charged-off after a “confirming event” has occurred which serves to validate that full repayment pursuant to the terms of the loan is unlikely. Allocation of the allowance may be made for specific loans, but the entire allowance is available for any loan that, in management’s judgment, is deemed to be uncollectible.
The Company deems loans impaired when, based on current information and events, it is probable that the Company will be unable to collect all amounts due according to the contractual terms of the loan agreement. Collection of all amounts due according to the contractual terms means that both the interest and principal payments of a loan will be collected as scheduled in the loan agreement.
An impairment allowance is recognized if the fair value of the loan is less than the recorded investment in the loan (recorded investment in the loan is the principal balance plus any accrued interest, net of deferred loan fees or costs and unamortized premium or discount). The impairment is recognized through the allowance. Loans that are impaired are recorded at the present value of expected future cash flows discounted at the loan’s effective interest rate, or if the loan is collateral dependent, impairment measurement is based on the fair value of the collateral, less estimated disposal costs. The Company believes it follows appropriate accounting and regulatory guidance in determining impairment and accrual status of impaired loans.
The level of allowance maintained is believed by management to be adequate to absorb probable losses inherent in the portfolio at the balance sheet date. The allowance is increased by provisions charged to expense and decreased by charge-offs, net of recoveries of amounts previously charged-off.
In assessing the adequacy of the allowance, the Company also considers the results of its ongoing independent loan review process. The Company’s loan review process assists in determining whether there are loans in the portfolio whose credit quality has weakened over time and evaluating the risk characteristics of the entire loan portfolio. The Company’s loan review process includes the judgment of management, the input from our independent loan reviewers, and reviews that may have been conducted by bank regulatory agencies as part of their examination process. The Company incorporates loan review results in the determination of whether or not it is probable that we will be able to collect all amounts due according to the contractual terms of a loan.
As part of the Company’s quarterly assessment of the allowance, management divides the loan portfolio into five segments: commercial and industrial loans, construction and land development loans, commercial real estate, residential real estate, and consumer installment loans. The Company analyzes each segment and estimates an allowance allocation for each loan segment.
The allocation of the allowance for loan losses begins with a process of estimating the probable losses inherent for these types of loans. The estimates for these loans are established by category and based on the Company’s internal system of credit risk ratings and historical loss data. The estimated loan loss allocation rate for the Company’s internal system of credit risk grades is based on its experience with similarly graded loans. For loan segments where the Company believes it
79
Table of Contents
does not have sufficient historical loss data, the Company may make adjustments based, in part, on loss rates of peer bank groups. At December 31, 2010, the Company adjusted its historical loss rates for the commercial real estate portfolio segment based, in part, on loss rates of peer bank groups. The related adjustments increased the allowance for loan losses for this portfolio segment at December 31, 2010.
The estimated loan loss allocation for all five loan portfolio segments is then adjusted for management’s estimate of probable losses for several “qualitative and environmental” factors. The allocation for qualitative and environmental factors is particularly subjective and does not lend itself to exact mathematical calculation. This amount represents estimated probable inherent credit losses which exist, but have not yet been identified, as of the balance sheet date, and are based upon quarterly trend assessments in delinquent and nonaccrual loans, credit concentration changes, prevailing economic conditions, changes in lending personnel experience, changes in lending policies or procedures and other influencing factors. These qualitative and environmental factors are considered for each of the five loan segments and the allowance allocation, as determined by the processes noted above, is increased or decreased based on the incremental assessment of these factors.
The Company maintains an unallocated amount for inherent factors that cannot be practically assigned to individual loan segments or categories. An example is the imprecision in the overall measurement process.
The Company constantly re-evaluates its practices in determining the allowance for loan losses. For example, in order to better capture the effect of current economic conditions on the Company’s loan loss experience, the Company calculated average losses by loan segment using a rolling 6 quarter historical period starting from the quarter ended September 30, 2010. Prior to September 30, 2010, the Company calculated average losses using a rolling 12 quarter historical period.
The following table details the allowance for loan losses at December 31, 2010 by portfolio segment:
| December 31, 2010 | ||||||||||||||||||||||||||||||
| (In thousands) | (1) C&I |
(2) C&D |
(3) CRE |
(4) RRE |
Consumer Installment |
Unallocated |
Total |
|||||||||||||||||||||||
| Allowance for loan losses |
$ | 972 | 2,223 | 2,893 | 1,336 | 141 | 111 | $ | 7,676 | |||||||||||||||||||||
| Individually evaluated |
277 | 123 | 765 | 144 | — | — | 1,309 | |||||||||||||||||||||||
| Collectively evaluated |
695 | 2,100 | 2,128 | 1,192 | 141 | 111 | 6,367 | |||||||||||||||||||||||
| Total loans |
$ | 53,288 | 47,850 | 166,241 | 96,241 | 10,676 | $ | 374,296 | ||||||||||||||||||||||
| Individually evaluated |
521 | 4,102 | 4,630 | 2,418 | — | 11,671 | ||||||||||||||||||||||||
| Collectively evaluated |
52,767 | 43,748 | 161,611 | 93,823 | 10,676 | 362,625 | ||||||||||||||||||||||||
| (1) | Commercial and industrial. |
| (2) | Construction and land development. |
| (3) | Commercial real estate. |
| (4) | Residential real estate. |
80
Table of Contents
Credit Quality Indicators
The credit quality of the loan portfolio is summarized no less frequently than quarterly using categories similar to the standard asset classification system used by the federal banking agencies. The following table presents credit quality indicators for the loan portfolio segments and classes. These categories are utilized to develop the associated allowance for loan losses using historical losses adjusted for current economic conditions and are defined as follows:
| • | Pass – loans which are well protected by the current net worth and paying capacity of the obligor (or guarantors, if any) or by the fair value, less cost to acquire and sell, of any underlying collateral. |
| • | Special Mention – loans with potential weakness that may, if not reversed or corrected, weaken the credit or inadequately protect the Company’s position at some future date. These loans are not adversely classified and do not expose an institution to sufficient risk to warrant an adverse classification. |
| • | Accruing Substandard – loans that exhibit a well-defined weakness which presently jeopardizes debt repayment, even though they are currently performing. These loans are characterized by the distinct possibility that the Company may incur a loss in the future if these weaknesses are not corrected; |
| • | Nonaccrual – includes loans where management has determined that full payment of principal and interest is in doubt. |
| December 31, 2010 | ||||||||||||||||||||
| (In thousands) | Pass | Special Mention |
Accruing Substandard |
Nonaccrual | Total Loans | |||||||||||||||
| Commercial and industrial |
$ | 51,632 | 722 | 413 | 521 | $ | 53,288 | |||||||||||||
| Construction and land development |
38,301 | 4,372 | 1,075 | 4,102 | 47,850 | |||||||||||||||
| Commercial real estate: |
||||||||||||||||||||
| Owner occupied |
67,702 | 716 | 5,001 | 2,833 | 76,252 | |||||||||||||||
| Other |
84,354 | 3,718 | 15 | 1,902 | 89,989 | |||||||||||||||
| Total commercial real estate |
152,056 | 4,434 | 5,016 | 4,735 | 166,241 | |||||||||||||||
| Residential real estate: |
||||||||||||||||||||
| Consumer mortgage |
48,620 | 2,700 | 4,124 | 2,118 | 57,562 | |||||||||||||||
| Investment property |
34,221 | 1,626 | 2,476 | 356 | 38,679 | |||||||||||||||
| Total residential real estate |
82,841 | 4,326 | 6,600 | 2,474 | 96,241 | |||||||||||||||
| Consumer installment |
10,426 | 133 | 116 | 1 | 10,676 | |||||||||||||||
| Total |
$ | 335,256 | 13,987 | 13,220 | 11,833 | $ | 374,296 | |||||||||||||
Impaired loans
The following table presents details related to the Company’s impaired loans. Loans which have been fully charged-off do not appear in the following table. The related allowance generally represents the following components which correspond to impaired loans:
| • | Individually evaluated impaired loans equal to or greater than $500,000 secured by real estate (nonaccrual construction and land development, commercial real estate, and residential real estate loans). |
| • | Individually evaluated impaired loans equal to or greater than $250,000 not secured by real estate (nonaccrual commercial and industrial and consumer loans). |
81
Table of Contents
The following table sets forth certain information regarding the Company’s impaired loans that were individually evaluated for impairment at December 31, 2010.
| December 31, 2010 | ||||||||||||||||||
| (In thousands) | Unpaid principal balance (1) |
Charge-offs and payments applied (2) |
Recorded investment (3) |
Related |
||||||||||||||
| With no allowance recorded: |
||||||||||||||||||
| Commercial and industrial |
$ | — | $ | — | $ | — | ||||||||||||
| Construction and land development |
2,538 | (54) | 2,484 | |||||||||||||||
| Commercial real estate: |
||||||||||||||||||
| Owner occupied |
— | — | — | |||||||||||||||
| Other |
1,592 | (51) | 1,541 | |||||||||||||||
| Total commercial real estate |
1,592 | (51) | 1,541 | |||||||||||||||
| Residential real estate: |
||||||||||||||||||
| Consumer mortgage |
1,072 | (27) | 1,045 | |||||||||||||||
| Investment property |
356 | — | 356 | |||||||||||||||
| Total residential real estate |
1,428 | (27) | 1,401 | |||||||||||||||
| Consumer installment |
— | — | — | |||||||||||||||
| Total |
$ | 5,558 | $ | (132) | $ | 5,426 | ||||||||||||
| With allowance recorded: |
||||||||||||||||||
| Commercial and industrial |
$ | 528 | $ | (7) | $ | 521 | $ | 277 | ||||||||||
| Construction and land development |
1,618 | — | 1,618 | 123 | ||||||||||||||
| Commercial real estate: |
||||||||||||||||||
| Owner occupied |
3,124 | (35) | 3,089 | 765 | ||||||||||||||
| Other |
— | — | — | — | ||||||||||||||
| Total commercial real estate |
3,124 | (35) | 3,089 | 765 | ||||||||||||||
| Residential real estate: |
||||||||||||||||||
| Consumer mortgage |
1,073 | (56) | 1,017 | 144 | ||||||||||||||
| Investment property |
— | — | — | — | ||||||||||||||
| Total residential real estate |
1,073 | (56) | 1,017 | 144 | ||||||||||||||
| Consumer installment |
— | — | — | — | ||||||||||||||
| Total |
$ | 6,343 | $ | (98) | $ | 6,245 | $ | 1,309 | ||||||||||
| Total impaired loans |
$ | 11,901 | $ | (230) | $ | 11,671 | $ | 1,309 | ||||||||||
| (1) | Unpaid principal balance represents the contractual obligation due from the customer. |
| (2) | Charge-offs and payments applied represents cumulative charge-offs taken, as well as interest payments that have been applied against the outstanding principal balance. |
| (3) | Recorded investment represents the unpaid principal balance less charge-offs and payments applied; it is shown before any related allowance for loan losses. |
For the years ended December 31, 2010, 2009 and 2008, the average recorded investments in impaired loans were $9.2 million, $4.0 million and $2.6 million, respectively. Total interest income recognized on impaired loans for the years ended December 31, 2010, 2009, and 2008 was not material.
At December 31, 2010 and 2009, the Company had impaired loans classified as TDRs of $7.6 million and $1.2 million, respectively. At December 31, 2010 and 2009, the Company had no accruing TDRs. For impaired loans classified as TDRs, the related allowance for loan losses was approximately $1.0 million at December 31, 2010. At December 31, 2010, there were no significant outstanding commitments to advance additional funds to customers whose loans had been restructured.
82
Table of Contents
NOTE 6: PREMISES AND EQUIPMENT
Premises and equipment at December 31, 2010 and 2009 is presented below.
| December 31 | ||||||||||||||||||
| (Dollars in thousands) | 2010 | 2009 | ||||||||||||||||
| Land |
$ | 4,678 | $ | 4,678 | ||||||||||||||
| Buildings and improvements |
6,708 | 6,673 | ||||||||||||||||
| Furniture, fixtures, and equipment |
3,290 | 3,565 | ||||||||||||||||
| Total premises and equipment |
14,676 | 14,916 | ||||||||||||||||
| Less: accumulated depreciation |
(6,571) | (6,634) | ||||||||||||||||
| Premises and equipment, net |
$ | 8,105 | $ | 8,282 | ||||||||||||||
Depreciation expense was approximately $319 thousand, $320 thousand, and $312 thousand for the periods ended December 31, 2010, 2009 and 2008, respectively.
NOTE 7: MORTGAGE SERVICING RIGHTS, NET
MSRs are recognized based on the fair value of the servicing right on the date the corresponding mortgage loan is sold. An estimate of the Company’s MSRs is determined using assumptions that market participants would use in estimating future net servicing income, including estimates of prepayment speeds, discount rate, default rates, cost to service, escrow account earnings, contractual servicing fee income, ancillary income, and late fees. Subsequent to the date of transfer, the Company has elected to measure its MSRs under the amortization method. Under the amortization method, MSRs are amortized in proportion to, and over the period of, estimated net servicing income.
The Company has recorded MSRs related to loans sold without recourse to Fannie Mae. The Company generally sells conforming, fixed-rate, closed-end, residential mortgages to Fannie Mae. Prior to January 1, 2009, the volume of loans sold servicing retained was not significant; therefore no servicing rights were capitalized.
The change in amortized MSRs and the related valuation allowance for the years ended December 31, 2010 and 2009, is presented below.
| Years ended December 31 | ||||||||||||||||
| (Dollars in thousands) | 2010 | 2009 | ||||||||||||||
| Beginning Balance |
$ | 834 | — | |||||||||||||
| Additions, net |
524 | 914 | ||||||||||||||
| Amortization expense |
(169) | (80) | ||||||||||||||
| Change in valuation allowance |
— | — | ||||||||||||||
| Ending Balance |
$ | 1,189 | 834 | |||||||||||||
| Fair value of amortized MSRs: |
||||||||||||||||
| Beginning of year |
978 | — | ||||||||||||||
| End of year |
$ | 1,335 | 978 | |||||||||||||
At December 31, 2010 and 2009, there was no valuation allowance for amortized MSRs. The Company periodically evaluates mortgage servicing rights for impairment. Impairment is determined by stratifying MSRs into groupings based on predominant risk characteristics, such as interest rate and loan type. If, by individual stratum, the carrying amount of the MSRs exceeds fair value, a valuation reserve is established. The valuation reserve is adjusted as the fair value changes.
83
Table of Contents
Data and assumptions used in the fair value calculation related to MSRs at December 31, 2010 are presented below.
| Years ended December 31 | ||||||||||||
| (Dollars in thousands) | 2010 | 2009 | ||||||||||
| Unpaid principal balance |
$ | 157,929 | 106,313 | |||||||||
| Weighted average prepayment speed (CPR) |
12.1 | % | 10.0 | |||||||||
| Discount rate (annual percentage) |
11.0 | % | 11.0 | |||||||||
| Weighted average coupon interest rate |
4.6 | % | 4.8 | |||||||||
| Weighted average remaining maturity (months) |
289 | 311 | ||||||||||
| Weighted average servicing fee (basis points) |
25.0 | 25.0 | ||||||||||
At December 31, 2010, the weighted average amortization period for MSRs was 6.2 years. Estimated amortization expense for each of the next five years is presented below.
| (Dollars in thousands) | December 31, 2010 | |||
| 2011 |
$ | 184 | ||
| 2012 |
160 | |||
| 2013 |
136 | |||
| 2014 |
115 | |||
| 2015 |
97 | |||
NOTE 8: DEPOSITS
At December 31, 2010, the scheduled maturities of certificates of deposit and other time deposits are presented below.
| (Dollars in thousands) | December 31, 2010 | |||
| 2011 |
$ | 150,989 | ||
| 2012 |
59,297 | |||
| 2013 |
34,257 | |||
| 2014 |
20,888 | |||
| 2015 |
16,073 | |||
| Thereafter |
24,609 | |||
| Total certificates of deposit and other time deposits |
$ | 306,113 | ||
Additionally, at December 31, 2010 and 2009, approximately $190.3 and $200.5 million, respectively, of certificates of deposit and other time deposits were issued in denominations of $100,000 or greater.
At December 31, 2010 and 2009, the amount of deposit accounts in overdraft status that were reclassified to loans on the accompanying consolidated balance sheets was not material.
84
Table of Contents
NOTE 9: SHORT-TERM BORROWINGS
| 2010 | 2009 | 2008 | ||||||||||||||||||||||
| Weighted | Weighted | Weighted | ||||||||||||||||||||||
| (Dollars in thousands) | Amount | Avg. Rate | Amount | Avg. Rate | Amount | Avg. Rate | ||||||||||||||||||
| Federal funds purchased: |
||||||||||||||||||||||||
| As of December 31 |
$ | — | — | $ | 12,450 | 0.93 % | $ | — | — | |||||||||||||||
| Average during the year |
1,125 | 0.94 % | 498 | 0.88 % | 6,837 | 2.55 % | ||||||||||||||||||
| Maximum outstanding at any month-end |
— | 12,450 | 18,204 | |||||||||||||||||||||
| Securities sold under agreements to repurchase: |
||||||||||||||||||||||||
| As of December 31 |
$ | 2,685 | 0.50 % | $ | 3,510 | 0.50 % | $ | 10,910 | 0.04 % | |||||||||||||||
| Average during the year |
2,404 | 0.50 % | 10,292 | 0.50 % | 9,767 | 1.53 % | ||||||||||||||||||
| Maximum outstanding at any month-end |
2,858 | 15,224 | 13,095 | |||||||||||||||||||||
Federal funds purchased represent unsecured overnight borrowings from other financial institutions by the Bank. The Bank had available federal fund lines totaling $34.0 million with none outstanding at December 31, 2010.
Securities sold under agreements to repurchase represent short-term borrowings with maturities less than one year collateralized by a portion of the Company’s securities portfolio. Securities with an aggregate carrying value of $5.0 million and $9.7 million at December 31, 2010 and 2009, respectively, were pledged to secure securities sold under agreements to repurchase.
NOTE 10: LONG-TERM DEBT
At December 31, 2010 and 2009, the composition of long-term debt is presented below.
| 2010 | 2009 | |||||||||||||||||||||||
| Weighted | Weighted | |||||||||||||||||||||||
| (Dollars in thousands) | Amount | Avg. Rate | Amount | Avg. Rate | ||||||||||||||||||||
| FHLB advances, due 2011 to 2018 |
$ | 71,114 | 3.88 % | $ | 86,132 | 4.01 % | ||||||||||||||||||
| Securities sold under agreements to repurchase, due 2017 |
15,000 | 4.21 | 25,000 | 4.08 | ||||||||||||||||||||
| Subordinated debentures, due 2033 |
7,217 | 3.38 | 7,217 | 3.38 | ||||||||||||||||||||
|
Total long-term debt |
$ | 93,331 | 3.90 % | $ | 118,349 | 3.99 % | ||||||||||||||||||
The Bank had $71.1 million and $86.1 million of FHLB advances with original maturities greater than one year at December 31, 2010 and 2009, respectively. Securities with an aggregate carrying value of $52.8 million and $62.6 million and certain qualifying residential mortgage loans with an aggregate carrying value of $48.9 million and $49.3 million at December 31, 2010 and 2009, respectively, were pledged to secure long-term FHLB advances.
The Bank had $15.0 million and $25.0 million in securities sold under agreements to repurchase with an original maturity greater than one year at December 31, 2010 and 2009, respectively. Securities with an aggregate carrying value of $19.0 million and $28.5 million at December 31, 2010 and 2009, respectively, were pledged to secure long-term securities sold under agreements to repurchase.
The Company formed Auburn National Bancorporation Capital Trust I (“Trust”), a wholly-owned statutory business trust, in 2003. The Trust issued $7.0 million of trust preferred securities that were sold to third parties. The proceeds from the sale of the trust preferred securities and trust common securities that we hold, were used to purchase subordinated debentures of $7.2 million from the Company, which are presented as long-term debt in the consolidated balance sheets and qualify for inclusion in Tier 1 capital for regulatory capital purposes, subject to certain limitations. The debentures mature on December 31, 2033 and may be redeemed on or after December 31, 2008.
85
Table of Contents
The following is a schedule of annual maturities of long-term debt:
| (Dollars in thousands) | 2011 | 2012 | 2013 | 2014 | 2015 | Thereafter | Total | |||||||||||||||||||||
| FHLB advances |
$ | 8,018 | 18 | 15,018 | 20,018 | 18,018 | 10,024 | 71,114 | ||||||||||||||||||||
| Securities sold under agreements to repurchase |
— | — | — | — | — | 15,000 | 15,000 | |||||||||||||||||||||
| Subordinated debentures |
— | — | — | — | — | 7,217 | 7,217 | |||||||||||||||||||||
| Total long-term debt |
$ | 8,018 | 18 | 15,018 | 20,018 | 18,018 | 32,241 | 93,331 | ||||||||||||||||||||
NOTE 11: OTHER COMPREHENSIVE INCOME (LOSS)
Comprehensive income is defined as the change in equity from all transactions other than those with shareholders, and it includes net earnings and other comprehensive income (loss). Other comprehensive income (loss) for the years ended December 31, 2010, 2009, and 2008, is presented below.
| (In thousands) | Pre-tax amount |
Tax benefit (expense) |
Net of tax amount |
|||||||||
| 2010: |
||||||||||||
| Unrealized net holding loss on other-than-temporarily impaired securities due to factors other than credit |
$ | (210) | 77 | (133) | ||||||||
| Unrealized net holding loss on all other securities |
(2,032) | 751 | (1,281) | |||||||||
| Reclassification adjustment for net gain on securities recognized in net earnings |
(1,423) | 525 | (898) | |||||||||
| Other comprehensive loss |
$ | (3,665) | 1,353 | (2,312) | ||||||||
| 2009: |
||||||||||||
| Unrealized net holding loss on other-than-temporarily impaired securities due to factors other than credit |
$ | (257) | 95 | (162) | ||||||||
| Unrealized net holding loss on all other securities |
(4,226) | 1,559 | (2,667) | |||||||||
| Reclassification adjustment for net loss on securities recognized in net earnings |
3,703 | (1,366) | 2,337 | |||||||||
| Other comprehensive loss |
$ | (780) | 288 | (492) | ||||||||
| 2008: |
||||||||||||
| Unrealized net holding gain on securities |
$ | 450 | (187) | 263 | ||||||||
| Reclassification adjustment for net loss on securities recognized in net earnings |
1,168 | (431) | 737 | |||||||||
| Other comprehensive income |
$ | 1,618 | (618) | 1,000 | ||||||||
NOTE 12: INCOME TAXES
For the years ended December 31, 2010, 2009, and 2008 the components of income tax expense (benefit) from continuing operations are presented below.
| Years ended December 31 | ||||||||||||
| (Dollars in thousands) | 2010 | 2009 | 2008 | |||||||||
| Current income taxes: |
||||||||||||
| Federal |
$ | 1,290 | $ | 1,563 | 2,321 | |||||||
| State |
285 | 287 | 370 | |||||||||
| Total current income taxes |
1,575 | 1,850 | 2,691 | |||||||||
| Deferred income taxes: |
||||||||||||
| Federal |
(698) | (1,930) | (589) | |||||||||
| State |
(79) | (260) | (79) | |||||||||
| Total deferred income taxes |
(777) | (2,190) | (668) | |||||||||
| Total income tax expense (benefit) |
$ | 798 | $ | (340) | 2,023 | |||||||
86
Table of Contents
Total income tax expense differs from the amounts computed by applying the statutory federal income tax rate of 34% to earnings before income taxes. A reconciliation of the differences for the years ended December 31, 2010, 2009 and 2008, is presented below. As discussed in Footnote 1, income tax expense for the year ended December 31, 2009 included a $281 thousand tax benefit related to the correction of an error in prior periods. The error resulted from the incorrect calculation of tax basis for certain available-for-sale securities, primarily related to periods prior to January 1, 2007.
| 2010 | 2009 | 2008 | ||||||||||||||||||||||
| (Dollars in thousands) | Amount |
Percent of earnings |
Amount | Percent of pre-tax earnings |
Amount |
Percent of earnings |
||||||||||||||||||
| Earnings before income taxes |
$ | 6,144 | $ | 2,064 | $ 8,660 | |||||||||||||||||||
| Income taxes at statutory rate |
2,089 | 34.0 % | 702 | 34.0 % | 2,944 | 34.0 % | ||||||||||||||||||
| Tax-exempt interest |
(1,042) | (17.0) | (939) | (45.5) | (779) | (9.0) | ||||||||||||||||||
| State income taxes, net of federal tax effect |
151 | 2.5 | 44 | 2.1 | 192 | 2.2 | ||||||||||||||||||
| Low-income housing credit |
(220) | (3.6) | (228) | (11.0) | (228) | (2.6) | ||||||||||||||||||
| Bank owned life insurance |
(154) | (2.5) | (144) | (7.0) | (160) | (1.8) | ||||||||||||||||||
| Change in valuation allowance |
— | — | 505 | 24.5 | — | — | ||||||||||||||||||
| Correction of prior period error |
— | — | (281) | (13.6) | — | — | ||||||||||||||||||
| Other |
(26) | (0.4) | 1 | 0.0 | 54 | 0.6 | ||||||||||||||||||
|
Total income tax expense (benefit) |
$ | 798 | 13.0 % | (340) | (16.5) % | 2,023 | 23.4 % | |||||||||||||||||
The Company had net deferred tax assets of $5.8 million and $3.7 million at December 31, 2010 and 2009, respectively. The tax effects of temporary differences that give rise to significant portions of the deferred tax assets and deferred tax liabilities at December 31, 2010 and 2009 are presented below:
| December 31 | ||||||||
|
(Dollars in thousands) |
2010 | 2009 | ||||||
| Deferred tax assets: |
||||||||
| Allowance for loan losses |
$ | 2,832 | 2,397 | |||||
| Securities |
1,549 | 1,723 | ||||||
| Unrealized loss on securities |
1,288 | — | ||||||
| Other real estate owned |
466 | — | ||||||
| Other assets |
274 | 186 | ||||||
| Capital loss carryforwards |
505 | 731 | ||||||
| Tax credit carryforwards |
108 | — | ||||||
| Other |
127 | 38 | ||||||
| Total deferred tax assets |
7,149 | 5,075 | ||||||
| Less: valuation allowance for nondeductible capital losses |
(505) | (505) | ||||||
| Total deferred tax assets less valuation allowance |
6,644 | 4,570 | ||||||
| Deferred tax liabilities: |
||||||||
| Depreciation |
59 | 189 | ||||||
| Discount accretion |
150 | 165 | ||||||
| Unrealized gain on securities |
— | 65 | ||||||
| FHLB stock dividends |
23 | 24 | ||||||
| Prepaid expenses |
99 | 79 | ||||||
| Deferred loan fees |
61 | 57 | ||||||
| Originated mortgage servicing rights |
439 | 308 | ||||||
| Total deferred tax liabilities |
831 | 887 | ||||||
|
Net deferred tax asset |
$ | 5,813 | 3,683 | |||||
At December 31, 2010, the Company had U.S. federal tax credit carryforwards of approximately $0.1 million, which expire in 2020. Additionally, at December 31, 2010, the Company had capital loss carryforwards of approximately $0.5 million that expire in 2014. The Company’s capital loss carryforwards at December 31, 2010 and 2009, respectively,
87
Table of Contents
were primarily attributable to a capital loss for income tax purposes related to its investments in the common stock of Silverton Financial Services, Inc, the holding company of Silverton Bank, which failed on May 1, 2009.
A valuation allowance is recognized for a deferred tax asset if, based on the weight of available evidence, it is more-likely-than-not that some portion of the entire deferred tax asset will not be realized. The ultimate realization of deferred tax assets is dependent upon the generation of future taxable income during the periods in which those temporary differences become deductible. Management considers the scheduled reversal of deferred tax liabilities, projected future taxable income and tax planning strategies in making this assessment.
The Company had a valuation allowance for deferred tax assets of approximately $0.5 million at December 31, 2010 and 2009, respectively, which reduced its deferred tax asset related to capital loss carryforwards to an amount that management believes will more-likely-than-not be realized. Based upon the level of historical taxable income and projection for future taxable income over the periods which the temporary differences resulting in the remaining deferred tax assets are deductible, management believes it is more-likely-than-not that the Company will realize the benefits of its remaining deferred tax assets at December 31, 2010. The amount of the deferred tax assets considered realizable, however, could be reduced in the near term if estimates of future taxable income are reduced.
The change in the net deferred tax asset for the years ended December 31, 2010, 2009 and 2008, is presented below.
| Years ended December 31 | ||||||||||||||||
|
(Dollars in thousands) |
2010 | 2009 | 2008 | |||||||||||||
| Net deferred tax asset: |
||||||||||||||||
| Balance, beginning of year |
$ | 3,683 | 1,205 | 1,155 | ||||||||||||
| Deferred tax benefit related to continuing operations |
777 | 2,190 | 668 | |||||||||||||
| Stockholders’ equity, for accumulated other comprehensive loss (income) |
1,353 | 288 | (618) | |||||||||||||
| Balance, end of year |
$ | 5,813 | 3,683 | 1,205 | ||||||||||||
ASC 740 defines the threshold for recognizing the benefits of tax return positions in the financial statements as “more-likely-than-not” to be sustained by the taxing authority. This section also provides guidance on the derecognition, measurement and classification of income tax uncertainties in interim periods. As of December 31, 2010, the Company had no unrecognized tax benefits related to federal or state income tax matters. The Company does not anticipate any material increase or decrease in unrecognized tax benefits during 2011 relative to any tax positions taken prior to December 31, 2010. As of December 31, 2010, the Company has accrued no interest and no penalties related to uncertain tax positions. It is the Company’s policy to recognize interest and penalties related to income tax matters in income tax expense.
The Company and its subsidiaries file consolidated U.S. federal and State of Alabama income tax returns. The Company is currently open to audit under the statute of limitations by the Internal Revenue Service for the years ended December 31, 2007 through 2010. The Company is also currently open to audit by the State of Alabama for the years ended December 31, 2007, through 2010, although certain matters have been closed.
NOTE 13: EMPLOYEE BENEFIT PLAN
The Company has a 401(k) Plan that covers substantially all employees. Participants may contribute up to 10% of eligible compensation subject to certain limits based on federal tax laws. The Company’s matching contributions to the Plan are determined by the board of directors. Participants become 20% vested in their accounts after two years of service and 100% vested after six years of service. Company matching contributions to the Plan were $113 thousand, $120 thousand, and $119 thousand for the years ended December 31, 2010, 2009, and 2008, respectively, and are included in salaries and benefits expense.
NOTE 14: DERIVATIVE INSTRUMENTS
Financial derivatives are reported at fair value in other assets or other liabilities. The accounting for changes in the fair value of a derivative depends on whether it has been designated and qualifies as part of a hedging relationship. For derivatives not designated as part of a hedging relationship, the gain or loss is recognized in current earnings. From time to time, the Company may enter into interest rate swaps (“swaps”) to facilitate customer transactions and meet their financing
88
Table of Contents
needs. Upon entering into these instruments to meet customer needs, the Company enters into offsetting positions in order to minimize the risk to the Company. These swaps qualify as derivatives, but are not designated as hedging instruments. At December 31, 2010 the Company had no derivative contracts to assist in managing the Company’s interest rate sensitivity.
Interest rate swap contracts involve the risk of dealing with counterparties and their ability to meet contractual terms. When the fair value of a derivative instrument contract is positive, this generally indicates that the counter party or customer owes the Company, and results in credit risk to the Company. When the fair value of a derivative instrument contract is negative, the Company owes the customer or counterparty and therefore, has no credit risk.
A summary of the Company’s interest rate swaps as of and for the year ended December 31, 2010 is presented below.
| Other Assets |
Other Liabilities |
Other noninterest income |
||||||||||||||||||||||||||||||
| (Dollars in thousands) | Notional | Estimated Fair Value |
Estimated Fair Value |
Gains (Losses) |
||||||||||||||||||||||||||||
| Interest rate swap agreements: |
||||||||||||||||||||||||||||||||
| Pay fixed / receive variable |
$ | 6,067 | $ | — | 1,101 | (170) | ||||||||||||||||||||||||||
| Pay variable / receive fixed |
6,067 | 1,101 | — | 170 | ||||||||||||||||||||||||||||
| Total interest rate swap agreements |
$ | 12,134 | $ | 1,101 | $ | 1,101 | $ | — | ||||||||||||||||||||||||
NOTE 15: COMMITMENTS AND CONTINGENT LIABILITIES
Credit-Related Financial Instruments
The Company is party to credit related financial instruments with off-balance sheet risk in the normal course of business to meet the financing needs of its customers. These financial instruments include commitments to extend credit and standby letters of credit. Such commitments involve, to varying degrees, elements of credit and interest rate risk in excess of the amount recognized in the consolidated balance sheets.
The Company’s exposure to credit loss is represented by the contractual amount of these commitments. The Company follows the same credit policies in making commitments as it does for on-balance sheet instruments.
At December 31, 2010 and 2009, the following financial instruments were outstanding whose contract amount represents credit risk:
| December 31 | ||||||||||||||||
| (Dollars in thousands) |
2010 |
2009 | ||||||||||||||
| Commitments to extend credit |
$ | 41,747 | $ | 46,505 | ||||||||||||
| Standby letters of credit |
7,785 | 8,116 | ||||||||||||||
| Commitments to fund affordable housing investments |
4,378 | — | ||||||||||||||
Commitments to extend credit are agreements to lend to a customer as long as there is no violation of any condition established in the contract. Commitments generally have fixed expiration dates or other termination clauses and may require payment of a fee. The commitments for lines of credit may expire without being drawn upon. Therefore, total commitment amounts do not necessarily represent future cash requirements. The amount of collateral obtained, if it is deemed necessary by the Company, is based on management’s credit evaluation of the customer.
Standby letters of credit are conditional commitments issued by the Company to guarantee the performance of a customer to a third party. Those letters of credit are primarily issued to support public and private borrowing arrangements. Essentially all letters of credit issued have expiration dates within one year. The credit risk involved in issuing letters of credit is essentially the same as that involved in extending loan facilities to customers. The Company holds various assets as collateral supporting those commitments for which collateral is deemed necessary. The Company has recorded a liability for the estimated fair value of these standby letters of credit in the amount of $54 thousand and $90 thousand at December 31, 2010 and 2009, respectively.
89
Table of Contents
Periodically, the Company may invest in various limited partnerships that sponsor affordable housing projects in its primary markets and surrounding areas as a means of supporting local communities. When commitments to fund affordable housing investments are contingent upon a future event, a liability must be recognized when that contingent event becomes probable. At December 31, 2010, total unfunded commitments outstanding for affordable housing investments were $4.4 million, of which $1.9 million was included in other liabilities. At December 31, 2009, the Company had no unfunded commitments related to affordable housing investments. For further discussion of the Company’s involvement with affordable housing investments, see Note 2, Variable Interest Entities.
Other Commitments
Minimum lease payments under leases classified as operating leases due in each of the five years subsequent to December 31, 2010, are as follows: 2011, $332 thousand; 2012, $229 thousand; 2013, $134 thousand; 2014, $51 thousand; 2015, $37 thousand.
Contingent Liabilities
The Company and the Bank are involved in various legal proceedings, arising in connection with their business. In the opinion of management, based upon consultation with legal counsel, the ultimate resolution of these proceeding will not have a material adverse affect upon the consolidated financial condition or results of operations of the Company and the Bank.
NOTE 16: FAIR VALUE DISCLOSURES
“Fair value” is defined by FASB ASC 820, Fair Value Measurements and Disclosures, as the price that would be received to sell an asset or paid to transfer a liability in an orderly transaction between market participants at the measurement date. FASB ASC 820 establishes a hierarchy for inputs used in measuring fair value that maximizes the use of observable inputs and minimizes the use of unobservable inputs by requiring that most observable inputs be used when available. Observable inputs are inputs that market participants would use in pricing the asset or liability developed based on market data obtained from sources independent of the Company. Unobservable inputs are inputs that reflect the Company’s assumptions about the inputs market participants would use in pricing the asset or liability developed based on the best information available in the circumstances. The hierarchy is broken down into three levels based on the reliability of inputs as follows:
Level 1—inputs to the valuation methodology are quoted prices (unadjusted) for identical assets or liabilities in active markets.
Level 2—inputs to the valuation methodology include quoted prices for similar assets and liabilities in active markets, and inputs that are observable for the asset or liability, either directly or indirectly, for substantially the full term of the financial instrument.
Level 3—inputs to the valuation methodology are unobservable and significant to the fair value measurement.
The Company’s assets and liabilities recorded at fair value have been categorized based upon a fair value hierarchy in accordance with FASB ASC 820.
Securities – Securities available-for-sale are recorded at fair value on a recurring basis. Where quoted prices are available in an active market, securities are classified within Level 1 of the valuation hierarchy. Level 1 securities would include highly liquid government securities such as U.S. Treasuries and exchange-traded equity securities.
When instruments are traded in secondary markets and quoted market prices are not available, the Company generally relies on prices obtained from independent vendors. Vendors compile prices from various sources and often apply matrix pricing for similar securities when no price is observable. Securities measured with these valuation techniques are generally classified within Level 2 of the valuation hierarchy and often involve using quoted market prices for similar securities, pricing models or discounted cash flow analyses using inputs observable in the market where available. Examples include U.S. government agency securities and residential mortgage-backed securities.
Security fair value measurements using significant inputs that are unobservable in the market due to limited activity or a less liquid market are classified within Level 3 of the valuation hierarchy. Such measurements include securities valued using discounted cash flow models or a combination of valuation techniques such as weighting of models
90
Table of Contents
and vendor or broker pricing, where the unobservable inputs are significant to the overall fair value measurement. Securities classified as Level 3 include pooled and individual issuer trust preferred securities.
Loans held for sale – Loans held for sale are carried at the lower of cost or estimated fair value and are subjected to nonrecurring fair value adjustments. Estimated fair value is determined on the basis of the current market value of similar loans. All of the Company’s loans held for sale are classified within Level 2 of the valuation hierarchy.
Loans, net – Loans considered impaired under FASB ASC 310-10-35, Receivables, are loans for which, based on current information and events, it is probable that the Company will be unable to collect all amounts due according to the contractual terms of the loan agreement. Impaired loans are subject to nonrecurring fair value adjustments to reflect (1) partial write-downs that are based on the observable market price or current appraised value of the collateral, or (2) the full charge-off of the loan carrying value. All of the Company’s impaired loans are classified within Level 3 of the valuation hierarchy.
Other real estate – Other real estate, consisting of properties obtained through foreclosure or in satisfaction of loans, are initially recorded at the lower of the loan’s carrying amount or the fair value less costs to sell upon transfer of the loans to other real estate. Subsequently, other real estate is carried at the lower of carrying value or fair value less costs to sell. Fair value is generally determined on the basis of current appraisals, comparable sales, and other estimates of value obtained principally from independent sources, adjusted for estimated selling costs. All of the Company’s other real estate is classified within Level 3 of the valuation hierarchy.
Other assets – The Company has certain financial assets carried at fair value on a recurring basis, including interest rate swap agreements. The carrying amount of interest rate swap agreements is based on information obtained from a third party bank. The Company classified these derivative assets within Level 2 of the valuation hierarchy. These swaps qualify as derivatives, but are not designated as hedging instruments. The Company had no derivative contracts to assist in managing interest rate sensitivity at December 31, 2010 or December 31, 2009.
Mortgage servicing rights, net, included in other assets on the accompanying consolidated balance sheets, are carried at the lower of cost or estimated fair value and are subjected to nonrecurring fair value adjustments. MSRs do not trade in an active market with readily observable prices. To determine the fair value of MSRs, the Company engages an independent third party. The independent third party’s valuation model calculates the present value of estimated future net servicing income using assumptions that market participants would use in estimating future net servicing income, including estimates of prepayment speeds, discount rate, default rates, cost to service, escrow account earnings, contractual servicing fee income, ancillary income, and late fees. Because the valuation of MSRs requires the use of significant unobservable inputs, all of the Company’s MSRs are classified within Level 3 of the valuation hierarchy.
Other liabilities – The Company has certain financial liabilities carried at fair value on a recurring basis, including interest rate swap agreements. The carrying amount of interest rate swap agreements is based on information obtained from a third party bank. The Company classified these derivative liabilities within Level 2 of the valuation hierarchy. These swaps qualify as derivatives, but are not designated as hedging instruments. The Company had no derivative contracts to assist in managing interest rate sensitivity at December 31, 2010 or December 31, 2009.
91
Table of Contents
Assets and liabilities measured at fair value on a recurring basis
The following table presents the balances of the assets and liabilities measured at fair value on a recurring basis as of December 31, 2010 and 2009, respectively, by caption, on the consolidated balance sheets by FASB ASC 820 valuation hierarchy (as described above).
| (Dollars in thousands) | Amount | Quoted Prices in Identical Assets (Level 1) |
Significant (Level 2) |
Significant (Level 3) |
||||||||||||
| December 31, 2010: |
||||||||||||||||
| Securities available-for-sale: |
||||||||||||||||
| Agency obligations |
$ | 90,471 | — | 90,471 | — | |||||||||||
| Agency RMBS |
143,144 | — | 143,144 | — | ||||||||||||
| States and political subdivisions |
76,766 | — | 76,766 | — | ||||||||||||
| Trust preferred securities: |
||||||||||||||||
| Pooled |
20 | — | — | 20 | ||||||||||||
| Individual issuer |
2,129 | — | — | 2,129 | ||||||||||||
| Corporate debt |
2,690 | 2,690 | — | — | ||||||||||||
| Total securities available-for-sale |
315,220 | 2,690 | 310,381 | 2,149 | ||||||||||||
| Other assets (1) |
1,101 | — | 1,101 | — | ||||||||||||
| Total assets at fair value |
$ | 316,321 | 2,690 | 311,482 | 2,149 | |||||||||||
| Other liabilities (1) |
$ | 1,101 | — | 1,101 | — | |||||||||||
| Total liabilities at fair value |
$ | 1,101 | — | 1,101 | — | |||||||||||
| December 31, 2009: |
||||||||||||||||
| Securities available-for-sale: |
||||||||||||||||
| Agency obligations |
$ | 90,220 | — | 90,220 | — | |||||||||||
| Agency RMBS |
158,642 | — | 158,642 | — | ||||||||||||
| States and political subdivisions |
81,562 | — | 81,562 | — | ||||||||||||
| Trust preferred securities: |
||||||||||||||||
| Pooled |
23 | — | — | 23 | ||||||||||||
| Individual issuer |
1,440 | — | — | 1,440 | ||||||||||||
| Corporate debt |
2,875 | — | 2,875 | — | ||||||||||||
| Total securities available-for-sale |
334,762 | — | 333,299 | 1,463 | ||||||||||||
| Other assets (1) |
931 | — | 931 | — | ||||||||||||
| Total assets at fair value |
$ | 335,693 | — | 334,230 | 1,463 | |||||||||||
| Other liabilities (1) |
$ | 931 | — | 931 | — | |||||||||||
| Total liabilities at fair value |
$ | 931 | — | 931 | — | |||||||||||
| (1) | Represents the fair value of interest rate swap agreements. |
Level changes in fair value measurements
Transfers between levels of the fair value hierarchy are recognized on the actual date of the event or circumstances that caused the transfer, which generally coincides with the Corporation’s monthly and/or quarterly valuation process. The Company monitors the valuation techniques utilized for each category of financial assets and liabilities to ascertain when transfers between levels have been affected. The nature of the Company’s financial assets and liabilities generally is such that transfers in and out of any level are expected to be rare. The Company disposed of its corporate debt securities during the first two weeks of January 2011. Due to the proximity between December 31, 2010 and the respective trade dates for these corporate debt securities sold, the Company determined that the trade price for each security approximated its fair value at December 31, 2010. Accordingly, the Company determined that its corporate securities should be transferred from
92
Table of Contents
Level 2 and classified as Level 1 at December 31, 2010. For the year ended December 31, 2010, there were no other transfers between levels.
The following is a reconciliation of the beginning and ending balances of recurring fair value measurements for financial assets recognized in the accompanying condensed consolidated balance sheets using Level 3 inputs:
| Years ended December 31 | ||||||||
| (Dollars in thousands) | 2010 | 2009 | ||||||
| Beginning balance |
$ | 1,463 | $ | 8,705 | ||||
| Total realized and unrealized gains and (losses): |
||||||||
| Included in net earnings |
(1,218 | ) | (5,234) | |||||
| Included in other comprehensive income |
1,904 | 605 | ||||||
| Purchases, issuances and settlements |
— | — | ||||||
| Transfers in and/or (out) of Level 3 |
— | (2,613) | ||||||
| Ending balance |
$ | 2,149 | $ | 1,463 | ||||
The transfer from Level 3 to Level 2 during the year ended December 31, 2009 primarily related to corporate debt securities. Due to an increase in trading activity and observable inputs for the Company’s corporate debt securities during the year ended December 31, 2009, the fair value measurements for these securities were recognized using Level 2 inputs.
Assets and liabilities measured at fair value on a nonrecurring basis
The following table presents the balances of the assets and liabilities measured at fair value on a nonrecurring basis as of December 31, 2010 and 2009, respectively, by caption, on the consolidated balance sheets and by FASB ASC 820 valuation hierarchy (as described above):
| (Dollars in thousands) | Amount | Quoted Prices in Identical Assets |
Significant Other Observable Inputs (Level 2) |
Significant (Level 3) |
||||||||||||
| December 31, 2010: |
||||||||||||||||
| Loans held for sale |
$ | 4,281 | — | 4,281 | — | |||||||||||
| Loans, net (1) |
10,362 | — | — | 10,362 | ||||||||||||
| Other real estate owned |
8,125 | — | — | 8,125 | ||||||||||||
| Other assets (2) |
1,189 | — | — | 1,189 | ||||||||||||
| Total assets at fair value |
$ | 23,957 | — | 4,281 | 19,676 | |||||||||||
| December 31, 2009: |
||||||||||||||||
| Loans held for sale |
$ | 4,881 | — | 4,881 | — | |||||||||||
| Loans, net (1) |
8,430 | — | — | 8,430 | ||||||||||||
| Other real estate owned |
7,292 | — | — | 7,292 | ||||||||||||
| Other assets (2) |
834 | — | — | 834 | ||||||||||||
| Total assets at fair value |
$ | 21,437 | — | 4,881 | 16,556 | |||||||||||
| (1) | Loans considered impaired under FASB ASC 310-10-35, Receivables. |
| (2) | Mortgage servicing rights, net included in this category. |
NOTE 17: FAIR VALUE OF FINANCIAL INSTRUMENTS
FASB ASC 825, Financial Instruments requires disclosure of fair value information about financial instruments, whether or not recognized on the face of the balance sheet, for which it is practicable to estimate that value. The assumptions used in the estimation of the fair value of the Company’s financial instruments are explained below. Where quoted market prices are not available, fair values are based on estimates using discounted cash flow and other valuation techniques. Discounted cash flows can be significantly affected by the assumptions used, including the discount rate and estimates of future cash flows. The following fair value estimates cannot be substantiated by comparison to independent
93
Table of Contents
markets and should not be considered representative of the liquidation value of the Company’s financial instruments, but rather a good–faith estimate of the fair value of financial instruments held by the Company. FASB ASC 825 excludes certain financial instruments and all nonfinancial instruments from its disclosure requirements.
The following methods and assumptions were used by the Company in estimating the fair value of its financial instruments:
Cash and cash equivalents
Due to their short-term nature, the carrying amounts reported in the balance sheet are assumed to approximate fair value for these assets. For purposes of disclosure, cash equivalents include federal funds sold and other short-term investments.
Securities
Fair value measurement is based upon quoted prices if available. If quoted market prices are not available, estimated fair values are based on quoted market prices of comparable instruments. See Note 3 for additional disclosure related to fair value measurements for securities.
Loans held for sale
Loans held for sale are carried at the lower of cost or estimated fair value and are subjected to nonrecurring fair value adjustments. Estimated fair value is determined on the basis of the current market value of similar loans.
Loans, net
The fair value of loans is calculated using discounted cash flows. The discount rates used to determine the present value of the loan portfolio are estimated market discount rates that reflect the credit and interest rate risk inherent in the loan portfolio. This method of estimating fair value does not incorporate the exit-price concept of fair value prescribed by FASB ASC 820 and generally produces a higher value than an exit-price approach. The estimated maturities are based on the Company’s historical experience with repayments adjusted to estimate the effect of current market conditions. The carrying amount of accrued interest approximates its fair value.
Deposits
Under FASB ASC 825, the fair value of deposits with no stated maturity, such as noninterest bearing demand deposits, interest bearing demand deposits and savings and certain types of money market accounts, is equal to the amount payable on demand at the reporting date (i.e., their carrying amount). The carrying amounts of variable-rate, fixed-term money market accounts and certificates of deposit approximate their fair values at the reporting date. Fair values for fixed-rate certificates of deposit are estimated using discounted cash flows. The discount rates used are based on estimated market rates for deposits of similar remaining maturities.
Short-term borrowings
The fair values of federal funds purchased, securities sold under agreements to repurchase, and other short–term borrowings approximate their carrying value.
Long–term debt
The fair value of the Company’s fixed rate long–term debt is estimated using discounted cash flows based on estimated current market rates for similar types of borrowing arrangements. The carrying amount of the Company’s variable rate long–term debt approximates its fair value.
Derivative Instruments
The Company enters into interest rate swaps to meet the financing, interest rate and equity risk management needs of its customers. The carrying amounts of these derivative instruments represent their fair value. Generally, the fair value of these instruments is based on an observable market price.
Off-balance sheet Instruments
The fair values of the Company’s off-balance-sheet financial instruments are based on fees charged to enter into similar agreements. However, commitments to extend credit do not represent a significant value to the Company until such commitments are funded. The Company has determined that the estimated fair value of commitments to extend credit approximates the carrying amount and is immaterial to the financial statements.
94
Table of Contents
The carrying value and related estimated fair value of the Company’s financial instruments at December 31, 2010 and December 31, 2009 are presented below.
| December 31, 2010 |
December 31, 2009 | |||||||||||||||
| (Dollars in thousands) | Carrying amount |
Estimated fair value |
Carrying amount |
Estimated fair value |
||||||||||||
| Financial Assets: |
||||||||||||||||
| Cash and cash equivalents |
$ | 21,424 | $ | 21,424 | $ | 12,395 | $ | 12,395 | ||||||||
| Securities |
315,220 | 315,220 | 334,762 | 334,762 | ||||||||||||
| Loans held for sale |
4,281 | 4,281 | 4,881 | 4,881 | ||||||||||||
| Loans, net |
366,539 | 372,869 | 369,608 | 373,940 | ||||||||||||
| Derivative Assets |
1,101 | 1,101 | 931 | 931 | ||||||||||||
| Financial Liabilities: |
||||||||||||||||
| Deposits |
$ | 607,127 | $ | 615,300 | $ | 579,409 | $ | 585,597 | ||||||||
| Short-term borrowings |
2,685 | 2,685 | 15,960 | 15,960 | ||||||||||||
| Long-term debt |
93,331 | 99,505 | 118,349 | 124,004 | ||||||||||||
| Derivative Liabilities |
1,101 | 1,101 | 931 | 931 | ||||||||||||
NOTE 18: RELATED PARTY TRANSACTIONS
A director of the Company is an officer in a construction company that the Company contracted with during the year ended December 31, 2009 for the construction of a new branch facility. Total payments made to the construction company under the terms of the construction contract were $587 thousand for the years ended December 31, 2009. No payments were made to the construction company for the year ended December 31, 2010.
The Bank has made, and expects in the future to continue to make in the ordinary course of business, loans to directors and executive officers of the Company, the Bank, and their affiliates. In management’s opinion, these loans were made in the ordinary course of business at normal credit terms, including interest rate and collateral requirements, and do not represent more than normal credit risk. An analysis of such outstanding loans is presented below.
| (Dollars in thousands) | Amount | |||
| Loans outstanding at December 31, 2009 |
$ | 3,257 | ||
| New loans/advances |
2,650 | |||
| Repayments |
(1,859) | |||
| Changes in directors and executive officers |
— | |||
| Loans outstanding at December 31, 2010 |
$ | 4,048 | ||
During 2010 and 2009, certain executive officers and directors of the Company and the Bank, including companies with which they are affiliated, were deposit customers of the bank. Total deposits for these persons at December 31, 2010 and 2009 amounted to $18.7 million and $17.8 million, respectively.
NOTE 19: REGULATORY RESTRICTIONS AND CAPITAL RATIOS
The Company and the Bank are subject to various regulatory capital requirements and policies administered by federal and State of Alabama banking regulators. Failure to meet minimum capital requirements can initiate certain mandatory – and possibly additional discretionary – actions by regulators that, if undertaken, could have a material effect on the consolidated financial statements. Under capital adequacy guidelines and the regulatory framework for prompt corrective action, the Company and the Bank must meet specific capital guidelines that involve quantitative measures of the Company’s and Bank’s assets, liabilities, and certain off–balance sheet items as calculated under regulatory accounting practices. The Company’s and Bank’s capital amounts and classification are also subject to qualitative judgments by the regulators about components, risk weightings, and other factors, including anticipated capital needs, and the Federal Reserve is encouraging the maintenance of higher levels of capital well above the minimum ratios and is expected to propose higher capital requirements to implement the Dodd-Frank Act and Basel III capital requirements. Supervisory assessments of capital adequacy may differ significantly from conclusions based solely upon risk-based capital ratios. Quantitative measures established by regulation to ensure capital adequacy require the Company and the Bank to maintain minimum amounts and ratios (set forth in the table below) Tier 1 leverage capital ratio, Tier 1 risk-based ratio and total risk-based ratio. Management believes, as of December 31, 2010, that the Company and the Bank meet all capital
95
Table of Contents
adequacy requirements to which they are subject.
As of December 31, 2010, the Bank is “well capitalized” under the regulatory framework for prompt corrective action. To be categorized as “well capitalized,” the Bank must maintain minimum total risk–based, Tier I risk–based, and Tier I leverage ratios as set forth in the table. Management has not received any notification from the Company or the Bank's regulators that changes the Bank’s regulatory capital status.
The actual capital amounts and ratios and the aforementioned minimums as of December 31, 2010 and 2009 are presented below.
| Actual | Minimum for capital
adequacy purposes |
Minimum to be
well capitalized |
||||||||||||||||||||||
| (Dollars in thousands) | Amount | Ratio | Amount | Ratio | Amount | Ratio | ||||||||||||||||||
| At December 31, 2010: |
||||||||||||||||||||||||
| Tier 1 Leverage Capital |
||||||||||||||||||||||||
| Auburn National Bancorporation |
$ | 65,644 | 8.47% | $ | 30,999 | 4.00% | N/A | N/A | ||||||||||||||||
| AuburnBank |
61,707 | 8.00 | 30,835 | 4.00 | $ | 38,544 | 5.00% | |||||||||||||||||
| Tier 1 Risk-Based Capital |
||||||||||||||||||||||||
| Auburn National Bancorporation |
$ | 65,644 | 14.57% | $ | 18,017 | 4.00% | N/A | N/A | ||||||||||||||||
| AuburnBank |
61,707 | 13.82 | 17,863 | 4.00 | $ | 26,795 | 6.00% | |||||||||||||||||
| Total Risk-Based Capital |
||||||||||||||||||||||||
| Auburn National Bancorporation |
$ | 71,269 | 15.82% | $ | 36,035 | 8.00% | N/A | N/A | ||||||||||||||||
| AuburnBank |
67,332 | 15.08 | 35,727 | 8.00 | $ | 44,658 | 10.00% | |||||||||||||||||
| At December 31, 2009: |
||||||||||||||||||||||||
| Tier 1 Leverage Capital |
||||||||||||||||||||||||
| Auburn National Bancorporation |
$ | 63,176 | 8.13% | $ | 31,095 | 4.00% | N/A | N/A | ||||||||||||||||
| AuburnBank |
59,143 | 7.65 | 30,931 | 4.00 | $ | 38,664 | 5.00% | |||||||||||||||||
| Tier 1 Risk-Based Capital |
||||||||||||||||||||||||
| Auburn National Bancorporation |
$ | 63,176 | 13.73% | $ | 18,402 | 4.00% | N/A | N/A | ||||||||||||||||
| AuburnBank |
59,143 | 12.97 | 18,244 | 4.00 | $ | 27,365 | 6.00% | |||||||||||||||||
| Total Risk-Based Capital |
||||||||||||||||||||||||
| Auburn National Bancorporation |
$ | 68,906 | 14.98% | $ | 36,803 | 8.00% | N/A | N/A | ||||||||||||||||
| AuburnBank |
64,873 | 14.22 | 36,487 | 8.00 | $ | 45,609 | 10.00% | |||||||||||||||||
Dividends paid by the Bank are a principal source of funds available to the Company for payment of dividends to its stockholders and for other needs. Applicable federal and state statutes and regulations impose restrictions on the amounts of dividends that may be declared by the subsidiary bank. State law and Federal Reserve policy restrict the Bank from declaring dividends in excess of the sum of the current year’s earnings plus the retained net earnings from the preceding two years without prior approval. In addition to the formal statutes and regulations, regulatory authorities also consider the adequacy of the Bank’s total capital in relation to its assets, deposits, and other such items. Capital adequacy considerations could further limit the availability of dividends from the Bank. At December 31, 2010, the Bank could have declared additional dividends of approximately $6.2 million without prior approval of regulatory authorities. As a result of this limitation, approximately $53.4 million of the Company’s investment in the Bank was restricted from transfer in the form of dividends.
96
Table of Contents
NOTE 20: AUBURN NATIONAL BANCORPORATION (PARENT COMPANY)
The Parent Company’s condensed balance sheet and related condensed statements of earnings and cash flows are as follows:
CONDENSED BALANCE SHEETS
| December 31 | ||||||||
| (Dollars in thousands) |
2010 |
2009 | ||||||
| Assets: |
||||||||
| Cash and due from banks |
$ | 804 | $ | 765 | ||||
| Investment in bank subsidiary |
59,534 | 59,254 | ||||||
| Premises and Equipment |
3,388 | 3,474 | ||||||
| Other assets |
575 | 591 | ||||||
| Total assets |
$ | 64,301 | $ | 64,084 | ||||
| Liabilities: |
||||||||
| Accrued expenses and other liabilities |
$ | 716 | $ | 684 | ||||
| Long-term debt |
7,217 | 7,217 | ||||||
| Total liabilities |
7,933 | 7,901 | ||||||
| Stockholders’ equity |
56,368 | 56,183 | ||||||
| Total liabilities and stockholders’ equity |
$ | 64,301 | $ | 64,084 | ||||
CONDENSED STATEMENTS OF EARNINGS
| Years ended December 31 | ||||||||||||
| (Dollars in thousands) |
2010 |
2009 | 2008 | |||||||||
| Income: |
||||||||||||
| Dividends from bank subsidiary |
$ | 3,085 | $ | 3,014 | $ | 3,136 | ||||||
| Noninterest income |
417 | 445 | 307 | |||||||||
| Total income |
3,502 | 3,459 | 3,443 | |||||||||
| Expense: |
||||||||||||
| Interest expense |
236 | 236 | 397 | |||||||||
| Noninterest expense |
577 | 587 | 526 | |||||||||
| Total expense |
813 | 823 | 923 | |||||||||
| Earnings before income tax benefit and equity in undistributed earnings of bank subsidiary |
2,689 | 2,636 | 2,520 | |||||||||
| Income tax benefit |
(65) | (97) | (214) | |||||||||
| Earnings before equity in undistributed earnings of bank subsidiary |
2,754 | 2,733 | 2,734 | |||||||||
| Equity in undistributed (distributed) earnings of bank subsidiary |
2,592 | (329) | 3,903 | |||||||||
| Net earnings |
$ | 5,346 | $ | 2,404 | $ | 6,637 | ||||||
97
Table of Contents
CONDENSED STATEMENTS OF CASH FLOWS
| Years ended December 31 | ||||||||||||
| (Dollars in thousands) |
2010 |
2009 |
2008 |
|||||||||
| Cash flows from operating activities: |
||||||||||||
| Net earnings |
$ | 5,346 | $ | 2,404 | $ | 6,637 | ||||||
| Adjustments to reconcile net earnings to net cash |
||||||||||||
| Depreciation and amortization |
106 | 105 | 110 | |||||||||
| Loss on sale of premises and equipment |
— | — | 142 | |||||||||
| Net decrease (increase) in other assets |
16 | 11 | (38) | |||||||||
| Net increase (decrease) in other liabilities |
32 | (78) | (113) | |||||||||
| Equity in (undistributed) distributed earnings of bank subsidiary |
(2,592) | 329 | (3,903) | |||||||||
| Net cash provided by operating activities |
2,908 | 2,771 | 2,835 | |||||||||
| Cash flows from investing activities: |
||||||||||||
| Purchases of premises and equipment |
(20) | (4) | (6) | |||||||||
| Proceeds from sale of premises and equipment |
— | — | 282 | |||||||||
| Net cash (used in) provided by investing activities |
(20) | (4) | 276 | |||||||||
| Cash flows from financing activities: |
||||||||||||
| Stock repurchases |
(9) | (90) | (813) | |||||||||
| Proceeds from sale of treasury stock |
2 | 3 | 2 | |||||||||
| Dividends paid |
(2,842) | (2,770) | (2,716) | |||||||||
| Net cash used in financing activities |
(2,849) | (2,857) | (3,527) | |||||||||
| Net change in cash and cash equivalents |
39 | (90) | (416) | |||||||||
| Cash and cash equivalents at beginning of period |
765 | 855 | 1,271 | |||||||||
| Cash and cash equivalents at end of period |
$ | 804 | $ | 765 | $ | 855 | ||||||
98
Table of Contents
PART III
| ITEM 10. | DIRECTORS AND EXECUTIVE OFFICERS OF THE REGISTRANT |
Information required by this item is set forth under the headings “Proposal One: Election of Directors - Information about Nominees for Directors,” and “Executive Officers,” “Additional Information Concerning the Company’s Board of Directors and Committees,” “Executive Compensation,” “Audit Committee Report” and “Compliance with Section 16(a) of the Securities Exchange Act of 1934” in the Proxy Statement, and is incorporated herein by reference.
The Board of Directors has adopted a Code of Conduct and Ethics applicable to the Company’s directors, officers and employees, including the Company’s principal executive officer, principal financial and principal accounting officer, controller and other senior financial officers. The Code of Conduct and Ethics, as well as the charters for the Audit Committee, Compensation Committee, and the Nominating and Corporate Governance Committee, can be found by clicking the heading “About Us” on the Company’s website, www.auburnbank.com, and then clicking on “Corporate Governance.” In addition, this information is available in print to any shareholder who requests it. Written requests for a copy of the Company’s Code of Conduct and Ethics or the Audit Committee, Compensation Committee, or Nominating and Corporate Governance Committee Charters may be sent to Auburn National Bancorporation, Inc., 100 N. Gay Street, Auburn, Alabama 36830, Attention: Marla Kickliter, Senior Vice President of Compliance and Internal Audit. Requests may also be made via telephone by contacting Marla Kickliter, Senior Vice President of Compliance and Internal Audit, or Laura Carrington, Vice President of Human Resources, at (334) 821-9200.
| ITEM 11. | EXECUTIVE COMPENSATION |
Information required by this item is set forth under the headings “Additional Information Concerning the Company’s Board of Directors and Committees – Board Compensation,” “Compensation Discussion and Analysis,” “Executive Officers,” and “Compensation Committee Report” in the Proxy Statement, and is incorporated herein by reference.
| ITEM 12. | SECURITY OWNERSHIP OF CERTAIN BENEFICIAL OWNERS AND MANAGEMENT AND RELATED STOCKHOLDER MATTERS |
Information required by this item is set forth under the headings “Proposal One: Election of Directors - Information about Nominees for Directors and Executive Officers” and “Stock Ownership by Certain Persons” in the Proxy Statement, and is incorporated herein by reference.
As of December 31, 2010 the Company had no compensation plans under which equity securities of the Company are authorized for issuance.
The Company’s Long Term Incentive Plan expired on May 10, 2004. No new plans have been issued.
| ITEM 13. | CERTAIN RELATIONSHIPS AND RELATED TRANSACTIONS AND DIRECTOR INDEPENDENCE |
Information required by this item is set forth under the headings “Additional Information Concerning the Company’s Board of Directors and Committees – Committees of the Board of Directors – Independent Directors Committee” and “Certain Transactions and Business Relationships” in the Proxy Statement, and is incorporated herein by reference.
| ITEM 14. | PRINCIPAL ACCOUNTING FEES AND SERVICES |
Information required by this item is set forth under the heading “Independent Public Accountants” in the Proxy Statement, and is incorporated herein by reference.
99
Table of Contents
PART IV
| ITEM 15. | EXHIBITS AND FINANCIAL STATEMENT SCHEDULES |
| (a) | List of all Financial Statements |
The following consolidated financial statements and report of independent registered public accounting firm of the Company are included in this Annual Report on Form 10-K:
Report of Independent Registered Public Accounting Firm
Consolidated Balance Sheets as of December 31, 2010 and 2009
Consolidated Statements of Earnings for the years ended December 31, 2010, 2009, and 2008
Consolidated Statements of Stockholders’ Equity and Comprehensive Income for the years ended December 31, 2010, 2009, and 2008
Consolidated Statements of Cash Flows for the years ended December 31, 2010, 2009, and 2008
Notes to the Consolidated Financial Statements
| (b) | Exhibits |
| 3.1. | Certificate of Incorporation of Auburn National Bancorporation, Inc. (incorporated by reference from Registrant’s Form 10-Q dated June 20, 2002 (File No. 000-26486)). | |
| 3.2. | Amended and Restated Bylaws of Auburn National Bancorporation, Inc., adopted as of November 13, 2007 (incorporated by reference from Registrant’s Form 10-K dated March 31, 2008 (File No. 000-26486)). | |
| 4.1 | Junior Subordinated Indenture, dated as of November 4, 2003, between Auburn National Bancorporation, Inc. and Wilmington Trust Company, as trustee (incorporated by reference from Registrant’s Form 10-Q dated November 14, 2003 (File No. 000-26486)). | |
| 4.2 | Amended and Restated Trust Agreement, dated as of November 4, 2003, among Auburn National Bancorporation, Inc., as Depositor, Wilmington Trust Company, as Property Trustee, Wilmington Trust Company, as Delaware Trustee and the Administrative Trustees named therein, as Administrative Trustees (incorporated by reference from Registrant's Form 10-Q dated November 14, 2003 (File No. 000-26486)). | |
| 4.3 | Guarantee Agreement dated as of November 4, 2003, between Auburn National Bancorporation, Inc., as Guarantor, and Wilmington Trust Company, as Guarantee Trustee (incorporated by reference from Registrant’s Form 10-Q dated November 14, 2003 (File No. 000-26486)). | |
| 10.2. | Lease and Equipment Purchase Agreement, dated September 15, 1987 (incorporated by reference from Registrant’s Registration Statement on Form SB-2 (File No. 33-86180)). | |
| 21.1 | Subsidiaries of Registrant | |
| 31.1 | Certification signed by the Chief Executive Officer pursuant to SEC Rule 13a-14(a). | |
| 31.2 | Certification signed by the Chief Financial Officer pursuant to SEC Rule 13a-14(a). | |
| 32.1 | Certification Pursuant to 18 U.S.C. Section 1350, As Adopted Pursuant To Section 906 of the Sarbanes-Oxley Act of 2002 by E.L. Spencer, Jr., President, Chief Executive Officer and Chairman of the Board. | |
| 32.2 | Certification Pursuant to 18 U.S.C. Section 1350, As Adopted Pursuant To Section 906 of the Sarbanes-Oxley Act of 2002 by David A. Hedges, VP, Controller and Chief Financial Officer. | |
| (c) | Financial Statement Schedules |
All financial statement schedules required pursuant to this item were either included in the financial information set forth in (a) above or are inapplicable and therefore have been omitted.
100
Table of Contents
SIGNATURES
Pursuant to the requirements of Section 13 or 15(d) of the Securities Exchange Act of 1934, the registrant has duly caused this report to be signed on its behalf by the undersigned, thereunto duly authorized, in the City of Auburn, State of Alabama, on the 29th day of March, 2011.
| AUBURN NATIONAL BANCORPORATION, INC. | ||
| (Registrant) | ||
| By: | /S/ E. L. SPENCER, JR. | |
| E. L. Spencer, Jr. President | ||
Pursuant to the requirements of the Securities Exchange Act of 1934, this report has been signed below by the following persons on behalf of the registrant and in the capacities and on the dates indicated.
| Signature |
Title |
Date | ||
| /S/ E. L. SPENCER, JR. E. L. Spencer, Jr. |
President, CEO and Chairman of the Board (Principal Executive Officer) |
March 29, 2011 | ||
| /S/ DAVID A. HEDGES David A. Hedges |
VP, Controller and Chief Financial Officer (Principal Financial and Accounting Officer) |
March 29, 2011 | ||
| /S/ C. WAYNE ALDERMAN C. Wayne Alderman |
Director | March 29, 2011 | ||
| /S/ TERRY W. ANDRUS Terry W. Andrus |
Director | March 29, 2011 | ||
| /S/ J. TUTT BARRETT J. Tutt Barrett |
Director | March 29, 2011 | ||
| /S/ ROBERT W. DUMAS Robert W. Dumas |
Director | March 29, 2011 | ||
| /S/ J. E. EVANS J. E. Evans |
Director | March 29, 2011 | ||
| /S/ WILLIAM F. HAM, JR. William F. Ham, Jr. |
Director | March 29, 2011 | ||
| /S/ DAVID E. HOUSEL David E. Housel |
Director | March 29, 2011 | ||
| /S/ ANNE M. MAY Anne M. May |
Director | March 29, 2011 | ||
| /S/ EDWARD LEE SPENCER, III Edward Lee Spencer, III |
Director | March 29, 2011 | ||
| /S/ EMIL F. WRIGHT, JR. Emil F. Wright, Jr. |
Director | March 29, 2011 | ||
101