Attached files
| file | filename |
|---|---|
| 10-K - BODY OF FORM 10-K - UNION BANKSHARES INC | unb12311010k.htm |
| EX-32.2 - EXHIBIT 32.2 - UNION BANKSHARES INC | unb123110ex322.htm |
| EX-31.1 - EXHIBIT 31.1 - UNION BANKSHARES INC | unb123110ex311.htm |
| EX-31.2 - EXHIBIT 31.2 - UNION BANKSHARES INC | unb123110ex312.htm |
| EX-32.1 - EXHIBIT 32.1 - UNION BANKSHARES INC | unb123110ex321.htm |
Exhibit 13.1
 | ||||
SELECTED FINANCIAL DATA
At or For The Years Ended December 31 | |||||||||||||||
2010 | 2009 | 2008 | 2007 | 2006 | |||||||||||
Balance Sheet Data | |||||||||||||||
Total assets | $ | 454,085 | $ | 447,522 | $ | 440,104 | $ | 393,264 | $ | 381,193 | |||||
Investment securities | 24,280 | 24,649 | 27,834 | 33,822 | 23,683 | ||||||||||
Loans, net of unearned income | 382,071 | 358,167 | 353,310 | 318,194 | 317,452 | ||||||||||
Allowance for loan losses | (3,755 | ) | (3,493 | ) | (3,556 | ) | (3,378 | ) | (3,338 | ) | |||||
Deposits | 376,660 | 368,827 | 364,370 | 323,961 | 319,822 | ||||||||||
Borrowed funds | 28,986 | 30,993 | 27,416 | 20,328 | 14,596 | ||||||||||
Stockholders' equity (1) | 41,725 | 41,180 | 39,150 | 42,074 | 41,923 | ||||||||||
Income Statement Data | |||||||||||||||
Total interest income | $ | 22,907 | $ | 23,217 | $ | 24,721 | $ | 26,273 | $ | 25,197 | |||||
Total interest expense | (4,117 | ) | (5,294 | ) | (7,177 | ) | (8,228 | ) | (6,821 | ) | |||||
Net interest and dividend income | 18,790 | 17,923 | 17,544 | 18,045 | 18,376 | ||||||||||
Provision for loan losses | (520 | ) | (400 | ) | (335 | ) | (265 | ) | (180 | ) | |||||
Noninterest income | 5,934 | 5,521 | 4,329 | 4,249 | 4,058 | ||||||||||
Noninterest expenses | (16,915 | ) | (16,397 | ) | (15,412 | ) | (14,409 | ) | (13,814 | ) | |||||
Income before provision for income taxes | 7,289 | 6,647 | 6,126 | 7,620 | 8,440 | ||||||||||
Provision for income taxes | (1,702 | ) | (1,420 | ) | (1,020 | ) | (1,965 | ) | (2,185 | ) | |||||
Net income | $ | 5,587 | $ | 5,227 | $ | 5,106 | $ | 5,655 | $ | 6,255 | |||||
Per Common Share Data | |||||||||||||||
Net income (2) | $ | 1.25 | $ | 1.17 | $ | 1.14 | $ | 1.25 | $ | 1.38 | |||||
Cash dividends paid | 1.00 | 1.00 | 1.12 | 1.12 | 1.06 | ||||||||||
Book value (1) | 9.36 | 9.23 | 8.75 | 9.34 | 9.25 | ||||||||||
Weighted average number of shares outstanding | 4,458,193 | 4,466,760 | 4,488,888 | 4,521,380 | 4,539,641 | ||||||||||
Number of shares outstanding | 4,455,704 | 4,461,208 | 4,474,598 | 4,502,969 | 4,531,977 | ||||||||||
(1) | Stockholders' equity includes unrealized gains or losses, net of applicable income taxes, on investment securities classified as “available-for-sale” and the unfunded liability for pension benefits, net of taxes for the defined benefit pension plan. |
(2) | Computed using the weighted average number of shares outstanding for the period. |
LETTER TO SHAREHOLDERS
Dear Shareholder, | March 28, 2011 |
We are pleased to present our 2010 annual report which contains much information, not only about your Company's financial performance but also highlights other activities, services and products we offer or participate in. Although the past year continued to be a difficult one for some financial institutions, after reading our report we believe you will agree we had a strong year in a number of areas.
Of particular significance to 2010's results were lending related activities. Interest rates remained at historically low levels, contributing to the continued refinancing of residential mortgages. Over $71 million in residential loans were originated and $51 million were sold into the secondary mortgage market, with the vast majority servicing retained, generating $1 million in premium income.
It is the Bank's procedure to retain servicing on sold loans in so far as it is possible. Our portfolio of sold and serviced loans now exceeds $166 million, placing us in the top 5% of banks in our peer group. Service fees generated by these sold loans generated $549,000 in revenue during the year and will provide a continuing stream of fees in the years to come.
In mid 2010, Congress passed the Wall Street Reform and Consumer Protection Act (Dodd-Frank Act). This legislation makes sweeping changes in the banking industry, consumer protection, and implements price controls on certain banking fees. Although community banks are exempted from some of these new rules, you can be assured the costs of regulatory compliance will increase for all financial institutions while revenue sources are being reduced. We need to remain proactive with regulatory compliance as we believe, over time banks which manage regulatory risk well will have additional opportunities for growth in the future, while those who are unable to comply will find it more difficult to operate under the increased regulatory burden.
This past November we announced that David Silverman, Senior Vice President and Senior Loan Officer of Union Bank, had been selected the successor to Ken Gibbons. In accordance with the management succession plan adopted by the Board last July, Mr. Silverman was voted by the Board as President of both companies effective April 1, 2011, and CEO in May 2012. Mr. Gibbons will become Board Chair upon the retirement of current Board Chair, Richard C. Sargent, at the annual meeting of shareholders in May 2011, and will remain as CEO during the management transition year of May 2011 to May 2012. Mr. Silverman was elected a director of Union Bank on November 17, 2010, and it is also expected that Mr. Silverman will stand for election to the Company's Board of Directors at the 2011 annual meeting. The transition process has begun and we are all looking forward to the changes it will bring.
We were saddened in September when long-time Director Franklin G. Hovey II passed away unexpectedly. Franklin had been a Director of the Company or a subsidiary since 1981 and was Board Secretary. Frank's insight, humor and directness were of great value to the Company and his fellow Board members.
Earlier this month we announced the purchase of three branch offices in New Hampshire from Northway Bank, which we expect will add approximately $80 million in deposits and $33 million in performing loans. With the changes happening on the regulatory front, the economy making positive advances and our expansion in New Hampshire, we believe 2011 will be a year of solid growth. The continued support and dedication of our shareholders, customers and staff will ensure continued success.
Sincerely,
 |  | |
Richard C. Sargent | Kenneth D. Gibbons | |
Chairman | President & CEO |
Union Bankshares, Inc. 2010 Annual Report 1
SHAREHOLDER ASSISTANCE & INVESTOR INFORMATION
If you need assistance with a change in registration of certificates, combining your certificates into one, reporting
lost certificates, non-receipt or loss of dividend checks, assistance regarding direct deposit of dividends,
information about the Company, or to receive copies of financial reports, please contact either:
JoAnn A. Tallman, Assistant Secretary | Registrar & Transfer Company | |
Union Bankshares, Inc. | Attn: Stock Transfer Department | |
P.O. Box 667 | 10 Commerce Drive | |
Morrisville, VT 05661-0667 | Cranford, NJ 07016 | |
Phone: 802-888-6600 | Phone: 1-800-368-5948 | |
Fax: 802-888-4921 | Fax: 1-908-497-2318 | |
Email: ubexec@unionbankvt.com | E-mail: info@rtco.com |
NASDAQ Stock Market Ticker Symbol: UNB
Corporate Name: Union Bankshares, Inc.
To view additional information about the Company or to receive alerts when public filings are posted, please view the Investor Relations page at www.unionbankvt.com.
Union Bankshares, Inc., operates as a one bank holding company for Union Bank, which provides commercial, municipal, trust and retail banking services in northern Vermont and northwestern New Hampshire. As of December 31, 2010, the company operated 13 community banking locations in Lamoille, Caledonia and Franklin counties of Vermont; one in the town of Littleton, (Grafton County), New Hampshire; and one loan center in South Burlington, (Chittenden County), Vermont; as well as 30 ATMs throughout northern Vermont and northwestern New Hampshire. Union Bank was founded in 1891 in Morrisville, Vermont, where the Bank’s and its holding company’s headquarters are located.
Union Bank promotes personal service and banking expertise within the communities it serves, with a focus on small- to middle-market businesses, local municipalities, non-profits, retail and trust customers. To leverage its local expertise, Union Bank continues to enhance its niche capabilities and focuses on expanding to additional neighboring communities.
Union Bankshares, through Union Bank, is committed to the communities it serves, and encourages employee participation in community events and charitable services. The Company views small businesses as foundations for thriving local economies; these businesses provide jobs, attract other businesses and create wealth.
Currently, Union Bank employs 160 people, many of whom are leaders in community organizations throughout the Bank’s service area.
• Union Bankshares’ growing asset base of over $454 million provides the financial strength to successfully serve its constituents
• The Company reported a Return on Average Equity of 12.33% or greater and a Return on Average Assets of 1.21% or greater for each of the last five years
• Union Bank has scored an "Outstanding" rating on ALL its CRA (Community Reinvestment Act) examinations since 1995
• Union Bank has been an SBA "Preferred Lender" since 1987
Union Bankshares, Inc. 2010 Annual Report 2
DIRECTORS

Union Bankshares, Inc. 2010 Annual Report 3
TAKING STOCK OF MILESTONES
Union Bankshares, Inc. (UNB), the holding Company for Union Bank, continues to grow in strength despite the economic conditions that are hampering the Nation. The rallying cry to “buy local” is resonating with consumers and a positive effect on businesses in small towns, including Union Bank. People are responding to the concept of putting their money to work for the local economy not only with their purchasing power but with their deposits as well. Turning these deposits around and using them to invest in our communities is a hallmark of our success.
Our dividend history, peer group standings, CRA ratings and infrastructure enhancements combine to form our solid foundation of strength. It is important to pause for a moment and take stock of these milestones.
Shareholder Value
Growing financial return for our shareholders over time is an important part of our mission. Total dividends paid per share for each of 2010 and 2009 was $1.00.
Our goal is to make prudent improvements to our infrastructure and systems that add efficiencies and increase our profitability. You will read further on about the addition of a Loan Center in South Burlington, Vermont; a name-change for the Trust Department and about the new web portal. We believe investing in changes like these will benefit our bottom line and continue to strengthen the performance of our stock.
We continue to provide above-average long-term returns while keeping current returns strong. Even though our financial performance has been good by most standards, we are not satisfied with the status quo. As we move forward, we will persistently look for areas in which we can grow, improve and become more efficient.
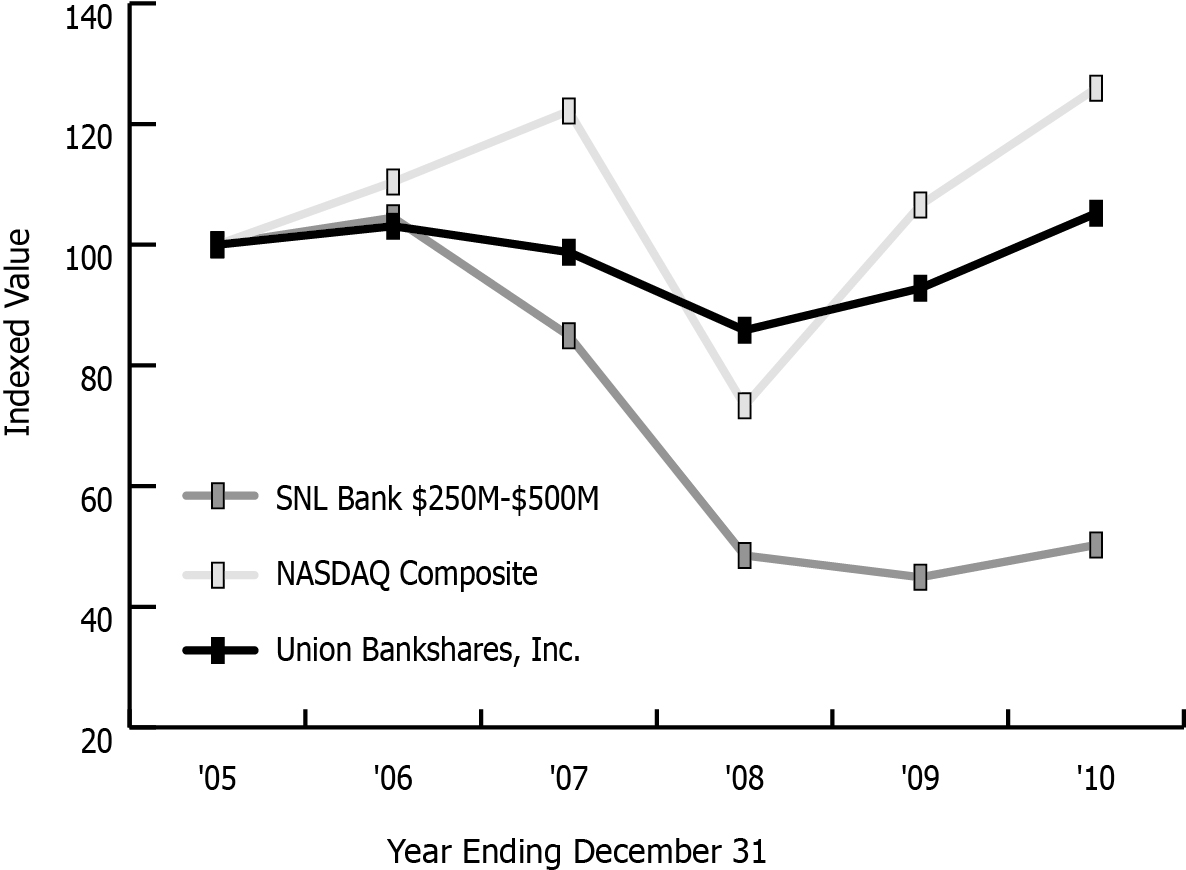
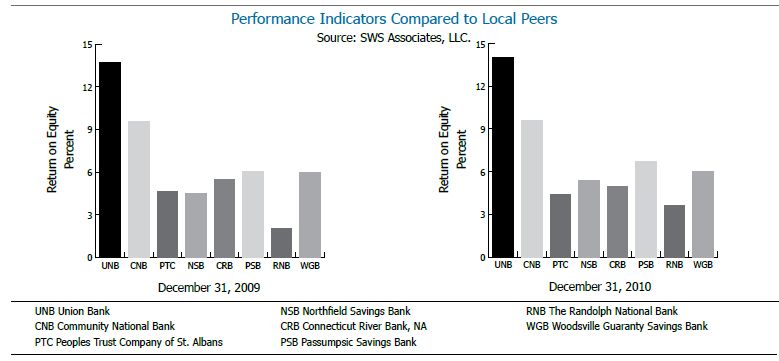
Peer Group Performance
Union Bank has consistently performed ahead of our peer group. The 2010 numbers again bear out our enviable position of financially outperforming our peers. See charts below.
The last few years have been difficult ones for the financial services industry. We believe that our strategy of holding firm to our core values while at the same time embracing technology has proven that a community bank can thrive and prosper even through difficult economic times.
Total Return Performance Source: SNL Financial LC
Union Bankshares, Inc. 2010 Annual Report 4
Expansion into Chittenden County
With the opening of our South Burlington Loan Center in September, the Bank has entered the largest marketplace in Vermont: Chittenden County. The new Loan Center currently specializes in residential lending and offers a variety of personal lending options, including both fixed and adjustable rate mortgages; portfolio, construction, renovation or addition loans; energy efficiency loans; and loans for land purchases.
Union Bank's history is built upon traditional values, and we continue to maintain those values in our approach to community and customer service at the Loan Center. We believe the Loan Center's Team-with its overall experience, knowledge and leadership-will provide a reliable resource for residential lending in Chittenden County.
Edward L. Levite is the Loan Center Manager and Senior Loan Originator. Ed's primary responsibilities are to originate residential loans, manage day-to-day office activities and establish Union Bank as the preferred residential mortgage lender in Chittenden County. Ed comes to Union with extensive lending experience, most recently as vice president of a multi-location residential mortgage operation. He also brings extensive loan office management experience and a strong history of building relationships with referral sources and vendors.
The Center has three Senior Mortgage Loan Originators: Brenda Farrell, Stephen M. Laquerre and our most recent addition, Sue Ryan. These three are primarily responsible for working with borrowers as they apply for residential and up-to-four-family home loans, from taking in a loan application through the disbursal of funds.
Completing the team is Jessica Eastman, Senior Mortgage Specialist/Underwriter. Jessica provides support to the loan originators, underwrites and closes mortgage loans. She has worked as a senior mortgage specialist, underwriter, direct endorsement underwriter, processor and loan closer for the past eight years in the Chittenden County area.
The Loan Center staff brings a wealth of experience in both Federal Housing Administration (FHA) and Veterans Administration (VA) lending. Union Bank has been approved to offer these loans across our entire footprint. We are currently working with our loan officers and loan assistants providing the necessary training for taking in and underwriting these loans. Soon we will offer all our customers the greater flexibility in refinancing and purchasing that the FHA loans bring. We are proud to bring eligible veterans throughout northern Vermont and New Hampshire very favorable financing terms with the addition of the VA loans.
Having these loans in our product line is one more way we are acting on our commitment to helping people in our communities buy homes.

Welcome to the Asset Management Group
Although the Trust Department is changing its name to Union Bank Asset Management Group to better reflect the array of services offered, it is still comprised of the same highly skilled staff members who are well versed in the legal and financial responsibilities associated with their fiduciary roles. Peter Eley, Managing Trust Officer, and Deb Partlow, Senior Trust Officer, work out of the Morrisville office, though any day could find them working with clients throughout northern Vermont and New Hampshire. Lura Jacques, Trust Officer, works out of our St. Albans office and takes care of clients in the surrounding neighborhoods. Local and accessible, our Asset Management advisors provide our communities with the best possible investment management and trust services.
The strength of these advisors is in the depth of the relationship they build with their clients. A relationship that is backed by their expertise and coupled with the confidence we have in our partner Granite Investment Advisors. Granite is an independent, employee owned investment advisory firm that manages our clients' equity and balanced investment portfolios. Founded in 1983, Granite Investment Advisors had 300+ clients and $527 million in assets under management on December 31, 2010.
The Asset Management Group's philosophy is to preserve, and ultimately grow, the purchasing power of assets under their management. The team provides prompt, personal service with professionalism by bringing quiet, rational discussions to bear. The portfolios are individually tailored with no employment of “common or proprietary funds.” The decision to purchase or sell individual securities is driven by the needs of the portfolio.
We will continue providing individualized services to our clients and making Asset Management available to people throughout northern Vermont and northwestern New Hampshire. We have purposefully kept our initial investment-level low in order to serve what we feel is a large and worthwhile demographic throughout our region, who are interested in protecting their wealth, an unbiased approach to investment selection, personal trusts, retirement strategies, estate services as well as commercial services.
Union Bankshares, Inc. 2010 Annual Report 5
CORE VALUES
A business' choice of core values and its resolve to live by those same values form its character and reputation. Core values are the underpinnings of our relationships-how we conduct business, how we interact with each other as a team, our customers and our shareholders. What the past few years have more than proven within the financial industry is that those values are the guidepost for professional judgments and choices, and variance causes serious repercussions.
At Union Bank we believe that our commitment to traditional values has saved us from much of the pain many larger financial institutions have felt and are still feeling. Though the mistakes of others have tarnished the industry's reputation, our values have served as a solid guide for decision-making and kept us strong. We want to take a moment to address what we see are our three core values-integrity, social responsibility and customer relationships-and how they have proven essential to our character and stability.
Integrity
Integrity is essential to a community bank; it is the basis for trust. Without it, it is difficult to imagine anyone entrusting us with one of their most precious resources-their money-be they customer or shareholder. Union Bank believes that our consistent and vigilant commitment to integrity has shaped and strengthened our reputation and continually earns us more business. We strive to practice integrity and excellence during every interaction with both current and future clients. That is the foundation of our reputation for honesty, fairness and expertise.
Integrity is essential to effectiveness internally as well. Union Bank associates are committed to practicing integrity throughout daily interactions and activities. Our average employee tenure (10 years) illustrates a work environment that only comes with trust. Integrity is integral to maintaining the responsible and committed leadership and effective management team we are fortunate to have. Integrity allows people to communicate fairly, learn from each other and form a highly functioning team bent for success.
Practicing integrity is how we earn the trust of our stakeholders and is essential to our long-term success. You can count on a person of integrity to do what they think is right. Everyone wants people of integrity on their team, and we want our customers and our shareholders to know that a commitment to honesty and integrity is basic to how Union Bank defines itself.
Social Responsibility
Corporate social responsibility isn't just one thing; it is comprised of a variety of actions and decisions that reflect a commitment to making a difference. A business that accepts responsibility is also perceived as being reliable, dependable and its employees are willing to be accountable for who they are and what they do. In short, they care and are recognized as an integral part of the community.
Healthy, thriving community economies and infrastructure are essential to our business and our own success. Union Bank believes that being a local bank means setting the bar for good corporate citizenship. The Bank as a business works in partnership with many community organizations by
Union Bank believes that being a local bank necessarily means commitment to being a good corporate citizen. The Bank as a business works in partnership with many community organizations annually.

Union Bankshares, Inc. 2010 Annual Report 6
contributing cash, services and in-kind goods. Our employees give countless hours of their expertise and time.
We also promote public interest by encouraging community growth and development. Our recognition as Outstanding for our Community Reinvestment for the past 15 years underscores this.
Reinvesting in Our Communities
The Community Reinvestment Act (CRA) of 1977 encourages banks to help meet their local communities' credit needs, and evaluates banks community development lending.
We are one of the few Vermont banks to have received an 'Outstanding' CRA rating for the past 15 years, and that is a testament to our Company's investment in the successes of the communities we serve.
Union Bank also works to support our environment. We encourage customers and staff to use "green" practices-such as Online Banking, E Statements and virtua!-which help us all use fewer natural resources in our homes and in our businesses. We also encourage and fund energy improvements with our lending program, Greenlend™.
Strong Customer Relationships
Since we started operations in 1891, our customers' financial needs have been and still are a top priority. Strong, loyal, customer relationships are the cornerstone of our success. Long-lasting relationships with satisfied customers mean return customers and referrals, and a growth-oriented future for the Bank.
Our strategy is simple: we offer quality products and excellent customer service. Our customers come to us because they have trust in us and they believe in our expertise. We work hard to keep our products in tune with the needs of our customers, listening to what they need. What better way is there to show the value that we place on our relationships?
We also know that our relationships are not limited to our customers' experiences within the branch. Our commitment to revisiting our website this year was made in recognition of the increased emphasis on electronic banking capabilities. For many customers today, trust starts with the first encounter, which is often online. Whether it is in the branch or on the website, we work to make every interaction with our customers as simple and clear as possible.
We believe our new website is a solid step forward to establishing our credibility as a tech-savvy bank that strives to be straight forward and easy to access. We endeavor to offer real value through information, products and services.
We are a bank that actually lends. At the end of 2010, our loan portfolio totaled $382 million, and we were servicing an additional $166 million in sold residential loans. We offer a full array of residential loans, including secondary market mortgages, FHA and VA loans.

Union Bankshares, Inc. 2010 Annual Report 7
SIGNIFICANT DECISIONS AFFECTING 2011 & BEYOND
Changes in Leadership
On November 3, 2010 both the Boards of the Company and the Bank unanimously selected David S. Silverman, Senior Vice President of the Bank and Vice President of the Company, as successor to President and Chief Executive Officer Kenneth D. Gibbons. The Bankshares Board also appointed Mr. Silverman as a director of the Bank as of November 17, 2010.
In accordance with the management succession plan adopted by the Board last July, Mr. Silverman will become President of both companies on April 1, 2011, and CEO in May 2012. Mr. Gibons will become Board Chair upon the retirement of the current Board Chair, Richard C. Sargent, at the annual meeting of shareholders May 18, 2011, and will remain as CEO during the management transition year of May 2011 to May 2012. Mr. Silverman will stand for election to the Company's Board of Directors at the 2011 annual meeting.
Mr. Silverman began employment with Union Bank in 1986, and over the years has progressed through various departments and positions to his current Bank positions of Senior Vice President (1994), Senior Commercial Lender (1999) and Senior Loan Officer (2008). He has also served as the Bank's Marketing Officer for many years. He has been Vice President of the Company since 2008.
Mr. Silverman moved with his family from Huntington, NY, to Essex, VT, in 1969, where he attended the Essex school system through high school graduation. Mr. Silverman holds a BA in Business Management from Johnson State College.
Mr. Silverman is very active within the community, currently serving as Board Chair of Copley Professional Services Group d/b/a Community Health Services of Lamoille Valley, a non-profit primary health care organization. He has also held the positions of Treasurer and Executive Committee Member of the Stowe Area Association, Member of the Morristown/ Morrisville Development Review Board, Commissioner of the Town of Hardwick Electric Department and served on the Board of Directors of Lamoille County Mental Health. He has also volunteered as an Umpire for the Little League and Babe Ruth Baseball in Lamoille County for several years.
Both the Boards and Senior Management are confident that Mr. Silverman's strong leadership qualities, skills and insights will help to ensure continuity and a smooth transaction.
Website Improvements
In today's world of finance, a bank's website functions as an electronic branch for customers and shareholders. Not only does it serve to introduce a bank to new customers, it is a critical interaction point for current customers and a location for conducting banking business. We are pleased to have recently launched our much improved Union Bank website.
Especially noteworthy is the introduction of Investors Relations pages. Here you will find corporate and stock information, SEC filings, financials, corporate news and market data, and other relevant financial information. We encourage you to visit the site at www.unionbankvt.com.
The web makes execution of banking tasks and access to our services easier for customers. Growing ever more dependent of electronic banking, our customers visited the Online Banking area of the site 15,500 times in the first week of launch. This way of conducting secure transactions brings a tremendous amount of efficiency to the Bank.
The new site is a better reflection of the Union Bank way of doing business. Simple, clear navigation complements essential information, creating a useful and practical banking tool.

Union Bankshares, Inc. 2010 Annual Report 8
INDEPENDENT REGISTERED PUBLIC ACCOUNTING FIRM REPORT

REPORT OF INDEPENDENT REGISTERED PUBLIC ACCOUNTING FIRM
The Board of Directors and Shareholders
Union Bankshares, Inc. and Subsidiary
We have audited the accompanying consolidated balance sheets of Union Bankshares, Inc. and Subsidiary (the Company) as of December 31, 2010 and 2009, and the related consolidated statements of income, changes in stockholders’ equity, and cash flows for the years then ended. These consolidated financial statements are the responsibility of the Company’s management. Our responsibility is to express an opinion on these consolidated financial statements based on our audits.
We conducted our audits in accordance with standards of the Public Company Accounting Oversight Board (United States). Those standards require that we plan and perform the audit to obtain reasonable assurance about whether the financial statements are free of material misstatement. The Company is not required to have, nor were we engaged to perform, an audit of its internal control over financial reporting. Our audits included consideration of internal control over financial reporting as a basis for designing audit procedures that are appropriate in the circumstances, but not for the purpose of expressing an opinion on the effectiveness of the Company’s internal control over financial reporting. Accordingly, we express no such opinion. An audit includes examining, on a test basis, evidence supporting the amounts and disclosures in the financial statements. An audit also includes assessing the accounting principles used and significant estimates made by management, as well as evaluating the overall financial statement presentation. We believe that our audits provide a reasonable basis for our opinion.
In our opinion, the consolidated financial statements referred to above present fairly, in all material respects, the consolidated financial position of Union Bankshares, Inc. and Subsidiary as of December 31, 2010 and 2009, and the consolidated results of their operations and their consolidated cash flows for the years then ended, in conformity with accounting principles generally accepted in the United States of America.

Portland, Maine
March 28, 2011
Vermont Registration No. 92-0000278
Union Bankshares, Inc. 2010 Annual Report 9
UNION BANKSHARES, INC. AND SUBSIDIARY
CONSOLIDATED BALANCE SHEETS
December 31, 2010 and 2009
2010 | 2009 | |||||
ASSETS | ||||||
Cash and due from banks | $5,447,386 | $ | 4,941,612 | |||
Federal funds sold and overnight deposits | 8,844,889 | 17,190,525 | ||||
Cash and cash equivalents | 14,292,275 | 22,132,137 | ||||
Interest bearing deposits in banks | 14,041,101 | 22,974,800 | ||||
Investment securities available-for-sale | 23,779,845 | 24,648,589 | ||||
Investment securities held-to-maturity (fair value was $502,205 at December 31, 2010) | 500,000 | — | ||||
Loans held for sale | 5,610,436 | 9,262,352 | ||||
Loans | 376,271,910 | 348,827,116 | ||||
Allowance for loan losses | (3,754,618 | ) | (3,492,783 | ) | ||
Net deferred loan costs | 188,305 | 77,508 | ||||
Net loans | 372,705,597 | 345,411,841 | ||||
Accrued interest receivable | 1,560,322 | 1,634,095 | ||||
Premises and equipment, net | 7,842,281 | 7,613,319 | ||||
Other assets | 13,753,554 | 13,844,963 | ||||
Total assets | $ | 454,085,411 | $ | 447,522,096 | ||
LIABILITIES AND STOCKHOLDERS' EQUITY | ||||||
LIABILITIES | ||||||
Deposits | ||||||
Noninterest bearing | $ | 64,526,154 | $ | 60,128,845 | ||
Interest bearing | 312,134,328 | 308,698,292 | ||||
Total deposits | 376,660,482 | 368,827,137 | ||||
Borrowed funds | 28,985,907 | 30,992,604 | ||||
Liability for defined benefit pension plan | 3,541,612 | 3,048,318 | ||||
Accrued interest and other liabilities | 3,172,736 | 3,474,427 | ||||
Total liabilities | 412,360,737 | 406,342,486 | ||||
COMMITMENTS AND CONTINGENCIES (Notes 8, 14, 15, 16, 17 and 20) | ||||||
STOCKHOLDERS' EQUITY | ||||||
Common stock, $2.00 par value; 7,500,000 shares authorized; 4,921,786 shares issued at December 31, 2010 and 2009 | 9,843,572 | 9,843,572 | ||||
Additional-paid-in capital | 244,363 | 219,331 | ||||
Retained earnings | 37,622,575 | 36,494,110 | ||||
Treasury stock at cost; 466,082 and 460,578 shares at December 31, 2010 and 2009, respectively | (3,822,838 | ) | (3,724,326 | ) | ||
Accumulated other comprehensive loss | (2,162,998 | ) | (1,653,077 | ) | ||
Total stockholders' equity | 41,724,674 | 41,179,610 | ||||
Total liabilities and stockholders' equity | $ | 454,085,411 | $ | 447,522,096 | ||
See accompanying notes to consolidated financial statements.
Union Bankshares, Inc. 2010 Annual Report 10
UNION BANKSHARES, INC. AND SUBSIDIARY
CONSOLIDATED STATEMENTS OF INCOME
Years Ended December 31, 2010 and 2009
2010 | 2009 | |||||
Interest income | ||||||
Interest and fees on loans | $ | 21,462,581 | $ | 21,558,734 | ||
Interest on debt securities: | ||||||
Taxable | 709,770 | 842,906 | ||||
Tax exempt | 297,975 | 302,560 | ||||
Dividends | 3,845 | 3,162 | ||||
Interest on federal funds sold and overnight deposits | 21,848 | 24,951 | ||||
Interest on interest bearing deposits in banks | 411,216 | 484,274 | ||||
Total interest income | 22,907,235 | 23,216,587 | ||||
Interest expense | ||||||
Interest on deposits | 2,977,065 | 4,117,568 | ||||
Interest on short-term borrowed funds | 17,814 | 693 | ||||
Interest on long-term debt | 1,122,367 | 1,175,949 | ||||
Total interest expense | 4,117,246 | 5,294,210 | ||||
Net interest income | 18,789,989 | 17,922,377 | ||||
Provision for loan losses | 520,000 | 400,000 | ||||
Net interest income after provision for loan losses | 18,269,989 | 17,522,377 | ||||
Noninterest income | ||||||
Trust income | 481,301 | 379,042 | ||||
Service fees | 4,027,893 | 3,600,094 | ||||
Net gains on sales of investment securities available-for-sale | 97,956 | 257,546 | ||||
Net gains on sales of loans held for sale | 1,029,720 | 969,541 | ||||
Other income | 297,380 | 315,084 | ||||
Total noninterest income | 5,934,250 | 5,521,307 | ||||
Noninterest expenses | ||||||
Salaries and wages | 6,558,759 | 6,097,064 | ||||
Pension and other employee benefits | 2,828,401 | 2,923,803 | ||||
Occupancy expense, net | 937,040 | 956,966 | ||||
Equipment expense | 1,056,687 | 1,109,626 | ||||
ATM and debit card expense | 446,689 | 251,569 | ||||
Vermont franchise tax | 414,263 | 396,549 | ||||
FDIC insurance assessment | 498,612 | 684,085 | ||||
Expenses of other real estate owned, net | 241,481 | 280,954 | ||||
Fees paid to sell loans in secondary market | 293,654 | 272,467 | ||||
Equity in losses of limited partnerships | 425,970 | 425,970 | ||||
Other expenses | 3,213,189 | 2,998,120 | ||||
Total noninterest expenses | 16,914,745 | 16,397,173 | ||||
Income before provision for income taxes | 7,289,494 | 6,646,511 | ||||
Provision for income taxes | 1,702,707 | 1,419,943 | ||||
Net income | $ | 5,586,787 | $ | 5,226,568 | ||
Earnings per common share | $ | 1.25 | $ | 1.17 | ||
Dividends per common share | $ | 1.00 | $ | 1.00 | ||
See accompanying notes to consolidated financial statements.
Union Bankshares, Inc. 2010 Annual Report 11
UNION BANKSHARES, INC. AND SUBSIDIARY
CONSOLIDATED STATEMENTS OF CHANGES IN STOCKHOLDERS' EQUITY
Years Ended December 31, 2010 and 2009
Common Stock | |||||||||||||||||||||
Shares, net of treasury | Amount | Additional paid-in capital | Retained earnings | Treasury stock | Accumulated other comprehensive loss | Total stockholders' equity | |||||||||||||||
Balances, December 31, 2008 | 4,474,598 | $ | 9,843,572 | $ | 207,683 | $ | 35,868,916 | $ | (3,500,504 | ) | $ | (3,269,584 | ) | $ | 39,150,083 | ||||||
Comprehensive income: | |||||||||||||||||||||
Net income | — | — | — | 5,226,568 | — | — | 5,226,568 | ||||||||||||||
Other comprehensive income, net of tax: | |||||||||||||||||||||
Change in net unrealized loss on investment securities available-for-sale, net of reclassification adjustment and tax effects | — | — | — | — | — | 447,285 | 447,285 | ||||||||||||||
Change in net unrealized loss on unfunded defined benefit pension plan liability, net of reclassification adjustment and tax effects | — | — | — | — | — | 1,169,222 | 1,169,222 | ||||||||||||||
Total other comprehensive income | 1,616,507 | ||||||||||||||||||||
Total comprehensive income | 6,843,075 | ||||||||||||||||||||
Cash dividends declared | — | — | — | (4,601,374 | ) | — | — | (4,601,374 | ) | ||||||||||||
Stock based compensation expense | — | — | 11,648 | — | — | — | 11,648 | ||||||||||||||
Purchase of treasury stock | (13,390 | ) | — | — | — | (223,822 | ) | — | (223,822 | ) | |||||||||||
Balances, December 31, 2009 | 4,461,208 | 9,843,572 | 219,331 | 36,494,110 | (3,724,326 | ) | (1,653,077 | ) | 41,179,610 | ||||||||||||
Comprehensive income: | |||||||||||||||||||||
Net income | — | — | — | 5,586,787 | — | — | 5,586,787 | ||||||||||||||
Other comprehensive loss, net of tax: | |||||||||||||||||||||
Change in net unrealized gain on investment securities available-for-sale, net of reclassification adjustment and tax effects | — | — | — | — | — | (184,345 | ) | (184,345 | ) | ||||||||||||
Change in net unrealized loss on unfunded defined benefit pension plan liability, net of reclassification adjustment and tax effects | — | — | — | — | — | (325,576 | ) | (325,576 | ) | ||||||||||||
Total other comprehensive loss | (509,921 | ) | |||||||||||||||||||
Total comprehensive income | 5,076,866 | ||||||||||||||||||||
Cash dividends declared | — | — | — | (4,458,322 | ) | — | — | (4,458,322 | ) | ||||||||||||
Stock based compensation expense | — | — | 25,032 | — | — | — | 25,032 | ||||||||||||||
Purchase of treasury stock | (5,504 | ) | — | — | — | (98,512 | ) | — | (98,512 | ) | |||||||||||
Balances, December 31, 2010 | 4,455,704 | $ | 9,843,572 | $ | 244,363 | $ | 37,622,575 | $ | (3,822,838 | ) | $ | (2,162,998 | ) | $ | 41,724,674 | ||||||
See accompanying notes to consolidated financial statements.
Union Bankshares, Inc. 2010 Annual Report 12
UNION BANKSHARES, INC. AND SUBSIDIARY
CONSOLIDATED STATEMENTS OF CASH FLOWS
j
Years Ended December 31, 2010 and 2009
2010 | 2009 | |||||
CASH FLOWS FROM OPERATING ACTIVITIES | ||||||
Net income | $ | 5,586,787 | $ | 5,226,568 | ||
Adjustments to reconcile net income to net cash provided by (used in) operating activities: | ||||||
Depreciation | 660,381 | 713,659 | ||||
Provision for loan losses | 520,000 | 400,000 | ||||
Deferred income tax benefit | (95,737 | ) | (11,415 | ) | ||
Net amortization of investment securities | 25,144 | 6,359 | ||||
Net gains on sales of investment securities available-for-sale | (97,956 | ) | (257,546 | ) | ||
Equity in losses of limited partnerships | 425,970 | 425,970 | ||||
Stock based compensation expense | 25,032 | 11,648 | ||||
Net gains on sales of loans held for sale | (1,029,720 | ) | (969,541 | ) | ||
Net losses on disposals of premises and equipment | 6,347 | 31,041 | ||||
Net (gains) losses on sales of other real estate owned | (37,760 | ) | 9,928 | |||
Write-down of impaired assets | 8,652 | 93,075 | ||||
Net increase in unearned loan costs | (110,797 | ) | (183,983 | ) | ||
Proceeds from sales of loans held for sale | 53,692,584 | 61,400,565 | ||||
Origination of loans held for sale | (49,010,948 | ) | (66,514,974 | ) | ||
Decrease in accrued interest receivable | 73,773 | 304,468 | ||||
Amortization (prepayment) of FDIC insurance assessment | 447,684 | (1,803,863 | ) | |||
Decrease (increase) in other assets | 289,896 | (1,063,133 | ) | |||
Contribution to defined benefit pension plan | (1,250,000 | ) | (2,106,963 | ) | ||
Increase in other liabilities | 1,127,726 | 1,427,306 | ||||
Net cash provided by (used in) operating activities | 11,257,058 | (2,860,831 | ) | |||
CASH FLOWS FROM INVESTING ACTIVITIES | ||||||
Interest bearing deposits in banks | ||||||
Proceeds from maturities and redemptions | 18,543,000 | 17,170,000 | ||||
Purchases | (9,609,301 | ) | (25,355,627 | ) | ||
Investment securities available-for-sale | ||||||
Proceeds from sales | 1,097,654 | 4,499,013 | ||||
Proceeds from maturities, calls and paydowns | 11,744,969 | 6,091,699 | ||||
Purchases | (12,180,377 | ) | (6,476,025 | ) | ||
Investment securities held-to-maturity | ||||||
Proceeds from maturities, calls and paydowns | 1,500,000 | — | ||||
Purchases | (2,000,000 | ) | — | |||
Net (increase) decrease in loans | (28,894,859 | ) | 305,889 | |||
Recoveries of loans charged off | 57,484 | 59,873 | ||||
Investments in limited partnerships | (179,420 | ) | (193,620 | ) | ||
Purchase of premises and equipment | (895,690 | ) | (897,326 | ) | ||
Proceeds from sales of other real estate owned | 421,876 | 228,848 | ||||
Proceeds from sales of repossessed property | 27,930 | 21,981 | ||||
Net cash used in investing activities | (20,366,734 | ) | (4,545,295 | ) | ||
CASH FLOWS FROM FINANCING ACTIVITIES | ||||||
Advances of long-term debt | 2,977,500 | — | ||||
Repayment of long-term debt | (1,544,197 | ) | (1,863,658 | ) | ||
Net (decrease) increase in short-term borrowings outstanding | (3,440,000 | ) | 5,440,000 | |||
Net increase (decrease) in noninterest bearing deposits | 4,397,309 | (1,185,814 | ) | |||
Net increase in interest bearing deposits | 3,436,036 | 5,643,223 | ||||
Purchase of treasury stock | (98,512 | ) | (223,822 | ) | ||
Dividends paid | (4,458,322 | ) | (4,601,374 | ) | ||
Net cash provided by financing activities | 1,269,814 | 3,208,555 | ||||
Net decrease in cash and cash equivalents | (7,839,862 | ) | (4,197,571 | ) | ||
CASH AND CASH EQUIVALENTS: | ||||||
Beginning of year | 22,132,137 | 26,329,708 | ||||
End of year | $ | 14,292,275 | $ | 22,132,137 | ||
SUPPLEMENTAL DISCLOSURES OF CASH FLOW INFORMATION | ||||||
Interest paid | $ | 4,284,578 | $ | 5,526,446 | ||
Income taxes paid | $ | 1,605,000 | $ | 1,245,000 | ||
SUPPLEMENTAL SCHEDULE OF NONCASH INVESTING AND FINANCING ACTIVITIES | ||||||
Other real estate acquired in settlement of loans | $ | 1,483,931 | $ | 1,093,229 | ||
Other assets acquired in settlement of loans | $ | 26,335 | $ | 21,500 | ||
Loans originated to finance the sale of other real estate owned | $ | 375,850 | $ | 533,157 | ||
See accompanying notes to consolidated financial statements.
Union Bankshares, Inc. 2010 Annual Report 13
UNION BANKSHARES, INC. AND SUBSIDIARY
NOTES TO CONSOLIDATED FINANCIAL STATEMENTS
Note 1. Significant Accounting Policies
Basis of financial statement presentation
The accounting and reporting policies of Union Bankshares, Inc. and Subsidiary (the “Company”) are in conformity with U. S. generally accepted accounting principles (“GAAP”) and general practices within the banking industry. The following is a description of the more significant policies.
The consolidated financial statements include the accounts of Union Bankshares, Inc., and its wholly owned subsidiary, Union Bank (“Union”) headquartered in Morrisville, Vermont. All significant intercompany transactions and balances have been eliminated. The Company utilizes the accrual method of accounting for financial reporting purposes.
The Company meets the qualification requirements under Securities and Exchange Commission (“SEC”) rules for smaller reporting companies and, pursuant to such rules, has elected to present audited statements of income, cash flows and changes in stockholders' equity for each of the most recent two fiscal years.
Certain amounts in the 2009 financial statements have been reclassified to conform to the current year presentation.
Nature of operations
The Company provides a variety of financial services to individuals, municipalities, commercial and nonprofit customers through its branches, ATMs, telebanking and internet banking systems in northern Vermont and northwestern New Hampshire. This market area encompasses primarily retail consumers, small businesses, municipalities, agricultural producers and the tourism industry. The Company's primary deposit products are checking, savings, money market accounts, certificates of deposit and individual retirement accounts and its primary lending products are commercial, real estate, municipal and consumer loans.
Concentration of risk
The Company's operations are affected by various risk factors, including interest rate risk, credit risk, and risk from geographic concentration of its deposit taking and lending activities. Management attempts to manage interest rate risk through various asset/liability management techniques designed to match maturities/repricing of assets and liabilities. Loan policies and administration are designed to provide assurance that loans will only be granted to creditworthy borrowers, although credit losses are expected to occur because of subjective factors and factors beyond the control of the Company. Although national economic conditions have been volatile during the last twenty seven months, local economic conditions have been somewhat more stable. The Company has a diversified loan portfolio with a substantial portion of the Company's loans secured by real estate and/or partially guaranteed by a U. S. Government agency. Most of its lending activities are conducted within the northern Vermont and northwestern New Hampshire market area where it is located. As a result, the Company and its borrowers may be especially vulnerable to the consequences of changes in the local economy and real estate market conditions. Notes 5 and 6 discuss the types of lending in which the Company engages.
Use of estimates
The preparation of consolidated financial statements in conformity with GAAP requires management to make estimates and assumptions that affect the reported amounts of assets and liabilities and disclosures of contingent assets and liabilities at the date of the consolidated financial statements and the reported amounts of revenues and expenses during the reporting period. Actual results could materially differ from those estimates. Material estimates that are particularly susceptible to significant change in the near term and involve inherent uncertainties relate to the determination of the allowance for losses on loans, the valuation of real estate acquired in connection with foreclosures or in satisfaction of loans, deferred tax assets, judgments regarding valuation and impairment of investment securities and other assets and pension plan accounting. These estimates involve a significant degree of complexity and subjectivity and the amount of the change that is reasonably possible, should any of these estimates prove inaccurate, cannot be estimated.
Union Bankshares, Inc. 2010 Annual Report 14
Presentation of cash flows
For purposes of presentation in the consolidated statements of cash flows, Cash and cash equivalents includes cash on hand, amounts due from banks (including cash items in process of clearing), Federal funds sold (generally purchased and sold for one day periods) and overnight deposits.
Trust operations
Assets held by the Trust & Asset Management Division of Union in a fiduciary or agency capacity, other than trust cash on deposit with Union, are not included in these consolidated financial statements because they are not assets of Union or the Company.
Fair value measurements
The Company utilizes the Financial Accounting Standards Board (“FASB”) Accounting Standards Codification (“ASC”) Topic 820, Fair Value Measurements and Disclosures, as guidance for accounting for assets and liabilities carried at fair value. This standard defines fair value as the price that would be received, without adjustment for transaction costs, to sell an asset or paid to transfer a liability in an orderly transaction between market participants at the measurement date. Fair value is a market based measurement that should be determined based on assumptions that market participants would use in pricing an asset or liability. The guidance in FASB ASC Topic 820 establishes a three-level fair value hierarchy, which prioritizes the inputs used in measuring fair value. A financial instrument's level within the fair value hierarchy is based on the lowest level of input that is significant to the fair value measurement.
The three levels of the fair value hierarchy are:
• | Level 1 - Unadjusted quoted prices in active markets that are accessible at the measurement date for identical, unrestricted assets or liabilities; |
• | Level 2 - Quoted prices for similar assets or liabilities in active markets, quoted prices in markets that are not active, or inputs that are observable, either directly or indirectly, for substantially the full term of the asset or liability; |
• | Level 3 - Prices or valuation techniques that require inputs that are both significant to the fair value measurement and unobservable (i.e., supported by little or no market activity). |
Investment securities
Investment securities purchased and held primarily for resale in the near future are classified as trading securities and are reported at fair value with unrealized gains and losses included in earnings. Debt securities the Company has the positive intent and ability to hold to maturity are classified as held-to-maturity and reported at amortized cost. Debt and equity securities not classified as either held-to-maturity or trading are classified as available-for-sale. Investments classified as available-for-sale are reported at fair value.
Accretion of discounts and amortization of premiums arising at acquisition on investment securities are included in income using the effective interest method over the life of the securities to maturity or call date. Unrealized gains and losses on investment securities available-for-sale are excluded from earnings and reported in Accumulated other comprehensive income (loss), net of tax and reclassification adjustment, as a separate component of stockholders' equity. The specific identification method is used to determine realized gains and losses on sales of available-for-sale or trading securities.
An unrealized loss is generally deemed to be other-than-temporary and a credit loss on a debt security is deemed to exist if the present value of the expected future cash flows is less than the amortized cost basis of the security. The credit loss component of an other-than-temporary write down is reflected in earnings as realized losses in other income. The remaining portion of the impairment loss is recognized in other comprehensive income, provided the Company does not intend to sell the underlying debt security and it is “more likely than not” that the Company will not have to sell the debt security prior to recovery.
Union Bankshares, Inc. 2010 Annual Report 15
Management considers the following factors in determining whether an other-than-temporary impairment exists and the period over which the debt security is expected to recover:
• | The length of time, and extent to which, the fair value has been less than the amortized cost; |
• | Adverse conditions specifically related to the security, issuer, industry, or geographic area; |
• | The historical and implied volatility of the fair value of the security; |
• | The payment structure of the debt security and the likelihood of the issuer being able to make payments that may increase in the future; |
• | Failure of the issuer of the security to make scheduled interest or principal payments; |
• | Any changes to the rating of the security by a rating agency; and |
• | Recoveries or additional declines in fair value subsequent to the balance sheet date. |
Loans held for sale
Loans originated and intended for sale in the secondary market are carried at the lower of cost or estimated fair value in the aggregate. Loans transferred from held for sale to portfolio are transferred at the lower of cost or fair value in the aggregate. Sales are normally made without recourse. Gains and losses on the disposition of loans held for sale are determined on the specific identification basis. Net unrealized losses are recognized through a valuation allowance by charges to income.
Loans
Loans receivable that management has the intent and ability to hold for the foreseeable future or until maturity or payoff are reported at their unpaid principal balances, adjusted for any charge-offs, the allowance for loan losses, and any deferred fees or costs on originated loans and unamortized premiums or discounts on purchased loans.
Loan interest income is accrued daily on outstanding balances. The accrual of interest is discontinued when a loan is specifically determined to be impaired and/or management believes, after considering collection efforts and other factors, that the borrowers' financial condition is such that collection of interest is doubtful. Normally, any unpaid interest previously accrued on those loans is reversed against interest income. A loan may be restored to accrual status when its financial status has significantly improved and there is no principal or interest past due. A loan may also be restored to accrual status if the borrower makes six consecutive monthly payments or the lump sum equivalent. Income on nonaccrual loans is generally not recognized unless a loan is placed back in accrual status or after all principal has been collected. Interest income generally is not recognized on impaired loans unless the likelihood of further loss is remote. Interest payments received on such loans are generally applied as a reduction of the loan principal balance. Delinquency status is determined based on contractual terms.
Loan origination, commitment fees and direct loan origination costs are deferred and amortized as an adjustment of the related loan's yield using methods that approximate the interest method. The Company generally amortizes these amounts over the contractual life of the related loans.
Allowance for loan losses
The allowance for loan losses is established for estimated losses in the loan portfolio through a provision for loan losses charged to earnings. Loan losses are charged against the allowance when management believes the loan balance is uncollectible or in accordance with federal guidelines. Subsequent recoveries, if any, are credited to the allowance.
The allowance for loan losses is maintained at a level believed by management to be appropriate to absorb probable credit losses inherent in the loan portfolio as of the balance sheet date. The amount of the allowance is based on management's periodic evaluation of the collectability of the loan portfolio, including the nature, volume and risk characteristics of the portfolio, credit concentrations, trends in historical loss experience, estimated value of any underlying collateral, specific impaired loans and economic conditions. While management uses available information to recognize losses on loans, future additions to the allowance for loan losses may be necessary based on changes in economic conditions or other relevant factors.
Union Bankshares, Inc. 2010 Annual Report 16
In addition, various regulatory agencies, as an integral part of their examination process, regularly review the Company's allowance for loan losses. Such agencies may require the Company to recognize additions to the allowance for loan losses based on their judgments about information available to them at the time of their examination, which may not be currently available to management.
The allowance consists of specific, general and unallocated components. The specific component relates to the loans that are classified as either monitor, substandard or special mention. For such loans, the level of allowance allocable to those loans is determined through estimating probable loss for each individual credit based on its specific risk attributes. Loans are also evaluated for impairment and may be classified as impaired when management believes it is probable that the Company will not collect all the contractual interest and principal payments as scheduled in the loan agreement. Impaired loans may also include troubled loans that are restructured. A troubled debt restructuring occurs when the Company, for economic or legal reasons related to the borrower's financial difficulties, grants a concession to the borrower that would otherwise not be granted. Troubled debt restructurings may include the transfer of assets to the Company in partial satisfaction of a troubled loan, a modification of a loan's terms, or a combination of the two. Large groups of smaller balance homogeneous loans are collectively evaluated for impairment. Accordingly, the Company does not separately identify individual consumer, residential or small balance commercial loans for
impairment evaluation, unless such loans are subject to a restructuring agreement or have been identified as impaired as part of a larger customer relationship. A specific reserve amount is allocated to the allowance for individual loans that have been classified as impaired on the basis of the fair value of the collateral for collateral dependent loans, an observable market price, or the present value of anticipated future cash flows. The general component represents the level of allowance allocable to each loan portfolio category with similar risk characteristics and is determined based on historical loss experience, adjusted for qualitative factors. Qualitative factors considered include underwriting, economic and market conditions, portfolio composition, collateral values, delinquencies, lender experience and legal issues. An unallocated component is maintained to cover uncertainties that could affect management's estimate of probable losses. The unallocated component of the allowance reflects the margin of imprecision inherent in the underlying assumptions used in the methodologies for estimating specific and general losses in the portfolio.
All evaluations are inherently subjective as they require estimates that are susceptible to significant revision as more information becomes available or as changes occur in economic conditions or other relevant factors.
Other real estate owned
Real estate properties acquired through or in lieu of loan foreclosure are to be sold and are initially recorded at the estimated fair value at the date of acquisition establishing a new carrying basis. Thereafter, valuations are periodically performed by management, and the real estate is carried in Other assets at the lower of carrying amount or fair value, less estimated cost to sell. Revenue and expenses from operations and changes in valuation are included in Expenses of other real estate owned, net.
Premises and equipment
Premises and equipment are stated at cost, less accumulated depreciation. Depreciation is computed principally by the straight line method over the estimated useful lives of the assets. The cost of assets sold or otherwise disposed of and the related accumulated depreciation are eliminated from the accounts and the resulting gains or losses are reflected in the statement of income. Maintenance and repairs are charged to current expense as incurred and the costs of major renewals and betterments are capitalized. Construction in progress is stated at cost, which includes the cost of construction and other direct costs attributable to the construction. No provision for depreciation is made on construction in progress until such time as the relevant assets are completed and put into use.
Federal Home Loan Bank stock
As a member of the Federal Home Loan Bank (“FHLB”) of Boston, Union is required to invest in Class B common stock of the FHLB of Boston. The Class B common stock has a five year notice requirement for redemption and there is no guarantee of future redemption. Also, there is the possibility of future capital calls by the FHLB of Boston on member
Union Bankshares, Inc. 2010 Annual Report 17
banks to ensure compliance with its capital plan. FHLB of Boston stock is reported in Other assets at its par value of $1,922,000 at December 31, 2010 and 2009. The stock is nonmarketable, and is redeemable by the FHLB of Boston at par value.
Company-owned life insurance
Company-owned life insurance (“COLI”) represents life insurance on the lives of certain current or former directors or employees who have provided positive consent allowing the Company to be the beneficiary of such policies. The Company utilizes COLI as tax-efficient funding for the benefit obligations to its employees and directors, including obligations under one of the Company's nonqualified deferred compensation plans. See Note 14. The Company is the primary beneficiary of the insurance policies. Increases in the cash value of the policies, as well as any gain on insurance proceeds received, are recorded in Other income, and are not currently subject to income taxes. COLI is recorded at the cash value of the policies, less any applicable cash surrender charges of which there are currently none. The COLI is reflected as an Other asset in the accompanying consolidated balance sheets. The Company reviews the financial strength of the insurance carriers prior to the purchase of COLI to ensure minimum credit ratings of at least investment grade. The financial strength of the carriers is reviewed annually and COLI with any individual carrier is limited by Company policy to 10% of capital plus reserves.
Servicing assets
Servicing assets are recognized as separate assets when rights are acquired through purchase or sale of loans with servicing rights retained. Capitalized servicing rights are reported in Other assets and are amortized against Noninterest income in proportion to, and over the period of, the estimated future net servicing income of the underlying loans. The value of capitalized servicing rights represents the present value of the future servicing fees arising from the right to service loans that have been previously sold. Servicing assets are evaluated regularly for impairment based upon the fair value of the rights as compared to amortized cost. Impairment is determined by stratifying rights by predominant characteristics, such as interest rates and terms. Fair value of a stratum is determined using prices for similar assets with similar characteristics, when available, or based upon discounted cash flows using market-based assumptions.
Impairment is recognized through a valuation allowance for an individual stratum, to the extent that estimated fair value is less than the capitalized amount for the stratum.
Investments carried at equity
The Company has purchased various limited partnership interests in low income housing partnerships. These partnerships were established to acquire, own and rent residential housing for elderly, low or moderate income residents in northeastern and central Vermont. The investments are accounted for under a method approximating the equity method of accounting. These equity investments, which are included in Other assets, are recorded at cost and adjusted for the Company's proportionate share of the partnerships' undistributed earnings or losses.
Pension plans
Union maintains a noncontributory defined benefit pension plan covering all eligible employees who meet certain service requirements. The costs of this plan, based on actuarial computations of current and estimated future benefits for employees, are charged to Pension and other employee benefits as a current operating expense.
Union also has a contributory 401(k) pension plan covering all employees who meet certain service requirements. The plan is voluntary, and Union, through the discretionary matching component of the plan, contributed fifty cents for every dollar contributed by participants, up to six percent of each participant's salary in 2010 and 2009.
Advertising costs
The Company expenses advertising costs as incurred and they were immaterial in 2010 and 2009.
Union Bankshares, Inc. 2010 Annual Report 18
Earnings per common share
Earnings per common share are computed based on the weighted average number of shares of common stock outstanding during the period, retroactively adjusted for stock splits and stock dividends and reduced for shares held in treasury. The weighted average shares outstanding were 4,458,193 and 4,466,760 for the years ended December 31, 2010 and 2009, respectively. There are 15,000 stock options outstanding at December 31, 2010 and 11,500 outstanding at December 31, 2009 excluded from the computation of diluted earnings per share since inclusion of these stock options would be anti-dilutive.
Income taxes
The Company prepares its Federal income tax return on a consolidated basis. Federal income taxes are allocated to members of the consolidated group based on taxable income. The Company recognizes income taxes under the asset and liability method. This involves estimating the Company's actual current tax exposure as well as assessing temporary differences resulting from differing treatment of items, such as timing of the deduction of expenses, for tax and GAAP purposes. These differences result in deferred tax assets and liabilities, which are included in the Company's consolidated balance sheets as Other assets. Deferred tax assets and liabilities are measured using enacted tax rates expected to apply to taxable income in the years in which those temporary differences are expected to be recovered or settled. The Company must also assess the likelihood that any deferred tax assets will be recovered from future taxable income and to the extent that recovery is not likely, a valuation allowance must be established. Significant management judgment is required in determining the provision for income taxes and deferred tax assets and liabilities. Low income housing tax credits are recognized as a reduction of the Provision for income taxes in the year they are earned.
Off-balance-sheet financial instruments
In the ordinary course of business, the Company is a party to off-balance-sheet financial instruments consisting of commitments to originate credit, unused lines of credit including commitments under credit card arrangements, commitments to purchase investment securities, commitments to invest in low income housing partnerships, commercial letters of credit, standby letters of credit and risk-sharing commitments on certain sold loans. Such financial instruments are recorded in the financial statements when they become fixed and certain.
Comprehensive income (loss)
Accounting principles generally require that recognized revenue, expenses, gains, and losses be included in net income. Although certain changes in assets and liabilities, such as the after tax effect of unrealized gains and losses on investment securities available-for-sale that are not other-than-temporarily impaired and the unfunded liability for the defined benefit pension plan, are not included in the statement of income, the cumulative effect of such items, net of tax effect, is reported as a separate component of the equity section of the balance sheet as Accumulated other comprehensive income (loss). Such items, along with net income, are components of comprehensive income.
Transfers of financial assets
Transfers of financial assets are accounted for as sales when control over the assets has been surrendered. Control over transferred assets is deemed to be surrendered when the assets have been isolated from the Company, the transferee obtains the right (free of conditions that constrain it from taking advantage of that right) to pledge or exchange the transferred assets, and the Company does not maintain effective control over the transferred assets through an agreement to repurchase them before their maturity.
Stock option plan
The Company recognizes stock-based compensation expense based on the grant date estimated fair value of stock-based awards over the vesting period of the awards.
Union Bankshares, Inc. 2010 Annual Report 19
Recent accounting pronouncements
In June 2009, FASB issued two related accounting pronouncements changing the accounting principles and disclosure requirements related to securitizations and special-purpose entities. Specifically, these pronouncements eliminate the concept of a "qualifying special-purpose entity", change the requirements for derecognizing financial assets and change how a company determines when an entity that is insufficiently capitalized or is not controlled through voting (or similar) rights should be consolidated. These pronouncements also expand existing disclosure requirements to include more information about transfers of financial assets, including securitization transactions, and where companies have continuing exposure to the risks related to transferred financial assets. These pronouncements were effective as of the beginning of each reporting entity's first annual reporting period that began after November 15, 2009, for interim periods within that first annual reporting period and for interim and annual reporting periods thereafter. The recognition and measurement provisions regarding transfers of financial assets shall be applied to transfers that occur on or after the effective date. These new pronouncements became effective for the Company on January 1, 2010. The adoption of these pronouncements did not have a material effect on the Company's consolidated financial statements.
In January 2010, the FASB issued an Accounting Standards Update (ASU), Fair Value Measurements and Disclosures: Improving Disclosures about Fair Value Measurements, to amend the disclosure requirements and clarify existing requirements related to recurring and nonrecurring fair value measurements and employers' disclosures about postretirement benefit plan assets. The guidance requires new disclosures regarding transfers of assets and liabilities between Level 1 (quoted prices in active market for identical assets or liabilities) and Level 2 (significant other observable inputs) of the fair value measurement hierarchy, including the reasons and the timing of the transfers. Additionally, the guidance requires a rollforward of activities, separately reporting purchases, sales, issuance, and settlements, for assets and liabilities measured using significant unobservable inputs (Level 3 fair value measurements). The new disclosure requirements apply to interim and annual reporting periods beginning after December 15, 2009, except for the new rules regarding purchases, sales, issuances and settlements associated with Level 3 measurements which are effective for fiscal years beginning after December 15, 2010, and for interim periods within those fiscal years. Other than requiring additional disclosures, adoption of this accounting standard did not have a material effect on the Company's consolidated financial statements. See Notes 14 and 18.
In February 2010, the FASB issued an ASU, Subsequent Events: Amendments to Certain Recognition and Disclosure Requirements, related to events that occur after the balance sheet date but before financial statements are issued. This guidance amends existing standards to address potential conflicts with SEC guidance and refines the scope of the reissuance disclosure requirements to include revised financial statements only. Under this guidance, SEC filers are no longer required to disclose to the date through which subsequent events have been evaluated. The adoption of this update did not have a material effect on the Company's consolidated financial statements. See Note 23.
In July 2010, the FASB issued an ASU, Receivables- Disclosures about the Credit Quality of Financing Receivables and the Allowance for Credit Losses, to provide additional information to assist financial statement users in assessing an entity's credit risk exposures and evaluating the adequacy of its allowance for credit losses. The disclosures are required on a disaggregated basis- portfolio segment and class of financing receivable. The new disclosures require an entity to provide credit quality indicators of financing receivables at the end of the reporting period by class, the aging of past due financing receivables at the end of the reporting period by class, the nature and extent of troubled debt restructurings that occurred during the period by class and their effect on the allowance for loan losses, the nature and extent of financing receivables modified as troubled debt restructurings within the previous twelve months that defaulted during the reporting period by class and their effect on the allowance for credit losses, and significant purchases and sales of financing receivables during the reporting period disaggregated by portfolio segment. The ASU also requires an entity to provide disclosures about its financing receivables on a disaggregated basis, including a roll forward schedule of allowance for credit losses for the reporting period on a portfolio segment basis, with the ending balance further disaggregated on the basis of the impairment method and the related recorded investment in financing receivables as well as the nonaccrual and impairment status of financing receivables by class. The new and amended disclosures for public entities as of the end of a reporting period were effective for interim and annual reporting periods ending on or after December 15, 2010. The disclosures about activity that occurs during a reporting period are effective for interim and annual reporting periods beginning on or after December 15, 2010. In January 2011, the FASB issued an ASU,
Union Bankshares, Inc. 2010 Annual Report 20
Deferral of the Effective Date of Disclosures about Troubled Debt Restructuring, for public-entity creditors to temporarily delay the effective date of the disclosures about troubled debt restructurings until the FASB completes its deliberations on what constitutes a troubled debt restructuring. The Company adopted the required portions of the accounting standard as of December 31, 2010 with no material impact on the Company's consolidated financial statements. See Notes 6 and 7 for additional disclosures required under this accounting standard.
Note 2. Restrictions on Cash and Due From Banks
The Company is required to maintain vault cash or noninterest bearing reserve balances with Federal Reserve Bank of Boston. Total reserve balances required at December 31, 2010 and 2009 were $360,000 and $307,000, respectively, which were both satisfied by vault cash.
The nature of the Company's business requires that it maintain amounts due from correspondent banks which, at times, may exceed federally insured limits. The balances in these accounts at December 31, were as follows:
2010 | 2009 | |||||
Noninterest bearing accounts | $ | 1,281,059 | $ | 826,625 | ||
Federal Reserve Bank of Boston | 9,677,784 | 18,039,925 | ||||
FHLB of Boston | 322,317 | 191,983 | ||||
No losses have been experienced in these accounts and the Company believes it is not exposed to any significant risk with respect to the accounts.
The Company was required to maintain contracted clearing balances of $1,000,000 at both December 31, 2010 and 2009, which are included in the Federal Reserve Bank of Boston balances above. Balances in excess of the contracted clearing amount at the Federal Reserve Bank of Boston and a portion of the funds at the FHLB of Boston are classified as overnight deposits as they earn interest.
Note 3. Interest Bearing Deposits in Banks
Interest bearing deposits in banks consist of certificates of deposit purchased from various financial institutions. Deposits at each institution are generally maintained at or below the Federal Deposit Insurance Corporation (“FDIC”) insurable limit of $250,000. Certificates are held with rates ranging from 0.40% to 5.50% and mature at various dates through 2015, with $6,543,000 scheduled to mature in 2011.
Union Bankshares, Inc. 2010 Annual Report 21
Note 4. Investment Securities
Investment securities as of the balance sheet dates consisted of the following:
December 31, 2010 | Amortized Cost | Gross Unrealized Gains | Gross Unrealized Losses | Fair Value | ||||||||
Available-for-sale | ||||||||||||
Debt securities: | ||||||||||||
U.S. Government-sponsored enterprises | $ | 4,521,083 | $ | 459 | $ | (62,906 | ) | $ | 4,458,636 | |||
Mortgage-backed | 4,734,511 | 87,201 | (10,983 | ) | 4,810,729 | |||||||
State and political subdivisions | 9,372,801 | 174,792 | (154,694 | ) | 9,392,899 | |||||||
Corporate | 4,737,273 | 274,495 | (39,682 | ) | 4,972,086 | |||||||
Total debt securities | 23,365,668 | 536,947 | (268,265 | ) | 23,634,350 | |||||||
Marketable equity securities | 49,718 | 1,385 | (5,723 | ) | 45,380 | |||||||
Mutual funds | 100,115 | — | — | 100,115 | ||||||||
Total | $ | 23,515,501 | $ | 538,332 | $ | (273,988 | ) | $ | 23,779,845 | |||
Held-to-maturity | ||||||||||||
U.S. Government-sponsored enterprises | $ | 500,000 | $ | 2,205 | $ | — | $ | 502,205 | ||||
December 31, 2009 | Amortized Cost | Gross Unrealized Gains | Gross Unrealized Losses | Fair Value | ||||||||
Available-for-sale | ||||||||||||
Debt securities: | ||||||||||||
U.S. Government-sponsored enterprises | $ | 4,498,813 | $ | 2,535 | $ | (47,570 | ) | $ | 4,453,778 | |||
Mortgage-backed | 4,750,024 | 112,023 | (2,346 | ) | 4,859,701 | |||||||
State and political subdivisions | 7,547,916 | 165,786 | (27,483 | ) | 7,686,219 | |||||||
Corporate | 7,176,437 | 349,200 | (2,500 | ) | 7,523,137 | |||||||
Total debt securities | 23,973,190 | 629,544 | (79,899 | ) | 24,522,835 | |||||||
Marketable equity securities | 49,717 | — | (5,991 | ) | 43,726 | |||||||
Mutual funds | 82,028 | — | — | 82,028 | ||||||||
Total | $ | 24,104,935 | $ | 629,544 | $ | (85,890 | ) | $ | 24,648,589 | |||
Investment securities with a carrying amount of $1,538,478 and $3,641,077 at December 31, 2010 and 2009, respectively, were pledged as collateral for public deposits and for other purposes as required or permitted by law.
Union Bankshares, Inc. 2010 Annual Report 22
Information pertaining to investment securities available-for-sale with gross unrealized losses as of the balance sheet date, aggregated by investment category and length of time that individual securities have been in a continuous loss position, follows:
Less Than 12 Months | Over 12 Months | Total | ||||||||||||||||
December 31, 2010 | Fair Value | Gross Unrealized Loss | Fair Value | Gross Unrealized Loss | Fair Value | Gross Unrealized Loss | ||||||||||||
Debt securities: | ||||||||||||||||||
U.S. Government-sponsored enterprises | $ | 3,937,094 | $ | (62,906 | ) | $ | — | $ | — | $ | 3,937,094 | $ | (62,906 | ) | ||||
Mortgage-backed | 862,248 | (10,983 | ) | — | — | 862,248 | (10,983 | ) | ||||||||||
State and political subdivisions | 4,313,584 | (154,694 | ) | — | — | 4,313,584 | (154,694 | ) | ||||||||||
Corporate | 201,748 | (39,682 | ) | — | — | 201,748 | (39,682 | ) | ||||||||||
Total debt securities | 9,314,674 | (268,265 | ) | — | — | 9,314,674 | (268,265 | ) | ||||||||||
Marketable equity securities | — | — | 8,300 | (5,723 | ) | 8,300 | (5,723 | ) | ||||||||||
Total | $ | 9,314,674 | $ | (268,265 | ) | $ | 8,300 | $ | (5,723 | ) | $ | 9,322,974 | $ | (273,988 | ) | |||
Less Than 12 Months | Over 12 Months | Total | ||||||||||||||||
December 31, 2009 | Fair Value | Gross Unrealized Loss | Fair Value | Gross Unrealized Loss | Fair Value | Gross Unrealized Loss | ||||||||||||
Debt securities: | ||||||||||||||||||
U.S. Government-sponsored enterprises | $ | 3,951,243 | $ | (47,570 | ) | $ | — | $ | — | $ | 3,951,243 | $ | (47,570 | ) | ||||
Mortgage-backed | 545,496 | (546 | ) | 160,442 | (1,800 | ) | 705,938 | (2,346 | ) | |||||||||
State and political subdivisions | 1,120,319 | (10,814 | ) | 276,199 | (16,669 | ) | 1,396,518 | (27,483 | ) | |||||||||
Corporate | 497,500 | (2,500 | ) | — | — | 497,500 | (2,500 | ) | ||||||||||
Total debt securities | 6,114,558 | (61,430 | ) | 436,641 | (18,469 | ) | 6,551,199 | (79,899 | ) | |||||||||
Marketable equity securities | 35,226 | (468 | ) | 8,500 | (5,523 | ) | 43,726 | (5,991 | ) | |||||||||
Total | $ | 6,149,784 | $ | (61,898 | ) | $ | 445,141 | $ | (23,992 | ) | $ | 6,594,925 | $ | (85,890 | ) | |||
The Company evaluates all investment securities on a quarterly basis, and more frequently when economic conditions warrant to determine if an other-than-temporary impairment exists. A debt security is considered impaired if the fair value is lower than its amortized cost basis at the report date. If impaired, management then assesses whether the unrealized loss is other-than-temporary. An unrealized loss on a debt security is generally deemed to be other-than temporary and a credit loss is deemed to exist if the present value of the expected future cash flows is less than the amortized cost basis of the debt security. The credit loss component of an other-than-temporary impairment write-down is recorded, net of tax effect, through net income as a component of net other-than-temporary impairment losses in the consolidated statement of income, while the remaining portion of the impairment loss is recognized in other comprehensive income (loss), provided the Company does not intend to sell the underlying debt security and it is “more likely than not” that the Company will not have to sell the debt security prior to recovery.
At December 31, 2010, twenty-five debt securities, consisting of one collateralized mortgage obligation issued by an U.S. Government agency, one U.S. Government sponsored enterprise mortgage-backed obligation, nine U.S. Government-sponsored enterprise bonds, one corporate bond and thirteen municipal bonds, as well as one marketable equity security, had unrealized losses totaling $273,988. This amounts to aggregate depreciation of 1.1% of the Company's amortized cost of the entire portfolio. Only the marketable equity security has been in an unrealized loss position for more than twelve months. The Company has the ability to hold this security for the foreseeable future. No declines were deemed by management to be other-than-temporary at December 31, 2010.
Union Bankshares, Inc. 2010 Annual Report 23
The Company's investment securities are exposed to various risks, such as interest rate, market and credit. The ongoing credit and liquidity crisis in the United States and globally continues to have far reaching implications for financial markets. Due to the level of risk associated with certain investment securities and the level of uncertainty related to changes in the value of investment securities, it is at least reasonably possible that changes in risks, further deterioration in credit quality and/or the continuation of the current imbalances in liquidity that exist in the financial marketplace would materially affect the amounts reported in the consolidated financial statements in future periods.
Proceeds from the sale of securities available-for-sale were $1,097,654 and $4,499,013 in 2010 and 2009, respectively. Gross realized gains from sales of investments available-for-sale were $97,956 and $257,824 and gross realized losses were $0 and $278 for the years 2010 and 2009, respectively.
The amortized cost and estimated fair value of debt securities available-for-sale by contractual scheduled maturity as of December 31, 2010 were as follows:
Amortized Cost | Fair Value | |||||
Available-for-sale | ||||||
Due in one year or less | $ | 1,252,040 | $ | 1,274,062 | ||
Due from one to five years | 3,693,823 | 3,842,897 | ||||
Due from five to ten years | 6,568,499 | 6,694,259 | ||||
Due after ten years | 7,116,795 | 7,012,403 | ||||
18,631,157 | 18,823,621 | |||||
Mortgage-backed securities | 4,734,511 | 4,810,729 | ||||
Total debt securities | $ | 23,365,668 | $ | 23,634,350 | ||
Held-to-maturity | ||||||
Due from five to ten years | $ | 500,000 | $ | 502,205 | ||
Actual maturities may differ for certain debt securities that may be called by the issuer prior to the contractual maturity. Actual maturities may differ from contractual maturities in mortgage-backed securities because the mortgages underlying the securities may be prepaid, usually without any penalties. Therefore, these mortgage-backed securities are not included in the maturity categories in the above maturity summary.
Note 5. Loans Held for Sale and Loan Servicing
At December 31, 2010 and 2009, Loans held for sale consisted of conventional residential mortgages and commercial real estate mortgages originated for subsequent sale. At December 31, 2010 and 2009, the estimated fair value of these loans was in excess of their carrying value, and therefore no valuation reserve was necessary for loans held for sale.
Commercial and mortgage loans serviced for others are not included in the accompanying balance sheets. The unpaid principal balances of commercial and mortgage loans serviced for others were $166,042,363 and $123,231,116 at December 31, 2010 and 2009, respectively. Loans sold during 2010 consisted of $1,099,769 in qualifying small business loans, $294,132 in credit card loans and $51,268,963 in residential loans, resulting in total loans sold of $52,662,864. The net gains realized on the sale of those loans amounted to $64,084, $9,534 and $956,102, respectively. Loans sold in 2009 totaled $60,431,024 and consisted solely of residential mortgages, resulting in net gains of $969,541. There were no guarantees to repurchase loans for any amount at December 31, 2010, but there were risk sharing commitments on certain sold loans totaling $91,625 as of such date.
The Company generally retains the servicing rights on loans sold. At December 31, 2010 and 2009, the unamortized balance of servicing rights on loans sold with servicing retained was $649,877 and $529,833, respectively, and is included in Other assets. The estimated fair value of these servicing rights was in excess of their carrying value at both December 31, 2010 and 2009, and therefore no impairment reserve was necessary. Loan servicing rights of $383,080 and $470,457 were capitalized in 2010 and 2009, respectively. Amortization of servicing rights was $263,035 and $269,652 for 2010 and 2009, respectively.
Union Bankshares, Inc. 2010 Annual Report 24
Note 6. Loans
The composition of Net loans at December 31, was as follows:
2010 | 2009 | |||||
Residential real estate | $ | 132,533,900 | $ | 123,915,103 | ||
Construction real estate | 18,578,588 | 19,391,035 | ||||
Commercial real estate | 167,055,400 | 159,094,575 | ||||
Commercial | 20,602,074 | 15,596,785 | ||||
Consumer | 6,046,521 | 6,967,268 | ||||
Municipal | 31,455,427 | 23,862,350 | ||||
Gross loans | 376,271,910 | 348,827,116 | ||||
Allowance for loan losses | (3,754,618 | ) | (3,492,783 | ) | ||
Net deferred loan costs | 188,305 | 77,508 | ||||
Net loans | $ | 372,705,597 | $ | 345,411,841 | ||
Residential real estate loans aggregating $9,605,183 and $7,956,531 at December 31, 2010 and 2009, respectively, were pledged as collateral on deposits of municipalities. Qualified first mortgages held by Union may also be pledged as collateral for borrowings from the FHLB of Boston under a blanket lien.
A summary of current, past due and nonaccrual loans as of December 31, 2010 was as follows:
Current | 30-89 Days | Over 90 Days and accruing | Nonaccrual | Total | |||||||||||
Residential real estate | $ | 123,573,216 | $ | 6,445,998 | $ | 587,066 | $ | 1,927,620 | $ | 132,533,900 | |||||
Construction real estate | 18,369,759 | 116,084 | 44,687 | 48,058 | 18,578,588 | ||||||||||
Commercial real estate | 163,523,912 | 2,728,742 | 172,832 | 629,914 | 167,055,400 | ||||||||||
Commercial | 20,293,405 | 160,833 | — | 147,836 | 20,602,074 | ||||||||||
Consumer | 5,953,039 | 53,498 | 1,137 | 38,847 | 6,046,521 | ||||||||||
Municipal | 31,455,427 | — | — | — | 31,455,427 | ||||||||||
Total | $ | 363,168,758 | $ | 9,505,155 | $ | 805,722 | $ | 2,792,275 | $ | 376,271,910 | |||||
Loans in nonaccrual status were $3,738,178 and loans past due 90 days or more and still accruing were $537,670 as of December 31, 2009. Aggregate interest on nonaccrual loans not recognized was $676,525 and $663,517 for the years ended December 31, 2010 and 2009, respectively.
Note 7. Allowance for Loan Losses and Credit Quality
Changes in the Allowance for loan losses for the year ended December 31, 2010 were as follows:
Residential Real Estate | Construction Real Estate | Commercial Real Estate | Commercial | Consumer, Municipal and Unallocated | Total | |||||||||||||
Balance, December 31, 2009 | $ | 975,511 | $ | 239,548 | $ | 1,959,258 | $ | 235,414 | $ | 83,052 | $ | 3,492,783 | ||||||
Provision for loan losses | 183,430 | 89,363 | 202,741 | 22,073 | 22,393 | 520,000 | ||||||||||||
Recoveries of amounts charged off | 7,472 | — | — | 20,754 | 29,258 | 57,484 | ||||||||||||
1,166,413 | 328,911 | 2,161,999 | 278,241 | 134,703 | 4,070,267 | |||||||||||||
Amounts charged off | (133,854 | ) | (88,966 | ) | (45,049 | ) | (27,805 | ) | (19,975 | ) | (315,649 | ) | ||||||
Balance, December 31, 2010 | $ | 1,032,559 | $ | 239,945 | $ | 2,116,950 | $ | 250,436 | $ | 114,728 | $ | 3,754,618 | ||||||
Despite the above allocation, the Allowance for loan losses is general in nature and is available to absorb losses from any loan type.
Union Bankshares, Inc. 2010 Annual Report 25
Changes in the Allowance for loan losses for the year ended December 31, 2009 were as follows:
Total | |||
Balance, January 1, 2009 | $ | 3,556,205 | |
Provision for loan losses | 400,000 | ||
Recoveries of amounts charged off | 59,873 | ||
4,016,078 | |||
Amounts charged off | (523,295 | ) | |
Balance, December 31, 2009 | $ | 3,492,783 | |
At December 31, 2010, the allocation of the Allowance for loan losses summarized on the basis of the Company's impairment methodology was as follows:
Residential Real Estate | Construction Real Estate | Commercial Real Estate | Commercial | Consumer, Municipal and Unallocated | Total | |||||||||||||
Individually evaluated for impairment | $ | 199,072 | $ | 12,015 | $ | 295,259 | $ | 38,858 | $ | 20,137 | $ | 565,341 | ||||||
Collectively evaluated for impairment | 833,487 | 227,930 | 1,821,691 | 211,578 | 94,591 | 3,189,277 | ||||||||||||
Allocated | $ | 1,032,559 | $ | 239,945 | $ | 2,116,950 | $ | 250,436 | $ | 114,728 | $ | 3,754,618 | ||||||
The recorded investment in loans summarized on the basis of the Company's impairment methodology as of December 31, 2010 was as follows:
Residential Real Estate | Construction Real Estate | Commercial Real Estate | Commercial | Consumer | Municipal | Total | |||||||||||||||
Individually evaluated for impairment | $ | 1,788,976 | $ | 48,058 | $ | 5,224,034 | $ | 145,866 | $ | 30,217 | $ | — | $ | 7,237,151 | |||||||
Collectively evaluated for impairment | 130,744,924 | 18,530,530 | 161,831,366 | 20,456,208 | 6,016,304 | 31,455,427 | 369,034,759 | ||||||||||||||
Total | $ | 132,533,900 | $ | 18,578,588 | $ | 167,055,400 | $ | 20,602,074 | $ | 6,046,521 | $ | 31,455,427 | $ | 376,271,910 | |||||||
The following table summarizes the loan ratings applied to the Company's loan types as of December 31, 2010:
Residential Real Estate | Construction Real Estate | Commercial Real Estate | Commercial | Consumer | Municipal | Total | |||||||||||||||
Pass | $ | 128,646,662 | $ | 17,999,545 | $ | 142,529,500 | $ | 19,638,448 | $ | 5,991,145 | $ | 31,455,427 | $ | 346,260,727 | |||||||
Satisfactory/Monitor | 2,098,262 | 530,985 | 19,301,866 | 817,760 | 25,159 | — | 22,774,032 | ||||||||||||||
Monitor | 267,003 | — | 1,872,856 | — | — | — | 2,139,859 | ||||||||||||||
Substandard | 1,521,973 | 48,058 | 3,351,178 | 145,866 | 30,217 | — | 5,097,292 | ||||||||||||||
Total | $ | 132,533,900 | $ | 18,578,588 | $ | 167,055,400 | $ | 20,602,074 | $ | 6,046,521 | $ | 31,455,427 | $ | 376,271,910 | |||||||
The following is an overview of the Company's loan rating system:
1-3 Rating - Pass
Risk-rating grades "1" through "3" comprise those loans ranging from lower than average credit risk which indicates borrowers with high liquidity, excellent financial condition, strong management, favorable industry trends or loans secured by highly liquid assets through marginal credit risk, which while credit worthy, exhibit some characteristics which require special attention by the account officer.
Union Bankshares, Inc. 2010 Annual Report 26
4 Rating - Satisfactory/Monitor
Borrowers exhibit potential credit weaknesses or downward trends warranting management's attention. While potentially weak, these borrowers are currently marginally acceptable; no loss of principal or interest is envisioned.
M Rating - Monitor
Loans in this category reflect an increased credit risk. Loans in this category do not presently expose the Bank to a sufficient degree of risk to warrant adverse classification but do possess credit deficiencies deserving management's close attention. These credits are maintained on the watch list.
5-8 Substandard
Borrowers exhibit well defined weaknesses that jeopardize the orderly liquidation of debt. Loan may be inadequately protected by the net worth and paying capacity of the obligor and/or the underlying collateral is inadequate.
The following table provides information with respect to impaired loans as of and for the year ended December 31, 2010:
December 31, 2010 | Year ended December 31, 2010 | ||||||||||||||
Recorded Investment | Principal Balance | Related Allowance | Average Recorded Investment | Interest Income Recognized | |||||||||||
With an allowance recorded: | |||||||||||||||
Residential real estate | $ | 300,947 | $ | 300,947 | $ | 43,000 | |||||||||
Commercial real estate | 1,970,034 | 1,970,034 | 39,500 | ||||||||||||
2,270,981 | 2,270,981 | 82,500 | |||||||||||||
With no allowance recorded: | |||||||||||||||
Commercial real estate | 235,417 | 235,417 | — | ||||||||||||
Commercial | 400 | 400 | — | ||||||||||||
235,817 | 235,817 | — | |||||||||||||
Total: | |||||||||||||||
Residential real estate | 300,947 | 300,947 | 43,000 | $ | 228,762 | $ | — | ||||||||
Commercial real estate | 2,205,451 | 2,205,451 | 39,500 | 2,585,231 | 84,749 | ||||||||||
Commercial | 400 | 400 | — | 1,600 | — | ||||||||||
Total | $ | 2,506,798 | $ | 2,506,798 | $ | 82,500 | $ | 2,815,593 | $ | 84,749 | |||||
Information regarding impaired loans as of or for the year ended December 31, 2009 was as follows:
2009 | |||
Impaired loans | $ | 3,328,006 | |
Total allowance for loan losses related to impaired loans | 341,100 | ||
Interest income recognized on impaired loans | 65,355 | ||
Average investment in impaired loans | 2,474,512 | ||
At December 31, 2010 and 2009, the Company was not committed to lend any additional funds to borrowers whose loans were nonperforming, impaired or restructured.
Union Bankshares, Inc. 2010 Annual Report 27
Note 8. Premises and Equipment
The major classes of Premises and equipment and accumulated depreciation at December 31 were as follows:
2010 | 2009 | |||||
Land and land improvements | $ | 1,841,224 | $ | 1,834,091 | ||
Building and improvements | 7,629,375 | 7,555,655 | ||||
Furniture and equipment | 6,055,754 | 5,664,709 | ||||
Construction in progress and deposits on equipment | 87,999 | 270,833 | ||||
15,614,352 | 15,325,288 | |||||
Less accumulated depreciation | (7,772,071 | ) | (7,711,969 | ) | ||
$ | 7,842,281 | $ | 7,613,319 | |||
Depreciation included in Occupancy and Equipment expenses amounted to $660,381 and $713,659 for the years ended December 31, 2010 and 2009, respectively.
The Company is obligated under noncancelable operating leases for premises that expire in various years through the year 2013. Options to renew for additional periods are available with these leases. Future minimum rental commitments for these leases with original or remaining terms of one year or more at December 31, 2010 were as follows:
2011 | $ | 126,046 | |
2012 | 66,033 | ||
2013 | 32,539 | ||
$ | 224,618 | ||
Rent expense for 2010 and 2009 amounted to $114,523 and $119,531, respectively.
Occupancy expense is shown in the consolidated statements of income, net of rental income of $120,810 and $103,746 in 2010 and 2009, respectively.
Note 9. Other Real Estate Owned
There were nine properties valued at $1,608,576 in other real estate owned at December 31, 2010 and six properties valued at $886,099 at December 31, 2009, which were included in Other assets. There was an allowance for losses on other real estate owned of $47,131 at both December 31, 2010 and 2009, which has been netted out of the foregoing values.
Note 10. Investments Carried at Equity
The Company has purchased from time to time various limited partnership interests established to acquire, own and rent residential housing for elderly, low or moderate income individuals in northeastern and central Vermont. The carrying values of investments carried at equity were $2,343,766 and $2,769,736 at December 31, 2010 and 2009, respectively. The investments are included in Other assets. The capital contributions payable related to these investments were $0 and $179,420 at December 31, 2010 and 2009, respectively, and are included in Accrued interest and other liabilities. The provision for undistributed net losses of the partnerships charged to earnings was $425,970 for both 2010 and 2009. The federal income tax credits related to these investments were $379,635 and $424,932 for the years ended December 31, 2010 and 2009, respectively, and recorded as a reduction of the Provision for income taxes.
Union Bankshares, Inc. 2010 Annual Report 28
Note 11. Deposits
The following is a summary of Interest bearing deposits at December 31:
2010 | 2009 | |||||
NOW accounts | $ | 64,317,479 | $ | 69,198,702 | ||
Saving and money market accounts | 116,068,641 | 104,801,340 | ||||
Time deposits, $100,000 and over | 62,910,177 | 60,216,604 | ||||
Other time deposits | 68,838,031 | 74,481,646 | ||||
$ | 312,134,328 | $ | 308,698,292 | |||
The following is a summary of time deposits by maturity at December 31, 2010:
2011 | $ | 97,899,731 | |
2012 | 16,107,452 | ||
2013 | 12,572,048 | ||
2014 | 2,690,137 | ||
2015 | 2,478,840 | ||
$ | 131,748,208 | ||
Note 12. Borrowed Funds
At December 31, 2010 and 2009, Borrowed funds were comprised of option advance borrowings from the FHLB of Boston of $28,985,907 and $30,992,604, respectively. The option advance borrowings are a mix of straight and callable bullets, balloons and amortizers with maturities through 2027. All of the borrowings had fixed interest rates ranging from 0.23% to 5.61% at December 31, 2010 and ranging from 0.19% to 5.61% at December 31, 2009. The weighted average interest rates on the borrowings were 3.84% and 3.52% at December 31, 2010 and 2009, respectively.
The contractual payments due for borrowed funds as of December 31, 2010 were as follows:
2011 | $ | 4,623,335 | |
2012 | 1,443,859 | ||
2013 | 5,963,047 | ||
2014 | 1,007,103 | ||
2015 and thereafter | 15,948,563 | ||
$ | 28,985,907 | ||
Additionally, Union maintains an IDEAL Way Line of Credit with the FHLB of Boston. As of December 31, 2010, the total available amount of this line was $551,000. There were no borrowings outstanding on this line at December 31, 2010. Interest on this line is chargeable at a rate determined by the FHLB of Boston and payable monthly based on daily balances outstanding.
Collateral on these borrowings consists of FHLB of Boston stock purchased by Union, all funds placed on deposit with the FHLB of Boston, qualified first mortgages held by Union, and any additional holdings which may be pledged as security.
Union also maintains lines of credit with correspondent banks for the purchase of overnight Federal Funds. As of December 31, 2010, the total available amount of these lines was $10.5 million with no outstanding borrowings. Interest on these borrowings is chargeable at the Federal Funds rate at the time of the borrowing and is payable daily.
Union Bankshares, Inc. 2010 Annual Report 29
Note 13. Income Taxes
The components of the Provision for income taxes for the years ended December 31 were as follows:
2010 | 2009 | |||||
Current tax provision | $ | 1,798,444 | $ | 1,431,358 | ||
Deferred tax benefit | (95,737 | ) | (11,415 | ) | ||
$ | 1,702,707 | $ | 1,419,943 | |||
The total provision for income taxes differs from the amounts computed at the statutory federal income tax rate of 34% primarily due to the following for the years ended December 31:
2010 | 2009 | |||||
Computed “expected” tax expense | $ | 2,478,428 | $ | 2,259,814 | ||
Tax exempt interest | (402,089 | ) | (420,120 | ) | ||
Increase in cash surrender value of life insurance | (25,670 | ) | (26,325 | ) | ||
Tax credits on limited partnership investments | (379,635 | ) | (424,932 | ) | ||
Other | 31,673 | 31,506 | ||||
$ | 1,702,707 | $ | 1,419,943 | |||
Listed below are the significant components of the net deferred tax asset at December 31:
2010 | 2009 | |||||
Components of the deferred tax asset | ||||||
Bad debts | $ | 1,078,473 | $ | 989,450 | ||
Mark-to-market loans | 10,562 | 9,596 | ||||
Nonaccrual loan interest | 230,018 | 225,596 | ||||
Deferred compensation | 442,104 | 435,470 | ||||
Net pension liability | 833,390 | 829,304 | ||||
Other | 61,748 | 22,457 | ||||
Total deferred tax asset | 2,656,295 | 2,511,873 | ||||
Components of the deferred tax liability | ||||||
Depreciation | (353,403 | ) | (228,191 | ) | ||
Mortgage servicing rights | (220,958 | ) | (180,143 | ) | ||
Limited partnership investments | (6,221 | ) | (307,766 | ) | ||
Unrealized gain on investment securities available-for-sale | (89,877 | ) | (184,842 | ) | ||
Total deferred tax liability | (670,459 | ) | (900,942 | ) | ||
Net deferred tax asset | $ | 1,985,836 | $ | 1,610,931 | ||
Deferred tax assets are recognized subject to management's judgment that realization is more likely than not as GAAP allows for the recognition and measurement of deductible temporary differences to the extent that it is more likely than not that the deferred tax asset will be realized. Based on the temporary taxable items, historical taxable income and estimates of future taxable income, the Company believes that it is more likely than not that the deferred tax assets at December 31, 2010 will be realized and therefore no valuation allowance is warranted.
Net deferred income tax assets are included in Other assets in the balance sheet at December 31, 2010 and 2009.
Based on management's evaluation, management has concluded that there were no significant uncertain tax positions requiring recognition in the Company's financial statements at December 31, 2010 or 2009. Although the Company is not currently the subject of a tax examination by the Internal Revenue Service (IRS), the Company's tax years ended December 31, 2007 through 2009 are open to examination by the IRS under the applicable statute of limitations as the 2010 tax return has not yet been filed.
The Company may from time to time be assessed interest and/or penalties by federal or state tax jurisdictions, although any such assessments historically have been minimal and immaterial to the Company's financial results. In the event that the Company receives an assessment for interest and/or penalties, it will be classified in the financial statements as Other expenses.
Union Bankshares, Inc. 2010 Annual Report 30
Note 14. Employee Benefit Plans
Defined Benefit Pension Plan: Union sponsors a noncontributory defined benefit pension plan covering all eligible employees. The plan provides defined benefits based on years of service and final average salary. There was no minimum required contribution under the ERISA guidelines for 2010 and the minimum contribution for 2009 was $601,287. Union measures defined benefit plan assets and obligations as of December 31, its fiscal year-end.
Union's policy is to accrue annually an amount equal to the actuarially calculated expense for current and estimated future benefits. Union made tax deductible voluntary contributions of $1,250,000 and $1,505,676 to the pension plan in 2010 and 2009, respectively, over and above the minimum required, which are included in employer contributions below. Information pertaining to the activity in the plan is as follows:
Obligations and funded status at December 31:
2010 | 2009 | |||||
Change in projected benefit obligation | ||||||
Projected benefit obligation at beginning of year | $ | 13,184,135 | $ | 12,344,137 | ||
Service cost | 577,730 | 577,443 | ||||
Interest cost | 773,026 | 720,209 | ||||
Actuarial loss (gain) | 985,768 | (220,277 | ) | |||
Benefits paid | (290,557 | ) | (237,377 | ) | ||
Projected benefit obligation at end of year | 15,230,102 | 13,184,135 | ||||
Change in fair value of plan assets | ||||||
Fair value of plan assets at beginning of year | 10,745,002 | 7,112,679 | ||||
Actuarial gain on plan assets | 1,074,507 | 1,762,737 | ||||
Employer contributions | 1,250,000 | 2,106,963 | ||||
Benefits paid | (290,557 | ) | (237,377 | ) | ||
Fair value of plan assets at end of year | 12,778,952 | 10,745,002 | ||||
Net liability for pension benefits | $ | (2,451,150 | ) | $ | (2,439,133 | ) |
2010 | 2009 | |||||
Accumulated benefit obligation at December 31 | $ | 11,983,352 | $ | 10,044,214 | ||
Amounts recognized in the consolidated balance sheet consist of:
2010 | 2009 | |||||
Prepaid pension benefit in Other assets | $ | 1,090,462 | $ | 609,185 | ||
Liability for defined benefit pension plan | $ | (3,541,612 | ) | $ | (3,048,318 | ) |
The impact of the pension activity for 2010 and 2009 on Other comprehensive income (loss) is detailed in Note 22.
The Company uses the alternate amortization method for prior service costs, as provided in FASB ASC Topic 715, Employers' Accounting for Pensions.
Net periodic pension benefit cost for 2010 and 2009 consisted of the following components:
2010 | 2009 | |||||
Service cost | $ | 577,730 | $ | 577,443 | ||
Interest cost on projected benefit obligation | 773,026 | 720,209 | ||||
Expected return on plan assets | (730,791 | ) | (533,836 | ) | ||
Amortization of prior service cost | 6,158 | 6,158 | ||||
Amortization of net loss | 142,597 | 316,214 | ||||
Net periodic benefit cost | $ | 768,720 | $ | 1,086,188 | ||
Union Bankshares, Inc. 2010 Annual Report 31
It is estimated that the net periodic benefit cost for 2011 will include approximately $6 thousand of amortization of prior service cost and $184 thousand of amortization of net actuarial loss.
Weighted average assumptions used to determine benefit obligation at December 31, 2010 and 2009 were a rate of compensation increase of 4.50% for both years and a discount rate of 5.56% at December 31, 2010 and 6.00% at December 31, 2009.
Weighted average assumptions used to determine net periodic benefit cost for the years ended December 31, 2010 and 2009 were a discount rate of 6.00%, a rate of compensation increase of 4.50% and an expected long-term rate of return on plan assets of 6.75%.
The overall expected long-term rate of return on assets is consistent with future inflation assumptions as well as consideration of historical asset returns and the current financial marketplace. The return is more conservative than the plan's long-term actual results and is at a level that management believes is sustainable. The 2010 benefit obligation discount rate is based on the plan's expected benefit payment stream utilizing December 2010 benchmark pension liability index yield curve spot rates and a review of published high quality bond indices.
Union's pension plan asset allocations at December 31, 2010 and 2009, by asset category based on their fair values were as follows:
Asset Category | 2010 | 2009 | ||
Cash and cash equivalents | 11.0 | % | 4.2 | % |
Interest bearing deposits in banks | 9.1 | % | 12.2 | % |
Debt securities | 20.0 | % | 20.8 | % |
Equity securities | 54.7 | % | 57.3 | % |
International mutual funds | 5.2 | % | 5.5 | % |
Total | 100.0 | % | 100.0 | % |
The investment philosophy for the pension plan is to prudently invest the assets of the plan and future contributions received in a diversified manner that will ensure the future benefits due to participants and beneficiaries over a long-term horizon as well as provide liquidity to pay current benefits. The Trustees of the plan seek to protect the pension plan assets through prudent asset allocation, FDIC insurance on a portion of plan assets, manager selection and periodic reviews. Investments in stocks and fixed income investments are diversified in a way which is consistent with risk tolerance, investment objectives and current financial market risks.
In order to achieve this goal the investment objective is to maintain a mix of growth and income investments allocated as follows, with no more than 20% of the equity portion of the portfolio invested in foreign equities:
Equity securities and international mutual funds | 55-70% |
Debt securities | 30-45% |
Cash and equivalents | 0-5% |
There are no securities of the Company or Union held by the pension plan. The assets of the plan are managed by the Trust & Asset Management Division of Union with the advice of its registered investment advisor, under the guidance of the plan's Trustees. The estimated employer contribution for 2011 is $1 million.
Union Bankshares, Inc. 2010 Annual Report 32
The fair values of the Company's pension plan assets at December 31, 2010 and 2009, segregated by fair value hierarchy level, are summarized below:
Fair Value Measurements December 31, 2010 | ||||||||||||
Fair Value | Quoted Prices in Active Markets for Identical Assets (Level 1) | Significant Other Observable Inputs (Level 2) | Significant Unobservable Inputs (Level 3) | |||||||||
Cash and cash equivalents | $ | 1,399,234 | $ | 1,399,234 | $ | — | $ | — | ||||
Interest bearing deposits in banks | 1,164,612 | — | 1,164,612 | — | ||||||||
Debt securities and bond funds | 2,573,066 | 108,440 | 2,464,626 | — | ||||||||
Marketable equity securities | 1,513,041 | 1,513,041 | — | — | ||||||||
Equity mutual and exchange traded funds | 6,128,999 | 6,128,999 | — | — | ||||||||
Total | $ | 12,778,952 | $ | 9,149,714 | $ | 3,629,238 | $ | — | ||||
Fair Value Measurements December 31, 2009 | ||||||||||||
Fair Value | Quoted Prices in Active Markets for Identical Assets (Level 1) | Significant Other Observable Inputs (Level 2) | Significant Unobservable Inputs (Level 3) | |||||||||
Cash and cash equivalents | $ | 450,690 | $ | 450,690 | $ | — | $ | — | ||||
Interest bearing deposits in banks | 1,307,994 | — | 1,307,994 | — | ||||||||
Debt securities and bond funds | 2,263,657 | 104,150 | 2,159,507 | — | ||||||||
Marketable equity securities | 1,548,408 | 1,548,408 | — | — | ||||||||
Equity mutual and exchange traded funds | 5,174,253 | 5,174,253 | — | — | ||||||||
Total | $ | 10,745,002 | $ | 7,277,501 | $ | 3,467,501 | $ | — | ||||
The fair values of the pension plan assets are determined by an independent pricing service which, given the nature of the assets within the portfolio, is able to utilize quoted prices in an active market to value the majority of the assets held. The market inputs sought for assets without a specific quote listed, in approximate order of priority, include benchmark yields, reported trades, broker/dealer quotes, issuer spreads, two-sided markets, benchmark securities, bids, offers and reference data including market research publications that vary by asset class. For certain security types, additional inputs may be used, or some standard inputs may not be applicable. There were no significant transfers in or out of levels 1 and 2 for the year ended December 31, 2010.
The following table summarizes the estimated future benefit payments expected to be paid under the Plan:
2011 | $ | 309,080 | |
2012 | 454,350 | ||
2013 | 510,976 | ||
2014 | 591,278 | ||
2015 | 605,818 | ||
Years 2016 to 2020 | 3,481,548 | ||
Nonqualified Deferred Compensation Plans: Union Bankshares, Inc. and Union have two nonqualified Deferred Compensation Plans for Directors and certain key officers. The 2008 Amended and Restated Nonqualified Deferred Compensation Plan of Union Bankshares, Inc. (“2008 Plan”) replaced a 1990 Plan that was not compliant with section 409A of the Internal Revenue Code. The amendments also included an increase in the amounts to be accrued under the 2008 Plan, subject to vesting requirements in 2009 and 2010, in order to align projected payouts under the 2008 Plan
Union Bankshares, Inc. 2010 Annual Report 33
with original commitments made to participants. The Company accrued an expense of $79,186 in 2010 and $56,754 in 2009 under the 2008 Plan. The benefit obligations under the 2008 Plan represent general unsecured obligations of the Company and no assets are segregated for such payments. However, the Company and Union have purchased life insurance contracts on the lives of each participant in order to fund these benefits. The benefits accrued under this 2008 Plan aggregated $1,200,179 and $1,198,732 at December 31, 2010 and 2009, respectively, and are included in Accrued interest and other liabilities. The cash surrender value of the life insurance policies purchased to fund the 2008 Plan
aggregated $1,568,763 and $1,493,262 at December 31, 2010 and 2009, respectively, and is included in Other assets in the Company's balance sheets.
An Executive Nonqualified Excess Plan was adopted in 2006 for Directors and certain key officers. The 2006 Plan is a defined contribution plan which provides a means by which participants may elect to defer receipt of current compensation from the Company or its subsidiary in order to provide retirement or other benefits as selected in the individual adoption agreements. Participants may select among designated reference investments consisting of investment funds, with the performance of the participant's account mirroring the selected reference investment. Distributions are made only upon a qualifying distribution event, which may include a separation from service, death, disability or unforeseeable emergency, or upon a date specified in the participant's deferral election form. The 2006 Plan is intended to comply with the provisions of Section 409A of the Internal Revenue Code. The 2006 Plan is unfunded, representing a general unsecured obligation of the Company of $100,128 and $82,061 as of December 31, 2010 and 2009, respectively.
401(k) Plan: Union maintains a defined contribution 401(k) plan under which employees may elect to make tax deferred contributions of up to the IRS maximum from their annual salary. All employees meeting service requirements are eligible to participate in the plan. Company contributions are fully vested after three years of service. Union's employer matching contributions to the plan are at the discretion of the Board of Directors. Employer matching contributions to the plan were $142,410 and $136,001 for 2010 and 2009, respectively.
Note 15. Stock Option Plan
Under the 2008 Incentive Stock Option Plan (“Plan”), the Company's Board of Directors may grant to certain key employees incentive stock options to purchase shares of the Company's common stock. As of December 31, 2010, of the 50,000 shares authorized for grants under the plan, 40,000 shares remain available for future option grants. The Company's 1998 Incentive Stock Option Plan expired in 2008. As of December 31, 2010, 5,000 options granted under the 1998 Plan remained outstanding and exercisable, with the last of such options expiring in December of 2012.
The exercise price of the options under both plans is equal to the market price of the stock at the date of grant; therefore, the intrinsic value of the options at the date of the grant is $0. All options have a one year requisite service period, vest after one year, and have a five-year contractual term. There were 6,000 options granted in 2010 and 4,000 options granted in 2009. The compensation cost that has been charged against income for the 2008 Plan was $25,032 for 2010 and $11,648 for 2009.
The fair value of each option award is estimated on the date of grant using a Black-Scholes based option valuation model. The estimated weighted average grant date fair values for options granted during 2010 and 2009 and the weighted average assumptions used are presented in the following table:
2010 | 2009 | |||||
Fair value per share | $ | 4.17 | $ | 2.91 | ||
Expected volatility | 50.95 | % | 34.07 | % | ||
Expected dividends | 5.83 | % | 5.84 | % | ||
Risk-free interest rate | 1.32 | % | 1.15 | % | ||
Expected term (in years) | 2.75 | 3.00 | ||||
Vesting periods (in years) | 1.00 | 1.00 | ||||
Union Bankshares, Inc. 2010 Annual Report 34
Expected volatilities are based on historical volatilities of the Company's stock, and, possibly, other factors. The Company uses historical data to estimate option exercise and employee termination within the valuation model. The expected term of options granted is estimated from past exercise activity, and represents the period of time that granted options are expected to be outstanding. The risk free interest rate for periods within the contractual life of the option is based on the U.S. Treasury yield curve at the time of grant. The expected dividend rate is estimated by annualizing the last dividend paid divided by the closing price of the Company's stock on the grant date of the option.
The following summarizes the option activity under the Plans for the year ended December 31, 2010:
Shares | Weighted Average Exercise Price | Weighted Average Remaining Contractual Term | Period End Aggregate Intrinsic Value | |||||||
Outstanding at January 1, 2010 | 11,500 | $ | 21.07 | |||||||
Granted | 6,000 | $ | 17.15 | |||||||
Exercised | — | — | ||||||||
Forfeited/Expired | (2,500 | ) | $ | 23.30 | ||||||
Outstanding at December 31, 2010 | 15,000 | $ | 19.13 | 2.91 | — | |||||
Exerciseable at December 31, 2010 | 9,000 | $ | 20.45 | 2.16 | — | |||||
There were no options exercised during 2010 or 2009. A summary of the status of the Company's total nonvested options as of and for the year ended December 31, 2010 is as follows:
Shares | Weighted Average Grant Date Fair Value | |||||
Nonvested at January 1, 2010 | 4,000 | $ | 2.91 | |||
Granted | 6,000 | 4.17 | ||||
Vested | (4,000 | ) | 2.91 | |||
Forfeited | — | — | ||||
Nonvested at December 31, 2010 | 6,000 | 4.17 | ||||
As of December 31, 2010, there was no unrecognized compensation cost related to nonvested share-based compensation arrangements granted under either Plan. There were no shares vested during 2009.
Note 16. Financial Instruments With Off-Balance-Sheet Risk
The Company is a party to financial instruments with off-balance-sheet risk in the normal course of business to meet the financing needs of its customers and to reduce its own exposure to fluctuations in interest rates. These financial instruments include commitments to extend credit, standby letters of credit, interest rate caps and floors written on adjustable-rate loans, commitments to participate in or sell loans, commitments to buy or sell securities, guarantees on certain sold loans and risk-sharing commitments on certain sold loans under the Mortgage Partnership Finance (MPF) program with the FHLB of Boston.
Such instruments involve, to varying degrees, elements of credit and interest rate risk in excess of the amount recognized in the balance sheet. The contract or notional amounts of those instruments reflect the extent of involvement the Company has in particular classes of financial instruments and the potential impact on the Company's future financial position, financial performance and cash flow.
Union Bankshares, Inc. 2010 Annual Report 35
The Company's exposure to credit loss in the event of nonperformance by the other party to the financial instrument for commitments to extend credit and standby letters of credit is represented by the contractual notional amount of those instruments. The Company uses the same credit policies in making commitments and conditional obligations as it does for on-balance-sheet instruments. For interest rate caps and floors embedded in adjustable-rate loans, the contract or notional amounts do not represent exposure to credit loss. The Company controls the risk of interest rate cap agreements through credit approvals, limits and monitoring procedures. Interest rate caps and floors on adjustable rate loans permit the Company to manage its interest rate risk and cash flow risk on these loans within parameters established by Company policy.
The Company generally requires collateral or other security to support financial instruments with credit risk. The following table shows financial instruments outstanding whose contract amount represents credit risk at December 31:
Contract or Notional Amount | ||||||
2010 | 2009 | |||||
Commitments to originate loans | $ | 15,653,989 | $ | 16,677,368 | ||
Unused lines of credit | 44,719,716 | 34,534,066 | ||||
Standby and commercial letters of credit | 1,494,406 | 2,438,399 | ||||
Credit card arrangement | 838,089 | 1,750,282 | ||||
MPF credit enhancement obligation, net (See Note 17) | 86,142 | 86,142 | ||||
Total | $ | 62,792,342 | $ | 55,486,257 | ||
Commitments to extend credit are agreements to lend to a customer as long as there is no violation of any condition established in the contract. Commitments generally have fixed expiration dates within 90 days of the commitment. Unused lines of credit are renewable at least annually except for home equity lines which generally have a specified draw period followed by a specified repayment period. Unused lines may have other termination clauses and may require payment of a fee.
Since many of the commitments and lines are expected to expire without being drawn upon, the total commitment amounts do not necessarily represent future cash requirements. The Company evaluates each customer's credit worthiness on a case-by-case basis. The amount of collateral obtained, if deemed necessary by the Company, upon issuance of a commitment to extend credit is based on management's credit evaluation of the customer. Collateral held varies but may include real estate, accounts receivable, inventory, property, plant and equipment and income-producing commercial properties.
Standby letters of credit are conditional commitments issued by the Company to guarantee the performance of a customer to a third party. Those guarantees are issued to support customer's private borrowing arrangements or guarantee the customer's contractual performance on behalf of a third party. The credit risk involved in issuing letters of credit is essentially the same as that involved in extending loans to customers and the Company evaluates each customer's credit worthiness on a case-by-case basis. The fair value of standby letters of credit has not been included in the balance sheets for either year as the fair value is immaterial.
The Company did not hold or issue derivative instruments or hedging instruments during the years ended December 31, 2010 and 2009.
Note 17. Commitments and Contingencies
Contingent Liabilities: The Company sells 1-4 family residential loans under the MPF program with FHLB of Boston. Under this program the Company shares in the credit risk of each mortgage, while receiving fee income in return. The Company is responsible for a Credit Enhancement Obligation (CEO) based on the credit quality of these loans. FHLB of Boston funds a First Loss Account (FLA) based on the Company's outstanding MPF mortgage balances. This creates a laddered approach to sharing in any losses. In the event of default, homeowner's equity and Private Mortgage Insurance, if any, are the first sources of repayment; the FHLB of Boston's FLA funds are then utilized, followed by the member's CEO,
Union Bankshares, Inc. 2010 Annual Report 36
with the balance the responsibility of FHLB of Boston. These loans meet specific underwriting standards of the FHLB of Boston. The Company had sold $4,984,317 in loans through the MPF program that had an outstanding balance of $2,584,404 as of December 31, 2010.
The volume of loans sold to the MPF program and the corresponding credit obligation are closely monitored by management. As of December 31, 2010, the notional amount of the maximum contingent contractual liability related to this program was $91,625 of which $5,483 has been recorded as a reserve through Other liabilities.
Legal Contingencies: In the normal course of business, the Company is involved in various legal and other proceedings. In the opinion of management, after consulting with the Company's legal counsel, any liability resulting from such proceedings would not have a material adverse effect on the Company's financial statements.
Note 18. Fair Value Measurements
The following is a description of the valuation methodologies used for the Company's financial assets that are measured on a recurring basis at estimated fair value:
Investment securities available-for-sale: Certain corporate debt securities, marketable equity securities and mutual funds have been valued using unadjusted quoted prices from active markets and therefore have been classified as level 1. However, the majority of the Company's investment securities available-for-sale have been valued utilizing level 2 inputs. For these securities, the Company obtains fair value measurements from an independent pricing service. The fair value measurements consider observable data that may include market maker bids, quotes and pricing models. Inputs to the pricing models include recent trades, benchmark interest rates, spreads and actual and projected cash flows.
Assets measured at fair value on a recurring basis at December 31, 2010 and 2009, segregated by fair value hierarchy level, are summarized below:
Fair Value Measurements | ||||||||||||
Fair Value | Quoted Prices in Active Markets for Identical Assets (Level 1) | Significant Other Observable Inputs (Level 2) | Significant Unobservable Inputs (Level 3) | |||||||||
December 31, 2010 | ||||||||||||
Investment securities available-for-sale | ||||||||||||
Debt securities: | ||||||||||||
U.S. Government-sponsored enterprises | $ | 4,458,636 | $ | — | $ | 4,458,636 | $ | — | ||||
Mortgage-backed | 4,810,729 | — | 4,810,729 | — | ||||||||
State and political subdivisions | 9,392,899 | — | 9,392,899 | — | ||||||||
Corporate | 4,972,086 | 2,104,860 | 2,867,226 | — | ||||||||
Total debt securities | 23,634,350 | 2,104,860 | 21,529,490 | — | ||||||||
Marketable equity securities | 45,380 | 45,380 | — | — | ||||||||
Mutual funds | 100,115 | 100,115 | — | — | ||||||||
Total | $ | 23,779,845 | $ | 2,250,355 | $ | 21,529,490 | $ | — | ||||
Union Bankshares, Inc. 2010 Annual Report 37
Fair Value Measurements | ||||||||||||
Fair Value | Quoted Prices in Active Markets for Identical Assets (Level 1) | Significant Other Observable Inputs (Level 2) | Significant Unobservable Inputs (Level 3) | |||||||||
December 31, 2009 | ||||||||||||
Investment securities available-for-sale | ||||||||||||
Debt securities: | ||||||||||||
U.S. Government-sponsored enterprises | $ | 4,453,778 | $ | — | $ | 4,453,778 | $ | — | ||||
Mortgage-backed | 4,859,701 | — | 4,859,701 | — | ||||||||
State and political subdivisions | 7,686,219 | — | 7,686,219 | — | ||||||||
Corporate | 7,523,137 | 5,279,498 | 2,243,639 | — | ||||||||
Total debt securities | 24,522,835 | 5,279,498 | 19,243,337 | — | ||||||||
Marketable equity securities | 43,726 | 43,726 | — | — | ||||||||
Mutual funds | 82,028 | 82,028 | — | — | ||||||||
Total | $ | 24,648,589 | $ | 5,405,252 | $ | 19,243,337 | $ | — | ||||
There were no significant transfers in or out of level 1 or 2 for the year ended December 31, 2010. Certain other assets and liabilities are measured at fair value on a nonrecurring basis, that is, the instruments are not measured at fair value on an ongoing basis but are subject to fair value adjustments in certain circumstances (for example, when there is evidence of impairment). Assets and liabilities measured at fair value on a non-recurring basis such as investment securities held-to-maturity, other real estate owned, impaired loans and mortgage servicing rights were not significant at December 31, 2010 or 2009. The Company has not elected to apply the fair value option to any financial assets or liabilities other than those situations where other accounting pronouncements require fair value measurements.
FASB ASC Topic 825, “Financial Instruments”, requires disclosure of the estimated fair value of financial instruments. Fair value is best determined based upon quoted market prices. However, in many instances, there are no quoted market prices for the Company's various financial instruments. In cases where quoted market prices are not available, fair values are based on estimates using present value or other valuation techniques. Those techniques are significantly affected by the assumptions used, including the discount rate and estimates of future cash flows. Management's estimates and assumptions are inherently subjective and involve uncertainties and matters of significant judgment. Changes in assumptions could dramatically affect the estimated fair values.
Accordingly, the fair value estimates may not be realized in an immediate settlement of the instrument. Certain financial instruments and all nonfinancial instruments may be excluded from disclosure requirements. Thus, the aggregate fair value amounts presented may not necessarily represent the actual underlying fair value of such instruments of the Company.
The following methods and assumptions were used by the Company in estimating its fair value disclosures for financial instruments:
Cash and cash equivalents: The carrying amounts reported in the balance sheet for cash and cash equivalents approximate those assets' fair values.
Interest bearing deposits in banks: Fair values for interest bearing deposits in banks are based on discounted present values of cash flows.
Investment securities: Fair values for investment securities are based on quoted market prices, where available. If quoted market prices are not available, fair value measurements consider observable data that may include market maker bids, quotes and pricing models. Inputs to the pricing models include recent trades, benchmark interest rates, spreads and actual and projected cash flows.
Union Bankshares, Inc. 2010 Annual Report 38
Loans and loans held for sale: Fair values of loans are estimated for portfolios of loans with similar financial characteristics and segregated by loan type. For variable-rate loans that reprice frequently and with no significant change in credit risk, fair values are based on carrying amounts. The fair values for other loans (for example, fixed-rate residential, commercial real estate, and rental property mortgage loans, and commercial and industrial loans) are estimated using discounted cash flow analysis, based on interest rates currently being offered for loans with similar terms to borrowers of similar credit quality. Loan fair value estimates include judgments regarding future cash flows, future expected loss experience and risk characteristics. The carrying amounts reported in the balance sheet for loans that are held for sale approximate their fair values. Fair values for impaired loans are estimated using discounted cash flow analyses or underlying collateral values, where applicable.
Accrued interest receivable and payable: The carrying amounts of accrued interest approximate their fair values.
FHLB of Boston stock: The carrying amount approximates its fair value.
Deposits: The fair values disclosed for demand deposits or nonmaturity deposits (for example, checking and savings accounts) are, by definition, equal to the amount payable on demand at the reporting date (that is, their carrying amounts). The carrying amounts of variable-rate time deposits approximate their fair values at the reporting date. The fair values for fixed-rate time deposits are estimated using a discounted cash flow calculation that applies interest rates currently being offered on time deposits to a schedule of aggregated contractual maturities on such time deposits.
Borrowed funds: The fair values of the Company's long-term debt are estimated using discounted cash flow analysis based on interest rates currently being offered on similar debt instruments. The fair values of the Company's short-term debt approximate the carrying amounts reported in the balance sheet.
Off-balance-sheet financial instruments: Fair values for off-balance-sheet, credit-related financial instruments are based on fees currently charged to enter into similar agreements, taking into account the remaining terms of the agreements and the counterparties' credit standing. The only commitments to extend credit that are normally longer than one year in duration are the Home Equity Lines whose interest rates are variable quarterly. The only fees collected for commitments are an annual fee on credit card arrangements and often a flat fee on commercial lines of credit and standby letters of credit. The fair value of off-balance-sheet financial instruments is not significant.
The estimated fair values and related carrying amounts of the Company's significant financial instruments at December 31 were as follows:
2010 | 2009 | |||||||||||
Carrying Amount | Estimated Fair Value | Carrying Amount | Estimated Fair Value | |||||||||
Financial assets: | ||||||||||||
Cash and cash equivalents | $ | 14,292,275 | $ | 14,292,275 | $ | 22,132,137 | $ | 22,132,137 | ||||
Interest bearing deposits in banks | 14,041,101 | 14,292,123 | 22,974,800 | 23,346,236 | ||||||||
Investment securities | 24,279,845 | 24,282,050 | 24,648,589 | 24,648,589 | ||||||||
Loans and loans held for sale, net | 378,316,033 | 373,717,749 | 354,674,193 | 346,796,679 | ||||||||
Accrued interest receivable | 1,560,322 | 1,560,322 | 1,634,095 | 1,634,095 | ||||||||
FHLB of Boston stock | 1,922,000 | 1,922,000 | 1,922,000 | 1,922,000 | ||||||||
Financial liabilities: | ||||||||||||
Deposits | $ | 376,660,482 | $ | 376,728,839 | $ | 368,827,137 | $ | 369,500,376 | ||||
Borrowed funds | 28,985,907 | 30,780,004 | 30,992,604 | 35,584,266 | ||||||||
Accrued interest payable | 388,919 | 388,919 | 556,251 | 556,251 | ||||||||
The carrying amounts in the preceding table are included in the balance sheet under the applicable captions.
Union Bankshares, Inc. 2010 Annual Report 39
Note 19. Transactions with Related Parties
The Company has had, and may be expected to have in the future, banking transactions in the ordinary course of business with principal stockholders, directors, principal officers, their immediate families and affiliated companies in which they are principal stockholders (commonly referred to as related parties), all of which have been, in the opinion of management, on the same terms, including interest rates and collateral, as those prevailing at the time for comparable transactions with unrelated parties and which do not represent more than the normal risk of collectability or present other unfavorable features.
Aggregate loan transactions with related parties for the years ended December 31 were as follows:
2010 | 2009 | |||||
Balance, January 1, | $ | 1,928,270 | $ | 1,443,260 | ||
New loans and advances on lines | 3,212,154 | 2,435,455 | ||||
Repayments | (3,163,145 | ) | (1,621,772 | ) | ||
Other, net | 1,974,757 | (328,673 | ) | |||
Balance, December 31, | $ | 3,952,036 | $ | 1,928,270 | ||
Balance available on lines of credit or loan commitments | $ | 787,506 | $ | 691,546 | ||
None of these loans are past due, are in nonaccrual status or have been restructured to provide a reduction or deferral of interest or principal because of deterioration in the financial position of the borrower. There were no loans to a related party that were considered classified at December 31, 2010 or 2009.
Deposit accounts with related parties were $1,836,347 and $1,434,823 at December 31, 2010 and 2009, respectively. The Union Bank Defined Benefit Pension Plan also invested $77,233 and $225,591 respectively, in FDIC insured certificates of deposit and had an operating demand deposit account with Union totaling $22,304 at December 31, 2009.
Note 20. Regulatory Capital Requirements
The Company (on a consolidated basis) and Union are subject to various regulatory capital requirements administered by the federal banking agencies. Failure to meet minimum capital requirements can initiate certain mandatory - and possibly additional discretionary - actions by regulators that, if undertaken, could have a direct material effect on the Company's and Union's financial statements. Under capital adequacy guidelines and the regulatory framework for prompt corrective action, the Company and Union must meet specific capital guidelines that involve quantitative measures of assets, liabilities and certain off-balance-sheet items as calculated under regulatory accounting practices. The Company's and Union's capital amounts and classification are also subject to qualitative judgments by the regulators about components, risk weightings and other factors. Prompt corrective action provisions are not applicable to bank holding companies.
Quantitative measures established by regulation to ensure capital adequacy require the Company and Union to maintain minimum amounts and ratios (set forth in the table below) of total and Tier I capital (as defined in the regulations) to risk-weighted assets (as defined), and of Tier I capital (as defined) to average assets (as defined). Management believes that, as of December 31, 2010 and 2009, the Company and Union met all capital adequacy requirements to which they were subject.
As of December 31, 2010 and 2009, the most recent notification from the FDIC categorized Union as well capitalized under the regulatory framework for prompt corrective action. To be categorized as well capitalized an institution must maintain minimum total risk based, Tier I risk based, and Tier I leverage ratios as set forth in the table below. There are no conditions or events since the date of the most recent notification that management believes might result in an adverse change to Union's regulatory capital category.
Union Bankshares, Inc. 2010 Annual Report 40
Union's and the Company's actual capital amounts (000's omitted) and ratios are presented in the following tables:
Actual | Minimum For Capital Requirement | Minimum To be Well Capitalized Under Prompt Corrective Action Provisions | |||||||||||||
Amount | Ratio | Amount | Ratio | Amount | Ratio | ||||||||||
As of December 31, 2010 | |||||||||||||||
Total capital to risk weighted assets | |||||||||||||||
Union | $ | 47,478 | 15.1 | % | $ | 25,137 | 8.0 | % | $ | 31,422 | 10.0 | % | |||
Company | 47,639 | 15.1 | % | 25,206 | 8.0 | % | N/A | N/A | |||||||
Tier I capital to risk weighted assets | |||||||||||||||
Union | $ | 43,723 | 13.9 | % | $ | 12,573 | 4.0 | % | $ | 18,860 | 6.0 | % | |||
Company | 43,884 | 13.9 | % | 12,601 | 4.0 | % | N/A | N/A | |||||||
Tier I capital to average assets | |||||||||||||||
Union | $ | 43,723 | 9.7 | % | $ | 18,012 | 4.0 | % | $ | 22,514 | 5.0 | % | |||
Company | 43,884 | 9.7 | % | 18,041 | 4.0 | % | N/A | N/A | |||||||
Actual | Minimum For Capital Requirement | Minimum To be Well Capitalized Under Prompt Corrective Action Provisions | |||||||||||||
Amount | Ratio | Amount | Ratio | Amount | Ratio | ||||||||||
As of December 31, 2009 | |||||||||||||||
Total capital to risk weighted assets | |||||||||||||||
Union | $ | 46,152 | 15.3 | % | $ | 24,195 | 8.0 | % | $ | 30,244 | 10.0 | % | |||
Company | 46,322 | 15.3 | % | 24,268 | 8.0 | % | N/A | N/A | |||||||
Tier I capital to risk weighted assets | |||||||||||||||
Union | $ | 42,659 | 14.1 | % | $ | 12,050 | 4.0 | % | $ | 18,153 | 6.0 | % | |||
Company | 42,829 | 14.1 | % | 12,133 | 4.0 | % | N/A | N/A | |||||||
Tier I capital to average assets | |||||||||||||||
Union | $ | 42,659 | 9.7 | % | $ | 17,555 | 4.0 | % | $ | 21,944 | 5.0 | % | |||
Company | 42,829 | 9.7 | % | 17,589 | 4.0 | % | N/A | N/A | |||||||
Dividends paid by Union are the primary source of funds available to the Company for payment of dividends to its stockholders. Union is subject to certain requirements imposed by federal banking laws and regulations, which among other things, establish minimum levels of capital and restrict the amount of dividends that may be distributed by Union to the Company.
Note 21. Treasury Stock
The basis for the carrying value of the Company's treasury stock is the purchase price of the shares at the time of purchase. The Board of Directors previously authorized the repurchase of up to 100,000 shares of common stock, or approximately 2.2%, of the Company's outstanding shares at the authorization date, for an aggregate repurchase cost not to exceed $2.15 million. Shares were repurchased in the open market or in negotiated transactions. The repurchase program ended during the first quarter of 2010 when the 100,000 share level was reached, for a total cost of $2.0 million since the inception of the program, including 500 shares repurchased in 2010, for a total cost of $8,725.
Union Bankshares, Inc. 2010 Annual Report 41
On May 20, 2010, Union Bankshares, Inc. announced the adoption of a limited stock repurchase plan to authorize the repurchase of up to 2,500 shares of its common stock each calendar quarter in open market purchases or privately negotiated transactions, as management may deem advisable and as market conditions may warrant. The repurchase authorization for a calendar quarter expires at the end of that quarter to the extent it has not been exercised, and is not carried forward into future quarters. The quarterly repurchase authorization expires on December 31, 2011. The Company repurchased 5,004 shares under this program, for a total cost of $89,787 in 2010.
During 2010 under the authorized repurchase programs, the Company repurchased 5,504 shares of its common stock at prices ranging from $17.45 to $18.51 per share, for a total of $98,512, and during 2009 repurchased 13,390 shares at prices ranging from $14.89 to $19.99 per share, for a total of $223,822.
Note 22. Other Comprehensive Income (Loss)
The following is a summary of the components of other comprehensive income (loss) for the years ended December 31:
2010 | 2009 | |||||
Investment securities available-for-sale: | ||||||
Net unrealized holding (losses) gains on investment securities available-for-sale, net of tax of $(61,661) and $317,985 | $ | (119,694 | ) | $ | 617,265 | |
Reclassification adjustment for net gains on investment securities available-for-sale realized in net income, net of tax of $(33,305) and $(87,566) | (64,651 | ) | (169,980 | ) | ||
Total | (184,345 | ) | 447,285 | |||
Defined benefit pension plan: | ||||||
Net unrealized actuarial gain (loss), net of tax of $(218,298) and $492,722 | (423,754 | ) | 956,459 | |||
Reclassification adjustment for amortization of net actuarial loss, realized in net income, net of tax of $48,483 and $107,515 | 94,114 | 208,699 | ||||
Reclassification adjustment for amortization of prior service cost, realized in net income, net of tax of $2,094 and $2,094 | 4,064 | 4,064 | ||||
Total | (325,576 | ) | 1,169,222 | |||
Total other comprehensive (loss) income | $ | (509,921 | ) | $ | 1,616,507 | |
The components of accumulated other comprehensive loss, net of tax, at December 31 are:
2010 | 2009 | |||||
Net unrealized gain on investment securities available-for-sale | $ | 174,467 | $ | 358,812 | ||
Defined benefit pension plan: | ||||||
Net unrealized actuarial loss | (2,326,817 | ) | (1,997,177 | ) | ||
Net unrealized prior service cost | (10,648 | ) | (14,712 | ) | ||
Total | $ | (2,162,998 | ) | $ | (1,653,077 | ) |
Note 23. Subsequent Events
Subsequent events represent events or transactions occurring after the balance sheet date but before the financial statements are issued. Financial statements are considered “issued” when they are widely distributed to shareholders and others for general use and reliance in a form and format that complies with GAAP.
Union Bankshares, Inc. 2010 Annual Report 42
Specifically, there are two types of subsequent events:
Those comprising events or transactions providing additional evidence about conditions that existed at the balance sheet date, including estimates inherent in the financial statement preparation process (referred to as recognized subsequent events).
Those comprising events that provide evidence about conditions not existing at the balance sheet date but, rather, that arose after such date (referred to as nonrecognized subsequent events).
On January 19, 2011, Union Bankshares, Inc. declared a $0.25 per share regular quarterly cash dividend payable February 10, 2011 to stockholders of record on January 29, 2011.
On March 17, 2011, Union Bankshares, Inc. announced an agreement to purchase three New Hampshire branch offices of Northway Bank. Union will assume approximately $80 million in deposits and $33 million in performing loans, subject to regulatory approval and routine adjustments prior to the expected second quarter 2011 closing, and will purchase the related Groveton and North Woodstock banking facilities, assume the lease for the Littleton location and offer the Northway branch employees their current branch positions.
Note 24. Condensed Financial Information (Parent Company Only)
The following condensed financial statements are for Union Bankshares, Inc. (Parent Company Only), and should be read in conjunction with the consolidated financial statements of Union Bankshares, Inc. and Subsidiary.
UNION BANKSHARES, INC. (PARENT COMPANY ONLY)
CONDENSED BALANCE SHEETS
Years Ended December 31, 2010 and 2009
2010 | 2009 | |||||
ASSETS | ||||||
Cash | $ | 127,469 | $ | 152,648 | ||
Investment securities available-for-sale | 109,195 | 90,909 | ||||
Investment in subsidiary - Union | 41,562,453 | 41,009,824 | ||||
Other assets | 734,052 | 695,640 | ||||
Total assets | $ | 42,533,169 | $ | 41,949,021 | ||
LIABILITIES AND STOCKHOLDERS' EQUITY | ||||||
LIABILITIES | ||||||
Other liabilities | $ | 808,495 | $ | 769,411 | ||
Total liabilities | 808,495 | 769,411 | ||||
STOCKHOLDERS' EQUITY | ||||||
Common stock, $2.00 par value; 7,500,000 shares authorized; 4,921,786 shares issued at December 31, 2010 and 2009 | 9,843,572 | 9,843,572 | ||||
Additional paid-in capital | 244,363 | 219,331 | ||||
Retained earnings | 37,622,575 | 36,494,110 | ||||
Treasury stock at cost; 466,082 and 460,578 shares at December 31, 2010 and 2009, respectively | (3,822,838 | ) | (3,724,326 | ) | ||
Accumulated other comprehensive loss | (2,162,998 | ) | (1,653,077 | ) | ||
Total stockholders' equity | 41,724,674 | 41,179,610 | ||||
Total liabilities and stockholders' equity | $ | 42,533,169 | $ | 41,949,021 | ||
The investment in the subsidiary bank is carried under the equity method of accounting. The investment in subsidiary and cash, which is on deposit with Union, have been eliminated in consolidation.
Union Bankshares, Inc. 2010 Annual Report 43
UNION BANKSHARES, INC. (PARENT COMPANY ONLY)
CONDENSED STATEMENTS OF INCOME
Years Ended December 31, 2010 and 2009
2010 | 2009 | |||||
Revenues | ||||||
Dividends - bank subsidiary - Union | $ | 4,786,000 | $ | 5,025,000 | ||
Other dividends | 1,174 | — | ||||
Other income | 22,331 | 22,891 | ||||
Total revenues | 4,809,505 | 5,047,891 | ||||
Expenses | ||||||
Interest | 24,406 | 22,545 | ||||
Stock based compensation expense | 25,032 | 11,648 | ||||
Administrative and other | 369,810 | 317,316 | ||||
Total expenses | 419,248 | 351,509 | ||||
Income before applicable income tax benefit and equity in undistributed net income of subsidiary | 4,390,257 | 4,696,382 | ||||
Applicable income tax benefit | (132,756 | ) | (113,490 | ) | ||
Income before equity in undistributed net income of subsidiary | 4,523,013 | 4,809,872 | ||||
Equity in undistributed net income - Union | 1,063,774 | 416,696 | ||||
Net income | $ | 5,586,787 | $ | 5,226,568 | ||
UNION BANKSHARES, INC. (PARENT COMPANY ONLY)
CONDENSED STATEMENTS OF CASH FLOWS
Years Ended December 31, 2010 and 2009
2010 | 2009 | |||||
CASH FLOWS FROM OPERATING ACTIVITIES | ||||||
Net income | $ | 5,586,787 | $ | 5,226,568 | ||
Adjustments to reconcile net income to net cash provided by operating activities: | ||||||
Equity in undistributed net income of Union | (1,063,774 | ) | (416,696 | ) | ||
Stock based compensation expense | 25,032 | 11,648 | ||||
Increase in other assets | (39,042 | ) | (36,032 | ) | ||
Increase in other liabilities | 39,084 | 37,739 | ||||
Net cash provided by operating activities | 4,548,087 | 4,823,227 | ||||
CASH FLOWS FROM INVESTING ACTIVITIES | ||||||
Purchases of investment securities available-for-sale | (16,432 | ) | (51,687 | ) | ||
CASH FLOWS FROM FINANCING ACTIVITIES | ||||||
Dividends paid | (4,458,322 | ) | (4,601,374 | ) | ||
Purchase of treasury stock | (98,512 | ) | (223,822 | ) | ||
Net cash used in financing activities | (4,556,834 | ) | (4,825,196 | ) | ||
Net decrease in cash | (25,179 | ) | (53,656 | ) | ||
CASH | ||||||
Beginning of year | 152,648 | 206,304 | ||||
End of year | $ | 127,469 | $ | 152,648 | ||
SUPPLEMENTAL SCHEDULE OF CASH FLOW INFORMATION | ||||||
Interest paid | $ | 24,406 | $ | 22,545 | ||
Income taxes paid | $ | 250 | $ | 250 | ||
Union Bankshares, Inc. 2010 Annual Report 44
Note 25. Quarterly Financial Data (Unaudited)
A summary of financial data for each of the four quarters of 2010 and 2009 is presented below (dollars in thousands):
Quarters in 2010 Ended | ||||||||||||
March 31, | June 30, | Sept. 30, | Dec. 31, | |||||||||
Interest income | $ | 5,644 | $ | 5,721 | $ | 5,728 | $ | 5,814 | ||||
Interest expense | 1,056 | 1,036 | 1,030 | 995 | ||||||||
Net interest income | 4,588 | 4,685 | 4,698 | 4,819 | ||||||||
Provision for loan losses | 90 | 90 | 200 | 140 | ||||||||
Noninterest income | 1,219 | 1,580 | 1,625 | 1,510 | ||||||||
Noninterest expenses | 4,139 | 4,174 | 4,206 | 4,396 | ||||||||
Net income | 1,219 | 1,526 | 1,460 | 1,382 | ||||||||
Earnings per common share | $ | 0.27 | $ | 0.34 | $ | 0.33 | $ | 0.31 | ||||
Quarters in 2009 Ended | ||||||||||||
March 31, | June 30, | Sept. 30, | Dec. 31, | |||||||||
Interest income | $ | 5,850 | $ | 5,813 | $ | 5,848 | $ | 5,706 | ||||
Interest expense | 1,488 | 1,358 | 1,277 | 1,171 | ||||||||
Net interest income | 4,362 | 4,455 | 4,571 | 4,535 | ||||||||
Provision for loan losses | 95 | 75 | 75 | 155 | ||||||||
Noninterest income | 1,351 | 1,272 | 1,509 | 1,389 | ||||||||
Noninterest expenses | 3,990 | 4,156 | 4,134 | 4,117 | ||||||||
Net income | 1,267 | 1,235 | 1,445 | 1,280 | ||||||||
Earnings per common share | $ | 0.28 | $ | 0.28 | $ | 0.32 | $ | 0.29 | ||||
Union Bankshares, Inc. 2010 Annual Report 45
MANAGEMENT'S DISCUSSION AND ANALYSIS OF FINANCIAL CONDITION AND
RESULTS OF OPERATIONS
GENERAL
The following discussion and analysis by management focuses on those factors that had a material effect on the financial position of Union Bankshares, Inc. (the Company) as of December 31, 2010 and 2009, and its results of operations for the years ended December 31, 2010 and 2009. This discussion is being presented to provide an explanation of the consolidated financial statements and should be read in conjunction with the financial statements and related notes and with other financial data in the Company's annual report on Form 10-K for the year ended December 31, 2010. The purpose of this presentation is to enhance overall financial disclosures and to provide information about historical financial performance and developing trends as a means to assess to what extent past performance can be used to evaluate the prospects for future performance. The Company meets the qualification requirements under Securities and Exchange Commission (SEC) rules for smaller reporting companies, and pursuant to such rules, has elected to present audited statements of income, cash flows and changes in stockholders' equity for each of the preceding two, rather than three, fiscal years. Management is not aware of the occurrence of any events after December 31, 2010, which would materially affect the information presented.
FORWARD-LOOKING STATEMENTS
The Company may from time-to-time make written or oral statements that are considered “forward-looking statements” within the meaning of the Private Securities Litigation Reform Act of 1995. Forward-looking statements may include financial projections, statements of plans and objectives for future operations, estimates of future economic performance or conditions and assumptions relating thereto. The Company may include forward-looking statements in its filings with the SEC, in its reports to stockholders, including this Annual Report, in press releases, other written materials, and in statements made by senior management to analysts, rating agencies, institutional investors, representatives of the media and others.
Forward-looking statements reflect management's current expectations and are subject to uncertainties, both general and specific, and risk exists that actual results will differ from those predictions, forecasts, projections and other estimates contained in forward-looking statements. These risks cannot be readily quantified. When management uses any of the words "believes," "expects," "anticipates," "intends," "projects," "plans," "seeks," "estimates," "targets," "goals," "may," "could," "would," "should" or similar expressions, they are making forward-looking statements. Many possible events or factors, including those beyond the control of management, could affect the future financial results and performance of the Company. This could cause results or performance to differ materially from those expressed in forward-looking statements. Management has discussed some of the more likely factors that might affect forward-looking statements in this report on form 10-K. The possible events or factors that might affect the forward-looking statements include, but are not limited to, the following:
• | uses of monetary, fiscal and tax policy by various governments including measures taken by the Federal or State governments to stimulate the economy; |
• | political, legislative or regulatory developments in Vermont, New Hampshire or the United States, including changes in laws concerning accounting, taxes, financial reporting, consumer protection, banking and other aspects of the financial services industry; |
• | further disruptions in U.S. and global financial and credit markets; |
• | economic instability or changes in business conditions globally, nationally, in Vermont, or in northwestern New Hampshire, including interest rate fluctuations, market fluctuations and perceptions, job creation and unemployment rates, ability to attract new business, and inflation or deflation and their effects on the Company or its customers; |
• | the creditworthiness of current loan customers is different from management's understanding or changes dramatically and therefore the allowance for loan losses becomes inadequate; |
• | the failure of assumptions underlying the establishment of the allowance for loan losses and estimations of values of collateral and various financial assets and liabilities; |
• | adverse changes in the local real estate market, which negatively impact collateral values and the Company's ability to recoup loan losses through disposition of real estate collateral; |
• | changes in the competitive environment for financial services organizations, including expanded powers and increased competition from tax-advantaged credit unions, mutual banks and out-of-market competitors offering financial services over the internet; |
• | impact of governmental interposition in financial services or other industries; |
Union Bankshares, Inc. 2010 Annual Report 46
• | acts or threats of terrorism or war and actions taken by the United States or other governments that might adversely affect business or economic conditions for the Company or its customers; |
• | the Company's ability to attract and retain key personnel; |
• | changes in technology, including demands for greater automation which could present operational issues or require significant capital outlays; |
• | the ability to generate additional capital and liquidity resources in the future on acceptable terms; |
• | unanticipated lower revenues or increased cost of funds, loss of customers or business, or higher operating expenses; |
• | uncontrollable increases in the cost of doing business, such as increased costs of Federal Deposit Insurance Corporation (FDIC) insurance for deposits or higher taxes, assessments, compliance or audit expense imposed by regulatory or legislative bodies; |
• | adverse changes in the securities market generally or in the market for financial institution securities which could adversely affect the value of the Company's stock; |
• | the failure of actuarial, investment, work force, salary and other assumptions underlying the establishment of reserves for future pension costs or changes in legislative or regulatory requirements affecting such costs; |
• | the amount invested in new business opportunities and the timing of these investments; |
• | future cash requirements might be higher than anticipated due to loan commitments or unused lines of credit being drawn upon or depositors withdrawing their funds at higher volumes or in different time frames than anticipated based on historical patterns and contractual terms; |
• | assumptions made regarding interest rate movement and sensitivity could vary substantially if actual experience differs from historical experience, which could adversely affect the Company's results of operations; |
• | the Company's ability to attract and retain deposits and loans; |
• | the implementation of international financial reporting standards (IFRS) for United States companies; |
• | illegal acts of theft or fraud perpetuated against the Company's subsidiary bank or its customers including online security breaches and computer viruses; |
• | any actual or alleged conduct which could harm the Company's reputation; |
• | natural or other disasters which could affect the ability of the Company to operate under normal conditions; |
• | loans and investments may be called or prepaid prior to their contractual maturity or become other than temporarily impaired; |
• | further expansion of fair value accounting by the Financial Accounting Standards Board (FASB) which could result in, among other things, volatility in reported asset values and earnings; |
• | regulatory limitations placed on income producing methods including the limiting of debit and credit card interchange fees and restricting of asset sales; |
• | ability of financial institutions to offer interest bearing transaction accounts to all customers as of July 21, 2011 and the resulting competitive impacts and the impact on the cost of deposits; |
• | further modification of the federal Transaction Account Guaranty Program (TAG program) providing unlimited deposit insurance for two years beginning January 1, 2011 which becomes mandatory for all banks and will no longer cover any interest bearing transaction accounts except IOLTA's; |
• | changes to the Company's and/ or the financial market operations resulting from the Dodd-Frank Wall Street Reform and Consumer Protection Act of 2010 (the Dodd-Frank Act or the Act); |
• | changes in monetary, regulatory or tax policy that could affect consumer behavior; increased accounting expense and administrative cost that could result from the adoption of a proposed Auditing Standard that would require the external auditor to issue a written report for each interim review; and |
• | changes in state foreclosure policies or procedures, which may result in delays in lien enforcement and additional costs. |
When evaluating forward-looking statements to make decisions with respect to the Company, investors and others are cautioned to consider these and other risks and uncertainties, including the events and circumstances discussed under “Recent Developments” below, and are reminded not to place undue reliance on such statements and should not consider any such list of factors to be a complete list of risks or uncertainties. Forward-looking statements speak only as of the date they are made and the Company undertakes no obligation to update them to reflect new or changed information or events, except as may be required by federal securities laws.
Union Bankshares, Inc. 2010 Annual Report 47
RECENT DEVELOPMENTS
In March 2011, the Company announced the purchase of three New Hampshire branch offices of Northway Bank. Union will assume approximately $80 million in deposits and $33 million in performing loans, subject to regulatory approval and routine adjustments prior to the expected second quarter 2011 closing, and will purchase the related Groveton and North Woodstock banking facilities, assume the lease for the Littleton location and offer the Northway branch employees their current branch positions.
Economic data continues to suggest a slow but positive trend towards economic recovery. Vermont's unemployment rate dropped throughout 2010 to 5.8% at year end. This rate compares favorably with that of the United States, which had a rate of 9.4%. Interest rates remain near historic lows which has allowed many consumers and commercial customers to reduce their monthly debt payments by refinancing their loans. Inflation appears controlled but recent global unrest and related rise in the price of oil may cause an inflationary spiral. Many financial institutions who accepted government support have repaid those funds and the U.S. financial markets appear to be operating more independently now. The positive growth in stock market values have also added to a boost in consumer confidence.
In response to the earlier financial crisis affecting the banking and financial markets, the resulting recession and the changing political environment; many new laws, regulations and programs have been adopted or proposed. We will not attempt to discuss them all within this annual report but will mention the ones that continue to have or will have a financial impact on the Company.
There have been some positive developments during the last year that have impacted the Company as follows:
• | The decision to permanently exclude, for smaller reporting companies, the requirement under the Sarbanes-Oxley Act for the preparation and inclusion in a filer's annual report of an independent auditor's attestation regarding the effectiveness of the Company's internal controls over financial reporting will keep the Company from incurring external audit fees related to an auditor's attestation. |
• | The decision to permanently increase the FDIC insurance limit from $100,000 to $250,000. |
• | The decision to continue to offer unlimited insurance coverage on noninterest bearing transaction accounts for all FDIC insured financial institutions until December 31, 2012. This also includes IOLTA accounts. |
• | The decision to change the FDIC insurance assessment base from total deposits to net assets will reduce the Company's future assessment costs and put community banks on a more level playing field with national and regional financial institutions. |
• | The decision to waive the 90 day recourse period upon the sale of SBA loans to the secondary market makes that a more attractive alternative for community banks. |
• | The FASB, citing outreach activities in which "almost all" constituents believe that amortized cost is significantly more relevant for purposes of measuring most loans, agreed to consider amortized cost as a primary attribute (in addition to fair value) for measuring financial instruments. Therefore loans and debt securities that are held as part of the "customer financing activities of a bank" may continue to be recorded at amortized cost. |
• | The receipt of an "outstanding" rating resulting from the FDIC examination of Union Bank under the Community Reinvestment Act during 2010. |
• | Starting in July 2011, banks will be permitted to pay interest on business checking accounts which may increase banks' overall cost of funds but will allow them to compete with nonbanks for these customer funds. |
• | The opening of the South Burlington, Vermont loan center in August 2010. |
There have been new laws, regulations and actions proposed or enacted during 2010 that may be problematic for the Company in terms of future earnings and/or efficiency. The following are the most relevant:
• | The Dodd-Frank Act represents the biggest re-write of financial regulation in decades and bankers are faced with an estimated 5,000 pages of new or expanded regulations as a result of the bill which will take several years to implement with the full impact on the banking industry not yet known. |
• | By March 15, 2012, all existing ATM's must meet the new Americans with Disabilities Act accessibility standards which will require the replacement of deployed nonconforming ATM's over the next twelve months. |
• | Under new Federal Reserve regulations effective in July 2010, banks can no longer charge fees to cover debit or ATM card overdrafts unless consumers have expressly consented. Those consumers who have not consented have their ATM or debit card transactions denied if there are not sufficient funds in the account. |
Union Bankshares, Inc. 2010 Annual Report 48
• | The establishment of the new Consumer Financial Protection Bureau during 2010 may lead to conflicting regulatory guidance for community banks and increase regulatory costs and burdens. |
• | The Dodd-Frank Act prohibits the inclusion of trust preferred securities in Tier I Capital of bank holding companies (subject to certain grandfathering and phase-ins), thereby limiting future capital funding alternatives. |
• | During 2010, the credit union industry received taxpayer assistance to resolve insolvent multi billion-dollar corporate credit unions despite the fact that credit unions do not pay any federal or state income taxes. Credit unions are also not required to reinvest in their communities. Credit unions' exemption from these rules has helped them to increase market share and double their business lending in the past five years. Community banks find it increasingly difficult to compete on this uneven playing field. |
• | State and national healthcare reform initiatives may increase employer costs to provide employer sponsored group health care plans to eligible employees. Also, the increased information reporting requirements under the 2010 Health-Care Reform Act will add additional operating costs for all businesses. |
• | The Dodd-Frank Act includes a provision (the Durbin amendment) which requires the Federal Reserve to set rates by April 21, 2011 to become effective July 21, 2011 for debit interchange fees. (There were more than 41 billion debit card transactions worldwide in 2010 up 28% from the previous year.) Even though banks with assets of $10 billion or less are exempt from this provision, in reality the rate set will become the new norm and will benefit the merchants at the expense of the banks and ultimately the consumers, as the rates being proposed are substantially below the cost of processing a transaction, which creates an unsustainable structure. |
• | In November 2010, the FDIC issued final overdraft payment supervisory guidance to be in place by July 1, 2011 requiring banks to promptly honor customers' requests to decline overdraft coverage from nonelectronic transactions, give consumers the opportunity to affirmatively choose the overdraft payment product that will best meet their needs, monitor accounts and take meaningful and effective action to limit overdraft use by customers as a form of short-term, high-cost credit, institute appropriate daily limits on overdraft fees and not process transactions in a manner designed to maximize the cost for consumers. According to research statistics, only 23% of consumers overdrew their accounts in the past year and most said they only paid one or two fees but banks must conform their practices in accordance with this new guidance. |
• | Among the new regulations imposed by the Dodd-Frank Act are new residential mortgage provisions that mandate more extensive disclosures, require lenders to offer terms that reasonably reflect the consumers' ability to repay a loan, prohibit mandatory arbitration provisions, add new customer protections for high-cost mortgages, set escrow account and appraisal standards and set credit risk retention requirements for companies who sell mortgage-backed securities and similar products. |
• | The Basel III Capital Framework published in December 2010 will increase minimum capital levels and add a new capital conservation buffer over the next nine years. Union Bankshares' ratios are well over those new minimums plus the buffer at December 31, 2010. Basel III will also implement a leverage ratio starting in 2013, a liquidity coverage ratio in 2015 and a net stable funding ratio in 2018 but these ratios have yet to be defined. |
Vermont continues to have one of the lowest residential foreclosure rates in the country. Also, as northern New England had not experienced the dramatic run up in housing prices, likewise, we have not seen the values drop as far as other parts of the country.
The cost of doing business as usual has increased dramatically in this regulatory environment as the number and extent of new regulations and the speed with which they must be implemented have put a strain on software providers and staff as well as customers. Also, the costs of mitigating long term interest rate risk by selling loans to the secondary market continued to increase during 2010 and it is anticipated that this cost will continue to grow as the government sponsored entities continue to work through their own financial problems.
Union is a member of FHLB of Boston with an investment of $1.9 million in its Class B common stock at December 31, 2010. The FHLB system is a cooperative that provides services to member banking institutions. The primary reason for joining the FHLB is to obtain funding. FHLB of Boston stock requirement is determined under an activity based formula that is directly proportional to the volume of funding. FHLB stock is bought and redeemed at par value. The FHLB of Boston adopted a revised retained earnings target, a repurchase moratorium on their Class B common stock, and a quarterly dividend payout restriction under their 2009 capital plan. These decisions limited the level of funds available under certain FHLB of Boston programs, affected the pricing of other programs and impacted the declaration and receipt of dividends by Union on its Class B common stock investment. On February 22, 2011 the FHLB of Boston announced that they have met their regulatory and internal minimum capital-to-assets ratio as of December 31, 2010, have declared a modest dividend to be paid March 2, 2011 to all members and have increased the Affordable Housing Program funds
Union Bankshares, Inc. 2010 Annual Report 49
available for 2011. On March 1, 2011, the 12 FHLB's entered into a Joint Capital Enhancement Agreement to enhance capital by building retained earnings for each FHLB and the FHLB system as a whole by allocating the 20 percent of its earnings previously paid to REFCorp to a restricted retained earnings account on its own balance sheet.
It is not completely clear at this time what impact current or future government sponsored programs, regulations or legislation will have on the Company, its customers or the U.S. and global financial markets but additional regulatory complexity and allocation of Company resources to deal with it is likely.
RISK FACTORS
The Company, like other financial institutions, is subject to a number of risks, many of which are outside of the Company's direct control, though efforts are made to manage those risks while optimizing returns. Managing those risks is an essential part of successfully managing a financial institution. Risk identification and monitoring are key elements in overall risk management. Among the risks assumed are: (1) credit risk, which is the risk that loan customers or other counterparties will be unable to perform their contractual obligations, (2) market risk, which is the risk that changes in market rates and prices will adversely affect the Company's financial condition or results of operation, (3) liquidity risk, which is the risk that the Company will have insufficient funds or access to funds to meet operational needs, (4) operational risk, which is the risk of loss resulting from inadequate or failed internal processes, people and systems, or from external events, and (5) regulatory risk, which is the risk of loss resulting from new or changing regulations which increases operating cost or restricts business practices.
CRITICAL ACCOUNTING POLICIES
The Company has established various accounting policies which govern the application of accounting principles generally accepted in the United States of America (GAAP) in the preparation of the Company's financial statements. Certain accounting policies involve significant judgments and assumptions by management which have a material impact on the reported amount of assets, liabilities, capital, revenues and expenses and related disclosures of contingent assets and liabilities in the consolidated financial statements and accompanying notes. The SEC has defined a company's critical accounting policies as the ones that are most important to the portrayal of the company's financial condition and results of operations, and which require the company to make its most difficult and subjective judgments, often as a result of the need to make estimates of matters that are inherently uncertain. Based on this definition, the Company has identified the accounting policies and judgments most critical to the Company. The judgments and assumptions used by management are based on historical experience and other factors, which are believed to be reasonable under the circumstances. Because of the nature of the judgments and assumptions made by management, actual results could differ from estimates and have a material impact on the carrying value of assets, liabilities, capital, or the results of operations of the Company.
Allowance for loan losses
The Company believes the allowance for loan losses is a critical accounting policy that requires the most significant judgments and estimates used in the preparation of its consolidated financial statements. Adequacy of the allowance for loan losses is determined quarterly using a consistent, systematic methodology, which analyzes the risk inherent in the loan portfolio. In addition to evaluating the collectability of specific loans when determining the adequacy of the allowance, management also takes into consideration other qualitative factors such as changes in the mix and size of the loan portfolio, historical loss experience, the amount of delinquencies and loans adversely classified, industry trends, and the impact of the local and regional economy on the Company's borrowers. Changes in these qualitative factors may cause management's estimate of the allowance for loan losses to increase or decrease and result in adjustments to the Company's provision for loan losses in future periods. For additional information, see FINANCIAL CONDITION- Allowance for Loan Losses below.
Other-than-temporary impairment of securities
Given the disruptions in the financial markets over the last three years, the decision to recognize other-than-temporary impairment on investment securities has become more difficult as complete information is not always available and market conditions and other relevant factors are subject to rapid changes. The other-than-temporary impairment decision is a critical accounting policy for the Company. Accounting guidance requires companies to perform periodic reviews of individual securities in their investment portfolios to determine whether a decline in the value of a security
Union Bankshares, Inc. 2010 Annual Report 50
is other-than-temporary. A review of other-than-temporary impairment requires companies to make certain judgments regarding the cause and materiality of the decline, its effect on the financial statements and the probability, extent and timing of a valuation recovery, the company's intent and ability to continue to hold the security, and, with respect to debt securities, the likelihood that the company will have to sell the security before its value recovers. Pursuant to these requirements, management assesses valuation declines to determine the extent to which such changes are attributable to (1) fundamental factors specific to the issuer, such as the nature of the issuer and its financial condition, business prospects or other factors or (2) market-related factors, such as interest rates or equity market declines. Declines in the fair value of securities below their costs that are deemed by management to be other-than-temporary are (1) if equity securities, recorded in earnings as realized losses and (2) if debt securities, recorded in earnings as realized losses to the extent they are deemed credit losses, with noncredit losses recorded in Other comprehensive income (loss). Once an other-than-temporary loss on a debt or equity security is realized, subsequent gains in the value of the security may not be recognized in income until the security is sold.
Pension liabilities
The Company's defined benefit pension obligations and net periodic benefit cost are actuarially determined based on the following assumptions: discount rate, current and estimated future return on plan assets, wage base rate, anticipated mortality rates, Consumer Price Index rate, and rate of increase in compensation levels. The determination of the pension benefit obligations and net periodic benefit cost is a critical accounting estimate as it requires the use of estimates and judgments related to the amount and timing of expected future cash outflows for benefit payments and cash inflows for maturities and returns on plan assets as well as Company contributions. Changes in estimates, assumptions and actual results could have a material impact on the Company's financial condition and/or results of operations.
Other
The Company also has other key accounting policies, which involve the use of estimates, judgments and assumptions, that are significant to understanding the results of operations, including the valuation of deferred tax assets, investment securities and other real estate owned (OREO). The most significant accounting policies followed by the Company are presented in Note 1 to the financial statements and in the section below under the caption “FINANCIAL CONDITION” and the subcaptions “Allowance for Loan Losses”, ”Investment Activities” and “Liability for Pension Benefits”. Although management believes that its estimates, assumptions and judgments are reasonable, they are based upon information presently available and can be impacted by events outside the control of the Company. Actual results may differ significantly from these estimates under different assumptions, judgments or conditions.
OVERVIEW
The Federal Reserve discount rate and the prime rate dropped 500 basis points from 8.25% between September 2007 to December 2008, resulting in a discount rate of 0.50% and a prime rate of 3.25%. The prime rate remained at 3.25% throughout 2009 and 2010 while the discount rate was raised from 0.50% to 0.75% in February 2010. The target federal funds range remained at the 0.00% to 0.25% range throughout 2010. This is the lowest that the prime rate has been since 1955. The combination of the low interest rates and the turmoil in the financial markets over the last three years has added to the challenging environment in which the Company and its sole subsidiary, Union, operates. A regulatory review of Union was satisfactorily completed during the fourth quarter of 2009 and a Community Reinvestment Act review in 2010 resulted in a rating of outstanding.
The Company's asset quality remained strong compared to the banking industry as a whole, when measured by net charge-offs of 0.07% to average loans not held for sale in 2010, and was down from 0.13% for the Company in 2009. Net income is up $360 thousand, or 6.9%, to $5.59 million for 2010 from $5.23 million for 2009. Earnings are still solid and above the peer group average with a return on average assets of 1.26% and a return on average equity of 13.37% for 2010. The Company also out-performed the SNL Bank $250 million-$500 million index for 2010 and over the last five years has had a higher total return performance than the SNL Bank $250 million-$500 million index.
Earnings per share increased to $1.25 in 2010 from $1.17 in 2009. Dividends per share of $1.00 were paid out in both 2010 and in 2009. The Company remained well capitalized under regulatory guidelines after payment of dividends. The Company's return on average equity improved in 2010 to 13.37% from 2009 at 13.29%. The Company's capital position was strengthened due to stronger earnings.
Union Bankshares, Inc. 2010 Annual Report 51
Historically, the largest and most variable source of income for the Company is net interest income. The results of operations for the years ended December 31, 2010 and 2009 reflect the impact of changes in rates as well as growth in the volume and change in composition of both interest earning assets and interest bearing liabilities during these periods.
The Company's assets continued to grow $10.5 million, or 2.4%, during 2010 to an average of $443.6 million from $433.2 million in 2009. Net interest income increased from $17.92 million in 2009 to $18.79 million in 2010. The net $868 thousand increase resulted from two factors; (1) an increase between years of $160 thousand due to the cumulative effect of the decrease in rates paid on interest bearing liabilities over and above the decrease in rates earned on interest earning assets, and (2) an increase of $708 thousand between years due to the increased volume of interest earning assets over and above the increased volume of interest bearing liabilities. See Yields Earned and Rates Paid and the Rate/ Volume Analysis tables on page 55 and page 56, respectively, for further details.
The Company opened a loan center in South Burlington, Vermont during the second half of 2010 which has resulted in real estate loan growth in that market. Average earning assets grew from $408.6 million in 2009 to $418.0 million in 2010, or 2.3%. Residential loan originations exceeded $71 million in 2010 compared to originations of $78 million in 2009, and new commercial real estate loan growth was strong. The Company continued to manage growth and interest rate risk during 2010 through the sale of $51.3 million in long-term fixed-rate residential loans, the sale of $1.1 million in commercial real estate loans and the participation of $10.3 million in commercial real estate loans. The Company also sold its consumer credit card portfolio of $294 thousand during the fourth quarter of 2010 as it was no longer profitable to retain. The Company realized $1.0 million in net gains on sales of loans held for sale in 2010 compared to $970 thousand in 2009 but these gains were partially offset by higher fees paid to sell loans in the secondary market of $294 thousand in 2010 compared to $272 thousand in 2009. The historically low prime rate throughout 2010 helped to drive customer refinancings and produce the 10 basis point, or 2.2%, increase in the net interest margin to 4.62% for 2010 as compared to 4.52% for 2009.
Despite the weakening economy, loan demand was strong in 2010, with total loan growth of $23.9 million, or 6.7%, over 2009, net of loan sales of $52.7 million in 2010 compared to loan sales of $60.4 million for 2009. Residential real estate loans grew $8.6 million, or 7.0%, net of loans sold, commercial real estate loans grew $8.0 million, or 5.0%, commercial loans grew $5.0 million, or 32.1%, and municipal loans grew $7.6 million, or 31.8%. Loans in nonaccrual status were down between years at $2.8 million at December 31, 2010 versus $3.7 million at December 31, 2009. Other nonperforming loans increased to $806 thousand at December 31, 2010 from $538 thousand at December 31, 2009; $129 thousand of those loans at December 31, 2010 were covered by guarantees of U.S. government agencies. The ratio of net charge-offs to average loans not held for sale was 0.07% for 2010 compared to 0.13% for 2009. The Company's ratio of allowance for loan losses to loans not held for sale was 1.00% at both December 31, 2010 and 2009. The ratio of allowance for loan losses to nonperforming loans has increased to 104.36% at December 31, 2010 from 81.69% at December 31, 2009. The increase in the 2010 provision to $520 thousand from $400 thousand in 2009 reflects the increased volume of loans, the composition of the loan portfolio, net charge offs, the general economy and management's assessment of credit quality.
Deposits at year end, December 31, 2010 were up $7.8 million, or 2.1%. Average deposit growth for the year was $10.6 million, or 3.0%, as the economic turmoil and volatile financial markets over the last three years sent deposit dollars back to the safety of FDIC insured depository institutions and the stability of a local community bank. The growth in average deposits was $26.1 million, or 7.9%, in 2009. Interest rates paid on deposits and interest rates earned on loans have dropped steadily over the last twenty seven months and these factors combined to increase the net interest spread 17 basis points from 4.22% in 2009 to 4.39% in 2010, as the average rate paid on interest bearing liabilities dropped 38 basis points from 1.59% to 1.21% from 2009 to 2010, while the average rate earned on interest earning assets dropped 21 basis points from 5.81% to 5.60% over the same time frame. The Company increased the average volume in all categories of interest earning assets except federal funds sold. The growth in deposits was utilized to support the growth in interest-earning assets.
The Company continues to focus on customer service and its core business of community banking to provide products and services to the communities it serves, including the market for its newest branches in Danville and St. Albans, Vermont, as well as the loan center in South Burlington, Vermont which opened in August 2010, and to enhance the delivery of products and services by adopting new technologies as appropriate.
Union Bankshares, Inc. 2010 Annual Report 52
The Company's pension benefit obligations and net periodic benefit cost are actuarially determined annually by an independent, certified actuary. The Company had a prepaid expense of $1.1 million and an unfunded liability for pension benefits for its defined benefit pension plan of $3.5 million at December 31, 2010, resulting in a net liability of $2.4 million. At December 31, 2009, there was an prepaid expense of $609 thousand and an unfunded pension liability of $3.0 million for a net liability of $2.4 million. The main reason for the increase in the prepaid expense between years was attributable to the $1.25 million contribution to the plan by the Company in 2010. The main reason for the increase in the liability for the defined benefit pension plan was the increase in the unrealized actuarial loss on investment assets held from $3.0 million at December 31, 2009 to $3.5 million at December 31, 2010, which was mainly driven by the decrease in the discount rate utilized to determine the benefit obligations from 6.00% at December 31, 2009 to 5.56% at December 31, 2010. The 2010 actuarially computed net periodic benefit cost expensed in 2010 was $769 thousand compared to $1.1 million in 2009, or a decrease of 29.2%. The accounting requirements mandate that all calculations are as of the last day of the fiscal year. With the 2010 contribution and the improved market values at December 31, 2010, the 2011 expense will be $833 thousand compared to the 2010 expense of $769 thousand and the 2009 expense of $1.1 million. See Liability for Pension Benefits on Page 71 for further information.
The regulatory environment of the past few years, including the federal Sarbanes-Oxley Act of 2002 and the changes discussed in Recent Developments, has placed an extensive burden on small publicly traded companies as there are few significant differences in the requirements because of size, complexity of operations and products, nor is any relief provided to banking companies despite the significant regulatory oversight to which the banking industry is already subject from states, the FDIC and the Federal Reserve. The additional requirements add to operating costs and divert management somewhat from the objectives of growing and strengthening the business. Banks also spend a significant amount of time and dollars complying with the US Patriot Act and the Bank Secrecy Act to protect the U.S. financial system and their customers against identity theft, anti-money laundering, and terrorism. The cost of doing business as a community bank continued to increase throughout 2010 and the announced changes for 2011 and beyond, will exacerbate that trend.
The following per share information and key ratios depict several measurements of performance or financial condition for or at the years ended December 31, 2010 and 2009, respectively:
2010 | 2009 | |||||
Return on average assets (ROA) | 1.26 | % | 1.21 | % | ||
Return on average equity (ROE) | 13.37 | % | 13.29 | % | ||
Net interest margin (1) | 4.62 | % | 4.52 | % | ||
Efficiency ratio (2) | 67.32 | % | 69.16 | % | ||
Net interest spread (3) | 4.39 | % | 4.22 | % | ||
Total loans to deposits ratio | 101.39 | % | 97.09 | % | ||
Net loan charge-offs to average loans not held for sale | 0.07 | % | 0.13 | % | ||
Allowance for loan losses to loans not held for sale | 1.00 | % | 1.00 | % | ||
Nonperforming assets to total assets (4) | 1.15 | % | 1.15 | % | ||
Equity to assets | 9.19 | % | 9.20 | % | ||
Total capital to risk weighted assets | 15.12 | % | 15.30 | % | ||
Book value per share | $ | 9.36 | $ | 9.23 | ||
Earnings per share | $ | 1.25 | $ | 1.17 | ||
Dividends paid per share | $ | 1.00 | $ | 1.00 | ||
Dividend payout ratio (5) | 80 | % | 85.47 | % | ||
(1) | The ratio of tax equivalent net interest income to average earning assets. See page 54 for more information. |
(2) | The ratio of noninterest expense ($16,914,745 in 2010 and $16,397,173 in 2009) to tax equivalent net interest income ($19,289,723 in 2010 and $18,444,626 in 2009) and noninterest income ($5,934,250 in 2010 and $5,521,307 in 2009), excluding securities gains ($97,956 in 2010 and $257,546 in 2009). |
(3) | The difference between the average rate earned on earning assets and the average rate paid on interest bearing liabilities. See page 55 for more information. |
(4) | Nonperforming assets are loans or investment securities that are in nonaccrual or 90 or more days past due as well as other real estate or assets owned. |
(5) | Cash dividends declared and paid per share divided by consolidated net income per share. |
Union Bankshares, Inc. 2010 Annual Report 53
RESULTS OF OPERATIONS
The Company's net income for the year ended December 31, 2010, was $5.59 million compared with net income of $5.23 million for the year 2009. Pressure on the net interest margin continued due to the prevailing low interest rate environment but the Company was able to improve the net interest margin 10 basis points from 4.52% for 2009 to 4.62% for 2010. Earnings per share increased to $1.25 in 2010 from $1.17 in 2009, reflecting the combined effect of the following income and expense items: Net interest income increased $868 thousand, or 4.8%, with a 2.3% growth in average interest earning assets, accounting for a 13¢ increase in earnings per share. The Provision for loan losses increased $120 thousand, or 30.0%, accounting for a 2¢ decrease in earnings per share. Noninterest income increased $413 thousand, or 7.5%, accounting for a 5¢ increase in earnings per share. Non interest expense increased $518 thousand, or 3.2%, accounting for an 8¢ decrease in earnings per share. Federal income tax credits decreased $45 thousand, or 3.2%, accounting for a 1¢ decrease in earnings per share.
Net Interest Income. The largest component of the Company's operating income is net interest income, which is the difference between interest and dividend income received from interest earning assets and the interest expense paid on interest bearing liabilities. The Company's level of net interest income can fluctuate over time due to changes in the level and mix of interest earning assets and interest bearing liabilities and from changes in the yields earned and costs of funds. The Company's net interest income increased $868 thousand, or 4.8%, to $18.79 million for the year ended December 31, 2010 from $17.92 million for the year ended December 31, 2009. This increase was due primarily to the decrease in interest expense of $1.18 million from $5.29 million in 2009 to $4.12 million in 2010, which more than offset the decrease in interest income of $309 thousand from $23.22 million in 2009 to $22.91 million in 2010. The decrease in 2010 interest income reflected the historically low 3.25% prime rate that prevailed throughout the year, as adjustable rate loans repriced at lower rates, existing loans were refinanced and new loans originated at lower rates. The effect of this decrease in yield was partially offset by the growth in average interest earning assets to $418.0 million in 2010 from $408.6 million in 2009.
On average for the year, 94.2% of assets earned interest in 2010 versus 94.3% in 2009. The net interest spread increased to 4.39% for the year ended December 31, 2010, from 4.22% for the year ended December 31, 2009, despite the continued low flat interest rate environment where deposit rates have continued to drop. The net interest margin for the 2010 period increased 10 basis points to 4.62% from 4.52% for the 2009 period.
Yields Earned and Rates Paid. The following table shows for the periods indicated the total amount of income recorded from average interest earning assets, the related average tax equivalent yields, the interest expense associated with average interest bearing liabilities, the related average rates paid and the resulting tax equivalent net interest spread and margin. Yield and rate information is average information for the year, and is calculated by dividing the tax equivalent income or expense item for the year by the average balance of the appropriate balance sheet item for that year. Net interest margin is tax equivalent net interest income divided by average earning assets. Nonaccrual loans or investments are included in asset balances for the appropriate periods, but recognition of interest on such loans or investments is discontinued and any remaining accrued interest receivable is reversed, in conformity with federal regulations.
Tax-exempt interest income amounted to $1.2 million for both the years ended December 31, 2010 and 2009. The following table presents the effect of tax-exempt income on the calculation of the net interest margin, using a marginal tax rate of 34% for 2010 and 2009:
Years Ended December 31, | ||||||
2010 | 2009 | |||||
(Dollars in thousands) | ||||||
Net interest income as presented | $ | 18,790 | $ | 17,922 | ||
Effect of tax-exempt interest | ||||||
Investment securities | 126 | 128 | ||||
Loans | 374 | 394 | ||||
Net interest income, tax equivalent | $ | 19,290 | $ | 18,444 | ||
Union Bankshares, Inc. 2010 Annual Report 54
Years ended December 31, | ||||||||||||||||
2010 | 2009 | |||||||||||||||
Average Balance | Income/ Expense | Average Yield/Rate | Average Balance | Income/ Expense | Average Yield/Rate | |||||||||||
(Dollars in thousands) | ||||||||||||||||
Average Assets | ||||||||||||||||
Federal funds sold and overnight deposits | $ | 13,390 | $ | 22 | 0.16 | % | $ | 14,451 | $ | 25 | 0.17 | % | ||||
Interest bearing deposits in banks | 17,852 | 411 | 2.30 | % | 16,372 | 484 | 2.96 | % | ||||||||
Investment securities (1), (2) | 24,564 | 1,012 | 4.63 | % | 24,104 | 1,148 | 5.30 | % | ||||||||
Loans, net (1), (3) | 360,261 | 21,462 | 6.06 | % | 351,796 | 21,559 | 6.24 | % | ||||||||
FHLB of Boston stock (4) | 1,922 | — | — | 1,922 | — | — | ||||||||||
Total interest earning assets (1) | 417,989 | 22,907 | 5.60 | % | 408,645 | 23,216 | 5.81 | % | ||||||||
Cash and due from banks | 5,097 | 5,280 | ||||||||||||||
Premises and equipment | 7,915 | 7,485 | ||||||||||||||
Other assets | 12,637 | 11,755 | ||||||||||||||
Total assets | $ | 443,638 | $ | 433,165 | ||||||||||||
Average Liabilities and Stockholders' Equity | ||||||||||||||||
NOW accounts | $ | 62,094 | $ | 139 | 0.22 | % | $ | 61,727 | $ | 159 | 0.26 | % | ||||
Savings/money market accounts | 120,469 | 624 | 0.52 | % | 105,372 | 658 | 0.62 | % | ||||||||
Time deposits | 130,384 | 2,214 | 1.70 | % | 138,140 | 3,300 | 2.39 | % | ||||||||
Borrowed funds | 27,066 | 1,140 | 4.16 | % | 27,667 | 1,177 | 4.20 | % | ||||||||
Total interest bearing liabilities | 340,013 | 4,117 | 1.21 | % | 332,906 | 5,294 | 1.59 | % | ||||||||
Noninterest bearing deposits | 55,829 | 52,890 | ||||||||||||||
Other liabilities | 6,019 | 8,041 | ||||||||||||||
Total liabilities | 401,861 | 393,837 | ||||||||||||||
Stockholders' equity | 41,777 | 39,328 | ||||||||||||||
Total liabilities and Stockholders' equity | $ | 443,638 | $ | 433,165 | ||||||||||||
Net interest income | $ | 18,790 | $ | 17,922 | ||||||||||||
Net interest spread (1) | 4.39 | % | 4.22 | % | ||||||||||||
Net interest margin (1) | 4.62 | % | 4.52 | % | ||||||||||||
(1) | Average yields reported on a tax equivalent basis using a marginal tax rate of 34%. |
(2) | Average balances of investment securities are calculated on the amortized cost basis and include nonaccrual securities if applicable. |
(3) | Includes loans held for sale as well as nonaccrual loans and unamortized costs and is net of the allowance for loan losses. |
(4) | Dividends on the Federal Home Loan Bank (FHLB) of Boston stock were suspended effective the fourth quarter of 2008 but will resume in March 2011. |
Union Bankshares, Inc. 2010 Annual Report 55
Rate/Volume Analysis. The following table describes the extent to which changes in average interest rates (on a fully tax-equivalent basis) and changes in volume of average interest earning assets and interest bearing liabilities have affected the Company's interest income and interest expense during the period indicated. For each category of interest earning assets and interest bearing liabilities, information is provided on changes attributable to:
• | changes in volume (change in volume multiplied by prior rate); |
• | changes in rate (change in rate multiplied by prior volume); and |
• | total change in rate and volume. |
Changes attributable to both rate and volume have been allocated proportionately to the change due to volume and the change due to rate.
Year ended December 31, 2010 | |||||||||
Compared to Year ended | |||||||||
December 31, 2009 | |||||||||
Increase/(Decrease) Due to Change In | |||||||||
Volume | Rate | Net | |||||||
(Dollars in thousands) | |||||||||
Interest earning assets | |||||||||
Federal funds sold and overnight deposits | $ | (2 | ) | $ | (1 | ) | $ | (3 | ) |
Interest bearing deposits in banks | 41 | (114 | ) | (73 | ) | ||||
Investment securities | 25 | (161 | ) | (136 | ) | ||||
Loans, net | 530 | (627 | ) | (97 | ) | ||||
Total interest earning assets | $ | 594 | $ | (903 | ) | $ | (309 | ) | |
Interest bearing liabilities | |||||||||
NOW accounts | $ | 1 | $ | (21 | ) | $ | (20 | ) | |
Savings/money market accounts | 87 | (121 | ) | (34 | ) | ||||
Time deposits | (176 | ) | (910 | ) | (1,086 | ) | |||
Borrowed funds | (26 | ) | (11 | ) | (37 | ) | |||
Total interest bearing liabilities | $ | (114 | ) | $ | (1,063 | ) | $ | (1,177 | ) |
Net change in net interest income | $ | 708 | $ | 160 | 868 | ||||
Interest and Dividend Income. The Company's interest and dividend income decreased $309 thousand, or 1.3%, to $22.91 million for the year ended December 31, 2010 from $23.22 million for the year ended December 31, 2009. Average earning assets increased $9.3 million, or 2.3%, from $408.6 million at December 31, 2009 to $418.0 million at December 31, 2010. Average loans were $360.3 million for the year ended December 31, 2010 compared to $351.8 million for the year ended December 31, 2009, which is an increase of $8.5 million, or 2.4%. The increase in volume in average commercial construction and commercial real estate loans was partially offset by the modest slowdown in the origination of residential construction loans and the continuing sales of residential loans to mitigate long-term interest rate risk. The average yield on the loan portfolio decreased from 6.24% for the year ended December 31, 2009, to 6.06% for the year ended December 31, 2010, or a decrease of 18 basis points, as the prime rate remained flat at 3.25% for 2010 and 2009. The continued low rate environment throughout 2010 resulted in many customers refinancing or new customers receiving loans at lower interest rates while at the same time adjustable rate loans repriced downward. This yield reduction accounted for a $627 thousand drop in loan interest income, which was partially offset by an increase of $530 thousand due to increased volume resulting in total loan interest income of $21.46 million for 2010 compared to $21.56 million for 2009.
The average balance of investment securities (including mortgage-backed securities) increased $460 thousand, or 1.9%, from $24.1 million for the year ended December 31, 2009 to $24.6 million for the year ended December 31, 2010. The yield on the investment portfolio decreased from 5.30% for 2009 to 4.63% for 2010, or 67 basis points. The average level of federal funds sold and overnight deposits decreased $1.1 million, or 7.3%, from $14.5 million for the year ended December 31, 2009 to $13.4 million for the year ended December 31, 2010. The average yield on federal funds sold and overnight deposits decreased from 0.17% for 2009 to 0.16% for 2010, as the Federal Funds target rate set by
Union Bankshares, Inc. 2010 Annual Report 56
the Federal Open Market Committee of the Federal Reserve dropped to between 0.00% and 0.25% in late 2008 and stayed at that level throughout 2009 and 2010. The average balance of interest bearing deposits in banks increased $1.5 million, or 9.0%, to $17.9 million for the year ended December 31, 2010 from $16.4 million for the year ended December 31, 2009. These deposits are FDIC insured. The average yield on interest bearing deposits in banks decreased from 2.96% for 2009 to 2.30% for 2010, or 66 basis points, reflecting the rate environment during the last two years and the shortness of the duration of the portfolio as we anticipate an eventual rise in interest rates. The FHLB of Boston implemented a quarterly dividend restriction under their 2009 capital plan which eliminated the dividends received by Union Bank on its Class B common stock investment, both in 2009 and 2010. However, the FHLB of Boston declared a modest dividend payable in March 2011. Interest income from nonloan instruments decreased $212 thousand, or 12.8%, between years, with $1.44 million in income for 2010 compared to $1.66 million for 2009, reflecting the overall decrease in average yields on all categories. The average volume of nonloan interest bearing asset categories increased from $56.8 million for the year ended December 31, 2009 to $57.7 million for the year ended December 31, 2010 but the increased volume was not enough to offset the drop in yields.
Interest Expense. The Company's interest expense decreased $1.18 million, or 22.2%, from $5.29 million for the year ended December 31, 2009 to $4.12 million for the year ended December 31, 2010. Interest rates paid in 2010 decreased for all categories of interest bearing liabilities as interest rates dropped significantly during the last two years as it became apparent that the low interest rate environment was not going to be of a short duration. Average interest bearing liabilities increased $7.1 million, or 2.1%, from $332.9 million for the year ended December 31, 2009 to $340.0 million for the year ended December 31, 2010. Average NOW accounts increased $367 thousand, or 0.6%, from $61.7 million for the year ended December 31, 2009 to $62.1 million for the year ended December 31, 2010. The average balances of savings and money market accounts increased $15.1 million, or 14.3%, from $105.4 million for the year ended December 31, 2009 to $120.5 million for the year ended December 31, 2010. Average time deposits decreased $7.8 million, or 5.6%, to $130.4 million for 2010 from $138.1 million for 2009. The average rate paid on interest bearing deposits decreased 39 basis points from 1.34% in 2009 to 0.95% in 2010. The average balance of borrowed funds decreased $601 thousand, or 2.2%, from $27.7 million for the year ended December 31, 2009, to $27.1 million for the year ended December 31, 2010. The average rate paid for borrowed funds decreased from 4.20% for the year ended December 31, 2009 to 4.16% for the year ended December 31, 2010.
Provision for Loan Losses. The provision for loan losses increased from $400 thousand in 2009 to $520 thousand in 2010 due to the increased loan volume in 2010 and management's evaluation of the collectability of the loan portfolio through its assessment of credit quality, composition and size of the loan portfolio, historical loss experience and current economic conditions and risks, including the impact of the increased loan demand, the real estate market in our region, and general economic conditions. Refer to Asset Quality and Allowance for Loan Losses sections below for more in depth discussion.
Noninterest Income. The following table sets forth changes from 2009 to 2010 for the components of noninterest income:
For The Years Ended December 31, | |||||||||||
2010 | 2009 | $ Variance | % Variance | ||||||||
(Dollars in thousands) | |||||||||||
Trust income | $ | 481 | $ | 379 | $ | 102 | 27.0 | ||||
Service fees | 4,028 | 3,600 | 428 | 11.9 | |||||||
Net gains on sales of loans held for sale | 1,030 | 969 | 61 | 6.2 | |||||||
Other | 297 | 315 | (18 | ) | (5.6 | ) | |||||
Subtotal | 5,836 | 5,263 | 573 | 10.9 | |||||||
Net gains on sales of investment securities | 98 | 258 | (160 | ) | (62.0 | ) | |||||
Total noninterest income | $ | 5,934 | $ | 5,521 | $ | 413 | 7.5 | ||||
Noninterest income before gains, losses and write-downs on investment securities available-for-sale was $5.84 million, or 20.2%, of total income for the year ended December 31, 2010 compared to $5.26 million, or 18.3%, of total income for the year ended December 31, 2009. This increase between years is due to increased income in every category except Other income.
Union Bankshares, Inc. 2010 Annual Report 57
Trust income. The increase in trust income for 2010 compared to 2009 was primarily due to the increase in assets under management as well as the increase in the market value of total assets managed due to the strong performance of equity securities in 2010.
Service fees. The increase in service fees for 2010 compared to 2009 was primarily due to the increase in ATM/Debit card fees and related interchange income which in total rose from $945 thousand in 2009 to $1.34 million in 2010. A main reason for this increase was due to a change in the billing breakdown from net fees to gross fees from the servicer (the reader will note an increased expense for these services in other noninterest expense discussed below) as well as the growth in the volume of electronic transactions. There was also an increase of $59 thousand, or 15.9%, in loan servicing fees from $370 thousand for 2009 to $429
thousand for 2010 due to the increased volume of loans serviced for third parties. Also, there was an increase in merchant program income from $433 thousand in 2009 to $468 thousand in 2010 due to the increase in merchant transactions. These increases were partially offset by a drop in overdraft fees from $1.20 million in 2009 to $1.16 million in 2010 and a drop in service charges on deposit accounts from $238 thousand for 2009 to $209 thousand for 2010 as it appears that our customers were more fiscally responsible with their account management in 2010.
As noted above under "Recent Developments" new price controls on interchange fees mandated by the Dodd-Frank Act are likely to adversely affect this source of revenue in future periods.
Net gains on sales of loans held for sale. Net gains increased from 2009 to 2010 by $61 thousand, or 6.2%, despite the drop in total loans sold to $52.7 million in 2010 from $60.4 million in 2009 as gains were stronger in 2010 due to the continuing low rate environment.
Other. The decrease between 2010 and 2009 is primarily due to the $81 thousand decrease in net mortgage servicing rights due to the decrease in loans sold during 2010 partially offset by the $24 thousand increase in income from sales of gas royalties and oil leases and the $37 thousand in income from the purchase and utilization of state tax credits.
Net gains on sales of investment securities. Available-for-sale debt securities of $1.1 million were sold in 2010 for a gain of $98 thousand compared to available-for-sale debt securities totaling $4.5 million sold in 2009 for a net gain of $258 thousand.
Noninterest expense. The following table sets forth changes from 2009 to 2010 for the components of noninterest expense:
For The Years Ended December 31, | |||||||||||
2010 | 2009 | $ Variance | % Variance | ||||||||
(Dollars in thousands) | |||||||||||
Salaries and wages | $ | 6,559 | $ | 6,097 | $ | 462 | 7.6 | ||||
Pension and other employee benefits | 2,828 | 2,924 | (96 | ) | (3.3 | ) | |||||
Occupancy expense, net | 937 | 957 | (20 | ) | (2.1 | ) | |||||
Equipment expense | 1,057 | 1,110 | (53 | ) | (4.8 | ) | |||||
Supplies and printing | 319 | 304 | 15 | 4.9 | |||||||
Communications | 261 | 227 | 34 | 15.0 | |||||||
Postage and shipping | 240 | 230 | 10 | 4.3 | |||||||
ATM and debit card expense | 447 | 252 | 195 | 77.4 | |||||||
Professional fees | 355 | 301 | 54 | 17.9 | |||||||
Director and advisory board fees | 299 | 279 | 20 | 7.2 | |||||||
Advertising and public relations | 283 | 234 | 49 | 20.9 | |||||||
Vermont franchise tax | 414 | 396 | 18 | 4.6 | |||||||
FDIC insurance assessment | 499 | 684 | (185 | ) | (27.1 | ) | |||||
Expenses of other real estate owned, net | 241 | 281 | (40 | ) | (14.2 | ) | |||||
Fees paid to sell loans in secondary market | 294 | 272 | 22 | 8.1 | |||||||
Equity in losses of limited partnerships | 426 | 426 | — | — | |||||||
Other expenses | 1,456 | 1,423 | 33 | 2.3 | |||||||
Total noninterest expense | $ | 16,915 | $ | 16,397 | $ | 518 | 3.2 | ||||
Union Bankshares, Inc. 2010 Annual Report 58
Salaries and wages. The salaries and wages increase in 2010 over 2009 was due primarily to regular salary activity, the increase in staffing for the new South Burlington, Vermont loan center opened in the third quarter of 2010, the addition of a number of new positions due to growth and increasing regulatory requirements and the reduction between years in deferred loan origination costs which offset current salary expense.
Pension and employee benefits. The majority of the decrease was due to the $317 thousand decrease from $1.1 million for 2009 to $769 thousand for 2010 in the cost of the defined benefit pension plan, which represents the actuarily computed pension expense for the year determined as of the last day of the previous calendar year. The Company contribution of $2.1 million to the plan for 2009 contributed to the lower expense for 2010. An offsetting increase between years was the increase in the cost of the fully insured health plan of $189 thousand from $1.0 million for 2009 to $1.2 million for 2010. The majority of that increase was due
to the $156 thousand of credits to the expense account in 2009 as the Company was able to eliminate the unused reserve that had been established in prior years for the Company's self-insured health plan.
Equipment expense. The decrease in equipment expense for 2010 versus 2009 was primarily due to decreased depreciation expense and a reduction in the losses on the disposal of fixed assets.
ATM and debit card expense. The increase between 2009 and 2010 is mainly due to the increase of $195 thousand in ATM/debit card expenses due to the vendors' new gross billing system referred to above, as well as the growth in volume of electronic transactions.
Professional fees. Professional fees increased between years due to the executive search for a new Bank president, the utilization of a professional mailing service for all of 2010 compared to only eight months in 2009, increased audit fees due to growth and the complexity of new accounting pronouncements and for consulting services regarding the Company's salary and benefit packages.
Advertising and public relations. The increase between years of $49 thousand, or 20.9%, is mainly due to outsourcing advertising and public relations to a professional firm who has assisted in the development of a strategic marketing plan including the updating of Union Bank's website at www.unionbankvt.com.
Fees paid to sell loans in secondary markets. The volume of loans sold decreased from $60.4 million in 2009 to $52.7 million in 2010 but the loan fee expense increased from $272 thousand to $294 thousand between years due to new and higher fees imposed by The Federal Home Loan Mortgage Association (Freddie Mac) in 2010.
FDIC Insurance Assessment. The majority of the decrease between 2009 and 2010 was due to the special assessment of $191 thousand in 2009. This was partially offset by the growth in deposits.
Income Tax Expense. The Company has provided for estimated current and deferred federal income taxes for the current and all prior periods presented. The Company's provision for income taxes increased to $1.70 million for 2010 from $1.42 million for 2009. This is mainly the result of the increase in federal income taxes from increased taxable income and lower federal tax credits from investments in affordable housing limited partnerships. The federal tax credits totaled $380 thousand in 2010 versus $425 thousand in 2009. The Company's effective tax rate for 2010 was 23.4% compared to 21.4% for 2009.
FINANCIAL CONDITION
At December 31, 2010, the Company had total consolidated assets of $454.1 million, including gross loans and loans held for sale (“total loans”) of $381.9 million, deposits of $376.7 million and stockholders' equity of $41.7 million. Based on the most recent information published by the Vermont Banking Commissioner, in terms of total assets at December 31, 2010, Union Bank ranked as the fifth largest institution of the fourteen commercial banks and savings institutions headquartered in Vermont.
The Company's total assets increased by $6.6 million, or 1.5%, to $454.1 million at December 31, 2010 from $447.5 million at December 31, 2009. Total net loans and loans held for sale increased by $23.6 million, or 6.7%, to $378.3 million, representing 83.3% of total assets at December 31, 2010 as compared to $354.7 million, or 79.3%, of total
Union Bankshares, Inc. 2010 Annual Report 59
assets at December 31, 2009. The increase in 2010 resulted mainly from growth of $8.0 million in commercial real estate loans, $8.6 million in residential real estate loans, $5.0 million in commercial loans and $7.6 million in municipal loans. These increases were offset in part by a decrease of $812 thousand in construction real estate loans and $921 thousand in consumer loans. Loan demand was strong during the year but growth of the loan portfolio was moderated significantly by management's decision to continue to sell the majority of qualified lower rate residential loans into the secondary market during 2010 to mitigate future interest rate risk and to participate out or sell some commercial real estate loans to mitigate the level of credit and interest rate risk.
Cash and due from banks increased slightly from $4.9 million at December 31, 2009 to $5.4 million at December 31, 2010. Federal funds sold and overnight deposits decreased $8.3 million to $8.8 million at December 31, 2010 from $17.2 million at December 31, 2009. Interest bearing deposits in banks decreased $8.9 million, or 38.9%, from $23.0 million at December 31, 2009 to $14.0 million at December 31, 2010 as maturing deposits were used to fund loan demand. Investment securities available-for-sale decreased $869 thousand, or 3.5%, from $24.6 million at December 31, 2009 to $23.8 million at December 31, 2010. The Company added $500 thousand in investment securities held-to-maturity during 2010. Total nonloan interest bearing assets dropped to 10.9% of total assets at December 31, 2010 compared to 14.9% at December 31, 2009 as maturing assets were utilized to fund loan demand.
Total deposits increased $7.8 million, or 2.1%, to $376.7 million at December 31, 2010 from $368.8 million at December 31, 2009. Noninterest bearing deposits increased 7.3%, or $4.4 million, from $60.1 million at December 31, 2009 to $64.5 million at December 31, 2010. Interest bearing deposits increased 1.1%, or $3.4 million, from $308.7 million to $312.1 million during the same time frame. It appears that the financial and credit market turmoil of the last few years and the increased FDIC insurance coverage has made it easier to attract and retain deposits, despite the low rates paid, as average deposits grew $10.6 million, or 3.0% in 2010. However, the long-term outlook for bank deposit gathering is unclear as even some government sponsored agencies are being allowed to offer deposit accounts to consumers directly in order to collect deposits to fund their lending and investment activities.
Borrowed funds from the FHLB of Boston decreased $2.0 million, or 6.5%, to $29.0 million at December 31, 2010 from $31.0 million at December 31, 2009 as Union Bank paid off a short term liquidity advance in early 2010 of $5.4 million which was partially offset by match funding commercial real estate loans late in 2010 to lock in the interest rate spread for the life of the loan and an end of the year $2.0 million short term liquidity advance.
Total stockholders' equity increased by $545 thousand, or 1.3%, to $41.7 million at December 31, 2010 from $41.2 million at December 31, 2009. This increase reflected the combined effect of net income of $5.6 million, a $25 thousand increase due to stock based compensation, a decrease of $184 thousand in the net unrealized holding gain on investment securities available-for-sale component, an increase of $326 thousand in the net unfunded defined benefit pension liability component of other comprehensive income (loss), cash dividend payments of $4.5 million and the purchase of treasury stock for $99 thousand.
Loan Portfolio. The Company's loan portfolio (including loans held for sale) primarily consists of adjustable- and fixed-rate mortgage loans secured by one-to-four family, multifamily and commercial real estate loans. As of December 31, 2010, the gross loan portfolio totaled $381.9 million, or 84.1%, of assets compared to $358.1 million, or 80.0%, of assets as of December 31, 2009. Total loans have increased $23.8 million, or 6.6%, since December 31, 2009, despite the sale of $52.7 million of loans held for sale during 2010, resulting in a gain on sale of loans of $1.0 million and the participation of another $10.3 million of commercial real estate loans. Sales of loans in 2009 totaled $60.4 million for a gain of $970 thousand. Management expects to continue to sell and/ or participate loans to manage interest rate risk, credit exposure or liquidity needs in the future, especially in light of the continuing low interest rate environment. While competition for good loans is strong, the Company has been able to originate loans to both current and new customers while maintaining credit quality. Management expects the loan refinancing trend to slow over the coming months as the number of borrowers able to refinance lessens and/ or interest rates rise.
Union Bankshares, Inc. 2010 Annual Report 60
The composition of the Company's total loan portfolio at year-end for each of the last five years was as follows:
Years Ended, December 31, | |||||||||||||||||||
2010 | 2009 | 2008 | 2007 | 2006 | |||||||||||||||
$ | % | $ | % | $ | % | $ | % | $ | % | ||||||||||
(Dollars in thousands) | |||||||||||||||||||
Residential real estate | 132,533 | 34.7 | 123,915 | 34.6 | 128,292 | 36.3 | 115,303 | 36.2 | 114,139 | 35.9 | |||||||||
Construction real estate | 18,578 | 4.9 | 19,391 | 5.4 | 19,038 | 5.4 | 20,190 | 6.4 | 22,568 | 7.1 | |||||||||
Commercial real estate | 167,056 | 43.7 | 159,095 | 44.4 | 153,821 | 43.5 | 134,658 | 42.3 | 132,186 | 41.6 | |||||||||
Commercial | 20,604 | 5.4 | 15,597 | 4.4 | 18,833 | 5.3 | 19,537 | 6.1 | 19,253 | 6.1 | |||||||||
Consumer and other | 6,046 | 1.6 | 6,967 | 1.9 | 6,735 | 1.9 | 7,175 | 2.3 | 7,717 | 2.4 | |||||||||
Municipal | 31,455 | 8.2 | 23,862 | 6.7 | 23,519 | 6.7 | 13,731 | 4.3 | 17,959 | 5.7 | |||||||||
Loans held for sale | 5,610 | 1.5 | 9,262 | 2.6 | 3,178 | 0.9 | 7,711 | 2.4 | 3,750 | 1.2 | |||||||||
Total loans | 381,882 | 100.0 | 358,089 | 100.0 | 353,416 | 100.0 | 318,305 | 100.0 | 317,572 | 100.0 | |||||||||
For residential loans, the Company generally does not lend more than 80% of the appraised value of the home without a government guaranty or the borrower purchasing private mortgage insurance and does not lend more than 100% of the appraised value under any circumstances. Although the Company lends up to 80% of the collateral value on commercial real estate loans to strong borrowers, the majority of commercial real estate loans do not exceed 75% of the appraised collateral value. However, the loan to value may go up to 90% on loans with government guarantees or other mitigating circumstances. Vermont and northwestern New Hampshire have not experienced the steep decline in property values that have been prevalent in other areas of the country but the market to sell properties remains slow given the impact of the decline in the financial markets, the uncertainty of the current economic environment and the number of properties on the market. Real estate secured loans represented $323.8 million, or 84.8%, of total loans at December 31, 2010 compared to $311.7 million, or 87.0%, of total loans at December 31, 2009.
The Company does not make loans that are interest only, have teaser rates or that result in negative amortization of the principal, except for construction and other short-term loans for either commercial or consumer purposes where the credit risk is evaluated on a borrower by borrower basis. The Company evaluates the borrower's ability to pay on variable-rate loans over a variety of interest rate scenarios, not just the current rate.
The Company originates and sells residential mortgages into the secondary market, with most of the sales made to Freddie Mac and occasionally to the Vermont Housing Finance Agency (VHFA). In 2008, the Company entered into a contract with the FHLB of Boston Mortgage Partnership Finance Program (MPF) to sell up to $5 million in loans. This contract was completed in early 2009 and a second $5 million contract was executed for future sales but has not yet been utilized. These loans are classified as held for sale at the time of origination or when a decision is made to sell the loans. Loans held for sale are accounted for at the lower of cost or fair value and reviewed at least quarterly based on current market pricing.
The Company serviced a residential real estate mortgage portfolio of $ 280.7 million and $229.1 million at December 31, 2010 and 2009, respectively. Of that portfolio, $148.2 million at December 31, 2010 and $96.4 million at December 31, 2009 was serviced for unaffiliated third parties. Additionally, the Company originates commercial real estate and commercial loans under various Small Business Administration (SBA), U.S. Department of Agriculture Rural Development Authority (USDA) and Vermont Economic Development Authority (VEDA) programs that provide an agency guarantee for a portion of the loan amount. The Company occasionally sells the guaranteed portion of the loan to other financial concerns and will retain servicing rights, which generates fee income. These loans are classified as held for sale as they are identified and accounted for at the lower of cost or fair value and priced at least quarterly by an independent party. The Company serviced approximately $3.5 million of commercial and commercial real estate loans for unaffiliated third parties as of December 31, 2010 and $3.0 million at December 31, 2009.
The Company capitalizes its loan servicing rights on these loans and recognizes gains and losses on the sale of the principal portion of these notes as they occur. The unamortized balance of servicing rights on loans sold with servicing retained was $650 thousand as of December 31, 2010 and $530 thousand as of December 31, 2009, with an estimated market value in excess of their carrying value at both year ends. Management periodically evaluates and measures the servicing assets for impairment.
Union Bankshares, Inc. 2010 Annual Report 61
In the ordinary course of business, the Company occasionally sells participations in a portion of commercial, municipal or real estate loans to other financial institutions on a nonrecourse basis for liquidity or credit concentration management purposes. The total of loans participated out as of December 31, 2010 was $14.4 million and $16.2 million at December 31, 2009.
The majority of the Company's loan portfolio is secured by real estate located throughout the Company's primary market area of northern Vermont and northwestern New Hampshire. Underlying real estate values for both residential and commercial properties have decreased slightly in the Company's market area during the last year, though a quick sale may result in a steeper discount should such a sale of real estate collateral become necessary. Although the Company's loan portfolio consists of different segments, there is a portion of the loan portfolio centered in tourism related loans. The Company has implemented risk management strategies to mitigate exposure in this industry through utilizing government guaranty programs as well as participations with other financial institutions as discussed above. Additionally, the loan portfolio contains many loans to seasoned and well established businesses and/or well secured loans which further reduce the Company's risk. Management closely follows the local and national economies and their impact on the local businesses, especially on the tourism industry, as part of the Company's risk management program.
The following table breaks down by classification the contractual maturities of the gross loans held in portfolio and for sale as of December 31, 2010:
Within 1 Year | 2-5 Years | Over 5 Years | |||||||
(Dollars in thousands) | |||||||||
Residential real estate | |||||||||
Fixed-rate | $ | 830 | $ | 3,272 | $ | 48,687 | |||
Variable-rate | 2,579 | 1,756 | 80,865 | ||||||
Construction real estate | |||||||||
Fixed-rate | 8,064 | 67 | 377 | ||||||
Variable-rate | 2,035 | 36 | 7,999 | ||||||
Commercial real estate | |||||||||
Fixed-rate | 2,286 | 8,350 | 8,122 | ||||||
Variable-rate | 13,855 | 9,954 | 124,643 | ||||||
Commercial | |||||||||
Fixed-rate | 5,299 | 4,318 | 1,175 | ||||||
Variable-rate | 5,184 | 3,042 | 1,586 | ||||||
Municipal | |||||||||
Fixed-rate | 16,239 | 1,271 | 12,302 | ||||||
Variable-rate | — | — | 1,643 | ||||||
Consumer & Other | |||||||||
Fixed-rate | 1,763 | 3,876 | 333 | ||||||
Variable-rate | 25 | 10 | 39 | ||||||
Total | $ | 58,159 | $ | 35,952 | $ | 287,771 | |||
Asset Quality. The Company, like all financial institutions, is exposed to certain credit risks including those related to the value of the collateral that secures its loans and the ability of borrowers to repay their loans. The underlying value of real estate collateral has not seen as much of a decline in Vermont and northwestern New Hampshire as has been experienced in some other parts of the country and the Company's conservative loan policies have been prudent for both the Company and its customers. Renewed market volatility, increases in unemployment rates and weaknesses in the general economic condition of the country or our market area, may have a negative effect on our customers' ability to make their loan payments on a timely basis and/or on underlying collateral values. Management closely monitors the Company's loan and investment portfolios, other real estate and other assets owned for potential problems and reports to the Company's and the subsidiary's Boards of Directors at regularly scheduled meetings. Repossessed assets and loans or investments that are 90 days or more past due are considered to be nonperforming assets. Board approved policies set forth portfolio diversification levels to mitigate concentration risk and the Company participates large credits out to other financial institutions to further mitigate that risk.
Union Bankshares, Inc. 2010 Annual Report 62
The Company's Board of Directors has set forth well-defined lending policies (which are periodically reviewed and revised as appropriate) that include conservative individual lending limits for officers, aggregate and advisory board approval levels, Board approval for large credit relationships, a loan review program and other limits or standards deemed necessary and prudent. The Company's loan review department is supervised by an experienced former regulatory examiner and staffed by a Certified Public Accountant, as well as other experienced personnel. The Company's loan review program encompasses a quality control process for loan documentation and underwriting for select loans as well as a monitoring process for credit extensions to assess the credit quality and degree of risk in the loan portfolio. Management performs and shares with the Board of Directors periodic concentration analyses based on various factors such as industries, collateral types, location, large credit sizes and officer portfolio loads. The Company has established underwriting guidelines to be followed by its officers; material exceptions are required to be approved by a senior loan officer or the Board of Directors. The Company monitors its delinquency levels for any adverse trends. There can be no assurance, however, that the Company's loan portfolio will not become subject to increasing pressures from deteriorating borrower financial strength or declining collateral values due to general or local economic conditions. The Company did not target sub-prime borrowers and has not experienced an elevated delinquency in this area.
Restructured loans include the Company's troubled debt restructurings that involved forgiving a portion of interest or principal, refinancing at a rate materially less than the market rate, rescheduling loan payments, or granting other concessions to a borrower due to financial or economic reasons related to the debtor's financial difficulties that the Company would not ordinarily grant. Restructured loans do not include qualifying restructured loans that have complied with the terms of their restructure agreement for a satisfactory period of time. There was one commercial real estate loan at $1.8 million restructured at December 31, 2010 and restructured loans totaling $1.9 million at December 31, 2009. Restructured loans are considered impaired when evaluating a specific loan loss reserve allocation.
Loans on which the accrual of interest has been discontinued are designated as nonaccrual loans. Management reviews the loan portfolio continuously for evidence of problem loans. Such loans are placed under close supervision with consideration given to placing the loan on nonaccrual status. Loans are designated as nonaccrual when reasonable doubt exists as to the full collection of interest and principal. Normally, when a loan is placed on nonaccrual status, all interest previously accrued but not collected is reversed against current period interest income. Income on such loans is then recognized only to the extent that cash is received and where the future collection of interest and principal is probable. Generally, interest accrual is resumed on such loans only when they are brought fully current with respect to interest and principal and when, in the judgment of management, the loans are estimated to be fully collectible as to both principal and interest. The aggregate interest on nonaccrual loans not recognized for the years ended December 31, 2010 and 2009 was $677 thousand and $664 thousand, respectively.
The following chart details the composition of the Company's nonperforming assets as of December 31:
2010 | 2009 | |||||
(Dollars in thousands) | ||||||
Nonaccrual loans | $ | 2,792 | $ | 3,738 | ||
Loans past due 90 days or more and still accruing interest | 806 | 538 | ||||
Total nonperforming loans | 3,598 | 4,276 | ||||
Other real estate owned (OREO) | 1,609 | 886 | ||||
Total nonperforming assets | $ | 5,207 | $ | 5,162 | ||
The Company had guarantees of U.S. or Vermont government agencies on the above nonperforming loans totaling $129 thousand at December 31, 2010 and $243 thousand at December 31, 2009. There were six loans in process of foreclosure at December 31, 2010 included in the nonperforming loans.
Union Bankshares, Inc. 2010 Annual Report 63
The following table reviews certain asset quality ratios monitored by Company's management at December 31:
2010 | 2009 | |||
Allowance for loan losses to loans not held for sale | 1.00 | % | 1.00 | % |
Allowance for loan losses to nonperforming loans | 104.36 | % | 81.69 | % |
Nonperforming loans to total loans | 0.94 | % | 1.19 | % |
Nonperforming assets to total assets | 1.15 | % | 1.15 | % |
Delinquent loans (30 days to nonaccruing) to total loans | 3.48 | % | 3.26 | % |
Net charge-offs to average loans not held for sale | 0.07 | % | 0.13 | % |
Loan loss provision to net charge-offs | 201.42 | % | 86.39 | % |
Nonperforming loans improved in terms of dollars and percentages from December 31, 2009 as has the allowance for loan losses as a percentage to nonperforming loans. The Company's success at keeping the nonperforming and delinquency ratios at favorable levels in these challenging economic conditions is the result of continued focus on maintaining strict underwriting standards, as well as our practice as a community bank to actively work with troubled borrowers to resolve the borrower's delinquency, while maintaining the safe and sound credit practices of the Bank and safeguarding our strong capital position.
At December 31, 2010, the Company had internally classified certain loans totaling $1.7 million representing four customer relationships, compared to $776 thousand at December 31, 2009. In management's view, such loans represent a higher degree of risk and could become nonperforming loans in the future. While still on a performing status, in accordance with the Company's credit policy, loans are internally classified when a review indicates the existence of any of the following conditions making the likelihood of collection questionable:
• | the financial condition of the borrower is unsatisfactory; |
• | repayment terms have not been met; |
• | the borrower has sustained losses that are sizable, either in absolute terms or relative to net worth; |
• | confidence is diminished; |
• | loan covenants have been violated; |
• | collateral is inadequate; or |
• | other unfavorable factors are present. |
The Company actively works with customers who may be delinquent or who may have financial difficulties. One of the benefits of being a community financial institution is our employees' and Boards' knowledge of the community and borrowers which allows us to be proactive in working closely with our loan customers. The Company's delinquency rates have historically run higher than similar institutions nationally, while losses have been lower. Although management believes that nonperforming and internally classified loans are generally well-secured and that in management's estimate probable credit losses inherent in the loan portfolio are provided for in the Company's allowance for loan losses, there can be no assurance that future deterioration in economic conditions and/or collateral values, or changes in other relevant factors will not result in future credit losses.
Except for those nonperforming loans discussed above, the Company's management is not aware of any loans as of December 31, 2010, for which known financial problems of the borrower would cause serious doubts as to the ability of these borrowers to materially comply with their present loan repayment terms, or any known events that would result in the loan being designated as nonperforming at some future date. However, a combination of the following economic conditions in the Company's market has the potential to create a situation where any borrower's status can quickly change. Real estate and other asset values declined during 2009 and 2010 and any recovery in the real estate market remains tentative. Deterioration in the value of collateral securing the Company's loans could put pressure on loan to value margins. Additionally, economic conditions resulting in higher unemployment rates and business failures are still a concern and could result in an increase in loan default rates. Management will continue to monitor and evaluate the effects of the troubled housing market and economy on the Company's loan portfolio.
Vermont continues to have one of the lowest residential foreclosure rate in the United States but on occasion real estate properties are acquired through or in lieu of loan foreclosure. These properties are held for sale and are initially recorded at the fair value less estimated selling costs at the date of the Company's acquisition of the property, with fair value
Union Bankshares, Inc. 2010 Annual Report 64
based on an appraisal for more significant properties and on a broker's price opinion for minor properties. Holding costs and declines in fair value after acquisition of the property result in charges against income. The Company evaluates each property at least quarterly for changes in fair value. The Company had three residential, one multi-family, two commercial and three construction/ land development properties classified as OREO at December 31, 2010 valued at $1.6 million and four properties valued at $886 thousand so classified on December 31, 2009. Of the nine properties in OREO at December 31, 2010, one of the properties has since been sold and two are under contract to sell. Further softening in the real estate market would make the potential to recover all principal and related costs for OREO properties uncertain.
Allowance for Loan Losses. Some of the Company's loan customers ultimately do not make all of their contractually scheduled payments, requiring the Company to charge off a portion or all of the remaining principal balance due. The Company maintains an allowance for loan losses to absorb such losses. The allowance is maintained at a level believed by management to be appropriate to absorb probable credit losses inherent in the loan portfolio; however, actual loan losses may vary from current estimates.
The adequacy of the allowance for loan losses is evaluated quarterly using a consistent, systematic methodology, which analyzes the risk inherent in the loan portfolio. In addition to evaluating the collectability of specific loans when determining the adequacy of the allowance, management also takes into consideration other qualitative factors such as changes in the mix and size of the loan portfolio, credit concentrations, historic loss experience, the amount of delinquencies and loans adversely classified, industry trends, and the impact of the local and regional economy on the Company's borrowers as well as the estimated value of any underlying collateral. The adequacy of the allowance for loan losses is assessed by an allocation process whereby specific loss allocations are made against certain adversely classified loans and general loss allocations are made against segments of the loan portfolio that have similar attributes. Although the allowance for loan losses is assessed by allocating reserves by loan category, the total allowance for possible loan losses is available for future losses which may occur within one or more loan categories.
The allowance is increased by a provision for loan losses charged to earnings, and reduced by charge-offs, net of recoveries. The provision for loan losses represents management's estimate of the current period credit cost associated with maintaining an appropriate allowance for loan losses. Based on an evaluation of the loan portfolio and other relevant qualitative factors, management presents a quarterly analysis of the adequacy of the allowance to the Board of Directors, indicating any changes in the allowance since the last review and any recommendations as to adjustments in the allowance. Additionally, bank regulatory agencies regularly review the Company's allowance for loan losses, including the methodology for determining the allowance, as an integral part of their examination process.
Credit quality of the commercial portfolio is quantified by a credit rating system designed to parallel regulatory criteria and categories of loan risk and has historically been well received by the various regulatory authorities. Individual loan officers monitor their loans to ensure appropriate rating assignments are made on a timely basis. Risk ratings and quality of commercial and retail credit portfolios are also assessed on a regular basis by an internal independent Loan Review Department. Loan Review personnel conduct ongoing portfolio analyses and individual credit reviews to evaluate loan risk and compliance with lending policies.
The level of allowance allocable to each loan portfolio category with similar risk characteristics is determined based on historical charge-offs, adjusted for qualitative risk factors. A quarterly analysis of various qualitative factors, including portfolio characteristics, national and local economic trends, overall market conditions, and levels of, and trends in, delinquencies and non-performing loans, helps to ensure that areas with the potential risk for loss are considered in management's allowance estimate. In addition, when other individual loans are identified by management as representing an elevated risk of loss, the level of allowance allocable to those loans is determined through estimating probable loss for each individual credit based on its specific risk attributes. Nonaccrual loans are also evaluated for specific impairment when Union's loan exposure is greater than $100 thousand or Union's exposure for an entire customer relationship is greater than $150 thousand. These loans may be classified as impaired when management believes it is probable that the Company will not collect all the contractual interest and principal payments as scheduled in the loan agreement. A specific reserve amount is allocated to the allowance for individual loans that have been classified as impaired on the basis of the fair value of the collateral for collateral dependent loans, an observable market price, or the present value of anticipated future cash flows.
The composition of the Company's loan portfolio remained relatively unchanged from December 31, 2009 to December 31, 2010, and there was no material change in the lending programs or terms during the year.
Union Bankshares, Inc. 2010 Annual Report 65
The following table reflects activity in the allowance for loan losses for the years ended December 31:
2010 | 2009 | 2008 | 2007 | 2006 | |||||||||||
(Dollars in thousands) | |||||||||||||||
Balance at the beginning of period | $ | 3,493 | $ | 3,556 | $ | 3,378 | $ | 3,338 | $ | 3,071 | |||||
Charge-offs | |||||||||||||||
Real estate | 268 | 379 | 50 | 99 | 8 | ||||||||||
Commercial | 27 | 101 | 54 | 79 | 3 | ||||||||||
Consumer and other | 20 | 43 | 102 | 90 | 73 | ||||||||||
Total charge offs | 315 | 523 | 206 | 268 | 84 | ||||||||||
Recoveries | |||||||||||||||
Real estate | 7 | 10 | 2 | 10 | 26 | ||||||||||
Commercial | 21 | 15 | 8 | 3 | 18 | ||||||||||
Consumer and other | 29 | 35 | 39 | 30 | 127 | ||||||||||
Total recoveries | 57 | 60 | 49 | 43 | 171 | ||||||||||
Net (charge-offs) recoveries | (258 | ) | (463 | ) | (157 | ) | (225 | ) | 87 | ||||||
Provision for loan losses | 520 | 400 | 335 | 265 | 180 | ||||||||||
Balance at end of period | $ | 3,755 | $ | 3,493 | $ | 3,556 | $ | 3,378 | $ | 3,338 | |||||
Provision charged to income as a percent of average loans | 0.15 | % | 0.11 | % | 0.10 | % | 0.09 | % | 0.06 | % | |||||
The following table shows the breakdown of the Company's allowance for loan loss by risk component (net of loans held for sale) and the percentage of loans in each risk component to gross loans in the respective portfolios at December 31:
2010 | 2009 | 2008 | 2007 | 2006 | ||||||||||||||||
$ | % | $ | % | $ | % | $ | % | $ | % | |||||||||||
(Dollars in thousands) | ||||||||||||||||||||
Real Estate: | ||||||||||||||||||||
Residential | 1,033 | 35.2 | 976 | 35.5 | 933 | 36.7 | 710 | 35.7 | 640 | 34.8 | ||||||||||
Commercial | 2,117 | 47.3 | 1,959 | 47.8 | 1,917 | 43.9 | 2,011 | 42.9 | 1,901 | 41.7 | ||||||||||
Construction | 240 | 4.9 | 240 | 5.6 | 223 | 5.4 | 202 | 6.5 | 296 | 7.2 | ||||||||||
Other Loans: | ||||||||||||||||||||
Commercial | 250 | 5.5 | 235 | 4.5 | 391 | 5.4 | 277 | 5.3 | 312 | 6.1 | ||||||||||
Consumer, municipal, other and unallocated | 115 | 7.1 | 83 | 6.6 | 92 | 8.6 | 178 | 9.6 | 189 | 10.2 | ||||||||||
Total | 3,755 | 100.0 | 3,493 | 100.0 | 3,556 | 100.0 | 3,378 | 100.0 | 3,338 | 100.0 | ||||||||||
Ratio of net charge-offs (recoveries) to average loans not held for sale | 0.07 | % | 0.13 | % | 0.05 | % | 0.07 | % | (0.03 | )% | ||||||||||
Ratio of allowance for loan losses to loans not held for sale | 1.00 | % | 1.00 | % | 1.02 | % | 1.09 | % | 1.06 | % | ||||||||||
Ratio of allowance for loan losses to nonperforming loans (1) | 104.36 | % | 81.69 | % | 48.75 | % | 60.47 | % | 70.26 | % | ||||||||||
(1) | Nonperforming loans includes loans in nonaccrual status plus loans past due 90 days or more and still accruing. |
Union Bankshares, Inc. 2010 Annual Report 66
Management of the Company believes, in their best estimate, that the allowance for loan losses at December 31, 2010 is appropriate to cover estimated probable credit losses inherent in the Company's loan portfolio as of such date. However, there can be no assurance that the Company will not sustain losses in future periods which could be greater than the size of the allowance at December 31, 2010. In addition, our banking regulators, as an integral part of their examination process, periodically review our allowance for loan losses. Such agencies may require us to recognize adjustments to the allowance based on its judgments about information available to them at the time of examination. A large loss could deplete the allowance and require increased provisions to replenish the allowance, which could negatively affect earnings.
While the Company recognizes that a further economic slowdown may adversely impact its borrowers' financial performance and ultimately their ability to repay their loans, management continues to be cautiously optimistic about the collectability of the Company's loan portfolio.
Investment Activities. The investment portfolio is used to generate interest income, manage liquidity and mitigate interest rate sensitivity. At December 31, 2010, the reported value of investment securities available-for-sale was $23.8 million, or 5.3%, of assets, compared to $24.6 million, or 5.5%, of assets at December 31, 2009. The Company had one investment security at $500 thousand classified as held-to-maturity and none classified as trading. Current accounting guidance requires banks to recognize all appreciation or depreciation of the investment portfolio on the balance sheet for available-for-sale securities even though a gain or loss has not been realized. Investment securities classified as available-for-sale are marked-to-market, with any unrealized gain or loss after estimated taxes charged to the equity portion of the balance sheet through the Accumulated other comprehensive income (loss) component of stockholders' equity. The reported value of investment securities available-for-sale at December 31, 2010 reflects a net unrealized gain of $264 thousand.
At December 31, 2010, twenty-five debt securities and one marketable equity security had unrealized losses with aggregate depreciation of 1.2% from the Company's amortized cost basis. Securities are evaluated at least quarterly for other-than-temporary impairment and at December 31, 2010, in management's estimation no security was other-than-temporarily impaired. Management's evaluation of other-than-temporary impairments is subject to risks and uncertainties and is intended to determine that appropriate amount and timing for recognizing an impairment charge. The assessment of whether such impairment for debt securities has occurred is based on management's best estimate of the cash flows expected to be collected at the individual security level. We regularly monitor our investment portfolio to ensure that securities that may be other-than-temporarily impaired are identified in a timely manner and that any impairment charge is recognized in the proper period and, with respect to debt securities, that the impairment is properly allocated between credit losses recognized in earnings and noncredit unrealized losses recognized in other comprehensive income (loss). Further deterioration in credit quality or a new round of imbalances in liquidity in the financial marketplace might adversely affect the fair values of the Company's investment portfolio and may increase the potential that certain unrealized losses will be designated as other-than-temporary in future periods, resulting in write-downs.
At December 31, 2010, the Company had no investments in a single company or entity (other than U.S. Government-sponsored enterprise securities) that had an aggregate book value in excess of 2% of our equity. The Company had one private collateralized mortgage obligation with a fair value of $105 thousand at December 31, 2010, and all the other mortgage-backed securities as of such date were issued by Government National Mortgage Association (GNMA), Federal National Mortgage Association (Fannie Mae) or the Federal Home Loan Mortgage Corporation (Freddie Mac). The Company did not invest in the preferred stock or subordinated debt of either Fannie Mae or Freddie Mac. Although the Fannie Mae and Freddie Mac debt securities are not explicitly guaranteed by the federal government, one of the stated purposes of the U.S. Treasury's September, 2008 conservatorship and capital support of the two institutions was to stabilize the market in their debt securities, and that purpose was again evident in legislation passed by Congress in late 2009 which effectively lifted any dollar ceiling on the implicit U.S. Treasury guaranty of Fannie Mae and Freddie Mac debt securities.
Union Bankshares, Inc. 2010 Annual Report 67
The following tables show as of December 31 the amortized cost, fair value and weighted average yield on a tax equivalent basis of the Company's investment debt securities portfolio maturing within the stated periods:
December 31, 2010 | |||||||||||||||||
Maturities | |||||||||||||||||
Within One Year | One to Five Years | Five to Ten Years | Over Ten Years | Total Cost | Weighted Average Yield | ||||||||||||
(Dollars in thousands) | |||||||||||||||||
Investment securities available-for-sale: | |||||||||||||||||
U.S. Government-sponsored enterprises | $ | — | $ | 1,000 | $ | 2,500 | $ | 1,021 | $ | 4,521 | 2.00 | % | |||||
Mortgage-backed | 740 | 498 | 956 | 2,541 | 4,735 | 2.80 | % | ||||||||||
State and political subdivisions | 502 | 190 | 2,585 | 6,096 | 9,373 | 5.47 | % | ||||||||||
Corporate debt | 750 | 2,503 | 1,484 | — | 4,737 | 5.40 | % | ||||||||||
Investment securities held-to-maturity: | |||||||||||||||||
U.S. Government-sponsored enterprises | — | — | 500 | — | 500 | 2.00 | % | ||||||||||
Total investment debt securities | $ | 1,992 | $ | 4,191 | $ | 8,025 | $ | 9,658 | $ | 23,866 | 4.19 | % | |||||
Fair value | $ | 2,014 | $ | 4,358 | $ | 8,192 | $ | 9,572 | $ | 24,136 | |||||||
Weighted average yield | 3.47 | % | 4.08 | % | 4.18 | % | 4.42 | % | 4.19 | % | |||||||
December 31, 2009 | |||||||||||||||||
Maturities | |||||||||||||||||
Within One Year | One to Five Years | Five to Ten Years | Over Ten Years | Total Cost | Weighted Average Yield | ||||||||||||
(Dollars in thousands) | |||||||||||||||||
Investment securities available-for-sale | |||||||||||||||||
U.S. Government-sponsored enterprises | $ | — | $ | 1,000 | $ | 1,000 | $ | 2,499 | $ | 4,499 | 3.78 | % | |||||
Mortgage-backed | 723 | 982 | 1,498 | 1,547 | 4,750 | 4.19 | % | ||||||||||
State and political subdivisions | 596 | 417 | 2,577 | 3,958 | 7,548 | 5.87 | % | ||||||||||
Corporate debt | 451 | 3,758 | 2,967 | — | 7,176 | 5.40 | % | ||||||||||
Total investment debt securities | $ | 1,770 | $ | 6,157 | $ | 8,042 | $ | 8,004 | $ | 23,973 | 5.00 | % | |||||
Fair value | $ | 1,795 | $ | 6,374 | $ | 8,313 | $ | 8,041 | $ | 24,523 | |||||||
Weighted average yield | 4.88 | % | 4.71 | % | 5.09 | % | 5.17 | % | 5.00 | % | |||||||
The tables above exclude marketable equity securities with a book value of $50 thousand and a market value of $45 thousand at December 31, 2010, and a book value of $50 thousand and a market value of $44 thousand at December 31, 2009, which have no maturity but may be sold by the Company at any time. The table also excludes mutual funds with a book and market value of $100 thousand at December 31, 2010 and of $82 thousand at December 31, 2009.
Federal Home Loan Bank of Boston Stock. Union is a member of the FHLB of Boston with an investment of $1.9 million in its Class B common stock at both December 31, 2010 and 2009. The Class B common stock has a five year notice requirement for redemption and there is no guarantee of future redemption. Also, there is the possibility of future capital calls by the FHLB of Boston on member banks to ensure compliance with its capital plan. Union's investment in FHLB stock is carried as an Other asset at cost and is nonmarketable. Similar to evaluating investment securities available-for-sale for other-than-temporary impairment, the Company has evaluated its investment in the FHLB of Boston. The FHLB of Boston has taken a number of steps to strengthen its capital position in the short-term and preserve its capital in the wake of significant other-than-temporary impairment charges it has recorded in its investment portfolio since the fourth quarter of 2008. The FHLB of Boston remains in compliance with all regulatory capital ratios as of December 31, 2010 and 2009. Dividend payments on the FHLB of Boston Class B common stock had been suspended since the third quarter of 2008 and a moratorium on excess stock repurchases was implemented. On February 22, 2011, the FHLB of
Union Bankshares, Inc. 2010 Annual Report 68
Boston announced the resumption of dividend payments during 2011, but at a modest rate, with a dividend payable on March 2, 2011, but did not lift the moratorium on stock repurchases. The FHLB of Boston also announced that it had exceeded the 5.5% minimum internal capital-to-assets ratio of December 31, 2010 with an actual ratio of 6.8% and announced an increase in the Affordable Housing Program funds available for 2011. Management's most recent evaluation of the Company's holdings of FHLB of Boston common stock concluded that the investment is not impaired at December 31, 2010.
Deposits. The following table shows information concerning the Company's average deposits by account type, and the weighted average nominal rates at which interest was paid on such deposits for the years ended December 31:
2010 | 2009 | |||||||||||||
Average Amount | Percent of Total Deposits | Average Rate | Average Amount | Percent of Total Deposits | Average Rate | |||||||||
(Dollars in thousands) | ||||||||||||||
Nontime deposits | ||||||||||||||
Noninterest bearing deposits | $ | 55,829 | 15.1 | — | $ | 52,890 | 14.8 | — | ||||||
NOW accounts | 62,094 | 16.8 | 0.22 | % | 61,727 | 17.2 | 0.26 | % | ||||||
Money market accounts | 73,484 | 19.9 | 0.66 | % | 62,030 | 17.3 | 0.84 | % | ||||||
Savings accounts | 46,985 | 12.8 | 0.30 | % | 43,343 | 12.1 | 0.31 | % | ||||||
Total nontime deposits | 238,392 | 64.6 | 0.32 | % | 219,990 | 61.4 | 0.37 | % | ||||||
Time deposits | ||||||||||||||
Less than $100,000 | 71,205 | 19.3 | 1.67 | % | 79,877 | 22.3 | 2.38 | % | ||||||
$100,000 and over | 59,179 | 16.1 | 1.73 | % | 58,262 | 16.3 | 2.40 | % | ||||||
Total time deposits | 130,384 | 35.4 | 1.70 | % | 138,139 | 38.6 | 2.39 | % | ||||||
Total deposits | $ | 368,776 | 100.0 | 0.81 | % | $ | 358,129 | 100.0 | 1.15 | % | ||||
The Company does not normally accept brokered certificates of deposit except through participation with the Certificate of Deposit Account Registry Service (CDARS) of Promontory Interfinancial Network, LLC. The Company had $9.8 million of reciprocal time deposits of $250 thousand or less on the balance sheet placed through CDARS at December 31, 2010 and $13.6 million at December 31, 2009 as the safety of FDIC insurance coverage continues to be important to customers , especially for those taking money out of the volatile stock market or other financial investments. These deposits are considered “brokered” deposits for certain regulatory purposes. None of the Company's CDARS deposits as of the respective balance sheet dates represent purchased deposits, as all such deposits were matched dollar for dollar with Union's customer deposits which were placed in other participating financial institutions in order to provide our customers with full FDIC insurance coverage.
Deposits grew $7.9 million, or 2.1%, from $368.8 million at December 31, 2009 to $376.7 million at December 31, 2010. On average, all categories of deposits, with the exception of time deposits less than $100,000, grew between years even though the interest rate paid on all account types declined. Total average deposits grew $10.6 million, or 3.0%, between years with average nontime deposits growing $18.4 million, or 8.4%, during the same time frame.
In December 2008, Union elected to participate in the portion of the FDIC's Temporary Liquidity Guarantee Program (TLGP) that provides full FDIC deposit insurance on all noninterest bearing transaction accounts even if they exceeded the deposit insurance limit of $250 thousand. The TLPG was extended through December 31, 2010 and the Company elected to continue its participation. This program is separate from the Troubled Asset Purchase Program, the Capital Access Program and the Capital Purchase Program, all of which the Company chose not to participate in.
Part of the Dodd-Frank Act permanently raised FDIC deposit insurance coverage to $250 thousand per depositor per insured depository institution for each account ownership category. At December 31, 2010, the Company had deposit accounts between $100 thousand and $250 thousand totaling $75.4 million which now have permanent FDIC insurance protection. There is $85.4 million in deposit accounts greater than $250 thousand at December 31, 2010 and $20.4 million was FDIC insured through the FDIC TLGP program.
Union Bankshares, Inc. 2010 Annual Report 69
A maturity distribution of the Company's time deposits in denominations of $100,000 or more at December 31 is as follows:
2010 | 2009 | |||||
(Dollars in thousands) | ||||||
Three months or less | $ | 6,732 | $ | 12,098 | ||
Over three months through six months | 28,441 | 22,434 | ||||
Over six months through twelve months | 16,751 | 19,107 | ||||
Over twelve months | 10,986 | 6,578 | ||||
$ | 62,910 | $ | 60,217 | |||
Borrowings. Advances from the FHLB of Boston are another key source of funds to support earning assets. These funds are also used to manage the Bank's interest rate and liquidity risk exposures. Borrowings from the FHLB of Boston were $29.0 million at December 31, 2010, at a weighted average rate of 3.84%, and $31.0 million at December 31, 2009, at a weighted average rate of 3.52%. The Company's borrowed funds at both December 31, 2010 and December 31, 2009 were comprised solely of FHLB of Boston advances. The decline in borrowings between years included the maturity during 2010 of $5.4 million in short term FHLB of Boston funding at 0.19%. The Company also made scheduled monthly payments on long-term amortizing advances of $831 thousand, prepaid a $359 thousand amortizing advance with an interest rate of 5.51% that did not mature until 2027 and a $354 thousand amortizing advance at 5.61% that did not mature until 2016. These decreases were partially offset by match funding a $3.0 million commercial real estate loan with a 3.18% amoritizing advance to mitigate interest rate risk and the drawdown of a $2.0 million bullet advance at 0.23% in late 2010 for liquidity purposes. The Company had no overnight federal funds purchased on December 31, 2010 or 2009. Average borrowings outstanding for 2010 were $27.1 million, compared to average borrowings outstanding for 2009 of $27.7 million. The weighted average interest rate on the Company's borrowings dropped from 4.20% for 2009 to 4.16% for 2010, reflecting the low interest rate environment that prevailed throughout both years.
Liability for Pension Benefits. The Company had a Liability for defined pension benefit plan of $3.5 million at December 31, 2010 and $3.0 million at December 31, 2009. The increase in the pension liability between years is mainly due to the decrease in the discount rate from 6.00% to 5.56% but the negative effects of that change were partially offset by the investment gains and the $1.25 million contribution to the plan by Union Bank during 2010. The investments of the plan that were in the “market” were not immune to the turmoil experienced over the last three years and their value fluctuated accordingly. Weighted average asset allocations at December 31, 2010 are more conservative in response to the market volatility; but, since the plan has a very long-term (40 + years) horizon, the investments are managed for the long-term. In addition to the pension liability at December 31, 2010, the Company had deferred tax assets of $1.2 million, Other assets through a prepaid pension benefit of $1.1 million and Accumulated other comprehensive loss of $2.3 million. The Accumulated other comprehensive loss has no impact on regulatory capital amounts or ratios or the Company's legal lending limit. Note 14 to the Consolidated Financial Statements includes further discussion and information on the Company's employee benefits.
The Company's pension benefit obligation and net periodic cost are actuarially determined based on the following assumptions: discount rate, expected future return on plan assets, change in the Social Security wage base rate, the Consumer Price Index rate, mortality tables and the expected rate of increase in compensation levels. While a change in any of the assumptions would have an impact on financial condition and future results of operations, a change in the discount rate and future rate of return on plan assets could be material. A discount rate is used both to determine the present value of future benefit obligations and the net periodic benefit cost. The expected rate of return on plan assets is only used to determine net period benefit cost.
The 2010 pension benefit obligation discount rate utilized is based on the plan's expected benefit payment stream utilizing December 2010 benchmark pension liability index yield curve spot rates. The determination was made to lower the discount rate to 5.56% at December 31, 2010 from 6.00% at December 31, 2009.
The Company bases its expected rate of return on plan assets on past history, current earning rates available on investments and economic forecasts of where rates are headed in the future. The expected rate of return is conservative as the plan has typically taken short-term risk by investing more heavily in equity and international mutual fund markets which over the long-term have proven to be good decisions. Through the end of 2010, our actual net investment
Union Bankshares, Inc. 2010 Annual Report 70
returns over the last 20 years had a high of 20.73% and a low of negative 26.93%. The latest one year return, as of December 31, 2010, was 10.29%. Therefore, the conservative expectation of a 6.75% return, which is consistent with the 2.50% inflation assumption, is balanced by our discount rate of 5.56% since the plan has a very long-term (40+ years) horizon. The net periodic pension cost (or pension plan expense on the Company's income statement) was $769 thousand for 2010 and $1.1 million for 2009. The pension plan expense for 2011 will be $833 thousand as calculated by the actuary as of December 31, 2010.
OTHER FINANCIAL CONSIDERATIONS
Market Risk and Asset and Liability Management. Market risk is the potential of loss in a financial instrument arising from adverse changes in market prices, interest rates, foreign currency exchange rates, commodity prices and equity prices. As of December 31, 2010, the Company did not have any market risk sensitive instruments acquired for trading purposes. The Company's market risk arises primarily from interest rate risk inherent in its lending, investing, deposit taking, and borrowing activities as yields on assets change in a different time period or to a different extent from that of interest costs on liabilities. Many other factors also affect the Company's exposure to changes in interest rates, such as national, regional and local economic and financial conditions, financial market conditions, legislative and regulatory actions and initiatives, competitive pressures, customer preferences including loan prepayments and/or early withdrawal of time deposits, and historical pricing relationships.
The earnings of the Company and its subsidiary are affected not only by general economic, financial and credit market conditions, but also by the monetary and fiscal policies of the United States and its agencies, particularly the Federal Reserve System. The monetary policies of the Federal Reserve System influence to a significant extent the overall growth of loans, investments, deposits and borrowings; the level of interest rates earned on assets and paid for liabilities; and interest rates charged on loans and paid on deposits. The nature and impact of future changes in monetary policies are often not predictable. The dramatic change in the financial markets in a very short window of time during 2008 proved that monetary policies are not foolproof and that “exotic” investment vehicles that had been allowed to proliferate over the last twenty years were often not solidly based or understood, monitored, and policed by the appropriate regulatory agency. The Company did not invest in any of the “exotic” vehicles directly but had invested in a few companies and agencies that have been hurt by their investments or operating practices. Few predicted the 500 basis point drop in the prime rate between September 2007 and December 2008 or the stagnation of the financial markets and the economy in the last four months of 2008 that continued throughout 2009 and that has slowly started to recover in 2010.
A key element in the process of managing market risk involves direct involvement by senior management and oversight by the Board of Directors as to the level of risk assumed by the Company in its balance sheet. The Board of Directors reviews and approves risk management policies, including risk limits and guidelines, and reviews quarterly the current position in relationship to those limits and guidelines. Daily oversight functions are delegated to the Asset Liability Management Committee (ALCO). The ALCO, consisting of senior business and finance officers, actively measures, monitors, controls and manages the interest rate risk exposure that can significantly impact the Company's financial position and operating results. The ALCO sets liquidity targets based on the Company's financial condition and existing and projected economic and market conditions. Liquidity ratios and cash flow reports are reviewed monthly by both senior management and the Board of Directors of Union. The Company attempts to structure its balance sheet to maximize net interest income and shareholder value, while controlling its exposure to interest rate risk. Strategies might include selling or participating out loans held for sale, selling or purchasing investments available-for-sale, match funding new loans with FHLB of Boston advances or purchasing or selling brokered deposits through CDARS. The ALCO formulates strategies to manage interest rate risk by evaluating the impact on earnings and capital of such factors as current interest rate forecasts and economic indicators, potential changes in such forecasts and indicators, liquidity, competitive pressures and various business strategies. The ALCO's methods for evaluating interest rate risk include an analysis of the Company's interest rate sensitivity “gap”, which provides a static analysis of the maturity and repricing characteristics of the Company's entire balance sheet, and a simulation analysis, which calculates projected net interest income based on alternative balance sheet and interest rate scenarios, including “rate shock” scenarios involving immediate substantial increases or decreases in market rates of interest.
Members of ALCO meet at least weekly to set loan and deposit rates, make investment decisions, monitor liquidity and evaluate loan demand and review opportunities to sell residential or commercial loans into the secondary market. Deposit runoff is monitored daily and loan prepayments evaluated monthly. The Company historically has maintained a
Union Bankshares, Inc. 2010 Annual Report 71
substantial portion of its loan portfolio on a variable-rate basis (66.8% at December 31, 2010) and plans to continue this Asset/Liability/Management (ALM) strategy in the future. The majority of the variable-rate loan portfolio have interest rate floors and caps which are taken into account by the Company's ALM modeling software to predict interest rate sensitivity including prepayment risk. The utilization of interest rate floors embedded in variable rate loans has become Company policy for loans originated since the beginning of 2009 due to historic low interest rates. As of December 31, 2010, $23.8 million, or 97.9%, of the investment portfolio was classified as available-for-sale and the modified duration was relatively short. The Company does not utilize any exotic derivative products or invest in any “high risk” instruments.
Interest rates have stayed at historic lows throughout 2009 and 2010. There continues to be a significant amount of uncertainty in the financial markets. The economic outlook is also precarious and modeling software is limited to mathematically provable results. Given these facts, management believes it is especially important to know your customers and your market and to have an experienced team of employees with varied experience in the financial field. Union Bankshares has operated successfully for 119 years, throughout a variety of challenging economic environments.
The Company's interest rate sensitivity analysis (simulation) as of December 2009 for a flat rate environment (the prime rate at both December 31, 2009 and 2010 was 3.25%) projected the following 2010 results compared to the actual:
2010 | 2010 | % | ||||||
Projected | Actual | Variance | ||||||
(Dollars in thousands) | ||||||||
Interest and fees on loans | $ | 21,583 | $ | 21,462 | (0.6 | ) | ||
Other interest income | 1,796 | 1,445 | (19.5 | ) | ||||
Interest expense | (5,587 | ) | (4,117 | ) | 26.3 | |||
Net interest income | $ | 17,792 | $ | 18,790 | 5.6 | |||
Net income | $ | 4,598 | $ | 5,587 | 21.5 | |||
Return on average assets | 1.07 | % | 1.26 | % | 17.8 | |||
Return on average equity | 11.91 | % | 13.37 | % | 12.3 | |||
Interest income on nonloan earning assets was lower than projected as funds previously invested in interest bearing deposits in banks were utilized upon maturity to fund the strong loan demand. Rates paid on fixed rate time and core deposits decreased during 2010 further than projected as interest rates remained low and competitive pressures eased in the deposit gathering market. Deposit growth was also stronger in nontime deposits which pay a lower rate of interest than was anticipated in projections. This positive variance in interest expense more than offset the negative variances in interest income, which resulted in a positive variance in actual net interest income for 2010 over the simulation model prepared in December 2009.
Commitments, Contingent Liabilities, and Off-Balance-Sheet Arrangements. The Company is a party to financial instruments with off-balance-sheet risk in the normal course of business to meet the financing needs of its customers, to reduce its own exposure to fluctuations in interest rates and to implement its strategic objectives. These financial instruments include commitments to extend credit, standby letters of credit, interest rate caps and floors written on adjustable-rate loans, commitments to participate in or sell loans, commitments to buy or sell securities, certificates of deposit or other investment instruments and risk-sharing commitments or guarantees on certain sold loans. Such instruments involve, to varying degrees, elements of credit and interest rate risk in excess of the amount recognized on the balance sheet. The contractual or notional amounts of these instruments reflect the extent of involvement the Company has in a particular class of financial instruments.
The Company's exposure to credit loss in the event of nonperformance by the other party to the financial instrument for commitments to extend credit and standby letters of credit is represented by the contractual notional amount of those instruments. The Company uses the same credit policies in making commitments and conditional obligations as it does for on-balance-sheet instruments. For interest rate caps and floors embedded in adjustable-rate loans, the contractual or notional amounts do not represent the Company's exposure to credit loss. The Company controls the risk of interest rate cap agreements through credit approvals, limits, and monitoring procedures. The Company generally requires collateral or other security to support financial instruments with credit risk.
Union Bankshares, Inc. 2010 Annual Report 72
The following table details the contractual or notional amount of financial instruments that represented credit risk at December 31, 2010:
Contract or Notional Amount | |||||||||||||||||||||
2011 | 2012 | 2013 | 2014 | 2015 | Thereafter | Total | |||||||||||||||
(Dollars in thousands) | |||||||||||||||||||||
Commitments to originate loans | $ | 15,004 | $ | 650 | $ | — | $ | — | $ | — | $ | — | $ | 15,654 | |||||||
Unused lines of credit | 38,762 | 1,304 | 1,533 | 3,045 | 20 | 56 | 44,720 | ||||||||||||||
Standby and commercial letters of credit | 1,238 | 112 | 129 | 15 | — | — | 1,494 | ||||||||||||||
Credit card arrangement | 838 | — | — | — | — | — | 838 | ||||||||||||||
FHLB of Boston-MPF credit enhancement obligation, net of liability recorded | 86 | — | — | — | — | — | 86 | ||||||||||||||
Total | $ | 55,928 | $ | 2,066 | $ | 1,662 | $ | 3,060 | $ | 20 | $ | 56 | $ | 62,792 | |||||||
Commitments to originate loans are agreements to lend to a customer as long as there is no violation of any condition established in the contract. Commitments generally have a fixed expiration date or other termination clause and may require payment of a fee. Approximately $6.6 million of the unused lines of credit outstanding at December 31, 2010 relate to real estate construction loans that are expected to fund within the next twelve months. The remaining lines primarily relate to revolving lines of credit for other real estate or commercial loans. Many of these lines may expire without being fully drawn upon and therefore the commitment amounts do not necessarily represent future cash needs.
Unused lines of credit increased $10.2 million from $34.5 million at December 31, 2009 to $44.7 million at December 31, 2010, or 29.5%. Some of the larger lines have underlying participation agreements with other financial institutions in place as a draw is made in order for the Company to be able to continue to support a borrower's larger needs without bearing all the credit risk in the Company's balance sheet. Commitments to originate loans decreased $1.0 million from $16.7 million at December 31, 2009 to $15.7 million at December 31, 2010, due primarily to the slowdown in demand for loan refinancing in December 2010 as residential mortgage rates crept upward.
The Company may, from time-to-time, enter into commitments to purchase, participate or sell loans, securities, certificates of deposit, or other investment instruments which involve market and interest rate risk. There were no such commitments at December 31, 2010.
The Company sells 1-4 family residential loans under a loss-sharing program with FHLB of Boston, the Mortgage Partnership Finance program (MPF) when it is the most economically viable solution. Under this program the Company shares in the credit risk of each mortgage, while receiving fee income in return. The Company is responsible for a Credit Enhancement Obligation (CEO) based on the credit quality of these loans. FHLB of Boston funds a First Loss Account (FLA) based on the Company's outstanding MPF mortgage balances. This creates a laddered approach to sharing in any losses. In the event of default, homeowner's equity and private mortgage insurance, if any, are the first sources of repayment; the FHLB of Boston's FLA funds are then utilized, followed by the member's CEO, with the balance the responsibility of FHLB of Boston. These loans must meet specific underwriting standards of the FHLB of Boston. As of December 31, 2010, the Company had $5.0 million in loans sold through the MPF program and a contract for delivery of an additional $5.0 million of future loan sales. The volume of loans sold to the MPF program and the corresponding credit obligation are closely monitored by management. As of December 31, 2010, the notional amount of the maximum contingent contractual liability related to this program was $91 thousand, of which $5 thousand has been recorded as a reserve through Other liabilities.
Union Bankshares, Inc. 2010 Annual Report 73
Contractual Obligations: The Company has various financial obligations, including contractual obligations that may require future cash payments. The following table presents, as of December 31, 2010, significant fixed and determinable contractual obligations to third parties by payment date:
Payments Due By Period | |||||||||||||||
Less than 1 year | 2 & 3 years | 4 & 5 years | Thereafter | Total | |||||||||||
(Dollars in thousands) | |||||||||||||||
Operating lease commitments | $ | 126 | $ | 99 | $ | — | $ | — | $ | 225 | |||||
Contractual payments on borrowed funds (1) | 4,623 | 7,407 | 5,333 | 11,623 | 28,986 | ||||||||||
Deposits without stated maturity (2) (1) | 244,912 | — | — | — | 244,912 | ||||||||||
Certificates of deposit (2) (1) | 97,900 | 28,679 | 5,169 | — | 131,748 | ||||||||||
Pension plan contributions (3) | 1,000 | — | — | — | 1,000 | ||||||||||
Deferred compensation payouts (4) | 146 | 369 | 186 | 519 | 1,220 | ||||||||||
Total | $ | 348,707 | $ | 36,554 | $ | 10,688 | $ | 12,142 | $ | 408,091 | |||||
(1) | The amounts exclude interest payable as amounts other than the $389 thousand currently payable are not estimatable. |
(2) | While Union has a contractual obligation to depositors should they wish to withdraw all or some of the funds on deposit, management believes, based on historical analysis as well as current conditions in financial markets, that the majority of these deposits will remain on deposit for the foreseeable future. |
(3) | Anticipated funding obligations for pension contributions after 2011 are excluded due to the significant variability in the assumptions required to project the amount and timing of future cash contributions. |
(4) | The amounts exclude $93 thousand where the payment period begins at the individual's retirement which is not determinable. |
The Company's subsidiary bank is required (as are all banks) to maintain vault cash or a noninterest bearing reserve balance as established by Federal Reserve Board regulations. The average total reserve for the 14-day maintenance period including December 31, 2010 was $360 thousand, which was satisfied by vault cash. The Company has also committed to maintain a noninterest bearing contracted clearing balance of $1.0 million at December 31, 2010 with the Federal Reserve Bank of Boston.
Interest Rate Sensitivity “Gap” Analysis. An interest rate sensitivity “gap” is defined as the difference between interest earning assets and interest bearing liabilities maturing or repricing within a given time period. A gap is considered positive when the amount of interest rate sensitive assets exceeds the amount of interest rate sensitive liabilities. A gap is considered negative when the amount of interest rate sensitive liabilities exceeds the amount of interest rate sensitive assets. During a period of rising interest rates, a negative gap would tend to adversely affect net interest income, while a positive gap would tend to result in an increase in net interest income. During a period of falling interest rates, a negative gap would tend to result in an increase in net interest income, while a positive gap would tend to affect net interest income adversely. Because different types of assets and liabilities with the same or similar maturities may react differently to changes in overall market interest rates or conditions, changes in interest rates may affect net interest income positively or negatively even if an institution were perfectly matched in each maturity category.
The Company prepares its interest rate sensitivity “gap” analysis by scheduling interest earning assets and interest bearing liabilities into periods based upon the next date on which such assets and liabilities could mature or reprice. The amounts of assets and liabilities shown within a particular period were determined in accordance with the contractual terms of the assets and liabilities, except that:
• | adjustable-rate loans, investment securities, variable-rate time deposits and FHLB of Boston advances are included in the period when they are first scheduled to adjust and not in the period in which they mature; |
• | fixed-rate mortgage-related securities and residential loans reflect estimated prepayments, which were estimated based on analyses of broker estimates, the results of a prepayment model utilized by the Company, and empirical data; |
Union Bankshares, Inc. 2010 Annual Report 74
• | other nonmortgage related fixed-rate loans reflect scheduled contractual amortization, with no estimated prepayments; and |
• | NOW, money markets, and savings deposits, which do not have contractual maturities, reflect estimated levels of attrition, which are based on detailed studies by the Company of the sensitivity of each such category of deposit to changes in interest rates. |
Management believes that these assumptions approximate actual experience and considers them reasonable. However, the interest rate sensitivity of the Company's assets and liabilities in the following table could vary substantially if different assumptions were used, callable investment options were modeled, prepayment speeds changed or actual experience differs from the historical experience on which the assumptions are based.
The following table shows the Company's rate sensitivity analysis as of December 31, 2010:
Cumulative repriced within | ||||||||||||||||||
3 Months or Less | 4 to 12 Months | 1 to 3 Years | 3 to 5 Years | Over 5 Years | Total | |||||||||||||
(Dollars in thousands, by repricing date) | ||||||||||||||||||
Interest sensitive assets | ||||||||||||||||||
Overnight deposits | $ | 8,845 | $ | — | $ | — | $ | — | $ | — | $ | 8,845 | ||||||
Interest bearing deposits in banks | 1,471 | 5,072 | 6,008 | 1,490 | — | 14,041 | ||||||||||||
Investment securities (1) (3) | 1,483 | 3,304 | 4,160 | 3,159 | 12,029 | 24,135 | ||||||||||||
Loans and loans held for sale (2) (3) | 126,907 | 60,092 | 70,167 | 61,551 | 63,354 | 382,071 | ||||||||||||
FHLB Stock | — | — | — | — | 1,922 | 1,922 | ||||||||||||
Total interest sensitive assets | $ | 138,706 | $ | 68,468 | $ | 80,335 | $ | 66,200 | $ | 77,305 | $ | 431,014 | ||||||
Interest sensitive liabilities | ||||||||||||||||||
Time deposits | $ | 20,910 | $ | 77,409 | $ | 28,260 | $ | 5,169 | $ | — | $ | 131,748 | ||||||
Money markets | 24,310 | — | — | — | 44,519 | 68,829 | ||||||||||||
Savings | 9,227 | — | — | — | 38,012 | 47,239 | ||||||||||||
NOW accounts | 22,678 | — | — | — | 41,640 | 64,318 | ||||||||||||
Borrowed funds | 2,243 | 2,380 | 7,407 | 5,333 | 11,623 | 28,986 | ||||||||||||
Total interest sensitive liabilities | $ | 79,368 | $ | 79,789 | $ | 35,667 | $ | 10,502 | $ | 135,794 | $ | 341,120 | ||||||
Net interest rate sensitivity gap | $ | 59,338 | $ | (11,321 | ) | $ | 44,668 | $ | 55,698 | $ | (58,489 | ) | $ | 89,894 | ||||
Cumulative net interest rate sensitivity gap | $ | 59,338 | $ | 48,017 | $ | 92,685 | $ | 148,383 | $ | 89,894 | ||||||||
Cumulative net interest rate sensitivity gap as a percentage of total assets | 13.1 | % | 10.6 | % | 20.4 | % | 32.7 | % | 19.8 | % | ||||||||
Cumulative net interest sensitivity gap as a percentage of total interest sensitive assets | 13.8 | % | 11.1 | % | 21.5 | % | 34.4 | % | 20.9 | % | ||||||||
Cumulative net interest sensitivity gap as percentage of total interest sensitive liabilities | 17.4 | % | 14.1 | % | 27.2 | % | 43.5 | % | 26.4 | % | ||||||||
(1) | Investment securities exclude marketable equity securities with a cost of $50 thousand and a fair value of $45 thousand and mutual funds with a book and fair value of $100 thousand, respectively, that may be sold by the Company at any time. |
(2) | Balances shown include deferred unamortized loan costs of $188 thousand. |
(3) | Estimated repayment assumptions considered in Asset/Liability model. |
Simulation Analysis. In its simulation analysis, the Company uses computer software to simulate the estimated impact on net interest income under various interest rate scenarios, balance sheet trends, and strategies over a relatively short time horizon. These simulations incorporate assumptions about balance sheet dynamics such as loan and deposit growth, product pricing, prepayment speeds on mortgage related assets, principal maturities or calls on other financial instruments, and changes in the funding mix. While such assumptions are inherently uncertain as actual rate changes
Union Bankshares, Inc. 2010 Annual Report 75
and balance sheet growth rarely follow any given forecast and asset/liability pricing and other model inputs usually do not remain constant in their historical relationships, management believes that these assumptions are reasonable. Based on the results of these simulations, the Company is able to quantify its estimate of interest rate risk and develop and implement appropriate strategies.
The following chart reflects the cumulative results of the Company's latest simulation analysis for the next twelve months on net interest income, net income, return on assets and return on equity. Shocks are intended to capture interest rate risk under extreme conditions by immediately shifting to the new level. The projection utilizes a proportional rate shock of up 300 basis points and down 100 basis points from the December 31, 2010 prime rate of 3.25%. A 300 basis point shock is the highest internal slope monitored. This slope range was determined to be the most relevant during this economic cycle. It should be noted that given the current prime rate and other key rates at December 31, 2010, the floor rates on various loans and deposits may have already been reached or be hit in a down 100 basis point environment which is handled by the simulation model. What the model cannot take into account is what rates the Company will find necessary to accept on loans or pay on deposits given the current competitive, low interest rate environment.
INTEREST RATE SENSITIVITY SIMULATION ANALYSIS | ||||||||||||||
December 31, 2010 | ||||||||||||||
(Dollars in thousands) | ||||||||||||||
Year Ending | Prime Rate | Net Interest Income | Change % | Net Income | Return on Assets | Return on Equity | ||||||||
December-2011 | 6.25 | % | $ | 24,324 | 21.9 | $ | 8,532 | 1.84 | % | 18.36 | % | |||
3.25 | % | 19,951 | 0.0 | 5,523 | 1.19 | % | 12.27 | % | ||||||
2.25 | % | 18,666 | (6.4 | ) | 4,635 | 1.00 | % | 10.40 | % | |||||
The resulting projected cumulative effect of these estimates on net interest income for the year ending December 31, 2011 are within the approved ALCO guidelines. The return on assets in the flat and down 100 basis point shock are lower than the Board guideline of 1.25%. The return on equity in the down 100 basis point shock is lower than the Board minimum guideline of 12.00%. The simulations of earnings do not incorporate any management actions, which might moderate the negative consequences of interest rate deviations. Therefore, they do not reflect likely actual results, but serve as conservative estimates of interest rate risk. Any further drops in interest rates would not be in the best interests of the Company. Noninterest income and expenses in the simulation are based on the budget for 2011 and will change over the course of the next twelve months as management actions are taken in response to current economic conditions and operational changes.
Liquidity. Managing liquidity risk is essential to maintaining both depositor confidence and stability in earnings. Liquidity is a measurement of the Company's ability to meet potential cash requirements, including ongoing commitments to fund deposit withdrawals, repay borrowings, fund investment and lending activities, and for other general business purposes. The Company's principal sources of funds are deposits, amortization and prepayment of loans and securities, maturities of investment securities and other short-term investments, sales of securities and loans available-for-sale, earnings and funds provided from operations. Maintaining a relatively stable funding base, which is achieved by diversifying funding sources, competitively pricing deposit products and extending the contractual maturity of liabilities, reduces the Company's exposure to rollover risk on deposits and limits reliance on volatile short-term purchased funds. Short-term funding needs arise from declines in deposits or other funding sources, funding of loan commitments, draws on lines of credit, requests for new loans and extraordinary regulatory demands, such as the required three year prepayment of FDIC assessments in 2009. The Company's strategy is to fund assets, to the maximum extent possible, with core deposits that provide a sizable source of relatively stable and low-cost funds. The Company has seasonal short-term funding needs which are normally satisfied by short-term FHLB of Boston advances or utilization of Federal Funds Purchased lines.
For the year ended December 31, 2010, the Company's ratio of average total net loans to average deposits was 97.7% compared to the average for the year ended December 31, 2009 of 98.2%. The 2010 and 2009 average total loans to average deposits ratios are higher than historical ratios but are consistent with management's philosophy, given low short-term investment interest rates available and the active daily role taken in managing liquidity by the senior managers of the Company. The Company's deposit base continued to grow with the addition of two new full service
Union Bankshares, Inc. 2010 Annual Report 76
branches in the third quarter of 2008 and the sale of the largest domiciled bank in Vermont effective January 1, 2009 to a larger regional organization. People seem to have rediscovered the benefits of doing business with a locally owned community bank and our Company has benefited. Also, the continuing practice of selling qualified long-term, low-rate residential mortgages to the secondary market has assisted liquidity management efforts and the majority of loans being generated by the new South Burlington loan center are being sold as well.
As a member of the FHLB of Boston, Union has access to preapproved lines of credit of $1.6 million at December 31, 2010 over and above the $29.0 million term advances already drawn on the line, based on a FHLB of Boston estimate as of that date. This line of credit can be used for either short-term or long-term liquidity or other needs. The December 31, 2010 analysis by FHLB of Boston shows additional borrowing capacity for Union Bank of approximately $19.9 million which would require additional purchase of FHLB of Boston Class B common stock as well as the evaluation by FHLB of Boston of the underlying collateral available. At December 31, 2010, Union maintains $10.5 million preapproved Federal Funds lines of credit with upstream correspondent banks and access to the Federal Reserve Discount window, which would require pledging of qualified assets. There were no balances outstanding on either the federal funds purchases line or at the discount window at December 31, 2010.
Union is a member of the Certificate of Deposit Account Registry Service (“CDARS”) and the Insured Cash Sweep (ICS) programs of Promontory Interfinancial Network, which allow Union to provide higher FDIC deposit insurance to customers by exchanging time and/or money market deposits with other members and also allow Union to purchase deposits from other members as another source of funding. There were no purchased deposits at either December 31, 2010 or 2009, although Union exchanged $9.8 million and $13.6 million of deposits, respectively, with other CDARS members at those dates in order to provide our customers with full FDIC insurance coverage.
Union maintains an IDEAL Way Line of Credit with the FHLB of Boston. The total line available was $551 thousand at December 31, 2010 and 2009. There were no borrowings against this line of credit at either year-end. Interest on these borrowings is chargeable at a rate determined by the FHLB of Boston and payable monthly. Should Union utilize this line of credit, qualified portions of the loan and investment portfolios would collateralize these borrowings.
Union has also been approved in March 2011 for a $15 million repurchase line of credit which further strengthens its liquidity contingency options in the future.
While scheduled loan and securities payments and FHLB of Boston advances are relatively predictable sources of funds, deposit flows and prepayments on loans and mortgage-backed securities are greatly influenced by market interest rates, economic conditions, and competition. The Company's liquidity is actively managed on a daily basis, monitored by the ALCO, and reviewed monthly with the subsidiary's Board of Directors. The ALCO measures the Company's marketable assets and credit available to fund liquidity requirements and compares the adequacy of that aggregate amount against the aggregate amount of the Company's interest sensitive or volatile liabilities, such as core deposits and time deposits in excess of $100,000, borrowings and term deposits with short maturities, and credit commitments outstanding. The primary objective is to manage the Company's liquidity position and funding sources in order to ensure that it has the ability to meet its ongoing commitments to its depositors, to fund loan commitments and unused lines of credit and to maintain a portfolio of investment securities.
The Company's management monitors current and projected cash flows and adjusts positions as necessary to maintain adequate levels of liquidity. Although approximately 74.3% of time deposits will mature within twelve months, that level is in line with the preceding four years, which ranged from 70.6% to 87.8%. The deposit gathering activities of financial institutions generally have been affected by the low interest rates which earlier in the recession made customers reluctant to lock in funds for a longer term but short-term rates have dropped so low during the last two years that we are seeing customers extend out in order to receive a better rate. Since the federal funds target rate has remained unchanged at a historic low of 0.00% to 0.25% during the last two years, as customers' time deposits matured, the rollover interest rate available to those customers is most often lower than their previous deposit rate and therefore the cost of funding has continued to drop. This phenomenon is happening throughout the banking industry and the Company is optimistic that it can maintain and grow its customer deposit base through good customer service, new deposit products offered, competitive but prudent pricing strategy and the continued expansion of the branch network . Management believes the introduction of more electronic options for deposit products and their off premise utilization through the internet will also assist in the growth of the deposit base. The relationships developed with local municipalities, businesses and
Union Bankshares, Inc. 2010 Annual Report 77
retail customers and the variety of deposit products offered should, in management's view, help to ensure that Union will retain a substantial portion of these deposits. Management will continue to offer a competitive but prudent pricing strategy to facilitate retention of such deposits.
A reduction in total deposits could be offset by purchases of federal funds, purchase of brokered deposits in the form of one-way CDARS deposits, short-or long-term FHLB borrowings, utilization of the Federal Reserve discount window or liquidation of investment securities available-for-sale, loans held for sale, or brokerage certificates of deposit. Such steps could result in an increase in the Company's cost of funds or a decrease in the yield earned on assets and therefore adversely impact the net interest spread and margin. Management believes the Company has sufficient liquidity to meet all reasonable borrower, depositor and creditor needs in the present economic environment. However, any projections of future cash needs and flows are subject to substantial uncertainty. Management continually evaluates opportunities to buy/sell securities available-for-sale and loans held for sale, to participate out loans and lines of credit, obtain credit facilities from lenders and restructure debt for strategic reasons or to further strengthen the Company's financial position.
Capital Resources. Capital management is designed to maintain an optimum level of capital in a cost-effective structure that meets target regulatory ratios; supports management's internal assessment of economic capital; funds the Company's short and long-term business strategies; and builds long-term stockholder value. Dividends are generally in line with long-term trends in earnings per share and conservative earnings projections, while sufficient profits are retained to support anticipated business growth, fund strategic investments and provide continued support for deposits. The Company and its subsidiary are considered well capitalized under the capital adequacy requirements to which they are subject. The Company continues to evaluate growth opportunities, both through internal growth or potential acquisitions. The dividend payouts and treasury stock purchases of the last few years reflect the Board's desire to utilize our capital for the benefit of the stockholders until the right growth opportunities are found.
The total dollar value of the Company's stockholders' equity increased from $41.2 million at December 31, 2009 to $41.7 million at December 31, 2010, reflecting net income of $5.6 million for 2010 and a $25 thousand increase due to the issuance of stock options, a decrease in the net unrealized other comprehensive gain of $184 thousand on investment securities available-for-sale, an increase of $326 thousand in the net other comprehensive loss attributable to the unfunded defined benefit pension liability, cash dividends paid of $4.5 million, and the purchase of 5,504 shares of treasury stock during 2010 totaling $99 thousand.
The Company has 7,500,000 shares of $2.00 par value common stock authorized. As of December 31, 2010, the Company had 4,921,786 shares issued, of which 4,455,704 were outstanding and 466,082 were held in treasury. Also as of December 31, 2010, there were outstanding employee incentive stock options with respect to 5,000 shares of the Company's common stock, granted under the Company's 1998 Incentive Stock Option Plan, all of which were exercisable, and options with respect to 10,000 shares granted under the 2008 Incentive Stock Option Plan, of which 4,000 were exercisable. Incentive stock options up to 50,000 shares (subject to antidilution adjustments) may be granted under the 2008 Plan, of which 40,000 shares are available for future grants.
In 2005, the Company adopted a stock repurchase program, which was most recently reauthorized on March 19, 2008. The Board of Directors had authorized the repurchase of up to 100,000 shares of common stock, or approximately 2.2%, of the Company's outstanding shares, for an aggregate repurchase cost not to exceed $2.15 million. The repurchase program ended during the first quarter of 2010 when the 100,000 share level was reached for a total cost of $2.0 million since the inception of the program, including the 500 shares repurchased in 2010, for a total cost $9 thousand. In May 2010, the Company adopted a limited stock repurchase plan to authorize the repurchase of up to 2,500 shares of its common stock each calendar quarter in open market purchases or privately negotiated transactions, as management may deem advisable and as market conditions may warrant. The repurchase authorization for a calendar quarter expires at the end of that quarter to the extent it has not been exercised, and is not carried forward into future quarters. The quarterly repurchase authorization expires on December 31, 2011. The Company repurchased 5,004 shares under this program, for a total cost of $90 thousand in 2010.
For the Company total capital to risk weighted assets was 15.1% at December 31, 2010 and 15.3% at December 31, 2009. Tier I capital to risk weighted assets was 13.9%, at December 31, 2010 and 14.1% at December 31, 2009 and Tier I capital to average assets was 9.7% at both December 31, 2010 and 2009. Union is categorized as well capitalized under the regulatory framework and the Company is well over the minimum capital requirements. The Company remains
Union Bankshares, Inc. 2010 Annual Report 78
focused on long-term growth and above-average shareholder return. It has become more important than ever in today's economic environment for banks to ensure and plan ahead to maintain strong capital reserves.
Impact of Inflation and Changing Prices. The Company's consolidated financial statements have been prepared in accordance with U.S. generally accepted accounting principles, which allow for the measurement of financial position and results of operations in terms of historical dollars, without considering changes in the relative purchasing power of money over time due to inflation. Banks have asset and liability structures that are essentially monetary in nature, and their general and administrative costs constitute relatively small percentages of total expenses. Thus, increases in the general price levels for goods and services have a relatively minor effect on the Company's total expenses but could have an impact on our loan customers' financial condition. Interest rates have a more significant impact on the Company's financial performance than the effect of general inflation. During the last twenty-seven months, the Federal Reserve maintained a target federal funds rate of 0.00% to 0.25% while the U.S. prime rate, which is the base rate that banks use in pricing short-term maturity commercial loans to their best, or most creditworthy, customers remained at 3.25%. The target federal funds rate has never been this low and the last time the prime rate was at 3.25% was in 1955. These market rates are out of the Company's control but have a dramatic impact on net interest income.
Interest rates do not necessarily move in the same direction or change in the same magnitude as the prices of goods and services, although periods of increased inflation may accompany a rising interest rate environment. Inflation in the price of goods and services, while not having a substantial impact on the operating results of the Company, does affect all customers and therefore may impact their ability to keep funds on deposit or make loan payments in a timely fashion. The Company is aware of this risk and evaluates that risk along with others in making business decisions. Unprecedented deficit spending by federal, state and local governments may have unanticipated impacts on interest rates or inflation in future periods that could have an unfavorable impact on the future operating results of the Company.
Regulatory Matters. The Company and its subsidiary bank are subject to periodic examinations by the various regulatory agencies. These examinations include, but are not limited to, procedures designed to review lending practices, risk management, credit quality, liquidity, compliance and capital adequacy. During both 2009 and 2010, the Federal Deposit Insurance Corporation performed various examinations of Union pursuant to their regular, periodic regulatory reviews, including a Community Reinvestment Act review for which Union received an outstanding rating. No comments were received during any of the examinations that would have a material adverse effect on the Company's or Union's financial condition, liquidity, capital resources, or results of operations.
Union Bankshares, Inc. 2010 Annual Report 79
MARKET FOR UNION BANKSHARE'S COMMON STOCK AND RELATED STOCKHOLDER MATTERS
On March 15, 2011, there were 4,455,704 shares of common stock outstanding held by 647 stockholders of record. The number of stockholders does not reflect the number of beneficial owners, including persons or entities who may hold the stock in nominee or “street name”.
Union Bankshares' common stock is listed on the NASDAQ Global Market trading under the symbol UNB.
2010 | 2009 | ||||||||||||||||||||||
High | Low | Dividends | High | Low | Dividends | ||||||||||||||||||
First Quarter | $ | 19.82 | $ | 17.00 | $ | 0.25 | $ | 19.24 | $ | 15.02 | $ | 0.25 | |||||||||||
Second Quarter | $ | 19.00 | $ | 17.44 | $ | 0.25 | $ | 16.99 | $ | 13.00 | $ | 0.25 | |||||||||||
Third Quarter | $ | 18.48 | $ | 17.40 | $ | 0.25 | $ | 18.88 | $ | 14.34 | $ | 0.25 | |||||||||||
Fourth Quarter | $ | 18.25 | $ | 17.73 | $ | 0.25 | $ | 18.00 | $ | 15.08 | $ | 0.25 | |||||||||||
On January 19, 2011, the Company declared a regular dividend of $0.25 per share to stockholders of record as of January 29, 2011, payable February 10, 2011.
Form 10-K
A copy of the Company's Form 10-K Report for the year ended December 31, 2010 filed with the Securities and Exchange Commission may be obtained without charge upon written request to:
Marsha A. Mongeon, Treasurer and Chief Financial Officer
Union Bankshares, Inc.
P.O. Box 667
Morrisville, VT 05661-0667
Or maybe be accessed on the Investor Relations page at www.unionbankvt.com.
Corporate Name: Union Bankshares, Inc.
Corporate Transfer Agent: Registrar & Transfer Company, 10 Commerce Drive, Cranford, NJ 07016
Union Bankshares, Inc. 2010 Annual Report 80

Union Bankshares, Inc. 2010 Annual Report 81

Union Bankshares, Inc. 2010 Annual Report 82