Attached files
| file | filename |
|---|---|
| 10-K - SBT BANCORP, INC. 10-K - SBT Bancorp, Inc. | a6658422.htm |
| EX-23 - EXHIBIT 23 - SBT Bancorp, Inc. | a6658422ex23.htm |
| EX-21 - EXHIBIT 21 - SBT Bancorp, Inc. | a6658422ex21.htm |
| EX-32.1 - EXHIBIT 32.1 - SBT Bancorp, Inc. | a6658422ex32_1.htm |
| EX-31.2 - EXHIBIT 31.2 - SBT Bancorp, Inc. | a6658422ex31_2.htm |
| EX-31.1 - EXHIBIT 31.1 - SBT Bancorp, Inc. | a6658422ex31_1.htm |
| EX-32.2 - EXHIBIT 32.2 - SBT Bancorp, Inc. | a6658422ex32_2.htm |
| EX-99.1 - EXHIBIT 99.1 - SBT Bancorp, Inc. | a6658422ex99_1.htm |
| EX-99.2 - EXHIBIT 99.2 - SBT Bancorp, Inc. | a6658422ex99_2.htm |
Exhibit 13
April 11, 2011
Dear Fellow Shareholders:
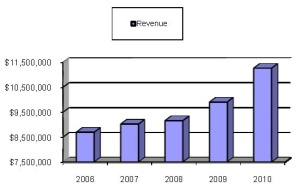
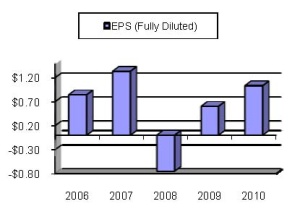
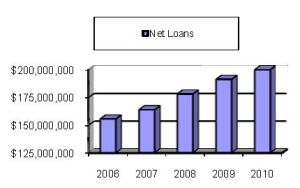
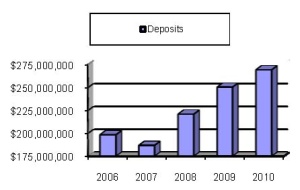
Simsbury Bank’s performance improved significantly in 2010. Net income increased 60% and fully diluted earnings per share increased 72%. Revenue grew strongly by 14% based on balance sheet and fee income growth. Total assets grew by 8% due to a similar increase in deposits as we welcomed new customers and an increase in business from existing customers. Net loans increased by 6% and gain on loans sold increased 284%.
We were pleased with the progress in expanding our capabilities to enhance our customers’ experience with us.
|
●
|
We invested in a stronger and deeper team of mortgage and consumer loan professionals who enabled us to expand our mortgage product offerings and improve our consumer loan systems and processes. Our mortgage team has built an infrastructure that will support our efforts to expand our loan origination activity throughout Central Connecticut.
|
|
●
|
We introduced new consumer deposit based products and services. Our Pinnacle Account, a relationship based offering of services and benefits, was well received by the market. We also introduced electronic delivery of deposit account statements and already over 25% of our online banking customers have selected e-statements as the way they prefer to receive their monthly statements. We made online banking enrollment much easier and found other ways to use technology to make our customers’ lives easier and our staff more productive and efficient.
|
|
●
|
We researched a variety of alternatives to streamline our small commercial loan process. We look forward to implementing some of these ideas for a more customer friendly loan underwriting, closing and monitoring process in 2011.
|
|
●
|
Finally, we focused on ensuring that our policies, processes and procedures are in strong shape for current and future business best practice and regulatory compliance standards. We feel confident that our commitment to a compliance culture and well controlled operating environment will support our growth in the future.
|
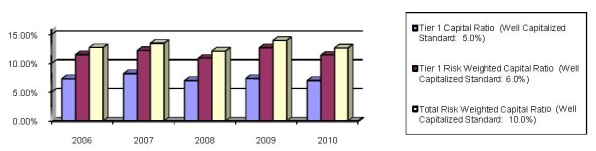
Simsbury Bank continues to benefit from its strong balance sheet. We have a relatively low-risk loan portfolio comprised of loans secured by conventionally underwritten residential mortgages and home equity loans (72%), commercial loans (26%), and consumer loans (2%). We have only modest exposure to the typically riskiest loan categories, construction and development loans and non-owner-occupied commercial real estate secured loans, which declined to approximately 8% from last year’s approximately 11% of total loans, well below many peer banks. Our deposit mix remains low cost and diversified with almost 34% demand deposits, 37% money market and savings deposits, and 29% certificates of deposit. Finally, our capital levels remain comfortably above levels qualifying the Bank as “well capitalized” from a regulatory perspective.
Earnings
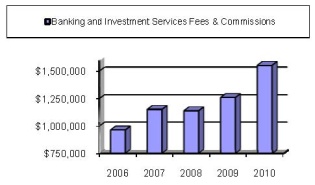
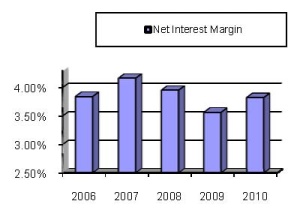
In 2010, Simsbury Bank’s total revenue increased 14% to $11.3 million from the prior year due to a 14% increase in net dividend and interest income to $10.2 million and a 17% increase in noninterest income to $1.8 million, partially offset by a 38% increase in loan loss provision to $0.76 million. Net interest and dividend revenue benefited from volume growth. Noninterest income benefited from a 6% increase in service charges and fees to $1.2 million and a 284% increase in loan sale gains to $0.2 million. As deposit growth of 8% exceeded our loan growth of 6%, our loan to deposit ratio decreased slightly to 76% at year-end 2010 from 78% at year-end 2009. Our close management of deposit costs and loan pricing resulted in an improvement in our net interest margin to 3.82% in 2010 from 3.56% in 2009.
 |
 |
 |
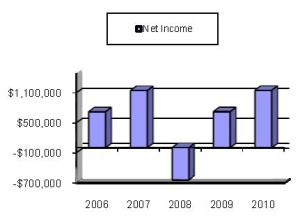
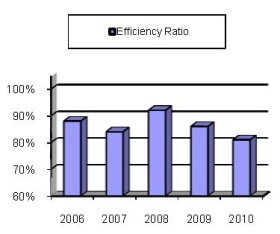
Thanks to the strong revenue growth and careful management of noninterest expenses, the Bank’s net income increased 60% to $1.1 million. Our efficiency ratio improved to 81% reflecting the benefits of our increased scale.
 |
 |
 |
Loans and Deposits
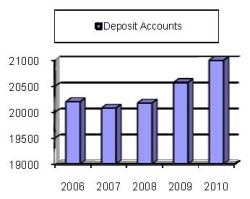
As noted above, 2010 was another excellent year for loan and deposit growth. Mortgage and consumer loans increased by approximately 8% while commercial loans increased by approximately 2%. The Bank’s deposit mix remains favorable and relationship based. Deposit growth was led by checking deposits and money market deposits with each increasing by almost 16% and by savings deposits which increased 5%. These increases were partially offset by an approximately 9% decrease in time deposits. The number of deposit accounts increased by almost 3%.
 |
 |
 |
Asset Quality
The Bank’s asset quality remains strong, both absolutely and compared to our competitors. Nonaccrual loans at year-end totaled $2.3 million, 27% lower than the prior year end. This resulted in the ratio of nonaccruals to total loans declining to 1.12% from 1.63%. Net charge offs increased to $640,000 (0.32% of average loans) as we moved aggressively to deal with problem loans. The Bank’s provision for loan losses totaled $755,000 compared to $547,000 in 2009. The allowance for loan and lease losses increased approximately 5% to $2.3 million, which continued to equal 1.14% of total loans and leases at year end.
- 2 -
Shareholder’s Equity and Capital
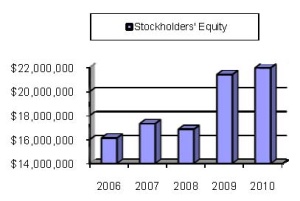
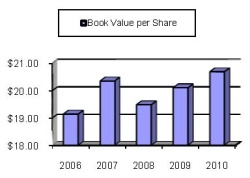
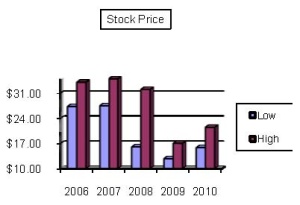
Shareholder’s equity increased through our retained earnings in 2010. Book value per share also improved. The Company’s stock price remains well below historic multiples of book value, as does that of most of our peers.
 |
 |
 |
We continue to manage our capital position to support revenue growth and remain comfortably “well capitalized” by regulatory standards.
 |
In Recognition
Lincoln S. Young retired as SBT’s Chairman of the Board of Directors upon reaching the Board’s mandatory retirement age in November 2010. Linc was one of the Bank’s founders and served as a director since 1994. He also served as Secretary prior to becoming Chairman in 2002. Linc’s strong leadership reflected his extensive banking and business experience and deep commitment to community banking values. We will miss Linc’s steady hand, wisdom and guidance and wish him well.
The Board was pleased to elect another founding director, Robert J. Bogino, as Chairman upon Linc’s retirement. Bob served as Secretary from 2002 to 2004 when he was elected Vice Chairman. Bob’s entrepreneurial business experience, focus on shareholder value and commitment to ensuring that Simsbury Bank continues to fulfill its mission will ensure that SBT continues to enjoy strong leadership.
Reflecting on 2010 and Looking Forward
2010 was another year of progress for Simsbury Bank. We continued to develop our bankers’ advisory skills and introduced new products and services that resulted in broader and deeper customer relationships. We had a terrific year in mortgage and consumer lending while also putting in place the infrastructure necessary to expand that business in 2010 and beyond.
We anticipate that significant change in the regulatory environment will continue as the provisions of the Dodd-Frank Act of 2010 are implemented. We strongly believe that our policymakers’ continuing focus on writing regulations appropriate for large banks then forcing small banks to comply with them only serves to undermine the benefits to the American economy of having many banks of all sizes. Unnecessary regulatory burdens on banks with simple business models like Simsbury Bank serve only to diminish choices for consumers and businesses. We will continue to advocate for an appropriate regulatory posture. And we will take all steps necessary to ensure that we comply with whatever regulatory requirements come our way.
- 3 -
Simsbury Bank has a bright future. Our board of directors, management and team members are united in our commitment to providing outstanding, personal service to our customers, being open for lending in good economic times and bad, and contributing to a healthy economy and quality of life for many years to come.
We will work hard to make 2011 another year of forward progress in helping our customers achieve their life goals, providing our shareholders with a competitive return, ensuring that our employees enjoy fulfilling jobs, and improving our communities’ quality of life.
Sincerely,
| /s/ Martin J. Geitz | /s/ Robert J. Bogino |
| Martin J. Geitz | Robert J. Bogino |
| President & Chief Executive Officer | Chairman of the Board of Directors |
- 4 -

Lincoln S. Young
Board Member 1994 to 2010
Chairman of the Board 2002 to 2010
The Board of Directors wishes to express its deep gratitude to Mr. Young for his dedicated service to Simsbury Bank. Mr. Young retired as Chairman of the Board in November 2010, having served in that capacity since 2002 and as a board member since 1994.
Mr. Young brought his long career in banking and business ownership to his roles with Simsbury Bank. His leadership during the capital raising period, early formation and ongoing operation of our institution has been critical to our success. His guiding principles through this time were to always maintain the highest standards of financial strength and to focus on the strong and steady expansion of Simsbury Bank in its marketplace and to its customer base, while ensuring an exceptional level of personalized customer service.
During Mr. Young’s service to Simsbury Bank, this institution successfully raised capital during a recession, opened to the public for banking business, conducted a very successful second stock offering and expanded its marketplace geographically as well as in the products and services available to our customers. The continued development of relationships with individuals, businesses and the community has provided families, businesses and not-for-profit organizations the financial resources to maintain and improve the quality of life and commerce in our community.
The directors, officers, employees, shareholders, customers and the communities we serve are grateful for and better because of Mr. Young’s dedication to Simsbury Bank. In honor of his service, the Board has elected Mr. Young as Director Emeritus and we look forward to his continued association with Simsbury Bank.
Thank you, Linc, for your vision of what Simsbury Bank could be and for generously committing
your talents in leading the way to its fulfillment.
- 5 -
Selected Financial and Other Data
|
At 12/31/10
|
At 12/31/09
|
At 12/31/08
|
||||||||||
|
Balance Sheet Data:
|
||||||||||||
|
Total assets
|
$ | 295,566,591 | $ | 273,738,573 | $ | 240,756,468 | ||||||
|
Loans, net
|
202,792,477 | 191,303,519 | 178,073,758 | |||||||||
|
Investment securities
|
46,948,797 | 50,642,016 | 33,628,012 | |||||||||
|
Federal funds sold, money market mutual
funds, and other interest-earning
deposits
|
23,707,092 | 8,876,984 | 7,550,417 | |||||||||
|
Deposits
|
269,279,026 | 250,445,682 | 220,879,117 | |||||||||
|
Stockholders’ equity
|
21,967,361 | 21,411,578 | 16,846,649 | |||||||||
|
For the Year
Ended 12/31/10
|
For the Year
Ended 12/31/09
|
For the Year
Ended 12/31/08
|
||||||||||
|
Statement of Income Data:
|
||||||||||||
|
Total interest and dividend income
|
$ | 12,054,857 | $ | 11,791,863 | $ | 11,064,810 | ||||||
|
Total interest expense
|
1,813,528 | 2,823,394 | 3,042,570 | |||||||||
|
Net interest and dividend income
|
10,241,329 | 8,968,469 | 8,022,240 | |||||||||
|
Provision for loan losses
|
755,000 | 547,000 | 450,000 | |||||||||
|
Net interest and dividend income after
provision for loan losses
|
9,486,329 | 8,421,469 | 7,572,240 | |||||||||
|
Gain on loans sold, net
|
226,580 | 58,928 | - | |||||||||
|
Write-down of available-for-sale
Securities
|
- | - | (1,755,600 | ) | ||||||||
|
Other noninterest income
|
1,776,981 | 1,522,020 | 1,601,042 | |||||||||
|
Noninterest expense
|
9,754,507 | 8,997,485 | 8,830,965 | |||||||||
|
Income tax expense (benefit)
|
362,094 | 227,713 | (768,459 | ) | ||||||||
|
Net income (loss)
|
1,146,709 | 718,291 | (644,824 | ) | ||||||||
|
Earnings (loss) per common share
|
$ | 1.03 | $ | 0.60 | $ | (0.75 | ) | |||||
|
Earnings (loss) per common share,
assuming dilution
|
$ | 1.03 | $ | 0.60 | $ | (0.75 | ) | |||||
|
Other Data:
|
||||||||||||
|
Net interest spread
|
3.66 | % | 3.32 | % | 3.56 | % | ||||||
|
Net interest margin
|
3.82 | % | 3.56 | % | 3.95 | % | ||||||
|
Return on average assets
|
0.42 | % | 0.27 | % | (0.30 | )% | ||||||
|
Return on average stockholders’ equity
|
5.16 | % | 3.49 | % | (3.71 | )% | ||||||
|
Dividend payout ratio
|
46.7 | % | 59.6 | % | n/a | |||||||
|
Average stockholders’ equity to
average assets
|
7.67 | % | 7.63 | % | 8.02 | % | ||||||
- 6 -
Management's Discussion and Analysis of
Financial Conditions and Results of Operations
Forward-Looking Statements
When used in this Annual Report or any press release, public announcement or filing, the words “intends,” “expects,” “plans,” “estimates,” “projects,” “believes,” “anticipates” and similar expressions are intended to identify forward-looking statements. The Company (defined below) has made and may continue to make various forward-looking statements with respect to earnings, credit quality and other financial and business matters for periods subsequent to December 31, 2010. All statements, other than statements of historical facts, are forward-looking statements. The Company cautions that these forward-looking statements are not guarantees of future performance and are subject to numerous assumptions, risks and uncertainties, and that statements relating to subsequent periods are subject to greater uncertainty because of the increased likelihood of changes in underlying factors and assumptions. Actual results could differ materially from forward-looking statements. In addition to those factors previously disclosed by the Company or the Bank (defined below) and those factors identified elsewhere herein, the following factors could cause actual results to differ materially from such forward-looking statements: competitive pressures on loan and deposit product pricing; other actions of competitors; changes in economic conditions; the extent and timing of actions of the Federal Reserve Board; customer deposit disintermediation; changes in customers' acceptance of the Bank's products and services; and the extent and timing of legislative and regulatory actions and reforms.
Please do not rely unduly on any forward-looking statement, as such statements speak only as of the date made and the Company undertakes no obligation to revise or update such statements to reflect events or circumstances after the date hereof or to reflect the occurrence of unanticipated events or circumstances.
General
This discussion is designed to assist you in better understanding the Company’s financial condition, results of operations, liquidity and capital resources and any significant changes and trends related thereto. This discussion should be read in conjunction with our financial statements.
SBT Bancorp, Inc. (the “Company”) is the holding company for The Simsbury Bank & Trust Company, Inc. (the “Bank”). The Company was incorporated in the State of Connecticut on February 17, 2006. The Company became the Bank’s sole shareholder pursuant to a reorganization that occurred on March 2, 2006. The Company’s only business is its investment in the Bank, which is a community-oriented financial institution providing a variety of banking and investment services.
The Bank was incorporated on April 28, 1992 and commenced operations as a Connecticut chartered bank on March 31, 1995. The Bank's deposit accounts are insured under the Federal Deposit Insurance Act, up to the maximum applicable limits thereof. The Bank is not a member of the Federal Reserve System. The Bank's main office and its corporate offices are located in the town of Simsbury, Connecticut. The Bank has branch offices in the towns of Granby, Avon, and Bloomfield, Connecticut. The Bank also maintains a business office in Canton, Connecticut. The Bank's customer base consists primarily of individual consumers and small businesses in north central Connecticut. The Bank has in excess of 21,150 deposit accounts.
The Bank offers a full range of commercial banking services to residents and businesses in its primary and secondary markets through a wide variety of mortgage programs, home equity lines and loans, FDIC-insured checking, savings, IRA accounts, and 401K rollover, as well as safe deposit and other customary non-deposit banking services. As of December 31, 2010, approximately 71% of the Bank's loans were secured by residential property located in Connecticut.
- 7 -
The Bank has two ATMs at its main office and at the Bloomfield branch, and one ATM at each of its other branch/business office locations. The ATMs generate activity fees based upon utilization by other banks' customers. The Bank offers investment products to customers through SBT Investment Services, Inc., a wholly-owned subsidiary of the Bank, and through its affiliation with the securities broker/dealer LPL Financial Services Corporation.
The Bank earned net income of $1,146,709 for the year ended December 31, 2010, compared to $718,291 for the year ended December 31, 2009, an increase of 60%. Net income available to common shareholders after preferred dividends was $889,709, or $1.03 per diluted share, for the year ended December 31, 2010, compared to $552,369, or $0.60 per diluted share, for the year ended December 31, 2009, an increase in diluted earnings per share of 72%. Key items for the year ended December 31, 2010 compared to the year ended December 31, 2009 included the following: Earnings per share increased by 72%; total revenues increased by 14%; core deposits increased by 14%; total loans outstanding increased by 6%; taxable equivalent net interest margin increased by 26 basis points to 3.82%, from 3.56%; total non-accrual loans and loans 30 days or more days past due decreased to 1.39% from 1.80% of loans outstanding; allowance for loan losses ended the 2010 year at 1.14% of total loans outstanding; and capital ratios remained well above regulatory standards for a “well capitalized” bank.
Results of Operations for the Years Ended December 31, 2010, 2009, and 2008
Net Interest Income and Net Interest Margin
The Bank’s earnings depend largely upon the difference between the income received from its loan portfolio and investment securities and the interest paid on its liabilities, mainly interest paid on deposits. This difference is “net interest income.” The net interest income, when expressed as a percentage of average total interest-earning assets, is referred to as the net interest margin. The Bank’s net interest income is affected by the change in the level and the mix of interest-earning assets and interest-bearing liabilities, referred to as volume changes. The Bank’s net interest margin is also affected by changes in yields earned on assets and rates paid on liabilities, referred to as rate changes. Interest rates charged on the Bank’s loans are affected principally by the demand for such loans, the supply of money available for lending purposes and competitive factors. These factors are in turn affected by general economic conditions and other factors beyond the Bank’s control, such as federal economic policies, the general supply of money in the economy, legislative tax policies, governmental budgetary matters, and the actions of the Federal Reserve.
Net interest and dividend income after provision for loan losses totaled $9,486,329 in 2010, which is an increase of $1,064,860, or 12.6%, from 2009. Earning assets have grown from $256 million on December 31, 2009 to $273 million at December 31, 2010. The Bank’s net interest spread and net interest margin increased to 3.66% and 3.82%, respectively, during 2010 as compared to 3.32% and 3.56%, respectively, during 2009. This was primarily due to the historically low level of interest rates prevalent for much of the year.
The following table presents the average amounts outstanding for the major categories of the Bank’s interest-earning assets and interest-bearing liabilities and the average interest rates earned or paid thereon for the years ended December 31, 2010, 2009 and 2008.
- 8 -
|
NET INTEREST INCOME
|
||||||||||||
|
(Dollars in thousands)
|
||||||||||||
|
For the Year Ended 12/31/10
|
||||||||||||
|
Average
Balance
|
(1)
Interest
|
Yield
|
||||||||||
|
Federal funds sold and overnight deposits
|
$ | 14,192 | $ | 32 | 0.23 | % | ||||||
|
Investments (1)
|
57,342 | 1,974 | 3.44 | |||||||||
|
Mortgage loans
|
106,578 | 5,500 | 5.16 | |||||||||
|
Commercial loans
|
49,904 | 2,714 | 5.44 | |||||||||
|
Consumer loans
|
45,177 | 2,038 | 4.51 | |||||||||
|
Term federal funds sold
|
- | - | - | |||||||||
|
Total loans
|
201,659 | 10,252 | 5.08 | % | ||||||||
|
Total interest-earning assets
|
$ | 273,193 | $ | 12,258 | 4.49 | % | ||||||
|
NOW deposits
|
$ | 35,729 | $ | 40 | 0.11 | % | ||||||
|
Savings deposits
|
103,179 | 585 | 0.57 | |||||||||
|
Time deposits
|
76,286 | 1,149 | 1.51 | |||||||||
|
Total interest-bearing deposits
|
215,194 | 1,774 | 0.82 | |||||||||
|
Securities sold under agreements to
repurchase
|
3,434 | 40 | 1.16 | |||||||||
|
Federal Home Loan Bank advances
|
51 | - | - | |||||||||
|
Total interest-bearing liabilities
|
$ | 218,679 | $ | 1,814 | 0.83 | % | ||||||
|
Net interest income
|
$ | 10,444 | ||||||||||
|
Net interest spread
|
3.66 | % | ||||||||||
|
Net interest margin
|
3.82 | % | ||||||||||
|
For the Year Ended 12/31/09
|
||||||||||||
|
Average
Balance
|
(1)
Interest
|
Yield
|
||||||||||
|
Federal funds sold and overnight deposits
|
$ | 14,829 | $ | 25 | 0.17 | % | ||||||
|
Investments (1)
|
57,629 | 2,106 | 3.65 | |||||||||
|
Mortgage loans
|
100,650 | 5,444 | 5.41 | |||||||||
|
Commercial loans
|
49,657 | 2,759 | 5.56 | |||||||||
|
Consumer loans
|
33,507 | 1,615 | 4.82 | |||||||||
|
Term federal funds sold
|
227 | 3 | 1.32 | |||||||||
|
Total loans
|
184,041 | 9,821 | 5.34 | |||||||||
|
Total interest-earning assets
|
$ | 256,499 | $ | 11,952 | 4.66 | % | ||||||
|
NOW deposits
|
$ | 32,670 | $ | 37 | 0.11 | % | ||||||
|
Savings deposits
|
86,423 | 656 | 0.76 | |||||||||
|
Time deposits
|
90,322 | 2,115 | 2.34 | |||||||||
|
Total interest-bearing deposits
|
209,415 | 2,808 | 1.34 | |||||||||
|
Securities sold under agreements to
repurchase
|
980 | 8 | 0.82 | |||||||||
|
Federal Home Loan Bank advances
|
227 | 7 | 3.08 | |||||||||
|
Total interest-bearing liabilities
|
$ | 210,622 | $ | 2,823 | 1.34 | % | ||||||
|
Net interest income
|
$ | 9,129 | ||||||||||
|
Net interest spread
|
3.32 | % | ||||||||||
|
Net interest margin
|
3.56 | % | ||||||||||
- 9 -
|
NET INTEREST INCOME
|
||||||||||||
|
(Dollars in thousands)
|
||||||||||||
|
For the Year Ended 12/31/08
|
||||||||||||
|
Average
Balance
|
(1)
Interest
|
Yield
|
||||||||||
|
Federal funds sold and overnight deposits
|
$ | 3,812 | $ | 201 | 5.27 | % | ||||||
|
Investments (1)
|
33,092 | 1,597 | 4.83 | |||||||||
|
Mortgage loans
|
78,901 | 4,343 | 5.50 | |||||||||
|
Commercial loans
|
38,528 | 2,747 | 7.13 | |||||||||
|
Consumer loans
|
39,864 | 2,566 | 6.44 | |||||||||
|
Term federal funds sold
|
33 | 1 | 3.03 | |||||||||
|
Total loans
|
157,326 | 9,657 | 6.14 | |||||||||
|
Total interest-earning assets
|
$ | 194,230 | 11,455 | 5.90 | ||||||||
|
NOW deposits
|
$ | 27,764 | $ | 51 | 0.18 | % | ||||||
|
Savings deposits
|
57,754 | 546 | 0.95 | |||||||||
|
Time deposits
|
65,016 | 2,758 | 4.24 | |||||||||
|
Total interest-bearing deposits
|
150,534 | 3,355 | 2.23 | |||||||||
|
Securities sold under agreements to
repurchase
|
1,529 | 37 | 2.42 | |||||||||
|
Federal Home Loan Bank advances
|
1,632 | 85 | 5.21 | |||||||||
|
Total interest-bearing liabilities
|
$ | 153,695 | $ | 3,477 | 2.26 | % | ||||||
|
Net interest income
|
$ | 7,978 | ||||||||||
|
Net interest spread
|
3.64 | % | ||||||||||
|
Net interest margin
|
4.11 | % | ||||||||||
|
(1)
|
On a fully taxable equivalent basis based on a tax rate of 34%. Interest income on investments includes a fully taxable equivalent adjustment of $203,000 in 2010, $161,000 in 2009, and $143,000 in 2008.
|
The following table sets forth the effects of changing rates and volumes on our net interest income. The rate column shows the effects attributable to changes in rate (changes in rate multiplied by prior volume). The volume column shows the effects attributable to changes in volume (changes in volume multiplied by prior rate). The net column represents the sum of the rate column and the volume column. For purposes of this table, changes attributable to changes in both rate and volume that cannot be segregated have been allocated proportionally based on the changes due to rate and the changes due to volume.
- 10 -
|
Year Ended December 31, 2010
Compared to
Year Ended December 31, 2009
|
Year Ended December 31, 2009
Compared to
Year Ended December 31, 2008
|
|||||||||||||||||||||||
|
Increase (Decrease)
Due to
|
Increase (Decrease)
Due to
|
|||||||||||||||||||||||
|
Volume
|
Rate
|
Net
|
Volume
|
Rate
|
Net
|
|||||||||||||||||||
|
(In thousands)
|
||||||||||||||||||||||||
|
Interest and dividend income:
|
||||||||||||||||||||||||
|
Federal funds sold and overnight
|
||||||||||||||||||||||||
|
deposits
|
$ | (1 | ) | $ | 9 | $ | 8 | $ | 175 | $ | (294 | ) | $ | (119 | ) | |||||||||
|
Investments
|
(10 | ) | (122 | ) | (132 | ) | 1,090 | (235 | ) | 855 | ||||||||||||||
|
Loans
|
785 | (354 | ) | 431 | 396 | (387 | ) | 9 | ||||||||||||||||
|
Total interest-earning assets
|
774 | (467 | ) | 307 | 1,661 | (916 | ) | 745 | ||||||||||||||||
|
Interest expense:
|
||||||||||||||||||||||||
|
NOW deposits
|
3 | - | 3 | 5 | (13 | ) | (8 | ) | ||||||||||||||||
|
Savings deposits
|
233 | (304 | ) | (71 | ) | (1,765 | ) | 1,704 | (61 | ) | ||||||||||||||
|
Time deposits
|
(293 | ) | (673 | ) | (966 | ) | (536 | ) | 437 | (99 | ) | |||||||||||||
|
Total interest-bearing deposits
|
(57 | ) | (977 | ) | (1,034 | ) | (2,296 | ) | 2,128 | (168 | ) | |||||||||||||
|
Securities sold under agreements to
|
||||||||||||||||||||||||
|
repurchase
|
27 | 5 | 32 | (17 | ) | (23 | ) | (40 | ) | |||||||||||||||
|
FHLB advances
|
(2 | ) | (4 | ) | (6 | ) | (11 | ) | 1 | (10 | ) | |||||||||||||
|
Total interest-bearing liabilities
|
(32 | ) | (976 | ) | (1,008 | ) | (2,324 | ) | 2,106 | (218 | ) | |||||||||||||
|
Net change in interest income
|
$ | 806 | $ | 509 | $ | 1,315 | $ | 3,985 | $ | (3,022 | ) | $ | 963 | |||||||||||
Provision for Loan Losses
Provisions for loan losses are charged to earnings to bring the total allowance for loan losses to a level deemed appropriate by the Bank’s management (“Management”) based on such factors as historical experience, the volume and type of lending conducted by the Bank, the amount of non-performing loans, regulatory policies, generally accepted accounting principles, general economic conditions, and other factors related to the collectability of loans in the Bank’s portfolio.
Each month the Bank reviews the allowance for loan losses and makes additional provisions to the allowance, as needed. For the year ended December 31, 2010, the allowance increased $114,386, net of charge-offs and recoveries. The total allowance for loan losses at December 31, 2010 was $2,325,687 or 1.14% of outstanding loans. This compares with a total allowance for loan losses of $2,211,301 at year-end 2009, which represented 1.14% of outstanding loans. With the exclusion of loans to financial institutions (term federal funds sold), this ratio was 1.14% at year-end 2010 and 2009. During 2010, the Bank charged off eight loans for a total of $646,761 compared to 2009 when it charged off fifteen loans for a total of $358,097. The Bank recovered five loans for $6,147 in 2010 and five loans for $5,253 in 2009. Management believes the allowance for loan losses is adequate.
Noninterest Income and Noninterest Expense
The following table sets forth the various components of the Bank’s noninterest income (charges) and noninterest expense for the years ended December 31, 2010, 2009, and 2008.
- 11 -
|
NONINTEREST INCOME (CHARGES)
|
|
For Year
Ended
12/31/10
|
% of Income
excluding Write-down
|
For Year
Ended
12/31/09
|
% of Income
excluding Write-down
|
For Year
Ended
12/31/08
|
% of Income
excluding Write-down
|
|||||||||||||||||||
|
Service charges on
deposit accounts
|
$ | 523,770 | 29.5 | % | $ | 544,054 | 35.7 | % | $ | 479,210 | 29.9 | % | ||||||||||||
|
Safe deposit fees
|
80,230 | 4.5 | 80,968 | 5.3 | 74,039 | 4.6 | ||||||||||||||||||
|
Business manager income
|
116,338 | 6.5 | 109,425 | 7.2 | 129,232 | 8.1 | ||||||||||||||||||
|
Gain on loans sold, net
|
226,580 | 12.8 | 58,928 | 3.9 | - | - | ||||||||||||||||||
|
SBT Investment Services, Inc
|
114,046 | 6.4 | 100,910 | 6.6 | 82,295 | 5.2 | ||||||||||||||||||
|
Other income
|
716,017 | 40.3 | 627,735 | 41.3 | 836,266 | 52.2 | ||||||||||||||||||
|
Noninterest income
excludes write-down
|
1,776,981 | 100.0 | % | 1,522,020 | 100.0 | % | 1,601,042 | 100.0 | % | |||||||||||||||
|
Write-down of securities available- for-sale
|
- | - | (1,755,600 | ) | ||||||||||||||||||||
|
Total noninterest income (charges)
|
$ | 1,776,981 | $ | 1,522,020 | $ | (154,558 | ) | |||||||||||||||||
|
NONINTEREST EXPENSE
|
|
For Year
Ended
12/31/10
|
% of
Total
|
For Year
Ended
12/31/09
|
% of
Total
|
For Year
Ended
12/31/08
|
% of
Total
|
|||||||||||||||||||
|
Salaries and employee benefits
|
$ | 4,818,836 | 49.4 | % | $ | 4,165,247 | 46.3 | % | $ | 4,284,603 | 48.5 | % | ||||||||||||
|
Occupancy expense
|
1,133,024 | 11.6 | 1,128,436 | 12.5 | 1,287,076 | 14.5 | ||||||||||||||||||
|
Equipment expense
|
287,414 | 2.9 | 349,935 | 3.7 | 411,703 | 4.7 | ||||||||||||||||||
|
Impairment of operating lease
|
- | - | - | - | 298,657 | 3.4 | ||||||||||||||||||
|
Professional fees
|
722,772 | 7.4 | 513,000 | 5.7 | 407,597 | 4.6 | ||||||||||||||||||
|
Advertising and promotions
|
407,944 | 4.2 | 398,365 | 4.4 | 384,404 | 4.4 | ||||||||||||||||||
|
Forms and supplies
|
146,103 | 1.5 | 185,882 | 2.1 | 152,212 | 1.7 | ||||||||||||||||||
|
Insurance
|
471,606 | 4.8 | 575,120 | 6.4 | 200,750 | 2.3 | ||||||||||||||||||
|
Loan expenses
|
199,443 | 2.0 | 94,742 | 1.1 | 68,393 | 0.8 | ||||||||||||||||||
|
Postage
|
97,779 | 1.0 | 103,912 | 1.2 | 151,522 | 1.7 | ||||||||||||||||||
|
Other expenses
|
1,469,586 | 15.2 | 1,482,846 | 16.6 | 1,184,048 | 13.4 | ||||||||||||||||||
|
Total
|
$ | 9,754,507 | 100.0 | % | $ | 8,997,485 | 100.0 | % | $ | 8,830,965 | 100.0 | % | ||||||||||||
Noninterest income for the twelve months ended December 31, 2010 increased by approximately $255,000 to $1,776,981 from $1,522,020 for the twelve months ended December 31, 2009. This increase was due primarily to an increase of approximately $168,000 in gains on loans sold. For the twelve months ended December 31, 2009, noninterest income decreased by approximately $79,000, excluding the write-down of securities available for sale, when compared to the twelve months ended December 31, 2008. The 2009 decrease in noninterest income was due primarily to a decrease of approximately $247,000 in cash surrender value of bank owned life insurance (“BOLI”) and BOLI death benefit income, which was partially offset by an increase in service charges on deposit accounts. Total noninterest income (charges) was a loss in 2008 due to the write-down of securities available-for-sale. Management deemed the value of Fannie Mae and Freddie Mac preferred stock holdings to be other-than-temporarily impaired.
At December 31, 2010, the Bank had 21,174 deposit accounts, an increase of 658 accounts or 3.2% over the number of accounts at year-end 2009 and approximately 1,000 accounts more than at year-end 2008. SBT Investment Services, Inc.’s revenues increased by approximately $13,000 in 2010 compared to 2009.
Noninterest expense for the year ended December 31, 2010 was approximately $9,755,000, an increase of approximately $758,000 or 8% over 2009. Noninterest expense for the year ended December 31, 2009 was approximately $8,997,000, which represents an increase of 2% over noninterest expense for 2008. The increase in 2010 was primarily related to an approximately $654,000 increase in salary and benefits and an approximately $210,000 increase in professional fees as the Bank made preparations for future growth.
- 12 -
Salaries and employee benefits comprised 49% of total noninterest expense during 2010, as compared to 46% in 2009. Occupancy expense and equipment expense, at approximately 14% in 2010 and 16% in 2009, continue to be the other major categories of noninterest expense.
Financial Condition at Years Ended December 31, 2010, 2009 and 2008
The following table sets forth the average balances of each principal category of our assets, liabilities and capital accounts for the years ended December 31, 2010, 2009 and 2008.
|
Distribution of Assets, Liabilities and Stockholders’ Equity
|
|||||||||||||||||||
|
(Dollars in thousands)
|
|
For the Year Ended
12/31/10
|
For the Year Ended
12/31/09
|
For the Year Ended
12/31/08
|
||||||||||||||||||||||
|
Average
Balance
|
Percent of
Total
Assets
|
Average
Balance
|
Percent of
Total
Assets
|
Average
Balance
|
Percent of
Total
Assets
|
|||||||||||||||||||
|
Assets
|
||||||||||||||||||||||||
|
Cash and due from banks
|
$ | 8,221 | 2.8 | % | $ | 7,280 | 2.7 | % | $ | 7,682 | 3.6 | % | ||||||||||||
|
Investment securities
|
58,211 | 20.1 | 57,881 | 21.4 | 22,873 | 10.5 | ||||||||||||||||||
|
Federal funds sold and overnight
deposits
|
14,086 | 4.9 | 14,829 | 5.5 | 9,717 | 4.5 | ||||||||||||||||||
|
Loans, net
|
199,358 | 68.8 | 181,929 | 67.5 | 171,723 | 79.1 | ||||||||||||||||||
|
Premises and equipment
|
643 | 0.2 | 787 | 0.3 | 1,072 | 0.5 | ||||||||||||||||||
|
Accrued interest and other assets
|
9,081 | 3.2 | 6,909 | 2.6 | 3,960 | 1.8 | ||||||||||||||||||
|
Total assets
|
$ | 289,600 | 100.0 | % | $ | 269,615 | 100.0 | % | $ | 217,027 | 100.0 | % | ||||||||||||
|
Liabilities and Stockholders' Equity
|
||||||||||||||||||||||||
|
Deposits
|
||||||||||||||||||||||||
|
Demand and NOW deposits
|
$ | 83,348 | 28.8 | % | $ | 70,154 | 26.0 | % | $ | 64,953 | 29.9 | % | ||||||||||||
|
Savings deposits
|
103,179 | 35.6 | 86,423 | 32.1 | 65,706 | 30.3 | ||||||||||||||||||
|
Time deposits
|
76,286 | 26.4 | 90,322 | 33.5 | 65,755 | 30.3 | ||||||||||||||||||
|
Total deposits
|
262,813 | 90.8 | 246,899 | 91.6 | 196,414 | 90.5 | ||||||||||||||||||
|
Accrued interest and other liabilities
|
4,576 | 1.6 | 2,146 | 0.8 | 3,210 | 1.5 | ||||||||||||||||||
|
Total liabilities
|
267,389 | 92.4 | 249,045 | 92.4 | 199,624 | 92.0 | ||||||||||||||||||
|
Stockholders’ equity:
|
||||||||||||||||||||||||
|
Preferred stock
|
4,049 | 1.4 | 3,079 | 1.1 | - | - | ||||||||||||||||||
|
Common stock
|
9,380 | 3.2 | 9,353 | 3.5 | 9,177 | 4.2 | ||||||||||||||||||
|
Retained earnings and other
comprehensive income
|
8,782 | 3.0 | 8,138 | 3.0 | 8,226 | 3.8 | ||||||||||||||||||
|
Total stockholders’ equity
|
22,211 | 7.6 | 20,570 | 7.6 | 17,403 | 8.0 | ||||||||||||||||||
|
Total liabilities and
stockholders’ equity
|
$ | 289,600 | 100.0 | % | $ | 269,615 | 100.0 | % | $ | 217,027 | 100.0 | % | ||||||||||||
Investment Portfolio
In order to maintain a reserve of readily marketable assets to meet the Bank’s liquidity and loan requirements, the Bank purchases United States Treasury securities and other investments. Sales of “federal funds” (short-term loans to other banks) are regularly utilized. Placement of funds in certificates of deposit with other financial institutions may be made as alternative investments pending utilization of funds for loans or other purposes.
Securities may be pledged to meet security requirements imposed as a condition for receipt of deposits of public funds and repurchase agreements. At December 31, 2010, the Bank had forty-five securities with a carrying value totaling $16,587,463 pledged for such purposes.
As of December 31, 2010, the Bank’s investment portfolio consisted of U.S. government and agency securities and preferred stocks, mortgage-backed securities, corporate bonds, municipal securities, and money market mutual funds. The Bank’s policy is to stagger the maturities of its investments to meet overall liquidity requirements of the Bank.
- 13 -
The following table summarizes the amounts and distribution of the Bank’s investment securities held as of December 31, 2010, 2009, and 2008.
|
INVESTMENT PORTFOLIO
|
|||||||
|
(Dollars in thousands)
|
|
December 31, 2010
|
||||||||||||
|
Amortized Cost
|
Fair
Value
|
Yield
|
||||||||||
|
AVAILABLE-FOR-SALE SECURITIES
|
||||||||||||
|
U.S. government and agency securities
|
||||||||||||
|
Due after one to five years
|
$ | 10,750 | $ | 10,791 | 1.77 | % | ||||||
|
Total U.S. government and agency securities
|
10,750 | 10,791 | 1.77 | |||||||||
|
State and municipal securities
|
||||||||||||
|
Due within one year
|
497 | 497 | 0.85 | |||||||||
|
Due after one to five years
|
499 | 507 | 5.10 | |||||||||
|
Due after five to ten years
|
3,426 | 3,486 | 3.57 | |||||||||
|
Due after ten to fifteen years
|
5,294 | 5,203 | 3.90 | |||||||||
|
Due beyond fifteen years
|
1,891 | 1,873 | 4.10 | |||||||||
|
Total state and municipal securities
|
11,607 | 11,566 | 3.76 | |||||||||
|
Corporate debt securities
|
||||||||||||
|
Due after one to five years
|
1,003 | 1,022 | 3.65 | |||||||||
|
Total corporate debt securities
|
1,003 | 1,022 | 3.65 | |||||||||
|
Mortgage-backed securities
|
||||||||||||
|
WARM* within one year
|
3 | 3 | 5.65 | |||||||||
|
WARM* after one to five years
|
838 | 861 | 3.68 | |||||||||
|
WARM* after five to ten years
|
5,060 | 5,192 | 3.63 | |||||||||
|
WARM* after ten to fifteen years
|
7,944 | 8,042 | 3.12 | |||||||||
|
WARM* beyond fifteen years
|
7,181 | 7,209 | 3.80 | |||||||||
|
Total mortgage-backed securities
|
21,026 | 21,307 | 3.50 | |||||||||
|
SBA loan pool
|
||||||||||||
|
Due after one to five years
|
194 | 203 | 4.63 | |||||||||
|
Due after five to ten years
|
1,265 | 1,365 | 5.14 | |||||||||
|
Total SBA loan pool
|
1,459 | 1,568 | 5.07 | |||||||||
|
Preferred stocks
|
17 | 35 | 0.00 | |||||||||
|
Total available-for-sale securities
|
$ | 45,862 | $ | 46,289 | 3.46 | % | ||||||
|
* - Weighted-Average Remaining Maturity
|
||||||||||||
|
INVESTMENT PORTFOLIO
|
|
(Dollars in thousands)
|
|
December 31, 2009
|
||||||||||||
|
Amortized
Cost
|
Fair
Value
|
Yield
|
||||||||||
|
AVAILABLE-FOR-SALE SECURITIES
|
||||||||||||
|
U.S. Government and Agency securities
|
||||||||||||
|
Due after one to five years
|
$ | 15,723 | $ | 15,767 | 2.44 | % | ||||||
|
Total U.S. Government and Agency securities
|
15,723 | 15,767 | 2.44 | |||||||||
|
State and municipal securities
|
||||||||||||
|
Due after one to five years
|
1,493 | 1,537 | 5.39 | |||||||||
|
Due after five to ten years
|
1,847 | 1,883 | 5.41 | |||||||||
|
Due after ten to fifteen years
|
3,920 | 3,918 | 3.88 | |||||||||
|
Due beyond fifteen years
|
2,717 | 2,764 | 4.18 | |||||||||
|
Total state and municipal securities
|
9,977 | 10,102 | 4.10 | |||||||||
|
Corporate debt securities
|
||||||||||||
|
Due after one to five years
|
509 | 536 | 5.00 | |||||||||
|
Total corporate debt securities
|
509 | 536 | 5.00 | |||||||||
|
Mortgage -backed securities
|
||||||||||||
|
WARM* within one year
|
110 | 111 | 3.60 | |||||||||
|
WARM* after one to five years
|
1,497 | 1,528 | 3.73 | |||||||||
|
WARM* after five to ten years
|
4,165 | 4,279 | 4.07 | |||||||||
|
WARM* after ten to fifteen years
|
8,047 | 8,090 | 3.95 | |||||||||
|
WARM* beyond fifteen years
|
7,953 | 7,834 | 4.14 | |||||||||
|
Total mortgage-backed securities
|
21,772 | 21,842 | 4.03 | |||||||||
|
SBA loan pool
|
|||||||||||||
|
Due after one to five years
|
195 | 202 | 4.63 | ||||||||||
|
Due after five to ten years
|
1,445 | 1,505 | 5.18 | ||||||||||
|
Total SBA loan pool
|
1,640 | 1,707 | 5.11 | ||||||||||
|
Preferred stocks
|
17 | 57 | - | ||||||||||
|
Total available-for-sale securities
|
$ | 49,638 | $ | 50,011 | 3.58 | % | |||||||
- 14 -
|
INVESTMENT PORTFOLIO
|
|
(Dollars in thousands)
|
|
December 31, 2008
|
||||||||||||
|
Amortized
Cost
|
Fair
Value
|
Yield
|
||||||||||
|
AVAILABLE-FOR-SALE SECURITIES
|
||||||||||||
|
U.S. Government and Agency securities
|
||||||||||||
|
Due within one year
|
$ | 500 | $ | 503 | 4.91 | % | ||||||
|
Due after one to five years
|
5,272 | 5,351 | 3.25 | |||||||||
|
Total U.S. Government and Agency securities
|
5,772 | 5,854 | 3.40 | |||||||||
|
State and municipal securities
|
||||||||||||
|
Due after one to five years
|
1,493 | 1,546 | 5.39 | |||||||||
|
Due after five to ten years
|
231 | 237 | 5.41 | |||||||||
|
Due after ten to fifteen years
|
1,851 | 1,822 | 3.92 | |||||||||
|
Due beyond fifteen years
|
2,373 | 2,249 | 4.12 | |||||||||
|
Total state and municipal securities
|
5,948 | 5,854 | 4.43 | |||||||||
|
Corporate debt securities
|
||||||||||||
|
Due within one year
|
2,159 | 2,176 | 6.00 | |||||||||
|
Due after one to five years
|
512 | 514 | 5.00 | |||||||||
|
Total corporate debt securities
|
2,671 | 2,690 | 5.78 | |||||||||
|
Mortgage -backed securities
|
||||||||||||
|
WARM* within one year
|
234 | 234 | 3.72 | |||||||||
|
WARM* after one to five years
|
2,216 | 2,236 | 3.88 | |||||||||
|
WARM* after five to ten years
|
3,472 | 3,469 | 4.55 | |||||||||
|
WARM* after ten to fifteen years
|
4,219 | 4,231 | 4.77 | |||||||||
|
WARM* beyond fifteen years
|
6,658 | 6,533 | 5.22 | |||||||||
|
Total mortgage-backed securities
|
16,799 | 16,703 | 4.77 | |||||||||
|
SBA loan pool
|
||||||||||||
|
Due within one year
|
17 | 18 | 8.80 | |||||||||
|
Due after one to five years
|
230 | 231 | 4.63 | |||||||||
|
Due after five to ten years
|
- | - | - | |||||||||
|
Due after ten to fifteen years
|
1,583 | 1,630 | 5.11 | |||||||||
|
Total SBA loan pool
|
1,830 | 1,879 | 5.09 | |||||||||
|
Preferred stocks
|
17 | 17 | - | |||||||||
|
Total available-for-sale securities
|
$ | 33,037 | $ | 32,997 | 4.64 | % | ||||||
|
* - Weighted-Average Remaining Maturity
|
||||||||||||
- 15 -
Loan Portfolio
General
The following table presents the Bank’s loan portfolio as of December 31, 2010, 2009, 2008, 2007, and 2006.
|
LOAN PORTFOLIO
|
|
(Dollars in thousands)
|
|
December 31, 2010
|
December 31, 2009
|
December 31, 2008
|
||||||||||||||||||||||
|
Balance
|
% Total
Loans
|
Balance
|
% Total
Loans
|
Balance
|
% Total
Loans
|
|||||||||||||||||||
|
Commercial, financial and agricultural *
|
$ | 13,568 | 6.6 | % | $ | 12,901 | 6.7 | % | $ | 15,742 | 8.7 | % | ||||||||||||
|
Real estate – construction and land development
|
4,987 | 2.4 | 6,745 | 3.5 | 8,871 | 4.9 | ||||||||||||||||||
|
Real estate – residential
|
148,396 | 72.5 | 138,409 | 71.6 | 126,042 | 70.1 | ||||||||||||||||||
|
Real estate – commercial
|
31,294 | 15.3 | 28,721 | 14.9 | 22,962 | 12.8 | ||||||||||||||||||
|
Municipal
|
2,034 | 1.0 | 2,015 | 1.0 | 2,082 | 1.2 | ||||||||||||||||||
|
Consumer
|
4,512 | 2.2 | 4,474 | 2.3 | 4,125 | 2.3 | ||||||||||||||||||
|
Total loans
|
204,791 | 100.0 | % | 193,265 | 100.0 | % | 179,824 | 100.0 | % | |||||||||||||||
|
Allowance for loan losses
|
(2,326 | ) | (2,211 | ) | (2,017 | ) | ||||||||||||||||||
|
Deferred costs, net
|
327 | 250 | 267 | |||||||||||||||||||||
|
Net loans
|
$ | 202,792 | $ | 191,304 | $ | 178,074 | ||||||||||||||||||
|
* - Includes term federal funds sold of $0 at 12/31/2010, $0 at 12/31/2009 and $2,000,000 at 12/31/2008.
|
||||||||||||||||||||||||
|
December 31, 2007
|
December 31, 2006
|
|||||||||||||||
|
Balance
|
% Total
Loans
|
Balance
|
% Total
Loans
|
|||||||||||||
|
Commercial, financial and agricultural *
|
$ | 16,585 | 10.0 | % | $ | 10,947 | 7.0 | % | ||||||||
|
Real estate – construction and land development
|
10,756 | 6.5 | 11,113 | 7.1 | ||||||||||||
|
Real estate – residential
|
113,629 | 68.7 | 106,375 | 67.7 | ||||||||||||
|
Real estate – commercial
|
15,135 | 9.1 | 15,974 | 10.2 | ||||||||||||
|
Municipal
|
1,916 | 1.2 | 987 | 0.6 | ||||||||||||
|
Consumer
|
7,427 | 4.5 | 11,582 | 7.4 | ||||||||||||
|
Total loans
|
165,448 | 100.0 | % | 156,978 | 100.0 | % | ||||||||||
|
Allowance for loan losses
|
(1,925 | ) | (1,698 | ) | ||||||||||||
|
Deferred costs, net
|
242 | 233 | ||||||||||||||
|
Net loans
|
$ | 163,765 | $ | 155,513 | ||||||||||||
|
* - Includes term federal funds sold of $3,000,000 at 12/31/2007 and $0 at 12/31/2006.
|
||||||||||||||||
The Bank’s commercial loans are made for the purpose of providing working capital, financing the purchase of equipment, or for other business purposes. Such loans include loans with maturities ranging from thirty days to two years and “term loans,” which are loans with maturities normally ranging from one to ten years. Short-term business loans are generally intended to finance current transactions and typically provide for periodic principal payments, with interest payable monthly. Term loans normally provide for fixed or floating interest rates, with monthly payments of both principal and interest.
The Bank’s construction loans are primarily interim loans made to finance the construction of commercial and single-family residential property. These loans are typically short-term. The Bank generally pre-qualifies construction loan borrowers for permanent “take-out” financing as a condition to making the construction loan. The Bank occasionally will make loans for speculative housing construction or for acquisition and development of raw land.
- 16 -
The Bank’s other real estate loans consist primarily of loans made based on the borrower’s cash flow and which are secured by deeds of trust on commercial and residential property to provide another source of repayment in the event of default. It is the Bank’s policy to restrict real estate loans without credit enhancement to no more than 80% of the lower of the appraised value or the purchase price of the property depending on the type of property and its utilization. The Bank offers both fixed and floating rate loans. Maturities on such loans typically range from five to thirty years. However, Small Business Administration (SBA) and certain other real estate loans easily sold in the secondary market are made for longer maturities. The Bank has been designated an approved SBA lender. The Bank’s SBA loans are categorized as commercial or real estate depending on the underlying collateral. Also, the Bank has been approved as an originator of loans that can be sold to the Federal Home Loan Mortgage Corporation.
During the year ended December 31, 2010, there were 71 loans sold with a total principal balance of $14,706,700 resulting in a total gain for the Bank of $226,600. During the year ended December 31, 2009, there were 21 loans sold with a total principal balance of $4,718,800 resulting in a total gain for the Bank of approximately $59,000. During 2008 there were no loans sold. During the year ended December 31, 2007, the Bank sold one loan with total principal balance of approximately $268,000 resulting in a total net loss of $414 for the Bank. During the year ended December 31, 2006, the Bank sold four loans with total principal balances of approximately $598,000 resulting in a total net gain of $3,977 for the Bank.
Consumer loans are made for the purpose of financing automobiles, various types of consumer goods, and other personal purposes. Consumer loans generally provide for the monthly payment of principal and interest. Most of the Bank’s consumer loans are secured by the personal property being purchased.
With certain exceptions, the Bank is permitted under applicable law to make related extensions of credit to any one borrowing entity up to 15% of the Bank’s capital and reserves. An additional 10% is permitted under applicable law if the credit is fully secured by qualified collateral. The Bank sells participations in its loans when necessary to stay within lending limits. As of December 31, 2010, these lending limits for the Bank were $3,606,713 and $6,011,188, respectively.
Loan Concentrations
The Bank does not have any significant concentrations in its loan portfolio by industry or group of industries. As of December 31, 2010, approximately 71% of the Bank’s loans were secured by residential property located in Connecticut. As of December 31, 2009, approximately 78% of the Bank’s loans were secured by such property.
Loan Portfolio Maturities and Interest Rate Sensitivity
The following table summarizes the maturities and interest rate sensitivity of the Bank’s loan portfolio.
|
MATURITIES AND RATE SENSITIVITY OF LOANS
|
|
As of December 31, 2010
|
|
(In thousands)
|
|
One Year
or Less
|
Over One to
Five Years
|
Over
Five Years
|
Total
|
|||||||||||||
|
Commercial, financial and agricultural
|
$ | 5,656 | $ | 7,912 | $ | - | $ | 13,568 | ||||||||
|
Real estate - construction and land development
|
4,987 | - | - | 4,987 | ||||||||||||
|
Real estate – residential
|
41,528 | 63,515 | 43,353 | 148,396 | ||||||||||||
|
Real estate – commercial
|
26,379 | 2,393 | 2,522 | 31,294 | ||||||||||||
|
Municipal
|
2,035 | - | - | 2,035 | ||||||||||||
|
Consumer
|
1,868 | 2,644 | - | 4,512 | ||||||||||||
|
Total loans
|
$ | 82,453 | $ | 76,464 | $ | 45,875 | $ | 204,792 | ||||||||
|
Loans with fixed interest rates
|
$ | 23,748 | $ | 68,340 | $ | 44,877 | $ | 136,929 | ||||||||
|
Loans with variable interest rates
|
58,705 | 8,160 | 998 | 67,863 | ||||||||||||
|
Total loans
|
$ | 82,453 | $ | 76,464 | $ | 45,875 | $ | 204,792 | ||||||||
- 17 -
The following table sets forth the Bank’s loan commitments, standby letters of credit, and unadvanced portions of loans at December 31, 2010, 2009 and 2008.
|
LOAN COMMITMENTS AND STANDBY LETTERS OF CREDIT
|
|
(In thousands)
|
|
12/31/10
|
12/31/09
|
12/31/08
|
||||||||||
|
Commitments to originate loans
|
$ | 2,701 | $ | 1,498 | $ | 1,273 | ||||||
|
Standby letters of credit
|
233 | 337 | 337 | |||||||||
|
Unadvanced portion of loans:
|
||||||||||||
|
Construction
|
4,322 | 3,474 | 5,987 | |||||||||
|
Commercial lines of credit
|
7,858 | 7,744 | 9,479 | |||||||||
|
Consumer
|
735 | 701 | 715 | |||||||||
|
Home equity lines of credit
|
24,120 | 24,232 | 22,894 | |||||||||
|
Commercial real estate, land
|
- | - | - | |||||||||
|
Total
|
$ | 39,969 | $ | 37,986 | $ | 40,685 | ||||||
Non-Performing Assets
Interest on performing loans is accrued and taken into income daily. Loans over 90 days past due are deemed “non-performing” and are placed on a nonaccrual status, unless the loan is well collateralized and in the process of collection. Interest received on nonaccrual loans is credited to income only upon receipt and in certain circumstances may be applied to principal until the loan has been repaid in full, at which time the interest received is credited to income. The Bank had 19 nonaccrual loans with a balance of approximately $2,300,000 as of December 31, 2010, 21 nonaccrual loans with a balance of approximately $3,200,000 as of December 31, 2009, 12 nonaccrual loans with a balance of approximately $561,000 as of December 31, 2008, one nonaccrual loan with a balance of approximately $5,000 as of December 31, 2007 and one nonaccrual loan with a balance of approximately $78,000 as of December 31, 2006. Gross interest that would have been recorded if the nonaccrual loans had been current was approximately $136,000 for the year ended December 31, 2010, $77,000 for the year ended December 31, 2009 and $26,000 for the year ended December 31, 2008. For the years ended December 31, 2007 and 2006, respectively, the gross interest that would have been recorded if the nonaccrual loans had been current was immaterial. The amount of interest on nonaccrual loans included in net income was approximately $61,000 for the year ended December 31, 2010, approximately $18,000 for the year ended December 31, 2009 and approximately $19,000 for the year ended December 31, 2008. For the years ended December 31, 2007 and 2006, respectively, the amount of interest on nonaccrual loans included in net income was immaterial. As of December 31, 2010, the Bank had no loans more than 90 days past due and still accruing interest. As of December 31, 2009, the Bank had two loans with a balance of approximately $202,000 that were more than 90 days past due and still accruing interest. The Bank had four loans with a balance of approximately $90,000 as of December 31, 2008 and one loan with a balance of approximately $1,000 as of December 31, 2007 that were more than 90 days past due and still accruing interest. The Bank had no loans more than 90 days past due and still accruing interest as of year-end 2006.
When appropriate or necessary to protect the Bank’s interests, real estate taken as collateral on a loan may be taken by the Bank through foreclosure or a deed in lieu of foreclosure. Real property acquired in this manner by the Bank is referred to as “other real estate owned” (“OREO”), and is carried on the books of the Bank as an asset, at the lesser of the Bank’s recorded investment or the fair value less estimated costs to sell. As of December 31, 2010, there was $350,121 in OREO property held by the Bank. As of December 31, 2009, 2008, 2007 and 2006, there was no OREO held by the Bank.
A loan whose terms have been modified due to financial difficulties of a borrower is reported as a troubled debt restructure (“TDR”). All TDRs are placed on non-accrual status until the loan qualifies for return to accrual status. Loans qualify for return to accrual status once they have demonstrated performance with the restructured terms of the loan agreement for a minimum of six months. The Bank had three TDR loans at December 31, 2010 with a balance of approximately $408,000. The Bank had no TDR loans at December 31, 2009, 2008, 2007 and 2006.
The risk of nonpayment of loans is an inherent feature of the banking business. That risk varies with the type and purpose of the loan, the collateral which is utilized to secure payment, and ultimately, the credit worthiness of the borrower. In order to minimize this credit risk, the Bank requires that most loans be approved by at least two officers, one of whom must be an executive officer. Commercial loans greater than $500,000, as well as other loans in certain circumstances, must be approved by the Loan Committee of the Bank’s Board of Directors.
- 18 -
The Bank has an internal review process to verify credit quality and risk classifications. In addition, the Bank also maintains a program of annual review of certain new and renewed loans by an outside loan review consultant. Loans are graded from “pass” to “loss,” depending on credit quality, with “pass” representing loans that are fully satisfactory as additions to the Bank’s portfolio. These are loans which involve a degree of risk that is not unwarranted given the favorable aspects of the credit and which exhibit both primary and secondary sources of repayment. Classified loans identified in either review process are added to the Bank’s Internal Watchlist and an additional allowance for loan losses is established for such loans if appropriate. Additionally, the Bank is examined regularly by the Federal Deposit Insurance Corporation and the State of Connecticut Department of Banking at which time a further review of the loan portfolio is conducted.
There were fifty-two classified loans with a combined outstanding balance of $7,820,966 as of December 31, 2010, sixty-three classified loans with a combined outstanding balance of $9,382,436 as of December 31, 2009, forty-one classified loans with a combined outstanding balance of $ 5,944,355 as of December 31, 2008, twenty-four classified loans with a combined outstanding balance of $ 4,157,400 as of December 31, 2007 and eighteen classified loans with a combined outstanding balance of $2,168,600 as of December 31, 2006.
Allowance for Loan Losses
The Bank maintains an allowance for loan losses to provide for potential losses in the loan portfolio. Additions to the allowance are made by charges to operating expenses in the form of a provision for loan losses. All loans that are judged to be uncollectable are charged against the allowance while any recoveries are credited to the allowance. Management conducts a critical evaluation of the loan portfolio monthly. This evaluation includes an assessment of the following factors: the results of the Bank’s internal loan review, any external loan review, any regulatory examination, loan loss experience, estimated potential loss exposure on each credit, concentrations of credit, value of collateral, any known impairment in the borrower’s ability to repay, and present and prospective economic conditions.
The following table summarizes the Bank’s loan loss experience, transactions in the allowance for loan losses, and certain prominent ratios at or for the years ended December 31, 2010, 2009, 2008, 2007, and 2006.
|
At or For the Year
Ended 12/31/10
|
At or For the Year
Ended 12/31/09
|
|||||||
|
ALLOWANCE FOR LOAN LOSSES
|
||||||||
|
Balance at beginning of period
|
$ | 2,211 | $ | 2,017 | ||||
|
Charge-offs:
|
||||||||
|
Commercial, financial and agricultural
|
(627 | ) | (226 | ) | ||||
|
Installment loans to individuals
|
(20 | ) | (132 | ) | ||||
|
Total charge-offs
|
(647 | ) | (358 | ) | ||||
|
Recoveries:
|
||||||||
|
Commercial, financial and agricultural
|
1 | 3 | ||||||
|
Installment loans to individuals
|
6 | 2 | ||||||
|
Total recoveries
|
7 | 5 | ||||||
|
Net loans (charged-off) recovered
|
(640 | ) | (353 | ) | ||||
|
Provision for loan losses
|
755 | 547 | ||||||
|
Balance at end of period
|
$ | 2,326 | $ | 2,211 | ||||
|
BALANCES
|
||||||||
|
Average total loans
|
$ | 202,181 | $ | 184,089 | ||||
|
Total loans at end of period
|
204,792 | 193,265 | ||||||
|
RATIOS
|
||||||||
|
Allowance for loan losses to average loans
|
1.15 | % | 1.20 | % | ||||
|
Allowance for loan losses to loans at end of period
|
1.14 | 1.14 | ||||||
- 19 -
|
At or For the Year
Ended 12/31/08
|
At or For the Year
Ended 12/31/07
|
|||||||
|
ALLOWANCE FOR LOAN LOSSES
|
||||||||
|
Balance at beginning of period
|
$ | 1,924 | $ | 1,698 | ||||
|
Charge-offs:
|
||||||||
|
Commercial, financial and agricultural
|
(130 | ) | (3 | ) | ||||
|
Installment loans to individuals
|
(229 | ) | (21 | ) | ||||
|
Total charge-offs
|
(359 | ) | (24 | ) | ||||
|
Recoveries:
|
||||||||
|
Commercial, financial and agricultural
|
2 | - | ||||||
|
Installment loans to individuals
|
- | - | ||||||
|
Total recoveries
|
2 | - | ||||||
|
Net loans (charged-off) recovered
|
(357 | ) | (24 | ) | ||||
|
Provision for loan losses
|
450 | 250 | ||||||
|
Balance at end of period
|
$ | 2,017 | $ | 1,924 | ||||
|
BALANCES
|
||||||||
|
Average total loans
|
$ | 173,168 | $ | 157,326 | ||||
|
Total loans at end of period
|
179,824 | 165,448 | ||||||
|
RATIOS
|
||||||||
|
Allowance for loan losses to average loans
|
1.17 | % | 1.22 | % | ||||
|
Allowance for loan losses to loans at end of period
|
1.12 | 1.16 | ||||||
|
At or For the Year
Ended 12/31/06
|
||||
|
ALLOWANCE FOR LOAN LOSSES
|
||||
|
Balance at beginning of period
|
||||
|
Total charge-offs (installment loans to individuals)
|
$ | 1,720 | ||
|
Total recoveries (installment loans to individuals)
|
(22 | ) | ||
|
Net loans (charged-off) recovered
|
- | |||
|
Provision for loan losses
|
(22 | ) | ||
|
Balance at end of period
|
- | |||
| $ | 1,698 | |||
|
BALANCES
|
||||
|
Average total loans
|
||||
|
Total loans at end of period
|
$ | 151,822 | ||
| 156,978 | ||||
|
RATIOS
|
||||
|
RATIOS
|
||||
|
Allowance for loan losses to average loans
|
1.12 | % | ||
|
Allowance for loan losses to loans at end of period
|
1.08 | |||
The following table summarizes the allocation of the allowance for loan losses by loan type and the percent of loans in each category compared to total loans at December 31, 2010, 2009, 2008, 2007 and 2006.
|
ALLOCATION OF ALLOWANCE FOR LOAN LOSSES
|
|||||||||||||||||
|
(Dollars in thousands)
|
|||||||||||||||||
|
December 31, 2010
|
December 31, 2009
|
December 31, 2008
|
||||||||||||||||||||||
|
Allocation of Allowance
|
% of
Loans by Category
|
Allocation of Allowance
|
% of
Loans by
Category
|
Allocation of Allowance
|
% of
Loans by
Category
|
|||||||||||||||||||
|
Real estate - residential
|
$ | 1,198 | 72.5 | % | $ | 1,229 | 71.6 | % | $ | 639 | 70.1 | % | ||||||||||||
|
Real estate - commercial
|
465 | 15.3 | 450 | 14.9 | 823 | 12.8 | ||||||||||||||||||
|
Real estate – construction and land
development
|
68 | 2.4 | 106 | 3.5 | 77 | 4.9 | ||||||||||||||||||
|
Commercial, financial and agricultural
|
377 | 6.6 | 341 | 6.7 | 345 | 8.8 | ||||||||||||||||||
|
Municipal
|
34 | 1.0 | 38 | 1.0 | 33 | 1.2 | ||||||||||||||||||
|
Consumer
|
91 | 2.2 | 47 | 2.3 | 100 | 2.2 | ||||||||||||||||||
|
Unallocated
|
93 | - | - | - | - | - | ||||||||||||||||||
|
Total
|
$ | 2,326 | 100.0 | % | $ | 2,211 | 100.0 | % | $ | 2,017 | 100.0 | % | ||||||||||||
- 20 -
|
December 31, 2007
|
December 31, 2006
|
|||||||||||||||
|
Allocation of Allowance
|
% of
Loans by
Category
|
Allocation of Allowance
|
% of
Loans by
Category
|
|||||||||||||
|
Real estate - residential
|
$ | 563 | 68.7 | % | $ | 464 | 67.7 | % | ||||||||
|
Real estate - commercial
|
316 | 9.1 | 465 | 10.2 | ||||||||||||
|
Real estate – construction and land
development
|
464 | 6.5 | 212 | 7.1 | ||||||||||||
|
Commercial, financial and agricultural
|
363 | 10.0 | 331 | 7.0 | ||||||||||||
|
Municipal
|
31 | 1.2 | 9 | 0.6 | ||||||||||||
|
Consumer
|
188 | 4.5 | 217 | 7.4 | ||||||||||||
|
Total
|
$ | 1,925 | 100.0 | % | $ | 1,698 | 100.0 | % | ||||||||
Deposits
Deposits are the Bank’s primary source of funds. At December 31, 2010, the Bank had a deposit mix of 34% checking, 37% savings, and 29% certificates of deposit. Twenty-one percent of the total deposits of $269.3 million were noninterest bearing at December 31, 2010. At December 31, 2009, the Bank had a deposit mix of 32% checking, 35% savings, and 33% certificates of deposit. Seventeen percent of the total deposits of $250.4 million were noninterest bearing at December 31, 2009. At December 31, 2010, $35.6 million of the Bank’s deposits were from public sources and at December 31, 2009, $28.7 million of the Bank’s deposits were from public sources. The Bank’s net interest income is enhanced by its percentage of noninterest bearing deposits.
The Bank’s deposits are obtained from a cross-section of the communities it serves. No material portion of the Bank’s deposits has been obtained from or is dependent upon any one person or industry. The Bank’s business is not seasonal in nature. The Bank accepts deposits in excess of $100,000 from customers. Those deposits are priced to remain competitive. Through the Certificate of Deposit Accounts Registry Service (CDARS) program, the Bank has brokered deposits of $7,700,879 as of December 31, 2010, and $5,344,781 as of December 31, 2009.
The Bank is not dependent upon funds from sources outside the United States and has not made loans to any foreign entities.
The following table summarizes the distribution of average deposits and the average annualized rates paid for the years ended December 31, 2010, 2009 and 2008.
|
AVERAGE DEPOSITS
|
||||||||||||||
|
(Dollars in thousands)
|
|
For the Year Ended
December 31, 2010
|
For the Year Ended
December 31, 2009
|
For the Year Ended
December 31, 2008
|
||||||||||||||||||||||
|
Average
Balance
|
Average
Rate
|
Average
Balance
|
Average
Rate
|
Average
Balance
|
Average
Rate
|
|||||||||||||||||||
|
Demand deposits
|
$ | 47,618 | 0.00 | % | $ | 37,484 | 0.00 | % | $ | 34,963 | 0.00 | % | ||||||||||||
|
NOW deposits
|
35,729 | 0.11 | 32,670 | 0.11 | 29,990 | 0.15 | ||||||||||||||||||
|
Savings deposits
|
103,179 | 0.57 | 86,423 | 0.76 | 65,706 | 1.09 | ||||||||||||||||||
|
Time deposits
|
76,286 | 1.51 | 90,323 | 2.34 | 65,755 | 3.37 | ||||||||||||||||||
|
Total average deposits
|
$ | 262,812 | 0.68 | % | $ | 246,900 | 1.14 | % | $ | 196,414 | 1.51 | % | ||||||||||||
- 21 -
The following table indicates the maturity schedule for the Bank’s time deposits of $100,000 or more as of December 31, 2010, 2009 and 2008.
|
SCHEDULED MATURITY OF TIME DEPOSITS OF $100,000 OR MORE
|
||||||||||||
|
(Dollars in thousands)
|
|
December 31, 2010
|
December 31, 2009
|
December 31, 2008
|
||||||||||||||||||||||
|
Balance
|
% of
Total
|
Balance
|
% of
Total
|
Balance
|
% of
Total
|
|||||||||||||||||||
|
Three months or less
|
$ | 12,126 | 37.6 | % | $ | 14,342 | 41.4 | % | $ | 21,148 | 62.6 | % | ||||||||||||
|
Over three through six months
|
6,166 | 19.1 | 6,984 | 20.1 | 5,180 | 15.4 | ||||||||||||||||||
|
Over six through twelve months
|
3,277 | 10.2 | 5,983 | 17.2 | 3,923 | 11.6 | ||||||||||||||||||
|
Over twelve months
|
10,673 | 33.1 | 7,369 | 21.3 | 3,503 | 10.4 | ||||||||||||||||||
|
Total Time Deposits
|
$ | 32,242 | 100.0 | % | $ | 34,678 | 100.0 | % | $ | 33,754 | 100.0 | % | ||||||||||||
Liquidity and Asset-Liability Management
Liquidity management for banks requires that funds always be available to pay anticipated deposit withdrawals and maturing financial obligations promptly and fully in accordance with their terms. The balance of the funds required is generally provided by payments on loans, sale of loans, liquidation of assets, and the acquisition of additional deposit liabilities.
To meet liquidity needs, the Bank maintains a portion of its funds in cash deposits in other banks, federal funds sold, and available-for-sale securities. As of December 31, 2010, the Bank’s liquidity ratio was 22%, defined as the sum of $2.8 million in federal funds sold, $29.7 million in available-for-sale securities at fair value, and $28.1 million in cash and due from banks and interest-bearing deposits at the Federal Home Loan Bank and Federal Reserve Bank, as a percentage of total deposits. As of December 31, 2009, the Bank’s liquidity ratio was 22%, defined as the sum of $2.4 million in federal funds sold, $39 million in available-for-sale securities at fair value, and $13.3 million in cash and due from banks and interest-bearing deposits at the Federal Home Loan Bank and Federal Reserve Bank, as a percentage of total deposits.
The careful planning of asset and liability maturities, and the matching of interest rates to correspond with these maturities, is an integral part of the active management of an institution’s net yield. To the extent maturities of assets and liabilities do not match in a changing interest rate environment, net yields may be affected. Even with perfectly matched repricing of assets and liabilities, risks remain in the form of prepayment of assets, timing lags in adjusting certain assets and liabilities that have varying sensitivities to market interest rates, and basis risk. In its overall attempt to match assets and liabilities, Management takes into account rates and maturities to be offered in connection with its time deposits and variable interest rates charged on its loans. The Bank has generally been able to control its exposure to changing interest rates by maintaining shorter-term investments and offering floating interest rate loans and a majority of its time deposits at relatively short maturities.
The table below sets forth the interest rate sensitivity of the Bank’s interest-sensitive assets and interest-sensitive liabilities as of December 31, 2010, 2009 and 2008, using the interest rate sensitivity gap ratio. For the purposes of the following table, an asset or liability is considered rate-sensitive within a specified period when it can be repriced or matures within its contractual terms.
- 22 -
|
INTEREST RATE SENSITIVITY
|
||||||||||
|
(Dollars in thousands)
|
|
December 31, 2010
|
||||||||||||||||||||
|
Due within
Three
Months
|
Due in
Three to Twelve
Months
|
Due after One
Year to Five
Years
|
Due after
Five
Years
|
Total
|
||||||||||||||||
|
Rate sensitive assets
|
||||||||||||||||||||
|
Federal funds sold and overnight
deposits
|
$ | 2,787 | $ | - | $ | - | $ | - | $ | 2,787 | ||||||||||
|
Available-for-sale securities
|
2,109 | 13,541 | 16,409 | 14,230 | 46,289 | |||||||||||||||
|
Total loans
|
62,256 | 20,195 | 76,464 | 45,876 | 204,791 | |||||||||||||||
|
Total
|
$ | 67,152 | $ | 33,736 | $ | 92,873 | $ | 60,106 | $ | 253,867 | ||||||||||
|
Rate sensitive liabilities
|
||||||||||||||||||||
|
NOW deposits
|
$ | 1,800 | $ | - | $ | - | $ | 34,190 | $ | 35,990 | ||||||||||
|
Savings deposits
|
69,053 | - | - | 31,165 | 100,218 | |||||||||||||||
|
Time deposits
|
23,508 | 32,156 | 22,068 | - | 77,732 | |||||||||||||||
|
Securities sold under agreements to
repurchase
|
3,235 | - | - | - | 3,235 | |||||||||||||||
|
Total
|
$ | 97,596 | $ | 32,156 | $ | 22,068 | $ | 65,355 | $ | 217,175 | ||||||||||
|
Interest rate sensitivity gap
|
(30,444 | ) | 1,580 | 70,805 | (5,249 | ) | $ | 36,692 | ||||||||||||
|
Cumulative gap
|
$ | (30,444 | ) | $ | (28,864 | ) | $ | 41,941 | $ | 36,692 | ||||||||||
|
Cumulative gap ratio to total assets
|
(10 | )% | (10 | )% | 14 | % | 12 | % | ||||||||||||
|
December 31, 2009
|
||||||||||||||||||||
|
Due within
Three
Months
|
Due in
Three to Twelve Months
|
Due after One
Year to Five
Years
|
Due after
Five
Years
|
Total
|
||||||||||||||||
|
Rate sensitive assets
|
||||||||||||||||||||
|
Federal funds sold and overnight deposits
|
$ | 4,916 | $ | - | $ | - | $ | - | $ | 4,916 | ||||||||||
|
Available-for-sale securities
|
5,334 | 15,943 | 18,458 | 10,276 | 50,011 | |||||||||||||||
|
Total loans
|
60,116 | 22,411 | 68,026 | 42,712 | 193,265 | |||||||||||||||
|
Total
|
$ | 70,366 | $ | 38,354 | $ | 86,484 | $ | 52,988 | $ | 248,192 | ||||||||||
|
Rate sensitive liabilities
|
||||||||||||||||||||
|
NOW deposits
|
$ | 1,751 | $ | - | $ | - | $ | 33,262 | $ | 35,013 | ||||||||||
|
Savings deposits
|
59,814 | - | - | 29,655 | 89,469 | |||||||||||||||
|
Time deposits
|
26,534 | 38,805 | 16,738 | - | 82,077 | |||||||||||||||
|
Securities sold under agreements to
repurchase
|
913 | - | - | - | 913 | |||||||||||||||
|
Total
|
$ | 89,012 | $ | 38,805 | $ | 16,738 | $ | 62,917 | $ | 207,472 | ||||||||||
|
Interest rate sensitivity gap
|
(18,646 | ) | (451 | ) | 69,746 | (9,929 | ) | $ | 40,720 | |||||||||||
|
Cumulative gap
|
$ | (18, 646 | ) | $ | (19,097 | ) | $ | 50,649 | $ | 40,720 | ||||||||||
|
Cumulative gap ratio to total assets
|
(7 | )% | (7 | )% | 19 | % | 15 | % | ||||||||||||
- 23 -
|
INTEREST RATE SENSITIVITY
(Dollars in thousands)
|
|
December 31, 2008
|
||||||||||||||||||||
|
Due within
Three
Months
|
Due in
Three to Twelve
Months
|
Due after One
Year to Five
Years
|
Due after
Five
Years
|
Total
|
||||||||||||||||
|
Rate sensitive assets
|
||||||||||||||||||||
|
Federal funds sold and overnight deposits
|
$ | 3,800 | $ | - | $ | - | $ | - | $ | 3,800 | ||||||||||
|
Available-for-sale securities
|
1,099 | 1,872 | 13,206 | 16,820 | 32,997 | |||||||||||||||
|
Total loans
|
58,283 | 14,914 | 69,182 | 37,445 | 179,824 | |||||||||||||||
|
Total
|
$ | 63,182 | $ | 16,786 | $ | 82,388 | $ | 54,265 | $ | 216,621 | ||||||||||
|
Rate sensitive liabilities
|
||||||||||||||||||||
|
NOW deposits
|
$ | 1,608 | $ | - | $ | - | $ | 30,549 | $ | 32,157 | ||||||||||
|
Savings deposits
|
41,121 | - | - | 24,986 | 66,107 | |||||||||||||||
|
Time deposits
|
44,349 | 29,977 | 10,001 | - | 84,327 | |||||||||||||||
|
Borrowings
|
1,000 | - | 1,000 | |||||||||||||||||
|
Securities sold under agreements to
|
||||||||||||||||||||
|
repurchase
|
577 | - | - | - | 577 | |||||||||||||||
|
Total
|
$ | 88,655 | $ | 29,977 | $ | 10,001 | $ | 55,535 | $ | 184,168 | ||||||||||
|
Interest rate sensitivity gap
|
(25,473 | ) | $ | (13,191 | ) | $ | 72,387 | $ | (1,270 | ) | $ | 32,453 | ||||||||
|
Cumulative gap
|
$ | (25,473 | ) | $ | (38,664 | ) | $ | 33,723 | $ | 32,453 | ||||||||||
|
Cumulative gap ratio to total assets
|
(11 | )% | (16 | )% | 14 | % | 13 | % | ||||||||||||
Since interest rate changes do not affect all categories of assets and liabilities equally or simultaneously, a cumulative gap analysis alone cannot be used to evaluate the Bank’s interest rate sensitivity position. To supplement traditional gap analysis, the Bank performs simulation modeling to estimate the potential effects of changing interest rates. This process allows the Bank to explore complex relationships among repricing assets and liabilities over time in various interest rate environments.
The Company’s Executive Committee meets at least quarterly to monitor the Bank’s investments and liquidity needs and to oversee its asset-liability management. Between meetings of the Executive Committee, management oversees the Bank’s liquidity.
Capital Reserve
The Federal Deposit Insurance Corporation Improvement Act of 1991 (FDICIA) defines specific capital categories based upon an institution’s capital ratios. The capital categories, in declining order, are: (i) well capitalized; (ii) adequately capitalized; (iii) undercapitalized; (iv) significantly undercapitalized; and (v) critically undercapitalized. Under FDICIA and the FDIC’s prompt corrective action rules, the FDIC may take any one or more of the following actions against an undercapitalized bank: restrict dividends and management fees, restrict asset growth, and prohibit new acquisitions, new branches or new lines of business without prior FDIC approval. If a bank is significantly undercapitalized, the FDIC may also require the bank to raise capital, restrict interest rates the bank may pay on deposits, require a reduction in assets, restrict any activities that might cause risk to the bank, require improved management, prohibit the acceptance of deposits from correspondent banks, and restrict compensation to any senior executive officer. When a bank becomes critically undercapitalized, (i.e., the ratio of tangible equity to total assets is equal to or less than 2%), the FDIC must, within 90 days thereafter, appoint a receiver for the bank or take such action as the FDIC determines would better achieve the purposes of the law. Even where such other action is taken, the FDIC generally must appoint a receiver for a bank if the bank remains critically undercapitalized during the calendar quarter beginning 270 days after the date on which the bank became critically undercapitalized.
- 24 -
To be considered “adequately capitalized,” an institution must generally have a leverage ratio of at least 4%, a Tier 1 capital to risk-weighted assets ratio of at least 4%, and total Tier 1 and Tier 2 capital to risk-weighted assets ratio of at least 8%. As of December 31, 2010, the most recent notification from the Federal Deposit Insurance Corporation categorized the Bank as well capitalized under the regulatory framework for prompt corrective action. To be categorized as well capitalized, the Bank must maintain minimum total risk-based, Tier 1 risk-based and Tier 1 leverage ratios as set forth in the table below. There are no conditions that Management believes have changed the Bank’s category.
At December 31, 2010, 2009 and 2008, the Bank’s capital exceeded all minimum regulatory requirements and the Bank was considered to be “well capitalized” as defined in the regulations issued by the FDIC.
|
CAPITAL RATIOS
|
|
Actual
12/31/10
|
Actual
12/31/09
|
Actual
12/31/08
|
Minimum
Regulatory
Requirements
|
Well-
Capitalized
|
||||||||||||||||
|
Bank:
|
||||||||||||||||||||
|
Total capital (to risk weighted assets)
|
12.66% | 13.97% | 12.13% | 8.00% | 10.00% | |||||||||||||||
|
Tier 1 capital (to risk weighted assets)
|
11.41% | 12.71% | 10.88% | 4.00% | 6.00% | |||||||||||||||
|
Tier 1 capital (to average assets)
|
7.00% | 7.35% | 7.00% | 4.00% | 5.00% |
Inflation
The impact of inflation on a financial institution can differ significantly from that exerted on other companies. Banks, as financial intermediaries, have many assets and liabilities that may move in concert with inflation both as to interest rates and value. This is especially true for entities, such as the Bank, with a high percentage of interest rate sensitive assets and liabilities. A bank can reduce the impact of inflation if it can manage its interest rate sensitivity position. The Bank attempts to structure its mix of financial instruments and manage its interest rate sensitivity position in order to minimize the potential adverse effects of inflation or other market forces on its net interest income and therefore its earnings and capital.
Financial institutions are also affected by inflation’s impact on non-interest expenses, such as salaries and occupancy expenses. During the period 1992 through 2009, inflation has remained relatively stable, due primarily to continuous management of the money supply by the Federal Reserve. As such, the management of the money supply by the Federal Reserve to control the rate of inflation may indirectly have an impact on the earnings of the Bank. Also, the changes in interest rates may have a corresponding impact on the ability of borrowers to repay loans with the Bank.
- 25 -
Options Outstanding
The Company previously issued options to purchase shares of its common stock under the SBT Bancorp 1998 Stock Plan. As of March 18, 2011, there are options outstanding to purchase an aggregate of 43,311 shares of the Company’s authorized but unissued common stock at prices ranging between $15.65 and $31.50 per share. Such options will expire between the years 2012 and 2017. The SBT Bancorp 1998 Stock Plan expired in March 2008. Accordingly, there were no options available to be granted during the year ended December 31, 2010 to the Company’s named executives or any other employees.
The following table sets forth the total number of securities authorized for issuance under equity compensation plans as of December 31, 2010.
|
Number of
securities to be
issued upon
exercise of
outstanding options
(a)
|
Weighted-average
exercise price of
outstanding options
(b)
|
Number of
securities remaining
available for future
issuance under
equity
compensation plans
(excluding
securities reflected
in column (a))
(c)
|
||||||||||
|
Equity compensation plans
approved by security
holders
|
49,875 | $ | 30.21 | 0 | ||||||||
|
Equity compensation plans not
approved by security
holders
|
0 | 0 | 0 | |||||||||
|
Total
|
49,875 | $ | 30.21 | 0 | ||||||||
- 26 -

The Board of Directors and Stockholders
SBT Bancorp, Inc.
Simsbury, Connecticut
REPORT OF INDEPENDENT REGISTERED PUBLIC ACCOUNTING FIRM
We have audited the accompanying consolidated balance sheets of SBT Bancorp, Inc. and Subsidiary as of December 31, 2010 and 2009 and the related consolidated statements of income, changes in stockholders' equity and cash flows for the years then ended. These consolidated financial statements are the responsibility of the Company's management. Our responsibility is to express an opinion on these consolidated financial statements based on our audits.
We conducted our audits in accordance with the standards of the Public Company Accounting Oversight Board (United States). Those standards require that we plan and perform the audit to obtain reasonable assurance about whether the consolidated financial statements are free of material misstatement. The Company is not required to have, nor were we engaged to perform, an audit of its internal control over financial reporting. Our audit included consideration of internal control over financial reporting as a basis for designing audit procedures that are appropriate in the circumstances, but not for the purpose of expressing an opinion on the effectiveness of the Company’s internal control over financial reporting. Accordingly, we express no such opinion. An audit includes examining, on a test basis, evidence supporting the amounts and disclosures in the consolidated financial statements. An audit also includes assessing the accounting principles used and significant estimates made by management, as well as evaluating the overall consolidated financial statement presentation. We believe that our audits provide a reasonable basis for our opinion.
In our opinion, the consolidated financial statements referred to above present fairly, in all material respects, the consolidated financial position of SBT Bancorp, Inc. and Subsidiary as of December 31, 2010 and 2009 and the consolidated results of their operations and their cash flows for the years then ended, in conformity with accounting principles generally accepted in the United States of America.
| /s/ |
 |
|
SHATSWELL, MacLEOD & COMPANY, P.C.
|
|||||
|
West Peabody, Massachusetts
March 16, 2011
|
|||||

- 27 -
SBT BANCORP, INC. AND SUBSIDIARY
CONSOLIDATED BALANCE SHEETS
December 31, 2010 and 2009
|
ASSETS
|
2010
|
2009
|
||||||
|
Cash and due from banks
|
$ | 7,164,252 | $ | 8,212,425 | ||||
|
Interest-bearing deposits with the Federal Reserve Bank
|
||||||||
|
and Federal Home Loan Bank
|
12,577,125 | 5,108,273 | ||||||
|
Money market mutual funds
|
8,342,967 | 1,352,711 | ||||||
|
Federal funds sold
|
2,787,000 | 2,416,000 | ||||||
|
Cash and cash equivalents
|
30,871,344 | 17,089,409 | ||||||
|
Interest-bearing time deposits with other banks
|
5,963,426 | 5,488,037 | ||||||
|
Investments in available-for-sale securities (at fair value)
|
46,289,197 | 50,011,316 | ||||||
|
Federal Home Loan Bank stock, at cost
|
659,600 | 630,700 | ||||||
|
Loans
|
205,118,164 | 193,514,820 | ||||||
|
Less allowance for loan losses
|
2,325,687 | 2,211,301 | ||||||
|
Loans, net
|
202,792,477 | 191,303,519 | ||||||
|
Premises and equipment
|
561,713 | 684,294 | ||||||
|
Accrued interest receivable
|
904,896 | 977,350 | ||||||
|
Other real estate owned
|
350,121 | - | ||||||
|
Bank owned life insurance
|
4,013,099 | 3,846,083 | ||||||
|
Other assets
|
3,160,718 | 3,707,865 | ||||||
|
Total assets
|
$ | 295,566,591 | $ | 273,738,573 | ||||
|
LIABILITIES AND STOCKHOLDERS' EQUITY
|
||||||||
|
Deposits:
|
||||||||
|
Demand deposits
|
$ | 55,338,463 | $ | 43,886,928 | ||||
|
Savings and NOW deposits
|
136,208,224 | 124,482,134 | ||||||
|
Time deposits
|
77,732,339 | 82,076,620 | ||||||
|
Total deposits
|
269,279,026 | 250,445,682 | ||||||
|
Securities sold under agreements to repurchase
|
3,235,083 | 912,849 | ||||||
|
Other liabilities
|
1,085,121 | 968,464 | ||||||
|
Total liabilities
|
273,599,230 | 252,326,995 | ||||||
|
Stockholders' equity:
|
||||||||
|
Preferred stock, fixed rate cumulative perpetual, Series A, no par;
|
||||||||
|
4,000 shares issued in 2009; liquidation value of $1,000 per share
|
3,850,500 | 3,804,500 | ||||||
|
Preferred stock, fixed rate cumulative perpetual, Series B, no par;
|
||||||||
|
200 shares issued in 2009; liquidation value of $1,000 per share
|
219,500 | 225,500 | ||||||
|
Common stock, no par value; authorized 2,000,000 shares; issued
|
||||||||
|
and outstanding 864,976 shares on 2010 and 2009
|
9,381,535 | 9,372,068 | ||||||
|
Retained earnings
|
8,255,217 | 7,781,696 | ||||||
|
Accumulated other comprehensive income
|
260,609 | 227,814 | ||||||
|
Total stockholders' equity
|
21,967,361 | 21,411,578 | ||||||
|
Total liabilities and stockholders' equity
|
$ | 295,566,591 | $ | 273,738,573 | ||||
The accompanying notes are an integral part of these consolidated financial statements.
- 28 -
SBT BANCORP, INC. AND SUBSIDIARY
CONSOLIDATED STATEMENTS OF INCOME
Years Ended December 31, 2010 and 2009
|
2010
|
2009
|
|||||||
|
Interest and dividend income:
|
||||||||
|
Interest and fees on loans
|
$ | 10,251,583 | $ | 9,821,472 | ||||
|
Interest on debt securities:
|
||||||||
|
Taxable
|
1,315,932 | 1,596,380 | ||||||
|
Tax-exempt
|
455,493 | 348,612 | ||||||
|
Other interest
|
31,849 | 25,399 | ||||||
|
Total interest and dividend income
|
12,054,857 | 11,791,863 | ||||||
|
Interest expense:
|
||||||||
|
Interest on deposits
|
1,773,383 | 2,807,793 | ||||||
|
Interest on Federal Home Loan Bank advances
|
175 | 7,309 | ||||||
|
Interest on securities sold under agreements to repurchase
|
39,970 | 8,292 | ||||||
|
Total interest expense
|
1,813,528 | 2,823,394 | ||||||
|
Net interest and dividend income
|
10,241,329 | 8,968,469 | ||||||
|
Provision for loan losses
|
755,000 | 547,000 | ||||||
|
Net interest and dividend income after provision for loan losses
|
9,486,329 | 8,421,469 | ||||||
|
Noninterest income:
|
||||||||
|
Service charges on deposit accounts
|
523,770 | 544,054 | ||||||
|
Gain on sales and calls of available-for-sale securities
|
- | 39,491 | ||||||
|
Gain on sale of mortgages
|
226,580 | 58,928 | ||||||
|
Investment services fees and commissions
|
114,046 | 100,910 | ||||||
|
Other service charges and fees
|
644,351 | 562,036 | ||||||
|
Increase in cash surrender value of life insurance policies
|
167,016 | 142,390 | ||||||
|
Other income
|
101,218 | 74,211 | ||||||
|
Total noninterest income
|
1,776,981 | 1,522,020 | ||||||
|
Noninterest expense:
|
||||||||
|
Salaries and employee benefits
|
4,818,836 | 4,165,247 | ||||||
|
Occupancy expense
|
1,133,024 | 1,128,436 | ||||||
|
Equipment expense
|
287,414 | 349,935 | ||||||
|
Professional fees
|
722,772 | 513,000 | ||||||
|
Advertising and promotions
|
407,944 | 398,365 | ||||||
|
Forms and supplies
|
146,103 | 185,882 | ||||||
|
Correspondent charges
|
290,468 | 272,475 | ||||||
|
FDIC assessment
|
402,837 | 516,200 | ||||||
|
Postage
|
97,779 | 103,912 | ||||||
|
Directors’ fees
|
146,233 | 132,000 | ||||||
|
Data processing
|
394,585 | 364,921 | ||||||
|
Other expense
|
906,512 | 867,112 | ||||||
|
Total noninterest expense
|
9,754,507 | 8,997,485 | ||||||
|
Income before income tax expense
|
1,508,803 | 946,004 | ||||||
|
Income tax expense
|
362,094 | 227,713 | ||||||
|
Net income
|
$ | 1,146,709 | $ | 718,291 | ||||
|
Net income available to common stockholders
|
$ | 888,709 | $ | 522,369 | ||||
|
Earnings per common share
|
$ | 1.03 | $ | 0.60 | ||||
|
Earnings per common share, assuming dilution
|
$ | 1.03 | $ | 0.60 | ||||
The accompanying notes are an integral part of these consolidated financial statements.
- 29 -
SBT BANCORP, INC. AND SUBSIDIARY
CONSOLIDATED STATEMENTS OF CHANGES IN STOCKHOLDERS' EQUITY
Years Ended December 31, 2010 and 2009
|
Accumulated
|
||||||||||||||||||||||||
|
Other
|
||||||||||||||||||||||||
|
Preferred Stock
|
Common
|
Retained
|
Comprehensive
|
|
||||||||||||||||||||
|
Series A
|
Series B
|
Stock
|
Earnings
|
Income (Loss)
|
Total
|
|||||||||||||||||||
|
Balance, December 31, 2008
|
$ | - | $ | - | $ | 9,328,313 | $ | 7,542,863 | $ | (24,527 | ) | $ | 16,846,649 | |||||||||||
|
Comprehensive income:
|
||||||||||||||||||||||||
|
Net income
|
- | - | - | 718,291 | - | - | ||||||||||||||||||
|
Net change in unrealized holding loss on available-for-sale
|
||||||||||||||||||||||||
|
securities, net of tax effect
|
- | - | - | - | 252,341 | - | ||||||||||||||||||
|
Comprehensive income
|
- | - | - | - | - | 970,632 | ||||||||||||||||||
|
Preferred stock issuance
|
3,770,000 | 230,000 | - | - | - | 4,000,000 | ||||||||||||||||||
|
Preferred stock dividends
|
- | - | - | (138,067 | ) | - | (138,067 | ) | ||||||||||||||||
|
Preferred stock amortization (accretion)
|
34,500 | (4,500 | ) | - | (30,000 | ) | - | - | ||||||||||||||||
|
Stock based compensation
|
- | - | 43,755 | - | - | 43,755 | ||||||||||||||||||
|
Dividends declared common stock ($0.36 per share)
|
- | - | - | (311,391 | ) | - | (311,391 | ) | ||||||||||||||||
|
Balance, December 31, 2009
|
3,804,500 | 225,500 | 9,372,068 | 7,781,696 | 227,814 | 21,411,578 | ||||||||||||||||||
|
Comprehensive income:
|
||||||||||||||||||||||||
|
Net income
|
- | - | - | 1,146,709 | - | - | ||||||||||||||||||
|
Net change in unrealized holding gain on available-for-sale
|
||||||||||||||||||||||||
|
securities, net of tax effect
|
- | - | - | - | 32,795 | - | ||||||||||||||||||
|
Comprehensive income
|
1,179,504 | |||||||||||||||||||||||
|
Preferred stock dividends
|
- | - | - | (218,000 | ) | - | (218,000 | ) | ||||||||||||||||
|
Preferred stock amortization (accretion)
|
46,000 | (6,000 | ) | - | (40,000 | ) | - | - | ||||||||||||||||
|
Stock based compensation
|
- | - | 9,467 | - | - | 9,467 | ||||||||||||||||||
|
Dividends declared common stock ($0.48 per share)
|
- | - | - | (415,188 | ) | - | (415,188 | ) | ||||||||||||||||
|
Balance, December 31, 2010
|
$ | 3,850,500 | $ | 219,500 | $ | 9,381,535 | $ | 8,255,217 | $ | 260,609 | $ | 21,967,361 | ||||||||||||
|
Reclassification disclosure for the years ended December 31:
|
||||||||||||||||||||||||
| 2010 | 2009 | |||||||||||||||||||||||
|
Net unrealized holding gains on available-for-sale securities
|
$ | 53,719 | $ | 452,826 | ||||||||||||||||||||
|
Reclassification adjustment for realized gains losses in net income
|
- | (39,491 | ) | |||||||||||||||||||||
|
Other comprehensive income before income tax effect
|
53,719 | 413,335 | ||||||||||||||||||||||
|
Income tax expense
|
(20,924 | ) | (160,994 | ) | ||||||||||||||||||||
|
Other comprehensive income, net of tax
|
$ | 32,795 | $ | 252,341 | ||||||||||||||||||||
Accumulated other comprehensive income as of December 31, 2010 and 2009 consists of net unrealized holding gains on available-for-sale securities, net of taxes.
The accompanying notes are an integral part of these consolidated financial statements.
- 30 -
SBT BANCORP, INC. AND SUBSIDIARY
CONSOLIDATED STATEMENTS OF CASH FLOWS
Years Ended December 31, 2010 and 2009
|
2010
|
2009
|
|||||||
|
Cash flows from operating activities:
|
||||||||
|
Net income
|
$ | 1,146,709 | $ | 718,291 | ||||
|
Adjustments to reconcile net income to net cash provided (used in) by
|
||||||||
|
operating activities:
|
||||||||
|
Interest capitalized on interest-bearing time deposits with other banks
|
(189,772 | ) | (167,603 | ) | ||||
|
Amortization of securities, net
|
192,264 | 141,845 | ||||||
|
Gain on sales and calls of available-for-sale securities, net
|
- | (39,491 | ) | |||||
|
Change in deferred loan costs, net
|
(76,917 | ) | 16,589 | |||||
|
Provision for loan losses
|
755,000 | 547,000 | ||||||
|
Depreciation and amortization
|
229,536 | 265,282 | ||||||
|
Accretion on impairment of operating lease
|
(44,246 | ) | (44,246 | ) | ||||
|
Decrease (increase) in other assets
|
363,274 | (1,443,200 | ) | |||||
|
Decrease (increase) in interest receivable
|
72,454 | (141,791 | ) | |||||
|
Decrease in taxes receivable
|
164,094 | 120,466 | ||||||
|
Increase in cash surrender value of bank owned life insurance
|
(167,016 | ) | (142,390 | ) | ||||
|
Stock based compensation
|
9,467 | 43,755 | ||||||
|
Increase (decrease) in other liabilities
|
159,936 | (437,389 | ) | |||||
|
Increase (decrease) in interest payable
|
967 | (3,670 | ) | |||||
|
Deferred tax benefit
|
- | (17,753 | ) | |||||
|
Net cash (used in) provided by operating activities
|
2,615,750 | (584,305 | ) | |||||
|
Cash flows from investing activities:
|
||||||||
|
Purchases of interest-bearing time deposits with other banks
|
(285,617 | ) | (3,000,000 | ) | ||||
|
Proceeds from maturities of interest-bearing time deposits with other banks
|
- | 5,000,000 | ||||||
|
Purchases of available-for-sale securities
|
(18,775,486 | ) | (31,867,586 | ) | ||||
|
Proceeds from sales of available-for-sale securities
|
- | 1,170,316 | ||||||
|
Proceeds from maturities of available-for-sale securities
|
22,359,060 | 13,994,247 | ||||||
|
Loan originations and principal collections, net
|
(10,011,392 | ) | (1,565,172 | ) | ||||
|
Loans purchased
|
(2,511,917 | ) | (12,233,431 | ) | ||||
|
Recoveries of loans previously charged off
|
6,147 | 5,253 | ||||||
|
Capital expenditures
|
(108,100 | ) | (118,348 | ) | ||||
|
Purchase of life insurance policies
|
- | (2,500,000 | ) | |||||
|
Purchases of Federal Home Loan Bank stock
|
(28,900 | ) | - | |||||
|
Net cash used in investing activities
|
(9,356,205 | ) | (31,114,721 | ) | ||||
|
Cash flows from financing activities:
|
||||||||
|
Net increase in demand deposits, NOW and savings accounts
|
23,177,625 | 31,816,986 | ||||||
|
Decrease in time deposits
|
(4,344,281 | ) | (2,250,421 | ) | ||||
|
Payment of long-term advances from Federal Home Loan Bank
|
- | (1,000,000 | ) | |||||
|
Net increase in securities sold under agreements to repurchase
|
2,322,234 | 335,916 | ||||||
|
Proceeds from issuance of preferred stock
|
- | 4,000,000 | ||||||
|
Dividends paid - preferred stock
|
(218,000 | ) | (138,067 | ) | ||||
|
Dividends paid - common stock
|
(415,188 | ) | (311,391 | ) | ||||
|
Net cash provided by financing activities
|
20,522,390 | 32,453,023 | ||||||
|
Net increase in cash and cash equivalents
|
13,781,935 | 753,997 | ||||||
|
Cash and cash equivalents at beginning of year
|
17,089,409 | 16,335,412 | ||||||
|
Cash and cash equivalents at end of year
|
$ | 30,871,344 | $ | 17,089,409 | ||||
|
Supplemental disclosures:
|
||||||||
|
Interest paid
|
$ | 1,812,561 | $ | 2,827,064 | ||||
|
Income taxes paid
|
198,000 | 125,000 | ||||||
|
Loans transferred to other real estate owned
|
350,121 | - | ||||||
- 31 -
SBT BANCORP, INC. AND SUBSIDIARY
NOTES TO CONSOLIDATED FINANCIAL STATEMENTS
Years Ended December 31, 2010 and 2009
NOTE 1 - NATURE OF OPERATIONS
On March 2, 2006, The Simsbury Bank & Trust Company, Inc. (the “Bank”) reorganized into a holding company structure. As a result, the Bank became a wholly-owned subsidiary of SBT Bancorp, Inc. (the “Company”) and each outstanding share of common stock of the Bank was converted into the right to receive one share of the common stock, no par value, of the Company. The Company files reports with the Securities and Exchange Commission and is supervised by the Board of Governors of the Federal Reserve System.
The Bank is a state chartered bank which was incorporated on April 28, 1992 and is headquartered in Simsbury, Connecticut. The Bank commenced operations on March 31, 1995 engaging principally in the business of attracting deposits from the general public and investing those deposits in securities, residential and commercial real estate, consumer and small business loans.
NOTE 2 - ACCOUNTING POLICIES
The accounting and reporting policies of the Company and its subsidiary conform to accounting principles generally accepted in the United States of America and predominant practices within the banking industry. The consolidated financial statements of the Company were prepared using the accrual basis of accounting. The significant accounting policies of the Company are summarized below to assist the reader in better understanding the consolidated financial statements and other data contained herein.
USE OF ESTIMATES:
The preparation of consolidated financial statements in conformity with accounting principles generally accepted in the United States of America requires management to make estimates and assumptions that affect the reported amounts of assets and liabilities and disclosure of contingent assets and liabilities at the date of the consolidated financial statements and the reported amounts of revenues and expenses during the reporting period. Actual results could differ from those estimates.
BASIS OF PRESENTATION:
The consolidated financial statements include the accounts of the Company and its wholly-owned subsidiary the Bank and the Bank’s wholly-owned subsidiaries, SBT Investment Services, Inc. and NERE Holdings, Inc. SBT Investment Services, Inc. was established solely for the purpose of providing investment products, financial advice and services to its clients and the community. NERE Holdings, Inc. was established to hold real estate. All significant intercompany accounts and transactions have been eliminated in the consolidation.
CASH AND CASH EQUIVALENTS:
For purposes of reporting cash flows, cash and cash equivalents include cash on hand, cash items, due from banks, Federal Home Loan Bank interest-bearing demand and overnight deposits, Federal Reserve Bank interest-bearing demand deposits, money market mutual funds and federal funds sold.
- 32 -
Cash and due from banks as of December 31, 2010 and 2009 includes $4,070,000 and $3,127,000, respectively, which is subject to withdrawals and usage restrictions to satisfy the reserve requirements of the Federal Reserve Bank of Boston and Bankers’ Bank Northeast.
SECURITIES:
Investments in debt securities are adjusted for amortization of premiums and accretion of discounts computed so as to approximate the interest method. Gains or losses on sales of investment securities are computed on a specific identification basis.
The Company classifies debt and equity securities into one of three categories: held-to-maturity, available-for-sale, or trading. These security classifications may be modified after acquisition only under certain specified conditions. In general, securities may be classified as held-to-maturity only if the Company has the positive intent and ability to hold them to maturity. Trading securities are defined as those bought and held principally for the purpose of selling them in the near term. All other securities must be classified as available-for-sale.
|
|
--
|
Held-to-maturity securities are measured at amortized cost in the consolidated balance sheets. Unrealized holding gains and losses are not included in earnings, or in a separate component of capital. They are merely disclosed in the notes to the consolidated financial statements.
|
|
|
--
|
Available-for-sale securities are carried at fair value on the consolidated balance sheets. Unrealized holding gains and losses are not included in earnings but are reported as a net amount (less expected tax) in a separate component of capital until realized.
|
|
|
--
|
Trading securities are carried at fair value on the consolidated balance sheets. Unrealized holding gains and losses for trading securities are included in earnings.
|
For any debt security with a fair value less than its amortized cost basis, the Company will determine whether it has the intent to sell the debt security or whether it is more likely than not it will be required to sell the debt security before the recovery of its amortized cost basis. If either condition is met, the Company will recognize a full impairment charge to earnings. For all other debt securities that are considered other-than-temporarily impaired and do not meet either condition, the credit loss portion of impairment will be recognized in earnings as realized losses. The other-than-temporary impairment related to all other factors will be recorded in other comprehensive income.
Declines in marketable equity securities below their cost that are deemed other than temporary are reflected in earnings as realized losses.
As a member of the Federal Home Loan Bank (FHLB), the Company is required to invest in $100 par value stock of FHLB. The FHLB capital structure mandates that members must own stock as determined by their Total Stock Investment Requirement which is the sum of a member’s Membership Stock Investment Requirement and Activity-Based Stock Investment Requirement. The Membership Stock Investment Requirement is calculated as 0.35% of member’s Stock Investment Base, subject to a minimum investment of $10,000 and a maximum investment of $25,000,000. The Stock Investment Base is an amount calculated based on certain assets held by a member that are reflected on call reports submitted to applicable regulatory authorities. The Activity-Based Stock Investment Requirement is calculated as 4.5% of a member’s outstanding principal balances of FHLB advances plus a percentage of advance commitments, 4.5% of standby letters of credit issued by the FHLB and 4.5% of the value of intermediated derivative contracts. Management evaluates the Company’s investment in FHLB of Boston stock for other-than-temporary impairment at least on a quarterly basis and more frequently when economic or market conditions warrant such evaluation. Based on its most recent analysis of the FHLB of Boston as of December 31, 2010 management deems its investment in FHLB of Boston stock to be not other-than-temporarily impaired.
- 33 -
On December 8, 2008, the Federal Home Loan Bank of Boston announced a moratorium on the repurchase of excess stock held by its members. The moratorium will remain in effect indefinitely.
LOANS HELD-FOR-SALE:
Loans held-for-sale in the secondary market are carried at the lower of cost or estimated fair value in the aggregate. Net unrealized losses are provided for in a valuation allowance by charges to operations.
Interest income on mortgages held-for-sale is accrued currently and classified as interest on loans.
LOANS:
Loans receivable that management has the intent and ability to hold until maturity or payoff, are reported at their outstanding principal balances adjusted for amounts due to borrowers on unadvanced loans, any charge-offs, the allowance for loan losses and any deferred fees or costs on originated loans, or unamortized premiums or discounts on purchased loans.
Interest on loans is recognized on a simple interest basis.
Loan origination and commitment fees and certain direct origination costs are deferred, and the net amount amortized as an adjustment of the related loan's yield. The Company is amortizing these amounts over the contractual life of the related loans.
Residential real estate loans are generally placed on nonaccrual when reaching 90 days past due or in process of foreclosure. All closed-end consumer loans 90 days or more past due and any equity line in the process of foreclosure are placed on nonaccrual status. Secured consumer loans are written down to realizable value and unsecured consumer loans are charged-off upon reaching 120 or 180 days past due depending on the type of loan. Commercial real estate loans and commercial business loans and leases which are 90 days or more past due are generally placed on nonaccrual status, unless secured by sufficient cash or other assets immediately convertible to cash. When a loan has been placed on nonaccrual status, previously accrued and uncollected interest is reversed against interest on loans. A loan can be returned to accrual status when collectability of principal is reasonably assured and the loan has performed for a period of time, generally six months.
Cash receipts of interest income on impaired loans are credited to principal to the extent necessary to eliminate doubt as to the collectability of the net carrying amount of the loan. Some or all of the cash receipts of interest income on impaired loans is recognized as interest income if the remaining net carrying amount of the loan is deemed to be fully collectible. When recognition of interest income on an impaired loan on a cash basis is appropriate, the amount of income that is recognized is limited to that which would have been accrued on the net carrying amount of the loan at the contractual interest rate. Any cash interest payments received in excess of the limit and not applied to reduce the net carrying amount of the loan are recorded as recoveries of charge-offs until the charge-offs are fully recovered.
The Company has certain lending policies and procedures in place that are designed to maximize loan income with an acceptable level of risk. Management reviews and approves these policies and procedures on an annual basis. A reporting system is in place which provides management with frequent reports related to loan quality, loan production, loan delinquencies and non-performing or potential problem loans.
Commercial and industrial loans are underwritten after evaluating historical and projected profitability and cash flow to determine the borrower’s ability to repay their obligation as agreed. Underwriting standards are designed to promote relationship banking rather than transactional banking. Commercial and industrial loans are made primarily based on the identified cash flow of the borrower and secondarily on the underlying collateral supporting the loan facility. The cash flow of the borrower may not be as expected and the collateral supporting the loan may fluctuate in value. Most commercial and industrial loans are secured by the assets being financed or other business assets such as accounts receivable and inventory and may incorporate a personal guarantee. Some loans may be made on an unsecured basis. In the case of loans secured by accounts receivable, the availability of funds for the repayment of these loans may be substantially dependent upon the ability of the borrower to collect amounts due from its customers.
- 34 -
Commercial real estate loans are subject to the underwriting standards and processes similar to commercial and industrial loans, in addition to those underwriting standards for real estate loans. These loans are viewed primarily as cash flow dependent and secondarily as loans secured by real estate. Commercial real estate lending typically involves higher principal balances and longer repayment periods. Repayment of these loans is generally dependent upon the successful operation of the property securing the loan or the principal business conducted on the property securing the loan. Commercial real estate loans may be adversely affected by conditions in the real estate markets or the economy in general. The properties securing the Company’s commercial real estate portfolio are diverse in terms of type and geographic location. This diversification reduces the exposure to adverse economic conditions that affect any single market or industry. Management monitors and evaluates commercial real estate loans based on collateral, geography and risk-rating criteria. The Company also utilizes third-party experts to provide environmental and market valuations, in addition to economic conditions and trends within a specific industry. The Company also tracks the level of owner occupied commercial real estate loans within its commercial real estate portfolio. At December 31, 2010, approximately 78.3% of the outstanding principal balance of the Company’s commercial real estate loans were secured by owner-occupied properties.
With respect to land developers and builders that are secured by non-owner-occupied properties that the Company may originate from time to time, the Company generally requires that the borrower have a proven record of success. Construction loans are underwritten based upon a financial analysis of the developers and property owners and construction cost estimates, in addition to independent appraisal valuations. These loans will rely on the value associated with the project upon completion. These cost and valuation estimates may be inaccurate. Construction loans generally involve the disbursement of substantial funds over a short period of time with repayment substantially dependent upon the success of the completed project. Sources of repayment of these loans would be permanent financing upon completion or sales of developed property. These loans are closely monitored by onsite inspections and are considered to be of a higher risk than other real estate loans due to their ultimate repayment being sensitive to general economic conditions, availability of long-term financing, interest rate sensitivity, and governmental regulation of real property.
The Company originates consumer loans utilizing a computer-based credit-scoring analysis to supplement the underwriting process. To monitor and manage consumer loan risk, policies and procedures are developed and modified, as needed, jointly by staff and management. This continual review, coupled with the high volume of borrowers of smaller dollar loans, minimizes risk. Additionally, trend and outlook reports are reviewed by management on a regular basis. Underwriting standards for home equity loans are heavily influenced by regulatory requirements, which include but are not limited to a maximum loan-to-value of 75%, collection remedies, the number of such loans that a borrower can have at one time, and documentation requirements.
The Company engages an independent loan review firm that reviews and validates the credit risk program on a periodic basis. Results of these reviews are presented to management and the Board of Directors. The loan review process complements and reinforces the risk identification process and assessment decisions made by the relationship managers and credit officer, as well as the Company’s policies and procedures.
ALLOWANCE FOR LOAN LOSSES:
The allowance for loan losses is established as losses are estimated to have occurred through a provision for loan losses charged to earnings. Loan losses are charged against the allowance when management believes the uncollectability of a loan balance is confirmed. Subsequent recoveries, if any, are credited to the allowance.
- 35 -
The allowance for loan losses is evaluated on a regular basis by management and is based upon management’s periodic review of the collectability of the loans in light of historical experience, the nature and volume of the loan portfolio, adverse situations that may affect the borrower’s ability to repay, estimated value of any underlying collateral and prevailing economic conditions. This evaluation is inherently subjective as it requires estimates that are susceptible to significant revision as more information becomes available.
General component:
The general component of the allowance for loan losses is based on historical loss experience adjusted for qualitative factors stratified by the following loan segments: residential real estate, commercial real estate, construction, commercial and consumer. Management uses a rolling average of historical losses based on a time frame appropriate to capture relevant loss data for each loan segment. This historical loss factor is adjusted for the following qualitative factors: levels/trends in delinquencies; trends in volume and terms of loans; effects of changes in risk selection and underwriting standards and other changes in lending policies, procedures and practices; experience/ability/depth of lending management and staff; and national and local economic trends and conditions. There were no changes in the Company’s policies or methodology pertaining to the general component of the allowance for loan losses during 2010.
The qualitative factors are determined based on the various risk characteristics of each loan segment. Risk characteristics relevant to each portfolio segment are as follows:
Residential real estate: The Company generally does not originate loans with a loan-to-value ratio greater than 80 percent without obtaining private mortgage insurance for any amounts over 80% and does not grant subprime loans. All loans in this segment are collateralized by owner-occupied residential real estate and repayment is dependent on the credit quality of the individual borrower. The overall health of the economy, including unemployment rates and housing prices, will have an effect on the credit quality in this segment.
Commercial real estate: Loans in this segment are primarily income-producing properties throughout the Farmington Valley in Connecticut. The underlying cash flows generated by the properties are adversely impacted by a downturn in the economy as evidenced by increased vacancy rates, which in turn will, have an effect on the credit quality in this segment. Management periodically obtains rent rolls annually and continually monitors the cash flows of these loans.
Construction loans: Loans in this segment primarily include speculative real estate development loans for which payment is derived from sale of the property. Credit risk is affected by cost overruns, time to sell at an adequate price, and market conditions.
Commercial loans: Loans in this segment are made to businesses and are generally secured by assets of the business. Repayment is expected from the cash flows of the business. A weakened economy, and resultant decreased consumer spending, will have an effect on the credit quality in this segment.
Consumer loans: Loans in this segment are generally unsecured and repayment is dependent on the credit quality of the individual borrower.
Allocated component:
The allocated component relates to loans that are classified as impaired. Impairment is measured on a loan-by-loan basis for commercial, commercial real estate and construction loans by either the present value of expected future cash flows discounted at the loan’s effective interest rate or the fair value of the collateral if the loan is collateral dependent. An allowance is established when the discounted cash flows (or collateral value) of the impaired loan is lower than the carrying value of that loan. Large groups of smaller balance homogeneous loans are collectively evaluated for impairment. Accordingly, the Company does not separately identify individual consumer and residential real estate loans for impairment disclosures, unless such loans are subject to a troubled debt restructuring agreement.
- 36 -
A loan is considered impaired when, based on current information and events, it is probable that the Company will be unable to collect the scheduled payments of principal or interest when due according to the contractual terms of the loan agreement. Factors considered by management in determining impairment include payment status, collateral value, and the probability of collecting scheduled principal and interest payments when due. Loans that experience insignificant payment delays and payment shortfalls generally are not classified as impaired. Management determines the significance of payment delays and payment shortfalls on a case-by-case basis, taking into consideration all of the circumstances surrounding the loan and the borrower, including the length of the delay, the reasons for the delay, the borrower’s prior payment record, and the amount of the shortfall in relation to the principal and interest owed.
The Company periodically may agree to modify the contractual terms of loans. When a loan is modified and a concession is made to a borrower experiencing financial difficulty, the modification is considered a troubled debt restructuring ("TDR"). All TDRs are initially classified as impaired.
Unallocated component:
An unallocated component is maintained to cover uncertainties that could affect management’s estimate of probable losses. The unallocated component of the allowance reflects the margin of imprecision inherent in the underlying assumptions used in the methodologies for estimating allocated and general reserves in the portfolio.
PREMISES AND EQUIPMENT:
Premises and equipment are stated at cost, less accumulated depreciation and amortization. Cost and related allowances for depreciation and amortization of premises and equipment retired or otherwise disposed of are removed from the respective accounts with any gain or loss included in income or expense. Depreciation and amortization are calculated principally on the straight-line method over the estimated useful lives of the assets. Estimated lives are 3 to 20 years for furniture and equipment. Leasehold improvements are amortized over the lesser of the life of the lease or the estimated life of the improvements.
OTHER REAL ESTATE OWNED AND IN-SUBSTANCE FORECLOSURES:
Other real estate owned includes properties acquired through foreclosures and properties classified as in-substance foreclosures in accordance with ASC 310-40, “Receivables – Troubled Debt Restructuring by Creditors.” These properties are carried at the lower of cost or estimated fair value less estimated costs to sell. Any writedown from cost to estimated fair value required at the time of foreclosure or classification as in-substance foreclosure is charged to the allowance for loan losses. Expenses incurred in connection with maintaining these assets, subsequent writedowns, and gains or losses recognized upon sale are included in other expense.
In accordance with ASC 310-10-35, “Receivables – Overall – Subsequent Measurements,” the Company classifies loans as in-substance repossessed or foreclosed if the Company receives physical possession of the debtor’s assets regardless of whether formal foreclosure proceedings take place.
FAIR VALUES OF FINANCIAL INSTRUMENTS:
ASC 825,“ Financial Instruments,” requires that the Company disclose estimated fair values for its financial instruments. Fair value methods and assumptions used by the Company in estimating its fair value disclosures are as follows:
Cash and cash equivalents: The carrying amounts reported in the balance sheets for cash and cash equivalents approximate those assets' fair values.
Interest-bearing time deposits with banks: The fair values of interest bearing time deposits with banks are estimated using discounted cash flow analyses using interest rates currently being offered for deposits with similar terms to investors.
- 37 -
Securities: Fair values for securities are based on quoted market prices, where available. If quoted market prices are not available, fair values are based on quoted market prices of comparable instruments.
Loans held-for-sale: Fair values for loans held-for-sale are estimated based on outstanding investor commitments, or in the absence of such commitments, are based on current investor yield requirements.
Loans receivable: For variable-rate loans that reprice frequently and with no significant change in credit risk, fair values are based on carrying values. The fair values for other loans are estimated by discounting the future cash flows, using interest rates currently being offered for loans with similar terms to borrowers of similar credit quality.
Accrued interest receivable: The carrying amount of accrued interest receivable approximates its fair value.
Deposit liabilities: The fair values disclosed for demand deposits, regular savings, NOW accounts, and money market accounts are equal to the amount payable on demand at the reporting date (i.e., their carrying amounts). Fair values for certificates of deposit are estimated using a discounted cash flow calculation that applies interest rates currently being offered on certificates to a schedule of aggregated expected monthly maturities on time deposits.
Federal Home Loan Bank advances: Fair values of Federal Home Loan Bank advances are estimated using discounted cash flow analyses based on the Company’s current incremental borrowing rates for similar types of borrowing arrangements.
Securities sold under agreements to repurchase: The carrying amounts of securities sold under agreements to repurchase approximate their fair values.
Due to broker: The carrying amount of due to broker approximates its fair value.
Off-balance sheet instruments: The fair value of commitments to originate loans is estimated using the fees currently charged to enter similar agreements, taking into account the remaining terms of the agreements and the present creditworthiness of the counterparties. For fixed-rate loan commitments and the unadvanced portion of loans, fair value also considers the difference between current levels of interest rates and the committed rates. The fair value of letters of credit is based on fees currently charged for similar agreements or on the estimated cost to terminate them or otherwise settle the obligation with the counterparties at the reporting date.
ADVERTISING:
The Company directly expenses costs associated with advertising as they are incurred.
INCOME TAXES:
The Company recognizes income taxes under the asset and liability method. Under this method, deferred tax assets and liabilities are established for the temporary differences between the accounting basis and the tax basis of the Company's assets and liabilities at enacted tax rates expected to be in effect when the amounts related to such temporary differences are realized or settled.
STOCK BASED COMPENSATION:
At December 31, 2010, the Company has a stock-based employee compensation plan which is described more fully in Note 17. The Company accounts for the plan under ASC 718-10, “Compensation – Stock Compensation – Overall.” During the years ended December 31, 2010 and 2009, $9,467 and $43,755, respectively, in stock-based employee compensation was recognized.
EARNINGS PER SHARE:
Basic earnings per share excludes dilution and is computed by dividing income available to common stockholders by the weighted-average number of common shares outstanding for the period. Diluted earnings per share reflects the potential dilution that could occur if securities or other contracts to issue common stock were exercised or converted into common stock or resulted in the issuance of common stock that then shared in the earnings of the entity.
- 38 -
RECENT ACCOUNTING PRONOUNCEMENTS:
In March 2010, the FASB issued ASU 2010-11, “Scope Exception Related to Embedded Credit Derivatives.” The ASU clarifies that certain embedded derivatives, such as those contained in certain securitizations, CDOs and structured notes, should be considered embedded credit derivatives subject to potential bifurcation and separate fair value accounting. The ASU allows any beneficial interest issued by a securitization vehicle to be accounted for under the fair value option at transition. At transition, the Company may elect to reclassify various debt securities (on an instrument-by-instrument basis) from held-to-maturity (HTM) or available-for-sale (AFS) to trading. The new rules are effective July 1, 2010. This ASU did not have a significant impact on the Company’s financial condition or results of operation.
In January 2010, the FASB issued ASU 2010-06, “Improving Disclosures about Fair Value Measurements.” The ASU requires disclosing the amounts of significant transfers in and out of Level 1 and 2 of the fair value hierarchy and describing the reasons for the transfers. The disclosures are effective for reporting periods beginning after December 15, 2009. The Company adopted ASU 2010-06 as of January 1, 2010. The required disclosures are included in Note 11. Additionally, disclosures of the gross purchases, sales, issuances and settlements activity in the Level 3 of the fair value measurement hierarchy will be required for fiscal years beginning after December 15, 2010.
In April 2010, the FASB issued ASU 2010-18, “Effect of a Loan Modification When the Loan is Part of a Pool That is Accounted for as a Single Asset.” As a result of this ASU, modifications of loans that are accounted for within a pool under Subtopic 310-30 do not result in the removal of those loans from the pool even if the modification of those loans would otherwise be considered a troubled debt restructuring. An entity will continue to be required to consider whether the pool of assets in which the loan is included is impaired if expected cash flows for the pool change. The amendments in this ASU are effective for modifications of loans accounted for within pools under Subtopic 310-30 occurring in the first interim or annual period ending on or after July 15, 2010. The amendments are to be applied prospectively. Early application is permitted.
In July 2010, the FASB issued ASU 2010-20, “Disclosures about the Credit Quality of Financing Receivables and the Allowance for Credit Losses.” This ASU is created to provide financial statement users with greater transparency about an entity’s allowance for credit losses and the credit quality of its financing receivables. This ASU is intended to provide additional information to assist financial statement users in assessing the entity’s
credit risk exposures and evaluating the adequacy of its allowance for credit losses. The amendments in this ASU are effective for public entities as of the end of a reporting period for interim and annual reporting periods ending on or after December 15, 2010. The disclosures about activity that occurs during a reporting period are effective for interim and annual reporting periods beginning on or after December 15, 2010. For nonpublic entities, the disclosures are effective for annual reporting periods ending on or after December 15, 2011.
In December 2010, the FASB issued ASU 2010-28, “Intangibles - Goodwill and Other.” This ASU is to addresses when to perform step 2 of the goodwill impairment test for reporting units with zero or negative carrying amounts. For public entities, the amendments in this ASU are effective for fiscal years, and interim periods beginning after December 15, 2010. For nonpublic entities, the amendments are effective for fiscal years and interim periods beginning after December 15, 2011.
In December 2010, the FASB issued ASU 2010-29, “Disclosure of Supplementary Pro Forma Information for Business Combinations.” This ASU addresses diversity in practice about the interpretation of the pro forma revenue and earnings disclosure requirements for business combinations. This ASU is effective prospectively for business combinations for which the acquisition date is on or after the beginning of the first annual reporting period beginning on or after December 15, 2010.
- 39 -
NOTE 3 - INVESTMENTS IN AVAILABLE-FOR-SALE SECURITIES
Debt and equity securities have been classified in the consolidated balance sheets according to management’s intent. The amortized cost of securities and their approximate fair values are as follows as of December 31:
| Amortized Cost Basis |
Gross Unrealized Gains |
Gross Unrealized Losses |
Fair Value |
|||||||||||||
|
December 31, 2010:
|
||||||||||||||||
|
Debt securities issued by the U.S. Treasury and other U.S. government corporations and agencies
|
$ | 10,749,626 | $ | 76,693 | $ | 35,297 | $ | 10,791,022 | ||||||||
|
Obligations of states and municipalities
|
11,607,144 | 94,764 | 135,763 | 11,566,145 | ||||||||||||
|
Corporate debt securities
|
1,003,447 | 21,281 | 2,633 | 1,022,095 | ||||||||||||
|
Mortgage-backed securities
|
21,026,171 | 453,027 | 172,085 | 21,307,113 | ||||||||||||
|
SBA loan pools
|
1,459,431 | 108,893 | - | 1,568,324 | ||||||||||||
|
U.S. government sponsored enterprises perpetual/callable preferred stocks
|
16,500 | 17,998 | - | 34,498 | ||||||||||||
|
Marketable equity securities
|
8,342,967 | - | - | 8,342,967 | ||||||||||||
| 54,205,286 | 772,656 | 345,778 | 54,632,164 | |||||||||||||
|
Money market mutual funds included in cash and cash equivalents
|
(8,342,967 | ) | - | - | (8,342,967 | ) | ||||||||||
|
Total available-for-sale securities
|
$ | 45,862,319 | $ | 772,656 | $ | 345,778 | $ | 46,289,197 | ||||||||
| Amortized Cost Basis |
Gross Unrealized Gains |
Gross Unrealized Losses |
Fair Value |
|||||||||||||
|
December 31, 2009:
|
||||||||||||||||
|
Debt securities issued by the U.S. Treasury and other U.S. government corporations and agencies
|
$ | 15,723,378 | $ | 56,246 | $ | 12,563 | $ | 15,767,061 | ||||||||
|
Obligations of states and municipalities
|
9,977,623 | 159,024 | 34,238 | 10,102,409 | ||||||||||||
|
Corporate debt securities
|
508,673 | 27,012 | - | 535,685 | ||||||||||||
|
Mortgage-backed securities
|
21,772,298 | 322,668 | 253,165 | 21,841,801 | ||||||||||||
|
SBA loan pools
|
1,639,685 | 67,480 | - | 1,707,165 | ||||||||||||
|
U.S. government sponsored enterprises perpetual/callable preferred stocks
|
16,500 | 40,695 | - | 57,195 | ||||||||||||
|
Marketable equity securities
|
1,352,711 | - | - | 1,352,711 | ||||||||||||
| 50,990,868 | 673,125 | 299,966 | 51,364,027 | |||||||||||||
|
Money market mutual funds included in cash and cash equivalents
|
(1,352,711 | ) | - | - | (1,352,711 | ) | ||||||||||
|
Total available-for-sale securities
|
$ | 49,638,157 | $ | 673,125 | $ | 299,966 | $ | 50,011,316 | ||||||||
The scheduled maturities of securities were as follows as of December 31, 2010:
| Fair Value |
||||
|
Due within one year
|
$ | 497,536 | ||
|
Due after one year through five years
|
12,319,807 | |||
|
Due after five years through ten years
|
3,486,090 | |||
|
Due after ten years
|
7,110,327 | |||
|
SBA loan pools
|
1,568,324 | |||
|
Mortgage-backed securities
|
21,307,113 | |||
| $ | 46,289,197 |
- 40 -
There were no sales of available-for-sale securities during the year ended December 31, 2010. During 2009, proceeds from sales of available-for-sale securities amounted to $1,170,316. Gross realized gains on those sales amounted to $39,491. The tax benefit applicable to these gross realized gains amounted to $15,382.
There were no securities of issuers whose aggregate carrying amount exceeded 10% of stockholders’ equity as of December 31, 2010.
As of December 31, 2010 and 2009, the total carrying amounts of securities pledged for securities sold under agreements to repurchase and public deposits were $16,587,463 and $11,037,829, respectively.
The aggregate fair value and unrealized losses of securities that have been in a continuous unrealized loss position for less than twelve months and for twelve months or more, and are not other than temporarily impaired, are as follows:
| Less than 12 Months | 12 Months or Longer | Total | ||||||||||||||||||||||
| Fair Value |
Unrealized Losses |
Fair Value |
Unrealized Losses |
Fair Value |
Unrealized Losses |
|||||||||||||||||||
|
December 31, 2010:
|
||||||||||||||||||||||||
|
Debt securities issued by the U.S. Treasury and other U.S. government corporations and
agencies
|
$ | 5,214,703 | $ | 35,297 | $ | - | $ | - | $ | 5,214,703 | $ | 35,297 | ||||||||||||
|
Obligations of states and municipalities
|
3,759,853 | 135,763 | - | - | 3,759,853 | 135,763 | ||||||||||||||||||
|
Corporate debt securities
|
496,130 | 2,633 | - | - | 496,130 | 2,633 | ||||||||||||||||||
|
Mortgage-backed securities
|
3,900,106 | 61,665 | 847,756 | 110,420 | 4,747,862 | 172,085 | ||||||||||||||||||
|
Total temporarily impaired securities
|
$ | 13,370,792 | $ | 235,358 | $ | 847,756 | $ | 110,420 | $ | 14,218,548 | $ | 345,778 | ||||||||||||
| Less than 12 Months | 12 Months or Longer | Total | ||||||||||||||||||||||
| Fair Value |
Unrealized Losses |
Fair Value |
Unrealized Losses |
Fair Value |
Unrealized Losses |
|||||||||||||||||||
|
December 31, 2009:
|
||||||||||||||||||||||||
|
Debt securities issued by the U.S. Treasury and other U.S. government corporations and
agencies
|
$ | 2,988,620 | $ | 12,563 | $ | - | $ | - | $ | 2,988,620 | $ | 12,563 | ||||||||||||
|
Obligations of states and municipalities
|
3,044,480 | 34,238 | - | - | 3,044,480 | 34,238 | ||||||||||||||||||
|
Mortgage-backed securities
|
2,227,512 | 17,610 | 1,317,233 | 235,555 | 3,544,745 | 253,165 | ||||||||||||||||||
|
Total temporarily impaired securities
|
$ | 8,260,612 | $ | 64,411 | $ | 1,317,233 | $ | 235,555 | $ | 9,577,845 | $ | 299,966 | ||||||||||||
The investments in the Company’s investment portfolio that are temporarily impaired as of December 31, 2010 consist of debt issued by states of the United States and political subdivisions of the states, U.S. corporations, and U.S. government corporations and agencies. Company management considers investments with an unrealized loss as of December 31, 2010 to be only temporarily impaired because the impairment is attributable to changes in market interest rates and current market inefficiencies. Company management anticipates that the fair value of securities that are currently impaired will recover to cost basis. As management has the ability to hold securities for the foreseeable future no declines are deemed to be other than temporary.
- 41 -
NOTE 4 - LOANS
Loans consisted of the following as of December 31:
|
2010
|
2009
|
|||||||
|
Commercial, financial and agricultural
|
$ | 13,568,271 | $ | 12,900,649 | ||||
|
Real estate - construction and land development
|
4,986,546 | 6,744,569 | ||||||
|
Real estate - residential
|
148,396,036 | 138,408,956 | ||||||
|
Real estate - commercial
|
31,293,763 | 28,721,564 | ||||||
|
Municipal
|
2,034,597 | 2,015,318 | ||||||
|
Consumer
|
4,512,092 | 4,473,822 | ||||||
| 204,791,305 | 193,264,878 | |||||||
|
Allowance for loan losses
|
(2,325,687 | ) | (2,211,301 | ) | ||||
|
Deferred costs, net
|
326,859 | 249,942 | ||||||
|
Net loans
|
$ | 202,792,477 | $ | 191,303,519 | ||||
Changes in the allowance for loan losses were as follows for the years ended December 31:
|
2010
|
2009
|
|||||||
|
Balance at beginning of year
|
$ | 2,211,301 | $ | 2,017,145 | ||||
|
Provision for loan losses
|
755,000 | 547,000 | ||||||
|
Charge offs
|
(646,761 | ) | (358,097 | ) | ||||
|
Recoveries of loans previously charged off
|
6,147 | 5,253 | ||||||
|
Balance at end of year
|
$ | 2,325,687 | $ | 2,211,301 | ||||
The following table sets forth information regarding the allowance for loan losses by portfolio segment as of December 31, 2010:
| Real Estate: | ||||||||||||||||||||||||||||||||
| Residential | Commercial |
Construction and
Land Development
|
Home Equity | Commerical & Industrial |
Consumer | Unallocated | Total | |||||||||||||||||||||||||
|
Allowance:
|
||||||||||||||||||||||||||||||||
|
Ending balance:
|
||||||||||||||||||||||||||||||||
|
Individually evaluated for impairment
|
$ | 79,000 | $ | - | $ | - | $ | 600 | $ | - | $ | - | $ | - | $ | 79,600 | ||||||||||||||||
|
Ending balance:
|
||||||||||||||||||||||||||||||||
|
Collectively evaluated for impairment
|
759,321 | 464,526 | 67,655 | 359,680 | 410,355 | 93,579 | 90,971 | 2,246,087 | ||||||||||||||||||||||||
|
|
||||||||||||||||||||||||||||||||
|
Total allowance
|
||||||||||||||||||||||||||||||||
|
for loan lease loss ending balance
|
$ | 838,321 | $ | 464,526 | $ | 67,655 | $ | 360,280 | $ | 410,355 | $ | 93,579 | $ | 90,971 | $ | 2,325,687 | ||||||||||||||||
|
Loans:
|
||||||||||||||||||||||||||||||||
|
Ending balance:
|
||||||||||||||||||||||||||||||||
|
Individually evaluated for impairment
|
$ | 384,094 | $ | 326,406 | $ | 1,000,743 | $ | 7,802 | $ | - | $ | - | $ | - | $ | 1,719,045 | ||||||||||||||||
|
Ending balance:
|
||||||||||||||||||||||||||||||||
|
Collectively evaluated for impairment
|
100,302,895 | 30,997,736 | 3,990,265 | 47,927,571 | 15,661,681 | 4,518,971 | - | 203,399,119 | ||||||||||||||||||||||||
|
Total loans
|
||||||||||||||||||||||||||||||||
|
ending balance
|
$ | 100,686,989 | $ | 31,324,142 | $ | 4,991,008 | $ | 47,935,373 | $ | 15,661,681 | $ | 4,518,971 | $ | - | $ | 205,118,164 | ||||||||||||||||
- 42 -
The following table presents the Company’s loans by risk rating as of December 31, 2010:
Credit quality indicators
| Real Estate | ||||||||||||||||||||||||||||
| Residential | Commercial | Construction and Land Development |
Home Equity | Commerical and Industrial |
Consumer | Total | ||||||||||||||||||||||
|
Grade:
|
||||||||||||||||||||||||||||
|
Pass
|
$ | 99,658,355 | $ | 28,802,453 | $ | 3,650,310 | $ | 47,515,158 | $ | 14,392,933 | $ | 4,510,408 | $ | 198,529,617 | ||||||||||||||
|
Special Mention
|
259,610 | 1,797,703 | 339,955 | - | 162,364 | - | 2,559,632 | |||||||||||||||||||||
|
Substandard
|
769,024 | 723,986 | 1,000,743 | 420,215 | 1,106,384 | 8,563 | 4,028,915 | |||||||||||||||||||||
|
Total
|
$ | 100,686,989 | $ | 31,324,142 | $ | 4,991,008 | $ | 47,935,373 | $ | 15,661,681 | $ | 4,518,971 | $ | 205,118,164 | ||||||||||||||
Credit Quality Indicators: As part of the ongoing monitoring of the credit quality of the Company’s loan portfolio, management tracks certain credit quality indicators including trends related to (i) weighted average risk rating of commercial loans; (ii) the level of classified and criticized commercial loans; (iii) non performing loans; (iv) net charge-offs and (v) the general economic conditions within the State of Connecticut.
The Company utilizes a risk rating grading matrix to assign a risk grade to each of its commercial loans. Loans are graded on a scale of 1 to 7. A description of each rating class is as follows:
Risk Rating 1 (Superior) – This risk rating is assigned to loans secured by cash.
Risk Rating 2 (Good) – This risk rating is assigned to borrowers of high credit quality who have primary and secondary sources of repayment which are well defined and fully confirmed.
Risk Rating 3 (Satisfactory) – This risk rating is assigned to borrowers who are fully responsible for the loan or credit commitment, which has primary and secondary sources of repayment that are well defined and adequately confirmed. Most credit factors are favorable, and the credit exposure is managed through normal monitoring.
Risk Rating 3.5 (Bankable with Care) – This risk rating is assigned to borrowers who are fully responsible for the loan or credit commitment and the secondary sources of repayment are weak. These loans may require more than the average amount of attention from the relationship manager.
Risk Rating 4 (Special Mention) – This risk rating is assigned to borrowers which may be adequately protected by the present debt service capacity and tangible net worth of the borrower, but which have potential problems that could, if not checked or corrected, eventually weaken these assets or otherwise jeopardize the repayment of principal and interest as originally intended. Most credit factors are unfavorable, and the credit exposure requires immediate corrective action
Risk Rating 5 (Substandard) – This risk rating is assigned to borrowers who have inadequate cash flow or collateral to satisfy their loan obligations as originally defined in the loan agreement. Substandard loans may be placed on nonaccrual status if the conditions described above are generally met.
Risk Rating 6 (Doubtful) – This risk rating is assigned to a borrower or portion of a borrower’s loan with which the Company is no longer certain of its collectability. A specific reserve allocation is assigned to this portion of the loan.
Risk Rating 7 (Loss) – This risk rating is assigned to loans which have been charged off or the portion of the loan that has been charged down. “Loss” does not imply that the loan, or portion of, will never be paid, nor does it imply that there has been a forgiveness of debt.
- 43 -
An age analysis of past-due loans, segregated by class of loans, as of December 31, 2010 is as follows:
|
30-59 Days
|
60-89 Days
|
Greater than 90 Days
|
Total
Past Due |
Recorded
Investment > 90 Days and Accruing |
||||||||||||||||
|
Real estate:
|
||||||||||||||||||||
|
Residential
|
$ | 529,324 | $ | - | $ | 324,455 | $ | 853,779 | $ | - | ||||||||||
|
Commercial
|
- | 254,548 | 71,858 | 326,406 | - | |||||||||||||||
|
Construction and land development
|
- | - | 1,000,743 | 1,000,743 | - | |||||||||||||||
|
Commercial and industrial
|
- | - | 203,117 | 203,117 | - | |||||||||||||||
|
Consumer
|
72,503 | 526 | 8,620 | 81,649 | - | |||||||||||||||
|
Total
|
$ | 601,827 | $ | 255,074 | $ | 1,608,793 | $ | 2,465,694 | $ | - | ||||||||||
The following table sets forth information regarding nonaccrual loans as of December 31, 2010:
|
Real Estate:
|
||||
|
Residential
|
$ | 541,969 | ||
|
Commercial
|
326,406 | |||
|
Construction and land development
|
1,000,743 | |||
|
Home equity
|
420,215 | |||
|
Consumer
|
17,183 | |||
|
Total nonaccrual loans
|
$ | 2,306,516 | ||
The following table sets forth information regarding nonaccrual loans and accruing loans 90 days or more overdue as of December 31, 2009:
|
Total nonaccrual loans
|
$ | 3,153,187 | ||
|
Accruing loans which are 90 days or more overdue
|
$ | 202,024 |
Information about loans that meet the definition of an impaired loan in ASC 310-10-35 is as follows as of and for the year ended December 31, 2010.
| Recorded Investment |
Unpaid Principal Balance |
Related Allowance |
||||||||||
|
December 31, 2010:
|
||||||||||||
|
With no related allowance recorded:
|
||||||||||||
|
Real Estate:
|
||||||||||||
|
Commercial
|
$ | 326,406 | $ | 325,340 | $ | - | ||||||
|
Construction and land development
|
1,000,743 | 1,000,838 | - | |||||||||
|
Total impaired with no related allowance
|
1,327,149 | 1,326,178 | - | |||||||||
|
With an allowance recorded:
|
||||||||||||
|
Real Estate:
|
||||||||||||
|
Residential
|
384,094 | 400,747 | 79,000 | |||||||||
|
Home equity
|
7,802 | 7,703 | 600 | |||||||||
|
Total impaired with an allowance recorded
|
391,896 | 408,450 | 79,600 | |||||||||
|
Total:
|
||||||||||||
|
Real Estate:
|
||||||||||||
|
Residential
|
384,094 | 400,747 | 79,000 | |||||||||
|
Commercial
|
326,406 | 325,340 | - | |||||||||
|
Construction and land development
|
1,000,743 | 1,000,838 | - | |||||||||
|
Home equity
|
7,802 | 7,703 | 600 | |||||||||
| $ | 1,719,045 | $ | 1,734,628 | $ | 79,600 | |||||||
- 44 -
|
Recorded
|
||||
|
Investment
|
||||
|
Average recorded investment in impaired loans
|
||||
|
during the year ended December 31, 2010
|
$ | 2,027,326 | ||
|
Related amount of interest income recognized during the
|
||||
|
time, in the year ended December 31, 2010 that the loans
|
||||
|
were impaired
|
||||
|
Total recognized
|
$ | 35,260 | ||
|
Amount recognized using a cost-basis method of accounting
|
$ | 34,380 | ||
Information about loans that meet the definition of an impaired loan in ASC 310-10-35 is as follows as of and for the year ended December 31, 2009:
| 2009 | ||||||||
| Recorded Investment in Impaired Loans |
Related Allowance for Credit Losses |
|||||||
|
Loans for which there is a related allowance for credit losses
|
$ | 353,613 | $ | 160,000 | ||||
|
Loans for which there is no related allowance for credit losses
|
1,911,995 | - | ||||||
|
Totals
|
$ | 2,265,608 | $ | 160,000 | ||||
|
Average recorded investment in impaired loans during the year ended December 31, 2009
|
$ | 1,215,532 | ||||||
|
Related amount of interest income recognized during the time, in the year ended December 31, 2009 that the loans were impaired
|
||||||||
|
Total recognized
|
$ | 560 | ||||||
|
Amount recognized using a cash-basis method of accounting
|
$ | - | ||||||
NOTE 5 - PREMISES AND EQUIPMENT
The following is a summary of premises and equipment as of December 31:
|
2010
|
2009
|
|||||||
|
Leasehold improvements
|
$ | 1,178,612 | $ | 1,155,367 | ||||
|
Furniture and equipment
|
2,369,883 | 2,302,763 | ||||||
| 3,548,495 | 3,458,130 | |||||||
|
Accumulated depreciation and amortization
|
(2,986,782 | ) | (2,773,836 | ) | ||||
| $ | 561,713 | $ | 684,294 | |||||
- 45 -
NOTE 6 - DEPOSITS
The aggregate amount of time deposit accounts in denominations of $100,000 or more as of December 31, 2010 and 2009 was $32,242,306 and $34,678,968, respectively.
For time deposits as of December 31, 2010, the scheduled maturities for years ended December 31 are:
|
2011
|
$ | 55,664,340 | ||
|
2012
|
13,405,673 | |||
|
2013
|
2,653,084 | |||
|
2014
|
2,954,258 | |||
|
2015
|
3,054,984 | |||
|
Total
|
$ | 77,732,339 |
NOTE 7 - SECURITIES SOLD UNDER AGREEMENTS TO REPURCHASE
Securities sold under agreements to repurchase consist of funds borrowed from customers on a short-term basis secured by portions of the Company's investment portfolio. The securities which were sold have been accounted for not as sales but as borrowings. The securities consisted of debt securities issued by the U.S. Treasury and other U.S. government sponsored enterprises, corporations and agencies and states and municipalities. The securities were held in safekeeping by Morgan Stanley, under the control of the Company. The purchasers have agreed to sell to the Company substantially identical securities at the maturity of the agreements. The agreements mature generally within three months from date of issue.
NOTE 8 - FEDERAL HOME LOAN BANK ADVANCES
Advances consist of funds borrowed from the Federal Home Loan Bank (FHLB). There were no FHLB advances outstanding as of December 31, 2010 and 2009.
Borrowings from the FHLB are secured by a blanket lien on qualified collateral, consisting primarily of loans with first mortgages secured by one to four family properties and other qualified assets.
The Company has a line of credit with the FHLB in the amount of $1,525,000 at December 31, 2010 and 2009. At December 31, 2010 and 2009, there were no advances outstanding under this line of credit.
NOTE 9 - INCOME TAX EXPENSE
The components of income tax expense are as follows for the years ended December 31:
| 2010 | 2009 | |||||||
|
Current:
|
||||||||
|
Federal
|
$ | 262,551 | $ | 184,014 | ||||
|
State
|
99,543 | 61,452 | ||||||
| 362,094 | 245,466 | |||||||
|
Deferred:
|
||||||||
|
Federal
|
(1,469 | ) | (30,352 | ) | ||||
|
State
|
1,469 | 12,599 | ||||||
| - | (17,753 | ) | ||||||
|
Total income tax expense
|
$ | 362,094 | $ | 227,713 | ||||
- 46 -
The reasons for the differences between the statutory federal income tax rate and the effective tax rates are summarized as follows for the years ended December 31:
|
2010
|
2009
|
|||||||
|
% of
|
% of
|
|||||||
|
Income
|
Income
|
|||||||
|
Federal income tax at statutory rate
|
34.0 | % | 34.0 | % | ||||
|
Increase (decrease) in tax resulting from:
|
||||||||
|
Tax-exempt income
|
(15.5 | ) | (20.0 | ) | ||||
|
Other
|
1 | 3.3 | ||||||
|
Stock-based compensation
|
0.2 | 1.6 | ||||||
|
State tax expense, net of federal benefit
|
4.3 | 5.2 | ||||||
|
Effective tax rates
|
24.0 | % | 24.1 | % | ||||
The Company had gross deferred tax assets and gross deferred tax liabilities as follows as of December 31:
|
2010
|
2009
|
|||||||
|
Deferred tax assets:
|
||||||||
|
Allowance for loan losses
|
$ | 798,326 | $ | 803,109 | ||||
|
Deferred compensation
|
88,146 | 61,350 | ||||||
|
Other
|
- | 24,456 | ||||||
|
Impairment of operating lease
|
78,988 | 96,221 | ||||||
|
Write-down of equity securities
|
772,573 | 772,573 | ||||||
|
Alternative minimum tax carryforward
|
115,662 | 83,375 | ||||||
|
Gross deferred tax assets
|
1,853,695 | 1,841,084 | ||||||
|
Deferred tax liabilities:
|
||||||||
|
Depreciation
|
(15,181 | ) | (34,475 | ) | ||||
|
Deferred loan costs/fees
|
(127,313 | ) | (97,351 | ) | ||||
|
Other
|
(1,943 | ) | - | |||||
|
Net unrealized holdings gain on available-for-sale securities
|
(166,269 | ) | (145,345 | ) | ||||
|
Gross deferred tax liabilities
|
(310,706 | ) | (277,171 | ) | ||||
|
Net deferred tax asset
|
$ | 1,542,989 | $ | 1,563,913 | ||||
Deferred tax assets as of December 31, 2010 and 2009 have not been reduced by a valuation allowance because management believes that it is more likely than not that the full amount of deferred taxes will be realized.
As of December 31, 2010, the Company had no operating loss carryovers for income tax purposes.
It is the Company’s policy to provide for uncertain tax positions and the related interest and penalties based upon management’s assessment of whether a tax benefit is more likely than not to be sustained upon examination by tax authorities. As of December 31, 2010 and 2009, there were no material uncertain tax positions related to federal and state income tax matters. The Company is currently open to audit under the statute of limitations by the Internal Revenue Service and state taxing authorities for the years ended December 31, 2007 through December 31, 2010.
NOTE 10 - COMMITMENTS AND CONTINGENT LIABILITIES
As of December 31, 2010 the Company was obligated under non-cancelable operating leases for bank premises and equipment expiring between March 2011 and May 2016. The total minimum rental due in future periods under these existing agreements is as follows as of December 31, 2010:
|
2011
|
$ | 501,903 | ||
|
2012
|
458,524 | |||
|
2013
|
446,966 | |||
|
2014
|
385,082 | |||
|
2015
|
282,491 | |||
|
Thereafter
|
47,839 | |||
|
Total
|
$ | 2,122,805 |
- 47 -
Certain leases contain provisions for escalation of minimum lease payments contingent upon percentage increases in the consumer price index. Total rental expense amounted to $600,343 and $597,445 for the years ended December 31, 2010 and 2009, respectively.
On November 28, 2008, the Company entered into an agreement with its data processing servicer which ends in five years, and automatically continues for three years, unless terminated by either party with notice. Under the agreement, the Company must pay a termination fee as described in the agreement if the Company terminates the agreement with notice, before the end of the agreement.
NOTE 11 - FAIR VALUE MEASUREMENTS
ASC 820-10, “Fair Value Measurements and Disclosures,” provides a framework for measuring fair value under generally accepted accounting principles. This guidance also allows an entity the irrevocable option to elect fair value for the initial and subsequent measurement for certain financial assets and liabilities on a contract-by-contract basis.
In accordance with ASC 820-10, the Company groups its financial assets and financial liabilities measured at fair value in three levels, based on the markets in which the assets and liabilities are traded and the reliability of the assumptions used to determine fair value.
Level 1 - Valuations for assets and liabilities traded in active exchange markets, such as the New York Stock Exchange. Level 1 also includes U.S. Treasury, other U.S. Government and agency mortgage-backed securities that are traded by dealers or brokers in active markets. Valuations are obtained from readily available pricing sources for market transactions involving identical assets or liabilities.
Level 2 - Valuations for assets and liabilities traded in less active dealer or broker markets. Valuations are obtained from third party pricing services for identical or comparable assets or liabilities.
Level 3 - Valuations for assets and liabilities that are derived from other methodologies, including option pricing models, discounted cash flow models and similar techniques, are not based on market exchange, dealer, or broker traded transactions. Level 3 valuations incorporate certain assumptions and projections in determining the fair value assigned to such assets and liabilities.
A financial instrument’s level within the fair value hierarchy is based on the lowest level of input that is significant to the fair value measurement. The Company did not have any significant transfers of assets between Level 1 and Level 2 of the fair value hierarchy during the year ended December 31, 2010.
A description of the valuation methodologies used for instruments measured at fair value, as well as the general classification of such instruments pursuant to the valuation hierarchy, is set forth below. These valuation methodologies were applied to all of the Company’s financial assets and financial liabilities carried at fair value for December 31, 2010 and 2009.
The Company’s cash instruments are generally classified within Level 1 or Level 2 of the fair value hierarchy because they are valued using quoted market prices, broker or dealer quotations, or alternative pricing sources with reasonable levels of price transparency.
The Company’s investment in obligations of states and municipalities, mortgage-backed securities and other debt securities available-for-sale are generally classified within Level 2 of the fair value hierarchy. For these securities, we obtain fair value measurements from independent pricing services. The fair value measurements consider observable data that may include dealer quotes, market spreads, cash flows, the U.S. treasury yield curve, trading levels, market consensus prepayment speeds, credit information, and the instrument’s terms and conditions.
- 48 -
Level 3 is for positions that are not traded in active markets or are subject to transfer restrictions, valuations are adjusted to reflect illiquidity and/or non-transferability, and such adjustments are generally based on available market evidence. In the absence of such evidence, management’s best estimate is used. Subsequent to inception, management only changes Level 3 inputs and assumptions when corroborated by evidence such as transactions in similar instruments, completed or pending third-party transactions in the underlying investment or comparable entities, subsequent rounds of financing, recapitalization and other transactions across the capital structure, offerings in the equity or debt markets, and changes in financial ratios or cash flows.
The Company’s impaired loans are reported at the fair value of the underlying collateral if repayment is expected solely from the collateral. Collateral values are estimated using Level 2 inputs based upon appraisals of similar properties obtained from a third party. For Level 3 inputs, fair values are based on management estimates.
Other real estate owned values are estimated using Level 2 inputs based upon appraisals of similar properties obtained from a third party. For Level 3 inputs, fair values are based on management estimates.
The following summarizes assets measured at fair value for the period ending December 31, 2010 and 2009.
ASSETS MEASURED AT FAIR VALUE ON A RECURRING BASIS
|
Fair Value Measurements at Reporting Date Using:
|
||||||||||||||||
|
Quoted Prices in
|
Significant
|
Significant
|
||||||||||||||
|
Active Markets for
|
Other Observable
|
Unobservable
|
||||||||||||||
|
Identical Assets
|
Inputs
|
Inputs
|
||||||||||||||
|
Total
|
Level 1
|
Level 2
|
Level 3
|
|||||||||||||
|
December 31, 2010:
|
||||||||||||||||
|
Securities available-for-sale
|
$ | 46,289,197 | $ | 34,498 | $ | 46,254,699 | $ | - | ||||||||
|
Totals
|
$ | 46,289,197 | $ | 34,498 | $ | 46,254,699 | $ | - | ||||||||
|
December 31, 2009:
|
||||||||||||||||
|
Securities available-for-sale
|
$ | 50,011,316 | $ | 57,195 | $ | 49,954,121 | $ | - | ||||||||
|
Totals
|
$ | 50,011,316 | $ | 57,195 | $ | 49,954,121 | $ | - | ||||||||
Under certain circumstances we make adjustments to fair value for our assets and liabilities although they are not measured at fair value on an ongoing basis. The following table presents the financial instruments carried on the consolidated balance sheet by caption and by level in the fair value hierarchy, at December 31, 2010 and 2009, for which a nonrecurring change in fair value has been recorded:
ASSETS MEASURED AT FAIR VALUE ON A NONRECURRING BASIS
|
Fair Value Measurements at Reporting Date Using:
|
||||||||||||||||
|
Quoted Prices in
|
Significant
|
Significant
|
||||||||||||||
|
Active Markets for
|
Other Observable
|
Unobservable
|
||||||||||||||
|
Identical Assets
|
Inputs
|
Inputs
|
||||||||||||||
|
Total
|
Level 1
|
Level 2
|
Level 3
|
|||||||||||||
|
December 31, 2010:
|
||||||||||||||||
|
Impaired loans
|
$ | 312,296 | $ | - | $ | - | $ | 312,296 | ||||||||
|
Totals
|
$ | 312,296 | $ | - | $ | - | $ | 312,296 | ||||||||
|
December 31, 2009:
|
||||||||||||||||
|
Impaired loans
|
$ | 193,613 | $ | - | $ | 193,613 | $ | - | ||||||||
|
Totals
|
$ | 193,613 | $ | - | $ | 193,613 | $ | - | ||||||||
|
Fair Value Measurements
|
||||
|
Using Significant Unobservable Inputs
|
||||
|
Level 3
|
||||
|
Impaired Loans
|
||||
|
Beginning balance, December 31, 2009
|
$ | - | ||
|
Transfers in and/or out of Level 3
|
312,296 | |||
|
Ending balance, December 31, 2010
|
$ | 312,296 | ||
- 49 -
The estimated fair values of the Company’s financial instruments, all of which are held or issued for purposes other than trading, are as follows as of December 31:
|
2010
|
2009
|
|||||||||||||||
|
Carrying
|
Fair
|
Carrying
|
Fair
|
|||||||||||||
|
Amount
|
Value
|
Amount
|
Value
|
|||||||||||||
|
Financial assets:
|
||||||||||||||||
|
Cash and cash equivalents
|
$ | 30,871,344 | $ | 30,871,344 | $ | 17,089,409 | $ | 17,089,409 | ||||||||
|
Interest-bearing time deposits with other banks
|
5,963,426 | 6,257,000 | 5,488,037 | 5,690,000 | ||||||||||||
|
Available-for-sale securities
|
46,289,197 | 46,289,197 | 50,011,316 | 50,011,316 | ||||||||||||
|
Federal Home Loan Bank stock
|
659,600 | 659,600 | 630,700 | 630,700 | ||||||||||||
|
Loans, net
|
202,792,477 | 204,841,000 | 191,303,519 | 193,185,000 | ||||||||||||
|
Accrued interest receivable
|
904,896 | 904,896 | 977,350 | 977,350 | ||||||||||||
|
Financial liabilities:
|
||||||||||||||||
|
Deposits
|
269,279,026 | 270,082,000 | 250,445,682 | 251,268,000 | ||||||||||||
|
Securities sold under agreements to repurchase
|
3,235,083 | 3,235,083 | 912,849 | 912,849 | ||||||||||||
The carrying amounts of financial instruments shown in the above table are included in the consolidated balance sheets under the indicated captions. Accounting policies related to financial instruments are described in Note 2.
NOTE 12 - FINANCIAL INSTRUMENTS
The Company is party to financial instruments with off-balance sheet risk in the normal course of business to meet the financing needs of its customers. These financial instruments include commitments to originate loans, unadvanced funds on loans and standby letters of credit. The instruments involve, to varying degrees, elements of credit risk in excess of the amount recognized in the balance sheets. The contract amounts of those instruments reflect the extent of involvement the Company has in particular classes of financial instruments.
The Company's exposure to credit loss in the event of nonperformance by the other party to the financial instrument for loan commitments is represented by the contractual amounts of those instruments. The Company uses the same credit policies in making commitments and conditional obligations as it does for on-balance sheet instruments.
Commitments to originate loans are agreements to lend to a customer provided there is no violation of any condition established in the contract. Commitments generally have fixed expiration dates or other termination clauses and may require payment of a fee. Since many of the commitments are expected to expire without being drawn upon, the total commitment amounts do not necessarily represent future cash requirements. The Company evaluates each customer's creditworthiness on a case-by-case basis. The amount of collateral obtained, if deemed necessary by the Company upon extension of credit, is based on management's credit evaluation of the borrower. Collateral held varies, but may include secured interests in mortgages, accounts receivable, inventory, property, plant and equipment and income-producing properties.
Standby letters of credit are conditional commitments issued by the Company to guarantee the performance by a customer to a third party. The credit risk involved in issuing letters of credit is essentially the same as that involved in extending loan facilities to customers. As of December 31, 2010 and 2009, the maximum potential amount of the Company’s obligation was $233,400 and $337,000, respectively for financial and standby letters of credit. The Company’s outstanding letters of credit generally have a term of less than one year. If a letter of credit is drawn upon, the Company may seek recourse through the customer’s underlying line of credit. If the customer’s line of credit is also in default, the Company may take possession of the collateral, if any, securing the line of credit.
- 50 -
Notional amounts of financial instrument liabilities with off-balance-sheet credit risk are as follows as of December 31:
|
2010
|
2009
|
|||||||
|
Commitments to originate loans
|
$ | 2,701,250 | $ | 1,498,580 | ||||
|
Standby letters of credit
|
233,400 | 337,000 | ||||||
|
Unadvanced portions of loans:
|
||||||||
|
Construction
|
4,321,442 | 3,473,939 | ||||||
|
Commercial lines of credit
|
7,857,538 | 7,743,686 | ||||||
|
Consumer
|
735,355 | 701,361 | ||||||
|
Home equity
|
24,119,575 | 24,231,520 | ||||||
| $ | 39,968,560 | $ | 37,986,086 | |||||
There is no material difference between the notional amounts and the estimated fair values of the above off-balance sheet liabilities.
NOTE 13 - RELATED PARTY TRANSACTIONS
Certain directors and executive officers of the Company and companies in which they have significant ownership interest were customers of the Bank during 2010. Total loans to such persons and their companies amounted to $4,700,867 as of December 31, 2010. During the year ended December 31, 2010 principal payments totaled $2,695,414 and advances amounted to $2,740,101.
Deposits from related parties held by the Company as of December 31, 2010 and 2009 amounted to $4,408,009 and $3,434,620, respectively.
During 2010 and 2009, the Company paid $56,711 and $65,420, respectively, for rent and related expenses of the Company’s Granby branch office to a company of which a bank director is a principal. The rent expense for the Granby branch included in Note 10 amounted to $43,078 in 2010 and $44,935 in 2009.
NOTE 14 - SIGNIFICANT GROUP CONCENTRATIONS OF CREDIT RISK
Most of the Company's business activity is with customers located within the state. There are no concentrations of credit to borrowers that have similar economic characteristics. The majority of the Company's loan portfolio is comprised of loans collateralized by real estate located in the state of Connecticut.
NOTE 15 - REGULATORY MATTERS
The Bank is subject to various regulatory capital requirements administered by the federal banking agencies. Failure to meet minimum capital requirements can initiate certain mandatory and possibly additional discretionary actions by regulators that, if undertaken, could have a direct material effect on the Bank’s financial statements. Under capital adequacy guidelines and the regulatory framework for prompt corrective action, the Bank must meet specific capital guidelines that involve quantitative measures of its assets, liabilities, and certain off-balance-sheet items as calculated under regulatory accounting practices. The Bank’s capital amounts and classification are also subject to qualitative judgments by the regulators about components, risk weightings and other factors.
Quantitative measures established by regulation to ensure capital adequacy require the Bank to maintain minimum amounts and ratios (set forth in the table below) of total and Tier 1 capital (as defined in the regulations) to risk-weighted assets (as defined), and of Tier 1 capital (as defined) to average assets (as defined). Management believes, as of December 31, 2010 and 2009, that the Bank meets all capital adequacy requirements to which it is subject.
As of December 31, 2010, the most recent notification from the Federal Deposit Insurance Corporation categorized the Bank as well capitalized under the regulatory framework for prompt corrective action. To be categorized as well capitalized the Bank must maintain minimum total risk-based, Tier 1 risk-based and Tier 1 leverage ratios as set forth in the table. There are no conditions or events since that notification that management believes have changed the institution's category.
- 51 -
The Bank’s actual capital amounts and ratios are also presented in the table.
|
To Be Well
|
||||||||||||||||||
|
Capitalized Under
|
||||||||||||||||||
|
For Capita
|
Prompt Corrective
|
|||||||||||||||||
|
Actual
|
Adequacy Purposes
|
Action Provisions
|
||||||||||||||||
|
Amount
|
Ratio
|
Amount
|
Ratio
|
Amount
|
Ratio
|
|||||||||||||
|
|
(Dollar amounts in thousands) | |||||||||||||||||
|
As of December 31, 2010:
|
||||||||||||||||||
|
Total Capital (to Risk Weighted Assets):
|
||||||||||||||||||
|
Simsbury Bank & Trust Company, Inc.
|
$ | 23,150 | 12.66 | % | $ | 14,624 |
> 8.0%
|
$ | 18,280 |
> 10.0%
|
||||||||
|
Tier 1 Capital (to Risk Weighted Assets):
|
||||||||||||||||||
|
Simsbury Bank & Trust Company, Inc.
|
20,864 | 11.41 | 7,312 |
> 4.0
|
10,968 |
> 6.0
|
||||||||||||
|
Tier 1 Capital (to Average Assets):
|
||||||||||||||||||
|
Simsbury Bank & Trust Company, Inc.
|
20,864 | 7.00 | 11,921 |
> 4.0
|
14,901 |
> 5.0
|
||||||||||||
|
As of December 31, 2009:
|
||||||||||||||||||
|
Total Capital (to Risk Weighted Assets):
|
||||||||||||||||||
|
Simsbury Bank & Trust Company, Inc.
|
22,512 | 13.97 | 12,896 |
>8.0
|
16,119 |
>10.0
|
||||||||||||
|
Tier 1 Capital (to Risk Weighted Assets):
|
||||||||||||||||||
|
Simsbury Bank & Trust Company, Inc.
|
20,495 | 12.71 | 6,448 |
>4.0
|
9,672 |
>6.0
|
||||||||||||
|
Tier 1 Capital (to Average Assets):
|
||||||||||||||||||
|
Simsbury Bank & Trust Company, Inc.
|
20,495 | 7.35 | 11,156 |
>4.0
|
13,945 |
>5.0
|
||||||||||||
The declaration of cash dividends is dependent on a number of factors, including regulatory limitations, and the Company's operating results and financial condition. The stockholders of the Company will be entitled to dividends only when, and if, declared by the Company's Board of Directors out of funds legally available therefore. The declaration of future dividends will be subject to favorable operating results, financial conditions, tax considerations, and other factors.
Under Connecticut law, the Bank may pay dividends only out of net profits. The Connecticut Banking Commissioner’s approval is required for dividend payments which exceed the current year’s net profits and retained net profits from the preceding two years. As of December 31, 2010, the Bank is restricted from declaring dividends to the Company in an amount greater than $350,644.
NOTE 16 - EMPLOYEE BENEFITS
The Company sponsors a 401(k) savings and retirement plan. Employees who were 21 years of age and employed on the plan's effective date were immediately eligible to participate in the plan. Other employees who have attained age 21 are eligible for membership on the first day of the month following completion of 90 days of service.
The provisions of the 401(k) plan allow eligible employees to contribute subject to IRS limitations. The Company's matching contribution will be determined at the beginning of the plan year. The Company's expense under this plan was $87,089 in 2010 and $75,755 in 2009.
The Company entered into Supplemental Executive Retirement Agreements with current and former executive officers. The agreements require the payment of specified benefits upon retirement over specified periods as described in each agreement. The total liability for the agreements included in other liabilities was $226,305 at December 31, 2010 and $157,510 at December 31, 2009. Expenses under these agreements amounted to $73,796 and $13,939, respectively, for the years ended December 31, 2010 and 2009.
The Company entered into employment agreements (the “Agreements”) with the Executive Officers of the Company. The Agreements provide for severance benefits upon termination following a change in control as defined in the agreements in amounts equal to cash compensation as defined in the agreements, and fringe benefits that the Executive(s) would have received if the Executive(s) would have continued working for an additional two or five years.
- 52 -
NOTE 17 - STOCK OPTION PLAN
The Simsbury Bank & Trust Company, Inc. 1998 Stock Plan (“Plan”) provides for the granting of options to purchase shares of common stock or the granting of shares of restricted stock up to an aggregate amount of 142,000 shares of common stock of the Company. Options granted under the Plan may be either Incentive Stock Options (“ISOs”) within the meaning of Section 422 of the Internal Revenue Code or non-qualified options which do not qualify as ISOs (“NQOs”). Effective March 17, 2009, no additional restricted stock awards or stock options may be granted under the Plan.
The exercise price for shares covered by an ISO may not be less than 100% of the fair market value of common stock on the date of grant. The exercise price for shares covered by a NQO may not be less than 50% of the fair market value of common stock at the date of grant. All options must expire no later than ten years from the date of grant. The Plan also provides the Board with authority to make grants that will provide that options will become exercisable and restricted awards will become fully vested upon a change in control of the Company.
In accordance with the Plan each non-employee director is granted a NQO to purchase 1,000 shares of common stock at the fair market value of the common stock on the grant date. These options will become exercisable in two equal installments beginning on the first anniversary of the date of grant.
The Company did not grant any options in 2010 and 2009.
A summary of the status of the Company’s stock option plan as of December 31 and changes during the years ending on that date is presented below:
|
2010
|
2009
|
|||||||||||||||
|
Weighted-Average
|
Weighted-Average
|
|||||||||||||||
|
Fixed Options
|
Shares
|
Exercise Price
|
Shares
|
Exercise Price
|
||||||||||||
|
Outstanding at beginning of year
|
51,189 | $ | 30.33 | 51,189 | $ | 30.33 | ||||||||||
|
Granted
|
- | - | - | - | ||||||||||||
|
Exercised
|
- | - | - | - | ||||||||||||
|
Forfeited
|
( 1,314 | ) | 34.90 | - | - | |||||||||||
|
Outstanding at end of year
|
49,875 | 30.21 | 51,189 | 30.33 | ||||||||||||
|
Options exercisable at year-end
|
49,875 | 30.21 | 47,689 | 30.35 | ||||||||||||
|
Weighted-average fair value of
|
||||||||||||||||
|
options granted during the year
|
N/A | N/A | ||||||||||||||
The following table summarizes information about fixed stock options outstanding as of December 31, 2010:
|
Options Outstanding and Exercisable
|
||||||||||||||||||
|
Weighted-Average
|
||||||||||||||||||
|
Number
|
Remaining
|
Number
|
||||||||||||||||
|
Exercise Price
|
Outstanding
|
Contractual Life
|
Exercisable
|
Exercise Price
|
||||||||||||||
| $ | 15.65 | 1,311 | 1.2 | 1,311 | $ | 15.65 | ||||||||||||
| 16.25 | 1,314 | 0.9 | 1,314 | 16.25 | ||||||||||||||
| 35.00 | 5,250 | 3.8 | 5,250 | 35.00 | ||||||||||||||
| 31.50 | 21,000 | 5.0 | 21,000 | 31.50 | ||||||||||||||
| 29.00 | 10,500 | 5.5 | 10,500 | 29.00 | ||||||||||||||
| 30.00 | 10,500 | 6.6 | 10,500 | 30.00 | ||||||||||||||
| 30.21 | 49,875 | 5.1 | 49,875 | 30.21 | ||||||||||||||
As of December 31, 2010, compensation costs related to share-based arrangements granted under the Plan have been fully recognized. The total value of shares that vested during the years ended December 31, 2010 and 2009 was $9,467 and $43,755, respectively.
- 53 -
NOTE 18 – EARNINGS PER SHARE
Reconciliation of the numerators and the denominators of the basic and diluted per share computations for net income available to common stockholders are as follows:
|
2010
|
2009
|
|||||||
|
Basic earnings per share computation:
|
||||||||
|
Net income
|
$ | 1,146,709 | $ | 718,291 | ||||
|
Preferred stock net accretion
|
(40,000 | ) | (30,000 | ) | ||||
|
Cumulative preferred stock dividends
|
(218,000 | ) | (165,922 | ) | ||||
|
Net income available to common shareholders
|
$ | 888,709 | $ | 522,369 | ||||
|
Weighted average shares outstanding, basic
|
864,976 | 864,976 | ||||||
|
Basic earnings per share
|
$ | 1.03 | $ | 0.60 | ||||
|
Diluted earnings per share computation:
|
||||||||
|
Net income
|
$ | 1,146,709 | $ | 718,291 | ||||
|
Preferred stock net accretion
|
(40,000 | ) | (30,000 | ) | ||||
|
Cumulative preferred stock dividends
|
(218,000 | ) | (165,922 | ) | ||||
|
Net income available to common shareholders
|
$ | 888,709 | $ | 522,369 | ||||
|
Weighted average shares outstanding, before dilution
|
864,976 | 864,976 | ||||||
|
Dilutive potential shares
|
367 | - | ||||||
|
Weighted average shares outstanding, assuming dilution
|
865,343 | 864,976 | ||||||
|
Diluted earnings per share
|
$ | 1.03 | $ | 0.60 | ||||
NOTE 19 - PREFERRED STOCK
On March 27, 2009, the Company entered into a Letter Agreement, which includes a Securities Purchase Agreement (together, the “Purchase Agreement”), with the United States Department of the Treasury (“Treasury Department”) pursuant to which the Company has issued and sold to the Treasury Department: (i) 4,000 shares of the Company’s Fixed Rate Cumulative Perpetual Preferred Stock, Series A, no par (the “Series A Preferred Stock”), having a liquidation amount per share of $1,000 for a total purchase price of $4,000,000 and (ii) a warrant (the “Warrant”) to purchase 200.002 shares of the Company’s Fixed Rate Cumulative Perpetual Preferred Stock, Series B, no par (the “Series B Preferred Stock”), with a liquidation amount of $1,000 per share, at an exercise price of $.01. The Warrant had a ten-year term and was immediately exercisable. Immediately following the issuance of the Series A Preferred Stock and the Warrant, the Treasury Department exercised its rights under the Warrant to acquire 200 shares of the Series B Preferred Stock through a cashless exercise.
The Series A Preferred Stock pays cumulative dividends at a rate of 5% per 360-day year for the first five years and thereafter at a rate of 9% per 360-day year. The Series A Preferred Stock and the Series B Preferred Stock may be redeemed by the Company upon payment of the liquidation amount plus accrued and unpaid dividends (the “Redemption Amount”). The Series A Preferred Stock is generally non-voting. The Series B Preferred Stock pays cumulative dividends at a rate of 9% per 360-day year. The Series B Preferred Stock generally has the same rights and privileges as the Series A Preferred Stock.
The Series A Preferred Stock and the Warrant were issued in a private placement exempt from registration pursuant to Section 4(2) of the Securities Act of 1933, as amended. The Company has agreed to register for resale the Series A Preferred Stock and the Series B Preferred Stock upon request of the Treasury Department. The Purchase Agreement provides that neither the Series A Preferred Stock nor the Series B Preferred Stock will be subject to any contractual restrictions on transfer, except that the Treasury Department and its transferees may not effect any transfer of the Series A Preferred Stock or the Series B Preferred Stock that would cause the Company to otherwise become subject to the periodic reporting requirements of the Securities Exchange Act of 1934. The Purchase Agreement also provides for certain restrictions on dividend payments and stock repurchases by the Company.
- 54 -
The Company has allocated the $4,000,000 in proceeds received from the U.S. Treasury Department between Series A Preferred Stock and Series B Preferred Stock assuming that the Preferred Stock would be replaced with a qualifying equity offering and the Preferred Stock would therefore be redeemed at the end of five years. The allocation has been recorded assuming a discount rate of 12% on the cash flows of each instrument. The allocation of the proceeds is as follows:
|
Series A Preferred Stock
|
$ | 3,770,000 | ||
|
Series B Preferred Stock
|
230,000 | |||
|
Proceeds received from the Treasury Department
|
$ | 4,000,000 |
The Series A Preferred Stock is being accreted over a five-year period so that, at the end of five years, the balance in Series A Preferred Stock would equal $4,000,000. The aggregate accretion from retained earnings was $46,000 in 2010 and $34,500 in 2009.
Estimated accretion from retained earnings for each of the four years succeeding 2010 is as follows:
|
2011
|
$ | 46,000 | ||
|
2012
|
46,000 | |||
|
2013
|
46,000 | |||
|
2014
|
11,500 | |||
| $ | 149,500 |
The Series B Preferred Stock is being amortized over a five-year period so that, at the end of five years, the balance in Series B Preferred Stock would equal $200,000. The aggregate amortization to retained earnings was $6,000 in 2010 and $4,500 in 2009.
Estimated amortization to retained earnings for each of the four years succeeding 2010 is as follows:
|
2011
|
$ | 6,000 | ||
|
2012
|
6,000 | |||
|
2013
|
6,000 | |||
|
2014
|
1,500 | |||
| $ | 19,500 | |||
NOTE 20 – LEGAL CONTINGENCIES
Various legal claims also arise from time to time in the normal course of business which, in the opinion of management, will have no material effect on the Company’s consolidated financial statements.
NOTE 21 - SUBSEQUENT EVENT
In January of 2011, the Bank formed a subsidiary Passive Investment Company (PIC). Under State of Connecticut statutes, such a company is not subject to Connecticut corporation business taxes. Provided that the Bank meets the mandated statutory requirements, the current annual benefit to net income of establishing the PIC, in the form of reduced Connecticut corporation business taxes, should exceed $100,000. This amount may adjust upward or downward as the Bank’s net income changes over time. First quarter 2011 net income will be negatively impacted by approximately $160,000, consisting of certain non-recurring charges incurred in establishing the PIC net of favorable tax benefits expected to be recognized during the quarter.
NOTE 22 - RECLASSIFICATION
Certain amounts in the prior year have been reclassified to be consistent with the current year's statement presentation.
- 55 -
Shareholder Data
The bid price of the stock of the Bank’s parent company, SBT Bancorp, Inc., which was formed on March 2, 2006, is currently quoted on the OTC Bulletin Board (Symbol: “SBTB”). At December 31, 2010, there were 864,976 shares of the Company's common stock outstanding and approximately 1,100 shareholders of record. There is a limited market for the Company’s common stock. The following table sets forth the high and low bid price for the periods indicated.
|
Year Ended
|
Year Ended
|
|||||||||||||||
|
December 31, 2010
|
December 31, 2009
|
|||||||||||||||
|
High
|
Low
|
High
|
Low
|
|||||||||||||
|
Fourth Quarter
|
$ | 21.00 | $ | 18.60 | $ | 16.25 | $ | 15.50 | ||||||||
|
Third Quarter
|
$ | 19.00 | $ | 18.40 | $ | 16.05 | $ | 15.00 | ||||||||
|
Second Quarter
|
$ | 21.50 | $ | 18.20 | $ | 17.00 | $ | 12.75 | ||||||||
|
First Quarter
|
$ | 19.50 | $ | 15.65 | $ | 16.15 | $ | 13.00 | ||||||||
The above quotations reflect inter-dealer prices, without retail mark-up, mark-down or commission, and may not reflect actual transactions.
Dividends
The Company's shareholders are entitled to dividends when and if declared by the Board of Directors out of funds legally available therefor. Connecticut law prohibits the Company from paying cash dividends except from its net profits, which are defined by State statutes. In addition, on March 27, 2009, the Company issued 4,000 shares of Fixed Rate Cumulative Perpetual Preferred Stock, Series A, and 200 shares of Fixed Rate Cumulative Perpetual Preferred Stock, Series B, to the U.S. Treasury under the Troubled Asset Relief Program (“TARP”) Capital Purchase Program. While these shares of Preferred Stock are outstanding to the U.S. Treasury, with limited exceptions, the U.S. Treasury’s consent is required for: (i) any increase in dividends paid on the Company’s common stock above a quarterly dividend of $0.12 per share of common stock or (ii) the repurchase of common stock by the Company. The terms of the Preferred Stock also prohibit the payment of dividends on the Company’s common stock unless all accrued and unpaid dividends on the Preferred Stock have been fully paid.
In 2010, the Company declared and paid cash dividends on common stock of $103,797 on each of March 15, 2010, June 11, 2010, September 13, 2010, and December 14, 2010, respectively. The Company also declared and paid cash dividends on preferred stock of $54,500, on each of February 16, 2010, May 17, 2010, August 16, 2010, and November 15, 2010, respectively. In 2009, the Company declared and paid cash dividends on common stock of $103,797 on each of June 11, 2009, September 16, 2009, and December 16, 2009, respectively. The Company also declared and paid cash dividends on preferred stock of $29,067, $54,500, and $54,500 on each of May 15, 2009, August 17, 2009, and November 16, 2009, respectively.
The Company did not repurchase any of its common stock or other securities during 2010.
- 56 -
|
Board of Directors
|
Officers
|
|
|
*Chairman of Committee
|
||
|
Robert J. Bogino
|
||
|
Chairman of the Board
|
Gary R. Kevorkian
|
Martin J. Geitz
|
|
Retired President and Co-Owner
|
Attorney at Law
|
President and Chief Executive Officer
|
|
Bogino & DeMaria, Inc.
|
Executive Committee
|
|
|
Compensation & Human Resources
|
Loan Committee
|
Anthony F. Bisceglio, Ph.D.
|
|
Committee
|
Compensation & Human Resources
|
Treasurer and Chief Financial Officer
|
|
Corporate Governance Committee*
|
Committee*
|
|
| Executive Committee |
Gary R. Kevorkian
|
|
|
Loan Committee
|
Jerry W. Long
|
Secretary
|
|
President and CEO
|
|
|
|
James T. Fleming
|
PCC Technology Group
|
Susan D. Presutti
|
|
President
|
Compensation & Human Resources
|
Assistant Secretary
|
|
Connecticut Automotive Retailers
|
Committee
|
|
|
Association
|
Loan Committee
|
|
|
Audit & Compliance Committee
|
|
|
|
Corporate Governance Committee
|
Nicholas B. Mason
|
|
|
Retired Chief Financial Officer
|
||
|
Martin J. Geitz
|
Savings Bank of Manchester
|
|
|
President and Chief Executive Officer
|
Audit & Compliance Committee
|
|
|
The Simsbury Bank & Trust Company, Inc.
|
Corporate Governance Committee
|
|
|
Executive Committee
|
|
|
|
Loan Committee
|
George B. Odlum, Jr., DMD
|
|
|
Retired General Dentistry
|
||
|
Edward J. Guarco
|
Audit & Compliance Committee*
|
|
|
Vice President
|
Executive Committee
|
|
|
State Line Oil
|
|
|
|
Audit & Compliance Committee
|
Rodney R. Reynolds
|
|
|
Compensation & Human Resources
|
Retired Founding Director
|
|
|
Committee
|
Trust Company of Connecticut
|
|
|
Compensation & Human Resources
|
||
|
Committee
|
||
|
Corporate Governance Committee
|
||
|
David W. Sessions
|
||
|
Vice Chairman
|
||
|
President and Treasurer
|
||
|
Casle Corporation
|
||
|
Compensation & Human Resources
|
||
|
Committee
|
||
|
Executive Committee*
|
||
|
Loan Committee*
|
||
|
Penny R. Woodford
|
||
|
Real Estate Agent
|
||
|
Coldwell Banker Residential Brokerage
|
||
|
Audit & Compliance Committee
|
||
|
Corporate Governance Committee
|
- 57 -
The Simsbury Bank & Trust Company, Inc.
|
Board of Directors
|
Officers
|
Employees
|
|
All SBT Bancorp, Inc. Directors
|
Executive Officers
|
Mami Barall
|
|
Deborah L. Barber
|
||
|
Martin J. Geitz
|
Theresa D. Bendell
|
|
|
Directors Emeriti
|
President and Chief Executive Officer
|
Mary Lou Bidwell
|
|
Celeste M. Brouillard
|
||
|
Richard C. Anthony
|
Anthony F. Bisceglio, Ph.D.
|
Katherine P. Cain
|
|
Consultant
|
Executive Vice President, Treasurer and
|
Bente Christensen
|
|
Chief Financial Officer
|
Meagan Chrusciel
|
|
|
Jackson F. Eno
|
Sophia P. Clarke
|
|
|
Vice President
|
Michael L. Alberts
|
Carol D. Clifford
|
|
Morgan Stanley
|
Senior Vice President and Chief
|
Megan L. Clifford
|
|
Commercial Banking Officer
|
Catherine A. Cook
|
|
|
Jane F. von Holzhausen
|
Jacek Danillowicz
|
|
| Retired Vice President of Operations |
Michael T. Sheahan
|
Cheryl B. DiLisio
|
|
Southwest Region
|
Senior Vice President and Chief
|
S. Thomas Edge
|
|
Prudential Connecticut Realty
|
Mortgage & Consumer Lending Officer
|
Deborah A. Fochesato
|
|
Shirley T. Gentry
|
||
|
Evan W. Woollacott
|
Howard R. Zern
|
Paula M. Giorgio
|
|
Retired Vice Chairman and Commissioner
|
Senior Vice President and Chief
|
Lynn G. Godin
|
|
Connecticut Department of Public
|
Retail Banking, IT & Deposit Operations
|
Kelly M. Hammick
|
|
Utility Control
|
Officer
|
Lucyna Jennison
|
|
Leslie S. Kane
|
||
|
Lincoln S. Young
|
Gary R. Kevorkian
|
Sherrie S. Krawczyk
|
|
Retired Chief Executive Officer
|
Secretary
|
Susan LeBel
|
|
Turbine Engine Services Corp.
|
Jaclyn Levesque
|
|
|
Senior Vice President
|
Cindy Matthews
|
|
|
Terry L. Boulton
|
Christine L. Miller
|
|
|
Jordan Moore
|
||
|
Vice Presidents
|
Susan S. Pohlod
|
|
|
Richard A. Bahre
|
Patricia A. Pschirer
|
|
|
Brian D. Belyea
|
Michelle Raymond
|
|
|
Joan Beresford
|
Petrina C. Reid
|
|
|
Charlene Faselle
|
Margaret E. Rose
|
|
|
Aurelia P. Pruzin
|
Lamar J. Ross
|
|
|
Barbara J. Wallace
|
Megan B. Shufelt
|
|
|
Joyce E. Slate
|
||
|
Assistant Vice Presidents
|
Irene M. Smith
|
|
|
Brenda J. Abbott
|
Jean M. Spalla
|
|
|
Robin J. DiNicola
|
Maria Theodoratos
|
|
|
Jocelyn A. Mitchell
|
Annette M. Troutman
|
|
|
Craig S. Porter
|
Margaret Washer
|
|
|
Susan D. Presutti, Assistant Secretary
|
Michelle G. Wiggins
|
|
|
Peter G. Sepelak, Jr.
|
||
|
Kenneth S. Sklodosky
|
||
|
Sophie S. Stevens
|
||
|
Assistant Treasurers
|
||
|
Margot M. Byrne
|
||
|
Lori L. Ethier
|
||
|
Barbara J. Hanifin
|
||
|
Ella Marker
|
||
|
Lisa A. Morgan
|
||
|
Romualdo A. Polce
|
- 58 -
Corporate Information
SBT Bancorp, Inc.
760 Hopmeadow Street
P.O. Box 248
Simsbury, Connecticut 06070-0248
(860) 408-5493
Fax: (860) 408-4679
simsburybank.com
|
Notice of Shareholders' Meeting
|
|
|
The Annual Meeting of Shareholders of SBT Bancorp, Inc., the holding company for The Simsbury Bank & Trust Company, Inc., will be held at 5:00 p.m. on Tuesday, May 10, 2011 at 981 Hopmeadow Street, Simsbury, Connecticut.
|
|
|
Independent Auditors
|
Legal Counsel
|
|
Shatswell, MacLeod & Company, P.C.
83 Pine Street
West Peabody, MA 01960-3635
|
Day Pitney LLP
Counselors at Law
242 Trumbull Street
Hartford, CT 06103-1212
|
|
Transfer Agent
|
Shareholder Contact
|
|
American Stock Transfer & Trust Company
59 Maiden Lane
Plaza Level
New York, NY 10005
Shareholder Relations: (800) 937-5449
Trading Symbol: SBTB
|
Susan D. Presutti, Assistant Secretary
SBT Bancorp, Inc.
760 Hopmeadow Street, P.O. Box 248
Simsbury, CT 06070-0248
(860) 408-5493
|
COPIES OF THE COMPANY’S ANNUAL REPORT ON FORM 10-K WILL BE FORWARDED WITHOUT CHARGE UPON WRITTEN REQUEST TO:
Gary R. Kevorkian, Secretary
SBT Bancorp, Inc.
760 Hopmeadow Street
P.O. Box 248
Simsbury, CT 06070-0248
- 59 -