Attached files
EXHIBIT 13


Front Row: William F. Overacre, A. Patricia Merryman, John P. Erb (Chairman),
James E. Burton, IV (Vice Chairman), Michael E. Watson
Back Row: C. Bryan Stott, A. Willard Arthur, Thomas F. Hall, Robert H. Gilliam, Jr.,
John L. Waller, R. B. Hancock, Jr., Carroll E. Shelton
B O A R D O F D I R E C TO R S
| A. Willard Arthur | A. Patricia Merryman | |
| Retired; Former Chairman & Secretary | Vice President | |
| Marvin V. Templeton & Sons, Inc. | Sonny Merryman, Inc. | |
| James E. Burton, IV – Vice Chairman | William F. Overacre | |
| President | Retired; Former Associate Broker | |
| Templeton Paving, LLC | RE/MAX 1st Olympic, REALTORS | |
| John P. Erb – Chairman | Carroll E. Shelton | |
| Assistant Superintendent | Senior Vice President & Chief Credit Officer | |
| Campbell County Schools | First National Bank | |
| Vice President | ||
| Robert H. Gilliam, Jr. | Pinnacle Bankshares Corporation | |
| Chief Executive Officer | ||
| First National Bank | C. Bryan Stott | |
| President & Chief Executive Officer | Vice President & Branch Manager | |
| Pinnacle Bankshares Corporation | Stifel Nicolaus | |
| R. B. Hancock, Jr. | John L. Waller | |
| Retired; Former President & Owner | Owner & Operator | |
| R.B.H., Inc. | Waller Farms, Inc. | |
| Thomas F. Hall | Michael E. Watson | |
| President | Controller/Treasurer | |
| George E. Jones & Sons, Inc. | Flippin, Bruce & Porter, Inc. | |
PINNACLE BANKSHARES CORPORATION
AND SUBSIDIARY
Table of Contents
| Page | ||||
| Office Locations |
2 | |||
| Officers and Managers |
3 | |||
| President’s Letter |
4 | |||
| Selected Consolidated Financial Information |
6 | |||
| Management’s Discussion and Analysis of Financial Condition and Results of Operations |
7 | |||
| Consolidated Balance Sheets |
26 | |||
| Consolidated Statements of Income |
27 | |||
| Consolidated Statements of Changes in Stockholders’ Equity and Comprehensive Income |
28 | |||
| Consolidated Statements of Cash Flows |
29 | |||
| Notes to Consolidated Financial Statements |
31 | |||
| Management’s Report on Internal Control over Financial Reporting |
61 | |||
| Report of Independent Registered Public Accounting Firm |
62 | |||
| Shareholder Information |
63 | |||
| Tribute to Robert H. Gilliam, Jr. |
IBC | |||
PINNACLE BANKSHARES CORPORATION
AND SUBSIDIARY
First National Bank Office Locations
ALTAVISTA
MAIN OFFICE
622 Broad Street
Altavista, Virginia 24517
Telephone: (434) 369-3000
VISTA OFFICE
1301 N. Main Street
Altavista, Virginia 24517
Telephone: (434) 369-3001
LYNCHBURG
AIRPORT OFFICE
14580 Wards Road
Lynchburg, Virginia 24502
Telephone: (434) 237-3788
TIMBERLAKE OFFICE
20865 Timberlake Road
Lynchburg, Virginia 24502
Telephone: (434) 237-7936
OLD FOREST ROAD OFFICE
3309 Old Forest Road
Lynchburg, Virginia 24501
Telephone: (434) 385-4432
FOREST
FOREST OFFICE
14417 Forest Road
Forest, Virginia 24551
Telephone: (434) 534-0451
AMHERST
AMHERST OFFICE
130 South Main Street
Amherst, Virginia 24521
Telephone: (434) 946-7814
RUSTBURG
RUSTBURG OFFICE
1033 Village Highway
Rustburg, Virginia 24588
Telephone: (434) 332-1742
SMITH MOUNTAIN LAKE
LOAN PRODUCTION OFFICE
74 Scruggs Road, Suite 102
Moneta, Virginia 24121
Telephone: (540) 719-0193
2
PINNACLE BANKSHARES CORPORATION AND SUBSIDIARY
| Officers of Pinnacle Bankshares Corporation | ||
| Robert H. Gilliam, Jr. |
President & Chief Executive Officer | |
| Aubrey H. Hall, III |
Executive Vice President | |
| Carroll E. Shelton |
Vice President | |
| Bryan M. Lemley |
Secretary, Treasurer & Chief Financial Officer | |
| Officers and Managers of First National Bank |
||
| Robert H. Gilliam, Jr. |
Chief Executive Officer & Trust Officer | |
| Aubrey H. Hall, III |
President & Chief Operating Officer | |
| Carroll E. Shelton |
Senior Vice President & Chief Credit Officer | |
| Bryan M. Lemley |
Senior Vice President, Cashier & Chief Financial Officer | |
| Lucy H. Johnson |
Senior Vice President & Chief Information Officer | |
| William J. Sydnor, II |
Senior Vice President & Branch Administration Officer | |
| Judith A. Clements |
Senior Vice President & Director of Human Resources | |
| Thomas R. Burnett, Jr. |
Senior Vice President & Chief Lending Officer | |
| Pamela R. Adams |
Vice President & Loan Operations Manager | |
| James M. Minear |
Vice President & Commercial Officer | |
| Shawn D. Stone |
Vice President & Commercial Officer | |
| Tracie A. Robinson |
Vice President & Mortgage Production Manager | |
| Bianca K. Allison |
Vice President & Mortgage Loan Officer | |
| Tony J. Bowling |
Vice President & Network Administrator | |
| Cecilia L. Doyle |
Vice President & Senior Credit Analyst | |
| John E. Tucker |
Vice President & Investment Consultant | |
| Vivian S. Brown |
Vice President & Retail Sales and Service Manager | |
| Daniel R. Wheeler |
Vice President & Branch Manager (Airport) | |
| Marian E. Marshall |
Assistant Vice President & Branch Manager (Forest) | |
| Nancy J. Holt |
Assistant Vice President & Branch Manager (Main) | |
| Janet H. Whitehead |
Assistant Vice President & Branch Manager (Timberlake) | |
| M. Amanda Ramsey |
Assistant Vice President & Branch Manager (Amherst) | |
| Charlene A. Thompson |
Assistant Vice President & Branch Manager (Rustburg) | |
| Andria C. Smith |
Assistant Vice President & Branch Manager (Vista) | |
| Courtney M. Woody |
Assistant Vice President & Branch Manager (Old Forest Road) | |
| Christine A. Hunt |
Assistant Vice President & Internal Auditor | |
| Vicki G. Greer |
Assistant Vice President & Financial Analyst | |
| Albert N. Fariss |
Assistant Vice President & Facilities/Purchasing Manager and Security Officer | |
| Tarry R. Pribble |
Assistant Vice President & Collection and Recovery Manager | |
| Lisa M. Landrum |
Assistant Vice President & Dealer Finance Loan Officer | |
| Anita M. Jones |
Loan Production Officer | |
| Melissa L. Collins |
Mortgage Loan Officer | |
| Dianna C. Hamlett |
Compliance Officer & Bank Secrecy Act Officer | |
| Lauren R. Michael |
Training Officer | |
| J. Wayne Drumheller |
Collection Officer | |
| Barbara H. Caldwell |
Assistant Branch Manager (Main) | |
| Arin L. Brown |
Retail Business Development Officer (Main) | |
| April A. Morris |
Retail Business Development Officer (Main) | |
| Doris N. Trent |
Retail Business Development Officer (Vista) | |
| Sherry D. Johnson |
Retail Business Development Officer (Forest) | |
| Melissa T. Campbell |
Retail Business Development Officer (Airport) | |
| Romonda F. Davis |
E-Commerce Sales Officer | |
| Cathy C. Simms |
Assistant Portfolio Manager | |
| Cynthia I. Gibson |
Bookkeeping Manager | |
3

TO OUR SHAREHOLDERS, CUSTOMERS AND FRIENDS:
Progress was achieved by your Company on a number of fronts in 2010, not the least of which was in financial performance.
Net income for 2010 increased 96% over net income for 2009 to $687,000. The gain in net income was primarily fueled by an increase in net interest income of $772,000, as our net interest margin grew from 3.23% in 2009 to 3.37% in 2010. Noninterest income was essentially unchanged on a year-over-year basis, while noninterest expense registered a slight decline of 1% from 2009 to 2010.
Asset quality continues to be a concern as nonperforming loans stood at $7,843,000 as of December 31, 2010. The provision for loan losses charged against earnings in 2010 was $1,878,000, $348,000 more than in 2009. Obviously this level of loss provision adversely impacts net income. Our allowance for loan losses was $4,037,000 at year-end 2010, 8% higher than at year-end 2009, and amounted to 1.50% of total loans outstanding. We continue to employ an aggressive stance in dealing with credit quality issues, but expect to be challenged in addressing problem loans throughout much of 2011.
Although returns for 2010 continue to be fractions of pre-2008 returns, 2010 net income represents a positive step in the right direction and we are encouraged about prospects for a continuation of this trend in upcoming years.
The balance sheet reflects an increase in total assets of $4,903,000 in 2010, ending the year at $337,113,000. Total deposits grew $4,835,000 for the year. Net loans declined $874,000, less than 1%, in 2010, to $265,030,000, while securities owned increased $6,361,000 to $26,517,000 at December 31, 2010. Stockholders’ equity ended 2010 at $26,482,000, a $631,000 increase over 2009. Average equity to average assets was 7.88% for 2010, compared with 7.69% for 2009.
A $0.05 per share cash dividend was paid in November, 2010, fulfilling the goal of reinstatement of some level of dividend payment in 2010. This was the first cash dividend since $0.10 per share was paid in February 2009. Improvement in the level of cash dividend payments will continue to be a high priority of your board and management, evaluated in the context of the critical importance of capital preservation.
Another front in which progress was achieved in 2010 was in the corporate governance arena. The President and Chief Executive Officer for a number of years has served as acting Chairman of the Board, inasmuch as the Board had chosen not to formally elect a chairman. In 2010, the Board of Directors added an independence element to its leadership structure by electing outside directors John P. Erb and James E. Burton, IV as Chairman of the Board and Vice Chairman of the Board, respectively. Both Mr. Erb and Mr. Burton have filled these rolls in an admirable fashion.
Changes also occurred in the composition of the Board in 2010. James P. Kent, Jr. retired from the Board after having completed 30 years of dedicated service. His wise counsel to the Board during his tenure is much appreciated. Two new directors were elected to the Board in 2010 in the persons of A. Patricia Merryman and C. Bryan Stott. Both new directors have brought valuable attributes to the Board and have made immediate contributions.
4
Another area where I would recognize progress is that of management succession and transition. Succession and transition began in late 2010 when I informed our Board of my intention to retire in a mid-year 2011 timeframe and continues on through this date. In early 2011 our Board identified Aubrey H. (Todd) Hall, III as my successor, appointed him to the Board of First National Bank and elected him President of the Bank. Todd has been nominated for election to the Board of Directors of Pinnacle Bankshares at the 2011 Annual Meeting of Shareholders. He is slated to become Chief Executive Officer of First National Bank and President and Chief Executive Officer of Pinnacle Bankshares Corporation upon my retirement, targeted for July 1, 2011.
Todd is a Campbell County native and lifelong resident. He has worked in the banking industry since graduating from Lynchburg College in May, 1992, and has been with First National Bank since March, 2003. The Company is fortunate to have a highly qualified successor within the existing ranks of senior management. Todd is a skilled banker and will serve this Company well in the top leadership role. I am pleased to report that transition is proceeding smoothly.
The development of a new five year Strategic Plan is another example of progress in 2010. The Plan will serve as a guide to managing the Company to a higher level of performance in future years and will be a living, breathing document that can be amended to reflect changes in the economy and banking environment. The Strategic Plan is an important element in management transition as well.
Your patience with us in these challenging times is much appreciated as we work hard to lead your Company through and out of the effects of the deep and prolonged economic downturn that began in late 2007. Our rich heritage and history of strength and stability have served us well during this period. Progress is slow and gradual, but there is clear evidence of progress nonetheless and we firmly believe that momentum has developed in a positive direction.
We look forward to sharing more of the Pinnacle Bankshares story at our Annual Meeting of Shareholders to be held at 11:30 a.m., Tuesday, April 12, 2011 in the Fellowship Hall of Altavista Presbyterian Church, 707 Broad Street, Altavista, Virginia. We hope you will be able to join us for this occasion.
Thank you for the distinct privilege of allowing me to have served as your President and Chief Executive Officer.

|
| Robert H. Gilliam, Jr. |
| President and Chief Executive Officer |
February 18, 2011
5
PINNACLE BANKSHARES CORPORATION
AND SUBSIDIARY
Selected Consolidated Financial Information
(In thousands, except ratios, share and per share data)
| Years ended December 31, | ||||||||||||||||||||
| 2010 | 2009 | 2008 | 2007 | 2006 | ||||||||||||||||
| Income Statement Data: |
||||||||||||||||||||
| Net interest income |
$ | 10,776 | 10,004 | 10,209 | 10,181 | 9,192 | ||||||||||||||
| Provision for loan losses |
1,878 | 1,530 | 2,881 | 462 | 339 | |||||||||||||||
| Noninterest income |
3,134 | 3,148 | 2,896 | 2,632 | 2,500 | |||||||||||||||
| Noninterest expenses |
11,037 | 11,171 | 9,846 | 8,524 | 7,825 | |||||||||||||||
| Income tax expense |
308 | 100 | 72 | 1,227 | 1,116 | |||||||||||||||
| Net income |
687 | 351 | 306 | 2,600 | 2,412 | |||||||||||||||
| Per Share Data: |
||||||||||||||||||||
| Basic net income |
$ | 0.46 | 0.24 | 0.21 | 1.76 | 1.65 | ||||||||||||||
| Diluted net income |
0.46 | 0.24 | 0.21 | 1.75 | 1.64 | |||||||||||||||
| Cash dividends |
0.05 | 0.10 | 0.60 | 0.60 | 0.55 | |||||||||||||||
| Book value |
17.71 | 17.41 | 16.78 | 17.95 | 16.66 | |||||||||||||||
| Weighted-Average Shares Outstanding: |
||||||||||||||||||||
| Basic |
1,492,137 | 1,485,089 | 1,485,089 | 1,479,689 | 1,459,007 | |||||||||||||||
| Diluted |
1,492,137 | 1,485,089 | 1,488,213 | 1,489,377 | 1,471,806 | |||||||||||||||
| Balance Sheet Data: |
||||||||||||||||||||
| Assets |
$ | 337,113 | 332,210 | 321,243 | 279,913 | 256,421 | ||||||||||||||
| Loans, net |
265,030 | 265,904 | 279,199 | 232,752 | 207,861 | |||||||||||||||
| Securities |
26,517 | 20,156 | 13,931 | 19,635 | 24,866 | |||||||||||||||
| Cash and cash equivalents |
32,533 | 32,060 | 15,926 | 18,344 | 14,586 | |||||||||||||||
| Deposits |
306,954 | 302,119 | 287,233 | 251,866 | 230,817 | |||||||||||||||
| Stockholders’ equity |
26,482 | 25,851 | 24,919 | 26,816 | 24,492 | |||||||||||||||
| Performance Ratios: |
||||||||||||||||||||
| Return on average assets |
0.21 | % | 0.11 | % | 0.10 | % | 0.97 | % | 1.00 | % | ||||||||||
| Return on average equity |
2.62 | % | 1.40 | % | 1.14 | % | 10.17 | % | 10.10 | % | ||||||||||
| Dividend payout |
10.92 | % | 41.88 | % | 291.50 | % | 34.12 | % | 33.25 | % | ||||||||||
| Asset Quality Ratios: |
||||||||||||||||||||
| Allowance for loan losses to total loans, net of unearned income and fees |
1.50 | % | 1.38 | % | 1.40 | % | 0.73 | % | 0.84 | % | ||||||||||
| Net charge-offs to average loans, net of unearned income and fees |
0.59 | % | 0.65 | % | 0.24 | % | 0.23 | % | 0.04 | % | ||||||||||
| Capital Ratios: |
||||||||||||||||||||
| Leverage |
7.74 | % | 8.04 | % | 8.28 | % | 9.54 | % | 9.80 | % | ||||||||||
| Risk-based: |
||||||||||||||||||||
| Tier 1 capital |
9.36 | % | 9.50 | % | 9.20 | % | 10.55 | % | 9.92 | % | ||||||||||
| Total capital |
10.61 | % | 10.75 | % | 10.45 | % | 11.24 | % | 10.64 | % | ||||||||||
| Average equity to average assets |
7.88 | % | 7.69 | % | 9.14 | % | 9.45 | % | 9.91 | % | ||||||||||
6
Management’s Discussion and Analysis
of Financial Condition and Results of Operations
(in thousands, except ratios, share and per share data)
Cautionary Statement Regarding Forward-Looking Statements
The following discussion is qualified in its entirety by the more detailed information and the consolidated financial statements and accompanying notes appearing elsewhere in this Annual Report. In addition to the historical information contained herein, this Annual Report contains forward-looking statements within the meaning of the Private Securities Litigation Reform Act of 1995. Forward-looking statements, which are based on certain assumptions and describe future plans, strategies, and expectations of management, are generally identifiable by use of words such as “believe,” “expect,” “intend,” “anticipate,” “estimate,” “project,” “may,” “will” or similar expressions. These forward-looking statements may include, but are not limited to, statements relating to anticipated future financial performance, funding sources including cash generated by banking operations, loan portfolio composition, trends in asset quality and strategies to address nonperforming assets and nonaccrual loans, adequacy of the allowance for loan losses and future provisions for loan losses, securities portfolio composition and future performance, interest rate environments, deposit insurance assessments, and strategic business initiatives.
Although we believe our plans, intentions and expectations reflected in these forward-looking statements are reasonable, we can give no assurance that these plans, intentions, or expectations will be achieved. Our ability to predict results or the actual effect of future plans or strategies is inherently uncertain, and actual results, performance or achievements could differ materially from those contemplated. Factors that could have a material adverse effect on our operations and future prospects include, but are not limited to, changes in: interest rates; declining collateral values, especially in the real estate market; general economic conditions, including continued deterioration in general business and economic conditions and in the financial markets; deterioration in the value of securities held in our investment securities portfolio; the legislative/regulatory climate, including the impact of any policies or programs implemented pursuant to the Emergency Economic Stabilization Act of 2008 (the EESA), the American Recovery and Reinvestment Act of 2009 (the ARRA), the Dodd-Frank Wall Street Reform and Consumer Protection Act (the Dodd-Frank Act) or other laws; monetary and fiscal policies of the U.S. government, including policies of the U.S. Treasury and the Board of Governors of the Federal Reserve System; the quality or composition of the loan and/or investment portfolios; demand for loan products; deposit flows; competition; demand for financial services in our market area; and accounting principles, policies and guidelines. These risks and uncertainties should be considered in evaluating forward-looking statements contained herein. We base our forward-looking statements on management’s beliefs and assumptions based on information available as of the date of this report. You should not place undue reliance on such statements, because the assumptions, beliefs, expectations and projections about future events on which they are based may, and often do, differ materially from actual results. We undertake no obligation to update any forward-looking statement to reflect developments occurring after the statement is made.
In addition, we have experienced increases in loan losses during the current economic climate. Continued difficulties in significant portions of the global financial markets, particularly if it worsens, could further impact our performance, both directly by affecting our revenues and the value of our assets and liabilities, and indirectly by affecting our counterparties and the economy generally. Dramatic declines in the residential and commercial real estate markets in recent years have resulted in significant write-downs of asset values by financial institutions in the United States. Concerns about the stability of the U.S. financial markets generally have reduced the availability of funding to certain financial institutions, leading to a tightening of credit and reduction of business activity. There can be no assurance that the EESA, the ARRA, the Dodd-Frank Act or other actions taken by the Federal government will stabilize the U.S. financial system or alleviate the industry or economic factors that may adversely affect our business. In addition, our business and financial performance could be impacted as the financial industry restructures in the current environment, both by changes in the creditworthiness and performance of our counterparties and by changes in the competitive and regulatory landscape.
7
Company Overview
Pinnacle Bankshares Corporation, a Virginia corporation (Bankshares), was organized in 1997 and is registered as a bank holding company under the Bank Holding Company Act of 1956, as amended. Bankshares is headquartered in Altavista, Virginia. Bankshares conducts all of its business activities through the branch offices of its wholly owned subsidiary bank, First National Bank (the Bank). Bankshares exists primarily for the purpose of holding the stock of its subsidiary, the Bank, and of such other subsidiaries as it may acquire or establish.
First National Bank currently maintains a total of nine offices to serve its customers. The Main Office and Vista Branch are located in the Town of Altavista, the Airport Branch and Timberlake Branch in Campbell County, the Old Forest Road Branch in the City of Lynchburg, the Forest Branch in Bedford County, the Amherst Branch in the Town of Amherst, the Rustburg Branch in the Town of Rustburg and a Loan Production Office in Franklin County at Smith Mountain Lake. The Bank also maintains an administrative and training facility in the Wyndhurst section of the City of Lynchburg.
A total of one-hundred seven full and part-time staff members serve the Bank’s customers.
With an emphasis on personal service, the Bank today offers a broad range of commercial and retail banking products and services including checking, savings and time deposits, individual retirement accounts, merchant bankcard processing, residential and commercial mortgages, home equity loans, consumer installment loans, agricultural loans, investment loans, small business loans, commercial lines of credit and letters of credit. The Bank also offers a full range of investment, insurance and annuity products through its association with Infinex Investments, Inc. and Banker’s Insurance, LLC. The Bank has two wholly-owned subsidiaries: FNB Property Corp., which holds title to Bank premises real estate; and First Properties, Inc., which holds title to other real estate owned from foreclosures.
The following discussion supplements and provides information about the major components of the results of operations and financial condition, liquidity and capital resources of Bankshares and its subsidiary (collectively the Company). This discussion and analysis should be read in conjunction with the Company’s consolidated financial statements and accompanying notes.
Executive Summary
The Company serves a trade area known better as Region 2000 consisting primarily of Campbell County, northern Pittsylvania County, eastern Bedford County, northern Franklin County, Amherst County and the city of Lynchburg from nine facilities located within the area. In February 2009, the Company opened the Rustburg facility located on Village Highway in the Rustburg Marketplace Shopping Center. This opening further increases our presence in Campbell County. The Company operates in a well-diversified industrial economic region that does not depend upon one or a few types of commerce.
The Company earns revenues on the interest margin between the interest it charges on loans it extends to customers and interest received on the Company’s securities portfolio net of the interest it pays on deposits to customers. The Company also earns revenues on service charges on deposit and loan products, gains on securities that are called or sold, fees from origination of mortgages, and other noninterest income items including but not limited to overdraft fees, commissions from investment, insurance and annuity sales, safe deposit box rentals, and automated teller machine surcharges. In 2010, an increase in net income was realized due to an increase in net interest margin and a decrease in noninterest expense. The Company’s revenue generating activities and related expenses are outlined in the consolidated statements of income and consolidated statements of changes in stockholders’ equity and comprehensive income and accompanying notes and in “Results of Operations” below.
The Company generates cash through its operating, investing and financing activities. The generation of cash flows is outlined more fully in the consolidated statements of cash flows and accompanying notes and in “Liquidity and Asset/Liability Management” below.
8
The Company’s balance sheet experienced a slight decline in its loan portfolio and growth in its deposit portfolio in 2010. The overall growth of the Company is outlined in the consolidated balance sheets and accompanying notes and the “Investment Portfolio,” “Loan Portfolio,” “Bank Premises and Equipment,” “Deposits” and “Capital Resources” discussions below.
The Company expects minimal loan portfolio growth in 2011, as we continue to monitor our capital ratios. The Company will look to continue growth in our branches, especially our newer Amherst and Rustburg locations, as we continue to build relationships with businesses and individuals within each market. While growing, the Company continues to leverage efficiencies from our reporting and imaging systems. The Company is also making our customers’ lives more convenient by offering innovative products and services and providing many channels to bank with us including Internet banking, Internet bill pay, telephone banking, mobile banking, remote deposit capture, debit and credit cards and real-time ATMs. The Company will continue to identify and install convenient products and services in 2011 with the goal to better enhance the customer’s experience with the Company.
Overview of 2010 and 2009
Total assets at December 31, 2010 were $337,113, up 1.48% from $332,210 at December 31, 2009. The principal components of the Company’s assets at the end of the year were $32,533 in cash and cash equivalents, $26,517 in securities and $265,030 in net loans. During the year ended December 31, 2010, gross loans decreased 0.22% or $590. The Company’s lending activities are a principal source of income. Loans decreased in 2010 as the Company experienced lower demand for credit and employed tighter credit standards.
Total liabilities at December 31, 2010 were $310,631, up 1.39% from $306,359 at December 31, 2009, with the increase reflective of an increase in total deposits of $4,835 or 1.60%. Noninterest-bearing demand deposits decreased $1,092 or 3.38% and represented 10.16% of total deposits at December 31, 2010, compared to 10.68% at December 31, 2009. Savings and NOW accounts increased $14,499 or 14.02% and represented 38.42% of total deposits at December 31, 2010, compared to 34.24% at December 31, 2009. Time deposits decreased $8,572 or 5.15% at December 31, 2010 and represented 51.42% of total deposits at December 31, 2010, compared to 55.08% at December 31, 2009. The Company’s deposits are provided by individuals and businesses located within the communities served. The Company had no brokered deposits as of December 31, 2010 and December 31, 2009.
Total stockholders’ equity at December 31, 2010 was $26,482, including $21,918 in retained earnings. At December 31, 2009, stockholders’ equity totaled $25,851, including $21,306 in retained earnings. The increase in stockholders’ equity resulted mainly from the Company’s retained earnings of $612 during 2010.
The Company had net income of $687 for the year ended December 31, 2010, compared to net income of $351 for the year ended December 31, 2009, an increase of 95.73%. The Company’s net income increased primarily due to an increase in net interest income which was largely due to improvements to the Company’s net interest margin, and a decrease in noninterest expense, partially offset by an increase in provision for loan losses. Management expects continued improvement in net income, although whether the Company can continue to grow net income could be adversely affected by numerous factors including factors related to the Company’s asset quality. We expect continued improvement in our net interest margin in 2011. We expect minimal increases in noninterest expense and noninterest income in 2011.
Profitability as measured by the Company’s return on average assets (ROA) was 0.21% in 2010, compared to 0.11% in 2009. Return on average equity (ROE), was 2.62% for 2010, compared to 1.40% for 2009.
Overview of 2009 and 2008
Total assets at December 31, 2009 were $332,210, up 3.41% from $321,243 at December 31, 2008. The principal components of the Company’s assets at the end of the year were $32,060 in cash and cash equivalents, $20,156 in securities and $265,904 in net loans. During the year ended December 31, 2009, gross loans decreased 4.80% or $13,608. The Company’s lending activities are a principal source of income. Loans decreased in 2009 as the Company experienced lower demand for credit and employed tighter credit standards. Total liabilities at
9
December 31, 2009 were $306,359, up 3.39% from $296,324 at December 31, 2008, with the increase reflective of an increase in total deposits of $14,886 or 5.18%. Noninterest-bearing demand deposits increased $4,545 or 16.39% and represented 10.68% of total deposits at December 31, 2009, compared to 9.65% at December 31, 2008. Savings and NOW accounts increased $15,613 or 17.78% and represented 34.24% of total deposits at December 31, 2009, compared to 30.58% at December 31, 2008. Time deposits decreased $5,272 or 3.07% at December 31, 2009 and represented 55.08% of total deposits at December 31, 2009, compared to 59.77% at December 31, 2008. The Company’s deposits are provided by individuals and businesses located within the communities served. The Company had no brokered deposits as of December 31, 2009 and December 31, 2008.
Total stockholders’ equity at December 31, 2009 was $25,851, including $21,306 in retained earnings. At December 31, 2008, stockholders’ equity totaled $24,919, including $21,102 in retained earnings. The increase in stockholders’ equity resulted mainly from an after tax after tax unrealized gain of $660 incurred by the Company’s retirement plan. This unrealized gain is recognized in accumulated other comprehensive net loss.
The Company had net income of $351 for the year ended December 31, 2009, compared to net income of $306 for the year ended December 31, 2008, an increase of 14.71%. The Company’s net income increased primarily due to a decrease in provision for loan loss expense of $1,351 in 2009 compared to 2008. This was partially offset by a decrease in net interest income due to lower margins and lower loan volume. It was also partially offset by an increase in noninterest expense due to the effect of the overall growth of the company on personnel expenses and fixed assets. Profitability as measured by the Company’s ROA was 0.11% in 2009, compared to 0.10% in 2008. Return on average equity (ROE), was 1.40% for 2009, compared to 1.14% for 2008.
Results of Operations
Net Interest Income. Net interest income represents the principal source of earnings for the Company. Net interest income is the amount by which interest and fees generated from loans, securities and other interest-earning assets exceed the interest expense associated with funding those assets. Changes in the amounts and mix of interest-earning assets and interest-bearing liabilities, as well as their respective yields and rates, have a significant impact on the level of net interest income. Changes in the interest rate environment and the Company’s cost of funds also affect net interest income.
The net interest spread increased to 3.07% for the year ended December 31, 2010 from 2.85% for the year ended December 31, 2009. Net interest income was $10,776 ($10,842 on a tax-equivalent basis) for the year ended December 31, 2010, compared to $10,004 ($10,097 on a tax-equivalent basis) for the year ended December 31, 2009, and is attributable to interest income from loans, federal funds sold and securities exceeding the cost associated with interest paid on deposits and other borrowings. In 2010, our deposits repriced at lower rates more rapidly than did our loans in the declining rate environment, causing our interest rate spread to increase. The Bank’s cost of rate on interest-bearing liabilities in 2010 was sixty basis points lower compared to 2009. The Bank’s yield on interest-earning assets for the year ended December 31, 2010 was thirty-eight basis points lower than the year ended December 31, 2009 due to higher yielding assets being replaced by lower yielding assets in 2010 and repricing of existing assets in the declining rate environment.
The net interest spread decreased to 2.85% for the year ended December 31, 2009 from 3.11% for the year ended December 31, 2008. Net interest income was $10,004 ($10,097 on a tax-equivalent basis) for the year ended December 31, 2009, compared to $10,209 ($10,325 on a tax-equivalent basis) for the year ended December 31, 2008, and is attributable to interest income from loans, federal funds sold and securities exceeding the cost associated with interest paid on deposits and other borrowings. In 2009, our loans repriced at lower rates more rapidly than did our deposits in the declining rate environment, causing our interest rate spread to decrease. The Bank’s yield on interest-earning assets for the year ended December 31, 2009 was ninety-four basis points lower than the year ended December 31, 2008 due to higher yielding assets being replaced by lower yielding assets in 2009 and repricing of existing assets. The Bank’s cost of funds rate on interest-bearing liabilities in 2009 was sixty-eight basis points lower compared to 2008.
In an effort to stimulate economic activity, the Federal Reserve has pushed interest rates to exceptionally low levels, causing the Company’s interest-earning assets and interest-bearing liabilities to reprice downward. The Company’s net interest margins declined from 2008 to 2009 as interest-earning assets repriced faster than
10
interest-bearing liabilities, but net interest margins expanded from 2009 to 2010 as our interest-bearing liabilities repriced faster than our interest-earning assets. The Company’s improved net interest margin in 2010 was due in part to deposit pricing strategies. The Company attempts to conserve net interest margin by product pricing strategies, such as attracting deposits with longer maturities when rates are relatively low and attracting deposits with shorter maturities when rates are relatively high, all depending on our funding needs. Many economic forecasts of interest rates predict that interest rates will continue to remain at historically low levels for much of 2011 with a slight increase in rates towards the end of 2011. The Company expects its net interest margin to improve slightly in 2011 as we expect interest-bearing liabilities to reprice slightly faster than interest-earning assets. While there is no guarantee of how rates may change in 2011, the Company will price products that are competitive in the market, allow for growth and strive to maintain the net interest margin as much as possible. The Company also continues to seek new sources of noninterest income to combat the effects of volatility in the interest rate environment.
The following table presents the major categories of interest-earning assets, interest-bearing liabilities and stockholders’ equity with corresponding average balances, related interest income or interest expense and resulting yield and rates for the periods indicated.
ANALYSIS OF NET INTEREST INCOME
| Years ended December 31, | ||||||||||||||||||||||||||||||||||||
| 2010 | 2009 | 2008 | ||||||||||||||||||||||||||||||||||
| Assets | Average balance(1) |
Interest income/ expense |
Rate earned/ paid |
Average balance(1) |
Interest income/ expense |
Rate earned/ paid |
Average balance(1) |
Interest income/ expense |
Rate earned/ paid |
|||||||||||||||||||||||||||
| Interest-earning assets: |
||||||||||||||||||||||||||||||||||||
| Loans (2)(3) |
$ | 264,604 | 15,835 | 5.98 | % | 274,710 | 16,622 | 6.05 | % | 263,924 | 17,615 | 6.67 | % | |||||||||||||||||||||||
| Investment securities: |
||||||||||||||||||||||||||||||||||||
| Taxable |
20,456 | 587 | 2.87 | % | 11,351 | 470 | 4.14 | % | 13,041 | 622 | 4.77 | % | ||||||||||||||||||||||||
| Tax-exempt (4) |
3,063 | 167 | 5.45 | % | 4,046 | 273 | 6.75 | % | 4,910 | 324 | 6.60 | % | ||||||||||||||||||||||||
| Interest-earning deposits |
31,912 | 84 | 0.26 | % | 16,907 | 33 | 0.20 | % | 261 | 6 | 2.30 | % | ||||||||||||||||||||||||
| Federal funds sold |
1,261 | 4 | 0.32 | % | 5,564 | 11 | 0.20 | % | 4,689 | 104 | 2.22 | % | ||||||||||||||||||||||||
| Total interest-earning assets |
321,296 | 16,677 | 5.19 | % | 312,578 | 17,409 | 5.57 | % | 286,825 | 18,671 | 6.51 | % | ||||||||||||||||||||||||
| Other assets: |
||||||||||||||||||||||||||||||||||||
| Allowance for loan losses |
(3,774 | ) | (3,766 | ) | (1,912 | ) | ||||||||||||||||||||||||||||||
| Cash and due from banks |
2,419 | 2,123 | 5,171 | |||||||||||||||||||||||||||||||||
| Other assets, net |
14,058 | 13,749 | 8,618 | |||||||||||||||||||||||||||||||||
| Total assets |
$ | 333,999 | 324,684 | 298,702 | ||||||||||||||||||||||||||||||||
| Years ended December 31, | ||||||||||||||||||||||||||||||||||||
| 2010 | 2009 | 2008 | ||||||||||||||||||||||||||||||||||
| Liabilities and Stockholders’ equity |
Average balance(1) |
Interest income/ expense |
Rate earned/ paid |
Average balance(1) |
Interest income/ expense |
Rate earned/ paid |
Average balance(1) |
Interest income/ expense |
Rate earned/ paid |
|||||||||||||||||||||||||||
| Interest-bearing liabilities: |
||||||||||||||||||||||||||||||||||||
| Savings and NOW |
$ | 113,100 | 1,271 | 1.12 | % | 97,233 | 1,264 | 1.30 | % | 79,298 | 1,170 | 1.48 | % | |||||||||||||||||||||||
| Time |
162,489 | 4,564 | 2.81 | % | 171,293 | 6,044 | 3.53 | % | 160,613 | 7,055 | 4.39 | % | ||||||||||||||||||||||||
| Other borrowings |
— | — | — | 740 | 4 | 0.54 | % | 5,150 | 110 | 2.14 | % | |||||||||||||||||||||||||
| Federal funds purchased |
— | — | — | — | — | — | 408 | 11 | 2.70 | % | ||||||||||||||||||||||||||
| 275,589 | 5,835 | 2.12 | % | 269,266 | 7,312 | 2.72 | % | 245,469 | 8,346 | 3.40 | % | |||||||||||||||||||||||||
| Noninterest-bearing liabilities: |
||||||||||||||||||||||||||||||||||||
| Demand deposits |
27,884 | 25,883 | 25,169 | |||||||||||||||||||||||||||||||||
| Other liabilities |
4,376 | 4,580 | 774 | |||||||||||||||||||||||||||||||||
| 307,849 | 299,729 | 271,412 | ||||||||||||||||||||||||||||||||||
| Stockholders’ equity |
26,150 | 24,955 | 27,290 | |||||||||||||||||||||||||||||||||
| $ | 333,999 | 324,684 | 298,702 | |||||||||||||||||||||||||||||||||
| Net interest income |
10,842 | 10,097 | 10,325 | |||||||||||||||||||||||||||||||||
| Net interest margin (5) |
3.37 | % | 3.23 | % | 3.60 | % | ||||||||||||||||||||||||||||||
| Net interest spread (6) |
3.07 | % | 2.85 | % | 3.11 | % | ||||||||||||||||||||||||||||||
11
| (1) | Averages are daily averages. |
| (2) | Loan interest income includes accretion of loan fees of $30 in 2010, amortization of loan fees of $67 in 2009 and amortization of loan fees of $24 in 2008. |
| (3) | For the purpose of these computations, non-accrual loans are included in average loans. |
| (4) | Tax-exempt income from investment securities is presented on a tax-equivalent basis assuming a 34% U.S. Federal tax rate for 2010, 2009 and 2008. |
| (5) | The net interest margin is calculated by dividing net interest income by average total interest-earning assets. |
| (6) | The net interest spread is calculated by subtracting the interest rate paid on interest-bearing liabilities from the interest rate earned on interest-earning assets. |
As discussed above, the Company’s net interest income is affected by the change in the amounts and mix of interest-earning assets and interest-bearing liabilities, referred to as “volume change,” as well as by changes in yields earned on interest-earning assets and rates paid on deposits and other borrowed funds, referred to as “rate change.”. The following table presents, for the periods indicated, a summary of changes in interest income and interest expense for the major categories of interest-earning assets and interest-bearing liabilities and the amounts of change attributable to variations in volumes and rates.
RATE/VOLUME ANALYSIS
| Years ended December 31, | ||||||||||||||||||||||||
| 2010 compared to 2009 Increase (decrease) |
2009 compared to 2008 Increase (decrease) |
|||||||||||||||||||||||
| Volume | Rate | Net | Volume | Rate | Net | |||||||||||||||||||
| Interest earned on interest-earning assets: |
||||||||||||||||||||||||
| Loans (1) |
$ | (606 | ) | (181 | ) | (787 | ) | 772 | (1,765 | ) | (993 | ) | ||||||||||||
| Investment securities: |
||||||||||||||||||||||||
| Taxable |
190 | (73 | ) | 117 | (75 | ) | (77 | ) | (152 | ) | ||||||||||||||
| Tax-exempt (2) |
(59 | ) | (47 | ) | (106 | ) | (58 | ) | 7 | (51 | ) | |||||||||||||
| Interest-earning deposits |
39 | 4 | 43 | 27 | — | 27 | ||||||||||||||||||
| Federal funds sold |
(31 | ) | 24 | (7 | ) | 24 | (117 | ) | (93 | ) | ||||||||||||||
| Total interest earned on interest-earning assets |
(467 | ) | (273 | ) | (740 | ) | 690 | (1,952 | ) | (1,262 | ) | |||||||||||||
| Interest paid on interest-bearing liabilities: |
||||||||||||||||||||||||
| Savings and NOW |
41 | (34 | ) | 7 | 198 | (104 | ) | 94 | ||||||||||||||||
| Time |
(298 | ) | (1,182 | ) | (1,480 | ) | 516 | (1,527 | ) | (1,011 | ) | |||||||||||||
| Federal funds purchased |
— | — | (11 | ) | — | (11 | ) | |||||||||||||||||
| Other borrowings |
(2 | ) | (2 | ) | (4 | ) | (57 | ) | (49 | ) | (106 | ) | ||||||||||||
| Total interest paid on interest-bearing liabilities |
(259 | ) | (1,218 | ) | (1,477 | ) | 646 | (1,680 | ) | (1,034 | ) | |||||||||||||
| Change in net interest income |
$ | (208 | ) | 945 | 737 | 44 | (272 | ) | (228 | ) | ||||||||||||||
| (1) | Non-accrual loans are included in the average loan totals used in the calculation of this table. |
| (2) | Tax-exempt income from investment securities is presented on a tax equivalent basis assuming a 34% U.S. Federal tax rate. |
Provision for Loan Losses. The provision for loan losses is based upon the Company’s evaluation of the quality of the loan portfolio, total outstanding and committed loans, the Company’s previous loan loss experience and current and anticipated economic conditions. The amount of the provision for loan losses is a charge against earnings. Actual loan losses are charges against the allowance for loan losses.
The Company’s allowance for loan losses is maintained at a level deemed adequate to provide for known and inherent losses in the loan portfolio. No assurance can be given that unforeseen adverse economic conditions or other circumstances will not result in increased provisions in the future, or that the allowance for loan losses will be adequate for actual losses. Additionally, regulatory examiners may require the Company to recognize additions to the allowance based upon their judgment about information available to them at the time of their examinations.
The provisions for loan losses for the years ended December 31, 2010, 2009 and 2008 were $1,878, $1,530 and $2,881, respectively. The provision for loan losses increased substantially in 2008 from prior periods as management recognized weaknesses in the loan portfolio due to declining economic conditions, declining collateral values and an increased risk of some customer’s ability to service their of loans due to job losses. While the provision for loan losses decreased 46.89% from 2008 to 2009, the provision for loan losses increased 22.75%
12
from 2009 to 2010 due to continuing pressures on asset quality in 2010. The Company saw an increase in its nonperforming loans to total loans from 1.49% on December 31, 2009 to 2.91% on December 31, 2010. Total nonperforming loans were $7,843 as of December 31, 2010 and $4,017 as of December 31, 2009. The Company expects to continue to see weaknesses in its loan portfolio in 2011 and is working to minimize its losses from non-accrual and past due loans. See “Allowance for Loan Losses” for further discussions.
Noninterest Income. Total noninterest income for the year ended December 31, 2010 decreased $14 or 0.44% to $3,134 from $3,148 in 2009. The Company’s principal source of noninterest income is service charges and fees on deposit accounts, particularly transaction accounts, fees on sales of mortgage loans, and commissions and fees from investment, insurance, annuity and other bank products. The slight decrease in 2010 is primarily attributable to the following factors. Service charges on deposit accounts decreased $18 for the year ended December 31, 2010 compared to 2009 as nonsufficient funds charges decreased due to new regulations and opt-in requirements. Commissions and fees increased $54 for the year ended December 31, 2010, compared to 2009 and were mainly derived from investment sales. Mortgage loan fees increased $24 for the year ended December 31, 2010, compared to 2009. Service charges on loan accounts decreased by $36 due to lower loan volume in 2010 compared with 2009.
Total noninterest income for the year ended December 31, 2009 increased $252 or 8.70% to $3,148 from $2,896 in 2008. The Company’s principal source of noninterest income is service charges and fees particularly transaction accounts, mortgage loan fees, and commissions and fees from investment, insurance, annuity and other bank products. The increase in 2009 is primarily attributable to an increase in the volume of mortgage loan sales. Mortgage loan fees increased $286 for the year ended December 31, 2009, compared to 2008.
Noninterest Expense. Total noninterest expense for the year ended December 31, 2010 decreased $134 or 1.20% to $11,037 from $11,171 in 2009. The decrease in noninterest expense is primarily attributable to a $120 decrease in FDIC premiums and a $96 decrease in salaries and employee benefits due to lower retirement cost. The Company anticipates future increases in deposit insurance assessment rates as the FDIC attempts to replenish its resolution fund.
Total noninterest expense for the year ended December 31, 2009 increased $1,325 or 13.46% to $11,171 from $9,846 in 2008. The increase in noninterest expense is attributable a $544 increase in FDIC premiums, and increase in commissions paid on mortgage loan and investment sales and an increase in fixed asset costs due to the growth of the Company. A $135 increase in the cost of foreclosures led to an increase in other expenses.
Income Tax Expense. Applicable income taxes on 2010 earnings amounted to $308, resulting in an effective tax rate of 30.95% compared to $100, or 22.17% in 2009. The effective tax rate for 2010 is a function of the higher net income earned in 2010 than in 2009 and the effects of interest earned on tax-exempt securities.
Applicable income taxes on 2009 earnings amounted to $100, resulting in an effective tax rate of 22.17% compared to $72, or 19.05% in 2008. The effective tax rate for 2009 is a function of the higher net income earned and the effects of interest earned on tax-exempt securities.
Liquidity and Asset/Liability Management
Effective asset/liability management includes maintaining adequate liquidity and minimizing the impact of future interest rate changes on net interest income. The responsibility for monitoring the Company’s liquidity and the sensitivity of its interest-earning assets and interest-bearing liabilities lies with the Investment Committee of the Bank which meets at least quarterly to review liquidity and the adequacy of funding sources.
Cash Flows. The Company derives cash flows from its operating, investing and financing activities. Cash flows of the Company are primarily used to fund loans and purchase securities and are provided by the deposits and borrowings of the Company.
The Company’s operating activities for the year ended December 31, 2010 resulted in net cash provided from operating activities of $3,683 compared to net cash provided from operating activities of $766 in 2009, an increase of $2,917. This increase is primarily attributable to cash received from noninterest income of $5,022,
13
which is $3,774 higher than 2009. The increase in net cash provided from operating activities is also due to cash received from net interest income of $10,862, which is $1,108 higher than in 2009. Partially offsetting this was cash paid for income taxes totaling $1,283 in 2010 compared to cash received of $353 in 2009. Also offsetting these increases was cash paid for non-interest expense of $10,965, which was $376 higher than 2009. Management expects continued increases in the Company’s cash provided by operating activities through deposit pricing strategies and continued focus on improving the efficiency of the Company’s operations.
The Company’s cash flows from investing activities for the year ended December 31, 2010 resulted in net cash used of $7,993, compared to net cash provided of $4,629 in 2009. The increase is primarily attributable to an $8,740 increase in cash used to purchase securities as the Company increased its securities portfolio by 31.56% from 2009. The Company also saw a small net increase in loans made to customers of $1,400 in 2010. The Company experienced more maturities and calls from available-for sale securities and less paydowns, maturities and sales of available-for-sale mortgage-backed securities in 2010. The Company expects a lower volume of paydowns in available-for-sale mortgage-backed securities in 2011 due to fewer mortgage-backed securities in the investment portfolio.
Net cash provided by financing activities for the year ended December 31, 2010 was $4,783, compared to net cash provided by financing activities of $10,739 in 2009. The decrease in net cash provided is primarily attributable to an accelerated decrease in time deposits from 2009 to 2010 as compared to the change from 2008 to 2009. The Company also experienced smaller net increases in demand, savings and NOW deposits from 2009 to 2010 as compared to the change from 2008 to 2009.
The Company’s operating activities for the year ended December 31, 2009 resulted in net cash the provided from operating activities of $766 compared to net cash provided from operating activities of $2,968 in 2008. The decrease is primarily attributable to the cash paid for noninterest expenses of $10,589. This was $902 higher than 2008 due to higher personnel expenses, fixed asset costs and FDIC insurance premiums in 2009. Offsetting this was cash received for income taxes totaled $353 in 2009 compared to cash paid of $1,087 in 2008. Also offsetting this was cash received from net interest income of $9,754, which was $555 lower than the net interest received in 2008 as a result of a decrease in loan volume and interest received. Cash received from noninterest income in 2009 was $2,675 lower than the noninterest income amount received in 2008.
The Company’s cash flows from investing activities for the year ended December 31, 2009 resulted in net cash provided of $4,629, compared to net cash used in investing activities of $45,864 in 2008. The increase is primarily attributable to an $11,080 decrease in cash used to make loans to customers as the Company decreased its gross loans by 4.80% from 2008 to 2009 as compared to a 20.76% increase from 2007 to 2008. The Company experienced more paydowns, maturities and sales of available-for-sale mortgage-backed securities in 2009.
Net cash provided by financing activities for the year ended December 31, 2009 was $10,739, compared to net cash provided by financing activities of $40,478 in 2008. The decrease in net cash provided is primarily attributable to an accelerated decrease in time deposits from 2008 to 2009 as compared to the change from 2007 to 2008. The Company also repaid a note payable to the Federal Home Loan Bank. The Company had success in attracting demand, savings and NOW deposits in 2009.
Liquidity. Liquidity measures the ability of the Company to meet its maturing obligations and existing commitments, to withstand fluctuations in deposit levels, to fund its operations, and to provide for customers’ credit needs. Liquidity represents an institution’s ability to meet present and future financial obligations through either the sale or maturity of existing assets or the acquisition of additional funds from alternative funding sources.
The Company’s liquidity is provided by cash and due from banks, federal funds sold, investments available-for-sale, managing investment maturities, interest-earning deposits in other financial institutions and loan repayments. The Company’s ratio of liquid assets to deposits and short-term borrowings was 16.96% as of December 31, 2010 as compared to 16.37% as of December 31, 2009. The Company sells excess funds as overnight federal funds sold to provide an immediate source of liquidity. Federal funds sold at December 31, 2010 was $0 as compared to $2,008 at December 31, 2009. The decrease in federal funds sold in 2010 was primarily related to retaining excess funds in our Federal Reserve account which began paying interest in 2009.
14
Cash and due from banks of $32,533, which includes funds in our Federal Reserve account, as of December 31, 2010 was $2,481 higher when compared to December 31, 2009 as more funds were moved to our Federal Reserve account. The Company expects to deploy some of this cash into securities in 2011. We also expect loans to increase slightly in 2011.
The level of deposits may fluctuate significantly due to seasonal business cycles of depository customers. Levels of deposits are also affected by convenience of branch locations and ATMs to the customer, the rates offered on interest-bearing deposits and the attractiveness of noninterest-bearing deposit offerings compared with the competition. Similarly, the level of demand for loans may vary significantly and at any given time may increase or decrease substantially. However, unlike the level of deposits, management has more direct control over lending activities and maintains the level of those activities according to the amounts of available funds. Loan demand may be affected by the overall health of the local economy, loan rates compared with the competition and other loan features offered by the Company.
As a result of the Company’s management of liquid assets and its ability to generate liquidity through alternative funding sources, management believes that the Company maintains overall liquidity that is sufficient to satisfy its depositors’ requirements and to meet customers’ credit needs. Additional sources of liquidity available to the Company include its capacity to borrow funds through correspondent banks and the Federal Home Loan Bank. The total amount available for borrowing to the Company for liquidity purposes was $65,650 on December 31, 2010.
The Company obtains sources of funds through growth in deposits, scheduled payments and prepayments from the loan and investment portfolios and retained earnings growth, and may purchase or borrow funds from the Federal Home Loan Bank or through the Federal Reserve’s discount window. The Company also has sources of liquidity through three correspondent banking relationships. The Company uses its funds to fund loan and investment growth. Excess funds are sold daily to other institutions. The Company also has a $5,000 holding company line of credit with a correspondent bank for bank capital purposes with an outstanding balance of $2,000 on December 31, 2010 and December 31, 2009.
Contractual Obligations
The Company has entered into certain contractual obligations including long-term debt and operating leases. The table does not include deposit liabilities entered into in the ordinary course of banking. Operating Leases include leases of our Amherst, Timberlake and Wyndhurst facilities. Also included are contractual leases for offsite ATMs and postage machinery. The following table summarizes the Company’s contractual obligations as of December 31, 2010.
| Pinnacle Bankshares Corporation Line of Credit |
2011 | $ | 2,000 | |||||
| Operating Leases |
||||||||
| Year | Payments | |||||||
| 2011 | $ | 199 | ||||||
| 2012 | 185 | |||||||
| 2013 | 141 | |||||||
| 2014 | 141 | |||||||
| 2015 | 141 | |||||||
| After 2015 | 2,010 | |||||||
| Total | $ | 2,817 | ||||||
15
Interest Rates
While no single measure can completely identify the impact of changes in interest rates on net interest income, one gauge of interest rate sensitivity is to measure, over a variety of time periods, the differences in the amounts of the Company’s rate-sensitive assets and rate-sensitive liabilities. These differences or “gaps” provide an indication of the extent to which net interest income may be affected by future changes in interest rates. A “positive gap” exists when rate-sensitive assets exceed rate-sensitive liabilities and indicates that a greater volume of assets than liabilities will reprice during a given period. This mismatch may enhance earnings in a rising interest rate environment and may inhibit earnings in a declining interest rate environment. Conversely, when rate-sensitive liabilities exceed rate-sensitive assets, referred to as a “negative gap,” it indicates that a greater volume of liabilities than assets will reprice during the period. In this case, a rising interest rate environment may inhibit earnings and a declining interest rate environment may enhance earnings. The cumulative one-year gap as of December 31, 2010 was $44,860, representing 13.31% of total assets. This positive gap falls within the parameters set by the Company.
The following table illustrates the Company’s interest rate sensitivity gap position at December 31, 2010.
| 1 year | 1-3 years | 3-5 years | 5-15 years | |||||||||||||
| ASSET/(LIABILITY): |
||||||||||||||||
| Cumulative interest rate sensitivity gap |
$ | 44,860 | 28,022 | 17,827 | 38,284 | |||||||||||
As of December 31, 2010, the Company was asset-sensitive in all periods up to 15 years. The foregoing table does not necessarily indicate the impact of general interest rate movements on the Company’s net interest yield, because the repricing of various categories of assets and liabilities is discretionary and is subject to competition and other pressures. As a result, various assets and liabilities indicated as repricing within the same period may reprice at different times and at different rate levels. Management attempts to mitigate the impact of changing interest rates in several ways, one of which is to manage its interest rate-sensitivity gap. In addition to managing its asset/liability position, the Company has taken steps to mitigate the impact of changing interest rates by generating noninterest income through service charges, and offering products that are not interest rate-sensitive.
Effects of Inflation
The effect of changing prices on financial institutions is typically different from other industries as the Company’s assets and liabilities are monetary in nature. Interest rates are significantly impacted by inflation, but neither the timing nor the magnitude of the changes is directly related to price level indices. Impacts of inflation on interest rates, loan demand and deposits are not reflected in the consolidated financial statements.
Investment Portfolio
The Company’s investment portfolio is used primarily for investment income and secondarily for liquidity purposes. The Company invests funds not used for capital expenditures or lending purposes in securities of the U.S. Government and its agencies, mortgage-backed securities, taxable and tax-exempt municipal bonds, corporate securities or certificates of deposit. Obligations of the U.S. Government and its agencies include treasury notes and callable or noncallable agency bonds. The mortgage-backed securities include mortgage-backed security pools that are diverse as to interest rates. The Company has not invested in derivatives.
Investment securities available-for-sale as of December 31, 2010 totaled $22,048, an increase of $2,943 or 15.40% from $19,105 as of December 31, 2009. Investment securities held-to-maturity increased to $4,469 as of December 31, 2010 from $1,051 as of December 31, 2009, an increase of $3,418 or 325.21%. Securities increased in 2010 as funds from loan payoffs, security maturities, calls and pay downs were used to buy additional bonds and kept as cash due to low loan demand in 2010. Held-to-maturity securities increased in 2010 as the Company purchased taxable and tax-exempt bonds in 2010 which are normally classified as held-to-maturity.
The following table presents the composition of the Company’s investment portfolios as of the dates indicated.
16
| 2010 | December 31, 2009 |
2008 | ||||||||||||||||||||||
| Available-for-Sale | Amortized cost |
Fair value |
Amortized cost |
Fair value |
Amortized cost |
Fair value |
||||||||||||||||||
| U.S. Treasury securities and obligations of U.S. Government corporations and agencies |
$ | 17,247 | 17,196 | 11,532 | 11,580 | 2,031 | 2,040 | |||||||||||||||||
| Obligations of states and political subdivisions |
3,381 | 3,471 | 4,728 | 4,839 | 4,891 | 4,973 | ||||||||||||||||||
| Corporate securities |
— | — | 1,000 | 1,003 | 999 | 974 | ||||||||||||||||||
| Mortgage-backed securities – government |
1,211 | 1,271 | 1,514 | 1,573 | 3,339 | 3,389 | ||||||||||||||||||
| Other securities |
110 | 110 | 110 | 110 | 50 | 50 | ||||||||||||||||||
| Total available-for-sale |
$ | 21,949 | 22,048 | 18,884 | 19,105 | 11,310 | 11,426 | |||||||||||||||||
| 2010 | December 31, 2009 |
2008 | ||||||||||||||||||||||
| Held-to-Maturity | Amortized cost |
Fair value |
Amortized cost |
Fair value |
Amortized cost |
Fair value |
||||||||||||||||||
| Obligations of states and political subdivisions |
$ | 4,469 | 4,400 | 1,051 | 1,078 | 2,505 | 2,575 | |||||||||||||||||
| Total held-to-maturity |
$ | 4,469 | 4,400 | 1,051 | 1,078 | 2,505 | 2,575 | |||||||||||||||||
The following table presents the maturity distribution based on fair values and amortized costs of the investment portfolios as of the dates indicated.
INVESTMENT PORTFOLIO – MATURITY DISTRIBUTION
| December 31, 2010 | ||||||||||||
| Available-for-Sale | Amortized Cost |
Fair Value |
Yield | |||||||||
| U.S. Treasury securities and obligations of U.S. |
||||||||||||
| Government corporations: |
||||||||||||
| Within one year |
$ | 30 | 31 | 6.00 | % | |||||||
| After one but within five years |
14,391 | 14,446 | 3.14 | % | ||||||||
| After five years through ten years |
2,825 | 2,718 | 2.91 | % | ||||||||
| Obligations of states and political subdivisions (1): |
||||||||||||
| Within one year |
1,252 | 1,275 | 4.27 | % | ||||||||
| After one but within five years |
1,438 | 1,496 | 6.52 | % | ||||||||
| After five years through ten years |
205 | 205 | 7.00 | % | ||||||||
| After ten years |
487 | 495 | 5.17 | % | ||||||||
| Mortgage-backed securities – government |
1,211 | 1,272 | 3.59 | % | ||||||||
| Other securities (2) |
110 | 110 | — | |||||||||
| Total available-for-sale |
$ | 21,949 | 22,048 | |||||||||
| Held-to-Maturity |
||||||||||||
| Obligations of states and political subdivisions (1): |
||||||||||||
| After one but within five years |
2,836 | 2,852 | 3.69 | % | ||||||||
| After five years through ten years |
1,633 | 1,548 | 4.12 | % | ||||||||
| Total held-to-maturity |
$ | 4,469 | 4,400 | |||||||||
| (1) | Obligations of states and political subdivisions include yields of tax-exempt securities presented on a tax-equivalent basis assuming a 34% U.S. Federal tax rate. |
| (2) | Equity securities are assumed to have a life greater than ten years. |
Loan Portfolio
The Company’s net loans were $265,030 as of December 31, 2010, a decrease of $874 or 0.33% from $265,904 as of December 31, 2009. This decrease resulted primarily from decreased volume of real estate loan originations during 2010. The Company’s ratio of net loans to total deposits was 86.34% as of December 31, 2010 compared to 88.01% as of December 31, 2009.
17
Typically, the Company maintains a ratio of loans to deposits of between 80% and 100%. The loan portfolio primarily consists of commercial, real estate (including real estate term loans, construction loans and other loans secured by real estate), and loans to individuals for household, family and other consumer expenditures. However, the Company adjusts its mix of lending and the terms of its loan programs according to market conditions and other factors. The Company’s loans are typically made to businesses and individuals located within the Company’s market area, most of whom have account relationships with the Bank. There is no concentration of loans exceeding 10% of total loans that is not disclosed in the categories presented below. The Company has not made any loans to any foreign entities including governments, banks, businesses or individuals. Commercial and construction loans in the Company’s portfolio are primarily variable rate loans and have little interest rate risk.
The Company had no option adjustable rate mortgages, subprime loans or loans with teaser rates and similar products as of December 31, 2010. Junior lien mortgages totaled of $26,209 as of December 31, 2010 with a specific allowance for loan loss calculation of $269. The Company had interest only loans totaling $13,025 as of December 31, 2010. Residential mortgage loans with a loan to collateral value ratio exceeding 100% were $2,793 as of December 31, 2010.
The following table presents the composition of the Company’s loan portfolio as of the dates indicated.
LOAN PORTFOLIO
| December 31, | ||||||||||||||||||||
| 2010 | 2009 | 2008 | 2007 | 2006 | ||||||||||||||||
| Real estate loans: |
||||||||||||||||||||
| Residential real estate |
$ | 111,369 | 116,259 | 117,806 | 75,579 | 68,540 | ||||||||||||||
| Commercial real estate |
87,216 | 81,219 | 86,915 | 92,102 | 72,797 | |||||||||||||||
| Loans to individuals for household, family and other consumer expenditures |
47,545 | 50,097 | 54,329 | 46,834 | 46,360 | |||||||||||||||
| Commercial and industrial loans |
22,794 | 21,589 | 23,820 | 19,909 | 21,694 | |||||||||||||||
| All other loans |
262 | 612 | 514 | 240 | 454 | |||||||||||||||
| Total loans, gross |
269,186 | 269,776 | 283,384 | 234,664 | 209,845 | |||||||||||||||
| Less unearned income and fees |
(119 | ) | (149 | ) | (216 | ) | (192 | ) | (214 | ) | ||||||||||
| Loans, net of unearned income and fees |
269,067 | 269,627 | 283,168 | 234,472 | 209,631 | |||||||||||||||
| Less allowance for loan losses |
(4,037 | ) | (3,723 | ) | (3,969 | ) | (1,720 | ) | (1,770 | ) | ||||||||||
| Loans, net |
$ | 265,030 | 265,904 | 279,199 | 232,752 | 207,861 | ||||||||||||||
Commercial Loans. Commercial and industrial loans accounted for 8.47% of the Company’s gross loan portfolio as of December 31, 2010 compared to 8.00% as of December 31, 2009. Such loans are generally made to provide operating lines of credit, to finance the purchase of inventory or equipment, and for other business purposes. Commercial loans are primarily made at rates that adjust with changes in the prevailing prime interest rate, are generally made for a maximum term of five years (unless they are term loans), and generally require interest payments to be made monthly. The creditworthiness of these borrowers is reviewed, analyzed and evaluated on a periodic basis. Most commercial loans are collateralized with business assets such as accounts receivable, inventory and equipment. Even with substantial collateralization such as all of the assets of the business and personal guarantees, commercial lending involves considerable risk of loss in the event of a business downturn or failure of the business.
Real Estate Loans. Real estate loans accounted for 73.77% of the Company’s gross loan portfolio as of December 31, 2010 compared to 73.20% as of December 31, 2009. The Company makes commercial real estate term loans that are typically secured by a first deed of trust.
As of December 31, 2010, 56.08% of the real estate loans were secured by 1-4 family residential properties. Of these 1-4 family residential property loans, 6.62% were construction loans, 33.91% were home equity lines of credit, 53.96% were closed end loans secured by a first deed of trust and 5.51% were closed end loans secured by a second deed of trust.
As of December 31, 2010, 43.92% of the real estate loans were secured by commercial real estate. Of the total commercial real estate loans as of December 31, 2010, 29.60% were acquisition and development loans, 8.44%
18
were secured by farmland, 43.69% were secured by owner occupied commercial real estate and 18.27% were secured by non-owner occupied commercial real estate typically 1st and 2nd deeds of trust.
Real estate lending involves risk elements when there is lack of timely payment and/or a decline in the value of the collateral. Both commercial and residential real estate values in the Company’s market declined slightly in 2010. The Company is still seeing evidence of some borrowers being strained in their ability to service loans. This has resulted in a higher number of loan impairments in 2010 and may result in future impairments in 2011. The Company continuously monitors the local real estate market for signs of weakness that could decrease collateral values.
Installment Loans. Installment loans are represented by loans to individuals for household, family and other consumer expenditures with typical collateral such as automobile titles. Installment loans accounted for 17.66% of the Company’s loan portfolio as of December 31, 2010 compared to 18.57% as of December 31, 2009.
Loan Maturity and Interest Rate Sensitivity. The following table presents loan portfolio information related to maturity distribution of commercial and industrial loans and real estate construction loans based on scheduled repayments at December 31, 2010.
| Due within one year |
Due one to five years |
Due after five years |
Total | |||||||||||||
| Commercial and industrial loans |
$ | 12,594 | 5,088 | 5,112 | 22,794 | |||||||||||
| Real estate – construction |
6,308 | 905 | 158 | 7,371 | ||||||||||||
The following table presents the interest rate sensitivity of commercial and industrial loans and real estate construction loans maturing after one year or longer as of December 31, 2010.
INTEREST RATE SENSITIVITY
| Fixed interest rates |
$ | 11,263 | ||
| Variable interest rates |
— | |||
| Total maturing after one year |
$ | 11,263 | ||
Restructured Loans. The Company had four restructured loans totaling $3,262 at December 31, 2010 and none at December 31, 2009.
Nonperforming Assets. Interest on loans is normally accrued from the date a disbursement is made and recognized as income as it is earned. Generally, the Company reviews any loan on which payment has not been made for 90 days for potential nonaccrual. The loan is examined and the collateral is reviewed to determine loss potential. If the loan is placed on nonaccrual status, any prior accrued interest that remains unpaid is reversed. Loans on nonaccrual status amounted to $7,073, $2,619 and $2,292 as of December 31, 2010, 2009 and 2008, respectively. Interest income that would have been earned on nonaccrual loans if they had been current in accordance with their original terms and the recorded interest that was included in income on these loans was not significant for 2010, 2009 or 2008. There were no commitments to lend additional funds to customers whose loans were on nonaccrual status at December 31, 2010. Five foreclosed properties totaling $474 were on hand as of December 31, 2010 compared to three properties totaling $461 as of December 31, 2009 and one property totaling $300 as of 2008.
The current recession which began in the second half of 2008 has led to an increase in the Company’s nonperforming assets over the last three years. Some commercial borrowers have struggled to service their loans due to the difficult business climate, lower revenues, tightening of credit markets and difficulties in moving their product. Some noncommercial borrowers have experienced job losses and other economic challenges, as well. Continued market weaknesses including increased unemployment levels in 2010 led to the increase in nonperforming assets in 2010 compared to 2009. We expect nonperforming assets to decrease slightly in 2011 as the economy recovers. The Company will continue to monitor the situation and take steps necessary to mitigate losses in its loan portfolio, such as increased early monitoring of its portfolio to identify “problem” credits and
19
continued counseling of customers to discuss options available to them. The following table presents information with respect to the Company’s nonperforming assets and nonaccruing loans 90 days or more past due by type as of the dates indicated.
NONPERFORMING ASSETS
| December 31, | ||||||||||||
| 2010 | 2009 | 2008 | ||||||||||
| Nonaccrual loans |
$ | 7,073 | 2,619 | 2,292 | ||||||||
| Loans 90 days or more past due |
770 | 1,398 | 620 | |||||||||
| Foreclosed properties |
474 | 461 | 300 | |||||||||
| Total nonperforming assets |
$ | 8,317 | 4,478 | 3,212 | ||||||||
Nonperforming assets totaled $8,317 or 2.47% of total assets as of December 31, 2010, compared to $4,478 or 1.35% as of December 31, 2009 and $3,212 or 1.00% as of December 31, 2008. The following table presents the balance of accruing loans 90 days or more past due by type as of the dates indicated.
ACCRUING LOANS 90 DAYS OR MORE
PAST DUE BY TYPE
| December 31, | ||||||||||||
| 2010 | 2009 | 2008 | ||||||||||
| Loans 90 days or more past due by type: |
||||||||||||
| Real estate loans |
$ | 732 | 1,283 | 546 | ||||||||
| Loans to individuals |
38 | 84 | 41 | |||||||||
| Commercial loans |
— | 31 | 33 | |||||||||
| Total accruing loans 90 days or more past due |
$ | 770 | 1,398 | 620 | ||||||||
Allowance for Loan Losses. The Company maintains an allowance for loan losses which it considers adequate to cover the risk of losses in the loan portfolio. The allowance is based upon management’s ongoing evaluation of the quality of the loan portfolio, total outstanding and committed loans, previous charges against the allowance and current and anticipated economic conditions. The allowance is also subject to regulatory examinations and determinations as to adequacy, which may take into account such factors as the methodology used to calculate the allowance. The Company’s management believes that as of December 31, 2010, 2009 and 2008, the allowance was adequate. The amount of the provision for loan losses is a charge against earnings. Actual loan losses are charged against the allowance for loan losses.
Management evaluates the reasonableness of the allowance for loan losses on a monthly basis and adjusts the provision as deemed necessary using regulatory approved methodology. Management uses historical loss data by loan type as well as current economic factors in its calculation of allowance for loan loss. Management also uses qualitative factors such as changes in lending policies and procedures, changes in national and local economies, changes in the nature and volume of the loan portfolio, changes in experience of lenders and the loan department, changes in volume and severity of past due and classified loans, changes in quality of the Bank’s loan review system, the existence and effect of concentrations of credit and external factors such as competition and regulation in its allowance for loan loss calculation. Each qualitative factor is evaluated and applied to each type of loan in the Company’s portfolio and a percentage of each loan is reserved as allowance. A percentage of each loan is also reserved according to the loan type’s historical loss data. Larger percentages of allowance are taken as the risk for a loan is determined to be greater. As of December 31, 2010, the allowance for loan losses totaled $4,037 or 1.50% of total loans, net of unearned income and fees, compared to $3,723 or 1.38% of total loans, net of unearned income and fees, as of December 31, 2009. The provision for loan losses for the years ended December 31, 2010 and 2009 was $1,878 and $1,530, respectively. Net charge-offs for the Company were $1,564 and $1,776 for the years ended December 31, 2010 and 2009, respectively. The ratio of net loan charge-offs during the period to average loans outstanding for the period was 0.59% and 0.65% for the years ended December 31, 2010 and 2009, respectively.
20
As of December 31, 2009, the allowance for loan losses totaled $3,723 or 1.38% of total loans, net of unearned income and fees compared to $3,969 or 1.40% of total loans, net of unearned income and fees as of December 31, 2008. The provision for loan losses for the years ended December 31, 2009 and 2008 was $1,530 and $2,881, respectively. Net charge-offs for the Company were $1,776 and $632 for the years ended December 31, 2009 and 2008, respectively. The ratio of net loan charge-offs during the period to average loans outstanding for the period was 0.65% and 0.24% for the years ended December 31, 2009 and 2008, respectively.
At the end of 2008 the Company deemed it prudent to make a special provision in excess of $2,000 to the allowance for loan losses, over and beyond the regular monthly loss provision, after reviewing nonperforming and potential problem loans, the general economic climate and declining collateral values.
The following table presents charged off loans, provisions for loan losses, recoveries on loans previously charged off, allowance adjustments and the amount of the allowance for the years indicated.
ANALYSIS OF ALLOWANCE FOR LOAN LOSSES
| December 31, | ||||||||||||||||||||
| 2010 | 2009 | 2008 | 2007 | 2006 | ||||||||||||||||
| Balance at beginning of year |
$ | 3,723 | 3,969 | 1,720 | 1,770 | 1,508 | ||||||||||||||
| Loan charge-offs: |
||||||||||||||||||||
| Real estate loans – residential |
(774 | ) | — | — | — | — | ||||||||||||||
| Real estate loans – commercial |
(315 | ) | (1,252 | ) | (252 | ) | (223 | ) | — | |||||||||||
| Commercial and industrial loans |
(232 | ) | (112 | ) | (200 | ) | (137 | ) | — | |||||||||||
| Loans to individuals for household, family and other consumer expenditures |
(444 | ) | (693 | ) | (353 | ) | (286 | ) | (206 | ) | ||||||||||
| Total loan charge-offs |
(1,765 | ) | (2,057 | ) | (805 | ) | (646 | ) | (206 | ) | ||||||||||
| Loan recoveries: |
||||||||||||||||||||
| Real estate loans – residential |
12 | — | — | — | — | |||||||||||||||
| Real estate loans – commercial |
8 | 80 | 33 | — | — | |||||||||||||||
| Commercial and industrial loans |
37 | 37 | 25 | — | — | |||||||||||||||
| Loans to individuals for household, family and other consumer expenditures |
144 | 164 | 115 | 134 | 129 | |||||||||||||||
| Total recoveries |
201 | 281 | 173 | 134 | 129 | |||||||||||||||
| Net loan charge-offs |
(1,564 | ) | (1,776 | ) | (632 | ) | (512 | ) | (77 | ) | ||||||||||
| Provisions for loan losses |
1,878 | 1,530 | 2,881 | 462 | 339 | |||||||||||||||
| Balance at end of year |
$ | 4,037 | 3,723 | 3,969 | 1,720 | 1,770 | ||||||||||||||
The following table presents net charge offs to average loans net unearned income and fees.
| 2010 | 2009 | 2008 | 2007 | 2006 | ||||||||||||||||
| Net charge-offs to average loans, net of unearned income and fees |
0.59 | % | 0.65 | % | 0.24 | % | 0.23 | % | 0.04 | % | ||||||||||
The primary risk elements considered by management with respect to each installment and conventional real estate loan are lack of timely payment and the value of the collateral. The primary risk elements with respect to real estate construction loans are fluctuations in real estate values in the Company’s market areas, inaccurate estimates of construction costs, fluctuations in interest rates, the availability of conventional financing, the demand for housing in the Company’s market area and general economic conditions. The primary risk elements with respect to commercial loans are the financial condition of the borrower, general economic conditions in the Company’s market area, the sufficiency of collateral, the timeliness of payment and, with respect to adjustable rate loans, interest rate fluctuations. Management has a policy of requesting and reviewing annual financial statements from its commercial loan customers and periodically reviews the existence of collateral and its value at least annually. Management also has a reporting system that monitors all past due loans and has adopted policies
21
to pursue its creditor’s rights in order to preserve the Company’s position. Management also recognizes the real estate values are declining in the Company’s markets and is diligently monitoring appraisal values at least annually.
Loans are charged against the allowance when, in management’s opinion, they are deemed uncollectible, although the Company continues to aggressively pursue collection. The Company considers a number of factors to determine the need for and timing of charge-offs including the following: whenever any commercial loan becomes past due for 120 days for any scheduled principal or interest payment and collection is considered uncollectible; whenever foreclosure on real estate collateral or liquidation of other collateral does not result in full payment of the obligation and the deficiency or some portion thereof is deemed uncollectible, the uncollectible portion is charged-off; whenever any installment loan becomes past due for 120 days and collection is considered unlikely; whenever any repossessed vehicle remains unsold for 60 days after repossession; whenever a bankruptcy notice is received on any installment loan and review of the facts results in an assessment that all or most of the balance will not be collected, the loan will be placed in non-accrual status; whenever a bankruptcy notice is received on a small, unsecured, revolving installment account; and whenever any other small, unsecured, revolving installment account becomes past due for 180 days.
Although management believes that the allowance for loan losses is adequate to absorb losses as they arise, there can be no assurance that (i) the Company will not sustain losses in any given period which could be substantial in relation to the size of the allowance for loan losses, (ii) the Company’s level of nonperforming loans will not increase, (iii) the Company will not be required to make significant additional provisions to its allowance for loan losses, or (iv) the level of net charge-offs will not increase and possibly exceed applicable reserves.
The following table presents the allocation of the allowance for loan losses as of the dates indicated. Notwithstanding these allocations, the entire allowance for loan losses is available to absorb charge-offs in any category of loans.
| December 31, 2010 | December 31, 2009 | December 31, 2008 | December 31, 2007 | December 31, 2006 | ||||||||||||||||||||||||||||||||||||
| Allowance for loan losses |
Percent of loans in each category to total loans |
Allowance for loan losses |
Percent of loans in each category to total loans |
Allowance for loan losses |
Percent of loans in each category to total loans |
Allowance for loan losses |
Percent of loans in each category to total loans |
Allowance for loan losses |
Percent of loans in each category to total loans |
|||||||||||||||||||||||||||||||
| Real estate loans: |
||||||||||||||||||||||||||||||||||||||||
| Residential |
$ | 1,631 | 41.37% | 2,179 | 43.10% | 1,530 | 41.57% | 57 | 32.21% | 17 | 24.72% | |||||||||||||||||||||||||||||
| Commerical |
1,723 | 32.40% | 1,042 | 30.11% | 1,231 | 30.67% | 970 | 39.25% | 282 | 36.75% | ||||||||||||||||||||||||||||||
| Loans to individuals for households, family and other consumer expenditures |
424 | 17.66% | 293 | 18.57% | 635 | 19.17% | 416 | 19.96% | 502 | 22.09% | ||||||||||||||||||||||||||||||
| Commercial and industrial loans |
259 | 8.47% | 209 | 8.00% | 573 | 8.41% | 226 | 8.48% | 509 | 16.22% | ||||||||||||||||||||||||||||||
| All other loans |
— | 0.10% | — | 0.22% | — | 0.18% | — | 0.10% | — | 0.22% | ||||||||||||||||||||||||||||||
| Unallocated |
— | — | — | — | — | — | 51 | — | 460 | — | ||||||||||||||||||||||||||||||
| Totals |
$ | 4,037 | 100.00% | 3,723 | 100.00% | 3,969 | 100.00% | 1,720 | 100.00% | 1,770 | 100.00% | |||||||||||||||||||||||||||||
While consumer related charge-offs represent many of the charge-offs over the last three years, they are of a low dollar amount on an individual loan basis. Commercial and real estate loans on the other hand, though relatively few in terms of the number of charge-offs over the past three years, have the potential to greatly impact the allowance if a particular loan defaults. The Bank’s loan review team uses the principles of the Financial Accounting Standards Board (FASB) Accounting Standards Codification (ASC) topic Receivables, when determining the allocation of allowance for loan losses between loan categories. The determination of a loan category’s allowance is based on the probability of a loan’s default and the probability of loss in the event of a default.
22
Credit Risk Management
The risk of nonpayment of loans is an inherent aspect of commercial banking. The degree of perceived risk is taken into account in establishing the structure of, and interest rates and security for, specific loans and various types of loans. The Company strives to minimize its credit risk exposure by its credit underwriting standards and loan policies and procedures. Management continually evaluates the credit risks of its loans and believes it has provided adequately for the credit risks associated with these loans. The Company has implemented and expects to continue to implement and update new policies and procedures to maintain its credit risk management systems.
Bank Premises and Equipment
Bank premises and equipment decreased 4.10% in 2010 due to normal depreciation and no major purchases compared to an increase of 8.76% in 2009 due to fixed assets additions associated with the new Rustburg facility partially offset by depreciation in 2009. The Company is leasing the Timberlake and Amherst branch facilities and the Smith Mountain Lake loan production office. In early 2008, the Company began leasing a building in the Wyndhurst section of Lynchburg for administrative and training purposes.
Deposits
Average deposits were $303,473 for the year ended December 31, 2010, an increase of $9,064 or 3.08% from $294,409 of average deposits for the year ended December 31, 2009. As of December 31, 2010, total deposits were $306,954 representing an increase of $4,835 or 1.60% from $302,119 in total deposits as of December 31, 2009. The change in deposits during 2010 was primarily due to increased deposit balances in previously existing deposit accounts, new deposit accounts opened as a result of new banking relationships, growth at the Company’s newer branch locations, competitive pricing of the Company’s products and services and the continued success of our KaChing! Rewards checking product.
For the year ended December 31, 2010, average noninterest-bearing demand deposits were $27,884 or 9.19% of average deposits. For the year ended December 31, 2009, average noninterest-bearing demand deposits were $25,883 or 8.79% of average deposits. Average interest-bearing deposits were $275,589 for the year ended December 31, 2010, representing an increase of $7,063 or 2.63% over the $268,526 in average interest-bearing deposits for the year ended December 31, 2009.
The levels of noninterest-bearing demand deposits (including retail accounts) are influenced by such factors as customer service, service charges and the availability of banking services. No assurance can be given that the Company will be able to maintain its current level of noninterest-bearing deposits. Competition from other banks and thrift institutions as well as money market funds, some of which offer interest rates substantially higher than the Company, makes it difficult for the Company to maintain the current level of noninterest-bearing deposits. Management continually works to implement pricing and marketing strategies designed to control the cost of interest-bearing deposits and to maintain a stable deposit mix.
The following table presents the Company’s average deposits and the average rate paid for each category of deposits for the periods indicated.
23
AVERAGE DEPOSIT INFORMATION
| Year ended December 31, 2010 |
Year ended December 31, 2009 |
Year ended December 31, 2008 |
||||||||||||||||||||||
| Average amount of deposits(1) |
Average rate paid |
Average amount of deposits(1) |
Average rate paid |
Average amount of deposits(1) |
Average rate paid |
|||||||||||||||||||
| Noninterest-bearing demand deposits |
$ | 27,884 | N/A | 25,883 | N/A | 25,169 | N/A | |||||||||||||||||
| Interest-bearing demand deposits |
46,497 | 0.65 | % | 42,875 | 0.80 | % | 43,731 | 1.38 | % | |||||||||||||||
| Savings and NOW deposits |
66,603 | 1.45 | % | 54,358 | 1.70 | % | 35,568 | 1.59 | % | |||||||||||||||
| Time deposits: |
||||||||||||||||||||||||
| Under $100,000 |
113,767 | 2.69 | % | 118,286 | 3.48 | % | 118,298 | 4.43 | % | |||||||||||||||
| $100,000 and over |
48,722 | 3.10 | % | 53,007 | 3.64 | % | 42,315 | 4.27 | % | |||||||||||||||
| Total average time deposits |
162,489 | 171,293 | 160,613 | |||||||||||||||||||||
| Total average deposits |
$ | 303,473 | 294,409 | 265,081 | ||||||||||||||||||||
| (1) | Averages are daily averages. |
The following table presents the maturity schedule of time certificates of deposit of $100,000 and over and other time deposits of $100,000 and over as of December 31, 2010.
TIME DEPOSITS OF $100,000 AND OVER
| Certificates of deposit |
Other time deposits |
Total | ||||||||||
| Three months or less |
$ | 3,739 | 1,240 | 4,979 | ||||||||
| Over three through six months |
1,462 | — | 1,462 | |||||||||
| Over six through 12 months |
8,211 | 1,025 | 9,236 | |||||||||
| Over 12 months |
19,255 | 14,312 | 33,567 | |||||||||
| Total time deposits of $100,000 and over |
$ | 32,667 | 16,577 | 49,244 | ||||||||
Financial Ratios
The following table presents certain financial ratios for the periods indicated.
RETURN ON EQUITY AND ASSETS
| Years ended December 31, |
||||||||||||
| 2010 | 2009 | 2008 | ||||||||||
| Return on average assets |
0.21 | % | 0.11 | % | 0.10 | % | ||||||
| Return on average equity |
2.62 | % | 1.40 | % | 1.14 | % | ||||||
| Dividend payout ratio |
10.92 | % | 41.88 | % | 291.50 | % | ||||||
| Average equity to average assets |
7.88 | % | 7.69 | % | 9.14 | % | ||||||
Capital Resources
The Company’s financial position at December 31, 2010 reflects liquidity and capital levels currently adequate to fund anticipated future business expansion. Capital ratios are in excess of required regulatory minimums for a “well-capitalized” institution. The assessment of capital adequacy depends on a number of factors such as asset quality, liquidity, earnings performance, and changing competitive conditions and economic forces. The adequacy of the Company’s capital is reviewed by management on an ongoing basis. Management seeks to maintain a capital structure that will assure an adequate level of capital to support anticipated asset growth and to absorb potential losses.
The primary indicators relied on by bank regulators in measuring the capital position are the Tier 1 capital, total risk-based capital and leverage ratios. Tier 1 capital consists generally of common and qualifying preferred stockholders’ equity less goodwill. Total capital generally consists of Tier 1 capital, qualifying subordinated debt and a portion of the allowance for loan losses. Risk-based capital ratios are calculated with reference to risk-weighted
24
assets. The Company’s Tier 1 capital ratio was 9.36% at December 31, 2010 and 9.50% at December 31, 2009. The total capital ratio was 10.61% at December 31, 2010 and 10.75% at December 31, 2009.
These ratios exceed the mandated minimum requirements of 4% and 8%, respectively. As of December 31, 2010 and 2009, the Company met all regulatory capital ratio requirements and was considered “well capitalized” in accordance with the Federal Deposit Insurance Corporation Improvement Act.
Stockholders’ equity was $26,482 at December 31, 2010 compared to $25,851 at December 31, 2009.
The leverage ratio consists of Tier 1 capital divided by quarterly average assets. At December 31, 2010, the Company’s leverage ratio was 7.74% compared to 8.04% at December 31, 2009. Each of these exceeds the required minimum leverage ratio of 4%. The dividend payout ratio was 10.92% and 41.88% in 2010 and 2009, respectively, with the decline due to the increase in net income over the same period and a smaller dividend payout. The Company paid dividends of $0.05 per share in 2010 and $0.10 per share in 2009.
Off-Balance Sheet Arrangements
The Company did not use any financial derivatives during 2010 and 2009. However, the Company has off-balance sheet arrangements that may have a material effect on the results of operations in the future. The Company, in the normal course of business, may at times be a party to financial instruments such as standby letters of credit. Standby letters of credit as of December 31, 2010 equaled $1,237 compared with $1,203 as of December 31, 2009. Other commitments include commitments to lend money. Not all of these commitments will be acted upon; therefore, the cash requirements will likely be significantly less than the commitments themselves. As of December 31, 2010, the Company had unused loan commitments of $56,910 including $30,176 in unused commitments with an original maturity exceeding one year compared with $47,515 including $24,457 in unused commitments with an original maturity exceeding one year as of December 31, 2009. See Note 9 of the Notes to Consolidated Financial Statements.
Critical Accounting Policies
The reporting policies of the Company are in accordance with U.S. generally accepted accounting principles (GAAP). Certain critical accounting policies affect the more significant judgments and estimates used in the preparation of the consolidated financial statements. The Company’s single most critical accounting policy relates to the Company’s allowance for loan losses, which reflects the estimated losses resulting from the inability of the Company’s borrowers to make required loan payments. If the financial condition of the Company’s borrowers were to deteriorate, resulting in an impairment of their ability to make payments, the Company’s estimates would be updated, and additional provisions for loan losses may be required. Further discussion of the estimates used in determining the allowance for loan losses is contained in the discussion on “Allowance for Loan Losses” on page 20 and “Loans and Allowance for Loan Losses” in Note 1 of the Notes to Consolidated Financial Statements.
Impact of Recently Issued Accounting Standards
For a discussion of recently adopted accounting pronouncements and recently issued pronouncements which are not yet effective and the impact, if any, on our financial statements, see Note 1(t), “Current Accounting Developments” of the Notes to Consolidated Financial Statements included in this Annual Report.
25
PINNACLE BANKSHARES CORPORATION AND SUBSIDIARY
CONSOLIDATED BALANCE SHEETS
December 31, 2010 and 2009
(In thousands of dollars, except share data)
| 2010 | 2009 | |||||||
| Assets |
||||||||
| Cash and cash equivalents (note 2): |
||||||||
| Cash and due from banks |
$ | 32,533 | $ | 30,052 | ||||
| Federal funds sold |
— | 2,008 | ||||||
| Total cash and cash equivalents |
32,533 | 32,060 | ||||||
| Securities (note 3): |
||||||||
| Available-for-sale, at fair value |
22,048 | 19,105 | ||||||
| Held-to-maturity, at amortized cost |
4,469 | 1,051 | ||||||
| Federal Reserve Bank stock, at cost (note 1(c)) |
135 | 105 | ||||||
| Federal Home Loan Bank stock, at cost (note 1(c)) |
579 | 579 | ||||||
| Loans, net (notes 4, 9 and 11) |
265,030 | 265,904 | ||||||
| Bank premises and equipment, net (note 5) |
6,932 | 7,228 | ||||||
| Accrued interest receivable |
1,077 | 1,190 | ||||||
| Prepaid FDIC Insurance |
1,376 | 1,842 | ||||||
| Goodwill |
539 | 539 | ||||||
| Other assets (notes 7 and 8) |
2,395 | 2,607 | ||||||
| Total assets |
$ | 337,113 | $ | 332,210 | ||||
| Liabilities and Stockholders’ Equity | ||||||||
| Liabilities: |
||||||||
| Deposits (note 6): |
||||||||
| Demand |
$ | 31,184 | $ | 32,276 | ||||
| Savings and NOW accounts |
117,944 | 103,445 | ||||||
| Time |
157,826 | 166,398 | ||||||
| Total deposits |
306,954 | 302,119 | ||||||
| Note payable to Federal Home Loan Bank (note 1(d)) |
— | — | ||||||
| Note payable under line of credit (note 1 (d)) |
2,000 | 2,000 | ||||||
| Accrued interest payable |
500 | 613 | ||||||
| Other liabilities (note 7) |
1,177 | 1,627 | ||||||
| Total liabilities |
310,631 | 306,359 | ||||||
| Stockholders’ equity (notes 7, 12 and 15): |
||||||||
| Common stock, $3 par value. Authorized 3,000,000 shares, issued and outstanding 1,495,589 shares in 2010 and 1,485,089 shares in 2009 |
$ | 4,462 | $ | 4,455 | ||||
| Capital surplus |
850 | 787 | ||||||
| Retained earnings |
21,918 | 21,306 | ||||||
| Accumulated other comprehensive loss, net |
(748 | ) | (697 | ) | ||||
| Total stockholders’ equity |
26,482 | 25,851 | ||||||
| Commitments, contingencies and other matters (notes 9, 10 and 12) |
||||||||
| Total liabilities and stockholders’ equity |
$ | 337,113 | $ | 332,210 | ||||
See accompanying notes to consolidated financial statements.
26
PINNACLE BANKSHARES CORPORATION AND SUBSIDIARY
CONSOLIDATED STATEMENTS OF INCOME
Years ended December 31, 2010, 2009 and 2008
(In thousands of dollars, except per share data)
| 2010 | 2009 | 2008 | ||||||||||
| Interest income: |
||||||||||||
| Interest and fees on loans |
$ | 15,835 | $ | 16,622 | $ | 17,615 | ||||||
| Interest on securities: |
||||||||||||
| U.S. Government agencies |
416 | 287 | 310 | |||||||||
| Corporate |
3 | 42 | 66 | |||||||||
| States and political subdivisions (taxable) |
159 | 133 | 203 | |||||||||
| States and political subdivisions (tax-exempt) |
110 | 180 | 214 | |||||||||
| Other |
84 | 41 | 43 | |||||||||
| Interest on federal funds sold |
4 | 11 | 104 | |||||||||
| Total interest income |
16,611 | 17,316 | 18,555 | |||||||||
| Interest expense: |
||||||||||||
| Interest on deposits: |
||||||||||||
| Savings and NOW accounts |
1,271 | 1,264 | 1,170 | |||||||||
| Time - under $100,000 |
3,056 | 4,115 | 5,246 | |||||||||
| Time - $100,000 and over |
1,508 | 1,929 | 1,809 | |||||||||
| Other interest expense |
— | 4 | 121 | |||||||||
| Total interest expense |
5,835 | 7,312 | 8,346 | |||||||||
| Net interest income |
10,776 | 10,004 | 10,209 | |||||||||
| Provision for loan losses (note 4) |
1,878 | 1,530 | 2,881 | |||||||||
| Net interest income after provision for loan losses |
8,898 | 8,474 | 7,328 | |||||||||
| Noninterest income: |
||||||||||||
| Service charges on deposit accounts |
1,498 | 1,516 | 1,493 | |||||||||
| Commissions and fees |
524 | 470 | 442 | |||||||||
| Mortgage loan fees |
571 | 547 | 261 | |||||||||
| Service charges on loan accounts |
237 | 273 | 403 | |||||||||
| Other operating income |
304 | 342 | 297 | |||||||||
| Total noninterest income |
3,134 | 3,148 | 2,896 | |||||||||
| Noninterest expense: |
||||||||||||
| Salaries and employee benefits (note 7) |
5,973 | 6,069 | 5,621 | |||||||||
| Occupancy expense |
740 | 697 | 625 | |||||||||
| Furniture and equipment |
1,001 | 1,066 | 949 | |||||||||
| Office supplies and printing |
277 | 288 | 254 | |||||||||
| Federal deposit insurance premiums |
501 | 621 | 77 | |||||||||
| Capital stock tax |
226 | 226 | 212 | |||||||||
| Advertising expense |
122 | 116 | 142 | |||||||||
| Other operating expenses |
2,197 | 2,088 | 1,966 | |||||||||
| Total noninterest expense |
11,037 | 11,171 | 9,846 | |||||||||
| Income before income tax expense |
995 | 451 | 378 | |||||||||
| Income tax expense (note 8) |
308 | 100 | 72 | |||||||||
| Net income |
$ | 687 | $ | 351 | $ | 306 | ||||||
| Basic net income per share (note 1(o)) |
$ | 0.46 | $ | 0.24 | $ | 0.21 | ||||||
| Diluted net income per share (note1(o)) |
$ | 0.46 | $ | 0.24 | $ | 0.21 | ||||||
See accompanying notes to consolidated financial statements.
27
PINNACLE BANKSHARES CORPORATION AND SUBSIDIARY
CONSOLIDATED STATEMENTS OF CHANGES IN STOCKHOLDERS’ EQUITY AND COMPREHENSIVE INCOME
Years ended December 31, 2010, 2009 and 2008
(In thousands of dollars, except share and per share data)
| Common Stock | Capital Surplus |
Retained Earnings |
Accumulated Other Comprehensive Income (Loss) |
Total | ||||||||||||||||||||
| Shares | Par Value | |||||||||||||||||||||||
| Balances, December 31, 2007 |
1,485,089 | $ | 4,455 | $ | 787 | $ | 21,685 | $ | (111 | ) | $ | 26,816 | ||||||||||||
| Net income |
— | — | — | 306 | — | 306 | ||||||||||||||||||
| Change in net unrealized gains on available-for-sale securities, net of deferred tax benefit of $41 |
— | — | — | — | 83 | 83 | ||||||||||||||||||
| Adjustment to apply ASC topic, Compensation- Retirement Benefits, net of tax of $719 |
(1,397 | ) | (1,397 | ) | ||||||||||||||||||||
| Comprehensive income (loss) |
(1,008 | ) | ||||||||||||||||||||||
| Cash dividends declared by Bankshares ($0.60 per share) |
(889 | ) | — | (889 | ) | |||||||||||||||||||
| Balances, December 31, 2008 |
1,485,089 | $ | 4,455 | $ | 787 | $ | 21,102 | $ | (1,425 | ) | $ | 24,919 | ||||||||||||
| Net income |
— | — | — | 351 | — | 351 | ||||||||||||||||||
| Change in net unrealized gains on available-for-sale securities, net of deferred tax benefit of $41 |
— | — | — | — | 68 | 68 | ||||||||||||||||||
| Adjustment to apply ASC topic, Compensation- Retirement Benefits, net of tax of $340 |
660 | 660 | ||||||||||||||||||||||
| Comprehensive income |
1,079 | |||||||||||||||||||||||
| Cash dividends declared by Bankshares ($0.10 per share) |
— | — | — | (147 | ) | — | (147 | ) | ||||||||||||||||
| Balances, December 31, 2009 |
1,485,089 | $ | 4,455 | $ | 787 | $ | 21,306 | $ | (697 | ) | $ | 25,851 | ||||||||||||
| Net income |
— | — | — | 687 | — | 687 | ||||||||||||||||||
| Change in net unrealized gains on available-for-sale securities, net of deferred tax benefit of $33 |
— | — | — | — | (88 | ) | (88 | ) | ||||||||||||||||
| Adjustment to apply ASC topic, Compensation- Retirement Benefits, net of tax of $19 |
37 | 37 | ||||||||||||||||||||||
| Comprehensive income |
636 | |||||||||||||||||||||||
| Issuance of restricted stock and related expense |
10,500 | 7 | 16 | 23 | ||||||||||||||||||||
| Stock option expense |
47 | 47 | ||||||||||||||||||||||
| Cash dividends declared by Bankshares ($0.05 per share) |
— | — | — | (75 | ) | — | (75 | ) | ||||||||||||||||
| Balances, December 31, 2010 |
1,495,589 | $ | 4,462 | $ | 850 | $ | 21,918 | $ | (748 | ) | $ | 26,482 | ||||||||||||
See accompanying notes to consolidated financial statements.
28
PINNACLE BANKSHARES CORPORATION AND SUBSIDIARY
CONSOLIDATED STATEMENTS OF CASH FLOWS
Years ended December 31, 2010, 2009 and 2008
(In thousands of dollars)
| 2010 | 2009 | 2008 | ||||||||||
| Cash flows from operating activities: |
||||||||||||
| Net income |
$ | 687 | $ | 351 | $ | 306 | ||||||
| Adjustments to reconcile net income to net cash provided by operating activities: |
||||||||||||
| Depreciation of bank premises and equipment |
522 | 514 | 426 | |||||||||
| Accretion (Amortization) of unearned fees, net |
30 | (67 | ) | (24 | ) | |||||||
| Net amortization of premiums and discounts on securities |
56 | 51 | — | |||||||||
| Provision for loan losses |
1,878 | 1,530 | 2,881 | |||||||||
| Provision for deferred income taxes |
(327 | ) | (218 | ) | (562 | ) | ||||||
| Net realized gain on securities |
— | (33 | ) | — | ||||||||
| Accrual of stock option vesting |
47 | — | — | |||||||||
| Net decrease (increase) in: |
||||||||||||
| Accrued interest receivable |
113 | 25 | 113 | |||||||||
| Prepaid FDIC insurance |
466 | (1,842 | ) | — | ||||||||
| Other assets |
774 | 646 | 84 | |||||||||
| Net increase (decrease) in: |
||||||||||||
| Accrued interest payable |
(113 | ) | (259 | ) | 11 | |||||||
| Other liabilities |
(450 | ) | 68 | (267 | ) | |||||||
| Net cash provided by operating activities |
3,683 | 766 | 2,968 | |||||||||
| Cash flows from investing activities: |
||||||||||||
| Purchases of held-to-maturity securities |
(5,672 | ) | — | — | ||||||||
| Purchases of available-for-sale securities |
(15,325 | ) | (12,257 | ) | (1,010 | ) | ||||||
| Proceeds from maturities and calls of held-to-maturity securities |
2,250 | 1,464 | 1,670 | |||||||||
| Proceeds from maturities and calls of available-for-sale securities |
11,909 | 2,835 | 4,379 | |||||||||
| Proceeds from paydowns and maturities of available-for-sale mortgage-backed securities |
300 | 928 | 790 | |||||||||
| Proceeds from sales of available-for-sale mortgage-backed securities |
— | 892 | — | |||||||||
| Sale (purchase) of Federal Home Loan Bank stock |
— | 149 | (252 | ) | ||||||||
| Purchase of Federal Reserve Stock |
(30 | ) | (30 | ) | — | |||||||
| Collections on loan participations |
— | 382 | 252 | |||||||||
| Net (increase) decrease in loans made to customers |
(1,199 | ) | 11,362 | (49,841 | ) | |||||||
| Purchases of bank premises and equipment |
(226 | ) | (1,096 | ) | (1,852 | ) | ||||||
| Net cash provided by (used in) investing activities |
(7,993 | ) | 4,629 | (45,864 | ) | |||||||
Continued
29
PINNACLE BANKSHARES CORPORATION AND SUBSIDIARY
CONSOLIDATED STATEMENTS OF CASH FLOWS
| 2010 | 2009 | 2008 | ||||||||||
| Cash flows from financing activities: |
||||||||||||
| Net increase in demand, savings and NOW deposits |
13,407 | 20,158 | 13,449 | |||||||||
| Net increase (decrease) in time deposits |
(8,572 | ) | (5,272 | ) | 21,918 | |||||||
| Borrowing (repayments) of note payable to Federal Home Loan Bank |
— | (5,000 | ) | 5,000 | ||||||||
| Borrowing under line of credit |
— | 1,000 | 1,000 | |||||||||
| Proceeds from issuance of common stock |
23 | — | — | |||||||||
| Cash dividends paid |
(75 | ) | (147 | ) | (889 | ) | ||||||
| Net cash provided by financing activities |
4,783 | 10,739 | 40,478 | |||||||||
| Net increase (decrease) in cash and cash equivalents |
473 | 16,134 | (2,418 | ) | ||||||||
| Cash and cash equivalents, beginning of period |
32,060 | 15,926 | 18,344 | |||||||||
| Cash and cash equivalents, end of period |
$ | 32,533 | $ | 32,060 | $ | 15,926 | ||||||
| Supplemental disclosure of cash flows information |
||||||||||||
| Cash paid during the year for: |
||||||||||||
| Income taxes |
$ | 300 | $ | — | $ | 1,086 | ||||||
| Interest |
5,948 | 7,571 | 8,335 | |||||||||
| Supplemental schedule of noncash investing and financing activities: |
||||||||||||
| Transfer of loans to repossessed properties |
$ | 152 | $ | 73 | $ | 15 | ||||||
| Loans charged against the allowance for loan losses |
1,765 | 2,056 | 805 | |||||||||
| Unrealized gains (losses) on available-for-sale securities |
(122 | ) | 105 | 125 | ||||||||
| Defined benefit plan adjustment per ASC topic Compensation-Retirement Benefits |
56 | 1,000 | (2,115 | ) | ||||||||
See accompanying notes to consolidated financial statements.
30
PINNACLE BANKSHARES CORPORATION
AND SUBSIDIARY
Notes to Consolidated Financial Statements
(In thousands, except ratios, share and per share data)
| (1) | Summary of Significant Accounting Policies and Practices |
Pinnacle Bankshares Corporation, a Virginia corporation (Bankshares), was organized in 1997 and is registered as a bank holding company under the Bank Holding Company Act of 1956, as amended. Bankshares is headquartered in Altavista, Virginia. Bankshares conducts all of its business activities through the branch offices of its wholly owned subsidiary bank, First National Bank (the Bank). Bankshares exists primarily for the purpose of holding the stock of its subsidiary, the Bank, and of such other subsidiaries as it may acquire or establish. The Company has a single reportable segment for purposes of segment reporting.
The accounting and reporting policies of Bankshares and its wholly owned subsidiary (collectively, the Company), conform to accounting principles generally accepted in the United States of America and general practices within the banking industry. The following is a summary of the more significant accounting policies and practices:
| (a) | Consolidation |
The consolidated financial statements include the accounts of Bankshares and the Bank. All material intercompany balances and transactions have been eliminated.
| (b) | Securities |
The Company classifies its securities in three categories: (1) debt securities that the Company has the positive intent and ability to hold to maturity are classified as “held-to-maturity securities” and reported at amortized cost; (2) debt and equity securities that are bought and held principally for the purpose of selling them in the near term are classified as “trading securities” and reported at fair value, with unrealized gains and losses included in net income; and (3) debt and equity securities not classified as either held-to-maturity securities or trading securities are classified as “available-for-sale securities” and reported at fair value, with unrealized gains and losses excluded from net income and reported in accumulated other comprehensive income, a separate component of stockholders’ equity, net of deferred taxes. Fair value is determined from quoted prices obtained and reviewed by management from FT (Financial Times) Interactive Data in cooperation with a correspondent bank, the Company’s third–party bond accountant. Held-to-maturity securities are stated at cost, adjusted for amortization of premiums and accretion of discounts on a basis, which approximates the level yield method. As of December 31, 2010, the Company does not maintain trading securities. Gains or losses on disposition are based on the net proceeds and adjusted carrying values of the securities called or sold, using the specific identification method on a trade date basis. If a decline below cost in the market value of any available-for-sale or held-to-maturity security is deemed other than temporary, the decline is charged to net income resulting in the establishment of a new cost basis for the security.
| (c) | Required Investments |
As a member of the Federal Reserve Bank (FRB) and the Federal Home Loan Bank (FHLB) of Atlanta, the Company is required to maintain certain minimum investments in the common stock of the FRB and FHLB, which are carried at cost. Required levels of investment are based upon the Company’s capital and a percentage of qualifying assets.
In addition, the Company is eligible to borrow from the FHLB with borrowings collateralized by qualifying assets, primarily residential mortgage loans, and the Company’s capital stock investment in the FHLB.
31
| (d) | Borrowings |
At December 31, 2010, the Company’s available borrowing limit with the FHLB was approximately $43,450. The Company had $0 in borrowings from the FHLB outstanding at December 31, 2010 and 2009. Bankshares also has a $5,000 line of credit with a corresponding bank with $2,000 outstanding as of December 31, 2010 and $2,000 outstanding as of December 31, 2009 with a 5.00% interest rate that matures on December 31, 2011.
| (e) | Loans and Allowance for Loan Losses |
Loans are stated at the amount of unpaid principal, reduced by unearned income and fees on loans, and an allowance for loan losses. Income is recognized over the terms of the loans using methods that approximate the level yield method. The allowance for loan losses is a cumulative valuation allowance consisting of an annual provision for loan losses, plus any amounts recovered on loans previously charged off, minus loans charged off. The provision for loan losses charged to operating expenses is the amount necessary in management’s judgment to maintain the allowance for loan losses at a level it believes adequate to absorb probable losses inherent in the loan portfolio. Management determines the adequacy of the allowance based upon reviews of individual credits, recent loss experience, delinquencies, current economic conditions, the risk characteristics of the various categories of loans and other pertinent factors. Management uses historical loss data by loan type as well as current economic factors in its calculation of allowance for loan loss. Management also uses qualitative factors such as changes in lending policies and procedures, changes in national and local economies, changes in the nature and volume of the loan portfolio, changes in experience of lenders and the loan department, changes in volume and severity of past due and classified loans, changes in quality of the Company’s loan review system, the existence and effect of concentrations of credit and external factors such as competition and regulation in its allowance for loan loss calculation. Each qualitative factor is evaluated and applied to each type of loan in the Company’s portfolio and a percentage of each loan is reserved as allowance. A percentage of each loan type is also reserved according to the loan type’s historical loss data. Larger percentages of allowance are taken as the risk for a loan is determined to be greater. Loans are charged against the allowance for loan losses when management believes the collectability of the principal is uncollectible. While management uses available information to recognize losses on loans, future additions to the allowance for loan losses may be necessary based on changes in economic conditions or the Company’s recent loss experience. It is reasonably possible that management’s estimate of loan losses and the related allowance may change materially in the near term. However, the amount of change that is reasonably possible cannot be estimated. In addition, various regulatory agencies, as an integral part of their examination process, periodically review the Company’s allowance for loan losses. Such agencies may require the Company to recognize additions to the allowance for loan losses based on their judgments about information available to them at the time of their examinations.
Loans are charged against the allowance when, in management’s opinion, they are deemed doubtful, although the Company continues to aggressively pursue collection. The Company considers a number of factors to determine the need for and timing of charge-offs including the following: whenever any commercial loan becomes past due for 120 days for any scheduled principal or interest payment and collection is considered uncollectible; whenever foreclosure on real estate collateral or liquidation of other collateral does not result in full payment of the obligation and the deficiency or some portion thereof is deemed uncollectible, the uncollectible portion shall be charged-off; whenever any installment loan becomes past due for 120 days and collection is considered unlikely; whenever any repossessed vehicle remains unsold for 60 days after repossession; whenever a bankruptcy notice is received on any installment loan and review of the facts results in an assessment that all or most of the balance will not be collected, the loan will be placed in non-accrual status; whenever a bankruptcy notice is received on a small, unsecured, revolving installment account; and whenever any other small, unsecured, revolving installment account becomes past due for 180 days.
32
Interest related to non-accrual loans is recognized on the cash basis. Loans are generally placed in non-accrual status when the collection of principal and interest is 90 days or more past due, unless the obligation relates to a consumer or residential real estate loan or is both well-secured and in the process of collection.
Impaired loans are required to be presented in the financial statements at net realizable value of the expected future cash flows or at the fair value of the loan’s collateral. Homogeneous loans such as real estate mortgage loans, individual consumer loans and home equity loans are evaluated collectively for impairment. Management, considering current information and events regarding the borrower’s ability to repay their obligations, considers a loan to be impaired when it is probable that the Company will be unable to collect all amounts due according to the contractual terms of the loan agreement. Impairment losses are included in the allowance for loan losses through a charge to the provision for loan losses. Cash receipts on impaired loans receivable are applied first to reduce interest on such loans to the extent of interest contractually due and any remaining amounts are applied to principal.
The following table presents information on the Company’s allowance for loan losses and recorded investment in loans:
Allowance for Loan Losses and Recorded Investment in Loans
For the Year Ended December 31, 2010
| Commercial | Commercial Real Estate |
Consumer | Residential | Total | ||||||||||||||||
| Allowance for Loan Losses: |
||||||||||||||||||||
| Beginning balance |
$ | 208 | $ | 257 | $ | 291 | $ | 2,967 | $ | 3,723 | ||||||||||
| Chargeoffs |
232 | — | 444 | 1,089 | 1,765 | |||||||||||||||
| Recoveries |
37 | — | 144 | 20 | 201 | |||||||||||||||
| Provision |
245 | 7 | 433 | 1,193 | 1,878 | |||||||||||||||
| Ending Balance |
$ | 258 | $ | 264 | $ | 424 | $ | 3,091 | $ | 4,037 | ||||||||||
| Ending balance: individually evaluated for impairment |
— | — | — | 29 | 29 | |||||||||||||||
| Ending balance: collectively evaluated for impairment |
258 | 264 | 424 | 3,062 | 4,008 | |||||||||||||||
| Loans: |
||||||||||||||||||||
| Total loans ending balance |
$ | 22,794 | $ | 53,885 | $ | 47,807 | $ | 144,700 | $ | 269,186 | ||||||||||
| Ending balance: individually evaluated for impairment |
13 | 292 | 52 | 6,716 | 7,073 | |||||||||||||||
| Ending balance: collectively evaluated for impairment |
$ | 22,781 | $ | 53,593 | $ | 47,755 | $ | 137,984 | $ | 262,113 | ||||||||||
33
The following table illustrates the Company’s credit quality indicators:
Credit Quality Indicators
As of December 31, 2010
| Credit Exposure | Commercial | Commercial Real Estate |
Consumer | Residential | Total | |||||||||||||||
| Pass |
$ | 21,978 | $ | 44,553 | $ | 47,621 | $ | 127,343 | $ | 241,495 | ||||||||||
| Special Mention |
678 | 7,224 | 67 | 7,005 | 14,974 | |||||||||||||||
| Substandard |
138 | 2,108 | 119 | 9,969 | 12,334 | |||||||||||||||
| Doubtful |
— | — | — | 383 | 383 | |||||||||||||||
| Total |
$ | 22,794 | $ | 53,885 | $ | 47,807 | $ | 144,700 | $ | 269,186 | ||||||||||
The following table presents information on the Company’s impaired loans and their related allowance for loan recording:
Impaired Loans
For the Year Ended December 31, 2010
| Recorded Investment |
Unpaid Principal Balance |
Related Allowance |
Average Recorded Investment |
Interest Income Recognized |
||||||||||||||||
| With no related allowance recorded: |
||||||||||||||||||||
| Commercial |
$ | 13 | $ | 13 | — | $ | 14 | — | ||||||||||||
| Commercial real estate |
292 | 292 | — | 298 | — | |||||||||||||||
| Consumer |
52 | 52 | — | 109 | 1 | |||||||||||||||
| Residential |
6,636 | 6,636 | — | 6,012 | 306 | |||||||||||||||
| With allowance recorded: |
||||||||||||||||||||
| Commercial |
— | — | — | — | — | |||||||||||||||
| Commercial real estate |
— | — | — | — | — | |||||||||||||||
| Consumer |
— | — | — | — | ||||||||||||||||
| Residential |
80 | 80 | 29 | 80 | — | |||||||||||||||
| Total: |
||||||||||||||||||||
| Commercial |
13 | 13 | — | 14 | — | |||||||||||||||
| Commercial real estate |
292 | 292 | — | 298 | — | |||||||||||||||
| Consumer |
52 | 52 | — | 109 | 1 | |||||||||||||||
| Residential |
$ | 6,716 | $ | 6,716 | $ | 29 | $ | 6,092 | $ | 306 | ||||||||||
| (f) | Loan Origination and Commitment Fees and Certain Related Direct Costs |
Loan origination and commitment fees and certain direct loan origination costs charged by the Company are deferred and the net amount amortized as an adjustment of the related loan’s yield. The Company amortizes these net amounts over the contractual life of the related loans or, in the case of demand loans, over the estimated life. Fees related to standby letters of credit are recognized over the commitment period.
34
| (g) | Bank Premises and Equipment |
Bank premises and equipment are stated at cost, net of accumulated depreciation. Depreciation is computed by the straight-line and declining-balance methods over the estimated useful lives of the assets. Depreciable lives include 15 years for land improvements, 40 years for buildings, and 3 to 7 years for equipment, furniture and fixtures. The cost of assets retired and sold and the related accumulated depreciation are eliminated from the accounts and the resulting gains or losses are included in determining net income. Expenditures for maintenance and repairs are charged to expense as incurred, and improvements and betterments are capitalized.
| (h) | Goodwill |
The Company carries goodwill totaling $539 as of December 31, 2010 and 2009. The Company performs goodwill impairment testing annually. The Company performed goodwill impairment testing at December 31, 2010 because Bankshares’ common stock had been trading below book value per share in 2010. The test performed calculated impairment pursuant to ASC Topic Goodwill and Other Intangible Assets using a market comparable approach, a comparable transactions approach and a discounted cash flow approach. Management determined that no goodwill impairment charge was required because management determined that the fair value of the Company was not less than the Company’s carrying value. Management will continue to monitor the relationship of Bankshares’ market capitalization to both its book value and tangible book value, which management attributes to both financial services industry-wide and Company-specific factors, and to evaluate the carrying value of goodwill.
While management has a plan to return the Company’s business fundamentals to levels that support Bankshares’ common stock trading at or above book value per common share, there is no assurance that the plan will be successful, or that the market price of the common stock will increase to such levels in the foreseeable future. If Bankshares’ common stock price continues to trade below book value per common share, the Company may have to recognize an impairment of all, or some portion of, its goodwill.
| (i) | Foreclosed Assets |
Foreclosed properties consist of properties acquired through foreclosure or deed in lieu of foreclosure. These properties are carried at the lower of cost or fair value less estimated costs to sell. Losses from the acquisition of property in full or partial satisfaction of loans are charged against the allowance for loan losses. Subsequent write-downs, if any, are charged to expense. Gains and losses on the sales of foreclosed properties are included in determining net income in the year of the sale.
| (j) | Impairment or Disposal of Long-Lived Assets |
The Company’s long-lived assets are reviewed for impairment whenever events or changes in circumstances indicate that the carrying amount of an asset may not be recoverable. Recoverability of assets to be held and used, such as bank premises and equipment, is measured by a comparison of the carrying amount of an asset to future net cash flows expected to be generated by the asset. If the carrying amount of an asset exceeds its estimated future cash flows, an impairment charge is recognized in the amount by which the carrying amount of the asset exceeds the fair value of the asset. Assets to be disposed of, such as foreclosed properties, are reported at the lower of the carrying amount or fair value less costs to sell.
| (k) | Pension Plan |
The Company maintains a noncontributory defined benefit pension plan, which covers substantially all of its employees. The net periodic pension expense includes a service cost component, interest on the projected benefit obligation, a component reflecting the actual return on plan assets, the effect of deferring and amortizing certain actuarial gains and losses, and the amortization of any unrecognized net transition obligation on a straight-line basis over the average remaining service period of employees expected to receive benefits under the plan. The Company’s funding policy is to make
35
annual contributions in amounts necessary to satisfy the Internal Revenue Service’s funding standards, to the extent that they are tax deductible.
In September 2006, the FASB issued ASC topic, Defined Benefit Plans, which requires a business entity to recognize the overfunded or underfunded status of a single-employer defined benefit postretirement plan as an asset or liability in its statement of financial position and to recognize changes in that funded status in comprehensive income in the year in which the changes occur. Defined Benefit Plans also requires a business entity to measure the funded status of a plan as of the date of its year-end statement of financial position, with limited exceptions. The recognition and disclosure provisions of Defined Benefit Plans were adopted by the Company beginning with the year ended December 31, 2006. The requirement to measure plan assets and benefit obligations as of the date of the Company’s fiscal year end statement of position was adopted on December 31, 2008.
| (l) | Advertising |
The Company expenses advertising expenses as incurred. Advertising expenses totaled $122 in 2010, $116 in 2009 and $142 in 2008.
| (m) | Income Taxes |
Income taxes are accounted for under the asset and liability method, whereby deferred tax assets and liabilities are recognized for the future tax consequences attributable to differences between the financial statement carrying amounts of existing assets and liabilities and their respective tax bases. Deferred tax assets and liabilities are measured using enacted tax rates expected to apply to taxable income in the years in which those temporary differences are expected to be recovered or settled. The effect on deferred tax assets and liabilities of a change in tax rates is recognized in net income in the period that includes the enactment date.
Deferred income tax assets and liabilities are determined using the liability (or balance sheet) method. Under this method, the net deferred tax asset or liability is determined based on the tax effects of the temporary differences between the book and tax bases of the various balance sheet assets and liabilities and gives current recognition to changes in tax rates and laws. Deferred taxes are reduced by a valuation allowance when, in the opinion of management, it is more likely than not that some portion or all of the deferred tax assets will not be realized. When tax returns are filed, it is highly certain that some positions taken would be sustained upon examination by the taxing authorities, while others are subject to uncertainty about the merits of the position taken or the amount of the position that would be ultimately sustained. The benefit of a tax position is recognized in the financial statements in the period during which, based on all available evidence, management believes it is more likely than not that the position will be sustained upon examination, including the resolution of appeals or litigation processes, if any. Tax positions taken are not offset or aggregated with other positions. Tax positions that meet the more-likely-than-not recognition threshold are measured as the largest amount of tax benefit that is more than 50 percent likely of being realized upon settlement with the applicable taxing authority. The portion of the benefits associated with tax positions taken that exceeds the amount measured as described above is reflected as a liability for unrecognized tax benefits in the accompanying balance sheet along with any associated interest and penalties that would be payable to the taxing authorities upon examination.
| (n) | Stock Options |
The Company accounts for its stock based compensation plan under the provisions of ASC topic, Share-Based Payment which requires recognizing expense for options granted equal to the grant date fair value of the unvested amounts over their remaining vesting periods. There were 48,000 shares granted in 2010 and none granted in 2009. Future levels of compensation cost recognized related to share-based compensation awards may be impacted by new awards and/or modification, repurchases and cancellations of existing awards after the adoption of this standard.
36
| (o) | Net Income per Share |
Basic net income per share excludes dilution and is computed by dividing income available to common stockholders by the weighted-average number of common shares outstanding for the period. Diluted net income per share reflects the potential dilution that could occur if securities or other contracts to issue common stock were exercised or converted into common stock or resulted in the issuance of common stock that then shared in the earnings of the Company.
The following is a reconciliation of the numerators and denominators of the basic and diluted net income per share computations for the periods indicated:
| Year ended December 31, 2010 | Net income (numerator) |
Shares (denominator) |
Per share amount |
|||||||||
| Basic net income per share |
$ | 687 | 1,492,137 | $ | 0.46 | |||||||
| Effect of dilutive stock options |
— | — | ||||||||||
| Diluted net income per share |
$ | 687 | 1,492,137 | $ | 0.46 | |||||||
| Year ended December 31, 2009 | Net income (numerator) |
Shares (denominator) |
Per share amount |
|||||||||
| Basic net income per share |
$ | 351 | 1,485,089 | $ | 0.24 | |||||||
| Effect of dilutive stock options |
— | — | ||||||||||
| Diluted net income per share |
$ | 351 | 1,485,089 | $ | 0.24 | |||||||
| Year ended December 31, 2008 | Net income (numerator) |
Shares (denominator) |
Per share amount |
|||||||||
| Basic net income per share |
$ | 306 | 1,485,089 | $ | 0.21 | |||||||
| Effect of dilutive stock options |
— | 3,124 | ||||||||||
| Diluted net income per share |
$ | 306 | 1,488,213 | $ | 0.21 | |||||||
| (p) | Consolidated Statements of Cash Flows |
For purposes of the consolidated statements of cash flows, cash and cash equivalents include cash on hand, amounts due from banks (with original maturities of three months or less), and federal funds sold. Generally, federal funds are purchased and sold for one-day periods.
| (q) | Comprehensive Income |
ASC topic Comprehensive Income, requires the Company to classify items of “Other Comprehensive Income” (such as net unrealized gains (losses) on available-for-sale securities) by their nature in a financial statement and present the accumulated balance of other comprehensive income separately from retained earnings and additional paid-in capital in the equity section of a statement of financial position. The Company’s other comprehensive income consists of net income, and net unrealized gains (losses) on securities available-for-sale, net of income taxes, and adjustments relating to its defined benefit plan, net of income taxes.
| (r) | Fair Value Measurements |
Effective January 1, 2008, the Company adopted the provisions of ASC topic, Fair Value Measurements and Disclosures. Fair Value Measurements and Disclosures, which was issued in September 2006, establishes a framework for using fair value. It defines fair value as the price that would be received to sell an asset or paid to transfer a liability in an orderly transaction between market participants at the measurement date.
In accordance with Fair Value Measurements and Disclosures, the Company groups its financial assets and financial liabilities in three levels, based on the markets in which the assets and liabilities are traded and the reliability of the assumptions used to determine fair value. The most significant instruments that the Company measures at fair value are available-for-sale securities. All available-for-sale
37
securities fall into Level 2 fair value hierarchy. Valuation methodologies for the fair value hierarchy are as follows:
Level 1 – Valuations are based on quoted prices for identical assets and liabilities traded in active exchange markets, such as the New York Stock Exchange.
Level 2 – Valuations for assets and liabilities are obtained from readily available pricing sources via independent providers for market transactions involving similar assets or liabilities, model-based valuation techniques, or other observable inputs.
Level 3 – Valuations for assets and liabilities that are derived from other valuation methodologies, including option pricing models, discounted cash flow models and similar techniques, and are not based on market exchange, dealer, or broker traded transactions. Level 3 valuations incorporate certain assumptions and projections in determining fair value assigned to such assets and liabilities.
The following is a description of valuation methodologies used for assets and liabilities recorded at fair value.
Available-for-sale Securities
Available-for-sale securities are recorded at fair value on a recurring basis. Fair value measurement is based upon quoted prices, if available, and would in such case be included as a Level 1 asset. The Company currently carries no Level 1 securities. If quoted prices are not available, valuations are obtained from readily available pricing sources from independent providers for market transactions involving similar assets or liabilities. The Company’s principal market for these securities is the secondary institutional markets, and valuations are based on observable market data in those markets. These would be classified as Level 2 assets. The Company’s entire available-for-sale securities portfolio is classified as Level 2 securities. The Company currently carries no Level 3 securities for which fair value would be determined using unobservable inputs.
Loans
The Company does not record loans at fair value on a recurring basis. However, from time to time, a loan is considered impaired and an allowance for loan losses is established. Loans for which it is probable that payment of interest and principal will not be made in accordance with the contractual terms of the loan agreement are considered impaired. Once a loan is identified as individually impaired, management measures impairment in accordance with ASC topic, Impairment of a Loan. The fair value of impaired loans is estimated using one of several methods, including collateral value, market value of a similar debt, liquidation value and discounted cash flows. Those impaired loans not requiring an allowance represent loans at which fair value of the expected repayments or collateral exceed the recorded investments in such loans. At December 31, 2010, substantially all of the impaired loans were evaluated based on the fair value of the collateral. In accordance with Impairment of a Loan, impaired loans where an allowance is established based on the fair value of the collateral require classification in the fair value hierarchy. When the fair value of the collateral is based on an observable market price or a current appraised value, the Company records the impaired loan as a nonrecurring Level 2 asset. When an appraised value is not available or management determines the fair value of the collateral is further impaired below the appraised value and there is no observable market price, the Company records the impaired loan as a nonrecurring Level 3 asset.
Foreclosed Assets
Foreclosed assets are adjusted to fair value upon transfer of the loans to foreclosed assets. Subsequently, foreclosed assets are carried at the lower of carrying value or fair value. Fair value is based upon independent market prices, appraised values of the collateral or management’s estimation of the value of the collateral. When the fair value of the collateral is based on observable market price or a current appraised value, the Company records the foreclosed asset as a nonrecurring Level
38
2 asset. When an appraised value is not available or management determines the fair value of the collateral is further impaired below the appraised value and there is no observable market price, the Company records the foreclosed asset as a nonrecurring Level 3 asset.
Below are tables that present information about certain assets and liabilities measured at fair value:
Fair Value Measurements on December 31, 2010
| Description | Total Carrying Amount in The Consolidated Balance Sheet 12/31/2010 |
Assets/Liabilities Measured at Fair Value 12/31/2010 |
Quoted Prices (Level 1) |
Significant Other Observable Inputs (Level 2) |
Significant Unobservable Inputs (Level 3) |
|||||||||||||||
| Available-for-sale securities |
$ | 22,048 | $ | 22,048 | NA | $ | 22,048 | NA | ||||||||||||
| Impaired loans (nonrecurring) |
$ | 7,073 | $ | 7,073 | NA | NA | $ | 7,073 | ||||||||||||
| Foreclosed assets (nonrecurring) |
$ | 474 | $ | 474 | NA | NA | $ | 474 | ||||||||||||
Fair Value Measurements on December 31, 2009
| Description | Total Carrying Amount in The Consolidated Balance Sheet 12/31/2009 |
Assets/Liabilities Measured at Fair Value 12/31/2009 |
Quoted Prices in Active Markets for Identical Assets (Level 1) |
Significant Other Observable Inputs (Level 2) |
Significant Unobservable Inputs (Level 3) |
|||||||||||||||
| Available-for-sale securities |
$ | 19,105 | 19,105 | NA | $ | 19,105 | NA | |||||||||||||
| Impaired loans (nonrecurring) |
$ | 4,478 | $ | 4,478 | NA | NA | $ | 4,478 | ||||||||||||
| Foreclosed assets (nonrecurring) |
$ | 461 | $ | 461 | NA | NA | $ | 461 | ||||||||||||
39
The following table sets forth a summary of changes in the fair value of the Company’s nonrecurring Level 3 assets for the year ended December 31, 2010:
| Year Ended December 31, 2010 | ||||||||
| Impaired Loans |
Foreclosed Assets |
|||||||
| Balance, beginning of the year |
$ | 4,478 | $ | 461 | ||||
| Realized gains/(losses) |
— | — | ||||||
| Unrealized gains/(losses) relating to instruments still held at the reporting date |
— | — | ||||||
| Purchases, sales, issuances, and settlements (net) |
2,595 | 13 | ||||||
| Balance, end of year |
$ | 7,073 | $ | 474 | ||||
| (s) | Use of Estimates |
In preparing the consolidated financial statements in accordance with GAAP, management is required to make estimates and assumptions that affect the reported amounts of assets and liabilities as of the dates of the consolidated balance sheets and revenues and expenses for the years ended December 31, 2010, 2009 and 2008. Actual results could differ from those estimates. Material estimates that are particularly susceptible to significant changes in the near term relate to the determination of the allowance for loan losses.
| (t) | Current Accounting Developments |
In January 2010, the FASB issued Accounting Standards Update (“ASU”) 2010-06, Improving Disclosures about Fair Value Measurements, to amend existing guidance in ASC 820, Fair Value Measurements and Disclosures, to expand and clarify existing disclosures regarding recurring and nonrecurring fair value measurements. The amended guidance in ASC 820 is effective for interim and annual reporting periods beginning after December 15, 2009. The amended guidance in ASU 2010-06 had no impact on the Company’s consolidated financial statements.
In September 2009, the FASB issued ASU 2009-12, Investments in Certain Entities That Calculate Net Asset Value per Share (or Its Equivalent), to amend the existing guidance in ASC 820 for measuring the fair value of investments in certain entities that do not have a quoted market price but calculate net asset value (“NAV”) per share or its equivalent. As a practical expedient, the amendments in ASU 2009-12 permit, but do not require, a reporting entity to measure the fair value of an investment in an investee within the scope of the amendments in the ASU based on the investee’s NAV per share or its equivalent. The amended guidance in ASC 820 is effective for interim and annual periods ending after December 15, 2009. The amended guidance in ASU 2009-12 had no impact on the Company’s consolidated financial statements.
In August 2009, the FASB issued ASU 2009-05, Measuring Liabilities at Fair Value, to amend ASC 820 to clarify how entities should estimate the fair value of liabilities. ASC 820, as amended, includes clarifying guidance for circumstances in which a quoted price in an active market is not available, the effect of the existence of liability transfer restrictions, and the effect of quoted prices for the identical liability, including when the identical liability is traded as an asset. The amended guidance in ASC 820 on measuring liabilities at fair value is effective for the first interim or annual reporting period beginning after August 26, 2009. The amended guidance in ASU 2009-05 had no impact on the Company’s consolidated financial statements.
In June 2009, the FASB issued SFAS No. 168, The FASB Accounting Standards Codification™ and the Hierarchy of Generally Accepted Accounting Principles. This Statement was incorporated into ASC 105 and became the source of authoritative accounting principles recognized by the FASB to be
40
applied by nongovernmental entities in the preparation of financial statements in conformity with GAAP. Rules and interpretative releases of the Securities and Exchange Commission (“SEC”) under authority of federal securities law are also sources of authoritative GAAP for SEC registrants. ASC 105 became effective for the quarterly period ended September 30, 2009, and adoption had no impact on the Company’s consolidated financial statements.
In June 2009, the FASB issued SFAS No. 166, Accounting for Transfers of Financial Assets-an amendment of FASB Statement No. 140. This Statement was incorporated into ASC 860 and removes the concept of qualifying special-purpose entity and limits the circumstances in which a financial asset, or portion of a financial asset, should be derecognized when the transferor has not transferred the entire financial asset to an entity that is not consolidated with the transferor in the financial statements being presented and/or when the transferor has continuing involvement with the transferred financial asset. The Statement is effective for annual reporting periods beginning after November 15, 2009 and interim and annual reporting periods thereafter. Adoption had no impact on the Company’s consolidated financial statements.
In April 2009, the FASB issued Staff Position (“FSP”) FAS 157-4, Determining the Fair Value of a Financial Asset When the Volume and Level of Activity for the Asset or Liability Have Significantly Decreased and Identifying Transactions That Are Not Orderly. This FSP was incorporated into ASC 820 and provides additional guidance for estimating fair value when the volume and level of activity for the asset or liability have significantly decreased and also provides guidance on identifying circumstances that indicate the transaction is not orderly. Provisions of this FSP incorporated into ASC 820 became effective for the quarterly period ended June 30, 2009, and adoption had no impact on the Company’s consolidated financial statements.
In April 2009, the FASB issued FSP FAS 115-2 and FAS 124-2, Recognition and Presentation of Other-Than-Temporary Impairments. This FSP was incorporated into ASC 320 and amends the presentation of other-than-temporary impairments on debt and equity securities in the financial statements. The FSP did not amend existing recognition and measurement guidance related to other-than-temporary impairments of equity securities. Provisions of this FSP incorporated into ASC 320 became effective for the quarterly period ended June 30, 2009, and adoption had no impact on the Company’s consolidated financial statements.
In March 2008, the FASB issued SFAS No. 161, Disclosures about Derivative Instruments and Hedging Activities-an amendment of FASB Statement No. 133. This Statement was incorporated into ASC 815 and is intended to improve financial reporting about derivative instruments and hedging activities by requiring enhanced disclosures to enable investors to better understand their effects on an entity’s financial condition, financial performance, and cash flows. Provisions of this Statement incorporated into ASC 815 became effective for the quarterly period ended March 31, 2009, and adoption had no impact on the Company’s consolidated financial statements.
ASC Topic 310 “Receivables.” New authoritative accounting guidance under ASC Topic 310, “Receivables,” amended prior guidance to provide a greater level of disaggregated information about the credit quality of loans and leases and the Allowance for Loan and Lease Losses (the “Allowance”). The new authoritative guidance also requires additional disclosures related to credit quality indicators, past due information, and information related to loans modified in a troubled debt restructuring. The new authoritative guidance amends only the disclosure requirements for loans and leases and the allowance. The Company adopted the period end disclosures provisions of the new authoritative guidance under ASC Topic 310 in the reporting period ending December 31, 2010. Adoption of the new guidance did not have an impact on the Company’s statements of income and financial condition. The disclosures about activity that occurs will be effective for reporting periods after January 1, 2011, and will have no impact on the Company’s statements of income and financial condition.
41
FASB ASC 310 Receivables, Sub-Topic 310-30 Loans and Debt Securities Acquired with Deteriorated Credit Quality (“Subtopic 310-30”) was amended to clarify that modifications of loans that are accounted for within a pool under Subtopic 310-30 do not result in the removal of those loans from the pool even if the modification would otherwise be considered a troubled debt restructuring. The amendments do not affect the accounting for loans under the scope of Subtopic 310-30 that are not accounted for within pools. Loans accounted for individually under Subtopic 310-30 continue to be subject to the troubled debt restructuring accounting provisions within ASC 310 Subtopic 310-40 Troubled Debt Restructurings by Creditors. The new authoritative accounting guidance under Subtopic 310-30 became effective in the third quarter of 2010 and did not have an impact on the Company’s financial statements.
| (2) | Restrictions on Cash |
To comply with Federal Reserve regulations, the Company is required to maintain certain average reserve balances. The daily average reserve requirements were approximately $4,731 and $4,300 for the weeks including December 31, 2010 and 2009, respectively.
| (3) | Securities |
The amortized costs, gross unrealized gains, gross unrealized losses and fair values for securities at December 31, 2010 and 2009 are as follows:
42
| 2010 | ||||||||||||||||
| Available-for-Sale | Amortized costs |
Gross unrealized gains |
Gross unrealized losses |
Fair values |
||||||||||||
| U.S. Treasury securities and obligations of U.S. Government corporations and agencies |
$ | 17,247 | 168 | (219 | ) | 17,196 | ||||||||||
| Obligations of states and political subdivisions |
3,381 | 90 | — | 3,471 | ||||||||||||
| Mortgage-backed securities-government |
1,211 | 60 | — | 1,271 | ||||||||||||
| Other securities |
110 | — | — | 110 | ||||||||||||
| Total available-for-sale |
$ | 21,949 | 318 | (219 | ) | 22,048 | ||||||||||
| 2010 | ||||||||||||||||
| Held-to-Maturity | Amortized costs |
Gross unrealized gains |
Gross unrealized losses |
Fair values |
||||||||||||
| Obligations of states and political subdivisions |
$ | 4,469 | 34 | (103 | ) | 4,400 | ||||||||||
| 2009 | ||||||||||||||||
| Available-for-Sale | Amortized costs |
Gross unrealized gains |
Gross unrealized losses |
Fair values |
||||||||||||
| U.S. Treasury securities and obligations of U.S. Government corporations and agencies |
$ | 11,532 | 66 | (18 | ) | 11,580 | ||||||||||
| Obligations of states and political subdivisions |
4,728 | 128 | (17 | ) | 4,839 | |||||||||||
| Corporate securities |
1,000 | 3 | — | 1,003 | ||||||||||||
| Mortgage-backed securities – government |
1,514 | 59 | — | 1,573 | ||||||||||||
| Other securities |
110 | — | — | 110 | ||||||||||||
| Total available-for-sale |
$ | 18,884 | 256 | (35 | ) | 19,105 | ||||||||||
| 2009 | ||||||||||||||||
| Held-to-Maturity | Amortized costs |
Gross unrealized gains |
Gross unrealized losses |
Fair values |
||||||||||||
| Obligations of states and political subdivisions |
$ | 1,051 | 27 | — | 1,078 | |||||||||||
The following table shows the gross unrealized losses and fair value of the Company’s investments, aggregated by investment category and length of time that individual securities have been in a continuous unrealized loss position, at December 31, 2010:
| Less than 12 months | 12 months or more | Total | ||||||||||||||||||||||
| Description of Securities | Fair value |
Gross unrealized losses |
Fair value |
Gross unrealized losses |
Fair value |
Gross Unrealized losses |
||||||||||||||||||
| U.S. Treasury securities and obligations of U.S. Government corporations and agencies |
$ | 7,106 | 219 | — | — | 7,106 | 219 | |||||||||||||||||
| Obligations of states and political subdivisions |
2,859 | 103 | — | — | 2,859 | 103 | ||||||||||||||||||
| Total temporarily impaired securities |
$ | 9,965 | 322 | — | — | 9,965 | 322 | |||||||||||||||||
43
The Company does not consider the unrealized losses other-than-temporary losses based on the volatility of the securities market price involved, the credit quality of the securities, and the Company’s ability, if necessary, to hold the securities until maturity. The securities include 13 bonds that have continuous losses for less than 12 months and no bonds that have continuous losses for more than 12 months. The $9,965 in securities in which there is an unrealized loss of $322 includes unrealized losses ranging from less than $4 to $46 or from 0.67% to 5.37% of the original cost of the investment. Gross realized gains on securities sold in 2010 totaled $0 and $33 in 2009 and $0 in 2008. There were no gross realized losses on securities sold in 2010, 2009 and 2008.
The following table shows the gross unrealized losses and fair value of the Company’s investments, aggregated by investment category and length of time that individual securities have been in a continuous unrealized loss position, at December 31, 2009:
| Less than 12 months | 12 months or more | Total | ||||||||||||||||||||||
| Description of Securities | Fair value |
Gross unrealized losses |
Fair value |
Gross unrealized losses |
Fair value |
Gross Unrealized losses |
||||||||||||||||||
| U.S. Treasury securities and obligations of U.S. Government corporations and agencies |
$ | 4,099 | 18 | — | — | 4,099 | 18 | |||||||||||||||||
| Obligations of states and political subdivisions |
1,060 | 17 | — | — | 1,060 | 17 | ||||||||||||||||||
| Total temporarily impaired securities |
$ | 5,159 | 35 | — | — | 5,159 | 35 | |||||||||||||||||
The Company does not consider the unrealized losses other-than-temporary losses based on the volatility of the securities market price involved, the credit quality of the securities, and the Company’s ability if necessary, to hold the securities until maturity. The securities include 10 bonds that have continuous losses for less than 12 months and no bonds that have continuous losses for more than 12 months. The $5,159 in securities in which there is an unrealized loss of $35 includes unrealized losses ranging from less than $1 to $15 or from 0.01% to 3.39% of the original cost of the investment.
The amortized costs and fair values of available-for-sale and held-to-maturity securities at December 31, 2010, by contractual maturity, are shown below. Actual maturities may differ from contractual maturities because borrowers may have the right to call or prepay obligations with or without call or prepayment penalties.
| 2010 | ||||||||||||||||
| Available-for-Sale | Held-to-Maturity | |||||||||||||||
| Amortized costs |
Fair values |
Amortized costs |
Fair values |
|||||||||||||
| Due in one year or less |
$ | 1,392 | 1,416 | — | — | |||||||||||
| Due after one year through five years |
15,829 | 15,943 | 2,836 | 2,852 | ||||||||||||
| Due after five years through ten years |
3,030 | 2,923 | 1,633 | 1,548 | ||||||||||||
| Due after ten years |
487 | 495 | — | — | ||||||||||||
| 20,738 | 20,777 | 4,469 | 4,400 | |||||||||||||
| Mortgage-backed securities |
1,211 | 1,271 | — | — | ||||||||||||
| Totals |
$ | 21,949 | 22,048 | 4,469 | 4,400 | |||||||||||
Securities with amortized costs of approximately $3,364 and $3,328 (fair values of $3,460 and $3,416, respectively) as of December 31, 2010 and 2009, respectively, were pledged as collateral for public deposits and to the Federal Reserve for overdraft protection and treasury tax and loan.
44
| (4) | Loans |
A summary of loans at December 31, 2010 and 2009 follows:
| 2010 | 2009 | |||||||
| Real estate loans: |
||||||||
| Residential-mortgage |
$ | 103,998 | 106,619 | |||||
| Residential-construction |
7,371 | 9,640 | ||||||
| Commercial |
87,216 | 81,219 | ||||||
| Loans to individuals for household, family and other consumer expenditures |
47,545 | 50,097 | ||||||
| Commercial and industrial loans |
22,794 | 21,589 | ||||||
| All other loans |
262 | 612 | ||||||
| Total loans, gross |
269,186 | 269,776 | ||||||
| Less unearned income and fees |
(119 | ) | (149 | ) | ||||
| Loans, net of unearned income and fees |
269,067 | 269,627 | ||||||
| Less allowance for loan losses |
(4,037 | ) | (3,723 | ) | ||||
| Loans, net |
$ | 265,030 | 265,904 | |||||
Nonaccrual loans amounted to approximately $7,073 and $2,619 at December 31, 2010 and 2009, respectively. There were no commitments to lend additional funds to customers whose loans were on nonaccrual status at December 31, 2010.
In the normal course of business, the Bank has made loans to executive officers and directors. At December 31, 2010, loans to executive officers and directors totaled $195 compared to $764 at December 31, 2009. During 2010, new loans made to executive officers and directors totaled $55 and repayments amounted to approximately $234. Loans to companies in which executive officers and directors have an interest amounted to $0 and $374 at December 31, 2010 and 2009, respectively. One director, which had outstanding personal loans and loans to companies in which the director has an interest, retired during 2010. All such loans were made in the ordinary course of business on substantially the same terms and conditions, including interest rates and collateral, as those prevailing at the same time for comparable transactions with unrelated persons, and, in the opinion of management, do not involve more than normal risk of collectability or present other unfavorable features.
Activity in the allowance for loan losses for the years ended December 31, 2010, 2009 and 2008 is summarized as follows:
| 2010 | 2009 | 2008 | ||||||||||
| Balances at beginning of year |
$ | 3,723 | 3,969 | 1,720 | ||||||||
| Provision for loan losses |
1,878 | 1,530 | 2,881 | |||||||||
| Loans charged off |
(1,765 | ) | (2,057 | ) | (805 | ) | ||||||
| Loan recoveries |
201 | 281 | 173 | |||||||||
| Balances at end of year |
$ | 4,037 | 3,723 | 3,969 | ||||||||
At December 31, 2010, 2009 and 2008, the recorded investment in loans for which impairment has been identified totaled approximately $7,073, $2,619 and $2,292, respectively, with corresponding valuation allowances of approximately $29, $318 and $543, respectively. The average recorded investment in impaired loans receivable during 2010, 2009 and 2008 was approximately $6,513, $4,194 and $1,609, respectively. Interest income recognized on a cash basis on impaired loans during 2010, 2009 and 2008 was approximately $307, $354 and $278, respectively.
45
The following table represents an age analysis of the Company’s past due loans:
Age Analysis of Past Due Loans
As of December 31, 2010
| 30-59 Days Past Due |
60-69 Days Past Due |
Greater Than 90 Days |
Total Past Due |
Current | Total Loans |
Recorded Investment> 90 Days and Accruing |
||||||||||||||||||||||
| Commercial |
$ | 96 | $ | 51 | $ | 13 | $ | 160 | $ | 22,634 | $ | 22,794 | $ | — | ||||||||||||||
| Commercial real estate |
— | 377 | 292 | 669 | 53,216 | 53,885 | — | |||||||||||||||||||||
| Consumer |
394 | 144 | 90 | 628 | 47,179 | 47,807 | 38 | |||||||||||||||||||||
| Residential |
2,235 | 415 | 7,448 | 10,098 | 134,602 | 144,700 | 732 | |||||||||||||||||||||
| Total |
$ | 2,725 | $ | 987 | $ | 7,843 | $ | 11,555 | $ | 257,631 | $ | 269,186 | $ | 770 | ||||||||||||||
The following presents information on the Company’s nonaccrual loans:
Loans in Nonaccrual Status
As of December 31, 2010
| 2010 | ||||
| Commercial |
$ | 13 | ||
| Commercial real estate |
292 | |||
| Consumer |
52 | |||
| Residential |
6,716 | |||
| Total |
$ | 7,073 | ||
| (5) | Bank Premises and Equipment |
Bank premises and equipment, net were comprised of the following as of December 31, 2010 and 2009:
| 2010 | 2009 | |||||||
| Land improvements |
$ | 521 | 453 | |||||
| Buildings |
6,036 | 6,036 | ||||||
| Equipment, furniture and fixtures |
4,507 | 4,349 | ||||||
| 11,064 | 10,838 | |||||||
| Less accumulated depreciation |
(5,812 | ) | (5,290 | ) | ||||
| 5,252 | 5,548 | |||||||
| Land |
1,680 | 1,680 | ||||||
| Bank premises and equipment, net |
$ | 6,932 | 7,228 | |||||
46
| (6) | Deposits |
A summary of deposits at December 31, 2010 and 2009 follows:
| 2010 | 2009 | |||||||
| Noninterest-bearing demand deposits |
$ | 31,184 | 32,276 | |||||
| Interest-bearing: |
||||||||
| Savings and money market accounts |
52,309 | 46,225 | ||||||
| NOW accounts |
65,635 | 57,220 | ||||||
| Time deposits – under $100,000 |
108,582 | 114,404 | ||||||
| Time deposits – $100,000 and over |
49,244 | 51,994 | ||||||
| Total interest-bearing deposits |
275,770 | 269,843 | ||||||
| Total deposits |
$ | 306,954 | 302,119 | |||||
At December 31, 2010, the scheduled maturity of time deposits is as follows: $61,700 in 2011; $12,395 in 2012; $40,046 in 2013; $19,335 in 2014 and $24,350 in 2015.
In the normal course of business, the Bank has received deposits from executive officers and directors. At December 31, 2010 and 2009, deposits from executive officers and directors were approximately $3,476 and $3,692, respectively. All such deposits were received in the ordinary course of business on substantially the same terms and conditions, including interest rates, as those prevailing at the same time for comparable transactions with unrelated persons.
| (7) | Employee Benefit Plans |
The Bank maintains a noncontributory defined benefit pension plan that covers substantially all of its employees. Benefits are computed based on employees’ average final compensation and years of credited service. Pension expense amounted to approximately $340, $427 and $358 in 2010, 2009 and 2008, respectively. The change in benefit obligation, change in plan assets and funded status of the pension plan at December 31, 2010, 2009 and 2008 and pertinent assumptions are as follows:
47
| Pension Benefits | ||||||||||||
| Change in Benefit Obligation | 2010 | 2009 | 2008 | |||||||||
| Benefit obligation at beginning of year |
$ | 6,253 | 5,814 | 5,440 | ||||||||
| Service cost |
308 | 264 | 482 | |||||||||
| Interest cost |
371 | 347 | 423 | |||||||||
| Actuarial (gain) loss |
231 | 21 | (519 | ) | ||||||||
| Benefits paid |
(466 | ) | (193 | ) | (12 | ) | ||||||
| Benefit obligation at end of year |
$ | 6,697 | 6,253 | 5,814 | ||||||||
| Change in Plan Assets |
||||||||||||
| Fair value of plan assets at beginning of year |
4,865 | 3,847 | 5,491 | |||||||||
| Actual return on plan assets |
625 | 1,210 | (2,031 | ) | ||||||||
| Employer contribution |
— | — | 400 | |||||||||
| Benefit paid |
(466 | ) | (193 | ) | (12 | ) | ||||||
| Fair value of plan assets at end of year |
$ | 5,024 | 4,864 | 3,848 | ||||||||
| Funded Status at the End of the Year |
(1,673 | ) | (1,388 | ) | (1,966 | ) | ||||||
| Amounts Recognized in the Balance Sheet |
||||||||||||
| Other liabilities, accrued pension |
(1,673 | ) | (1,388 | ) | (1,966 | ) | ||||||
| Other assets, prepaid pension |
$ | — | — | — | ||||||||
| Amounts Recognized in Accumulated Other Comprehensive Income Net of Tax Effect |
||||||||||||
| Unrecognized net actuarial loss |
814 | 846 | 1,500 | |||||||||
| Prior service cost |
— | 3 | 6 | |||||||||
| Net obligation in transition |
— | 2 | 5 | |||||||||
| Benefit obligation included in accumulated other comprehensive income |
$ | 814 | 851 | 1,511 | ||||||||
| Funded Status |
||||||||||||
| Benefit obligation |
(6,697 | ) | (6,253 | ) | (5,814 | ) | ||||||
| Fair value of assets |
5,024 | 4,864 | 3,848 | |||||||||
| Unrecognized net actuarial (gain) loss |
1,233 | 1,282 | 2,274 | |||||||||
| Unrecognized net obligation at transition |
— | 4 | 7 | |||||||||
| Unrecognized prior service cost |
— | 4 | 8 | |||||||||
| (Accrued)/prepaid benefit cost included in the balance sheet |
$ | (440 | ) | (99 | ) | 323 | ||||||
| Pension Benefits | ||||||||||||
| Weighted Average Assumptions as of December 31, 2010 and 2009 and September 30, 2008: |
2010 | 2009 | 2008 | |||||||||
| Discount rate |
5.50 | % | 6.00 | % | 6.25 | % | ||||||
| Expected long-term return on plan assets |
8.00 | % | 8.00 | % | 8.50 | % | ||||||
| Rate of compensation increase |
4.00 | % | 4.00 | % | 4.00 | % | ||||||
| Pension Benefits | ||||||||||||
| 2010 | 2009 | 2008 | ||||||||||
| Other Changes in Plan Assets and Benefit Obligation Recognized in Other Comprehensive Income Net of Tax Effect |
||||||||||||
| Net (gain)/loss |
$ | (32 | ) | (654 | ) | 1,403 | ||||||
| Prior service cost |
— | — | — | |||||||||
| Amortization of prior service cost |
(3 | ) | (3 | ) | (4 | ) | ||||||
| Net obligation at transition |
— | — | — | |||||||||
| Amortization of net obligation at transition |
(2 | ) | (3 | ) | (3 | ) | ||||||
| Total recognized in other comprehensive income |
$ | (37 | ) | (660 | ) | 1,396 | ||||||
48
| Total Recognized in Net Periodic Benefit Cost and Other Comprehensive Income |
$ | 285 | (578 | ) | 1,639 |
The estimated portion of prior service cost and net transition obligation included in accumulated other comprehensive income that will be recognized as a component of net periodic pension cost over the next fiscal year are $4 and $3, respectively.
The Company selects the expected long-term rate-of-return-on-assets assumption in consultation with its investment advisors and actuary. This rate is intended to reflect the average rate of return expected to be earned on the funds invested or to be invested to provide plan benefits. Historical performance is reviewed – especially with respect to real rates of return (net of inflation) – for the major asset classes held or anticipated to be held by the trust, and for the trust itself. Undue weight is not given to recent experience, which may not continue over the measurement period, and higher significance is placed on current forecasts of future long-term economic conditions.
Because assets are held in a qualified trust, anticipated returns are not reduced for taxes. Further – solely for this purpose – the plan is assumed to continue in force and not terminate during the period during which assets are invested. However, consideration is given to the potential impact of current and future investment policy, cash flow into and out of the trust, and expenses (both investment and non-investment) typically paid from plan assets (to the extent such expenses are not explicitly estimated within periodic cost).
The components of net pension benefit cost under the plan for the years ended December 31, 2010, 2009 and 2008 is summarized as follows:
| Pension Benefits | ||||||||||||
| 2010 | 2009 | 2008 | ||||||||||
| Service cost |
$ | 308 | 265 | 529 | ||||||||
| Interest cost |
371 | 347 | 424 | |||||||||
| Expected return on plan assets |
(383 | ) | (306 | ) | (613 | ) | ||||||
| Net amortization |
6 | 9 | 11 | |||||||||
| Recognized net actuarial loss |
38 | 108 | — | |||||||||
| Net pension benefit cost |
$ | 340 | 423 | 351 | ||||||||
Projected Benefit Payments
The projected benefit payments under the plan are summarized as follows for the years ending December 31:
| 2011 |
$ | 131 | ||
| 2012 |
144 | |||
| 2013 |
166 | |||
| 2014 |
190 | |||
| 2015 |
215 | |||
| 2016-2020 |
2,026 | |||
Plan Asset Allocation
Plan assets are held in a pooled pension trust fund administered by the Virginia Bankers Association. The pooled pension trust fund is sufficiently diversified to maintain a reasonable level of risk without
49
imprudently sacrificing return, with a targeted asset allocation of 20% fixed income and 80% equities. The Investment Manager selects investment fund managers with demonstrated experience and expertise, and funds with demonstrated historical performance, for the implementation of the pension plan’s investment strategy. The Investment Manager will consider both actively and passively managed investment strategies and will allocate funds across the asset classes to develop an efficient investment structure.
It is the responsibility of the Virginia Bankers Association to administer the investments of the pooled pension trust fund within reasonable costs, being careful to avoid sacrificing quality. These costs include, but are not limited to, management and custodial fees, consulting fees, transaction costs and other administrative costs.
The asset or liability’s fair value measurement level within the fair value hierarchy is based on the lowest level of any input that is significant to the fair value measurement. Valuation techniques used need to maximize the use of observable inputs and minimize the use of unobservable inputs. Following is a description of the valuation methodologies used for assets measured at fair value.
Mutual funds-fixed income and equity funds: Valued at the net asset value of shares held at year-end.
Cash and equivalents: Valued at cost which approximates fair value.
The preceding methods described may produce a fair value calculation that may not be indicative of net realizable value or reflective of future fair values. Furthermore, although the Company believes its valuation methods are appropriate and consistent with other market participants, the use of different methodologies or assumptions to determine fair value of certain financial instruments could result in a different fair value measurement as of December 31, 2010.
The following table presents the fair value of the assets, by asset category, at December 31, 2010 and 2009.
| 2010 | 2009 | |||||||
| Cash and equivalents |
$ | — | $ | 23 | ||||
| Mutual funds-fixed income |
1,055 | 1,147 | ||||||
| Mutual funds-equity |
3,969 | 3,694 | ||||||
| Total assets at fair value |
$ | 5,024 | $ | 4,864 | ||||
The following table sets forth by level, within the fair value hierarchy, the assets carried at fair value as of December 31, 2010.
| Assets at Fair Value as of December 31, 2010 | ||||||||||||||||
| Level 1 | Level 2 | Level 3 | Total | |||||||||||||
| Cash and equivalents |
$ | — | $ | — | $ | — | $ | — | ||||||||
| Mutual funds-fixed income |
1,055 | — | — | 1,055 | ||||||||||||
| Mutual funds-equity |
3,969 | — | — | 3,969 | ||||||||||||
| Total assets at fair value |
$ | 5,024 | $ | — | $ | — | $ | 5,024 | ||||||||
Contributions
The Company expects to contribute $750 to its pension plan in 2011.
The Company also has a 401(k) plan under which the Company matches employee contributions to the plan. In 2010 and 2009, the Company matched 100% of the first 1% of salary deferral and 50% of the next 5% of salary deferral to the 401(k) savings provision. The amount expensed for the 401(k) plan was $110 during the year ended December 31, 2010 and $108 during the year ended December 31, 2009.
50
| (8) | Income Taxes |
Income tax expense (benefit) attributable to income before income tax expense for the years ended December 31, 2010, 2009 and 2008 is summarized as follows:
| 2010 | 2009 | 2008 | ||||||||||
| Current |
$ | 612 | (112 | ) | 740 | |||||||
| Deferred |
(304 | ) | 212 | (668 | ) | |||||||
| Total income tax expense |
$ | 308 | 100 | 72 | ||||||||
Reported income tax expense for the years ended December 31, 2010, 2009 and 2008 differed from the amounts computed by applying the U.S. Federal income tax rate of 34% to income before income tax expense as a result of the following:
| 2010 | 2009 | 2008 | ||||||||||
| Computed “expected” income tax expense |
$ | 338 | 154 | 129 | ||||||||
| Increase (reduction) in income tax expense resulting from: |
||||||||||||
| Tax-exempt interest |
(39 | ) | (71 | ) | (80 | ) | ||||||
| Disallowance of interest expense |
4 | 7 | 10 | |||||||||
| Other, net |
5 | 10 | 13 | |||||||||
| Reported income tax expense |
$ | 308 | 100 | 72 | ||||||||
The tax effects of temporary differences that give rise to significant portions of the deferred tax assets and deferred tax liabilities at December 31, 2010 and 2009 are as follows:
| 2010 | 2009 | |||||||
| Deferred tax assets: |
||||||||
| Loans, principally due to allowance for loan losses |
$ | 1,066 | 1,020 | |||||
| Defined benefit plan valuation adjustments |
419 | 438 | ||||||
| Accrued pension, due to actual pension contributions in excess of accrual for financial reporting purposes |
— | 34 | ||||||
| Loans, due to unearned fees, net |
23 | 27 | ||||||
| Other |
295 | 66 | ||||||
| Total gross deferred tax assets |
1,803 | 1,585 | ||||||
| Deferred tax liabilities: |
||||||||
| Bank premises and equipment, due to differences in depreciation |
(244 | ) | (199 | ) | ||||
| Net unrealized gains on available-for-sale securities |
(34 | ) | (75 | ) | ||||
| Other |
(176 | ) | (289 | ) | ||||
| Total gross deferred tax liabilities |
(454 | ) | (563 | ) | ||||
| Net deferred tax asset, included in other assets |
$ | 1,349 | 1,022 | |||||
The Bank has determined that a valuation allowance for the gross deferred tax assets is not necessary at December 31, 2010, 2009 and 2008, since realization of the entire gross deferred tax assets can be supported by the amounts of taxes paid during the carryback periods available under current tax laws.
The Company adopted the provisions of ASC topic, Income Taxes, on January 1, 2007 with no impact on the financial statements. The Company did not recognize any interest or penalties related to income tax during the years ended December 31, 2009 and 2010, and did not accrue any interest or penalties as of December 31, 2009 or 2010. The Company does not have an accrual for uncertain tax positions as deductions taken and benefits accrued are based on widely understood administrative practices and procedures and are based on clear and unambiguous tax law. Tax returns for all years 2007 and thereafter are subject to future examination by tax authorities.
51
| (9) | Financial Instruments with Off-Balance-Sheet Risk |
The Company is a party to financial instruments with off-balance-sheet risk in the normal course of business to meet the financing needs of its customers. These financial instruments include commitments to extend credit and standby letters of credit. These instruments may involve, to varying degrees, credit risk in excess of the amount recognized in the balance sheets. The contract amounts of these instruments reflect the extent of involvement the Bank has in particular classes of financial instruments.
Credit risk is defined as the possibility of sustaining a loss because the other parties to a financial instrument fail to perform in accordance with the terms of the contract. The Company’s maximum exposure to credit loss under commitments to extend credit and standby letters of credit is represented by the contractual amount of these instruments. The Company uses the same credit policies in making commitments and conditional obligations as it does for on-balance-sheet instruments.
The Company requires collateral to support financial instruments when it is deemed necessary. The Bank evaluates such customers’ creditworthiness on a case-by-case basis. The amount of collateral obtained upon extension of credit is based on management’s credit evaluation of the counterparty. Collateral may include deposits held in financial institutions, U.S. Treasury securities, other marketable securities, real estate, accounts receivable, inventory, and property, plant and equipment.
Financial instruments whose contract amounts represent credit risk:
| Contract amounts at December 31, |
||||||||
| 2010 | 2009 | |||||||
| Commitments to extend credit |
$ | 56,910 | 47,515 | |||||
| Standby letters of credit |
$ | 1,237 | 1,203 | |||||
Commitments to extend credit are agreements to lend to a customer as long as there is no violation of any condition established in the contract. Commitments generally have fixed expiration dates or other termination clauses and may require payment of a fee. Since many of the commitments are expected to expire without being drawn upon, the total commitment amounts do not necessarily represent future cash requirements.
Standby letters of credit are conditional commitments issued by the Bank to guarantee the performance of a customer to a third party. These guarantees are primarily issued to support public and private borrowing arrangements, including bond financing and similar transactions. Unless renewed, substantially all of the Company’s standby letters of credit commitments at December 31, 2010 will expire within one year. Management does not anticipate any material losses as a result of these transactions. The credit risk involved in issuing letters of credit is essentially the same as that involved in extending loans to customers.
| (10) | Leases |
The Company leases premises and equipment under various operating lease agreements. Generally, operating leases provide for one or more renewal options on the same basis as current rental terms. Certain leases require increased rentals under cost-of-living escalation clauses. The following are future minimum lease payments as required under the agreements:
| Year |
Payments | |||
| 2011 |
$ | 199 | ||
| 2012 |
185 | |||
| 2013 |
141 | |||
| 2014 |
141 | |||
| 2015 |
141 | |||
| After 2015 |
2,010 | |||
| Total |
$ | 2,817 | ||
52
The Company entered into a lease of the Amherst branch facility with an entity in which a director of the Company has a 50% ownership interest in 2009. The original term of the lease is twenty years and may be renewed at the Company’s option for two additional terms of five years each. The Company’s current rental payment under the lease is $130 annually.
| (11) | Concentrations of Credit Risk |
The Company grants commercial, residential and consumer loans to customers primarily in the central Virginia area. The Company has a diversified loan portfolio that is not dependent upon any particular economic sector. As a whole, the portfolio is affected by general economic conditions in the central Virginia region.
The Company’s commercial and real estate loan portfolios are diversified, with no significant concentrations of credit other than the geographic focus on the central Virginia region. The installment loan portfolio consists of consumer loans primarily for automobiles and other personal property. Overall, the Company’s loan portfolio is not concentrated within a single industry or group of industries, the loss of any one or more of which would generate a materially adverse impact on the business of the Company.
The Company has established operating policies relating to the credit process and collateral in loan originations. Loans to purchase real and personal property are generally collateralized by the related property. Credit approval is principally a function of collateral and the evaluation of the creditworthiness of the borrower based on available financial information.
At times, the Company may have cash and cash equivalents at a financial institution in excess of insured limits. The Company places its cash and cash equivalents with high credit quality financial institutions whose credit rating is monitored by management to minimize credit risk.
| (12) | Dividend Restrictions and Capital Requirements |
Bankshares’ principal source of funds for dividend payments is dividends received from its subsidiary Bank. For the years ended December 31, 2010 and 2009, dividends from the subsidiary Bank totaled $338 and $420, respectively.
Substantially all of Bankshares’ retained earnings consist of undistributed earnings of its subsidiary Bank, which are restricted by various regulations administered by federal banking regulatory agencies. Under applicable federal laws, the Comptroller of the Currency restricts, without prior approval, the total dividend payments of the Bank in any calendar year to the net profits of that year, as defined, combined with the retained net profits for the two preceding years. At December 31, 2010, retained net profits of the Bank that were free of such restriction approximated $1,269.
Bankshares and the Bank are subject to various regulatory capital requirements administered by the federal banking agencies. Failure to meet minimum capital requirements can initiate certain mandatory and possibly additional discretionary actions by regulators that, if undertaken, could have a direct material effect on Bankshares’ consolidated financial statements. Under capital adequacy guidelines and the regulatory framework for prompt corrective action, Bankshares and the Bank must meet specific capital guidelines that involve quantitative measures of their assets, liabilities and certain off-balance-sheet items as calculated under regulatory accounting practices. Bankshares and the Bank’s capital amounts and classification are also subject to qualitative judgments by the regulators about components, risk weightings and other factors.
Quantitative measures established by regulation to ensure capital adequacy require Bankshares and the Bank to maintain minimum amounts and ratios (set forth in the table below) of total and Tier 1 capital (as defined in the regulations) to risk-weighted assets (as defined), and of Tier 1 capital (as defined) to average assets (as defined). Management believes, as of December 31, 2010, that Bankshares and the Bank meets all capital adequacy requirements to which it is subject.
53
As of December 31, 2010, the most recent notification from Office of the Comptroller of the Currency categorized Bankshares and the Bank as “well capitalized” under the regulatory framework for prompt corrective action. To be categorized as “well capitalized,” Bankshares and the Bank must maintain minimum total risk-based, Tier 1 risk-based and Tier 1 leverage ratios as set forth in the table below. There are no conditions or events since that notification that management believes have changed Bankshares and the Bank’s category.
Bankshares and the Bank’s actual capital amounts and ratios are presented in the table below.
| Actual | For Capital Adequacy Purposes |
To Be “Well Capitalized” Under Prompt Corrective Action Provisions |
||||||||||||||||||||||
| Amount | Ratio | Amount | Ratio | Amount | Ratio | |||||||||||||||||||
| As of December 31, 2010: |
||||||||||||||||||||||||
| Total Capital (to Risk Weighted Assets): |
||||||||||||||||||||||||
| Bankshares consolidated |
$ | 29,689 | 10.61 | % | $ | 22,380 | 8.0 | % | $ | N/A | N/A | |||||||||||||
| Bank |
31,718 | 11.36 | % | 22,342 | 8.0 | % | 27,927 | 10.0 | % | |||||||||||||||
| Tier 1 Capital (to Risk Weighted Assets): |
||||||||||||||||||||||||
| Bankshares consolidated |
26,180 | 9.36 | % | 11,190 | 4.0 | % | N/A | N/A | ||||||||||||||||
| Bank |
28,220 | 10.10 | % | 11,190 | 4.0 | % | 16,785 | 6.0 | % | |||||||||||||||
| Tier 1 Capital (Leverage) (to Average Assets): |
||||||||||||||||||||||||
| Bankshares consolidated |
26,180 | 7.74 | % | 13,521 | 4.0 | % | N/A | N/A | ||||||||||||||||
| Bank |
28,220 | 8.36 | % | 13,505 | 4.0 | % | 16,882 | 5.0 | % | |||||||||||||||
| Actual | For Capital Adequacy Purposes |
To Be “Well Capitalized” Under Prompt Corrective Action Provisions |
||||||||||||||||||||||
| Amount | Ratio | Amount | Ratio | Amount | Ratio | |||||||||||||||||||
| As of December 31, 2009: |
||||||||||||||||||||||||
| Total Capital (to Risk Weighted Assets): |
||||||||||||||||||||||||
| Bankshares consolidated |
$ | 29,437 | 10.75 | % | $ | 21,910 | 8.0 | % | $ | N/A | N/A | |||||||||||||
| Bank |
31,055 | 11.36 | % | 21,877 | 8.0 | % | 27,347 | 10.0 | % | |||||||||||||||
| Tier 1 Capital (to Risk Weighted Assets): |
||||||||||||||||||||||||
| Bankshares consolidated |
26,008 | 9.50 | % | 10,955 | 4.0 | % | N/A | N/A | ||||||||||||||||
| Bank |
27,626 | 10.10 | % | 10,939 | 4.0 | % | 16,408 | 6.0 | % | |||||||||||||||
| Tier 1 Capital (Leverage) (to Average Assets): |
||||||||||||||||||||||||
| Bankshares consolidated |
26,008 | 8.04 | % | 12,945 | 4.0 | % | N/A | N/A | ||||||||||||||||
| Bank |
27,626 | 8.55 | % | 12,930 | 4.0 | % | 16,162 | 5.0 | % | |||||||||||||||
54
| (13) | Disclosures about Fair Value of Financial Instruments |
The ASC topic Fair Value Option, requires the Company to disclose estimated fair values of its financial instruments.
The following methods and assumptions were used to estimate the approximate fair value of each class of financial instrument for which it is practicable to estimate that value.
| (a) | Cash and Due from Banks and Federal Funds Sold |
The carrying amounts are a reasonable estimate of fair value.
| (b) | Securities |
The fair value of securities is estimated based on bid prices published in financial newspapers or bid quotations received from securities dealers. The fair value of certain state and municipal securities is not readily available through market sources other than dealer quotations; so fair value estimates are based on quoted market prices of similar instruments, adjusted for differences between the quoted instruments and the instruments being valued.
| (c) | Loans |
Fair values are estimated for portfolios of loans with similar financial characteristics. Loans are segregated by type such as commercial, real estate - residential, real estate - other, loans to individuals and other loans. Each loan category is further segmented into fixed and adjustable rate interest terms.
The fair value of fixed rate loans is calculated by discounting scheduled cash flows through the estimated maturity using estimated market discount rates that reflect the credit and interest rate risk inherent in the loan as well as estimates for prepayments. The estimate of maturity is based on the Company’s historical experience with repayments for each loan classification, modified, as required, by an estimate of the effect of current economic and lending conditions.
| (d) | Deposits and Note Payable to Federal Home Loan Bank |
The fair value of demand deposits, NOW accounts, and savings deposits is the amount payable on demand. The fair value of fixed maturity time deposits, certificates of deposit and the note payable to the Federal Home Loan Bank is estimated by discounting scheduled cash flows through the estimated maturity using the rates currently offered for deposits or borrowings of similar remaining maturities.
| (e) | Commitments to Extend Credit and Standby Letters of Credit |
The only amounts recorded for commitments to extend credit and standby letters of credit are the deferred fees arising from these unrecognized financial instruments. These deferred fees are not deemed significant at December 31, 2010 and 2009, and as such, the related fair values have not been estimated.
55
The carrying amounts and approximate fair values of the Company’s financial instruments are as follows at December 31, 2010 and 2009:
| 2010 | 2009 | |||||||||||||||
| Carrying amounts |
Approximate fair values |
Carrying amounts |
Approximate fair values |
|||||||||||||
| Financial assets: |
||||||||||||||||
| Cash and due from banks |
$ | 32,533 | 32,533 | 30,052 | 30,052 | |||||||||||
| Federal funds sold |
— | — | 2,008 | 2,008 | ||||||||||||
| Securities: |
||||||||||||||||
| Available-for-sale |
22,048 | 22,048 | 19,105 | 19,105 | ||||||||||||
| Held-to-maturity |
4,469 | 4,400 | 1,051 | 1,078 | ||||||||||||
| Federal Reserve Bank Stock |
135 | 135 | 105 | 105 | ||||||||||||
| Federal Home Loan Bank Stock |
579 | 579 | 579 | 579 | ||||||||||||
| Loans, net of unearned income and fees |
265,030 | 270,488 | 269,627 | 274,623 | ||||||||||||
| Total financial assets |
$ | 324,794 | 330,183 | 322,527 | 327,550 | |||||||||||
| Financial liabilities: |
||||||||||||||||
| Deposits |
$ | 306,954 | 312,863 | 302,119 | 306,987 | |||||||||||
| Line of credit |
2,000 | 2,000 | 2,000 | 2,000 | ||||||||||||
| Total financial liabilities |
$ | 308,954 | 314,863 | 304,119 | 308,987 | |||||||||||
Fair value estimates are made at a specific point in time, based on relevant market information and information about the financial instrument. These estimates do not reflect any premium or discount that could result from offering for sale at one time the Company’s entire holdings of a particular financial instrument. Because no market exists for a significant portion of the Company’s financial instruments, fair value estimates are based on judgments regarding future expected loss experience, current economic conditions, risk characteristics of various financial instruments and other factors. These estimates are subjective in nature and involve uncertainties and matters of significant judgment and therefore cannot be determined with precision. Changes in assumptions could significantly affect the estimates.
Fair value estimates are based on existing on and off-balance sheet financial instruments without attempting to estimate the value of anticipated future business and the value of assets and liabilities that are not considered financial instruments. Significant assets that are not considered financial assets include deferred tax assets and premises and equipment and other real estate owned. In addition, the tax ramifications related to the realization of the unrealized gains and losses can have a significant effect on fair value estimates and have not been considered in the estimates.
56
| (14) | Parent Company Financial Information |
Condensed financial information of Bankshares (Parent) is presented below:
Condensed Statements of Income
| Years
ended December 31, |
||||||||||||
| 2010 | 2009 | 2008 | ||||||||||
| Income: |
||||||||||||
| Dividends from subsidiary |
$ | 338 | 420 | 978 | ||||||||
| Expenses: |
||||||||||||
| Other expenses |
264 | 265 | 103 | |||||||||
| Income before income tax benefit and equity in undistributed net income of subsidiary |
74 | 155 | 875 | |||||||||
| Applicable income tax benefit |
90 | 90 | 35 | |||||||||
| Income before equity in undistributed net income of subsidiary |
164 | 245 | 910 | |||||||||
| Equity in undistributed net income of subsidiary |
523 | 106 | (604 | ) | ||||||||
| Net income |
$ | 687 | 351 | 306 | ||||||||
Condensed Statements of Cash Flows
| Years
ended December 31, |
||||||||||||
| 2010 | 2009 | 2008 | ||||||||||
| Cash flows from operating activities: |
||||||||||||
| Net income |
$ | 687 | 351 | 306 | ||||||||
| Adjustments to reconcile net income to net cash provided by operating activities: |
||||||||||||
| Equity in undistributed net income of subsidiary |
(523 | ) | (106 | ) | 604 | |||||||
| Increase in other assets |
(81 | ) | (79 | ) | (60 | ) | ||||||
| Net cash provided by operating activities |
83 | 166 | 850 | |||||||||
| Cash flows from investing activities: |
||||||||||||
| Additional investment in Bank |
(1,000 | ) | (1,000 | ) | (1,000 | ) | ||||||
| Net cash used in financing activity |
(1,000 | ) | (1,000 | ) | (1,000 | ) | ||||||
| Cash flows from financing activities |
||||||||||||
| Cash dividends paid |
(75 | ) | (147 | ) | (889 | ) | ||||||
| Draw on line of credit |
1,000 | 1,000 | 1,000 | |||||||||
| Increase (decrease) in other liabilities |
3 | (24 | ) | 24 | ||||||||
| Net cash provided by (used in) financing activities |
928 | 829 | 135 | |||||||||
| Net increase (decrease) in cash due from subsidiary |
11 | (5 | ) | (15 | ) | |||||||
| Cash due from subsidiary, beginning of year |
7 | 12 | 27 | |||||||||
| Cash due from subsidiary, end of year |
$ | 18 | 7 | 12 | ||||||||
| (15) | Stock-based Compensation |
The Company has two incentive stock option plans. The 1997 Incentive Stock Plan (the 1997 Plan), pursuant to which the Company’s Board of Directors could grant stock options to officers and key employees, became effective as of May 1, 1997. The 1997 Plan authorized grants of options to purchase up to 50,000 shares of the Company’s authorized, but unissued common stock. Accordingly, 50,000 shares of authorized, but unissued common stock were reserved for use in the 1997 Plan. All stock options were granted with an exercise price equal to the stock’s fair market value at the date of grant. At December 31, 2010, there were no additional shares available for grant under the 1997 Plan as the plan expired on May 1, 2007.
57
The 2004 Incentive Stock Plan (the 2004 Plan), pursuant to which the Company’s Board of Directors may grant stock options to officers and key employees, was approved by shareholders on April 13, 2004 and became effective as of May 1, 2004. The 2004 Plan authorizes grants of options to purchase up to 100,000 shares of the Company’s authorized, but unissued common stock. Accordingly, 100,000 shares of authorized, but unissued common stock were reserved for use in the 2004 Plan. All stock options are granted with an exercise price equal to the stock’s fair market value at the date of the grant. At December 31, 2010, there were 52,000 shares available for grant under the 2004 Plan.
Stock options generally have 10-year terms, vest at the rate of 20% per year, and become fully exercisable five years from the date of grant.
During 2010, 2009 and 2008, no stock options were exercised. On May 1, 2010, equity awards to acquire 48,000 shares of common stock were granted to employees. Equity awards to acquire 37,500 were granted in the form of incentive stock options with tandem stock appreciation rights with a four year vesting period, and equity awards to acquire 10,500 shares of common stock granted were in the form of restricted stock with a three year cliff restriction. During 2009 and 2008, there was no stock-based compensation granted to employees.
At December 31, 2010, options for 9,500 shares were exercisable at an exercise price of $14.00 per share, options for 7,500 shares were exercisable at an exercise price of $14.75 per share and options for 37,500 shares were exercisable at $9.00 per share.
The Company expensed $47 in 2010 in compensation expensed as a direct result of the issuance of the 37,500 incentive stock options with tandem stock appreciation rights and will recognized $50 in 2011, $26 in 2012, $13 in 2013 and $3 in 2014 in compensation expense related to unvested stock options. The fair value $3.96 per share of each option grant is estimated on the grant date using the Black-Scholes option-pricing model with the following weighted average assumptions used: dividend yield of 2.065%, expected volatility of 45.61%, a risk-free interest rate of 4.63%, and expected lives of 9 years.
The Company also expensed $23 in 2010 in compensation expensed as a direct result of the granting of 10,500 shares of restricted stock and will recognize $31 in 2011, $32 in 2012 and $10 in 2013. The restricted stock was granted at a market price of $9.00 per share
Stock option activity during the years ended December 31, 2010 and 2009 is as follows:
| Number of Shares |
Weighted average exercise price |
|||||||
| Balance at December 31, 2008 |
17,000 | $ | 14.33 | |||||
| Forfeited |
— | — | ||||||
| Exercised |
— | |||||||
| Granted |
— | — | ||||||
| Balance at December 31, 2009 |
17,000 | $ | 14.33 | |||||
| Exercised |
— | |||||||
| Granted |
37,500 | 9.00 | ||||||
| Balance at December 31, 2010 |
54,500 | $ | 10.66 | |||||
58
The following table summarizes information about stock options outstanding at December 31, 2010:
| Options Outstanding | Options Exercisable | |||||||||||||||||||||
| Exercise Price |
Number Outstanding at 12/31/10 |
Weighted- Average Remaining Contractual Life (in years) |
Weighted- Average Exercise Price |
Number Exercisable at 12/31/2010 |
Weighted- Average Exercise Price |
|||||||||||||||||
| $ | 14.00 | 9,500 | 1.5 | $ | 14.00 | 9,500 | $ | 14.00 | ||||||||||||||
| 14.75 | 7,500 | 2.6 | 14.75 | 7,500 | 14.75 | |||||||||||||||||
| 9.00 | 37,500 | 9.4 | 9.00 | — | 9.00 | |||||||||||||||||
| 54,500 | 7.1 | $ | 10.66 | 17,000 | $ | 14.33 | ||||||||||||||||
The aggregate intrinsic value of options outstanding was $0, of options exercisable was $0, and of options unvested and expected to vest was $0 at December 31, 2010.
The aggregate intrinsic value of restricted stock granted during 2010 was $95.
The total intrinsic value (market value on date of exercise less exercise price) of options exercised during the years ended December 31, 2010, 2009 and 2008 totaled $0, $0 and $0, respectively.
| (16) | Quarterly Results of Operations (Unaudited) |
The following is a summary of the unaudited quarterly results of operations for the years ended December 31, 2010, 2009 and 2008:
59
| 2010 | ||||||||||||||||
| First quarter |
Second quarter |
Third quarter |
Fourth quarter |
|||||||||||||
| Income statement data: |
||||||||||||||||
| Interest income |
$ | 4,084 | 4,107 | 4,124 | 4,295 | |||||||||||
| Interest expense |
1,521 | 1,505 | 1,470 | 1,340 | ||||||||||||
| Net interest income |
2,563 | 2,602 | 2,654 | 2,955 | ||||||||||||
| Provision for loan losses |
263 | 509 | 191 | 915 | ||||||||||||
| Noninterest income |
672 | 714 | 855 | 894 | ||||||||||||
| Noninterest expense |
2,708 | 2,711 | 2,764 | 2,853 | ||||||||||||
| Income tax expense |
81 | 29 | 180 | 18 | ||||||||||||
| Net income (loss) |
$ | 183 | 67 | 374 | 63 | |||||||||||
| Per share data: |
||||||||||||||||
| Basic net income (loss) per share |
$ | 0.12 | 0.05 | 0.25 | 0.04 | |||||||||||
| Diluted net income (loss) per share |
0.12 | 0.05 | 0.25 | 0.04 | ||||||||||||
| Cash dividends per share |
0.00 | 0.00 | 0.00 | 0.05 | ||||||||||||
| Book value per share |
17.55 | 17.54 | 17.84 | 17.71 | ||||||||||||
| 2009 | ||||||||||||||||
| First quarter |
Second quarter |
Third quarter |
Fourth quarter |
|||||||||||||
| Income statement data: |
||||||||||||||||
| Interest income |
$ | 4,325 | 4,320 | 4,360 | 4,311 | |||||||||||
| Interest expense |
1,957 | 1,871 | 1,821 | 1,663 | ||||||||||||
| Net interest income |
2,368 | 2,449 | 2,539 | 2,648 | ||||||||||||
| Provision for loan losses |
774 | 67 | 188 | 501 | ||||||||||||
| Noninterest income |
692 | 810 | 867 | 779 | ||||||||||||
| Noninterest expense |
2,647 | 2,825 | 2,880 | 2,819 | ||||||||||||
| Income tax expense (benefit) |
(142 | ) | 112 | 101 | 29 | |||||||||||
| Net income (loss) |
$ | (219 | ) | 255 | 237 | 78 | ||||||||||
| Per share data: |
||||||||||||||||
| Basic net income (loss) per share |
$ | (0.15 | ) | 0.17 | 0.16 | 0.06 | ||||||||||
| Diluted net income (loss) per share |
(0.15 | ) | 0.17 | 0.16 | 0.06 | |||||||||||
| Cash dividends per share |
0.10 | 0.00 | 0.00 | 0.00 | ||||||||||||
| Book value per share |
16.57 | 16.74 | 16.93 | 17.41 | ||||||||||||
| 2008 | ||||||||||||||||
| First quarter |
Second quarter |
Third quarter |
Fourth quarter |
|||||||||||||
| Income statement data: |
||||||||||||||||
| Interest income |
$ | 4,551 | 4,614 | 4,767 | 4,623 | |||||||||||
| Interest expense |
2,081 | 2,020 | 2,122 | 2,123 | ||||||||||||
| Net interest income |
2,470 | 2,594 | 2,645 | 2,500 | ||||||||||||
| Provision for loan losses |
138 | 157 | 248 | 2,338 | ||||||||||||
| Noninterest income |
677 | 761 | 754 | 704 | ||||||||||||
| Noninterest expense |
2,287 | 2,384 | 2,474 | 2,701 | ||||||||||||
| Income tax expense (benefit) |
229 | 262 | 215 | (634 | ) | |||||||||||
| Net income |
$ | 493 | 552 | 462 | (1,201 | ) | ||||||||||
| Per share data: |
||||||||||||||||
| Basic net income (loss) per share |
$ | 0.33 | 0.37 | 0.31 | (0.80 | ) | ||||||||||
| Diluted net income (loss) per share |
0.33 | 0.37 | 0.31 | (0.80 | ) | |||||||||||
| Cash dividends per share |
0.15 | 0.15 | 0.15 | 0.15 | ||||||||||||
| Book value per share |
18.32 | 18.42 | 18.61 | 16.78 | ||||||||||||
60
| (17) | Subsequent Events |
The Company evaluated all subsequent events for potential recognition and disclosure through February 25, 2010.
Management’s Report on Internal Control over Financial Reporting.
The Company’s management is responsible for establishing and maintaining adequate internal control over financial reporting as defined in Rule 13a-15(f) under the Securities Exchange Act of 1934, as amended (the Exchange Act).
Because of its inherent limitations, internal control over financial reporting may not prevent or detect misstatements. Therefore, even those systems determined to be effective can provide only reasonable assurance with respect to financial statement preparation and presentation.
Management assessed the effectiveness of the Company’s internal control over financial reporting as of December 31, 2010. In making this assessment, management used the criteria set forth by the Committee of Sponsoring Organizations of the Treadway Commission (COSO) in Internal Control – Integrated Framework. Based on this assessment, our management concluded that, as of December 31, 2010, the Company’s internal control over financial reporting was effective based on those criteria.
This annual report does not include an attestation report of the Company’s registered public accounting firm regarding internal control over financial reporting. Management’s report was not subject to attestation by the Company’s registered public accounting firm pursuant to temporary rules of the Securities and Exchange Commission that permit the Company to provide only management’s report in this annual report.
Changes in Internal Controls.
No changes in our internal control over financial reporting occurred during the quarter ended December 31, 2010 that have materially affected, or are reasonably likely to materially affect, our internal control over financial reporting.
61

Report of Independent Registered Public Accounting Firm
The Board of Directors and Stockholders
Pinnacle Bankshares Corporation
Altavista, Virginia
We have audited the accompanying consolidated balance sheets of Pinnacle Bankshares Corporation and subsidiary as of December 31, 2010 and 2009, and the related consolidated statements of income, changes in stockholders’ equity and comprehensive income, and cash flows for each of the years in the three-year period ended December 31, 2010. These consolidated financial statements are the responsibility of the Bank’s management. Our responsibility is to express an opinion on these consolidated financial statements based on our audits.
We conducted our audits in accordance with the standards of the Public Company Accounting Oversight Board (United States). Those standards require that we plan and perform the audit to obtain reasonable assurance about whether the financial statements are free of material misstatement. An audit includes examining, on a test basis, evidence supporting the amounts and disclosures in the financial statements. An audit also includes assessing the accounting principles used and significant estimates made by management, as well as evaluating the overall financial statement presentation. We believe that our audits provide a reasonable basis for our opinion.
In our opinion, the consolidated financial statements referred to above present fairly, in all material respects, the financial position of Pinnacle Bankshares Corporation and subsidiary as of December 31, 2010 and 2009, and the results of their operations and their cash flows for each of the years in the three-year period ended December 31, 2010, in conformity with accounting principles generally accepted in the United States of America.

|
| Raleigh, North Carolina |
| February 25, 2011 |
62
Shareholder Information
PERFORMANCE GRAPH
The graph below compares total returns assuming reinvestment of dividends of Pinnacle Bankshares Common Stock, the NASDAQ Market Index, and an Industry Peer Group Index. In addition, we have included the S&P 500 and the SNL Bank and Thrift Index and will use these as our peer groups going forward as we have determined that the companies included in these indices more closely match our Company characteristics than the companies included in the SIC Code Index. The graph assumes $100 invested on January 1, 2005 in Pinnacle Bankshares Corporation Common Stock and in each of the indices. In 2010, the financial holding companies in the SIC Code Index consisted of 568 banks with the same standard industry code of 6022 as Pinnacle Bankshares Corporation.
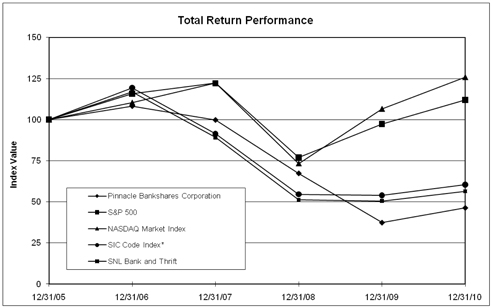
| Period Ending | ||||||||||||||||||||||||
| Index |
12/31/05 | 12/31/06 | 12/31/07 | 12/31/08 | 12/31/09 | 12/31/10 | ||||||||||||||||||
| Pinnacle Bankshares Corporation |
100.00 | 108.17 | 99.77 | 67.35 | 37.45 | 46.38 | ||||||||||||||||||
| S&P 500 |
100.00 | 115.79 | 122.16 | 76.96 | 97.33 | 111.99 | ||||||||||||||||||
| NASDAQ Market Index |
100.00 | 110.39 | 122.15 | 73.32 | 106.57 | 125.91 | ||||||||||||||||||
| SIC Code Index* |
100.00 | 119.43 | 91.39 | 54.62 | 53.89 | 60.47 | ||||||||||||||||||
| SNL Bank and Thrift |
100.00 | 116.85 | 89.10 | 51.24 | 50.55 | 56.44 | ||||||||||||||||||
63
Shareholder Information
Annual Meeting
The 2011 Annual Meeting of Shareholders will be held on April 12, 2011, at 11:30 a.m. at the Fellowship Hall of Altavista Presbyterian Church, located at 707 Broad Street, Altavista, Virginia.
Market for Common Equity and Related Stockholder Matters
The Company’s Common Stock is quoted on the OTC Bulletin Board. The following table presents the high and low bid prices per share of the Common Stock, as reported on the OTC Bulletin Board, and dividend information of the Company for the quarters presented. The high and low bid prices of the Common Stock presented below reflect inter-dealer prices and do not include retail markups, markdowns or commissions, and may not represent actual transactions.
| 2010 | 2009 | |||||||||||||||||||||||
| High | Low | Dividends | High | Low | Dividends | |||||||||||||||||||
| First Quarter |
$ | 8.50 | $ | 7.15 | $ | 0.00 | $ | 13.00 | $ | 6.40 | $ | 0.10 | ||||||||||||
| Second Quarter |
$ | 9.00 | $ | 7.80 | $ | 0.00 | $ | 6.40 | $ | 7.10 | $ | 0.00 | ||||||||||||
| Third Quarter |
$ | 8.50 | $ | 7.80 | $ | 0.00 | $ | 10.00 | $ | 5.84 | $ | 0.00 | ||||||||||||
| Fourth Quarter |
$ | 9.50 | $ | 7.30 | $ | 0.05 | $ | 9.75 | $ | 6.50 | $ | 0.00 | ||||||||||||
Each share of Common Stock is entitled to participate equally in dividends, which are payable as and when determined by the Board of Directors after consideration of the earnings, general economic conditions, the financial condition of the business and other factors as might be appropriate. The Company’s ability to pay dividends is dependent upon its receipt of dividends from its subsidiary. Prior approval from the Comptroller of the Currency is required if the total of all dividends declared by a national bank, including the proposed dividend, in any calendar year will exceed the sum of the Bank’s net profits for that year and its retained net profits for the preceding two calendar years, less any required transfers to surplus. This limitation has not had a material impact on the Bank’s ability to declare dividends during 2010 and 2009 and is not expected to have a material impact during 2011.
As of March 1, 2011, there were approximately 369 shareholders of record of Bankshares’ Common Stock.
Requests for Information
Requests for information about the Company should be directed to Bryan M. Lemley, Secretary, Treasurer and Chief Financial Officer, P.O. Box 29, Altavista, Virginia 24517, telephone (434) 369-3000. A copy of the Company’s Annual Report on Form 10-K for the year ended December 31, 2010, will be furnished without charge to shareholders upon written request.
Shareholders seeking information regarding lost certificates and dividends should contact Registrar and Transfer Company in Cranford, New Jersey, telephone (800) 368-5948. Please submit address changes in writing to:
Registrar and Transfer Company
Investor Relations Department
10 Commerce Drive
Cranford, New Jersey 07016-9982
64
Robert H. Gilliam, Jr.

|
Over the past 31 years the banking industry has changed significantly due to deregulation, interstate banking, ever evolving technology and the recent financial crisis. Mergers and acquisitions as well as bank failures have reduced the total number of commercial banks to less than half of those that were in business at the beginning of that time period. Increased regulatory burden and a slow economic recovery currently challenge the ability of many banks to remain independent. However, throughout over 3 decades of change and market volatility there has been one constant; First National Bank, under the leadership of Robert H. Gilliam, Jr., has continued to grow by focusing on the “basics” and fulfilling the financial needs of its customers throughout Central Virginia.
In December of 2010 Mr. Gilliam, or “Rob” as he is known by customers and employees, announced his intention to retire in the mid-year 2011 timeframe after providing First National Bank with over 40 years of dedicated service. He started with the Bank in 1970 after spending 3 years as an Assistant National Bank Examiner with the Comptroller of the Currency and became President and CEO of the company in 1980. During his tenure as First National’s leader the company has grown from a 1 branch operation located in Altavista to a Bank that serves the broader Region 2000 market having 8 branches, a loan production office and over $335 million in assets. Rob’s open-mindedness, progressive nature, meticulous attention to details and willingness to empower his employees has all combined to be the catalyst for First National’s success during this time. | |
|
Beyond First National Bank, Rob has been a champion for the banking industry through his extensive involvement with the American Bankers Association, the Virginia Bankers Association and the Virginia Association of Community Banks. He has served as President of the Virginia Bankers Association and recently completed a 3 year term as a member of the Board of Directors of the Federal Reserve Bank of Richmond. Rob’s work with these entities is a demonstration of the high level of commitment he has had to ensuring the continued health and viability of the banking industry.
Outside of banking Rob has continually sought and accepted opportunities to give back to his community through his involvement with the Region 2000 Economic Development Council, the Altavista Economic Development Authority, the Centra Health Foundation, the Altavista Life Saving & First Aid Crew, Inc., the Altavista Area Chamber of Commerce, the Altavista Lions Club, the Greater Lynchburg Community Trust and the Altavista Area YMCA. Rob’s willingness to take on leadership roles with these organizations over the years has been indicative of his desire to give of himself in order to make Central Virginia a better place to work and live.
Therefore, it is with sincere gratitude that we take this opportunity to thank Rob Gilliam for his service, devotion and loyalty to First National Bank and wish him much happiness as he embarks on this new chapter of his life. Rob’s career has set the standard for commitment and his leadership has prepared us well to carry the First National banner into the future. | ||
The Board of Directors and Employees of First National Bank