Attached files
| file | filename |
|---|---|
| 8-K - FORM 8-K - NABORS INDUSTRIES LTD | h80974e8vk.htm |
Exhibit 99.1

| Howard Weil 39th Annual Energy Conference March 28, 2011 Presenter: Gene Isenberg Chairman and CEO |
| Forward Looking Statements We often discuss expectations regarding our markets, demand for our products and services, and our future performance in our annual and quarterly reports, press releases, and other written and oral statements. Such statements, including statements in this document incorporated by reference that relate to matters that are not historical facts are "forward-looking statements" within the meaning of the safe-harbor provisions of the Securities Act of 1933 and the Securities Exchange Act of 1934. These forward-looking statements are based on our analysis of currently available competitive, financial and economic data and our operating plans. They are inherently uncertain, and investors must recognize that events and actual results could turn out to be significantly different from our expectations. You should consider the following key factors when evaluating these forward-looking statements: fluctuations in worldwide prices and demand for natural gas and oil; fluctuations in levels of natural gas and crude oil exploration and development activities; fluctuations in the demand for our services; the existence of competitors, technological changes and developments in the oilfield services industry; the existence of operating risks inherent in the oilfield services industry; the existence of regulatory and legislative uncertainties; the possibility of changes in tax laws; the possibility of political instability, war or acts of terrorism in any of the countries where we operate; and general economic conditions including the capital and credit markets. Our businesses depend, to a large degree, on the level of spending by oil and gas companies for exploration, development and production activities. Therefore, a sustained increase or decrease in the price of natural gas or oil, which could have a material impact on exploration and production activities, could also materially affect our financial position, results of operations and cash flows. The above description of risks and uncertainties is by no means all-inclusive, but is designed to highlight what we believe are important factors to consider. Additional information concerning these and other risk factors is contained in our most recently filed annual reports on Form 10-K, subsequent quarterly reports on Form 10-Q, recent current reports on Form 8-K, and other SEC filings. |
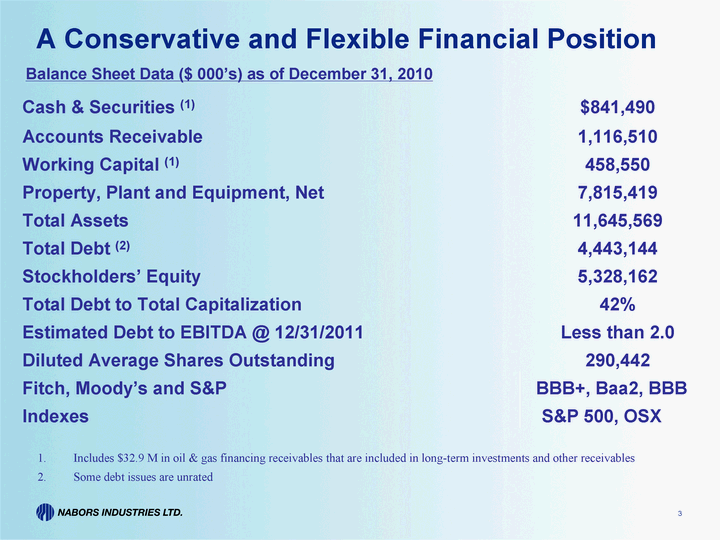
| A Conservative and Flexible Financial Position Cash & Securities (1) Cash & Securities (1) $841,490 $841,490 $841,490 $841,490 $841,490 Accounts Receivable Accounts Receivable 1,116,510 1,116,510 1,116,510 1,116,510 1,116,510 Working Capital (1) Working Capital (1) 458,550 458,550 458,550 458,550 458,550 Property, Plant and Equipment, Net Property, Plant and Equipment, Net 7,815,419 7,815,419 7,815,419 7,815,419 7,815,419 Total Assets Total Assets 11,645,569 11,645,569 11,645,569 11,645,569 11,645,569 Total Debt (2) Total Debt (2) 4,443,144 4,443,144 4,443,144 4,443,144 4,443,144 Stockholders' Equity Stockholders' Equity 5,328,162 5,328,162 5,328,162 5,328,162 5,328,162 Total Debt to Total Capitalization Total Debt to Total Capitalization 42% 42% 42% 42% 42% Estimated Debt to EBITDA @ 12/31/2011 Estimated Debt to EBITDA @ 12/31/2011 Less than 2.0 Less than 2.0 Less than 2.0 Less than 2.0 Less than 2.0 Diluted Average Shares Outstanding Diluted Average Shares Outstanding 290,442 290,442 290,442 290,442 290,442 Fitch, Moody's and S&P BBB+, Baa2, BBB BBB+, Baa2, BBB BBB+, Baa2, BBB BBB+, Baa2, BBB Indexes S&P 500, OSX S&P 500, OSX S&P 500, OSX S&P 500, OSX Balance Sheet Data ($ 000's) as of December 31, 2010 Includes $32.9 M in oil & gas financing receivables that are included in long-term investments and other receivables Some debt issues are unrated |
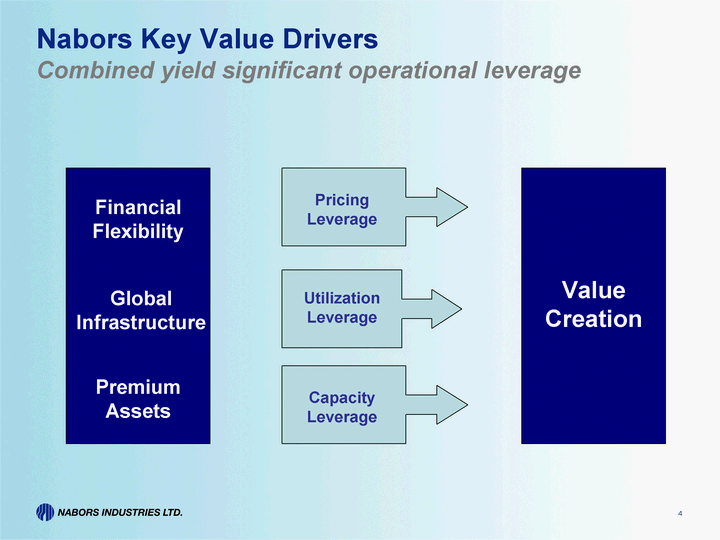
| Nabors Key Value Drivers Combined yield significant operational leverage Premium Assets Financial Flexibility Global Infrastructure Pricing Leverage Utilization Leverage Capacity Leverage Value Creation |
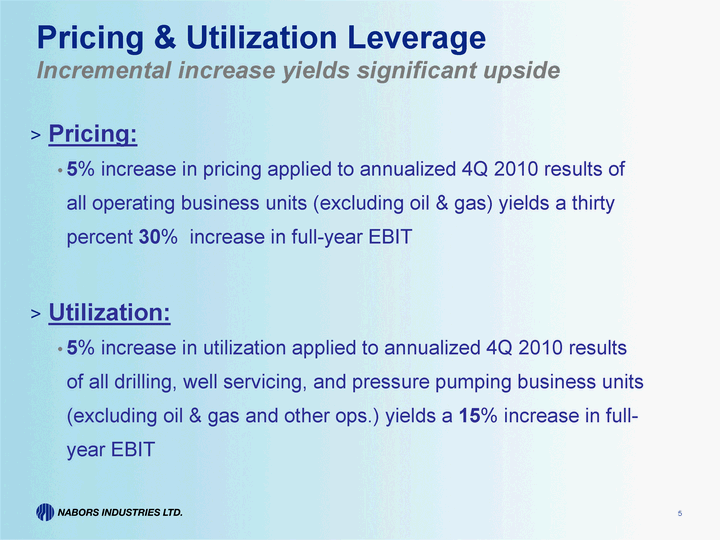
| Pricing & Utilization Leverage Incremental increase yields significant upside Pricing: 5% increase in pricing applied to annualized 4Q 2010 results of all operating business units (excluding oil & gas) yields a thirty percent 30% increase in full-year EBIT Utilization: 5% increase in utilization applied to annualized 4Q 2010 results of all drilling, well servicing, and pressure pumping business units (excluding oil & gas and other ops.) yields a 15% increase in full- year EBIT |
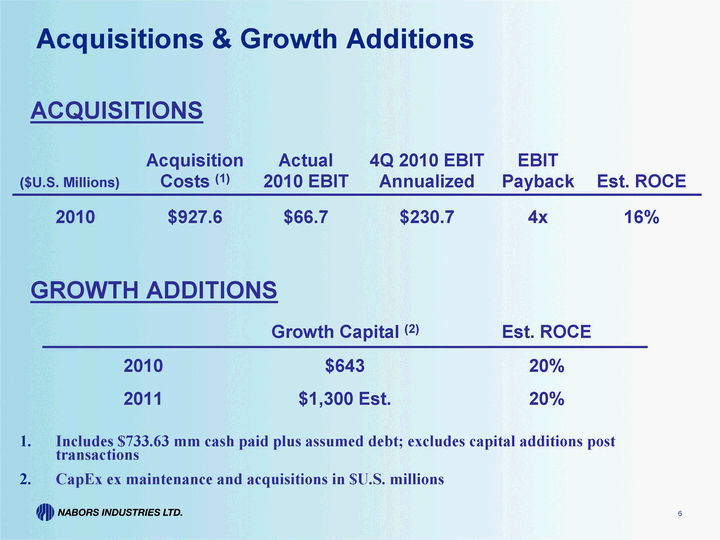
| Acquisitions & Growth Additions ($U.S. Millions) Acquisition Costs (1) Actual 2010 EBIT 4Q 2010 EBIT Annualized EBIT Payback Est. ROCE 2010 $927.6 $66.7 $230.7 4x 16% ACQUISITIONS GROWTH ADDITIONS Growth Capital (2) Est. ROCE 2010 $643 20% 2011 $1,300 Est. 20% Includes $733.63 mm cash paid plus assumed debt; excludes capital additions post transactions CapEx ex maintenance and acquisitions in $U.S. millions |
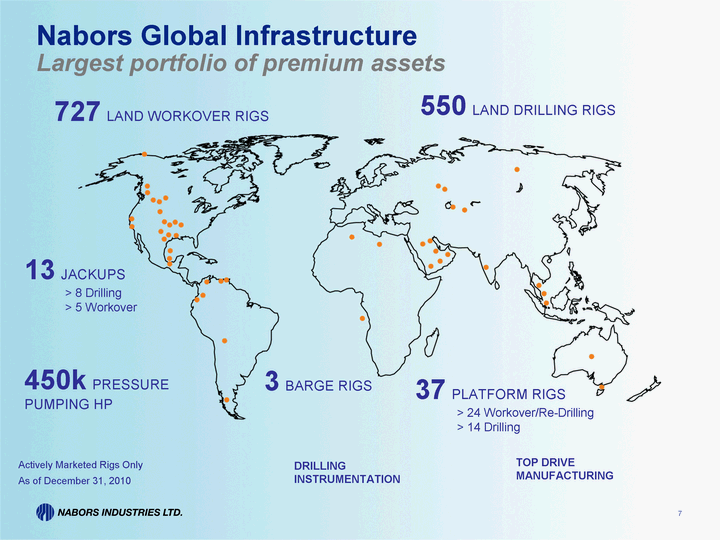
| Nabors Global Infrastructure Largest portfolio of premium assets 13 JACKUPS 8 Drilling 5 Workover 3 BARGE RIGS 37 PLATFORM RIGS 24 Workover/Re-Drilling 14 Drilling 727 LAND WORKOVER RIGS 550 LAND DRILLING RIGS Actively Marketed Rigs Only As of December 31, 2010 DRILLING INSTRUMENTATION TOP DRIVE MANUFACTURING 450k PRESSURE PUMPING HP |
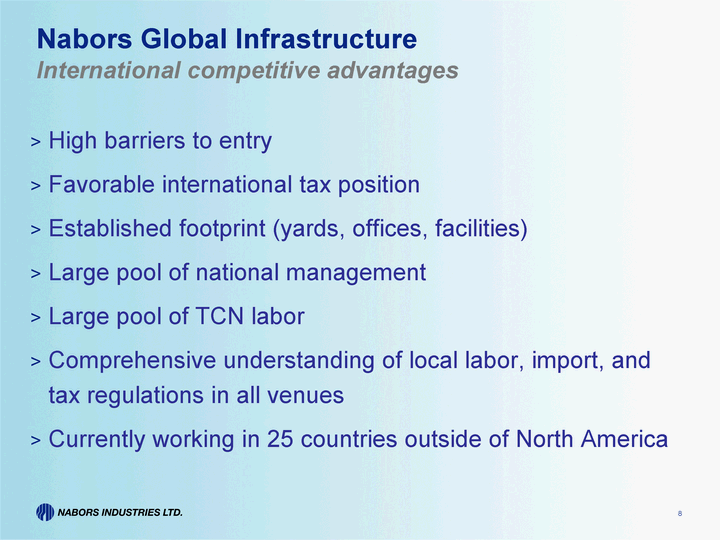
| Nabors Global Infrastructure International competitive advantages High barriers to entry Favorable international tax position Established footprint (yards, offices, facilities) Large pool of national management Large pool of TCN labor Comprehensive understanding of local labor, import, and tax regulations in all venues Currently working in 25 countries outside of North America |
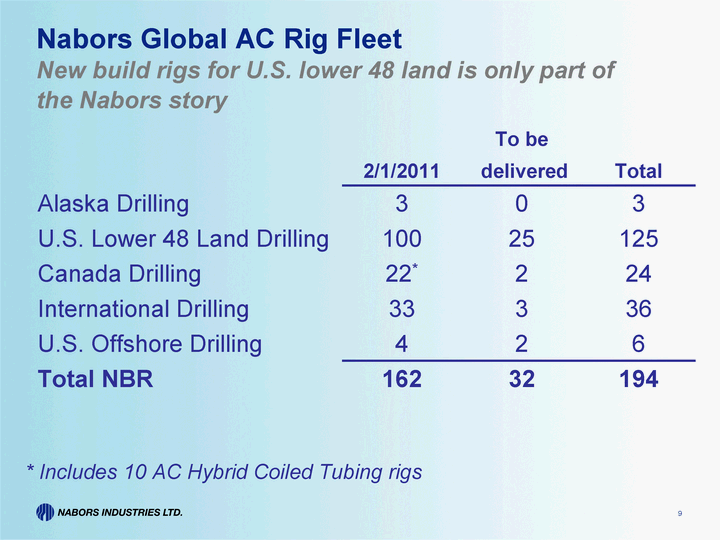
| Nabors Global AC Rig Fleet New build rigs for U.S. lower 48 land is only part of the Nabors story 2/1/2011 To be delivered Total Alaska Drilling 3 0 3 U.S. Lower 48 Land Drilling 100 25 125 Canada Drilling 22* 2 24 International Drilling 33 3 36 U.S. Offshore Drilling 4 2 6 Total NBR 162 32 194 * Includes 10 AC Hybrid Coiled Tubing rigs |
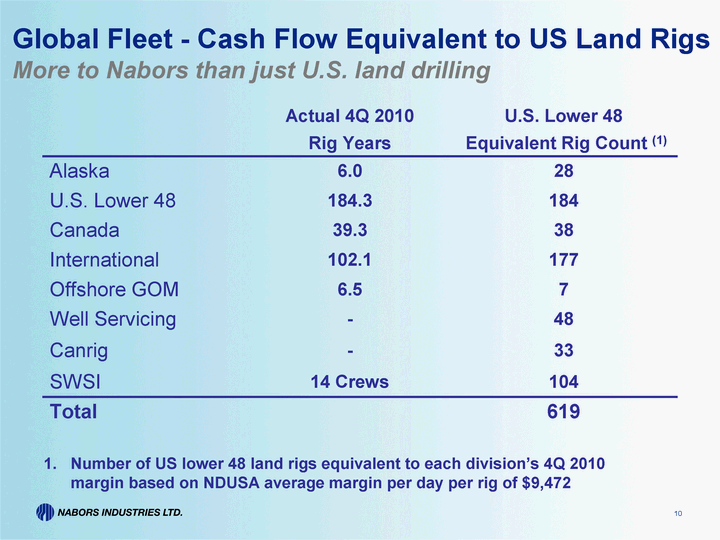
| Global Fleet - Cash Flow Equivalent to US Land Rigs More to Nabors than just U.S. land drilling Actual 4Q 2010 Rig Years U.S. Lower 48 Equivalent Rig Count (1) Alaska 6.0 28 U.S. Lower 48 184.3 184 Canada 39.3 38 International 102.1 177 Offshore GOM 6.5 7 Well Servicing - 48 Canrig - 33 SWSI 14 Crews 104 Total 619 Number of US lower 48 land rigs equivalent to each division's 4Q 2010 margin based on NDUSA average margin per day per rig of $9,472 |
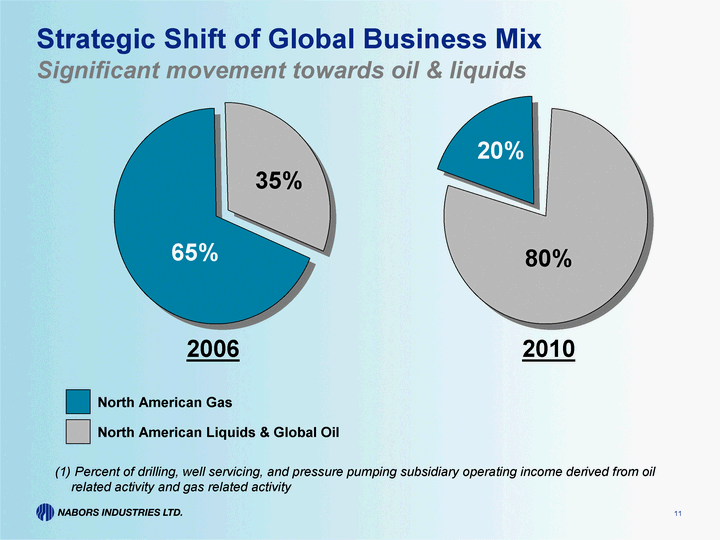
| Strategic Shift of Global Business Mix Significant movement towards oil & liquids Percent of drilling, well servicing, and pressure pumping subsidiary operating income derived from oil related activity and gas related activity 2006 65% 2010 North American Gas North American Liquids & Global Oil 20% 35% 80% |
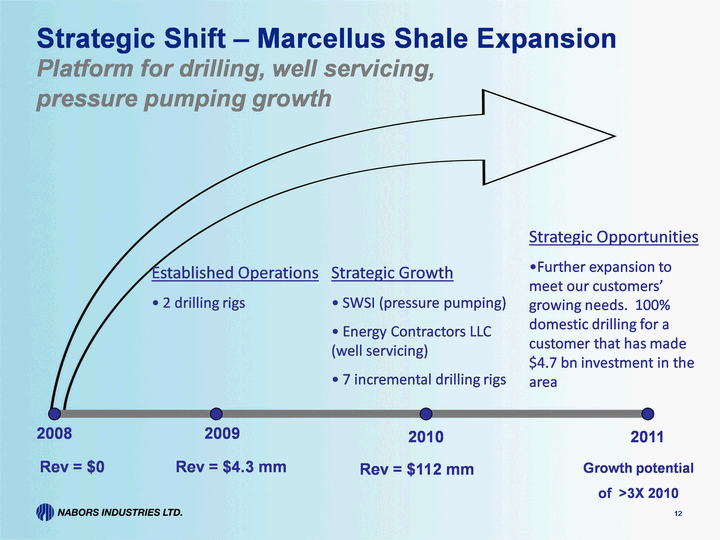
| Strategic Shift - Marcellus Shale Expansion Platform for drilling, well servicing, pressure pumping growth 2009 2010 2011 Strategic Growth SWSI (pressure pumping) Energy Contractors LLC (well servicing) 7 incremental drilling rigs Strategic Opportunities Further expansion to meet our customers' growing needs. 100% domestic drilling for a customer that has made $4.7 bn investment in the area 2008 Established Operations 2 drilling rigs Rev = $0 Rev = $4.3 mm Rev = $112 mm Growth potential of >3X 2010 |
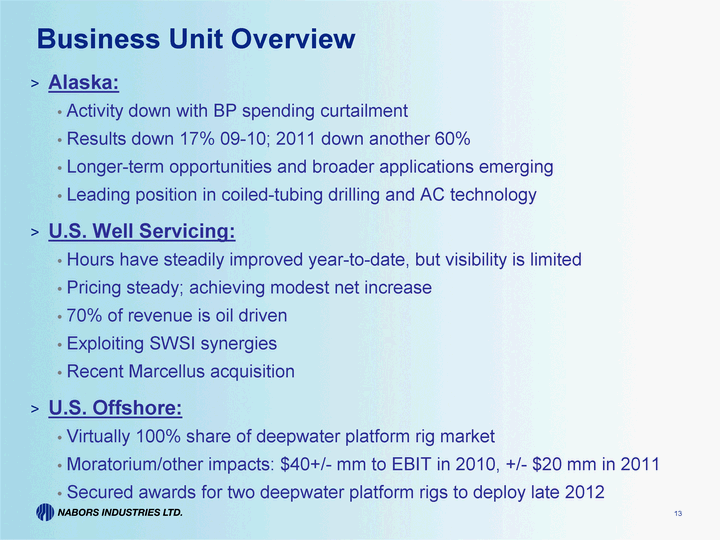
| Business Unit Overview Alaska: Activity down with BP spending curtailment Results down 17% 09-10; 2011 down another 60% Longer-term opportunities and broader applications emerging Leading position in coiled-tubing drilling and AC technology U.S. Well Servicing: Hours have steadily improved year-to-date, but visibility is limited Pricing steady; achieving modest net increase 70% of revenue is oil driven Exploiting SWSI synergies Recent Marcellus acquisition U.S. Offshore: Virtually 100% share of deepwater platform rig market Moratorium/other impacts: $40+/- mm to EBIT in 2010, +/- $20 mm in 2011 Secured awards for two deepwater platform rigs to deploy late 2012 |
| Business Unit Overview Canada: 2010 saw continued improvement throughout the year 2011 2x 2010; Outlook continues to improve with oil activity We remain optimistic on our long-term position as market direction favors NBR fleet Significant upside remaining as 2010 EBIT only 12% of 2006 Other Segments: Innovative, technology-based products are currently being rolled out yielding competitive edges in our rig operations Ryan - broader applications emerging for directional drilling |
| Oil & Gas - Planned Sales Oil Assets: Colombia: Sale process proceeding in multiple transactions covering roughly 50% of acreage Proceeds of $250+ million expected Expect to spend additional capital on remaining acreage to position for future sale Gas Assets: British Columbia and NFR: Postponed sale until a more conducive gas environment Long-term value expectations still intact |
| U.S. Lower 48 Land Drilling As of 3/18/11, NDUSA has 194 rigs on revenue Virtually all PACE(r) rigs committed Full utilization of PACE(r) rigs has improved the market for SCR rigs Activity increasing in oil & liquids driven regions Percent of Cash Flow (EBITDA) in 2006: 85% gas; 15% Oil & Liquids Percent of Cash Flow (EBITDA) in 2011E: 32% gas; 68% Oil & Liquids Leading edge rig pricing continues to move up slowly Ongoing convergence of average margins toward leading edge; Continuation of this trend provides potential upside in 2011 |
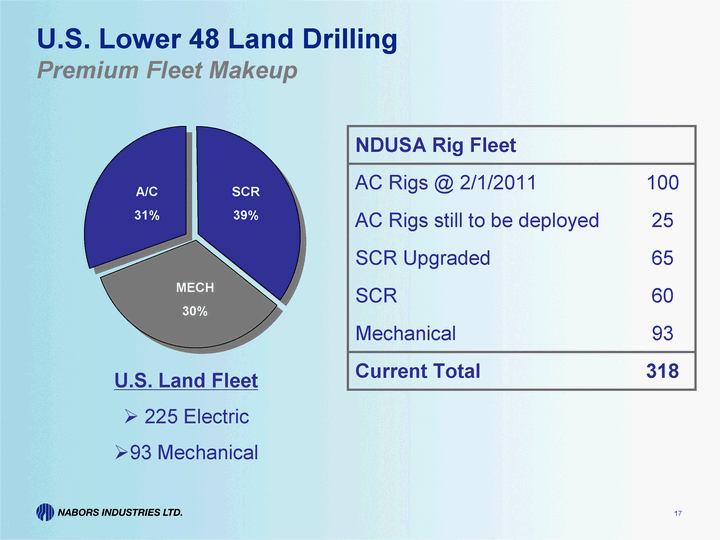
| U.S. Lower 48 Land Drilling Premium Fleet Makeup U.S. Land Fleet 225 Electric 93 Mechanical A/C 31% MECH 30% SCR 39% NDUSA Rig Fleet NDUSA Rig Fleet AC Rigs @ 2/1/2011 100 AC Rigs still to be deployed 25 SCR Upgraded 65 SCR 60 Mechanical 93 Current Total 318 |
| U.S. Lower 48 Land Drilling Recent Achievements Bakken: NDUSA rig achieved 1,000 days without recordable incident. Drilled a horizontal well in 15.88 days (spud to td) Marcellus: NDUSA rig drilled 8,000 ft in 3.88 days (spud to td) compared with major peer's published 2010 average of approximately 7.5 days. Eagle Ford: NDUSA rig drilled 19,400 ft in 20 days. This represents an approximate 3,000 ft gain for the same time period compared to major peer's January - December 2010 published average. Announced 26 AC new builds & 3 SCR upgrades in 2010. 3 upgraded SCR are economically equivalent to new builds. |
| International Drilling Full-year 2011 EBIT down 10% year-over-year 4Q 2011 EBIT should approximate 4Q 2010 EBIT Jackup repricing and downtime ? ($90) million in 2011 EBIT Largest impact in 1Q 2011 and 2Q 2011 Downtime on 4 Saudi jackups for dry dock and upgrades Lower rates on 3 jackups, 2 renewed third expected in July 6 Saudi rigs down 60 days for upgrades to gas drilling Higher rig count ? plus $70-80 million in 2011 EBIT Saudi: 5 land rigs to restart soon Iraq: 1 rig currently working, 8 rigs contracted, 3 more pending Other Venues: Generally improving activity and outlook Overall: 15+ rigs scheduled to restart in next two quarters |
| Superior Well Services Acquisition Leading provider of comprehensive, high-tech completion services 12 crews at 09/2010 ? 14 currently ? 23 by EOY 2011 Current focus on term contracts 4Q 2010 results: $54.6 million EBIT 1Q 2011 expectations down with weather impact Capacity balance not until at least mid-2012 as average number of stages increases and new oil shales develop |
| Summary & Outlook Macro Risk Still Present: Risk remains in North American Gas Markets Risk remains on International timing Nonetheless 2011 is Promising: International and U.S. Offshore - 2nd Half Turnaround Canada - growing with rig activity U.S. Land Well Servicing - growing with volume, pricing and synergies U.S. Land drilling up with new rig deployment and pricing Pressure pumping growing with price and capacity adds, hedged with long-term contracts |
| Auxiliary Information |
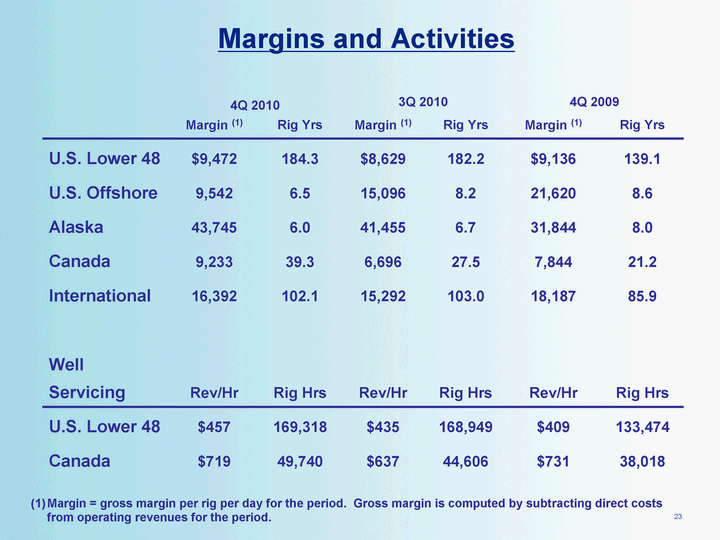
| Margins and Activities Margin = gross margin per rig per day for the period. Gross margin is computed by subtracting direct costs from operating revenues for the period. 4Q 2010 4Q 2010 3Q 2010 3Q 2010 4Q 2009 4Q 2009 Margin (1) Rig Yrs Margin (1) Rig Yrs Margin (1) Rig Yrs U.S. Lower 48 $9,472 184.3 $8,629 182.2 $9,136 139.1 U.S. Offshore 9,542 6.5 15,096 8.2 21,620 8.6 Alaska 43,745 6.0 41,455 6.7 31,844 8.0 Canada 9,233 39.3 6,696 27.5 7,844 21.2 International 16,392 102.1 15,292 103.0 18,187 85.9 Well Servicing Rev/Hr Rig Hrs Rev/Hr Rig Hrs Rev/Hr Rig Hrs U.S. Lower 48 $457 169,318 $435 168,949 $409 133,474 Canada $719 49,740 $637 44,606 $731 38,018 |
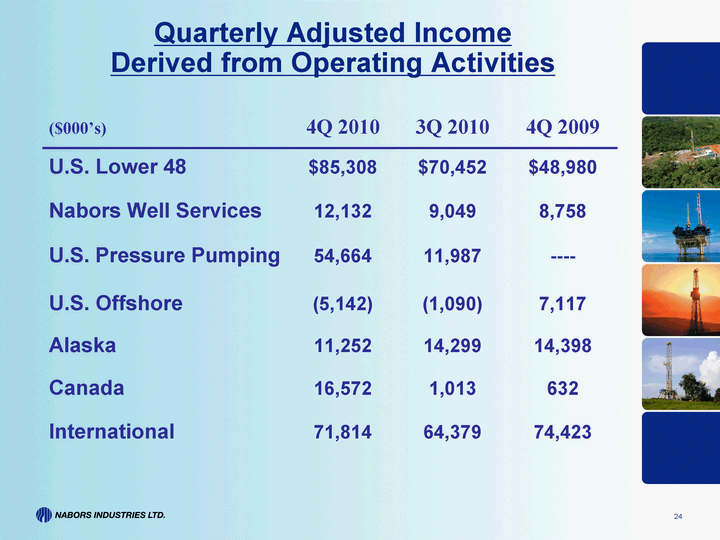
| Quarterly Adjusted Income Derived from Operating Activities ($000's) 4Q 2010 3Q 2010 4Q 2009 U.S. Lower 48 $85,308 $70,452 $48,980 Nabors Well Services 12,132 9,049 8,758 U.S. Pressure Pumping 54,664 11,987 ---- U.S. Offshore (5,142) (1,090) 7,117 Alaska 11,252 14,299 14,398 Canada 16,572 1,013 632 International 71,814 64,379 74,423 |
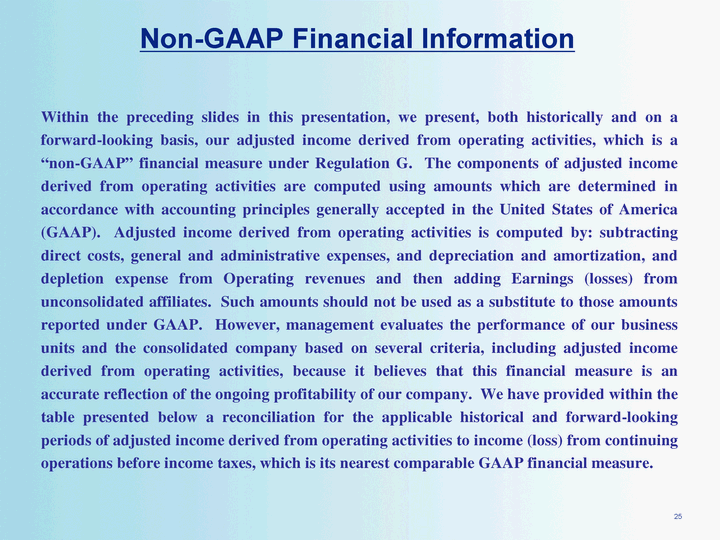
| Non-GAAP Financial Information Within the preceding slides in this presentation, we present, both historically and on a forward-looking basis, our adjusted income derived from operating activities, which is a "non-GAAP" financial measure under Regulation G. The components of adjusted income derived from operating activities are computed using amounts which are determined in accordance with accounting principles generally accepted in the United States of America (GAAP). Adjusted income derived from operating activities is computed by: subtracting direct costs, general and administrative expenses, and depreciation and amortization, and depletion expense from Operating revenues and then adding Earnings (losses) from unconsolidated affiliates. Such amounts should not be used as a substitute to those amounts reported under GAAP. However, management evaluates the performance of our business units and the consolidated company based on several criteria, including adjusted income derived from operating activities, because it believes that this financial measure is an accurate reflection of the ongoing profitability of our company. We have provided within the table presented below a reconciliation for the applicable historical and forward-looking periods of adjusted income derived from operating activities to income (loss) from continuing operations before income taxes, which is its nearest comparable GAAP financial measure. |
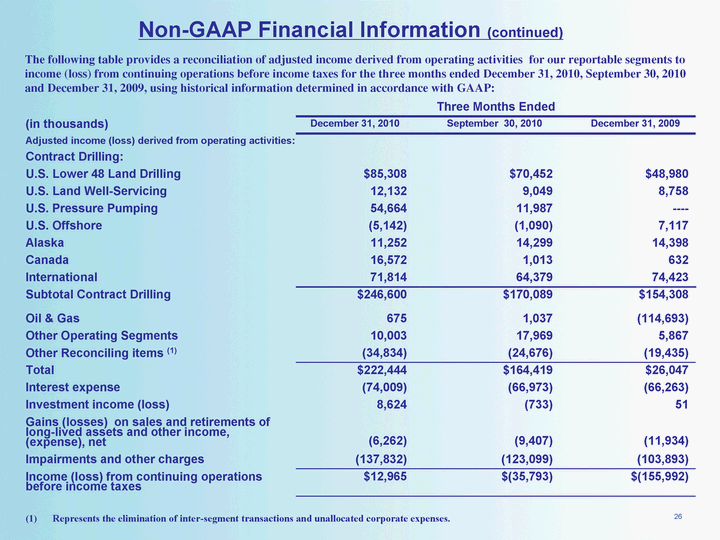
| Non-GAAP Financial Information (continued) The following table provides a reconciliation of adjusted income derived from operating activities for our reportable segments to income (loss) from continuing operations before income taxes for the three months ended December 31, 2010, September 30, 2010 and December 31, 2009, using historical information determined in accordance with GAAP: Represents the elimination of inter-segment transactions and unallocated corporate expenses. Three Months Ended Three Months Ended Three Months Ended Three Months Ended Three Months Ended (in thousands) December 31, 2010 September 30, 2010 December 31, 2009 Adjusted income (loss) derived from operating activities: Adjusted income (loss) derived from operating activities: Contract Drilling: U.S. Lower 48 Land Drilling $85,308 $70,452 $48,980 U.S. Land Well-Servicing 12,132 9,049 8,758 U.S. Pressure Pumping 54,664 11,987 ---- U.S. Offshore (5,142) (1,090) 7,117 Alaska 11,252 14,299 14,398 Canada 16,572 1,013 632 International 71,814 64,379 74,423 Subtotal Contract Drilling $246,600 $170,089 $154,308 Oil & Gas 675 1,037 (114,693) Other Operating Segments 10,003 17,969 5,867 Other Reconciling items (1) (34,834) (24,676) (19,435) Total $222,444 $164,419 $26,047 Interest expense (74,009) (66,973) (66,263) Investment income (loss) 8,624 (733) 51 Gains (losses) on sales and retirements of long-lived assets and other income, (expense), net (6,262) (9,407) (11,934) Impairments and other charges (137,832) (123,099) (103,893) Income (loss) from continuing operations before income taxes $12,965 $(35,793) $(155,992) |
