Attached files
Table of Contents
As filed with the Securities and Exchange Commission on March 28, 2011
Registration No. 333-172635
UNITED STATES
SECURITIES AND EXCHANGE COMMISSION
Washington, D.C. 20549
AMENDMENT NO. 1
TO
Form S-1
REGISTRATION STATEMENT
Under
THE SECURITIES ACT OF 1933
INPHI CORPORATION
(Exact name of registrant as specified in its charter)
| Delaware | 3674 | 77-0557980 | ||
| (State or other jurisdiction of incorporation or organization) |
(Primary Standard Industrial Classification Code Number) |
(I.R.S. Employer Identification No.) |
3945 Freedom Circle, Suite 1100
Santa Clara, California 95054
(408) 217-7300
(Address, including zip code, and telephone number, including area code, of registrant’s principal executive offices)
Young K. Sohn
Chief Executive Officer and President
3945 Freedom Circle, Suite 1100
Santa Clara, California 95054
(408) 217-7300
(Name, address, including zip code, and telephone number, including area code, of agent for service)
Copies to:
| Jorge del Calvo, Esq. Allison Leopold Tilley, Esq. Davina K. Kaile, Esq. Noelle Matteson, Esq. Pillsbury Winthrop Shaw Pittman LLP 2475 Hanover Street Palo Alto, CA 94304 (650) 233-4500 (650) 233-4545 facsimile |
Bruce K. Dallas, Esq. Davis Polk & Wardwell LLP 1600 El Camino Real Menlo Park, CA 94025 (650) 752-2000 (650) 752-2111 facsimile |
Approximate date of commencement of proposed sale to the public: As soon as practicable after this Registration Statement becomes effective.
If any of the securities being registered on this Form are to be offered on a delayed or continuous basis pursuant to Rule 415 under the Securities Act of 1933, check the following box. ¨
If this Form is filed to register additional securities for an offering pursuant to Rule 462(b) under the Securities Act, please check the following box and list the Securities Act registration statement number of the earlier effective registration statement for the same offering. ¨
If this Form is a post-effective amendment filed pursuant to Rule 462(c) under the Securities Act, check the following box and list the Securities Act registration statement number of the earlier effective registration statement for the same offering. ¨
If this Form is a post-effective amendment filed pursuant to Rule 462(d) under the Securities Act, check the following box and list the Securities Act registration statement number of the earlier effective registration statement for the same offering. ¨
Indicate by check mark whether the registrant is a large accelerated filer, an accelerated filer, a non-accelerated filer or a smaller reporting company. See the definitions of “large accelerated filer,” “accelerated filer” and smaller reporting company in Rule 12b-2 of the Exchange Act (check one):
| Large accelerated filer | ¨ | Accelerated | ¨ | |||
| Non-accelerated filer | x (Do not check if a smaller reporting company) | Smaller reporting company | ¨ |
CALCULATION OF REGISTRATION FEE
| Title of Securities Being Registered | Number of Shares Being Registered(1) |
Proposed Maximum Offering Price per Share(2) |
Proposed Maximum Offering Price |
Amount of Registration Fee(3) | ||||
| Common Stock, $0.001 par value per share |
4,351,340 | $21.51 | $93,597,323 | $10,867 | ||||
| (1) | Includes 449,366 shares of common stock issuable pursuant to an option granted to the underwriters to cover over-allotments, if any. |
| (2) | Estimated solely for the purpose of calculating the registration fee pursuant to Rule 457(c) based upon the average of the high and low prices of the Company’s Common Stock on the New York Stock Exchange on March 25, 2011. |
| (3) | A registration fee of $16,369 was previously paid. The excess fee of $5,502 should be credited to registrant’s account. |
The Registrant hereby amends this Registration Statement on such date or dates as may be necessary to delay its effective date until the Registrant shall file a further amendment which specifically states that this Registration Statement shall thereafter become effective in accordance with Section 8(a) of the Securities Act of 1933 or until the Registration Statement shall become effective on such date as the Commission, acting pursuant to said Section 8(a), may determine.
Table of Contents
The information in this prospectus is not complete and may be changed. We and the selling stockholders may not sell these securities until the registration statement filed with the Securities and Exchange Commission is effective. This prospectus is not an offer to sell these securities and neither we nor the selling stockholders are soliciting an offer to buy these securities in any state where the offer or sale is not permitted.
PROSPECTUS (Subject to Completion)
Issued March 28, 2011
3,901,974 Shares

COMMON STOCK
Inphi Corporation is offering 100,000 shares of its common stock and the selling stockholders identified in this prospectus are offering 3,801,974 shares of our common stock. We will not receive any proceeds from the sale of the shares by the selling stockholders.
Our common stock is listed on The New York Stock Exchange under the symbol “IPHI.” The closing price of our common stock as reported on The New York Stock Exchange on March 25, 2011, was $21.51 per share.
Investing in our common stock involves risks. See “Risk Factors” beginning on page 9.
PRICE $ A SHARE
| Price to |
Underwriting |
Proceeds to |
Proceeds to | |||||
| Per Share |
$ | $ | $ | $ | ||||
| Total |
$ | $ | $ | $ |
Certain selling stockholders have granted the underwriters the right to purchase up to an additional 449,366 shares of our common stock to cover over-allotments.
The Securities and Exchange Commission and state securities regulators have not approved or disapproved these securities or determined if this prospectus is truthful or complete. Any representation to the contrary is a criminal offense.
The underwriters expect to deliver the shares of common stock to purchasers on , 2011.
| MORGAN STANLEY |
DEUTSCHE BANK SECURITIES |
| RBC CAPITAL MARKETS |
||||||
| STIFEL NICOLAUS WEISEL |
||||||
| NEEDHAM & COMPANY, LLC | ||||||
| OPPENHEIMER & CO. | ||||||
, 2011
Table of Contents

Table of Contents
| Page | ||||
| 1 | ||||
| 9 | ||||
| 29 | ||||
| 30 | ||||
| Price Range of Our Common Stock |
30 | |||
| 30 | ||||
| 31 | ||||
| 32 | ||||
| 37 | ||||
| Management’s Discussion and Analysis of Financial Condition and Results of Operations |
39 | |||
| 56 | ||||
| 74 | ||||
| 82 | ||||
| 98 | ||||
| 100 | ||||
| 106 | ||||
| Material U.S. Federal Income and Estate Tax Consequences to Non-U.S. Holders |
110 | |||
| 113 | ||||
| 117 | ||||
| 117 | ||||
| 117 | ||||
| F-1 | ||||
Neither we, the selling stockholders nor the underwriters have authorized anyone to provide any information or to make any representations other than those contained in this prospectus or in any free writing prospectuses we have prepared. We take no responsibility for, and can provide no assurance as to the reliability of, any other information that others may give you. This prospectus is an offer to sell only the shares offered hereby but only under circumstances and in jurisdictions where it is lawful to do so. The information contained in this prospectus is current only as of its date. Our business, financial condition, results of operations and prospects may have changed since that date.
For investors outside the United States: Neither we, the selling stockholders nor any of the underwriters have done anything that would permit this offering or possession or distribution of this prospectus in any jurisdiction where action for that purpose is required, other than in the United States. You are required to inform yourselves about and to observe any restrictions relating to this offering and the distribution of this prospectus outside of the United States.
i
Table of Contents
This summary highlights selected information contained elsewhere in this prospectus. Because this is only a summary, it does not contain all of the information you should consider before investing in our common stock. Before making an investment decision, you should carefully read the entire prospectus, especially the risks set forth under the heading “Risk Factors” and our financial statements and related notes included elsewhere in this prospectus. References in this prospectus to “our company,” “we,” “us” and “our” refer to Inphi Corporation and its subsidiaries and predecessors during the period presented unless the context requires otherwise.
INPHI CORPORATION
We are a fabless provider of high-speed analog semiconductor solutions for the communications and computing markets. Our analog semiconductor solutions provide high signal integrity at leading-edge data speeds while reducing system power consumption. Our semiconductor solutions are designed to address bandwidth bottlenecks in networks, maximize throughput and minimize latency in computing environments and enable the rollout of next generation communications and computing infrastructures. Our solutions provide a vital high-speed interface between analog signals and digital information in high-performance systems such as telecommunications transport systems, enterprise networking equipment, datacenter and enterprise servers, storage platforms, test and measurement equipment and military systems. We provide 40G, or 40 gigabits per second, and 100G, or 100 gigabits per second, high-speed analog semiconductor solutions for the communications market and high-speed memory interface solutions for the computing market. We have a broad product portfolio with 17 product lines and over 170 products as of December 31, 2010. For the years ended December 31, 2010 and 2009, our total revenue was $83.2 million and $58.9 million, respectively, and our net income was $26.1 million and $7.3 million, respectively.
We help define industry conventions and standards within the markets we target by collaborating with technology leaders, original equipment manufacturers, or OEMs, systems manufacturers and standards bodies. Our products are designed into systems sold by OEMs, including Agilent Technologies, Inc., Alcatel-Lucent, Cisco Systems, Inc., Danaher Corporation, Dell Inc., EMC Corporation, Hewlett-Packard Company, Huawei, International Business Machines Corporation and Oracle Corporation. We believe we are one of a limited number of suppliers to these OEMs, and in some cases we may be the sole supplier for certain applications. We sell our semiconductor solutions both directly to these OEMs and to other intermediary systems or module manufacturers that, in turn, sell to these OEMs. As a result, while we cannot verify each OEM to which our products may ultimately be sold, the entities listed above represent those OEMs that we have been able to verify as end customers. During the year ended December 31, 2010, we sold our semiconductor products to more than 160 customers. Sales directly to Samsung accounted for 34% and 36% of our total revenue and sales directly and through distributors to Micron accounted for 11% and 17% of our total revenue for the years ended December 31, 2010 and 2009, respectively. Our sales to Samsung and Micron are made on a purchase order basis and we do not have long-term purchase commitments from any of our customers, including Samsung and Micron. Since 2006, we have shipped more than 100 million high-speed analog semiconductors. In 2009, we successfully introduced and began to ship a new product in production which we identify as product number INSSTE32882-GS04, or the GS04 product, and which consists of an integrated phase lock loop, or PLL, and register buffer. In a computing or storage system, in order to access the data stored in memory, a central processing unit, or CPU, is required to send command and address signals to the memory circuits. Each memory circuit connected to a CPU places a certain load, or burden, on the CPU. Therefore, there is a limit to how many memory circuits can be connected to a CPU, resulting in a limit on the memory capacity of the computing or storage system. To overcome this limit, an integrated phase lock loop, or PLL, and register buffer can be used to provide an interface between the CPU and memory to increase the memory capacity. A PLL is an electronic circuit used to synchronize a clock on an integrated circuit with an external clock source, to minimize any timing mismatches. A register buffer is an electronic circuit that allows a memory circuit to be connected to a CPU, with a reduced load on the CPU. Together, an integrated PLL and register buffer provides
1
Table of Contents
an interface between the CPU and memory to enable the installation of sufficient memory in computing and storage platforms. Sales of the GS04 product comprised 18% and 43% of our total revenue in 2010 and 2009, respectively. In 2010, we also began to ship in production volume a new “low voltage” version of our integrated PLL and register buffer, which is shipping in the form of product number INSSTE32882LV-GS02, or the GS02 product. Sales of the GS02 product comprised 32% of our total revenue in 2010. There were no other products that generated more than 10% of our total revenue in 2010, 2009 or 2008. Our total revenue increased to $83.2 million for the year ended December 31, 2010 from $58.9 million for the year ended December 31, 2009. As of December 31, 2010, our accumulated deficit was $34.6 million. Our net income increased to $26.1 million for the year ended December 31, 2010 from $7.3 million for the year ended December 31, 2009. We operate an outsourced manufacturing business model. As a result, we rely on third parties to manufacture, assemble and test our products. We also perform testing in our Westlake Village, California, facility.
The proliferation of mobile devices and wireless connectivity is driving growth in demand for network bandwidth as users seek faster access to high-definition video and multimedia content and applications. According to the Cisco Visual Networking Index, global Internet protocol, or IP, traffic is projected to increase more than four-fold from 2009 to 2014, reaching 63.9 exabytes per month in 2014. Global mobile IP traffic is a key driver of this growth, and is projected to increase at a compound annual growth rate of 108% from 2009 to 2014. In addition, the emergence of cloud computing, which allows multiple users to simultaneously execute applications and access data at high speeds, is creating additional demand for network bandwidth and computing resources. According to the IDC eXchange, New IT Cloud Services Forecast: 2009-2013, October 2009, spending on public cloud-based server and storage services is expected to grow from $3.7 billion in 2009 to $12.8 billion in 2013, representing a compound annual growth rate of 37%.
In order to handle growing network bandwidth and faster computing speeds, communications and computing systems require greater processing resources and higher access speeds. As processing power and access speeds continue to increase, it becomes more difficult for systems to achieve high signal integrity and reliable data transmission and recovery using traditional semiconductor solutions. Moreover, in many networks and computing systems, bandwidth bottlenecks arise where the physical media and traditional semiconductor solutions are incapable of supporting the increased data transfer rates and cause signal deterioration. These signal deterioration issues are typically addressed with high-speed analog semiconductors that maintain or improve signal integrity at every point of the physical interface by employing sophisticated analog signal processing techniques to accurately generate, amplify, reshape, retime and receive the transmitted data.
We leverage our proprietary high-speed analog signal processing expertise and our deep understanding of system architectures to address data bottlenecks in current and emerging communications, enterprise network, computing and storage architectures. We use our core technology and strength in high-speed analog design to enable our customers to deploy next generation communications and computing systems that operate with high performance at high speeds. We believe we are at the forefront of developing semiconductor solutions that deliver 100G speeds throughout the network infrastructure, including core, metro and the datacenter. Furthermore, our analog signal processing expertise enables us to improve throughput in computing systems. Our core competitive strengths include:
| • | System-Level Simulation Capabilities. In order to understand and solve system problems, we work closely with systems vendors to develop proprietary component, channel and system simulation models. We use these proprietary simulation and validation tools to accurately predict system performance prior to fabricating the semiconductor or alternately to identify and optimize critical semiconductor parameters to satisfy customer system requirements. |
| • | Analog Design Expertise. High-speed analog circuit design is extremely challenging at high frequencies. We believe that we are a leader in developing broadband analog semiconductors operating at frequencies of up to 100 gigahertz, or GHz. Our analog design expertise has enabled us to design and commercially ship |
2
Table of Contents
| the first 18 GHz track-and-hold amplifier, 28 GHz linear transimpedance amplifier, 40 GHz transimpedance amplifier and 50 GHz multiplexer, or MUX, and demultiplexer, or DEMUX, components. |
| • | Strong Relationships with Industry Leaders. We develop many of our high-speed analog semiconductor solutions for applications and systems that are driven by the industry leaders in the communications and computing markets. As a result of our demonstrated ability to address our customers’ technological challenges, our products have been selected to be incorporated, or “designed”, into several of their current systems and we believe we are well-positioned to continue to develop high-speed analog semiconductor solutions for their emerging architectures. For instance, our high-speed memory interface designs have been validated for Intel’s Xeon® Core i7® and next generation platforms. We also work with communication companies such as Alcatel-Lucent, Cisco and Huawei to address their next generation 100G efforts. |
| • | Broad Process Technology. We employ process technology experts, device technologists and circuit designers who have extensive experience in many process technologies including complementary metal oxide semiconductor, or CMOS, silicon germanium, or SiGe, and III-V technologies such as gallium arsenide, or GaAs, and indium phosphide, or InP. We believe that our ability to design high-speed analog semiconductors in a wide range of materials and process technologies allows us to provide superior performance, power, cost and reliability for a specific set of market requirements. |
| • | High-Speed Package Modeling and Design. We have developed deep expertise in high-speed package modeling and design, since introducing the first high-speed 50 gigahertz multiplexer and demultiplexer, or 50 GHz MUX and DEMUX, product in 2001. Our current packaging and modeling techniques enable us to deliver semiconductors that are energy efficient, offer high-speed processing and enable advanced signal integrity, all in a small footprint. |
We believe that our system-level simulation capabilities, our analog design and broad process technology design capabilities as well as our strengths in packaging enable us to differentiate ourselves by delivering advanced high-speed analog signal processing solutions. For example, we believe we have successfully demonstrated the feasibility of our next generation 100G Ethernet architecture well ahead of our competitors. Within the server market, we have applied our analog signal processing expertise to develop our isolation memory buffer, or iMB™ technology, which is designed to expand the memory capacity in existing server and computing platforms. We believe the key benefits that our solutions provide to our customers are as follows:
| • | High Performance. Our high-speed analog semiconductor solutions are designed to meet the specific technical requirements of our customers in their respective end markets. For instance, in the broadband communications market, we believe our products achieve the highest signal integrity and attain superior signal transmission distance at required error-free or low-error rates. In the computing market, we believe our products achieve industry-leading data transfer rates at the smallest die size. |
| • | Low Power and Small Footprint. In each of the end markets that we serve, the power budget of the overall system is a key consideration for the systems designers. We believe that our high-speed analog signal processing solutions enable our customers to implement system architectures that reduce overall system power consumption. We also believe that at high frequencies, our high-speed analog semiconductor devices typically consume less power than our competitors’ standard designs. In many of our applications, we are able to design and deliver semiconductors that have a smaller footprint and therefore reduce the overall system size. |
| • | Faster Time to Market. Our customers compete in markets that require high-speed, reliable semiconductors that can be integrated into their systems as soon as new market opportunities develop. To meet our customers’ time-to-market requirements, we work closely with them early in their design cycles and are actively involved in their development processes. |
3
Table of Contents
Our mission is to enable faster communications and computing infrastructure with high-speed analog semiconductor solutions that reliably capture critical analog signals, convert them to useful data, and transport the data at high speeds. Key elements of our strategy include:
| • | Focus on Markets that Require High Signal Integrity at High Speeds. We believe our target markets are driven by expected growth trends in video applications, mobile Internet and cloud computing, causing a greater demand for network bandwidth and computing speeds. We intend to continue to focus our efforts in markets where high signal integrity at high speeds is imperative. |
| • | Extend Technology Leadership in High-Speed Analog Semiconductors. We believe we employ best-in-class technology and design capabilities in our high-speed analog semiconductor solutions. We intend to continue to invest in research and development to extend our leadership in existing markets and enable the widespread deployment of our next generation technology into newer markets. |
| • | Expand Global Presence. We believe that a global presence is critical to securing design wins from both new and existing customers given the continued globalization of supply chains, particularly with respect to design and manufacturing. We plan to continue the expansion of our sales, design and technical support organization to broaden our customer reach in new markets, primarily in Asia and Europe. |
| • | Continue to Build Deep Relationships with Customers. We intend to continue to develop long-term, collaborative relationships with customers who are regarded as leaders in their respective markets. In addition, we plan to continue to work closely with customers to enable them to develop innovative solutions that address both existing and new performance challenges. |
| • | Attract and Retain Top Talent. We believe one of our key differentiators resides in the design of solutions that address complex, real world problems for our customers. In this respect, our team of analog engineers and systems designers is critical to our success. We intend to continue to aggressively recruit and seek to retain talented engineering and design personnel. |
Risk Related to Our Business
Investing in our common stock involves substantial risks, including, but not limited to, the following:
| • | Fluctuations in our Revenue and Operating Results. Our revenue and operating results can fluctuate, which could cause our stock price to decline. Factors that may contribute to these fluctuations include, but are not limited to, the reduction or cancellation of customer orders, fluctuations in the levels of component inventories held by our customers, the gain or loss of significant customers, our ability to develop and market new products and technologies on a timely basis and the timing and extent of product development costs. |
| • | History of Losses and Accumulated Deficit. As of December 31, 2010, we had an accumulated deficit of $34.6 million and have incurred net losses in each year through 2008, and we may incur net losses in the future. |
| • | Dependence on a Limited Number of Customers. We depend on a limited number of customers and products for a substantial portion of our revenue. For example, sales directly to Samsung accounted for 34% and 36% of our total revenue and sales directly and through distributors to Micron accounted for 11% and 17% of our total revenue for the years ended December 31, 2010 and 2009, respectively. Some of our customers, including Samsung and Micron, use our products primarily in high-speed memory devices. |
| • | Lack of Long-Term Purchase Commitments. Substantially all of our sales are made on a purchase order basis and we do not have long-term purchase commitments with any of our customers. The loss of, or reduction in sales to, a key customer will materially and adversely affect our operating results. |
4
Table of Contents
| • | Lengthy Sales Cycle. We must win competitive bid processes, such wins known as “design wins,” to enable us to sell our semiconductor products for use in our customers’ products. The design win process is lengthy and we may not secure the design win or generate any revenue despite incurring significant design and development expenditures. Even after securing a design win, we may experience delays in generating revenue. |
| • | Lengthy and Expensive Qualification Process. Our customers require our products and our third-party contractors to undergo lengthy, expensive and extensive qualification processes. In addition, a successful qualification does not assure any sales of the product to that customer and it can take several months or more before a customer takes volume production of components or systems that incorporate our products, if at all. |
| • | Need to Continually Develop and Introduce New Products. Our future success depends on our ability to continually develop and introduce new products to meet the changing technology and performance requirements of our customers, diversify our revenue base and generate new revenue to replace, or build upon, the success of previously introduced products which may be rapidly maturing. For example, in 2009, we successfully introduced and began to ship a new product in production which we identify as product number INSSTE32882-GS04, or the GS04 product, and which consists of an integrated PLL and register buffer. Sales of the GS04 product comprised 18% and 43% of our total revenue in 2010 and 2009, respectively. This product has now matured and, as a result, sales of this product are now declining in volume. In 2010, we also began to ship in production volume a new “low voltage” version of our integrated PLL and register buffer, which is shipping in the form of product number INSSTE32882LV-GS02, or the GS02 product. Sales of the GS02 product comprised 32% of our total revenue in 2010. |
| • | Market Development of and Demand for 100G Solutions. We are currently investing significant resources to develop semiconductor solutions supporting 100G data transmission rates. If sufficient market demand for 100G solutions does not develop or develops more slowly than expected, or if we fail to accurately predict market requirements or demand for 100G solutions, our business, competitive position and operating results would suffer. |
Before you invest in our common stock, you should carefully consider all the information in this prospectus including matters set forth under the heading “Risk Factors.”
Corporate Information
We were incorporated in Delaware in November 2000 as TCom Communications, Inc. and changed our name to Inphi Corporation in February 2001. Our principal executive offices are located at 3945 Freedom Circle, Suite 1100, Santa Clara, California 95054. Our telephone number at that location is (408) 217-7300. Our website address is www.inphi.com. Information on our website is not part of this prospectus and should not be relied upon in determining whether to make an investment decision. Substantially all of our long-lived tangible assets are located in the United States. As of December 31, 2010, the net book value of our long-lived tangible assets located outside the United States was approximately $1.3 million, which consists mainly of manufacturing fixtures used by our third-party contractors in Taiwan. In addition, we recently established our international headquarters in Singapore, from which we plan to conduct our international operations.
Inphi®, iMB™, the Inphi logo and Think Fast logo are trademarks or service marks owned by Inphi. All other trademarks, service marks and trade names appearing in this prospectus are the property of their respective owners.
5
Table of Contents
THE OFFERING
| Common stock offered by us |
100,000 shares | |
| Common stock offered by selling stockholders |
3,801,974 shares | |
| Common stock to be outstanding immediately after this offering |
26,041,014 shares (26,041,014 if the underwriters exercise their over-allotment in full) | |
| Over-allotment option |
449,366 shares | |
| Use of proceeds |
We intend to use the net proceeds from this offering for general corporate purposes, including working capital. See “Use of Proceeds.” | |
| New York Stock Exchange symbol |
“IPHI” | |
The number of shares of common stock to be outstanding immediately after this offering is based on 25,088,122 shares outstanding as of December 31, 2010, and excludes:
| • | 6,672,249 shares of common stock issuable upon the exercise of options outstanding as of December 31, 2010, at a weighted average exercise price of $3.85 per share; |
| • | 40,713 shares of common stock issuable upon the exercise of outstanding warrants at a weighted average exercise price of $1.64 per share; and |
| • | 2,032,192 shares of common stock reserved for future issuance under our 2010 Stock Incentive Plan, as well as up to 396,379 shares subject to outstanding options under our 2000 Stock Option/Stock Issuance Plan, or 2000 Stock Plan. Our 2010 Stock Incentive Plan contains provisions that will automatically increase its share reserve each year, as more fully described in “Executive Compensation—Employee Benefit Plans.” |
Unless otherwise stated, all information in this prospectus assumes:
| • | no exercise of options or warrants outstanding as of December 31, 2010, except for 852,892 shares to be issued and sold in this offering upon the exercise of vested stock options, at a weighted average exercise price of $1.67 per share; and |
| • | no exercise by the underwriters of their option to purchase additional shares. |
6
Table of Contents
SUMMARY CONSOLIDATED FINANCIAL INFORMATION
The information set forth below should be read together with “Capitalization,” “Selected Financial Data,” “Management’s Discussion and Analysis of Financial Condition and Results of Operations” and our consolidated financial statements and related notes included elsewhere in this prospectus.
The summary statements of operations data for the years ended December 31, 2010, 2009 and 2008 have been derived from our audited financial statements included elsewhere in this prospectus. Historical results are not necessarily indicative of the results to be expected in the future, and results of interim periods are not necessarily indicative of results for the entire year.
| Year Ended December 31, | ||||||||||||
| 2010 | 2009 | 2008 | ||||||||||
| (in thousands, except share and per share data) |
||||||||||||
| Statements of Operations Data: |
||||||||||||
| Revenue |
$ | 55,253 | $ | 37,617 | $ | 32,727 | ||||||
| Revenue from related party(1) |
27,940 | 21,235 | 10,227 | |||||||||
| Total revenue |
83,193 | 58,852 | 42,954 | |||||||||
| Cost of revenue |
29,438 | 21,269 | 19,249 | |||||||||
| Gross profit |
53,755 | 37,583 | 23,705 | |||||||||
| Total operating expense(2) |
41,816 | 29,498 | 27,009 | |||||||||
| Income (loss) from operations |
11,939 | 8,085 | (3,304 | ) | ||||||||
| Other income (expense) |
(50 | ) | 73 | (124 | ) | |||||||
| Income (loss) before income taxes |
11,889 | 8,158 | (3,428 | ) | ||||||||
| Provision (benefit) for income taxes(3) |
(14,242 | ) | 829 | — | ||||||||
| Net income (loss) |
$ | 26,131 | $ | 7,329 | $ | (3,428 | ) | |||||
| Net income (loss) allocable to common stockholders |
$ | 5,240 | $ | 130 | $ | (3,428 | ) | |||||
| Net income (loss) per share: |
||||||||||||
| Basic |
$ | 1.03 | $ | 0.08 | $ | (2.66 | ) | |||||
| Diluted |
$ | 0.61 | $ | 0.05 | $ | (2.66 | ) | |||||
| Weighted-average shares used in computing net income (loss) per share: |
||||||||||||
| Basic |
5,086,169 | 1,668,876 | 1,289,431 | |||||||||
| Diluted |
8,546,537 | 2,785,277 | 1,289,431 | |||||||||
| (1) | Revenue from related party consists of revenue from Samsung, which, together with associated entities, held over 13% of our outstanding shares of common stock before our initial public offering. After our initial public offering in November 2010, Samsung, together with associated entities, holds less than 10% of our outstanding shares of common stock. Revenue from Samsung for the entire year of 2010 was presented as revenue from related party. |
Footnotes continued on the following page.
7
Table of Contents
| As of December 31, 2010 | ||||||||
| Actual | As Adjusted | |||||||
| (in thousands) | ||||||||
| Balance Sheet Data: |
||||||||
| Cash and cash equivalents |
$ | 110,172 | $ | 112,979 | ||||
| Working capital |
116,887 | 119,694 | ||||||
| Total assets |
158,957 | 161,764 | ||||||
| Total liabilities |
16,271 | 16,271 | ||||||
| Total stockholders’ equity |
142,686 | 145,493 | ||||||
The preceding table presents a summary of our balance sheet data as of December 31, 2010:
| • | on an actual basis; and |
| • | on an adjusted basis to give effect to the sale by stockholders of 852,892 shares of common stock to be issued upon exercise of vested stock options immediately prior to completion of this offering with net proceeds to us of $1.4 million and the sale of 100,000 shares of common stock in this offering at an assumed public offering price of $21.51 per share (the closing price of our common stock as reported on the New York Stock Exchange on March 25, 2011), after deducting the estimated underwriting discounts and commissions and estimated offering expenses payable by us. |
A $1.00 increase (decrease) in the assumed public offering price of $21.51 per share would increase (decrease), on an as adjusted basis, each of cash and cash equivalents, total assets and total stockholders’ equity by approximately $95,750, assuming the number of shares offered by us, as set forth on the cover page of this prospectus, remains the same and after deducting the estimated underwriting discounts and commissions and estimated offering expenses payable by us. The as adjusted information discussed above is illustrative only and will be adjusted based on the actual public offering price and other terms of this offering determined at pricing.
Footnotes continued from the prior page.
| (2) | Stock-based compensation expense is included in our results of operations as follows: |
| Year Ended December 31, | ||||||||||||
| 2010 | 2009 | 2008 | ||||||||||
| (in thousands) | ||||||||||||
| Operating expense: |
||||||||||||
| Cost of revenue |
$ | 107 | $ | 31 | $ | 119 | ||||||
| Research and development |
1,381 | 475 | 358 | |||||||||
| Sales and marketing |
526 | 238 | 101 | |||||||||
| General and administrative |
691 | 421 | 417 | |||||||||
| (3) | The provision (benefit) for income taxes for the years ended December 31, 2010 and 2009 included the releases and reversals of valuation allowances against deferred tax assets provided in prior periods. Please see note 7 to the notes to our consolidated financial statements. |
8
Table of Contents
Investing in our common stock involves a high degree of risk. You should carefully consider the risks described below before making a decision to buy our common stock. The risks and uncertainties described below are not the only ones we face. If any of the following risks actually occurs, our business, financial condition, results of operations or growth prospects could be harmed. In that case, the trading price of our common stock could decline and you might lose all or part of your investment in our common stock. Additional risks and uncertainties not currently known to us or that we currently deem immaterial may also impair our business operations. You should also refer to the other information set forth in this prospectus, including our financial statements and the related notes.
Risks Related to Our Business
Our revenue and operating results can fluctuate from period to period, which could cause our share price to fluctuate.
Our revenue and operating results have fluctuated in the past and may fluctuate from period to period in the future due to a variety of factors, many of which are beyond our control. Factors relating to our business that may contribute to these fluctuations include the following factors, as well as other factors described elsewhere in this prospectus:
| • | the receipt, reduction or cancellation of orders by customers; |
| • | fluctuations in the levels of component inventories held by our customers; |
| • | the gain or loss of significant customers; |
| • | market acceptance of our products and our customers’ products; |
| • | our ability to develop, introduce and market new products and technologies on a timely basis; |
| • | the timing and extent of product development costs; |
| • | new product announcements and introductions by us or our competitors; |
| • | incurrence of research and development and related new product expenditures; |
| • | fluctuations in sales by module manufacturers who incorporate our semiconductor solutions in their products, such as memory modules; |
| • | cyclical fluctuations in our markets; |
| • | fluctuations in our manufacturing yields; |
| • | significant warranty claims, including those not covered by our suppliers; |
| • | changes in our product mix or customer mix; |
| • | intellectual property disputes; and |
| • | loss of key personnel or the inability to attract qualified engineers. |
As a result of these and other factors, the results of any prior quarterly or annual periods should not be relied upon as indications of our future revenue or operating performance. Fluctuations in our revenue and operating results could cause our share price to decline.
We have an accumulated deficit and have incurred net losses in the past. We may incur net losses in the future.
As of December 31, 2010, we had an accumulated deficit of $34.6 million. We have incurred net losses in each year through 2008. We generated net income (loss) of $26.1 million, $7.3 million and $(3.4) million for the years ended December 31, 2010, 2009 and 2008, respectively. We may incur net losses in the future.
9
Table of Contents
We depend on a limited number of customers for a substantial portion of our revenue, and the loss of, or a significant reduction in orders from, one or more of our major customers could negatively impact our revenue and operating results. In addition, if we offer more favorable prices to attract or retain customers, our average selling prices and gross margins would decline.
For the year ended December 31, 2010, our 10 largest customers collectively accounted for 76% of our total revenue. Sales directly to Samsung accounted for 34% and 36% of our total revenue and sales directly and through distributors to Micron accounted for 11% and 17% of our total revenue for the years ended December 31, 2010 and 2009, respectively. Some of our customers, including Samsung and Micron, use our products primarily in high-speed memory devices. We believe our operating results for the foreseeable future will continue to depend on sales to a relatively small number of customers. In the future, these customers may decide not to purchase our products at all, may purchase fewer products than they did in the past or may alter their purchasing patterns.
In addition, our relationships with some customers may deter other potential customers who compete with these customers from buying our products. To attract new customers or retain existing customers, we may offer these customers favorable prices on our products. In that event, our average selling prices and gross margins would decline. The loss of a key customer, a reduction in sales to any key customer or our inability to attract new significant customers could negatively impact our revenue and materially and adversely affect our results of operations.
We do not have long-term purchase commitments from our customers and if our customers cancel or change their purchase commitments, our revenue and operating results could suffer.
Substantially all of our sales to date, including sales to Samsung and Micron, have been made on a purchase order basis. We do not have any long-term commitments with any of our customers. As a result, our customers may cancel, change or delay product purchase commitments with little or no notice to us and without penalty. This in turn could cause our revenue to decline and materially and adversely affect our results of operations.
We may face claims of intellectual property infringement, which could be time-consuming, costly to defend or settle and result in the loss of significant rights and which could harm our relationships with our customers and distributors.
The semiconductor industry is characterized by companies that hold patents and other intellectual property rights and that vigorously pursue, protect and enforce intellectual property rights. From time to time, third parties may assert against us and our customers and distributors their patent and other intellectual property rights to technologies that are important to our business.
Claims that our products, processes or technology infringe third-party intellectual property rights, regardless of their merit or resolution, could be costly to defend or settle and could divert the efforts and attention of our management and technical personnel. For example, Netlist, Inc. filed suit against us in the United States District Court, Central District of California, in September 2009, alleging that our iMB™ and certain other memory module components infringe three of Netlist’s patents. For more details, see “Business—Legal Proceedings.”
Infringement claims also could harm our relationships with our customers or distributors and might deter future customers from doing business with us. We do not know whether we will prevail in these proceedings given the complex technical issues and inherent uncertainties in intellectual property litigation. If any pending or future proceedings result in an adverse outcome, we could be required to:
| • | cease the manufacture, use or sale of the infringing products, processes or technology; |
| • | pay substantial damages for infringement; |
| • | expend significant resources to develop non-infringing products, processes or technology, which may not be successful; |
10
Table of Contents
| • | license technology from the third-party claiming infringement, which license may not be available on commercially reasonable terms, or at all; |
| • | cross-license our technology to a competitor to resolve an infringement claim, which could weaken our ability to compete with that competitor; or |
| • | pay substantial damages to our customers or end users to discontinue their use of or to replace infringing technology sold to them with non-infringing technology, if available. |
Any of the foregoing results could have a material adverse effect on our business, financial condition and results of operations.
Winning business is subject to lengthy competitive selection processes that require us to incur significant expenditures prior to generating any revenue or without any guarantee of any revenue related to this business. Even if we begin a product design, a customer may decide to cancel or change its product plans, which could cause us to generate no revenue from a product. If we fail to generate revenue after incurring substantial expenses to develop our products, our business and operating results would suffer.
We are focused on winning more competitive bid processes, known as “design wins,” that enable us to sell our high-speed analog semiconductor solutions for use in our customers’ products. These selection processes typically are lengthy and can require us to incur significant design and development expenditures and dedicate scarce engineering resources in pursuit of a single customer opportunity. We may not win the competitive selection process and may never generate any revenue despite incurring significant design and development expenditures. Failure to obtain a design win could prevent us from offering an entire generation of a product. This could cause us to lose revenue and require us to write off obsolete inventory, and could weaken our position in future competitive selection processes. Even after securing a design win, we may experience delays in generating revenue from our products as a result of the lengthy development cycle typically required. Our customers generally take a considerable amount of time to evaluate our products. Our design cycle from initial engagement to volume shipment is typically two to three years.
The delays inherent in these lengthy sales cycles increase the risk that a customer will decide to cancel, curtail, reduce or delay its product plans or adopt a competing design from one of our competitors, causing us to lose anticipated revenue. In addition, any delay or cancellation of a customer’s plans could materially and adversely affect our financial results, as we may have incurred significant expense without generating any revenue. Finally, our customers’ failure to successfully market and sell their products could reduce demand for our products and materially and adversely affect our business, financial condition and results of operations. If we were unable to generate revenue after incurring substantial expenses to develop any of our products, our business would suffer.
Our customers require our products and our third-party contractors to undergo a lengthy and expensive qualification process which does not assure product sales. If we are unsuccessful in or delayed in qualifying any of our products with a customer, our business and operating results would suffer.
Prior to purchasing our products, our customers require that both our products and our third-party contractors undergo extensive qualification processes, which involve testing of our products in the customers’ systems, as well as testing for reliability. This qualification process may continue for several months. However, qualification of a product by a customer does not assure any sales of the product to that customer. Even after successful qualification and sales of a product to a customer, a subsequent revision in our third party contractors’ manufacturing process or our selection of a new supplier may require a new qualification process with our customers, which may result in delays and in our holding excess or obsolete inventory. After our products are qualified, it can take several months or more before the customer commences volume production of components or systems that incorporate our products. Despite these uncertainties, we devote substantial resources, including design, engineering, sales, marketing and management efforts, to qualifying our products with customers in anticipation of sales. If we are unsuccessful or delayed in qualifying any of our products with a customer, sales of those products to the customer may be precluded or delayed, which may impede our growth and cause our business to suffer.
11
Table of Contents
The complexity of our products could result in undetected defects and we may be subject to warranty claims and product liability, which could result in a decrease in customers and revenue, unexpected expenses and loss of market share. In addition, our product liability insurance may not adequately cover our costs arising from products defects or otherwise.
Our products are sold as components or as modules for use in larger electronic equipment sold by our customers. A product usually goes through an intense qualification and testing period performed by our customers before being used in production. We primarily outsource our product testing to third parties and also perform some testing in our Westlake Village, California, facility. We inspect and test parts, or have them inspected and tested in order to screen out parts that may be weak or potentially suffer a defect incurred through the manufacturing process. From time to time, we are subject to warranty or product liability claims that may require us to make significant expenditures to defend these claims or pay damage awards. For example, in September 2010, we were informed of a claim related to repair and replacement costs in connection with shipments of over 4,000 integrated circuits made by us during the summer and fall of 2009. Of these shipments, approximately 4% were later confirmed or suspected to have random manufacturing process anomalies in the wafer die in the product. Based on our standard warranty provisions, we provided replacement parts to the customer for the known and suspected failures that had occurred. In addition, and without informing us, in the fall of 2009, the customer instituted its own larger scale replacement program that covered the replacement of entire subassemblies in which our product was only one component. In September 2010, the customer made an initial claim for approximately $18 million against us for the costs incurred relative to that program. We believe the amount of the claim is without merit as our warranty liability is contractually limited to the repair or replacement of the affected Inphi products, which, to the extent the customer has requested replacement, has already been completed. A formal claim has yet to be made and discussions with the customer are ongoing. However, claims of this nature are subject to various risks and uncertainties and there can be no assurance that this matter will be resolved without further significant costs to us, including the potential for arbitration or litigation.
Generally, our agreements seek to limit our liability to the replacement of the part or to the revenue received for the product, but these limitations on liability may not be effective or sufficient in scope in all cases. If a customer’s equipment fails in use, the customer may incur significant monetary damages including an equipment recall or associated replacement expenses, as well as lost revenue. The customer may claim that a defect in our product caused the equipment failure and assert a claim against us to recover monetary damages. The process of identifying a defective or potentially defective product in systems that have been widely distributed may be lengthy and require significant resources, and we may incur significant replacement costs and contract damage claims from our customers as well as harm to our reputation. In certain situations, circumstances might warrant that we consider incurring the costs or expense related to a recall of one of our products in order to avoid the potential claims that may be raised should the customer reasonably rely upon our product only to suffer a failure due to a design or manufacturing process defect. Defects in our products could harm our relationships with our customers and damage our reputation. Customers may be reluctant to buy our products, which could harm our ability to retain existing customers and attract new customers and our financial results. In addition, the cost of defending these claims and satisfying any arbitration award or judicial judgment with respect to these claims could harm our business prospects and financial condition. Although we carry product liability insurance, this insurance may not adequately cover our costs arising from defects in our products or otherwise.
We rely on our relationships with industry and technology leaders to enhance our product offerings and our inability to continue to develop or maintain such relationships in the future would harm our ability to remain competitive.
We develop many of our semiconductor products for applications in systems that are driven by industry and technology leaders in the communications and computing markets. We also work with OEMs, system manufacturers and standards bodies to define industry conventions and standards within our target markets. We believe these relationships enhance our ability to achieve market acceptance and widespread adoption of our products. If we are unable to continue to develop or maintain these relationships, our semiconductor solutions would become less desirable to our customers, our sales would suffer and our competitive position could be harmed.
12
Table of Contents
If we fail to accurately anticipate and respond to market trends or fail to develop and introduce new or enhanced products to address these trends on a timely basis, our ability to attract and retain customers could be impaired and our competitive position could be harmed.
We operate in industries characterized by rapidly changing technologies and industry standards as well as technological obsolescence. We have developed products that may have long product life cycles of 10 years or more, as well as other products in more volatile high growth or rapidly changing areas, which may have shorter life cycles of only two to three years. We believe that our future success depends on our ability to develop and introduce new technologies and products that generate new sources of revenue to replace, or build upon, existing product revenue streams that may be dependent upon limited product life cycles. If we are not able to repeatedly introduce, in successive years, new products that ship in volume, our revenue will likely not grow and may decline significantly and rapidly. In 2009, we successfully introduced and began to ship a new product in production which we identify as product number INSSTE32882-GS04, or the GS04 product, and which consists of an integrated phase lock loop, or PLL, and register buffer. Sales of the GS04 product comprised 18% and 43% of our total revenue in 2010 and 2009, respectively. In 2010, we also began to ship in production volume a new “low voltage” version of our integrated PLL and register buffer, which is shipping in the form of product number INSSTE32882LV-GS02, or the GS02 product. Sales of the GS02 product comprised 32% of our total revenue in 2010. There were no other products that generated more than 10% of our total revenue in 2010, 2009 or 2008. As we continued to grow our business in 2010, the GS04 product matured. As a result, sales of the GS04 product are now declining in volume. We currently expect that by 2011 the GS04 product will no longer be material to our total revenue. This underscores the importance of the need for us to continually develop and introduce new products to diversify our revenue base as well as generate new revenue to replace and build upon the success of previously introduced products which may be rapidly maturing.
To compete successfully, we must design, develop, market and sell new or enhanced products that provide increasingly higher levels of performance and reliability while meeting the cost expectations of our customers. The introduction of new products by our competitors, the delay or cancellation of a platform for which any of our semiconductor solutions are designed, the market acceptance of products based on new or alternative technologies or the emergence of new industry standards could render our existing or future products uncompetitive from a pricing standpoint, obsolete and otherwise unmarketable. Our failure to anticipate or timely develop new or enhanced products or technologies in response to technological shifts could result in decreased revenue and our competitors winning design wins. In particular, we may experience difficulties with product design, manufacturing, marketing or certification that could delay or prevent our development, introduction or marketing of new or enhanced products. Although we believe our products are fully compliant with applicable industry standards, proprietary enhancements may not in the future result in full conformance with existing industry standards under all circumstances. Due to the interdependence of various components in the systems within which our products and the products of our competitors operate, customers are unlikely to change to another design, once adopted, until the next generation of a technology. As a result, if we fail to introduce new or enhanced products that meet the needs of our customers or penetrate new markets in a timely fashion, and our designs do not gain acceptance, we will lose market share and our competitive position, very likely on an extended basis, and operating results will be adversely affected.
If sufficient market demand for 100G solutions does not develop or develops more slowly than expected, or if we fail to accurately predict market requirements or market demand for 100G solutions, our business, competitive position and operating results would suffer.
We are currently investing significant resources to develop semiconductor solutions supporting 100G data transmission rates in order to increase the number of such solutions in our product line. If we fail to accurately predict market requirements or market demand for 100G semiconductor solutions, or if our 100G semiconductor solutions are not successfully developed or competitive in the industry, our business will suffer. If 100G networks are deployed to a lesser extent or more slowly than we currently anticipate, we may not realize any benefits from our investment. As a result, our business, competitive position, market share and operating results would suffer.
13
Table of Contents
Our target markets may not grow or develop as we currently expect and are subject to market risks, any of which could materially harm our business, revenue and operating results.
To date, a substantial portion of our revenue has been attributable to demand for our products in the communications and computing markets and the growth of these overall markets. These markets have fluctuated in size and growth in recent times. Our operating results are impacted by various trends in these markets. These trends include the deployment and broader market adoption of next generation technologies, such as 40 gigabits per second, or Gbps or G, and 100G, in communications and enterprise networks, timing of next generation network upgrades, the introduction and broader market adoption of next generation server platforms, timing of enterprise upgrades and the introduction and deployment of high-speed memory interfaces in computing platforms. We are unable to predict the timing or direction of the development of these markets with any accuracy. For example, we expect that the deployment of different types of memory devices for which our iMB™ product is designed will be substantially dependent on the development of next generation server platforms. We have not generated any significant revenue from our iMB™ product to date, and if the development or adoption of next generation server platforms is delayed, or if these server platforms do not interoperate with memory devices for which our iMB™ product is designed, we may not realize revenue from our iMB™ product. In addition, because some of our products are not limited in the systems or geographic areas in which they may be deployed, we cannot always determine with accuracy how, where or into which applications our products are being deployed. If our target markets do not grow or develop in ways that we currently expect, demand for our semiconductor products may decrease and our business and operating results could suffer.
We rely on a limited number of third parties to manufacture, assemble and test our products, and the failure to manage our relationships with our third-party contractors successfully could adversely affect our ability to market and sell our products and our reputation. Our revenue and operating results would suffer if these third parties fail to deliver products or components in a timely manner and at reasonable cost or if manufacturing capacity is reduced or eliminated as we may be unable to obtain alternative manufacturing capacity.
We operate an outsourced manufacturing business model. As a result, we rely on third-party foundry wafer fabrication and assembly and test capacity. We also perform testing in our Westlake Village, California, facility. We generally use a single foundry for the production of each of our various semiconductors. Currently, our principal foundries are Global Communications Semiconductors, Inc., or GCS, Sumitomo Electric Device Innovations Inc., Taiwan Semiconductor Manufacturing Company Ltd., or TSMC, TowerJazz Semiconductor Ltd., United Monolithic Semiconductors S.A.S., or UMS, and WIN Semiconductors Corp. We also use third-party contract manufacturers for a significant majority of our assembly and test operations, including Kyocera Corporation, Natel Engineering Co., Inc., Orient Semiconductor Electronics Ltd., or OSE, Presto Engineering, Signetics Korea Co., Ltd. and STATS ChipPAC Ltd.
Relying on third-party manufacturing, assembly and testing presents significant risks to us, including the following:
| • | failure by us, our customers or their end customers to qualify a selected supplier; |
| • | capacity shortages during periods of high demand; |
| • | reduced control over delivery schedules and quality; |
| • | shortages of materials; |
| • | misappropriation of our intellectual property; |
| • | limited warranties on wafers or products supplied to us; and |
| • | potential increases in prices. |
The ability and willingness of our third-party contractors to perform is largely outside our control. If one or more of our contract manufacturers or other outsourcers fails to perform its obligations in a timely manner or at
14
Table of Contents
satisfactory quality levels, our ability to bring products to market and our reputation could suffer. For example, if that manufacturing capacity is reduced or eliminated at one or more facilities, including as a response to the recent worldwide decline in the semiconductor industry, or any of those facilities are unable to keep pace with the growth of our business, we could have difficulties fulfilling our customer orders and our revenue could decline. In addition, if these third parties fail to deliver quality products and components on time and at reasonable prices, we could have difficulties fulfilling our customer orders, our revenue could decline and our business, financial condition and results of operations would be adversely affected.
Additionally, as many of our fabrication and assembly and test contractors are located in the Pacific Rim region, principally in Taiwan, our manufacturing capacity may be similarly reduced or eliminated due to natural disasters, political unrest, war, labor strikes, work stoppages or public health crises, such as outbreaks of H1N1 flu. This could cause significant delays in shipments of our products until we are able to shift our manufacturing, assembly or test from the affected contractor to another third-party vendor. There can be no assurance that alternative capacity could be obtained on favorable terms, if at all.
Our costs may increase substantially if the wafer foundries that supply our products do not achieve satisfactory product yields or quality.
The wafer fabrication process is an extremely complicated process where the slightest changes in the design, specifications or materials can result in material decreases in manufacturing yields or even the suspension of production. From time to time, our third-party wafer foundries have experienced, and are likely to experience manufacturing defects and reduced manufacturing yields related to errors or problems in their manufacturing processes or the interrelationship of their processes with our designs. In some cases, our third-party wafer foundries may not be able to detect these defects early in the fabrication process or determine the cause of such defects in a timely manner. We may incur substantial research and development expense for prototype or development stage products as we qualify the products for production.
Generally, in pricing our semiconductors, we assume that manufacturing yields will continue to increase, even as the complexity of our semiconductors increases. Once our semiconductors are initially qualified with our third-party wafer foundries, minimum acceptable yields are established. We are responsible for the costs of the wafers if the actual yield is above the minimum. If actual yields are below the minimum we are not required to purchase the wafers. The minimum acceptable yields for our new products are generally lower at first and increase as we achieve full production. Unacceptably low product yields or other product manufacturing problems could substantially increase the overall production time and costs and adversely impact our operating results on sales of our products. Product yield losses will increase our costs and reduce our gross margin. In addition to significantly harming our operating results and cash flow, poor yields may delay shipment of our products and harm our relationships with existing and potential customers.
We do not have any long-term supply contracts with our contract manufacturers or suppliers, and any disruption in our supply of products or materials could have a material adverse affect on our business, revenue and operating results.
We currently do not have long-term supply contracts with any of our third-party contract manufacturers. We make substantially all of our purchases on a purchase order basis, and our contract manufacturers are not required to supply us products for any specific period or in any specific quantity. We expect that it would take approximately nine to 12 months to transition from our current foundry or assembly services to new providers. Such a transition would likely require a qualification process by our customers or their end customers. We generally place orders for products with some of our suppliers several months prior to the anticipated delivery date, with order volumes based on our forecasts of demand from our customers. Accordingly, if we inaccurately forecast demand for our products, we may be unable to obtain adequate and cost-effective foundry or assembly capacity from our third-party contractors to meet our customers’ delivery requirements, or we may accumulate excess inventories. On occasion, we have been unable to adequately respond to unexpected increases in customer
15
Table of Contents
purchase orders and therefore were unable to benefit from this incremental demand. None of our third-party contract manufacturers have provided any assurance to us that adequate capacity will be available to us within the time required to meet additional demand for our products.
Our foundry vendors and assembly and test vendors may allocate capacity to the production of other companies’ products while reducing deliveries to us on short notice. In particular, other customers that are larger and better financed than us or that have long-term agreements with our foundry vendor or assembly and test vendors may cause our foundry vendor or assembly and test vendors to reallocate capacity to those customers, decreasing the capacity available to us. We do not have long-term supply contracts with our third-party contract manufacturers and if we enter into costly arrangements with suppliers that include nonrefundable deposits or loans in exchange for capacity commitments, commitments to purchase specified quantities over extended periods or investment in a foundry, our operating results could be harmed. We may not be able to make any such arrangement in a timely fashion or at all, and any arrangements may be costly, reduce our financial flexibility, and not be on terms favorable to us. Moreover, if we are able to secure foundry capacity, we may be obligated to use all of that capacity or incur penalties. These penalties may be expensive and could harm our financial results. To date, we have not entered into such arrangements with our suppliers. If we need another foundry or assembly and test subcontractor because of increased demand, or if we are unable to obtain timely and adequate deliveries from our providers, we might not be able to cost effectively and quickly retain other vendors to satisfy our requirements.
Many of our customers depend on us as the sole source for a number of our products. If we are unable to deliver these products as the sole supplier or as one of a limited number of suppliers, our relationships with these customers and our business would suffer.
A number of our customers do not have alternative sources for our semiconductor solutions and depend on us as the sole supplier or as one of a limited number of suppliers for these products. Since we outsource our manufacturing to third-party contractors, our ability to deliver our products is substantially dependent on the ability and willingness of our third-party contractors to perform, which is largely outside our control. A failure to deliver our products in sufficient quantities or at all to our customers that depend on us as a sole supplier or as one of a limited number of suppliers may be detrimental to their business and, as a result, our relationship with the customer would be negatively impacted. If we are unable to maintain our relationships with these customers after such failure, our business and financial results may be harmed.
If we are unable to attract, train and retain qualified personnel, particularly our design and technical personnel, we may not be able to execute our business strategy effectively.
Our future success depends on our ability to attract and retain qualified personnel, including our management, sales and marketing, and finance, and particularly our design and technical personnel. We do not know whether we will be able to retain all of these personnel as we continue to pursue our business strategy. Historically, we have encountered difficulties in hiring qualified engineers because there is a limited pool of engineers with the expertise required in our field. Competition for these personnel is intense in the semiconductor industry. As the source of our technological and product innovations, our design and technical personnel represent a significant asset. The loss of the services of one or more of our key employees, especially our key design and technical personnel, or our inability to attract and retain qualified design and technical personnel, could harm our business, financial condition and results of operations.
We may not be able to effectively manage our growth, and we may need to incur significant expenditures to address the additional operational and control requirements of our growth, either of which could harm our business and operating results.
To effectively manage our growth, we must continue to expand our operational, engineering and financial systems, procedures and controls and to improve our accounting and other internal management systems. This
16
Table of Contents
may require substantial managerial and financial resources, and our efforts in this regard may not be successful. Our current systems, procedures and controls may not be adequate to support our future operations. If we fail to adequately manage our growth, or to improve our operational, financial and management information systems, or fail to effectively motivate or manage our new and future employees, the quality of our products and the management of our operations could suffer, which could adversely affect our operating results.
We face intense competition and expect competition to increase in the future. If we fail to compete effectively, it could have an adverse effect on our revenue, revenue growth rate, if any, and market share.
The global semiconductor market in general, and the communications and computing markets in particular, are highly competitive. We compete or plan to compete in different target markets to various degrees on the basis of a number of principal competitive factors, including product performance, power budget, features and functionality, customer relationships, size, ease of system design, product roadmap, reputation and reliability, customer support and price. We expect competition to increase and intensify as more and larger semiconductor companies enter our markets. Increased competition could result in price pressure, reduced profitability and loss of market share, any of which could materially and adversely affect our business, revenue and operating results.
Currently, our competitors range from large, international companies offering a wide range of semiconductor products to smaller companies specializing in narrow markets. Our primary competitors include Broadcom Corporation, Hittite Microwave Corporation, Integrated Device Technology, Inc. and Texas Instruments Incorporated, as well as other analog signal processing companies. We expect competition in the markets in which we participate to increase in the future as existing competitors improve or expand their product offerings. In addition, as we develop our 100G semiconductor solution, we may face competition from companies such as Broadcom and NetLogic Microsystems, Inc.
Our ability to compete successfully depends on elements both within and outside of our control, including industry and general economic trends. During past periods of downturns in our industry, competition in the markets in which we operate intensified as our customers reduced their purchase orders. Many of our competitors have substantially greater financial and other resources with which to withstand similar adverse economic or market conditions in the future. These developments may materially and adversely affect our current and future target markets and our ability to compete successfully in those markets.
We use a significant amount of intellectual property in our business. Monitoring unauthorized use of our intellectual property can be difficult and costly and if we are unable to protect our intellectual property, our business could be adversely affected.
Our success depends in part upon our ability to protect our intellectual property. To accomplish this, we rely on a combination of intellectual property rights, including patents, copyrights, trademarks and trade secrets in the United States and in selected foreign countries where we believe filing for such protection is appropriate. Effective protection of our intellectual property rights may be unavailable, limited or not applied for in some countries. Some of our products and technologies are not covered by any patent or patent application, as we do not believe patent protection of these products and technologies is critical to our business strategy at this time. A failure to timely seek patent protection on products or technologies generally precludes us from seeking future patent protection on these products or technologies. We cannot guarantee that:
| • | any of our present or future patents or patent claims will not lapse or be invalidated, circumvented, challenged or abandoned; |
| • | our intellectual property rights will provide competitive advantages to us; |
| • | our ability to assert our intellectual property rights against potential competitors or to settle current or future disputes will not be limited by our agreements with third parties; |
| • | any of our pending or future patent applications will be issued or have the coverage originally sought; |
17
Table of Contents
| • | our intellectual property rights will be enforced in jurisdictions where competition may be intense or where legal protection may be weak; |
| • | any of the trademarks, copyrights, trade secrets or other intellectual property rights that we presently employ in our business will not lapse or be invalidated, circumvented, challenged or abandoned; or |
| • | we will not lose the ability to assert our intellectual property rights against or to license our technology to others and collect royalties or other payments. |
For example, we filed a complaint against Netlist in Federal District Court in November 2009 alleging that Netlist infringes two of our patents. Netlist asserts in its amended answer to the complaint that it does not infringe the patents, that the patents are invalid and that one of the patents is unenforceable due to inequitable conduct before the United States Patent and Trademark Office, or the USPTO. For more details, see “Business—Legal Proceedings.”
In addition, our competitors or others may design around our protected patents or technologies. Effective intellectual property protection may be unavailable or more limited in one or more relevant jurisdictions relative to those protections available in the United States, or may not be applied for in one or more relevant jurisdictions. If we pursue litigation to assert our intellectual property rights, an adverse decision in any of these legal actions could limit our ability to assert our intellectual property rights, limit the value of our technology or otherwise negatively impact our business, financial condition and results of operations.
Monitoring unauthorized use of our intellectual property is difficult and costly. Unauthorized use of our intellectual property may have occurred or may occur in the future. Although we have taken steps to minimize the risk of this occurring, any such failure to identify unauthorized use and otherwise adequately protect our intellectual property would adversely affect our business. Moreover, if we are required to commence litigation, whether as a plaintiff or defendant, not only would this be time-consuming, but we would also be forced to incur significant costs and divert our attention and efforts of our employees, which could, in turn, result in lower revenue and higher expenses.
We also rely on contractual protections with our customers, suppliers, distributors, employees and consultants, and we implement security measures designed to protect our trade secrets. We cannot assure you that these contractual protections and security measures will not be breached, that we will have adequate remedies for any such breach or that our suppliers, employees or consultants will not assert rights to intellectual property arising out of such contracts.
In addition, we have a number of third-party patent and intellectual property license agreements. Some of these license agreements require us to make one-time payments or ongoing royalty payments. We cannot guarantee that the third-party patents and technology we license will not be licensed to our competitors or others in the semiconductor industry. In the future, we may need to obtain additional licenses, renew existing license agreements or otherwise replace existing technology. We are unable to predict whether these license agreements can be obtained or renewed or the technology can be replaced on acceptable terms, or at all.
Average selling prices of our products often decrease over time, which could negatively impact our revenue and gross margins.
Our operating results may be impacted by a decline in the average selling prices of our semiconductors. If competition increases in our target markets, we may need to reduce the average unit price of our products in anticipation of competitive pricing pressures, new product introductions by us or our competitors and for other reasons. If we are unable to offset any reductions in our average selling prices by increasing our sales volumes or introducing new products with higher margins, our revenue and gross margins will suffer. To maintain our revenue and gross margins, we must develop and introduce new products and product enhancements on a timely basis and continually reduce our costs as well as our customers’ costs. Failure to do so would cause our revenue and gross margins to decline.
18
Table of Contents
We are subject to order and shipment uncertainties, and differences between our estimates of customer demand and product mix and our actual results could negatively affect our inventory levels, sales and operating results.
Our revenue is generated on the basis of purchase orders with our customers rather than long-term purchase commitments. In addition, our customers can cancel purchase orders or defer the shipments of our products under certain circumstances. Our products are manufactured using semiconductor foundries according to our estimates of customer demand, which requires us to make separate demand forecast assumptions for every customer, each of which may introduce significant variability into our aggregate estimates. It is difficult for us to forecast the demand for our products, in part because of the complex supply chain between us and the end-user markets that incorporate our products. Due to our lengthy product development cycle, it is critical for us to anticipate changes in demand for our various product features and the applications they serve to allow sufficient time for product development and design. We have limited visibility into future customer demand and the product mix that our customers will require, which could adversely affect our revenue forecasts and operating margins. Moreover, because some of our target markets are relatively new, many of our customers have difficulty accurately forecasting their product requirements and estimating the timing of their new product introductions, which ultimately affects their demand for our products. Our failure to accurately forecast demand can lead to product shortages that can impede production by our customers and harm our customer relationships. Conversely, our failure to forecast declining demand or shifts in product mix can result in excess or obsolete inventory. The rapid pace of innovation in our industry could also render significant portions of our inventory obsolete. Excess or obsolete inventory levels could result in unexpected expenses or increases in our reserves that could adversely affect our business, operating results and financial condition. In contrast, if we were to underestimate customer demand or if sufficient manufacturing capacity were unavailable, we could forego revenue opportunities, potentially lose market share and damage our customer relationships. In addition, any significant future cancellations or deferrals of product orders or the return of previously sold products due to manufacturing defects could materially and adversely impact our profit margins, increase our write-offs due to product obsolescence and restrict our ability to fund our operations.
We rely on third-party sales representatives and distributors to assist in selling our products. If we fail to retain or find additional sales representatives and distributors, or if any of these parties fail to perform as expected, it could reduce our future sales.
In 2010, we derived 79% of our total revenue from sales by our direct sales team and third-party sales representatives. In addition, in 2010 and 2009, approximately 21% and 22% of our sales were made through third-party distributors, respectively. Two of our distributors, which sell solely to Micron, accounted for 11% and 17% of our total revenue in 2010 and 2009, respectively. We are unable to predict the extent to which these third-party sales representatives and distributors will be successful in marketing and selling our products. Moreover, many of these third-party sales representatives and distributors also market and sell competing products, which may affect the extent to which they promote our products. Even where our relationships are formalized in contracts, our third-party sales representatives and distributors often have the right to terminate their relationships with us at any time. Our future performance will also depend, in part, on our ability to attract additional third-party sales representatives and distributors who will be able to market and support our products effectively, especially in markets in which we have not previously sold our products. If we cannot retain our current distributors or find additional or replacement third-party sales representatives and distributors, our business, financial condition and results of operations could be harmed. Additionally, if we terminate our relationship with a distributor, we may be obligated to repurchase unsold products. We record a reserve for estimated returns and price credits. If actual returns and credits exceed our estimates, our operating results could be harmed.
The facilities of our third-party contractors and distributors are located in regions that are subject to earthquakes and other natural disasters.
The facilities of our third-party contractors and distributors are subject to risk of catastrophic loss due to fire, flood or other natural or man-made disasters. A number of our facilities and those of our contract
19
Table of Contents
manufacturers are located in areas with above average seismic activity and also subject to typhoons and other Pacific storms. Several foundries that manufacture our wafers are located in Taiwan, Japan and California, and a majority of our third-party contractors who assemble and test our products are located in Asia. In addition, our headquarters are located in California. The risk of an earthquake in the Pacific Rim region or California is significant due to the proximity of major earthquake fault lines. For example, Japan recently experienced a major earthquake and tsunami. Although we have not received any reports of damage to the foundry we use in Japan, it did experience a temporary suspension of production. If there is a shortage or interruption in the availability to us of any wafers manufactured by this foundry or shortages in other components or materials, and we cannot timely obtain a commercially and technologically suitable substitute or make sufficient and timely design or other product modifications to permit the use of such a substitute, we may not be able to timely deliver sufficient quantities of our products to satisfy our contractual obligations and revenue expectations. In addition, one of our principal packaging and assembly contractors is located in Japan. As a result of the effects of the earthquake and tsunami, this contractor may be unable to ship our products in sufficient quantities or in a timely manner, which could have a material adverse affect on our results of operations. Any further catastrophic loss to any of these facilities would likely disrupt our operations, delay production, shipments and revenue and result in significant expenses to repair or replace the facility. In particular, any catastrophic loss at our California locations would materially and adversely affect our business.
We rely on third-party technologies for the development of our products and our inability to use such technologies in the future would harm our ability to remain competitive.
We rely on third parties for technologies that are integrated into our products, such as wafer fabrication and assembly and test technologies used by our contract manufacturers, as well as licensed architecture technologies. If we are unable to continue to use or license these technologies on reasonable terms, or if these technologies fail to operate properly, we may not be able to secure alternatives in a timely manner or at all, and our ability to remain competitive would be harmed. In addition, if we are unable to successfully license technology from third parties to develop future products, we may not be able to develop such products in a timely manner or at all.
Our business would be adversely affected by the departure of existing members of our senior management team and other key personnel.
Our success depends, in large part, on the continued contributions of our senior management team, in particular, the services of Young K. Sohn, our President and Chief Executive Officer, as well as other key personnel, including Dr. Loi Nguyen, one of our founders and our Vice President of Networking, Communications and Multi-Market Products. In February 2011, our Chief Technology Officer resigned and we promoted our Vice President of Engineering for New Business Initiatives to serve as our new Chief Technology Officer. This change could negatively affect our operations and our relationships with our customers, employees and market leaders. In addition, we have not entered into non-compete agreements with members of our senior management team. The loss of any member of our senior management team or key personnel could harm our ability to implement our business strategy and respond to the rapidly changing market conditions in which we operate.
Potential future acquisitions could be difficult to integrate, divert attention of key personnel, disrupt our business, dilute stockholder value and impair our operating results.
As part of our business strategy, we have pursued and may continue to pursue acquisitions in the future that we believe will complement our business, semiconductor solutions or technologies. For example, we recently acquired all of the outstanding shares of Winyatek Technology Inc., a Taiwanese company. Any acquisition involves a number of risks, many of which could harm our business, including:
| • | difficulties in integrating the operations, technologies, products, existing contracts, accounting and personnel of the target company; |
| • | realizing the anticipated benefits of any acquisition; |
20
Table of Contents
| • | difficulties in transitioning and supporting customers, if any, of the target company; |
| • | diversion of financial and management resources from existing operations; |
| • | the price we pay or other resources that we devote may exceed the value we realize, or the value we could have realized if we had allocated the purchase price or other resources to another opportunity; |
| • | potential loss of key employees, customers and strategic alliances from either our current business or the target company’s business; |
| • | assumption of unanticipated problems or latent liabilities, such as problems with the quality of the target company’s products; |
| • | inability to generate sufficient revenue to offset acquisition costs; |
| • | dilutive effect on our stock as a result of any equity-based acquisitions; |
| • | inability to successfully complete transactions with a suitable acquisition candidate; and |
| • | in the event of international acquisitions, risks associated with accounting and business practices that are different from applicable U.S. practices and requirements. |
Acquisitions also frequently result in the recording of goodwill and other intangible assets that are subject to potential impairments, which could harm our financial results. As a result, if we fail to properly evaluate acquisitions or investments, we may not achieve the anticipated benefits of any such acquisitions, and we may incur costs in excess of what we anticipate. The failure to successfully evaluate and execute acquisitions or investments or otherwise adequately address these risks could materially harm our business and financial results.
Tax benefits that we receive may be terminated or reduced in the future, which would increase our costs.
In 2010, we began to expand our international presence to take advantage of the opportunity to recruit additional engineering design talent, as well as to more closely align our operations geographically with our customers and suppliers in Asia. In certain international jurisdictions, we have also entered into agreements with local governments to provide us with, among other things, favorable local tax rates if certain minimum criteria are met. These agreements may require us to meet several requirements as to investment, headcount and activities to retain this status. We currently believe that we will be able to meet all the terms and conditions specified in these agreements. However, if adverse changes in the economy or changes in technology affect international demand for our products in an unforeseen manner or if we fail to otherwise meet the conditions of the local agreements, we may be subject to additional taxes, which in turn would increase our costs.
Changes in our effective tax rate may harm our results of operations. A number of factors may increase our future effective tax rates, including:
| • | the jurisdictions in which profits are determined to be earned and taxed; |
| • | the resolution of issues arising from tax audits with various tax authorities; |
| • | changes in the valuation of our deferred tax assets and liabilities and in deferred tax valuation allowances; |
| • | changes in the value of assets or services transferred or provided from one jurisdiction to another; |
| • | adjustments to income taxes upon finalization of various tax returns; |
| • | increases in expenses not deductible for tax purposes, including write-offs of acquired in-process research and development and impairments of goodwill in connection with acquisitions; |
| • | changes in available tax credits; |
| • | changes in tax laws or the interpretation of such tax laws, and changes in U.S. generally accepted accounting principles; and |
| • | a decision to repatriate non-U.S. earnings for which we have not previously provided for U.S. taxes. |
21
Table of Contents
We are subject to additional regulatory compliance requirements, including Section 404 of the Sarbanes-Oxley Act of 2002, as a result of being a public company and our management has limited experience managing a public company.
As a public company, we will incur significant legal, accounting and other expenses that we did not incur as a private company. The individuals who constitute our management team have limited experience managing a publicly traded company, and limited experience complying with the increasingly complex and changing laws pertaining to public companies. Our management team and other personnel will need to devote a substantial amount of time to new compliance initiatives and we may not successfully or efficiently manage our transition into a public company. We expect rules and regulations such as the Sarbanes-Oxley Act of 2002 to increase our legal and finance compliance costs and to make some activities more time-consuming and costly. We will need to hire a number of additional employees with public accounting and disclosure experience in order to meet our ongoing obligations as a public company. For example, Section 404 of the Sarbanes-Oxley Act of 2002 requires that our management report on, and our independent registered public accounting firm attest to, the effectiveness of our internal control over financial reporting in our annual report on Form 10-K for the fiscal year ending December 31, 2011. Section 404 compliance may divert internal resources and will take a significant amount of time and effort to complete. We may not be able to successfully complete the procedures and certification and attestation requirements of Section 404 by the time we will be required to do so. If we fail to do so, or if in the future our Chief Executive Officer, Chief Financial Officer or independent registered public accounting firm determines that our internal controls over financial reporting are not effective as defined under Section 404, we could be subject to sanctions or investigations by The New York Stock Exchange, or NYSE, the Securities and Exchange Commission, or the SEC, or other regulatory authorities. Furthermore, investor perceptions of our company may suffer, and this could cause a decline in the market price of our stock. Irrespective of compliance with Section 404, any failure of our internal controls could have a material adverse effect on our stated results of operations and harm our reputation. If we are unable to implement these changes effectively or efficiently, it could harm our operations, financial reporting or financial results and could result in an adverse opinion on internal controls from our independent auditors.
Our insiders who are significant stockholders may control the election of our board and may have interests that conflict with those of other stockholders.
Our directors and executive officers, together with members of their immediate families and affiliated funds, beneficially owned, in the aggregate, more than 35.5% of our outstanding capital stock as of December 31, 2010. In addition, entities affiliated with Walden International and Tallwood I, L.P. beneficially owned 14.0% and 13.8%, respectively, of our outstanding capital stock as of December 31, 2010. Lip-Bu Tan and Diosdado Banatao, who are affiliated with Walden International and Tallwood I, L.P., respectively, are currently two of the eight members of our board of directors. As a result, acting together, this group has the ability to exercise significant control over most matters requiring our stockholders’ approval, including the election and removal of directors and significant corporate transactions.
Risks Related to Our Industry
We may be unable to make the substantial and productive research and development investments which are required to remain competitive in our business.
The semiconductor industry requires substantial investment in research and development in order to develop and bring to market new and enhanced technologies and products. Many of our products originated with our research and development efforts and have provided us with a significant competitive advantage. Our research and development expense was $23.8 million in 2010, $17.8 million in 2009 and $17.5 million in 2008. We are committed to investing in new product development in order to remain competitive in our target markets. We do not know whether we will have sufficient resources to maintain the level of investment in research and development required to remain competitive. In addition, we cannot assure you that the technologies which are the focus of our research and development expenditures will become commercially successful.
22
Table of Contents
Our business, financial condition and results of operations could be adversely affected by worldwide economic conditions, as well as political and economic conditions in the countries in which we conduct business.
Our business and operating results are impacted by worldwide economic conditions, including the current European debt crisis. Uncertainty about current global economic conditions may cause businesses to continue to postpone spending in response to tighter credit, unemployment or negative financial news. This in turn could have a material negative effect on the demand for our semiconductor products or the products into which our semiconductors are incorporated. Although the United States economy has recently shown signs of recovery, the strength and duration of any economic recovery will be impacted by the European debt crisis and the reaction to any efforts to address the crisis. Multiple factors relating to our international operations and to particular countries in which we operate could negatively impact our business, financial condition and results of operations. These factors include:
| • | changes in political, regulatory, legal or economic conditions; |
| • | restrictive governmental actions, such as restrictions on the transfer or repatriation of funds and foreign investments and trade protection measures, including export duties and quotas and customs duties and tariffs; |
| • | disruptions of capital and trading markets; |
| • | changes in import or export requirements; |
| • | transportation delays; |
| • | civil disturbances or political instability; |
| • | geopolitical turmoil, including terrorism, war or political or military coups; |
| • | public health emergencies; |
| • | differing employment practices and labor standards; |
| • | limitations on our ability under local laws to protect our intellectual property; |
| • | local business and cultural factors that differ from our customary standards and practices; |
| • | nationalization and expropriation; |
| • | changes in tax laws; |
| • | currency fluctuations relating to our international operating activities; and |
| • | difficulty in obtaining distribution and support. |
A significant portion of our products are manufactured, assembled and tested outside the United States. Any conflict or uncertainty in these countries, including due to natural disasters, public health concerns, political unrest or safety concerns, could harm our business, financial condition and results of operations. In addition, if the government of any country in which our products are manufactured or sold sets technical standards for products manufactured in or imported into their country that are not widely shared, it may lead some of our customers to suspend imports of their products into that country, require manufacturers in that country to manufacture products with different technical standards and disrupt cross-border manufacturing relationships which, in each case, could harm our business.
Changes in current or future laws or regulations or the imposition of new laws or regulations, including new or changed tax regulations, environmental laws and export control laws, or new interpretations thereof, by federal or state agencies or foreign governments could impair our ability to compete in international markets.
Changes in current laws or regulations applicable to us or the imposition of new laws and regulations in the United States or other jurisdictions in which we do business, such as China, Japan, Korea, Singapore and Taiwan,
23
Table of Contents
could materially and adversely affect our business, financial condition and results of operations. For example, we have entered into agreements with local governments to provide us with, among other things, favorable local tax rates if certain minimum criteria are met, as discussed in our risk factor entitled “Tax benefits that we received may be terminated or reduced in the future, which would increase our costs.” These agreements may require us to meet several requirements as to investment, headcount and activities to retain this status. If we fail to otherwise meet the conditions of the local agreements, we may be subject to additional taxes, which in turn would increase our costs. In addition, potential future U.S. tax legislation could impact the tax benefits we effectively realize under these agreements.
Due to environmental concerns, the use of lead and other hazardous substances in electronic components and systems is receiving increased attention. In response, the European Union passed the Restriction on Hazardous Substances, or RoHS, Directive, legislation that limits the use of lead and other hazardous substances in electrical equipment. The RoHS Directive became effective July 1, 2006. We believe that our current product designs and material supply chains are in compliance with the RoHS Directive. If our product designs or material supply chains are deemed not to be in compliance with the RoHS Directive, we and our third party manufacturers may need to redesign products with components meeting the requirements of the RoHS Directive and we may incur additional expense as well as loss of market share and damage to our reputation.
In addition, we are subject to export control laws, regulations and requirements that limit which products we sell and where and to whom we sell our products. In some cases, it is possible that export licenses would be required from U.S. government agencies for some of our products in accordance with the Export Administration Regulations and the International Traffic in Arms Regulations. We may not be successful in obtaining the necessary export licenses in all instances. Any limitation on our ability to export or sell our products imposed by these laws would adversely affect our business, financial condition and results of operations. In addition, changes in our products or changes in export and import laws and implementing regulations may create delays in the introduction of new products in international markets, prevent our customers from deploying our products internationally or, in some cases, prevent the export or import of our products to certain countries altogether. While we are not aware of any other current or proposed export or import regulations which would materially restrict our ability to sell our products in countries such as China, Japan, Korea, Singapore or Taiwan, any change in export or import regulations or related legislation, shift in approach to the enforcement or scope of existing regulations, or change in the countries, persons or technologies targeted by these regulations, could result in decreased use of our products by, or in our decreased ability to export or sell our products to, existing or potential customers with international operations. In such event, our business and results of operations could be adversely affected.
We are subject to the cyclical nature of the semiconductor industry, which has suffered and may suffer from future recessionary downturns.
The semiconductor industry is highly cyclical and is characterized by constant and rapid technological change, rapid product obsolescence and price erosion, evolving standards and wide fluctuations in product supply and demand. The industry experienced a significant downturn during the current global recession. These downturns have been characterized by diminished product demand, production overcapacity, high inventory levels and accelerated erosion of average selling prices. The most recent downturn and any future downturns could negatively impact our business and operating results. Furthermore, any upturn in the semiconductor industry could result in increased competition for access to third-party foundry and assembly capacity. We are dependent on the availability of this capacity to manufacture and assemble our integrated circuits. None of our third-party foundry or assembly contractors has provided assurances that adequate capacity will be available to us in the future.
Our products must conform to industry standards in order to be accepted by end users in our markets.
Our products comprise only a part of larger electronic systems. All components of these systems must uniformly comply with industry standards in order to operate efficiently together. These industry standards are often developed and promoted by larger companies who are industry leaders and provide other components of the systems in which our products are incorporated. In driving industry standards, these larger companies are able
24
Table of Contents
to develop and foster product ecosystems within which our products can be used. We work with a number of these larger companies in helping develop industry standards with which our products are compatible. If larger companies do not support the same industry standards that we do, or if competing standards emerge, market acceptance of our products could be adversely affected, which would harm our business.
Some industry standards may not be widely adopted or implemented uniformly, and competing standards may still emerge that may be preferred by our customers. Products for communications and computing applications are based on industry standards that are continually evolving. Our ability to compete in the future will depend on our ability to identify and ensure compliance with these evolving industry standards. The emergence of new industry standards could render our products incompatible with products developed by other suppliers or make it difficult for our products to meet the requirements of certain OEMs. As a result, we could be required to invest significant time and effort and to incur significant expense to redesign our products to ensure compliance with relevant standards. If our products are not in compliance with prevailing industry standards for a significant period of time, we could miss opportunities to achieve crucial design wins. We may not be successful in developing or using new technologies or in developing new products or product enhancements that achieve market acceptance. Our pursuit of necessary technological advances may require substantial time and expense.
Risks Related to this Offering and our Common Stock
The trading price and volume of our common stock is subject to volatility.
The trading price of our common stock has experienced wide fluctuations. For example, since our initial public offering the closing price of our common stock ranged from $15.12 on November 23, 2010 to $26.63 on February 17, 2011. Volatility in the market price of our common stock may occur in the future. The market price of shares of our common stock could be subject to wide fluctuations in response to many risk factors listed in this prospectus and others beyond our control, including:
| • | actual or anticipated fluctuations in our financial condition and operating results; |
| • | changes in the economic performance or market valuations of other companies that provide high-speed analog semiconductor solutions; |
| • | loss of a significant amount of existing business; |
| • | actual or anticipated changes in our growth rate relative to our competitors; |
| • | actual or anticipated fluctuations in our competitors’ operating results or changes in their growth rates; |
| • | issuance of new or updated research or reports by securities analysts; |
| • | our announcement of actual results for a fiscal period that are higher or lower than projected results or our announcement of revenue or earnings guidance that is higher or lower than expected; |
| • | regulatory developments in our target markets affecting us, our customers or our competitors; |
| • | fluctuations in the valuation of companies perceived by investors to be comparable to us; |
| • | share price and volume fluctuations attributable to inconsistent trading volume levels of our shares; |
| • | sales or expected sales of additional common stock; |
| • | terrorist attacks or natural disasters or other such events impacting countries where we or our customers have operations; and |
| • | general economic and market conditions. |
Furthermore, the stock markets have experienced extreme price and volume fluctuations that have affected and continue to affect the market prices of equity securities of many companies. These fluctuations often have been unrelated or disproportionate to the operating performance of those companies. These broad market and
25
Table of Contents
industry fluctuations, as well as general economic, political and market conditions such as recessions, interest rate changes or international currency fluctuations, may cause the market price of shares of our common stock to decline. If the market price of shares of our common stock after this offering does not exceed the public offering price, you may not realize any return on your investment in us and may lose some or all of your investment. In the past, companies that have experienced volatility in the market price of their stock have been subject to securities class action litigation. We may be the target of this type of litigation in the future. Securities litigation against us could result in substantial costs and divert our management’s attention from other business concerns, which could seriously harm our business.
If securities or industry analysts do not publish research or reports about our business, or if they change their recommendations regarding our stock adversely, our stock price and trading volume could decline.
The trading market for our common stock will be influenced by the research and reports that industry or securities analysts publish about us or our business. If one or more of the analysts who cover us downgrade our stock, our stock price would likely decline. If one or more of these analysts cease coverage of our company or fail to regularly publish reports on us, we could lose visibility in the financial markets, which in turn could cause our stock price or trading volume to decline.
Substantial future sales of our common stock in the public market could cause our stock price to fall.
Sales of our common stock in the public market or the perception that sales could occur, could cause the market price of our common stock to decline. As of December 31, 2010, we had 25,088,122 shares of common stock outstanding, of which 17,233,838 shares are eligible for sale at various times upon the expiration of lock-up agreements in May 2011 and June 2011 and subject to vesting requirements, the requirements of Rule 144 and trading black-out periods.
Our directors, executive officers and substantially all of our stockholders have agreed with limited exceptions that they will not sell any shares of common stock owned by them without the prior written consent of Morgan Stanley & Co. Incorporated and Deutsche Bank Securities Inc., on behalf of the underwriters, until May 9, 2011. In addition, in connection with this offering, our directors, executive officers and certain selling stockholders have agreed with limited exceptions not to sell any shares of common stock owned by them without the prior written consent of Morgan Stanley & Co. Incorporated and Deutsche Bank Securities Inc., on behalf of the underwriters, for a period of 90 days following this offering. At any time and without public notice, the underwriters may in their sole discretion release some or all of the securities from these lock-up agreements prior to the expiration of the lock-up period. As resale restrictions end, the market price of our common stock could decline if the holders of those shares sell them or are perceived by the market as intending to sell them.
Management may apply our net proceeds from this offering to uses that do not increase our market value or improve our operating results.
We intend to use our net proceeds from this offering for general corporate purposes, including as yet undetermined amounts related to working capital and capital expenditures. As was the case with the proceeds from our initial public offering, our management will have considerable discretion in applying our net proceeds and you will not have the opportunity, as part of your investment decision, to assess whether we are using our net proceeds appropriately. Until the net proceeds we receive are used, they may be placed, along with the net proceeds from our initial public offering, in investments that do not produce income or that lose value. We may use our net proceeds for purposes that do not result in any increase in our results of operations, which could cause the price of our common stock to decline.
26
Table of Contents
We may not be able to obtain capital when desired on favorable terms, if at all, or without dilution to our stockholders and our failure to raise capital when needed could prevent us from executing our growth strategy.
We believe that our existing cash and cash equivalents, and cash flows from our operating activities, will be sufficient to meet our anticipated cash needs for at least the next 12 months. We operate in an industry, however, that makes our prospects difficult to evaluate. It is possible that we may not generate sufficient cash flow from operations or otherwise have the capital resources to meet our future capital needs. If this occurs, we may need additional financing to execute on our current or future business strategies, including to:
| • | invest in our research and development efforts by hiring additional technical and other personnel; |
| • | expand our operating infrastructure; |
| • | acquire complementary businesses, products, services or technologies; or |
| • | otherwise pursue our strategic plans and respond to competitive pressures. |
If we raise additional funds through the issuance of equity or convertible debt securities, the percentage ownership of our stockholders could be significantly diluted, and these newly-issued securities may have rights, preferences or privileges senior to those of existing stockholders. If we raise additional funds by obtaining loans from third parties, the terms of those financing arrangements may include negative covenants or other restrictions on our business that could impair our operational flexibility, and would also require us to incur interest expense. We have not made arrangements to obtain additional financing and there is no assurance that additional financing will be available on terms favorable to us, or at all. If adequate funds are not available or are not available on acceptable terms, if and when needed, our ability to fund our operations, take advantage of unanticipated opportunities, develop or enhance our products, or otherwise respond to competitive pressures could be significantly limited.
Delaware law and our corporate charter and bylaws contain anti-takeover provisions that could delay or discourage takeover attempts that stockholders may consider favorable.
Provisions in our certificate of incorporation and bylaws may have the effect of delaying or preventing a change of control or changes in our management. These provisions include the following:
| • | the right of our board of directors to elect a director to fill a vacancy created by the expansion of our board of directors; |
| • | the classification of our board of directors so that only a portion of our directors are elected each year, with each director serving a three-year term; |
| • | the requirement for advance notice for nominations for election to our board of directors or for proposing matters that can be acted upon at a stockholders’ meeting; |
| • | the ability of our board of directors to alter our bylaws without obtaining stockholder approval; |
| • | the ability of our board of directors to issue, without stockholder approval, up to 10,000,000 shares of preferred stock with rights set by our board of directors, which rights could be senior to those of common stock; |
| • | the required approval of holders of at least two-thirds of the shares entitled to vote at an election of directors to adopt, amend or repeal our bylaws or amend or repeal the provisions of our certificate of incorporation regarding the election and removal of directors and the ability of stockholders to take action by written consent; and |
| • | the elimination of the right of stockholders to call a special meeting of stockholders and to take action by written consent. |
27
Table of Contents
In addition, because we are incorporated in Delaware, we are governed by the provisions of Section 203 of the Delaware General Corporation Law. These provisions may prohibit or restrict large stockholders, in particular those owning 15% or more of our outstanding voting stock, from merging or combining with us. These provisions in our certificate of incorporation and bylaws and under Delaware law could discourage potential takeover attempts and could reduce the price that investors might be willing to pay for shares of our common stock in the future and result in our market price being lower than it would without these provisions.
We do not currently intend to pay dividends on our common stock and, consequently, your ability to achieve a return on your investment will depend on appreciation in the price of our common stock.
We have never declared or paid any cash dividends on our common stock and do not currently intend to do so for the foreseeable future. We currently intend to invest our future earnings, if any, to fund our growth. Therefore, you are not likely to receive any dividends on your common stock for the foreseeable future and the success of an investment in shares of our common stock will depend upon any future appreciation in their value. There is no guarantee that shares of our common stock will appreciate in value or even maintain the price at which our stockholders have purchased their shares.
28
Table of Contents
SPECIAL NOTE REGARDING FORWARD-LOOKING STATEMENTS
This prospectus contains forward-looking statements that involve risks and uncertainties. The forward-looking statements are contained principally in the sections entitled “Prospectus Summary,” “Risk Factors,” “Management’s Discussion and Analysis of Financial Condition and Results of Operations” and “Business.” In some cases, you can identify forward-looking statements by terms such as “may,” “might,” “will,” “objective,” “intend,” “should,” “could,” “can,” “would,” “expect,” “believe,” “estimate,” “predict,” “potential,” “plan,” or the negative of these terms, and similar expressions intended to identify forward-looking statements. These statements reflect our current views with respect to future events and are based on assumptions and subject to risks and uncertainties. Given these uncertainties, you should not place undue reliance on these forward-looking statements. Forward-looking statements include, but are not limited to, statements about:
| • | anticipated trends and challenges in our business and the markets in which we operate, including the market for 40G and 100G high-speed analog semiconductor solutions; |
| • | our plans for future products, such as our iMB™, clock and data recovery, or CDR, and serializer-deserializer, or SERDES, products, and enhancements of existing products; |
| • | our expectations regarding our expenses and revenue, including our expectations that our research and development, sales and marketing and general and administrative expenses may increase in absolute dollars; |
| • | our anticipated cash needs and our estimates regarding our capital requirements and our needs for additional financing, as further discussed under “Management’s Discussion and Analysis of Financial Condition and Results of Operations—Operating and Capital Expenditure Requirements”; |
| • | our anticipated growth strategies, including those described under “Business—Our Strategy”; |
| • | our ability to retain and attract customers, particularly in light of our dependence on a limited number of customers for a substantial portion of our revenue; |
| • | the anticipated costs and benefits of our recent acquisition of Winyatek Technology Inc.; and |
| • | our expectations regarding competition as more and larger semiconductor companies enter our markets and as existing competitors improve or expand their product offerings; |
These statements involve known and unknown risks, uncertainties and other factors which may cause our actual results, performance or achievements to be materially different from any future results, performances or achievements expressed or implied by the forward-looking statements.
We discuss many of these risks in this prospectus in greater detail under the heading “Risk Factors.” Also, these forward-looking statements represent our estimates and assumptions only as of the date of this prospectus. Unless required by U.S. federal securities laws, we do not intend to update any of these forward-looking statements to reflect circumstances or events that occur after the statement is made.
You should read this prospectus and the documents that we reference in this prospectus and have filed as exhibits to the registration statement, of which this prospectus is a part, completely and with the understanding that our actual future results may be materially different from what we expect. We qualify all of our forward-looking statements by these cautionary statements.
The market data and certain other statistical information used throughout this prospectus are based on independent industry publications, governmental publications, reports by market research firms or other independent sources. Some data are also based on our good faith estimates.
29
Table of Contents
We estimate that we will receive net proceeds from this offering of approximately $1.4 million based on an assumed public offering price of $21.51 per share (the closing price of our common stock as reported on the New York Stock Exchange on March 25, 2011), after deducting estimated underwriting discounts and commissions and estimated offering expenses payable by us.
We intend to use our proceeds from this offering for general corporate purposes, including working capital and capital expenditures. The amount and timing of these expenditures will vary depending on a number of factors, including competitive and technological developments and the rate of growth, if any, of our business. In addition, we also may use a portion of the net proceeds to acquire complementary businesses, products or technologies. However, we do not currently have any agreements or understandings with respect to any such acquisitions.
As of the date of this prospectus, however, we have not determined all of the anticipated uses for the proceeds of this offering or the amounts that we will actually spend on the uses set forth above. The amount and timing of actual expenditures may vary significantly depending upon a number of factors, including the amount of cash generated from our operations, competitive and technological developments and the rate of growth, if any, of our business. Accordingly, our management will have significant flexibility in applying the net proceeds of this offering. Pending use of the net proceeds as described above, we intend to invest the net proceeds of this offering in short-term, interest-bearing, investment-grade securities.
PRICE RANGE OF OUR COMMON STOCK
Our common stock has been trading on the New York Stock Exchange under the symbol “IPHI” since our initial public offering on November 11, 2010. Prior to that date, our common stock was not traded on any public exchange. The following table sets forth the range of high and low sales prices for our common stock in each quarter since our stock began trading:
| 2010 |
Low | High | ||||||
| Fourth Quarter (from November 11, 2010) |
$ | 14.73 | $ | 20.94 | ||||
| 2011 |
||||||||
| First Quarter (to March 25, 2011) |
$ | 16.91 | $ | 27.20 | ||||
On March 25, 2011, the last day prior to the date of this prospectus for which information was practicably available, the closing price for our common stock as reported on the New York Stock Exchange was $21.51 per share.
We have never declared or paid any cash dividends on shares of our capital stock. We expect to retain all of our earnings to finance the expansion and development of our business and we do not currently intend to pay any cash dividends on our capital stock in the foreseeable future. Our board of directors will determine future dividends, if any.
30
Table of Contents
The following table describes our capitalization as of December 31, 2010:
| • | on an actual basis; |
| • | on an as adjusted basis to give effect to the sale by stockholders of 852,892 shares of common stock to be issued upon exercise of vested stock options at a weighted average exercise price of $1.67 per share immediately prior to completion of this offering with net proceeds to us of $1.4 million and the sale of shares of common stock in this offering at an assumed public offering price of $21.51 per share (the closing price of our common stock as reported on the New York Stock Exchange on March 25, 2011), after deducting estimated underwriting discounts and commissions and estimated offering expenses payable by us. |
You should read this table together with “Management’s Discussion and Analysis of Financial Condition and Results of Operations” and our consolidated financial statements and the related notes appearing elsewhere in this prospectus.
| As of December 31, 2010 | ||||||||
| Actual | As Adjusted | |||||||
| (in thousands, except share and per share data) |
||||||||
| Stockholders’ equity (deficit): |
||||||||
| Preferred stock, $0.001 par value per share; 10,000,000 shares authorized, no shares issued or outstanding, actual and as adjusted |
— | — | ||||||
| Common stock, $0.001 par value per share; 500,000,000 shares authorized, 25,088,122 shares issued and outstanding, actual; and 26,041,014 shares issued and outstanding, as adjusted |
25 | 26 | ||||||
| Additional paid-in capital |
176,505 | 179,311 | ||||||
| Accumulated deficit |
(34,644 | ) | (34,644 | ) | ||||
| Accumulated other comprehensive income |
800 | 800 | ||||||
| Total stockholders’ equity (deficit) |
142,686 | 145,493 | ||||||
| Total capitalization |
$ | 142,686 | 145,493 | |||||
The actual and as adjusted information set forth in the table:
| • | excludes 6,672,249 shares of common stock issuable upon the exercise of options outstanding as of December 31, 2010, at a weighted average exercise price of $3.85 per share, except for 852,892 shares to be issued and sold in this offering upon the exercise of vested stock options, at a weighted average exercise price of $1.67 per share; |
| • | excludes 40,713 shares of common stock issuable upon the exercise of warrants outstanding as of December 31, 2010, at an exercise price of $1.64 per share; |
| • | excludes 2,032,192 shares of common stock reserved for future issuance under our 2010 Stock Incentive Plan as well as up to 396,379 shares subject to outstanding options or forfeiture restrictions under our 2000 Stock Plan that are subsequently forfeited or terminated for any reason before being exercised and contains provisions that will automatically increase its share reserve each year, as more fully described in “Executive Compensation—Employee Benefit Plans”; and |
| • | assumes no exercise of the option to purchase additional shares granted to the underwriters. |
A $1.00 increase (decrease) in the assumed public offering price of $21.51 per share would increase (decrease), on an as adjusted basis, each of cash and cash equivalents, total assets and total stockholders’ equity by approximately $95,750, assuming the number of shares offered by us, as set forth on the cover page of this prospectus, remains the same and after deducting the estimated underwriting discounts and commissions and estimated offering expenses payable by us. The as adjusted information discussed above is illustrative only and will be adjusted based on the actual public offering price and other terms of this offering determined at pricing.
31
Table of Contents
UNAUDITED PRO FORMA COMBINED FINANCIAL INFORMATION
On June 30, 2010, we acquired all of the outstanding shares of Winyatek Technology Inc., or Winyatek, a Taiwanese company, in exchange for $7.9 million of consideration comprised of $3.3 million in cash and 313,713 shares of Series E preferred stock valued at $4.5 million. Winyatek is primarily engaged in the research, design, development, manufacture and sale of Nand Flash Controller System-On-Chip, secure digital/multi-media card controller and card reader products.
The accompanying unaudited pro forma combined financial statements reflect the acquisition of Winyatek using the acquisition method of accounting in accordance with U.S. Generally Accepted Accounting Principles, or GAAP. Pro forma data is based on currently available information and certain estimates and assumptions as explained in the notes to the unaudited pro forma combined financial statements. Pro forma data is not necessarily indicative of the financial results that would have been attained had the acquisitions occurred on January 1, 2010. As actual adjustments may differ from the pro forma adjustments, the pro forma amounts presented should not be viewed as indicative of operations in future periods. The unaudited pro forma combined financial information does not reflect any cost savings, operating synergies or revenue enhancements that the combined company may achieve as a result of the acquisition.
The unaudited pro forma combined statements of operations for the year ended December 31, 2010 illustrate the effect of the acquisition of Winyatek as if the acquisition had occurred on January 1, 2010. The unaudited pro forma combined statement of operations for the year ended December 31, 2010 combines the unaudited statement of operations of Winyatek for the period from January 1, 2010 to June 30, 2010, the date of acquisition, and our audited statement of operations for the year ended December 31, 2010. As the functional currency of Winyatek is the New Taiwan Dollar, the statement of operations information of Winyatek for the six months ended June 30, 2010 have been translated from New Taiwan dollars into US Dollars using the average exchange rate for the period of $0.031. The unaudited pro forma combined financial information has been adjusted to give effect to pro forma events that are (1) directly attributable to the acquisition, (2) factually supportable, and (3) expected to have a continuing impact on our combined results. The detailed assumptions used to prepare the pro forma financial information are contained in the notes to the unaudited pro forma combined financial statements, and such assumptions should be reviewed in their entirety.
The pro forma combined financial statements and accompanying notes thereto should be read together with our consolidated financial statements for the years ended December 31, 2009 and 2010, and Winyatek’s financial statements for the year ended December 31, 2009, included elsewhere in this prospectus.
32
Table of Contents
Inphi Corporation and Subsidiaries
Unaudited Pro Forma Combined Statement of Operations
For the Year Ended December 31, 2010
| Thousands of dollars except per share amounts |
Inphi Corporation Year Ended December 31, 2010 Historical |
Winyatek Technology Inc. Six Months Ended June 30, 2010 Historical |
Pro Forma Adjustment (Note 2) |
Inphi Corporation Pro Forma Year Ended December 31, 2010 |
||||||||||||
| Revenue |
$ | 55,253 | $ | 1,123 | — | $ | 56,376 | |||||||||
| Revenue from related party |
27,940 | — | — | 27,940 | ||||||||||||
| Total revenue |
83,193 | 1,123 | — | 84,316 | ||||||||||||
| Cost of revenue |
29,438 | 797 | 100 | (b) | 30,335 | |||||||||||
| Gross profit |
53,755 | 326 | (100 | ) | 53,981 | |||||||||||
| Operating expense: |
||||||||||||||||
| Research and development |
23,781 | 453 | — | 24,234 | ||||||||||||
| Sales and marketing |
8,823 | 168 | 73 | (c) | 9,064 | |||||||||||
| General and administrative |
9,212 | 179 | (278 | )(d) | 9,113 | |||||||||||
| Amortization of intangible asset |
— | 123 | (123 | )(a) | — | |||||||||||
| Total operating expense |
41,816 | 923 | (328 | ) | 42,411 | |||||||||||
| Income (loss) from operations |
11,939 | (597 | ) | 228 | 11,570 | |||||||||||
| Other income (expense) |
(50 | ) | (4 | ) | — | (54 | ) | |||||||||
| Income (loss) before income taxes |
11,889 | (601 | ) | 228 | 11,516 | |||||||||||
| Provision (benefit) for income taxes |
(14,242 | ) | — | (258 | )(e) | (14,500 | ) | |||||||||
| Net income (loss) |
$ | 26,131 | $ | (601 | ) | $ | 487 | $ | 26,016 | |||||||
| Net income allocable to common stockholders |
$ | 5,240 | $ | 5,224 | ||||||||||||
| Net income per share: |
||||||||||||||||
| Basic |
$ | 1.03 | $ | 1.03 | ||||||||||||
| Diluted |
$ | 0.61 | $ | 0.61 | ||||||||||||
| Weighted-average shares used in computing net income per share: |
||||||||||||||||
| Basic |
5,086,169 | 5,086,169 | ||||||||||||||
| Diluted |
8,546,537 | 8,546,537 | ||||||||||||||
33
Table of Contents
Inphi Corporation
Notes to the Unaudited Pro Forma Combined Financial Statements
(Amounts in thousands except share and per share amounts)
1. General
On June 30, 2010, the Company acquired all of the outstanding shares of Winyatek Technology, Inc. (“WTI”) in exchange for consideration of $7.9 million comprised of $3.3 million in cash and 313,713 shares of Series E Preferred stock valued at $4.5 million. WTI is primarily engaged in the research, design, development, manufacture and sale of Nand Flash Controller System-On-Chip, secure digital/multi-media card controller, and card reader products.
The Company issued 313,713 shares of Series E preferred stock that has a total fair value of $4.5 million based on a valuation performed as of June 30, 2010, the acquisition date.
The following table summarizes the purchase price allocation on June 30, 2010:
| Net assets acquired: |
||||
| Cash |
$ | 808 | ||
| Receivables |
174 | |||
| Inventories |
493 | |||
| Other current assets |
100 | |||
| Property and equipment |
68 | |||
| Customer relationships |
730 | |||
| Developed technology |
800 | |||
| In-process research and development |
110 | |||
| Other noncurrent assets |
34 | |||
| Accounts payable and accrued expenses |
(539 | ) | ||
| Deferred tax liabilities, net |
(177 | ) | ||
| Total identifiable net assets |
2,601 | |||
| Goodwill |
5,281 | |||
| $ | 7,882 | |||
The acquisition of WTI includes a contingent consideration arrangement that requires additional consideration to be paid by the Company based on achievement of certain revenue and gross margin metrics of WTI over the three fiscal quarters starting July 1, 2010. The amount of contingent consideration, if any, is payable on or before May 15, 2011. The amount of consideration the Company could pay under the agreement ranges from $0 to $2 million. The fair value of the contingent consideration on the acquisition date and at December 31, 2010 was determined to be insignificant as the probability of WTI achieving the revenue and gross margin requirement is remote.
34
Table of Contents
Inphi Corporation
Notes to the Unaudited Pro Forma Combined Financial Statements—(Continued)
(Amounts in thousands except share and per share amounts)
Identifiable intangible assets consist of developed technology of $800 and customer relationships of $730. The Company used a relief-from-royalty method to value developed technology, based on market-derived royalties for similar fundamental technologies. The relief-from-royalty method estimates the cost savings that accrue to the owner of an intangible asset that would otherwise be payable as royalties or license fees on revenues earned through the use of the asset. The royalty rate used is based on an analysis of licensing agreements related to similar technologies. Revenue is projected over the expected remaining useful life of the developed technology. The market-derived royalty rate is then applied to estimate the royalty savings. Customer relationships represent future projected revenue that will be derived from sales of products to existing customers. Developed technology and customer relationships will be amortized on a straight-line method, which approximates the pattern of economic consumption over their estimated useful lives as follows:
Developed technology 4 years
Customer relationships 5 years
The Company capitalized $110 of in-process research and development (“IPR&D”) costs related to the WTI acquisition. Upon completion of the projects, the related IPR&D assets will be amortized over their estimated useful lives. If any of the projects are abandoned, the Company will be required to impair the related IPR&D asset. The fair value of IPR&D was determined using the relief-from-royalty method similar to the process as discussed above.
The Company incurred acquisition costs of $278 which were included in general and administrative expense in the Company’s statement of operations for the year ended December 31, 2010.
On July 14, 2010, the Company granted 147,198 stock options to WTI employees with an exercise price of $12.02. The stock-based compensation expense related to these stock options was not included as a pro forma adjustment.
2. Pro Forma Adjustments to the Unaudited Pro Forma Combined Statement of Operations
Pro forma adjustments to the Unaudited Pro Forma Combined Statement of Operations for the year ended December 31, 2010 assume the acquisition was consummated on January 1, 2010.
The unaudited pro forma combined statements of operations have been adjusted as follows:
| (a) | Elimination of WTI’s historical intangible asset amortization expense. |
| • | January 1, 2010 to June 30, 2010, $123 |
| (b) | Amortization expense related to the fair value of developed technology acquired. |
| • | January 1, 2010 to June 30, 2010, $100 |
| (c) | Amortization expense related to the fair value of customer relationships acquired. |
| • | January 1, 2010 to June 30, 2010, $73 |
| (d) | Elimination of acquisition costs of $278 included in the Company’s statement of operations for the year ended December 31, 2010 as they will not have a continuing impact on the combined results. |
35
Table of Contents
Inphi Corporation
Notes to the Unaudited Pro Forma Combined Financial Statements—(Continued)
(Amounts in thousands except share and per share amounts)
| (e) | Adjustment to the tax provision as a result of full valuation allowance recognized against deferred tax assets and deferred tax liabilities related to the intangible assets recorded in purchase accounting. |
The unaudited pro forma combined statements of operation for the year ended December 31, 2010 does not include the effect on interest income related to the $3.3 million in cash consideration as the amount is not deemed material.
36
Table of Contents
SELECTED CONSOLIDATED FINANCIAL DATA
The following selected consolidated financial data should be read together with “Management’s Discussion and Analysis of Financial Condition and Results of Operations” and our consolidated financial statements and related notes included elsewhere in this prospectus. The selected balance sheet data as of December 31, 2010 and 2009, and the selected statements of operations data for each of the years ended December 31, 2010, 2009 and 2008, have been derived from our audited financial statements included elsewhere in this prospectus. The selected balance sheet data as of December 31, 2008, 2007 and 2006, and the selected statements of operations data for the years ended December 31, 2007 and 2006 have been derived from our audited financial statements not included in this prospectus. Historical results are not necessarily indicative of the results to be expected in the future, and results of interim periods are not necessarily indicative of results for the entire year.
| Year Ended December 31, | ||||||||||||||||||||
| 2010 | 2009 | 2008 | 2007 | 2006 | ||||||||||||||||
| (in thousands, except share and per share data) | ||||||||||||||||||||
| Statement of Operations Data: |
||||||||||||||||||||
| Revenue |
$ | 55,253 | $ | 37,617 | $ | 32,727 | $ | 31,681 | $ | 19,741 | ||||||||||
| Revenue from related party(1) |
27,940 | 21,235 | 10,227 | 4,556 | 1,557 | |||||||||||||||
| Total revenue |
83,193 | 58,852 | 42,954 | 36,237 | 21,298 | |||||||||||||||
| Cost of revenue(2) |
29,438 | 21,269 | 19,249 | 16,028 | 11,244 | |||||||||||||||
| Gross profit |
53,755 | 37,583 | 23,705 | 20,209 | 10,054 | |||||||||||||||
| Operating expense: |
||||||||||||||||||||
| Research and development(2) |
23,781 | 17,847 | 17,501 | 17,332 | 11,645 | |||||||||||||||
| Sales and marketing(2) |
8,823 | 7,704 | 6,339 | 5,157 | 3,190 | |||||||||||||||
| General and administrative(2) |
9,212 | 3,947 | 3,169 | 2,966 | 2,446 | |||||||||||||||
| Total operating expense |
41,816 | 29,498 | 27,009 | 25,455 | 17,281 | |||||||||||||||
| Income (loss) from operations |
11,939 | 8,085 | (3,304 | ) | (5,246 | ) | (7,227 | ) | ||||||||||||
| Other income (expense) |
(50 | ) | 73 | (124 | ) | (95 | ) | 405 | ||||||||||||
| Income (loss) before income taxes |
11,889 | 8,158 | (3,428 | ) | (5,341 | ) | (6,822 | ) | ||||||||||||
| Provision (benefit) for income taxes(3) |
(14,242 | ) | 829 | — | — | — | ||||||||||||||
| Net income (loss) |
$ | 26,131 | $ | 7,329 | $ | (3,428 | ) | $ | (5,341 | ) | $ | (6,822 | ) | |||||||
| Net income (loss) allocable to common stockholders |
$ | 5,240 | $ | 130 | $ | (3,428 | ) | $ | (5,341 | ) | $ | (6,822 | ) | |||||||
| Net income (loss) per share: |
||||||||||||||||||||
| Basic |
$ | 1.03 | $ | 0.08 | $ | (2.66 | ) | $ | (6.57 | ) | $ | (16.35 | ) | |||||||
| Diluted |
$ | 0.61 | $ | 0.05 | $ | (2.66 | ) | $ | (6.57 | ) | $ | (16.35 | ) | |||||||
| Weighted-average shares used in computing net income (loss) per share: |
||||||||||||||||||||
| Basic |
5,086,169 | 1,668,876 | 1,289,431 | 813,290 | 417,232 | |||||||||||||||
| Diluted |
8,546,537 | 2,785,277 | 1,289,431 | 813,290 | 417,232 | |||||||||||||||
| (1) | Revenue from related party consists of revenue from Samsung, which, together with associated entities, held over 13% of our outstanding shares of common stock before our initial public offering. After our initial public offering in November 2010, Samsung, together with associated entities, holds less than 10% of our outstanding shares of common stock |
Footnotes continued on the following page.
37
Table of Contents
| As of December 31, | ||||||||||||||||||||
| 2010 | 2009 | 2008 | 2007 | 2006 | ||||||||||||||||
| (in thousands) |
||||||||||||||||||||
| Balance Sheet Data: |
||||||||||||||||||||
| Cash and cash equivalents |
$ | 110,172 | $ | 19,061 | $ | 9,052 | $ | 3,268 | $ | 5,587 | ||||||||||
| Working capital |
116,887 | 20,055 | 10,721 | 3,010 | 7,504 | |||||||||||||||
| Total assets |
158,957 | 34,472 | 20,373 | 16,190 | 15,785 | |||||||||||||||
| Total liabilities |
16,271 | 11,588 | 6,558 | 10,522 | 6,180 | |||||||||||||||
| Convertible preferred stock |
— | 77,616 | 77,616 | 67,680 | 67,680 | |||||||||||||||
| Total stockholders’ equity (deficit) |
142,686 | $ | (54,732 | ) | $ | (63,801 | ) | $ | (62,012 | ) | $ | (58,076 | ) | |||||||
Footnotes continued from the prior page.
| (2) | Stock-based compensation expense is included in our results of operations as follows: |
| As of December 31, | ||||||||||||||||||||
| 2010 | 2009 | 2008 | 2007 | 2006 | ||||||||||||||||
| (in thousands) | ||||||||||||||||||||
| Operating expenses: |
||||||||||||||||||||
| Cost of revenue |
$ | 107 | $ | 31 | $ | 119 | $ | 19 | $ | 9 | ||||||||||
| Research and development |
1,381 | 475 | 358 | 168 | 76 | |||||||||||||||
| Sales and marketing |
526 | 238 | 101 | 66 | 133 | |||||||||||||||
| General and administrative |
691 | 421 | 417 | 574 | 280 | |||||||||||||||
| (3) | The provision (benefit) for income taxes for the year ended December 31, 2010 and 2009 included the releases and reversals of valuation allowances against deferred tax assets provided in prior periods. Please see note 7 to the notes to our consolidated financial statements. |
38
Table of Contents
MANAGEMENT’S DISCUSSION AND ANALYSIS OF
FINANCIAL CONDITION AND RESULTS OF OPERATIONS
The following discussion and analysis of our financial condition and results of operations should be read in conjunction with the consolidated financial statements and related notes thereto included in this prospectus. In addition to historical information, this discussion and analysis contains forward-looking statements that involve risks, uncertainties and assumptions. Our actual results could differ materially from those discussed in the forward-looking statements. We discuss factors that we believe could cause or contribute to these differences below and elsewhere in this prospectus, particularly in the “Risk Factors” section.
Overview
We are a fabless provider of high-speed analog semiconductor solutions for the communications and computing markets. Our analog semiconductor solutions provide high signal integrity at leading-edge data speeds while reducing system power consumption. Our semiconductor solutions are designed to address bandwidth bottlenecks in networks, maximize throughput and minimize latency in computing environments and enable the rollout of next generation communications and computing infrastructures. Our solutions provide a vital high-speed interface between analog signals and digital information in high-performance systems such as telecommunications transport systems, enterprise networking equipment, datacenter and enterprise servers, storage platforms, test and measurement equipment and military systems. We provide 40G and 100G high-speed analog semiconductor solutions for the communications market and high-speed memory interface solutions for the computing market. We have a broad product portfolio with 17 product lines and over 170 products as of December 31, 2010. We help define industry conventions and standards within the markets we target by collaborating with technology leaders, OEMs, systems manufacturers and standards bodies.
The history of our product development and sales and marketing efforts is as follows:
| • | From 2000 to 2002, we were primarily engaged in the development of our core high-speed analog products and proprietary system architecture models to address bottlenecks in emerging network architectures. Specifically, during this period, we developed and shipped our 50 GHz MUX and DEMUX products. During this period, we also began development work on our initial 40G products. |
| • | In 2003, we introduced and shipped 13G, 25G and 50G logic products, 20G MUX and 40G transimpedance amplifiers and modulator drivers for the communications, test and measurement and military markets. During this period, we also began the development of our first generation high-speed PLLs and register solution used primarily in conjunction with double data rate 2, or DDR2, modules for the computing market. |
| • | In 2005, we introduced and shipped our high-speed PLLs and register solution used primarily in conjunction with DDR2 modules for the computing market. |
| • | In 2006, we began development of our second generation single chip high-speed PLLs and register solution to be used primarily in conjunction with double data rate 3, or DDR3, modules for the computing market and were the first to introduce this product to the market. In addition, we introduced and shipped track-and-hold amplifiers for the communications market. |
| • | In 2007, we began volume shipments of our high-speed PLLs and register solution used primarily in conjunction with DDR2 modules, and continued development of our single chip high-speed PLLs and register solution, used primarily in conjunction with DDR3 modules. |
| • | In 2008, we began volume shipments of our 40G drivers for the communications market and commenced shipments of our high-speed PLLs and register solution used primarily in conjunction with DDR3 modules for the computing market. |
| • | In 2009, due to the launch of Intel’s Nehalem-based platform servers, we began volume shipments of our single chip high-speed PLLs and register solution to be used primarily in conjunction with DDR3 |
39
Table of Contents
| modules. We also shipped engineering samples of the first generation of our isolation memory buffer, or iMB™, for the computing market. We also began development of our second generation iMB™ product, the architecture for which has been adopted by the Joint Electronic Device Engineering Council, or JEDEC, and development of our low power CMOS SERDES product for next generation 100G Ethernet in enterprise networks. |
| • | In 2010, we began to ship in production volume a new “low voltage” version of our integrated PLL and register buffer. We also shipped engineering samples of the second generation iMB product. |
Our products are designed into systems sold by OEMs, including Agilent, Alcatel-Lucent, Cisco, Danaher, Dell, EMC, HP, Huawei, IBM and Oracle. We believe we are one of a limited number of suppliers to these OEMs, and in some cases we may be the sole supplier for certain applications. We sell both directly to these OEMs and to module manufacturers, original design manufacturers, or ODMs, and subsystems providers that, in turn, sell to these OEMs. During the year ended December 31, 2010, we sold our products to more than 160 customers. A significant portion of our revenue has been generated by a limited number of customers. Sales directly to Samsung accounted for 34% and 36% of our total revenue and sales directly and through distributors to Micron accounted for 11% and 17% of our total revenue for the years ended December 31, 2010 and 2009, respectively. Substantially all of our sales to date, including our sales to Samsung and Micron, are made on a purchase order basis. Since the beginning of 2006, we have shipped more than 100 million high-speed analog semiconductors. Our total revenue increased to $83.2 million for the year ended December 31, 2010 from $58.9 million for the year ended December 31, 2009. As of December 31, 2010, our accumulated deficit was $34.6 million.
Sales to customers in Asia accounted for 80%, 77% and 64% of our total revenue in 2010, 2009 and 2008, respectively. Because many of our customers or their OEM manufacturers are located in Asia, we anticipate that a majority of our future revenue will continue to come from sales to that region. Although a large percentage of our sales are made to customers in Asia, we believe that a significant number of the systems designed by these customers are then sold to end users outside Asia.
In April 2010, we received approval from the government of Singapore to set up an international headquarters from which to conduct our international operations. Because of its geographic alignment with suppliers and customers, we established our operations in Singapore to become a new international headquarters office for receiving and fulfilling orders for product shipped to locations outside the United States. Singapore has a strong university system and an established group of technology-based companies from which to recruit new engineers. We intend to build a team of engineering capability in Singapore both for development as well as testing associated with manufacturing. International operations in Singapore commenced on May 1, 2010 and during 2010, we transitioned our international operations from the United States to our Singapore subsidiary.
Demand for new features changes rapidly. It is difficult for us to forecast the demand for our products, in part because of the complex supply chain between us and the end-user markets that incorporate our products. Due to our lengthy product development cycle, it is critical for us to anticipate changes in demand for our various product features and the applications they serve to allow sufficient time for product development and design. Our failure to accurately forecast demand can lead to product shortages that can impede production by our customers and harm our customer relationships. Conversely, our failure to forecast declining demand or shifts in product mix can result in excess or obsolete inventory.
Although revenue generated by each design win and the timing of the recognition of that revenue can vary significantly, we consider ongoing design wins to be a key factor in our future success. We consider a design win to occur when an OEM or contract manufacturer notifies us that it has selected our products to be incorporated into a product or system under development. The design win process is typically lengthy, and as a result, our sales cycles will vary based on the market served, whether the design win is with an existing or new customer and whether our product is under consideration for inclusion in a first or subsequent generation product. In addition, our customers’ products that incorporate our semiconductors can be complex and can require a
40
Table of Contents
substantial amount of time to define, design and produce in volume. As a result, we can incur significant design and development expenditures in circumstances where we do not ultimately recognize, or experience delays in recognizing revenue. Our customers generally order our products on a purchase order basis. We do not have any long-term purchase commitments (in excess of one year) from any of our customers. Once our product is incorporated into a customer’s design, however, we believe that our product is likely to continue to be purchased for that design throughout that product’s life cycle because of the time and expense associated with redesigning the product or substituting an alternative semiconductor. Our design cycle from initial engagement to volume shipment is typically two to three years. Product life cycles in the markets we serve typically range from two to 10 years or more and vary by application.
On June 30, 2010, we acquired all of the outstanding shares of Winyatek Technology Inc., in exchange for $3.3 million in cash, 313,713 shares of our Series E preferred stock and earn-out consideration up to $2,000,000 to be determined based on certain operating metrics.
Critical Accounting Policies and Significant Management Estimates
Our consolidated financial statements are prepared in accordance with U.S. Generally Accepted Accounting Principles, or GAAP. In connection with the preparation of our consolidated financial statements, we are required to make assumptions and estimates about future events, and apply judgments that affect the reported amounts of assets, liabilities, revenue, expenses and the related disclosures. We base our assumptions, estimates and judgments on historical experience, current trends and other factors that management believes to be relevant at the time our consolidated financial statements are prepared. On a regular basis, we review the accounting policies, assumptions, estimates and judgments to ensure that our consolidated financial statements are presented fairly and in accordance with GAAP. However, because future events and their effects cannot be determined with certainty, actual results could differ from our assumptions and estimates, and such differences could be material.
Our significant accounting policies are discussed in note 1 of the notes to our consolidated financial statements. We believe that the following accounting estimates are the most critical to aid in fully understanding and evaluating our reported financial results, and they require our most difficult, subjective or complex judgments, resulting from the need to make estimates about the effect of matters that are inherently uncertain. We have reviewed these critical accounting estimates and related disclosures with our audit committee.
Revenue Recognition
Our products are fully functional at the time of shipment and do not require production, modification or customization. We recognize revenue from product sales when persuasive evidence of an arrangement exists, delivery has occurred, the fee is fixed or determinable and collection is reasonably assured. Our fee is considered fixed or determinable at the execution of an agreement, based on specific products and quantities to be delivered at specified prices, which is evidenced by a customer purchase order or other persuasive evidence of an arrangement. Our agreements with non-distributor customers do not include rights of return or acceptance provisions. Product revenue is recognized upon shipment of product to end customers.
Approximately 21% of our sales were made through distributors in 2010. Sales to distributors are included in deferred revenue and we include the related costs in inventory until sales and delivery to the end customers occurs. Two distributor arrangements, which together accounted for 11% of our total revenue in 2010, allow for limited price protection and rights of stock rotation on product unsold by the distributors. The price protection rights allow distributors the right to a credit in the event of declines in the price of our product that they hold prior to the sale to a specific end customer. In the event that we reduce the selling price of products held by distributors, deferred revenue related to distributors with price protection rights is reduced upon notification to the customer of the price change. Stock rotation in the two distributor arrangements is limited to returns for exchange only for a small percentage of product (5%-10%) purchased over a limited period of time (during the immediately prior three to nine months). Other than these two arrangements, no other customer arrangements
41
Table of Contents
include any rights of return or acceptance provisions. There were no material product returns or price protection credits in 2010, 2009 and 2008. Revenue recognition on product sales through distributors is highly dependent on receiving pertinent and accurate data from our distributors in a timely fashion. Distributors provide us periodic data prior to the release of our consolidated financial statements regarding the product, price, quantity and end customer when products are resold, as well as the quantities of our products they still have in stock.
We have not experienced any significant sales returns from end customers due to our stringent quality control standards. We monitor collectability of accounts receivable primarily through review of the accounts receivable aging. Our policy is to record an allowance for doubtful accounts based on specific collection issues we have identified, aging of underlying receivables and historical experience of uncollectible balances. As of December 31, 2010 and 2009, our allowance for doubtful accounts was $68,000.
We have not made any material changes in the accounting methodology we use to record the allowance for doubtful accounts during the past three years. If actual results are not consistent with the assumptions and estimates used, for example, if the financial condition of the customer deteriorated, we may be required to record additional expense that could materially negatively impact our operating results. To date, however, substantially all of our receivables have been collected within the credit term of 30 to 45 days.
Inventory Valuation
We value our inventory, which includes materials, labor and overhead, at the lower of cost or market. Cost is computed using standard cost, which approximates actual cost, on a first-in, first-out basis. We periodically write-down our inventory to the lower of cost or market based on our estimates that consider historical usage and future demand. These factors are impacted by market and economic conditions, technology changes, new product introductions and changes in strategic direction. The calculation of our inventory valuation requires management to make assumptions and to apply judgment regarding forecasted customer demand and technological obsolescence that may turn out to be inaccurate. Inventory valuation reserves were $1,372,000, $916,000 and $938,000 as of December 31, 2010, 2009 and 2008, respectively. Inventory valuation reserves, once established, are not reversed until the related inventory has been sold or scrapped.
We have not made any material changes in the accounting methodology we use to record inventory reserves during the past three years. We do not believe there is a reasonable likelihood that there will be a material change in the future estimates or assumptions that we use to calculate our inventory reserve. However, if estimates regarding customer demand are inaccurate or changes in technology affect demand for certain products in an unforeseen manner, we may be exposed to losses or gains that could be material.
Product Warranty
Our products are under warranty against defects in material and workmanship generally for a period of one or two years. We accrue for estimated warranty cost at the time of sale based on anticipated warranty claims and actual historical warranty claims experience including knowledge of specific product failures that are outside of our typical experience. The warranty obligation is determined based on product failure rates, cost of replacement and failure analysis cost. We monitor product returns for warranty-related matters and monitor an accrual for the related warranty expense based on historical experience. Our warranty obligation requires management to make assumptions regarding failure rates and failure analysis costs. If actual warranty costs differ significantly from these estimates, adjustments may be required in the future, which would adversely affect our gross margins and operating results. The warranty liability as of December 31, 2010 and 2009, were $602,000 and $450,000, respectively, and was immaterial in 2008.
In September 2010, we were informed of a claim related to repair and replacement costs in connection with shipments of over 4,000 integrated circuits made by us during the summer and fall of 2009. Of these shipments, approximately 4% were later confirmed or suspected to have random manufacturing process anomalies in the
42
Table of Contents
wafer die in the product. These anomalies made the circuitry of a small number of random die per foundry wafer susceptible to failure under certain customer specific system operating conditions. At the time of shipment in 2009 and early 2010, we established an initial warranty reserve and added to that accrual as the problem was identified and reliable information became available. The foundry who produced the wafers has informed us that the random anomalies are normal in a Gallium Arsenide, or GaAs, manufacturing process.
In March 2010, we developed additional tests to screen out the wafer die that might be susceptible to this type of failure and resumed shipments to the customer with no subsequent additional reported incidents. Based on our standard warranty provisions, we have provided replacement parts to the customer for the known and suspected failures that had occurred.
In addition and without informing us, in the fall of 2009 the customer instituted its own larger scale replacement program that covered the replacement of entire subassemblies in which our product was only one component. In September 2010, the customer made an initial claim for approximately $18 million against us for the costs incurred relative to that program. We believe the amount of the claim is without merit as our warranty liability is contractually limited to the repair or replacement of our affected products, which to the extent the customer has requested replacement, has already been completed. A formal claim has yet to be made and discussions with the customer are ongoing. At this time, we believe our current warranty reserves are adequate to address the matter and that our obligations under our standard warranty provisions have been fulfilled. However, claims of this nature are subject to various risks and uncertainties and there can be no assurance that this matter will be resolved without further significant costs to us, including the potential for arbitration or litigation. If and when the amount of any additional loss, if any, becomes both probable and determinable, we may be required to record an incremental reserve. We currently expect to continue to do business with this customer for both current and future products.
Goodwill and Purchased Intangible Assets.
Goodwill is recorded as the difference, if any, between the aggregate consideration paid for an acquisition and the fair value of the acquired net tangible and intangible assets. The amounts and useful lives assigned to intangible assets acquired, other than goodwill, impact the amount and timing of future amortization. The value of our intangible assets, including goodwill, could be impacted by future adverse changes such as: (a) any future declines in our operating results, (b) a decline in the valuation of technology company stocks, including the valuation of our common stock, (c) a further significant slowdown in the worldwide economy or the semiconductor industry, (d) any failure to meet the performance projections included in our forecasts of future operating results or (e) the abandonment of any of our acquired in-process research and development projects. We evaluate goodwill and purchased intangible assets deemed to have indefinite lives, on an annual basis in the fourth quarter or more frequently if we believe indicators of impairment exist. Significant management judgment is required in performing periodic impairment tests. The testing for a potential impairment of goodwill involves a two-step process. The first step involves comparing the estimated fair values of our reporting units with their respective book values, including goodwill. If the estimated fair value exceeds book value, goodwill is considered not to be impaired and no additional steps are necessary. If, however, the fair value of the reporting unit is less than book value, then the carrying amount of the goodwill is compared with its implied fair value. The estimate of implied fair value of goodwill may require valuations of certain internally generated and unrecognized intangible assets such as our technology, customer relationships, patents and trademarks. If the carrying amount of goodwill exceeds the implied fair value of that goodwill, an impairment loss is recognized in an amount equal to the excess. If our actual results, or the plans and estimates used in future impairment analyses, are lower than the original estimates used to assess the recoverability of these assets, we could incur additional impairment charges. On June 30, 2010, we acquired all of the outstanding shares of Winyatek Technology Inc. for which we recorded goodwill and identifiable intangible assets of $5,281,000 and $1,640,000, respectively. See note 2 to the notes to our consolidated financial statements.
43
Table of Contents
Stock-Based Compensation
Effective January 1, 2006, we adopted authoritative guidance for stock-based compensation which requires the measurement and recognition of compensation expense for all share-based payment awards made to employees and directors based on the grant date fair values of the awards. The fair value is estimated using the Black-Scholes option pricing model. The value of the award that is ultimately expected to vest is recognized as expense over the requisite service periods in our consolidated statements of operations. We elected to treat share-based payment awards with graded vesting schedules and time-based service conditions as a single award and recognize stock-based compensation expense on a straight-line basis (net of estimated forfeitures) over the requisite service period. Stock-based compensation expenses are classified in the statement of operations based on the department to which the related employee reports.
We account for stock options issued to non-employees in accordance with the guidance for equity-based payments to non-employees. Stock option awards to non-employees are accounted for at fair value using the Black-Scholes option pricing model. Our management believes that the fair value of stock options is more reliably measured than the fair value of the services received. The fair value of the unvested portion of the options granted to non-employees is re-measured each period. The resulting increase in value, if any, is recognized as expense during the period the related services are rendered.
The Black-Scholes option pricing model requires management to make assumptions and to apply judgment in determining the fair value of our awards. The most significant assumptions and judgments include estimating the fair value of underlying stock, expected volatility and expected term. In addition, the recognition of stock-based compensation expense is impacted by estimated forfeiture rates.
We estimated the expected volatility from the historical volatilities of several unrelated public companies within the semiconductor industry because our common stock has no trading history. When selecting the public companies used in the volatility calculation, we selected companies in the semiconductor industry with comparable characteristics to us, including stage of development, lines of business, market capitalization, revenue and financial leverage. The weighted average expected life of options was calculated using the simplified method of prescribed guidance provided by the SEC. This decision was based on the lack of relevant historical data due to our limited experience and the lack of active market for our common stock. The risk-free interest rate is based on the U.S. Treasury yields in effect at the time of grant for periods corresponding to the expected term of the options. The expected dividend rate is zero based on the fact that we have not historically paid dividends and have no intention to pay cash dividends in the foreseeable future. The forfeiture rate is established based on the historical average period of time that options were outstanding and adjusted for expected changes in future exercise patterns.
We do not believe there is a reasonable likelihood that there will be material changes in the estimates and assumptions we use to determine stock-based compensation expense. In the future, if we determine that other option valuation models are more reasonable, the stock-based compensation expense that we record in the future may differ significantly from what we have recorded using the Black-Scholes option pricing model.
Income Taxes
Deferred tax assets and liabilities are determined based on differences between financial reporting and tax bases of assets and liabilities, and are measured using the enacted tax rates and laws that will be in effect when and where the differences are expected to reverse. We record a valuation allowance to reduce deferred tax assets to the amount that we believe is more likely than not to be realized. In assessing the need for a valuation allowance, we considered historical levels of income, projections of future income, expectations and risk associated with estimates of future taxable income and ongoing prudent and practical tax planning strategies. To the extent that we believe it is more likely than not that some portion of our deferred tax assets will not be realized, we would increase the valuation allowance against deferred tax assets. Although, we believe that the judgment we used is reasonable, actual results can differ due to a change in market conditions, changes in tax laws and other factors.
44
Table of Contents
From inception through 2008, we incurred annual losses, and accordingly, we determined that a valuation allowance should be recorded against all of our deferred tax assets. We considered future taxable income and prudent and feasible tax planning strategies in determining the need for a valuation allowance and evaluated the need for a valuation allowance on a regular basis. The determination of recording or releasing a tax valuation allowance is made, in part, pursuant to an assessment performed by management regarding the likelihood that we will generate sufficient future taxable income against which the benefits of our deferred tax assets may or may not be realized. This assessment requires management to exercise significant judgment and make estimates with respect to our ability to generate revenue, gross profits, operating income and taxable income in future periods. Among other factors, management must make assumptions regarding current and projected overall business and semiconductor industry conditions, operating efficiencies, our ability to timely develop, introduce and consistently manufacture new products to meet our customers’ needs and specifications, our ability to adapt to technological changes and the competitive environment, which may impact our ability to generate taxable income and, in turn, realize the value of our deferred tax assets. Significant cumulative operating losses in 2008 and prior years, uncertainty with respect to the acceptance of our products by end customers and significant economic uncertainties in the market made our ability to project future taxable income highly uncertain and volatile at December 31, 2009. Although 2009 was our first profitable year, only the last three quarters of the year were profitable and the vast majority of our pre-tax income was generated in the last two quarters of the year. Based upon management’s assessment of all available evidence, including a relatively short period of recent profitability coupled with significant uncertainties associated with our 2010 business outlook, we concluded, as of December 31, 2009, that it was not more likely than not that our net deferred tax assets would be realized. See note 7 of the notes to our consolidated financial statements.
In March 2010, we received our first substantial quantity of production orders for a new low voltage product, product number INSSTE32882LV-GS02, or the GS02 product, which was a new low voltage version of our integrated PLL and register buffer. This new low voltage product was widely expected in the market to be significant and is expected to begin shipping in high volumes for both us and our competitors with a new Intel platform in the second half of 2010. This GS02 product has been launched and is currently in full commercial production and is shipping in commercial volume. The arrival of these production orders from one of our largest customers reduced concerns and increased our confidence in the strength of our business outlook for the balance of 2010. In addition, certain other new product introductions began to gain traction with customers, providing additional confidence in our longer term outlook. We also achieved further clarity around certain contingencies related to ongoing litigation and certain other product acceptance concerns that existed at December 31, 2009. Furthermore, during the first quarter of 2010, we unexpectedly received additional orders for an older product that allowed us to exceed the overall plan for the quarter and continue our recent trend of profitability into the first quarter of 2010. At its April 30, 2010 meeting, based on a review of the positive developments that materialized in the first quarter of 2010, our board of directors decided to authorize management to retain investment bankers and proceed with plans to pursue a potential initial public offering. Based on these positive developments and an additional quarter of profitable operation, we reassessed the need for a valuation allowance at March 31, 2010 and concluded that a change in circumstances had occurred. Management determined that, based on our prospects and business outlook, it was then reasonable to conclude that it is more likely than not that our deferred tax assets will be realized. Accordingly, we released the full valuation allowance recorded against our deferred tax assets based on the weight of positive evidence that existed at March 31, 2010. Significant judgment is required to determine the timing and extent of a valuation allowance release and our ability to utilize deferred tax assets will continue to be dependent on our ability to generate sufficient taxable income in future periods.
In accordance with the Financial Accounting Standards Board’s guidance on Accounting for Uncertainty in Income Taxes, we perform a comprehensive review of uncertain tax positions regularly. The guidance prescribes a recognition threshold and measurement attribute for the financial statement recognition and measurement of a tax position taken, or expected to be taken, in a tax return. We determine the tax liability for uncertain tax positions based on a two-step process. The first step is to determine whether it is more likely than not based on technical merits that each income tax position would be sustained upon examination. The second step is to
45
Table of Contents
measure the tax benefit as the largest amount that has a greater than 50% likelihood of being realized upon ultimate settlement with a tax authority that has full knowledge of all relevant information. The assessment of each tax position requires significant judgment and estimates. We believe our tax return positions are fully supported, but tax authorities could challenge certain positions, which may not be fully sustained. All tax positions are periodically analyzed and adjusted as a result of events, such as the resolution of tax audits, issuance of new regulations or new case law, negotiations with tax authorities, and expiration of statutes of limitations.
Results of Operations and Key Operating Metrics
The following describes the line items in the statements of operations, which we consider to be our key operating metrics.
Revenue. We generate revenue from sales of our semiconductor products to end customers. A portion of our products is sold indirectly to customers through distributors.
We design and develop high-speed analog semiconductor solutions for the communications and computing markets. Our revenue is driven by various trends in these markets. These trends include the deployment and broader market adoption of next generation 40G and 100G technologies in communications and enterprise networks, the timing of next generation network and enterprise server upgrades in different geographic locations worldwide, the introduction and broader market adoption of next generation server platforms such as Intel’s Nehalem-based platform, and the deployment of high-speed memory interfaces in server and computing platforms.
Our revenue is also impacted by changes in the number and average selling prices of our semiconductor products. Our products are typically characterized by a life cycle that begins with higher average selling prices and lower volumes, followed by broader market adoption, higher volumes, and average selling prices that are lower than initial levels.
We operate in industries characterized by rapidly changing technologies and industry standards as well as technological obsolescence. Our revenue growth is dependent on our ability to continually develop and introduce new products to meet the changing technology and performance requirements of our customers, diversify our revenue base and generate new revenue to replace, or build upon, the success of previously introduced products which may be rapidly maturing. As a result, our revenue is impacted to a more significant extent by product life cycles for a variety of products and to a much lesser extent, if any, by any single product. In 2008, there were no products that represented more than 10% of our total revenue. In 2009, we successfully introduced and began to ship a new product in production which integrated a new PLL, along with a new register buffer. Sales of this newly introduced part comprised 18% and 43% of our total revenue in 2010 and 2009, respectively. In 2010, this product matured. As a result, sales of this product in 2010 declined in volume. We currently expect that by 2011 the new product introduced in 2009 will no longer be material to our total revenue. In 2010, we also began to ship in production volume a new “low voltage” version of our integrated PLL and register buffer, which is shipping in the form of product number INSSTE32882LV-GS02, or the GS02 product. Sales of GS02 product comprised 32% of our total revenue in 2010. In 2011, we expect that revenue from sales of GS02 will continue to be significant.
46
Table of Contents
The following table is based on the geographic location to which our product is initially shipped. In most cases this will differ from the ultimate location of the end user of a product containing our technology. For sales to our distributors, their geographic location may be different from the geographic locations of the ultimate end customer. Sales by geography for the periods indicated were:
| Year Ended December 31, | ||||||||||||
| 2010 | 2009 | 2008 | ||||||||||
| (in thousands) | ||||||||||||
| Korea |
$ | 14,319 | $ | 18,307 | $ | 15,147 | ||||||
| United States |
13,528 | 10,727 | 12,265 | |||||||||
| China |
29,238 | 9,924 | 2,258 | |||||||||
| Japan |
6,557 | 5,688 | 5,903 | |||||||||
| Taiwan |
6,838 | 5,687 | 1,544 | |||||||||
| Other |
12,713 | 8,519 | 5,837 | |||||||||
| $ | 83,193 | $ | 58,852 | $ | 42,954 | |||||||
In 2009, we were shipping products to a customer in Korea. However, in 2010, this customer requested to ship a majority of the products to their facility in China. This resulted in a significant shift in revenue between China and Korea.
Cost of revenue. Cost of revenue includes cost of materials such as wafers processed by third-party foundries, costs associated with packaging and assembly, test and shipping, cost of personnel, including stock-based compensation, as well as equipment associated with manufacturing support, logistics and quality assurance, warranty costs, write down of inventories, amortization of production mask costs, overhead and other indirect costs, such as allocated occupancy and information technology, or IT, costs.
As some semiconductor products mature and unit volumes increase, their average selling prices may decline. These declines are often paired with improvements in manufacturing yields and lower wafer, assembly and test costs, which offset some of the margin reduction that results from lower prices. However, our gross profit, period over period, may fluctuate as a result of changes in average selling prices due to new product introductions or existing product transitions into larger scale commercial volumes, manufacturing costs as well as our product mix.
Research and development. Research and development expense includes personnel-related expenses, including salaries, stock-based compensation and employee benefits. It also includes pre-production engineering mask costs, software license expenses, prototype wafer, packaging and test costs, design and development costs, testing and evaluation costs, depreciation expense and other indirect costs. All research and development costs are expensed as incurred. We expect research and development expense to increase as a result of the establishment of a design center in the United Kingdom and our acquisition of Winyatek Technology Inc. In addition, we expect research and development expense to increase in absolute dollars as we continue to invest resources to develop more products and enhance our existing product portfolio.
Sales and marketing. Sales and marketing expense consists primarily of salaries, stock-based compensation, employee benefits, travel, promotions, trade shows, marketing and customer support, commission payments to employees, depreciation expense and other indirect costs. We expect sales and marketing expense to increase in absolute dollars to support the growth of our business and promote our products to current and potential customers.
General and administrative. General and administrative expense consists primarily of salaries, stock-based compensation, employee benefits and expenses for executive management, legal, finance and human resources. In addition, general and administrative expenses include fees for professional services and other indirect costs. We expect general and administrative expense to increase in absolute dollars due to the general growth of our business and the costs associated with becoming a public company for, among other things, SEC reporting and
47
Table of Contents
compliance, including compliance with the Sarbanes-Oxley Act of 2002, director fees, insurance, transfer agent fees and similar expenses.
Provision (benefit) for income taxes. In each period since our inception to December 31, 2009, we have recorded a valuation allowance for the full amount of our deferred tax asset, as the realization of the full amount of our deferred tax asset was uncertain. Therefore, no deferred tax expense or benefit was recognized in the consolidated financial statements. In 2009, a provision for current income tax was recorded primarily due to our inability to use net operating loss carryforwards for state tax purposes in California and alternative minimum tax for federal tax purposes. For the year ended December 31, 2010, we recorded a net tax benefit of $14.2 million, which reflects an effective tax rate benefit of 120%. The effective tax rate benefit of 120% differs from the statutory rate of 35% primarily due to a release of our deferred tax valuation allowance and, to a lesser extent, foreign income taxes provided at lower rates, geographic mix in profitability and recognition of federal research and development credits. In 2011, we expect the effective tax rate to be lower than 35% due to foreign operations subject to lower tax rates.
The following table sets forth a summary of our statement of operations for the periods indicated:
| Year Ended December 31, | ||||||||||||
| 2010 | 2009 | 2008 | ||||||||||
| (in thousands) |
||||||||||||
| Total revenue |
$ | 83,193 | $ | 58,852 | $ | 42,954 | ||||||
| Cost of revenue |
29,438 | 21,269 | 19,249 | |||||||||
| Gross profit |
53,755 | 37,583 | 23,705 | |||||||||
| Operating expense: |
||||||||||||
| Research and development |
23,781 | 17,847 | 17,501 | |||||||||
| Sales and marketing |
8,823 | 7,704 | 6,339 | |||||||||
| General and administrative |
9,212 | 3,947 | 3,169 | |||||||||
| Total operating expenses |
41,816 | 29,498 | 27,009 | |||||||||
| Income (loss) from operations |
11,939 | 8,085 | (3,304 | ) | ||||||||
| Other income (expense) |
(50 | ) | 73 | (124 | ) | |||||||
| Income (loss) before income taxes |
11,889 | 8,158 | (3,428 | ) | ||||||||
| Provision (benefit) for income taxes |
(14,242 | ) | 829 | — | ||||||||
| Net income (loss) |
$ | 26,131 | $ | 7,329 | $ | (3,428 | ) | |||||
The following table sets forth a summary of our statement of operations as a percentage of each line item to the revenue:
| Year Ended December 31, | ||||||||||||
| 2010 | 2009 | 2008 | ||||||||||
| Total revenue |
100 | % | 100 | % | 100 | % | ||||||
| Cost of revenue |
35 | 36 | 45 | |||||||||
| Gross profit |
65 | 64 | 55 | |||||||||
| Operating expense: |
||||||||||||
| Research and development |
29 | 30 | 41 | |||||||||
| Sales and marketing |
11 | 13 | 15 | |||||||||
| General and administrative |
11 | 7 | 7 | |||||||||
| Total operating expenses |
51 | 50 | 63 | |||||||||
| Income (loss) from operations |
14 | 14 | (8 | ) | ||||||||
| Other income (expense) |
— | — | — | |||||||||
| Income (loss) before income taxes |
14 | 14 | (8 | ) | ||||||||
| Provision (benefit) for income taxes |
(17 | ) | 2 | — | ||||||||
| Net income (loss) |
31 | % | 12 | % | (8 | )% | ||||||
48
Table of Contents
Comparison of the Years Ended December 31, 2010, 2009 and 2008
Revenue
| Change | ||||||||||||||||||||||||||||
| Year Ended December 31, | 2010 | 2009 | ||||||||||||||||||||||||||
| 2010 | 2009 | 2008 | Amount | % | Amount | % | ||||||||||||||||||||||
| (dollars in thousands) | ||||||||||||||||||||||||||||
| Total revenue |
$ | 83,193 | $ | 58,852 | $ | 42,954 | $ | 24,341 | 41 | % | $ | 15,898 | 37 | % | ||||||||||||||
Total revenue for the year ended December 31, 2010 increased by $24.3 million due to a 66% increase in the number of units sold, partially offset by a decrease in average selling price of 15%. The increase in unit volumes was a result of a wider acceptance of our products and technology in new server platforms, such as Intel’s Nehalem-based platform servers. This increase was partially offset by a year-over-year decrease in average selling price of certain products of approximately 15%. Our average selling price decreased primarily as a result change in product mix.
Total revenue for the year ended December 31, 2009 increased by $15.9 million due to a combination of a 7% increase in the number of units sold and an increase in average selling price of 29%, primarily due to changes in product mix. The increase in revenue was primarily driven by the increased adoption of high-speed memory interfaces by our end customers.
Cost of Revenue and Gross Profit
| Change | ||||||||||||||||||||||||||||
| Year Ended December 31, | 2010 | 2009 | ||||||||||||||||||||||||||
| 2010 | 2009 | 2008 | Amount | % | Amount | % | ||||||||||||||||||||||
| (dollars in thousands) | ||||||||||||||||||||||||||||
| Cost of revenue |
$ | 29,438 | $ | 21,269 | $ | 19,249 | $ | 8,169 | 38 | % | $ | 2,020 | 10 | % | ||||||||||||||
| Gross profit |
53,755 | 37,583 | 23,705 | 16,172 | 43 | % | 13,878 | 59 | % | |||||||||||||||||||
| Gross profit as a percentage of revenue |
65 | % | 64 | % | 55 | % | — | 1 | % | — | 9 | % | ||||||||||||||||
Cost of revenue and gross profit for the year ended December 31, 2010 increased by $8.2 million and $16.2 million, respectively, compared to the prior year primarily due to an increase in the number of units purchased by customers consistent with the overall increase in revenue. Product costs as a percentage of revenue were relatively unchanged compared to the prior year.
Cost of revenue in 2009 increased by $2.0 million as a result of an increase in the number of units sold in 2009, compared to 2008 specifically for our high-speed memory interface products. Gross profit and gross profit as a percentage of revenue increased in 2009 relative to 2008 primarily because of a shift in product mix to newer higher margin products shipping in volume.
Research and Development
| Change | ||||||||||||||||||||||||||||
| Year Ended December 31, | 2010 | 2009 | ||||||||||||||||||||||||||
| 2010 | 2009 | 2008 | Amount | % | Amount | % | ||||||||||||||||||||||
| (dollars in thousands) | ||||||||||||||||||||||||||||
| Research and development |
$ | 23,781 | $ | 17,847 | $ | 17,501 | $ | 5,934 | 33 | % | $ | 346 | 2 | % | ||||||||||||||
Research and development expense for the year ended December 31, 2010 increased by $5.9 million due to the increase in research and development headcount, establishment of a design center in United Kingdom and the acquisition of Winyatek Technology Inc., which together resulted in a $3.7 million increase in personnel costs
49
Table of Contents
and stock-based compensation expense, a $0.7 million increase in pre-production engineering mask costs and packaging development expense and engineering software expense of $0.2 million. The increase in personnel and development expense was primarily driven by our strategy to expand our product offerings and enhance our existing products. Specifically, we accelerated the development of our products for next generation communications networks and high-speed memory interfaces. In addition, rent expense increased by $0.2 million due to new building leases for two offices in California.
Research and development expense for the year ended December 31, 2009 increased by $0.3 million primarily due to continued product enhancements initiatives. Specifically, the increase is related to pre-production engineering mask costs of $0.3 million and additional personnel costs, including stock-based compensation of $0.2 million. These increases were partially offset by a reduction in recruiting expenses by $0.2 million due to payment of fees to an outside recruitment company for new employees hired in 2008.
Sales and Marketing
| Change | ||||||||||||||||||||||||||||
| Year Ended December 31, | 2010 | 2009 | ||||||||||||||||||||||||||
| 2010 | 2009 | 2008 | Amount | % | Amount | % | ||||||||||||||||||||||
| (dollars in thousands) | ||||||||||||||||||||||||||||
| Sales and marketing |
$ | 8,823 | $ | 7,704 | $ | 6,339 | $ | 1,119 | 15 | % | $ | 1,365 | 22 | % | ||||||||||||||
Sales and marketing expense for the year ended December 31, 2010 increased by $1.1 million primarily due to an increase in personnel costs, including stock-based compensation expense, to support the increased sales activities.
Sales and marketing expense for the year ended December 31, 2009 increased by $1.4 million from 2008 primarily due to an increase in sales activities. Personnel costs, including stock-based compensation expense increased by $0.2 million and commission expense increased by $0.5 million. In addition, marketing expenses increased by $0.3 million.
General and Administrative
| Change | ||||||||||||||||||||||||||||
| Year Ended December 31, | 2010 | 2009 | ||||||||||||||||||||||||||
| 2010 | 2009 | 2008 | Amount | % | Amount | % | ||||||||||||||||||||||
| (dollars in thousands) | ||||||||||||||||||||||||||||
| General and administrative |
$ | 9,212 | $ | 3,947 | $ | 3,169 | $ | 5,265 | 133 | % | $ | 778 | 25 | % | ||||||||||||||
General and administrative expenses for the year ended December 31, 2010 increased by $5.3 million primarily due to third-party professional fees and personnel costs. Outside legal fees increased by $1.8 million related primarily to litigation matters described in note 15 of the notes to our consolidated financial statements. Accounting and consulting fees increased by $0.8 million due to expenses incurred for our 2009 audit and quarterly reviews and the establishment of our subsidiary in Singapore. Other professional fees increased by $0.4 million for consulting services in information technology and human resource functions. General and administrative headcount increased, resulting in a $1.4 million increase in personnel costs and stock-based compensation expense.
General and administrative expense for the year ended December 31, 2009 increased compared to 2008 due to additional personnel costs of $0.6 million which consist of salaries of new employees, stock-based compensation and incentive pay.
50
Table of Contents
Provision (benefit) for Income Taxes
| Change | ||||||||||||||||||||||||||
| Year Ended December 31, | 2008 | 2009 | ||||||||||||||||||||||||
| 2010 | 2009 | 2008 | Amount | % | Amount | % | ||||||||||||||||||||
| (dollars in thousands) | ||||||||||||||||||||||||||
| Provision (benefit) for income taxes |
$ | (14,242 | ) | $ | 829 | $ | — | $ | (15,071 | ) | N/M | $ | 829 | N/M | ||||||||||||
The income tax benefit of $14.2 million for the year ended December 31, 2010 reflects an effective tax rate benefit of 120%. The effective tax rate benefit of 120% for the year ended December 31, 2010 differs from the statutory rate of 35% primarily due to a release of our deferred tax valuation allowance $24 million and, to a lesser extent, foreign income taxes provided at lower rates, geographic mix in profitability and recognition of federal research and development credits.
The provision for income taxes in 2009 consisted of state income taxes recorded due to our inability to use net operating loss carryforwards for state tax purposes in California and federal income taxes related to alternative minimum tax.
During 2008, we did not record a provision for income tax primarily due to net losses realized and a full valuation allowance on our deferred tax assets.
Quarterly Results of Operations
The following table presents our unaudited quarterly results of operations for the eight quarters in the period ended December 31, 2010. This unaudited quarterly information has been prepared on the same basis as our audited financial statements and includes all adjustments, consisting of only normal recurring adjustments, necessary for the fair statement of the information for the quarters presented. You should read this information in conjunction with our consolidated financial statements and the related notes thereto. The results of operations for any quarter are not necessarily indicative of results of operations for any future period.
| Three Months Ended | ||||||||||||||||||||||||||||||||
| Mar. 31, 2009 |
Jun. 30, 2009 |
Sept. 30, 2009 |
Dec. 31, 2009 |
Mar. 31, 2010 |
Jun. 30, 2010 |
Sept. 30, 2010 |
Dec. 31, 2010 |
|||||||||||||||||||||||||
| (in thousands) | ||||||||||||||||||||||||||||||||
| Total revenue |
$ | 10,336 | $ | 12,986 | $ | 18,370 | $ | 17,160 | $ | 19,086 | $ | 21,099 | $ | 21,862 | $ | 21,146 | ||||||||||||||||
| Cost of revenue |
3,703 | 4,652 | 6,373 | 6,541 | 7,187 | 7,344 | 7,555 | 7,352 | ||||||||||||||||||||||||
| Gross profit |
6,633 | 8,334 | 11,997 | 10,619 | 11,899 | 13,755 | 14,307 | 13,794 | ||||||||||||||||||||||||
| Operating expense: |
||||||||||||||||||||||||||||||||
| Research and development |
4,707 | 4,327 | 4,714 | 4,099 | 5,066 | 5,126 | 6,719 | 6,870 | ||||||||||||||||||||||||
| Sales and marketing |
1,662 | 1,742 | 2,032 | 2,268 | 2,075 | 2,049 | 2,347 | 2,352 | ||||||||||||||||||||||||
| General and administrative |
739 | 967 | 945 | 1,296 | 1,903 | 2,568 | 2,332 | 2,409 | ||||||||||||||||||||||||
| Total operating expense |
7,108 | 7,036 | 7,691 | 7,663 | 9,044 | 9,743 | 11,398 | 11,631 | ||||||||||||||||||||||||
| Income (loss) from operations |
(475 | ) | 1,298 | 4,306 | 2,956 | 2,855 | 4,012 | 2,909 | 2,163 | |||||||||||||||||||||||
| Other income (expense) |
14 | 11 | (23 | ) | 71 | 27 | (34 | ) | 70 | (113 | ) | |||||||||||||||||||||
| Income (loss) before income tax |
(461 | ) | 1,309 | 4,283 | 3,027 | 2,882 | 3,978 | 2,979 | 2,050 | |||||||||||||||||||||||
| Provision (benefit) for income tax |
— | 86 | 437 | 306 | (9,117 | ) | (3,600 | ) | (600 | ) | (925 | ) | ||||||||||||||||||||
| Net income (loss) |
$ | (461 | ) | $ | 1,223 | $ | 3,846 | $ | 2,721 | $ | 11,999 | $ | 7,578 | $ | 3,579 | $ | 2,975 | |||||||||||||||
| Earnings per share: |
||||||||||||||||||||||||||||||||
| Basic |
$ | (0.29 | ) | $ | — | $ | 0.15 | $ | 0.08 | $ | 0.65 | $ | 0.37 | $ | 0.11 | $ | 0.20 | |||||||||||||||
| Diluted |
$ | (0.29 | ) | $ | — | $ | 0.08 | $ | 0.03 | $ | 0.26 | $ | 0.14 | $ | 0.05 | $ | 0.11 | |||||||||||||||
51
Table of Contents
The following table presents the unaudited quarterly results of operations as a percentage of revenue:
| Three Months Ended | ||||||||||||||||||||||||||||||||
| Mar. 31, 2009 |
Jun. 30, 2009 |
Sept. 30, 2009 |
Dec. 31, 2009 |
Mar. 31, 2010 |
Jun. 30, 2010 |
Sept. 30, 2010 |
Dec. 31, 2010 |
|||||||||||||||||||||||||
| Total revenue |
100 | % | 100 | % | 100 | % | 100 | % | 100 | % | 100 | % | 100 | % | 100 | % | ||||||||||||||||
| Cost of revenue |
36 | 36 | 35 | 38 | 38 | 35 | 35 | 35 | ||||||||||||||||||||||||
| Gross profit |
64 | 64 | 65 | 62 | 62 | 65 | 65 | 65 | ||||||||||||||||||||||||
| Operating expense: |
||||||||||||||||||||||||||||||||
| Research and development |
46 | 33 | 26 | 24 | 26 | 24 | 31 | 33 | ||||||||||||||||||||||||
| Sales and marketing |
16 | 14 | 11 | 13 | 11 | 10 | 11 | 11 | ||||||||||||||||||||||||
| General and administrative |
7 | 7 | 5 | 8 | 10 | 12 | 10 | 11 | ||||||||||||||||||||||||
| Total operating expense |
69 | 54 | 42 | 45 | 47 | 46 | 52 | 55 | ||||||||||||||||||||||||
| Income (loss) from operations |
(5 | ) | 10 | 23 | 17 | 15 | 19 | 13 | 10 | |||||||||||||||||||||||
| Other income (expense) |
— | — | — | — | — | — | — | — | ||||||||||||||||||||||||
| Income (loss) before income tax |
(5 | ) | 10 | 23 | 17 | 15 | 19 | 13 | 10 | |||||||||||||||||||||||
| Provision (benefit) for income tax |
— | 1 | 2 | 1 | (48 | ) | (17 | ) | (3 | ) | (4 | ) | ||||||||||||||||||||
| Net income (loss) |
(5 | )% | 9 | % | 21 | % | 16 | % | 63 | % | 36 | % | 16 | % | 14 | % | ||||||||||||||||
Total revenue has generally increased over the eight quarters presented due to the success of our high-speed memory interface and next generation high-speed communications products which were introduced in 2007, 2008 and 2010. Total revenue for the fourth quarter of 2009 decreased slightly, primarily related to a delay in delivery of a high-speed communications product to a specific customer who, due to the specifications of their particular platform design, required that our products be screened and pre-selected for certain performance characteristics. The process for screening was established late in the first quarter and our products associated with this order shipped beginning in the second quarter of 2010. Total revenue for the fourth quarter of 2010 decreased slightly due to continued declines in shipments of older DDR2 products, as well as smaller declines in DDR3 products due to supply chain adjustments, partially offset by increases in 40G communications products. To date, we have not experienced any material impact from seasonal effects on an annual or quarterly basis. Gross profit as a percentage of revenue remained relatively constant from period to period except for the fourth quarter of 2009 and the first quarter of 2010 when gross profit percentage decreased due to a change in product mix.
To accommodate our growth, our operating expenses increased in the third quarter of 2009 and the first, second, third and fourth quarters of 2010. Increases in operating expenses have been largely attributable to growing investment in research and development, increase in sales and marketing efforts and general and administrative expenses for accounting and professional fees, including consulting expenses. Research and development expense increased in the first, second, third and fourth quarters of 2010 primarily due to an increase in the number of employees, the establishment of a design center in United Kingdom, the acquisition of Winyatek Technology Inc., and an increase in pre-production engineering mask costs. General and administrative expense increased in the first, second, third and fourth quarters of 2010 primarily due to legal fees incurred as a result of the litigation matters as described in legal proceedings below, as well as accounting and consulting fees incurred in connection with the audit and quarterly reviews and the establishment of our subsidiary in Singapore.
Liquidity and Capital Resources
We have historically financed our operating activities and capital expenditures primarily through proceeds from the issuances of capital stock. We achieved profitability on an annual basis beginning in 2009 and on a quarterly basis in the second quarter of 2009. We have funded our operating activities and capital expenditures primarily through cash generated from operations since 2009. As of December 31, 2010, we had cash and cash equivalents of $110.2 million.
52
Table of Contents
Our primary uses of cash are to fund operating expenses, purchase inventory and acquire property and equipment. Cash used to fund operating expenses is impacted by the timing of when we pay these expenses, as reflected in the changes in our outstanding accounts payable and accrued expenses. Our primary sources of cash are cash receipts on accounts receivable from our revenue. Aside from the growth in amounts billed to our customers, net cash collections of accounts receivable are impacted by the efficiency of our cash collections process, which can vary from period to period, depending on the payment cycles of our major customers.
The following table summarizes our cash flows for the periods indicated:
| Year Ended December 31, | ||||||||||||
| 2010 | 2009 | 2008 | ||||||||||
| (in thousands) | ||||||||||||
| Net cash provided by operating activities |
$ | 12,361 | $ | 9,849 | $ | 1,377 | ||||||
| Net cash used in investing activities |
(7,664 | ) | (556 | ) | (2,478 | ) | ||||||
| Net cash provided by financing activities |
86,365 | 716 | 6,885 | |||||||||
| Effect of currency exchange rate on cash |
|
49 |
|
— | — | |||||||
| Net increase in cash and cash equivalents |
$ | 91,111 | $ | 10,009 | $ | 5,784 | ||||||
Net Cash Provided by Operating Activities
Net cash provided by operating activities in 2010 primarily reflected net income of $26.1 million, increases to accounts payable and accrued expenses of $1.3 million, depreciation and amortization of $1.8 million and stock-based compensation of $2.7 million offset by increases in inventory of $0.6 million, accounts receivable of $1.9 million, deferred income taxes and deferred charge of $16.1 million and decrease in income tax payable of $1.4 million. Our accounts payable and accrued expenses increased as a result of increased production volumes. Our inventories increased as a result of growing production for immediate delivery to customers in the first quarter of 2011, and accounts receivable increased as a result of increased shipments.
Net cash provided by operating activities in 2009 primarily reflected net income of $7.3 million, increases to accounts payable of $1.4 million, accrued expense of $1.1 million and deferred revenue of $1.6 million, depreciation of $1.3 million and stock-based compensation of $1.2 million. These were offset by an increase in receivables of $4.6 million. Our accounts payable and accrued expenses increased in 2009 to support our increased production volumes and overall operational growth. Our deferred revenue increased due to payments received from customers for future shipments. Our accounts receivable increased as a result of significantly higher product shipments in the fourth quarter of 2009 to meet customer demand.
Net cash provided by operating activities in 2008 primarily reflected the decline in receivables and inventory of $1.8 million and $0.6 million, respectively, increases to accrued expenses by $0.5 million and deferred revenue by $0.4 million, depreciation of $1.4 million and stock-based compensation of $1 million. These were partially offset by a net loss of $3.4 million and a decrease in accounts payable of $1.2 million. Receivables decreased due to improved collection efforts. Inventory decreased due to increased shipment of products to customers. The decrease in accounts payable was due to the timing of payments of vendors as a result of purchasing activities.
Net Cash Used in Investing Activities
In 2010, net cash used in investing activities consisted of net cash used to acquire all of the outstanding shares of Winyatek Technology Inc. of $2.5 million, purchases of property and equipment of $5.2 million, of which $1.9 million was invested in leasehold improvements, including new laboratories, in connection with our move to our new facilities.
53
Table of Contents
Net cash used in investing activities during the years ended December 31, 2009 and 2008 consisted of purchases of property and equipment of $0.6 million and $2.5 million, respectively.
Net Cash Provided by Financing Activities
Net cash provided by financing activities in 2010 consisted primarily of $85.7 million net proceeds from the sale of common stock in our initial public offering, the proceeds from the exercise of stock options of $0.5 million and the excess tax benefit related to stock-based payment of $0.2 million.
Net cash provided by financing activities in 2009 consisted primarily of $0.7 million in proceeds from the exercise of stock options.
Net cash provided by financing activities in 2008 consisted of net proceeds of $9.9 million from our sale of Series E preferred stock and $0.6 million of net proceeds from the exercise of stock options, offset by the repayment on our line of credit of $3.7 million.
Operating and Capital Expenditure Requirements
Our principal source of liquidity as of December 31, 2010 consisted of $110.2 million of cash and cash equivalents. Since inception, our operations have been financed primarily by net proceeds of approximately $77.6 million from sales of our convertible preferred stock and, beginning in 2009, by cash generated from operations. Based on our current operating plan, and in the absence of this offering, we believe that our existing cash and cash equivalents from operations will be sufficient to finance our operational cash needs through at least the next 12 to 18 months. In the future, we expect our operating and capital expenditures to increase as we increase headcount, expand our business activities and grow our end customer base which will result in higher needs for working capital. Our ability to generate cash from operations is also subject to substantial risks described under the caption “Risk Factors.” If any of these risks occur, we may be unable to generate or sustain positive cash flow from operating activities and the proceeds from this offering. We would then be required to use existing cash and cash equivalents to support our working capital and other cash requirements. If additional funds are required to support our working capital requirements, acquisitions or other purposes, we may seek to raise funds through debt financing or from other sources. If we raise additional funds through the issuance of equity or convertible debt securities, the percentage ownership of our stockholders could be significantly diluted, and these newly-issued securities may have rights, preferences or privileges senior to those of existing stockholders, including those acquiring shares in this offering. If we raise additional funds by obtaining loans from third parties, the terms of those financing arrangements may include negative covenants or other restrictions on our business that could impair our operating flexibility, and would also require us to incur interest expense. We can provide no assurance that additional financing will be available at all or, if available, that we would be able to obtain additional financing on terms favorable to us.
Contractual Obligations, Commitments and Contingencies
The following table summarizes our outstanding contractual obligations as of December 31, 2010:
| Payments due by period | ||||||||||||||||||||
| Total | Less Than 1 Year |
1-3 Years |
3-5 Years |
More Than 5 Years |
||||||||||||||||
| (in thousands) | ||||||||||||||||||||
| Operating lease obligations |
$ | 10,801 | $ | 3,726 | $ | 4,145 | $ | 2,194 | $ | 736 | ||||||||||
As of December 31, 2010, we had noncancelable purchase obligations consisting primarily of research and development contracts and commitments to purchase services of $0.9 million, which are payable in 2011 for $0.7 million and in 2012 for $0.2 million.
54
Table of Contents
As of December 31, 2010, we recorded a liability for our uncertain tax position of $1.0 million. We are unable to reasonably estimate the timing of payments in individual years due to uncertainties in the timing of the effective settlement of tax positions.
Legal Proceedings
We are currently a party to lawsuits involving Netlist. For additional information regarding this litigation, see “Business—Legal Proceedings.” In addition, we may from time to time become involved in litigation relating to claims arising from our ordinary course of business. These claims, even if not meritorious, could result in the expenditure of significant financial and diversion of managerial resources.
Off-Balance Sheet Arrangements
Since our inception, we have not engaged in any off-balance sheet arrangements, such as the use of structured finance, special purpose entities or variable interest entities.
Recent Authoritative Accounting Guidance
See note 1 of the notes to our consolidated financial statements for information regarding recently issued accounting pronouncements.
Quantitative and Qualitative Disclosures About Market Risk
Interest Rate Sensitivity
We had cash and cash equivalents of $110.2 million and $19.1 million at December 31, 2010 and 2009, respectively, which was held for working capital purposes. We do not enter into investments for trading or speculative purposes. We do not believe that we have any material exposure to changes in the fair value of these investments as a result of changes in interest rates due to their short-term nature. Declines in interest rates, however, will reduce future investment income.
Foreign Currency Risk
To date, our international customer and vendor agreements have been denominated almost exclusively in United States dollars. Accordingly, we have limited exposure to foreign currency exchange rates and do not currently enter into foreign currency hedging transactions.
55
Table of Contents
Overview
We are a fabless provider of high-speed analog semiconductor solutions for the communications and computing markets. Our analog semiconductor solutions provide high signal integrity at leading-edge data speeds while reducing system power consumption. Our semiconductor solutions are designed to address bandwidth bottlenecks in networks, maximize throughput and minimize latency in computing environments and enable the rollout of next generation communications and computing infrastructures. Our solutions provide a vital high-speed interface between analog signals and digital information in high-performance systems such as telecommunications transport systems, enterprise networking equipment, datacenters and enterprise servers, storage platforms, test and measurement equipment and military systems. We provide 40G and 100G high-speed analog semiconductor solutions for the communications market and high-speed memory interface solutions for the computing market. We have a broad product portfolio with 17 product lines and over 170 products as of December 31, 2010.
We leverage our proprietary high-speed analog signal processing expertise and our deep understanding of system architectures to address data bottlenecks in current and emerging communications, enterprise network, computing and storage architectures. We develop these solutions as a result of our competitive strengths, including our system-level simulation capabilities, analog design expertise, strong relationships with industry leaders, extensive broad process technology experience and high-speed package modeling and design expertise. We use our core technology and strength in high-speed analog design to enable our customers to deploy next generation communications and computing systems that operate with high performance at high speed. We believe we are at the forefront of developing semiconductor solutions that deliver 100G speeds throughout the network infrastructure, including core, metro and the datacenter. Furthermore, our analog signal processing expertise enables us to improve throughput in computing systems. For example, some of our computing products enable up to four times the memory capacity on server platforms while using the current generation of memory devices.
We help define industry conventions and standards within the markets we target by collaborating with technology leaders, OEMs, systems manufacturers and standards bodies. Our products are designed into systems sold by OEMs, including Agilent, Alcatel-Lucent, Cisco, Danaher, Dell, EMC, HP, Huawei, IBM and Oracle. We believe we are one of a limited number of suppliers to these OEMs, and in some cases we may be the sole supplier for certain applications. We sell both directly to these OEMs and to other intermediary systems or module manufacturers that, in turn, sell to these OEMs. During the year ended December 31, 2010, we sold our products to more than 160 customers. Since 2006, we have shipped more than 100 million high-speed analog semiconductors. Our total revenue increased to $83.2 million for the year ended December 31, 2010 from $58.9 million for the year ended December 31, 2009. As of December 31, 2010, our accumulated deficit was $34.6 million.
56
Table of Contents
Industry Background
The proliferation of mobile devices and wireless connectivity is driving growth in demand for network bandwidth as users seek faster access to high-definition video and multimedia content and applications. According to the Cisco Visual Networking Index, global IP traffic is projected to increase more than four-fold from 2009 to 2014, reaching 63.9 exabytes per month in 2014. Global mobile IP traffic is a key driver of this growth, and is projected to grow at a compound annual growth rate of 108% from 2009 to 2014. In addition, the emergence of cloud computing, which allows multiple users to simultaneously execute applications and access data at high speeds is creating additional demand for network bandwidth and computing resources. In order to handle growing network bandwidth and faster computing speeds, communications and computing systems require greater processing resources and higher access speeds.
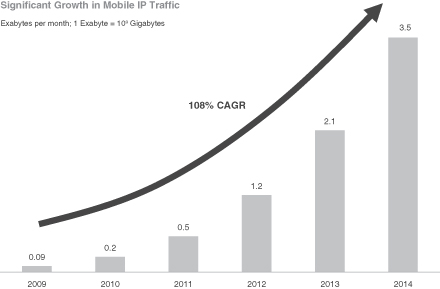
Source: Cisco Visual Networking Index.
57
Table of Contents
Emergence of Cloud Computing
Cloud computing refers to an architecture that locates computing resources, including hardware, software and data, in centralized datacenters and enables users to access these resources on-demand via the Internet. The diagram below graphically depicts a cloud computing architecture example, including a centralized datacenter with computing resources, and the core network and aggregation networks that connect the users to the datacenter.
As illustrated in the diagram, the datacenter consists of both hardware and software layers. The hardware layer, which is designed to allow multiple users to access multiple resources, includes servers and other storage devices with large amounts of memory and networking hardware such as routers and switches. The software layer delivers applications and services that run on this hardware layer. The core network provides communications to users across the country or a metropolitan region, and the aggregation network provides communications to users in a local region. Both the core and aggregation networks employ networking hardware such as dense wavelength division multiplexers, routers, and switches. The core and aggregation networks enable a user to access various applications and services, such as Internet Protocol television, or IPTV, and video conferencing, which run on the hardware and software layers in the datacenters, without regard to where the datacenters are located or how they are accessed. In addition, because of the large amounts of memory on the servers in the datacenters and other hardware and software features that enable high capacity, the applications and services can be simultaneously accessed by a large number of users. For example, it is possible for large numbers of users in diverse geographic locations to simultaneously access these applications and services via mobile or broadband Internet by connecting over the aggregation and core networks to datacenters located across the country. This is commonly referred to as accessing the applications and services “in the cloud.”
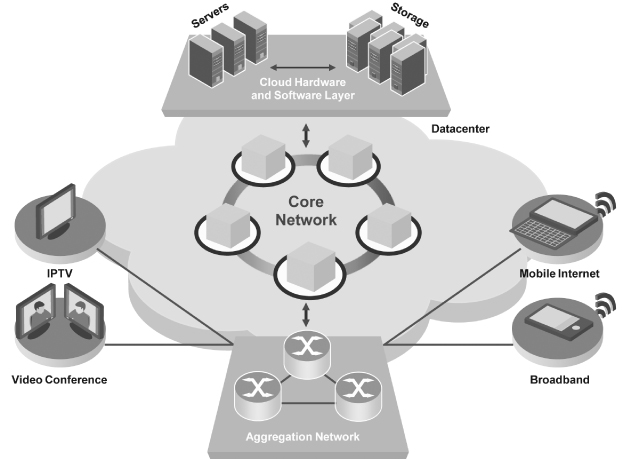
58
Table of Contents
Users benefit from the cloud computing paradigm through increased mobility as well as limited capital and operating expenditures, while maintaining data security and reliability. Providers benefit from increased utilization through economies of scale. According to the IDC eXchange, New IT Cloud Services Forecast: 2009-2013, October 2009, spending on public cloud-based server and storage services is expected to grow from $3.7 billion in 2009 to $12.8 billion in 2013, representing a compound annual growth rate of 37%.
The continued successful adoption of cloud computing requires networks that are scalable and efficient. In order to allow multiple users to simultaneously access data at high speeds, service provider, enterprise and datacenter networks require additional bandwidth and storage. For example, in order to provide new and advanced applications, leading Internet companies operate datacenters that demand additional network bandwidth and storage capacity to scale as their user base grows and applications increase and become more sophisticated. The proliferation of cloud computing is expected to accelerate service provider and enterprise network upgrades and lead to the widespread deployment of the next generation of high-speed network technologies.
Trends Across the Network and Computing Infrastructure
Service providers have historically driven network upgrade cycles to increase bandwidth and increase the number and quality of services they provide to customers. These upgrade cycles are generally characterized by increased speed requirements for data transmission. For example, transmission speeds in the Internet backbone increased from 622 Mbps (megabits per second) in the early 1990s to 2.5 Gbps by the end of that decade, and to 10 Gbps by the mid 2000s. Beginning in 2006, carriers began upgrading core and metro networks from 10 Gbps to 40 Gbps to meet increasing bandwidth demand. Ovum Research expects the total 40G market to grow from $469 million in 2010 to $1.3 billion in 2015, representing a compound annual growth rate of 23%. Beyond 40G, 100G network upgrades are expected to begin to be deployed in 2012, both in the communication networks as well as in enterprise datacenters. Ovum Research expects the total 100G market to grow by a compound annual growth rate of 88% to $1.2 billion from 2012 to 2015.
Enterprises are addressing the increased bandwidth demand by upgrading their corporate networks and expanding computing capacity in datacenters. At the same time, enterprises are trying to minimize power consumption and space requirements. Historically, enterprises have deployed various technologies in their networks, and Ethernet has emerged as a commonly deployed solution to upgrade corporate networks because of its ability to cost-effectively scale bandwidth capacity while minimizing power consumption, space and operational support requirements. Due to favorable performance attributes of 100G technology, enterprise networking equipment is also expected to transition to 100G technology. For example, a single 100G Ethernet link can provide the same bandwidth, better latency and reduced system complexity while utilizing a fraction of the power and space as compared to ten 10G Ethernet links. As a result, 100G Ethernet technology is expected to improve energy efficiency and lower capital expenditures as compared to 10G Ethernet technology.
Increasing data volumes, coupled with software technologies such as virtualization, which allows multiple users to run different operating systems and applications on a single server, require increased server processing capacity in the datacenter. As server virtualization and efficiency become more important to enterprise IT management, we believe that servers with multi-core central processing units, or CPUs, and high-speed technology will become more prevalent in the datacenter. These high-end servers must support the transfer of large volumes of data between the CPU, the system memory and other input-output, or I/O, devices at extremely high speeds and with low latency. This requirement is particularly challenging because increases in memory density have failed to keep pace with advances in processing power, resulting in bottlenecks within the server. As enterprises continue to migrate to cloud computing models, these high-end servers and other datacenter solutions require technology solutions that allow them to process greater data volume from multiple sources, maximize server floor space, cost-effectively upgrade new and existing networks and reduce power consumption.
59
Table of Contents
The Need for High-Speed Analog Semiconductors to Address Critical Signal Integrity Challenges
Communications and computing systems must manage data reliably at increasing speeds using a wide range of physical media or interfaces, including wireless, twisted pair copper wires, coaxial cables and fiber optic cables. At higher speeds, signal integrity and data transmission and recovery become increasingly difficult to achieve. Moreover, in many networks and computing systems, bandwidth bottlenecks arise where the physical media and traditional semiconductor solutions are incapable of supporting the increased data transfer rates and cause signal deterioration. These signal deterioration issues are addressed with high-speed analog semiconductors that maintain or improve signal integrity at every switching or regeneration interface. These high-speed analog semiconductors employ sophisticated analog signal processing techniques to accurately generate, amplify, reshape, retime and receive the transmitted data.
High-speed analog semiconductor solutions address critical engineering needs of the different markets within the communications and computing infrastructures. These needs include: high signal integrity at high speeds, reduced power consumption, system-wide cost efficiency, small form factor and rapid time to market. Signal integrity, especially at high speeds, has been a technical challenge that has not been met by many existing analog semiconductor solutions. Further, those analog solutions that have met the required signal integrity benchmarks at high speeds are often constrained by power, cost, footprint and other performance considerations. These constraints differ by end market, and are outlined below:
| • | Communications Networks. Network operators are upgrading their networks from 10G to 40G and 100G, requiring error-free or low-error transmission of data up to several thousands of kilometers in distance. In these networks, high-speed analog semiconductors are required to ensure high signal integrity as well as increased data transfer from transmission through receipt. Current solutions that achieve high signal integrity typically do so at the expense of power consumption, footprint and size. |
| • | Enterprise and Datacenter Networks. In the datacenter, Ethernet switches and routers have traditionally connected downstream servers with 1G Ethernet ports to upstream switches and routers with 10G Ethernet ports. The advent of more powerful downstream servers results in data bottlenecks in these switches and routers as they provide upstream connections with existing 10G ports. High-speed analog semiconductors are required to address these data bottlenecks that arise as server interconnect port speeds increase. |
| • | Computing and Storage. The proliferation of advanced multi-core processing and higher CPU speeds has made it more challenging to incorporate additional I/O and memory devices. At high speeds, signal deterioration within communication channels restricts the maximum number of I/O interface or memory devices that can connect to a single controller or CPU. As speeds within each channel and the number of channels increases, the impact of these limitations is magnified, resulting in reduced I/O, memory and CPU communication channel capacity and throughput. This results in decreased server utilization, which creates the need for additional server racks and increases system power consumption. To increase throughput, high-speed analog semiconductors are required to manage signals along the communication channels between the CPU, system memory and other interface devices. |
High-speed analog semiconductors also serve critical functions within high-performance systems deployed in other markets such as test and measurement equipment and military systems. For example, to support the measurement and validation of communications systems, research and development teams within systems providers need to use signal test and measurement tools with even more advanced, next generation capabilities. These test and measurement systems, require high-speed analog semiconductors to enable high frequency signal acquisition. In addition, military systems, such as next generation radar detection systems, incorporate high-speed analog semiconductors to improve signal integrity and data throughput at higher speeds while limiting system power consumption, size and cost. As the speed requirements for next generation test and measurement systems and military equipment continue to increase, we believe that many current solutions will fall short of addressing market needs.
60
Table of Contents
Our Competitive Strengths
Our semiconductor solutions leverage our deep understanding of high-speed analog signal processing and our system architecture knowledge to address data bottlenecks in current and emerging network architectures. We design and develop our products for the communications and computing markets, which typically have two to three year design cycles, and product life cycles of 10 or more years. We believe our leadership position in developing high-speed analog semiconductors is a result of the following core strengths:
| • | System-Level Simulation Capabilities. We design our high-speed analog semiconductor solutions to be critical components in complex systems. In order to understand and solve system problems, we work closely with systems vendors to develop proprietary component, channel and system simulation models. We use these proprietary simulation and validation tools to accurately predict system performance prior to fabricating the semiconductor or alternately, to identify and optimize critical semiconductor parameters to satisfy customer system requirements. We use these simulation and validation capabilities to reduce our customers’ time to market and engineering investments, thus enabling us to establish differentiated design relationships with our customers. |
| • | Analog Design Expertise. We believe that we are a leader in developing broadband analog semiconductors operating at high frequencies of up to 100 GHz. High-speed analog circuit design is extremely challenging because, as frequencies increase, semiconductors are increasingly sensitive to temperature, power supply noise, process variation and interaction with neighboring circuit elements. Development of components that work robustly at high frequencies requires an understanding of analog circuit design, including electromagnetic theory and practical experience in implementation and testing. Our analog design expertise has enabled us to design and commercially ship the first 18 GHz track-and-hold amplifier, 28 GHz linear transimpedance amplifier, 40 GHz transimpedance amplifier and 50 GHz MUX and DEMUX components. |
| • | Strong Relationships with Industry Leaders. We develop many of our high-speed analog semiconductor solutions for applications and systems that are driven by industry leaders in the communications and computing markets. Through our established relationships with industry leaders, we have repeatedly demonstrated the ability to address their technological challenges. As a result, we are designed into several of their current systems and believe we are well-positioned to develop high-speed analog semiconductor solutions for their emerging architectures. For instance, our high-speed memory interface designs have been validated for Intel’s Xeon® Core i7® and next generation platforms. As a result of our development efforts with industry leaders, we help define industry conventions and standards within the markets we target by collaborating with technology leaders, OEMs and systems manufacturers, as well as standards bodies such as the Joint Electronic Device Engineering Councils, or JEDEC, and the Institute of Electrical and Electronic Engineers, or IEEE, and the Optical Internetworking Forum, or OIF, to establish industry standards. |
| • | Broad Process Technology. We employ process technology experts, device technologists and circuit designers who have extensive experience in many process technologies including CMOS, SiGe and III-V technologies such as GaAs or InP. We have developed specific internal models and design kits for each process to support a uniform design methodology across all of our semiconductor solutions. For example, our products using 40 nanometer CMOS technology require development of accurate models for sub-circuits such as PLLs, varactors and inductors. As another example, for III-V materials-based processes, in-house model development is a necessity and we believe also provides a substantial competitive advantage because these processes have complex material and device interactions. Combined with our fabless manufacturing strategy, our design expertise, proprietary model libraries and uniform design methodology allow us to use the best possible materials and substrates to design and develop our semiconductor solutions. We believe that our ability to design high-speed analog semiconductors in a wide range of materials and process technologies allows us to provide superior performance, power, cost and reliability for a specific set of market requirements. |
61
Table of Contents
| • | High-Speed Package Modeling and Design. We have developed deep expertise in high-speed package modeling and design, since introducing the first high-speed 50 GHz MUX and DEMUX product in 2001. At high frequencies, the interaction between an analog device, its package and the external environment can significantly affect product performance. Accurately modeling and developing advanced packaging allows semiconductor solutions to address this challenge. Due to the advanced nature of this work, there is a limited supply of engineers with experience in high-speed package modeling and design, and therefore this required expertise can be difficult to acquire for companies that have not invested in developing such a skill set. We have developed an infrastructure to simulate electrical, mechanical and thermal properties of devices and packages that we integrate within our semiconductor design process and implement at our third-party packaging providers. Modeling is an inherently iterative process, and since our model libraries are used extensively by our circuit designers, the accuracy and value of these models increases over time. Our current packaging and modeling techniques enable us to deliver semiconductors that are energy efficient, offer high-speed processing and enable advanced signal integrity, all in a small footprint. |
We believe that our system-level simulation capabilities, our analog design and broad process technology design capabilities as well as our strengths in packaging enable us to differentiate ourselves by delivering advanced high-speed analog signal processing solutions. For example, we believe we have successfully demonstrated the feasibility of our next generation 100G Ethernet architecture well ahead of our competitors. Within the server market, we have applied our analog signal processing expertise to develop our iMBTM technology, which is designed to expand the memory capacity in existing server and computing platforms. Adoption of the iMBTM allows up to four times the memory capacity to be installed in a server platform, while using the current generation of memory devices.
Benefits We Provide to Our Customers
We believe the key benefits that our solutions provide to our customers are as follows:
| • | High Performance. Our high-speed analog semiconductor solutions are designed to meet the specific technical requirements of our customers in their respective end-markets. In many cases, our close design relationships and deep engineering expertise put us in a position where we are one of a limited group of semiconductor vendors that can provide the necessary solution. For instance, in the broadband communications market, we believe our products achieve the highest signal integrity and attain superior signal transmission distance at required error-free or low error rates. In the computing market, we believe our products achieve industry leading data transfer rates at the smallest die size. |
| • | Low Power and Small Footprint. In each of the end markets that we serve, the power budget of the overall system is a key consideration for systems designers. Power consumption greatly impacts system operation cost, footprint and cooling requirements, and is increasingly becoming a point of focus for our customers. We believe that our high speed analog signal processing solutions enable our customers to implement system architectures that reduce overall system power consumption. We also believe that, at high frequencies, our high-speed analog semiconductor devices typically consume less power than competitors’ standard designs, which often incorporate power-consuming digital signal processing to perform data transfer functions, thereby further reducing overall system power consumption. In addition, in many of our applications, we are able to design and deliver semiconductors that have a smaller footprint and therefore reduce the overall system size. |
| • | Faster Time to Market. Our customers compete in markets that require high-speed, reliable semiconductors that can be integrated into their systems as soon as new market opportunities develop. To meet our customers’ time-to-market requirements, we work closely with them early in their design cycles and are actively involved in their development processes. Over the past nine years, we have developed methodologies and simulation environments that accurately predict the behavior of complex integrated circuits within various communications systems. In addition, we have developed an |
62
Table of Contents
| extensive internal library of proven building block circuits such as amplifiers, phase frequency detectors and transmitters that are reused to shorten design cycles and reduce risk. |
Risks Associated with Our Business Model
Our business model is subject to various risks and uncertainties, including, but not limited to, the following:
| • | Fluctuations in our Revenue and Operating Results. Our revenue and operating results can fluctuate, which could cause our stock price to decline. Factors that may contribute to these fluctuations include, but are not limited to, the reduction or cancellation of customer orders, fluctuations in the levels of component inventories held by our customers, the gain or loss of significant customers, our ability to develop and market new products and technologies on a timely basis and the timing and extent of product development costs. |
| • | History of Losses and Accumulated Deficit. As of December 31, 2010, we had an accumulated deficit of $34.6 million and have incurred net losses in each year through 2008, and we may incur net losses in the future. |
| • | Dependence on a Limited Number of Customers. We depend on a limited number of customers and products for a substantial portion of our revenue. For example, sales directly to Samsung accounted for 34% and 36% of our total revenue and sales directly and through distributors to Micron accounted for 11% and 17% of our total revenue for the years ended December 31, 2010 and 2009, respectively. Some of our customers, including Samsung and Micron, use our products primarily in high-speed memory devices. |
| • | Lack of Long-Term Purchase Commitments. Substantially all of our sales are made on a purchase order basis and we do not have long-term purchase commitments with any of our customers. The loss of, or reduction in sales to, a key customer will materially and adversely affect our operating results. |
| • | Lengthy Sales Cycle. We must win competitive bid processes, such wins known as “design wins,” to enable us to sell our semiconductor products for use in our customers’ products. The design win process is lengthy and we may not secure the design win or generate any revenue despite incurring significant design and development expenditures. Even after securing a design win, we may experience delays in generating revenue. |
| • | Lengthy and Expensive Qualification Process. Our customers require our products and our third-party contractors to undergo lengthy, expensive and extensive qualification processes. In addition, a successful qualification does not assure any sales of the product to that customer and it can take several months or more before a customer takes volume production of components or systems that incorporate our products, if at all. |
| • | Need to Continually Develop and Introduce New Products. Our future success depends on our ability to continually develop and introduce new products to meet the changing technology and performance requirements of our customers, diversify our revenue base and generate new revenue to replace, or build upon, the success of previously introduced products which may be rapidly maturing. For example, in 2009, we successfully introduced and began to ship a new product in production which we identify as product number INSSTE32882-GS04, or the GS04 product, and which consists of an integrated PLL and register buffer. Sales of the GS04 product comprised 18% and 43% of our total revenue in 2010 and 2009, respectively. This product has now matured and, as a result, sales of this product are now declining in volume. In 2010, we also began to ship in production volume a new “low voltage” version of our integrated PLL and register buffer, which is shipping in the form of product number INSSTE32882LV-GS02, or the GS02 product. Sales of GS02 product comprised 32% of our total revenue in 2010. |
| • | Market Development of and Demand for 100G Solutions. We are currently investing significant resources to develop semiconductor solutions supporting 100G data transmission rates. If sufficient |
63
Table of Contents
| market demand for 100G solutions does not develop or develops more slowly than expected, or if we fail to accurately predict market requirements or demand for 100G solutions, our business, competitive position and operating results would suffer. |
For additional discussion of the risks applicable to our business model, please see the discussion under the heading “Risk Factors.”
Our Strategy
Our mission is to enable faster communications and computing infrastructure with high-speed analog semiconductor solutions that reliably capture critical analog signals, convert them to useful data, and transport the data at high speeds. Key elements of our strategy include:
| • | Focus on Markets that Require High Signal Integrity at High Speeds. We believe our target markets are driven by expected growth trends in video applications, mobile Internet and cloud computing, causing a greater demand for network bandwidth and computing speeds. Due to higher bandwidth and faster computing needs, these applications require our specialized semiconductor solutions that provide high-speed data traffic, preserve signal integrity and increase power efficiency. For example, we provide high-speed analog semiconductor solutions for high growth markets such as 40G and 100G communications. We intend to continue to focus our efforts in markets where high signal integrity at high speeds is imperative. |
| • | Extend Technology Leadership in High-Speed Analog Semiconductors. We believe we employ best-in-class technology and design capabilities in our high-speed analog semiconductor solutions. Our innovative approaches have allowed us to be first to market in a number of key product lines. For example, we designed and commercially shipped the first 18 GHz track-and-hold amplifier, 28 GHz linear transimpedance amplifier, 40 GHz transimpedance amplifier and 50 GHz MUX and DEMUX components. We intend to continue to invest in research and development to extend our leadership in existing markets and enable the widespread deployment of our next generation technology into newer markets. |
| • | Expand Global Presence. Given the continued globalization of the semiconductor supply chain, we believe that a global presence is critical to securing design wins from both new and existing customers. We currently have offices in North America, Asia and Europe coupled with 16 sales channel partners worldwide. We plan to continue the expansion of our sales, design and technical support organization to broaden our customer reach in new markets, primarily in Asia and Europe. For example, we recently opened new design center in the United Kingdom and an international headquarters in Singapore to capitalize on local design talent. Additionally, we continue to increase the number of global sales professionals directly and through channel partners. |
| • | Continue to Build Deep Relationships with Customers. We intend to continue to develop long-term, collaborative relationships with customers who are regarded as leaders in their respective markets. We work closely with customers throughout design cycles that often last two to three years, and often in situations where we are their sole supplier for a given product. As a result, we are able to develop long-term relationships with our customers as our technology becomes embedded in their products. We plan to continue to work with customers to enable them to develop innovative solutions that address both existing and new performance challenges. |
| • | Attract and Retain Top Talent. We believe one of our key differentiators resides in the design of solutions that address complex, real world problems for our customers. In this respect, our team of analog engineers and systems designers is critical to our success. Our technical team typically has, on average, more than 20 years of industry experience with more than 75% having advanced degrees and more than 25% having Ph.Ds. We intend to continue to aggressively recruit and seek to retain talented engineering and design personnel. For example, on June 30, 2010, we recently acquired all of the outstanding shares of Winyatek Technology Inc., a Taiwanese company, in part to further strengthen our technology and engineering resources. |
64
Table of Contents
Products
Our products address bandwidth bottlenecks throughout the cloud computing and network communications infrastructure, as depicted in the illustration below. For instance, our high-speed memory interface products can be found in servers where they allow CPUs to better utilize available memory resources. In addition, our products find application in devices such as dense wavelength division multiplexers that enable core and aggregation networks.
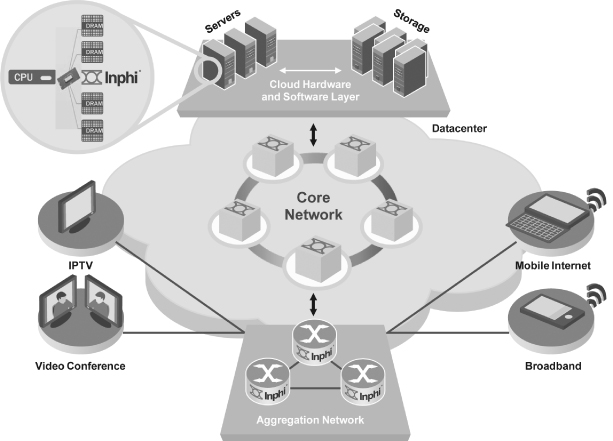
As of December 31, 2010, we had more than 170 products across 17 product lines, including products that have commercially shipped, products for which we have shipped engineering samples and products under development, that perform a wide range of functions such as amplifying, encoding, multiplexing, demultiplexing, retiming and buffering data and clock signals at speeds up to 100 Gbps. These products are key enablers for servers, routers, switches, storage and other equipment that process, store and transport data traffic. Our products are also used in test and measurement equipment and military radar systems that capture and process high-speed and ultra broadband signals. We introduced 8 new products in 2010. We design and develop our products for the communications and computing markets, which typically have two to three year design cycles, and product life cycles as long as 10 years or more.
In 2009, we successfully introduced and began to ship a new product in production which we identify as product number INSSTE32882-GS04, or the GS04 product, and which consists of an integrated PLL and register
buffer. Sales of the GS04 product comprised 18% and 43% of our total revenue in 2010 and 2009, respectively.
65
Table of Contents
In 2010, we also began to ship in production volume a new “low voltage” version of our integrated PLL and register buffer, which is shipping in the form of product number INSSTE32882LV-GS02, or the GS02 product. This GS02 product has been launched and is currently in full commercial production and is shipping in commercial volume. Sales of GS02 product comprised 32% of our total revenue in 2010. There were no other products that generated more than 10% of our total revenue in 2010, 2009 or 2008.
The table below lists our products, their application speed in gigabits per second, or Gbps or G, and functional description.
| Product Line | Speed | Description | Application | |||
| Clock and Data Recovery (CDR) | 100G | Recovers the clock from high-speed signals; used to retime the signal prior to re-transmitting to ensure the highest signal integrity | Enables the next generation of small form factor 100G Ethernet modules, line cards and backplane applications | |||
| Clock fanout | 10G to 50G | Provides replication and buffering of high-speed clock signals | Typically used to distribute a high-speed clock to multiple chips in a system | |||
| Demultiplexer (DEMUX) | 10G to 50G | De-serializes a high-speed data stream to multiple lower speed data streams for further signal processing | Typically used in high-speed data acquisition applications | |||
| D Flip Flops | 10G to 50G | Retimes the input signal to deliver optimal signal integrity | Typically used in high-speed pattern generation applications | |||
| Differential Amplifiers | 10G | Amplifies differential signals and drives high-speed analog-to-digital converters | Typically used to amplify linear broadband signals or drive high-speed analog-to-digital converters for data acquisition applications | |||
| Differential Encoders | 10G | Provides differential encoding function for Differential Phase Shift Keying (DPSK) transmission | Typically used in 10 Gbps ultra long haul optical transceivers | |||
| Isolation Memory Buffer (iMBTM) | 1.6G | Provides critical high-speed interface between the central processing unit (CPU) and memory | Architecture adopted by the Joint Electronic Device Engineering Council as an industry standard | |||
| Latched Comparator | 10G to 50G | Used as a high-speed 1-bit analog-to-digital converter | Typically used in high-speed data acquisition applications | |||
| Logic Gates | 10G to 50G | Standard logic gates used as general-purpose building blocks for high-speed data processing | Typically used in test and measurement applications | |||
| Modulator Driver | 40G to 100G | Amplifies a small signal to 8 volts (or higher) output voltage in order to drive optical modulators for very long distance data transmission | Typically used in optical transmission systems and test and measurement equipment | |||
| Multiplexer (MUX) | 10G to 50G | Serializes multiple data streams to a high-speed data stream prior to transmission | Typically used in high-speed pattern generation applications | |||
| Phase-Lock Loop (PLL)* | 1.86G | Provides critical high-speed interface between CPU and memory | Typically used for all but the lowest capacity modules in order to install sufficient memory in computing and storage platforms | |||
| Prescalers | 10G to 50G | Divides the high frequency clock to a lower frequency clock | Typically used in test and measurement, military and ultra long haul optical transmission equipment | |||
| Register Buffers* | 1.86G | Regenerates a CPU’s command and address signals | Typically used for all but the lowest capacity modules in order to install sufficient memory in computing and storage platforms | |||
| Return-to-Zero (RZ) Converter | 10G | Converts a Non-Return-to-Zero (NRZ) digital bit stream to RZ format | Typically used in 10 Gbps ultra long haul optical transceivers | |||
| Serializer-Deserializer (SERDES) | 100G | Combines a serializer, deserializer, equalizer and CDR functions on one chip | Enables the next generation of high density 100G Ethernet linecards | |||
| Transimpedance Amplifier (TIA) | 10G to 100G | Amplifies small currents generated by a photodetector for further signal processing | Typically used in optical transceivers for Ethernet, synchronous optical networking, dense wavelength division multiplexing, as well as other optical receiver applications |
66
Table of Contents
| * | Product number INSSTE32882-GS04, or the GS04 product, consists of an integrated PLL and register buffer. Sales of the GS04 product comprised 18% and 43% of our total revenue in 2010 and 2009, respectively. In 2010, a new low voltage version of our integrated PLL and register buffer is also now shipping in volume as product number INSSTE32882LV-GS02. Sales of GS02 product comprised 32% of our total revenue in 2010. |
Each of the products listed in the table above are currently in commercial production except for our iMB™ product, for which we are currently shipping engineering samples and expect to commence commercial production in 2011, and our CDR and SERDES products, which are under development. We currently expect to commence shipments of engineering samples of our CDR and SERDES products in 2011, and commercial production of these products in 2012.
Customers
We sell our products directly to OEMs and indirectly to OEMs through module manufacturers, ODMs and sub-systems providers. We work closely with technology leaders, including microprocessor and communications equipment companies, to design architectures and products that help solve bandwidth bottlenecks in and between systems. These technology leaders often design our products into reference designs, which they provide to their customers and suppliers. For example, in the server market we work closely with major CPU manufacturers to address the bottleneck between their CPU and the increasing amount of memory attached to it. These CPU manufacturers then provide their server CPU customers and memory module partners with a validation report, including validation of our memory interface products. These server OEMs and memory module companies then design our memory interface products into their production systems. Ultimately, our sales into these servers are to memory module companies, including Hynix, Micron, Samsung and others. In the networking market, we work closely with OEMs to deliver high performance communication links. These OEMs design our product into their systems and then require their ODM and electronics manufacturing services suppliers to purchase and use that specific product from us. We also work directly with module manufacturers to design our products into their modules, which they sell to OEMs.
We work closely with our customers throughout design cycles that often last two to three years and we are able to develop long-term relationships with them as our technology becomes embedded in their products. As a result, we believe we are well-positioned to not only be designed into their current systems, but also to continually develop next generation high-speed analog semiconductor solutions for their future products. During the year ended December 31, 2010, we sold our products to more than 160 customers.
Sales to customers in Asia accounted for 80%, 77% and 64% of our total revenue in 2010, 2009 and 2008 respectively. Because many of our customers or their OEM manufacturers are located in Asia, we anticipate that a majority of our future revenue will continue to come from sales to that region. Although a large percentage of our sales are made to customers in Asia, we believe that a significant number of the systems designed by these customers and incorporating our semiconductor products are then sold to end users outside Asia.
We currently rely, and expect to continue to rely, on a limited number of customers for a significant portion of our revenue. In the year ended December 31, 2010, Samsung accounted for 34% of our total revenue, and our 10 largest customers collectively accounted for 76% of our total revenue. In addition, sales directly and through distributors to Micron accounted for 11% of our total revenue in the year ended December 31, 2010. Samsung directly accounted for 36% of our total revenue and sales directly and through distributors to Micron accounted for 17% of our total revenue for the year ended December 31, 2009. No other single customer directly or indirectly accounted for more than 10% of our total revenue in 2010 or 2009.
Sales and Marketing
Our design cycle from initial engagement to volume shipment is typically two to three years, with product life cycles in the markets we serve ranging from two to 10 years or more. For many of our products, early
67
Table of Contents
engagement with our customers’ technical staff is necessary for success. To ensure an adequate level of early engagement, our application and development engineers work closely with our customers to identify and propose solutions to their systems challenges.
In addition to our direct customers, we work closely with technology leaders such as Intel and AMD for the computing and storage markets and Alcatel-Lucent, Cisco, Huawei for the networking and communications market to anticipate and solve next generation challenges facing our customers. As part of the sales and product development process, we often design our products in close collaboration with these industry leaders and help define their architecture. We also participate actively in setting industry standards with organizations such as IEEE, JEDEC and OIF to have a voice in the definition of future market trends.
We sell our products worldwide through multiple channels, including our direct sales force and a network of sales representatives and distributors. For the year ended December 31, 2010, 79% of our revenue was generated by our direct sales team and third-party sales representatives. We operate direct sales offices in Japan, Korea, Singapore, Taiwan and the United States and employ sales personnel that cover our direct customers and manage our channel partners. We utilize two sales representatives and two distributors in Asia, a distributor in Europe, a distributor in Israel, nine sales representatives in North America and a distributor in Japan. Our channel network includes more than 100 sales professionals to support our products and customers, including seven in Japan, 21 in Asia (other than Japan), 62 in North America and 26 in Europe, the Middle East and Africa, or EMEA. All of these sales professionals are sales agents and are employed by our distributors and sales representatives except for 10 sales agents who are our direct employees, including two in Japan, three in Asia, four in North America and one in EMEA. We believe these distributors and sales representatives have the requisite technical experience in our target markets and are able to leverage existing relationships and understanding of our customers’ products to effectively sell our products. Given the breadth of our target markets, customers and products, we provide our direct and indirect sales teams with regular training and share product information with our customers and sales team using web-based tools.
Manufacturing
We operate a fabless business model and use third-party foundries and assembly and test manufacturing contractors to manufacture, assemble and test our semiconductor products. We also inspect and test parts in our Westlake Village, California, facility. This outsourced manufacturing approach allows us to focus our resources on the design, sale and marketing of our products. In addition, we believe outsourcing many of our manufacturing and assembly activities provides us the flexibility needed to respond to new market opportunities, simplifies our operations and significantly reduces our capital requirements.
We subject our third-party manufacturing contractors to qualification requirements in order to meet the high quality and reliability standards required of our products. We carefully qualify each of our partners and processes before applying the technology to our products. Our engineers work closely with our foundries and other contractors to increase yield, lower manufacturing costs and improve product quality.
| • | Wafer Fabrication. We currently utilize a wide range of semiconductor processes to develop and manufacture our products. Each of our foundries tends to specialize in a particular semiconductor wafer process technology. We choose the semiconductor process and foundry that we believe provides the best combination of performance attributes for any particular product. For most of our products, we utilize a single foundry for semiconductor wafer production. Our principal foundries are TSMC in Taiwan, Sumitomo in Japan, WIN Semiconductors in Taiwan, GCS in North America and UMS in France. |
| • | Package and Assembly. Upon the completion of processing at the foundry, the finished wafers are shipped to our third-party assemblers for packaging and assembly. Currently, our principal packaging and assembly contractors are OSE in Taiwan, STATS ChipPAC in Korea, Signetics in Korea, Kyocera in North America and Japan, and Natel in North America. |
68
Table of Contents
| • | Test. At the last stage of integrated circuit production, our third-party test service providers test the packaged and assembled integrated circuits. Currently, OSE in Taiwan, STATS ChipPAC in Korea, Signetics in Korea and Presto Engineering in North America are our test partners. We also perform testing in our Westlake Village, California, facility. |
We are committed to maintaining the highest level of quality in our products. Our objective is that our products meet all of our customer requirements, are delivered on-time and function reliably throughout their useful lives. As part of our total quality assurance program, our quality management system has been certified to ISO 9001:2008 standards. Our manufacturing partners are also ISO 9001 certified.
Research and Development
We focus our research and development efforts on developing products that address bandwidth bottlenecks in networks and minimize latency in computing environments. We believe that our continued success depends on our ability to both introduce improved versions of our existing products and to develop new products for the markets that we serve. We devote a portion of our resources to expanding our core technology including efforts in system-level simulation, high-speed analog design, supporting a broad range of process technologies and high-speed package modeling and design.
We develop models that are used as an input to a combination of proprietary and commercially available simulation tools. We use these tools to predict overall system performance based on the performance of our product. After our product is manufactured, we perform system measurements and refine our model set to improve the model’s accuracy and predictive ability. As a result, our models and simulation tools have improved over time and we have been able to very accurately predict overall system performance prior to fabricating a part.
We have assembled a core team of experienced engineers and systems designers in three design centers located in the United States, the United Kingdom and Taiwan. Our technical team typically has, on average, more than 20 years of industry experience with more than 75% having advanced degrees and more than 25% having Ph.Ds. These engineers and designers are involved in advancing our core technologies, as well as applying these core technologies to our product development activities across a number of areas including telecommunications transport systems, enterprise networking equipment, datacenters and enterprise servers, storage platforms, test and measurement and military systems. In 2010, 2009 and 2008, our research and development expenses were $23.8 million, $17.8 million and $17.5 million, respectively.
Competition
The global semiconductor market in general, and the communications and computing markets in particular, are highly competitive. We expect competition to increase and intensify as more and larger semiconductor companies enter our markets. Increased competition could result in price pressure, reduced profitability and loss of market share, any of which could materially and adversely affect our business, revenue and operating results.
Currently, our competitors range from large, international companies offering a wide range of semiconductor products to smaller companies specializing in narrow markets. Our primary competitors include Broadcom, Hittite, IDT and Texas Instruments, as well as other smaller analog signal processing companies. We expect competition in our target markets to increase in the future as existing competitors improve or expand their product offerings. In addition, as we continue to develop our 100G semiconductor solutions for enterprise networks, we may face competition from companies such as Broadcom and NetLogic.
Our ability to compete successfully depends on elements both within and outside of our control, including industry and general economic trends. During past periods of downturns in our industry, competition in the markets in which we operate intensified as our customers reduced their purchase orders. Many of our competitors are significantly larger, have greater financial, technical, marketing, distribution, customer support and other
69
Table of Contents
resources, are more established than we are, and have significantly better brand recognition and broader product offerings with which to withstand similar adverse economic or market conditions in the future. These developments may materially and adversely affect our current and future target markets and our ability to compete successfully in those markets.
We compete or plan to compete in different target markets to various degrees on the basis of a number of principal competitive factors, including:
| • | product performance; |
| • | power budget; |
| • | features and functionality; |
| • | customer relationships; |
| • | size; |
| • | ease of system design; |
| • | product roadmap; |
| • | reputation and reliability; |
| • | customer support; and |
| • | price. |
We believe we compete favorably with respect to each of these factors. We maintain our competitive position through our ability to successfully design, develop and market complex high-speed analog solutions for the customers that we serve.
Intellectual Property
We rely on a combination of intellectual property rights, including patents, trade secrets, copyrights and trademarks, and contractual protections, to protect our core technology and intellectual property. As of December 31, 2010, we had 30 issued and allowed patents in the United States and other patent applications pending in the United States. The 30 issued and allowed patents in the United States expire in the years beginning in 2021 through 2027. Many of our issued patents and pending patent applications relate to high-speed circuit and package designs.
We may not receive competitive advantages from any rights granted under our patents, and our patent applications may not result in the issuance of any patents. In addition, any future patent may be opposed, contested, circumvented, designed around by a third party or found to be unenforceable or invalidated. Others may develop technologies that are similar or superior to our proprietary technologies, duplicate our proprietary technologies or design around patents owned or licensed by us.
In addition to our own intellectual property, we also use third-party licensors for certain technologies embedded in our semiconductor solutions. These are typically non-exclusive contracts provided under paid-up licenses. These licenses are generally perpetual or automatically renewed for so long as we continue to pay any maintenance fees that may be due. To date, maintenance fees have not constituted a significant portion of our capital expenditures. We have entered into a number of licensing arrangements pursuant to which we license third-party technologies. We do not believe our business is dependent to any significant degree on any individual third-party license.
We generally control access to and use of our confidential information through the use of internal and external controls, including contractual protections with employees, contractors and customers. We rely in part
70
Table of Contents
on United States and international copyright laws to protect our mask work. All employees and consultants are required to execute confidentiality agreements in connection with their employment and consulting relationships with us. We also require them to agree to disclose and assign to us all inventions conceived or made in connection with the employment or consulting relationship.
Despite our efforts to protect our intellectual property, unauthorized parties may still copy or otherwise obtain and use our software, technology or other information that we regard as proprietary intellectual property. In addition, we intend to expand our international operations, and effective patent, copyright, trademark and trade secret protection may not be available or may be limited in foreign countries.
The semiconductor industry is characterized by vigorous protection and pursuit of intellectual property rights and positions, which has resulted in protracted and expensive litigation for many companies. We have in the past received and, particularly as a public company, we expect that in the future we may receive, communications from various industry participants alleging our infringement of their patents, trade secrets or other intellectual property rights. Any lawsuits could subject us to significant liability for damages, invalidate our proprietary rights and harm our business and our ability to compete. Any litigation, regardless of success or merit, could cause us to incur substantial expenses, reduce our sales and divert the efforts of our technical and management personnel. In the event we receive an adverse result in any litigation, we could be required to pay substantial damages, seek licenses from third parties, which may not be available on reasonable terms or at all, cease sale of products, expend significant resources to develop alternative technology or discontinue the use of processes requiring the relevant technology.
Employees
At December 31, 2010, we employed 166 full-time equivalent employees, including 93 in research, product development and engineering, 28 in sales and marketing and 19 in general and administrative management and 26 in manufacturing logistics. We consider relations with our employees to be good and have never experienced a work stoppage. None of our employees are either represented by a labor union or subject to a collective bargaining agreement.
Facilities
We currently lease our principal executive offices in Santa Clara, California, under a lease for 14,578 square feet of office space that expires on July 31, 2015. The total minimum lease payments under this lease are $2.1 million. We also lease 29,090 square feet of office space in Westlake Village, California under a lease that expires on December 31, 2016. The total minimum lease payments under this lease are $3.6 million. Our Singapore subsidiary currently leases 2,368 square feet of office space in Singapore under a lease that expires on March 14, 2012. Our United Kingdom subsidiary currently leases office space in Northamptonshire, England under a lease that expires on September 24, 2011. We also lease 8,640 square feet of office space in Hsinchu, Taiwan under a lease that expires on March 31, 2013. We believe that current facilities are sufficient to meet our needs for the foreseeable future.
Legal Proceedings
We are currently a party to the following legal proceedings:
Netlist, Inc. v. Inphi Corporation, Case No. 09-cv-6900 (C.D. Cal.)
On September 22, 2009, Netlist filed suit in the United States District Court, Central District of California, or the Court, asserting that we infringe U.S. Patent No. 7,532,537. Netlist filed an amended complaint on December 22, 2009, further asserting that we infringe U.S. Patent Nos. 7,619,912 and 7,636,274, collectively with U.S. Patent No. 7,532,537, the patents-in-suit, and seeking both unspecified monetary damages to be determined and an injunction to prevent further infringement. These infringement claims allege that our iMB™
71
Table of Contents
and certain other memory module components infringe the patents-in-suit. We answered the amended complaint on February 11, 2010 and asserted that we do not infringe the patents-in-suit and that the patents-in-suit are invalid. We have since filed inter partes requests for reexamination with the USPTO asserting that the patents-in-suit are invalid.
On August 27, 2010, the USPTO granted the Request for Inter Partes Reexamination for U.S. Patent No. 7,636,274 and found a substantial new question of patentability based upon each of the different issues that we raised as the reexamination requestor. The USPTO has not, however, accompanied its Reexamination Order of U.S. Patent No. 7,636,274 with its own evaluation of the validity of this patent, indicating that such evaluation will be forthcoming at a later time. With respect to the granted reexamination request for U.S. Patent No. 7,636,274, the USPTO will evaluate the validity of this patent in reexamination proceedings.
On September 8, 2010, the USPTO ordered the Inter Partes Request for Reexamination for U.S. Patent No. 7,532,537 and found a substantial new question of patentability based upon different issues that we raised as the reexamination requestor. The USPTO accompanied this Reexamination Order of U.S. Patent No. 7,532,537 with its own evaluation of the validity of this patent, and rejected some but not all of claims. In a response dated October 8, 2010, Netlist responded to the USPTO determination by amending some but not all of the claims, adding new claims and making arguments why the claims were not invalid in view of the cited references. We provided rebuttal comments to the USPTO on January 27, 2011, which the USPTO will consider, and the proceeding will continue in accordance with established inter partes reexamination procedures.
On September 8, 2010, the USPTO ordered the Inter Partes Request for Reexamination for U.S. Patent No. 7,619,912 and found a substantial new question of patentability based upon different issues that we raised as the reexamination requestor. The USPTO accompanied this Reexamination Order of U.S. Patent No. 7,619,912 with its own evaluation of the validity of this patent, and determined that all of the claims were patentable based upon our reexamination. Netlist has not commented upon this Reexamination Order. The USPTO on February 28, 2011 also merged the Proceedings of our Reexamination of U.S. Patent No. 7,619,912, bearing Control No. 90/001,339 with Inter Partes Reexamination Proceeding 95/000,578 filed October 20, 2010 on behalf of SMART Modular Technologies, Inc. and Inter Partes Reexamination Proceeding 95/000,579 filed October 21, 2010 on behalf of Google, Inc. In each of these other Reexamination Proceedings, the USPTO had indicated that there existed a substantial new question of patentability with respect to certain claims of U.S. Patent No. 7,619,912, but had not accompanied the Reexamination Orders related thereto with its own evaluation of the validity of this patent, indicating that such evaluation would be forthcoming at a later time. The merged Reexamination Proceeding will be conducted in accordance with established procedures for merged Reexamination Proceedings. As part of the merged Reexamination Proceeding, once the USPTO issues a Right of Notice of Appeal, we will have the opportunity to appeal the USPTO determination of our Reexamination Request in accordance with these established procedures for merged Reexamination Proceedings.
The reexamination proceedings could result in a determination that the patents-in-suit, in whole or in part, are valid or invalid, as well as modifications of the scope of the patents-in-suit.
A third party, Sanmina-SCI Corporation, or SSC, has also requested interference proceedings with the USPTO with respect to each of the patents-in-suit. In its April 21, 2010 Request for Continued Examination of U.S. Application No. 11/142,989, or SSC ’989 patent application, SSC asserted that it has priority to the inventions claimed by the patents-in-suit and should be granted rights to those inventions. We have entered into an agreement with SSC for a non-exclusive license to those rights, if any, that SSC may obtain to the inventions claimed by the patents-in-suit if the USPTO agrees to commence interference proceedings and if SSC prevails in those proceedings.
The USPTO, in a communication dated July 7, 2010, acknowledged that claims were submitted in a filing made in the SSC ‘989 patent application to invoke an Interference with each of the patents-in-suit, but has
72
Table of Contents
declined to declare an Interference at this time. The July 7, 2010 USPTO communication rejected the claims submitted to invoke the Interference based upon 35 USC 112, with the rejection asserting that these claims contain “subject matter which was not described in the specification in such a way as to reasonably convey to one skilled in the relevant art that the inventor(s), at the time the application was filed, had possession of the claimed invention.” SSC responded to this USPTO communication on December 24, 2010, and a further communication from the USPTO is anticipated.
In connection with the reexamination requests and the interference proceedings, we also filed a motion to stay proceedings with the Court, which was granted on May 18, 2010, whereby the Court stayed the proceedings until at least February 14, 2011, requested that Netlist notify the Court within one week of any action taken by the USPTO in connection with the reexamination or interference proceedings, and requested that the parties file papers by January 31, 2011 stating their position on whether the stay should be extended. We filed our paper on January 31, 2011 stating the reasons we believe the stay should be maintained and Netlist, having been given leave to file its paper later, filed its paper on February 21, 2011. Based on these papers the Court ordered a continued stay of the proceedings until February 24, 2012, that the parties file papers by January 30, 2012 stating their position on whether the stay should be extended, and that Netlist notify the Court within one week of any action taken by the USPTO in the reexamination or interference proceedings. While the Court granted the stay until February 24, 2012, the Court could lift the stay before then. For example, if the USPTO confirms that all claims of the patents-in-suit are patentable, the Court may decide to lift the stay.
If this litigation results in an adverse outcome, we may be required to cease the manufacture, use or sale of any product held to infringe Netlist’s patents, including our iMB product, unless and until we or our customers obtain a license from Netlist. A license from Netlist may or may not be available on commercially reasonable terms. An adverse outcome could also result in our having to pay damages for infringement and the expenditure of significant resources to redesign any infringing product, including our iMB product, in a non-infringing manner, which may or may not be successful. To date, we have only sampled our iMB product and, as a result, we have generated very little revenue. Our ability to generate future revenue from our iMB product, could be adversely affected, though it is currently difficult to estimate the level at which this may affect our revenue.
Inphi Corporation v. Netlist, Inc, Case No. 09-cv-8749 (C.D. Cal.).
On November 30, 2009, we filed suit in the United States District Court, Central District of California asserting that Netlist infringes U.S. Patent Nos. 7,307,863 and 7,479,799, collectively the patents-in-suit, and are seeking both unspecified monetary damages and an injunction to prevent further infringement. Netlist answered the complaint on January 15, 2010 and filed an amended answer on April 22, 2010, asserting that it does not infringe the patents-in-suit, that the patents-in-suit are invalid and that U.S. Patent No. 7,479,799 is unenforceable due to inequitable conduct before the USPTO. Discovery is currently proceeding, and the Court has set a trial date of October 11, 2011.
While we intend to defend and prosecute these lawsuits vigorously, litigation, whether or not determined in our favor or settled, could be costly and time-consuming and could divert our attention and resources, which could adversely affect our business. We are unable to assess the possible outcome of these matters. However, because of the nature and inherent uncertainties of litigation, should the outcome of these actions be unfavorable, our business, financial condition, results of operations or cash flows could be materially and adversely affected.
We are not currently a party to any other material litigation. The semiconductor industry is characterized by frequent claims and litigation, including claims regarding patent and other intellectual property rights as well as improper hiring practices. We may from time to time become involved in litigation relating to claims arising from our ordinary course of business. These claims, even if not meritorious, could result in the expenditure of significant financial and managerial resources.
73
Table of Contents
Executive Officers and Directors
The following table shows information about our executive officers and directors as of February 28, 2011:
| Name |
Age | Position(s) | ||
| Young K. Sohn |
54 | President, Chief Executive Officer and Director | ||
| John Edmunds |
53 | Chief Financial Officer and Chief Accounting Officer | ||
| Ron Torten |
43 | Vice President of Worldwide Sales | ||
| Diosdado P. Banatao |
64 | Chairman of the Board | ||
| Chenming C. Hu(2) |
63 | Director | ||
| David J. Ladd(1)(2)(3) |
64 | Director | ||
| Timothy D. Semones |
51 | Director | ||
| Peter J. Simone(1)(2)(3) |
63 | Director | ||
| Sam S. Srinivasan(1)(2)(3) |
66 | Lead Director | ||
| Lip-Bu Tan |
51 | Director | ||
| (1) | Member of our audit committee |
| (2) | Member of our compensation committee |
| (3) | Member of our nominating and corporate governance committee |
Young K. Sohn has served as our President and Chief Executive Officer since August 2007 and as a director since July 2007. Prior to joining us, Mr. Sohn served as an Advisor at Panorama Capital, a venture capital firm, from June 2006 to June 2007. From August 2003 until his retirement in March 2005, Mr. Sohn served as President of Agilent Technologies, Inc.’s Semiconductor Group, now known as Avago Technologies, and as Chairman and Chief Executive Officer of Oak Technology, Inc., a semiconductor company, from 1999 until it was acquired by Zoran Corporation in August 2003. In addition, Mr. Sohn was an advisor to the Massachusetts Institute of Technology Media Lab’s OLPC (One Laptop Per Child) program from 2005 to 2007 and was the past President and Chairman of the Asia America MultiTechnology Association (AAMA) from 2001 to 2003. He currently serves on the board of directors for ARM Holdings PLC and Cymer, Inc. Mr. Sohn holds a B.S. degree in electrical engineering from the University of Pennsylvania and an M.S. degree from the MIT Sloan School of Management.
John Edmunds has served as our Chief Financial Officer and Chief Accounting Officer since January 2008. He previously served as Chief Financial Officer of Trident Microsystems, a semiconductor company, from June 2004 to January 2008. Mr. Edmunds also served as Senior Vice President and Chief Financial Officer for Oak Technology, Inc. from January 2000 until it was acquired by Zoran Corporation in August 2003. He continued to serve as Vice President of Finance for Zoran until June 2004. Mr. Edmunds started his career as a C.P.A. with Coopers & Lybrand in San Francisco and San Jose. He holds a B.S. degree in finance and accounting from the University of California, Berkeley.
Ron Torten has served as our Vice President of Worldwide Sales since December 2007. Mr. Torten previously served as Chief Executive Officer of NemeriX, a semiconductor company, from January 2006 to December 2007. From January 2004 to December 2005, he served as Vice President, Worldwide Materials, at Agilent Technologies, Inc., a semiconductor company. Mr. Torten served as Vice President and General Manager for the Networking Entertainment Division at Agere Systems, Inc., a semiconductor company, from April 2000 to January 2004. He holds a B.S. degree in chemical engineering from the Technion—Israel Institute of Technology and an M.B.A. from the University of California, Davis.
74
Table of Contents
Diosdado P. Banatao has served on our board of directors and as chairman of our board of directors since December 2000 and served as our Interim President and Chief Executive Officer from October 2006 to August 2007. Mr. Banatao has been a Managing Partner of Tallwood Venture Capital, a venture capital firm, since July 2000 and served as Interim President and Chief Executive Officer at Ikanos Communications, Inc. from April 2010 to August 2010. From April 2008 to June 2009, he also served as Interim Chief Executive Officer of SiRF Technology Holdings, Inc., which was acquired by CSR plc in June 2009. Prior to forming Tallwood, Mr. Banatao was a venture partner at Mayfield Fund from January 1998 to May 2000. Mr. Banatao co-founded three technology startups: S3 Incorporated, Chips & Technologies and Mostron. He also held positions in engineering and general management at National Semiconductor Corporation, Seeq Technologies and Intersil Corporation. Mr. Banatao currently serves on the board of directors of Ikanos Communications, Inc. He previously served as Chairman and led investments in SiRF Technology, acquired by CSR plc (CSR); CSR plc (CSR); Marvell Technology Group (MRVL); Acclaim Communications, acquired by Level One (INTC); Newport Communications, acquired by Broadcom (BRCM); Cyras Systems, acquired by Ciena (CIEN); and Stream Machine, acquired by Cirrus Logic (CRUS). He has also served on the board of directors of various privately held companies in the semiconductor industry. Mr. Banatao holds a B.S. degree in electrical engineering, cum laude, from the Mapua Institute of Technology in the Philippines and an M.S. degree in electrical engineering from Stanford University.
Mr. Banatao’s background as a technologist, as well as a senior manager of, board member of, and investor in numerous semiconductor companies provides a diversity of experience for his service on our board of directors. The companies with which he has been involved range from start-up companies to very large public corporations.
Dr. Chenming C. Hu has served on our board of directors since August 2010. Since 2004, Dr. Hu has served as the TSMC Distinguished Chair Professor of Microelectronics in Electrical Engineering and Computer Sciences at University of California, Berkeley, where he has been a professor since 1976. From 2001 until 2004, Dr. Hu was the Chief Technology Officer at Taiwan Semiconductor Manufacturing Company. Dr. Hu also serves on the boards of SanDisk Corp. and Formfactor, Inc. and was the founding board chairman of Celestry Design Solutions. Dr. Hu is a member of the U.S. National Academy of Engineering, the Chinese Academy of Sciences and Academia Sinica. Dr. Hu received his B.S. degree from National Taiwan University and M.S. and Ph.D. degrees from University of California, Berkeley, all in electrical engineering.
Dr. Hu’s background as an academic in electrical engineering and computer science provides a diversity of experience for his service on our board of directors and valuable insight into our industry. Dr. Hu has also served on the board of directors of several other technology companies.
David J. Ladd has served on our board of directors since June 2007. In 1997, Mr. Ladd joined Mayfield Fund, a forty-two year old venture capital firm, where he has served in various capacities as a member of Mayfield Fund’s investment team until his retirement in December 2010. Prior to joining Mayfield Fund, he served as Chief Technology Officer of Octel Communications Corporation from 1994 until it was acquired by Lucent Technologies in 1997. In 1981 he co-founded Opcom/VMX, a voice messaging company, which was acquired by Octel in 1994. Mr. Ladd holds a B.S. degree in electrical engineering from the University of California, Berkeley and an M.S. degree in Computer Science from Stevens Institute of Technology.
Mr. Ladd’s experience as a technologist and as a technology-focused investor, which gives him in-depth knowledge of, and exposure to, current technology and industry trends and developments, provides us with valuable insight into our industry and target markets.
Timothy D. Semones is one of our founders and has served as a director since 2001. Mr. Semones also served as our Chief Financial Officer from November 2000 to January 2008 and as our Chief Operating Officer from October 2006 to June 2007. Mr. Semones previously served as the Director of Marketing at MindSpring Enterprises, an Internet service provider, and the Director of Broadband Technology at Earthlink Network, an
75
Table of Contents
Internet service provider. He has also held general management and engineering positions with Measurement Systems, Inc. and Hewlett-Packard Company. Mr. Semones also sits on the board of directors of Semi Dice, Inc. He holds a B.S. degree in electrical engineering from Georgia Institute of Technology and an M.B.A. from the Anderson School of Management at the University of California, Los Angeles.
As one of our founders and a technologist, Mr. Semones has comprehensive expertise and knowledge regarding our semiconductor solutions and technology, as well as insight into our anticipated future technological needs and industry needs.
Peter J. Simone has served on our board of directors since April 2010. Mr. Simone has served as an investment consultant and as a consultant to numerous private companies since February 2001. He also served as Executive Chairman of SpeedFam-IPEC, Inc., a semiconductor equipment manufacturing company, which was acquired by Novellus Systems, Inc., from June 2001 to December 2002. From February 2000 to February 2001, Mr. Simone served as a director and President of Active Controls Experts, Inc., a manufacturer and distributor of solid-state actuators, and served as President, Chief Executive Officer and director of Xionics Document Technologies, Inc., a software company, from April 1997 until Xionics’ acquisition by Oak Technology, Inc. in January 2000. Mr. Simone currently serves on the board of directors of Monotype Imaging Holdings Inc., Newport Corporation, Veeco Instruments, Inc. and Cymer, Inc. He previously served on the board of directors of Sanmina-SCI Corporation from 2003 to 2008. Mr. Simone is also a member of the board of directors of the Massachusetts High Technology Council and is vice president of the board of Walker Home and School for Children. Mr. Simone holds a B.S. degree in accounting from Bentley University and an M.B.A. from Babson College.
Mr. Simone possesses particular knowledge and operational experience across several industries as well as broad experience in financial markets, which provides a diversity of experience.
Sam S. Srinivasan has served on our board of directors since June 2007 and as lead director since February 2011. Mr. Srinivasan served as Chief Executive Officer and Chairman of Health Language, Inc., a software company, from May 2000 to March 2002 and currently serves as Chairman Emeritus. He also served as Senior Vice President, Finance, Chief Financial Officer of Cirrus Logic, Inc., a semiconductor company, from November 1988 to March 1996, and as Director, Internal Audits and subsequently as Corporate Controller of Intel Corporation, a semiconductor company, from May 1984 to November 1988. Currently, Mr. Srinivasan serves on the board of directors of TranSwitch Corporation, as well as its nominating and corporate governance committee and is the chairman of its audit committee. Mr. Srinivasan previously served on the board of directors of SiRF Technology Holdings, Inc. from 2004 to 2009, Centillium Communications, Inc. from 2006 to 2008, and Leadis Technology, Inc. from 2008 to 2009. He holds a B.A. in commerce from Madras University, India and an M.B.A. from Case Western Reserve University. Mr. Srinivasan is a member of the American Institute of Certified Public Accountants.
Mr. Srinivasan has considerable financial experience with publicly-traded companies and is a certified public accountant. He has also served as a director for a number of technology companies and as member of various board of director committees.
Lip-Bu Tan has served on our board of directors since May 2002. Mr. Tan has served as Chairman of Walden International, an international venture capital firm, since he founded the firm in 1987. He has also served as President and Chief Executive Officer of Cadence Design Systems, Inc., an electronic design automation software and engineering services company, since January 2009 and as a director since 2004. Mr. Tan currently serves on the board of directors of Flextronics International Ltd., Semiconductor Manufacturing International Corporation and SINA Corporation. He previously served on the board of directors of Centillium Communications, Inc. from 1997 to 2007, Creative Technology, Ltd. from 1990 to 2009, Integrated Silicon Solution, Inc. from 1990 to 2007, Leadis Technology, Inc. from 2002 to 2006 and MindTree Ltd. from 2006 to 2009. He holds a B.S. degree in physics from Nanyang University in Singapore, an M.S. degree in nuclear engineering from Massachusetts Institute of Technology and an M.B.A. from the University of San Francisco.
76
Table of Contents
As Chief Executive Officer of Cadence and a Chairman of an international venture capital firm, as well as a director of a number of technology companies, Mr. Tan has extensive experience in the electronic design and semiconductor industries, as well as international operations and corporate governance expertise.
Board of Directors
We currently have eight directors on our board of directors. Our bylaws provide for a board of directors consisting of not fewer than 3 nor more than 11 members. The authorized number of directors may be changed by resolution of our board of directors. Vacancies on the board can be filled by resolution of our board of directors. Our board of directors is divided into three classes, each serving staggered, three-year terms:
| • | Our Class I directors are Messrs. Ladd, Semones and Tan and their terms will expire at the 2011 annual meeting of stockholders; |
| • | Our Class II directors are Messrs. Banatao and Sohn and their terms will expire at the 2012 annual meeting of stockholders; and |
| • | Our Class III directors are Dr. Hu and Messrs. Simone and Srinivasan and their terms will expire at the 2013 annual meeting of stockholders. |
As a result, only one class of directors will be elected at each annual meeting of stockholders, with the other classes continuing for the remainder of their respective terms. This classification of our board of directors may delay or prevent a change in control of Inphi.
Corporate Governance
We believe our corporate governance initiatives comply with the Sarbanes-Oxley Act of 2002 and the rules and regulations of the SEC adopted thereunder. In addition, we believe our corporate governance initiatives comply with the rules of the NYSE. Our board of directors continues to evaluate our corporate governance principles and policies.
Our board of directors also adopted a code of business conduct that applies to each of our directors, officers and employees. The code addresses various topics, including:
| • | compliance with laws, rules and regulations, including the Foreign Corrupt Practices Act; |
| • | conflicts of interest; |
| • | insider trading; |
| • | corporate opportunities; |
| • | competition and fair dealing; |
| • | equal employment and working conditions; |
| • | record keeping; |
| • | confidentiality; |
| • | giving and accepting gifts; |
| • | compensation or reimbursement to customers; |
| • | protection and proper use of company assets; and |
| • | payments to government personnel and political contributions. |
Our board of directors also adopted a code of ethics for senior financial officers applicable to our Chief Executive Officer, President, Chief Financial Officer, controller and other key management employees addressing ethical issues. Our code of business conduct and the code of ethics are posted on our website. The
77
Table of Contents
code of business conduct and the code of ethics can only be amended by the approval of a majority of our board of directors. Any waiver to the code of business conduct for an executive officer or director or any waiver of the code of ethics may only be granted by our board of directors or our nominating and corporate governance committee and must be timely disclosed as required by applicable law. We also implemented whistleblower procedures that establish formal protocols for receiving and handling complaints from employees. Any concerns regarding accounting or auditing matters reported under these procedures will be communicated promptly to our audit committee.
Director Independence
In June 2010, our board of directors undertook a review of the independence of our directors and considered whether any director has a material relationship with us that could compromise his ability to exercise independent judgment in carrying out his responsibilities. As a result of this review, our board of directors determined that Messrs. Banatao, Ladd, Simone and Srinivasan and Dr. Hu, representing a majority of our directors, are “independent directors” as defined under the rules of the NYSE. Mr. Banatao served as our Interim Chief Executive Officer and beneficially owns approximately 13.8% of our common stock, which represents shares held by Tallwood I, L.P., a venture fund affiliated with Tallwood Venture Capital, of which Mr. Banatao is a Managing Partner. Our board of directors considered Mr. Banatao’s prior role with us and his beneficial stock ownership in its determination that Mr. Banatao qualifies as an independent director as defined under the rules of the NYSE.
In determining that Messrs. Banatao, Ladd, Simone and Srinivasan and Dr. Hu qualify as “independent directors,” our board of directors determined that none of these individuals had any of the relationships enumerated in Rule 303A.02(b) of the New York Stock Exchange Manual, or Rule 303A.02(b), that would preclude them from serving as independent directors. Our board of directors also made an affirmative determination that none of these directors, including Mr. Banatao and Mr. Ladd, had any other material relationship with us, other than in his capacity as a director and stockholder. Our board of directors specifically considered the beneficial ownership of common stock deemed held by Messrs. Banatao and Ladd and determined that such ownership would not impact their ability to exercise independent judgment as a director, notwithstanding such beneficial ownership. Upon concluding that neither Mr. Banatao nor Mr. Ladd had any of the relationships specifically enumerated in Rule 303A.02(b) or any other material relationship with us, and that their respective beneficial ownership of our common stock would not impact their ability to exercise independent judgment as a director or their overall independence from management, our board of directors determined that both Messrs. Banatao and Ladd qualify as independent directors.
Lead Director
Our board of directors established certain corporate governance principles in connection with our initial public offering. Our board of directors determined as part of our corporate governance principles that one of our independent directors should serve as a lead director at any time when the title of chairman is held by an employee director. Mr. Banatao is our Chairman and while our board of directors has determined that Mr. Banatao is an independent director under the rules of the NYSE, our board of directors has elected Mr. Srinivasan as lead director. Mr. Srinivasan will serve as lead director for three years at which time our board of directors will elect another independent director to serve as lead director.
Role of the Board in Risk Oversight
One of the key functions of our board of directors is informed oversight of our risk management process. Our board of directors does not have a standing risk management committee, but rather administers this oversight function directly through the board of directors as a whole, as well as through various board of directors standing committees that address risks inherent in their respective areas of oversight. In particular, our board of directors is responsible for monitoring and assessing strategic risk exposure, our audit committee has the responsibility to
78
Table of Contents
consider and discuss our major financial risk exposures and the steps our management has taken to monitor and control these exposures, including guidelines and policies to govern the process by which risk assessment and management is undertaken. The audit committee also monitors compliance with legal and regulatory requirements, in addition to oversight of the performance of our internal audit function. Our nominating and corporate governance committee monitors the effectiveness of our corporate governance guidelines, including whether they are successful in preventing illegal or improper liability-creating conduct. Our compensation committee assesses and monitors whether any of our compensation policies and programs has the potential to encourage excessive risk-taking.
Board Committees
We have established an audit committee, a compensation committee and a nominating and corporate governance committee. We believe that the composition of these committees meet the criteria for independence under, and the functioning of these committees complies with the applicable requirements of, the Sarbanes-Oxley Act of 2002, the current rules of the NYSE and SEC rules and regulations. We intend to comply with future requirements as they become applicable to us. Our board of directors has determined that Messrs. Simone and Srinivasan are each an audit committee financial expert, as defined by the rules promulgated by the SEC. Each committee has the composition and responsibilities described below:
Audit Committee. Messrs. Ladd, Simone and Srinivasan serve on our audit committee. Mr. Srinivasan is chairperson of this committee. Our audit committee assists our board of directors in fulfilling its legal and fiduciary obligations in matters involving our accounting, auditing, financial reporting, internal control and legal compliance functions, and is directly responsible for the approval of the services performed by our independent accountants and reviewing of their reports regarding our accounting practices and systems of internal accounting controls. Our audit committee also oversees the audit efforts of our independent accountants and takes actions as it deems necessary to satisfy itself that the accountants are independent of management. Our audit committee is also responsible for monitoring the integrity of our financial statements and our compliance with legal and regulatory requirements as they relate to financial statements or accounting matters.
In addition, our board of directors considered Mr. Simone’s services on the audit committee of four other corporate boards of directors. Mr. Simone serves as a member of our audit committee. He also serves as the chairman of the audit committee of Monotype, Newport, Veeco and Cymer, all publicly-traded companies. Pursuant to the terms of the audit committee charter and the regulations of the NYSE, our board of directors has determined that Mr. Simone’s simultaneous service on multiple audit committees would not impair his ability to effectively serve on our audit committee.
Compensation Committee. Dr. Hu and Messrs. Ladd, Simone and Srinivasan serve on our compensation committee. Mr. Simone is chairperson of this committee. Our compensation committee assists our board of directors in meeting its responsibilities with regard to oversight and determination of executive compensation and assesses whether our compensation structure establishes appropriate incentives for officers and employees. Our compensation committee reviews and makes recommendations to our board of directors with respect to our major compensation plans, policies and programs. In addition, our compensation committee reviews and makes recommendations for approval by the independent members of our board of directors regarding the compensation for our executive officers, establishes, modifies the terms and conditions of employment of our executive officers and administers our stock option plans.
Nominating and Corporate Governance Committee. Messrs. Ladd, Simone and Srinivasan serve on our nominating and corporate governance committee. Mr. Ladd is chairperson of this committee. Our nominating and corporate governance committee is responsible for making recommendations to our board of directors regarding candidates for directorships and the size and composition of the board. In addition, our nominating and corporate governance committee is responsible for overseeing our corporate governance guidelines, and reporting and making recommendations to the board concerning corporate governance matters.
79
Table of Contents
Compensation Committee Interlocks and Insider Participation
Dr. Hu and Messrs. Ladd, Simone and Srinivasan served as members of our compensation committee during 2010. None of the members of our compensation committee is or has in the past served as an officer or employee of our company. None of our executive officers currently serves, or in the past year has served, as a member of the board of directors or compensation committee of any entity that has one or more executive officers serving on our board of directors or compensation committee.
Compensation of Directors
Prior to our initial public offering, our independent directors received an annual retainer of $32,000 and the chairman of our audit committee received an additional annual retainer of $10,000. In addition, for a description of our compensation arrangements with Young K. Sohn, see “Executive Compensation.”
Following completion of our initial public offering in November 2010, our non-employee directors, other than our Chairman of the Board and the lead director, receive an annual retainer of $32,000, prorated for partial service in any year. Our Chairman of the Board and lead director receive an annual retainer of $50,000 and $40,000, respectively, so long as such director is not an employee of Inphi. Members of our audit committee, compensation committee and nominating and corporate governance committee, other than the chairpersons of those committees, receive an additional annual retainer of $7,500, $5,000 and $4,000, respectively. The chairpersons of our audit committee, compensation committee and nominating and corporate governance committee each receive an additional annual retainer of $15,000, $10,000 and $7,500, respectively.
In addition, non-employee directors receive nondiscretionary, automatic grants of restricted stock units under our 2010 Stock Incentive Plan. A non-employee director, other than those currently serving on our board of directors, will be automatically granted an initial restricted stock unit for shares of our common stock that have a value of $160,000, calculated using the fair market value of our common stock on the date of grant, upon becoming a member of our board of directors. The initial restricted stock unit will vest over four years in equal annual installments. On the first business day following each of our regularly scheduled annual meetings of stockholders, each non-employee director will be automatically granted a restricted stock unit for shares of our common stock that have a value of $80,000, calculated using the fair market value of our common stock on the date of grant, provided the director has served on our board of directors for at least six months. These restricted stock units will vest on the first anniversary of the date of grant or immediately prior to our next annual meeting of stockholders, if earlier. The restricted stock units granted to non-employee directors will have a per share fair value equal to the closing price of the underlying shares on the date of grant as reported on the New York Stock Exchange and will become fully vested if a change in control occurs. See “Employee Benefit Plans—2010 Stock Incentive Plan.”
We also reimbursed our non-employee directors for their reasonable out-of-pocket costs and travel expenses in connection with their attendance at board and committee meetings.
2010 Director Compensation
The following table sets forth the compensation paid or accrued by us to our non-employee directors in 2010. The table excludes Young K. Sohn, who did not receive any additional compensation from us for his role as a director because he is our Chief Executive Officer.
| Name |
Fees Earned or Paid in Cash ($) |
Stock Awards ($)(1)(2) |
All
Other Compensation(3) |
Total ($) | ||||||||||||
| Diosdado Banatao |
6,250 | — | — | 6,250 | ||||||||||||
| Chenming C. Hu |
12,625 | 206,047 | — | 218,672 | ||||||||||||
| Timothy D. Semones |
4,000 | — | 86,400 | 90,400 | ||||||||||||
| Peter J. Simone |
29,188 | 159,249 | — | 188,437 | ||||||||||||
| Sam S. Srinivasan |
43,750 | — | — | 43,750 | ||||||||||||
80
Table of Contents
| (1) | Amounts listed in this column represent the fair value of the awards computed in accordance with FASB ASC Topic 718 as of the grant date multiplied by the number of shares. See note 11 to the notes to our consolidated financial statements for a discussion of assumptions made in determining the grant date fair value. |
| (2) | Please see the outstanding equity awards table below for the details of the stock awards granted. |
| (3) | Represents fees earned for consulting services. |
The following table lists all outstanding equity awards held by non-employee directors as of the end of December 31, 2010:
| Option Awards | Stock Awards | |||||||||||||||||||||||||||||||
| Name |
Option Grant Date(1) |
Number of Securities Underlying Unexercised Options Exercisable |
Number of Securities Underlying Unexercised Options Unexercisable |
Option Exercise Price |
Option Expiration Date |
Stock Award Grant Date |
Number of Shares or Units That Have Not Vested (#) |
Market Value of Shares or Units That Have Not Vested ($)(2) |
||||||||||||||||||||||||
| Sam S. Srinivasan |
8/15/07 | 25,714 | — | $ | 1.78 | 8/15/2017 | ||||||||||||||||||||||||||
| 8/27/09 | 19,285 | — | $ | 2.62 | 8/27/2019 | |||||||||||||||||||||||||||
| Timothy D. Semones |
|
6/7/02 5/5/06 2/16/07 8/15/07 10/17/07 |
|
|
6,866 4,285 56,888 28,444 51,428 |
|
|
— — — — — |
|
$ $ $ $ $ |
2.34 1.05 1.22 1.78 1.94 |
|
|
6/7/2012 5/5/2016 2/16/2017 8/15/2017 10/17/2017 |
|
|||||||||||||||||
| Chenming C. Hu |
8/17/10 | 17,142 | 344,383 | |||||||||||||||||||||||||||||
| Peter J. Simone |
4/30/10 | 17,142 | 344,383 | |||||||||||||||||||||||||||||
| (1) | The grant date fair value of the common stock underlying these option awards was equal to the option exercise price on the date the stock options were granted. |
| (2) | The amount represents the fair market value of our common stock as of December 31, 2010 multiplied by unvested shares as of December 31, 2010. The closing price of our common stock on December 31, 2010 was $20.09. |
81
Table of Contents
Compensation Discussion and Analysis
Executive Summary
This Compensation Discussion and Analysis discusses the compensation programs and policies for our principal executive officer, principal financial officer and our two other mostly highly compensated executive officers as determined by the rules of the SEC. In February 2011, Dr. Raghavan resigned from his position as Chief Technology Officer. Our named executive officers and their positions in 2010 were:
| Young K. Sohn |
President and Chief Executive Officer | |
| John Edmunds |
Chief Financial Officer and Chief Accounting Officer | |
| Gopal Raghavan |
Former Chief Technology Officer | |
| Ron Torten |
Vice President of Worldwide Sales |
Recommendations for executive compensation are made by our compensation committee and approved by our board of directors, except that compensation recommendations for our Chief Executive Officer are approved by the non-employee members of our board of directors. The primary components of compensation for our named executive officers were base salary, cash incentive compensation and equity-based compensation. The following information should be read together with the compensation tables and related disclosures set forth below.
Objectives of the Executive Compensation Program
Our executive compensation program is shaped by the competitive market for executives in the semiconductor industry. We have designed an executive compensation program with the following primary objectives:
| • | to attract, retain and motivate talented and experienced executives; |
| • | to provide fair, equitable and reasonable compensation to each executive officer; |
| • | to reward job performance; and |
| • | to further align the interest of our executive officers with that of our stockholders. |
Since we were founded in 2000, our executive compensation program has focused primarily on attracting executive talent to manage and operate our business, retaining individuals whose employment is key to our success and growth, and rewarding individuals who help us achieve our business objectives. We aim to achieve these objectives while preserving our cash resources, largely through equity-based compensation. By focusing our executive compensation program primarily on equity-based compensation, we have sought to align the interest of our executive officers and stockholders by motivating executive officers to increase the value of our stock over time.
Our compensation committee expects to:
| • | refine and modify our compensation programs to further reflect the competitive market for executive talent and our changing business needs as a public company; |
| • | use individual and corporate performance goals to tie the compensation of our executive officers to our financial performance and creation of stockholder value; |
| • | use equity-based award programs to continue the long-term connection with stockholder value and executive compensation; and |
| • | structure our executive compensation program as to not incentivize unnecessary risk-taking. |
82
Table of Contents
Role of Compensation Committee
Our compensation committee is currently comprised of four independent, non-employee directors, Mr. Simone (Chairman), Dr. Hu, Mr. Ladd and Mr. Srinivasan. Our compensation committee determines and recommends to our board of directors the compensation for our executive officers. With respect to our named executive officers, other than our Chief Executive Officer, our compensation committee meets with our Chief Executive Officer as needed to provide evaluations of our executive officers and other relevant information to our compensation committee and makes recommendations regarding appropriate compensation for each executive, including merit increases, changes to incentive compensation and grant of equity awards. Historically, our compensation committee has established the executive compensation by considering the competitive market for corresponding positions at companies of similar size and stage of development operating in the semiconductor industry. Specifically, our compensation committee used research and industry standards based on their personal knowledge of the competitive market. In 2010, to complement its review of executive compensation for our named executive officers, our compensation committee consulted the 2009 High Technology Executive Compensation Survey, a publicly available compensation survey prepared by Radford, a compensation consulting firm, to benchmark our executive compensation against companies with similar revenues, market capitalization and other financial measures within our industry. We expect that our compensation committee will continue to engage an independent consultant in setting our executive compensation program.
2010 Competitive Market Review
Our compensation committee has the sole authority to retain compensation consultants to assist in its evaluation of our executive compensation program, including authority to approve the consultant’s fees and other terms of its engagement. Our compensation committee engaged Radford in January 2010 to perform the following services:
| • | assess and provide recommendations with respect to updating the list of peer companies against which we benchmark our executive compensation; |
| • | brief our compensation committee on current compensation market trends; |
| • | assess our performance against our peer groups and evaluate our current executive compensation program with a view to supporting and reinforcing our long-term strategic goals; and |
| • | assist our compensation committee in developing a competitive executive compensation program to reinforce our long-term strategic goals. |
To understand our position relative to market, it has been our historical practice to consider the market for comparable positions on an annual basis to ensure executive compensation remains competitive. Going forward, our compensation committee intends to evaluate the practice of setting our executive compensation program at the median of our peer group as established by our compensation committee. In 2010, Radford selected the following 16 companies to create a benchmark for assistance in determining competitive compensation packages.
| Advanced Analogic Technologies |
Hittite Microwave | Microsemi | Semtech | |||
| Applied Micro Circuits |
Integrated Device Technology | Monolithic Power Systems | Silicon Labs | |||
| Cavium Networks |
Lattice Semiconductor | Netlogic Microsystems | Standard Microsystems | |||
| Cirrus Logic |
Micrel | Power Integrations | Volterra Semiconductor |
Elements of Executive Compensation
Overview
Our executive compensation program consists of three principal components:
| • | base salary; |
| • | cash incentive compensation; and |
| • | equity-based compensation. |
83
Table of Contents
We also provide our executive officers with other benefits, including commuting allowance, severance, change-of-control benefits and the ability to participate in employee benefit plans on the same terms as all other eligible employees. While we do not have an exact formula for allocating between cash and non-cash compensation, we try to balance long-term equity versus short-term cash compensation and variable compensation versus fixed compensation.
Base Salary
Our base salaries are intended to provide financial stability, predictability and security of compensation for our executive officers for fulfilling their core job responsibilities. Our compensation committee considered several factors in determining base salaries, including each executive officer’s position, functional role, scope of responsibilities and seniority, individual performance, our financial performance and the relative ease or difficulty of replacing such executive officer with a person with comparable experience.
The effective base salary for each of our named executive officers for 2009 and 2010 was as follows:
| Annual Base Salary(1) | ||||||||
| Named Executive Officer |
2009 | 2010 | ||||||
| Young K. Sohn |
$ | 250,000 | $ | 300,000 | ||||
| John Edmunds |
$ | 250,000 | $ | 260,000 | ||||
| Gopal Raghavan |
$ | 200,000 | $ | 225,000 | ||||
| Ron Torten |
$ | 200,000 | $ | 225,000 | ||||
| (1) | Reflects the highest annualized base salary established for the named executive officer during each year. |
From our time of incorporation until 2009, we did not make substantial increases in our base salary structure for our executive officers. As we did not realize net profits and positive cash flows from operations until second quarter of 2009, our base salaries reflected our status as a start-up company focused principally on technology and product development and efficient use of limited cash resources. However, in 2009, our revenue began to increase and we generated positive cash flows. Accordingly, our compensation committee approved the increase in base salaries of our executive officers in 2010 in light of their additional responsibilities as we focused on increased customer and revenue growth. The increase was consistent with the Radford survey of base salaries from our peer group and brought our executive officers’ base salaries to approximately the 25th percentile of base salaries of our peer group.
Cash Incentive Compensation
Our cash incentive compensation is intended to incentivize our executive officers in the achievement of our pre-determined financial objectives and individual performance objectives. We believe it is important to provide our executive officers with the opportunity to earn annual cash incentive payments to reward performance and the achievement of various pre-determined objectives. In 2010, we established an annual cash incentive plan for our executive officers and we anticipate that we will establish similar cash incentive plans in the future. Under the annual cash compensation plan, an executive officer’s annual cash incentive award will generally depend on two performance factors, one related to our financial performance and one related to the executive officer’s individual performance as measured against specific management-by-objective goals, or MBO.
Year 2010
In 2010, our compensation committee approved a financial performance-based cash incentive plan for our executive officers. The performance target is based on our revenue growth, and the MBO goals for each of our named executive officers, which include, but are not limited to, achieving our financial performance goals, maintaining leadership in the market, building strong engagements with customers, introducing new products and preparing for our initial public offering. Under this cash incentive plan, if our revenue for the year ended
84
Table of Contents
December 31, 2010 equaled or exceeded $72 million, then our bonus pool would be equal to 6% of our targeted earnings before income tax, stock-based compensation expense, and depreciation and amortization. Our bonus pool could increase up to a maximum of 12% of our targeted earnings before income tax, stock-based compensation expense, and depreciation and amortization if we exceed our revenue target by 15% or more. The target amounts that could be paid out of the available bonus pool to our named executive officers are as follows:
| Named Executive Officer |
Target Cash Incentive ($) |
Percentage of Base Salary (%) |
Maximum Cash Incentive ($) |
Percentage of Base Salary (%) |
||||||||||||
| Young K. Sohn |
150,000 | 50 | 300,000 | 100 | ||||||||||||
| John Edmunds |
78,000 | 30 | 156,000 | 60 | ||||||||||||
| Gopal Raghavan |
67,500 | 30 | 135,000 | 60 | ||||||||||||
| Ron Torten |
67,500 | 30 | 135,000 | 60 | ||||||||||||
Mr. Sohn’s MBO goals in 2010 were centered around us achieving a corporate revenue goal of $72 million, as well as achieving product development and market penetration goals, exploring potential growth through establishing relationships with third parties and preparing for a possible initial public offering. Mr. Edmunds’s MBO goals in 2010 were centered around us achieving a corporate revenue goal of $72 million, completing our initial public offering and leading certain functional areas within the company. Mr. Raghavan’s MBO goals in 2010 were aligned with developing and maintaining technology leadership and exploring the technology aspects of certain potential strategic relationship opportunities. Mr. Torten’s MBO goals for 2010 were based upon us achieving our corporate revenue objective of $72 million and upon achieving his individual MBO goals to increase sales in order for us to achieve our corporate revenue target of $72 million, to increase design wins and to maintain our leadership position in the markets in which we compete. For 2010, our revenue was $83.2 million, exceeding our corporate revenue goal of $72 million. As a result, our named executive officers were eligible to receive a cash incentive payment from the bonus pool. As discussed above, bonuses for each of our named executive officers were determined based on their overall performance and contribution to our company, taking into account their MBO goals. In assessing each individual’s performance, our compensation committee did not apply a quantitative analysis but instead made a qualitative assessment of the relative importance of the overall objectives achieved by each of our named executive officers. The bonus paid to each of our named executive officers is set forth in the 2010 Summary Compensation Table under Non-Equity Incentive Plan Compensation.
Year 2011
In 2011, our compensation committee approved a financial performance-based cash incentive plan for our named executive officers similar to what was in place for 2010. For 2011, the performance target is based on our operating income growth and the MBO goals for each of our named executive officers, which include, but are not limited to, achieving our financial performance goals, maintaining leadership in the market, building strong engagements with customers, introducing new products and operating in good form as a public company. In 2011, if we exceed our operating income targets, 33% of such excess will fund the bonus pool for all employees up to a total of $2 million. We believe that the 2011 goals are reasonably challenging to incentivize our named executive officers to achieve returns for our stockholders, considered in light of general economic conditions, our company and industry and competitive conditions. In our judgment, the threshold targets are set at levels exceeding the prior year and are intended to incentivize our executive officers to increase stockholder return.
Equity-Based Compensation
Our equity-based compensation is intended to incentivize and retain executive officers through the use of time-based vesting while tying our long-term financial performance and stockholder value creation to the executive officer’s financial gain. Historically, equity-based compensation has been our primary long-term incentive compensation component. We believe that equity-based compensation has been and will continue to be a significant part of our executive officers’ total compensation packages. We believe both time-based vesting and shared financial success are long-term incentives that motivate executive officers to grow revenue and earnings, enhance stockholder value and align the interests of our stockholders and executives over the long-term. We
85
Table of Contents
believe that long-term performance is achieved through an ownership culture that encourages a high level of continuously improving performance by our executive officers through grants of equity awards. The vesting feature of our equity grants contributes to executive officer retention as this feature provides an incentive to our executive officers to remain in our employ during the vesting period. To date, stock options have been the only type of equity award granted to our executive officers.
The equity-based awards granted to our executive officers have been in the form of stock options granted at fair market value with time-based vesting under our 2000 Stock Plan. All of our executive officers receive equity-based awards when they are hired and these awards typically vest over a four-year period, with 1/4th of the shares vesting one year from the vesting commencement date and the remaining shares vesting in equal monthly installments over the following 36 months. The level of equity-based compensation is reviewed periodically and additional option grants are made from time to time. In the future, we expect our compensation committee to review equity-based compensation levels, along with our base salary and annual cash incentives, on an annual basis.
In 2010, our named executive officers were awarded the following stock options under our 2000 Stock Plan:
| Named Executive Officer |
Date of Award | Number of Shares | ||||||
| Young K. Sohn |
4/30/2010 | 128,571 | (1) | |||||
| John Edmunds |
4/30/2010 | 42,856 | (1) | |||||
| Gopal Raghavan |
4/30/2010 | 107,142 | (1) | |||||
| Ron Torten |
4/30/2010 | 21,428 | (1) | |||||
| 7/14/2010 | 428 | (2) | ||||||
| (1) | The awards will begin vesting on April 30, 2011 and will vest as to 1/48th of the shares monthly thereafter over the 48 succeeding months. |
| (2) | This award vested immediately in full. |
Our compensation committee granted the above awards in recognition of our named executive officers’ efforts during the previous year after considering the extraordinary growth and development of our business. In determining the amount of the awards above, our compensation committee considered the executive officer’s position, the existing equity awards held by the executive officer and the total number of equity awards outstanding. The equity-based awards are meant to provide long-term incentives to motivate the executive officers to stay and contribute to our continuous growth.
Other Compensatory Benefits
We believe it is appropriate and necessary for recruitment and retention to provide our executive officers with other forms of compensatory benefits, including the following:
Severance and Change of Control Benefits. Certain of our named executive officers are entitled to severance and change of control benefits pursuant to their offer letters. We believe these severance and change of control benefits are an essential element of our executive compensation package that enables us to recruit and retain talented executives, the terms of which are described below under “—Employment, Severance and Change in Control Arrangements.”
Benefits. We maintain broad-based benefits that are provided to all eligible employees, including our 401(k), flexible spending accounts, medical, dental and vision care plans, our life and accidental death and dismemberment insurance policies and long-term and short-term disability plans. Executive officers are eligible to participate in each of these programs on the same terms as non-executive employees. We do not provide any retirement benefits separate from the 401(k).
86
Table of Contents
Other Compensation. We pay Mr. Sohn a commuting allowance to reimburse him for expenses incurred traveling between our Westlake Village office and his place of residence. Under his offer letter, Mr. Sohn is entitled to a commuting allowance of $50,000 per year. The value of this benefit is included in the “2010 Summary Compensation Table” under “All Other Compensation.”
Accounting and Tax Considerations
Section 162(m). Section 162(m) of the U.S. Internal Revenue Code of 1986, as amended, or the Code, which will become applicable to us upon the closing of this offering, generally disallows a tax deduction for compensation in excess of $1.0 million paid to any and each of our Chief Executive Officer and other highest paid officers in office at year end. Qualifying performance-based compensation is not subject to the deduction limitation if specified requirements are met. We periodically review the potential consequences of Section 162(m) and we generally intend to structure the performance-based portion of our executive compensation, where feasible, to comply with exemptions in Section 162(m) so that the compensation remains tax deductible to us. However, our compensation committee may, in its judgment, authorize compensation payments that do not comply with the exemptions in Section 162(m) when it believes that such payments are appropriate to attract and retain executive talent.
Share-based compensation cost is measured at grant date, based on the fair value of the awards, and is recognized as an expense over the requisite employee service period. Our compensation committee has determined to retain for the foreseeable future our stock option program as the sole component of its long-term compensation program and to record this expense on an ongoing basis.
Compensation Policies and Practices as They Relate to Risk Management
We believe that our compensation policies and practices for all employees, including our executive officers, do not create risks that are reasonably likely to have a material adverse effect on our company. In making this determination, we assessed our executive and broad-based compensation and benefits programs to determine if the programs’ provisions and operations create undesired or unintentional risk of a material nature. This risk assessment process included a review of our compensation policies and practices and an analysis of our executive compensation program. Although we reviewed all compensation programs, we focused on the programs with variability of payout, with the ability of a participant to directly affect payout and the controls on participant action and payout. Based on the foregoing, we believe that our compensation policies and practices do not create inappropriate or unintended significant risk to us as a whole. We also believe that our incentive compensation arrangements provide incentives that do not encourage risk-taking beyond the organization’s ability to effectively identify and manage significant risks, are compatible with effective internal controls and our risk management practices, and are supported by the oversight and administration of our compensation committee with regard to our executive compensation program.
Several features in our compensation programs and policies mitigate or reduce the likelihood of excessive risk-taking by employees, including the following:
| • | The core principles outlined above and compensation program elements discussed below are designed to align goals with stockholder interests. |
| • | Pay typically consists of a mix of fixed and variable compensation, with the variable compensation designed to reward both short- and long-term corporate performance. |
| • | A significant portion of our executive officers’ total direct compensation is in the form of equity awards that usually vest over multiple years. Internal controls, the number of people involved and discipline over financial records, financial reporting, disclosure and external communications tend to dilute the ability of any one individual to single handedly have a material influence on our financial reporting in a way that would materially increase the potential value of an individual’s equity award. |
87
Table of Contents
| • | The funded pool of our annual bonus program is dependent upon company revenue performance relative to the annual plan and capped in total by our board of directors when the annual business plan is approved in the beginning of the year. All individual awards for executives from the pool are reviewed by our compensation committee in relation to the individual performance against specific pre set objectives. All other awards to individual contributors are also reviewed by the committee for reasonableness and equity among the employees. |
| • | Our compensation committee has the ability to use, and has used, negative discretion to reduce payouts under the annual bonuses as appropriate to the circumstances. |
Our determination that our compensation policies and practices do not create risks that are reasonably likely to have a material adverse effect on our company was based upon the considerations identified above.
2010 Summary Compensation Table
The following table sets forth compensation for services rendered in all capacities to us for the years ended December 31, 2010 and 2009 for our President and Chief Executive Officer, our Chief Financial Officer and our two other most highly compensated executive officers as of December 31, 2010, whom we refer to as the named executive officers.
| Name & Principal Position |
Year | Salary ($) |
Option Awards(1) ($) |
Non-Equity Incentive Plan Compensation(2) ($) |
All
Other Compensation ($)(3) |
Total ($) |
||||||||||||||||||
| Young K. Sohn |
2010 | 289,583 | 730,290 | 175,000 | 50,000 | 1,244,873 | ||||||||||||||||||
| President and Chief Executive Officer |
2009 | 250,000 | — | 100,000 | 50,000 | 400,000 | ||||||||||||||||||
| John Edmunds |
2010 | 260,000 | 243,430 | 63,000 | — | 566,430 | ||||||||||||||||||
| Chief Financial Officer and Chief Accounting Officer |
2009 | 250,000 | 12,195 | 40,000 | — | 302,195 | ||||||||||||||||||
| Gopal Raghavan(4) |
2010 | 220,833 | 608,575 | 65,000 | — | 894,408 | ||||||||||||||||||
| Chief Technology Officer |
2009 | 200,000 | 41,349 | 53,200 | — | 294,549 | ||||||||||||||||||
| Ron Torten |
2010 | 212,500 | 124,433 | 75,757 | — | 412,690 | ||||||||||||||||||
| Vice President of Worldwide Sales |
2009 | 200,000 | 15,118 | 109,161 | — | 324,279 | ||||||||||||||||||
| (1) | The amount reflects the aggregate grant date fair value of the awards computed in accordance with FASB ASC Topic 718, rather than the amounts paid to or realized by the named individual. We provide information regarding the assumptions used to calculate the value of all stock option awards made to executive officers in note 11 to the notes to our consolidated financial statements. There can be no assurance that awards will vest or will be exercised (in which case no value will be realized by the individual), or that the value upon exercise will approximate the aggregate grant date fair value. None of our executive officers forfeited any option awards in 2010. |
| (2) | Reflects the amount approved by our compensation committee as cash incentive to executive officers for 2010 based upon satisfaction of the criteria under our 2010 bonus program. See “Compensation Discussion and Analysis—Cash Incentive Compensation” for a discussion on our bonus plan in 2010. |
| (3) | Represents commuting allowance. |
| (4) | Dr. Raghavan resigned as our Chief Technology Officer effective February 18, 2011. |
88
Table of Contents
Grants of Plan-Based Awards in 2010
The following table sets forth information on grants of plan-based awards in 2010 to our named executive officers.
| Estimated Future Payouts Under Non-Equity Inventive Plan Awards(1)(2) |
All Other Option Awards: Number of Securities Underlying Options (#) |
Exercise or Base Price of Option Awards ($/Sh) |
Grant Date Fair Value of Stock and Option Awards($)(3) |
|||||||||||||||||||||||||
| Name |
Grant Date | Threshold($) | Target($) | Maximum($) | ||||||||||||||||||||||||
| Young K. Sohn |
4/30/10 | 128,571 | 9.29 | 730,290 | ||||||||||||||||||||||||
| — | 150,000 | 300,000 | — | — | — | |||||||||||||||||||||||
| John Edmunds |
4/30/10 | 42,856 | 9.29 | 243,430 | ||||||||||||||||||||||||
| — | 78,000 | 156,000 | — | — | — | |||||||||||||||||||||||
| Gopal Raghavan |
4/30/10 | 107,142 | 9.29 | 608,575 | ||||||||||||||||||||||||
| — | 67,500 | 135,000 | — | — | — | |||||||||||||||||||||||
| Ron Torten |
4/30/10 | 21,428 | 9.29 | 121,715 | ||||||||||||||||||||||||
| 7/14/10 | 428 | 12.02 | 2,718 | |||||||||||||||||||||||||
| — | 67,500 | 135,000 | — | — | — | |||||||||||||||||||||||
| (1) | The target incentive amounts shown in this column reflect our annual bonus awards originally provided under our cash incentive plan and represents pre-established target awards as a percentage of base salary for the year ended December 31, 2010, with the potential for actual awards under the plan to either exceed or be less than such funding target depending upon corporate performance. Actual award amounts are not guaranteed and are determined at the discretion of our compensation committee, which may consider an individual’s performance during the period. For additional information, please refer to the Compensation Discussion and Analysis section. Actual cash incentive plan payouts are reflected in the Non-Equity Incentive Plan Compensation column of the 2010 Summary Compensation Table. |
| (2) | The threshold illustrates the smallest payout that can be made if all of the pre-established performance objectives are achieved at the minimum achievement level. Actual awards may be more or less than these amounts and are at the discretion of our compensation committee. The target is the payout that can be made if the pre-established performance objectives have been achieved at the target achievement level. The maximum is the greatest payout that can be made if the pre-established maximum performance objectives are achieved or exceeded at the outperform achievement levels. |
| (3) | The amount reflects the aggregate grant date fair value of the awards computed in accordance with FASB ASC Topic 718, rather than the amounts paid to or realized by the named individual. We provide information regarding the assumptions used to calculate the value of all awards of stock options made to executive officers in note 11 to the notes to our consolidated financial statements. There can be no assurance that awards will vest or will be exercised (in which case no value will be realized by the individual), or that the value upon exercise will approximate the aggregate grant date fair value. None of our executive officers forfeited any option awards in 2010. |
Narrative to 2010 Summary Compensation Table and Grants Plan-Based Awards in 2010 Table
Please see “—Compensation Discussion and Analysis” above for a complete description of compensation plans pursuant to which the amounts listed under the 2010 Summary Compensation Table and Grants of Plan-Based Awards in 2010 Table were paid or awarded and the criteria for such payment, including targets for payment of annual incentives, as well as performance criteria on which such payments were based. The Compensation Discussion and Analysis also describes the options grants.
89
Table of Contents
Outstanding Equity Awards at December 31, 2010
The following table presents certain information concerning equity awards held by our named executive officers at December 31, 2010.
| Option Awards(1) | ||||||||||||||||
| Name |
Number of Securities Underlying Unexercised Options (#) Exercisable |
Number of Securities Underlying Unexercised Options (#) Unexercisable |
Option Exercise Price ($) |
Option Expiration Date |
||||||||||||
| Young K. Sohn |
866,704 | — | 1.78 | 8/15/2017 | ||||||||||||
| 128,571 | (4) | — | 9.29 | 4/30/2020 | ||||||||||||
| John Edmunds |
183,221 | — | 1.96 | 3/12/2018 | ||||||||||||
| 12,857 | (2) | — | 1.47 | 2/25/2019 | ||||||||||||
| 42,856 | (4) | — | 9.29 | 4/30/2020 | ||||||||||||
| Gopal Raghavan |
143,666 | (3) | — | 2.34 | 6/7/2012 | |||||||||||
| 268,761 | (3) | — | 0.70 | 5/19/2014 | ||||||||||||
| 200,571 | — | 1.05 | 5/5/2016 | |||||||||||||
| 42,857 | (2) | — | 1.47 | 2/25/2019 | ||||||||||||
| 428 | (3) | — | 2.62 | 8/27/2019 | ||||||||||||
| 107,142 | (4) | — | |
9.29 |
|
4/30/2020 | ||||||||||
| Ron Torten |
193,165 | — | 1.96 | 3/12/2018 | ||||||||||||
| 8,571 | (2) | — | 1.47 | 2/25/2019 | ||||||||||||
| 4,285 | (3) | — | 2.62 | 8/27/2019 | ||||||||||||
| 21,428 | (4) | — | |
9.29 |
|
4/30/2020 | ||||||||||
| 428 | (3) | — | |
12.02 |
|
7/14/2020 | ||||||||||
| (1) | Except as otherwise noted, all option awards listed in the table vest as to 1/4th of the total number of shares subject to the option 12 months after the vesting commencement date, and the remaining shares vest at a rate of 1/48th of the total number of shares subject to the option each month thereafter. Unless otherwise noted, all option awards are subject to early exercise, subject to our right of repurchase during the vesting period. |
| (2) | This stock option vests in full after three years of service from the grant date. |
| (3) | This stock option is fully vested. |
| (4) | This stock option vests in a series of 48 successive equal monthly installments upon completion of each additional month of service over the 48-month period measured from the first anniversary of such optionee’s vesting commencement date. |
Option Exercises and Stock Vested in 2010
The following table sets forth the number of shares acquired upon exercise of options by each named executive officer during 2010.
| Option Awards | ||||||||
| Name |
Number of Shares Acquired on Exercise (#) |
Value Realized On Exercise ($)(1) |
||||||
| Young K. Sohn |
— | — | ||||||
| John Edmunds |
— | — | ||||||
| Gopal Raghavan |
67,285 | 755,521 | ||||||
| Ron Torten |
10,285 | 103,261 | ||||||
| (1) | Value realized is based on the fair market value of our common stock on the date of exercise minus the exercise price. As there was no public market for our common stock on the dates the options were exercised, we have assumed the fair market value on the date of exercise was $12.00, the initial public offering price per share. |
90
Table of Contents
Employment, Severance and Change in Control Arrangements
In July 2007, we entered into an offer letter agreement with Young K. Sohn, our Chief Executive Officer. This offer letter agreement set Mr. Sohn’s base salary at an annual rate of $250,000. Pursuant to the offer letter agreement, Mr. Sohn is entitled to a commuting allowance of $50,000 annually, or $4,167 per month. In addition, Mr. Sohn was granted options to purchase 1,220,703 shares of our common stock under the 2000 Stock Plan. Mr. Sohn is also entitled to participate in all employee benefit plans, including group health care plans and all fringe benefit plans. Mr. Sohn’s offer letter agreement provides that he is an at-will employee and his employment may be terminated at any time by us. On June 8, 2010, we entered into an amendment to Mr. Sohn’s offer letter to conform his offer letter to the requirements of Section 409A of the Code.
Pursuant to Mr. Sohn’s offer letter agreement, if Mr. Sohn’s employment terminates after a “corporate transaction” as defined below, he will receive one year of benefits and salary. If he is involuntarily terminated within 18 months of a “corporate transaction,” then his options granted under the offer letter agreement will become fully vested. If Mr. Sohn’s employment is involuntarily terminated and his termination is not subsequent to a “corporate transaction”, as defined below, Mr. Sohn will receive one year of benefits. However, these provisions were superseded pursuant to a change of control severance agreement we entered into with Mr. Sohn on June 8, 2010. Under this change of control severance agreement, if Mr. Sohn is terminated by us without “cause,” as defined below, or if he resigns for “good reason,” as defined below, within 12 months of an Inphi “change of control,” as defined below, Mr. Sohn will be entitled to receive a lump sum equal to 200% of the sum of his annual base salary, plus his annual target bonus as in effect on his termination date. In addition, if Mr. Sohn elects and pays to continue health insurance under the Consolidated Omnibus Budget Reconciliation Act of 1985, or COBRA, we will reimburse Mr. Sohn on a monthly basis an amount equal to the monthly amount we were paying as the employer-portion of premium contributions for health coverage for Mr. Sohn and his eligible dependents, until the earlier of (a) the end of the 24–month period following his termination date or (b) the date Mr. Sohn or his eligible dependents lose eligibility for COBRA continued coverage. We also agreed to accelerate the vesting of 100% of his unvested outstanding equity awards.
In December 2007, we entered into an offer letter agreement with John Edmunds, our Chief Financial Officer. This offer letter agreement set Mr. Edmunds’ base salary at an annual rate of $250,000. Pursuant to the offer letter agreement, Mr. Edmunds was entitled to a commuting allowance of $2,000 per month and a relocation allowance of up to $25,000 in the event he relocates to Westlake Village. However, it was agreed that instead of receiving this commuting allowance, we would reimburse Mr. Edmunds for travel expenses incurred for traveling between our headquarters in Sunnyvale, California and Westlake Village, California. In addition, Mr. Edmunds was granted options to purchase 183,221 shares of common stock, determined by our board of directors under the 2000 Stock Plan. Mr. Edmunds is also entitled to participate in all employee benefit plans, including group health care plans and all fringe benefit plans. Mr. Edmunds’ offer letter agreement provides that he is an at-will employee and his employment may be terminated at any time by us.
The offer letter agreement further provided that if Mr. Edmunds’ employment terminates within 18 months after a “corporate transaction”, as defined below, his option granted under his offer letter agreement will accelerate as to 50% of the unvested shares. However, pursuant to his stock option agreement, the vesting of the option will accelerate and the option will become fully vested. These provisions were superseded pursuant to a change of control severance agreement we entered into with Mr. Edmunds on June 8, 2010. Under this change of control severance agreement, if Mr. Edmunds is terminated by us without “cause,” as defined below, or if he resigns for “good reason,” as defined below, within 12 months of an Inphi “change of control,” as defined below, Mr. Edmunds will be entitled to receive a lump sum equal to 150% of the sum of his annual base salary, plus his annual target bonus as in effect on his termination date. In addition, if Mr. Edmunds elects and pays to continue health insurance under COBRA, we will reimburse Mr. Edmunds on a monthly basis an amount equal to the monthly amount we were paying as the employer-portion of premium contributions for health coverage for Mr. Edmunds and his eligible dependents, until the earlier of (a) the end of the 18-month period following his termination date or (b) the date Mr. Edmunds or his eligible dependents lose eligibility for COBRA continued coverage. We also agreed to accelerate the vesting of 100% of his unvested outstanding equity awards.
91
Table of Contents
For purposes of the offer letter agreements above, “corporate transaction” is defined as: (a) a merger or consolidation in which securities possessing more than 50% of the total combined voting power of our outstanding securities are transferred to a person or persons different from the persons holding those securities immediately prior to such transaction or (b) the sale, transfer or other disposition of all or substantially all of our assets in complete liquidation or dissolution of our company.
For purposes of the change of control agreements above, “good reason” is defined as (a) a reduction in compensation by greater than 10%, unless part of a general reduction in compensation applicable to our senior executives, (b) relocation of job site by more than 50 miles, or (c) a material reduction in job responsibilities, change in title or change in reporting structure.
The term “cause” is defined as (a) commission of a felony, an act involving moral turpitude, or an act constituting common law fraud, and which has a material adverse effect on our the business or affairs or that of our affiliates or stockholders, (b) intentional or willful misconduct or refusal to follow the lawful instructions of our board of directors, or (c) intentional breach of our confidential information obligations which has an adverse effect on us or our affiliates or stockholders.
The term “change of control” is defined as the occurrence of any one of the following events:
| • | the approval by our stockholders of our liquidation or dissolution or the sale or disposition of all or substantially all of our assets; |
| • | a merger or consolidation where we are not the surviving entity; |
| • | any person or persons becoming the beneficial owner, directly or indirectly, of 50% or more of the total voting power of our then outstanding voting securities; or |
| • | a change in the composition of our board of directors, as a result of which fewer than a majority of the directors who are currently on our board of director or who are elected, or nominated for election, to our board of directors with the affirmative votes of at least a majority of those directors whose election or nomination was not in connection with any transactions described in subsections (a), (b) or (c), or in connection with an actual or threatened proxy contest relating to our election of directors. |
Potential Payments Upon Termination and Change of Control
The following table shows the potential payments that would have been paid to our named executive officers if they had been involuntarily terminated on December 31, 2010.
| Involuntary Termination without a Change of Control |
Involuntary Termination Following a Change of Control | |||||||||||||||
| Name |
Health Care Benefits ($) |
Severance Payments Attributable to Salary ($) |
Value of Accelerated Equity Awards ($) |
Health Care Benefits ($) |
||||||||||||
| Young K. Sohn |
21,760 | 750,000 | 4,648,113 | (1) | 36,298 | |||||||||||
| John Edmunds |
— | 468,000 | 1,601,907 | (2) | 17,827 | |||||||||||
| Gopal Raghavan |
— | — | — | — | ||||||||||||
| Ron Torten |
— | — | — | — | ||||||||||||
| (1) | The amount represents the fair market value per share of our common stock as of December 31, 2010, less the option exercise price ($1.78 and $9.29) multiplied by the unvested options as of December 31, 2010 (306,591 options). The closing price of our common stock on December 31, 2010 was $20.09. |
| (2) | The amount represents the fair market value per share of our common stock as of December 31, 2010, less the option exercise price ($1.47, $1.96 and $9.29) multiplied by unvested options as of December 31, 2010 (105,336 options). The closing price of our common stock on December 31, 2010 was $20.09. |
92
Table of Contents
Each executive will not receive a gross-up payment if the executive officer is required to pay excise tax under Section 4999 of the Code.
In addition to the benefits described above, our 2000 Stock Plan provides for the acceleration of vesting of awards in certain circumstances in connection with a change of control of our company. See “Employee Benefit Plans” below.
Employee Benefit Plans
2000 Stock Option/Stock Issuance Plan
Our board of directors adopted our 2000 Stock Option/Stock Issuance Plan, as amended, or 2000 Stock Plan. The 2000 Stock Plan was last amended on April 30, 2010. Our 2000 Stock Plan is divided into two separate equity programs:
| • | The Option Grant Program under which eligible persons may be granted options to purchase shares of common stock; and |
| • | The Stock Issuance Program under which eligible persons may be issued shares of common stock directly, either through the immediate purchase of such shares, as a bonus for services rendered to us or for services to be rendered to us. |
The persons eligible to participate in the plan are employees, non-employee members of our board of directors and consultants who provide services to us.
Share Reserve. As of November 16, 2010, we had reserved a total of 8,940,222 shares of our common stock for issuance pursuant to the 2000 Stock Plan. As of November 16, 2010, options to purchase 6,674,820 shares of common stock were outstanding, and 31,121 shares were available for future grant, under the 2000 Stock Plan.
Following our initial public offering, no additional awards have been granted and no shares of our common stock remain available for future issuance under the 2000 Stock Plan. Shares originally reserved for issuance under our 2000 Stock Plan but which are not issued or subject to outstanding grants on the effective date of our 2010 Stock Incentive Plan, and shares subject to outstanding options or forfeiture restrictions under our 2000 Stock Plan on the effective date of our 2010 Stock Incentive Plan that are subsequently forfeited or terminated for any reason before being exercised, up to a number of additional shares not to exceed an aggregate of 428,572 shares, will again become available for awards under our 2010 Stock Incentive Plan.
Administration. Our board of directors currently administers our 2000 Stock Plan. Under our 2000 Stock Plan, the administrator has the power to determine the terms of the awards, including the employees, directors and consultants who will receive awards, the exercise price or purchase price of awards, the number of shares subject to each award, the vesting schedule and exercisability of awards and the form of consideration payable for shares issued under the 2000 Stock Plan.
Stock Options. With respect to all incentive stock options granted under the 2000 Stock Plan, the exercise price shall not be less than 100% of the fair market value per share of common stock on the date of grant. Incentive stock options granted to any holder of more than 10% of the voting power of all classes of our outstanding stock as of the grant date must have an exercise price of at least 110% of the fair market value of our common stock on the date of grant. With respect to all non-statutory options granted under the 2000 Stock Plan, the exercise price shall not be less than 85% of the fair market value per share of our common stock on the date of grant. However, with respect to any participant who owns more than 10% of the voting power of all classes of our outstanding stock as of the grant date, the exercise price of the option shall not be less than 110% of the fair market value per share of our common stock on the grant date. The term of an option may not exceed 10 years.
93
Table of Contents
After termination of an employee, director or consultant, other than due to death or disability, he or she may exercise his or her option, to the extent vested, for a period of three months following such termination or such longer period of time as specified in the stock options agreement. If termination is due to disability, the option will remain exercisable for a period of 12 months following such termination or such longer period of time as specified in the stock option agreement. If termination is due to death, the option will remain exercisable for a period of 12 months following the date of death or such longer period of time as specified in the stock options agreement. If termination is due to misconduct, all options shall terminate immediately and cease to remain outstanding. However, an option may not be exercised later than the expiration of its term.
Transferability. Our 2000 Stock Plan does not allow for the transfer of incentive stock options under the 2000 Stock Plan other than by will, the laws of descent and distribution. Only the recipient of an incentive stock option may exercise such award during his or her lifetime. A nonstatutory stock option may be assigned by gift or domestic relations order to family members, as permitted by Rule 701 of the Securities Act.
Stock Issuances. Shares of our common stock may be issued directly under the 2000 Stock Plan. Such shares may be subject to vesting conditioned upon continued service or upon the attainment of specified performance objectives. However, the vesting of such shares may not be more restrictive than 20% of shares subject to the award vesting per year, with initial vesting to occur no later than one year after the issuance date. With respect to such shares issued under the 2000 Stock Plan, the purchase price (if any) shall not be less than 85% of the fair market value per share of common stock on the date of issuance. Participants who are granted shares under the 2000 Stock Plan will generally have all of the rights of a stockholder with respect to such shares, other than the right to transfer such shares before vesting.
Adjustments. In the event of a stock split, stock dividend, recapitalization, combination of shares, exchange of shares or other change affecting our common stock without our receipt of consideration, appropriate adjustments will be made to the maximum number or class of securities issuable under the 2000 Stock Plan and the number or class of securities and exercise price per share under each outstanding option in order to prevent the dilution or enlargement of benefits under outstanding options.
Corporate Transaction. Upon a merger, consolidation, sale, transfer or other disposition of all or substantially all of our assets in the event of a complete liquidation or dissolution, our 2000 Stock Plan provides that the successor corporation or its parent or subsidiary will assume, substitute or replace an equivalent award for each outstanding award under the 2000 Stock Plan. If there is no assumption or substitution of outstanding awards, such awards will become fully vested and exercisable.
Plan Amendments and Termination. According to its terms, the 2000 Stock Plan shall terminate upon the earliest (a) the expiration of the 10-year period measured from the date the Plan is adopted by the Board, (b) the date on which all shares available for issuance under the Plan shall have been issued as vested shares or (c) the termination of all outstanding options in connection with a corporate transaction. All options and unvested stock issuances outstanding at the time of a clause (a) termination event shall continue to have full force and effect in accordance with the provisions of the documents evidencing those options or issuances.
2010 Stock Incentive Plan
General. Our 2010 Stock Incentive Plan was adopted by our board of directors in June 2010, subject to stockholder approval, and became effective immediately prior to completion of our initial public offering on November 16, 2010.
The 2010 Stock Incentive Plan provides for the granting of incentive stock options within the meaning of Section 422 of Code to employees and the granting of nonstatutory stock options to employees, non-employee directors, advisors and consultants. The 2010 Stock Incentive Plan also provides for the grants of restricted stock, stock appreciation rights and stock unit awards to employees, non-employee directors, advisors and consultants.
94
Table of Contents
Administration. Our compensation committee of our board of directors administer the 2010 Stock Incentive Plan, including the determination of the recipient of an award, the number of shares subject to each award, whether an option is to be classified as an incentive stock option or nonstatutory option, and the terms and conditions of each award, including the exercise and purchase prices and the vesting or duration of the award.
At the discretion of our board of directors, our compensation committee may consist solely of two or more “non-employee directors” within the meaning of Rule 16b-3 of the Securities Exchange Act of 1934, or the Exchange Act, or solely of two or more “outside directors” within the meaning of Section 162(m) of the Code. Our board of directors may appoint one or more separate committees of our board, each consisting of one or more members of our board of directors, to administer our 2010 Stock Incentive Plan with respect to employees who are not subject to Section 16 of the Exchange Act. Subject to applicable law, our board of directors may also authorize one or more officers to designate employees, other than employees who are subject to Section 16 of the Exchange Act, to receive awards under our 2010 Stock Incentive Plan and/or determine the number of such awards to be received by such employees subject to limits specified by our board of directors.
Authorized Shares. As of December 31, 2010, 2,032,192 shares of our common stock were reserved for issuance under our 2010 Stock Incentive Plan. As of December 31, 2010, no equity awards had been granted under the 2010 Stock Incentive Plan. In addition, the number of shares that have been authorized for issuance under the 2010 Stock Incentive Plan will be automatically increased on the first day of each fiscal year beginning in 2011 and ending in 2020, in an amount equal to the least of (a) 3,000,000 shares, (b) 5% of the outstanding shares of our common stock on the last day of the immediately preceding year or (c) another amount determined by our board of directors. Shares subject to awards granted under the 2010 Stock Incentive Plan that are forfeited or terminated before being exercised or settled, or are not delivered to the participant because such award is settled in cash will again become available for issuance under the 2010 Stock Incentive Plan. Shares withheld to satisfy the grant, exercise price or tax withholding obligation related to an award will again become available for issuance under the 2010 Stock Incentive Plan. However, shares that have actually been issued shall not again become available unless forfeited. No more than 10,000,000 shares may be delivered upon the exercise of incentive stock options granted under the 2010 Stock Incentive Plan plus, to the extent allowable under applicable law, any shares that again become available for issuance under the 2010 Stock Incentive Plan. In addition, shares originally reserved for issuance under our 2000 Stock Plan but which are not issued or subject to outstanding grants on the effective date of the 2010 Stock Incentive Plan, and shares subject to outstanding options or forfeiture restrictions under our 2000 Stock Plan on the effective date of the 2010 Stock Incentive Plan that are subsequently forfeited or terminated for any reason before being exercised, up to a number of additional shares not to exceed an aggregate of 428,572 shares, will again become available for awards under our 2010 Stock Incentive Plan on the date the 2010 Stock Incentive Plan is effective.
No participant in the 2010 Stock Incentive Plan can receive option grants, restricted shares, stock appreciation rights or stock units totaling more than an aggregate of 3,000,000 shares in any calendar year, except in the participant’s first year of employment in which the participant may receive equity awards totaling up to 6,000,000 shares. No participant in the 2010 Stock Incentive Plan may be paid more than an aggregate of $2,000,000 in cash during any calendar year with respect to equity awards that are payable in cash.
Types of Awards.
| • | Stock Options. A stock option is the right to purchase a certain number of shares of stock, at a certain exercise price, in the future. Under our 2010 Stock Incentive Plan, incentive stock options and nonstatutory options must be granted with an exercise price of at least 100% of the fair market value of our common stock on the date of grant. Incentive stock options granted to any holder of more than 10% of the voting shares of our company must have an exercise price of at least 110% of the fair market value of our common stock on the date of grant. No incentive stock option can be granted to an employee if as a result of the grant, the employee would have the right in any calendar year to exercise for the first time one or more incentive stock options for shares having an aggregate fair market value |
95
Table of Contents
| in excess of $100,000. The stock option agreement specifies the date when all or any installment of the option is to become exercisable. We expect that 1/4th of the total number of shares subject to the options will vest and become exercisable 12 months after the vesting commencement date for options granted, and the remaining options will vest and become exercisable at a rate of 1/48th of the total number of shares subject to the options each month thereafter. Each stock option agreement sets forth the term of the options, which is prohibited from exceeding 10 years (five years in the case of an incentive stock option granted to any holder of more than 10% of our voting shares), and the extent to which the optionee will have the right to exercise the option following termination of the optionee’s service with the company. Payment of the exercise price may be made in cash or cash equivalents or, if provided for in the stock option agreement evidencing the award, (a) by surrendering, or attesting to the ownership of, shares which have already been owned by the optionee, (b) by delivery of an irrevocable direction to a securities broker to sell shares and to deliver all or part of the sale proceeds to us in payment of the aggregate exercise price, (c) by delivery of an irrevocable direction to a securities broker or lender to pledge shares and to deliver all or part of the loan proceeds to us in payment of the aggregate exercise price, (d) by delivering a full-recourse promissory note or (e) by any other form that is consistent with applicable laws, regulations and rules. |
| • | Restricted Stock. Restricted stock is a share award that may be subject to vesting conditioned upon continued service, the achievement of performance objectives or the satisfaction of any other condition as specified in a restricted stock agreement. Participants who are granted restricted stock awards generally have all of the rights of a stockholder with respect to such stock, other than the right to transfer such stock prior to vesting. Subject to the terms of the 2010 Stock Incentive Plan, our compensation committee will determine the terms and conditions of any restricted stock award, including any vesting arrangement, which will be set forth in a restricted stock agreement to be entered into between us and each recipient. Restricted stock may be awarded for such consideration as our compensation committee may determine, including without limitation cash, cash equivalents, full-recourse promissory notes, future services or services rendered prior to the award, without cash payment by the recipient. |
| • | Stock Units. Stock units give recipients the right to acquire a specified number of shares of stock at a future date upon the satisfaction of certain conditions, including any vesting arrangement, established by our compensation committee and as set forth in a stock unit agreement. Unlike restricted stock, the stock underlying stock units will not be issued until the stock units have vested and are settled, and recipients of stock units generally will have no voting or dividend rights prior to the time the vesting conditions are satisfied and the award is settled. Our compensation committee may elect to settle vested stock units in cash or in common stock or in a combination of cash and common stock. Subject to the terms of the 2010 Stock Incentive Plan, our compensation committee will determine the terms and conditions of any stock unit award, which will be set forth in a stock unit agreement to be entered into between us and each recipient. |
| • | Stock Appreciation Rights. Stock appreciation rights typically will provide for payments to the recipient based upon increases in the price of our common stock over the exercise price of the stock appreciation right. The exercise price of a stock appreciation right will be determined by our compensation committee, which shall not be less than the fair market value of our common stock on the date of grant. Our compensation committee may elect to pay stock appreciation rights in cash or in common stock or in a combination of cash and common stock. |
Other Plan Features.
Under the 2010 Stock Incentive Plan:
| • | Unless the agreement evidencing an award expressly provides otherwise, no award granted under the plan may be transferred in any manner (prior to the vesting and lapse of any and all restrictions applicable to shares issued under such award), other than by will or the laws of descent and distribution. |
96
Table of Contents
| • | Nondiscretionary, automatic grants of nonstatutory stock options will be made to outside directors. Any outside director who first joins our board of directors on or after the effective date, will be automatically granted an initial nonstatutory option to purchase shares of our common stock that have a value of $160,000, calculated using the fair market value of our common stock on the date of grant, upon first becoming a member of our board of directors. The initial option will vest and become exercisable over four years in equal monthly installments. On the first business day after each of our regularly scheduled annual meetings of stockholders, each outside director will be automatically granted an option to purchase shares of our common stock that have a value of $80,000, calculated using the fair market value of our common stock on the date of grant, provided that the outside director has served on our board of directors for at least six months. Each annual option will vest and become exercisable on the first anniversary of the date of grant, or immediately prior to the next regular annual meeting of the company’s stockholders following the date of grant if the meeting occurs prior to the first anniversary date. The options granted to outside directors will have a per share exercise price equal to 100% of the fair market value of the underlying shares on the date of grant and will become fully vested if we are subject to a change of control. In addition, such options will terminate on the earlier of (a) the day before the 10th anniversary of the date of grant or (b) the date 12 months after the termination of the outside director’s termination of service for any reason. |
| • | In the event of a recapitalization, stock split or similar capital transaction, our compensation committee we will make appropriate and equitable adjustments to the number of shares reserved for issuance under the 2010 Stock Incentive Plan, including the share number in the formula for automatic annual increases, the limitation regarding the total number of shares underlying awards given to an individual participant in any calendar year, the number of shares that can be issued as incentive stock options and other adjustments in order to preserve the benefits of outstanding awards under the 2010 Stock Incentive Plan. |
| • | Generally, if we merge with or into another corporation, we will provide for full exercisability or vesting and accelerated expiration of outstanding awards or settlement of the intrinsic value of the outstanding awards in cash or cash equivalents followed by cancellation of such awards unless the awards are continued if we are the surviving entity, or assumed or substituted for by any surviving entity or a parent or subsidiary of the surviving entity. |
| • | If we are involved in an asset acquisition, stock acquisition, merger or similar transaction with another entity, our compensation committee may make awards under the 2010 Stock Incentive Plan by the assumption, substitution or replacement of awards granted by another entity. The terms of such assumed, substituted or replaced awards will be determined by our compensation committee in its discretion. |
| • | Awards under our 2010 Stock Incentive Plan may be made subject to the attainment of performance criteria including cash flows, earnings per share, earnings before interest, taxes and amortization, return on equity, total stockholder return, share price performance, return on capital, return on assets or net assets, revenue, income or net income, operating income or net operating income, operating profit or net operating profit, operating margin or profit margin, return on operating revenue, return on invested capital, market segment, shares, costs, expenses, regulatory body approval for commercialization of a product or implementation or completion of critical projects. |
| • | The 2010 Stock Incentive Plan terminates 10 years after its initial adoption, unless terminated earlier by our board of directors. Our board of directors may amend or terminate the plan at any time, subject to stockholder approval where required by applicable law. Any amendment or termination may not materially impair the rights of holders of outstanding awards without their consent. |
97
Table of Contents
In addition to the compensation arrangements with directors and executive officers described elsewhere in this prospectus, the following is a description of each transaction since January 1, 2008 and each currently proposed transaction in which:
| • | we have been or are to be a participant; |
| • | the amount involved exceeds or will exceed $120,000; and |
| • | any of our directors, executive officers or beneficial holders of more than 5% of our capital stock, or any immediate family member of or person sharing the household with any of these individuals (other than tenants or employees), had or will have a direct or indirect material interest. |
Registration Rights
We have entered into an investors’ rights agreement with each of the purchasers of our preferred stock. Under this agreement, our preferred stockholders are entitled to registration rights with respect to their shares of common stock issuable upon the automatic conversion of their convertible preferred stock immediately prior to completion of this offering and common stock, respectively. For additional information, see “Description of Capital Stock—Registration Rights.”
Sale of Preferred Stock
Messrs. Banatao and Tan, two of our directors, are affiliated with Tallwood I, L.P. and entities affiliated with Walden International, respectively.
From January 30, 2008 through April 21, 2008, Tallwood I, L.P., entities affiliated with Walden International, an entity associated with Samsung, and Mr. Srinivasan, one of our directors, purchased 178,729, 267,056, 160,595 and 31,312 shares of our Series E preferred stock, respectively, for an aggregate purchase price of approximately $1,712,387, $2,558,651, $1,538,646 and $300,000, respectively, or $9.5809 per share. In connection with these purchases of our Series E preferred stock, Tallwood I, L.P., entities affiliated with Walden International, an entity associated with Samsung and Mr. Srinivasan entered into the same agreements as the other investors, and we believe that the significant terms of these purchases of preferred stock would not differ in any material way from the terms we could have negotiated with unaffiliated third parties.
As Messrs. Banatao and Tan are affiliated with Tallwood I, L.P. and Walden International, respectively, beneficial ownership of the shares purchased by Tallwood I, L.P. and by entities affiliated with Walden International are attributable to Messrs. Banatao and Tan, respectively.
Indemnification Agreements
We intend to enter into indemnification agreements with each of our current directors and executive officers. These agreements require us to indemnify these individuals to the fullest extent permitted under Delaware law against liabilities that may arise by reason of their service to us, and to advance expenses incurred as a result of any proceeding against them as to which they could be indemnified. We also intend to enter into indemnification agreements with our future directors and executive officers.
98
Table of Contents
Other Transactions
We have a business relationship with Samsung, which holds approximately 4.6% of our outstanding shares of common stock. Samsung disclaims beneficial ownership of an additional 4.1% of our outstanding shares of common stock held by funds associated with Samsung Venture Investment Company. For the years ended December 31, 2010 and 2009, Samsung purchased high-speed PLLs and register solution for approximately $27.9 million and $21.2 million, respectively, constituting 34% and 36% of our total revenue, respectively. While Samsung is a significant stockholder, we believe that the terms of our purchase orders, including pricing, would not differ in any material way from the terms we could have negotiated with unaffiliated third parties.
As of December 31, 2010, we have a software subscription and maintenance agreement with Cadence Design Systems, Inc., which agreement was entered into in the ordinary course of business. In connection with this agreement, we committed to pay approximately $7.0 million, payable in 16 quarterly payments through May 2011. We paid $1.4 million, $1.8 million and $2.1 million in the years ended December 31, 2008, 2009 and 2010, respectively. In December 2010, we committed to pay an additional $5.25 million, payable in 10 quarterly payments through November 2013. Mr. Tan, one of our directors, is currently the Chief Executive Officer of Cadence. Mr. Tan does not have a direct or indirect material interest in the transaction. The agreement with Cadence was entered into in June 2007, prior to Mr. Tan’s employment with Cadence. Mr. Tan was appointed the President and Chief Executive Officer of Cadence in January 2009, although he has served as a member of the Cadence board of directors since 2004. Mr. Tan did not participate in the negotiation of, and did not derive any direct or indirect compensation or other benefit, monetary or otherwise, as a result of this agreement. In addition, Mr. Tan is not a party to the agreement. Further, the amounts paid and to be paid to Cadence under this agreement do not, and are not expected to, constitute a material percentage of the revenue of Cadence. Specifically, the amounts paid to Cadence in the years ended December 31, 2008, 2009 and 2010 accounted for 0.13%, 0.21% and 0.22% of Cadence’s revenue for the years ended January 3, 2009, January 2, 2010 and January 1, 2011, respectively. We believe that the significant terms of these purchases, including pricing, would not differ in any material way from the terms we could have negotiated with unaffiliated third parties.
Procedures for Approval of Related Party Transactions
Pursuant to our Related Person Transactions Policy, the audit committee of our board of directors must approve transactions with our company valued at or above $120,000 in which any director, officer, 5% or greater stockholder or certain related persons or entities has a direct or indirect material interest.
99
Table of Contents
PRINCIPAL AND SELLING STOCKHOLDERS
The following table sets forth information as of March 14, 2011 regarding the number of shares of common stock beneficially owned and the percentage of common stock beneficially owned before and after the completion of this offering by:
| • | each person or group of persons known to us to be the beneficial owner of more than 5% of our common stock; |
| • | each of our named executive officers; |
| • | each of our directors; |
| • | all of our directors and executive officers as a group; and |
| • | each of the selling stockholders. |
Unless otherwise noted below, the address of each beneficial owner listed in the table is c/o Inphi Corporation, 3945 Freedom Circle, Suite 1100, Santa Clara, California 95054.
We have determined beneficial ownership in accordance with the rules of the SEC. Except as indicated by the footnotes below, we believe, based on the information furnished to us, that the persons and entities named in the table below have sole voting and investment power with respect to all shares of common stock that they beneficially own, subject to applicable community property laws.
The shares to be sold by the selling stockholders were originally issued and sold by us to such stockholders pursuant to exemptions from registration requirements in reliance upon Section 4(1) of the Securities Act or Regulation D thereunder, or Rule 701 promulgated under Section 3(b). The shares issued and sold in reliance upon Section 4(1) or Regulation D were issued and sold in private placement transactions of our common stock as well as our former Series A, B, C, D and E preferred stock at various times from November 2000 to January 2008. The selling stockholders in each of these transactions were accredited investors. The shares issued and sold in reliance upon Rule 701 were issued and sold pursuant to the exercise of options to purchase our common stock granted under benefit plans relating to compensation as provided under Rule 701. Each of the selling stockholders represented their intentions at the time to acquire the securities for investment only and not with a view to or sale in connection with any distribution thereof and had adequate access to information about us.
Applicable percentage ownership is based on 25,404,595 shares of common stock outstanding on March 14, 2011. For purposes of the table below, we have assumed that 26,357,487 shares of common stock will be outstanding upon completion of this offering. The percentage ownership information assumes no exercise of the underwriters’ over-allotment option from the selling stockholders unless otherwise noted. In computing the number of shares of common stock beneficially owned by a person and the percentage ownership of that person, we deemed outstanding shares of common stock subject to options and warrants held by that person that are currently exercisable or exercisable within 60 days of March 14, 2011. We did not deem these shares outstanding, however, for the purpose of computing the percentage ownership of any other person.
100
Table of Contents
| Number of Shares Offered |
Beneficial Ownership of Shares After the Offering |
|||||||||||||||||||||||||||||||
| Beneficial Ownership of Shares Before Offering |
Without Over- Allotment Exercise |
With Over- Allotment Exercise |
Without Over- Allotment Exercise |
With Over- Allotment Exercise |
||||||||||||||||||||||||||||
| Name and Address of Beneficial Owner |
Number | Percent | Number | Percent | Number | Percent | ||||||||||||||||||||||||||
| 5% Stockholders: |
||||||||||||||||||||||||||||||||
| Entities affiliated with Walden International(1) |
3,507,458 | 13.8 | % | 332,350 | (2) | 391,000 | (3) | 3,175,108 | 12.0 | % | 3,116,458 | 11.8 | % | |||||||||||||||||||
| Entities affiliated with Tallwood I, L.P.(4) |
3,356,687 | 13.2 | 816,000 | (5) | 960,000 | (6) | 2,540,687 | 9.6 | 2,396,687 | 9.1 | ||||||||||||||||||||||
| Entities affiliated with Mayfield Fund(7) |
3,134,420 | 12.3 | 297,500 | (8) | 350,000 | (9) | 2,836,920 | 10.8 | 2,784,420 | 10.6 | ||||||||||||||||||||||
| Named Executive Officers and Directors: |
||||||||||||||||||||||||||||||||
| Young K. Sohn(10) |
1,349,274 | 5.1 | 328,063 | (11) | 328,063 | (11) | 1,021,211 | 3.7 | 1,021,211 | 3.7 | ||||||||||||||||||||||
| John Edmunds(12) |
238,934 | * | — | — | 238,934 | * | 238,934 | * | ||||||||||||||||||||||||
| Gopal Raghavan(13) |
756,901 | 2.9 | 227,040 | 227,040 | 529,861 | 2.0 | 529,861 | 2.0 | ||||||||||||||||||||||||
| Ron Torten(14) |
238,162 | * | 49,000 | 49,000 | 189,162 | * | 189,162 | * | ||||||||||||||||||||||||
| Diosdado P. Banatao(4) |
3,356,687 | 13.2 | 816,000 | (5) | 960,000 | (6) | 2,540,687 | 9.6 | 2,396,687 | 9.1 | ||||||||||||||||||||||
| Chenming Hu(15) |
17,142 | * | — | — | 17,142 | * | 17,142 | * | ||||||||||||||||||||||||
| David J. Ladd(16) |
8,879 | * | — | — | 8,879 | * | 8,879 | * | ||||||||||||||||||||||||
| Timothy D. Semones(17) |
229,101 | * | 60,000 | 60,000 | 169,101 | * | 169,101 | * | ||||||||||||||||||||||||
| Sam S. Srinivasan(18) |
102,025 | * | 26,615 | 31,312 | 75,410 | * | 70,713 | * | ||||||||||||||||||||||||
| Peter J. Simone(19) |
17,142 | * | — | — | 17,142 | * | 17,142 | * | ||||||||||||||||||||||||
| Lip-Bu Tan(1) |
3,507,458 | 13.8 | 332,350 | (2) | 391,000 | (3) | 3,175,108 | 12.0 | 3,116,458 | 11.8 | ||||||||||||||||||||||
| All executive officers and directors as a group (10 persons)(20) |
9,064,804 | 35.7 | 1,612,021 | 1,819,375 | 7,452,776 | 28.3 | 7,245,429 | 27.5 | ||||||||||||||||||||||||
| Selling stockholders: |
||||||||||||||||||||||||||||||||
| Adam Sohn |
42,857 | * | 12,857 | 12,857 | 30,000 | * | 30,000 | * | ||||||||||||||||||||||||
| Asian Venture Capital Investment Corporation (21) |
59,210 | * | 5,611 | 6,601 | 53,599 | * | 52,609 | * | ||||||||||||||||||||||||
| Banatao Children’s Trust u/a DTD 7/21/1999 (22) |
816,802 | 3.2 | 255,000 | 300,000 | 561,802 | 2.1 | 516,802 | 2.0 | ||||||||||||||||||||||||
| Dali, Hook Partners, L.P. (23) |
711,132 | 2.8 | 181,339 | 213,340 | 529,793 | 2.0 | 497,792 | 1.9 | ||||||||||||||||||||||||
| Donna Young (24) |
26,643 | * | 4,250 | 5,000 | 22,393 | * | 21,643 | * | ||||||||||||||||||||||||
| Erik Sohn |
42,857 | * | 12,857 | 12,857 | 30,000 | * | 30,000 | * | ||||||||||||||||||||||||
| George Pavlov (25) |
96,348 | * | 29,750 | 35,000 | 66,598 | * | 61,348 | * | ||||||||||||||||||||||||
| International Venture Capital Investment Corporation (26) |
59,210 | * | 5,611 | 6,601 | 53,599 | * | 52,609 | * | ||||||||||||||||||||||||
| International Venture Capital Investment III Corp (27) |
59,210 | * | 5,611 | 6,601 | 53,599 | * | 52,609 | * | ||||||||||||||||||||||||
| KTB Investment & Securities Co., Ltd. (28) |
317,325 | 1.3 | 269,726 | 317,325 | 47,599 | * | — | — | ||||||||||||||||||||||||
| Margaret Sohn |
42,857 | * | 12,857 | 12,857 | 30,000 | * | 30,000 | * | ||||||||||||||||||||||||
| Mayfield Associates Fund VI (29) |
56,418 | * | 5,355 | 6,300 | 51,063 | * | 50,118 | * | ||||||||||||||||||||||||
| Mayfield Principals Fund II (30) |
194,333 | * | 18,445 | 21,700 | 175,888 | * | 172,633 | * | ||||||||||||||||||||||||
| Mayfield XI Qualified (31) |
2,714,412 | 10.7 | 257,635 | 303,100 | 2,456,777 | 9.3 | 2,411,312 | 9.2 | ||||||||||||||||||||||||
| Mayfield XI (32) |
169,257 | * | 16,065 | 18,900 | 153,192 | * | 150,357 | * | ||||||||||||||||||||||||
| Pacven Walden Ventures Parallel V-A C.V. (33) |
52,423 | * | 4,967 | 5,844 | 47,456 | * | 46,579 | * | ||||||||||||||||||||||||
| Pacven Walden Ventures Parallel V-B C.V. (34) |
52,423 | * | 4,967 | 5,844 | 47,456 | * | 46,579 | * | ||||||||||||||||||||||||
| Pacven Walden Ventures Parallel VI L.P. (35) |
62,642 | * | 5,936 | 6,983 | 56,706 | * | 55,659 | * | ||||||||||||||||||||||||
| Pacven Walden Ventures V Associates Fund L.P. (36) |
5,576 | * | 528 | 621 | 5,048 | * | 4,955 | * | ||||||||||||||||||||||||
| Pacven Walden Ventures V L.P. (37) |
2,274,888 | 9.0 | 215,557 | 253,597 | 2,059,331 | 7.8 | 2,021,292 | 7.7 | ||||||||||||||||||||||||
| Pacven Walden Ventures VI L.P. (38) |
804,499 | 3.2 | 76,231 | 89,683 | 728,268 | 2.8 | 714,816 | 2.7 | ||||||||||||||||||||||||
| Pacven Walden Ventures V-QP Associates Fund, L.P. (39) |
36,672 | * | 3,475 | 4,088 | 33,197 | * | 32,584 | * | ||||||||||||||||||||||||
101
Table of Contents
| Number of Shares Offered |
Beneficial Ownership of Shares After the Offering |
|||||||||||||||||||||||||||||||
| Beneficial Ownership of Shares Before Offering |
Without Over- Allotment Exercise |
With Over- Allotment Exercise |
Without Over- Allotment Exercise |
With Over- Allotment Exercise |
||||||||||||||||||||||||||||
| Name and Address of Beneficial Owner |
Number | Percent | Number | Percent | Number | Percent | ||||||||||||||||||||||||||
| Seed Ventures III Pte Ltd. (40) |
40,705 | * | 3,856 | 4,537 | 36,849 | * | 36,168 | * | ||||||||||||||||||||||||
| Tallwood Partners, LLC (41) |
1,497,536 | 5.9 | 561,000 | 660,000 | 936,536 | 3.6 | 837,536 | 3.2 | ||||||||||||||||||||||||
| Tech Ventures II L.P. (42) |
288,491 | 1.1 | 68,000 | 80,000 | 220,491 | * | 208,491 | * | ||||||||||||||||||||||||
| TVP II LLC (43) |
399,120 | 1.6 | 339,252 | 399,120 | 59,868 | * | — | — | ||||||||||||||||||||||||
| All Other Selling Stockholders (44) |
3,820,096 | * | (44) | 773,089 | 805,140 | 3,047,007 | * | (44) | 3,014,956 | * | (44) | |||||||||||||||||||||
| * | Represents beneficial ownership of less than 1%. |
| (1) | Based on the Forms 4 filed on November 16, 2010, represents 59,210 shares held by Asian Venture Capital Investment Corporation, or AVCIC, 59,210 shares held by International Venture Capital Investment Corporation, or IVCIC, 59,210 shares held by International Venture Capital Investment III Corp., or IVCIC III, 52,423 shares held by Pacven Walden Ventures Parallel V-A C.V., 52,423 shares held by Pacven Walden Ventures Parallel V-B. C.V., 62,642 shares held by Pacven Walden Ventures Parallel VI, L.P., 5,576 shares held by Pacven Walden Ventures V Associates Fund, L.P., 2,274,888 shares held by Pacven Walden Ventures V, L.P., 804,499 shares held by Pacven Walden Ventures VI, L.P., 36,672 shares held by Pacven Walden Ventures V-QP Associates Fund, L.P. and 40,705 shares held by Seed Ventures III Ptd Ltd. Lip-Bu Tan, one of our directors, is the sole director of Pacven Walden Management V Co. Ltd,. which is the general partner of Pacven Walden Ventures V, L.P., Pacven Walden Ventures Parallel V-A C.V., Pacven Walden Ventures Parallel V-B C.V., Pacven Walden Ventures V Associates Fund, L.P. and Pacven Walden Ventures V-QP Associates Fund, L.P., or Pacven V and affiliated funds. He is also the sole director of Pacven Walden Management VI Co. Ltd., which is the general partner of Pacven Walden Ventures VI, L.P. and Pacven Walden Ventures Parallel VI, L.P., or Pacven VI and Parallel Funds. Mr. Tan is also the President of each of AVCIC, IVCIC and IVCIC III. The voting and investment power over the shares held by AVCIC is determined by a majority of its six directors, You-Lin Lu, Allen Kao, Allen Hsu, Wee Ee Cheong, George Lee and Mr. Tan, all of whom disclaim beneficial ownership of shares held by AVCIC except to the extent of any pecuniary interest therein. The voting and investment power over the shares held by IVCIC is determined by a majority of its 13 directors, You-Lin Lu, Allen Hsu, C. C. Kuo, Allen Kao, Yaw Nan Lu, James Tseng, Wen-Ching Tseng, Yu-Hwei Huang, F. C. Sun, Hock Voon Loo, Wee Ee Cheong, Lorin Young and Mr. Tan, all of whom disclaim beneficial ownership of shares held by IVCIC except to the extent of any pecuniary interest therein. The voting and investment power over the shares held by IVCIC III is determined by a majority of its four directors, James Tseng, Yaw Nan Lu, Julian Yu and Mr. Tan, all of whom disclaim beneficial ownership of shares held by IVCIC III except to the extent of any pecuniary interest therein. Mr. Tan, Mary Coleman, Brian Chiang, Hock Voon Loo and Andrew Kau hold shared voting and investment power with respect to the shares held by Pacven V and affiliated funds and Pacven VI and Parallel Funds, all of whom disclaim beneficial ownership of these shares except to the extent of any pecuniary interest therein. The address for Walden International is One California Street, Suite 2800, San Francisco, CA 94111. |
| (2) | Consists of 5,611 shares to be sold by AVCIC, 5,611 shares to be sold by IVCIC, 5,611 shares to be sold by IVCIC III, 4,967 shares to be sold by Pacven Walden Ventures Parallel V-A C.V., 4,967 shares to be sold by Pacven Walden Ventures Parallel V-B C.V., 5,936 shares to be sold by Pacven Walden Ventures Parallel VI L.P., 528 shares to be sold by Pacven Walden Ventures V Associates Fund L.P., 215,557 shares to be sold by Pacven Walden Ventures V L.P., 76,231 shares to be sold by Pacven Walden Ventures VI L.P., 3,475 shares to be sold by Pacven Walden Ventures V-QP Associates Fund L.P., and 3,856 shares to be sold by Seed Ventures III Ptd Ltd. |
| (3) | Consists of up to an additional 990 shares to be sold by AVCIC, 990 shares to be sold by IVCIC, 990 shares to be sold by IVCIC III, 877 shares to be sold by Pacven Walden Ventures Parallel V-A C.V., 877 shares to be sold by Pacven Walden Ventures Parallel V-B C.V., 1,047 shares to be sold by Pacven Walden Ventures Parallel VI L.P., 93 shares to be sold by Pacven Walden Ventures V Associates Fund L.P., 38,040 shares to be sold by Pacven Walden Ventures V L.P., 13,452 shares to be sold by Pacven Walden Ventures VI L.P., 613 shares to be sold by Pacven Walden Ventures V-QP Associates Fund L.P., and 681 shares to be sold by Seed Ventures III Ptd Ltd. if the underwriters exercise their over-allotment option. |
| (4) | Based on the Form 4 filed by Tallwood I, L.P. on March 4, 2011, consists of 3,458,090 shares held by Tallwood I, L.P., 243,384 shares held by the Banatao Living Trust DTD 7/21/99, 25,909 shares held by Tallwood Management Co., LLC, 1,497,536 shares held by Tallwood Partners, LLC, 816,802 shares held by the Banatao Children’s Trust and 7,317 shares held by the Banatao Heritage Trust U/A DTD 5/7/01. Diosdado Banatao, one of our directors, is the managing member of Tallwood Management Co. LLC, which is the general partner of Tallwood I, L.P. The Banatao Living Trust directly or indirectly holds 100% of the membership interests in Tallwood Management Co. LLC and Tallwood Partners, LLC. Mr. and Mrs. Banatao, as trustees of the Banatao Living Trust, hold shared voting and dispositive power over the securities held by |
102
Table of Contents
| these funds. Mr. Banatao, as trustee of the Banatao Living Trust, Banatao Children’s Trust and the Banatao Heritage Trust U/A DTD 5/7/01, holds shared voting and dispositive power of the securities held by these trusts. Mr. and Mrs. Banatao disclaim beneficial ownership of the reported securities except to the extent of any pecuniary interest therein. The principal business address of Tallwood I, L.P., Tallwood Management Co. LLC and Tallwood Partners, LLC is 400 Hamilton Avenue, Suite 230, Palo Alto, CA 94301. |
| (5) | Consists of 561,000 shares to be sold by Tallwood Partners, LLC and 255,000 shares to be sold by the Banatao Children’s Trust. |
| (6) | Consists of up to an additional 99,000 shares to be sold by Tallwood Partners, LLC and 45,000 shares to be sold by the Banatao Children’s Trust if the underwriters exercise their over-allotment option. |
| (7) | Based on the Schedule 13G filed Mayfield XI Management, LLC on February 9, 2011, represents 56,418 shares held by Mayfield Associates Fund VI, a Delaware limited partnership, or MF AF VI, 194,333 shares held by Mayfield Principals Fund II, a Delaware limited liability company, or MF PF II, 169,257 shares held by Mayfield XI, a Delaware limited partnership, or MF XI, and 2,714,412 shares held by Mayfield XI Qualified, a Delaware limited partnership, or MF XI Q. Yogen K. Dalal, Janice M. Roberts and Robert T. Vasan are managing directors of Mayfield XI Management, L.L.C., which is the general partner of MF XI Q, MF XI and MF AF VI and the sole Managing Director of MF PF II. The individuals listed herein may be deemed to have voting and dispositive power over the shares which are, or may be, deemed to be beneficially owned by MF XI Q, MF PF II, MF XI and MF AF VI, but disclaim such beneficial ownership except to the extent of his or her pecuniary interest therein. The address of the entities affiliated with Mayfield Fund is 2800 Sand Hill Road, Suite 250, Menlo Park, CA 94025. |
| (8) | Consists of 5,355 shares to be sold by MF AF VI, 18,445 shares to be sold by MF PF II, 257,635 shares to be sold by MF XI Q and 16,065 shares to be sold by MF XI. |
| (9) | Consists of up to an additional 945 shares to be sold by MF AF VI, 3,255 shares to be sold by MF PF II, 45,465 shares to be sold by MF XI Q and 2,835 shares to be sold by MF XI if the underwriters exercise their over-allotment option. |
| (10) | Includes 995,275 shares subject to options that are immediately exercisable, of which 190,776 shares are subject to our right of repurchase as of May 13, 2011, and 14,090 restricted shares are subject to our right of repurchase as of May 13, 2011. Also includes 42,857 shares held by each of Mr. Sohn’s three children. |
| (11) | Includes 12,857 shares to be sold by each of Mr. Sohn’s three children. |
| (12) | Includes 238,934 shares subject to options that are immediately exercisable, of which 90,068 shares are subject to our right of repurchase as of May 13, 2011. |
| (13) | Includes 412,855 shares subject to options that are immediately exercisable, none of which are subject to our right of repurchase as of May 13, 2011. |
| (14) | Includes 196,592 shares subject to options that are immediately exercisable, of which 63,908 shares are subject to our right of repurchase as of May 13, 2011. |
| (15) | Consists of 17,142 restricted shares that are subject to forfeiture as of May 13, 2011. |
| (16) | Consists of 8,879 shares subject to restricted stock units, all of which are unvested as of May 13, 2011. |
| (17) | Includes 152,911 shares subject to options that are immediately exercisable, of which 5,000 shares are subject to our right of repurchase as of May 13, 2011. |
| (18) | Includes 44,999 shares subject to options that are immediately exercisable, of which 7,501 shares are subject to our right of repurchase as of May 13, 2011. |
| (19) | Includes 12,856 restricted shares that are subject to forfeiture as of May 13, 2011. |
| (20) | Includes 1,628,711 shares subject to options that are immediately exercisable, of which 357,253 shares are subject to our right of repurchase as of May 13, 2011, and 14,090 outstanding restricted shares that are subject to our right of repurchase as of May 13, 2011 and 38,877 outstanding restricted shares or units that are subject to forfeiture as of May 13, 2011. |
| (21) | Mr. Tan is the President of AVCIC. The voting and investment power over the shares held by AVCIC is determined by a majority of its six directors, You-Lin Lu, Allen Kao, Allen Hsu, Wee Ee Cheong, George Lee and Mr. Tan, all of whom disclaim beneficial ownership of shares held by AVCIC except to the extent of any pecuniary interest therein. The address for AVCIC, c/o Walden International, is One California Street, Suite 2800, San Francisco, CA 94111. See also footnotes 1, 2 and 3. |
| (22) | Mr. Banatao, as trustee of the Banatao Children’s Trust, holds shared voting and dispositive power of the securities held by this trust. Mr. Banatao disclaims beneficial ownership of the reported securities except to the extent of any pecuniary interest therein. The principal business address of Mr. Banatao is 400 Hamilton Avenue, Suite 230, Palo Alto, CA 94301. See also footnotes 4, 5 and 6. |
| (23) | Paul Dali holds shared voting and dispositive power over the shares held by Dali, Hook Partners, L.P. Mr. Dali disclaims beneficial ownership of the shares held by Dali, Hook Partners, L.P. except to the extent of any pecuniary interest therein. The principal business address of Dali, Hook Partners, L.P. is 830 Menlo Ave, #105, Menlo Park, CA 94025. |
103
Table of Contents
| (24) | Includes 14,392 shares held by The Young Trust dated July 27, 1993. Mr. and Mrs. Young, as trustees of The Young Trust dated July 27, 1993, hold shared voting and dispositive power of the securities held by the trust. |
| (25) | Includes 7,195 shares held by Fallen Oak Partners L.P. Mr. Pavlov holds voting and dispositive power over the shares held by Fallen Oak Partners L.P. and disclaims beneficial ownership of such shares except to the extent of any pecuniary interest therein. The principal business address for Fallen Oak Partners L.P. is 400 Hamilton Avenue, Suite 230, Palo Alto, CA 94301. |
| (26) | Mr. Tan is the President of IVCIC. The voting and investment power over the shares held by IVCIC is determined by a majority of its 13 directors, You-Lin Lu, Allen Hsu, C. C. Kuo, Allen Kao, Yaw Nan Lu, James Tseng, Wen-Ching Tseng, Yu-Hwei Huang, F. C. Sun, Hock Voon Loo, Wee Ee Cheong, Lorin Young and Mr. Tan, all of whom disclaim beneficial ownership of shares held by IVCIC except to the extent of any pecuniary interest therein. The address for IVCIC, c/o Walden International, is One California Street, Suite 2800, San Francisco, CA 94111. See also footnotes 1, 2 and 3. |
| (27) | Mr. Tan is the President of IVCIC III. The voting and investment power over the shares held by IVCIC III is determined by a majority of its four directors, James Tseng, Yaw Nan Lu, Julian Yu and Mr. Tan, all of whom disclaim beneficial ownership of shares held by IVCIC III except to the extent of any pecuniary interest therein. The address for IVCIC III, c/o Walden International, is One California Street, Suite 2800, San Francisco, CA 94111. |
| (28) | Won Ju holds voting and dispositive power over the shares held by KTB Investment & Securities Co., Ltd. Mr. Ju disclaims beneficial ownership of shares held by KTB Investment & Securities Co., Ltd. except to the extent of any pecuniary interest therein. The principal business address of KTB Investment & Securities Co., Ltd. is 9Fl Hana Securities Bldg, 23-3, Yoido-dong, Youngdeungpo-gu, Seoul 150-709, Korea. |
| (29) | Yogen K. Dalal, Janice M. Roberts and Robert T. Vasan are managing directors of Mayfield XI Management, L.L.C., which is the general partner of MF AF VI. The individuals listed herein may be deemed to have voting and dispositive power over the shares which are, or may be, deemed to be beneficially owned by MF AF VI, but disclaim such beneficial ownership except to the extent of his or her pecuniary interest therein. The address of the entities affiliated with Mayfield Fund is 2800 Sand Hill Road, Suite 250, Menlo Park, CA 94025. See also footnotes 7, 8 and 9. |
| (30) | Yogen K. Dalal, Janice M. Roberts and Robert T. Vasan are managing directors of Mayfield XI Management, L.L.C., which is the sole Managing Director of MF PF II. The individuals listed herein may be deemed to have voting and dispositive power over the shares which are, or may be, deemed to be beneficially owned by MF PF II, but disclaim such beneficial ownership except to the extent of his or her pecuniary interest therein. The address of the entities affiliated with Mayfield Fund is 2800 Sand Hill Road, Suite 250, Menlo Park, CA 94025. See also footnotes 7, 8 and 9. |
| (31) | Yogen K. Dalal, Janice M. Roberts and Robert T. Vasan are managing directors of Mayfield XI Management, L.L.C., which is the general partner of MF XI Q. The individuals listed herein may be deemed to have voting and dispositive power over the shares which are, or may be, deemed to be beneficially owned by MF XI Q, but disclaim such beneficial ownership except to the extent of his or her pecuniary interest therein. The address of the entities affiliated with Mayfield Fund is 2800 Sand Hill Road, Suite 250, Menlo Park, CA 94025. See also footnotes 7, 8 and 9. |
| (32) | Yogen K. Dalal, Janice M. Roberts and Robert T. Vasan are managing directors of Mayfield XI Management, L.L.C., which is the general partner of MF XI. The individuals listed herein may be deemed to have voting and dispositive power over the shares which are, or may be, deemed to be beneficially owned by MF XI, but disclaim such beneficial ownership except to the extent of his or her pecuniary interest therein. The address of the entities affiliated with Mayfield Fund is 2800 Sand Hill Road, Suite 250, Menlo Park, CA 94025. See also footnotes 7, 8 and 9. |
| (33) | Mr. Tan is the sole director of Pacven Walden Management V Co. Ltd., which is the general partner of Pacven Walden Ventures Parallel V-A C.V. Mr. Tan, Mary Coleman, Brian Chiang, Hock Voon Loo and Andrew Kau hold shared voting and investment power with respect to the shares held by this fund, all of whom disclaim beneficial ownership of these shares except to the extent of any pecuniary interest therein. The address for Walden International is One California Street, Suite 2800, San Francisco, CA 94111. See also footnotes 1, 2 and 3. |
| (34) | Mr. Tan is the sole director of Pacven Walden Management V Co. Ltd., which is the general partner of Pacven Walden Ventures Parallel V-B C.V. Mr. Tan, Mary Coleman, Brian Chiang, Hock Voon Loo and Andrew Kau hold shared voting and investment power with respect to the shares held by this fund, all of whom disclaim beneficial ownership of these shares except to the extent of any pecuniary interest therein. The address for Walden International is One California Street, Suite 2800, San Francisco, CA 94111. See also footnotes 1, 2 and 3. |
| (35) | Mr. Tan is the sole director of Pacven Walden Management VI Co. Ltd., which is the general partner of Pacven Walden Ventures Parallel VI, L.P. Mr. Tan, Mary Coleman, Brian Chiang, Hock Voon Loo and Andrew Kau hold shared voting and investment power with respect to the shares held by this fund, all of whom disclaim beneficial ownership of these shares except to the extent of any pecuniary interest therein. The address for Walden International is One California Street, Suite 2800, San Francisco, CA 94111. See also footnotes 1, 2 and 3. |
| (36) | Mr. Tan is the sole director of Pacven Walden Management V Co. Ltd., which is the general partner of Pacven Walden Ventures V Associates Fund, L.P. Mr. Tan, Mary Coleman, Brian Chiang, Hock Voon Loo and Andrew Kau hold shared voting and investment power with respect to the shares held by this fund, all of whom disclaim beneficial ownership of |
104
Table of Contents
| these shares except to the extent of any pecuniary interest therein. The address for Walden International is One California Street, Suite 2800, San Francisco, CA 94111. See also footnotes 1, 2 and 3. |
| (37) | Mr. Tan is the sole director of Pacven Walden Management V Co. Ltd., which is the general partner of Pacven Walden Ventures V, L.P., Pacven Walden Ventures Parallel V-A C.V., Pacven Walden Ventures Parallel V-B C.V., Pacven Walden Ventures V Associates Fund, L.P. and Pacven Walden Ventures V-QP Associates Fund, L.P., or Pacven V and affiliated funds. He is also the sole director of Pacven Walden management VI Co. Ltd., which is the general partners of Pacven Walden Ventures VI, L.P. and Pacven Walden Ventures Parallel VI, L.P., or Pacven VI and Parallel Funds. See also footnotes 1, 2 and 3. |
| (38) | Mr. Tan is the sole director of Pacven Walden Management VI Co. Ltd., which is the general partner of Pacven Walden Ventures VI, L.P. Mr. Tan, Mary Coleman, Brian Chiang, Hock Voon Loo and Andrew Kau hold shared voting and investment power with respect to the shares held by this fund, all of whom disclaim beneficial ownership of these shares except to the extent of any pecuniary interest therein. The address for Walden International is One California Street, Suite 2800, San Francisco, CA 94111. See also footnotes 1, 2 and 3. |
| (39) | Mr. Tan is the sole director of Pacven Walden Management V Co. Ltd., which is the general partner of Pacven Walden Ventures V-QP Associates Fund, L.P. Mr. Tan, Mary Coleman, Brian Chiang, Hock Voon Loo and Andrew Kau hold shared voting and investment power with respect to the shares held by this fund, all of whom disclaim beneficial ownership of these shares except to the extent of any pecuniary interest therein. The address for Walden International is One California Street, Suite 2800, San Francisco, CA 94111. See also footnotes 1, 2 and 3. |
| (40) | Hock Voon Loo holds voting and dispositive power over the shares held by Seed Ventures III Pte. Ltd. and disclaims beneficial ownership of such shares except to the extent of any pecuniary interest therein. The principal business address of Seed Ventures III Pte. Ltd. is One California Street, 28th Floor, San Francisco, CA 94111. See also footnotes 1, 2 and 3. |
| (41) | The Banatao Living Trust directly or indirectly holds 100% of the membership interests in Tallwood Partners, LLC. Mr. and Mrs. Banatao, as trustees of the Banatao Living Trust, hold shared voting and dispositive power over the securities held by this fund. Mr. and Mrs. Banatao disclaim beneficial ownership of the reported securities except to the extent of any pecuniary interest therein. The principal business address of Tallwood Partners, LLC. is 400 Hamilton Avenue, Suite 230, Palo Alto, CA 94301. See also footnotes 4, 5 and 6. |
| (42) | Alfredo R. de Borja, Edwin J. Lau, Guillermo D. Luchangco, Lawrence C. Qua and William M. Valtos, Jr. hold shared voting and dispositive power over the shares held by Tech Ventures II L.P. Messrs. de Borja, Lau, Luchangco, Qua and Valtos, Jr. disclaim beneficial ownership of the shares held by Tech Ventures II L.P. except to the extent of any pecuniary interest therein. The principal business address of Tech Venture Partners, Ltd. is 17F Robinsons Summit Center, 6783 Ayala Avenue, 1226 Makati City, Philippines. |
| (43) | Cadence Design Systems, Inc., as the sole member of TVP II LLC, holds voting and dispositive power over the shares held by TVP II LLC. The principal business address of TVP II LLC is 2655 Seely Avenue, Bldg. 5, San Jose, CA 95134. |
| (44) | Represents shares held by 86 selling stockholders not listed above, each of whom owned less than 1% of the outstanding shares of common stock prior to this offering and none of whom is a director, executive officer, or an affiliate of a director or executive officer. Of these selling stockholders, 62 are current or former (within the past three years) employees of Inphi. Beneficially owned shares include 2,168,632 shares subject to options that are immediately exercisable, of which 839,210 shares are subject to our right of repurchase as of May 13, 2011, and 173,810 shares subject to options that are exercisable as of May 13, 2011. |
105
Table of Contents
General
The following is a summary of our capital stock and provisions of our restated certificate of incorporation and bylaws. You should also refer to the copies of our restated certificate of incorporation and bylaws that have been or will be filed with the SEC, and to the provisions of Delaware law. Our authorized capital stock consists of 500,000,000 shares of common stock, par value $0.001 per share, and 10,000,000 shares of undesignated preferred stock, par value $0.001 per share.
Common Stock
As of December 31, 2010, there were 25,088,122 shares of common stock outstanding held by approximately 183 stockholders of record.
Each holder of common stock is entitled to one vote for each share of common stock held on all matters submitted to a vote of stockholders and are not entitled to cumulative voting in the election of directors by our certificate of incorporation. This means that the holders of a majority of the voting shares will be able to elect all of the directors then standing for election. Subject to preferences that may apply to shares of preferred stock outstanding at the time, the holders of outstanding shares of our common stock will be entitled to receive dividends out of assets legally available at the times and in the amounts that our board of directors may determine from time to time. See "Dividend Policy." Upon our liquidation, dissolution or winding-up, the holders of common stock would be entitled to share ratably in all assets remaining after payment of all liabilities and the liquidation preferences of any outstanding preferred stock. Holders of common stock have no preemptive or conversion rights or other subscription rights. There will be no redemption or sinking fund provisions applicable to the common stock. All currently outstanding shares of common stock are fully paid and nonassessable, and the shares of common stock to be issued in this offering, when paid for, will also be fully paid and nonassessable.
Preferred Stock
Our certificate of incorporation authorizes our board of directors, subject to limitations imposed by Delaware law, to issue from time to time up to 10,000,000 shares of preferred stock in one or more series, without stockholder approval. Our board of directors is authorized to establish from time to time the number of shares to be included in each series, and to fix the rights, preferences and privileges of the shares of each wholly unissued series and any of its qualifications, limitations or restrictions. Our board of directors is also be able to increase or decrease the number of shares of any series, but not below the number of shares of that series then outstanding, without any further vote or action by the stockholders.
Our board of directors may authorize the issuance of preferred stock with voting or conversion rights that could dilute the voting power or alter other rights of the holders of our common stock, or that could decrease the amount of earnings and assets available for distribution to holders of our common stock. The issuance of preferred stock, while providing flexibility in connection with possible acquisitions and other corporate purposes, could, among other things, have the effect of delaying, deferring or preventing a change in control of us and might harm the market price of our common stock and the voting and other rights of the holders of common stock. We have no current plans to issue any shares of preferred stock after the completion of this offering.
Warrants
As of December 31, 2010, there were warrants outstanding exercisable for an aggregate of 40,713 shares of common stock, at a weighted average exercise price of $1.64 per share.
106
Table of Contents
Registration Rights
The holders of 14,851,170 shares of common stock, including shares to be issued upon the exercise of warrants to purchase shares of our capital stock, are entitled to contractual rights by which they may require us to register those shares under the Securities Act. All of these shares are subject to a 180-day lock-up period, which expires on May 9, 2011. If we propose to register any of our securities under the Securities Act for our own account, holders of those shares are entitled to include their shares in our registration, provided they accept the terms of the underwriting as agreed upon between us and the underwriters selected by us, and among other conditions, that the underwriters of any such offering have the right to limit the number of shares included in the registration. Subject to limitations and conditions specified in the amended and restated investor rights agreement with the holders, six months after our initial public offering, holders of at least 30% of the shares of common stock issued upon conversion of our former preferred stock upon completion of our initial public offering and shares of common stock that were issued as a result of the exercise of certain warrants may require us to prepare and file a registration statement under the Securities Act at our expense covering those shares, provided that the shares to be included in the registration shall include at least 20% of such shares of common stock and shares issued as a result of the exercise of certain warrants, or a lesser percentage if the anticipated aggregate public offering price would exceed $10,000,000. We are not obligated to effect more than two of these demand registrations.
Anti-Takeover Effects of Delaware Law and Our Certificate of Incorporation and Bylaws
The provisions of Delaware law, our restated certificate of incorporation and our bylaws described below may have the effect of delaying, deferring or discouraging another party from acquiring control of us.
Delaware Law
We are subject to the provisions of Section 203 of the Delaware General Corporation Law regulating corporate takeovers. In general, those provisions prohibit a Delaware corporation from engaging in any business combination with any interested stockholder for a period of three years following the date that the stockholder became an interested stockholder, unless:
| • | the transaction is approved by the board before the date the interested stockholder attained that status; |
| • | upon consummation of the transaction which resulted in the stockholder becoming an interested stockholder, the interested stockholder owned at least 85% of the voting stock of the corporation outstanding at the time the transaction commenced; or |
| • | on or after the date the business combination is approved by our board of directors, the business combination is authorized at a meeting of stockholders, and not by written consent, by at least two-thirds of the outstanding voting stock that is not owned by the interested stockholder. |
In general, Section 203 defines “business combination” to include the following:
| • | any merger or consolidation involving the corporation and the interested stockholder; |
| • | any sale, transfer, pledge or other disposition of 10% or more of the assets of the corporation involving the interested stockholder; |
| • | subject to certain exceptions, any transaction that results in the issuance or transfer by the corporation of any stock of the corporation to the interested stockholder; |
| • | any transaction involving the corporation that has the effect of increasing the proportionate share of the stock of any class or series of the corporation beneficially owned by the interested stockholder; or |
| • | the receipt by the interested stockholder of the benefit of any loans, advances, guarantees, pledges or other financial benefits provided by or through the corporation. |
In general, Section 203 defines an interested stockholder as any entity or person beneficially owning 15% or more of the outstanding voting stock of the corporation and any entity or person affiliated with or controlling or controlled by any such entity or person.
107
Table of Contents
A Delaware corporation may opt out of this provision by express provision in its original certificate of incorporation or by amendment to its certificate of incorporation or bylaws approved by its stockholders. We have not opted out of Section 203. The statute could prohibit or delay mergers or other takeover or change in control attempts and, accordingly, may discourage attempts to acquire us.
Charter and Bylaws
Our certificate of incorporation and bylaws provide that:
| • | no action can be taken by stockholders except at an annual or special meeting of the stockholders called in accordance with our bylaws, and stockholders may not act by written consent; |
| • | the classification of our board of directors so that only a portion of our directors is elected each year, with each director serving a three-year term; |
| • | the approval of holders of two-thirds of the shares entitled to vote at an election of directors will be required to adopt, amend or repeal our bylaws or amend or repeal the provisions of our certificate of incorporation regarding the election and removal of directors and the ability of stockholders to take action by written consent or call a special meeting; |
| • | our board of directors will be expressly authorized to make, alter or repeal our bylaws; |
| • | the Court of Chancery of the State of Delaware will have the sole and exclusive forum for derivative actions, claims of breach of a fiduciary duty, claims asserted under the Delaware General Corporation Law or claims governed by the internal affairs doctrine; |
| • | stockholders may not call special meetings of the stockholders or fill vacancies on the board; |
| • | stockholders must provide notice of nominations of directors or the proposal of business to be voted on at an annual meeting; |
| • | our board of directors will be authorized to issue preferred stock without stockholder approval, as described above; |
| • | directors may only be removed for cause; and |
| • | we will indemnify officers and directors against losses that they may incur in investigations and legal proceedings resulting from their services to us, which may include services in connection with takeover defense measures. |
Limitation of Liability and Indemnification Matters
Our certificate of incorporation limits the liability of our directors for monetary damages for breach of their fiduciary duty as directors, except for liability that cannot be eliminated under the Delaware General Corporation Law. Accordingly, our directors are not personally liable for monetary damages for breach of their fiduciary duty as directors, except for liabilities:
| • | for any breach of the director’s duty of loyalty to us or our stockholders; |
| • | for acts or omissions not in good faith or which involve intentional misconduct or a knowing violation of law; |
| • | for unlawful payments of dividends or unlawful stock repurchases or redemptions, as provided under Section 174 of the Delaware General Corporation Law; or |
| • | for any transaction from which the director derived an improper personal benefit. |
Any amendment or repeal of these provisions will require the approval of the holders of shares representing at least two-thirds of the shares entitled to vote in the election of directors, voting as one class.
108
Table of Contents
Our certificate of incorporation and bylaws also provide that we will indemnify our directors and officers to the fullest extent permitted under Delaware law. Our certificate of incorporation and bylaws also permit us to purchase insurance on behalf of any officer, director, employee or other agent for any liability arising out of his actions as our officer, director, employee or agent, regardless of whether Delaware law would permit indemnification. We have entered into separate indemnification agreements with our directors and executive officers that could require us, among other things, to indemnify them against certain liabilities that may arise by reason of their status or service as directors and to advance their expenses incurred as a result of any proceeding against them as to which they could be indemnified. We believe that the limitation of liability provision in our certificate of incorporation and the indemnification agreements will facilitate our ability to continue to attract and retain qualified individuals to serve as directors and officers.
The New York Stock Exchange Listing Symbol
Our common stock is listed on The New York Stock Exchange under the symbol “IPHI.”
Transfer Agent and Registrar
The transfer agent and registrar for our common stock is American Stock Transfer.
109
Table of Contents
MATERIAL U.S. FEDERAL INCOME AND ESTATE TAX
CONSEQUENCES TO NON-U.S. HOLDERS
The following is a summary of the material U.S. federal income tax and estate tax consequences of the ownership and disposition of our common stock to non-U.S. holders, but does not purport to be a complete analysis of all the potential tax considerations relating thereto. This summary is based upon the provisions of the Internal Revenue Code of 1986, as amended, or the Code, Treasury regulations promulgated thereunder, administrative rulings and judicial decisions, all as of the date hereof. These authorities may be changed, possibly retroactively, so as to result in U.S. federal income tax or estate tax consequences different from those set forth below.
This summary does not address the tax considerations arising under the laws of any U.S. state or local or any non-U.S. jurisdiction or under U.S. federal gift and estate tax laws, except to the limited extent below. In addition, this discussion does not address tax considerations applicable to an investor’s particular circumstances or to investors that may be subject to special tax rules, including, without limitation:
| • | banks, insurance companies or other financial institutions; |
| • | persons subject to the alternative minimum tax; |
| • | tax-exempt organizations; |
| • | dealers in securities or currencies; |
| • | “controlled foreign corporations,” or “passive foreign investment companies,” each as defined for U.S. federal income tax purposes; |
| • | partnerships or entities classified as partnerships for U.S. federal income tax purposes, or any investors in such entities; |
| • | traders in securities that elect to use a mark-to-market method of accounting for their securities holdings; |
| • | persons that own, or are deemed to own, more than five percent of our common stock (except to the extent specifically set forth below); |
| • | certain former citizens or long-term residents of the United States; |
| • | persons who hold our common stock as a position in a hedging transaction, “straddle,” “conversion transaction” or other risk reduction transaction; |
| • | persons who do not hold our common stock as a capital asset within the meaning of Section 1221 of the Code (generally, for investment purposes); or |
| • | persons deemed to sell our common stock under the constructive sale provisions of the Code. |
If a partnership or entity classified as a partnership for U.S. federal income tax purposes holds our common stock, the tax treatment of a partner generally will depend on the status of the partner and upon the activities of the partnership. Accordingly, partnerships that hold our common stock, and partners in such partnerships, should consult their tax advisors.
You are urged to consult your tax advisor with respect to the application of the U.S. federal income tax laws to your particular situation, as well as any tax consequences of the purchase, ownership and disposition of our common stock arising under the U.S. federal estate or gift tax rules or under the laws of any U.S. state or local or any non-U.S. or other taxing jurisdiction or under any applicable tax treaty.
Non-U.S. Holder Defined
For purposes of this discussion, you are a non-U.S. holder if you are any holder (other than a partnership or entity classified as a partnership for U.S. federal income tax purposes) that is not:
| • | an individual citizen or resident of the U.S.; |
110
Table of Contents
| • | a corporation or other entity taxable as a corporation created or organized in the U.S. or under the laws of the United States or any political subdivision thereof; |
| • | an estate whose income is subject to U.S. federal income tax regardless of its source; or |
| • | a trust (x) whose administration is subject to the primary supervision of a U.S. court and which has one or more U.S. persons who have the authority to control all substantial decisions of the trust or (y) which has made an election to be treated as a U.S. person. |
Distributions
If we make distributions on our common stock, those payments will constitute dividends for U.S. tax purposes to the extent paid from our current or accumulated earnings and profits, as determined under U.S. federal income tax principles. To the extent those distributions exceed both our current and our accumulated earnings and profits, they will constitute a return of capital and will first reduce your basis in our common stock, but not below zero, and then will be treated as gain from the sale of stock.
Any dividend paid to you generally will be subject to U.S. withholding tax either at a rate of 30% of the gross amount of the dividend or such lower rate as may be specified by an applicable income tax treaty. In order to receive a reduced treaty rate, you must provide us with an IRS Form W-8BEN or other appropriate version of IRS Form W-8 certifying qualification for the reduced rate.
Dividends received by you that are effectively connected with your conduct of a U.S. trade or business are taxed at the same graduated rates applicable to U.S. persons, net of certain deductions and credits, subject to an applicable income tax treaty providing otherwise. In addition, if you are a corporate non-U.S. holder, dividends you receive that are effectively connected with your conduct of a U.S. trade or business may also be subject to a branch profits tax at a rate of 30% or such lower rate as may be specified by an applicable income tax treaty. Payment of effectively connected dividends that are included in the gross income of a non-U.S. holder generally are exempt from withholding tax. In order to obtain this exemption, you must provide us with an IRS Form W-8ECI or other applicable IRS Form W-8 properly certifying such exemption.
If you are eligible for a reduced rate of withholding tax pursuant to a tax treaty, you may be able to obtain a refund of any excess amounts currently withheld if you timely file an appropriate claim for refund with the Internal Revenue Service, or the IRS.
Gain on Disposition of Common Stock
You generally will not be required to pay U.S. federal income tax on any gain realized upon the sale or other disposition of our common stock unless:
| • | the gain is effectively connected with your conduct of a U.S. trade or business (and, if an income tax treaty applies, the gain is attributable to a permanent establishment maintained by you in the U.S.), in which case you will be required to pay tax on the net gain derived from the sale (net of certain deductions or credits) under regular graduated U.S. federal income tax rates, and for a non-U.S. holder that is a corporation, such non-U.S. holder may be subject to a branch profits tax at a 30% rate or such lower rate as may be specified by an applicable income tax treaty; |
| • | you are an individual who is present in the U.S. for a period or periods aggregating 183 days or more during the calendar year in which the sale or disposition occurs and certain other conditions are met, in which case you will be required to pay a flat 30% tax on the gain derived from the sale, which tax may be offset by U.S. source capital losses (even though you are not considered a resident of the U.S.) subject to applicable income tax or other treaties providing otherwise; or |
| • | our common stock constitutes a U.S. real property interest by reason of our status as a “United States real property holding corporation” for U.S. federal income tax purposes, or a USRPHC, at any time within the shorter of the five-year period preceding the disposition or your holding period for our |
111
Table of Contents
| common stock. We believe that we are not currently and will not become a USRPHC. However, because the determination of whether we are a USRPHC depends on the fair market value of our U.S. real property relative to the fair market value of our other business assets, there can be no assurance that we will not become a USRPHC in the future. Even if we become a USRPHC, however, as long as our common stock is regularly traded on an established securities market, such common stock will be treated as a U.S. real property interest only if you actually or constructively hold more than five percent of such regularly traded common stock at any time during the five year (or shorter) period that is described above. |
Federal Estate Tax
Our common stock held (or treated as held) by an individual non-U.S. holder at the time of death will be included in such holder’s gross estate for U.S. federal estate tax purposes, unless an applicable estate tax treaty provides otherwise, and therefore may be subject to U.S. federal estate tax.
Backup Withholding and Information Reporting
Generally, we must report annually to the IRS the amount of dividends paid to you, your name and address, and the amount of tax withheld, if any. A similar report will be sent to you. Pursuant to applicable income tax treaties or other agreements, the IRS may make these reports available to tax authorities in your country of residence.
Payments of dividends or of proceeds on the disposition of common stock made to you may be subject to additional information reporting and backup withholding at a current rate of 28% unless you establish an exemption, for example by properly certifying your non-U.S. status on a Form W-8BEN or another appropriate version of IRS Form W-8. Notwithstanding the foregoing, backup withholding and information reporting may apply if either we or our paying agent has actual knowledge, or reason to know, that you are a U.S. person.
Backup withholding is not an additional tax; rather, the U.S. income tax liability of persons subject to backup withholding will be reduced by the amount of tax withheld. If withholding results in an overpayment of taxes, a refund or credit may generally be obtained from the IRS, provided that the required information is furnished to the IRS in a timely manner.
Recent Legislative Developments
Recently enacted federal legislation, generally applicable to payments made after December 31, 2012, imposes a 30% U.S. withholding tax on dividends on our common stock and the gross proceeds of a disposition of our common stock paid to (a) a “foreign financial institution” (as specifically defined in this new legislation) unless such institution enters into an agreement with the United States Treasury to collect and disclose information regarding United States account holders of such institution (including certain account holders that are foreign entities with United States owners) and (b) a non-financial foreign entity unless such entity provides the payor with a certification identifying the direct and indirect United States owners of the entity. Under certain circumstances, a non-U.S. holder of our common stock may be eligible for refunds or credits of such taxes. You are encouraged to consult with your own tax advisor regarding the possible implications of this legislation on your investment in our common stock.
The preceding discussion of U.S. federal tax considerations is for general information only. It is not tax advice. Each prospective investor should consult its own tax advisor regarding the particular U.S. federal, state and local and non-U.S. tax consequences of purchasing, holding and disposing of our common stock, including the consequences of any proposed change in applicable laws.
112
Table of Contents
Under the terms and subject to the conditions contained in an underwriting agreement dated the date of this prospectus, the underwriters named below, for whom Morgan Stanley & Co. Incorporated and Deutsche Bank Securities Inc. are acting as representatives, have severally agreed to purchase, and we have agreed to sell to them, severally, the number of shares of common stock indicated below:
| Name |
Number of |
|||
| Morgan Stanley & Co. Incorporated |
||||
| Deutsche Bank Securities Inc. |
||||
| RBC Capital Markets Corp. |
||||
| Stifel, Nicolaus & Company, Incorporated |
||||
| Needham & Company, LLC |
||||
| Oppenheimer & Co. Inc. |
||||
| Total |
3,901,974 | |||
The underwriters are offering the shares of our common stock subject to their acceptance of the shares from us and subject to prior sale. The underwriting agreement provides that the obligations of the several underwriters to pay for and accept delivery of the shares of common stock offered by this prospectus are subject to the approval of certain legal matters by their counsel and to certain other conditions. The underwriters are obligated to take and pay for all of the shares of common stock offered by this prospectus if any such shares are taken. However, the underwriters are not required to take or pay for the shares covered by the underwriters’ over-allotment option described below.
The underwriters initially propose to offer part of the shares of common stock directly to the public at the public offering price listed on the cover page of this prospectus and part to certain dealers at a price that represents a concession not in excess of $ a share under the public offering price. After the initial offering of the shares of common stock, the offering price and other selling terms may from time to time be varied by the representatives.
Certain selling stockholders have granted to the underwriters an option, exercisable for 30 days from the date of this prospectus, to purchase up to an aggregate of 449,366 additional shares of common stock at the public offering price listed on the cover page of this prospectus, less underwriting discounts and commissions. The underwriters may exercise this option solely for the purpose of covering over-allotments, if any, made in connection with the offering of the shares of common stock offered by this prospectus. To the extent that the option is exercised, each underwriter will become obligated, subject to certain conditions, to purchase about the same percentage of the additional shares of common stock as the number listed next to the underwriter’s name in the preceding table bears to the total number of shares of common stock listed next to the names of all underwriters in the preceding table. If the underwriters’ option is exercised in full, the total price to the public would be $ million, the total underwriters’ discounts and commissions would be $ million, and total proceeds to us would be $ million and total proceeds to the selling stockholders would be $ .
The estimated offering expenses payable by us, in addition to the underwriting discounts and commissions, are approximately $ million, which includes legal, accounting and printing costs and various other fees associated with registering and listing our common stock. The underwriters have agreed to reimburse us for certain of these expenses.
The underwriters have informed us that they do not intend sales to discretionary accounts to exceed five percent of the total number of shares of common stock offered by them.
Our common stock is listed on The New York Stock Exchange under the trading symbol “IPHI.”
113
Table of Contents
We and all of our directors and executive officers and all selling stockholders whose shares are being sold pursuant to the exercise of contractual registration rights between us and such selling stockholders have agreed that, without the prior written consent of Morgan Stanley & Co. Incorporated and Deutsche Bank Securities Inc. on behalf of the underwriters, we and they will not, during the period ending 90 days after the date of this prospectus:
| • | offer, pledge, sell, contract to sell, sell any option or contract to purchase, purchase any option or contract to sell, grant any option, right or warrant to purchase, lend or otherwise transfer or dispose of directly or indirectly, any shares of common stock beneficially owned or any other securities so owned convertible into or exercisable or exchangeable for common stock; |
| • | in the case of us, file any registration statement with the SEC relating to the offering of any shares of common stock or any securities convertible into or exercisable or exchangeable for common stock; or |
| • | enter into any swap or other arrangement that transfers to another, in whole or in part, any of the economic consequences of ownership of the common stock, |
whether any such transaction described above is to be settled by delivery of common stock or such other securities, in cash or otherwise. The restrictions described in this paragraph do not apply to:
| • | the sale of shares of common stock to the underwriters; |
| • | the issuance by us of shares of common stock upon the exercise of an option or a warrant or the conversion of a security outstanding on the date of this prospectus of which the underwriters have been advised in writing; |
| • | the filing by us of a registration statement on Form S-8 in respect of any shares issued under or the grant of any award pursuant to our 2000 Stock Option Plan/Stock Issuance Plan and 2010 Stock Incentive Plan; |
| • | our sale or issuance of or entry into an agreement to sell or issue shares of common stock in connection with our acquisition of one or more businesses, products or technologies, in an aggregate number of shares not to exceed 10% of the total number of shares of common stock issued and outstanding immediately following the completion of this offering, provided that each recipient of these shares of common stock shall sign and deliver a copy of the lock-up agreement; |
| • | transactions by a director, officer or stockholder relating to shares of common stock or other securities acquired in open market transactions after the completion of this offering, provided that no filing under Section 16(a) of the Exchange Act shall be required or shall be voluntarily made in connection with subsequent sales of common stock or other securities acquired in such open market transactions; |
| • | in the case of a director, officer or stockholder, transfers of shares of common stock or any securities convertible into or exercisable or exchangeable for common stock (i) by will or intestate succession to the immediate family of the director, officer or other stockholder or to a trust formed for the benefit of an immediate family member or (ii) by bona fide gift; |
| • | in the case of a stockholder which is a corporation, partnership or other business entity, transfers of shares of common stock or any securities convertible into or exercisable or exchangeable for common stock to an affiliate, subsidiary, limited partner, general partner, member or stockholder, as applicable, of the director, officer or other stockholder; |
| • | the transfer of common stock to us by a director, officer or stockholder upon the exercise of options to purchase shares of common stock, including standalone options or options issued pursuant to our 2000 Stock Option Plan/Stock Issuance Plan and 2010 Stock Incentive Plan, to cover tax withholding obligations in connection with such vesting or exercise, provided that no filing under Section 16(a) of the Exchange Act reporting a disposition of shares of common stock shall be required or shall be made voluntarily in connection with the exercise; |
114
Table of Contents
| • | the establishment by a director, officer or stockholder of a trading plan pursuant to Rule 10b5-1 under the Exchange Act for the transfer of shares of common stock, provided that such plan does not provide for the transfer of common stock during the restricted period and no public announcement or filing under the Exchange Act regarding the establishment of such plan shall be required of or voluntarily made by or on behalf of the directors, officers or other stockholders or us during the 90-day restricted period; or |
provided that in the case of any transfer or distribution pursuant to the fifth and sixth bullets above, it shall be a condition of the transfer or distribution that there shall be no disposition for value, each transferee, donee or distributee shall sign and deliver a copy of the lock-up agreement and no filing under Section 16(a) of the Exchange Act reporting a reduction in beneficial ownership of shares of common stock shall be required or shall be made voluntarily during the 90-day restricted period. In addition, one of our directors, one of our executive officers and an affiliate of Tallwood I, L.P., each of whom have pre-existing Rule 10b5-1 plans, may sell shares pursuant to such plans prior to expiration of the 90-day restricted period. As of March 25, 2011, there was an aggregate of approximately 278,595 shares available for sale under such plans.
Without the prior written consent of Morgan Stanley & Co. Incorporated and Deutsche Bank Securities Inc., on behalf of the underwriters, no party to the agreement will be able, during the period ending 90 days after the date of this prospectus, to make any demand for, or exercise any right with respect to, the registration of any shares of common stock or any security convertible into or exercisable or exchangeable for common stock.
The lock-up agreements described above do not contain provisions to extend the 90-day restricted period if we announce material developments, including earnings information. Accordingly, under applicable rules of the Financial Industry Regulatory Authority, research analysts from firms participating in this offering will not be able to provide or update their research reports for the period beginning 15 calendar days before and ending 15 calendar days after the expiration of the 90-day restricted period.
In order to facilitate the offering of the common stock, the underwriters may engage in transactions that stabilize, maintain or otherwise affect the price of the common stock. Specifically, the underwriters may sell more shares than they are obligated to purchase under the underwriting agreement, creating a short position. A short sale is covered if the short position is no greater than the number of shares available for purchase by the underwriters under the over-allotment option. The underwriters can close out a covered short sale by exercising the over-allotment option or purchasing shares in the open market. In determining the source of shares to close out a covered short sale, the underwriters will consider, among other things, the open market price of shares compared to the price available under the over-allotment option. The underwriters may also sell shares in excess of the over-allotment option, creating a naked short position. The underwriters must close out any naked short position by purchasing shares in the open market. A naked short position is more likely to be created if the underwriters are concerned that there may be downward pressure on the price of the common stock in the open market after pricing that could adversely affect investors who purchase in the offering. As an additional means of facilitating the offering, the underwriters may bid for, and purchase, shares of common stock in the open market to stabilize the price of the common stock. The underwriting syndicate also may reclaim selling concessions allowed to an underwriter or a dealer for distributing the common stock in the offering, if the syndicate repurchases previously distributed common stock to cover syndicate short positions or to stabilize the price of the common stock. These activities may raise or maintain the market price of the common stock above independent market levels or prevent or retard a decline in the market price of the common stock. The underwriters are not required to engage in these activities, and may end any of these activities at any time.
We have agreed to indemnify the underwriters against certain liabilities, including liabilities under the Securities Act, and to contribute to payments that the underwriters may be required to make for these liabilities.
The underwriters may in the future provide investment banking services to us for which they would receive customary compensation.
115
Table of Contents
Selling Restrictions
European Economic Area
In relation to each Member State of the European Economic Area which has implemented the Prospectus Directive (each, a “Relevant Member State”) an offer to the public of any shares which are the subject of the offering contemplated by this Prospectus (the “Shares”) may not be made in that Relevant Member State, except that an offer to the public in that Relevant Member State of any Shares may be made at any time under the following exemptions under the Prospectus Directive, if they have been implemented in that Relevant Member State:
| (a) | to any legal entity which is a qualified investor as defined in the Prospectus Directive; |
| (b) | to fewer than 100 or, if the Relevant Member State has implemented the relevant provision of the 2010 PD Amending Directive, 150, natural or legal persons (other than qualified investors as defined in the Prospectus Directive), as permitted under the Prospectus Directive, subject to obtaining the prior consent of Morgan Stanley & Co. Incorporated for any such offer; or |
| (c) | in any other circumstances falling within Article 3(2) of the Prospectus Directive, provided that no such offer of Shares shall result in a requirement for the publication by us or any of the underwriters of a prospectus pursuant to Article 3 of the Prospectus Directive. |
For the purposes of this provision, the expression an “offer to the public” in relation to any Shares in any Relevant Member State means the communication in any form and by any means of sufficient information on the terms of the offer and any Shares to be offered so as to enable an investor to decide to purchase any Shares, as the same may be varied in that Member State by any measure implementing the Prospectus Directive in that Member State, the expression “Prospectus Directive” means Directive 2003/71/EC (and amendments thereto, including the 2010 PD Amending Directive, to the extent implemented in the Relevant Member State), and includes any relevant implementing measure in the Relevant Member State, and the expression “2010 PD Amending Directive” means Directive 2010/73/EU.
United Kingdom
Each underwriters has represented and agreed that:
| (a) | it has only communicated or caused to be communicated and will only communicate or cause to be communicated an invitation or inducement to engage in investment activity (within the meaning of Section 21 of the FSMA) received by it in connection with the issue or sale of the Shares in circumstances in which Section 21(1) of the FSMA does not apply to us; and |
| (b) | it has complied and will comply with all applicable provisions of the FSMA with respect to anything done by it in relation to the Shares in, from or otherwise involving the United Kingdom. |
116
Table of Contents
The validity of the common stock offered by this prospectus will be passed upon for us by Pillsbury Winthrop Shaw Pittman LLP, Palo Alto, California. Davis Polk & Wardwell LLP, Menlo Park, California, is representing the underwriters.
The financial statements of Inphi Corporation as of December 31, 2009 and 2010 and for each of the three years in the period ended December 31, 2010 included in this prospectus have been so included in reliance on the report of PricewaterhouseCoopers LLP, an independent registered public accounting firm, given on the authority of said firm as experts in auditing and accounting.
The financial statements of Winyatek Technology Inc. as of December 31, 2009 and for the year then ended included in this prospectus have been so included in reliance on the report of PricewaterhouseCoopers, Taiwan, an independent registered public accounting firm, given on the authority of said firm as experts in auditing and accounting.
WHERE YOU CAN FIND ADDITIONAL INFORMATION
We electronically file our annual reports on Form 10-K, quarterly reports on Form 10-Q and current reports on Form 8-K pursuant to Section 13(a) or 15(d) of the Securities Exchange Act of 1934, as amended with the SEC. The public may read or copy any materials we file with the SEC at the SEC’s Public Reference Room at 100 F Street, NE, Washington, DC 20549. The public may obtain information on the operation of the Public Reference Room by calling the SEC at 1-800-SEC-0330. The SEC maintains an Internet site that contains reports, proxy and information statements, and other information regarding issuers that file electronically with the SEC. The address of that site is http://www.sec.gov. You may obtain a free copy of our annual reports on Form 10-K, quarterly reports on Form 10-Q and current reports on Form 8-K and amendments to those reports with the SEC on our website.
We have filed with the SEC a registration statement under the Securities Act of 1933 with respect to the common stock offered by this prospectus. This prospectus does not contain all of the information set forth in the registration statement and the exhibits and schedules to the registration statement. Please refer to the registration statement, exhibits and schedules for further information with respect to the common stock offered by this prospectus. Statements contained in this prospectus regarding the contents of any contract or other document are only summaries. With respect to any contract or document filed as an exhibit to the registration statement, you should refer to the exhibit for a copy of the contract or document, and each statement in this prospectus regarding that contract or document is qualified by reference to the exhibit. You may read and obtain a copy of the registration statement and its exhibits and schedules from the SEC, as described in the preceding paragraph.
117
Table of Contents
Index to Consolidated Financial Statements
Inphi Corporation Consolidated Financial Statements:
| Page(s) | ||||
| F-2 | ||||
| F-3 | ||||
| F-4 | ||||
| Consolidated Statements of Convertible Preferred Stock and Stockholders’ Equity (Deficit) |
F-5 | |||
| F-6 | ||||
| F-7 | ||||
Winyatek Technologies Inc. Combined Carve-out Financial Statements:
| F-38 | ||||
| F-39 | ||||
| F-40 | ||||
| F-41 | ||||
| F-42 | ||||
| F-43 |
F-1
Table of Contents
Report of Independent Registered Public Accounting Firm
To the board of directors and stockholders of Inphi Corporation:
In our opinion, the accompanying consolidated balance sheets and the related consolidated statements of operations, of convertible preferred stock and stockholders’ equity (deficit) and of cash flows present fairly, in all material respects, the financial position of Inphi Corporation and its subsidiaries (the “Company”) at December 31, 2010 and 2009, and the results of their operations and their cash flows for each of the three years in the period ended December 31, 2010 in conformity with accounting principles generally accepted in the United States of America. These financial statements are the responsibility of the Company’s management. Our responsibility is to express an opinion on these financial statements based on our audits. We conducted our audits of these statements in accordance with the standards of the Public Company Accounting Oversight Board (United States). Those standards require that we plan and perform the audit to obtain reasonable assurance about whether the financial statements are free of material misstatement. An audit includes examining, on a test basis, evidence supporting the amounts and disclosures in the financial statements, assessing the accounting principles used and significant estimates made by management, and evaluating the overall financial statement presentation. We believe that our audits provide a reasonable basis for our opinion.
/s/ PricewaterhouseCoopers LLP
Los Angeles, California
March 4, 2011
F-2
Table of Contents
Consolidated Balance Sheets
(in thousands, except share and per share amounts)
| December 31, | ||||||||
| 2010 | 2009 | |||||||
| Assets |
||||||||
| Current assets: |
||||||||
| Cash and cash equivalents |
$ | 110,172 | $ | 19,061 | ||||
| Accounts receivable, net |
6,666 | 4,570 | ||||||
| Accounts receivable from related party |
3,386 | 3,411 | ||||||
| Inventories |
5,095 | 3,942 | ||||||
| Deferred tax assets |
1,665 | — | ||||||
| Income tax receivable |
2,214 | — | ||||||
| Prepaid expenses and other current assets |
1,366 | 374 | ||||||
| Total current assets |
130,564 | 31,358 | ||||||
| Property and equipment, net |
7,206 | 3,114 | ||||||
| Goodwill |
5,847 | — | ||||||
| Identifiable intangible assets |
1,624 | — | ||||||
| Deferred tax assets |
6,182 | — | ||||||
| Deferred tax charge |
7,293 | — | ||||||
| Other assets, net |
241 | — | ||||||
| Total assets |
$ | 158,957 | $ | 34,472 | ||||
| Liabilities, Convertible Preferred Stock and Stockholders’ Equity (Deficit) |
||||||||
| Current liabilities: |
||||||||
| Accounts payable |
$ | 6,692 | $ | 4,438 | ||||
| Income tax payable |
— | 444 | ||||||
| Deferred revenue |
2,647 | 3,383 | ||||||
| Accrued employee expenses |
1,749 | 1,274 | ||||||
| Other accrued expenses |
1,843 | 1,248 | ||||||
| Other current liabilities |
746 | 516 | ||||||
| Total current liabilities |
13,677 | 11,303 | ||||||
| Other liabilities |
2,594 | 285 | ||||||
| Total liabilities |
16,271 | 11,588 | ||||||
| Commitments and contingencies (Note 15) |
||||||||
| Convertible Preferred Stock: |
||||||||
| Series A Convertible Preferred Stock, $0.001 par value; 528,858 shares authorized; 518,555 shares issued and outstanding at December 31, 2009 |
— | 12,016 | ||||||
| Series B Redeemable Convertible Preferred Stock, $0.001 par value; 2,926,670 shares authorized; 2,905,783 shares issued and outstanding at December 31, 2009 |
— | 24,985 | ||||||
| Series C Redeemable Convertible Preferred Stock, $0.001 par value; 6,503,902 shares authorized; 6,503,882 shares issued and outstanding at December 31, 2009 |
— | 18,690 | ||||||
| Series D Redeemable Convertible Preferred Stock, $0.001 par value; 3,512,880 shares authorized; 3,509,749 shares issued and outstanding at December 31, 2009 |
— | 11,989 | ||||||
| Series E Redeemable Convertible Preferred Stock, $0.001 par value; 1,045,714 shares authorized; 1,043,731 shares issued and outstanding at December 31, 2009 |
— | 9,936 | ||||||
| Total convertible preferred stock |
— | 77,616 | ||||||
| Stockholders’ equity (deficit): |
||||||||
| Preferred stock, $0.001 par value; 10,000,000 shares authorized; no shares issued |
— | — | ||||||
| Common stock, $0.001 par value; 500,000,000 shares authorized; 25,088,122 and, 2,033,542 issued and outstanding at December 31, 2010 and 2009, respectively |
25 | 2 | ||||||
| Additional paid-in capital |
176,505 | 6,041 | ||||||
| Accumulated deficit |
(34,644 | ) | (60,775 | ) | ||||
| Accumulated other comprehensive income |
800 | — | ||||||
| Total stockholders’ equity (deficit) |
142,686 | (54,732 | ) | |||||
| Total liabilities, convertible preferred stock and stockholders’ equity (deficit) |
$ | 158,957 | $ | 34,472 | ||||
The accompanying notes are an integral part of these consolidated financial statements.
F-3
Table of Contents
Consolidated Statements of Operations
(in thousands, except share and per share amounts)
| Year Ended December 31, | ||||||||||||
| 2010 | 2009 | 2008 | ||||||||||
| Revenue |
$ | 55,253 | $ | 37,617 | $ | 32,727 | ||||||
| Revenue from related party |
27,940 | 21,235 | 10,227 | |||||||||
| Total revenue |
83,193 | 58,852 | 42,954 | |||||||||
| Cost of revenue |
29,438 | 21,269 | 19,249 | |||||||||
| Gross profit |
53,755 | 37,583 | 23,705 | |||||||||
| Operating expense: |
||||||||||||
| Research and development |
23,781 | 17,847 | 17,501 | |||||||||
| Sales and marketing |
8,823 | 7,704 | 6,339 | |||||||||
| General and administrative |
9,212 | 3,947 | 3,169 | |||||||||
| Total operating expense |
41,816 | 29,498 | 27,009 | |||||||||
| Income (loss) from operations |
11,939 | 8,085 | (3,304 | ) | ||||||||
| Other income (expense) |
(50 | ) | 73 | (124 | ) | |||||||
| Income (loss) before income taxes |
11,889 | 8,158 | (3,428 | ) | ||||||||
| Provision (benefit) for income taxes |
(14,242 | ) | 829 | — | ||||||||
| Net income (loss) |
$ | 26,131 | $ | 7,329 | $ | (3,428 | ) | |||||
| Net income (loss) allocable to common stockholders |
$ | 5,240 | $ | 130 | $ | (3,428 | ) | |||||
| Net income (loss) per share: |
||||||||||||
| Basic |
$ | 1.03 | $ | 0.08 | $ | (2.66 | ) | |||||
| Diluted |
$ | 0.61 | $ | 0.05 | $ | (2.66 | ) | |||||
| Weighted-average shares used in computing net income (loss) per share: |
||||||||||||
| Basic |
5,086,169 | 1,668,876 | 1,289,431 | |||||||||
| Diluted |
8,546,537 | 2,785,277 | 1,289,431 | |||||||||
The accompanying notes are an integral part of these consolidated financial statements.
F-4
Table of Contents
Consolidated Statements of Convertible Preferred Stock and Stockholders’ Equity (Deficit)
(in thousands, except share amounts)
| Series A Convertible Preferred Stock |
Series B Redeemable Convertible Preferred Stock |
Series C Redeemable Convertible Preferred Stock |
Series D Redeemable Convertible Preferred Stock |
Series E Redeemable Convertible Preferred Stock |
Total Preferred Stock |
Common Stock | Additional Paid-in Capital |
Accumu- lated Deficit |
Accumulated Other Comprehensive Income |
Total Stock- holders’ Equity (Deficit) |
||||||||||||||||||||||||||||||||||||||||||||||||||||||||||
| Shares | Amount | Shares | Amount | Shares | Amount | Shares | Amount | Shares | Amount | Shares | Amount | |||||||||||||||||||||||||||||||||||||||||||||||||||||||||
| Balance at December 31, 2007 |
518,555 | $ | 12,016 | 2,905,783 | $ | 24,985 | 6,503,882 | $ | 18,690 | 3,509,749 | $ | 11,989 | — | $ | — | $ | 67,680 | 986,056 | $ | 1 | $ | 2,663 | $ | (64,676 | ) | — | $ | (62,012 | ) | |||||||||||||||||||||||||||||||||||||||
| Exercise of stock options |
— | — | — | — | — | — | — | — | — | — | — | 591,919 | 1 | 643 | — | — | 644 | |||||||||||||||||||||||||||||||||||||||||||||||||||
| Stock-based compensation expense |
— | — | — | — | — | — | — | — | — | — | — | — | — | 995 | — | — | 995 | |||||||||||||||||||||||||||||||||||||||||||||||||||
| Issuance of preferred stock, net |
— | — | — | — | — | — | — | — | 1,043,731 | 9,936 | 9,936 | — | — | — | — | — | — | |||||||||||||||||||||||||||||||||||||||||||||||||||
| Net loss |
— | — | — | — | — | — | — | — | — | — | — | — | — | — | (3,428 | ) | (3,428 | ) | ||||||||||||||||||||||||||||||||||||||||||||||||||
| Balance at December 31, 2008 |
518,555 | 12,016 | 2,905,783 | 24,985 | 6,503,882 | 18,690 | 3,509,749 | 11,989 | 1,043,731 | 9,936 | 77,616 | 1,577,975 | 2 | 4,301 | (68,104 | ) | — | (63,801 | ) | |||||||||||||||||||||||||||||||||||||||||||||||||
| Exercise of stock options |
— | — | — | — | — | — | — | — | — | — | — | 455,567 | — | 575 | — | — | 575 | |||||||||||||||||||||||||||||||||||||||||||||||||||
| Stock-based compensation expense |
— | — | — | — | — | — | — | — | — | — | — | — | — | 1,165 | — | — | 1,165 | |||||||||||||||||||||||||||||||||||||||||||||||||||
| Net income |
— | — | — | — | — | — | — | — | — | — | — | — | — | — | 7,329 | — | 7,329 | |||||||||||||||||||||||||||||||||||||||||||||||||||
| Balance at December 31, 2009 |
518,555 | 12,016 | 2,905,783 | 24,985 | 6,503,882 | 18,690 | 3,509,749 | 11,989 | 1,043,731 | 9,936 | 77,616 | 2,033,542 | 2 | 6,041 | (60,775 | ) | — | (54,732 | ) | |||||||||||||||||||||||||||||||||||||||||||||||||
| Exercise of stock options, warrant and restricted stock award grant |
— | — | — | — | — | — | — | — | — | — | — | 439,167 | — | 584 | — | — | 584 | |||||||||||||||||||||||||||||||||||||||||||||||||||
| Income tax benefit from stock option exercises |
— | — | — | — | — | — | — | — | — | — | — | — | — | 216 | — | — | 216 | |||||||||||||||||||||||||||||||||||||||||||||||||||
| Stock-based compensation expense |
— | — | — | — | — | — | — | — | — | — | — | — | — | 2,705 | — | — | 2,705 | |||||||||||||||||||||||||||||||||||||||||||||||||||
| Issuance of preferred stock |
— | — | — | — | — | — | — | — | 313,713 | 4,538 | 4,538 | — | — | — | — | — | — | |||||||||||||||||||||||||||||||||||||||||||||||||||
| Issuance of common stock in connection with initial public offering, net |
— | — | — | — | — | — | — | — | — | — | — | 7,820,000 | 8 | 84,690 | — | — | 84,698 | |||||||||||||||||||||||||||||||||||||||||||||||||||
| Conversion of preferred stock to common stock |
(518,555 | ) | (12,016 | ) | (2,905,783 | ) | (24,985 | ) | (6,503,882 | ) | (18,690 | ) | (3,509,749 | ) | (11,989 | ) | (1,357,444 | ) | (14,474 | ) | (82,154 | ) | 14,795,413 | 15 | 82,139 | — | — | 82,154 | ||||||||||||||||||||||||||||||||||||||||
| Conversion of preferred stock warrant to common stock warrant |
— | — | — | — | — | — | — | — | — | — | — | — | — | 130 | — | — | 130 | |||||||||||||||||||||||||||||||||||||||||||||||||||
| Net income |
— | — | — | — | — | — | — | — | — | — | — | — | — | — | 26,131 | — | 26,131 | |||||||||||||||||||||||||||||||||||||||||||||||||||
| Currency translation adjustment |
— | — | — | — | — | — | — | — | — | — | — | — | — | — | — | 800 | 800 | |||||||||||||||||||||||||||||||||||||||||||||||||||
| Total comprehensive income |
— | — | — | — | — | — | — | — | — | — | — | — | — | — | — | — | 26,931 | |||||||||||||||||||||||||||||||||||||||||||||||||||
| Balance at December 31, 2010 |
— | $ | — | — | $ | — | — | $ | — | — | $ | — | — | $ | — | $ | — | 25,088,122 | $ | 25 | $ | 176,505 | $ | (34,644 | ) | $ | 800 | $ | 142,686 | |||||||||||||||||||||||||||||||||||||||
The accompanying notes are an integral part of these consolidated financial statements.
F-5
Table of Contents
Consolidated Statements of Cash Flows
(in thousands)
| Year Ended December 31, | ||||||||||||
| 2010 | 2009 | 2008 | ||||||||||
| Cash flows from operating activities |
||||||||||||
| Net income (loss) |
$ | 26,131 | $ | 7,329 | $ | (3,428 | ) | |||||
| Adjustments to reconcile net income (loss) to net cash provided by operating activities: |
||||||||||||
| Depreciation and amortization |
1,820 | 1,291 | 1,430 | |||||||||
| Stock-based compensation |
2,705 | 1,165 | 995 | |||||||||
| Deferred income taxes and deferred tax charge |
(16,054 | ) | — | — | ||||||||
| Amortization of deferred tax charge |
746 | — | — | |||||||||
| Excess tax benefit related to stock-based compensation |
(216 | ) | — | — | ||||||||
| Other noncash items |
89 | 27 | 51 | |||||||||
| Changes in assets and liabilities (net of effect of acquisition): |
||||||||||||
| Accounts receivable |
(1,890 | ) | (4,588 | ) | 1,766 | |||||||
| Inventories |
(627 | ) | 143 | 635 | ||||||||
| Prepaid expenses and other assets |
(1,083 | ) | (88 | ) | 245 | |||||||
| Income tax payable/receivable |
(1,442 | ) | 444 | — | ||||||||
| Accounts payable |
344 | 1,413 | (1,185 | ) | ||||||||
| Accrued expenses |
965 | 1,062 | 492 | |||||||||
| Deferred revenue |
(736 | ) | 1,605 | 373 | ||||||||
| Other liabilities |
1,609 | 46 | 3 | |||||||||
| Net cash provided by operating activities |
12,361 | 9,849 | 1,377 | |||||||||
| Cash flows from investing activities |
||||||||||||
| Purchases of property and equipment |
(5,165 | ) | (560 | ) | (2,550 | ) | ||||||
| Proceeds from sale of property and equipment |
— | 4 | 72 | |||||||||
| Acquisition, net of cash acquired |
(2,499 | ) | — | — | ||||||||
| Net cash used in investing activities |
(7,664 | ) | (556 | ) | (2,478 | ) | ||||||
| Cash flows from financing activities |
||||||||||||
| Repayment of capital lease obligations |
— | (17 | ) | (45 | ) | |||||||
| Repayment of line of credit |
— | — | (3,650 | ) | ||||||||
| Proceeds from exercise of stock options |
485 | 733 | 644 | |||||||||
| Excess tax benefit related to stock-based compensation |
216 | — | — | |||||||||
| Net proceeds from issuance of preferred stock issuance |
— | — | 9,936 | |||||||||
| Proceeds from initial public offering, net of costs paid |
85,664 | — | — | |||||||||
| Net cash provided by financing activities |
86,365 | 716 | 6,885 | |||||||||
| Effect of currency exchange rates on cash and cash equivalents |
49 | — | — | |||||||||
| Net increase in cash and cash equivalents |
91,111 | 10,009 | 5,784 | |||||||||
| Cash and cash equivalents at beginning of year |
19,061 | 9,052 | 3,268 | |||||||||
| Cash and cash equivalents at end of year |
$ | 110,172 | $ | 19,061 | $ | 9,052 | ||||||
| Supplemental Cash Flow Information |
||||||||||||
| Interest paid |
$ | — | $ | — | $ | 63 | ||||||
| Income taxes paid |
2,502 | 381 | — | |||||||||
| Noncash investing and financing activities |
||||||||||||
| Acquisition of Winyatek Technology Inc. in exchange for Series E preferred shares |
$ | 4,538 | — | — | ||||||||
| Conversion of preferred stock to common stock |
82,154 | — | — | |||||||||
| Conversion of preferred stock warrant to common stock warrant |
130 | — | — | |||||||||
The accompanying notes are an integral part of these consolidated financial statements.
F-6
Table of Contents
Notes to Consolidated Financial Statements
(Dollars in thousands except share and per share amounts)
1. Organization and Summary of Significant Accounting Policies
Inphi Corporation (the “Company”), a Delaware corporation, was incorporated in November 2000. The Company is a fabless provider of high-speed analog semiconductor solutions for the communications and computing markets. The Company’s semiconductor solutions are designed to address bandwidth bottlenecks in networks, maximize throughput and minimize latency in computing environments and enable the rollout of next generation communications and computing infrastructures. In addition, the semiconductor solutions provide a vital high-speed interface between analog signals and digital information in high-performance systems such as telecommunications transport systems, enterprise networking equipment, datacenter and enterprise servers, storage platforms, test and measurement equipment and military systems.
The Company is subject to certain risks and uncertainties and believes changes in any of the following areas could have a material adverse effect on the Company’s future financial position or results of operations or cash flows: ability to sustain profitable operations due to history of losses and accumulated deficit, dependence on limited number of customers for a substantial portion of revenue, product defects, risks related to intellectual property matters, lengthy sales cycle and competitive selection process, lengthy and expensive qualification process, ability to develop new or enhance products in a timely manner, market development of and demand for the Company’s products, reliance on third parties to manufacture, assemble and test products and ability to compete.
Basis of Presentation
The accompanying financial statements through December 31, 2009 reflect the stand-alone operations of the Company. During the year ended December 31, 2010, the Company established subsidiaries in the United Kingdom and Singapore. In addition, on June 30, 2010, the Company completed the acquisition of all of the outstanding shares of Winyatek Technology Inc. (“WTI”). Accordingly, for the year ended December 31, 2010, the financial statements reflect the consolidated financial position, results of operations and cash flows of the Company. All significant intercompany balances and transactions have been eliminated in consolidation.
Reverse Stock Split
In October 2010, the Company’s Board of Directors approved a 3-for-7 reverse stock split of the Company’s issued and outstanding shares of common stock and preferred stock, which was effected on November 3, 2010. All common stock and preferred stock data and stock option plan information have been adjusted to reflect the split.
Initial Public Offering
In November 2010, the Company completed the initial public offering, or IPO, of its common stock in which it sold and issued 7,820,000 shares of common stock, including 1,020,000 shares related to the exercise of the underwriters’ over-allotment, at an issue price of $12.00 per share. The Company raised a total of $93.8 million in gross proceeds in the IPO, or approximately $84.7 million in net proceeds after deducting underwriting discounts and commissions of $6.5 million and other offering costs of $2.6 million. Immediately prior to the closing of the IPO, all shares of the Company’s then-outstanding convertible preferred stock outstanding automatically converted into 14,795,413 shares of common stock and the warrants to purchase preferred stock converted into warrants to purchase common stock.
F-7
Table of Contents
Inphi Corporation
Notes to Consolidated Financial Statements—(Continued)
(Dollars in thousands except share and per share amounts)
Use of Estimates
The preparation of consolidated financial statements in conformity with accounting principles generally accepted in the United States of America requires management to make estimates and assumptions that affect the reported amounts of assets and liabilities and disclosure of contingent assets and liabilities at the date of the financial statements and the reported amounts of revenue and expenses during the reporting period. Actual results could differ from those estimates.
On an ongoing basis, management evaluates its estimates, including those related to (i) the collectibility of accounts receivable; (ii) write down for excess and obsolete inventories; (iii) warranty obligations; (iv) the value assigned to and estimated useful lives of long-lived assets; (v) the realization of tax assets and estimates of tax liabilities and tax reserves; (vi) the valuation of equity securities; (vii) amounts recorded in connection with acquisitions; (viii) recoverability of intangible assets and goodwill and (ix) the recognition and disclosure of contingent liabilities. These estimates are based on historical data and experience, as well as various other factors that management believes to be reasonable under the circumstances, the results of which form the basis for making judgments about the carrying value of assets and liabilities that are not readily apparent from other sources. The Company engages third party valuation specialists to assist with estimates related to the valuation of financial instruments and assets associated with various contractual arrangements, the underlying value of preferred and common equity prior to the Company’s IPO and valuation of assets acquired in connection with acquisitions. Such estimates often require the selection of appropriate valuation methodologies and models, and significant judgment in evaluating ranges of assumptions and financial inputs. Actual results may differ from those estimates under different assumptions or circumstances.
Foreign Currency Translation
The Company and its subsidiaries except WTI use the U.S. dollar as its functional currency. Foreign currency assets and liabilities are remeasured into U.S. dollars at the end-of-period exchange rates except for non-monetary assets and liabilities, which are remeasured at historical exchange rates. Revenue and expenses are remeasured at the exchange rate in effect during the period the transaction occurred, except for those expenses related to balance sheet amounts, which are remeasured at historical exchange rates. Gains or losses from foreign currency transactions are included in the Consolidated Statements of Operations as part of “Other income (expense)”. Foreign currency gain or loss in 2010, 2009 and 2008 were not material.
The functional currency of WTI is the New Taiwan Dollar. Assets and liabilities of WTI are translated into US dollars at period-end exchange rates. Income, expense, and cash flow items are translated at average exchange rates prevailing during the period. The resulting currency translation adjustment is recorded as a component of accumulated other comprehensive income within stockholders’ equity.
Business Combinations
The Company accounts for acquisitions of businesses using the purchase method of accounting where the cost is allocated to the underlying net tangible and intangible assets acquired, based on their respective estimated fair values. The excess of the purchase price over the estimated fair values of the net assets acquired is recorded as goodwill. Determining the fair value of certain acquired assets and liabilities is subjective in nature and often involves the use of significant estimates and assumptions, including, but not limited to, the selection of appropriate valuation methodology, projected revenues, expenses and cash flows, weighted average cost of capital, discount rates, evaluation of in-process research and development (“IPR&D”), estimates of customer
turnover rates and estimates of terminal values. Acquisitions are included in the Company’s consolidated financial statements as of the date of acquisition.
F-8
Table of Contents
Inphi Corporation
Notes to Consolidated Financial Statements—(Continued)
(Dollars in thousands except share and per share amounts)
Cash and Cash Equivalents
The Company considers all highly liquid investments with an original or remaining maturity of three months or less at the date of purchase to be cash equivalents. The Company maintains its cash and cash equivalents with major financial institutions and, at times, such balances with any one financial institution may exceed Federal Deposit Insurance Corporation insurance limits. Cash equivalents primarily consist of money market funds.
Fair Market Value of Financial Instruments
The carrying amount reflected in the balance sheet for cash and cash equivalents, accounts receivable, prepaid and other current assets, accounts payable, accrued expenses and other current liabilities, approximate fair value due to the short-term nature of these financial instruments.
Inventories
Inventories include materials, labor and overhead and are stated at the lower of cost or market. Cost is computed using standard cost, which approximates actual cost, on a first-in, first-out basis. Inventories are reduced for write downs based on periodic reviews for evidence of slow-moving or obsolete parts. The write-down is based on comparison between inventory on hand and estimated future sales for each specific product. Once written down, inventory write downs are not reversed until the inventory is sold or scrapped. Inventory write downs are also established when conditions indicate that the net realizable value is less than cost due to physical deterioration, obsolescence, changes in price level or other causes. Inventory valuation reserves were $1,372 and $916 , as of December 31, 2010 and 2009, respectively.
Property and Equipment
Property and equipment are stated at cost less accumulated depreciation and amortization. Depreciation and amortization is provided on property and equipment over the estimated useful lives on a straight-line basis. Leasehold improvements are amortized on a straight-line basis over the shorter of their estimated useful lives or lease terms. Repairs and maintenance are charged to expense as incurred. Useful lives by asset category are as follows:
| Asset Category |
Years | |
| Office equipment |
3 years | |
| Software |
3 years | |
| Leasehold improvements |
Shorter of lease term or estimated useful life | |
| Production equipment |
2 years | |
| Computer equipment |
5 years | |
| Lab equipment |
5 years | |
| Furniture and fixtures |
7 years |
Equipment Under Capital Leases
The Company leases certain of its equipment under capital lease agreements. The assets and liabilities under capital leases are initially recorded at the fair value of the assets under lease. There were no material capital lease obligations outstanding at December 31, 2010 or 2009.
F-9
Table of Contents
Inphi Corporation
Notes to Consolidated Financial Statements—(Continued)
(Dollars in thousands except share and per share amounts)
Intangible Assets
Intangible assets represent rights acquired for developed technology, customer relationships and IPR&D in connection with the acquisition of WTI. Intangible assets with finite useful lives are amortized over periods ranging from four to five years using a method that reflects the pattern in which the economic benefits of the intangible asset are consumed, or if that pattern cannot be reliably determined, using a straight-line amortization method. Acquired IPR&D is capitalized and amortization commences upon completion of the underlying projects. If any of the projects are abandoned, the Company would be required to impair the related IPR&D asset.
Impairment of Long-lived Assets and Goodwill
Long-lived Assets
The Company assesses the impairment of long-lived assets, which consist primarily of property and equipment and intangible assets, whenever events or changes in circumstances indicate that such assets might be impaired and the carrying value may not be recoverable. Events or changes in circumstances that may indicate that an asset is impaired include significant decreases in the market value of an asset, significant underperformance relative to expected historical or projected future results of operations, a change in the extent or manner in which an asset is utilized, significant declines in the estimated fair value of the overall Company for a sustained period, shifts in technology, loss of key management or personnel, changes in the Company’s operating model or strategy and competitive forces.
If events or changes in circumstances indicate that the carrying amount of an asset may not be recoverable and the expected undiscounted future cash flows attributable to the asset are less than the carrying amount of the asset, an impairment loss equal to the excess of the asset’s carrying value over its fair value is recorded. Fair value is determined based on the present value of estimated expected future cash flows using a discount rate commensurate with the risk involved, quoted market prices or appraised values, depending on the nature of the assets.
Goodwill
Goodwill represents the excess of the cost of an acquired entity over the fair value of the acquired net assets. The Company tests goodwill for impairment annually during the fourth quarter of its fiscal year or when events or circumstances change that would indicate that goodwill might be permanently impaired. Events or circumstances which could trigger an impairment review include, but are not limited to a significant adverse change in legal factors or in the business climate, an adverse action or assessment by a regulator, unanticipated competition, a loss of key personnel, significant changes in the manner of the Company’s use of the acquired assets or the strategy for the Company’s overall business, significant negative industry or economic trends or significant underperformance relative to expected historical or projected future results of operations.
The testing for a potential impairment of goodwill involves a two-step process. The first step involves comparing the estimated fair values of the Company’s reporting units with their respective book values, including goodwill. If the estimated fair value exceeds book value, goodwill is considered not to be impaired and no additional steps are necessary. If, however, the fair value of the reporting unit is less than book value, then the carrying amount of the goodwill is compared with its implied fair value. The estimate of implied fair value of goodwill may require valuations of certain internally generated and unrecognized intangible assets such as the Company’s technology, customer relationships, patents and trademarks. If the carrying amount of goodwill exceeds the implied fair value of that goodwill, an impairment loss is recognized in an amount equal to the excess.
F-10
Table of Contents
Inphi Corporation
Notes to Consolidated Financial Statements—(Continued)
(Dollars in thousands except share and per share amounts)
Internal Use Software Costs
Certain external and internal computer software costs acquired for internal use are capitalized. Training costs and maintenance are expensed as incurred, while upgrades and enhancements are capitalized if it is probable that such expenditures will result in additional functionality. Capitalized costs are included within property and equipment.
Revenue Recognition
The Company’s products are fully functional at the time of shipment and do not require additional production, modification, or customization. The Company recognizes revenue when there is persuasive evidence of an arrangement, delivery has occurred, the fee is fixed or determinable, and collection is reasonably assured. The Company’s sales arrangements do not include multiple elements.
Product revenue is recognized upon shipment of product to customers, net of accruals for estimated sales returns and allowances, which to date, have not been significant. However, some of the Company’s sales are made through distributors under arrangements that allow for price protection or rights of return on product unsold by the distributors. Product revenue on sales made through distributors with rights of return or price protection is deferred until the distributors sell the product to end customers. Sales to distributors are included in deferred revenue and the Company includes the related costs in inventory until sale to the end customers occurs. Price protection rights allow distributors the right to a credit in the event of declines in the price of the Company’s product that they hold prior to the sale to an end customer. In the event that the Company reduces the selling price of products held by distributors, deferred revenue related to distributors with price protection rights is reduced upon notification to the customer of the price change. There were no material product returns or price declines in 2010, 2009 and 2008. The Company’s sales to direct customers are made primarily pursuant to standard purchase orders for delivery of products. The Company generally allows customers to cancel or change purchase orders within limited notice periods prior to the scheduled shipment.
Cost of Revenue
Cost of revenue includes cost of materials, such as wafers processed by third-party foundries, cost associated with packaging and assembly, test and shipping, cost of personnel, including stock-based compensation, and equipment associated with manufacturing support, logistics and quality assurance, warranty cost, write down of inventories, amortization of production mask costs, overhead and an allocated portion of occupancy costs.
Warranty
The Company’s products are under warranty against defects in material and workmanship generally for a period of one or two years. The Company accrues for estimated warranty cost at the time of sale based on anticipated warranty claims and actual historical warranty claims experience including knowledge of specific product failures that are outside of the Company’s typical experience. The warranty obligation is determined based on product failure rates, cost of replacement and failure analysis cost. If actual warranty costs differ significantly from these estimates, adjustments may be required in the future. As of December 31, 2010 and 2009, the warranty liability was $602 and $450, respectively.
F-11
Table of Contents
Inphi Corporation
Notes to Consolidated Financial Statements—(Continued)
(Dollars in thousands except share and per share amounts)
The following table sets forth changes in warranty accrual included in other accrued expenses in the Company’s consolidated balance sheets:
| Year Ended December 31, 2010 |
Year Ended December 31, 2009 |
|||||||
| Beginning balance |
$ | 450 | $ | — | ||||
| Accruals for warranties |
165 | 450 | ||||||
| Settlements |
(13 | ) | — | |||||
| Ending balance |
$ | 602 | $ | 450 | ||||
In September 2010, the Company was informed of a claim related to repair and replacement costs in connection with shipments of over 4,000 integrated circuits made by the Company during the summer and fall of 2009. Of these shipments, approximately 4% were later confirmed or suspected to have random manufacturing process anomalies in the wafer die in the product. These anomalies made the circuitry of a small number of random die per foundry wafer susceptible to failure under certain customer specific system operating conditions. At the time of shipment in 2009 and early 2010, the Company established an initial warranty reserve and added to that accrual as the problem was identified and reliable information became available. The foundry who produced the wafers has informed the Company that the random anomalies are normal in a Gallium Arsenide (“GaAs”) manufacturing process.
In March 2010, the Company developed additional tests to screen out the wafer die that might be susceptible to this type of failure and resumed shipments to the customer with no subsequent additional reported incidents. Based on its standard warranty provisions, the Company has provided replacement parts to the customer for the known and suspected failures that had occurred.
In addition and without informing the Company, in the fall of 2009 the customer instituted its own larger scale replacement program that covered the replacement of entire subassemblies in which the Company’s product was only one component. In September 2010, the customer made an initial claim for approximately $18 million against the Company for the costs incurred relative to that program. Management believes the amount of the claim is without merit as its warranty liability is contractually limited to the repair or replacement of the Company’s affected products, which to the extent the customer has requested replacement, has already been completed. A formal claim has yet to be made and discussions with the customer are ongoing. At this time, the Company believes its current warranty reserves are adequate to address the matter and that the Company’s obligations under its standard warranty provisions have been fulfilled. However, claims of this nature are subject to various risks and uncertainties and there can be no assurance that this matter will be resolved without further significant costs to the Company, including the potential for arbitration or litigation. If and when the amount of any additional loss, if any, becomes both probable and determinable, the Company may be required to record an incremental reserve. The Company currently expects to continue to do business with this customer for both current and future products.
Research and Development Expense
Research and development expense consists of costs incurred in performing research and development activities including salaries, stock-based compensation, employee benefits, occupancy costs, overhead costs and prototype wafer, packaging and test costs. Research and development costs are expensed as incurred.
F-12
Table of Contents
Inphi Corporation
Notes to Consolidated Financial Statements—(Continued)
(Dollars in thousands except share and per share amounts)
Sales and Marketing Expense
Sales and marketing expense consists of salaries, stock-based compensation, employee benefits, travel and trade show costs. The Company expenses sales and marketing costs as incurred. Advertising expenses for the years ended December 31, 2010, 2009 and 2008 were not material.
General and Administrative Expense
General and administrative expense consists of salaries, stock-based compensation, employee benefits and expenses for executive management, legal, finance and human resources personnel. In addition, general and administrative expense includes fees for professional services and occupancy costs. These costs are expensed as incurred.
Income Taxes
Deferred tax assets and liabilities are determined based on differences between financial reporting and tax bases of assets and liabilities, and are measured using the enacted tax rates and laws that will be in effect when the differences are expected to reverse. The Company must also make judgments in evaluating whether deferred tax assets will be recovered from future taxable income. To the extent that it believes that recovery is not likely, the Company must establish a valuation allowance. The carrying value of the Company’s net deferred tax asset is based on whether it is more likely than not that the Company will generate sufficient future taxable income to realize these deferred tax assets. A valuation allowance is established for deferred tax assets which the Company does not believe meet the “more likely than not” criteria. The Company’s judgments regarding future taxable income may change over time due to changes in market conditions, changes in tax laws, tax planning strategies or other factors. If the Company’s assumptions and consequently its estimates change in the future, the valuation allowance the Company has established may be increased or decreased, resulting in a material respective increase or decrease in income tax expense (benefit) and related impact on the Company’s reported net income (loss).
In accordance with FASBs guidance on Accounting for Uncertainty in Income Taxes, the Company performs a comprehensive review of uncertain tax positions regularly. In this regard, an uncertain tax position represents an expected treatment of a tax position taken in a filed tax return, or planned to be taken in a future tax return or claim, which has not been reflected in measuring income tax expense for financial reporting purposes. Until these positions are sustained by the taxing authorities, the Company does not recognize the tax benefits resulting from such positions and reports the tax effects as a liability for uncertain tax positions in our consolidated financial statements. The Company recognizes potential interest and penalties on uncertain tax positions in income taxes in the consolidated statement of operations.
Stock-Based Compensation
Stock-based compensation for stock option and restricted stock awards issued to the Company’s employees is measured at the grant date based on the fair value of the award and is recognized as expense over the requisite service period, which is the vesting period, on a straight-line basis. The Company uses the Black-Scholes option-pricing model for valuing stock option awards granted to employees and directors at the grant date. Determining the fair value of stock option awards at the grant date requires the input of various assumptions, including fair value of the underlying common stock, expected future share price volatility, expected term, risk-free interest rate and dividend rate. Changes in these assumptions can materially affect the fair value of the options. The Company based its estimate of expected volatility on the estimated volatility of similar entities whose share prices are publicly available. The risk-free interest rate is based on the U.S. Treasury yields in effect at the time
F-13
Table of Contents
Inphi Corporation
Notes to Consolidated Financial Statements—(Continued)
(Dollars in thousands except share and per share amounts)
of grant for periods corresponding to the expected life of the options. The weighted average expected life of options was calculated using the simplified method as prescribed by guidance provided by the Securities and Exchange Commission. This decision was based on the lack of relevant historical data due to the Company’s limited experience and the lack of an active market for the Company’s common stock. The expected dividend yield is zero because the Company has not historically paid dividends and has no present intention to pay dividends. The Company establishes the estimated forfeiture rates based on historical experience. The value of the portion of the award that is ultimately expected to vest is recognized as expense over the requisite service period which is equal to vesting period.
The Company has elected to treat share-based payment awards with graded vesting schedules and time-based service conditions as single awards and recognizes stock-based compensation expense on a straight-line basis (net of estimated forfeitures) over the requisite service period.
The Company recognizes non-employee stock-based compensation expenses based on the estimated fair value of the equity instrument determined using the Black-Scholes option-pricing model. Management believes that the fair value of the stock options is more reliably measured than the fair value of the services received. The fair value of each non-employee variable stock award is re-measured each period until a commitment date is reached, which is generally the vesting date.
Earnings per Share
The Company applies the two-class method for calculating earnings per share. Under the two–class method, net income (loss) is allocated between common stock and other participating securities based on their participation rights. Basic earnings per share is calculated by dividing income (loss) allocable to common stockholders (after the reduction for any preferred stock dividends assuming current income for the period had been distributed) by the weighted average number of shares of common stock outstanding, net of shares subject to repurchase by the Company, during the period. Diluted earnings per share is calculated by dividing the net income (loss) allocable to common stockholders by the weighted average number of common shares outstanding, adjusted for the effects of potentially dilutive common stock, which are comprised of stock options, warrants to purchase common stock and convertible preferred stock.
Segment Information
The Company’s operations are located primarily in the United States, and materially all tangible assets are located in Westlake Village, California. The Company operates in one segment related to the design, development and sale of high speed analog connectivity components that operate to maintain, amplify and improve signal integrity at high speeds in a wide variety of applications. The Company’s chief operating decision-maker is its Chief Executive Officer, who reviews operating results on an aggregate basis and manages the Company’s operations as a single operating segment.
Recent Accounting Pronouncements
In October 2009, the FASB reached final consensus on a new revenue recognition guidance regarding revenue arrangements with multiple deliverables. The new accounting guidance addresses how to determine whether an arrangement involving multiple deliverables contains more than one unit of accounting, and how the arrangement consideration should be allocated among the separate units of accounting. The new accounting guidance is effective for fiscal years beginning after June 15, 2010 and may be applied retrospectively or
F-14
Table of Contents
Inphi Corporation
Notes to Consolidated Financial Statements—(Continued)
(Dollars in thousands except share and per share amounts)
prospectively for new or materially modified arrangements. Early adoption is permitted. The Company does not expect that the adoption of this guidance will have a material impact on its financial position, results of operations or disclosures.
In January 2010, FASB issued an amendment regarding improving disclosures about fair value measurements. This new guidance requires additional new disclosures and clarifies some existing disclosure requirements about fair value measurement. The new disclosures and clarifications of existing disclosures are effective for interim and annual reporting periods beginning after December 15, 2009, except for the disclosures about purchases, sales, issuances and settlements in the roll forward of activity in Level 3 fair value measurements. Those disclosures are effective for fiscal years beginning after December 15, 2010 and for interim periods within those fiscal years. The adoption of this guidance did not have an impact on the Company’s disclosures for the year ended December 31, 2010. The Company does not expect that the adoption of the guidance relating to Level 3 fair value measurements will have a material impact on its financial position, results of operations or disclosures.
In April 2010, FASB issued an accounting guidance concerning application of milestone method of recognizing revenue for research and development which include payment provisions under which all or a portion of the considerations to be received is contingent upon the achievement of certain events. A milestone event must carry a substantive uncertainty when the arrangement is entered as to whether the event will be achieved. A milestone is deemed substantive when the milestone consideration is: a) proportionate with the vendor’s performance to achieve the milestone or the delivered items enhanced value resulting for the specific outcome of the vendor’s performance to achieve the milestone; b) related solely to the vendor’s past performance; and c) reasonable relative to all deliverables and payment terms in the arrangement. This guidance requires disclosures of accounting policy for the recognition of milestone consideration and description of the arrangement. This guidance is effective for fiscal years and interim periods beginning on or after June 15, 2010. Early adoption is allowed. The Company adopted this guidance in the year ended December 31, 2010. Revenue recognized under the milestone method was not material in 2010. There was no effect on prior years’ financial statements since there were no arrangements in prior periods.
In December 2010, FASB issued an amendment to the goodwill impairment test. The amendment modifies Step 1 of the goodwill impairment test for reporting units with zero or negative carrying amounts. For those reporting units, an entity is required to perform Step 2 of the goodwill impairment test if it is more likely than not that a goodwill impairment exists. In determining whether it is more likely than not that goodwill impairment exists, an entity should consider whether there are any adverse qualitative factors indicating that impairment may exist. The qualitative factors are consistent with the existing guidance and examples, which require that goodwill of a reporting unit be tested for impairment between annual tests if an event occurs or circumstances change that would more likely than not reduce the fair value of a reporting unit below its carrying amount. The amendments are effective for fiscal years, and interim periods within those years, beginning after December 15, 2010. Early adoption is not permitted. The Company does not expect that the adoption of this guidance will have a material impact on its financial position, results of operations or disclosures since the Company does not have any reporting units with zero or negative carrying amounts.
In December 2010, FASB issued an amendment to the disclosure of supplementary pro forma information for business combinations. The amendments specify that if a public entity presents comparative financial statements, the entity should disclose revenue and earnings of the combined entity as though the business combination that occurred during the current year had occurred as of the beginning of the comparable prior annual reporting period only. The amendments also expand the supplemental pro forma disclosures to include a
F-15
Table of Contents
Inphi Corporation
Notes to Consolidated Financial Statements—(Continued)
(Dollars in thousands except share and per share amounts)
description of the nature and amount of material, nonrecurring pro forma adjustments directly attributable to the business combination included in the reported pro forma revenue and earnings. The amendments are effective prospectively for business combinations for which the acquisition date is on or after the beginning of the first annual reporting period beginning on or after December 15, 2010. Early adoption is permitted. The Company does not expect that the adoption of this guidance will have a material impact on its financial position, results of operations or disclosures.
2. Acquisition
On June 30, 2010, the Company acquired all of the outstanding shares of WTI in exchange for $3.3 million in cash and 313,713 shares of Series E preferred stock. WTI is primarily engaged in the research, design, development, manufacture and sale of Nand Flash Controller System-On-Chip, secure digital/multi-media card controller, and card reader products. As a result of the acquisition, the Company is expected to expand its technology and engineering resources.
The fair value of consideration transferred is shown in the table below:
| Cash |
$ | 3,344 | ||
| Series E preferred stock |
4,538 | |||
| $ | 7,882 | |||
The Company issued 313,713 shares of Series E preferred stock that has a total fair value of $4.5 million based on the valuation performed as of June 30, 2010, the acquisition date. The acquisition of WTI includes a contingent consideration arrangement that requires additional consideration to be paid by the Company based on achievement of certain revenue and gross margin targets of WTI over the three fiscal quarters starting July 1, 2010. The amount of contingent consideration, if any, is payable on or before May 15, 2011. The amount of consideration the Company could pay under the agreement ranges from $0 to $2 million. The fair value of the contingent consideration on the acquisition date and at December 31, 2010 was determined to be insignificant as the probability of WTI achieving the revenue and gross margin requirement is deemed to be remote.
The acquisition has been accounted for using the acquisition method of accounting which requires, among other things, that assets acquired and liabilities assumed be recognized at their fair values as of the acquisition date.
F-16
Table of Contents
Inphi Corporation
Notes to Consolidated Financial Statements—(Continued)
(Dollars in thousands except share and per share amounts)
The following table summarizes the purchase price allocation as of the acquisition date:
| Cash |
$ | 808 | ||
| Receivables |
174 | |||
| Inventories |
493 | |||
| Other current assets |
100 | |||
| Property and equipment |
68 | |||
| Identifiable intangible assets |
1,530 | |||
| In-process research and development |
110 | |||
| Other noncurrent assets |
34 | |||
| Accounts payable and accrued expenses |
(539 | ) | ||
| Deferred tax liabilities, net |
(177 | ) | ||
| Total identifiable net assets |
2,601 | |||
| Goodwill |
5,281 | |||
| Net assets acquired |
$ | 7,882 | ||
As of the acquisition date, the fair value of receivables, inventories, property and equipment, accounts payable and accrued expenses approximated the book value acquired.
Identifiable intangible assets consist of developed technology of $800 and customer relationships of $730. The Company used a relief-from-royalty method to value developed technology. The relief-from-royalty method estimates the cost savings that accrue to the owner of an intangible asset that would otherwise be payable as royalties or license fees on revenue earned through the use of the asset. The royalty rate used is based on an analysis of licensing agreements related to similar technologies. Revenue is projected over the expected remaining useful life of the developed technology. The market-derived royalty rate is then applied to estimate the royalty savings. Customer relationships represent future projected revenue that will be derived from sales of products to existing customers. Developed technology and customer relationships will be amortized on a straight-line method, which approximates the pattern of economic consumption over their estimated useful lives as follows:
Developed technology 4 years
Customer relationships 5 years
The Company capitalized $110 of IPR&D costs related to the WTI acquisition. Upon completion of the projects, the related IPR&D assets will be amortized over their estimated useful lives. If any of the projects are abandoned, the Company will be required to impair the related IPR&D asset. The fair value of the IPR&D was determined using the relief-from-royalty method similar to the process as discussed above. The significant assumptions underlying the valuation of IPR&D are:
| Estimated percent complete |
7% | |
| Estimated time to complete |
6 months | |
| Estimated cost to complete |
$92 | |
| Discount rate |
32.5% |
As of December 31, 2010, the projects are expected to be completed in February 2011 and will commence commercial production in the second quarter of 2011.
F-17
Table of Contents
Inphi Corporation
Notes to Consolidated Financial Statements—(Continued)
(Dollars in thousands except share and per share amounts)
The accumulated amortization of developed technology and customer relationships as of December 31, 2010 was $111 and $81, respectively. Estimated amortization expense of identifiable intangible assets for the next five years is as follows: $401 in 2011, $408 in 2012, $408 in 2013, $297 in 2014 and $110 in 2015.
Goodwill is calculated as the excess of the consideration transferred over the net assets recognized and is attributable to the workforce of the acquired business and the synergies expected to arise after the Company’s acquisition of WTI. Goodwill is not amortized and is not deductible for tax purposes. The change in goodwill from acquisition date to December 31, 2010 was due to foreign currency translation.
The Company incurred acquisition costs of $0.3 million which are included in general and administrative expense in the consolidated statement of income for the year ended December 31, 2010.
WTI contributed revenue of $1,359 and pre-tax loss of $869 to the Company for the period from June 30 to December 31, 2010.
Pro Forma Information
The following unaudited pro forma financial information presents a summary of the Company’s consolidated results of operations for the year ended December 31, 2010 and the year ended December 31, 2009, assuming the WTI acquisition had been completed as of January 1, 2010 and January 1, 2009, respectively:
| Pro Forma Year Ended December 31, 2010 |
Pro Forma Year Ended December 31, 2009 |
|||||||
| (unaudited) | (unaudited) | |||||||
| Revenue |
$ | 84,316 | $ | 60,427 | ||||
| Net income |
$ | 25,738 | $ | 5,838 | ||||
| Net income allocable to common stockholders |
$ | 5,186 | $ | — | ||||
| Net income per share – basic |
$ | 1.02 | $ | — | ||||
| Net income per share – diluted |
$ | 0.61 | $ | — | ||||
The unaudited pro forma consolidated results were prepared using the acquisition method of accounting and are based on the historical financial information of the Company and WTI, reflecting the results of operations for the year ended December 31, 2010 and 2009. The unaudited pro forma consolidated results are not necessarily indicative of what our consolidated results of operations actually would have been had we completed the acquisition as of the beginning of each period presented. In addition, the unaudited pro forma consolidated results do not purport to project the future results of operations of the combined company nor do they reflect the expected realization of any cost savings associated with the acquisition.
3. Concentrations
Financial instruments that subject the Company to concentrations of credit risk consist primarily of cash, cash equivalents and trade accounts receivable. The Company extends differing levels of credit to customers and does not require collateral deposits. As of December 31, 2010 and 2009, the Company maintained an allowance for doubtful accounts of $68.
F-18
Table of Contents
Inphi Corporation
Notes to Consolidated Financial Statements—(Continued)
(Dollars in thousands except share and per share amounts)
The following table summarizes the significant customers’ and distributors’ revenue and accounts receivable as a percentage of total revenue and total accounts receivable, respectively:
| Year Ended December 31, | ||||||||||||
| Revenue | 2010 | 2009 | 2008 | |||||||||
| Customer A |
34 | % | 36 | % | 24 | % | ||||||
| Customer B |
* | * | 12 | |||||||||
| Customer C |
* | * | 11 | |||||||||
| Customer D |
* | * | * | |||||||||
| Customer E |
* | * | * | |||||||||
| December 31, | ||||||||
| Accounts Receivable | 2010 | 2009 | ||||||
| Customer A |
33 | % | 42 | % | ||||
| Customer B |
* | * | ||||||
| Customer C |
11 | * | ||||||
| Customer D |
* | 11 | ||||||
| Customer E |
* | 12 | ||||||
| * | Less than 10% of total revenue and accounts receivable |
Customers D and E are distributors that sell the Company’s products exclusively to an end customer. In the aggregate, revenue to such end customer, including revenue made through distributors as a percentage of total revenue was 11%, 17% and 11% for the years ended December 31, 2010, 2009 and 2008.
4. Inventories
Inventories consist of the following:
| December 31, | ||||||||
| 2010 | 2009 | |||||||
| Raw materials |
$ | 1,028 | $ | 1,002 | ||||
| Work in process |
2,033 | 1,375 | ||||||
| Finished goods |
2,034 | 1,565 | ||||||
| $ | 5,095 | $ | 3,942 | |||||
Finished goods held by distributors were $482 and $442 as of December 31, 2010 and 2009, respectively.
F-19
Table of Contents
Inphi Corporation
Notes to Consolidated Financial Statements—(Continued)
(Dollars in thousands except share and per share amounts)
5. Property and Equipment, net
Property and equipment consist of the following:
| December 31, | ||||||||
| 2010 | 2009 | |||||||
| Laboratory and production equipment |
$ | 11,882 | $ | 10,556 | ||||
| Office, software and computer equipment |
3,655 | 2,575 | ||||||
| Furniture and fixtures |
729 | 166 | ||||||
| Leasehold improvements |
2,652 | 48 | ||||||
| 18,918 | 13,345 | |||||||
| Less accumulated depreciation |
(11,712 | ) | (10,231 | ) | ||||
| $ | 7,206 | $ | 3,114 | |||||
Depreciation and amortization expense for the years ended December 31, 2010, 2009 and 2008 was $1,640, $1,291 and $1,430 respectively.
As of December 31, 2010 and 2009, laboratory and production equipment includes $397 in assets that have been capitalized under capital leases. Accumulated amortization of equipment under capital leases was $388 and $342 as of December 31, 2010 and 2009, respectively. Amortization expense in connection with equipment purchased under capital leases was $45, $70 and $73 for the years ended December 31, 2010, 2009 and 2008, respectively.
As of December 31, 2010 and 2009, computer software costs included in property and equipment were $1,471 and $1,251, respectively. Amortization expense of capitalized computer software costs was $184, $134 and $125 for the years ended December 31, 2010, 2009 and 2008, respectively.
6. Lines of Credit
In June 2007, the Company entered into a Loan and Security Agreement with an unrelated financial institution, which provided for borrowing up to an aggregate of $10 million. Amounts borrowed under the Loan and Security Agreement were collateralized by substantially all of the assets of the Company and carried an interest rate of prime per annum. The average effective interest rate during 2008 was 6.25%. The Company repaid the entire outstanding balance of $3,650 in February 2008, and the $10 million facility was terminated on June 8, 2009.
In connection with the Loan and Security Agreement, the Company issued a warrant to purchase 12,857 shares of common stock (see Note 10).
F-20
Table of Contents
Inphi Corporation
Notes to Consolidated Financial Statements—(Continued)
(Dollars in thousands except share and per share amounts)
7. Income Taxes
Income (loss) before income taxes consists of the following:
| Year Ended December 31, | ||||||||||||
| 2010 | 2009 | 2008 | ||||||||||
| United States |
12,765 | 8,158 | (3,428 | ) | ||||||||
| Foreign |
(876 | ) | — | — | ||||||||
| Total |
11,889 | 8,158 | (3,428 | ) | ||||||||
Income tax expense (benefit) consisted of the following:
| Year Ended December 31, | ||||||||||||
| 2010 | 2009 | 2008 | ||||||||||
| Current: |
||||||||||||
| U.S. Federal |
$ | (6,158 | ) | $ | 253 | $ | — | |||||
| U.S. State |
(1,015 | ) | 576 | — | ||||||||
| Foreign |
29 | — | — | |||||||||
| (7,144 | ) | 829 | — | |||||||||
| Deferred: |
||||||||||||
| U.S. Federal |
(4,523 | ) | — | — | ||||||||
| U.S. State |
(2,427 | ) | — | — | ||||||||
| Foreign |
(148 | ) | — | — | ||||||||
| (7,098 | ) | — | — | |||||||||
| Total |
$ | (14,242 | ) | $ | 829 | $ | — | |||||
Income tax expense (benefit) differed from the amounts computed by applying the U.S. federal income tax rate of 35% to pretax income (loss) as a result of the following:
| Year Ended December 31, | ||||||||||||
| 2010 | 2009 | 2008 | ||||||||||
| Provision (benefit) at statutory rate |
$ | 4,161 | $ | 2,855 | $ | (1,200 | ) | |||||
| State income taxes |
1,653 | 375 | 16 | |||||||||
| Research and development credits |
(2,063 | ) | (713 | ) | (528 | ) | ||||||
| Change in valuation allowance |
(24,022 | ) | (1,964 | ) | 1,544 | |||||||
| Foreign earnings, taxed at different rates |
4,912 | — | — | |||||||||
| Unrecognized tax benefits |
791 | — | — | |||||||||
| Stock-based compensation |
391 | — | — | |||||||||
| Other |
(65 | ) | 276 | 168 | ||||||||
| $ | (14,242 | ) | $ | 829 | $ | — | ||||||
F-21
Table of Contents
Inphi Corporation
Notes to Consolidated Financial Statements—(Continued)
(Dollars in thousands except share and per share amounts)
Significant components of the Company’s net deferred taxes consist of the following:
| December 31, | ||||||||
| 2010 | 2009 | |||||||
| Deferred tax assets |
||||||||
| Net operating loss carry forwards |
$ | 8,051 | $ | 15,424 | ||||
| Research and development credits |
3,788 | 4,602 | ||||||
| Stock-based compensation |
1,150 | 721 | ||||||
| Other temporary differences |
1,666 | 3,731 | ||||||
| Total deferred tax assets |
14,655 | 24,478 | ||||||
| Deferred tax liabilities |
||||||||
| Subpart F income on foreign subsidiaries earnings |
(5,635 | ) | — | |||||
| Amortization and depreciation |
(953 | ) | (425 | ) | ||||
| Other |
(249 | ) | (31 | ) | ||||
| Total deferred tax liabilities |
(6,837 | ) | (456 | ) | ||||
| Less: valuation allowance |
— | (24,022 | ) | |||||
| Deferred tax assets, net |
$ | 7,818 | $ | — | ||||
At December 31, 2010, the Company has recorded a deferred tax charge of $7.3 million, which represents the tax on the intercompany transfer of intangible assets in connection with the Company’s international reorganization during 2010 in accordance with ASC 740-10-25-3. The deferred tax charge is being amortized over the estimated useful life of 8 years to income tax expense.
Valuation Allowance
The Company recorded a full valuation allowance against its net deferred tax assets at December 31, 2008 and 2009. In determining the need for a valuation allowance, management reviewed all available evidence pursuant to the requirements of ASC 740. The determination of recording or releasing tax valuation allowances is made, in part, pursuant to an assessment performed by management regarding the likelihood that the Company will generate sufficient future taxable income against which benefits of the deferred tax assets may or may not be realized. This assessment requires management to exercise significant judgment and make estimates with respect to the Company’s ability to generate revenue, gross profits, operating income and taxable income in future periods. Amongst other factors, management must make assumptions regarding overall current and projected business and semiconductor industry conditions, operating efficiencies, the Company’s ability to timely develop, introduce and consistently manufacture new products to customers’ specifications, acceptance of new products, customer concentrations, technological change and the competitive environment which may impact the Company’s ability to generate taxable income and, in turn, realize the value of the deferred tax assets. Significant cumulative operating losses in 2008 and prior years, uncertainty with respect to the acceptance of the Company’s products by end customers and significant economic uncertainties in the market made the Company’s ability to project future taxable income highly uncertain and volatile at December 31, 2009. Although 2009 was the Company’s first profitable year, only the last three quarters of the year were profitable and the vast majority of the Company’s pre-tax income was generated in the last two quarters of the year. Based upon management’s assessment of all available evidence, including a relatively short period of recent profitability, coupled with significant uncertainties associated with the Company’s 2010 business outlook, the Company concluded as of December 31, 2009, that it was not more likely than not that its net deferred tax assets would be realized.
F-22
Table of Contents
Inphi Corporation
Notes to Consolidated Financial Statements—(Continued)
(Dollars in thousands except share and per share amounts)
In March 2010, the Company received its first substantial quantity of production orders for a new low voltage product, which was a new low voltage version of the Company’s integrated PLL and register buffer. This new low voltage product was widely expected in the market to be significant and is expected to begin shipping in high volumes for both the Company and its competitors with a new Intel platform in the second half of 2010. This new low voltage product is currently in commercial production and is shipping in volume. The arrival of these production orders from one of the Company’s largest customers reduced concerns and increased confidence in the strength of the Company’s business outlook for the balance of 2010. In addition, certain other new product introductions began to gain traction with customers, providing additional confidence in the Company’s longer term outlook. The Company also achieved further clarity around certain contingencies related to ongoing litigation and certain other product acceptance concerns that existed at December 31, 2009. Furthermore, during the first quarter of 2010 the Company unexpectedly received additional orders for an older product that allowed the Company to exceed its overall plan for the quarter and continue the recent trend of profitability into the first quarter of 2010. At its April 30, 2010 meeting, based on a review of the positive developments that materialized in the first quarter of 2010, the Company’s Board of Directors decided to authorize management to retain investment bankers and proceed with plans to pursue a potential initial public offering. Based on these positive developments and an additional quarter of profitable operation, management reassessed the need for a valuation allowance at March 31, 2010 and concluded that a change in circumstances had occurred. Management determined that, based on the Company’s prospects and business outlook, it was reasonable to conclude that it is more likely than not that the Company’s deferred tax assets will be realized. Accordingly, the Company released the full valuation allowance recorded against its deferred tax assets based on the weight of positive evidence that existed at March 31, 2010. Significant judgment is required to determine the timing and extent of a valuation allowance release and the Company’s ability to utilize deferred tax assets will continue to be dependent on the ability to generate sufficient taxable income in future periods.
In the year ended December 31, 2010, the Company was profitable and utilized a substantial amount of its federal net operating loss carryforward. Based on the current trend of operating results and Company forecasts, the Company believes that it is more likely than not that it will recognize the full benefit of the deferred tax assets and no valuation allowance is required as of December 31, 2010.
The decrease in the valuation allowance for the years ended December 31, 2010, 2009 and 2008 was $24,022, $2,280 and $3,950, respectively.
General Income Tax Disclosures
The Company has net operating loss (“NOL”) carryforwards for federal and state income tax purposes of approximately $12.9 million and $41.5 million, respectively at December 31, 2010 that will begin to expire in 2022 and 2016 for federal income tax purposes and state income tax purposes, respectively. In addition, the Company has NOL carryforwards for foreign income tax purposes of $18.3 million at December 31, 2010, which do not expire.
At December 31, 2010, the Company also has federal and state research and development (“R&D”) tax credit carryforwards of $3.6 million and $2.3 million, respectively. The federal tax credits will begin to expire in 2024, unless previously utilized. The state tax credits do not expire.
Pursuant to Internal Revenue Code sections 382 and 383, use of the Company’s NOL and R&D credits generated prior to June 2004 are subject to an annual limitation due to a cumulative ownership percentage change that occurred in that period. The Company has had two changes in ownership, one in December 2000 and the second in June 2004, resulting in an annual limitation on NOL and R&D credit utilization.
F-23
Table of Contents
Inphi Corporation
Notes to Consolidated Financial Statements—(Continued)
(Dollars in thousands except share and per share amounts)
As of December 31, 2010, the Company had approximately $3.0 million of unrecognized tax benefits, $2.4 million of which, if recognized, would affect the effective income tax rate. The Company does not expect any significant increases or decreases to its unrecognized tax benefits within the next 12 months.
The following table summarizes the changes in unrecognized tax benefits:
| Year Ended December 31, | ||||||||||||
| 2010 | 2009 | 2008 | ||||||||||
| Balance as of January 1 |
$ | 1,283 | $ | 1,057 | $ | 891 | ||||||
| Additions based on tax positions related to the current year |
1,438 | 226 | 166 | |||||||||
| Additions based on tax positions of prior year |
264 | — | — | |||||||||
| Balance as of December 31 |
$ | 2,985 | $ | 1,283 | $ | 1,057 | ||||||
The Company recognizes interest and penalties related to unrecognized tax benefits as a component of income tax expense. The Company recognized no interest or penalties during the years ended December 31, 2010, 2009 and 2008 as the prior year’s unrecognized tax benefits reduce tax attributes that have not yet been utilized on the Company’s tax return.
The Company files income tax returns in the U.S. federal jurisdiction, state of California and certain foreign jurisdictions. The Company is no longer subject to U.S. federal income tax examinations for tax years ended on or before December 31, 2006 or to California state income tax examinations for tax years ended on or before December 31, 2005. However, to the extent allowed by law, the tax authorities may have the right to examine prior periods where net operating losses or tax credits were generated and carried forward, and make adjustments up to the amount of the net operating loss or credit carryforward.
On December 31, 2009, the federal R&D credit statute expired and was retroactively reinstated into law on December 17, 2010. Accordingly, the Company recorded a tax benefit for federal research credits for the year ended December 31, 2010.
The Company does not provide for U.S. income taxes on undistributed earnings of its controlled foreign corporations that are intended to be invested indefinitely outside the United States. At December 31, 2010, the Company had $0.1 million of undistributed earnings.
F-24
Table of Contents
Inphi Corporation
Notes to Consolidated Financial Statements—(Continued)
(Dollars in thousands except share and per share amounts)
8. Earnings Per Share
The following shows the computation of basic and diluted earnings per share:
| Year Ended December 31, | ||||||||||||
| 2010 | 2009 | 2008 | ||||||||||
| Numerator |
||||||||||||
| Net income (loss) |
$ | 26,131 | $ | 7,329 | $ | (3,428 | ) | |||||
| Less amount allocable to preferred stockholders |
(20,805 | ) | (7,193 | ) | — | |||||||
| Less amount allocable to unvested early exercised options and unvested restricted stock award |
(86 | ) | (6 | ) | — | |||||||
| Net income (loss) allocable to common stockholders—basic and diluted |
$ | 5,240 | $ | 130 | $ | (3,428 | ) | |||||
| Denominator |
||||||||||||
| Weighted average common stock |
5,137,029 | 1,671,565 | 1,289,431 | |||||||||
| Less weighted average unvested common stock subject to repurchase and unvested restricted stock award |
(50,860 | ) | (2,689 | ) | — | |||||||
| Weighted average common stock—basic |
5,086,169 | 1,668,876 | 1,289,431 | |||||||||
| Effect of potentially dilutive securities: |
||||||||||||
| Add options to purchase common stock |
3,425,528 | 1,103,828 | — | |||||||||
| Add warrants to purchase common stock |
34,840 | 12,573 | — | |||||||||
| Weighted-average common stock—diluted |
8,546,537 | 2,785,277 | 1,289,431 | |||||||||
| Earnings per share |
||||||||||||
| Basic |
$ | 1.03 | $ | 0.08 | $ | (2.66 | ) | |||||
| Diluted |
$ | 0.61 | $ | 0.05 | $ | (2.66 | ) | |||||
Net income has been allocated to the common stock, convertible participating preferred stock before conversion to common stock, unvested early exercised options and unvested restricted stock award based on their respective rights to share in dividends.
The following securities were not included in the computation of diluted earnings per share as inclusion would have been anti-dilutive:
| Year Ended December 31, | ||||||||||||
| 2010 | 2009 | 2008 | ||||||||||
| Convertible preferred stock |
12,776,077 | 14,481,699 | 14,367,283 | |||||||||
| Common stock options |
938,691 | 2,145,688 | 5,639,483 | |||||||||
| Warrant to purchase common stock |
— | — | 38,571 | |||||||||
| Warrant to purchase redeemable convertible preferred stock |
— | 17,187 | 17,187 | |||||||||
| Unvested early exercised options |
32,872 | 2,689 | — | |||||||||
| Unvested restricted stock award |
17,987 | — | — | |||||||||
| 13,765,627 | 16,647,263 | 20,062,524 | ||||||||||
F-25
Table of Contents
Inphi Corporation
Notes to Consolidated Financial Statements—(Continued)
(Dollars in thousands except share and per share amounts)
9. Convertible Preferred Stock
Convertible preferred stock as of December 31, 2009 consists of the following:
| Par Value Per Share |
Shares | Liquidation Value |
||||||||||||||
| Authorized | Outstanding | |||||||||||||||
| Series A |
$ | 0.001 | 528,858 | 518,555 | $ | 12,100 | ||||||||||
| Series B |
$ | 0.001 | 2,926,670 | 2,905,783 | 24,985 | |||||||||||
| Series C |
$ | 0.001 | 6,503,902 | 6,503,882 | 18,690 | |||||||||||
| Series D |
$ | 0.001 | 3,512,880 | 3,509,749 | 11,989 | |||||||||||
| Series E |
$ | 0.001 | 1,045,714 | 1,043,731 | 10,000 | |||||||||||
| 14,518,024 | 14,481,700 | $ | 77,764 | |||||||||||||
The Company’s Board of Directors is authorized to determine the rights of each offering of convertible preferred stock including, among other terms, dividend rights, voting rights, conversion rights, redemption prices and liquidation preferences, if any, subject to the limitations of applicable laws, regulations and its charter. In October 2010, the majority of preferred stockholders consented to the automatic conversion of preferred stock to common stock on a one-for-one basis immediately prior to the completion of the initial public offering. In November 2010, the Company completed its IPO and all shares of the Company’s then outstanding convertible preferred stock automatically converted into 14,795,413 shares of common stock. Accordingly, no convertible preferred stock was outstanding at December 31, 2010.
The following summarizes the terms of each series of the Company’s previously convertible preferred stock:
Conversion Rights
Each share of Series E and Series D was convertible, at the holder’s option, into such number of fully paid and nonassessable shares of common stock as determined by dividing $9.5809 and $3.4160 by the applicable conversion price, respectively. At December 31, 2009, the conversion price of the Series E and Series D was $9.5809 and $3.4160, respectively, such that each share of Series E and Series D was convertible into one share of common stock.
Each share of Series C, Series B and Series A was convertible, at the holder’s option, into such number of fully paid and nonassessable shares of common stock as determined by dividing $2.8738 by the applicable conversion price, as defined. At December 31, 2009 the conversion price of the Series C, Series B and Series A was $2.8738 such that each share of Series C, Series B or Series A was convertible into one share of common stock.
In the event of the issuance of additional shares of common stock, subject to certain exclusions, at a price per share less than the conversion price for any series of convertible preferred stock in effect on the date of such issuance, the conversion price for that series will be adjusted based on a weighted average anti-dilution formula. The conversion price was also subject to adjustment based on certain other anti-dilution provisions. Each share of convertible preferred stock automatically converted into shares of common stock at its then effective conversion rate either immediately upon the closing of a qualified initial public offering as defined, or upon the consent of a majority of the preferred stockholders.
F-26
Table of Contents
Inphi Corporation
Notes to Consolidated Financial Statements—(Continued)
(Dollars in thousands except share and per share amounts)
Redemption Provisions
The holders of Series E, Series D, Series C and Series B were entitled to redeem their shares in three equal installments at any time between July 30, 2012 and July 30, 2013, upon the written election of the holders of then outstanding shares. The redemption provisions required at least 50% of Series E and Series D and 66 2/3% of the Series C and Series B, voting on an as converted to common stock basis. The redemption price for each share of preferred stock was the sum equal to the Original Issue Price for each share of preferred stock, plus all declared but unpaid dividends on such shares at the time of payment. The Series A was not redeemable.
Liquidation Preference
In the event of any liquidation, dissolution or winding up of the Company, either voluntary or involuntary, the holders of Series E were entitled to receive, prior and in preference to any distribution of any assets or surplus funds to the holders of the Series D, Series C, Series B, Series A or common stock, $9.5809 per share for Series E plus any dividends declared but unpaid on such shares. If the funds to be distributed were insufficient to permit full payment of the preferential amounts, then the assets will be distributed to the Series E holders ratably in proportion to the full amount due to the Series E holders. After the payment of the Series E liquidation preference, any excess assets and funds of the Company will be distributed to the holders of the Series D, prior and in preference to any distribution of any assets or surplus funds to the holders of the Series C, Series B, Series A or common stock, at $3.4160 per share for Series D plus any dividends declared but unpaid on such shares. If the funds to be distributed were insufficient to permit full payment of the preferential amounts, then the assets will be distributed to the Series D holders ratably in proportion to the full amount due to the Series D holders. After the payment of the Series D liquidation preference, any excess assets and funds of the Company will be distributed to the holders of the Series C and Series B, prior and in preference to any distribution of any assets or surplus funds to the holders of the Series A or common stock, at $2.8738 per share for Series C and $8.5984 per share of Series B, plus any dividends declared but unpaid on such shares. If the funds to be distributed were insufficient to permit full payment of the preferential amounts, then the assets will be distributed to the Series C and Series B holders on a pari passu basis ratably in proportion to the full amount due to the Series C and Series B holders. After the payment of the Series C and Series B liquidation preference, any excess assets and funds of the Company will be distributed to the holders of the Series A, prior and in preference to any distribution of any assets or surplus funds to the holders of the common stock, at $23.34 per share for Series A plus any dividends declared but unpaid on such shares. If the funds to be distributed were insufficient to permit full payment of the preferential amounts, then the assets will be distributed to the Series A holders ratably in proportion to the full amount due to the Series A holders.
After the payment of the convertible preferred stock liquidation preferences, any excess assets and funds of the Company will be distributed ratably among the holders of the common stock and convertible preferred stockholders in proportion to the number of common shares held by them or issuable upon the conversion of the convertible preferred stock.
Liquidation was deemed to include the Company’s sale of all or substantially all of its assets or the acquisition of the Company by another person or entity by means of merger or consolidation resulting from the transfer of 50% or more of the Company’s voting power. Convertible preferred stockholders can waive this “deemed” liquidation preference by a vote of at least 67% of the convertible preferred stock, voting as a single class on an as-converted to common stock basis.
F-27
Table of Contents
Inphi Corporation
Notes to Consolidated Financial Statements—(Continued)
(Dollars in thousands except share and per share amounts)
Voting Rights
The convertible preferred stockholders were entitled to one vote for each share of common stock into which such convertible preferred stock can be converted.
Dividends
The holders of each series of convertible preferred stock were entitled to receive noncumulative dividends per annum when and if declared by the Board of Directors. The Series E, Series D, Series C, Series B and Series A were entitled to dividends of $0.7665, $0.2733, $0.2299, $0.6879, and $1.8667, per share, respectively. After the foregoing dividend payments, if any have been made in full for in a given calendar year, the holders of the preferred stock were entitled to receive dividends with the holders of common stock on an as-converted common stock basis if declared by the Board of Directors. No dividends have been declared or paid to date.
10. Warrants
In connection with various financing agreements, the Company issued warrants to purchase common stock and preferred stock. At December 31, 2009, the following warrants were outstanding:
| Number of Shares |
Exercise Price per Share |
|||||||
| Series B Preferred Stock Warrants |
15,045 | $ | 8.60 | |||||
| Series D Preferred Stock Warrants |
2,142 | 3.42 | ||||||
| Common Stock Warrants |
38,571 | 1.54 | ||||||
The warrants to purchase Series B expire upon the earlier to occur of 1) a Qualifying Acquisition as defined or 2) December 31, 2010. The warrant to purchase Series D expires on the longer to occur of 1) the seventh anniversary after the issuance date or 2) 3 years after the Company’s initial public offering. The warrant to purchase 12,857 shares of common stock expires on June 8, 2014. The warrant to purchase 25,714 of common stock expires on the earliest to occur of 1) June 22, 2012, 2) a Qualified Initial Public Offering, or 3) a Qualifying Acquisition as defined.
In June 2005, the FASB issued authoritative guidance on the classification of freestanding warrants and other similar instruments on shares that are redeemable (either puttable or mandatorily redeemable). The guidance requires liability classification for warrants issued that are exercisable into convertible preferred stock. Liability classification requires the warrants to be remeasured to their fair value each reporting period. At December 31, 2009, the fair value of the warrants of $55, was included in accrued liabilities and the changes in fair value has been recorded in other income (expense).
In November 2010, upon completion of the initial public offering, all preferred stock warrants were converted to common stock warrants. In addition, 15,045 warrants were exercised. As of December 31, 2010, there were 2,142 and 38,571 outstanding common stock warrants with exercise price of $3.42 and $1.54 per share, respectively.
F-28
Table of Contents
Inphi Corporation
Notes to Consolidated Financial Statements—(Continued)
(Dollars in thousands except share and per share amounts)
11. Stock Option Plan
In 2000, the Company adopted the 2000 Stock Option/Stock Issuance Plan (the Plan). Under provisions of the Plan, employees, outside directors, consultants and other independent advisors who provide services to the Company may be issued incentive and non-qualified stock options to purchase common stock or may be issued shares of common stock directly. The Board of Directors is authorized to administer the Plan and establish the stock option terms, including the exercise price and vesting period. Options granted under the plan may have varying vesting schedules; however, options generally vest 25% upon completion of one year of service and thereafter in 36 equal monthly installments. Options granted are immediately exercisable and the shares issued upon exercise of the option are subject to a repurchase right held by the Company. The repurchase price under the repurchase right is the original exercise price and the right lapses in accordance with the option-vesting schedule. There were 32,875 and 89,232 unvested shares subject to the Company’s repurchase right as of December 31, 2010 and 2009, respectively. The proceeds received from the unvested early exercise of options are presented in the balance sheet as liabilities and subsequently classified to equity based on the vesting schedule. The vesting of certain options granted or shares issued under the Plan is subject to acceleration of vesting upon the occurrence of certain events as defined in the Plan.
Under the Plan, the exercise price, in the case of an incentive stock option, can not be less than 100%, and in the case of a nonqualified stock option, not less than 85%, of the fair market value of such shares on the date of grant. The term of the option is determined by the Board but in no case can exceed 10 years. At December 31, 2009, 7,901,158 shares of common stock have been reserved for issuance under the Plan.
In June 2010, the Board of Directors approved the Company’s 2010 Stock Incentive Plan, which became effective in November 2010. Upon completion of the Company’s initial public offering, shares originally reserved for issuance under the 2000 Plan but which were not issued or subject to outstanding grants on the effective date of the 2010 Stock Incentive Plan, and share subject to outstanding options or forfeiture restriction under the 2000 Plan on the effective date of the 2010 Stock Incentive Plan that are subsequently forfeited or terminated before being exercised, become available for awards under the 2010 Stock Incentive plan, up to 428,571 shares. At December 31, 2010, 2,032,192 shares of common stock have been reserved for issuance under the 2010 Stock Incentive Plan. There were no equity awards granted under this plan in 2010.
The fair value of each option grant is estimated on the date of grant using the Black-Scholes option pricing model with the following weighted average assumptions:
| Year Ended December 31, | ||||||||||||
| 2010 | 2009 | 2008 | ||||||||||
| Risk-free interest rate |
2.99 | % | 2.67 | % | 4.13 | % | ||||||
| Expected life (in years) |
6.42 | 6.25 | 6.25 | |||||||||
| Dividend yield |
— | — | — | |||||||||
| Expected volatility |
60.00 | % | 68.00 | % | 55.00 | % | ||||||
F-29
Table of Contents
Inphi Corporation
Notes to Consolidated Financial Statements—(Continued)
(Dollars in thousands except share and per share amounts)
The following table summarizes information regarding options outstanding:
| Number of Shares |
Weighted Average Exercise Price |
Weighted Average Remaining Contractual Life |
Aggregate Intrinsic Value |
|||||||||||||
| Outstanding at December 31, 2009 |
5,362,506 | 1.61 | 6.84 | $ | 15,175 | |||||||||||
| Granted |
1,839,738 | 9.75 | ||||||||||||||
| Exercised |
(396,753 | ) | 1.22 | |||||||||||||
| Canceled |
(133,242 | ) | 2.88 | |||||||||||||
| Outstanding at December 31, 2010 |
6,672,249 | $ | 3.85 | 6.88 | $ | 108,369 | ||||||||||
| Exercisable at December 31, 2010 |
6,672,249 | $ | 3.85 | 6.88 | $ | 108,369 | ||||||||||
| Vested at December 31, 2010 |
3,874,307 | $ | 1.61 | 5.48 | $ | 71,608 | ||||||||||
| Vested and expected to vest at December 31, 2010 |
6,658,466 | $ | 3.84 | 6.87 | $ | 108,205 | ||||||||||
The intrinsic value of options outstanding, exercisable and vested and expected to vest is calculated based on the difference between the exercise price and the fair value of the Company’s common stock as of the respective balance sheet date.
Stock-based compensation expense is included in the Company’s results of operations as follows:
| Year Ended December 31, | ||||||||||||
| 2010 | 2009 | 2008 | ||||||||||
| Operating expenses |
||||||||||||
| Cost of goods sold |
$ | 107 | $ | 31 | $ | 119 | ||||||
| Research and development |
1,381 | 475 | 358 | |||||||||
| Sales and marketing |
526 | 238 | 101 | |||||||||
| General and administrative |
691 | 421 | 417 | |||||||||
| $ | 2,705 | $ | 1,165 | $ | 995 | |||||||
Total unrecognized compensation cost related to unvested stock options at December 31, 2010, prior to the consideration of expected forfeitures, is approximately $10,219 and is expected to be recognized over a weighted-average period of 3.52 years.
The total fair value of employee options vested during the years ended December 31, 2010, 2009 and 2008 was $887, $963 and $1,007, respectively.
The weighted average grant date fair value per share of stock options granted to employees during the years ended December 31, 2010, 2009 and 2008 was $5.79, $1.34 and $1.10, respectively.
The total intrinsic value of options exercised during the years ended December 31, 2010, 2009 and 2008 was $3,247, $890 and $294, respectively. The intrinsic value of exercised options is calculated based on the difference between the exercise price and the fair value of the Company’s common stock as of the exercise date. Cash received from the exercise of stock options was $485, $733 and $644, respectively, for the years ended December 31, 2010, 2009 and 2008.
F-30
Table of Contents
Inphi Corporation
Notes to Consolidated Financial Statements—(Continued)
(Dollars in thousands except share and per share amounts)
On April 30, 2010, the Board of Directors granted 17,142 restricted stock awards to a Board member with a fair value of $9.29. The award vests 25% after one year of service and thereafter in 36 equal monthly installments.
On August 17, 2010, the Board of Directors granted 17,142 restricted stock awards to a Board member with a fair value of $12.02. The award vests 25% after one year of service and thereafter in 36 equal monthly installments.
12. Employee Benefit Plan
The Company has established a 401(k) tax-deferred savings plan (the “Plan”) which permits participants to make contributions by salary deduction pursuant to Section 401(k) of the Internal Revenue Code of 1986, as amended. The Company may, at its discretion, make matching contributions to the Plan. Furthermore, the Company is responsible for administrative costs of the Plan. The Company has not made contributions to the Plan since its inception.
13. Fair Value Measurements
The guidance on fair value measurements requires fair value measurements to be classified and disclosed in one of the following three categories:
Level 1: Unadjusted quoted prices in active markets that are accessible at the measurement date for identical, unrestricted assets or liabilities;
Level 2: Quoted prices in markets that are not active, or inputs which are observable, either directly or indirectly, for substantially the full term of the asset or liability, or
Level 3: Prices or valuation techniques that require inputs that are both significant to the fair value measurement and unobservable (i.e., supported by little or no market activity).
The following table presents information about assets and liabilities required to be carried at fair value on a recurring basis:
| December 31, 2010 |
Level 2 | Level 3 | Total | |||||||||
| Cash equivalents |
$ | 80,017 | $ | — | $ | 80,017 | ||||||
| December 31, 2009 |
Level 1 | Level 3 | Total | |||||||||
| Cash equivalents |
$ | 15,212 | $ | — | $ | 15,212 | ||||||
| Warrants |
— | (55 | ) | (55 | ) | |||||||
| $ | 15,212 | $ | (55 | ) | $ | 15,157 | ||||||
As of December 31, 2010, cash equivalents consist mainly of money market funds which are valued using the amortized cost method, in accordance with Rule 2a-7 under the 1940 Act which approximates fair value. Cash equivalents as of December 31, 2010 are categorized as Level 2.
As of December 31, 2009, cash equivalents consist mainly of money market funds which are traded in active exchange markets. The cash equivalents are categorized as Level 1.
F-31
Table of Contents
Inphi Corporation
Notes to Consolidated Financial Statements—(Continued)
(Dollars in thousands except share and per share amounts)
The Company utilized a Black-Scholes option pricing model in order to determine the fair value of the preferred stock warrants, including the consideration of a risk-free interest rate, expected term and expected volatility. Certain inputs used in the model are unobservable. The fair values of preferred stock warrants can change significantly based on market conditions and changes in the underlying value of the convertible preferred stock. Preferred stock warrants were categorized as Level 3. As of December 31, 2010, the preferred stock warrants were converted to common stock warrant as a result of the IPO.
The following table summarizes the change in value of the preferred stock warrants for the years ended December 31, 2010 and 2009:
| 2010 | 2009 | |||||||
| Balance at beginning of year |
$ | 55 | $ | 72 | ||||
| Change in fair value included in other (income) expense |
75 | (17 | ) | |||||
| Transfer to additional paid-in capital |
(130 | ) | — | |||||
| Balance at end of year |
$ | — | $ | 55 | ||||
14. Segment Information
The Company operates in one reportable segment. The Company’s Chief Executive Officer, who is considered to be the chief operating decision maker, manages the Company’s operations as a whole and reviews consolidated financial information for purposes of evaluating financial performance and allocating resources. Revenue by region is classified based on the locations to which the product is transported, which may differ from the customer’s principal offices.
The following table sets forth the Company’s revenue by geographic region:
| Year Ended December 31, | ||||||||||||
| 2010 | 2009 | 2008 | ||||||||||
| United States |
$ | 13,528 | $ | 10,727 | $ | 12,265 | ||||||
| Korea |
14,319 | 18,307 | 15,147 | |||||||||
| Japan |
6,557 | 5,688 | 5,903 | |||||||||
| China |
29,238 | 9,924 | 2,258 | |||||||||
| Taiwan |
6,838 | 5,687 | 1,544 | |||||||||
| Other |
12,713 | 8,519 | 5,837 | |||||||||
| $ | 83,193 | $ | 58,852 | $ | 42,954 | |||||||
As of December 31, 2009, substantially all of the Company’s long-lived tangible assets were located in the United States. As of December 31, 2010, $1,280 of long-lived tangible assets are located outside the United States of which $864 are located in Taiwan.
15. Commitments and Contingencies
Leases
The Company leases its facility and certain equipment under noncancelable lease agreements expiring in various years through 2016. The Company also licenses certain software used in its research and development activities under a term license subscription and maintenance arrangement.
F-32
Table of Contents
Inphi Corporation
Notes to Consolidated Financial Statements—(Continued)
(Dollars in thousands except share and per share amounts)
Future minimum lease payments under noncancelable operating leases having initial terms in excess of one year are as follows:
| December 31, 2010 |
||||
| 2011 |
$ | 3,726 | ||
| 2012 |
2,965 | |||
| 2013 |
1,180 | |||
| 2014 |
1,188 | |||
| 2015 |
1,006 | |||
| 2016 |
736 | |||
| $ | 10,801 | |||
For the years ended December 31, 2010, 2009 and 2008, lease operating expense was $3,272, $2,811 and $2,649, respectively.
Noncancelable Purchase Obligations
The Company’s noncancelable purchase obligations consisted primarily of license and consulting fees the Company committed to pay under several agreements. As of December 31, 2010, the Company’s future noncancelable purchase obligations are as follows:
| December 31, 2010 |
||||
| 2011 |
$ | 745 | ||
| 2012 |
175 | |||
| $ | 920 | |||
Legal Proceedings
Netlist, Inc. v. Inphi Corporation, Case No. 09-cv-6900 (C.D. Cal.)
On September 22, 2009, Netlist filed suit in the United States District Court, Central District of California, or the Court, asserting that the Company infringes U.S. Patent No. 7,532,537. Netlist filed an amended complaint on December 22, 2009, further asserting that the Company infringes U.S. Patent Nos. 7,619,912 and 7,636,274, collectively with U.S. Patent No. 7,532,537, the patents-in-suit, and seeking both unspecified monetary damages to be determined and an injunction to prevent further infringement. These infringement claims allege that the Company’s iMB™ and certain other memory module components infringe the patents-in-suit. The Company answered the amended complaint on February 11, 2010 and asserted that the Company does not infringe the patents-in-suit and that the patents-in-suit are invalid. The Company has since filed inter partes requests for reexamination with the United States Patent and Trademark Office (the “USPTO”), asserting that the patents-in-suit are invalid.
On August 27, 2010, the USPTO granted the Request for Inter Partes Reexamination for U.S. Patent No. 7,636,274 and found a substantial new question of patentability based upon each of the different issues that the Company raised as the reexamination requestor. The USPTO has not, however, accompanied its Reexamination Order of U.S. Patent No. 7,636,274 with its own evaluation of the validity of this patent,
F-33
Table of Contents
Inphi Corporation
Notes to Consolidated Financial Statements—(Continued)
(Dollars in thousands except share and per share amounts)
indicating that such evaluation will be forthcoming at a later time. With respect to the granted reexamination request for U.S. Patent No. 7,636,274, the USPTO will evaluate the validity of this patent in reexamination proceedings.
On September 8, 2010, the USPTO ordered the Inter Partes Request for Reexamination for U.S. Patent No. 7,532,537 and found a substantial new question of patentability based upon different issues that the Company raised as the reexamination requestor. The USPTO accompanied this Reexamination Order of U.S. Patent No. 7,532,537 with its own evaluation of the validity of this patent, and rejected some but not all of claims. In a response dated October 8, 2010, Netlist responded to the USPTO determination by amending some but not all of the claims, adding new claims and making arguments why the claims were not invalid in view of the cited references. The Company provided rebuttal comments to the USPTO on January 27, 2011, which the USPTO will consider, and the proceeding will continue in accordance with established inter partes reexamination procedures.
On September 8, 2010, the USPTO ordered the Inter Partes Request for Reexamination for U.S. Patent No. 7,619,912 and found a substantial new question of patentability based upon different issues that we raised as the reexamination requestor. The USPTO accompanied this Reexamination Order of U.S. Patent No. 7,619,912 with its own evaluation of the validity of this patent, and determined that all of the claims were patentable based upon the Company’s reexamination. Netlist has not commented upon this Reexamination Order. The USPTO on February 28, 2011 also merged the Proceedings of our Reexamination of U.S. Patent No. 7,619,912, bearing Control No. 90/001,339 with Inter Partes Reexamination Proceeding 95/000,578 filed October 20, 2010 on behalf of SMART Modular Technologies, Inc. and Inter Partes Reexamination Proceeding 95/000,579 filed October 21, 2010 on behalf of Google, Inc. In each of these other Reexamination Proceedings, the USPTO had indicated that there existed a substantial new question of patentability with respect to certain claims of U.S. Patent No. 7,619,912, but had not accompanied the Reexamination Orders related thereto with its own evaluation of the validity of this patent, indicating that such evaluation would be forthcoming at a later time. The merged Reexamination Proceeding will be conducted in accordance with established procedures for merged Reexamination Proceedings. As part of the merged Reexamination Proceeding, once the USPTO issues a Right of Notice of Appeal, the Company will have the opportunity to appeal the USPTO determination of its Reexamination Request in accordance with these established procedures for merged Reexamination Proceedings.
The reexamination proceedings could result in a determination that the patents-in-suit, in whole or in part, are valid or invalid, as well as modifications of the scope of the patents-in-suit.
A third party, Sanmina-SCI Corporation, or SSC, has also requested interference proceedings with the USPTO with respect to each of the patents-in-suit. In its April 21, 2010 Request for Continued Examination of U.S. Application No. 11/142,989 (“SSC ’989 patent application”), SSC asserted that it has priority to the inventions claimed by the patents-in-suit and should be granted rights to those inventions. The Company has entered into an agreement with SSC for a non-exclusive license to those rights, if any, that SSC may obtain to the inventions claimed by the patents-in-suit if the USPTO agrees to commence interference proceedings and if SSC prevails in those proceedings.
The USPTO, in a communication dated July 7, 2010, acknowledged that claims were submitted in a filing made in the SSC ‘989 patent application to invoke an Interference with each of the patents-in-suit, but has declined to declare an Interference at this time. The July 7, 2010 USPTO communication rejected the claims submitted to invoke the Interference based upon 35 USC 112, with the rejection asserting that these claims contain “subject matter which was not described in the specification in such a way as to reasonably convey to one
F-34
Table of Contents
Inphi Corporation
Notes to Consolidated Financial Statements—(Continued)
(Dollars in thousands except share and per share amounts)
skilled in the relevant art that the inventor(s), at the time the application was filed, had possession of the claimed invention.” SSC responded to this USPTO communication on December 24, 2010, and a further communication from the USPTO is anticipated.
In connection with the reexamination requests and the interference proceedings, the Company also filed a motion to stay proceedings with the Court, which was granted on May 18, 2010, whereby the Court stayed the proceedings until at least February 14, 2011, requested that Netlist notify the Court within one week of any action taken by the USPTO in connection with the reexamination or interference proceedings, and requested that the parties file papers by January 31, 2011 stating their position on whether the stay should be extended. The Company filed its paper on January 31, 2011 stating the reasons it believed the stay should be maintained and Netlist, having been given leave to file its paper later, filed its paper on February 21, 2011. the Court ordered a continued stay of the proceedings until February 24, 2012, that the parties file papers by January 30, 2012 stating their position on whether the stay should be extended, and that Netlist notify the Court within one week of any action taken by the USPTO in the reexamination or interference proceedings. While the Court granted the stay until February 24, 2012, the Court could lift the stay before then. For example, if the USPTO confirms that all claims of the patents-in-suit are patentable, the Court may decide to lift the stay. While the Company intends to defend the lawsuit vigorously, litigation, whether or not determined in the Company’s favor or settled, could be costly and time-consuming and could divert management’s attention and resources, which could adversely affect the Company’s business.
If this litigation results in an adverse outcome, we may be required to cease the manufacture, use or sale of any product held to infringe Netlist’s patents, including our iMB product, unless and until we or our customers obtain a license from Netlist. A license from Netlist may or may not be available on commercially reasonable terms. An adverse outcome could also result in our having to pay damages for infringement and the expenditure of significant resources to redesign any infringing product, including our iMB product, in a non-infringing manner, which may or may not be successful. To date, we have only sampled our iMB product and, as a result, we have generated very little revenue. Our ability to generate future revenue from our iMB product, could be adversely affected, though it is currently difficult to estimate the level at which this may affect our revenue.
Inphi Corporation v. Netlist, Inc, Case No. 09-cv-8749 (C.D. Cal.).
On November, 30, 2009, the Company filed suit in the United States District Court, Central District of California asserting that Netlist infringes U.S. Patent Nos. 7,307,863 and 7,479,799, collectively the patents-in-suit, and are seeking both unspecified monetary damages and an injunction to prevent further infringement. Netlist answered the complaint on January 15, 2010 and filed an amended answer on April 22, 2010, asserting that it does not infringe the patents-in-suit, that the patents-in-suit are invalid and that U.S. Patent No. 7,479,799 is unenforceable due to inequitable conduct before the USPTO. Discovery is currently proceeding, and the Court has set a trial date of October 11, 2011.
The Company is unable to assess the possible outcome of these matters. However, because of the nature and inherent uncertainties of litigation, should the outcome of these actions be unfavorable, the Company’s business, financial condition, results of operations or cash flows could be materially and adversely affected.
Indemnifications
In the ordinary course of business, the Company may provide indemnifications of varying scope and terms to customers, vendors, lessors, investors, directors, officers, employees and other parties with respect to certain
F-35
Table of Contents
Inphi Corporation
Notes to Consolidated Financial Statements—(Continued)
(Dollars in thousands except share and per share amounts)
matters, including, but not limited to, losses arising out of the Company’s breach of such agreements, services to be provided by the Company, or from intellectual property infringement claims made by third-parties. These indemnifications may survive termination of the underlying agreement and the maximum potential amount of future payments the Company could be required to make under these indemnification provisions may not be subject to maximum loss clauses. The Company has not incurred material costs to defend lawsuits or settle claims related to these indemnifications. As a result, the Company believes the estimated fair value of these agreements is immaterial. Accordingly, the Company has no liabilities recorded for these agreements as of December 31, 2010 and 2009.
16. Related Party Transactions
The Company recognized $27,940, $21,235 and $10,227 in revenue during the December 31, 2010, 2009 and 2008, respectively, from an investor. The receivable balance from the investor as of December 31, 2010 and 2009 was $3,386, and $3,411, respectively.
In 2007, the Company entered into software subscription and maintenance agreement with Cadence Design Systems, Inc. (“Cadence”), a related party company. A member of the Company’s Board of Directors is also the Chief Executive Officer, President and a director of Cadence. The Company committed to pay $7 million payable in 16 quarterly payments through May 2011. The Company paid $2.1 million, $1.8 million and $1.4 million in the years ended December 31, 2010, 2009 and 2008, respectively. Operating lease expense related to this agreement included in research and development expense was $1.8 million for the years ended December 31, 2010, 2009 and 2008. In December 2010, the software subscription and maintenance agreement was renewed effective June 30, 2011. Under the new agreement, the Company committed to pay $5.25 million payable in 10 quarterly payments through November 2013.
17. Subsequent Events
On January 20, 2011, the Board of Directors granted a 8,879 restricted stock unit award to a Board member and options to purchase an aggregate of 26,450 shares to new employees and a consultant.
F-36
Table of Contents
Winyatek Technology Inc.
Index to Combined Carve-out Financial Statements
| Page(s) | ||||
| F-38 | ||||
| F-39 | ||||
| F-40 | ||||
| F-41 | ||||
| F-42 | ||||
| F-43 | ||||
F-37
Table of Contents
Report of Independent Auditors
To the Stockholders and Board of Directors of
Winyatek Technology Inc.,
In our opinion, the accompanying combined carve-out balance sheet and the related combined carve-out statements of operations, of changes in stockholders’ equity and of cash flows present fairly, in all material respects, the financial position of Winyatek Technology Inc. (the “Company”) at December 31, 2009, and the results of its operations and its cash flows for the year then ended in conformity with accounting principles generally accepted in the United States of America. These financial statements are the responsibility of the Company’s management. Our responsibility is to express an opinion on these financial statements based on our audit. We conducted our audit of these statements in accordance with auditing standards generally accepted in the United States of America. Those standards require that we plan and perform the audit to obtain reasonable assurance about whether the financial statements are free of material misstatement. An audit includes examining, on a test basis, evidence supporting the amounts and disclosures in the financial statements, assessing the accounting principles used and significant estimates made by management, and evaluating the overall financial statement presentation. We believe that our audit provide a reasonable basis for our opinion.
The Company has historically been consolidated as wholly-owned business unit of Goyatek Technology Inc., and consequently, as described in Note 1, these combined carve-out financial statements have been substantially derived from the accounting records of Goyatek and reflect significant assumptions and allocations. Accordingly, these combined carve-out financial statements do not necessarily reflect the financial position, results of operations and cash flows of the Company had it been a separate stand-alone entity during the reporting period.
/s/ PricewaterhouseCoopers, Taiwan
Taipei, Taiwan
August 12, 2010
F-38
Table of Contents
Combined Carve-Out Balance Sheet
December 31, 2009
(EXPRESSED IN NEW TAIWAN DOLLARS)
| Assets |
||||
| Current assets |
||||
| Cash (Note 3) |
$ | 45,000,101 | ||
| Accounts receivable (Note 4) |
2,097,714 | |||
| Inventories (Note 5) |
9,997,679 | |||
| Prepaid expenses |
2,000,000 | |||
| Total current assets |
59,095,494 | |||
| Property and equipment—net (Note 6) |
1,564,972 | |||
| Intangible assets (Note 7) |
15,748,629 | |||
| Total assets |
$ | 76,409,095 | ||
| Liabilities and Stockholders’ Equity |
||||
| Current liabilities |
||||
| Trade payables—related party (Note 9) |
$ | 4,468,966 | ||
| Accrued expense and other payables (Note 9) |
2,730,835 | |||
| Total current liabilities |
7,199,801 | |||
| Capital collected in advance (Note 11) |
45,000,000 | |||
| Total liabilities |
52,199,801 | |||
| Commitments (Note 10) |
||||
| Stockholders’ equity |
||||
| Issued: 4,000,000 shares, $10 par value included capital contribution of $42,280,526 |
||||
| Capital contribution due from Goyatek (Note 1) |
82,280,526 | |||
| Accumulated deficit |
(58,071,232 | ) | ||
| Total stockholders’ equity |
24,209,294 | |||
| Total liabilities and stockholders’ equity |
$ | 76,409,095 | ||
The accompanying notes are an integral part of these financial statements.
F-39
Table of Contents
Combined Carve-Out Statement of Operations
Year ended to December 31, 2009
(EXPRESSED IN NEW TAIWAN DOLLARS)
| Net sales |
$ | 51,949,811 | ||
| Cost of sales (Note 9) |
(27,171,313 | ) | ||
| Gross profit |
24,778,498 | |||
| Depreciation |
(520,138 | ) | ||
| Amortization |
(9,458,724 | ) | ||
| Research and development expenses |
(36,454,652 | ) | ||
| Selling and administrative expenses |
(36,336,753 | ) | ||
| Total operating expenses |
(82,770,267 | ) | ||
| Operating loss |
(57,991,769 | ) | ||
| Interest income/expense |
127,839 | |||
| Loss on foreign currency exchange |
(263,190 | ) | ||
| Other income |
55,899 | |||
| Loss before income tax |
(58,071,221 | ) | ||
| Income tax expense (Note 8) |
(11 | ) | ||
| Net loss |
$ | (58,071,232 | ) | |
The accompanying notes are an integral part of these financial statements.
F-40
Table of Contents
Combined Carve-Out Statement of Changes in Stockholders’ Equity
Year Ended December 31, 2009
(EXPRESSED IN NEW TAIWAN DOLLARS)
| Capital Contribution due from Goyatek |
Accumulated Deficit |
Total | ||||||||||
| Balances at January 1, 2009 |
$ | 27,292,463 | $ | — | $ | 27,292,463 | ||||||
| Issuance of capital stock for cash |
40,000,000 | — | 40,000,000 | |||||||||
| Contribution from Goyatek |
14,988,063 | — | 14,988,063 | |||||||||
| Net loss |
— | (58,071,232 | ) | (58,071,232 | ) | |||||||
| Balances at December 31, 2009 |
$ | 82,280,526 | $ | (58,071,232 | ) | $ | 24,209,294 | |||||
The accompanying notes are an integral part of these financial statements.
F-41
Table of Contents
Combined Carve-Out Statements of Cash Flows
Year Ended December 31, 2009
(EXPRESSED IN NEW TAIWAN DOLLARS)
| Cash flows from operating activities |
||||
| Net loss |
$ | (58,071,232 | ) | |
| Adjustments to reconcile net loss to net cash used in operating activities: |
||||
| Depreciation |
520,138 | |||
| Amortization |
9,458,724 | |||
| Provision for reduction of inventories to market value |
208,301 | |||
| Changes in assets and liabilities |
||||
| Accounts receivable |
(2,097,714 | ) | ||
| Inventories |
(10,205,980 | ) | ||
| Prepaid expenses |
(2,000,000 | ) | ||
| Trade payables—related party |
4,468,966 | |||
| Accrued expenses and other payables |
2,730,835 | |||
| Net cash used in operating activities |
(54,987,962 | ) | ||
| Cash flows from financing activities |
||||
| Increase in capital contribution due from Goyatek |
54,988,063 | |||
| Increase in capital collected in advance |
45,000,000 | |||
| Net cash provided by financing activities |
99,988,063 | |||
| Net increase in cash |
45,000,101 | |||
| Cash |
||||
| Beginning of year |
— | |||
| End of year |
$ | 45,000,101 | ||
| Supplemental disclosures of cash flow information |
||||
| Interest paid |
$ | 77,656 | ||
| Income tax paid |
$ | 11 | ||
The accompanying notes are an integral part of these financial statements.
F-42
Table of Contents
Notes to Combined Carve-Out Financial Statements
December 31, 2009
(EXPRESSED IN NEW TAIWAN DOLLARS)
1. Business and Basis for Presentation of Combined Carve-out Financial Statements
Winyatek Technology Inc.(the “Company”) was incorporated under the provisions of the Company Law of the Republic of China (R.O.C) on November 12, 2009. The Company is primarily engaged in the research, design , development, manufacture and sale of Nand Flash Controller System-On-Chip, applied in the UFD, SD/MMC, and Card Reader products. In addition, the Company provides clients with manufacturing kits to help them finish product certification and online output in the shortest time.
Goyatek Technology Inc. (“Goyatek”) started its NAND Flash memory business in November 2008 with substantive operation commencing in 2009 and announced its intention to separate such business into a subsidiary in November 2009. On November 5, 2009, the Board of Directors of Goyatek passed a resolution to approve the spin off and create the Company with share capital of $1,000,000 at par value of $10 per share, and subsequently the Company increased the share capital by $39,000,000 at par value of $10 per share. On December 31, 2009, as part of the spin-off, Goyatek transferred its property, equipment and intangible assets with total carrying amount of $17,313,601 to the Company.
As of December 31, 2009, the Company’s issued and outstanding shares were 4,000,000 shares, and Goyatek, the Company’s ultimate parent company, held a 100% equity interest in the Company.
Basis of preparation
The Combined Carve-out Financial Statements of the Company have been prepared in accordance with generally accepted accounting principles in the United States of America. The financial statements of the Company as of and for the year ended December 31, 2009, represent a combination of the operations data of the NAND Flash memory business of Goyatek during the period from January 1, 2009 to November 17, 2009 that were transferred to the Company as discussed above, and the actual operations of the Company after the spin-off for the period from November 18, 2009 to December 31, 2009.
The financial information included herein may not necessarily reflect the results of operations, financial position, changes in shareholders’ equity and cash flows of the Company in the future, or what they would have been had it been a separate, stand-alone entity since the beginning of the period presented.
Balance sheet
Cash represents cash held by the Company as of December 31, 2009. Accounts receivables represent the amounts directly attributable to sales to customers of the Company’s products. Inventories represent the amount on hand as of the balance sheet date relating to the Company’s products. Trade payables represent the amounts attributable to the purchase of the Company’s products and other related costs directly attributable to the Company.
Capital contribution due from Goyatek primarily represents contribution of working capital as well as allocation of income and expenses before the incorporation of the Company.
Statement of operations
Net sales and cost of sales
Sales and cost of sales are distinguished by product line that the Company used to operate as part of Goyatek as if the Company had been a separate legal entity for the whole year of 2009. Therefore, sales and cost of sales represent those related to the operations of the NAND Flash memory business of Goyatek.
F-43
Table of Contents
Winyatek Technology Inc.
Notes to Combined Carve-Out Financial Statements—(Continued)
December 31, 2009
(EXPRESSED IN NEW TAIWAN DOLLARS)
Expenses
Personnel expenses are allocated to the Company based on the percentage of department payroll of Goyatek. The percentage applied to the Company for the allocation is 61.38%. Except for the allocation by the aforementioned percentage, other incurred expenses are directly charged to the Company as if the Company had been a separate legal entity. Management believes that the rationale and basis for the expense allocation is reasonable.
Financial Items
Financial items include interest income and loss on foreign currency exchange, all of which are credited /charged directly to the Company as if the Company had been a separate legal entity.
Statement of Changes in Stockholders’ Equity
The Statement of Changes in Stockholders’ Equity is presented based on the assumption that the Company had been a separate legal entity from January 1, 2009 and reflect capital contributions of the transferred fixed assets and intangible assets as of January 1, 2009 from Goyatek.
Cash Flow Statement
The Cash Flow Statement is presented based on the assumption that the Company had been a separate legal entity from January 1, 2009 with historical operation incurred or allocated to the Company. The increase in capital contribution from Goyatek included cash capital of $40,000,000 and the working capital funded from Goyatek during the entire year of 2009.
2. Summary of Significant Accounting Policies
USE OF ESTIMATES
The preparation of financial statements in conformity with generally accepted accounting principles in the United States requires management to make estimates and assumptions that affect the amounts of assets and liabilities and the disclosures of contingent assets and liabilities at the date of the financial statements and the amounts of revenues and expenses during the reporting period. Actual results could differ from those assumptions and estimates.
FOREIGN CURRENCY TRANSACTIONS
Receivables, other monetary assets and liabilities denominated in foreign currencies are translated at the spot exchange rates prevailing at the balance sheet date. Exchange gains or losses are recognized in profit or loss.
ACCOUNTS RECEIVABLE AND ALLOWANCE FOR DOUBTFUL ACCOUNTS
Trade accounts receivable are recorded at the invoiced amount and do not bear interest. We maintain an allowance for doubtful accounts for estimated losses resulting from the potential inability of our customers to make required payments. Our allowance for doubtful accounts is based on historical collection experience, adjusted for any specific known conditions or circumstances. Uncollectable account balances are charged against the allowance when we believe that it is probable that the receivable will not be recovered.
F-44
Table of Contents
Winyatek Technology Inc.
Notes to Combined Carve-Out Financial Statements—(Continued)
December 31, 2009
(EXPRESSED IN NEW TAIWAN DOLLARS)
INVENTORIES
The perpetual inventory system is adopted for inventory recognition. Inventories are stated at cost. The cost is determined using the weighted-average method. Finished goods and work in process inventories include material, labor and manufacturing overhead costs. The Company regularly reviews and writes down the value of inventory as required for estimated obsolescence or unmarketability. At the end of period, inventories are evaluated at the lower of cost or net realizable value, and the specific identification approach is used in the comparison to cost and net realizable value.
SIGNIFICANT CREDIT RISK
The majority of the Company’s customers are located in Taiwan. Concentration of credit risk with respect to accounts receivable is limited due to the large number of customers in various channels comprising the Company’s customer base. The Company regularly evaluates the adequacy of its allowance for doubtful accounts, in the aggregate, have not exceeded management’s expectations. No significant bad debts occurred in 2009. It is assessed that no significant credit risk will arise.
PROPERTY AND EQUIPMENT
Property and equipment are recorded at cost. Depreciation is based on the following estimated useful lives of the assets using the straight-line method:
| Computer equipment |
5 years | |||
| Trial equipment |
3 years |
Expenditures for repairs and maintenance are charged to expense as incurred. Expenditures for major renewals and betterments are capitalized and depreciated over the remaining useful lives. As assets are retired or sold, the related cost and accumulated depreciation are removed from the accounts and any resulting gain or loss is included in the results of operations.
INTANGIBLE ASSETS
Patents with finite lives are amortized over their estimated useful lives, which range from two to ten years. Software costs are amortized on a straight-line basis over their estimated useful lives.
PENSION PLAN
Under R.O.C. defined contribution pension plan, the Company contributes monthly an amount based on 6% of the employees’ monthly salaries and wages to the employees’ individual pension accounts at the Bureau of Labor Insurance. The amount contributed is recognized as pension cost as incurred on an accrual basis. The pension cost for the year ended December 31, 2009 amounted to $1,508,813, which is part of the R&D expense and selling and administrative expenses on the Statement of Operations.
INCOME TAXES
Current income taxes are determined based on estimated taxes payable or refundable on tax returns for the current year. Deferred income taxes are determined using enacted tax rates for the effect of temporary differences
F-45
Table of Contents
Winyatek Technology Inc.
Notes to Combined Carve-Out Financial Statements—(Continued)
December 31, 2009
(EXPRESSED IN NEW TAIWAN DOLLARS)
between the book and tax bases of recorded assets and liabilities. The effect on deferred tax assets and liabilities of a change in tax rates is recognized in income in the period that includes the enactment date. Valuation allowance on deferred tax assets is provided to the extent that it is more likely than not that the tax benefit will not be realized.
The Company’s taxable income or loss was included in the income tax return of Goyatek as the operating assets and liabilities of the Company were not formally transferred by Goyatek to the Company until December 31, 2009. The Company was effectively treated as a division of Goyatek through December 31, 2009. Further, there was no tax-sharing agreement between the Company and Goyatek. Since there is a full valuation allowance against the Company’s deferred tax assets, there is no deemed distribution from the Company to Goyatek as the book value of the deferred tax assets is zero.
NET SALES AND COST OF SALES
The Company’s products are fully functional at the time of shipment and do not require additional production, modification, or customization. Revenues from sales of goods are recognized when there is persuasive evidence of an arrangement, delivery has occurred, the fee is fixed or determinable, and collection is reasonable assured. Cost of sales includes cost of inventories purchased, cost associated with packaging, shipping, and write down of inventories. Costs and expenses are recognized as incurred.
IMPAIRMENT OF LONG-LIVED ASSETS
The Company assesses the impairment of long-lived assets, which consist primarily of property, equipment and intangible assets, whenever events or changes in circumstances indicate that such assets might be impaired and the carrying value may not be recoverable. Events or changes in circumstances that may indicate that an asset is impaired include significant decreases in the market value of an asset, significant underperformance relative to expected historical or projected future results of operations, a change in the extent or manner in which an asset is utilized, significant declines in the estimated fair value of the overall Company for a sustained period, shifts in technology, loss of key management or personnel, changes in the Company’s operating model or strategy and competitive forces. If events or changes in circumstances indicate that the carrying amount of an asset may not be recoverable and the expected undiscounted future cash flows attributable to the asset are less than the carrying amount of the asset, an impairment loss equal to the excess of the asset’s carrying value over its fair value is recorded. Fair value is determined based on the present value of estimated expected future cash flows using a discount rate commensurate with the risk involved, quoted market prices or appraised values, depending on the nature of the assets.
RESEARCH AND DEVELOPMENT EXPENSE
Research and development expense consists of costs incurred in performing research and development activities including salaries, employee benefits, rental, utilities, and test costs. Research and development costs are expensed as incurred.
SELLING AND ADMINISTRATIVE EXPENSE
Selling and administrative expense consists of salaries, employee benefits, travel costs, rental, utilities and other miscellaneous expenses. The Company expenses selling and administrative costs as incurred.
F-46
Table of Contents
Winyatek Technology Inc.
Notes to Combined Carve-Out Financial Statements—(Continued)
December 31, 2009
(EXPRESSED IN NEW TAIWAN DOLLARS)
RECENT ACCOUNTING PRONOUNCEMENTS
In December 2007, the Financial Accounting Standards Board (FASB) revised the authoritative guidance for business combinations, which establishes principles and requirements for how the acquirer: (a) recognizes and measures in its financial statements the identifiable assets acquired, the liabilities assumed, and any noncontrolling interest in the acquiree, (b) recognizes and measures the goodwill acquired in the business combination or a gain from a bargain purchase, and (c) determines what information to disclose to enable users of the financial statements to evaluate the nature and financial effects of the business combination. The guidance applies prospectively to the Company’s business combinations, if any, for which the acquisition date was on or after January 1, 2009. In April 2009, the FASB issued a new guidance that amends and clarifies the initial recognition and measurement, subsequent measurement and accounting, and disclosure of assets and liabilities arising from contingencies in a business combination. There were no business combinations in 2009 and therefore, the adoption of this guidance has no impact to the financial statements.
In May 2009, the FASB issued new accounting guidance relating to subsequent events, which establishes general standards of accounting for and disclosure of events that occur after the balance sheet date but before financial statements are issued or are available to be issued. In February 2010, the FASB amended this guidance. The new guidance eliminates the requirement for an SEC filer to disclose the date through which it has evaluated subsequent events, clarifies the period through which conduit bond obligors must evaluate subsequent events, and refines the scope of the disclosure requirements for reissued financial statements. Entities that are not SEC filers are required to disclose both the date through which subsequent events have been evaluated and whether that date represents the date the financial statements were issued or available to be issued. This accounting guidance is effective for interim or annual periods ending after June 15, 2009. The Company has adopted this guidance in connection with the issuance of its 2009 financial statements (see Note 11).
Effective July 2009, the FASB adopted the FASB Accounting Standards Codification, or the Codification, as the official single source of authoritative U.S. GAAP. All existing accounting standards are superseded. All other accounting guidance not included in the Codification will be considered nonauthoritative. The Codification also includes all relevant SEC guidance organized using the same topical structure in separate sections within the Codification. Following the Codification, FASB will not issue new standards in the form of Statements, FASB Staff Positions or Emerging Issues Task Force Abstracts. Instead, it will issue Accounting Standards Updates, which will serve to update the Codification, provide background information about the guidance and provide the basis for conclusions on the changes to the Codification. The Codification is not intended to change U.S. GAAP, but it will change the way U.S. GAAP is organized and presented. The Codification is effective for interim and annual periods ending after September 15, 2009. There will be no change to the financial statements due to implementation of the Codification other than changes in reference to various authoritative accounting pronouncements in the Notes to Combined Carve-Out Financial Statements.
In October 2009, the FASB reached final consensus on a new revenue recognition guidance regarding revenue arrangements with multiple deliverables. The new accounting guidance addresses how to determine whether an arrangement involving multiple deliverables contains more than one unit of accounting, and how the arrangement consideration should be allocated among the separate units of accounting. The new accounting guidance is effective for fiscal years beginning after June 15, 2010 and may be applied retrospectively or prospectively for new or materially modified arrangements. Early adoption is permitted. The Company does not expect that the adoption of this guidance will have a material impact on its financial position, results of operations or disclosures.
F-47
Table of Contents
Winyatek Technology Inc.
Notes to Combined Carve-Out Financial Statements—(Continued)
December 31, 2009
(EXPRESSED IN NEW TAIWAN DOLLARS)
3. Cash
| December 31, 2009 | ||||
| Cash in bank |
$ | 45,000,101 | ||
Cash in bank are not restricted or pledged.
4. Accounts Receivable
| December 31, 2009 | ||||
| Accounts receivable |
$ | 2,097,714 | ||
The collection term is 30 days. There was no allowance for doubtful accounts as of December 31, 2009.
| Customer | Amount | |||
| A |
$ | 1,104,708 | ||
| Others |
993,006 | |||
| $ | 2,097,714 | |||
5. Inventories
| December 31, 2009 | ||||
| Work in process |
$ | 7,228,017 | ||
| Finished goods |
1,712,521 | |||
| Merchandise |
1,265,442 | |||
| 10,205,980 | ||||
| Less: Allowance for reduction of inventory to market value |
(208,301 | ) | ||
| $ | 9,997,679 | |||
6. Property and Equipment—Net
| December 31, 2009 | ||||
| Computer equipment |
$ | 828,452 | ||
| Trial equipment |
1,628,000 | |||
| Total property and equipment |
2,456,452 | |||
| Less: Accumulated depreciation |
(891,480 | ) | ||
| Net property and equipment |
$ | 1,564,972 | ||
Depreciation was $520,138 for the year ended December 31, 2009.
F-48
Table of Contents
Winyatek Technology Inc.
Notes to Combined Carve-Out Financial Statements—(Continued)
December 31, 2009
(EXPRESSED IN NEW TAIWAN DOLLARS)
7. Intangible Assets
| December 31, 2009 | ||||||||||||
| Gross Carrying Amount |
Accumulated Amortization |
Net | ||||||||||
| Amortized intangible assets |
||||||||||||
| Software |
$ | 3,376,170 | $ | (2,905,325 | ) | $ | 470,845 | |||||
| Patents |
25,000,000 | (9,722,216 | ) | 15,277,784 | ||||||||
| Total |
$ | 28,376,170 | $ | (12,627,541 | ) | $ | 15,748,629 | |||||
8. Income Tax
1) Income tax and income tax payable as of December 31, 2009 were calculated as follows:
| December 31, 2009 | ||||
| Income tax expense |
$ | 11 | ||
| Income tax paid |
(11 | ) | ||
| Income tax payable |
$ | — | ||
2) As of December 31, 2009, the deferred income tax assets and liabilities were as follows:
| Deferred tax assets |
||||
| —Non Current |
$ | 7,994 | ||
| Less: Valuation allowance |
(7,994 | ) | ||
| $ | — | |||
3) As of December 31, 2009, temporary differences that resulted in deferred assets were as follows:
| Deferred tax assets | Amount | Income tax effect | ||||||
| Non-current: |
||||||||
| Loss carryforward |
$ | 39,968 | $ | 7,994 | ||||
| Less: Valuation allowance |
(7,994 | ) | ||||||
| $ | — | |||||||
9. Related Party Transactions and Balances
| Name of related party |
Relationship with the Company |
|||
| Goyatek Technology Inc. |
Parent Company | |||
1) Trade payables
| December 31, 2009 | ||||
| Goyatek Technology Inc. |
$ | 4,468,966 | ||
The payment term is 30 days.
| Other payables |
December 31, 2009 | |||
| Goyatek Technology Inc. |
$ | 2,690,755 | ||
F-49
Table of Contents
Winyatek Technology Inc.
Notes to Combined Carve-Out Financial Statements—(Continued)
December 31, 2009
(EXPRESSED IN NEW TAIWAN DOLLARS)
The value added tax on the purchase of assets amounting to $2,000,000 and other professional service fees were paid by Goyatek on behalf of the Company.
2) Purchases of inventories
| For the year
ended December 31, 2009 |
||||
| Goyatek Technology Inc. |
$ | 37,168,992 | ||
The purchase price is negotiated with Goyatek.
3) Purchase of Property, Equipment and Intangible Assets
| For the year
ended December 31, 2009 |
||||
| Goyatek Technology Inc. |
||||
| Intangible Assets |
||||
| Software |
$ | 470,845 | ||
| Patents |
15,277,784 | |||
| Property and Equipment |
1,564,972 | |||
| $ | 17,313,601 | |||
10. Commitment
The Company leases its office space under operating leases. The future minimum rental commitments for these non-cancelable contracts at December 31, 2009 are as follows:
| December 31, 2009 | ||||
| 2010 |
$ | 1,728,000 | ||
| 2011 |
2,304,000 | |||
| 2012 |
2,304,000 | |||
| 2013 |
576,000 | |||
| $ | 6,912,000 | |||
11. Subsequent event
The Company has performed an evaluation of subsequent events through August 12, 2010, the date of issuance of the financial statements.
On December 31, 2009, the Company received cash as capital collected in advance from Power Quotient International Co., Ltd., amounting to $45,000,000 for 3,000,000 shares. On January 13, 2010, the capital collected in advance was transferred into equity after the Company received legal approval from Ministry of Economic Affairs R.O.C. The Company’s total outstanding shares were 7,000,000 shares after the capital from Power Quotient International Co., Ltd with additional paid in capital of $15,000,000.
On June 30, 2010, Inphi International Pte Ltd., a wholly owned subsidiary of Inphi Corporation acquired 100% shares of the Company.
F-50
Table of Contents
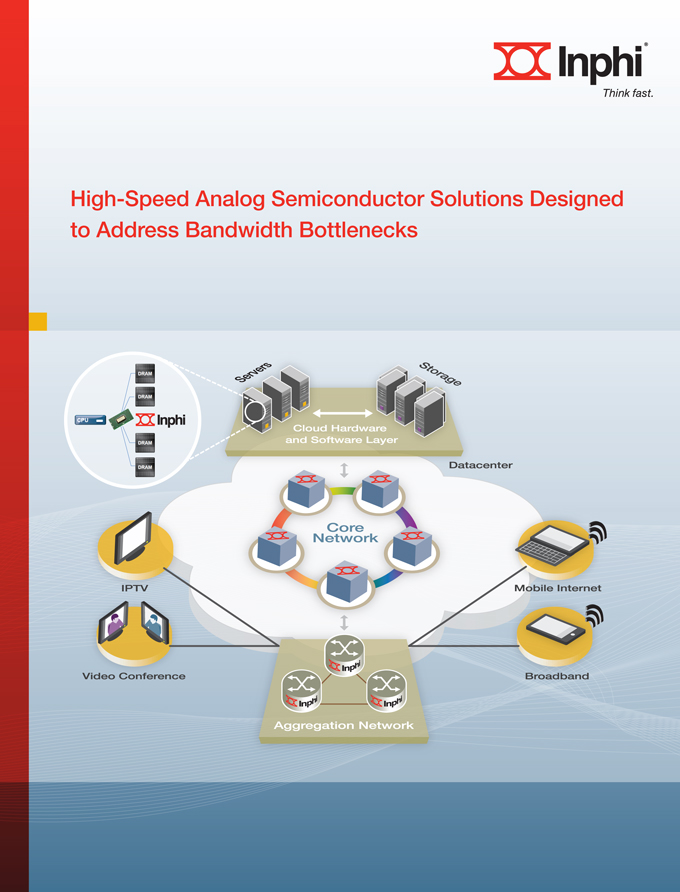
Table of Contents

Table of Contents
Part II
INFORMATION NOT REQUIRED IN PROSPECTUS
| Item 13. | Other Expenses of Issuance and Distribution |
The following table sets forth the various expenses expected to be incurred by the Registrant in connection with the sale and distribution of the securities being registered hereby, other than underwriting discounts and commissions. All amounts are estimated except for the Securities and Exchange Commission registration fee, the Financial Industry Regulatory Authority filing fee and The New York Stock Exchange listing fee.
| Securities and Exchange Commission registration fee |
$ | 10,867 | ||
| Financial Industry Regulatory Authority filing fee |
13,317 | |||
| The New York Stock Exchange listing fee |
16,800 | |||
| Blue Sky fees and expenses |
10,000 | |||
| Accounting fees and expenses |
100,000 | |||
| Legal fees and expenses |
400,000 | |||
| Printing and engraving expenses |
120,000 | |||
| Miscellaneous fees and expenses |
4,016 | |||
| Total |
$ | 675,000 | ||
| Item 14. | Indemnification of Directors and Officers |
Section 102 of the Delaware General Corporation Law allows a corporation to eliminate the personal liability of directors of a corporation to the corporation or its stockholders for monetary damages for breach of fiduciary duty as a director, except where the director breached the duty of loyalty, failed to act in good faith, engaged in intentional misconduct or knowingly violated a law, authorized the payment of a dividend or approved a stock repurchase in violation of the Delaware General Corporation Law or obtained an improper personal benefit.
Section 145 of the Delaware General Corporation Law provides, among other things, that we may indemnify any person who was or is a party, or is threatened to be made a party, to any threatened, pending or completed action, suit or proceeding, other than an action by or in the right of the Registrant, by reason of the fact that the person is or was a director, officer, agent or employee of the Registrant, or is or was serving at our request as a director, officer, agent or employee of another corporation, partnership, joint venture, trust or other enterprise against expenses, including attorneys’ fees, judgments, fines and amounts paid in settlement actually and reasonably incurred by the person in connection with such action, suit or proceeding. The power to indemnify applies (a) if such person is successful on the merits or otherwise in defense of any action, suit or proceeding, or (b) if such person acting in good faith and in a manner he or she reasonably believed to be in the best interest, or not opposed to the best interest, of the Registrant, and with respect to any criminal action or proceeding had no reasonable cause to believe his or her conduct was unlawful. The power to indemnify applies to actions brought by or in the right of the Registrant as well but only to the extent of defense expenses, including attorneys’ fees but excluding amounts paid in settlement, actually and reasonably incurred and not to any satisfaction of judgment or settlement of the claim itself, and with the further limitation that in such actions no indemnification shall be made in the event of any adjudication of liability to the Registrant, unless the court believes that in light of all the circumstances indemnification should apply.
Section 174 of the Delaware General Corporation Law provides, among other things, that a director who willfully or negligently approves of an unlawful payment of dividends or an unlawful stock purchase or redemption may be held liable for such actions. A director who was either absent when the unlawful actions were
II-1
Table of Contents
approved or dissented at the time, may avoid liability by causing his or her dissent to such actions to be entered in the books containing minutes of the meetings of our board of directors at the time such action occurred or immediately after such absent director receives notice of the unlawful acts.
The Registrant’s amended and restated bylaws, attached as Exhibit 3(ii) hereto, provide that the Registrant shall indemnify its directors and executive officers to the fullest extent not prohibited by the DGCL or any other applicable law. In addition, the Registrant has entered into separate indemnification agreements, attached as Exhibit 10.3 hereto, with its directors and officers which would require the Registrant, among other things, to indemnify them against certain liabilities which may arise by reason of their status or service as directors or officers to the fullest extent not prohibited by law. These indemnification provisions and the indemnification agreements may be sufficiently broad to permit indemnification of the Registrant’s officers and directors for liabilities, including reimbursement of expenses incurred, arising under the Securities Act of 1933, as amended, which we refer to as the Securities Act. The Registrant also intends to maintain director and officer liability insurance, if available on reasonable terms.
The form of Underwriting Agreement, to be attached as Exhibit 1.1 hereto, provides for indemnification by the Underwriters of us and our officers and directors for certain liabilities, including liabilities arising under the Securities Act, and affords certain rights of contribution with respect thereto.
| Item 15. | Recent Sales of Unregistered Securities |
The following sets forth information regarding all unregistered securities sold since January 1, 2008 through December 31, 2010 and gives effect to the 1-for-10 reverse stock split effected April 16, 2004 and a 3-for-7 reverse stock split effected November 3, 2010:
(a) On various dates between January 1, 2008 and November 16, 2010, we granted stock options to purchase 3,895,415 shares of our common stock to our directors, officers, employees and consultants pursuant to our 2000 Stock Plan, with exercise prices ranging from $1.47 to $12.02 per share. All of the consultants to whom we granted stock options are individuals who provided bona fide services to us and such services were not rendered in connection with the purchase or sale of our securities in a capital raising transaction.*
(b) On April 30, 2010, we granted a restricted stock award for 17,142 shares of our common stock, with a fair value of $9.29 per share, to one of our directors, pursuant to our 2000 Stock Plan.*
(c) On August 17, 2010, we granted a restricted stock award for 17,142 shares of our common stock, with a fair value of $12.02 per share, to one of our directors pursuant to our 2000 Stock Plan.*
(d) On various dates between January 1, 2008 and November 16, 2010, we issued and sold an aggregate of 1,442,739 shares of our common stock to our directors, officers, employees and consultants pursuant to the exercise of options granted under our 2000 Stock Plan. The exercise prices ranged from $0.70 to $3.73 per share, for an aggregate consideration of $1,859,655.23.*
(e) From January 30, 2008 through December 31, 2010, we issued and sold an aggregate of 1,357,444 shares of our Series E preferred stock to 22 accredited investors for an aggregate consideration of $14,537,866, including 1,043,731 shares at $9.5809 per share and 313,713 shares at $14.4654 per share issued in connection with our acquisition of Winyatek Technology Inc.**
None of the foregoing transactions involved any underwriters, underwriting discounts or commission, or any public offering, and the registrant believes that each transaction was exempt from the registration requirements of the Securities Act in reliance on the following exemptions:
| * | with respect to the transactions described in paragraphs (a) through (d), Rule 701, Rule 506 of Regulation D or Regulation S promulgated under the Securities Act as transactions pursuant to a compensatory benefit plan approved by the registrant’s board of directors; and |
II-2
Table of Contents
| ** | with respect to the transactions described in paragraph (e), Rule 506 of Regulation D promulgated under the Securities Act as a transactions by an issuer not involving a public offering. Each recipient of the securities in these transactions represented his or her intention to acquire the securities for investment only and not with a view to, or for resale in connection with, any distribution thereof, and appropriate legends were affixed to the stock certificates issued in each such transaction. In each case, the recipients received adequate information about the registrant or had adequate access, through his or her relationship with the registrant, to information about the registrant. |
There were no underwriters employed in connection with any of the transactions set forth in Item 15.
| Item 16. | Exhibits and Financial Statement Schedules |
(a) Exhibits
| Exhibit |
Description | |
| 1.1 | Form of Underwriting Agreement. | |
| 2.1 | Share Purchase Agreement dated as of May 25, 2010, by and among the Registrant, Winyatek Technology Inc. and the shareholder signatories thereto, as amended (excluding certain schedules and exhibits referred to in the agreement, which the Registrant agrees to furnish to the Securities and Exchange Commission upon request) (incorporated by reference to the exhibit of the same number filed with the Registrant’s Registration Statement on Form S-1 (File No. 333-167564)). | |
| 3(i) | Restated Certificate of Incorporation of the Registrant (incorporated by reference to Exhibit 3(i) filed with the Registrant’s Annual Report on Form 10-K for the year ended December 31, 2010). | |
| 3(ii) | Amended and Restated Bylaws of the Registrant (incorporated by reference to Exhibit 3(ii).2 filed with the Registrant’s Registration Statement on Form S-1 (File No. 333-167564). | |
| 4.1 | Specimen Common Stock Certificate (incorporated by reference to the exhibit of the same number filed with the Registrant’s Registration Statement on Form S-1 (File No. 333-167564)). | |
| 4.2 | Amended and Restated Investors’ Rights Agreement dated as of August 12, 2010 (incorporated by reference to Exhibit 4.2 the Registrant’s Annual Report on Form 10-K for the year ended December 31, 2010). | |
| 5.1 | Opinion of Pillsbury Winthrop Shaw Pittman LLP. | |
| 10.1+ | Inphi Corporation 2000 Stock Option/Stock Issuance Plan (as amended on June 2, 2010) and related form stock option plan agreements (incorporated by reference to the exhibit of the same number filed with the Registrant’s Registration Statement on Form S-1 (File No. 333-167564)). | |
| 10.2+ | Inphi Corporation 2010 Stock Incentive Plan and related form agreements (incorporated by reference to Exhibit 10.2 filed with the Registrant’s Annual Report on Form 10-K for the year ended December 31, 2010). | |
| 10.3+ | Form of Indemnification Agreement between the Registrant and its officers and directors (incorporated by reference to the exhibit of the same number filed with the Registrant’s Registration Statement on Form S-1 (File No. 333-167564)). | |
| 10.4+ | Offer letter dated July 14, 2007 between Young K. Sohn and the Registrant, as amended (incorporated by reference to the exhibit of the same number filed with the Registrant’s Registration Statement on Form S-1 (File No. 333-167564)). | |
| 10.5+ | Change of Control and Severance Agreement dated June 8, 2010, by and between Young K. Sohn and the Registrant (incorporated by reference to the exhibit of the same number filed with the Registrant’s Registration Statement on Form S-1 (File No. 333-167564)). | |
| 10.6+ | Offer letter dated December 10, 2007 between John Edmunds and the Registrant, as amended (incorporated by reference to the exhibit of the same number filed with the Registrant’s Registration Statement on Form S-1 (File No. 333-167564)). | |
II-3
Table of Contents
| Exhibit |
Description | |
| 10.7+ | Change of Control and Severance Agreement dated June 8, 2010, by and between John Edmunds and the Registrant (incorporated by reference to the exhibit of the same number filed with the Registrant’s Registration Statement on Form S-1 (File No. 333-167564)). | |
| 10.8+ | Offer letter dated October 3, 2007 between Ron Torten and the Registrant, as amended (incorporated by reference to the exhibit of the same number filed with the Registrant’s Registration Statement on Form S-1 (File No. 333-167564)). | |
| 10.9 | Lease Agreement between the Registrant and H&G Selvin Properties dated as of June 30, 2006, including amendments thereto (incorporated by reference to the exhibit of the same number filed with the Registrant’s Registration Statement on Form S-1 (File No. 333-167564)). | |
| 10.10 | Sublease Agreement between the Registrant and Scintera Networks, Inc. dated as of December 1, 2009, including amendments thereto (incorporated by reference to the exhibit of the same number filed with the Registrant’s Registration Statement on Form S-1 (File No. 333-167564)). | |
| 10.11 | Lease Agreement between the Registrant and Santa Clara Towers, L.P. dated as of April 27, 2010 (incorporated by reference to the exhibit of the same number filed with the Registrant’s Registration Statement on Form S-1 (File No. 333-167564)). | |
| 10.12 | Lease Agreement between the Registrant and LBA Realty Fund III—Company VII, LLC dated as of June 4, 2010 (incorporated by reference to the exhibit of the same number filed with the Registrant’s Registration Statement on Form S-1 (File No. 333-167564)). | |
| 10.13 | Workshop Lease Contract between Winyatek Technology Inc. and Integrated Circuit Solutions Inc. dated as of March 29, 2010 (incorporated by reference to the exhibit of the same number filed with the Registrant’s Registration Statement on Form S-1 (File No. 333-167564)). | |
| 10.14** | Software License and Maintenance Agreement dated as of June 29, 2007, by and between the Registrant and Cadence Design Systems, Inc. (incorporated by reference to Exhibit 10.1 filed with the Registrant’s Current Report on Form 8-K filed on March 28, 2011). | |
| 21.1 | List of Subsidiaries (incorporated by reference to the exhibit of the same number filed with the Registrant’s Registration Statement on Form S-1 (File No. 333-167564)). | |
| 23.1 | Consent of Pillsbury Winthrop Shaw Pittman LLP (included in Exhibit 5.1). | |
| 23.2 | Consent of PricewaterhouseCoopers LLP, independent registered public accounting firm. | |
| 23.3 | Consent of PricewaterhouseCoopers, Taiwan, independent registered public accounting firm. | |
| 24.1† | Power of Attorney | |
| ** | Confidential treatment requested. |
| + | Indicates management contract or compensatory plan. |
| † | Previously filed |
| Item 17. | Undertakings |
Insofar as indemnification for liabilities arising under the Securities Act of 1933, as amended (the “Act”), may be permitted to directors, officers and controlling persons of the Registrant pursuant to the foregoing provisions, or otherwise, the Registrant has been advised that in the opinion of the Securities and Exchange Commission such indemnification is against public policy as expressed in the Act and is, therefore, unenforceable. In the event that a claim for indemnification against such liabilities (other than the payment by the Registrant of expenses incurred or paid by a director, officer or controlling person of the Registrant in the successful defense of any action, suit or proceeding) is asserted by such director, officer or controlling person in connection with the securities being registered, the Registrant will, unless in the opinion of its counsel the matter has been settled by controlling precedent, submit to a court of appropriate jurisdiction the question whether such indemnification by it is against public policy as expressed in the Act and will be governed by the final adjudication of such issue.
II-4
Table of Contents
The undersigned Registrant hereby undertakes that:
| (1) | For purposes of determining any liability under the Act, the information omitted from the form of prospectus filed as part of this registration statement in reliance upon Rule 430A and contained in a form of prospectus filed by the Registrant pursuant to Rule 424(b)(1) or (4) or 497(h) under the Act shall be deemed to be part of this registration statement as of the time it was declared effective. |
| (2) | For the purpose of determining any liability under the Act, each post effective amendment that contains a form of prospectus shall be deemed to be a new registration statement relating to the securities offered therein, and the offering of such securities at that time shall be deemed to be the initial bona fide offering thereof. |
II-5
Table of Contents
SIGNATURES
Pursuant to the requirements of the Securities Act of 1933, the Registrant has duly caused this Amendment No. 1 to the Registration Statement to be signed on its behalf by the undersigned, thereunto duly authorized, in the City of Santa Clara, State of California, on the 28th day of March, 2011.
| INPHI CORPORATION | ||
| By: |
/S/ YOUNG K. SOHN | |
| Young K. Sohn | ||
| Chief Executive Officer | ||
Pursuant to the requirements of the Securities Act of 1933, this Registration Statement has been signed below by the following persons in the capacities and on the dates indicated.
| Name |
Title |
Date | ||
| /S/ YOUNG K. SOHN Young K. Sohn |
Chief Executive Officer (Principal Executive Officer), President and Director |
March 28, 2011 | ||
| /S/ JOHN EDMUNDS John Edmunds |
Chief Financial Officer and Chief Accounting Officer (Principal Financial and Accounting Officer) |
March 28, 2011 | ||
| * Diosdado P. Banatao |
Chairman of the Board | March 28, 2011 | ||
| * Chenming C. Hu |
Director | March 28, 2011 | ||
| * David J. Ladd |
Director | March 28, 2011 | ||
| * Timothy D. Semones |
Director | March 28, 2011 | ||
| * Peter J. Simone |
Director | March 28, 2011 | ||
| * Sam S. Srinivasan |
Lead Director | March 28, 2011 | ||
| * Lip-Bu Tan |
Director | March 28, 2011 | ||
| *By: |
/S/ JOHN EDMUNDS John Edmunds Attorney-in-fact |
|||||
II-6
Table of Contents
Exhibit Index
| Exhibit |
Description | |
| 1.1 | Form of Underwriting Agreement. | |
| 2.1 | Share Purchase Agreement dated as of May 25, 2010, by and among the Registrant, Winyatek Technology Inc. and the shareholder signatories thereto, as amended (excluding certain schedules and exhibits referred to in the agreement, which the Registrant agrees to furnish to the Securities and Exchange Commission upon request) (incorporated by reference to the exhibit of the same number filed with the Registrant’s Registration Statement on Form S-1 (File No. 333-167564)). | |
| 3(i) | Restated Certificate of Incorporation of the Registrant (incorporated by reference to Exhibit 3(i) filed with the Registrant’s Annual Report on Form 10-K for the year ended December 31, 2010). | |
| 3(ii) | Amended and Restated Bylaws of the Registrant (incorporated by reference to Exhibit 3(ii).2 filed with the Registrant’s Registration Statement on Form S-1 (File No. 333-167564). | |
| 4.1 | Specimen Common Stock Certificate (incorporated by reference to the exhibit of the same number filed with the Registrant’s Registration Statement on Form S-1 (File No. 333-167564)). | |
| 4.2 | Amended and Restated Investors’ Rights Agreement dated as of August 12, 2010 (incorporated by reference to the exhibit of the same number filed with the Registrant’s Annual Report on Form 10-K for the year December 31, 2010). | |
| 5.1 | Opinion of Pillsbury Winthrop Shaw Pittman LLP. | |
| 10.1+ | Inphi Corporation 2000 Stock Option/Stock Issuance Plan (as amended on June 2, 2010) and related form stock option plan agreements (incorporated by reference to the exhibit of the same number filed with the Registrant’s Registration Statement on Form S-1 (File No. 333-167564)). | |
| 10.2+ | Inphi Corporation 2010 Stock Incentive Plan and related form agreements (incorporated by reference to Exhibit 10.2 filed with the Registrant’s Annual Report on Form 10-K for the year ended December 31, 2010). | |
| 10.3+ | Form of Indemnification Agreement between the Registrant and its officers and directors (incorporated by reference to the exhibit of the same number filed with the Registrant’s Registration Statement on Form S-1 (File No. 333-167564)). | |
| 10.4+ | Offer letter dated July 14, 2007 between Young K. Sohn and the Registrant, as amended (incorporated by reference to the exhibit of the same number filed with the Registrant’s Registration Statement on Form S-1 (File No. 333-167564)). | |
| 10.5+ | Change of Control and Severance Agreement dated June 8, 2010, by and between Young K. Sohn and the Registrant (incorporated by reference to the exhibit of the same number filed with the Registrant’s Registration Statement on Form S-1 (File No. 333-167564)). | |
| 10.6+ | Offer letter dated December 10, 2007 between John Edmunds and the Registrant, as amended (incorporated by reference to the exhibit of the same number filed with the Registrant’s Registration Statement on Form S-1 (File No. 333-167564)). | |
| 10.7+ | Change of Control and Severance Agreement dated June 8, 2010, by and between John Edmunds and the Registrant (incorporated by reference to the exhibit of the same number filed with the Registrant’s Registration Statement on Form S-1 (File No. 333-167564)). | |
| 10.8+ | Offer letter dated October 3, 2007 between Ron Torten and the Registrant, as amended (incorporated by reference to the exhibit of the same number filed with the Registrant’s Registration Statement on Form S-1 (File No. 333-167564)). | |
Table of Contents
| Exhibit |
Description | |
| 10.9 | Lease Agreement between the Registrant and H&G Selvin Properties dated as of June 30, 2006, including amendments thereto (incorporated by reference to the exhibit of the same number filed with the Registrant’s Registration Statement on Form S-1 (File No. 333-167564)). | |
| 10.10 | Sublease Agreement between the Registrant and Scintera Networks, Inc. dated as of December 1, 2009, including amendments thereto (incorporated by reference to the exhibit of the same number filed with the Registrant’s Registration Statement on Form S-1 (File No. 333-167564)). | |
| 10.11 | Lease Agreement between the Registrant and Santa Clara Towers, L.P. dated as of April 27, 2010 (incorporated by reference to the exhibit of the same number filed with the Registrant’s Registration Statement on Form S-1 (File No. 333-167564)). | |
| 10.12 | Lease Agreement between the Registrant and LBA Realty Fund III—Company VII, LLC dated as of June 4, 2010 (incorporated by reference to the exhibit of the same number filed with the Registrant’s Registration Statement on Form S-1 (File No. 333-167564)). | |
| 10.13 | Workshop Lease Contract between Winyatek Technology Inc. and Integrated Circuit Solutions Inc. dated as of March 29, 2010 (incorporated by reference to the exhibit of the same number filed with the Registrants Registration Statement on Form S-1 (File No. 333-167564)). | |
| 10.14** | Software License and Maintenance Agreement dated as of June 29, 2007, by and between the Registrant and Cadence Design Systems, Inc (incorporated by reference to Exhibit 10.1 filed with the Registrant’s Current Report on Form 8-K filed on March 28, 2011). | |
| 21.1 | List of Subsidiaries (incorporated by reference to the exhibit of the same number filed with the Registrant’s Registration Statement on Form S-1 (File No. 333-167564)). | |
| 23.1 | Consent of Pillsbury Winthrop Shaw Pittman LLP (included in Exhibit 5.1). | |
| 23.2 | Consent of PricewaterhouseCoopers LLP, independent registered public accounting firm. | |
| 23.3 | Consent of PricewaterhouseCoopers, Taiwan, independent registered public accounting firm. | |
| 24.1† | Power of Attorney. | |
| ** | Confidential treatment requested. |
| + | Indicates management contract or compensatory plan. |
| † | Previously filed. |