Attached files
UNITED STATES
SECURITIES AND EXCHANGE COMMISSION
Washington, D.C. 20549
FORM 10-K
þ ANNUAL REPORT PURSUANT TO SECTION 13 OR 15(d) OF THE SECURITIES EXCHANGE ACT OF 1934
For the fiscal year ended December 31, 2010.
OR
|
¨
|
TRANSITION REPORT PURSUANT TO SECTION 13 OR 15(d) OF THE SECURITIES EXCHANGE ACT OF 1934
|
Commission file number 0-25286
CASCADE FINANCIAL CORPORATION
(Exact name of registrant as specified in its charter)
|
Washington
|
91-1661954
|
|
|
(State or other jurisdiction of incorporation or organization)
|
(I.R.S. Employer I.D. Number)
|
|
|
2828 Colby Avenue, Everett, Washington
|
98201
|
|
|
(Address of principal executive offices)
|
(Zip Code)
|
|
|
Registrant’s telephone number, including area code:
|
(425) 339-5500
|
|
|
Securities registered pursuant to Section 12(b) of the Act:
|
None
|
|
|
Securities registered pursuant to Section 12(g) of the Act:
|
Common Stock, par value $0.01 per share
|
Indicate by check mark if the registrant is a well-known seasoned issuer as defined in Rule 405 of the Securities Act.
YES ¨ NO þ
Indicate by check mark if the registrant is not required to file reports pursuant to Section 13 or Section 15(d) of the Act.
YES ¨ NO þ
Indicate by check mark whether the registrant (1) has filed all reports required to be filed by Section 13 or 15(d) of the Securities Exchange Act of 1934 during the preceding 12 months (or for such shorter period that the registrant was required to file such reports), and (2) has been subject to such filing requirements for the past 90 days.
YES þ NO ¨
Indicate by check mark whether the registrant has submitted electronically and posted on its corporate Website, if any, every Interactive Data File required to be submitted and posted pursuant to Rule 405 of Regulation S-T (§232.405 of this chapter) during the preceding twelve months (or for such shorter period that the registrant was required to submit and post such files).
YES þ NO ¨
Indicate by check mark if disclosure of delinquent filers pursuant to Item 405 of Regulation S-K (§229.405 of this chapter) is not contained herein, and will not be contained, to the best of registrant’s knowledge, in definitive proxy or information statements incorporated by reference in Part III of this Form 10-K or any amendment to this Form 10-K. ¨
1
Indicate by check mark whether the registrant is a large accelerated filer, an accelerated filer, a non-accelerated filer or a smaller reporting company. See the definitions of “large accelerated filer,” “accelerated filer” and “smaller reporting company” in Rule 12b-2 of the Exchange Act. (Check one):
Large Accelerated Filer ¨ Accelerated Filer ¨ Non-Accelerated Filer ¨ Smaller Reporting Company þ
Indicate by check mark whether the registrant is a shell company (as defined in Rule 12b-2 of the Exchange Act).
YES ¨ NO þ
The aggregate market value of the voting and non-voting Common Stock held by non-affiliates computed by reference to the price at which the Common Stock was last sold, or the average bid and asked price of such Common Stock, as of the last business day of the registrant's most recently completed second fiscal quarter, was $5.8 million.
The aggregate market value of Common Stock held by non-affiliates of the registrant at March 22, 2011 was $5.3 million (based on the last reported sale on such date). The number of shares of the registrant’s Common Stock outstanding at March 22, 2011, was 12,271,529.
DOCUMENTS INCORPORATED BY REFERENCE
|
|
None.
|
2
|
Cascade Financial Corporation
|
|
FORM 10-K
|
|
December 31, 2010
|
|
TABLE OF CONTENTS
|
|
PART I
|
||
|
Page
|
||
|
Item 1.
|
Business
|
4
|
|
Item 1A.
|
Risk Factors
|
16
|
|
Item 1B.
|
Unresolved Staff Comments
|
28
|
|
Item 2.
|
Properties
|
28
|
|
Item 3.
|
Legal Proceedings
|
28
|
|
Item 4.
|
[Removed and Reserved]
|
-
|
|
PART II
|
||
|
Item 5.
|
Market for Registrant’s Common Equity, Related Stockholder Matters and Issuer Purchases of Equity Securities
|
28
|
|
Item 6.
|
Selected Financial Data
|
30
|
|
Item 7.
|
Management’s Discussion and Analysis of Financial Condition and Results of Operation
|
33
|
|
Item 7A.
|
Quantitative and Qualitative Disclosures About Market Risk
|
64
|
|
Item 8.
|
Financial Statements and Supplementary Data
|
64
|
|
Item 9.
|
Changes in and Disagreements with Accountants on Accounting and Financial Disclosure
|
65
|
|
Item 9A.
|
Controls and Procedures
|
65
|
|
Item 9B.
|
Other Information
|
66
|
|
PART III
|
||
|
Item 10.
|
Directors, Executive Officers and Corporate Governance
|
66
|
|
Item 11.
|
Executive Compensation
|
72
|
|
Item 12.
|
Security Ownership of Certain Beneficial Owners and Management and Related Stockholder Matters
|
78
|
|
Item 13.
|
Certain Relationships and Related Transactions, and Director Independence
|
79
|
|
Item 14.
|
Principal Accounting Fees and Services
|
80
|
|
PART IV
|
||
|
Item 15.
|
Exhibits and Financial Statement Schedules
|
81
|
|
Exhibit Index
|
127
|
|
|
Signatures
|
129
|
3
PART I
FORWARD LOOKING STATEMENTS
This annual report on Form 10-K includes forward-looking statements, within the meaning of Section 27A of the Securities Act of 1933, as amended, and Section 21E of the Securities Exchange Act of 1934, as amended, and subject to the safe harbor created by the Private Securities Litigation Reform Act of 1995, that are subject to risks and uncertainties that could cause actual results to differ materially from those projected. These statements may be identified by the use of forward-looking terminology such as “anticipate,” “believe,” “continue,” “could,” “estimate,” “expect,” “intend,” “may,” “might,” “plan,” “potential,” “predict,” “should” or “will” or the negative thereof or other variations thereon or comparable terminology. We have based these forward-looking statements on our current expectations, assumptions, estimates and projections. While we believe these expectations, assumptions, estimates and projections are reasonable, such forward-looking statements are only predictions and involve known and unknown risks and uncertainties, many of which are beyond our control. These and other important factors, including those discussed below under the headings “Risk Factors,” “Management’s Discussion and Analysis of Financial Condition and Results of Operations” and “Business,” may cause our actual results, performance or achievements to differ materially from any future results, performance or achievements expressed or implied by these forward-looking statements. Some of the key factors that could cause actual results to differ from our expectations are:
|
·
|
management’s ability to raise capital to meet regulatory requirements and fund future operations;
|
|
·
|
management’s ability to effectively execute its business plan and strategy;
|
|
·
|
the credit risks of lending activities, including changes in the level and trend of loan delinquencies, collections and write-offs and changes in our allowance for loan losses and provision for loan losses that may be impacted by deterioration in the housing and commercial real estate markets;
|
|
·
|
changes in general economic conditions, either nationally or in our market areas;
|
|
·
|
the availability of and costs associated with sources of liquidity;
|
|
·
|
inflation, interest rates, market and monetary fluctuations;
|
|
·
|
legislative or regulatory changes or changes in accounting principles, policies or guidelines;
|
|
·
|
the possibility that we will be unable to comply with certain conditions imposed upon us in regulatory actions, which could result in the imposition of further restrictions on our operations, penalties or other regulatory actions;
|
|
·
|
the costs and effects of legal and regulatory developments, including the resolution of legal proceedings or regulatory or other governmental inquiries and the results of regulatory examinations or reviews;
|
|
·
|
our ability to attract and retain deposits;
|
|
·
|
further increases in premiums for deposit insurance;
|
|
·
|
the use of estimates in determining fair value of certain of our assets, which estimates may prove to be incorrect and result in significant declines in valuation;
|
|
·
|
our success at managing the risks involved in the foregoing; and
|
|
·
|
other risks which may be described in the Corporation’s future filings with the SEC under the Securities Exchange Act of 1934.
|
Given these risks and uncertainties, you are cautioned not to place undue reliance on such forward-looking statements. The forward-looking statements included or incorporated by reference into this report are made only as of the date hereof. We do not undertake and specifically decline any obligation to update any such statements or to publicly announce the results of any revisions to any such statements to reflect future events or developments. In addition, we may make certain statements in future Securities and Exchange Commission (SEC) filings, in press releases and in oral and written statements that are not statements of historical fact and may constitute forward-looking statements.
ITEM 1. BUSINESS
General
Cascade Financial Corporation (CFC or the Corporation) is a bank holding company incorporated in the state of Washington in 2003. At December 31, 2010, the Corporation’s wholly-owned subsidiaries were Cascade Bank (Cascade Bank or the Bank), and Cascade Capital Trusts I, II, and III, formed to hold trust preferred securities. Colby R.E., LLC, a subsidiary of the Bank, was incorporated in March 2009 and 2011 Yale Avenue East, LLC, a subsidiary of Colby R.E., LLC, was incorporated in May 2010. Both were formed to acquire, manage and sell properties taken in foreclosure (REO properties). The executive offices of the Corporation are located at 2828 Colby Avenue, Everett, Washington, 98201. The telephone number is (425)339-5500 and the website is www.cascadebank.com. Information on the website is not part of this Report.
4
The Bank has been serving the Puget Sound region since 1916 when it was organized as a mutual savings and loan association. On September 15, 1992, the Bank completed its conversion from a federal mutual to a federal stock savings bank. In July 2001, the Bank converted from a federal stock savings bank to a Washington state commercial bank.
The Corporation was organized on August 18, 1994, for the purpose of becoming the holding company for Cascade Bank. The reorganization was completed on November 30, 1994, on which date the Bank became the wholly-owned subsidiary of the Corporation, and the stockholders of the Bank became stockholders of the Corporation. Subsequent to this date, the primary activity of the Corporation has been holding the stock of the Bank. Accordingly, the information set forth in this report, including financial statements and related data, relates primarily to the Bank.
The Corporation conducts its business from its main office in Everett, Washington, and 21 other full-service offices in the greater Puget Sound region. At December 31, 2010, the Corporation had total assets of $1.5 billion, total deposits of $1.1 billion and total equity of $58.5 million.
The Bank, a full-service commercial bank, offers a wide range of products and services. The deposits of the Bank are insured by the Federal Deposit Insurance Corporation (FDIC), up to the limits specified by law.
Subsidiary Activity
The Corporation has four subsidiaries: Cascade Bank, Cascade Capital Trust I, II, and III. The activities of the Corporation are primarily conducted through the Bank. Accordingly, this Form 10-K principally discusses the Bank’s operations. The operations of the Bank include Colby R.E., LLC and 2011 Yale Avenue East, LLC, both of which were formed to (a) acquire, improve, manage, lease, operate, sell, transfer, exchange, encumber, pledge or dispose of any real or personal property acquired by the Bank; and (b) to engage in such other lawful acts or activities for which limited liability companies may be formed under the Washington Limited Liability Company Act.
Cascade Capital Trust I was formed for the exclusive purpose of issuing trust preferred securities underlying junior subordinated debentures issued by the Corporation, and engaging in only those other activities necessary, advisable or incidental to the above. The junior subordinated debentures total $10.3 million, have an interest rate of 11.0%, mature on March 1, 2030, and are the sole assets of Cascade Capital Trust I. The junior subordinated debentures became pre-payable, in whole or in part, at the Corporation’s option on or after March 1, 2010, at declining premiums to maturity. At December 31, 2010, the premium was 5.5%. Proceeds totaling approximately $9.3 million from the issuance of the junior subordinated debentures were used to increase the capital level of the Bank.
Cascade Capital Trust II incorporates the same structure for the same purposes as Cascade Capital Trust I. The junior subordinated debentures issued under Cascade Capital Trust II equal $5.2 million and had a rate of 5.82% for the first five years, and beginning January 7, 2010, float at the three-month LIBOR plus 1.90% for the remaining twenty-five years. The securities became callable at par on a quarterly basis beginning January 7, 2010.
Cascade Capital Trust III incorporates the same structure for the same purposes as Cascade Capital Trust I and II. The junior subordinated debentures issued under Cascade Capital Trust III equal $10.3 million and have a rate of 6.65% for the first five years, and beginning June, 2011, float at the three-month LIBOR plus 1.40% for the remaining twenty-five years. The securities are callable at par on a quarterly basis beginning June 15, 2011.
We have been deferring quarterly interest payments due on our trust preferred securities since the fourth quarter of 2009, as permitted by the terms of the indenture agreements, as a result of regulatory actions against us which prohibit us from making such payments. See “Management’s Discussion and Analysis of Financial Condition and Results of Operations – Junior Subordinated Debentures.” The balance of deferred interest was $2.6 million as of December 31, 2010, and is included in the Consolidated Balance Sheet under “Accrued interest payable, expenses and other liabilities.”
Proposed Merger
On March 4, 2011, the Corporation announced that the Corporation, the Bank and Opus Bank entered into a definitive agreement, providing for Opus Bank to acquire the Corporation and the Bank, and for the merger of the Bank into Opus Bank. Opus Bank is a California-chartered bank with its executive offices located in Irvine, California. According to the terms of the merger agreement, Opus Bank will pay approximately $16.25 million to retire the Corporation’s $39.0 million in preferred stock and associated warrants issued to the United States Department of the Treasury under the Treasury’s
5
Business Strategy
Our current business strategies are as follows:
|
·
|
Strengthening our capital position.
|
|
·
|
Proactively managing credit quality and loan collections and improving asset quality.
|
|
·
|
Diversifying our loan portfolio by emphasizing commercial and industrial lending through our existing branches.
|
|
·
|
Managing liquidity and improving our capital position in compliance with regulatory guidelines.
|
|
·
|
Continuing to seek out reasonable expense reduction measures.
|
|
·
|
Increasing core deposits to fund loan growth and maintaining net interest margin through an enhanced branch network and online banking.
|
The Corporation and its subsidiary, Cascade Bank, are subject to regulatory actions with respect to their operations, including the FDIC Order and FRB Agreement described in “Regulation and Supervision – Regulatory Actions” below. As a result of these regulatory actions, the significant operating losses incurred in 2010 and 2009 and our needs to raise additional capital, there is substantial doubt about our ability to continue as a going concern. The report of the Corporation’s independent registered public accounting firm on our financial statements for the year ended December 31, 2010, contains an explanatory paragraph with respect to our ability to continue as a going concern. The 2010 financial statements do not include any adjustments that might result from the outcome of this uncertainty, which could affect our ability to continue as a going concern.
Market Area
Headquartered in Everett, Washington, the Corporation serves its customers from 22 full-service offices - 13 in Snohomish County, eight in King County, and one in Skagit County. The primary geographic market area for most Cascade Bank business lines is in Snohomish, King, Pierce and Skagit Counties.
Our market area in King County includes the growing cities east of Seattle and Lake Washington. This area’s economy has been dominated by Microsoft and The Boeing Company, with other high technology companies also playing an important role.
Everett, the Snohomish County seat, is the homeport of the U.S. Navy’s carrier, the USS Abraham Lincoln. The contribution that the Navy makes to the economy is not as dependent on other trends. The economy in the Corporation’s market area has been enhanced by the growth of the health care and biotechnology industries. Snohomish County and northeast King County are home to numerous biotechnology companies.
As a gateway to Asia, the Bank’s market area has also benefited from the continued expansion of world trade. Economic weakness in either the United States or Asia could reduce that trade. Such slowdowns in the international flow of goods and services could prove detrimental to the economy of our market area and potentially the quality of our loan portfolios.
Competition
The competitive landscape for banking has changed significantly in the past three years. Three Washington state banks were closed by the FDIC during 2009, and 11 were closed in 2010. Additionally, many banks in the state, including Cascade Bank, are operating under formal regulatory orders. Competition for loans has therefore decreased in the community bank market due to limited capital, and competition for deposits has been reduced due to regulatory restrictions that cap the rates these banks may pay. Nevertheless, there continues to be competition from national banks, large regional banks, healthy community banks and credit unions.
6
The Bank’s primary focus for loans is small-to-medium sized businesses and consumers in the Puget Sound area. As noted above, major competitors for the Bank in these loan markets are national banks, large regional banks, community banks and credit unions. The large banks often compete on the basis of competitive pricing, while the community banks and credit unions compete on the basis of local decision making and promises of a higher level of service.
The Bank’s competitors for retail loans, which include residential real estate and consumer loans, are numerous, including banks, mortgage brokers, captive finance subsidiaries of automobile companies, etc. While not a major area of focus, the Bank provides consumer lending on a relationship basis to its retail customers and business owners and their employees.
On the deposit side, geographic location is still the primary factor in choosing a bank for a checking account relationship. As a result, the Bank’s competition for checking deposits comes primarily from large institutions with a broad network of locations. Online banking continues to be an important convenience service to attract checking customers from larger banks. Community banks and savings institutions, as well as other non-banking financial institutions, provide the greatest competition for the various savings vehicles such as money market deposit accounts and certificates of deposit.
In addition to competition from other banking institutions, the Bank continues to experience competition from non-banking companies such as credit unions, financial services companies and brokerage firms. Many credit unions, including a large one in Cascade Bank’s market area, have expanded their eligible membership by amending their charters.
Regulation and Supervision
Regulatory Actions
FDIC Consent Order. On July 20, 2010, the Board of Directors of the Bank stipulated to the entry of a Consent Order with the Federal Deposit Insurance Corporation (FDIC) and the Washington State Department of Financial Institutions (DFI), effective July 21, 2010 (FDIC Order). Under the terms of the FDIC Order, the Bank cannot pay any cash dividends or make any payments to the Corporation without the prior written approval of the FDIC and the Washington State DFI. Other material provisions of the FDIC Order require the Bank to:
|
·
|
review the qualifications of the Bank’s management;
|
|
·
|
provide the FDIC with 30 days written notice prior to adding any individual to the Board of Directors of the Bank or employing any individual as a senior executive officer;
|
|
·
|
increase director participation and supervision of Bank affairs;
|
|
·
|
develop a capital plan and increase Tier 1 leverage capital to 10% of the Bank’s average total assets and increase total risk-based capital to 12% of the Bank’s risk-weighted assets by November 18, 2010, and maintain such capital levels, in addition to maintaining a fully funded allowance for loan losses satisfactory to the regulators;
|
|
·
|
eliminate from its books, by charge-off or collection, all loans classified as “loss” and all amounts in excess of the fair value of the underlying collateral for assets classified as “doubtful” in the Report of Visitation dated February 16, 2010 that have not been previously collected or charged-off, by July 30, 2010;
|
|
·
|
reduce the amount of loans classified “substandard” and “doubtful” in the Report of Visitation that have not previously been charged off to not more than 130% of the Bank’s Tier 1 capital and allowance for loan losses, within 180 days;
|
|
·
|
eventually reduce the total of all adversely classified loans by collection, charge-off or sufficiently improving the quality of adversely classified loans to warrant removing any adverse classification, as determined by the regulators;
|
|
·
|
formulate a written plan to reduce the Bank’s levels of nonperforming assets and/or assets listed for “special mention” by the Bank to an acceptable level and to reduce the Bank’s concentrations in commercial real estate and acquisition, development and construction loans;
|
|
·
|
develop a three-year strategic plan and budget with specific goals for total loans, total investment securities and total deposits, and improvements in profitability and net interest margin, and reduction of overhead expenses;
|
|
·
|
submit a written plan for eliminating the Bank’s reliance on brokered deposits, in compliance with FDIC’s rules;
|
|
·
|
eliminate and/or correct all violations of law set forth in the Report of Visitation and the Report of Examination dated May 18, 2009, and ensure future compliance with all applicable laws and regulations;
|
|
·
|
implement a comprehensive policy for determining the adequacy of the allowance for loan losses satisfactory to the regulators and remedy any deficiency in the allowance in the calendar quarter discovered by a charge to current operating earnings;
|
7
|
·
|
refrain from extending additional credit with respect to loans charged-off or classified as “loss” and uncollected;
|
|
·
|
refrain from extending additional credit with respect to other adversely classified loans, without the prior approval of a majority of the directors on the Bank Board or its loan committee, and without first collecting all past due interest;
|
|
·
|
implement a liquidity and funds management policy to reduce the Bank’s reliance on brokered deposits and other non-core funding sources; and
|
|
·
|
prepare and submit periodic progress reports to the FDIC and the Washington State DFI.
|
The FDIC Order will remain in effect until modified or terminated by the FDIC and the Washington State DFI. A complete copy of the FDIC Order was filed as Exhibit 10.1 to the Form 8-K filed by the Corporation with the SEC on July 21, 2010.
FRB Written Agreement. Additionally, based on an examination concluded on March 11, 2010, the Corporation entered into a Written Agreement (FRB Agreement) with the Federal Reserve Bank (FRB) of San Francisco on November 4, 2010. Under the FRB Agreement, the Corporation cannot do any of the following without prior written approval of the FRB:
|
·
|
declare or pay any dividends;
|
|
·
|
make any distributions of principal or interest on junior subordinated debentures or trust preferred securities;
|
|
·
|
incur, increase or guarantee any debt; or
|
|
·
|
redeem any outstanding stock.
|
The FRB Agreement also requires the Corporation to:
|
·
|
take steps to ensure that the Bank complies with the FDIC Order;
|
|
·
|
submit a written capital plan that provides for sufficient capitalization of both the Corporation and the Bank within 60 days, and notify the FRB no more than 45 days after the end of any quarter in which any of the Corporation’s capital ratios fall below the approved plan’s minimum ratios;
|
|
·
|
submit a written cash flow projection plan for 2011 within 60 days;
|
|
·
|
comply with FRB regulations governing affiliate transactions, as well as submit a written plan to reimburse the Bank for all payments made by the Bank in violation of sections 23A and 23B of the Federal Reserve Act or to collateralize the loan made by the Bank to the Corporation in accordance with the requirements of sections 23A and 23B of the Federal Reserve Act;
|
|
·
|
comply with notice and approval requirements of the Federal Deposit Insurance Act (FDI Act) related to the appointment of directors and senior executive officers or change in the responsibility of any current senior executive officer;
|
|
·
|
comply with restrictions on paying or agreeing to pay certain indemnification and severance payments without prior written approval; and
|
|
·
|
submit a quarterly process report to the FRB.
|
The FRB Agreement will remain in effect until modified or terminated by the FRB. A complete copy of the FRB Agreement is attached as Exhibit 10.1 to the Form 10-Q filed by the Corporation with the SEC on November 9, 2010.
The Board of Directors is committed to taking all actions necessary to meet each of the requirements of the FDIC Order and the FRB Agreement and believes that the Bank and the Corporation were in compliance with these regulatory actions as of December 31, 2010, except for the requirement in the FDIC Order to increase the Bank’s Tier 1 leverage capital to 10% and risk-based capital to 12% by November 18, 2010. The Board of Directors is working diligently to comply with the requirement to raise capital. On March 4, 2011, the Corporation announced that the Corporation, the Bank and Opus Bank entered into a definitive agreement, providing for Opus Bank to acquire the Corporation and the Bank, and for the merger of the Bank into Opus Bank. See “Proposed Merger.”
The requirements and restrictions of the FDIC Order and the FRB Agreement are judicially enforceable and the failure of the Corporation or Cascade Bank to comply with such requirements and restrictions may subject the Corporation and Cascade Bank to additional regulatory restrictions including: the imposition of civil monetary penalties; the issuance of directives to increase capital or enter into a strategic transaction, whether by merger or otherwise, with a third party; the appointment of a conservator or receiver for Cascade Bank; the liquidation or other closure of Cascade Bank and inability of the Corporation to continue as a going concern; the termination of insurance of deposits; the issuance of removal and prohibition orders against institution-affiliated parties; and the enforcement of such actions through injunctions or restraining orders. Generally, these enforcement actions will be lifted only after subsequent examinations substantiate complete correction of the underlying issues.
8
The following discussion is only intended to provide summaries of significant statutes and regulations that affect the banking industry and is therefore not complete. Changes in applicable laws or regulations, and in the policies of regulators, may have a material effect on our business and prospects. We cannot accurately predict the nature or extent of the effects on our business and earnings that fiscal or monetary policies, or new federal or state laws and regulations, may have in the future.
We are extensively regulated under federal and state law. These laws and regulations are primarily intended to protect depositors, not shareholders. The discussion below describes and summarizes certain statutes and regulations. These descriptions and summaries are qualified in their entirety by reference to the particular statute or regulation. Changes in applicable laws or regulations may have a material effect on our business and prospects. Our operations may also be affected by changes in the policies of banking and other government regulators. We cannot accurately predict the nature or extent of the possible future effects on our business and earnings of changes in fiscal or monetary policies, or new federal or state laws and regulations.
Compliance
In order to assure that we are in compliance with the laws and regulations that apply to our operations, including those summarized below, we employ a full-time compliance officer and also provide compliance training to our employees. We are regularly reviewed or audited by the Federal Reserve, the FDIC and the Washington State DFI, Division of Banks, during which examinations such agencies assess our compliance with applicable laws and regulations.
Federal Bank Holding Company Regulation
General: Cascade Financial Corporation is a registered bank holding company as defined in the Bank Holding Company Act of 1956, as amended, or the Bank Holding Company Act, and is therefore subject to regulation, supervision and examination by the Federal Reserve. In general, the Bank Holding Company Act limits the business of bank holding companies to owning or controlling banks and engaging in other activities closely related to banking. CFC must file reports with the Federal Reserve and must provide it with such additional information as it may require.
The Federal Reserve may require CFC to terminate an activity or terminate control or liquidate or divest certain subsidiaries, affiliates or investments when the Federal Reserve believes the activity or the control of the subsidiary or affiliates constitutes a significant risk to the financial safety, soundness or stability of any of its banking subsidiaries.
The Federal Reserve also has the authority to regulate provisions of certain bank holding company debt, including the authority to impose interest ceilings and reserve requirements on such debt. Under certain circumstances, CFC must file written notice and obtain Federal Reserve approval prior to purchasing or redeeming its equity securities. Additionally, CFC is required by the Federal Reserve to maintain certain levels of capital. See “Capital Adequacy” below for a discussion of the applicable federal capital requirements.
Acquisition of Banks: The Bank Holding Company Act requires every bank holding company to obtain the Federal Reserve Board’s prior approval before:
|
·
|
acquiring direct or indirect ownership or control of any voting shares of any bank if, after the acquisition, the bank holding company will directly or indirectly own or control more than 5% of the bank’s voting shares;
|
|
·
|
acquiring all or substantially all of the assets of any bank; or
|
|
·
|
merging or consolidating with any other bank holding company.
|
Additionally, the Bank Holding Company Act provides that the Federal Reserve Board may not approve any of these transactions if it would result in or tend to create a monopoly, substantially lessen competition or otherwise function as a restraint of trade, unless the anti-competitive effects of the proposed transaction are clearly outweighed by the public interest in meeting the convenience and needs of the community to be served. The Federal Reserve Board is also required to consider the financial and managerial resources and future prospects of the bank holding companies and banks concerned and the convenience and needs of the community to be served. The Federal Reserve Board’s consideration of financial resources generally focuses on capital adequacy, which is discussed below.
9
Restrictions on Ownership of CFC: The Bank Holding Company Act requires any “bank holding company” (as defined in that Act) to obtain the approval of the Board of Governors of the Federal Reserve System prior to acquiring more than 5% of our outstanding common stock. Any person other than a bank holding company is required to obtain prior approval of the Federal Reserve Board to acquire 10% or more of our outstanding common stock under the Change in Bank Control Act. Any holder of 25% or more of our outstanding common stock, other than an individual, is subject to regulation as a bank holding company under the Bank Holding Company Act.
Holding Company Control of Nonbanks: With some exceptions, the Bank Holding Company Act also prohibits a bank holding company from acquiring or retaining direct or indirect ownership or control of more than 5% of the voting shares of any company which is not a bank or bank holding company, or from engaging directly or indirectly in activities other than those of banking, managing or controlling banks, or providing services for its subsidiaries. The principal exceptions to these prohibitions involve certain non-bank activities which, by statute or by Federal Reserve regulation or order, have been identified as activities closely related to the business of banking or of managing or controlling banks.
Transactions with Affiliates: Subsidiary banks of a bank holding company are subject to restrictions imposed by the Federal Reserve Act on extensions of credit to the holding company or its subsidiaries, on investments in their securities and on the use of their securities as collateral for loans to any borrower. These regulations and restrictions may limit our ability to obtain funds from the Bank for our cash needs, including funds for payment of future dividends, interest and operational expenses.
Tying Arrangements: We are prohibited from engaging in certain tie-in arrangements in connection with any extension of credit, sale or lease of property or furnishing of services. For example, with certain exceptions, neither CFC nor the Bank may condition an extension of credit to a customer on either: (i) a requirement that the customer obtain additional services provided by us; or (ii) an agreement by the customer to refrain from obtaining other services from a competitor.
Support of Subsidiary Banks: Under Federal Reserve policy, CFC is expected to act as a source of financial and managerial strength to the Bank. This means that CFC is required to commit, as necessary, resources to support the Bank. Any capital loans a bank holding company makes to its subsidiary banks are subordinate to deposits and to certain other indebtedness of those subsidiary banks.
Federal and State Regulation of Cascade Bank
General: Cascade Bank is a Washington chartered commercial bank with deposits insured by the FDIC. As a result, the Bank is subject to supervision and regulation by the Washington State DFI and the FDIC. These agencies have the authority to prohibit banks from engaging in what they believe constitute unsafe or unsound banking practices.
Lending Limits: Washington banking law generally limits the amount of funds that a bank may lend to a single borrower, including related entities, to 20% of shareholders’ equity. As of December 31, 2010, the Bank had not made any loans with balances in excess of the loans-to-one-borrower limit.
Control of Financial Institutions: The acquisition of 25% or more of a state chartered bank’s voting power by any individual, group or entity, is deemed a change in control under Washington banking law, requiring notice and application and prior approval of the DFI.
Community Reinvestment: The Community Reinvestment Act requires that, in connection with examinations of financial institutions within their jurisdiction, the FDIC evaluate the record of the financial institution in meeting the credit needs of its local communities, including low and moderate income neighborhoods, consistent with the safe and sound operation of the institution. These factors are also considered in evaluating mergers, acquisitions and applications to open a branch or facility. Cascade Bank received an “outstanding” CRA rating at the last examination.
Insider Credit Transactions: Banks are also subject to certain FDIC restrictions on extensions of credit to executive officers, directors, principal shareholders or any related interests of such persons (i.e., insiders). Extensions of credit: (i) must be made on substantially the same terms and pursuant to the same credit underwriting procedures as those for comparable transactions with persons who are neither insiders nor employees; and (ii) must not involve more than the normal risk of repayment or present other unfavorable features. Banks are also subject to certain lending limits and restrictions on overdrafts to insiders. A violation of these restrictions may result in regulatory sanctions on the bank or its insiders.
10
Safety and Soundness Standards: Federal law imposes upon banks certain non-capital safety and soundness standards. These standards cover internal controls, information systems, internal audit systems, loan documentation, credit underwriting, interest rate exposure, asset growth, compensation and benefits. Additional standards apply to asset quality, earnings and stock valuation. An institution that fails to meet these standards must develop a plan acceptable to its regulators, specifying the steps that the institution will take to meet the standards. Failure to submit or implement such a plan may subject the institution to regulatory sanctions. Under Washington state law, if the shareholders’ equity of a Washington state-chartered bank becomes impaired, the Commissioner of the Washington State DFI will require the bank to make the impairment good. Failure to make the impairment good may result in the Commissioner’s taking possession of the bank and liquidating it.
Dividends: The principal source of CFC cash reserves is dividends received from the Bank. Washington law limits the Bank’s ability to pay cash dividends. Under these restrictions, a bank may not declare or pay any dividend greater than its retained earnings without approval of the Washington State DFI. The Washington State DFI has the power to require any state-chartered bank to suspend the payment of any and all dividends. In addition, a bank may not pay cash dividends if doing so would reduce its capital below minimum applicable federal capital requirements. See “Capital Adequacy” below for a discussion of the applicable federal capital requirements.
In June 2009, the Corporation announced that it would temporarily suspend its regular quarterly cash dividend on common stock to preserve capital. We are prohibited by the pending regulatory actions described above (see “Regulatory Actions”), from paying any cash dividend or any other form of payment or distribution representing a reduction in the Bank’s capital.
The FRB has issued a policy statement on the payment of cash dividends by bank holding companies which expresses the FRB’s view that a bank holding company should pay cash dividends only to the extent that the Corporation’s net income for the past year is sufficient to cover both the cash dividend and a rate of retention consistent with the Corporation’s capital needs. The FRB also indicated that it would be inappropriate for a company experiencing serious financial problems to borrow to pay dividends.
Other Regulations: The loan operations of the Bank are subject to state usury laws and federal laws concerning interest rates.
Federal Laws Applicable to Credit Transactions: The Bank’s loan operations are also subject to federal laws applicable to credit transactions, such as the:
|
·
|
Truth-In-Lending Act, governing disclosures of credit terms to consumer borrowers;
|
|
·
|
Home Mortgage Disclosure Act of 1975, requiring financial institutions to provide information to enable the public and public officials to determine whether a financial institution is fulfilling its obligation to help meet the housing needs of the community it serves;
|
|
·
|
Equal Credit Opportunity Act, prohibiting discrimination on the basis of race, creed or other prohibited factors in extending credit;
|
|
·
|
Fair Credit Reporting Act of 1978, governing the use and provision of information to credit reporting agencies;
|
|
·
|
Fair Debt Collection Practices Act, governing the manner in which consumer debts may be collected by collection agencies;
|
|
·
|
Service Members Civil Relief Act, which amended the Soldiers’ and Sailors’ Civil Relief Act of 1940, governing the repayment terms of, and property rights underlying, secured obligations of persons in military service; and
|
|
·
|
Rules and regulations of the various federal agencies charged with the responsibility of implementing these federal laws.
|
11
Federal Laws Applicable to Deposit Operations: The Bank’s deposit operations are subject to:
|
·
|
the Right to Financial Privacy Act, which imposes a duty to maintain confidentiality of consumer financial records and prescribes procedures for complying with administrative subpoenas of financial records; and
|
|
·
|
the Electronic Funds Transfer Act and Regulation E issued by the Federal Reserve Board to implement that act, which govern automatic deposits to and withdrawals from deposit accounts and customers’ rights and liabilities arising from the use of automated teller machines and other electronic banking services.
|
Federal Home Loan Bank System: The Federal Home Loan Bank system, of which the Bank is a member, consists of 12 regional Federal Home Loan Banks governed and regulated by the Federal Housing Finance Board (FHFB). The Federal Home Loan Banks serve as reserve or credit facilities for member institutions within their assigned regions. They are funded primarily from proceeds derived from the sale of consolidated obligations of the FHLB system. They make loans (i.e. advances) to members in accordance with policies and procedures established by the FHLB and the boards of directors of each regional FHLB.
As a system member, the Bank is entitled to borrow from the FHLB of its region and is required to own a certain amount of capital stock in the FHLB. The Bank is in compliance with the stock ownership rules described above with respect to such advances, commitments and letters of credit and residential one-to-four family loans and similar obligations. All loans, advances and other extensions of credit made by the FHLB to the Bank are secured by a portion of the loan portfolio, certain other investments and the capital stock of the FHLB held by the Bank.
Mortgage Banking Operations: The Bank is subject to the rules and regulations of FHA, VA, FNMA, FHLMC and GNMA with respect to originating, processing, selling and servicing mortgage loans and the issuance and sale of mortgage-backed securities. Those rules and regulations, among other things, prohibit discrimination and establish underwriting guidelines which include provisions for inspections and appraisals require credit reports on prospective borrowers and fix maximum loan amounts, and, with respect to VA loans, fix maximum interest rates. Mortgage origination activities are subject to, among others, the Equal Credit Opportunity Act, Federal Truth-in-Lending Act and the Real Estate Settlement Procedures Act and the regulations promulgated thereunder which, among other things, prohibit discrimination and require the disclosure of certain basic information to mortgagors concerning credit terms and settlement costs.
Commercial Real Estate Guidance: The FDIC and the Federal Reserve Board issued joint Guidance on Concentrations in Commercial Real Estate Lending, Sound Risk Management Practices on December 6, 2006. The Guidance provides supervisory criteria, including the following numerical indicators, to assist bank examiners in identifying banks with potentially significant commercial real estate loan concentrations that may warrant greater supervisory scrutiny: (1) commercial real estate loans exceed 300% of capital and increased 50% or more in the preceding three years; or (2) construction and land development loans exceed 100% of capital. The Guidance does not limit banks’ levels of commercial real estate lending activities. The Guidance applies to the Bank, based on our current loan portfolio. We believe that our loan portfolio has been subject to rigorous examination by banking regulators and our own credit review function and that we are taking appropriate precautions to address the risks associated with our concentrations in commercial real estate lending. We do not expect the Guidance to adversely affect our operations or our ability to execute our business strategy.
Regulation E
In November 2009, the Federal Reserve issued amendments to Regulation E, which implemented the Electronic Fund Transfer Act (Regulation E). These amendments change, among other things, the way we and other banks may charge overdraft fees; by limiting our ability to charge an overdraft fee for ATM and one-time debit card transactions that overdraw a consumer’s account, unless the consumer affirmatively consents to the Bank’s payment of overdrafts for those transactions. On December 16, 2010, the Federal Reserve Board proposed an interchange fee cap of twelve cents per transaction. Changes to our overdraft practices will likely negatively impact future service charge revenues.
Privacy
Federal banking rules limit the ability of banks and other financial institutions to disclose nonpublic information about consumers to nonaffiliated third-parties. Pursuant to these rules, financial institutions must provide:
|
·
|
initial notices to customers about their privacy policies, describing the conditions under which they may disclose nonpublic personal information to nonaffiliated third-parties and affiliates;
|
12
|
·
|
annual notices of their privacy policies to current customers; and
|
|
·
|
a reasonable method for customers to “opt out” of disclosures to nonaffiliated third-parties.
|
These privacy provisions affect how consumer information is transmitted through diversified financial companies and conveyed to outside vendors. We have implemented privacy policies to comply with these requirements.
Interstate Banking and Branching
The Riegle-Neal Interstate Banking and Branching Efficiency Act of 1994 (Interstate Act) permits nationwide interstate banking and branching under certain circumstances. This legislation generally authorizes interstate branching and relaxes federal law restrictions on interstate banking. Currently, bank holding companies may purchase banks in any state, and states may not prohibit these purchases. Additionally, banks are permitted to merge with banks in other states, as long as the home state of neither merging bank has opted out under the legislation. The Interstate Act requires regulators to consult with community organizations before permitting an interstate institution to close a branch in a low-income area.
FDIC regulations prohibit banks from using their interstate branches primarily for deposit production. The FDIC has implemented a loan-to-deposit ratio screen to ensure compliance with this prohibition.
Washington enacted “opting in” legislation in accordance with the Interstate Act, allowing banks to engage in interstate merger transactions, subject to certain “aging” requirements. Until recently, Washington restricted out-of-state banks from opening de novo branches; however, in 2005, Washington interstate branching laws were amended so that an out-of-state bank may, subject to the DFI’s approval, open de novo branches in Washington or acquire an in-state branch so long as the home state of the out-of-state bank has reciprocal laws with respect to de novo branching or branch acquisitions. Once an out-of-state bank has acquired a bank within Washington, either through merger or acquisition of all or substantially all of the bank’s assets or through authorized de novo branching, the out-of-state bank may open additional branches within the state.
Deposit Insurance
Deposit Insurance. Under the Dodd-Frank Act, the maximum amount of federal deposit insurance coverage has been permanently increased from $100,000 to $250,000 per depositor, per institution. Due to the significant number of bank failures and the current balance of the Deposit Insurance Fund (DIF), we anticipate continued increases in our FDIC premiums going forward. The Dodd-Frank Act also temporarily increases the maximum amount of federal deposit insurance coverage for non-interest bearing accounts to an unlimited amount from December 31, 2010 until January 1, 2013. The Dodd-Frank Act also broadens the base for FDIC insurance assessments. Assessments will now be based on the average consolidated total assets less tangible equity capital of a financial institution. This could result in an increase in deposit insurance assessments to be paid by us.
Capital Adequacy
Regulatory Capital Guidelines: Federal bank regulatory agencies use capital adequacy guidelines in the examination and regulation of bank holding companies and banks. The guidelines are “risk-based,” meaning that they are designed to make capital requirements more sensitive to differences in risk profiles among banks and bank holding companies.
Tier I and Tier II Capital: Under the guidelines, an institution’s capital is divided into two broad categories, Tier I capital and Tier II capital. Tier I capital generally consists of common shareholders’ equity, surplus and undivided profits. Tier II capital generally consists of the allowance for loan losses, hybrid capital instruments and subordinated debt. The sum of Tier I capital and Tier II capital represents an institution’s total capital. The guidelines require that at least 50% of an institution’s total capital consist of Tier I capital.
Risk-based Capital Ratio: The adequacy of an institution’s capital is gauged primarily with reference to the institution’s risk weighted assets. The guidelines assign risk weightings to an institution’s assets in an effort to quantify the relative risk of each asset and to determine the minimum capital required to support that risk. An institution’s risk weighted assets are then compared with its Tier I capital and total capital to arrive at a Tier I risk-based ratio and a total risk-based ratio, respectively. The guidelines provide that an institution must have a minimum Tier I risk-based ratio of 4% and a minimum total risk-based ratio of 8%.
13
Leverage Ratio: The guidelines also employ a leverage ratio, which is Tier I capital as a percentage of total assets less intangibles, to be used as a supplement to risk-based guidelines. The principal objective of the leverage ratio is to constrain the maximum degree to which a bank holding company may leverage its equity capital base. The minimum leverage ratio is 3%; however, for all but the most highly rated bank holding companies and for bank holding companies seeking to expand, regulators generally expect an additional cushion of at least 1% to 2%.
Prompt Corrective Action (PCA): Under the guidelines, an institution is assigned to one of five capital categories depending on its total risk-based capital ratio, Tier I risk-based capital ratio, and leverage ratio, together with certain subjective factors. The categories range from “well capitalized” to “critically undercapitalized.” Institutions that are deemed to be undercapitalized, depending on the category to which they are assigned, are subject to certain mandatory supervisory corrective actions.
In order to be adequately capitalized, an institution must generally have a total risk-based capital ratio of not less than 8%, a Tier 1 risk-based capital of not less than 4%, and a leverage ratio of not less than 4%. Any institution that fails to meet these levels will be considered undercapitalized. Undercapitalized institutions are subject to certain prompt corrective action requirements, regulatory controls and restrictions, which become more extensive as an institution becomes more severely undercapitalized. See “Management’s Discussion and Analysis of Financial Condition and Results of Operations – Regulatory Capital” for additional discussion.
As of December 31, 2010, Cascade Bank was categorized by the FDIC as “undercapitalized” for purposes of PCA. Under the Federal Deposit Insurance (FDI) Act’s PCA capital requirements (12 U.S.C. § 1831o), depository institutions that are “undercapitalized”, in addition to being subject to a number of additional restrictions, the bank is required to submit a capital restoration plan to the FDIC. Pursuant to Federal Deposit Insurance Corporation Improvement Act, an undercapitalized bank is prohibited from increasing its assets, engaging in a new line of business, acquiring any interest in any company or insured depository institution, or opening or acquiring a new branch office, except under certain circumstances, including the acceptance by the FDIC of a capital restoration plan for the bank. If a bank is classified as significantly undercapitalized, the FDIC would be required to take one or more prompt corrective actions. These actions would include, among other things, requiring sales of new securities to bolster capital; improvements in management; limits on interest rates paid; prohibitions on transactions with affiliates; termination of certain risky activities and restrictions on compensation paid to executive officers. These actions may also be taken by the FDIC at any time on an undercapitalized bank if it determines those restrictions are necessary. If a bank is classified as critically undercapitalized, in addition to the foregoing restrictions, the Federal Deposit Insurance Corporation Improvement Act prohibits payment on any subordinated debt and requires the bank to be placed into conservatorship or receivership within 90 days, unless the FDIC determines that other action would better achieve the purposes of the Federal Deposit Insurance Corporation Improvement Act regarding prompt corrective action with respect to undercapitalized banks. The capital classification of a bank also affects the frequency of examinations of the bank. If our capital levels further decline, we may become subject to additional regulatory restrictions, which could adversely affect our earnings, business and operations.
State Corporate Law Restrictions
As a Washington corporation, we are subject to certain limitations and restrictions under applicable Washington corporate law. For example, state law restrictions in Washington include limitations and restrictions relating to indemnification of directors; distributions to shareholders; transactions involving directors, officers, or interested shareholders; maintenance of books, records, and minutes; and observance of certain corporate formalities.
Corporate Governance and Accounting Legislation
Sarbanes-Oxley Act of 2002: On July 30, 2002, the Sarbanes-Oxley Act of 2002, or SOX, was signed into law to address corporate and accounting fraud. SOX established a new accounting oversight board that enforces auditing standards and restricts the scope of services that accounting firms may provide to their public company audit clients. Among other things, SOX also: (i) requires chief executive officers and chief financial officers to certify to the accuracy of periodic reports filed with the SEC; (ii) imposes new disclosure requirements regarding internal controls, off-balance-sheet transactions, and pro forma (non GAAP) disclosures; (iii) accelerates the time frame for reporting of insider transactions and periodic disclosures by public companies; and (iv) requires companies to disclose whether or not they have adopted a code of ethics for senior financial officers and whether the audit committee includes at least one “audit committee financial expert.”
Under SOX, the SEC is required to regularly and systematically review corporate filings, based on certain enumerated factors. To deter wrongdoing, SOX: (i) subjects bonuses issued to top executives to disgorgement if a restatement of a company’s financial statements was due to corporate misconduct; (ii) prohibits an officer or director from misleading or coercing an auditor; (iii) prohibits insider trades during pension fund “blackout periods”; (iv) imposes new criminal penalties for fraud and other wrongful acts; and (v) extends the period during which certain securities fraud lawsuits can be brought against a company or its officers.
14
Anti-terrorism Legislation
USA Patriot Act of 2001: Among other things, the Patriot Act: (i) prohibits banks from providing correspondent accounts directly to foreign shell banks; (ii) imposes due diligence requirements on banks opening or holding accounts for foreign financial institutions or wealthy foreign individuals; (iii) requires financial institutions to establish an anti-money-laundering compliance program; and (iv) eliminates civil liability for persons who file suspicious activity reports. The Patriot Act also increased governmental powers to investigate terrorism, including expanded government access to account records. The Department of the Treasury is empowered to administer and make rules to implement the Patriot Act.
Effects of Government Monetary Policy
Our earnings and growth are affected not only by general economic conditions, but also by the fiscal and monetary policies of the federal government, particularly the Federal Reserve. The Federal Reserve can and does implement national monetary policy for such purposes as curbing inflation and combating recession. The nature and impact of future changes in monetary policies and their impact on us cannot be predicted with certainty.
Employees
At December 31, 2010, we had 200 full-time equivalent employees. The employees are not represented by a collective bargaining unit. We believe we have a good relationship with our employees.
Corporate Information
We make available through our Internet website, free of charge, copies of our annual report on Form 10-K, quarterly reports on Form 10-Q, current reports on Form 8-K and amendments to those reports filed or furnished pursuant to Section 13(a) or Section 15(d) of the Securities Exchange Act of 1934, as amended, as soon as reasonably practicable after filing such material electronically or otherwise furnishing it to the Securities and Exchange Commission (SEC). These filings can be accessed under “Shareholder Information” found on the homepage of our website at www.Cascadebank.com. These filings are also accessible on the SEC’s website at www.sec.gov. The public may read and copy any materials we file with the SEC at the SEC’s Public Reference Room at 100 F Street, N.E., Washington, D.C. 20549. The public may obtain information on the operation of the Public Reference Room by calling the SEC at 1-800-SEC-0330.
The Board has adopted Standards of Conduct for employees, officers and directors, which include a “code of ethics” as defined by Item 406 of the Regulation S-K. These Standards of Conduct apply to the members of the Board of Directors and all of the Corporation’s employees, including the Corporation’s Chief Executive Officer and Chief Financial Officer.
Each of the documents referred to above is also available in print (at no charge) to any shareholder upon request, addressed to:
Cascade Financial Corporation
Attention: Corporate Secretary
2828 Colby Avenue
Everett, WA 98201
Our website and the information contained therein or connected thereto are not incorporated by reference into this Form 10-K.
15
Capital Purchase Program Requirements. As an issuer of preferred stock to the U.S. Treasury under its Capital Purchase Program, which itself was a component of the Troubled Asset Relief Program, the Corporation agreed to certain terms and conditions. The issuance agreements established limitations on executive pay, requirements that the Corporation’s incentive/bonus programs do not encourage senior executive officers to take unnecessary and excessive risk, and provides for a claw back of previously paid bonuses if such payments are found to be based on materially inaccurate financial statements. In addition, participation in the program required a modification of existing employment and/or change of control agreements with senior executive officers.
ITEM 1A. RISK FACTORS
In the course of conducting our business operations, the Corporation and the Bank are exposed to a variety of risks that are inherent to the financial services industry. The following discusses some of the key inherent risk factors that could affect our business and operations as well as other risk factors, which are particularly relevant to us in the current period of significant economic and market disruptions. Other factors, besides those discussed below or elsewhere in this report or other reports filed with or furnished to the SEC, also could adversely affect our business and operations, and these risk factors should not be considered a complete list of potential risks that may affect the Corporation and the Bank. These risk factors also serve to describe factors which may cause our results to differ materially from those described in forward-looking statements included herein or in other documents or statements that make reference to this report. See “Forward-Looking Statements.”
Risks Related to Our Business and Markets
Our capital position has deteriorated and we are now categorized by the FDIC as undercapitalized, and subject to an FDIC Order to raise additional capital, and we may become subject to further adverse regulatory actions.
The Corporation’s and the Bank’s capital positions have deteriorated and the Bank is now considered to be “undercapitalized” under the prompt corrective action provision of the FDI Act and related regulations, and we are subject to regulatory actions, including an FDIC Order requiring us to raise at least $68.0 million of additional capital by November 18, 2010. We have not been able to raise additional capital to date, and therefore, risk further regulatory actions and penalties. Our ability to raise additional capital depends on the current capital markets and on our financial performance. See Item 1 of this report captioned “Regulation and Supervision” for further discussion.
If our capital levels further decline, we may become subject to additional regulatory restrictions, which could adversely affect our earnings, business and operations.
Our auditor’s opinion on our 2010 financial statements includes a “going concern” qualification to our financials.
As a result of the FDIC Order, the significant operating losses incurred in 2010 and 2009, and our need to raise additional capital, there is substantial doubt about our ability to continue as a going concern. The report of our independent registered public accounting firm on our consolidated financial statements for the year ended December 31, 2010, contains an explanatory paragraph with respect to our ability to continue as a going concern. See Item 15: Note 2 to the Consolidated Financial Statements. The 2010 financial statements do not include any adjustments that might result from the outcome of these uncertainties, which could affect our ability to continue as a going concern. The going concern qualification to our financials could make it even more difficult for us to raise additional capital.
Restrictions imposed by regulatory actions could have an adverse effect on us and failure to comply with these regulatory actions could result in further regulatory action or restrictions.
The business and operations of the Corporation and our subsidiary, Cascade Bank, are currently subject to regulatory actions, which for example, generally prohibit us from paying dividends, repurchasing stock, retaining new directors or senior managers or changing the duties of senior management, paying management or consulting fees or other funds to the Corporation, and extending additional credit with respect to nonperforming and adversely classified loans, which management believes complicates the workout of troubled loans. We are also required to raise additional capital. These and other regulatory actions are described in more detail in Item 1 of this report under “Regulation and Supervision.” Management believes that it is in compliance with all the requirements of these regulatory actions, other than the requirement to raise additional capital. These regulatory actions and any future actions could continue to adversely affect our earnings, business and operations. In addition, failure to comply with these regulatory actions or any future actions could result in further regulatory actions or restrictions, including monetary penalties and the potential closure of Cascade Bank.
16
We continue to operate in a challenging and uncertain economic environment, both nationally and in our western Washington market. Like many other financial institutions, we are being affected by sharp declines in residential and commercial real estate values, with rising foreclosures and high unemployment. Continued declines in residential and commercial real estate values and home sales and financial stress on borrowers as a result of the uncertain economic environment and job losses, could have an adverse effect on our borrowers or their customers and demand for our products and services, which could adversely affect our financial condition and earnings, increase loan delinquencies, defaults and foreclosures, and significantly impair the value of our collateral and our ability to sell the collateral upon foreclosure.
We have been experiencing significant deterioration in our loan portfolio, centered in our residential construction and land development loans.
As of December 31, 2010, approximately 86.4% of our loan portfolio was comprised of loans secured by real estate, made up of 44.6% commercial real estate loans, 25.3% one-to-four family residential loans, 9.6% multifamily loans, 6.9% land acquisition and development/land loans. Despite some recent signs of stabilization or improvement, the deterioration in our loan portfolio which began in 2008 and has been centered in our residential construction and land development loans, continues to be a significant challenge for us, although the pace of charge-offs and provisions for loan losses slowed in the latter half of 2010. The contraction or expansion of our nonaccrual loan portfolio and other real estate owned (REO) properties in future periods will depend upon our ongoing collection efforts and changes in market conditions. We have a dedicated team of 6 employees focused on the management of problem loans, but there is no guarantee that this team will be able to effectively manage the amount of problem loans we may encounter in the future. Additional information regarding credit risk is included in “Management’s Discussion and Analysis of Financial Condition and Results of Operations - Loans.”
Due to unforeseen circumstances and/or changes in estimates, our allowance for loan losses may not be adequate to cover future losses.
An essential element of our business is to make loans. We maintain an allowance for loan losses that we believe is a reasonable estimate of known and inherent losses within the loan portfolio. Our loan portfolio and allowance for loan losses are assessed each quarter by management, reviewed by our audit committee and external auditors, and were subject to recent examinations by our federal and state regulators. As of December 31, 2010, our allowance for loan losses increased to $26.1 million, or 2.62% of our total loans of $997.7 million, as a result of significant additional provisions for loan losses and charge-offs in 2010. See “Management’s Discussion and Analysis of Financial Condition and Results of Operations - Allowance for Loan Losses.” The determination of the appropriate level of loan loss allowance as well as the appropriate amount of loan charge-offs (net of loan recoveries) is an inherently difficult process and is based on numerous assumptions and there may be a range of potential estimates. The amount of future losses is susceptible to changes in economic, operating and other conditions, including changes in real estate values in our markets and interest rates that are beyond our control. Our underwriting policies, credit monitoring processes and risk management systems and controls may not prevent unexpected losses. In addition, bank regulators periodically review our allowance for loan losses, and may require us to increase our provision for loan losses or recognize further loan charge-offs. Due to our “undercapitalized” status and the regulatory actions against us, we are also subject to additional examinations. Any such additional loan losses, should they occur, would adversely affect our financial condition and profitability.
Nonperforming assets take significant time to resolve and adversely affect our results of operations and financial condition.
Our nonperforming assets adversely affect our net income in various ways. Until economic and market conditions improve, we may continue to incur additional losses relating to nonperforming loans. We do not record interest income on non-accrual loans, thereby adversely affecting our income, and increasing loan administration costs. When we receive collateral through foreclosures and similar proceedings, we are required to mark the related loan to the then fair market value of the collateral, which may result in a loss. An increase in the level of nonperforming assets also increases our risk profile and may impact the capital levels our regulators believe is appropriate in light of such risks. We utilize various techniques such as loan sales, workouts, and restructurings to manage our problem
17
If Cascade Bank’s foreclosed assets are not properly valued or sufficiently reserved to cover actual losses, or if the Bank is required to increase its valuation reserves, it could suffer additional losses.
Cascade Bank obtains updated collateral valuations when a loan has been foreclosed and the property taken in as real estate or real property owned and at certain other times. The net book value in the loan at the time of foreclosure and thereafter is compared to the updated market value, or fair value, of the foreclosed property less estimated selling costs. A writedown is recorded for any excess in the asset’s net book value over its fair value. If property values decline, the fair value of the foreclosed assets may not be sufficient to recover the carrying value in such assets, resulting in the need for additional charge-offs. Significant charge-offs to the foreclosed assets could have a material adverse effect on our financial condition and results of operations. In addition, bank regulators periodically review the foreclosed assets and may require us to recognize further charge-offs. Due to our undercapitalized status and various regulatory orders and agreements in place, we are subject to additional examinations, including the review of foreclosed properties. Any increase in the charge-offs, as required by the bank regulators, may have a material adverse effect on our financial condition and results of operations.
Market and other constraints on our construction and development loan origination volume have decreased our interest and fee income which have not been fully offset by reductions in our noninterest expenses.
Due to existing conditions in housing markets in the areas where we operate, general market conditions and other factors, our construction and development loan originations have been materially constrained in 2010 and we expect this to continue for the foreseeable future. Additionally, management’s revised business plan has de-emphasized the origination of construction loans. This has lowered interest income and fees generated from this part of our business. We have not succeeded in finding new revenue sources in the near term to completely offset declines in our interest income and origination of all new loans has decreased significantly. As a result, our total revenues have declined relative to our total noninterest expenses, and management cannot assure you that our total loans or assets will not continue to decline in the future.
We may be required to repurchase mortgage loans in some circumstances, which could harm our liquidity, results of operations and financial condition.
When we sell mortgage loans we are required to make certain representations and warranties to the purchaser about the mortgage loans and the manner in which they were originated. Our whole loan sale agreements require us to repurchase or substitute mortgage loans in the event we breach any of these representations or warranties. In addition, we may be required to repurchase mortgage loans as a result of borrower fraud or in the event of early payment default of the borrower on a mortgage loan. If repurchase and indemnity demands increase, our liquidity, results of operations and financial condition will be adversely affected.
Defaults and related losses in our residential construction and land development loan portfolio could result in a significant increase in REO balances and the number of properties to be disposed of, which would adversely affect our financial results.
As part of our collection process for all nonperforming real estate loans, we may foreclose on and take title to the property serving as collateral for the loan. Real estate owned by us and not used in the ordinary course of our operations is referred to as other real estate owned (REO) property. We expect to take additional properties into REO. Increased REO balances lead to greater expenses as we incurs costs to manage and dispose of the properties and, in certain cases, complete construction of improvements prior to sale. Any decrease in sale prices on properties may lead to REO write-downs with a corresponding expense in our statement of operations. Our management expects that earnings over the next several quarters could be negatively affected by various expenses associated with REO, including personnel costs, insurance and taxes, completion and repair costs, and other costs associated with property ownership, as well as by the funding costs associated with assets that are tied up in real estate during the period they are held in REO. The management and oversight of REO is time consuming and can be complex and can require significant resources of our management and employees.
18
Our future earnings may be adversely affected by legal and regulatory actions taken against us, as well as those legal actions that Cascade Financial Corporation has and may pursue.
Cascade Financial Corporation and Cascade Bank are involved in the regulatory, collection and potential foreclosure actions and proceedings referenced in “Item 3: Legal Proceedings,” which, if adversely determined, could have a material adverse effect on our consolidated financial position, results of operations or cash flows and our ability to raise capital. Moreover, the expenses of pending legal proceedings will adversely affect our results of operations until they are resolved.
Our profitability and the value of shareholders’ investments may suffer because of rapid and unpredictable changes in the highly regulated environment in which we operate.
We are subject to extensive supervision by several governmental regulatory agencies at the federal and state levels in the financial services area. Recently enacted, proposed and future legislation and regulations have had, and will continue to have, or may have a significant impact on the financial services industry. These regulations, which are generally intended to protect depositors and not stockholders, and the interpretation and application of them by federal and state regulators, are beyond our control, may change rapidly and unpredictably and can be expected to influence earnings and growth. For example, the FDIC and the Federal Reserve recently issued joint Guidance on Concentrations in Commercial Real Estate Lending, Sound Risk Management Practices that sets forth supervisory criteria to assist bank examiners in identifying banks with potentially significant commercial real estate loan concentrations that may warrant greater supervisory scrutiny.
The Guidance applies to Cascade Bank, based on our current loan portfolio, and our management expects that our business and operations will be subject to enhanced regulatory review for the foreseeable future. Regulatory authorities have extensive discretion in their supervisory and enforcement activities, including the imposition of restrictions on operations, the classification of assets and determination of the level of allowance for loan losses. Our success depends on our continued ability to maintain compliance with these regulations. Such additional regulation and supervision may increase our costs and limit our ability to pursue business opportunities.
Liquidity risk could impair our ability to fund operations and jeopardize our financial condition.
Liquidity is essential to our business. An inability to raise funds through deposits, borrowings, the sale of loans and other sources could have a substantial negative effect on our liquidity. Our access to funding sources in amounts adequate to finance our activities and on terms which are acceptable to us, could be impaired by factors that affect us specifically or the financial services industry or economy in general.
We must maintain sufficient funds to respond to the needs of depositors and borrowers. As a part of our liquidity management, we utilize and maintain a number of funding sources in addition to core deposit growth and repayments and maturities of loans and investments. We may become more dependent on these sources, which include advances from the Federal Home Loan Bank of Seattle and the Federal Reserve Bank of San Francisco, and securities sold under agreements to repurchase. Our financial flexibility will be severely constrained if we are unable to maintain our access to funding or if adequate financing is not available to accommodate future growth at acceptable interest rates. If we are required to rely more heavily on more expensive funding sources to support future growth, our revenues may not increase proportionately to cover our costs, and our profitability would be adversely affected.
Certain repurchase agreements we entered into include substantial termination fees.
We also use repurchase agreements for funding needs. The Bank has $50.0 million in repurchase agreements that have provisions allowing the agreements to be terminated by its counterparty. While we have received no indication that these repurchase agreements will be terminated prior to maturity, and the transactions are well secured by securities pledged to the counterparty, management believes that the likelihood of termination of the agreements is reasonably possible. If these repurchase agreements had been terminated as of December 31, 2010, the termination fee would have been approximately $13.7 million. An additional $75.0 million in repurchase agreements have provisions allowing termination by its counterparty with a termination fee, but these agreements cannot be terminated prior to December 2012, provided the Bank offers the lender additional securities in November and December 2011. Repurchase agreements with this lender totaling $25 million and $50 million
19
The FDIC Order limits the types of funding sources on which we may rely and may have a negative impact on our liquidity.
Pursuant to the terms of the FDIC Order, we may not accept, renew or roll over any brokered deposits, and are required to submit a plan that eliminates our reliance on brokered deposits. In addition, certain interest-rate limits apply to our brokered and solicited deposits. The reduction in the level of brokered deposits, even according to their regular maturity dates, may have a negative impact on our liquidity in the near term. Our financial flexibility could be severely constrained if we are unable to renew our wholesale funding or if adequate financing is not available in the future at acceptable rates of interest. We may not have sufficient liquidity to continue to fund new loan originations, and we may need to liquidate loans or other assets unexpectedly in order to repay obligations as they mature. Furthermore, we are now required to provide a higher level of collateral for any funds that we borrow from the Federal Reserve, and we may be required to provide additional collateral to our other funding sources as well. Any additional collateral requirements or limitations on our ability to access additional funding sources are expected to have a negative impact on our liquidity.
Fluctuations in interest rates could reduce our profitability and affect the value of our assets.
Like other financial institutions, we are subject to interest rate risk, which is the primary market risk affecting our financial performance. Our primary source of income is net interest income, which is the difference between interest earned on loans and investments and the interest paid on deposits and borrowings. We expect that we will periodically experience imbalances in the interest rate sensitivities of our assets and liabilities and the relationships of various interest rates to each other. Over any defined period of time, our interest-earning assets may be more sensitive to changes in market interest rates than our interest-bearing liabilities, or vice versa. In addition, the individual market interest rates underlying our loan and deposit products (e.g., prime) may not change to the same degree over a given time period. Loan volume and quality and deposit volume and mix can be affected by market interest rates. Changes in market interest rates could materially and adversely affect our net interest spread, asset quality, origination volume and overall profitability.
We principally manage interest rate risk by managing the volume and mix of our earning assets and funding liabilities. In a changing interest rate environment, we may not be able to manage this risk effectively. If we are unable to manage interest rate risk effectively, our business, financial condition and results of operations could be materially harmed.
Changes in the level of interest rates also may negatively affect our ability to originate loans, the value of our assets and our ability to realize gains from the sale of our assets, all of which ultimately affect our earnings.
Interest rate volatility and credit risk adjusted rate spreads may impact our financial assets and liabilities measured at fair value, particularly the fair value of our junior subordinated debentures.
The widening of market interest rate spreads on junior subordinated debentures to levels above the contractual spreads on our outstanding debentures, combined with recent reductions in three month LIBOR rates, has contributed to positive fair value adjustments in our junior subordinated debentures carried at fair value over the last three years. Tightening of these spreads may result in recognizing fair value adjustments that negatively impact our earnings in the future.
We are exposed to risk of environmental liabilities with respect to properties to which we take title.
Approximately 86.4% of our outstanding loan portfolio at December 31, 2010, was secured by real estate. In the course of our business and as a result of current market conditions, we have foreclosed and taken title to real estate which could subject us to environmental liabilities with respect to these properties. We may be held liable to a governmental entity or to third parties for property damage, personal injury, investigation and clean-up costs incurred by these parties in connection with environmental contamination, or may be required to investigate or clean-up hazardous or toxic substances, or chemical releases at a property. The costs associated with investigation or remediation activities could be substantial. In addition, if we are the owner or former owner of a contaminated site, we may be subject to common law claims by third parties based on damages and costs resulting from environmental contamination emanating from the property. If we become subject to significant environmental liabilities, our business, financial condition, results of operations and prospects could be materially and adversely affected.
20
Because of our participation in the Troubled Asset Relief Program (TARP), we are subject to restrictions on compensation paid to our executives, which may make it difficult to attract and retain key members of management.
Pursuant to the terms of the TARP Capital Purchase Program, we adopted certain standards for executive compensation and corporate governance for the period during which the Treasury owns our Series A Preferred Stock. These standards generally apply to our five most highly compensated senior executive officers, including our Chief Executive Officer and Chief Financial Officer, and certain of these restrictions also apply up to the next 20 most highly compensated senior executives. The standards include, among other things:
|
·
|
ensuring that incentive compensation for senior executives does not encourage unnecessary and excessive risks that threaten the value of the financial institution;
|
|
·
|
a required clawback of any bonus or incentive compensation paid to a senior executive officer or one of the next twenty most highly compensated employees based on statements of earnings, gains or other criteria that are later proven to be materially inaccurate;
|
|
·
|
a prohibition on making golden parachute payments to senior executive officers;
|
|
·
|
an agreement not to deduct, for tax purposes, annual compensation in excess of $500,000 for each senior executive officer; and
|
|
·
|
limitations on bonuses and incentive compensation.
|
We depend on the services of existing management to carry out our business and investment strategies. In order for us to implement our strategy to emphasize relationship banking, we will need to continue to attract and retain additional management and other qualified staff. Competition for such personnel is significant in our geographic market areas. The loss of the services of any management personnel, or the inability to recruit and retain qualified personnel in the future, could have an adverse effect on our results of operations, financial condition and prospects. In particular, the change to the deductibility limit on executive compensation may increase the overall cost of our compensation programs in future periods and may make it more difficult to attract suitable candidates to serve as executive officers.
Our ability to attract and retain customers and employees could be adversely affected to the extent our reputation is harmed.
Our ability to attract and retain customers and employees could be adversely affected to the extent our reputation is damaged. Our actual or perceived failure to address various issues could give rise to reputational risk that could cause harm to us and our business prospects, including failure to properly address operational risks. These issues include, but are not limited to, legal and regulatory requirements; privacy; properly maintaining customer and associate personal information; record keeping; money-laundering; sales and trading practices; ethical issues; appropriately addressing potential conflicts of interest; and the proper identification of the legal, reputational, credit, liquidity and market risks inherent in our products.
We are also facing enhanced public and regulatory scrutiny resulting from the financial crisis and the regulatory orders and agreement currently in place. Failure to appropriately address the requirements stemming from regulatory actions could also give rise to additional regulatory restrictions, reputational harm and legal risks, which could among other consequences increase the size and number of litigation claims and damages asserted or subject us to enforcement actions, fines and penalties and cause us to incur related costs and expenses.
Our ability to use some or all of our net operating loss carryforwards may be impaired.
There is a significant likelihood that if we complete a capital raise involving equity financing, we will experience an “ownership change,” which would cause a reduction in the value of our net operating loss carryforwards (NOLs) realizable for income tax purposes. Section 382 of the Internal Revenue Code imposes restrictions on the use of a corporation’s NOLs, as well as certain recognized built-in losses and other carryforwards, after an “ownership change” occurs. A Section 382 “ownership change” occurs if one or more stockholders or groups of stockholders who own at least 5% of our stock increase their ownership by more than 50 percentage points over their lowest ownership percentage within a rolling three-year period. If an “ownership change” occurs, Section 382 would impose an annual limit on the amount of pre-change NOLs and other losses we can use to reduce our tax liability generally equal to the product of the total value of our outstanding equity immediately prior to the “ownership change” and the applicable federal long-term tax-exempt interest rate for the month of the “ownership change."
21
Our investment in Federal Home Loan Bank stock may become impaired.
At December 31, 2010, Cascade Bank held Federal Home Loan Bank (FHLB) of Seattle stock with a par value of $11.9 million. As a condition of membership at the FHLB, we are required to purchase and hold a certain amount of FHLB stock. Our stock purchase requirement is based, in part upon the outstanding principal balance of advances from the FHLB and is calculated in accordance with the Capital Plan of the FHLB. Our FHLB stock has a par value of $100, is carried at cost, and is subject to recoverability testing per accounting guidance for the impairment of long-lived assets. The FHLB currently has a risk-based capital deficiency under the regulations of the Federal Housing Finance Agency (the FHFA), its primary regulator, and has suspended future dividends and the repurchase and redemption of outstanding common stock. The FHLB has communicated that it believes the calculation of risk-based capital under the current rules of the FHFA significantly overstates the market risk of the FHLB’s private-label mortgage-backed securities in the current market environment and that it has enough capital to cover the risks reflected in its balance sheet. As a result, we have not recorded an other-than-temporary impairment on our investment in FHLB stock. However, continued deterioration in the FHLB’s financial position may result in impairment in the value of those securities. We will continue to monitor the financial condition of the FHLB as it relates to, among other things, the recoverability of our investment.
We utilize the Federal Home Loan Bank as an additional source of liquidity.
We are members of the Federal Home Loan Bank (FHLB) of Seattle, which is one of the twelve regional banks comprising the FHLB System. The FHLB provides credit for member financial institutions. As a member of the FHLB, Cascade Bank is authorized to apply for advances from the FHLB, which are collateralized in the aggregate by loans, securities, FHLB stock, and by deposits with the FHLB. At December 31, 2010, we had $159.0 million in FHLB advances and a $40.0 million letter of credit outstanding. FHLB advances are only available to borrowers that meet certain conditions. If we were to cease meeting these conditions, our access to FHLB advances could be significantly reduced or eliminated, or future financial problems at the FHLBs may impact the collateral necessary to secure borrowings and limit the borrowings extended to member banks, as well as require additional capital contributions by member banks. Should this occur, our short term liquidity needs could be negatively impacted. Should we be restricted from using FHLB advances due to weakness in the FHLB System or with the FHLB of Seattle, we may be forced to find alternative funding sources. These alternative funding sources may include seeking lines of credit with third party banks or the Federal Reserve Bank, borrowing under repurchase agreement lines, increasing deposit rates to attract additional funds, or selling certain investment securities categorized as available-for-sale in order to maintain adequate levels of liquidity.
Our investment portfolio includes securities that are sensitive to interest rates and variations in interest rates may adversely impact our profitability.
Our securities portfolio includes securities which are insured or guaranteed by U.S. government agencies or government-sponsored enterprises and other securities which are sensitive to interest rate fluctuations. The unrealized gains or losses in our available-for-sale portfolio are reported as a separate component of stockholders’ equity until realized upon sale. As a result, future interest rate fluctuations may impact stockholders’ equity, causing material fluctuations from quarter to quarter. Failure to hold our securities until maturity or until market conditions are favorable for a sale could adversely affect our financial condition, profitability and prospects.
The value of the securities in our investment securities portfolio may be negatively affected by continued disruptions in the securities markets. The market for some of the investment securities held in our portfolio has become extremely volatile over the past two years. Volatile market conditions or deteriorating financial performance of the issuer or obligor may detrimentally affect the value of these securities. There can be no assurance that the declines in market value associated with these disruptions will not result in other-than-temporary or permanent impairments of these assets, which would lead to accounting charges that could have a material adverse effect on our net income and capital levels.
Further increases in Federal Deposit Insurance Corporation (FDIC) insurance premiums or special assessments could adversely impact our earnings.
During the year ended December 31, 2010, the Bank paid $4.1 million in deposit insurance. Under the Federal Deposit Insurance Act, the FDIC, absent extraordinary circumstances, must establish and implement a plan to restore the deposit insurance reserve ratio to 1.15% of insured deposits, over a five-year period, at any time that the reserve ratio falls below 1.15%. The escalating pace of bank failures that began in 2008 has significantly increased the Deposit Insurance Fund’s loss provisions, resulting in a decline in the reserve ratio. The FDIC expects continued insured institution failures in the next few years, which likely will result in a continued decline in the reserve ratio.
22
On November 12, 2009, the FDIC adopted regulations that require insured depository institutions to prepay on December 30, 2009, their estimated assessments for the fourth calendar quarter of 2009, and for all of 2010, 2011 and 2012. We were required to make a payment of $7.3 million to the FDIC on December 31, 2009, and to record the payment as a prepaid expense, which will be amortized to expense over three years.
The FDIC indicated that with the proceeds of the prepayment, additional special assessments were not necessary in 2010; however, the prepayment requirement does not necessarily preclude the FDIC from imposing a special assessment, from changing assessment rates or from revising the risk-based assessment system, pursuant to the existing notice-and-comment rulemaking framework. Should the FDIC find it necessary to impose any further special assessments or further increase assessment rates, our FDIC general insurance premium expense will further increase compared to prior periods.
Concern of customers over the safety of their deposits may cause a decrease in deposits.
With recent increased concerns about bank failures, customers increasingly are concerned about the safety of their deposits and the extent to which their deposits are insured by the FDIC. Customers may not believe Cascade Bank is a safe place to keep their deposit accounts and they may remove their deposit accounts. Additionally, customers may withdraw deposits from Cascade Bank in an effort to ensure that the amount they have on deposit at Cascade Bank is fully insured. Decreases in deposits may adversely affect our funding costs, liquidity and net income.
Strong competition within our market areas may limit our growth and adversely affect our operating results.
The banking and financial services industry is highly competitive. We compete in our market areas with commercial banks, savings institutions, mortgage brokerage firms, credit unions, finance companies, mutual funds, insurance companies, and brokerage and investment banking firms operating locally and elsewhere. Some of these competitors have substantially greater resources and lending limits than we do, have greater name recognition and market presence that benefit them in attracting business and deposits, and offer certain services that we do not or cannot provide. In addition, larger competitors may be able to price loans and deposits more aggressively than we do. Our results of operations depend upon our continued ability to successfully compete in our market area. The greater resources and deposit and loan products offered by some of our competitors may limit our ability to increase or maintain our interest earning assets. In that regard, the adverse economic conditions that began in 2007 and that have continued into 2011 have significantly reduced our origination of new loans, and there is no assurance that our total loans or assets will increase or not decline in 2011.
Our controls and procedures may fail to detect certain events or be circumvented.
We are subject to certain operations risks, including but not limited to data processing system failures and errors and customer or employee fraud. Management regularly reviews and updates the Corporation’s internal controls, disclosure controls and procedures, and corporate governance policies and procedures. Any system of controls, however well designed and operated, is based in part on certain assumptions and can provide only reasonable, not absolute, assurances that the objectives of the system are met. Any failure or circumvention of the Corporation’s controls and procedures or failure to comply with regulations related to controls and procedures could have a material adverse effect on the Corporation’s financial condition and results of operations.
We may not succeed in keeping up with technological changes in our industry.
The financial services industry is continually undergoing rapid technological change with frequent introductions of new technology-driven products and services. The effective use of technology increases efficiency and enables financial institutions to better serve customers and to reduce costs. The future success of the Corporation and Cascade Bank depends, in part, upon our ability to address the needs of the Bank’s customers by using technology to provide products and services that will satisfy customer demands, as well as to create additional efficiencies in the operations of the Corporation and Cascade Bank. Many of our competitors have substantially greater resources to invest in technological improvements. We may not be able to effectively implement new technology-driven products and services or be successful in marketing these products and services to the Bank’s customers. Failure to successfully keep pace with technological change affecting the financial services industry could have a material adverse effect on our financial condition and results of operations.
23
The network and computer systems on which we depend could fail or experience a security breach.
Our computer systems could be vulnerable to unforeseen problems. Because we conduct part of our business over the Internet and outsource several critical functions to third parties, operations will depend on our ability, as well as the ability of third-party service providers, to protect computer systems and network infrastructure against damage from fire, power loss, telecommunications failure, physical break-ins or similar catastrophic events. Any damage or failure that causes interruptions in operations could have a material adverse effect on our business, financial condition and results of operations.
In addition, a significant barrier to online financial transactions is the secure transmission of confidential information over public networks. Our Internet banking system relies on encryption and authentication technology to provide the security and authentication necessary to effect secure transmission of confidential information. Advances in computer capabilities, new discoveries in the field of cryptography or other developments could result in a compromise or breach of the algorithms our third-party service providers use to protect customer transaction data. If any such compromise of security were to occur, it could have a material adverse effect on our business, financial condition and results of operations.
Our operations could be interrupted if our third-party service providers experience difficulty, terminate their services or fail to comply with banking regulations.
We depend, and will continue to depend, to a significant extent, on a number of relationships with third-party service providers. Specifically, we receive core systems processing, essential web hosting and other Internet systems and deposit and other processing services from third-party service providers. If these third-party service providers experience difficulties or terminate their services, and we are unable to replace them with other service providers, our operations could be interrupted. If an interruption were to continue for a significant period of time, our business, financial condition and results of operations could be materially adversely affected.
Risks Associated With Our Securities
The price of our common stock may be volatile or may decline further and the value of our other securities may decline as a result of adverse changes in our financial performance, the economy, market conditions and other factors.
The trading price of our common stock has declined significantly and may decline further. The trading price also may fluctuate widely because of a number of factors, many of which are outside of our control. In addition, the stock market is subject to fluctuations in the share prices and trading volumes that affect the market prices of the shares of many companies, especially financial institutions. These broad market fluctuations could adversely affect the market price of our common stock. Among the factors that could affect our stock price are:
|
·
|
our ability to raise capital to meet regulatory requirements and fund our business growth;
|
|
·
|
actual or anticipated quarterly fluctuations in our operating results and financial condition;
|
|
·
|
changes in revenue or earnings estimates or publication of research reports and recommendations by financial analysts;
|
|
·
|
failure to meet analysts’ revenue or earnings estimates;
|
|
·
|
speculation in the press or investment community;
|
|
·
|
strategic actions by us or our competitors, such as acquisitions or restructurings;
|
|
·
|
actions by institutional stockholders;
|
|
·
|
fluctuations in the stock price and operating results of our competitors;
|
|
·
|
general market conditions and, in particular, developments related to market conditions for the financial services industry;
|
|
·
|
proposed or adopted legislative or regulatory changes or developments;
|
|
·
|
anticipated or pending investigations, proceedings or litigation that involve or affect us; or
|
|
·
|
domestic and international economic factors unrelated to our performance.
|
The stock market and, in particular, the market for financial institution stocks, has experienced significant volatility in recent years. As a result, the market price of our common shares may be volatile. In addition, the trading volume in our common shares may fluctuate and cause significant price variations to occur. The trading price of the shares of our common stock and the value of our other securities will depend on many factors, which may change from time to time, including, without limitation, our financial condition, performance, creditworthiness and prospects, future sales of our
24
We do not meet the minimum bid price for continued listing on Nasdaq.
We do not meet the minimum bid price requirement for continued listing on the Nasdaq Capital Market as set forth in Nasdaq’s Marketplace Rule 5450(a)(1), as a result of the bid price of our common stock closing below the required minimum $1.00 per share for 30 consecutive business days. We have been granted an extension by the NASDAQ staff to August 1, 2011, to regain compliance with the minimum $1.00 bid price per share requirement. The extension was based on the Corporation meeting the continued listing requirement for market value of publicly held shares and all other applicable requirements for initial listing on the Capital Market with the exception of the bid price requirement, and the Corporation’s written notice of its intention to meet the $1.00 per share requirement by August 1, 2011, by effecting a reverse stock split if necessary.
We intend to actively monitor the bid price and minimum market value for our common stock between now and the compliance date, and intend, if necessary, to pursue available options to regain compliance with the Nasdaq requirements. If we are unable to regain compliance with Nasdaq requirements and are delisted, market liquidity for our common stock could be severely affected, and our stockholders’ ability to sell securities in the secondary market could be more limited. Delisting from Nasdaq could also negatively affect the value of our common stock. Delisting could also have other negative results, including, but not limited to, the potential loss of confidence by employees, the loss of institutional investor interest and fewer business development opportunities.
We have continuing losses and continuing volatility in quarterly results.
The Corporation reported a net loss of $70.3 million for the year ended December 31, 2010. Losses resulted primarily from the high level of non-performing assets and the related reduction in interest income and increased provision for loan losses. In addition, several other factors affecting the business can cause significant variations in the quarterly results of operations. In particular, variations in the volume of loan originations and sales, the differences between the cost of funds and the average interest rate on earning assets, and other-than-temporary impairment charges in the Corporation’s investment securities portfolio could have a material adverse effect on the results of operations and financial condition. We can provide no assurance that we will not have continuing losses in our operations.
Shareholders interests may be diluted by future equity offerings or transactions.
In the future, we may attempt to increase our capital resources or, we could be forced to raise additional capital by making additional offerings of common stock, debt or preferred equity securities, including medium-term notes, trust preferred securities, senior or subordinated notes and preferred stock. In the event of liquidation, holders of our debt securities and shares of preferred stock, including the $25.8 million of trust preferred securities and the $39.0 million of preferred shares held by the U.S. Treasury, and lenders with respect to other borrowings would receive distributions of our available assets prior to the holders of our common shares. In any equity financing, we believe our stockholders would experience substantial dilution and the securities issued could have rights, preferences and privileges that are senior to those of our current stockholders, depending on the terms of any shares we were to issue. Holders of our common shares are not entitled to preemptive rights or other protections against dilution. Any debt financing also could negatively affect future earnings due to interest charges.
Shareholders may not receive any dividends on Cascade Financial Corporation common shares.
In June of 2009, we announced that we had suspended payment of cash dividends on our common stock to preserve capital. Commencing with the interest payments due in November of 2009, we exercised our right to defer regularly scheduled interest payments on our $25.8 million of outstanding junior subordinated debentures related to trust preferred securities and dividends on our outstanding $39.0 million of preferred stock issued to the Treasury. We may not pay any cash dividends on our common stock until we are current on interest payments on our outstanding junior subordinated debentures and dividends on our preferred stock. We continue to accrue for these payments. In addition, cash dividends from the Bank are the primary source of funds for payment of cash dividends to our shareholders, and under the regulatory actions against us, the Bank is currently prohibited from paying cash dividends without the prior consent of the regulators.
25
Our ability to service our debt, pay dividends and otherwise pay our obligations as they come due is substantially dependent on capital distributions from Cascade Bank, and these distributions are subject to regulatory limits and other restrictions.
The Corporation is a separate and distinct legal entity from Cascade Bank. However, substantially all of our activities are conducted through Cascade Bank, and, consequently, as the parent company of the Bank, the principal source of funds from which we service debt and pay our obligations and dividends is the receipt of dividends from the Bank. There are legal limitations on the extent to which Cascade Bank may extend credit, pay dividends or otherwise supply funds to, or engage in transactions with, us. If Cascade Bank is unable to pay dividends to us for a prolonged period, we may not be able to service our debt or pay our obligations and, as a result, our business, financial condition, results of operations and prospects would be materially adversely effected.
Recent legislative and regulatory initiatives to address difficult market and economic conditions may not stabilize the U.S. banking system.
On October 3, 2008, President Bush signed into law the Emergency Economic Stabilization Act of 2008 (EESA) in response to the crisis in the financial sector. The U.S. Department of the Treasury and banking regulators have and continue to implement a number of programs under this legislation to address capital and liquidity issues in the banking system. On February 17, 2009, President Obama signed into law the American Recovery and Reinvestment Act (ARRA) which, among other things, amended the executive compensation provisions of EESA. On July 21, 2010, President Obama signed the Dodd-Frank Reform Act which, among other things, imposes additional restrictions on banking activities. There can be no assurance, however, that any of the legislations will ease the current market volatility and limited credit availability. The failure of this legislation to help stabilize the financial markets and a continuation or worsening of current financial market conditions could materially and adversely affect our business, financial condition, results of operations, access to credit or the value of our securities.
Compliance with the recently enacted financial reform legislation may increase our costs of operations and adversely impact financial results.
On July 21, 2010, President Obama signed the Dodd-Frank Wall Street Reform and Consumer Protection Act (Dodd-Frank Reform Act) into law. The Dodd-Frank Reform Act will change the current bank regulatory structure and affect the lending, deposit, investment, trading and operating activities of financial institutions and their holding companies. The Dodd-Frank Reform Act requires various federal agencies to adopt a broad range of new implementing rules and regulations, and to prepare numerous studies and reports for Congress. The federal agencies are given significant discretion in drafting the implementing rules and regulations, and consequently, many of the details and much of the impact of the Dodd-Frank Reform Act may not be known for many months or years. Significant changes will include:
|
·
|
the establishment of the Financial Stability Oversight Counsel, which will be responsible for identifying and monitoring systemic risks posed by financial firms, activities, and practices;
|
|
·
|
the establishment of a Bureau of Consumer Financial Protection, within the Federal Reserve, to serve as a dedicated consumer-protection regulatory body with broad powers to supervise and enforce consumer protection laws. The Consumer Financial Protection Bureau has broad rule-making authority for a wide range of consumer protection laws that apply to all banks and savings institutions, including the authority to prohibit “unfair, deceptive or abusive” acts and practices. The Consumer Financial Protection Bureau has examination and enforcement authority over all banks with more than $10 billion in assets. Banks with $10 billion or less in assets will continue to be examined for compliance with the consumer laws by their primary bank regulators;
|
|
·
|
amendments to the Truth in Lending Act aimed at improving consumer protections with respect to mortgage originations, including originator compensation, minimum repayment standards, and prepayment considerations;
|
|
·
|
elimination of federal prohibitions on paying interest on demand deposits, thus allowing businesses to have interest bearing checking accounts. Depending on competitive responses, this significant change to existing law could have an adverse impact on the Bank’s interest expense;
|
|
·
|
broadened base for FDIC insurance assessments, with assessments now based on the average consolidated total assets less tangible equity capital of a financial institution;
|
|
·
|
permanent increase to the maximum amount of deposit insurance for banks, savings institutions and credit unions to $250,000 per depositor, retroactive to January 1, 2009, and non-interest bearing transaction accounts have unlimited deposit insurance through December 31, 2013;
|
26
|
·
|
requirement that publicly traded companies provide stockholders a non-binding vote on executive compensation and so-called “golden parachute” payments, and authorization for the SEC to promulgate rules that would allow stockholders to nominate their own candidates using a company’s proxy materials. The legislation also directs the Federal Reserve to promulgate rules prohibiting excessive compensation paid to bank holding company executives, regardless of whether the company is publicly traded or not;
|
|
·
|
enhanced supervision of large bank holding companies (i.e., those with over $50 billion in total consolidated assets), with more stringent supervisory standards to be applied to them;
|
|
·
|
the creation of a special regime to allow for the orderly liquidation of systemically important financial companies, including the establishment of an orderly liquidation fund;
|
|
·
|
the development of regulations to address derivatives markets, including clearing and exchange trading requirements and a framework for regulating derivatives-market participants;
|
|
·
|
enhanced supervision of credit-rating agencies through the Office of Credit Ratings within the SEC; and
|
|
·
|
increased regulation of asset-backed securities, including a requirement that issuers of asset-backed securities retain at least 5% of the risk of the asset-backed securities.
|
Many provisions in the Dodd-Frank Reform Act are aimed at financial institutions that are significantly larger than us. Nonetheless, there are provisions that apply to us and we must begin to comply with them immediately. In addition, federal agencies will promulgate rules and regulations to implement and enforce provisions in the Dodd-Frank Reform Act. We will have to apply resources to ensure that we are in compliance with all applicable provisions, which may adversely impact financial results. The precise nature, extent and timing of many of these reforms and the impact on us is still uncertain.
The Corporation’s issuance of securities to the United States Treasury may limit our ability to return capital to stockholders and is dilutive to the holders of our common stock.
In connection with our sale of Series A Preferred Stock to the U.S. Treasury, the Corporation also issued to the Treasury a warrant to purchase approximately 863,442 shares of our common stock. The terms of the transaction with the Treasury limits our ability to pay dividends and repurchase our shares. Until November 21, 2011 or until the Treasury no longer holds any shares of the Series A Preferred Stock, the Corporation will not be able to increase dividends above levels in effect when the warrant was issued ($0.045 per share of common stock on a quarterly basis) nor repurchase any of our shares without Treasury approval, with limited exceptions, most significantly purchases in connection with benefit plans. In addition, we are not able to pay any dividends on our common stock unless we are current on our dividend payments on the Series A Preferred Stock. Moreover, we are prohibited from paying any dividends on our common stock due to the regulatory orders and agreements in place. These restrictions, as well as the dilutive impact of the warrant, may have a negative effect on the market price of our common stock.
Unless the Corporation is able to redeem the Series A Preferred Stock prior to February 15, 2014, the cost of this capital will increase substantially on that date, from 5.00% (approximately $1.95 million annually) to 9.00% (approximately $3.16 million annually). Depending on our financial condition at the time, this increase in dividends on the Series A Preferred Stock could have a negative effect on our liquidity.
Holders of our junior subordinated debentures have rights that are senior to those of our stockholders.
As of December 31, 2010, we had outstanding $25.8 million of junior subordinated debentures. Payments of the principal and interest on the trust preferred securities are conditionally guaranteed by us. The junior subordinated debentures associated with the trust preferred securities are senior to our common stock. As a result, we must make payments on the junior subordinated debentures before any dividends can be paid on our common stock and, in the event of our bankruptcy, dissolution or liquidation, the holders of the junior subordinated debentures must be satisfied before any distributions can be made to our common stockholders. We have the right to defer distributions on the junior subordinated debentures (and the related trust preferred securities) under specified circumstances, during which time no dividends may be paid on our common stock. Starting in the fourth quarter of 2009, Cascade Bank has been prohibited from making dividend payments to us, which in turn led us to defer the payment of interest on the junior subordinated debentures and stop payment of dividends on our common stock. There are no assurances about if or when payment of interest on our junior subordinated debentures, and payment of dividends on our common stock, will resume.
27
Changes in accounting standards may impact how we report our financial condition and results of operations.
Our accounting policies and methods are fundamental to how we record and report our financial condition and results of operations. From time to time, the Financial Accounting Standards Board changes the financial accounting and reporting standards that govern the preparation of financial statements. These changes can be difficult to predict and can materially impact how we record and report our financial condition and results of operations. In some cases, we could be required to apply a new or revised standard retroactively, resulting in a restatement of prior period financial statements.
ITEM 1B. UNRESOLVED STAFF COMMENTS
None
ITEM 2. PROPERTIES
The Corporation owns nine full-service branch locations and leases 13 full-service locations. Owned offices range in size from 1,300 to 52,000 square feet and have a total net book value at December 31, 2010, including leasehold improvements, furniture and fixtures, of $13.3 million. The Corporation leases approximately 40% of its Marysville office, and approximately 78% of its Issaquah office is leased or is available for lease. See Note 7 of the Notes to the Consolidated Financial Statements, which is listed in Item 15, for additional information on premises and equipment. The Corporation’s management believes that all facilities occupied by the Corporation are adequate for present requirements.
ITEM 3. LEGAL PROCEEDINGS
We are periodically a party to or otherwise involved in legal proceedings arising in the normal and ordinary course of business, such as claims to enforce liens, foreclose on loan defaults, and other issues incident to its business. As of December 31, 2010, Cascade Bank had commenced collection proceedings on approximately 11 real estate loans, and there may be additional lawsuits or claims arising out of or related to the impaired loans.
We are unable to predict the outcome of these matters. Our cash expenditures, including legal fees, associated with the pending litigation described above, and the regulatory proceedings described in Item 1 of this report under the caption “Regulation and Supervision,” cannot be reasonably predicted at this time. Litigation and any potential regulatory actions or proceedings can be time-consuming and expensive and could divert management time and attention from our business, which could have a material adverse affect on our business, results of operations and financial condition.
Other than the proceedings described or referenced above and the anticipated institution of additional lawsuits or claims arising out of or related to the impaired loans, including lender liability claims and counterclaims, management does not believe that there are any proceedings threatened or pending against us which, if determined adversely, would have a material effect on our business, results of operations, cash flows or financial position.
PART II
ITEM 5. MARKET FOR REGISTRANT’S COMMON EQUITY, RELATED STOCKHOLDER MATTERS AND ISSUER PURCHASES OF EQUITY SECURITIES
|
(a)
|
Cascade Financial Corporation’s common stock is traded on the Nasdaq Capital Market under the symbol CASB. The table below indicates the high/low trading range of the Corporation’s stock over the last eight quarters:
|
|
Quarter Ended
|
High
|
Low
|
||||||
|
March 31, 2009
|
$ | 5.13 | $ | 1.60 | ||||
|
June 30, 2009
|
4.35 | 2.15 | ||||||
|
September 30, 2009
|
2.30 | 1.60 | ||||||
|
December 31, 2009
|
2.75 | 1.54 | ||||||
|
March 31, 2010
|
$ | 3.20 | $ | 1.80 | ||||
|
June 30, 2010
|
3.20 | 0.45 | ||||||
|
September 30, 2010
|
0.70 | 0.26 | ||||||
|
December 31, 2010*
|
1.04 | 0.30 | ||||||
* The Corporation transferred the listing of its securities from the Nasdaq Global Market to the Nasdaq Capital Market on December 8, 2010.
28
|
(b)
|
On November 24, 2008, the Corporation issued 38,970 shares of Series A Fixed-Rate Cumulative Perpetual Preferred Stock to the U.S. Treasury under its Capital Purchase Program. These preferred shares provide for cumulative dividends at a rate of 5% per annum for the first five years, and 9% per annum thereafter. During 2009, we paid dividends on these preferred shares of $454,650, $487,125 and $487,125 in the first, second and third quarters. As a result of the regulatory actions against us, we began deferring dividends on our preferred shares in fourth quarter of 2009. Accrued dividends on these shares as of December 31, 2010, was $2.8 million. Under the terms of the preferred stock, deferral of dividend payment is permitted without triggering an event of default.
|
|
(c)
|
At December 31, 2010, there were 12,271,529 common shares outstanding, which were held by approximately 3,300 shareholders.
|
|
(d)
|
The Table below indicates the cash dividends paid on each share of its common stock for the periods noted:
|
|
Quarter Ended
|
Dividend Declared
|
Record Date
|
Payment Date
|
|||
|
December 2008
|
$ | 0.045 |
01/06/09
|
01/20/09
|
||
|
March 2009
|
0.010 |
04/15/09
|
04/29/09
|
|||
In June 2009, to preserve capital, the Corporation announced that it would temporarily suspend its regular quarterly cash dividend on common stock. For the foreseeable future, we do not intend to declare cash dividends. Additionally, the FDIC Order and the FRB Agreement prohibit the Corporation from paying dividends without the prior written approval of the regulators.
|
(e)
|
In May 2008, the Corporation announced a new stock repurchase plan to purchase up to 300,000 shares of the Corporation’s stock. The Stock Repurchase Plan expired on May 31, 2009. There were no stock repurchases in the fourth quarter of 2009 or for the year ended December 31, 2009. Given the restrictions of the U.S. Treasury’s Capital Purchase Program, which precludes share repurchases by participants, the program was not reauthorized.
|
|
(f)
|
As of December 31, 2010, options to purchase a total of 537,151 shares remain available for issuance under the option plans. The following table sets forth information regarding outstanding options and shares reserved for future issuance under the equity compensation plans as of December 31, 2010.
|
|
Plan Category
|
Number of Shares to be Issued Upon Exercise of Outstanding Options
(in thousands)
|
Weighted Average Exercise Price of Outstanding Options
|
Number of Shares Remaining Available for Future Issuance
(in thousands)
|
|||||||||
|
Equity compensation plans approved by shareholders – 1997 Plan
|
171 | $ | 4.97 | - | ||||||||
|
Equity compensation plans approved by shareholders – 2003 Plan
|
325 | 13.40 | 537 | |||||||||
|
Equity compensation plans not approved by shareholders
|
- | - | - | |||||||||
|
Total
|
496 | $ | 10.49 | 537 | ||||||||
29
Shareholder Return Performance Graph
The following graph compares the Corporation's cumulative shareholder return on its common stock with the return on the Nasdaq Bank Index, the S&P Banking Index and the KBW Bank Index. Total return assumes (i) the reinvestment of all dividends and (ii) the value of the investment in the Corporation's common stock and each index was $100 at the close of trading on December 31, 2005.
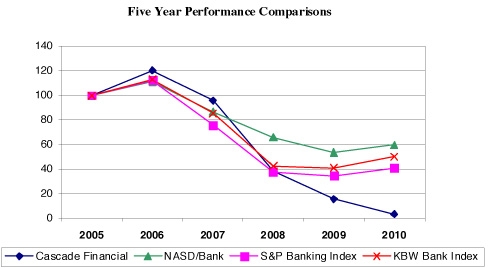
|
12/31/05
|
12/31/06
|
12/31/07
|
12/31/08
|
12/31/09
|
12/31/10
|
|||||||||||||||||||
|
Cascade Financial Corporation
|
100.00 | 120.21 | 95.77 | 38.31 | 15.56 | 3.24 | ||||||||||||||||||
|
Nasdaq Bank Index
|
100.00 | 111.01 | 86.51 | 65.81 | 53.63 | 60.01 | ||||||||||||||||||
|
S&P Banking Index
|
100.00 | 112.27 | 75.74 | 37.91 | 34.56 | 41.02 | ||||||||||||||||||
|
KBW Bank Index
|
100.00 | 113.17 | 85.32 | 42.68 | 41.13 | 50.28 | ||||||||||||||||||
ITEM 6. SELECTED FINANCIAL DATA
|
(Dollars in thousands, except share and per share amounts)
|
Years Ended December 31,
|
|||||||||||||||||||
|
Results of Operations
|
2010
|
2009
|
2008
|
2007
|
2006
|
|||||||||||||||
|
Interest income
|
$ | 71,395 | $ | 81,828 | $ | 92,571 | $ | 93,935 | $ | 82,658 | ||||||||||
|
Interest expense
|
34,956 | 38,540 | 46,686 | 50,540 | 43,268 | |||||||||||||||
|
Net interest income
|
36,439 | 43,288 | 45,885 | 43,395 | 39,390 | |||||||||||||||
|
Provision for loan losses
|
56,515 | 44,175 | 7,240 | 1,350 | 1,000 | |||||||||||||||
|
Other income
|
18,744 | 16,629 | 8,812 | 7,447 | 5,917 | |||||||||||||||
|
Other expense (excluding OTTI & goodwill impairment)
|
52,204 | 34,262 | 28,468 | 26,563 | 24,477 | |||||||||||||||
|
Other-than-temporary impairment (OTTI)
|
- | 858 | 17,338 | - | - | |||||||||||||||
|
Goodwill impairment charge
|
12,885 | 11,700 | - | - | - | |||||||||||||||
|
(Loss) income before provision (benefit) for income taxes
|
(66,421 | ) | (31,078 | ) | 1,651 | 22,929 | 19,830 | |||||||||||||
|
Net (loss) income
|
(70,286 | ) | (23,468 | ) | 2,090 | 15,546 | 13,355 | |||||||||||||
|
Dividends and accretion of issuance discount on preferred stock
|
2,476 | 2,365 | 251 | - | - | |||||||||||||||
|
Net (loss) income attributable to common stockholders
|
(72,762 | ) | (25,833 | ) | 1,839 | 15,546 | 13,355 | |||||||||||||
|
(Loss) earnings per common share, basic (1)
|
(5.95 | ) | (2.13 | ) | 0.15 | 1.29 | 1.11 | |||||||||||||
|
(Loss) earnings per common share, diluted (1)
|
(5.95 | ) | (2.13 | ) | 0.15 | 1.27 | 1.08 | |||||||||||||
|
Book value per common share (1)
|
1.71 | 8.02 | 10.23 | 10.15 | 9.53 | |||||||||||||||
30
ITEM 6. SELECTED FINANCIAL DATA (CONTINUED)
|
(Dollars in thousands, except share and per share amounts)
|
December 31,
|
|||||||||||||||||||
|
Financial Condition
|
2010
|
2009
|
2008
|
2007
|
2006
|
|||||||||||||||
|
Total assets
|
$ | 1,498,334 | $ | 1,704,628 | $ | 1,637,319 | $ | 1,417,588 | $ | 1,345,254 | ||||||||||
|
Cash and cash equivalents
|
131,335 | 145,595 | 53,466 | 14,530 | 42,879 | |||||||||||||||
|
Securities
|
300,438 | 275,902 | 256,192 | 232,018 | 239,422 | |||||||||||||||
|
Total loans
|
997,701 | 1,202,688 | 1,258,241 | 1,108,153 | 1,010,437 | |||||||||||||||
|
Loans, net
|
967,661 | 1,173,213 | 1,238,733 | 1,092,776 | 996,015 | |||||||||||||||
|
Deposits
|
1,107,554 | 1,139,774 | 1,006,782 | 904,896 | 855,449 | |||||||||||||||
|
FHLB advances
|
159,000 | 239,000 | 249,000 | 231,000 | 243,000 | |||||||||||||||
|
Other borrowings
|
161,965 | 184,216 | 212,365 | 147,512 | 121,485 | |||||||||||||||
|
Preferred stock
|
37,488 | 37,038 | 36,616 | - | - | |||||||||||||||
|
Total stockholders’ equity
|
58,452 | 134,450 | 160,122 | 122,096 | 115,199 | |||||||||||||||
|
December 31,
|
||||||||||||||||||||
|
Averages
|
2010 | 2009 | 2008 | 2007 | 2006 | |||||||||||||||
|
Average assets
|
$ | 1,645,980 | $ | 1,640,201 | $ | 1,534,458 | $ | 1,370,309 | $ | 1,275,526 | ||||||||||
|
Average earning assets
|
1,478,085 | 1,461,198 | 1,435,055 | 1,297,462 | 1,206,569 | |||||||||||||||
|
Average total loans
|
1,113,891 | 1,242,588 | 1,183,072 | 1,046,093 | 955,692 | |||||||||||||||
|
Average deposits
|
1,158,437 | 1,017,348 | 966,316 | 881,136 | 816,469 | |||||||||||||||
|
Average stockholders’ equity
|
94,099 | 143,534 | 129,083 | 117,534 | 109,103 | |||||||||||||||
|
Average common stockholder’s equity
|
56,852 | 106,716 | 125,400 | 117,534 | 109,103 | |||||||||||||||
|
Average tangible common stockholders’ equity
|
53,399 | 90,523 | 100,251 | 92,095 | 83,063 | |||||||||||||||
|
Years Ended December 31,
|
||||||||||||||||||||
|
Financial Ratios
|
2010 | 2009 | 2008 | 2007 | 2006 | |||||||||||||||
|
Return on average assets
|
(4.42 | )% | (1.57 | )% | 0.21 | % | 1.13 | % | 1.05 | % | ||||||||||
|
Return on average common stockholders’ equity
|
(127.98 | ) | (24.21 | ) | 1.47 | 13.23 | 12.24 | |||||||||||||
|
Return on average tangible common stockholders’ equity (2)
|
(112.13 | ) | (15.61 | ) | 1.83 | 16.88 | 16.08 | |||||||||||||
|
Net interest margin
|
2.47 | 2.96 | 3.20 | 3.34 | 3.26 | |||||||||||||||
|
Efficiency ratio
|
117.95 | 78.14 | 83.74 | 52.25 | 54.02 | |||||||||||||||
|
Efficiency ratio (excluding OTTI & goodwill impairment) (2)
|
94.60 | 57.18 | 52.05 | 52.25 | 54.02 | |||||||||||||||
|
Dividend payout ratio
|
- | - | 175.19 | 25.98 | 28.43 | |||||||||||||||
|
Average common stockholders’ equity to average assets
|
3.45 | 6.51 | 8.17 | 8.58 | 8.55 | |||||||||||||||
|
Total risk-based capital to risk-weighted assets
|
9.98 | 12.82 | 13.26 | 10.80 | 11.22 | |||||||||||||||
|
Tier 1 capital to average total assets
|
5.55 | 8.62 | 10.30 | 8.90 | 8.99 | |||||||||||||||
|
December 31,
|
||||||||||||||||||||
|
Asset Quality
|
2010 | 2009 | 2008 | 2007 | 2006 | |||||||||||||||
|
Nonperforming (nonaccruing) loans
|
$ | 48,098 | $ | 106,096 | $ | 40,278 | $ | 1,523 | $ | 851 | ||||||||||
|
Real estate owned (REO)
|
34,412 | 18,842 | 1,446 | - | - | |||||||||||||||
|
Nonperforming assets
|
82,510 | 124,938 | 41,724 | 1,523 | 851 | |||||||||||||||
|
Allowance for loan losses
|
26,106 | 25,900 | 16,439 | 11,653 | 10,988 | |||||||||||||||
|
Nonperforming loans to total loans
|
4.82 | % | 8.82 | % | 3.20 | % | 0.14 | % | 0.08 | % | ||||||||||
|
Nonperforming assets to total assets
|
5.51 | 7.33 | 2.55 | 0.11 | 0.06 | |||||||||||||||
|
Allowance for loan losses to total loans
|
2.62 | 2.15 | 1.31 | 1.05 | 1.09 | |||||||||||||||
|
(1)
|
Per common share data is retroactively adjusted to reflect all stock splits and stock dividends.
|
|
(2)
|
These financial statements contain certain non-GAAP financial measures in addition to results presented in accordance with Generally Accepted Accounting Principles (GAAP). These measures include average tangible common equity, and efficiency ratio (excluding OTTI and goodwill impairment charges). These measures should not be construed as a substitute for GAAP measures; they should be read and used in conjunction with the Corporation’s GAAP financial information. A reconciliation of the included non-GAAP financial measures to GAAP measures is included in these financial statements.
|
31
The following table presents selected unaudited quarterly financial data for 2010, 2009 and 2008:
|
Quarter Ended
|
|||||||||||||||||
|
(Dollars in thousands, except share and per share amounts)
|
Mar 31,
2010
|
Jun 30,
2010
|
Sept 30,
2010
|
Dec 31,
2010
|
|||||||||||||
|
Interest income
|
$ | 19,131 | $ | 18,627 | $ | 17,394 | $ | 16,242 | |||||||||
|
Interest expense
|
9,444 | 9,162 | 8,867 | 7,482 | |||||||||||||
|
Net interest income
|
9,687 | 9,465 | 8,527 | 8,760 | |||||||||||||
|
Provision for loan losses
|
31,290 | 11,725 | 8,000 | 5,500 | |||||||||||||
|
Other income
|
1,912 | 3,838 | 5,199 | 7,795 | |||||||||||||
|
Other expense
|
9,237 | 12,865 | 11,698 | 18,404 | |||||||||||||
|
Goodwill impairment
|
- | 12,885 | - | - | |||||||||||||
|
Loss before provision for income taxes
|
(28,928 | ) | (24,172 | ) | (5,972 | ) | (7,349 | ) | |||||||||
|
Provision for income taxes
|
3,211 | - | - | 654 | |||||||||||||
|
Net loss
|
$ | (32,139 | ) | $ | (24,172 | ) | $ | (5,972 | ) | $ | (8,003 | ) | |||||
|
Dividends and accretion of issuance discount on preferred stock
|
611 | 615 | 620 | 629 | |||||||||||||
|
Loss attributable to common stockholders
|
$ | (32,750 | ) | $ | (24,787 | ) | $ | (6,592 | ) | $ | (8,632 | ) | |||||
|
Loss per common share, basic
|
$ | (2.69 | ) | $ | (2.02 | ) | $ | (0.54 | ) | $ | (0.70 | ) | |||||
|
Loss per common share, diluted
|
(2.69 | ) | (2.02 | ) | (0.54 | ) | (0.70 | ) | |||||||||
|
Quarter Ended
|
|||||||||||||||||
|
Mar 31,
2009
|
Jun 30,
2009
|
Sept 30,
2009
|
Dec 31,
2009
|
||||||||||||||
|
Interest income
|
$ | 21,410 | $ | 20,215 | $ | 20,189 | $ | 20,014 | |||||||||
|
Interest expense
|
10,291 | 9,392 | 9,271 | 9,586 | |||||||||||||
|
Net interest income
|
11,119 | 10,823 | 10,918 | 10,428 | |||||||||||||
|
Provision for loan losses
|
13,875 | 18,300 | 4,000 | 8,000 | |||||||||||||
|
Other income
|
3,648 | 2,203 | 3,150 | 7,628 | |||||||||||||
|
Other expense
|
7,753 | 9,978 | 7,928 | 8,603 | |||||||||||||
|
OTTI
|
858 | - | - | - | |||||||||||||
|
Goodwill impairment
|
- | 11,700 | - | - | |||||||||||||
|
(Loss) income before provision for income taxes
|
(7,719 | ) | (26,952 | ) | 2,140 | 1,453 | |||||||||||
|
(Benefit) provision for income taxes
|
(2,902 | ) | (5,552 | ) | 507 | 338 | |||||||||||
|
Net (loss) income
|
$ | (4,817 | ) | $ | (21,400 | ) | $ | 1,633 | $ | 1,115 | |||||||
|
Dividends and accretion of issuance discount on preferred stock
|
587 | 592 | 592 | 594 | |||||||||||||
|
(Loss) income attributable to common stockholders
|
$ | (5,404 | ) | $ | (21,992 | ) | $ | 1,041 | $ | 521 | |||||||
|
(Loss) earnings per common share, basic
|
$ | (0.45 | ) | $ | (1.82 | ) | $ | 0.09 | $ | 0.04 | |||||||
|
(Loss) earnings per common share, diluted
|
(0.45 | ) | (1.82 | ) | 0.09 | 0.04 | |||||||||||
|
Quarter Ended
|
||||||||||||||||
|
Mar 31,
2008
|
Jun 30,
2008
|
Sept 30,
2008
|
Dec 31,
2008
|
|||||||||||||
|
Interest income
|
$ | 23,014 | $ | 22,793 | $ | 24,345 | $ | 22,419 | ||||||||
|
Interest expense
|
12,539 | 11,348 | 11,508 | 11,291 | ||||||||||||
|
Net interest income
|
10,475 | 11,445 | 12,837 | 11,128 | ||||||||||||
|
Provision for loan losses
|
2,390 | 1,200 | 1,250 | 2,400 | ||||||||||||
|
Other income
|
2,436 | 2,199 | 2,305 | 1,872 | ||||||||||||
|
Other expense
|
6,917 | 7,233 | 7,144 | 7,175 | ||||||||||||
|
OTTI
|
- | - | 17,338 | - | ||||||||||||
|
Income (loss) before provision for income taxes
|
3,604 | 5,211 | (10,590 | ) | 3,425 | |||||||||||
|
Provision (benefit) for income taxes
|
990 | 1,577 | (3,971 | ) | 964 | |||||||||||
|
Net income (loss)
|
$ | 2,614 | $ | 3,634 | $ | (6,619 | ) | $ | 2,461 | |||||||
|
Dividends and accretion of issuance discount on preferred stock
|
- | - | - | 251 | ||||||||||||
|
Income (loss) attributable to common stockholders
|
$ | 2,614 | $ | 3,634 | $ | (6,619 | ) | $ | 2,210 | |||||||
|
Earnings (loss) per common share, basic
|
$ | 0.22 | $ | 0.30 | $ | (0.55 | ) | $ | 0.18 | |||||||
|
Earnings (loss) per common share, diluted
|
0.21 | 0.30 | (0.55 | ) | 0.18 | |||||||||||
32
The following discussion is provided for the consolidated operations of Cascade Financial Corporation (CFC or the Corporation) as of December 31, 2010 and 2009, and for the three years ending December 31, 2010, 2009 and 2008. The consolidated financial statements include the accounts of the Corporation and its wholly-owned subsidiaries: Cascade Bank (Cascade Bank or the Bank), and Cascade Capital Trusts I, II, and III, formed in 2000, 2004, and 2006, respectively, for the exclusive purpose of issuing trust preferred securities and using the proceeds from the issuance to acquire junior subordinated debentures issued by the Corporation. The Corporation used the proceeds from the issuance to fund future asset growth. The Trusts are not consolidated by Cascade Financial Corporation. Colby R.E., LLC, a subsidiary under the Bank, was incorporated in March 2009 and 2011 Yale Avenue East, LLC, a subsidiary of Colby R.E., LLC, was incorporated in May 2010. Both were formed to acquire, manage and sell foreclosed properties.
The purpose of this discussion is to focus on significant factors concerning the Corporation’s financial condition and results of operations, and to provide a more comprehensive review of the Corporation’s operating results and financial condition than can be obtained from reading the consolidated financial statements alone. This discussion should be read with the consolidated financial statements and the notes thereto.
Cascade Financial Corporation, a Washington corporation, is a bank holding company owning all of the equity of its wholly owned subsidiary, Cascade Bank.
Recent Events
Regulatory Actions and Capital Raising Efforts
On July 20, 2010, the Board of Directors of the Bank stipulated to the entry of a Consent Order with the Federal Deposit Insurance Corporation (FDIC) and the Washington State Department of Financial Institutions (DFI), effective July 21, 2010 (FDIC Order). The FDIC identified deficiencies in the management and supervision of Cascade Bank that primarily relate to loan underwriting, procedures and monitoring, excessive concentrations in construction and land development loans, and related concerns about Cascade Bank’s capital and liquidity.
On November 4, 2010, the Corporation entered into a Written Agreement (FRB Agreement) with the Federal Reserve Bank of San Francisco (FRB).
See Item 1 of this report captioned “Regulation and Supervision” for further discussion.
As of December 31, 2010, Cascade Bank required approximately $68.0 million in new capital to meet the minimum Tier 1 leverage ratio requirement of 10% under the FDIC Order. Since late 2009, CFC’s Board of Directors and management team have been reviewing alternatives to improve the bank’s capital position with the assistance of its financial advisor, Sandler O’Neill + Partners LP, a nationally recognized investment banking firm and expert in the banking industry. As part of its review, the Board considered a range of alternatives including potential capital infusions from private investors and financial institutions, strategic combinations and private equity transactions, and actively solicited offers from potential investors and acquirers.
Proposed Merger
On March 4, 2011, the Corporation announced that it had entered into an agreement and plan of reorganization with Opus Bank (Opus), a California state-chartered bank. The terms of this agreement provide for Opus Bank to acquire the Corporation and the Bank, and for the merger of the Bank into Opus Bank. The merger agreement with Opus Bank was unanimously approved by the Boards of Directors of the Corporation, the Bank and Opus Bank
Under the terms of the merger agreement, the Corporation’s common stockholders will receive an amount in cash equal to $0.45 per share, which values the transaction at approximately $5.5 million. In addition, Opus Bank has offered to purchase the $39.0 million of the Corporation’s preferred stock and the associated warrant issued to the U.S. Department of the Treasury (the Treasury) under the Capital Purchase Program for $16.25 million in cash. The Treasury has indicated its willingness to agree to sell the Corporation’s preferred stock and warrant for such cash consideration subject to the entry into definitive documentation acceptable to the Treasury in its sole discretion. Opus also agreed to assume our $25.8 million of obligations with respect to trust preferred securities issued by Cascade Financial Corporation’s trust subsidiaries.
33
Financial Overview
For the year ended December 31, 2010, we had a net loss attributable to common stockholders of $72.8 million, or $5.95 per diluted common share, compared to a net loss attributable to common stockholders of $25.8 million, or $2.13 per diluted common share for the year ended December 31, 2009, and net income attributable to common stockholders of $1.8 million, or $0.15 per diluted common share for the year ended December 31, 2008.
The results for 2010 reflect continued pressure from an uncertain economy and the negative impact of the regional housing market. The impact of the economic downturn resulted in:
|
·
|
Allowance for loan losses of $26.1 million, or 2.62%, of total loans outstanding at December 31, 2010, compared to $25.9 million, or 2.15%, at December 31, 2009, and $16.4 million, or 1.31%, at December 31, 2008.
|
|
·
|
Net charge-offs of $56.3 million for 2010, compared to $34.7 million and $2.5 million for 2009 and 2008, respectively.
|
|
·
|
Nonperforming assets totaling $82.5 million, or 5.51% of total assets at December 31, 2010, compared to $124.9 million, or 7.33% of total assets at December 31, 2009.
|
Despite these challenging times, the Board of Directors and management continue to take important steps to strengthen the Corporation. During the year, we:
|
·
|
Reduced our level of nonperforming assets, by $20.8 million, or 20.0%.
|
|
·
|
Reduced our concentrations in real estate construction and land development loans by $175.1 million, or 68.2%.
|
|
·
|
Continued to closely monitor and manage our liquidity position and at December 31, 2010, on-balance sheet total liquidity, as a percentage of assets was 12.6%.
|
Net interest income in 2010 was $36.4 million, compared to $43.3 million in 2009. Other income was $18.7 million for the year compared to $16.6 million in 2009. For the year, total other expenses (excluding the second quarter 2010 goodwill impairment charge) increased to $52.2 million compared to $35.1 million (excluding the second quarter 2009 goodwill impairment charge) in 2009. The increase was largely due to a $9.9 million increase in write-downs/losses on sales of REO, $4.8 million in FHLB prepayment penalties associated with balance sheet restructuring transactions in the fourth quarter of 2010, a $1.4 million increase in FDIC insurance premiums and a $1.3 million increase in business insurance premiums. The second quarter 2010 and 2009 goodwill impairment charges were $12.9 million and $11.7 million, respectively.
|
Outlook for 2011
|
We face a variety of significant financial and operating challenges in 2011. These include taking all necessary actions to comply with the regulatory orders we are operating under, specifically raising capital, improving credit quality, and returning to profitability. We continue to take an aggressive stance in addressing credit issues in our loan portfolio to minimize future risks. Since 2008 we have had a Special Assets team in place to focus on managing and reducing nonperforming loans and REO properties. While we have seen progress in reducing the level of nonperforming assets, credit quality will remain an issue as long as current economic trends, including high unemployment rates and depressed real estate prices, continue.
We expect our loan portfolio balance to level off during the first quarter of 2011. However, we must still face the challenges of the current economic environment and flat loan demand, which will make it difficult for us to maintain our current loan portfolio balance as our existing credits pay down. Currently, we expect that interest rates will remain flat for the remainder of 2011. We based our 2011 projections, budgets and goals on these expectations. If these trends move differently than expected in either direction or speed, they could have a material impact on our financial condition and results of operations. The areas of our operations most directly impacted would be the net interest margin, loan and deposit growth and the provision for loan losses.
34
We will also continue our efforts to control noninterest expenses by working to achieve maximum efficiencies within our franchise. However, our noninterest expenses for 2011 will continue to be negatively affected by costs associated with higher business insurance expense, REO expense associated with the management and disposition of real estate properties acquired through foreclosure and increased FDIC insurance premiums.
The information contained in this section should be read in conjunction with the Consolidated Financial Statements and accompanying Notes to the Consolidated Financial Statements in Item 15 of this report.
Critical Accounting Policies and Estimates
The Corporation’s significant accounting policies and estimates are essential to understanding Management's Discussion and Analysis of Financial Condition and Results of Operations. The preparation of financial statements in conformity with accounting principles generally accepted in the United States of America requires management to make estimates and assumptions, which affect the reported amounts and disclosures. Changes in these estimates and assumptions are considered reasonably possible and may have a material impact on the consolidated financial statements and thus actual results could differ from the amounts reported and disclosed herein. The following policies involve a higher degree of judgment than do our other significant accounting policies detailed in Note 1 of the Notes to Consolidated Financial Statements listed in Item 15.
Material estimates particularly susceptible to significant change relate to the assessment of impaired assets, the determination of the allowance for loan losses, deferred income taxes, fair value measurements and valuation of real estate acquired in connection with foreclosures or in satisfaction of loans. In connection with the determination of the allowance for loan losses and the valuation of foreclosed assets held for sale, management obtains independent appraisals for significant properties.
Investment Securities
Debt and equity securities, including mortgage-backed securities (MBS), may be classified as available-for-sale or held-to-maturity. Securities available-for-sale are carried at fair value, with unrealized gains and losses reported as a component of other comprehensive (loss) income. Investment securities held-to-maturity are carried at amortized cost or principal balance, adjusted for amortization of premiums and accretion of discounts. Amortization of premiums and accretion of discounts are calculated using a method that approximates the level yield method. The Bank has the ability, and it is management’s positive intention, to hold held-to-maturity securities until maturity. Investments with fair values that are less than the amortized cost are considered impaired. Impairment may result from either a decline in the financial condition of the issuing entity or, in the case of fixed interest rate investments, from rising interest rates. Management reviews investment securities on an ongoing basis for the presence of other-than-temporary-impairment (OTTI) or permanent impairment, taking into consideration current market conditions; fair value in relationship to cost; extent and nature of the change in fair value; issuer rating changes and trends; whether management intends to sell a security or if it is likely that the Bank will be required to sell the security before recovery of the amortized cost basis of the investment, which may be upon maturity; and other factors. For debt securities, if management intends to sell the security or it is likely that the Bank will be required to sell the security before recovering its cost basis, the entire impairment loss would be recognized in earnings as an OTTI. If management does not intend to sell the security and it is not likely that the Bank will be required to sell the security, but management does not expect to recover the entire amortized cost basis of the security, only the portion of the impairment loss representing credit losses would be recognized in earnings. The credit loss on a security is measured as the difference between the amortized cost basis and the present value of the cash flows expected to be collected. Projected cash flows are discounted by the original or current effective interest rate depending on the nature of the security being measured for potential OTTI. The remaining impairment related to all other factors (i.e. the difference between the present value of the cash flows expected to be collected and fair value) is recognized as a charge to other comprehensive income. Impairment losses related to all other factors are presented as separate categories within other comprehensive income. Gains and losses on the sale of securities are recorded on the trade date and are determined using the specific identification method.
Allowance for Loan Losses
The allowance for loan losses is the amount which, in the opinion of management, is necessary to absorb future probable loan losses. Management’s determination of the level of the provision for loan losses is based on various judgments and assumptions, including general economic conditions, loan portfolio composition, prior loan loss experience, the evaluation of credit risk related to specific credits and market segments and monitoring results from our ongoing internal credit review staff. Subsequent recoveries, if any, are credited to the allowance.
35
Management determines the amount of the allowance for loan losses by utilizing a loan quality grading system to determine risk in the loan portfolio. The allowance consists of general and specific components. When loans are originated, they are assigned a risk rating that is reassessed periodically during the term of the loan through the Bank’s credit review process. The Bank’s loan quality grading methodology assigns a loan quality grade from 1 to 10, where a higher numerical rating represents higher risk. These loan quality-rating categories are a primary factor in determining an appropriate amount for the allowance for loan losses. The loan portfolio is separated by loan type and then by risk rating. Loans not considered impaired are evaluated as a group, by loan type, with a loss rate based on average historical losses and adjusted for qualitative (Q) factors. The Q factors include regional/local economic trends, the health of the real estate market, loan and collateral concentrations, size of borrowing relationships, trends in loan delinquencies and charge-offs and changes in loan classifications and are included in the Bank’s analysis of the allowance for loan losses. Allocations for Q factors are based upon management’s review of each of the factors and are applied to all loans included in the general valuation component of the allowance. The Q factors augment the historical loss factors utilized in assessing the allowance to reflect the potential losses embedded in the loan portfolio as real estate property values have declined and sales have slowed. After reviewing all historical and qualitative factors by loan type, management may add a management judgment factor to certain loan types if there are additional concerns in these portfolios that were not identified by using historical or other qualitative factors. Management may also include a negative adjustment to the allowance factor for certain loan types if analysis shows that the historical allowance factor overstates the allocated reserve due to the financial strength of the borrowers/guarantors, the collateral position or other factors in the related portfolio.
Management believes that the allowance for loan losses was adequate as of December 31, 2010. There is, however, no assurance that future loan losses will not exceed the levels provided for in the allowance for loan losses and could possibly result in additional charges to the provision for loan losses. See Item 1A. Risk Factors, of this report for further discussion.
Real Estate Owned (REO)
Real estate owned includes real estate acquired in settlement of loans. Real estate owned is recorded at the lower of carrying amount or fair value, based upon an appraisal, less estimated costs to sell. Developments and improvements related to the property are capitalized. Any losses recorded at the time a foreclosure occurs are classified as a charge-off against the allowance for loan losses. Losses that result from the ongoing periodic valuation of these properties, are charged to expense in the period identified. Revenue and expenses from operations and subsequent adjustments to the carrying amount of the property are included in noninterest expense in the statement of operations.
Income Taxes
The Corporation accounts for income taxes as required by FASB ASC Topic 740, Accounting for Income Taxes, under the liability method, which requires recognition of deferred tax assets and liabilities for the expected future income tax consequences of transactions that have been included in the Consolidated Financial Statements. Under this method, deferred tax assets and liabilities are determined based on the difference between the financial statement and tax basis of assets and liabilities using enacted tax rates in effect for the year in which the differences are expected to reverse. A valuation allowance is required on deferred tax assets if it is “more likely than not” that the deferred tax asset will not be realized. Deferred tax assets and liabilities are recognized for the future tax consequences attributable to temporary differences between the financial statement carrying amounts of existing assets and liabilities and their respective tax basis. Deferred tax assets and liabilities are measured using enacted tax rates expected to apply to taxable income in the years in which those temporary differences are expected to be recovered or settled. The effect on deferred tax assets and liabilities of a change in tax rates is recognized in income in the period that includes the enactment date. These calculations are based on many complex factors including estimates of the timing of reversals of temporary differences, the interpretation of federal income tax laws, and a determination of the differences between the tax and the financial reporting basis of assets and liabilities. Actual results could differ significantly from the estimates and interpretations used in determining the current and deferred income tax liabilities.
36
Fair Value Measurements
Fair value is defined as the price that would be received to sell an asset or paid to transfer a liability in an orderly transaction between market participants on the measurement date. ASU 2010-06, Fair Value Measurements and Disclosures (Topic 820) – Improving Disclosures about Fair Value Measurements (ASU 10-06) establishes a consistent framework for measuring fair value and expands disclosure requirements about fair value measurements. In determining fair value, the Bank maximizes the use of observable inputs and minimizes the use of unobservable inputs. Observable inputs reflect market data obtained from independent sources, while unobservable inputs reflect the Bank’s estimates for market assumptions.
Valuation inputs refer to the assumptions market participants would use in pricing a given asset or liability using one of the three valuation techniques. Inputs can be observable or unobservable. Observable inputs are those assumptions that market participants would use in pricing the particular asset or liability. These inputs are based on market data and are obtained from a source independent of the Bank. Unobservable inputs are assumptions based on the Bank’s own information or estimate of assumptions used by market participants in pricing the asset or liability. Unobservable inputs are based on the best and most current information available on the measurement date.
All inputs, whether observable or unobservable, are ranked in accordance with a prescribed fair value hierarchy that gives the highest ranking to quoted prices (unadjusted) in active markets for identical assets or liabilities (Level 1) and the lowest ranking to unobservable inputs (Level 3). Fair values for assets or liabilities classified as Level 2 are based on one or a combination of the following factors: (i) quoted prices for similar assets; (ii) observable inputs for the asset or liability, such as interest rates or yield curves; or (iii) inputs derived principally from, or corroborated by, observable market data.
Goodwill Impairment
Net assets of companies acquired in purchase transactions are recorded at fair value at the date of acquisition. Identifiable intangibles are amortized on an accelerated basis over the period benefited and also considered for impairment. Goodwill is not amortized but is reviewed for potential impairment. Impairment analysis of the fair value of goodwill involves a substantial amount of judgment. During the second quarter of 2010, the Corporation analyzed its goodwill to determine whether, and to what extent, its goodwill asset was impaired. The goodwill impairment test includes two steps. Step 1, used to identify potential impairment, compares the estimated fair value of the Corporation with its carrying amount including goodwill. Step 1 inputs used to determine the implied fair value of the Corporation include the quoted market price of the Corporation’s common stock, market prices of common stocks of other banking organizations, common stock trading multiples, and inputs from comparable transactions. In the Step 1 analysis, the carrying amount exceeded its estimated fair value and the second step of the goodwill impairment test was performed to measure the amount of impairment loss, if any. Step 2 of the goodwill impairment test compared the implied estimated fair value of goodwill with the carrying amount of the currently recorded goodwill. The Step 2 analysis indicated that the implied fair value of the goodwill was less than the carrying value of goodwill. As a result of the analysis, the Corporation wrote-off the remaining balance of its goodwill at June 30, 2010.
Financial Condition
Assets
The Corporation’s total assets at December 31, 2010, were $1.5 billion, compared to $1.7 billion at December 31, 2009, a decrease of 12.1%. This decrease was primarily due to a decline in the loan portfolio. The Corporation’s total assets at December 31, 2008, were $1.6 billion.
Investment Securities
Total securities, including FHLB stock, increased by $24.5 million to $300.4 million as of December 31, 2010. Securities designated as available-for-sale increased to $234.6 million at December 31, 2010, versus $227.8 million at December 31, 2009. Securities designated as held-to-maturity increased to $53.9 million at December 31, 2010, from $36.2 million a year earlier. The securities in both portfolios consist of notes issued by Government Sponsored Enterprises (i.e. Federal Home Loan Bank (FHLB), Fannie Mae (FNMA), Freddie Mac (FHLMC) or mortgage-backed securities issued by FNMA,
37
The following table presents the amortized cost and fair value of available-for-sale and held-to-maturity securities at the dates indicated:
|
December 31, 2010
|
December 31, 2009
|
December 31, 2008
|
||||||||||||||||||||||
|
(Dollars in thousands)
|
Amortized
Cost
|
Fair
Value
|
Amortized
Cost
|
Fair
Value
|
Amortized
Cost
|
Fair
Value
|
||||||||||||||||||
|
Securities available-for-sale
|
||||||||||||||||||||||||
|
Mortgage-backed securities
|
$ | 70,270 | $ | 67,203 | $ | 40,997 | $ | 41,280 | $ | 42,250 | $ | 41,852 | ||||||||||||
|
Agency notes & bonds
|
116,632 | 111,119 | 188,585 | 186,525 | 81,149 | 81,372 | ||||||||||||||||||
|
US Treasury notes
|
56,346 | 56,284 | - | - | - | - | ||||||||||||||||||
|
Corporate/other
|
- | - | - | - | 1,294 | 454 | ||||||||||||||||||
|
Total
|
$ | 243,248 | $ | 234,606 | $ | 229,582 | $ | 227,805 | $ | 124,693 | $ | 123,678 | ||||||||||||
|
December 31, 2010
|
December 31, 2009
|
December 31, 2008
|
||||||||||||||||||||||
|
(Dollars in thousands)
|
Amortized
Cost
|
Fair
Value
|
Amortized
Cost
|
Fair
Value
|
Amortized
Cost
|
Fair
Value
|
||||||||||||||||||
|
Securities held-to-maturity
|
||||||||||||||||||||||||
|
Mortgage-backed securities
|
$ | 25,137 | $ | 25,509 | $ | 15,405 | $ | 15,909 | $ | 20,484 | $ | 20,545 | ||||||||||||
|
Agency notes & bonds
|
28,000 | 26,784 | 19,997 | 19,810 | 99,335 | 99,381 | ||||||||||||||||||
|
Corporate/other
|
775 | 775 | 775 | 775 | 775 | 775 | ||||||||||||||||||
|
Total
|
$ | 53,912 | $ | 53,068 | $ | 36,177 | $ | 36,494 | $ | 120,594 | $ | 120,701 | ||||||||||||
Certain securities at December 31, 2010 shown above currently have fair values less than amortized cost, and therefore, contain unrealized losses. Available-for-sale securities had unrealized losses of $8.7 million and held-to-maturity securities had unrealized losses of $1.6 million. In the opinion of management, these securities are considered only temporarily impaired due to changes in market interest rates and/or the widening of market spreads subsequent to the initial purchase of the securities or to disruptions to credit markets. Since all these securities are rated AAA, this temporary impairment is not due to concerns regarding the underlying credit of the issuers or the underlying collateral.
Federal Home Loan Bank Stock. The Bank’s investment in Federal Home Loan Bank (FHLB) of Seattle stock is carried at par value ($100 per share) and does not have a readily determinable fair value. Ownership of FHLB stock is restricted to FHLB member institutions and can only be purchased and redeemed at par. As a member of the FHLB system, the Bank is required to maintain a minimum level of investment in FHLB stock, based on specified percentages of its outstanding FHLB advances. The Bank may request redemption at par value of any stock in excess of the amount the Bank is required to hold. Stock redemptions are at the discretion of the FHLB. At December 31, 2010, the Bank had 119,203 shares of FHLB stock.
The Bank evaluates FHLB stock for impairment. The determination of whether FHLB stock is impaired is based on an assessment of the ultimate recoverability of cost rather than declines in the book value of the shares. The determination of whether a decline affects the ultimate recoverability of cost is influenced by criteria such as: (1) the significance of any decline in net assets of the FHLB as compared to the capital stock amount for the FHLB and the length of time this situation has persisted, (2) commitments by the FHLB to make payments required by law or regulation and the level of such payments in relation to the operating performance of the FHLB, (3) the impact of legislative and regulatory changes on institutions and, accordingly, the customer base of the FHLB and (4) the liquidity position of the FHLB.
Based upon an analysis by Standard and Poors regarding the Federal Home Loan Banks, they stated that the FHLB System has a special public status (organized under the Federal Home Loan Bank Act of 1932) and because of the extraordinary support offered to it by the U.S. Treasury in a crisis, (though not used), the FHLB System can be considered an extension of the government. The U.S. government would almost certainly support the credit obligations of the FHLB System. The Bank has determined there is no impairment of the FHLB stock investment as of December 31, 2010.
38
In October 2010, the FHLB of Seattle entered into a Stipulation and Consent to the Issuance of a Consent Order with the Federal Housing Finance Agency (FHFA). The Stipulation and Consent provides that the FHLB agrees to a Consent Order issued by the FHFA, which requires the FHLB to take certain specified actions related to its business and operations (the Stipulation and Consent and the Consent Order are collectively referred to as the Consents). The Consents and related understandings with the FHFA constitute the FHLB's capital restoration plan and fulfill the FHFA's April 19, 2010, request of the FHLB for a business plan.
The Consents provide that, following a stabilization period (from the date of the Consent Order through the filing of the FHLB's second quarter 2011 quarterly report on Form 10-Q with the Securities and Exchange Commission) and once the FHLB reaches and maintains certain thresholds, it may begin repurchasing member capital stock at par.
For further information concerning the Bank’s securities portfolio, see Note 4 of the Notes to the Consolidated Financial Statements listed in Item 15.
Loans
The following table sets forth the Bank’s loan portfolio by type of loan and by type of collateral at the dates indicated:
|
At December 31,
|
||||||||||||||||||||||||||||||||||||||||
|
(Dollars in thousands)
|
2010
|
2009
|
2008
|
2007
|
2006
|
|||||||||||||||||||||||||||||||||||
|
Type of Loan
|
Amount
|
%
|
Amount
|
%
|
Amount
|
%
|
Amount
|
%
|
Amount
|
%
|
||||||||||||||||||||||||||||||
|
Business
|
$ | 400,047 | 40.10 | % | $ | 469,196 | 39.01 | % | $ | 485,060 | 38.55 | % | $ | 468,453 | 42.28 | % | $ | 442,391 | 43.78 | % | ||||||||||||||||||||
|
R/E Construction (1)
|
81,778 | 8.20 | 256,917 | 21.36 | 406,505 | 32.31 | 381,810 | 34.44 | 295,087 | 29.20 | ||||||||||||||||||||||||||||||
|
Commercial R/E
|
201,885 | 20.23 | 183,286 | 15.24 | 122,951 | 9.77 | 120,421 | 10.87 | 119,298 | 11.81 | ||||||||||||||||||||||||||||||
|
Multifamily
|
89,350 | 8.96 | 82,418 | 6.85 | 86,864 | 6.90 | 11,397 | 1.03 | 34,719 | 3.44 | ||||||||||||||||||||||||||||||
|
Home equity/consumer
|
29,964 | 3.00 | 31,738 | 2.64 | 30,772 | 2.45 | 27,688 | 2.50 | 27,686 | 2.74 | ||||||||||||||||||||||||||||||
|
Residential
|
194,677 | 19.51 | 179,133 | 14.90 | 126,089 | 10.02 | 98,384 | 8.88 | 91,256 | 9.03 | ||||||||||||||||||||||||||||||
|
Total loans
|
997,701 | 100.00 | % | 1,202,688 | 100.00 | % | 1,258,241 | 100.00 | % | 1,108,153 | 100.00 | % | 1,010,437 | 100.00 | % | |||||||||||||||||||||||||
|
Less:
|
||||||||||||||||||||||||||||||||||||||||
|
Deferred loan fees, net
|
3,934 | 3,575 | 3,069 | 3,724 | 3,434 | |||||||||||||||||||||||||||||||||||
|
Allowance for loan losses
|
26,106 | 25,900 | 16,439 | 11,653 | 10,988 | |||||||||||||||||||||||||||||||||||
|
Total loans, net
|
$ | 967,661 | $ | 1,173,213 | $ | 1,238,733 | $ | 1,092,776 | $ | 996,015 | ||||||||||||||||||||||||||||||
(1) Includes land loans
Business Loans. Business loans decreased from $469.2 million at December 31, 2009, to $400.0 million at December 31, 2010. Unsecured business banking loans totaled $9.4 million at December 31, 2010, compared to $25.9 million as of December 31, 2009. The Bank’s business loan portfolio consists primarily of commercial business loans to small and medium-sized businesses operating in Snohomish and King Counties. These loans are generally secured by real estate, receivables, equipment, other assets of the business, personal property and the personal guarantee of the borrower. These loans typically have variable-rate terms or fixed-rates with maturities of up to five years. The Bank also offers secured and unsecured operating lines of credit. Business loans are underwritten by the Bank on the basis of the borrower's cash flow, ability to service debt from earnings, and the underlying collateral value. The borrower is generally required to provide the Bank with financial statements, tax returns, current financial information on any and all guarantors, and other reports that show trends in their financial condition; and to update this information annually. Business loans also include owner occupied real estate loans with terms comparable to the Bank’s commercial real estate loans. In addition, as business-banking activity increases, the Bank expects to expand its lower cost deposit franchise through the growth of commercial checking as a source of funding.
Business loans are inherently sensitive to conditions in the economy. The collateral securing these loans may depreciate over time, may be difficult to appraise and may fluctuate in value based on the success of the business. In the case of loans secured by accounts receivable, the availability of funds for the repayment of such loans may be substantially dependent on the ability of the borrower to collect amounts due from its customers. Accordingly, the repayment of a business loan depends primarily on the successful operation of the borrower's business and creditworthiness of the borrower (and any guarantors), while liquidation of collateral is a secondary and potentially insufficient source of repayment.
Real Estate Construction Loans. Due to existing conditions in housing markets in the areas where we operate, the recession and other factors, the Bank projects real estate construction loan originations to be materially constrained in 2011 and beyond. Management’s revised business plan, of diversifying our loan portfolio, de-emphasizes the origination of construction loans. For the most
39
Construction loans involve higher credit risks because loan funds are advanced upon the security of the project under construction that is of uncertain value before completion. The Bank’s risk of loss on a construction loan is dependent largely upon the accuracy of the initial estimate of the property’s value at completion of construction or development and the estimated cost (including interest) of the construction. If the estimate of construction costs proves to be inaccurate, the Bank may be required to advance additional funds to complete the development. If upon completion of the project, the estimate of the marketability of the property is inaccurate, the borrower may be unable to sell the completed project in a timely manner or obtain adequate proceeds to repay the loan. Delays may arise from labor problems, material shortages and other unpredictable contingencies in completing the project. Furthermore, if the estimate of value of a completed project is inaccurate, the Bank may be confronted with a project with a value that is insufficient to assure full repayment. As a result, these loans may involve the disbursement of substantial funds with repayment dependent, in part, on the success of the ultimate project rather than the ability of the borrower or guarantor to repay principal and interest.
Commercial Real Estate Loans. Commercial real estate loans totaled $201.9 million or 20.2% of the Bank’s total loans at December 31, 2010, compared to $183.3 million or 15.2% of the portfolio at December 31, 2009. All commercial real estate loans are secured by properties in western Washington, mainly in the Puget Sound region. Improved property including office buildings and small commercial business properties, such as strip shopping centers, secure the Bank’s commercial real estate loans. These loans are primarily adjustable-rate with a maximum term until reset on the interest rate of five years. At December 31, 2010, the largest commercial real estate loan in the Bank’s portfolio was $17.2 million, which is performing according to its terms.
Commercial real estate loans are also sensitive to local economic conditions. An economic slowdown can lead to increased vacancies that would lower the borrower’s ability to service the debt. Commercial real estate loans also have a degree of interest rate risk in that if rates fall, borrowers may refinance, and if rates rise, the Bank could experience a squeeze in its net interest margin if the Bank does not properly fund these loans, which often have a fixed rate for the initial five years of the loan.
Multifamily Loans. Multifamily loans totaled $89.4 million or 9.0% of the total loan portfolio at December 31, 2010, compared to $82.4 million or 6.9% of the total loan portfolio at December 31, 2009. The multifamily portfolio is principally comprised of small to medium-size apartment projects with loan-to-value ratios usually up to 75%. All new loan originations are in the Puget Sound region and have adjustable interest rates.
Multifamily residential and commercial real estate lending affords the Bank an opportunity to receive interest at rates higher than those generally available from one-to-four family mortgage loans. However, loans secured by such properties usually are greater in amount and may involve a greater degree of risk than individual one-to-four family residential mortgage loans. Because payments on loans secured by multifamily residential and commercial properties are often dependent on the successful operation and management of the properties, repayment of such loans may be affected by adverse conditions in the real estate market or the economy.
Consumer Loans. The Bank’s consumer loan activities take three forms: home equity loans or lines of credit, installment loans/lines of credit, and Visa card loans. Home equity loans are secured by a junior lien in priority on the borrower's home. Such loans may have a combined loan-to-value ratio of up to 90% of the value of the home securing the loan. Home equity loans are fixed amount loans, which may have fixed or floating interest rates. Home equity lines of credit can be drawn upon at any time by the customer up to a specific amount. These loans are at a floating rate with a floor on that rate.
40
Residential Loans. At December 31, 2010, residential loans totaled $194.7 million or 19.5% of the total loan portfolio compared to $179.1 million or 14.9% of the total loan portfolio at December 31, 2009. Residential lending consists of first mortgage loans secured by single-family residential properties located principally in Snohomish and King counties. The Bank originates both fixed-rate and adjustable-rate mortgages (ARMs) with maturities up to 30 years. ARM loans are generally held in the Bank’s portfolio. Newly originated ARMs have interest rates that adjust based on the One Year Constant Maturity Treasury Index after an initial fixed-rate period. Borrower demand for ARMs versus fixed-rate mortgage loans is a function of the level of interest rates, the shape of the yield curve, and the differences between the interest rates and loan fees offered for fixed-rate mortgage loans and the rates and loan fees for ARMs.
Fixed-rate residential loans are generally sold and the servicing released to one of the Bank’s correspondents, except for loans generated under its Builder Sales program. The loans are sold on a “best efforts” basis. The Bank had no conforming loans held for sale at December 31, 2010, and $250,000 at December 31, 2009. Loans held for sale are not material and, therefore, the Bank does not include them as a separate line item on the balance sheet.
Beginning in 2009, the Bank has originated and holds loans generated under its Builder Sales program, which offers attractive terms to qualified buyers of houses from builders financed by the Bank. The Bank is required to discount these loans because of the special terms offered to the borrowers. Discounts recorded in 2010 associated with the program totaled $856,000 for the year ended December 31, 2010. The discount reduces the Bank’s allowance for loan losses. As of December 31, 2010, the Bank held $82.5 million of these loans.
The Bank’s conforming residential loans meet the Federal Home Loan Mortgage Corporation's underwriting standards with respect to credit, borrower debt ratios and documentation. The Bank’s nonconforming residential loans are those that do not conform to agency underwriting guidelines, due to the size of the loan, as a result of credit histories, debt-to-income ratios, reliance on the borrower's stated income, non-owner occupied property, rural property, loan-to-value, or other exceptions from agency guidelines. The Bank does not offer subprime loans.
Total loans decreased by $205.0 million to $997.7 million from December 31, 2009 to December 31, 2010. Payments and payoffs totaled $367.1 million for the year ended December 31, 2010 and offset $268.7 million in additional loan growth, most of which was due to advances on existing business loans as well as an increase in residential loans due to our Builder Sales program. Total loans were further reduced by charge-offs of $57.1 million and $47.3 million in transfers to real estate owned (REO) for the year ended December 31, 2010.
41
The following table presents the change in the Bank’s loan portfolio from December 31, 2009 to December 31, 2010:
|
(Dollars in thousands)
Loans
|
Balance at
December 31, 2010
|
Net
(Paydowns)
Additions
|
Reclassifi
-cations (1)
|
Charge-Offs (2)
|
Transfers to
REO
|
Transfers to Notes Receivable
|
Balance at
December 31, 2009
|
|||||||||||||||||||||
|
Business
|
$ | 400,047 | $ | (51,334 | ) | $ | (1,346 | ) | $ | (10,993 | ) | $ | (3,251 | ) | $ | (2,225 | ) | $ | 469,196 | |||||||||
|
R/E construction
|
- | |||||||||||||||||||||||||||
|
Spec construction
|
25,303 | (17,121 | ) | (8,616 | ) | (4,569 | ) | (3,751 | ) | - | 59,360 | |||||||||||||||||
|
Land acquisition & development/land
|
54,142 | (18,299 | ) | (454 | ) | (38,024 | ) | (35,245 | ) | - | 146,164 | |||||||||||||||||
|
Multifamily/custom construction
|
- | 193 | (19,116 | ) | - | - | - | 18,923 | ||||||||||||||||||||
|
Commercial R/E construction
|
2,333 | 336 | (23,976 | ) | (1,752 | ) | (4,745 | ) | - | 32,470 | ||||||||||||||||||
|
Total R/E Construction
|
81,778 | (34,891 | ) | (52,162 | ) | (44,345 | ) | (43,741 | ) | - | 256,917 | |||||||||||||||||
|
Commercial R/E
|
201,885 | (5,148 | ) | 24,530 | (783 | ) | - | - | 183,286 | |||||||||||||||||||
|
Multifamily
|
89,350 | (18,302 | ) | 25,234 | - | - | - | 82,418 | ||||||||||||||||||||
|
Home equity/consumer
|
29,964 | (1,343 | ) | (52 | ) | (379 | ) | - | - | 31,738 | ||||||||||||||||||
|
Residential
|
194,677 | 12,602 | 3,796 | (574 | ) | (280 | ) | - | 179,133 | |||||||||||||||||||
|
Total loans
|
$ | 997,701 | $ | (98,416 | ) | $ | - | $ | (57,074 | ) | $ | (47,272 | ) | $ | (2,225 | ) | $ | 1,202,688 | ||||||||||
|
Deferred loan fees
|
(3,934 | ) | (359 | ) | - | - | - | - | (3,575 | ) | ||||||||||||||||||
|
Allowance for loan losses
|
(26,106 | ) | (56,515 | ) | (19 | ) | 56,328 | - | - | (25,900 | ) | |||||||||||||||||
|
Loans, net
|
$ | 967,661 | $ | (155,290 | ) | $ | (19 | ) | $ | (746 | ) | $ | (47,272 | ) | $ | (2,225 | ) | $ | 1,173,213 | |||||||||
|
(1)
|
Includes $19 related to the change in off-balance sheet allowance for loan losses.
|
|
(2)
|
Excludes $267 related to overdrawn checking accounts, a write-down of $33, and recoveries of $1,046.
|
The following table sets forth information at December 31, 2010 regarding the dollar amount of loans maturing in the Bank’s portfolio based on their contractual terms to maturity, but does not include scheduled payments or potential prepayments. Loan balances do not include deferred loan fees. Construction loans are net of loans in process.
|
(Dollars in thousands)
|
Due in One
Year or Less
|
Due in One
to Five Years
|
Due After
Five Years
|
Total
|
With Variable or Adjustable Rate (For Maturities of More Than One Year)
|
With Fixed Rate
(For Maturities of
More Than One Year)
|
||||||||||||||||||
|
Business
|
$ | 67,383 | $ | 174,054 | $ | 154,264 | $ | 395,701 | $ | 152,901 | $ | 175,417 | ||||||||||||
|
R/E construction
|
39,052 | 27,583 | 2,590 | 69,225 | 12,138 | 18,035 | ||||||||||||||||||
|
Commercial R/E
|
14,790 | 87,350 | 71,393 | 173,533 | 151,185 | 7,558 | ||||||||||||||||||
|
Multifamily
|
17,178 | 42,237 | 29,935 | 89,350 | 45,032 | 27,140 | ||||||||||||||||||
|
Home equity/consumer
|
1,180 | 8,776 | 18,960 | 28,916 | 19,598 | 8,138 | ||||||||||||||||||
|
Residential
|
2,433 | 11,074 | 179,372 | 192,879 | 103,253 | 87,193 | ||||||||||||||||||
Allowance for Loan Losses
Management provides for potential future loan losses by maintaining an allowance for loan losses. The allowance for loan losses reflects management’s best estimate of probable losses as of a particular balance sheet date. The allowance for loan losses is maintained at levels based on management’s assessment of various factors affecting the loan portfolio, including analysis of adversely classified loans, delinquencies, trends in credit quality, local economic conditions, growth of the loan portfolio, past loss experience, and the portfolio’s composition. Increases in the allowance for loan losses made through provisions primarily reflect loan loss risks inherent in lending and the impact of the economic climate on the loan portfolio.
At December 31, 2010, the allowance for loan losses was $26.1 million (2.62% of total loans) compared to $25.9 million (2.15% of total loans) at December 31, 2009. The valuation reserve for off-balance sheet commitments was $50,000 at December 31, 2010 and $69,000 at December 31, 2009. The total allowance for loan losses, which includes the allowance for off-balance sheet commitments, was $26.2 million (2.62% of total loans) as of December 31, 2010, compared to $26.0 million (2.16% of total loans) as of December 31, 2009.
42
Activity in the allowance for loan losses during the year ended December 31, 2010 included a provision expense of $56.5 million and net charge-offs of $56.3 million. Charge-offs were primarily related to business and real estate construction, including land acquisition and development/land loans, which accounted for $55.4 million in charge-offs.
The following table sets forth information regarding changes in the Bank’s allowance for loan losses for the periods presented:
|
(Dollars in thousands)
|
Years Ended December 31,
|
|||||||||||||||||||
|
Allowance for Loan Losses
|
2010
|
2009
|
2008
|
2007
|
2006
|
|||||||||||||||
|
Balance at beginning of period
|
$ | 25,900 | $ | 16,439 | $ | 11,653 | $ | 10,988 | $ | 10,254 | ||||||||||
|
Charge-Offs
|
||||||||||||||||||||
|
Business
|
(11,026 | ) | (3,628 | ) | (1,212 | ) | (288 | ) | (46 | ) | ||||||||||
|
R/E construction
|
(44,345 | ) | (30,135 | ) | (1,941 | ) | - | - | ||||||||||||
|
Commercial R/E
|
(783 | ) | - | - | - | - | ||||||||||||||
|
Multifamily
|
- | (246 | ) | - | - | - | ||||||||||||||
|
Home equity/consumer
|
(645 | ) | (637 | ) | (632 | ) | (390 | ) | (368 | ) | ||||||||||
|
Residential
|
(574 | ) | (367 | ) | - | - | - | |||||||||||||
|
Recoveries
|
1,045 | 275 | 1,282 | 135 | 148 | |||||||||||||||
|
Net charge-offs
|
(56,328 | ) | (34,738 | ) | (2,503 | ) | (543 | ) | (266 | ) | ||||||||||
|
Provision for loan losses
|
56,515 | 44,175 | 7,240 | 1,350 | 1,000 | |||||||||||||||
|
Transfers from (to) off-balance commitments
|
19 | 24 | 49 | (142 | ) | - | ||||||||||||||
|
Balance at end of period
|
$ | 26,106 | $ | 25,900 | $ | 16,439 | $ | 11,653 | $ | 10,988 | ||||||||||
|
Average total loans
|
$ | 1,113,891 | $ | 1,242,588 | $ | 1,183,072 | $ | 1,046,093 | $ | 955,692 | ||||||||||
|
Nonperforming (nonaccruing) loans
|
48,098 | 106,096 | 40,278 | 1,523 | 851 | |||||||||||||||
|
Ratio of net charge-offs during the period to average total loans
|
5.06 | % | 2.80 | % | 0.21 | % | 0.05 | % | 0.03 | % | ||||||||||
|
Ratio of allowance for loan losses to average total loans
|
2.34 | 2.08 | 1.39 | 1.11 | 1.15 | |||||||||||||||
|
Ratio of allowance for loan losses to total loans
|
2.62 | 2.15 | 1.31 | 1.05 | 1.09 | |||||||||||||||
|
Coverage ratio
|
54.28 | 24.41 | 40.81 | 765.13 | 1,291.19 | |||||||||||||||
Historical net charge-offs are not necessarily accurate indicators of future losses since net charge-offs vary from period to period due to economic conditions and other factors that cannot be accurately predicted. Thus, an evaluation based on historical loss experience within individual loan categories is only one of many factors considered by management in evaluating the adequacy of the overall allowance.
Management believes that the allowance for losses on loans is adequate to provide for losses that may be incurred on loans; however, there is no guarantee that management’s estimate will be sufficient to cover actual loan losses.
At December 31, 2010, the allowance for loan losses was 54.28% of total nonperforming loans (coverage ratio) compared to 24.41% at December 31, 2009. The increase in the coverage ratio for the current period was due to the decrease in nonperforming loans. Nonperforming loans decreased 54.7% from $106.1 million at December 31, 2009 to $48.1 million at December 31, 2010. During the same period the allowance for loan losses increased 0.8% from $25.9 million to $26.1 million.
Asset Quality
Banking regulations require that each insured institution review and classify its assets regularly. In addition, bank examiners have the authority to identify problem assets and, if appropriate, require them to be adversely classified. There are three classifications for problem assets: substandard, doubtful and loss. Substandard assets have one or more defined weaknesses and are characterized by the distinct possibility that the insured institution will sustain some loss if the deficiencies are not corrected. Doubtful assets have sufficient weaknesses that make collection or payment in full, based on currently existing facts, conditions and values, questionable. An asset classified as loss is considered uncollectible and of such little value that its continuance as an asset of the institution is not warranted. If an asset, or portion thereof, is classified as loss, the insured institution must either establish specific allowances for loan losses in the amount of 100% of the portion of the asset classified as
43
In order to proactively address credit quality issues within its loan portfolios, Cascade Bank maintains fully staffed Credit Administration and Special Assets departments to address the increased volume of classified assets. Generally, when a loan becomes classified, the relationship is transferred to the Special Assets department. Cascade Bank actively engages the borrower and guarantor to determine a course of action. Current financial information is requested from the borrower(s) and guarantor(s) and updated collateral values are requested. If the loan is secured by real estate, updated title information is obtained to determine the status of encumbrances on the collateral. When possible, Cascade Bank requires the borrower to provide additional collateral or capital. In conjunction with the receipt of additional collateral, Cascade Bank will sometimes modify the terms of the loan. Often the new modified terms of the loan are consistent with terms that Cascade Bank would offer a new borrower. If the modification of terms is considered concessionary and the borrower is having financial difficulty for economic or legal reasons, the loan is classified as a troubled debt restructuring (TDR). All TDR loans are considered impaired and are reviewed for impairment using fair market methodology or discounted cash flow techniques.
Cascade Bank also may consider allowing a borrower to sell the underlying collateral for less than the outstanding balance on the loan if the current collateral evaluation supports the offer price. In such situations, Cascade Bank often requires the borrower to sign a new note for the resulting deficiency or to bring cash to closing. In some situations, Cascade Bank releases the collateral only in a sale transaction, preserving its right to seek monetary judgments against the borrowers and guarantors.
A report containing delinquencies of all loans is reviewed frequently by management and the Board of Directors. Actions on delinquent loans are taken based upon the particular circumstance of each loan. The Bank’s general procedures provide that when a loan becomes delinquent, the borrower is contacted, usually by phone, within 30 days. When the loan is over 30 days delinquent, the borrower is typically contacted in writing. Generally, the Bank will initiate foreclosure or other corrective action against the borrower when principal and interest become 90 days or more delinquent. In most cases, interest income is reduced by the full amount of accrued and uncollected interest on loans once they become 90 days delinquent, go into foreclosure or are otherwise determined to be uncollectible. Once interest has been paid to date, the borrower establishes six months of timely repayment performance, and management considers the loan fully collectible, it is returned to accrual status.
Nonperforming (Nonaccrual) Loans
It is the Bank's practice to discontinue accruing interest on virtually all loans that are delinquent in excess of 90 days regardless of risk of loss, collateral, etc. Some problem loans, which are less than 90 days delinquent, are also placed into nonaccrual status if the success of collecting full principal and interest in a timely manner is in doubt. Some loans will remain in nonaccrual status even after improved performance until a consistent timely repayment pattern is exhibited and/or timely performance is considered reliable.
At December 31, 2010, nonperforming loans totaled $48.1 million, compared to $106.1 million at December 31, 2009, and $40.3 million at December 31, 2008. The level of nonperforming loans is primarily attributable to the slow down in the housing market and general economy, which significantly impacted our real estate construction portfolio and, to a lessor extent, our commercial real estate portfolio. Of the total nonperforming loans at December 31, 2010, 26.1% relate to our real estate construction, land development and completed lot portfolios and 58.9% is related to our commercial real estate portfolio.
Loans are generally placed on nonaccrual status when they become past due over 90 days or when the collection of interest or principal is considered unlikely. Loans past due over 90 days that are not on nonaccrual status must be well secured by tangible collateral and in the process of collection. The Bank had no loans that were 90 days or more past due and still accruing interest at December 31, 2010.
44
The following table shows nonperforming loans versus total loans in each loan category:
|
(Dollars in thousands)
|
Balance at December 31, 2010
|
Nonperforming
Loans (NPL)
|
NPL as a %
of Loan Category
|
|||||||||
|
Business
|
$ | 400,047 | $ | 4,347 | 1.1 | % | ||||||
|
R/E Construction
|
||||||||||||
|
Spec construction
|
25,303 | 9,705 | 38.4 | |||||||||
|
Land acquisition & development/land
|
54,142 | 2,848 | 5.3 | |||||||||
|
Commercial R/E construction
|
2,333 | - | - | |||||||||
|
Total R/E construction
|
81,778 | 12,553 | 15.4 | |||||||||
|
Commercial R/E
|
201,885 | 28,352 | 14.0 | |||||||||
|
Multifamily
|
89,350 | - | - | |||||||||
|
Home equity/consumer
|
29,964 | 1,048 | 3.5 | |||||||||
|
Residential
|
194,677 | 1,798 | 0.9 | |||||||||
|
Total
|
$ | 997,701 | $ | 48,098 | 4.8 | % | ||||||
Nonperforming loans decreased to $48.1 million at December 31, 2010, compared to $106.1 million at December 31, 2009. The decline is largely the result of a net decrease of $62.3 million in nonperforming land acquisition and development/land loans, which decreased to $2.8 million at December 31, 2010, as compared to $65.1 million at December 31, 2009.
As of December 31, 2010, 15.4% of total real estate construction loans and 14.0% of commercial real estate loans were nonperforming. The other designated loan categories had no significant amounts of nonperforming loans compared to total loans outstanding in the respective categories.
Additions to nonperforming loans were $88.1 million for the year ended December 31, 2010, including two spec construction loans totaling $13.4 million, three land acquisition and development/land loans totaling $17.4 million and two commercial real estate loans totaling $18.7 million. These seven loans accounted for approximately 56.2% of the additions that occurred during the year ended December 31, 2010. One of the commercial real estate loans is secured by a 31,000 square foot office building and commercially zoned land, and the other is secured by a shopping center. The construction and land acquisition and development loans are secured by mostly completed residentially developed lots and/or finished houses. All seven loans have been individually reviewed for impairment. Additions to nonperforming loans during the period were offset by $39.5 million in paydowns, $57.1 million in charge-offs, $47.3 million in transfers to REO and $2.2 million in transfers to notes receivable. Charge-offs were largely for land acquisition and development/land loans, which accounted for $38.0 million and business loans, which accounted for $11.0 million of the total charge-offs.
The following table shows the migration of nonperforming loans (NPLs) through the portfolio in each category as of December 31, 2010, compared to December 31, 2009:
|
(Dollars in thousands)
Nonperforming Loans
|
Balance at
December 31, 2010
|
Additions
|
Paydowns
|
Charge-
Offs(1)
|
Transfers
to REO
|
Transfers to
Notes Receivable
|
Balance at
December 31, 2009
|
|||||||||||||||||||||
|
Business
|
$ | 4,347 | $ | 18,094 | $ | (4,266 | ) | $ | (10,993 | ) | $ | (3,251 | ) | $ | (2,225 | ) | $ | 6,988 | ||||||||||
|
R/E construction
|
||||||||||||||||||||||||||||
|
Spec construction
|
9,705 | 26,336 | (22,098 | ) | (4,569 | ) | (3,751 | ) | - | 13,787 | ||||||||||||||||||
|
Land acquisition & development/land
|
2,848 | 20,951 | (9,954 | ) | (38,024 | ) | (35,245 | ) | - | 65,120 | ||||||||||||||||||
|
Commercial R/E construction
|
- | 20 | - | (1,752 | ) | (4,745 | ) | - | 6,477 | |||||||||||||||||||
|
Total R/E construction
|
12,553 | 47,307 | (32,052 | ) | (44,345 | ) | (43,741 | ) | - | 85,384 | ||||||||||||||||||
|
Commercial R/E
|
28,352 | 18,954 | (2,400 | ) | (783 | ) | - | - | 12,581 | |||||||||||||||||||
|
Home equity/consumer
|
1,048 | 1,168 | (227 | ) | (379 | ) | - | - | 486 | |||||||||||||||||||
|
Residential
|
1,798 | 2,587 | (592 | ) | (574 | ) | (280 | ) | - | 657 | ||||||||||||||||||
|
Total nonperforming loans
|
$ | 48,098 | $ | 88,110 | $ | (39,537 | ) | $ | (57,074 | ) | $ | (47,272 | ) | $ | (2,225 | ) | $ | 106,096 | ||||||||||
|
(1)
|
Excludes $267 related to overdrawn checking accounts, a write-down of $33, and recoveries of $1,046.
|
45
Impaired Loans
A loan is considered impaired when, based on current information and events, the Bank determines that it is probable it will not be able to collect all amounts due according to the loan contract, including scheduled interest payments. When the Bank identifies a loan as impaired, it measures the impairment using discounted cash flows, except when the sole remaining source of the repayment for the loan is the liquidation of the collateral. In these cases, the Bank uses the current fair value of the collateral, less selling costs, instead of discounted cash flows. If the Bank determines that the value of the impaired loan is less than the recorded investment in the loan, it either recognizes an impairment reserve as a specific component to be provided for in the allowance for loan losses or charges-off the impaired balance on collateral dependent loans if it is determined that such amount represents a confirmed loss. The combination of the general allowance calculation and the specific reserve on impaired loans result in the total allowance for loan losses.
See Note 5 to Item 15: Notes to Consolidated Financial Statements, for a breakdown of our impaired loans at December 31, 2010 and 2009, by loan category and reserves.
When loans are identified as impaired they are typically transferred to the Bank’s Special Assets department. When the Bank identifies a loan as impaired, it measures the loan for potential impairment using discounted cash flows, except when the loan is collateral dependent. In these cases, the Bank uses the current fair value of collateral, less selling costs. The current fair value of collateral is generally determined through obtaining external appraisals. External appraisals are updated on a periodic basis as determined by the Chief Credit Officer. The Bank obtains appraisals from a pre-approved list of independent, third party, local appraisal firms. Larger appraisals are reviewed by the Bank’s Chief Appraiser, or a qualified third party reviewer to ensure the quality of the appraisal and the expertise and independence of the appraiser. Smaller appraisals are reviewed by a Bank underwriter. Although an external appraisal is the primary source used to value collateral dependent loans, the Bank may also utilize values obtained through executed purchase and sale agreements, negotiated short sales, broker price opinions, historical sales activity, or internal evaluations. These alternative sources of value are used for interim periods between appraisals and only if deemed to be more representative of current value. Impairment analyses are updated, reviewed and approved on a quarterly basis at or near the end of each reporting period. Based on these processes, the Bank does not believe there are significant time lapses for the recognition of additional loan loss provisions or charge-offs from the date they become known.
At December 31, 2010, the recorded investment in loans classified as impaired totaled $144.0 million. Included in this total are $40.0 million in impaired loans with a corresponding specific reserve (included in the allowance for loan losses) of $5.8 million. The remaining $104.0 million in impaired loans are considered collateral dependent and have been written-down to their estimated net realizable value. At December 31, 2009, the total recorded investment in impaired loans was $183.7 million, with a corresponding specific reserve of $6.4 million.
Impaired loans include $94.2 million and $51.9 million in loans that have been designated as troubled debt restructured (TDR) loans at December 31, 2010 and December 31, 2009, respectively. Of the total TDR loans, $63.8 million and $26.6 million are performing as agreed under the restructured notes at December 31, 2010 and December 31, 2009, respectively.
Troubled Debt Restructured (TDR) Loans
Loans are classified as TDR when a modification of terms is processed by the Bank, for economic or legal reasons related to the debtor’s financial difficulty, at terms and conditions that the Bank would not otherwise consider. In some cases, the Bank has extended the interest-only period of a loan or allowed a borrower to make interest-only payments to assist the borrower while trying to sell the collateral securing the loan.
46
The following table shows TDR loans outstanding as of the date indicated:
|
(Dollars in thousands)
|
December 31,
|
|||||||||||||||||||
|
Troubled Debt Restructured Loans
|
2010
|
2009
|
2008
|
2007
|
2006
|
|||||||||||||||
|
Business
|
$ | 19,614 | $ | 3,626 | $ | 47 | $ | 261 | $ | 115 | ||||||||||
|
R/E construction
|
- | - | - | |||||||||||||||||
|
Spec construction
|
14,329 | 11,783 | - | - | - | |||||||||||||||
|
Land acquisition and development/land
|
16,044 | 14,118 | - | - | - | |||||||||||||||
|
Total R/E construction
|
30,373 | 25,901 | - | - | - | |||||||||||||||
|
Commercial R/E
|
32,238 | 20,441 | - | - | - | |||||||||||||||
|
Multifamily
|
8,619 | - | - | - | - | |||||||||||||||
|
Home equity/consumer
|
244 | - | - | 73 | - | |||||||||||||||
|
Residential
|
3,084 | 1,896 | 863 | - | - | |||||||||||||||
|
Total
|
$ | 94,172 | $ | 51,864 | $ | 910 | $ | 334 | $ | 115 | ||||||||||
Real Estate Owned (REO)
REO consists of property acquired by the Bank through foreclosure and is carried at the lower of the estimated fair value less expected selling costs, or the principal balance of the foreclosed loans. The costs related to repair, maintenance, or other costs of such properties, are generally expensed with any gains or shortfalls from the ultimate sale of REO being shown as other income or other expense. REO totaled $34.4 million at December 31, 2010, compared to $18.8 million at December 31, 2009. REO as of December 31, 2010 consisted of $239,000 in residential construction, $23.7 million in land acquisition and development/land, $1.7 million in multifamily, $5.0 million in commercial real estate, and $3.8 million in completed single-family residences. An $11.0 million nonperforming commercial real estate loan on a retail center was transferred to REO after year-end and was included among nonperforming loans as of December 31, 2010.
Additions to REO were $47.6 million for the year ended December 31, 2010, including 22 land acquisition and development loans/land loans totaling $35.3 million. These loans accounted for approximately 74.1% of the additions that occurred during the period. Capitalized costs for the year ended December 31, 2010 were $6.3 million. Additions and capitalized costs for REO during the period were partially offset by $27.0 million in paydowns/sales and $11.4 million in write-downs/losses.
The following table presents the activity related to REO for the year ended December 31, 2010:
|
(Dollars in thousands)
REO
|
Balance at
December 31, 2010
|
Additions
(1)
|
Capitalized
Costs
|
Paydowns/Sales
|
Write-downs/
Losses
|
Balance at
December 31, 2009
|
||||||||||||||||||
|
R/E construction
|
||||||||||||||||||||||||
|
Residential construction
|
$ | 239 | $ | 2,644 | $ | 2,803 | $ | (7,850 | ) | $ | (483 | ) | $ | 3,125 | ||||||||||
|
Land acquisition & development/land
|
23,706 | 35,276 | 2,615 | (15,888 | ) | (10,030 | ) | 11,733 | ||||||||||||||||
|
Condominium construction
|
- | (2,027 | ) | 781 | (410 | ) | (432 | ) | 2,088 | |||||||||||||||
|
Total R/E construction
|
23,945 | 35,893 | 6,199 | (24,148 | ) | (10,945 | ) | 16,946 | ||||||||||||||||
|
Commercial R/E
|
4,974 | 5,559 | 92 | (573 | ) | (104 | ) | - | ||||||||||||||||
|
Multifamily
|
1,718 | 2,027 | - | (218 | ) | (91 | ) | - | ||||||||||||||||
|
Residential
|
3,775 | 4,143 | 38 | (2,017 | ) | (285 | ) | 1,896 | ||||||||||||||||
|
Total
|
$ | 34,412 | $ | 47,622 | $ | 6,329 | $ | (26,956 | ) | $ | (11,425 | ) | $ | 18,842 | ||||||||||
|
|
(1)
|
Includes a $287 addition to REO related to the pay-off of a first lien, $63 related to a single-family residence received in partial satisfaction of a loan and $2.0 million transferred from a completed condominium construction project to multifamily.
|
47
The following table presents information with respect to the Bank’s nonperforming assets at the dates indicated:
|
(Dollars in thousands)
|
December 31,
|
|||||||||||||||||||
|
Nonperforming assets
|
2010
|
2009
|
2008
|
2007
|
2006
|
|||||||||||||||
|
Business
|
$ | 4,347 | $ | 6,988 | $ | 1,149 | $ | 1,522 | $ | 731 | ||||||||||
|
R/E construction
|
||||||||||||||||||||
|
Spec construction
|
9,705 | 13,787 | 11,736 | - | - | |||||||||||||||
|
Land acquisition & development/land
|
2,848 | 65,120 | 27,236 | - | - | |||||||||||||||
|
Commercial R/E construction
|
- | 6,477 | - | - | - | |||||||||||||||
|
Total R/E construction
|
12,553 | 85,384 | 38,972 | - | - | |||||||||||||||
|
Commercial R/E
|
28,352 | 12,581 | - | - | - | |||||||||||||||
|
Home equity/consumer
|
1,048 | 486 | 2 | 1 | 120 | |||||||||||||||
|
Residential
|
1,798 | 657 | 155 | - | - | |||||||||||||||
|
Total nonperforming loans
|
48,098 | 106,096 | 40,278 | 1,523 | 851 | |||||||||||||||
|
REO
|
34,412 | 18,842 | 1,446 | - | - | |||||||||||||||
|
Total nonperforming assets
|
$ | 82,510 | $ | 124,938 | $ | 41,724 | $ | 1,523 | $ | 851 | ||||||||||
|
Total nonperforming loans to total loans
|
4.82 | % | 8.82 | % | 3.20 | % | 0.14 | % | 0.08 | % | ||||||||||
|
Total nonperforming loans to total assets
|
3.21 | 6.22 | 2.46 | 0.11 | 0.06 | |||||||||||||||
|
Total nonperforming assets to total assets
|
5.51 | 7.33 | 2.55 | 0.11 | 0.06 | |||||||||||||||
At December 31 2010, nonperforming assets consisting of nonperforming (nonaccruing) loans and REO, totaled $82.5 million or 5.51% of total assets. Nonperforming assets totaled $124.9 million or 7.33% of total assets at December 31, 2009.
Certain other loans, currently in nonaccrual, are in the process of foreclosure and potentially could become REO. Efforts, however, are constantly underway to reduce and minimize such nonperforming assets. During 2008 and 2009, we expanded our special assets group to focus on reducing nonperforming assets.
The decision to begin a foreclosure action generally occurs after all other reasonable collection efforts have been found ineffective. We comply with all applicable state statues regarding foreclosure proceedings. Loans in foreclosure are always categorized as nonperforming assets, and as such, have been assigned a specific loan loss reserve based on the most current property valuations available, discounted to reflect foreclosure expense, holding time and sales costs. Assuming no other legal actions, the statutory processing period for a so-called nonjudicial foreclosure in the state of Washington is a minimum of 120 days or 190 days after the date of default. The first step is a notice of default that is mailed to the borrower and posted at the property or the notice is delivered to the borrower in person. The borrower is given 30 days to respond to the notice of default. If the borrower does not stop the foreclosure within 30 days after receiving the notice of default, we record a notice of sale with the appropriate county recorder. The notice of sale is recorded at least 90 days before the sale date and is mailed to the borrower and any other lien holders. The notice of sale is also published twice in a local newspaper. A notice of foreclosure is also required to be sent to the borrower and/or guarantors if we want to retain the right to a deficiency. We are required to publish the notice of sale once between the 32nd and 28th days prior to the sale, and once between the 11th and 7th days before the sale. Foreclosure sales are by public auction with the property going to the highest bidder.
We will bid up to the amount of our loan balance. If we do not have a buyer for the collateral by the sale date, and there is no other or higher bidder, then we acquire ownership of the property for the amount of our credit bid, and the property becomes an REO property of the Bank. The obligations of the guarantors (but not the borrower) of a commercial loan for any deficiency (the amount by which the loan balance exceeds the foreclosure sale price), generally survives the sale and we may bring a lawsuit against the guarantors to collect the deficiency if we determine a judgment against the guarantors may be collectible and cost-effective.
A judicial foreclosure action may also be brought to collect a real estate loan in the state of Washington, and is used by Cascade Bank in certain cases; however, nonjudicial foreclosure is usually the preferred remedy because it is normally faster and less expensive than litigation, which can take from 6 months for summary judgment, to 2 years for trial.
48
In addition, where appropriate, instead of foreclosure, we may negotiate a settlement agreement with the borrower, with a deed in lieu of foreclosure conveying the property to the Bank, to enable the Bank to acquire possession of the property faster than pursuing the normal foreclosure process.
The transition of loans from performing to nonperforming status may result in the assignment of a specific reserve or charge-off, if the loan is collateral dependent, that adjusts the net book value of the loan’s principal balance to reflect the estimated fair value of supporting collateral or result in no assignment of a specific reserve or charge-off if the loan’s collateral value is in excess of its book value. Subsequent write-downs, requiring additional loan loss provisioning, could occur as a loan moves through the foreclosure process into REO based on recurring impairment analysis up to and until a property becomes an REO.
Deposits
Total deposits decreased by $32.2 million to $1.11 billion at December 31, 2010, compared to December 31, 2009. Retail deposits increased by $140.9 million, compared to December 31, 2009, which was offset by a planned runoff in public, brokered and internet-based deposits of $103.1 million, $57.6 million and $12.4 million, respectively. Included in total deposits at December 31, 2010, were $914.5 million in retail deposits, $35.5 million in public deposits, $105.4 million in brokered deposits and $52.2 million in internet-based deposits.
Total checking account balances decreased $107.4 million to $337.6 million at December 31, 2010, compared to $444.9 million at December 31, 2009, mostly due to a planned reduction in public funds checking accounts that require 100% collateralization and the cross-sale and conversion of checking balances to money market accounts (MMDA) and certificates of deposit (CDs).
Savings and MMDA increased $43.8 million to $176.9 million at December 31, 2010, compared to $133.1 million at December 31, 2009.
CDs increased $31.3 million to $593.0 million at December 31, 2010, compared to $561.7 million at December 31, 2009.
The market for deposits has remained very competitive. It remains a key objective of the Bank to increase its demand deposit account balances and other low rate accounts.
The following table sets forth the balances for each major category of deposits at December 31, 2010, 2009, and 2008:
|
(Dollars in thousands)
|
December 31,
|
|||||||||||
|
Deposits by Type
|
2010
|
2009
|
2008
|
|||||||||
|
Noninterest-bearing demand deposits
|
$ | 110,042 | $ | 99,724 | $ | 84,033 | ||||||
|
Interest-bearing demand deposits
|
227,524 | 345,198 | 102,810 | |||||||||
|
Money market deposits
|
164,944 | 123,129 | 193,448 | |||||||||
|
Savings
|
12,001 | 10,001 | 10,587 | |||||||||
|
Certificates of deposit
|
593,043 | 561,722 | 615,904 | |||||||||
|
Total
|
$ | 1,107,554 | $ | 1,139,774 | $ | 1,006,782 | ||||||
See Note 9 of the Notes to Consolidated Financial Statements listed in Item 15 for additional information about deposits.
FHLB Advances
The Bank uses FHLB advances to provide intermediate and longer term funding. At December 31, 2010, the Bank had $159.0 million in FHLB advances compared to $239.0 million at December 31, 2009. During 2010, the Bank transitioned from a blanket pledge collateral agreement with the FHLB of Seattle to a custodial agreement. Under the terms of this agreement, the Bank's future borrowings from the FHLB of Seattle currently are limited to overnight cash management advances (CMA), or short term advances with maturities of 90 days or less.
See Note 10 of the Notes to Consolidated Financial Statements listed in Item 15 for additional information about FHLB advances.
49
Securities Sold Under Agreements to Repurchase
The Bank also uses repurchase agreements for funding needs. The Bank had repurchase agreements outstanding totaling $145.0 million at December 31, 2010, and $145.4 million at December 31, 2009. Interest rates paid on the repurchase agreements ranged from 4.6% to 7.0 % at December 31, 2010. The repurchase agreements consist of a series of transactions with maturity dates ranging from 2017 to 2022. The agreements have provisions that allow the lenders to periodically terminate the agreements. Termination dates typically occur once each quarter; however, a portion of the agreements may not be terminated prior to December 2012, provided the Bank offers the lender additional securities in November and December 2011. Repurchase agreements with this lender totaling $25.0 million and $50.0 million could be terminated in December 2012 and November 2013, respectively. The termination fee related to these agreements cannot be estimated. Other repurchase agreements totaling $50.0 million have provisions allowing the repurchase agreements to be terminated quarterly (in January, April, July and October) upon providing 2 days notice. While the Bank has received no indication that these repurchase agreements will be terminated prior to maturity, and the transactions are well secured by securities pledged to the counterparty, management believes that the likelihood of termination of the agreements is reasonably possible. If these repurchase agreements had been terminated as of December 31, 2010, the termination fee would have been approximately $13.7 million.
See Note 11 of the Notes to Consolidated Financial Statements listed in Item 15 for additional information about securities sold under agreements to repurchase.
Junior Subordinated Debentures
In March 2000, the Corporation issued $10.3 million of 11.0% junior subordinated debentures. In turn, Cascade Capital Trust I, a wholly owned business trust whose common equity is 100% owned by the Corporation, issued trust preferred securities underlying the debentures. These junior subordinated debentures have a fixed rate of 11.0% and mature on March 1, 2030, but are callable at a premium beginning on March 1, 2010. At December 31, 2010, the premium was 5.5%. The Corporation applies fair value accounting to the junior subordinated debentures issued by Cascade Capital Trust I. The change in fair market value of the junior subordinated debentures is recorded as a component of other income. The fair value was $1.5 million at December 31, 2010 compared to $3.3 million at December 31, 2009. In December 2004, the Corporation issued an additional $5.2 million in junior subordinated debentures. In turn, Cascade Capital Trust II, a wholly owned business trust whose common equity is 100% owned by the Corporation, issued trust preferred securities underlying the debentures. These debentures had a fixed rate of 5.82% for the first five years and as of January 7, 2010, float at the three-month LIBOR plus 1.90% for the remaining twenty-five years. The rate payable on these debentures as of December 31, 2010 was 2.19%. The debentures are callable by the Corporation at par after the first five years. On March 30, 2006, the Corporation issued an additional $10.3 million in junior subordinated debentures. In turn, Cascade Capital Trust III, a wholly owned business trust whose common equity is 100% owned by the Corporation, issued trust preferred securities underlying the debentures. These debentures have an initial rate of 6.65% set for five years and then convert to a three-month LIBOR plus 1.40% for the remaining twenty-five years. The debentures are callable at par after five years. Subject to certain restrictions, the Corporation’s junior subordinated debentures are considered Tier 1 capital by financial institution regulators. All three trusts exist for the exclusive purpose of issuing the trust preferred securities underlying the junior subordinated debentures issued by the Corporation, and engaging in only those other activities necessary, advisable or incidental to the above.
During the fourth quarter of 2009, FDIC restrictions prohibited dividend payments from the Bank to the holding company, which in turn led the Corporation to defer the payment of interest on the trust preferred securities. Under the terms of each instrument, deferral of payments is permitted without triggering an event of default. Generally, during any deferral period, the Corporation is prohibited from paying any dividends or distributions on, or redeem, purchase or acquire, or make a liquidation payment with respect to the Corporation’s capital stock, or make any payment of principal or interest on, or repay, repurchase or redeem any debt securities of the Corporation that rank pari passu in all respects with, or junior to, the specific instrument. In addition, during any deferral period, interest on the trust preferred securities is compounded from the date such interest would have been payable. The balance of deferred interest was $2.6 million as of December 31, 2010.
See Note 12 of the Notes to Consolidated Financial Statements listed in Item 15 for additional information about junior subordinated debentures.
50
Derivatives and Hedging
In the fourth quarter of 2010, the Bank entered into derivative contracts to add stability to interest income and to manage its exposure to changes in interest rates. The Bank sought to minimize the volatility that changes in interest rates have on its variable-rate debt by entering into interest rate cap agreements. The Bank purchased a series of interest rate caps from two different major financial institutions based on their credit rating and other factors. Both counterparties provide cash collateral to the Bank on the majority of the fair value of the cap to significantly mitigate credit risk of these transactions. The Bank purchased interest rate caps designated as cash flow hedges to protect against movements in interest rates above the caps’ strike rate, which is tied to three month LIBOR. The interest rate caps have an aggregate notional amount of $159.0 million, strike rates of 1.29% and a maturity date of October 20, 2015. The Bank formally documented the relationship between the hedging instruments and hedged items, as well as its risk management objective and strategy before initiating the hedge. The caps were used to hedge the variable cash flows associated with variable rate FHLB advances that reprice based upon three month LIBOR on the same day that the rate caps reprice. The fair value of our interest rate caps, is based on derivative valuation models using market data inputs as of the valuation date that can generally be verified and do not typically involve significant management judgments. (Level 2 inputs). The valuation was performed on December 31, 2010 and will be performed each reporting date to determine if the hedge was effective over the reporting period, using the hypothetical derivative method, by comparing the actual changes in the hedged item to a “perfectly effective” hypothetical interest rate cap. If the ratio of the change in fair value of the actual cap to the change in fair value of the hypothetical cap falls between the effectiveness parameters the hedge will be considered to have been effective. The December 31, 2010 valuations showed the hedge to be “perfectly effective” and resulted in a mark-to-market gain on the interest rate caps totaling $3.5 million, which is included in accumulated other comprehensive loss. The Bank expects approximately $50,000 in expense to be reclassified into earnings within the next 12 months as the Bank begins to amortize the cost of the interest rate caps.
The following table presents the notional value, strike rate, fair value and collateral held for derivative instruments accounted for as a cash flow hedge at December 31, 2010.
|
(Dollars in thousands)
Derivatives
|
December 31, 2010
|
|||
|
Notional Value
|
$ | 159,000 | ||
|
Strike Rate
|
1.29 | % | ||
|
Fair Value
|
$ | 8,732 | ||
|
Cash Collateral
|
7,620 | |||
Income Taxes
The Corporation recorded a $3.9 million federal income tax provision for the year ended December 31, 2010, and a benefit of $7.6 million for the year ended December 31, 2009. The effective tax rates were (5.8)% and 24.5% respectively, for the year ended December 31, 2010 and 2009. At March 31, 2010, the Corporation assessed whether it was more likely than not that it would realize the benefits of its deferred tax asset. The Corporation determined that the negative evidence associated with cumulative losses, the expectation of entering into a FDIC Order with its regulators, and credit deterioration in its loan portfolio outweighed the positive evidence. Therefore, during the first quarter of 2010, the Corporation established a full valuation allowance on its deferred tax asset. The Corporation will not be able to recognize the tax benefits on current and future losses until it can show that it is more likely than not that it will generate enough taxable income in future periods to realize the benefits of its deferred tax asset and loss carryforwards.
Stockholders’ Equity and Regulatory Matters
Total stockholders’ equity decreased $76.0 million from $134.5 million at December 31, 2009, to $58.5 million at December 31, 2010. The decrease in equity was largely due to the net loss for the period. The loss was primarily due to the $56.5 million loan loss provision and the $12.9 million goodwill impairment charge that the Bank recorded during the year ended December 31, 2010.
In 2008, the Board of Directors of Cascade Financial Corporation chose to participate in the U.S. Treasury's voluntary Capital Purchase Program. On November 21, 2008, the Corporation completed its $39.0 million capital raise as a participant in the U.S. Treasury Department’s Capital Purchase Program. Under the terms of the transaction, the Corporation issued 38,970 shares of Series A Fixed-Rate Cumulative Perpetual Preferred Stock, and a warrant to purchase 863,442 shares of the Corporation’s common stock at an exercise price of $6.77 per share. During the fourth quarter of
51
The primary reason for the Corporation’s participation was the addition of cost-effective capital, which served to expand our ability to provide increased credit to businesses and consumers in our market area and added flexibility in considering strategic opportunities for growth. The Corporation monitors its activities to determine how its participation in the program has assisted the Bank in supporting prudent lending and/or supporting efforts to work with existing borrowers to avoid unnecessary foreclosures.
As a condition for participating in the CPP, the Corporation accepted limitations on executive compensation and benefits. These limitations include restrictions on bonuses and incentive compensation to senior executive officers, a prohibition on making golden parachute payments to senior executive officers, and requiring clawback of any bonus or incentive compensation paid to a senior executive officer or one of the next twenty most highly compensated employees based on statements of earnings, gains or other criteria that are later proven to be materially inaccurate.
The Corporation is committed to managing capital for maximum stockholder benefit and maintaining protection for depositors and creditors. The Corporation manages various capital levels at both the holding company and subsidiary bank level to attempt to maintain adequate capital ratios and levels in accordance with external regulations and capital guidelines established by the Board of Directors. The Corporation had a risk-based capital ratio of 9.98% and a Tier 1 capital ratio of 5.55% at December 31, 2010. The Bank had a risk-based capital ratio of 9.60% and a Tier 1 capital ratio of 5.56% at December 31, 2010.
The Corporation had paid its stockholders a cash dividend on a quarterly basis since 2002. In June 2009, the Corporation suspended its regular quarterly cash dividend on common stock to preserve capital.
Accumulated other comprehensive loss increased to $5.1 million at December 31, 2010, compared to a $1.2 million deficit at December 31, 2009.
On July 20, 2010, the Board of Directors of the Bank stipulated to the entry of a Consent Order with the Federal Deposit Insurance Corporation (FDIC) and the Washington State Department of Financial Institutions (DFI), effective July 21, 2010 (FDIC Order). Under the terms of the FDIC Order, the Bank cannot pay any cash dividends or make any payments to the Corporation without the prior written approval of the FDIC and the Washington State DFI. Other material provisions of the FDIC Order require the Bank to:
|
·
|
review the qualifications of the Bank’s management;
|
|
·
|
provide the FDIC with 30 days written notice prior to adding any individual to the Board of Directors of the Bank or employing any individual as a senior executive officer;
|
|
·
|
increase director participation and supervision of Bank affairs;
|
|
·
|
develop a capital plan and increase Tier 1 leverage capital to 10% of the Bank’s average total assets and increase total risk-based capital to 12% of the Bank’s risk-weighted assets by November 18, 2010, and maintain such capital levels, in addition to maintaining a fully funded allowance for loan losses satisfactory to the regulators;
|
|
·
|
eliminate from its books, by charge-off or collection, all loans classified as “loss” and all amounts in excess of the fair value of the underlying collateral for assets classified as “doubtful” in the Report of Visitation dated February 16, 2010 that have not been previously collected or charged-off, by July 30, 2010;
|
|
·
|
reduce the amount of loans classified “substandard” and “doubtful” in the Report of Visitation that have not previously been charged off to not more than 130% of the Bank’s Tier 1 capital and allowance for loan losses, within 180 days;
|
|
·
|
eventually reduce the total of all adversely classified loans by collection, charge-off or sufficiently improving the quality of adversely classified loans to warrant removing any adverse classification, as determined by the regulators;
|
52
|
·
|
formulate a written plan to reduce the Bank’s levels of nonperforming assets and/or assets listed for “special mention” by the Bank to an acceptable level and to reduce the Bank’s concentrations in commercial real estate and acquisition, development and construction loans;
|
|
·
|
develop a three-year strategic plan and budget with specific goals for total loans, total investment securities and total deposits, and improvements in profitability and net interest margin, and reduction of overhead expenses;
|
|
·
|
submit a written plan for eliminating the Bank’s reliance on brokered deposits, in compliance with FDIC’s rules;
|
|
·
|
eliminate and/or correct all violations of law set forth in the Report of Visitation and the Report of Examination dated May 18, 2009, and ensure future compliance with all applicable laws and regulations;
|
|
·
|
implement a comprehensive policy for determining the adequacy of the allowance for loan losses satisfactory to the regulators and remedy any deficiency in the allowance in the calendar quarter discovered by a charge to current operating earnings;
|
|
·
|
refrain from extending additional credit with respect to loans charged-off or classified as “loss” and uncollected;
|
|
·
|
refrain from extending additional credit with respect to other adversely classified loans, without the prior approval of a majority of the directors on the Bank Board or its loan committee, and without first collecting all past due interest;
|
|
·
|
implement a liquidity and funds management policy to reduce the Bank’s reliance on brokered deposits and other non-core funding sources; and
|
|
·
|
prepare and submit periodic progress reports to the FDIC and the Washington State DFI.
|
The FDIC Order will remain in effect until modified or terminated by the FDIC and the Washington State DFI. A complete copy of the FDIC Order was filed as Exhibit 10.1 to the Form 8-K filed by the Corporation with the SEC on July 21, 2010.
Additionally, based on an examination concluded on March 11, 2010, the Corporation entered into a Written Agreement (FRB Agreement) with the Federal Reserve Bank (FRB) of San Francisco on November 4, 2010. Under the FRB Agreement, the Corporation cannot do any of the following without prior written approval of the FRB:
|
·
|
declare or pay any dividends;
|
|
·
|
make any distributions of principal or interest on junior subordinated debentures or trust preferred securities;
|
|
·
|
incur, increase or guarantee any debt; or
|
|
·
|
redeem any outstanding stock.
|
The FRB Agreement also requires the Corporation to:
|
·
|
take steps to ensure that the Bank complies with the FDIC Order;
|
|
·
|
submit a written capital plan that provides for sufficient capitalization of both the Corporation and the Bank within 60 days, and notify the FRB no more than 45 days after the end of any quarter in which any of the Corporation’s capital ratios fall below the approved plan’s minimum ratios;
|
|
·
|
submit a written cash flow projection plan for 2011 within 60 days;
|
|
·
|
comply with FRB regulations governing affiliate transactions, as well as submit a written plan to reimburse the Bank for all payments made by the Bank in violation of sections 23A and 23B of the Federal Reserve Act or to collateralize the loan made by the Bank to the Corporation in accordance with the requirements of sections 23A and 23B of the Federal Reserve Act;
|
|
·
|
comply with notice and approval requirements of the Federal Deposit Insurance Act (FDI Act) related to the appointment of directors and senior executive officers or change in the responsibility of any current senior executive officer;
|
|
·
|
comply with restrictions on paying or agreeing to pay certain indemnification and severance payments without prior written approval; and
|
|
·
|
submit a quarterly process report to the FRB.
|
The Board of Directors is committed to taking all actions necessary to meet each of the requirements of the FDIC Order and the FRB Agreement and believes that the Bank and the Corporation were in compliance with these regulatory actions as of December 31, 2010, except for the requirement in the FDIC Order to increase Tier 1 leverage capital to 10% and risk-based capital to 12% by November 18, 2010. The Board of Directors is working diligently to comply with the requirement to raise capital.
53
Proposed Merger
On March 4, 2011, the Corporation announced that the Corporation, the Bank and Opus Bank entered into a definitive agreement, providing for Opus Bank to acquire the Corporation and the Bank, and for the merger of the Bank into Opus Bank. See “Recent Events – Proposed Merger.” The parties expect to close the transaction in the latter part of the second quarter of 2011. Not withstanding this, there are no assurances that the Corporation and the Bank will be able to successfully close the proposed transaction and that the Corporation and the Bank would not be subject to additional restrictions or sanctions imposed by its regulators if the Bank does not increase its capital ratios as required by the FDIC Order.
Results of Operations
Net (Loss) Income
Cascade Financial Corporation had a net loss of $70.3 million for the year ended December 31, 2010, compared to $23.5 million for the year ended December 31, 2009. After adjustments for preferred stock dividends and accretion of the issuance discount on preferred stock issued to the U.S. Treasury, net loss attributable to common stockholders for the year ended December 31, 2010, was $72.8 million as compared to $25.8 million for the year ended December 31, 2009. The primary factors contributing to the loss in 2010 were a $56.5 million provision for loan losses and a $12.9 million goodwill impairment charge. Net interest income decreased $6.8 million to $36.4 million in 2010 primarily due to a decline in the loan portfolio. Other income increased $2.1 million to $18.7 million compared to $16.6 million for the year ended December 31, 2009. The increase was mostly due to an increase in gain on sale of securities, which was up $6.9 million in 2010 to $8.8 million, but was mostly offset by a decline in fair value gain on junior subordinated debentures, which was down $5.3 million in 2010 to $1.8 million. The Corporation earned net income of $2.1 million and $1.8 million attributable to common stockholders’ for the fiscal year ended December 31, 2008.
Return on Average Common Stockholders’ Equity
Return on average common stockholders’ equity (average stockholders’ equity excluding preferred stock) was (127.98)% for the year ended December 31, 2010, compared to (24.21)% for the year ended December 31, 2009 and 1.47% for 2008. The decline in return on average equity from 2009 to 2010 was driven by a substantial increase in the Corporation’s provision for loan losses and the goodwill impairment charge.
Non-GAAP Financial Measure - Return on Average Tangible Common Stockholders’ Equity
Return on average tangible common stockholders’ equity (average stockholders’ equity less average goodwill and intangibles, and preferred stock), was (112.13)% for the year ended December 31, 2010, compared to (15.61)% in 2009 and 1.83% in 2008. The June 2004 acquisition of Issaquah Bancshares, Inc. (Issaquah) generated $26.3 million in goodwill and intangible assets and a like amount of capital. Eliminating the average intangible asset and reducing the capital by the same amount produces average tangible stockholders’ equity.
Return on average tangible common stockholders’ equity is determined by methods other than those in accordance with accounting principles generally accepted in the United States of America (GAAP). This measure excludes the average balance of acquisition-related goodwill and intangibles and preferred stock in determining average tangible common stockholders’ equity. Management believes the presentation of this financial measure, excluding the impact of these items, provides useful supplemental information that is necessary for a proper understanding of the financial results of Cascade Financial Corporation. This disclosure should not be viewed as a substitute for results determined to be in accordance with GAAP, nor is it necessarily comparable to non-GAAP performance measures that may be presented by other companies.
54
A summary of return on average tangible common stockholder’s equity follows:
|
Years Ended December 31,
|
||||||||||||
|
(Dollars in thousands)
|
2010
|
2009
|
2008
|
|||||||||
|
Net (loss) income attributable to common stockholders
|
$ | (72,762 | ) | $ | (25,833 | ) | $ | 1,839 | ||||
|
Goodwill impairment
|
12,885 | 11,700 | - | |||||||||
|
Net (loss) income attributable to common stockholders (excluding goodwill impairment charge)
|
(59,877 | ) | (14,133 | ) | 1,839 | |||||||
|
Average total equity
|
$ | 94,099 | $ | 143,534 | $ | 129,083 | ||||||
|
Average preferred stock
|
37,247 | 36,818 | 3,683 | |||||||||
|
Average common equity
|
56,852 | 106,716 | 125,400 | |||||||||
|
Average goodwill and intangibles
|
3,453 | 16,193 | 25,149 | |||||||||
|
Average tangible common equity
|
$ | 53,399 | $ | 90,523 | $ | 100,251 | ||||||
|
Return on average tangible common equity
|
(112.13 | )% | (15.61 | )% | 1.83 | % | ||||||
Net Interest Income
The largest component of the Corporation’s earnings is net interest income. Net interest income is the difference between interest-earning assets (primarily loans, interest-earning deposits with banks, and investment securities) and the interest expense associated with interest-earning liabilities (deposits and borrowings). Interest earned and interest paid is affected by general economic conditions, including the demand for loans, cost of deposits, market rates of interest and government policies. The Corporation’s operations may be sensitive to changes in interest rates and the resulting impact on net interest income.
Net interest income for the year ended December 31, 2010, decreased by 15.8%, or $6.8 million, to $36.4 million from $43.3 million for the year ended December 31, 2009. The decrease was primarily due to a decline in the loan portfolio. Net interest income for the year ended December 31, 2008, was $45.9 million.
Average earning assets remained unchanged at $1.5 billion for the year ended December 31, 2010, compared to the year ended December 31, 2009. Average earning assets were $1.4 billion for the year ended December 31, 2008.
Net interest margin is net interest income expressed as a percent of average earning assets. The net interest margin for the year ended December 31, 2010, was 2.47%, compared to 2.96% for the year ended December 31, 2009. The decline in the net interest margin was largely due to the decline in the loan portfolio, lower yields earned on the securities portfolio, and an increase in average low yielding interest-earning deposits. The yield on earning assets decreased 77 basis points to 4.83% in 2010. The cost of interest-bearing liabilities decreased 32 basis points to 2.44% for the year.
55
Average Balances and an Analysis of Average Rates Earned and Paid
The following table shows average balances and interest income or interest expense, with the resulting average yield or cost by category.
|
2010
|
2009
|
2008
|
||||||||||||||||||||||||||||||||||
|
(Dollars in thousands)
|
Average
Balance
|
Interest and Dividend
|
Yield/
Cost
|
Average
Balance
|
Interest and Dividend
|
Yield/
Cost
|
Average
Balance
|
Interest and Dividend
|
Yield/
Cost
|
|||||||||||||||||||||||||||
|
Assets
|
||||||||||||||||||||||||||||||||||||
|
Interest-earning assets
|
||||||||||||||||||||||||||||||||||||
|
Residential loans
|
$ | 193,046 | $ | 9,387 | 4.86 | % | $ | 145,970 | $ | 8,027 | 5.50 | % | $ | 107,912 | $ | 6,478 | 6.00 | % | ||||||||||||||||||
|
Multifamily loans
|
91,408 | 5,625 | 6.15 | 89,399 | 5,783 | 6.47 | 48,272 | 3,367 | 6.98 | |||||||||||||||||||||||||||
|
Commercial R/E loans
|
164,252 | 10,406 | 6.33 | 169,029 | 10,872 | 6.43 | 117,510 | 7,857 | 6.69 | |||||||||||||||||||||||||||
|
R/E construction loans
|
124,993 | 6,653 | 5.32 | 244,129 | 12,105 | 4.96 | 384,410 | 25,427 | 6.61 | |||||||||||||||||||||||||||
|
Home equity/consumer loans
|
30,665 | 1,991 | 6.49 | 30,933 | 2,016 | 6.52 | 29,111 | 1,931 | 6.63 | |||||||||||||||||||||||||||
|
Business loans
|
429,391 | 28,251 | 6.58 | 469,156 | 31,036 | 6.62 | 475,716 | 32,881 | 6.91 | |||||||||||||||||||||||||||
|
Total loans (1)
|
1,033,755 | 62,312 | 6.03 | 1,148,616 | 69,839 | 6.08 | 1,162,931 | 77,941 | 6.70 | |||||||||||||||||||||||||||
|
Securities available-for-sale
|
265,773 | 7,408 | 2.79 | 209,736 | 9,137 | 4.36 | 123,177 | 6,280 | 5.10 | |||||||||||||||||||||||||||
|
Securities held-to-maturity
|
32,161 | 1,327 | 4.13 | 54,053 | 2,759 | 5.10 | 140,008 | 8,213 | 5.87 | |||||||||||||||||||||||||||
|
Interest-earning deposits in other institutions
|
146,396 | 348 | 0.24 | 48,793 | 93 | 0.19 | 8,939 | 137 | 1.53 | |||||||||||||||||||||||||||
|
Total securities and interest-earning deposits
|
444,330 | 9,083 | 2.04 | 312,582 | 11,989 | 3.84 | 272,124 | 14,630 | 5.38 | |||||||||||||||||||||||||||
|
Total interest-earning assets
|
1,478,085 | 71,395 | 4.83 | 1,461,198 | 81,828 | 5.60 | 1,435,055 | 92,571 | 6.45 | |||||||||||||||||||||||||||
|
Noninterest-earning assets
|
||||||||||||||||||||||||||||||||||||
|
Premises and equipment, net
|
13,890 | 15,223 | 15,420 | |||||||||||||||||||||||||||||||||
|
REO and other repossessed assets, net
|
32,937 | 6,556 | 1,090 | |||||||||||||||||||||||||||||||||
|
Nonperforming loans
|
80,136 | 93,972 | 20,141 | |||||||||||||||||||||||||||||||||
|
Other noninterest-earning assets
|
40,932 | 63,252 | 62,752 | |||||||||||||||||||||||||||||||||
|
Total assets
|
$ | 1,645,980 | $ | 1,640,201 | $ | 1,534,458 | ||||||||||||||||||||||||||||||
|
Liabilities and Stockholders’ Equity
|
||||||||||||||||||||||||||||||||||||
|
Interest-bearing liabilities
|
||||||||||||||||||||||||||||||||||||
|
Savings accounts
|
$ | 10,510 | $ | 26 | 0.25 | % | $ | 9,932 | $ | 25 | 0.25 | % | $ | 10,888 | $ | 53 | 0.49 | % | ||||||||||||||||||
|
Checking accounts
|
302,473 | 3,067 | 1.01 | 200,671 | 2,643 | 1.32 | 72,817 | 1,203 | 1.65 | |||||||||||||||||||||||||||
|
Money market accounts
|
129,087 | 1,115 | 0.86 | 133,005 | 1,308 | 0.98 | 297,312 | 7,311 | 2.46 | |||||||||||||||||||||||||||
|
Certificates of deposit
|
606,481 | 10,807 | 1.78 | 581,097 | 13,088 | 2.25 | 497,115 | 18,648 | 3.75 | |||||||||||||||||||||||||||
|
Total interest-bearing deposits
|
1,048,551 | 15,015 | 1.43 | 924,705 | 17,064 | 1.85 | 878,132 | 27,215 | 3.10 | |||||||||||||||||||||||||||
|
Other interest-bearing liabilities
|
||||||||||||||||||||||||||||||||||||
|
FHLB advances
|
220,370 | 9,265 | 4.20 | 243,904 | 10,584 | 4.34 | 256,898 | 10,955 | 4.26 | |||||||||||||||||||||||||||
|
Securities sold under agreements to repurchase
|
145,320 | 8,627 | 5.94 | 148,323 | 8,625 | 5.82 | 124,211 | 6,021 | 4.80 | |||||||||||||||||||||||||||
|
Junior subordinated debentures
|
18,801 | 2,047 | 10.88 | 24,512 | 2,114 | 8.62 | 26,431 | 2,120 | 8.02 | |||||||||||||||||||||||||||
|
Other borrowings
|
712 | 2 | 0.28 | 55,890 | 153 | 0.27 | 22,553 | 375 | 1.92 | |||||||||||||||||||||||||||
|
Total interest-bearing liabilities
|
1,433,754 | 34,956 | 2.44 | 1,397,334 | 38,540 | 2.76 | 1,308,225 | 46,686 | 3.57 | |||||||||||||||||||||||||||
|
Other liabilities
|
118,127 | 99,333 | 97,150 | |||||||||||||||||||||||||||||||||
|
Total liabilities
|
1,551,881 | 1,496,667 | 1,405,375 | |||||||||||||||||||||||||||||||||
|
Stockholders’ equity
|
94,099 | 143,534 | 129,083 | |||||||||||||||||||||||||||||||||
|
Total liabilities and stockholders’ equity
|
$ | 1,645,980 | $ | 1,640,201 | $ | 1,534,458 | ||||||||||||||||||||||||||||||
|
Net interest income (2)
|
$ | 36,439 | $ | 43,288 | $ | 45,885 | ||||||||||||||||||||||||||||||
|
Interest rate spread (3)
|
2.39 | % | 2.84 | % | 2.88 | % | ||||||||||||||||||||||||||||||
|
Net interest margin (4)
|
2.47 | % | 2.96 | % | 3.20 | % | ||||||||||||||||||||||||||||||
|
Average interest-earning assets to average interest-bearing liabilities
|
103.09 | % | 104.57 | % | 109.69 | % | ||||||||||||||||||||||||||||||
(1) Does not include interest or balances on loans 90 days or more past due that are classified as nonperforming.
(2) Interest and dividends on total interest-earning assets less interest on total interest-bearing liabilities.
(3) Total interest-earning assets yield less total interest-bearing liabilities cost.
(4) Net interest income as a percentage of total interest-earning assets.
56
Rate/Volume Analysis
The following table sets forth the effects of changing rates and volumes on net interest income of the Corporation. Information is provided with respect to (i) effects on net interest income attributable to changes in volume (changes in volume multiplied by prior rate); (ii) effects on net interest income attributable to changes in rate (changes in rate multiplied by prior volume); and (iii) changes in rate/volume mix (change in rate multiplied by change in volume).
|
(Dollars in thousands)
|
Year Ended December 31, 2010
Compared to
Year Ended December 31, 2009
Increase (Decrease) Due to
|
|||||||||||||||
|
Interest-earning assets
|
Rate
|
Volume
|
Mix
|
Net
|
||||||||||||
|
Residential loans
|
$ | (929 | ) | $ | 2,589 | $ | (300 | ) | $ | 1,360 | ||||||
|
Multifamily loans
|
(281 | ) | 130 | (6 | ) | (157 | ) | |||||||||
|
Commercial R/E loans
|
(164 | ) | (307 | ) | 5 | (466 | ) | |||||||||
|
R/E construction loans
|
889 | (5,907 | ) | (434 | ) | (5,452 | ) | |||||||||
|
Home equity/consumer loans
|
(8 | ) | (18 | ) | - | (26 | ) | |||||||||
|
Business loans
|
(169 | ) | (2,631 | ) | 14 | (2,786 | ) | |||||||||
|
Total loans
|
(662 | ) | (6,144 | ) | (721 | ) | (7,527 | ) | ||||||||
|
Securities available-for-sale
|
(3,291 | ) | 2,441 | (879 | ) | (1,729 | ) | |||||||||
|
Securities held-to-maturity
|
(529 | ) | (1,117 | ) | 214 | (1,432 | ) | |||||||||
|
Interest-earning deposits in other institutions
|
23 | 186 | 46 | 255 | ||||||||||||
|
Total net change in income on interest-earning assets
|
$ | (4,459 | ) | $ | (4,634 | ) | $ | (1,340 | ) | $ | (10,433 | ) | ||||
|
Interest-bearing liabilities
|
||||||||||||||||
|
Interest-bearing deposits
|
$ | 3,501 | $ | (1,876 | ) | $ | 424 | $ | 2,049 | |||||||
|
FHLB advances
|
330 | 1,021 | (32 | ) | 1,319 | |||||||||||
|
Other borrowings
|
(738 | ) | 818 | 136 | 216 | |||||||||||
|
Total net change in expenses on interest-bearing liabilities
|
$ | 3,093 | $ | (37 | ) | $ | 528 | $ | 3,584 | |||||||
|
Net (decrease) in net interest income
|
$ | (6,849 | ) | |||||||||||||
|
Year Ended December 31, 2009
Compared to
Year Ended December 31, 2008
Increase (Decrease) Due to
|
||||||||||||||||
|
Interest-earning assets
|
Rate
|
Volume
|
Mix
|
Net
|
||||||||||||
|
Residential loans
|
$ | (544 | ) | $ | 2,285 | $ | (192 | ) | $ | 1,549 | ||||||
|
Multifamily loans
|
(244 | ) | 2,869 | (209 | ) | 2,416 | ||||||||||
|
Commercial R/E loans
|
(299 | ) | 3,445 | (131 | ) | 3,015 | ||||||||||
|
R/E construction loans
|
(6,366 | ) | (9,279 | ) | 2,323 | (13,322 | ) | |||||||||
|
Home equity/consumer loans
|
(34 | ) | 121 | (2 | ) | 85 | ||||||||||
|
Business loans
|
(1,411 | ) | (453 | ) | 19 | (1,845 | ) | |||||||||
|
Total loans
|
(8,898 | ) | (1,012 | ) | 1,808 | (8,102 | ) | |||||||||
|
Securities available-for-sale
|
(914 | ) | 4,413 | (642 | ) | 2,857 | ||||||||||
|
Securities held-to-maturity
|
(1,067 | ) | (5,042 | ) | 655 | (5,454 | ) | |||||||||
|
Interest-earning deposits
|
(120 | ) | 611 | (535 | ) | (44 | ) | |||||||||
|
Total net change in income on interest-earning assets
|
$ | (10,999 | ) | $ | (1,030 | ) | $ | 1,286 | $ | (10,743 | ) | |||||
|
Interest-bearing liabilities
|
||||||||||||||||
|
Interest-bearing deposits
|
$ | 12,109 | $ | (1,217 | ) | $ | (741 | ) | $ | 10,151 | ||||||
|
FHLB advances
|
(193 | ) | 554 | 10 | 371 | |||||||||||
|
Other borrowings
|
(1,049 | ) | (1,644 | ) | 317 | (2,376 | ) | |||||||||
|
Total net change in expenses on interest-bearing liabilities
|
$ | 10,867 | $ | (2,307 | ) | $ | (414 | ) | $ | 8,146 | ||||||
|
Net increase in net interest income
|
$ | (2,597 | ) | |||||||||||||
Provision for Loan Losses
The provision for loan losses totaled $56.5 million for the year ended December 31, 2010, compared to $44.2 million for the year ended December 31, 2009, and $7.2 million for the year ended December 31, 2008.
The increase in the provision for loan losses in 2010, as compared to 2009 and 2008, is primarily attributable to the overall decline in the economy, the downturn in the regional housing market and its impact on our real estate construction, land development and completed lot portfolios and elevated levels of nonperforming loans. At December 31, 2010, nonperforming loans totaled $48.1 million, compared to $106.1 million at December 31, 2009, and $40.3 million at December 31, 2008.
57
Other Income
Other income is derived from sources other than interest and fees on earning assets. The Corporation’s primary sources of other income are service charge fees on deposit accounts, other service fees, the accretion of cash surrender value of bank owned life insurance (BOLI), fair value gains on financial instruments, gains on the sale of single-family residential loans, gains on the sale of securities, and rental income. Other income for the year ended December 31, 2010, was $18.7 million compared to $16.6 million for the year ended December 31, 2009. The increase was mostly due to an increase in gain on sale of securities, which was up $6.9 million in 2010 to $8.8 million, but was mostly offset by a decline in fair value gain on junior subordinated debentures, which was down $5.3 million in 2010 to $1.8 million. Other income for the year ended December 31, 2008, was $8.8 million.
Other Expenses
Other expense includes expenses associated with compensation and employee benefits, occupancy and equipment, FDIC insurance premiums, REO (including write-downs and losses), FHLB prepayment penalties and other operations.
Other expenses increased by $17.9 million to $52.2 million, excluding a goodwill impairment charge of $12.9 million, for the year ended December 31, 2010, from $34.3 million, excluding a goodwill impairment charge of $11.7 million and an $858,000 OTTI charge, for the year ended December 31, 2009. Other expenses were $28.5 million, excluding a $17.3 million OTTI charge, for the year ended December 31, 2008.
During the second quarter of 2010, the Corporation recorded a goodwill impairment charge of $12.9 million. The non-cash goodwill impairment represented the write-off of the remaining balance of the goodwill recorded from a prior bank acquisition. The Corporation records impairment losses as charges to other expense and adjustments to the carrying value of goodwill. During the second quarter of 2009, the Corporation determined that goodwill impairment had occurred, and at that time wrote off $11.7 million of its $24.6 million in recorded goodwill. This was the result of the significant decline in the Corporation’s stock price and market capitalization, coupled with the significant loss recorded during the quarter and in conjunction with similar declines in the value of most financial institutions.
The Corporation owned preferred shares issued by FNMA ($10.2 million of original book value) and FHLMC ($8.4 million of original book value) with a combined original book value of approximately $18.6 million. Following the placement of these two government sponsored enterprises into conservatorship, and the decline in the market value of these securities, the Corporation recorded a pre-tax OTTI charge of $17.3 million in the third quarter of 2008 and a $858,000 charge in the first quarter of 2009.
Compensation and employee benefits increased $360,000 to $14.3 million for the year ended December 31, 2010, compared to $14.0 million for the year ended December 31, 2009. Within this category, employee salary expense was down $274,000, or 2.2%, and director’s compensation expense was down $77,000, or 15.1%. These reductions were more than offset by an increase in health insurance benefits and a decline in deferred compensation which reduces total compensation expense, due to lower loan originations in 2010 as compared to 2009. FHLB prepayment penalties, associated with balance sheet restructuring transactions in the fourth quarter of 2010, totaled $4.8 million for the year ended December 31, 2010. Write-downs/losses on sales of REO increased $9.9 million to $11.4 million, FDIC insurance premiums increased $1.4 million to $4.1 million, and business insurance increased $1.3 million to $1.5 million for the year ended December 31, 2010, compared to the year ended December 31, 2009. All other expenses increased $135,000 to $16.0 million for the year ended December 31, 2010, compared to $15.9 million for the year ended December 31, 2009.
Efficiency Ratio
A standard measurement used to calculate the overhead costs of financial institutions is the efficiency ratio. The efficiency ratio is calculated by dividing other expense by total revenue, which generally indicates how much an institution spends to generate a dollar of revenue. The lower the efficiency ratio, the more efficient the institution. Management continues to look for ways to improve the
58
Non-GAAP Financial Measure – Efficiency Ratio (Excluding OTTI and Goodwill Impairment Charges)
The efficiency ratio (excluding goodwill impairment and OTTI) is determined by methods other than those in accordance with accounting principles generally accepted in the United States of America (GAAP). For the year ended December 31, 2010, 2009 and 2008, the Corporation’s efficiency ratio (excluding goodwill impairment and OTTI) was 94.60%, 57.18% and 52.05%, respectively.
The efficiency ratio calculation excludes a goodwill impairment charge of $12.9 million for the year ended December 31, 2010, an $11.7 million goodwill impairment charge and an $858,000 OTTI charge for the year ended December 31, 2009. Management believes the presentation of this financial measure, excluding the impact of these items, provides useful supplemental information that is necessary for a proper understanding of the financial results of the Corporation. This disclosure should not be viewed as a substitute for results determined to be in accordance with GAAP, nor is it necessarily comparable to non-GAAP performance measures that may be presented by other companies.
A summary of the efficiency ratio (excluding OTTI and goodwill impairment charges) follows:
|
(Dollars in thousands)
|
Years Ended December 31,
|
|||||||||||
|
2010
|
2009
|
2008
|
||||||||||
|
Total other expenses
|
$ | 65,089 | $ | 46,820 | $ | 45,806 | ||||||
|
Less OTTI
|
- | 858 | 17,338 | |||||||||
|
Less goodwill impairment charge
|
12,885 | 11,700 | - | |||||||||
|
Total other expenses (excluding OTTI and goodwill impairment charges)
|
$ | 52,204 | $ | 34,262 | $ | 28,468 | ||||||
|
Net interest income
|
$ | 36,439 | $ | 43,288 | $ | 45,885 | ||||||
|
Other income
|
18,744 | 16,629 | 8,812 | |||||||||
|
Total income
|
$ | 55,183 | $ | 59,917 | $ | 54,697 | ||||||
|
Efficiency ratio (excluding OTTI and goodwill impairment charges)
|
94.60 | % | 57.18 | % | 52.05 | % | ||||||
Liquidity and Sources of Funds
Liquidity Resources. Liquidity refers to the ability to generate sufficient cash to meet the funding needs of current loan demand, deposit withdrawals, principal and interest payments with respect to outstanding borrowings and payment of operating expenses. The need for liquidity is affected by loan demand, net changes in deposit levels and the scheduled maturities of borrowings. We monitor the sources and uses of funds on a daily basis to maintain an acceptable liquidity position. Liquidity is derived from assets by receipt of interest and principal payments and prepayments, by the ability to sell assets at market prices, earnings and by utilizing unpledged assets as collateral for borrowings.
We continue to closely monitor and manage our liquidity position, understanding that this is of critical importance in the current economic environment. At December 31, 2010, cash, interest-earning deposits and unpledged securities, as a percentage of total assets, totaled 12.6%.
In an effort to increase on-balance sheet liquidity, we have been focused on restructuring our balance sheet, and in particular, reducing the loan portfolio and increasing retail deposits. As a result, we have maintained a high level of extremely liquid interest-bearing balances totaling $127.5 million at December 31, 2010. Year-over-year, total loans decreased $205.0 million, or 17.0%. Retail deposits increased $140.9 million or 18.2% year-over-year.
59
As shown in Item 15: Consolidated Statements of Cash Flows, net cash provided by operating activities was $19.6 million for the year ended December 31, 2010. The primary source (use) of cash provided by operating activities was net (loss) income, after excluding non-cash charges such as the provision for loan losses of $56.5 million. Net cash of $98.5 million provided by investing activities consisted primarily of $101.7 million from the net reduction of loans, $578.6 million from the sales/calls of available-for-sale and held-to-maturity securities and $27.0 million from proceeds on the sale of other real estate owned; partially offset by the purchase of $618.7 million of available-for-sale and held-to-maturity securities. The $132.3 million of cash used in financing activities primarily consisted of the $32.2 million decrease in deposits and the $80.0 million net decrease in FHLB advances.
The primary objective of the Bank’s liquidity management program is to ensure that it will have adequate funds readily available at a reasonable cost to meet the financial obligations of the Bank. Potential uses of funds include new loan originations or advances against existing loan commitments, deposit withdrawals, and repayment of borrowings and other liabilities. Potential sources of funds include existing liquid assets; cash flow from operations; deposit growth; FHLB advances; repayment of existing loans; the sale of loans; and borrowings from the FRB.
To meet the Bank’s immediate liquidity needs, it maintains readily available funds in deposit accounts at the FHLB and the FRB. In addition, the Bank invests excess funds in short-term, highly liquid securities that can later be used as collateral for borrowing or sold as needed. At December 31, 2010, the Bank’s combined deposit balances at FHLB and FRB were $127.5 million, compared with $141.6 million at December 31, 2009. Unpledged investments totaled $57.9 million at December 31, 2010, compared with $19.0 million at December 31, 2009.
In addition to meeting the Bank’s funding needs using liquid assets, it has borrowed from the FHLB, the FRB, and through the use of wholesale repurchase agreements. At December 31, 2010, the Bank had $159.0 million in FHLB borrowings, plus a $40.0 million Letter of Credit that is being used to secure public funds. Based upon collateral pledged, at December 31 2010, the Bank had adequate collateral at the FHLB. The Bank has also used reverse repurchase agreements (securities sold under agreements to repurchase) as a source of funding. These agreements require the market value of investments sold under agreements to repurchase to exceed the Corporation’s repurchase obligations. At December 31, 2010, the Bank had $145.0 million in reverse repurchase agreements outstanding. The agreements have provisions that allow the lenders to periodically terminate the agreements. Termination dates typically occur once each quarter, however, a portion of the agreements may not be terminated prior to December 2012, provided the Bank offers the lender additional securities in November and December 2011. The Bank has pledged $212.9 million in securities to secure the repurchase agreements. Termination of the repurchase agreements would have little or no effect on the Bank’s liquidity because the termination would free up the $212.9 million collateral that the bank has pledged against these borrowings.
As indicated in the Corporation’s Consolidated Statement of Cash Flows, net cash from operating activities for the year ended December 31, 2010, contributed $19.6 million to liquidity, compared to $11.9 million for the year ended December 31, 2009. Also during the year ended December 31, 2010, decreases in deposits totaled $32.2 million, compared with net growth in deposits of $133.0 million during the year ended December 31, 2009.
The Corporation’s ability to service its debts and pay its obligations is generally dependent upon the availability of dividends from the Bank. The payment of dividends by the Bank is subject to limitations imposed by law and governmental regulations. The Bank is currently prohibited by regulatory order from paying any dividends to the Corporation without prior regulatory approval. As a result, the Corporation began deferring the payment of interest on the trust preferred securities and dividends on the preferred stock. The balance of deferred interest on the trust preferred securities was $2.6 million and the balance of deferred dividends on the preferred stock was $2.8 million as of December 31, 2010.
As a result of capital deficiencies, the Corporation and Bank have entered into the FDIC Order and FRB Agreement whereby the Bank must increase its capital ratios. See the section entitled “Stockholders’ Equity and Regulatory Matters” for additional details.
Interest Rate Risk Management
The Bank, like other financial institutions, is subject to interest rate risk because its interest-bearing liabilities reprice on different terms than its interest-earning assets. Management actively monitors the inherent interest rate risk for the potential impact of changes in rates on the Bank.
60
The Bank uses a simulation model as its primary tool to measure its interest rate risk. A major focus of the Bank’s asset/liability management process is to preserve and enhance net interest income in likely interest rate scenarios. Further, Cascade Bank’s Board of Directors has enacted policies that establish targets for the maximum negative impact that changes in interest rates may have on the Bank’s net interest income and the fair value of equity under certain interest rate shock scenarios. Key assumptions are made to evaluate the change to Cascade Bank’s income and capital to changes in interest rates. These assumptions, while deemed reasonable by management, are inherently uncertain. As a result, the estimated effects of changes in interest rates from the simulation model will likely be different than actual experience.
At December 31, 2010, the Bank’s balance sheet was in a “liability-sensitive” position in the less than one-year period, as the repricing characteristics were such that an increase in market rates would have a negative effect on net interest income and fair value of equity.
The individual categories of assets and liabilities that are subject to interest rate sensitivity as of December 31, 2010, are shown in the following table:
|
Interest Repricing Assumptions
|
||||||||||||||||||||||||
|
(Dollars in thousands)
|
<1 Year
|
1-5
Years
|
6-10
Years
|
> 10 Years
|
Total
|
Fair Value
|
||||||||||||||||||
|
Interest-Sensitive Assets
|
||||||||||||||||||||||||
|
Total loans (1)
|
$ | 493,186 | $ | 403,527 | $ | 39,251 | $ | 13,639 | $ | 949,603 | $ | 932,932 | ||||||||||||
|
Investments and other interest-earning assets
|
293,414 | 84,770 | 35,912 | 7,398 | 421,494 | 418,406 | ||||||||||||||||||
|
Total
|
$ | 786,600 | $ | 488,297 | $ | 75,163 | $ | 21,037 | $ | 1,371,097 | $ | 1,351,338 | ||||||||||||
|
Interest-Sensitive Liabilities
|
||||||||||||||||||||||||
|
Checking accounts (2)
|
$ | 43,068 | $ | 161,251 | $ | 23,119 | $ | 86 | $ | 227,524 | $ | 219,057 | ||||||||||||
|
Money market accounts
|
58,909 | 106,035 | - | - | 164,944 | 164,338 | ||||||||||||||||||
|
Savings accounts
|
3,840 | 8,161 | - | - | 12,001 | 11,847 | ||||||||||||||||||
|
Certificates of deposit
|
535,229 | 57,814 | - | - | 593,043 | 595,446 | ||||||||||||||||||
|
Borrowings
|
159,000 | - | 120,000 | 25,000 | 304,000 | 366,537 | ||||||||||||||||||
|
Junior subordinated debentures payable
|
15,465 | - | - | 1,500 | 16,965 | 3,021 | ||||||||||||||||||
|
Total
|
$ | 815,511 | $ | 333,261 | $ | 143,119 | $ | 26,586 | $ | 1,318,477 | $ | 1,360,246 | ||||||||||||
|
Rate gap
|
$ | (28,911 | ) | $ | 155,036 | $ | (67,956 | ) | $ | (5,549 | ) | $ | 52,620 | |||||||||||
|
Cumulative rate gap
|
(28,911 | ) | 126,125 | 58,169 | 52,620 | - | ||||||||||||||||||
|
Cumulative rate gap as a percentage of
total interest-earning assets
|
(2.11 | )% | 9.20 | % | 4.24 | % | 3.84 | % | - | % | ||||||||||||||
|
(1)
|
Excludes nonperforming loans.
|
|
(2)
|
Excludes noninterest checking.
|
To limit its interest rate risk, the Bank has sought to emphasize its loan mix towards short-term adjustable loans with rate floors. In addition, the Bank sells many of its 15 and 30 year fixed rate residential loans, except those loans generated under its Builder Sales program.
The Bank extends the maturity of its liabilities by offering long-term deposit products to customers and by obtaining longer-term other wholesale borrowings. As of December 31, 2010, the FHLB advances portfolio of $159.0 million in long-term advances had original maturities greater than one year. This portfolio consists entirely of adjustable rate advances based on the 3-month LIBOR, which reprice quarterly. The Bank has purchased a series of interest rate caps totaling $159.0 million in notional amount to manage interest rate risk on these FHLB advances. The caps are designed to protect net interest margin and stockholders’ equity from potential future rising interest rates.
Off-Balance Sheet Arrangements: Credit Commitments
Commitments to extend credit are agreements to lend to a customer as long as there is no violation of any condition established in the contract. Commitments generally have fixed expiration dates or other termination clauses and may require payment of a fee. Since many of the commitments are expected to expire without being drawn upon, the total commitment amounts do not necessarily represent future cash requirements.
The Bank underwrites standby letters of credit using its policies and procedures applicable to loans in general. Standby letters of credit are made on an unsecured and secured basis.
61
The Bank has not incurred any losses on its commitments for the year ended December 31, 2010 or 2009.
At December 31, 2010, 2009 and 2008, the following financial instruments with off-balance sheet risk were outstanding:
|
December 31,
|
||||||||||||
|
(Dollars in thousands)
|
2010
|
2009
|
2008
|
|||||||||
|
Commitments to grant loans
|
$ | 2,100 | $ | 11,145 | $ | 6,327 | ||||||
|
Unfunded commitments under lines of credit/loans in process
|
81,868 | 122,714 | 167,353 | |||||||||
|
Standby letters of credit and financial guarantees written
|
1,576 | 1,695 | 5,116 | |||||||||
|
Unused commitments on bankcards
|
13,472 | 13,621 | 13,868 | |||||||||
|
Total
|
$ | 99,016 | $ | 149,175 | $ | 192,664 | ||||||
Contractual Obligations and Commitments
The following table sets forth the Corporation’s long-term contractual obligations:
|
Payments Due Per Period
|
||||||||||||||||||||
|
(Dollars in thousands)
|
<1 Year
|
1-3 Years
|
4-5 Years
|
>5 years
|
Total
|
|||||||||||||||
|
Certificates of deposit
|
$ | 535,229 | $ | 39,479 | $ | 18,335 | $ | - | $ | 593,043 | ||||||||||
|
FHLB advances
|
- | - | 10,000 | 149,000 | 159,000 | |||||||||||||||
|
Securities sold under agreements to repurchase
|
- | - | - | 145,000 | 145,000 | |||||||||||||||
|
Operating leases
|
888 | 1,748 | 1,449 | 7,093 | 11,178 | |||||||||||||||
|
Junior subordinated debentures
|
- | - | - | 25,000 | 25,000 | |||||||||||||||
|
Total
|
$ | 536,117 | $ | 41,227 | $ | 29,784 | $ | 326,093 | $ | 933,221 | ||||||||||
Significant Concentrations of Credit Risk
Concentration of credit risk is the risk associated with a lack of diversification, such as having substantial loan concentrations in a specific type of loan within the Bank’s loan portfolio, thereby exposing the Bank to greater risks resulting from adverse economic, political, regulatory, geographic, industrial or credit developments. At December 31, 2010, the Bank’s most significant concentration of credit risk was in loans secured by real estate. These loans totaled approximately $862.3 million or 86.4% of the Bank’s total loan portfolio. Real estate construction, including land acquisition and development/land, commercial real estate, multifamily, home equity and residential loans are included in the total loans secured by real estate for purposes of this calculation. There has been deterioration in the real estate market over the last three years, which has led to a significant increase in nonperforming loans and the allowance for loan losses.
At December 31, 2010, the Bank’s most significant investment concentration of credit risk was with the U.S. Government, its agencies and Government Sponsored Enterprises. The Bank’s exposure, which results from positions in securities issued by the U.S. Government, and its agencies, and securities guaranteed by Government Sponsored Enterprises, was $296.8 million, or 99.7% of the Bank’s total investment portfolio (including FHLB stock) at December 31, 2010.
Regulatory Capital
Cascade Bank is subject to the capital adequacy requirements of the FDIC. The Corporation, as a bank holding company, is subject to the capital adequacy requirements of the FRB. Failure to meet minimum capital requirements can initiate certain mandatory and possibly additional discretionary actions by regulators that, if undertaken, could have a direct material effect on the Corporation’s consolidated financial statements. Under capital adequacy guidelines and the regulatory framework for prompt corrective action, the Corporation and the Bank must meet specific capital guidelines that involve quantitative measures of assets, liabilities and certain off-balance sheet items as calculated under regulatory accounting practices. Capital amounts and classifications are also subject to qualitative judgment by regulators about components, risk weightings, and other related factors.
The risk-based capital requirements of the FRB and the FDIC define capital and establish minimum capital requirements in relation to assets and off-balance sheet exposure, adjusted for credit risk. The risk-based capital standards currently in effect are designed to make regulatory capital requirements more sensitive to differences in risk profiles among bank holding companies and banks, to account for
62
The risk-based capital standards issued by the FRB require all bank holding companies to have a Tier 1 leverage ratio of at least 4.0% to be “adequately capitalized” and at least 5.0% to be “well-capitalized” and a total risk-based capital ratio (Tier 1 and Tier 2) of at least 8.0% of total risk-adjusted assets to be “adequately capitalized” and at least 10.0% to be “well-capitalized.” Tier 1 capital generally includes common shareholders’ equity and qualifying perpetual preferred stock together with related surpluses and retained earnings, less deductions for goodwill and various other intangibles. Tier 2 capital may consist of a limited amount of intermediate-term preferred stock, a limited amount of term subordinated debt, certain hybrid capital instruments and other debt securities, perpetual preferred stock not qualifying as Tier 1 capital, and a limited amount of the allowance for loan losses.
The FRB has also adopted guidelines which supplement the risk-based capital guidelines with a minimum ratio of Tier 1 capital to average total consolidated assets (leverage ratio) of 3.0% for institutions with well diversified risk, including no undue interest rate exposure; excellent asset quality; high liquidity; good earnings; and that are generally considered to be strong banking organizations, rated composite 1 under applicable federal guidelines, and that are not experiencing or anticipating significant growth. Other banking organizations are required to maintain a leverage ratio of at least 4.0% in order to be categorized as “adequately capitalized” and at least 5.0% to be categorized as “well-capitalized.” These rules further provide that banking organizations experiencing internal growth or making acquisitions will be expected to maintain capital positions substantially above the minimum supervisory levels and comparable to peer group averages, without significant reliance on intangible assets.
Our actual capital amounts and ratios are presented in the following table. No amount was deducted from capital for interest-rate risk exposure.
|
(Dollars in thousands)
|
Cascade Financial Corporation
(Consolidated)
|
Cascade Bank
|
||||||||||||||
|
Amount
|
Ratio
|
Amount
|
Ratio
|
|||||||||||||
|
As of December 31, 2010
|
||||||||||||||||
|
Total risk-based
|
$ | 101,209 | 9.98 | % | $ | 97,456 | 9.60 | % | ||||||||
|
Tier 1 risk-based
|
84,556 | 8.34 | 84,600 | 8.58 | ||||||||||||
|
Tier 1 leverage
|
84,556 | 5.55 | 84,600 | 5.56 | ||||||||||||
|
As of December 31, 2009
|
||||||||||||||||
|
Total risk-based
|
$ | 158,882 | 12.82 | % | $ | 153,750 | 12.40 | % | ||||||||
|
Tier 1 risk-based
|
143,264 | 11.56 | 138,150 | 11.14 | ||||||||||||
|
Tier 1 leverage
|
143,264 | 8.62 | 138,150 | 8.32 | ||||||||||||
The minimum amounts of capital and ratios as established by banking regulators are as follows:
|
(Dollars in thousands)
|
Cascade Financial Corporation
(Consolidated)
|
Cascade Bank
|
||||||||||||||
|
Amount
|
Ratio
|
Amount
|
Ratio
|
|||||||||||||
|
As of December 31, 2010
|
||||||||||||||||
|
Total risk-based
|
$ | 81,149 | 8.00 | % | $ | 81,213 | 8.00 | % | ||||||||
|
Tier 1 risk-based
|
40,574 | 4.00 | 40,606 | 4.00 | ||||||||||||
|
Tier 1 leverage
|
60,958 | 4.00 | 60,902 | 4.00 | ||||||||||||
|
As of December 31, 2009
|
||||||||||||||||
|
Total risk-based
|
$ | 99,124 | 8.00 | % | $ | 99,205 | 8.00 | % | ||||||||
|
Tier 1 risk-based
|
49,562 | 4.00 | 49,603 | 4.00 | ||||||||||||
|
Tier 1 leverage
|
66,485 | 4.00 | 66,425 | 4.00 | ||||||||||||
We are subject to capital adequacy guidelines of the FDIC at the bank level that are substantially similar to the FRB guidelines. Although current regulatory guidelines state that a financial institution must have a total risk-based capital ratio of 10.0%, a Tier 1 risk-based capital ratio of 6.0%, and a Tier 1 leverage ratio of 5.0% to be considered “well-capitalized” in accordance with the regulations, the
63
Because of recent losses experienced by the Corporation and the Bank’s requirement for additional capital to meet these higher ratios, there is a need for the Corporation to raise additional capital. Since hiring a highly qualified investment firm in December of 2009, the Board and management have investigated various alternatives to raise capital. As a result of those efforts, on March 4, 2011, the Corporation announced that it has agreed to be acquired by Opus Bank. Opus Bank is a California-chartered bank with its executive offices located in Irvine, California. The terms of the merger agreement provide for Opus Bank to acquire the Corporation and the Bank, and for the merger of the Bank into Opus Bank. Under the terms of the merger agreement, our common shareholders will receive $5.5 million cash, or approximately $0.45 per share. In addition, Opus Bank has offered to purchase $39.0 million of the Corporation’s preferred stock and the associated warrant issued to the U.S. Treasury (the Treasury) under the Capital Purchase Program for $16.25 million in cash. Consummation of the merger is subject to approval by regulatory authorities, approval by our shareholders at a special shareholder meeting expected in June of 2011, and certain other conditions set forth in the agreement. The merger is expected to close in the latter part of the second quarter of 2011. Notwithstanding this, there are no assurances that the Corporation, the Bank and Opus Bank will be able to successfully close the proposed merger.
ITEM 7A. QUANTITATIVE AND QUALITATIVE DISCLOSURES ABOUT MARKET RISK
Asset and Liability Management Activities
The Bank’s Asset/Liability Management Committee (ALCO) has the responsibility to measure and monitor interest rate risk, the liquidity position, and capital adequacy. The Bank uses a variety of tools to measure, monitor, and manage interest rate risk. The Finance Committee of the Board of Directors reviews the interest rate risk management activities of the Bank on a regular basis and has established policies and guidelines on the amount of risk deemed acceptable. The impact on the Bank’s net interest income and the fair value of its capital are modeled under different interest rate scenarios. The Board, through the Asset/Liability Management Policy, has established guidelines for the maximum negative impact that changes in interest rates have on the Bank’s net interest income and the fair value of equity under certain interest rate shock scenarios. Cascade Bank uses a simulation model to measure rate risk, the impact on net interest income and the fair value of equity. In general, the Bank seeks to manage its rate risk through its balance sheet. The Bank focuses on originating more interest rate sensitive assets, such as variable-rate loans, while reducing its long-term, fixed-rate assets through the sale of long-term residential mortgages in the secondary market. The vast majority of the loans that the Bank keeps in its portfolio have rate repricing periods of five years or less, except for those loans generated under the Bank’s Builder Sales program during the last two years.
See the Interest Rate Risk Management section in the Management’s Discussion and Analysis of Financial Condition and Results of Operations included in Item 7 of this report.
ITEM 8. FINANCIAL STATEMENTS AND SUPPLEMENTARY DATA
The following consolidated financial statements are contained in Part IV, Item 15 of this report and are incorporated herein by reference.
Report of Independent Registered Public Accounting Firm
Consolidated Financial Statements
|
a)
|
Consolidated Balance Sheets at December 31, 2010, and December 31, 2009.
|
|
b)
|
Consolidated Statements of Operations for the years ended December 31, 2010, 2009 and 2008.
|
|
c)
|
Consolidated Statements of Stockholders’ Equity for the years ended December 31, 2010, 2009 and 2008.
|
|
d)
|
Comprehensive Income for the years ended December 31, 2010, 2009 and 2008.
|
|
e)
|
Consolidated Statements of Cash Flows for the years ended December 31, 2010, 2009 and 2008.
|
|
f)
|
Notes to Consolidated Financial Statements.
|
64
ITEM 9. CHANGES IN AND DISAGREEMENTS WITH ACCOUNTANTS ON ACCOUNTING AND FINANCIAL DISCLOSURE
None.
ITEM 9A. CONTROLS AND PROCEDURES
|
|
(a)
|
Evaluation of Disclosure Controls and Procedures: An evaluation of the Corporation's disclosure controls and procedures (as defined in section 13(a) - 14(c) of the Securities Exchange Act of 1934 (the Act)) was carried out under the supervision and with the participation of the Corporation's Chief Executive Officer, Chief Financial Officer and several other members of the Corporation's senior management effective December 31, 2010. The Corporation's Chief Executive Officer and Chief Financial Officer concluded that the Corporation's disclosure controls and procedures as currently in effect are effective in ensuring that the information required to be disclosed by the Corporation in the reports it files or submits under the Act is (i) accumulated and communicated to the Corporation's management (including the Chief Executive Officer and Chief Financial Officer) in a timely manner, and (ii) recorded, processed, summarized and reported within the time periods specified in the Security and Exchange Commission’s (the SEC’s) rules and forms.
|
|
|
(b)
|
Changes in Internal Controls: In the year ended December 31, 2010, the Corporation did not make any significant changes in, nor take any corrective actions regarding, its internal controls or other factors that could significantly affect these controls.
|
Disclosure Controls and Internal Controls. Disclosure controls are procedures that are designed with the objective of ensuring that information required to be disclosed in the Corporation's reports filed under the Act is recorded, processed, summarized and reported within the time periods specified in the SEC’s rules and forms. Disclosure controls are also designed with the objective of ensuring that such information is accumulated and communicated to our management, as appropriate to allow timely decisions regarding required disclosure. Internal controls are procedures which are designed with the objective of providing reasonable assurance that (1) transactions are properly authorized; (2) assets are safeguarded against unauthorized or improper use; and (3) transactions are properly recorded and reported, all to permit the preparation of financial statements in conformity with generally accepted accounting principles.
Limitations on the Effectiveness of Controls. The Corporation's management does not expect that our disclosure controls or our internal controls will prevent all errors and all fraud. A control system, no matter how well conceived and operated, can provide only reasonable, not absolute, assurance that the objectives of the control system are met. Further, the design of the control system must reflect the fact that there are resource constraints, and the benefits of controls must be considered relative to their costs. Because of the inherent limitations in all control systems, no evaluation of controls can provide absolute assurance that all control issues and instances of fraud, if any, within the Corporation have been detected. These inherent limitations include the realities that judgments in decision-making can be faulty, and that breakdowns can occur because of simple error or mistake. Additionally, controls can be circumvented by the individual acts of some persons, by collusion of two or more people, or by management override of the control. The design of any system of controls also is based in part upon certain assumptions about the likelihood of future events, and there can be no assurance that any design will succeed in achieving its stated goals under all potential future conditions; over time, controls may become inadequate because of changes in conditions, or the degree of compliance with the policies or procedures may deteriorate. Because of the inherent limitations in a cost-effective control system, misstatements due to error or fraud may occur and not be detected.
Management’s Report on Internal Control over Financial Reporting. Management of Cascade Financial Corporation is responsible for preparing the Corporation’s annual financial statements. Management is also responsible for establishing and maintaining effective internal control over financial reporting presented in conformity with the accounting principles generally accepted in the United States of America and regulatory reporting in conformity with the Federal Financial Institutions Examination Council Instructions for Consolidated Reports of Condition and Income (call report instructions). The Corporation’s internal controls contain monitoring mechanisms and actions are taken to correct deficiencies identified.
There are inherent limitations in the effectiveness of any internal control, including the possibility of human error and the circumvention or overriding of controls. Accordingly, even effective internal control can provide only reasonable assurance with respect to financial statement preparation. Further, because of changes in conditions, the effectiveness of internal control may vary over time.
65
It is also management’s responsibility to ensure satisfactory compliance with all designated laws and regulations, and in particular, those laws and regulations concerning loans to insiders and dividend restrictions.
Management assessed the Corporation’s internal control over financial reporting presented in conformity with both U.S. generally accepted accounting principles and call report instructions as of December 31, 2010. This assessment was based on criteria for effective internal control over financial reporting described in Internal Control—Integrated Framework issued by the Committee of Sponsoring Organizations of the Treadway Commission. Based on this assessment, management believes that, as of December 31, 2010, the Corporation maintained effective internal control over financial reporting presented in conformity with both accounting principles generally accepted in the United States of America and call report instructions. Management also believes that there was satisfactory compliance during 2010 with the designated laws and regulations.
The Corporation’s registered public accounting firm has audited the Corporation’s consolidated financial statements as of and for the year ended December 31, 2010 that are included in this annual report and issued their Report of Independent Registered Public Accounting Firm, listed in Item 15, which includes an attestation report on the Corporation’s internal control over financial reporting. The attestation report expresses an unqualified opinion on the effectiveness of the Corporation’s internal controls over financial reporting as of December 31, 2010.
ITEM 9B. OTHER INFORMATION
None.
PART III
ITEM 10. DIRECTORS, EXECUTIVE OFFICERS AND CORPORATE GOVERNANCE
Directors
The Corporation’s directors and their ages and biographical information, as of December 31, 2010, are as follows:
|
Name
|
Age
|
Position
|
Term Ending
|
|
Richard L. Anderson, C.P.A.
|
56
|
Director
|
2013
|
|
David W. Duce
|
51
|
Director
|
2014
|
|
Marion “Robin” Foote
|
65
|
Director
|
2013
|
|
Jim Gaffney
|
59
|
Director
|
2011
|
|
Janice E. Halladay
|
67
|
Director
|
2013
|
|
Arnold Hofmann
|
66
|
Director
|
2014
|
|
Dennis R. Murphy, Ph.D.
|
69
|
Director
|
2012
|
|
Carol K. Nelson
|
54
|
Director
|
2014
|
|
David R. O’Connor
|
65
|
Director
|
2014
|
|
Thomas Rainville
|
80
|
Director
|
2013
|
|
Christian Sievers
|
75
|
Director
|
2012
|
|
Ron Thompson
|
61
|
Director
|
2012
|
|
Brandt Westover
|
50
|
Director
|
2012
|
There are no family relationships among or between the directors listed above.
66
RICHARD L. ANDERSON has served as a director since 2004. He serves as Chair of the Audit Committee and is a member of the Loan Committee and the Executive Committee. He has been determined by the Board to be the “audit committee financial expert” as defined under SEC rules. Mr. Anderson is a Certified Public Accountant and a principal with Hascal, Sjoholm & Company, PLLC, an Everett-based accounting firm at which he has been employed since 1976. He is an experienced leader on numerous community boards. He has held board positions with a wide range of civic and community groups, including the Greater Everett Community Foundation, Everett Public Facilities District, Compass Health, the Everett Public Library, Arts United and Big Brothers/Big Sisters of Snohomish County, among others. Mr. Anderson received a Bachelor of Arts Degree in Business Administration with an emphasis in accounting from Washington State University in 1976 and earns continuing professional education credits specific to bank audit, ALCO and directorship sponsored by the American Institute of Certified Public Accountants and the Washington Society of CPAs. Mr. Anderson has extensive experience in accounting, taxation, strategic planning, auditing, financial statements, and capital management. His strong presence in the Everett community remains key to the retention and growth of both customer and shareholder relationships.
DAVID W. DUCE has served as a director since 1991. He serves as Vice Chair of the Board of Directors, Chair of the Corporate Governance and Nominating Committee, and Vice Chair of the Compensation Committee and the Executive Committee. He served as Chair of the Board from May 2004 to May 2008. He is a partner in the Everett, Washington based law firm of Duce Bastian Peterson where he has practiced law since 1985. Mr. Duce’s qualifications include a Juris Doctor degree, magna cum laude, from Pepperdine University School of Law in 1984. He is an “AV Rated” attorney, by Martindale-Hubbell, the highest rating possible for both legal skill and integrity. He is a past Chair of the Professional Negligence Section of the Washington State Association for Justice and has served for more than 10 years as an arbitrator for cases brought before the Snohomish County Superior Court. Mr. Duce’s skills include organizational, leadership and interpersonal. He brings his substantial legal skills as well as his long history of service to the Company to the Board.
MARION R. FOOTE has served as a director since 2010. She serves as a member of the Finance Committee and the Corporate Governance and Nominating Committee. Ms. Foote has over 28 years of experience in the banking industry, including a 16 year career in commercial banking, holding senior executive level positions at First Chicago/NBD (now part of JP Morgan Chase) and Bank of America. She has over 12 years of experience as a Managing Director in firms specializing in consulting with financial services companies in the areas of deposit growth, improving market share and increasing customer profitability. Since 2005, Ms. Foote has served as a Managing Director for Novantas, LLC, an international company headquartered in New York, where she also serves as the firm’s senior marketing partner. Ms. Foote’s financial services and banking experience provides valuable insights and perspective to the Board. She has held board positions with a wide range of business, civic and community groups, including current service as a director of Saturna Trust Company, a subsidiary of Saturna Capital, headquartered in Bellingham, Washington. Ms. Foote also serves as a Board Member and Treasurer of St. Joseph’s Hospital Foundation, Bellingham, Washington. She is an advisory director of privately-held Diacor, Inc. She is a former director of CFSBdirect (now part of E*Trade) and chaired its Audit and Compensation Committee while it had public ownership. Ms. Foote’s qualifications include a Bachelor of Arts degree in the Economics Honors Program at Smith College, where she graduated magna cum laude, Phi Beta Kappa in 1967 and a Masters in Business Administration from Harvard Business School where she graduated with High Distinction as a Baker Scholar in 1969.
JIM GAFFNEY has served as a director since 2006. He serves as a member of the Compensation Committee and the Loan Committee. Mr. Gaffney has more than 36 years of management and business ownership experience in commercial construction and real estate and land development as the owner/president and founder of Gaffney Construction, Inc. Based in Everett, Washington the firm has built a wide range of projects in the Northwest including bank, office, retail and nonprofit facilities. Mr. Gaffney is an experienced leader on numerous community boards, which included serving 20 years as a board member of the Boys & Girls Club of Snohomish County.
JANICE E. HALLADAY has served as a director since 1999. She serves as Chair of the Compensation Committee and is a member of the Loan Committee and the Executive Committee. Ms. Halladay brings knowledge of all aspects of bank operations as well as organization, leadership and interpersonal skills to her role as a director. She is a retired banking executive with more than 20 years of experience in the banking industry, including six years as a senior executive with Pioneer Bank. She most recently served as office manager for Moss Adams LLP. In addition, Ms. Halladay is an experienced leader on numerous non-profit community boards. She served as Chair of the Hospital Governance Board Committee of the Washington State Hospital Association and as an Ex-Officio member of the Board of Trustees for the Washington State Hospital Association. She served as the Chair of the Board of Directors of Providence Regional Medical Center Everett. She is a member of the
67
ARNOLD HOFMANN has served as a director since 2010. He serves as a member of the Compensation Committee and the Loan Committee. He was formerly a director of the American First National Bank in Everett, which was acquired by Cascade Bank in 1997. He has been the owner and developer of various multi-family and commercial properties in Everett, Edmonds and Seattle, Washington since 1977. He was a U.S. Navy Supply Corps Officer from 1968 to 1988, retiring at the rank of Commander. As a Naval Officer, Mr. Hofmann’s responsibilities included business planning, budgeting, contracting, and oversight of construction and maintenance projects. Mr. Hofmann brings logistical expertise and extensive knowledge of the local real estate industry to the Board. He is a graduate of Everett High School and the University of Washington, where he received a degree in Business Administration and a major in Finance in 1968.
DENNIS R. MURPHY has served as a director since 1991. He serves as Chair of the Board of Directors and Chair of the Executive Committee, and is Vice Chair of the Finance Committee. He is the past Audit and Finance Committee Chair. Dr. Murphy has substantial senior managerial experience in large organizations including Indiana University and Emory University. He is currently the Dean Emeritus of the College of Business and Economics and a Professor at Western Washington University. He was the past Provost and had a distinguished career as Dean of the College of Business and Economics for 25 years. He is an experienced leader on numerous community boards, which includes serving as a current Board member of the Economic Advisors of Saturna Capital. He is a past Board member and Chair of the Audit and Finance Committee of Northwest Medical Bureau, past Audit Committee Chair of Western Washington Foundation and past President of United Way of Whatcom County. Dr. Murphy holds a Ph.D. in Economics, which he received from Indiana University in 1974. Dr. Murphy’s extensive academic experience brings a different perspective to the Board.
CAROL K. NELSON. See biography below under “Executive Officers.”
DAVID R. O’CONNOR has served as a director since 1997. He serves as Chair of the Loan Committee and is a member of the Audit Committee and Executive Committee. Mr. O’Connor has over 35 years of experience in land development and construction management. He is co-owner of Mobile Country Club in Everett, Washington since 1993 and was previously a co-owner of O’Connor & Oehler Construction, Inc. from 1974 to 1996. Mr. O’Connor was formerly a bank director of American First National Bank for more than 13 years until it was acquired by Cascade in 1997.
THOMAS H. RAINVILLE has served as director since 2010. He serves as a member of the Audit Committee and the Finance Committee. After beginning his banking career in Montana, Mr. Rainville was recruited by the Bank of Everett, where he was elected to its Board of Directors and served as Executive Vice President and Chief Executive Officer, a position he held until the Bank of Everett merged into Rainier National Bank, where he served as a Senior Vice President. He left that position to found American First National Bank in Everett, where he served as President, Chairman and CEO until that bank was acquired by Cascade Bank in 1997. He was a founding director of the Northwest Intermediate Banking School, a founding director of the Washington Independent Bankers’ Association (where he served as President), and served as State Director of the Independent Bankers’ Association of the America. Mr. Rainville’s extensive management experience in the banking industry, as well as his community involvement in the banking industry, provides valuable input to the Board. Mr. Rainville has served on numerous Boards, including the Everett Area Chamber of Commerce, United Way of Snohomish County, the Everett YMCA, the Everett General Hospital Foundation, Everett Providence Hospital, and local chapters of Big Brothers Big Sisters, the Boy Scouts, the American Red Cross, the American Cancer Society and Junior Achievement, among others. He is a past president of the Rotary Club of Everett and a past District Governor of Rotary International. He is currently an elected Commissioner of the Mukilteo Water and Wastewater District and a member of the Finance Council of the Archdiocese of Seattle. Mr. Rainville received a degree in Business Administration with an accounting major from the University of Montana in 1959, and is a 1972 graduate of the Pacific Coast Banking School.
CHRISTIAN H. SIEVERS has served as director since 2010. He serves as a member of the Loan Committee and the Corporate Governance and Nominating Committee. He spent 16 years (1985-2001) as Senior Vice President and Managing Director of ABN AMRO-Seattle. ABN was one of the worlds’ largest banks, headquartered in Amsterdam, with offices in over 90 countries. Its customer base was primarily Fortune 500 companies. Mr. Sievers is currently an executive officer of H&H Properties, developer of the Useless Bay Colony and the Useless Bay Golf and Country Club on South Whidbey Island, a development which encompasses over 800 acres. He also manages personal real estate holdings. Prior to ABN AMRO, Mr. Sievers spent four years as a Vice President at Seafirst/Bank of America, handling the bank’s largest customers in the Pacific Northwest. Prior to that, he spent fourteen years with Pacific National Bank/First Interstate, becoming Vice President and Manager of the
68
RONALD E. THOMPSON has served as a director since 1991. He serves as Vice Chair of the Board of Directors and serves as Vice Chair of the Loan Committee, the Audit Committee and the Executive Committee. Mr. Thompson has over 30 years of experience as a Real Estate Broker specializing in residential, commercial and property management, and 10 years experience in savings & loan and commercial banking. Since 1984 he has been the owner and President of Windermere Commercial NW, Windermere Property Management NW and Turnkey Repair and Maintenance Divisions of Windermere Real Estate/Realty Brokerage, Inc. in Everett, Washington. This company provides full service commercial real estate brokerage, property management and property maintenance services. Mr. Thompson is an experienced leader on numerous non-profit community boards. He is a past president of the Snohomish County-Camano Association of Realtors, a past state director of the Washington Association of Realtors and has served on the Boards of the Mount Baker Council Boy Scouts of America, the Providence Hospital Foundation and the Everett Golf and Country Club. He is a Board member and past President for the Mukilteo Lacrosse Club.
G. BRANDT WESTOVER has served as a director since 1986. He serves as Chair of the Finance Committee, Vice Chair of the Corporate Governance and Nominating Committee and a member of the Executive Committee. Mr. Westover has over 24 years of experience in the financial services field, with a specific focus on financial market, risk, investment and banking experience. He is currently the Managing Director and Market Area Manager for UBS Financial Services, Inc. in Seattle, Washington, a position he has held since 2003. Prior to this position, he was a corporate Vice President and Branch Manager for UBS-Paine Webber in Bellevue, Washington from 1996 to 2002. Mr. Westover is an experienced leader on numerous community boards and organizations and currently coaches youth baseball and basketball. He is a past trustee of the University of Washington Alumni Association and a Board member of the Seattle Symphony. He received a Bachelor’s degree in Business Administration from the University of Washington in 1983 and he graduated from the Wharton School’s Securities Institute advanced course work program.
Board Committees and Meetings
During the year ended December 31, 2010, the Board held 15 regular meetings. The Board has an Executive Committee, an Audit Committee, a Finance Committee, a Compensation Committee, a Corporate Governance and Nominating Committee, and a Loan Committee, which is a committee of the Bank only.
Executive Committee. The Executive Committee consists of the CEO, the Chair and Vice Chair of the Board, and the Chairs of the Board’s committees, and has authority to generally act for the full Board.
Audit Committee. Formerly known as the Audit and Finance Committee, the duties of this committee were assigned to two separate committees, the Audit Committee and the Finance Committee, in 2009. The Audit Committee is responsible to the Board for the areas of audit and compliance, risk assessment and technology management. The Committee operates under a charter approved by the Board. The Audit Committee Charter is posted on the Bank’s website at www.cascadebank.com. The Committee is responsible for the appointment, compensation and oversight of the external auditor. The Committee provides direction and oversight to the internal audit department and reviews the examination of the Bank by federal regulatory authorities. The Committee also reviews the financial statements and filings. The Board has affirmatively determined that none of the members of the Audit Committee have a material relationship with the Corporation that would interfere with the exercise of independent judgment and all current members of the Audit Committee are “independent” directors within the meaning of both the NASDAQ and Securities and Exchange Commission (SEC) rules. The Board has determined that Richard L. Anderson is the “audit committee financial expert” as defined under SEC rules.
Finance Committee. This committee of the Board formed in 2009, focuses on the oversight of functions previously under the purview of the Audit and Finance Committee. The Finance Committee is responsible to the Board for the areas of asset and liability management, investments and financial strategy. The Committee operates under a charter approved by the Board. The Finance Committee Charter is posted on the Bank’s website at www.cascadebank.com. All current members of the Finance Committee are “independent” directors within the meaning of both the NASDAQ and Securities and Exchange Commission (SEC) rules.
69
Compensation Committee. The Compensation Committee, composed entirely of independent directors, is responsible for establishing and reviewing the compensation and employee benefit policies of the Corporation and the Bank. The Committee approves compensation of executive officers, and awards stock options and restricted stock, in accordance with the Corporation’s 2003 Long-Term Incentive Plan and established Board policies. The Committee operates under a charter approved by the Board. The charter is posted on the Bank’s website at www.cascadebank.com. The Corporation will also provide a copy of the charter to shareholders upon request.
Loan Committee. The Loan Committee is a Bank committee that reviews and approves loans in excess of the limits established for the Bank’s Management Loan Committee. Included in that review are all extensions of credit to borrowers whose aggregate borrowing levels exceed the limits placed on the Management Loan Committee. The Loan Committee also reviews loans that do not conform to the Bank’s Loan Policy. During 2009, this Committee’s role was expanded to include increased oversight of the Bank’s lending functions, including risk segmentation analysis of concentrations of credit risk identified by product type, geographic distribution, underlying collateral or other asset groups.
Corporate Governance and Nominating Committee. The Corporate Governance and Nominating Committee reviews and assesses the composition of the Board and oversees an annual evaluation of the Board and its committees; takes the lead in identifying potential candidates to serve as Board members; recommends director candidates to the Board; reviews and recommends appropriate director compensation; and provides leadership with respect to corporate governance. The Committee is responsible for establishing criteria for director eligibility; procedures for nominating directors, including director nominations from shareholders and timelines for the nomination process; as well as nominating the Chair and Vice Chair of the Board. Only independent directors serve on this Committee. The Committee operates under a charter approved by the Board. The charter is posted on the Bank’s website at www.cascadebank.com. The Corporation will also provide a copy of the charter to shareholders upon request.
The Board and its committees may retain outside advisors as they determine necessary to fulfill their responsibilities. All committees report their activities to the full Board.
The directors of the Corporation also serve as directors of Cascade Bank, the only operating subsidiary of the Corporation. Other than the Loan Committee, Cascade Bank has parallel committees and committee assignments.
Nomination Procedures
There have been no material changes to the procedures by which our shareholders may recommend nominees to the Board of Directors during our last fiscal year.
Executive Officers
The following table sets forth information with respect to the executive officers of the Corporation and the Bank:
|
Name
|
Age (a)
|
Position
|
|
Carol K. Nelson (b)
|
54
|
President, Chief Executive Officer and Director of Cascade Bank and Cascade Financial Corporation
|
|
Debra L. Johnson (b)
|
52
|
Executive Vice President, Chief Financial Officer
|
|
Robert G. Disotell
|
56
|
Executive Vice President, Chief Credit Officer
|
|
Steven R. Erickson
|
55
|
Executive Vice President, Commercial Banking
|
|
LeAnne M. Harrington
|
41
|
Executive Vice President, Chief Administrative Officer
|
|
Debbie E. McLeod
|
45
|
Executive Vice President, Retail Banking
|
(a) At December 31, 2010.
(b) Officer of the Corporation and Bank.
70
The principal occupation of each executive officer of the Corporation and Bank is set forth in the Proxy Statement or below. There are no family relationships among or between the executive officers listed above.
CAROL K. NELSON was appointed Chief Executive Officer of the Corporation commencing May 1, 2002. She has served as President of the Corporation and President and Chief Executive Officer of the Bank since February 2001. She was previously Senior Vice President and Northern Region Executive of Bank of America from 1996 to 2001. Ms. Nelson holds a Bachelor’s degree in Business Finance and a Master’s degree in Business Administration from Seattle University. Ms. Nelson serves as a Director and past Chair of the Board of the Washington Bankers Association, Volunteers of America Western Washington and Premera Blue Cross. She is a past member of the Boards of Directors of the Seattle Branch of the Federal Reserve Bank of San Francisco, the Washington Roundtable and the Washington State Major League Baseball Stadium Public Facilities District. She also serves as a trustee for Seattle University. In 2007, Ms. Nelson was appointed to chair the Governor’s Task Force on Homeowner Security. Ms. Nelson serves as Vice Chair of the Corporation’s Executive Committee and as a member of the Bank’s Loan Committee. She is a resident of Edmonds, Washington.
DEBRA L. JOHNSON joined the Bank in February 2010 as a consultant and in July 2010, was appointed to Executive Vice President and Chief Financial Officer. Ms. Johnson also serves as Secretary for the Corporation. Ms. Johnson has over 25 years of senior executive level experience in the financial services industry and was previously employed by HomeStreet Bank in Seattle, Washington, where she served as Executive Vice President and Chief Financial Officer. She currently serves as a member of the Board for the Coal Creek Family YMCA. Ms. Johnson is a member of the American Institute of Certified Public Accountants and the Washington State Society of CPA’s. She is a 1999 graduate of Pacific Coast Banking School and a 1980 graduate of Western Washington University, where she received a Bachelor’s degree in Business with a concentration in Accounting. Ms. Johnson is a resident of Bellevue, Washington.
ROBERT G. DISOTELL has been employed by Cascade Bank since 1977 and has served as Executive Vice President of the Credit Administration Division and Chief Credit Officer since February 2001. He is responsible for managing Credit Underwriting, Special Assets, Loan Servicing and Credit Operations including overseeing the credit quality of the Bank’s loan portfolios. Mr. Disotell has managed a variety of business groups in his tenure at Cascade Bank, including Mortgage Banking, Secondary Marketing, Retail Banking, and Community Reinvestment Act (CRA) activities. Mr. Disotell is a 1976 graduate of Washington State University with a degree in Communications and is a resident of Arlington, Washington.
STEVEN R. ERICKSON has served as the Executive Vice President and Commercial Banking Executive for the Bank since November 12, 2008. He is responsible for managing commercial and income property lending. Mr. Erickson joined Cascade Bank in 1978. He is a member of the Board for Big Brothers, Big Sisters of Snohomish County, Advisory Board Member for Snohomish County’s Pre-Diversion Program, and past board member of the Boys & Girls Club of Snohomish County. He is a resident of Marysville, Washington.
LEANNE M. HARRINGTON has served as the Executive Vice President and Chief Administrative Officer for the Bank since February 16, 2001. She has 24 years of banking experience, starting with Rainier Bank and Bank of America, where she served as Vice President and Northern Region Service Manager. Ms. Harrington joined Cascade Bank in February 2001. She is a 2006 graduate of Pacific Coast Banking School and is Chair of the Board for the Snohomish County Red Cross. Ms. Harrington is a resident of Everett, Washington.
DEBBIE E. McLEOD has served as the Executive Vice President of Retail Banking for the Bank since February 26, 2001. Ms. McLeod joined Cascade Bank in February 2001. She has over 20 years of commercial banking experience and was previously Vice President and Northern Region Sales Manager for Bank of America. Ms. McLeod is the Board Secretary for United Way of Snohomish County and is a past Board Chair. She also serves on the Board for United Way of Skagit County. Ms. McLeod is a 2009 graduate of Pacific Coast Banking School and a 1988 graduate of Pacific Lutheran University with a degree in Business Administration. She resides in Burlington, Washington.
Standards of Conduct
The Board has adopted Standards of Conduct for employees, officers and directors, which include a “code of ethics” as defined by Item 406 of the Regulation S-K. These Standards of Conduct apply to the members of the Board of Directors and all of the Corporation’s employees, including the Corporation’s Chief Executive Officer and Chief Financial Officer. The Corporation will provide a copy of the Standards of Conduct to shareholders upon request.
71
Compliance with Section 16(a) of the Exchange Act
Based upon a review of reports and written representations furnished to it, the Corporation believes that during fiscal year 2010, all filings with the Securities and Exchange Commission by its executive officers, directors and 10% or greater shareholders timely complied with requirements for reporting ownership and changes in ownership of the Corporation’s common stock pursuant to Section 16(a) of the Securities Exchange Act of 1934, with the exception of a Form 4 which one of our directors, Jim Gaffney, inadvertently failed to file for the sale by his broker of 1,625 shares on April 27, 2010. The Form 4 was filed promptly upon discovery of the mistake on March 10, 2011. This information in this section is based solely upon a review of Forms 3, Forms 4, and Forms 5 we have received.
ITEM 11. EXECUTIVE COMPENSATION
The following summary compensation table sets forth information concerning compensation for services rendered in all capacities during our past two fiscal years awarded to, earned by or paid to each of the following individuals. Salary and other compensation for these officers are set by the Compensation Committee of the Board of Directors.
|
Summary Compensation Table
|
|||||||||||||||||||||||||||||||||
|
Name and Principal Position
|
Year
|
Salary
($)
|
Bonus/ Incentive
($)
|
Stock Awards
($)
|
Option Awards
($)
|
Non-Equity Incentive Plan
Compensation
($)
|
Change in Pension Value & Nonqualified Deferred Compensation Earnings
($)
|
All Other Compensation
($)
|
Total
($)
|
||||||||||||||||||||||||
|
(a)
|
(b)
|
(c)
|
(d)
|
(e)
|
(f)
|
(g)
|
(h)
|
(i)
|
(j)
|
||||||||||||||||||||||||
|
Carol K. Nelson
|
2010
|
$ | 262,910 | $ | - | $ | - | $ | - | $ | - | $ | - | $ | 11,960 | $ | 274,870 | ||||||||||||||||
|
President & CEO
|
2009
|
262,910 | - | - | - | - | - | 14,400 | 277,310 | ||||||||||||||||||||||||
|
Steven R. Erickson
|
2010
|
$ | 174,636 | $ | - | $ | - | $ | - | $ | - | $ | - | $ | 1,783 | $ | 176,419 | ||||||||||||||||
|
EVP, Commercial Banking
|
2009
|
174,636 | - | - | - | - | - | 6,000 | 180,636 | ||||||||||||||||||||||||
|
Robert G. Disotell
|
2010
|
$ | 156,265 | $ | - | $ | - | $ | - | $ | - | $ | - | $ | 228 | $ | 156,493 | ||||||||||||||||
|
EVP, Chief Credit Officer
|
2009
|
156,265 | - | - | - | - | - | 2,149 | 158,414 | ||||||||||||||||||||||||
|
|
Column
|
|
(i)
|
All Other Compensation for calendar year 2010 includes the following: for Ms. Nelson, employer contribution to 401(k) Plan of $3,560 and a car allowance of $8,400; for Mr. Erickson, employer contribution to 401(k) Plan of $1,783; and for Mr. Disotell, employer contribution to 401(k) Plan of $228.
|
72
|
Outstanding Equity Awards
at December 31, 2010
|
||||||||||||||||||||||||||||
|
Option Awards
|
Stock Awards
|
|||||||||||||||||||||||||||
|
Name
|
Date
when Equity Fully Vests
|
Number of
Securities
Underlying Unexercised
Options
(#)
Exercisable
(Vested)
|
Number of
Securities
Underlying
Unexercised
Options
(#)
Unexercisable
(Unvested)
|
Equity
Incentive
Plan Awards:
Number of
Securities
Underlying Unexercised
Unearned
Options
(#)
|
Option
Exercise
Price
($)
|
Option
Expiration
Date
|
Number
of Shares
that Have
Not
Vested
(#)
|
Market
Value of
Shares that
Have Not
Vested
($)
|
Equity
Incentive
Plan
Awards:
Number of
Unearned
Shares That
Have Not
Vested
(#)
|
Equity
Incentive
Plan
Awards:
Market
Value of
Unearned
Shares That
Have Not
Vested ($)
|
||||||||||||||||||
|
(a)
|
(b)
|
(c)
|
(d)
|
(e)
|
(f)
|
(g)
|
(h)
|
(i)
|
(j)
|
(k)
|
||||||||||||||||||
|
Carol K. Nelson
|
Vested
|
15,625 | - |
NA
|
$ | 5.54 |
02/13/12
|
NA
|
$ | - | 25 | $ | 136 | |||||||||||||||
|
Vested
|
20,312 | - | 10.00 |
07/22/13
|
||||||||||||||||||||||||
|
Vested
|
15,115 | - | 15.92 |
03/23/14
|
||||||||||||||||||||||||
|
Vested
|
8,736 | - | 14.24 |
03/22/15
|
||||||||||||||||||||||||
|
03/28/11
|
12,101 | 5,186 | 15.00 |
03/28/16
|
||||||||||||||||||||||||
|
03/25/13
|
4,500 | 10,500 | 12.63 |
03/25/18
|
||||||||||||||||||||||||
|
Steven R. Erickson
|
Vested
|
10,937 | - |
NA
|
$ | 6.21 |
03/26/12
|
NA
|
$ | - |
NA
|
$ | - | |||||||||||||||
|
Vested
|
10,156 | - | 10.00 |
07/22/13
|
||||||||||||||||||||||||
|
Vested
|
7,625 | - | 15.92 |
03/23/14
|
||||||||||||||||||||||||
|
Vested
|
5,625 | - | 14.24 |
03/22/15
|
||||||||||||||||||||||||
|
03/28/11
|
7,875 | 3,375 | 15.00 |
03/28/16
|
||||||||||||||||||||||||
|
03/25/13
|
3,000 | 7,000 | 12.63 |
03/25/18
|
||||||||||||||||||||||||
|
Robert G. Disotell
|
Vested
|
7,812 | - |
NA
|
$ | 6.21 |
03/26/12
|
NA
|
$ | - | 25 | $ | 136 | |||||||||||||||
|
Vested
|
10,156 | - | 10.00 |
07/22/13
|
||||||||||||||||||||||||
|
Vested
|
7,625 | - | 15.92 |
03/23/14
|
||||||||||||||||||||||||
|
Vested
|
5,000 | - | 14.24 |
03/22/15
|
||||||||||||||||||||||||
|
03/28/11
|
7,000 | 3,000 | 15.00 |
03/28/16
|
||||||||||||||||||||||||
|
03/25/13
|
3,000 | 7,000 | 12.63 |
03/25/18
|
||||||||||||||||||||||||
73
|
Director Compensation
at December 31, 2010
|
||||||||||||||||||||||||||||
|
Name
|
Fees
Earned
or Paid
in Cash
($)
|
Stock
Awards
($)
|
Option
Awards
($)
|
Non-Equity
Incentive Plan
Compensation
($)
|
Change in Pension
Value &
Nonqualified
Deferred
Compensation
Earnings
($)
|
All Other
Compensation
($)
|
Total
($)
|
|||||||||||||||||||||
|
(a)
|
(b)
|
(c)
|
(d)
|
(e)
|
(f)
|
(g)
|
(h)
|
|||||||||||||||||||||
|
Dennis R. Murphy
|
$ | 45,000 | $ | - | $ | - | $ | - | $ | - | $ | - | $ | 45,000 | ||||||||||||||
|
Richard L. Anderson
|
41,000 | - | - | - | - | - | 41,000 | |||||||||||||||||||||
|
David W. Duce
|
33,000 | - | - | - | - | - | 33,000 | |||||||||||||||||||||
|
Marion R. Foote
|
20,250 | - | - | - | - | - | 20,250 | |||||||||||||||||||||
|
Jim Gaffney
|
35,000 | - | - | - | - | - | 35,000 | |||||||||||||||||||||
|
Janice E. Halladay
|
41,000 | - | - | - | - | - | 41,000 | |||||||||||||||||||||
|
Arnold R. Hofmann
|
23,333 | - | - | - | - | - | 23,333 | |||||||||||||||||||||
|
Carol K. Nelson
|
- | - | - | - | - | - | - | |||||||||||||||||||||
|
David R. O’Connor
|
39,500 | - | - | - | - | - | 39,500 | |||||||||||||||||||||
|
Thomas H. Rainville
|
18,000 | - | - | - | - | - | 18,000 | |||||||||||||||||||||
|
Christian H. Sievers
|
22,000 | - | - | - | - | - | 22,000 | |||||||||||||||||||||
|
Ronald E. Thompson
|
35,000 | - | - | - | - | - | 35,000 | |||||||||||||||||||||
|
G. Brandt Westover
|
33,000 | - | - | - | - | - | 33,000 | |||||||||||||||||||||
Compliance with the U.S. Treasury Department’s Capital Purchase Program
As an issuer of Preferred Stock to the U.S. Treasury, the Corporation has agreed to meet all the requirements regarding executive compensation embodied in the Securities Purchase Agreement entered into between the Corporation and the U.S. Treasury. The Corporation’s existing employment and change of control agreements have been modified to comply with the restrictions related to executive compensation.
These modifications include the prohibition from making a golden parachute payment to any Senior Executive Officer as long as any debt or equity securities issued by the Corporation are held by the Treasury (CPP Covered Period). Also included is the ability, during the CPP Covered Period, for the Corporation to “claw back” any payment made to the executive if the payment is later determined to have been based on any materially inaccurate financial statements or any other materially inaccurate metric criteria within the meaning of Section 111(b)(2)(B) of the Emergency Economic Stabilization Act (EESA).
In addition, the Compensation Committee is required to annually review its incentive plans to ensure that they do not encourage Senior Executive Officers (SEOs) to take unnecessary and excessive risks that threaten the value of the Corporation. This assessment was completed on February 9, 2009, in conjunction with the Bank’s Chief Risk Officer. As required, the assessment was updated and reviewed and discussed by the Committee with the Bank’s Chief Risk Officer in December 2009 and December 2010. Amalfi Consulting was retained to provide advice on the Committee’s process for determining whether executive compensation encourages unnecessary or excessive risk. The Compensation Committee reviewed the incentive structures for the Bank’s Senior Executive Officers and found no indicators of the aforementioned risk contained in the Bank’s incentive structures.
On February 17, 2009, President Obama signed into law the American Recovery and Reinvestment Act (ARRA) which, among other things, amended the executive compensation provisions of EESA. On January 12, 2010, the SEC adopted and published final rules that create a new Rule 14a-20 in order to implement the EESA-required advisory vote on executive compensation. The Committee and the Corporation are committed to taking all necessary steps to see that the Corporation complies with all of the new and amended provisions of ARRA.
Prohibition on Incentive Compensation Encouraging Excessive Risk
The guidance from the Treasury outlines a procedure for institutions that participate in the Capital Purchase Program, i.e. issue Preferred Stock to the U.S. Treasury, to establish procedures to assure the compliance with the prohibition on incentive compensation programs that encourage SEOs to take unnecessary and excessive risk that threatens the value of the financial institution.
74
To arrive at its determination, the Committee reviewed the components of each SEO’s incentive plan. The structure of each SEO’s incentive is based upon performance detailed in each individual’s scorecard, with the exception of the Corporation’s CEO. The scorecards in all cases included at least a 40% weighting on service and leadership. Most scorecards included a category of negotiated items, which typically include goals specific for that division’s operations during the year. The scorecard for SEOs with credit responsibility also contained a credit quality component of at least 20%.
In January 2010, the Committee amended the Bank’s incentive plans (for all employees) to increase the specificity and level of detail provided with respect to targets and to permit payment of a portion of incentives if at least 90% of the Bank’s profit goals are met in 2010 (rather than the all or nothing approach taken in the incentive plans prior to the amendment). While the Committee determined that the plans did not encourage or reward unnecessary and excessive risk even prior to the amendments, the Committee determined that the amendments would further discourage unnecessary and excessive risk by employees.
The CEO’s contract, as approved by the Board of Directors, also contains goals such as leadership and is balanced with specific measurable metrics that keep the incentives consistent with the goals elucidated in the Corporation’s strategic plan.
Each SEO has signed an Agreement to Amend Compensation Arrangements that prohibits Golden Parachutes, provides for the recovery of Incentive Compensation (clawbacks) and acknowledges that participation in the Capital Purchase Program may require the modification of any and all aspects of that person’s compensation. Each SEO’s Change of Control and Severance Agreement was also modified to be consistent with requirements of the Capital Purchase Program.
No Senior Executive Officer received total compensation in 2010 in excess of $500,000. Under certain circumstances, the Corporation’s CEO, could, in a future year, receive total compensation in excess of $500,000. To comply with the compensation requirements applicable to companies participating in the Capital Purchase Program, the Corporation has agreed to limit its deduction for compensation paid to any SEO to the $500,000 per annum limit.
The Committee has reviewed with the Chief Risk Officer the SEOs’ incentive compensation arrangements and has made reasonable efforts to ensure that such arrangements do not encourage the SEOs to take unnecessary and excessive risks that threaten the value of the financial institution. The Committee also has met to discuss and review the relationship between the Corporation’s risk management policies and practices and SEO incentive compensation arrangements.
Risk Assessment
The Compensation Committee met the requirement as prescribed in the Securities Purchase Agreement entered into between the Corporation and the U.S. Treasury to complete an assessment of the incentive plans to ensure that they did not encourage SEOs to take unnecessary and excessive risks that threaten the value of the Corporation. This assessment was completed on February 9, 2009 which was within the 90 day period, as required by the Treasury, of the receipt of TARP funds, and was updated with the Bank’s Chief Risk Officer by the Committee on December 11, 2009 and December 10, 2010, and by the full Board on February 25, 2010 and December 12, 2010, respectively.
The Compensation Committee retained Amalfi Consulting in 2010 to assist it in its review of the compensation policies of the Corporation and the Bank with respect to the compensation plans for selected employees. Following the Committee’s review of Amalfi’s findings, and the Committee’s own internal assessment completed with the assistance of the Bank’s Chief Risk Officer, the Committee concluded that the Corporation’s compensation policies and practices do not create risks that are reasonably likely to have a material adverse effect on the Corporation.
75
Employment/Change of Control/Severance Agreements
The following is a brief description of each agreement entered into by the Bank with named executive officers that provide potential payments upon termination or a change of control. Each SEO's Change of Control and Severance Agreement was modified in 2008 to be consistent with requirements of the Capital Purchase Program, which restricts severance payments if an executive officer’s employment is terminated during the CPP Covered Period.
Employment Agreement. The Bank entered into an employment agreement with Carol K. Nelson dated November 27, 2007, as modified effective November 21, 2008, to meet the requirements set by the Treasury, which replaced a previous agreement dated July 12, 2005. This agreement replaced a prior agreement dated March 26, 2002, and extended on January 27, 2004. The current agreement may be terminated upon 90 days written notice. The employment of Ms. Nelson is terminable at any time for cause as defined in the agreement, and she may be terminated without cause in which case she would receive a severance benefit equal to two times her annual base compensation plus incentive. Such payment would, at the option of the Bank, be made in a lump sum or in accordance with the Bank’s regular payroll schedule and would commence as soon as practicable, but not less than six (6) months, after the date that Ms. Nelson’s entitlement to such payments arose.
In the case that Ms. Nelson terminates her employment for “good reason,” as defined in the agreement, Ms. Nelson would receive a severance benefit equal to two (2) times her base compensation plus incentive before salary deferrals over the twelve (12) months preceding the month of termination, less statutory payroll deductions. Such payment would, at the option of the Bank, be made in a lump sum or in accordance with the Bank’s regular payroll schedule and would commence as soon as practicable, but not less than six (6) months, after the date that Ms. Nelson’s entitlement to such payment arose.
The agreement also provides for the payment of severance benefits to Ms. Nelson in the event of her termination of employment following a change of control of the Corporation or the Bank. All of Ms. Nelson’s equity grants/benefits would become fully vested upon the effective date of the change of control. If Ms. Nelson left the employment of the Bank, whether voluntarily or involuntarily, within twelve (12) months after such change of control, Ms. Nelson would be entitled to receive an amount equal to two (2) times her base compensation plus incentive before salary deferrals over the twelve (12) month period prior to the change of control. Such payment would not be made less than six (6) months after Ms. Nelson’s entitlement to the payment arose. During the term of the agreement and for twenty-four (24) months thereafter, if Ms. Nelson receives compensation due to a change of control, she would be prohibited from, directly or indirectly, soliciting or attempting to solicit: (i) any employees of the Bank to leave their employment; or (ii) any customers of the Bank to remove their business from the Bank or to participate in any manner in any financial institution or trust company that competes with or will compete with the Bank in King, Snohomish or Pierce Counties, or any start-up or other financial institution or trust company in King, Snohomish or Pierce Counties. Under the ARRA, the Committee cannot award Ms. Nelson any change of control compensation during the CPP Covered Period.
The agreement also provides that, if Ms. Nelson retires after attaining the age fifty-seven (57), Ms. Nelson will receive a severance benefit in an amount equal to two (2) times her base compensation plus incentive before salary deferrals over the twelve (12) months prior to her retirement, with such amounts payable in twenty-four (24) consecutive, equal, monthly installments, with the first such payment due on the first day of the seventh month following her retirement. In addition, Ms. Nelson would be entitled to the vesting of all stock-based compensation and certain health benefits. During the term of the agreement and for twenty-four (24) months thereafter, if Ms. Nelson receives compensation due to her retirement after attaining the age of fifty-seven (57), she would be restricted from becoming or serving as an officer, director, founder or employee of any financial institution with its main office in King, Snohomish or Pierce Counties, or any other financial institution which, in the judgment of the Board, is in substantial competition with the Bank, unless Ms. Nelson had first obtained the Board’s written consent. Furthermore, during the term of the agreement and for twenty-four (24) months thereafter, if Ms. Nelson receives compensation due to her retirement after age fifty-seven (57), she would be prohibited from, directly or indirectly, soliciting or attempting to solicit: (i) any employees of the Bank to leave their employment, or (ii) any customers of the Bank to remove their business from the Bank to participate in any manner in any financial institution or trust company that competes with or will compete with the Bank in King, Snohomish or Pierce Counties, or any start-up or other financial institution or trust company in King, Snohomish or Pierce Counties.
If termination of the agreement occurs due to Ms. Nelson’s death, her estate would be entitled to receive, under her employment contract, only the compensation, benefits earned and expenses reimbursable through the date the agreement is terminated. If termination occurs due to Ms. Nelson’s disability, Ms. Nelson would continue to receive her salary until payments under the Bank’s long-term disability plan commenced, or in the event the Bank had no long-term disability plan on the date of disability, her salary would continue for a period of six (6) months. In the event of Ms. Nelson’s death or disability while employed by the Bank, all of her then outstanding, stock-based compensation which had not vested would be accelerated and fully vested.
76
Government regulations place restrictions on the executives’ ability to receive severance payments as previously discussed. At December 31, 2010 in the event of a Change of Control, the potential payout (if all executives were terminated) would have been $1.9 million but any such payments to the SEOs would have been prohibited because the Corporation is a TARP recipient.
Compensation of the Board of Directors
The goal of Cascade Financial Corporation’s Director Compensation Philosophy is to ensure that the Corporation is able to attract, motivate and reward qualified directors. The Corporate Governance and Nominating Committee is responsible for developing recommendations to the full Board regarding director compensation. To create a focus on long-term success and reduce any conflict of interest, the compensation for the Board of Directors is limited to a set fee for service. Total director compensation consists of an annual retainer, committee and chair fees as applicable. Part of director compensation has historically been paid in the form of an equity grant.
In 2010, the Board reduced director compensation, resulting in a reduction in total compensation of approximately 25% compared to January 2009 total compensation levels by eliminating all equity compensation for directors in 2010. In addition, the annual compensation for the Chairs of the Compensation Committee and the Loan Committee for 2010 were reduced to $6,000 and $4,500, respectively.
In November 2010, the Board approved a recommendation by the Corporate Governance and Nominating Committee to leave 2010 director compensation levels unchanged for 2011. However, the Board adopted a policy to review director compensation and consider additional reductions in the event that certain soundness thresholds are not maintained.
77
For the year ended December 31, 2010, the Company’s director compensation program was comprised entirely of cash compensation as follows:
|
Cash Compensation
|
Director
|
Annual Amount
($)
|
|||
|
Cash Retainer
|
All non-executive directors
|
$ | 27,000 | ||
|
Supplemental Chair Fees
|
|||||
|
Chair of the Board
|
Dr. Murphy
|
$ | 18,000 | ||
|
Audit Committee
|
Mr. Anderson
|
$ | 6,000 | ||
|
Compensation Committee
|
Ms. Halladay
|
$ | 6,000 | ||
|
Loan Committee
|
Mr. O’Connor
|
$ | 4,500 | ||
|
Corporate Governance and Nominating Committee
|
Mr. Duce
|
$ | 6,000 | ||
|
Finance Committee
|
Mr. Westover
|
$ | 6,000 | ||
|
Supplemental Committee Fees
|
|||||
|
Loan Committee
|
All members of the Loan Committee
|
$ | 8,000 | ||
Compensation Committee Interlocks and Insider Participation
As a smaller reporting company, the Company is not required to provide this disclosure.
Compensation Committee Report
As a smaller reporting company, the Company is not required to provide this disclosure.
ITEM 12. SECURITY OWNERSHIP OF CERTAIN BENEFICIAL OWNERS AND MANAGEMENT
Persons and groups who beneficially own more than 5% of the Corporation’s common stock are required to file certain reports with the Securities and Exchange Commission (SEC) and to provide a copy to the Corporation disclosing such ownership. Based on such reports, as of February 28, 2011, management knows of no persons who were beneficial owners of more than 5% of the outstanding shares of common stock.
The following table shows the number of shares of the Corporation’s common stock beneficially owned at February 28, 2011 by the Corporation’s directors, executive officers identified in the Summary Compensation Table, and all directors and executive officers as a group. The address of each person below is the same as the Corporation’s principal office.
78
|
Name
|
Number of Shares
Beneficially Owned (1)
|
% of
Shares Outstanding
|
||||||
|
Directors:
|
||||||||
|
Richard L. Anderson
|
28,457 | * | ||||||
|
David W. Duce
|
59,260 | (2) | * | |||||
|
Marion R. Foote
|
100,000 | * | ||||||
|
Jim Gaffney
|
19,982 | * | ||||||
|
Janice E. Halladay
|
34,637 | * | ||||||
|
Arnold R. Hofmann
|
12,419 | * | ||||||
|
Dennis R. Murphy
|
42,800 | * | ||||||
|
Carol K. Nelson **
|
154,817 | 1.3 | % | |||||
|
David R. O’Connor
|
170,341 | (3) | 1.4 | % | ||||
|
Thomas H. Rainville
|
141,031 | 1.1 | % | |||||
|
Christian H. Sievers
|
6,875 | * | ||||||
|
Ronald E. Thompson
|
57,920 | * | ||||||
|
G. Brandt Westover
|
55,596 | * | ||||||
|
Named Executive Officers:
|
||||||||
|
Steven R. Erickson
|
96,082 | * | ||||||
|
Robert G. Disotell
|
188,925 | 1.5 | % | |||||
|
All Executive Officers and Directors as a group (18 persons)
|
1,294,264 | 10.5 | % | |||||
|
*
|
Less than 1% of shares outstanding
|
|
**
|
Also a named executive officer of the Corporation and executive officer of the Bank
|
|
(1)
|
In accordance with Rule 13d-3 under the Securities Exchange Act of 1934, as amended (Exchange Act), a person is deemed to be the beneficial owner, for purposes of this table, of any shares of common stock if he or she has voting and/or investment power with respect to such security. The table includes shares owned by spouses or other immediate family members in trust, shares held in retirement accounts or funds for the benefit of the named individuals, and other forms of ownership over which shares the persons named in the table possess voting and/or investment power. Shares held in accounts under the Corporation’s 401(k) plan as of February 28, 2011 are included in the above table as follows: Ms. Nelson: 2,928; Mr. Erickson: 44,789; and Mr. Disotell 36,381; all executive officers and directors as a group: 117,162. These amounts do not include the remaining shares held by the Bank’s 401(k) plan for which Ms. Nelson and Messrs. Anderson and Westover act as trustees. The amounts shown also include the following amounts of common stock which the following individuals have the right to acquire within 60 days of February 28, 2011 through the exercise of stock options granted pursuant to the Corporation’s stock option plans: Mr. Anderson: 4,250; Mr. Gaffney: 5,000; Ms. Nelson: 84,576; Mr. Erickson: 50,593; Mr. Disotell: 45,593; and all executive officers and directors as a group: 280,701.
|
|
(2)
|
Includes 192 shares held by Mr. Duce’s children, and 1,375 shares held by a testamentary trust of which Mr. Duce is trustee.
|
(3) Includes 124,265 shares held by a trust in which Mr. O’Connor has a pecuniary interest
ITEM 13. CERTAIN RELATIONSHIPS AND RELATED TRANSACTIONS, AND DIRECTOR INDEPENDENCE
Certain transactions involving loans, deposits, credit cards and sales of commercial paper, certificates of deposit and other money market instruments, and certain other banking transactions, occurred during 2010 between the Bank and certain directors or executive officers of the Corporation and its subsidiaries, members of their immediate families, corporations or organizations of which any
79
Review and Approval of Related Party Transactions
The Board reviews all transactions between the Corporation, the Bank and any of its officers and directors. The Corporation’s Standards of Conduct emphasize the importance of avoiding situations or transactions in which personal interests may interfere with the best interests of the Corporation, the Bank or the Corporation’s shareholders. In addition, the Corporation’s general corporate governance practice includes Board-level discussion and assessment of procedures for discussing and assessing relationships, including business, financial, familial and nonprofit, among the Corporation, the Bank and its officers and directors, to the extent that they may arise. The Board and the Corporate Governance and Nominating Committee review any transaction with an officer or director to determine, on a case-by-case basis, whether a conflict of interest exists. The Board ensures that all directors voting on such a matter have no interest in the matter and discusses the transaction with counsel as the Board deems necessary. The Board will generally delegate the task of discussing, reviewing and approving transactions between the Corporation or the Bank and any related persons to the Corporate Governance and Nominating Committee.
Settlement Agreement
On April 27, 2010, the Corporation entered into a settlement agreement with two then-serving directors – Craig G. Skotdal, Dwayne R. Lane – and other parties, including some who now serve as directors. The Corporation filed a complete copy of the settlement agreement with the SEC on April 29, 2010 as Exhibit 10.1 to its Current Report on Form 8-K. On July 16, 2010, Mr. Skotdal resigned from the Board and on July 20, 2010, Mr. Lane resigned from the Board.
ITEM 14. PRINCIPAL ACCOUNTANT FEES AND SERVICES
The Board has selected Moss Adams LLP, Certified Public Accountants, as independent auditors for the Corporation for the fiscal year ending December 31, 2011. Representatives of Moss Adams LLP are expected to be present at the Annual Meeting, will have the opportunity to make a statement if they desire to do so, and are expected to be available to respond to appropriate questions.
Audit and Non-Audit Fees
The following table presents fees for professional audit services rendered by Moss Adams LLP for the audit of the Corporation’s annual financial statements for the fiscal years ended December 31, 2010 and 2009, and fees billed for other services rendered.
The aggregate fees billed to the Corporation by Moss Adams LLP for 2010 and 2009 were as follows:
|
Fiscal Year Ended December 31,
|
||||||||
|
2010
|
2009
|
|||||||
|
Audit Fees
|
$ | 313,000 | $ | 284,000 | ||||
|
Audit-related Fees
|
41,000 | 54,000 | ||||||
|
Tax Fees
|
34,000 | 28,000 | ||||||
|
Total Fees
|
$ | 388,000 | $ | 366,000 | ||||
Audit Fees: Consists of fees billed to the Corporation for professional services rendered by Moss Adams LLP in connection with the integrated audit of our financial statements and review of financial statements included in the Corporation’s Forms 10-K and 10-Q or services to the Corporation in connection with statutory or regulatory filings or engagements.
80
Audit-Related Fees: Consists of fees relating to examination of management’s assertion regarding the effectiveness of internal controls (FDICIA), audit of the Corporation’s pension plans, and miscellaneous audit and accounting matters.
Tax Fees: Consists of fees relating to the preparation of the Corporation’s federal income tax return, tax planning and miscellaneous tax matters.
All Other Fees: There were no other fees for services included above for fiscal years ended December 31, 2010 and 2009.
In considering the nature of the services provided by Moss Adams LLP, the Audit Committee determined that such services are compatible with the provision of independent audit services. As part of its approval of all services provided by Moss Adams LLP, the Audit Committee discussed these services with Moss Adams LLP and Corporation management to determine that they are permitted under the rules and regulations concerning auditor independence promulgated by the SEC to implement Sarbanes-Oxley, and the American Institute of Certified Public Accountants.
PART IV
ITEM 15. EXHIBITS, FINANCIAL STATEMENT SCHEDULES
|
(a)
|
The audited consolidated financial statements follow.
|
81
REPORT OF INDEPENDENT REGISTERED PUBLIC ACCOUNTING FIRM
The Board of Directors
Cascade Financial Corporation:
We have audited the accompanying consolidated balance sheets of Cascade Financial Corporation and Subsidiaries (the Corporation) as of December 31, 2010 and 2009, and the related consolidated statements of operations, stockholders’ equity and comprehensive (loss) income, and cash flows for each of the years in the three-year period ended December 31, 2010. We also have audited the Corporation’s internal control over financial reporting as of December 31, 2010, based on criteria established in Internal Control—Integrated Framework issued by the Committee of Sponsoring Organizations of the Treadway Commission (COSO). The Corporation’s management is responsible for these financial statements, for maintaining effective internal control over financial reporting, and for its assessment of the effectiveness of internal control over financial reporting included in the accompanying Management’s Report on Internal Control over Financial Reporting. Our responsibility is to express an opinion on these financial statements and an opinion on the effectiveness of the Corporation’s internal control over financial reporting based on our audits.
We conducted our audits in accordance with auditing standards of the Public Company Accounting Oversight Board (United States). Those standards require that we plan and perform the audits to obtain reasonable assurance about whether the financial statements are free of material misstatement and whether effective internal control over financial reporting was maintained in all material respects. Our audits of the financial statements included examining, on a test basis, evidence supporting the amounts and disclosures in the financial statements, assessing the accounting principles used and significant estimates made by management, as well as evaluating the overall financial statement presentation. Our audit of internal control over financial reporting included obtaining an understanding of internal control over financial reporting, assessing the risk that a material weakness exists, and testing and evaluating the design and operating effectiveness of internal control based on the assessed risks. Our audits also included performing such other procedures as we considered necessary in the circumstances. We believe that our audits provide a reasonable basis for our opinions.
A company’s internal control over financial reporting is a process designed to provide reasonable assurance regarding the reliability of financial reporting and the preparation of financial statements for external purposes in accordance with generally accepted accounting principles. A company’s internal control over financial reporting includes those policies and procedures that (1) pertain to the maintenance of records that, in reasonable detail, accurately and fairly reflect the transactions and dispositions of the assets of the company; (2) provide reasonable assurance that transactions are recorded as necessary to permit preparation of financial statements in accordance with generally accepted accounting principles, and that receipts and expenditures of the company are being made only in accordance with authorizations of management and directors of the company; and (3) provide reasonable assurance regarding prevention or timely detection of unauthorized acquisition, use, or disposition of the company’s assets that could have a material effect on the financial statements.
Because of its inherent limitations, internal control over financial reporting may not prevent or detect misstatements. Also, projections of any evaluation of effectiveness to future periods are subject to the risk that controls may become inadequate because of changes in conditions, or that the degree of compliance with the policies or procedures may deteriorate.
In our opinion, the consolidated financial statements referred to above present fairly, in all material respects, the consolidated financial position of Cascade Financial Corporation and Subsidiaries as of December 31, 2010 and 2009, and the results of their operations and their cash flows for each of the years in the three-year period ended December 31, 2010, in conformity with accounting principles generally accepted in the United States of America. Also in our opinion, Cascade Financial Corporation maintained, in all material respects, effective internal control over financial reporting as of December 31, 2010, based on criteria established in Internal Control—Integrated Framework issued by the Committee of Sponsoring Organizations of the Treadway Commission (COSO).
The accompanying consolidated financial statements have been prepared assuming that the Corporation will continue as a going concern. As discussed in Note 2 to the consolidated financial statements, the Corporation’s two consecutive years of operating losses, high levels of nonperforming assets, and Stipulation to the Issuance of a Consent Order raise substantial doubt about its ability to continue as a going concern. Management’s plans regarding these matters are also described in Note 2. The consolidated financial statements do not include any adjustments that might result from the outcome of this uncertainty.
/s/ Moss Adams, LLP
Everett, Washington
March 25, 2011
82
CASCADE FINANCIAL CORPORATION AND SUBSIDIARIES
Consolidated Balance Sheets
December 31, 2010 and 2009
|
December 31,
|
||||||||
|
(Dollars in thousands, except share amounts)
|
2010
|
2009
|
||||||
|
Assets
|
||||||||
|
Cash on hand and in banks
|
$ | 3,871 | $ | 4,008 | ||||
|
Interest-earning deposits in other financial institutions
|
127,464 | 141,587 | ||||||
|
Securities available-for-sale, fair value
|
234,606 | 227,805 | ||||||
|
Securities held-to-maturity, amortized cost
|
53,912 | 36,177 | ||||||
|
Federal Home Loan Bank (FHLB) stock
|
11,920 | 11,920 | ||||||
|
Loans, net
|
967,661 | 1,173,213 | ||||||
|
Real estate owned (REO)
|
34,412 | 18,842 | ||||||
|
Premises and equipment, net
|
13,325 | 14,526 | ||||||
|
Cash surrender value of bank owned life insurance (BOLI), net
|
25,489 | 24,522 | ||||||
|
Goodwill
|
- | 12,885 | ||||||
|
Prepaid FDIC insurance premiums
|
2,968 | 6,859 | ||||||
|
Federal income tax receivable
|
- | 12,979 | ||||||
|
Accrued interest receivable
|
4,884 | 6,702 | ||||||
|
Other assets
|
17,822 | 12,603 | ||||||
|
Total assets
|
$ | 1,498,334 | $ | 1,704,628 | ||||
|
Liabilities
|
||||||||
|
Deposits
|
$ | 1,107,554 | $ | 1,139,774 | ||||
|
FHLB advances
|
159,000 | 239,000 | ||||||
|
Securities sold under agreements to repurchase
|
145,000 | 145,410 | ||||||
|
Federal Reserve Bank (FRB) Term Auction Facility (TAF)
|
- | 20,000 | ||||||
|
Junior subordinated debentures
|
15,465 | 15,465 | ||||||
|
Junior subordinated debentures, fair value
|
1,500 | 3,341 | ||||||
|
Accrued interest payable, expenses, and other liabilities
|
11,363 | 7,188 | ||||||
|
Total liabilities
|
1,439,882 | 1,570,178 | ||||||
|
Commitments and contingencies (Note 16)
|
||||||||
|
Stockholders’ Equity
|
||||||||
|
Preferred stock, no par value. Authorized 38,970 shares;
|
37,488 | 37,038 | ||||||
|
Series A (liquidation preference $1,000 per share); issued and outstanding 38,970 shares at December 31, 2010 and 2009
|
||||||||
|
Preferred stock, $.01 par value. Authorized 500,000 shares;
no shares issued or outstanding
|
- | - | ||||||
|
Common stock, $.01 par value. Authorized 65,000,000 shares;
issued and outstanding 12,271,529 shares at December 31, 2010, and
12,146,080 shares at December 31, 2009
|
123 | 121 | ||||||
|
Additional paid-in capital
|
43,932 | 43,649 | ||||||
|
(Accumulated deficit) retained earnings
|
(17,965 | ) | 54,797 | |||||
|
Accumulated other comprehensive loss
|
(5,126 | ) | (1,155 | ) | ||||
|
Total stockholders’ equity
|
58,452 | 134,450 | ||||||
|
Total liabilities and stockholders’ equity
|
$ | 1,498,334 | $ | 1,704,628 | ||||
|
(See accompanying notes to consolidated financial statements)
|
||||||||
83
CASCADE FINANCIAL CORPORATION AND SUBSIDIARIES
Consolidated Statements of Operations
Years ended December 31, 2010, 2009, and 2008
|
Years Ended December 31,
|
||||||||||||
|
(Dollars in thousands, except share amounts)
|
2010
|
2009
|
2008
|
|||||||||
|
Interest Income
|
||||||||||||
|
Loans, including fees
|
$ | 62,312 | $ | 69,839 | $ | 77,941 | ||||||
|
Securities available-for-sale
|
7,408 | 9,137 | 5,258 | |||||||||
|
Securities held-to-maturity
|
1,327 | 2,759 | 8,213 | |||||||||
|
FHLB dividends
|
- | - | 113 | |||||||||
|
Preferred stock dividends
|
- | - | 909 | |||||||||
|
Interest-earning deposits
|
348 | 93 | 137 | |||||||||
|
Total interest income
|
71,395 | 81,828 | 92,571 | |||||||||
|
Interest Expense
|
||||||||||||
|
Deposits
|
15,015 | 17,064 | 27,215 | |||||||||
|
FHLB advances
|
9,265 | 10,584 | 10,955 | |||||||||
|
FRB TAF borrowings
|
- | 153 | 375 | |||||||||
|
Securities sold under agreements to repurchase
|
8,629 | 8,625 | 6,021 | |||||||||
|
Junior subordinated debentures
|
2,047 | 2,114 | 2,120 | |||||||||
|
Total interest expense
|
34,956 | 38,540 | 46,686 | |||||||||
|
Net interest income
|
36,439 | 43,288 | 45,885 | |||||||||
|
Provision for loan losses
|
56,515 | 44,175 | 7,240 | |||||||||
|
Net interest (loss) income after provision for loan losses
|
(20,076 | ) | (887 | ) | 38,645 | |||||||
|
Other Income
|
||||||||||||
|
Checking service fees
|
5,402 | 5,047 | 4,848 | |||||||||
|
Other service fees
|
965 | 1,033 | 1,092 | |||||||||
|
Increase in cash surrender value of BOLI, net
|
967 | 885 | 981 | |||||||||
|
Gain on sales/calls of securities, net
|
8,790 | 1,845 | 398 | |||||||||
|
Gain on sale of loans
|
224 | 176 | 128 | |||||||||
|
Gain on fair value of financial instruments, net
|
1,841 | 7,169 | 912 | |||||||||
|
Other
|
555 | 474 | 453 | |||||||||
|
Total other income
|
18,744 | 16,629 | 8,812 | |||||||||
|
Other Expenses
|
||||||||||||
|
Compensation & employee benefits
|
14,341 | 13,981 | 14,544 | |||||||||
|
Occupancy & equipment
|
3,930 | 4,229 | 3,986 | |||||||||
|
FDIC insurance premiums
|
4,091 | 2,649 | 735 | |||||||||
|
Business insurance
|
1,514 | 253 | 169 | |||||||||
|
REO expenses
|
1,119 | 1,829 | 60 | |||||||||
|
Write-downs/losses on sales of REO
|
11,425 | 1,489 | 3 | |||||||||
|
Legal
|
1,451 | 821 | 294 | |||||||||
|
Contract services
|
1,196 | 381 | 231 | |||||||||
|
B&O tax
|
1,237 | 1,162 | 1,277 | |||||||||
|
FHLB prepayment penalty
|
4,808 | - | - | |||||||||
|
Other
|
7,092 | 7,468 | 7,169 | |||||||||
|
Other-than-temporary impairment (OTTI)
|
- | 858 | 17,338 | |||||||||
|
Goodwill impairment charge
|
12,885 | 11,700 | - | |||||||||
|
Total other expenses
|
65,089 | 46,820 | 45,806 | |||||||||
|
(Loss) income before provision (benefit) for income taxes
|
(66,421 | ) | (31,078 | ) | 1,651 | |||||||
|
Provision (benefit) for income taxes
|
3,865 | (7,610 | ) | (439 | ) | |||||||
|
Net (loss) income
|
(70,286 | ) | (23,468 | ) | 2,090 | |||||||
|
Dividends on preferred stock
|
2,026 | 1,943 | 216 | |||||||||
|
Accretion of issuance discount on preferred stock
|
450 | 422 | 35 | |||||||||
|
Net (loss) income attributable to common stockholders
|
$ | (72,762 | ) | $ | (25,833 | ) | $ | 1,839 | ||||
|
(See accompanying notes to consolidated financial statements)
|
||||||||||||
84
CASCADE FINANCIAL CORPORATION AND SUBSIDIARIES
Consolidated Statements of Operations, Continued, Stockholders’ Equity and Comprehensive (Loss) Income
Years ended December 31, 2010, 2009, and 2008
|
Consolidated Statements of Operations, Continued
|
Years Ended December 31,
|
|||||||||||
|
(Dollars in thousands, except share amounts)
|
2010
|
2009
|
2008
|
|||||||||
|
(Loss) income per common share, basic
|
$ | (5.95 | ) | $ | (2.13 | ) | $ | 0.15 | ||||
|
Weighted average number of common shares outstanding, basic
|
12,238,802 | 12,121,113 | 12,053,084 | |||||||||
|
(Loss) income per common share, diluted
|
$ | (5.95 | ) | $ | (2.13 | ) | $ | 0.15 | ||||
|
Weighted average number of common shares outstanding, diluted
|
12,238,802 | 12,121,113 | 12,159,174 | |||||||||
|
Retained
|
Accumulated
|
Total
|
||||||||||||||||||||||||||
|
Additional
|
Earnings
|
Other
|
Stock-
|
|||||||||||||||||||||||||
| (Dollars in thousands, |
Preferred
|
Common
|
Paid-In
|
(Accumulated
|
Comprehensive
|
holders’
|
||||||||||||||||||||||
|
except share amounts)
|
Stock
|
Shares
|
Amount
|
Capital
|
Deficit)
|
Income(Loss)
|
Equity
|
|||||||||||||||||||||
|
Balances at December 31, 2007
|
$ | - | 12,023,685 | $ | 120 | $ | 40,322 | $ | 82,169 | $ | (515 | ) | $ | 122,096 | ||||||||||||||
|
Dividends declared -
|
||||||||||||||||||||||||||||
|
Common stock ($0.27 per share)
|
- | - | - | - | (3,256 | ) | - | (3,256 | ) | |||||||||||||||||||
|
Preferred stock ($5.54 per share)
|
- | - | - | - | (216 | ) | - | (216 | ) | |||||||||||||||||||
|
Options exercised and issuance of common stock
|
- | 47,347 | 1 | 356 | - | - | 357 | |||||||||||||||||||||
|
Tax benefit from stock-based compensation
|
- | - | - | 30 | - | - | 30 | |||||||||||||||||||||
|
Stock compensation expense
|
- | - | - | 196 | - | - | 196 | |||||||||||||||||||||
|
Net income
|
- | - | - | - | 2,090 | - | 2,090 | |||||||||||||||||||||
|
Issuance of preferred stock
|
36,581 | - | - | - | - | - | 36,581 | |||||||||||||||||||||
|
Warrants on issuance of preferred stock
|
- | - | - | 2,389 | - | - | 2,389 | |||||||||||||||||||||
|
Accretion of discount on preferred stock
|
35 | - | - | - | (35 | ) | - | -- | ||||||||||||||||||||
|
Other comprehensive loss, net of tax benefit of $(78)
|
- | - | - | - | - | (145 | ) | (145 | ) | |||||||||||||||||||
|
Balances at December 31, 2008
|
36,616 | 12,071,032 | 121 | 43,293 | 80,752 | (660 | ) | 160,122 | ||||||||||||||||||||
|
Dividends declared -
|
||||||||||||||||||||||||||||
|
Common stock ($0.01 per share)
|
- | - | - | - | (122 | ) | - | (122 | ) | |||||||||||||||||||
|
Preferred stock ($49.86 per share)
|
- | - | - | - | (1,943 | ) | - | (1,943 | ) | |||||||||||||||||||
|
Issuance of common stock
|
- | 75,048 | - | 209 | - | - | 209 | |||||||||||||||||||||
|
Tax benefit from stock-based compensation
|
- | - | - | 4 | - | - | 4 | |||||||||||||||||||||
|
Stock compensation expense
|
- | - | - | 143 | - | - | 143 | |||||||||||||||||||||
|
Net loss
|
- | - | - | - | (23,468 | ) | - | (23,468 | ) | |||||||||||||||||||
|
Accretion of discount on preferred stock
|
422 | - | - | - | (422 | ) | - | - | ||||||||||||||||||||
|
Other comprehensive loss, net of tax benefit of $(266)
|
- | - | - | - | - | (495 | ) | (495 | ) | |||||||||||||||||||
|
Balances at December 31, 2009
|
37,038 | 12,146,080 | 121 | 43,649 | 54,797 | (1,155 | ) | 134,450 | ||||||||||||||||||||
|
Dividends declared -
|
||||||||||||||||||||||||||||
|
Preferred stock ($51.98 per share)
|
- | - | - | - | (2,026 | ) | - | (2,026 | ) | |||||||||||||||||||
|
Issuance of common stock
|
- | 125,449 | 2 | 228 | - | - | 230 | |||||||||||||||||||||
|
Stock compensation expense
|
- | - | - | 55 | - | - | 55 | |||||||||||||||||||||
|
Net loss
|
- | - | - | - | (70,286 | ) | - | (70,286 | ) | |||||||||||||||||||
|
Accretion of discount on preferred
stock
|
450 | - | - | - | (450 | ) | - | - | ||||||||||||||||||||
|
Other comprehensive loss
|
- | - | - | - | - | (3,971 | ) | (3,971 | ) | |||||||||||||||||||
|
Balances at December 31, 2010
|
$ | 37,488 | 12,271,529 | $ | 123 | $ | 43,932 | $ | (17,965 | ) | $ | (5,126 | ) | $ | 58,452 | |||||||||||||
|
Consolidated Statement of Comprehensive (Loss) Income
|
Years Ended December 31,
|
|||||||||||
|
(Dollars in thousands, except share amounts)
|
2010
|
2009
|
2008
|
|||||||||
|
Net (loss) income
|
$ | (70,286 | ) | $ | (23,468 | ) | $ | 2,090 | ||||
|
Unrealized gain on cash flow hedging instruments
|
3,517 | - | - | |||||||||
|
Unrealized holding gain on securities available-for-sale, net of tax provision of $622, $289, and $21
|
1,299 | 537 | 40 | |||||||||
|
Reclassification adjustment for gain on securities available-for-sale included in net (loss) income, net of tax benefit of $0, $(556), and $(100)
|
(8,787 | ) | (1,032 | ) | (185 | ) | ||||||
|
Comprehensive (loss) income
|
$ | (74,257 | ) | $ | (23,963 | ) | $ | 1,945 | ||||
(See accompanying notes to consolidated financial statements)
85
CASCADE FINANCIAL CORPORATION AND SUBSIDIARIES
Consolidated Statements of Cash Flows
Years ended December 31, 2010, 2009, and 2008
|
Years Ended December 31,
|
||||||||||||
|
(Dollars in thousands)
|
2010
|
2009
|
2008
|
|||||||||
|
Cash flows from operating activities:
|
||||||||||||
|
Net (loss) income
|
$ | (70,286 | ) | $ | (23,468 | ) | $ | 2,090 | ||||
|
Adjustments to reconcile net income to net cash provided by operating activities:
|
||||||||||||
|
Depreciation and amortization of premises and equipment
|
1,973 | 2,261 | 2,136 | |||||||||
|
Provision for losses on loans
|
56,515 | 44,175 | 7,240 | |||||||||
|
REO write-downs
|
10,527 | 1,256 | - | |||||||||
|
Goodwill impairment
|
12,885 | 11,700 | - | |||||||||
|
Increase in cash surrender value of BOLI
|
(967 | ) | (885 | ) | (981 | ) | ||||||
|
Amortization of core deposit intangible
|
141 | 141 | 141 | |||||||||
|
Deferred federal income taxes
|
4,369 | 5,104 | (8,176 | ) | ||||||||
|
Deferred loan fees, net of amortization
|
359 | 371 | (654 | ) | ||||||||
|
Gain on sale of loans
|
(224 | ) | (176 | ) | (128 | ) | ||||||
|
Origination of loans held-for-sale
|
(5,766 | ) | (11,015 | ) | (8,528 | ) | ||||||
|
Proceeds from sales of loans held-for-sale
|
6,106 | 12,387 | 8,785 | |||||||||
|
Stock compensation expense
|
55 | 143 | 196 | |||||||||
|
Excess tax benefits from stock-based compensation
|
- | (4 | ) | (30 | ) | |||||||
|
Gain on fair value of financial instruments, net
|
(1,841 | ) | (7,169 | ) | (912 | ) | ||||||
|
Net gain on sales/calls of securities available-for-sale
|
(8,787 | ) | (1,588 | ) | (285 | ) | ||||||
|
Gain on calls of securities held-to-maturity
|
(3 | ) | (257 | ) | (113 | ) | ||||||
|
Net loss on sales of REO
|
898 | 233 | 3 | |||||||||
|
Other-than-temporary impairment (OTTI) on investments
|
- | 858 | 17,338 | |||||||||
|
Net change in accrued interest receivable and other assets
|
11,625 | (15,558 | ) | (552 | ) | |||||||
|
Net change in accrued interest payable, expenses and other liabilities
|
2,041 | (6,647 | ) | (797 | ) | |||||||
|
Net cash provided by operating activities
|
19,620 | 11,862 | 16,773 | |||||||||
|
Cash flows from investing activities:
|
||||||||||||
|
Loans originated, net of principal repayments
|
92,533 | (4,054 | ) | (158,721 | ) | |||||||
|
Proceeds from sales of portfolio loans
|
8,674 | - | - | |||||||||
|
Purchases of securities available-for-sale
|
(576,568 | ) | (310,533 | ) | (149,022 | ) | ||||||
|
Proceeds from sales of securities available-for-sale
|
558,600 | 189,076 | 88,184 | |||||||||
|
Principal repayments on securities available-for-sale
|
13,089 | 17,298 | 2,743 | |||||||||
|
Purchases of securities held-to-maturity
|
(42,115 | ) | (19,997 | ) | (81,866 | ) | ||||||
|
Proceeds from sales/calls on securities held-to-maturity
|
20,000 | 99,600 | 96,550 | |||||||||
|
Principal repayments on securities held-to-maturity
|
4,383 | 5,072 | 2,074 | |||||||||
|
Net purchases of premises and equipment
|
(773 | ) | (1,324 | ) | (3,440 | ) | ||||||
|
Proceeds from sales/retirements of REO
|
26,956 | 6,087 | 4,434 | |||||||||
|
REO capitalized costs
|
(6,329 | ) | (1,164 | ) | - | |||||||
|
Net cash provided by (used) in investing activities
|
$ | 98,450 | $ | (19,939 | ) | $ | (199,064 | ) | ||||
(See accompanying notes to consolidated financial statements)
86
CASCADE FINANCIAL CORPORATION AND SUBSIDIARIES
Consolidated Statements of Cash Flows, Continued
Years ended December 31, 2010, 2009, and 2008
|
Years Ended December 31,
|
||||||||||||
|
(Dollars in thousands)
|
2010
|
2009
|
2008
|
|||||||||
|
Cash flows from financing activities:
|
||||||||||||
|
Proceeds from issuance of common stock
|
$ | 230 | $ | 209 | $ | 357 | ||||||
|
Proceeds from issuance of preferred stock and warrants
|
- | - | 38,970 | |||||||||
|
Dividends paid on common stock
|
- | (664 | ) | (3,794 | ) | |||||||
|
Dividends paid on preferred stock
|
- | (1,429 | ) | - | ||||||||
|
Excess tax benefits from stock-based compensation
|
- | 4 | 30 | |||||||||
|
Net (decrease) increase in deposits
|
(32,220 | ) | 132,992 | 101,886 | ||||||||
|
Proceeds from FHLB advances
|
159,000 | - | 105,500 | |||||||||
|
Repayments of FHLB advances
|
(239,000 | ) | (10,000 | ) | (87,500 | ) | ||||||
|
Net (decrease) increase in securities sold under agreements to repurchase
|
(410 | ) | (980 | ) | 25,765 | |||||||
|
Net (decrease) increase in FRB TAF borrowing
|
(20,000 | ) | (20,000 | ) | 40,000 | |||||||
|
Net increase in advance payments by borrowers for taxes and insurance
|
70 | 74 | 13 | |||||||||
|
Net cash (used in) provided by financing activities
|
(132,330 | ) | 100,206 | 221,227 | ||||||||
|
Net (decrease) increase in cash and cash equivalents
|
(14,260 | ) | 92,129 | 38,936 | ||||||||
|
Cash and cash equivalents at beginning of period
|
145,595 | 53,466 | 14,530 | |||||||||
|
Cash and cash equivalents at end of period
|
$ | 131,335 | $ | 145,595 | $ | 53,466 | ||||||
|
Supplemental disclosures of cash flow information – cash
|
||||||||||||
|
paid during the period for:
|
||||||||||||
|
Interest
|
$ | 33,139 | $ | 39,592 | $ | 47,494 | ||||||
|
Income taxes
|
- | 50 | 7,150 | |||||||||
|
Supplemental schedule of non-cash investing activities:
|
||||||||||||
|
Change in unrealized loss on securities available-for-sale
|
(7,488 | ) | (495 | ) | (145 | ) | ||||||
|
Change in unrealized gain on interest rate caps
|
3,517 | - | - | |||||||||
|
Dividends accrued on common stock
|
- | - | 543 | |||||||||
|
Dividends accrued on preferred stock
|
2,026 | 731 | 216 | |||||||||
|
Transfers of loans to REO
|
47,272 | 23,808 | 5,883 | |||||||||
|
Additions to REO for property received in partial satisfaction of a loan
|
63 | - | - | |||||||||
(See accompanying notes to consolidated financial statements)
87
CASCADE FINANCIAL CORPORATION AND SUBSIDIARIES
Notes to Consolidated Financial Statements
Note 1 - Summary of Significant Accounting Policies
The accounting and financial reporting policies of Cascade Financial Corporation (Corporation) and its wholly-owned subsidiaries, Cascade Bank (Cascade or the Bank), including Colby R.E., LLC and 2011 Yale Avenue East, LLC, Cascade Capital Trust I, II, and III (the Trusts), conform to accounting principles generally accepted in the United States of America and to general practices within the financial institutions industry, where applicable. In preparing the consolidated financial statements, management makes estimates and assumptions that affect the reported amounts of assets and liabilities and disclosure of contingent assets and liabilities at the date of the financial statements and the reported amounts of income and expense. Material estimates that are particularly susceptible to significant change relate to the determination of the allowance for loan losses, fair value of junior subordinated debentures and valuation of the deferred tax asset. Actual results could differ from those estimates.
The following is a description of the more significant policies that the Corporation follows in preparing and presenting its consolidated financial statements.
Basis of Presentation
The consolidated financial statements include the accounts of the Corporation and the Bank. All significant intercompany balances and transactions have been eliminated in the consolidation. The preparation of financial statements in conformity with accounting principles generally accepted in the United States of America requires management to make estimates and assumptions that affect the reported amounts and disclosures. Actual results may differ from these estimates under different assumptions or conditions.
Cascade Capital Trust I, II, and III were formed in 2000, 2004, and 2006, respectively, for the exclusive purpose of issuing trust preferred securities and using the proceeds from the issuance to acquire junior subordinated debentures issued by the Corporation. The Corporation used the proceeds from the issuance to fund future asset growth. The Trusts are not consolidated by Cascade Financial Corporation.
Colby R.E., LLC and 2011 Yale Avenue East, LLC were formed in 2009 and 2010, respectively, for the purpose of acquiring, managing and selling foreclosed (REO) properties. These subsidiaries of the Bank are consolidated in the financial statements of Cascade Financial Corporation.
Subsequent Events
The Corporation has evaluated events and transactions subsequent to December 31, 2010 for potential recognition and disclosure.
Cash and Cash Equivalents
The Corporation considers all cash on hand and in banks, fed funds sold and short-term highly-liquid investment securities with an original maturity of three months or less to be cash equivalents. At times, these balances may exceed Federal Deposit Insurance Corporation (FDIC) insurance limits.
Interest-earning deposits in other financial institutions are carried at cost and include interest-bearing deposits at the Federal Home Loan Bank (FHLB) and the Federal Reserve Bank (FRB).
Investment Securities
Debt and equity securities, including mortgage-backed securities (MBS), may be classified as available-for-sale or held-to-maturity. Securities available-for-sale are carried at fair value, with unrealized gains and losses reported as a component of other comprehensive (loss) income. Investment securities held-to-maturity are carried at amortized cost or principal balance, adjusted for amortization of premiums and accretion of discounts. Amortization of premiums and accretion of discounts are calculated using a method that approximates the level yield method. The Bank has the ability, and it is management’s positive intention, to hold held-to-maturity securities until maturity. Investments with fair values that are less than the amortized cost are considered impaired. Impairment may result from
88
CASCADE FINANCIAL CORPORATION AND SUBSIDIARIES
Notes to Consolidated Financial Statements
either a decline in the financial condition of the issuing entity or, in the case of fixed interest rate investments, from rising interest rates. Management reviews investment securities on an ongoing basis for the presence of other-than-temporary impairment (OTTI) or permanent impairment, taking into consideration current market conditions; fair value in relationship to cost; extent and nature of the change in fair value; issuer rating changes and trends; whether management intends to sell a security or if it is likely that the Bank will be required to sell the security before recovery of the amortized cost basis of the investment, which may be upon maturity; and other factors. For debt securities, if management intends to sell the security or it is likely that the Bank will be required to sell the security before recovering its cost basis, the entire impairment loss would be recognized in earnings as an OTTI. If management does not intend to sell the security and it is not likely that the Bank will be required to sell the security, but management does not expect to recover the entire amortized cost basis of the security, only the portion of the impairment loss representing credit losses would be recognized in earnings. The credit loss on a security is measured as the difference between the amortized cost basis and the present value of the cash flows expected to be collected. Projected cash flows are discounted by the original or current effective interest rate depending on the nature of the security being measured for potential OTTI. The remaining impairment related to all other factors, i.e., the difference between the present value of the cash flows expected to be collected and fair value, is recognized as a charge to other comprehensive income. Impairment losses related to all other factors are presented as separate categories within other comprehensive income. Gains and losses on the sale of securities are recorded on the trade date and are determined using the specific identification method.
FHLB Stock
As a member of the FHLB system, the Bank is required to maintain a minimum level of investment in FHLB stock based on specified percentages of its outstanding FHLB advances. The Bank's investment in FHLB stock is carried at par value ($100 per share), which reasonably approximates its fair value. The Bank may request redemption at par value of any stock in excess of the amount the Bank is required to hold. Stock redemptions are at the discretion of the FHLB. During 2002, the FHLB revised its capital structure from the issuance of one class of stock to two, B (1) and B (2) stock. Class B (1) stock can be sold back to the FHLB at cost, but is restricted as to purchase, sale and redemption. Class B (2) is not a required investment for institutions and is not restricted to purchase and sale, but has the same redemption restrictions as Class B (1) stock. Included in the balance sheet as of December 31, 2010, and 2009, the Bank has $11.9 million of Class B (1) and no B (2) stock.
The Bank evaluates FHLB stock for impairment based on its assessment of the ultimate recoverability of cost rather than by recognizing temporary declines in value. The determination of whether a decline affects the ultimate recoverability of cost is influenced by criteria such as: (1) the significance of any decline in net assets of the FHLB as compared to the capital stock amount for the FHLB and the length of time this situation has persisted, (2) commitments by the FHLB to make payments required by law or regulation and the level of such payments in relation to the operating performance of the FHLB, (3) the impact of legislative and regulatory changes on institutions and, accordingly, the customer base of the FHLB and (4) the liquidity position of the FHLB. Based upon an analysis by Standard and Poors regarding the Federal Home Loan Banks, they stated that the FHLB System has a special public status (organized under the Federal Home Loan Bank Act of 1932) and because of the extraordinary support offered to it by the U.S. Treasury in a crisis, (though not used), the FHLB System can be considered an extension of the government. The U.S. government would almost certainly support the credit obligations of the FHLB System. The Bank has determined there is no impairment of the FHLB stock investment as of December 31, 2010.
Loans Held-for-Sale
Loans held-for-sale include mortgage loans and are reported at the lower of cost or market value. Cost generally approximates market value, given the short duration of these assets. Gains or losses on the sale of loans that are held-for-sale are recognized at the time of the sale and determined by the difference between net sale proceeds and the net book value of the loans. Gains and losses on loan sales are recorded in other income and direct loan origination costs and fees are deferred at origination and are recognized in other income upon sale of the loan. The Bank had no loans held for sale at December 31, 2010, and $250,000 in loans held for sale at December 31, 2009. Loans are sold without recourse on a best efforts, servicing released basis.
89
CASCADE FINANCIAL CORPORATION AND SUBSIDIARIES
Notes to Consolidated Financial Statements
Loans that management has the intent and ability to hold for the near future or until maturity or pay-off generally are reported at their outstanding unpaid principal balances adjusted for the allowance for loan losses, and any deferred fees or costs on originated loans. Interest income is accrued by the interest method on the unpaid principal balance.
Interest is accrued only if deemed collectible. Accrual of interest income is generally discontinued when a loan becomes 90 days past due or is otherwise determined to be uncollectible and accrued interest amounts are reversed against income. Past due status is based on the contractual terms of the note. Once interest has been paid to date and management believes future payments are reasonably assured, the loan is returned to accrual status.
Loan origination fees and certain direct origination costs are deferred and amortized as an adjustment of the loan’s yield over the contractual life of the loan using the interest or straight-line method. In the event loans are sold, the remaining net deferred loan origination fees or costs are recognized as a component of the gains or losses on the sale of loans. When portfolio loans pay off before their contractual maturity, the remaining deferred fees or costs are charged to interest income on loans.
Regular credit review of the portfolio also identifies loans that are considered potentially impaired. A loan is considered impaired when, based on current information and events, the Bank determines that it will probably not be able to collect all amounts due according to the loan contract, including scheduled interest payments. When the Bank identifies a loan as impaired, it measures the impairment using discounted cash flows, except when the sole remaining source of the repayment for the loan is the liquidation of the collateral. In these cases, the Bank uses the current fair value of the collateral, less selling costs, instead of discounted cash flows. If the Bank determines that the value of the impaired loan is less than the recorded investment in the loan, it either recognizes an impairment reserve as a specific component to be provided for in the allowance for loan losses or charges-off the impaired balance on collateral dependent loans if it is determined that such amount represents a confirmed loss. The combination of risk rating-based allowance component and impairment reserve allowance component lead to an allocated allowance for loan losses.
Loans are classified as a troubled debt restructured (TDR) loan when a modification of terms is processed by the Bank, for economic or legal reasons related to the debtor’s financial difficulty, at terms and conditions that the Bank would not otherwise consider. In some cases, the Bank has extended the interest-only period of a loan or allowed a borrower to make interest-only payments to assist the borrower while trying to sell the collateral securing the loan. TDR loans are considered impaired and are reviewed for impairment using fair market methodology or discounted cash flow techniques.
Allowance for Loan Losses
The allowance for loan losses is established as losses are estimated to have occurred through a provision for loan losses charged to earnings. Loan losses are charged against the allowance when management believes the uncollectibility of a loan balance is confirmed. Subsequent recoveries, if any, are credited to the allowance.
The allowance for loan losses is evaluated on a regular basis by management and is based upon management’s periodic review of the collectibility of the loans in light of historical experience, the nature and volume of the loan portfolio, adverse situations that may affect the borrower’s ability to repay, estimated value of any underlying collateral and prevailing economic conditions. This evaluation is inherently subjective as it requires estimates that are susceptible to significant revision as more information becomes available.
Management determines the amount of the allowance for loan losses by utilizing a loan quality grading system to determine risk in the loan portfolio. The allowance consists of general and specific components. When loans are originated, they are assigned a risk rating that is reassessed periodically during the term of the loan through the Bank’s credit review process. The Bank’s loan quality grading methodology assigns a loan quality grade from 1 to 10, where a higher numerical rating represents higher risk. These loan quality-rating categories are a primary factor in determining an appropriate amount for the allowance for loan losses. The loan portfolio is separated by loan type and then by risk rating. Loans not considered impaired are evaluated as a group, by loan type, with a loss rate based on average historical losses and adjusted for qualitative (Q) factors. The Q factors include regional/local economic trends, the health of the real estate market, loan and collateral concentrations, size of borrowing relationships, trends in loan delinquencies and charge-offs and changes in loan classifications and are included in the Bank’s analysis of the allowance for loan losses. Allocations for
90
CASCADE FINANCIAL CORPORATION AND SUBSIDIARIES
Notes to Consolidated Financial Statements
Q factors are based upon management’s review of each of the factors and are applied to all loans included in the general valuation component of the allowance. The Q factors augment the historical loss factors utilized in assessing the allowance to reflect the potential losses embedded in the loan portfolio as real estate property values have declined and sales have slowed. After reviewing all historical and qualitative factors by loan type, management may add a management judgment factor to certain loan types if there are additional concerns in these portfolios that were not identified by using historical or other qualitative factors. Management may also include a negative adjustment to the allowance factor for certain loan types if analysis shows that the historical allowance factor overstates the allocated reserve due to the financial strength of the borrowers/guarantors, the collateral position or other factors in the related portfolio.
Management believes that the allowance for loan losses was adequate as of December 31, 2010. There is, however, no assurance that future loan losses will not exceed the levels provided for in the allowance for loan losses and could possibly result in additional charges to the provision for loan losses. In addition, bank regulatory authorities, as part of their periodic examination of the Bank, may require additional charges to the provision for loan losses in future periods if warranted as a result of their review. Approximately 86.4% of the Bank’s loan portfolio is secured by real estate, and a significant decline in real estate market values may require an increase in the allowance for loan losses. Over the last several years, there has been deterioration in the residential development market, which has led to an increase in non-performing loans and the allowance for loan losses. A continued deterioration in this market or deterioration in other segments of the Bank’s loan portfolio, such as commercial real estate or commercial construction, may lead to additional charges to the provision for loan losses.
Real Estate Owned
Real estate owned includes real estate acquired in settlement of loans. Real estate owned is recorded at the lower of carrying amount or fair value, based upon an appraisal, less estimated costs to sell. Developments and improvements related to the property are capitalized. Any losses recorded at the time a foreclosure occurs are classified as a charge-off against the allowance for loan losses. Losses that result from the ongoing periodic valuation of these properties, are charged to expense in the period identified. Revenue and expenses from operations and subsequent adjustments to the carrying amount of the property are included in noninterest expense in the statement of operations.
Premises and Equipment
Straight-line depreciation is provided over the estimated useful lives of the respective assets, which range from two to forty years. Land is carried at cost. Buildings and equipment are stated at cost less accumulated depreciation. Leasehold improvements are amortized over the estimated useful lives of the improvements, or terms of the related leases, whichever is shorter. The Bank evaluates long-lived assets for impairment whenever events or changes in circumstances indicate that the carrying value of an asset may not be recoverable. If the estimated future cash flows (undiscounted) over the remaining useful life of the asset are less than the carrying value, an impairment loss would be recorded to reduce the related asset to its estimated fair value.
Goodwill and Other Intangible Assets
Net assets of companies acquired in purchase transactions are recorded at fair value at the date of acquisition. Identifiable intangibles are amortized on an accelerated basis over the period benefited and also considered for impairment. Goodwill is not amortized but is reviewed for potential impairment. Impairment analysis of the fair value of goodwill involves a substantial amount of judgment. During the second quarter of 2010, the Corporation analyzed its goodwill to determine whether, and to what extent, its goodwill asset was impaired. The goodwill impairment test includes two steps. Step 1, used to identify potential impairment, compares the estimated fair value of the Corporation with its carrying amount including goodwill. Step 1 inputs used to determine the implied fair value of the Corporation include the quoted market price of the Corporation’s common stock, market prices of common stocks of other banking organizations, common stock trading multiples, and inputs from comparable transactions. In the Step 1 analysis, the carrying amount exceeded its estimated fair value and the second step of the goodwill impairment test was performed to measure the amount of impairment loss, if any. Step 2 of the goodwill impairment test compared the implied estimated fair value of goodwill with the carrying amount of the currently recorded goodwill. The Step 2 analysis indicated that the implied fair value of the goodwill was less than the carrying value of goodwill. As a result of the analysis, the Corporation wrote-off the remaining balance of its goodwill at June 30, 2010.
91
CASCADE FINANCIAL CORPORATION AND SUBSIDIARIES
Notes to Consolidated Financial Statements
The Bank may enter into interest rate exchange agreements (swaps, caps, and floors) with authorized dealers to hedge its exposure to changes in interest rates. Frequently called interest rate derivatives, interest rate swaps, caps and floors possess the advantages of customization of the risk-reward profile of the instrument, minimization of balance sheet leverage and improvement of liquidity. The Bank also formally assesses both at the inception of the hedge and on an ongoing basis, whether the derivative instruments used are highly effective in offsetting changes in fair values or cash flows of hedged items. Changes in the fair value of derivative instruments designated as “cash flow” hedges, to the extent the hedges are highly effective, are recorded in other comprehensive income, net of tax effects. Ineffective portions of cash flow hedges, if any, are recognized in current period earnings. Other comprehensive income or loss is reclassified into current period earnings when the hedged transaction affects earnings.
Transfer of Financial Assets
Transfers of financial assets are accounted for as sales, when control over the assets has been relinquished. Control over transferred assets is deemed to be surrendered when the assets have been isolated from the Bank, the transferee obtains the right (free of conditions that constrain it from taking advantage of that right) to pledge or exchange the transferred assets, and the Bank does not maintain effective control over the transferred assets through an agreement to repurchase them before their maturity.
Marketing Costs
The Bank expenses most marketing costs as they are incurred, but some marketing costs are capitalized and amortized over the useful life of the expenditure. Marketing expense was $797,000, $1.2 million, and $1.1 million for the years ended December 31, 2010, 2009, and 2008, respectively.
Stock-Based Compensation
The fair value of options granted to the Corporation’s employees were estimated on the date of grant using the Black-Scholes valuation model. The application of this valuation model involves assumptions that are judgmental and sensitive in the determination of compensation expense. Assumptions include the risk-free interest rate, expected life of options in years, expected volatility and the dividend yield.
Historical information was the primary basis for the selection of the expected volatility, expected dividend yield and the expected lives of the options. The Corporation has collected a long history of option activity and feels that this historical information presents the best basis for future projections. The risk-free interest rate is selected based upon U.S. Treasury issues with a term equal to the expected life of the option being valued at the time of the grant.
Income Taxes
The Corporation accounts for income taxes as required by FASB ASC Topic 740, Accounting for Income Taxes, under the liability method, which requires recognition of deferred tax assets and liabilities for the expected future income tax consequences of transactions that have been included in the Consolidated Financial Statements. Under this method, deferred tax assets and liabilities are determined based on the difference between the financial statement and tax basis of assets and liabilities using enacted tax rates in effect for the year in which the differences are expected to reverse. A valuation allowance is required on deferred tax assets if it is “more likely than not” that the deferred tax asset will not be realized. Deferred tax assets and liabilities are recognized for the future tax consequences attributable to temporary differences between the financial statement carrying amounts of existing assets and liabilities and their respective tax basis. Deferred tax assets and liabilities are measured using enacted tax rates expected to apply to taxable income in the years in which those temporary differences are expected to be recovered or settled. The effect on deferred tax assets and liabilities of a change in tax rates is recognized in income in the period that includes the enactment date. These calculations are based on many complex factors including estimates of the timing of reversals of temporary differences, the interpretation of federal income tax laws, and a determination of the differences between the tax and the financial reporting basis of assets and liabilities. Actual results could differ significantly from the estimates and interpretations used in determining the current and deferred income tax liabilities.
92
CASCADE FINANCIAL CORPORATION AND SUBSIDIARIES
Notes to Consolidated Financial Statements
(Loss) Earnings per Common Share
The Corporation displays basic and diluted (loss) earnings per common share in the consolidated statements of operations. Basic (loss) earnings per common share is computed by dividing net (loss) income attributable to common stockholders, which is net (loss) income less dividends and accretion of the discount on preferred stock, by the weighted average number of shares outstanding during the year. Diluted (loss) earnings per common share is computed by dividing net (loss) income attributable to common stockholders by diluted weighted average shares outstanding, which includes outstanding common stock equivalent shares, using the treasury stock method, unless such shares are anti-dilutive. Common stock equivalents include stock options and warrants.
Comprehensive (Loss) Income
Comprehensive (loss) income is comprised of net (loss) income and other comprehensive (loss) income. Other comprehensive (loss) income includes items previously recorded directly to equity, such as unrealized gains and losses on securities available-for-sale and unrealized gains and losses on cash flow hedges. In a cash flow hedge, the effective portion of the change in the fair value of the hedging derivative is recorded in accumulated other comprehensive (loss) income and is subsequently reclassified into earnings during the same period in which the hedged item affects earnings. Comprehensive (loss) income is presented within the consolidated statements of stockholders’ equity.
Fair Values of Financial Instruments
Fair values of financial instruments are estimated using relevant market information and other assumptions. Fair value estimates involve uncertainties and matters of significant judgment regarding interest rates, credit risks, prepayments, and other factors, especially in the absence of broad markets for particular items. Changes in assumptions or in market conditions could significantly affect the estimates.
Off-Balance Sheet Credit Related Financial Instruments
In the ordinary course of business, the Corporation enters into commitments to extend credit, including commitments under lines of credit, bankcards, letters of credit, and standby letters of credit and guarantees. Such financial instruments are recorded when they are funded.
Operating Segments
The Corporation and the Bank are managed as a legal entity and not by lines of business. The Bank’s operations include commercial banking services, such as lending activities, deposit products and other cash management services.
Reclassifications
Certain 2009 and 2008 balances have been reclassified to conform with the 2010 presentation. These reclassifications have no effect on previously reported net (loss) income.
Recent Accounting Pronouncements
In January 2010, the FASB issued ASU 2010-06, Fair Value Measurements and Disclosures (Topic 820) – Improving Disclosures about Fair Value Measurements (ASU 10-06). ASU 10-06 revises two disclosure requirements concerning fair value measurements and clarifies two others. It requires separate presentation of significant transfers into and out of Levels 1 and 2 of the fair value hierarchy and disclosure of the reasons for such transfers. It also requires the presentation of purchases, sales, issuances and settlements within Level 3 on a gross basis rather than a net basis. The amendments also
93
CASCADE FINANCIAL CORPORATION AND SUBSIDIARIES
Notes to Consolidated Financial Statements
clarify that disclosures should be disaggregated by class of asset or liability and that disclosures about inputs and valuation techniques should be provided for both recurring and non-recurring fair value measurements. The Corporation’s disclosures about fair value measurements are presented in Note 21 - Fair Value Measurements. The adoption of this ASU did not have a material impact on the Corporation’s Consolidated Financial Statements.
In January 2010, the FASB issued ASU 2010-01, Equity (Topic 505) – Accounting for Distributions to Shareholders with Components of Stock and Cash. The amendments in this update clarify that the stock portion of a distribution to stockholders that allows them to elect to receive cash or stock with a potential limitation on the total amount of cash that all stockholders can elect to receive in the aggregate is considered a share issuance that is reflected in earnings per share prospectively and is not a stock dividend. This update codifies the consensus reached in EITF Issue No. 09-E, Accounting for Stock Dividends, Including Distributions to Shareholders with Components of Stock and Cash. This update is effective for interim and annual periods ending on or after December 15, 2009, and should be applied on a retrospective basis. The implementation of this standard did not have a material impact on the Corporation’s Consolidated Financial Statements.
In February 2010, the FASB issued ASU 2010-09, Subsequent Events (Topic 855) - Amendments to Certain Recognition and Disclosure Requirements. This ASU eliminates the requirement to disclose the date through which a Corporation has evaluated subsequent events and refines the scope of the disclosure requirements for reissued financial statements. This ASU is effective for the first quarter of 2010. This ASU did not have a material impact on the Corporation's Consolidated Financial Statements.
In April 2010, the FASB issued ASU 2010-18, Receivables (Topic 310) - Effect of a Loan Modification When the Loan Is Part of a Pool that is Accounted for as a Single Asset. This ASU clarifies that modifications of loans that are accounted for within a pool under Topic 310-30 do not result in the removal of those loans from the pool even if the modification of those loans would otherwise be considered a troubled debt restructuring. An entity will continue to be required to consider whether the pool of assets in which the loan is included is impaired if expected cash flows for the pool change. No additional disclosures are required with this ASU. The amendments in this ASU are effective for modifications of loans accounted for within pools under Topic 310-30 occurring in the first interim or annual period ending on or after July 15, 2010. The amendments are to be applied prospectively and early application is permitted. Upon initial adoption of the guidance in this ASU, an entity may make a onetime election to terminate accounting for loans as a pool under Topic 310-30. This election may be applied on a pool-by-pool basis and does not preclude an entity from applying pool accounting to subsequent acquisitions of loans with credit deterioration. The adoption of this ASU did not have a material impact on the Corporation's Consolidated Financial Statements.
In July 2010, the FASB issued ASU 2010-20, Receivables (Topic 310) – Amendments to Disclosures about the Credit Quality of Financing Receivables and the Allowance for Credit Losses. The amendments require an entity to provide enhanced or additional disclosures that facilitate financial statement users’ evaluation of the nature of credit risk inherent in the entity’s portfolio of financing receivables, how that risk is analyzed and assessed in arriving at the allowance for credit losses, and the changes and reasons for those changes in the allowance for credit losses. This guidance requires that the enhanced and additional reporting disclosures must be disaggregated by portfolio segment. It is likely that this ASU will have the greatest effect on financial institutions. This ASU is effective for interim and annual reporting periods ending on or after December 15, 2010. The adoption of this ASU requires significant additional disclosures in the Corporation’s financial statements.
In December 2010, the FASB issued ASU 2010-29, Business Combinations (Topic 805) -Disclosure of Supplementary Pro Forma Information for Business Combinations. This update clarifies that if comparative financial statements are presented in disclosure of supplementary pro forma information for a business combination, revenue and earnings of the combined entity should be disclosed as though the business combination occurred as of the beginning of the comparable prior annual reporting period only. Additionally, supplemental pro forma disclosures should include a description of the nature and amount of material, nonrecurring pro forma adjustments included in the reported pro forma revenue and earnings. This update is effective prospectively for business combinations for which the acquisition date is on or after the beginning of the first annual reporting period beginning on or after December 15, 2010. The adoption of this ASU is not expected to have a material impact on the Corporation’s Consolidated Financial Statements.
In December 2010, the FASB issued ASU 2010-28, Intangibles-Goodwill and Other (Topic 350) - When to Perform Step 2 of the Goodwill Impairment Test for Reporting Units with Zero or Negative Carrying Amounts. The amendments in this update modify Step 1 of the goodwill impairment test for reporting units with zero or negative carrying amounts. For those reporting units, an entity is required to perform Step 2 of the goodwill impairment test if it is more likely than not that a goodwill impairment exists. In determining whether it is more likely than not that a goodwill impairment exists, an entity
94
CASCADE FINANCIAL CORPORATION AND SUBSIDIARIES
Notes to Consolidated Financial Statements
should consider whether there are any adverse qualitative factors indicating that an impairment may exist. The qualitative factors are consistent with the existing guidance, which requires that goodwill of a reporting unit be tested for impairment between annual tests if an event occurs or circumstances change that would more likely than not reduce the fair value of a reporting unit below its carrying amount. For public entities, the amendments in this update are effective for fiscal years, and interim periods within those years, beginning after December 15, 2010. Early adoption is not permitted. The adoption of this ASU is not expected to have a material impact on the Corporation’s Consolidated Financial Statements.
In January 2011, the FASB issued ASU 2011-01, Deferral of the Effective Date of Disclosures about Troubled Debt Restructurings in Update No. 2010-20. This ASU temporarily delays the effective date of the disclosures about troubled debt restructurings in Update 2010-20 for public entities. The delay is intended to allow the Board time to complete its deliberations on what constitutes a troubled debt restructuring. The effective date of the new disclosures about troubled debt restructurings for public entities and the guidance for determining what constitutes a troubled debt restructuring will then be coordinated. Currently, that guidance is anticipated to be effective for interim and annual periods ending after June 15, 2011. However, the Corporation has included the disclosures required by this ASU.
Note 2 – Regulatory Actions, Subsequent Event and Going Concern Considerations
While we have begun to see initial signs of improvement in the overall economy, we continue to operate in a difficult environment and have been significantly impacted by the unprecedented credit and economic market turmoil, as well as the recessionary economy that began in the latter part of 2007. Deterioration in real estate markets in our primary geographic market areas of Snohomish, King, Pierce and Skagit counties in western Washington and related declines in property values in those markets over the past three years has led to the recognition of significant credit costs, which has negatively impacted our operating results, capital position and overall financial condition.
Regulatory Actions
FDIC Consent Order. On July 20, 2010, the Board of Directors of the Bank stipulated to the entry of a Consent Order with the FDIC and the Washington State Department of Financial Institutions (DFI), effective July 21, 2010 (FDIC Order). Under the terms of the FDIC Order, the Bank cannot pay any cash dividends or make any payments to its stockholders without the prior written approval of the FDIC and the Washington State DFI. Other material provisions of the FDIC Order require the Bank to:
|
·
|
review the qualifications of the Bank’s management;
|
|
·
|
provide the FDIC with 30 days written notice prior to adding any individual to the Board of Directors of the Bank or employing any individual as a senior executive officer;
|
|
·
|
increase director participation and supervision of Bank affairs;
|
|
·
|
develop a capital plan and increase Tier 1 leverage capital to 10% of the Bank’s average total assets and increase total risk-based capital to 12% of the Bank’s risk-weighted assets by November 18, 2010, and maintain such capital levels, in addition to maintaining a fully funded allowance for loan losses satisfactory to the regulators;
|
|
·
|
eliminate from its books, by charge-off or collection, all loans classified as “loss” and all amounts in excess of the fair value of the underlying collateral for assets classified as “doubtful” in the Report of Visitation dated February 16, 2010 that have not been previously collected or charged-off, by July 30, 2010;
|
|
·
|
reduce the amount of loans classified “substandard” and “doubtful” in the Report of Visitation that have not previously been charged off to not more than 130% of the Bank’s Tier 1 capital and allowance for loan losses, within 180 days;
|
|
·
|
eventually reduce the total of all adversely classified loans by collection, charge-off or sufficiently improving the quality of adversely classified loans to warrant removing any adverse classification, as determined by the regulators;
|
|
·
|
formulate a written plan to reduce the Bank’s levels of nonperforming assets and/or assets listed for “special mention” by the Bank to an acceptable level and to reduce the Bank’s concentrations in commercial real estate and acquisition, development and construction loans;
|
|
·
|
develop a three-year strategic plan and budget with specific goals for total loans, total investment securities and total deposits, and improvements in profitability and net interest margin, and reduction of overhead expenses;
|
|
·
|
submit a written plan for eliminating the Bank’s reliance on brokered deposits, in compliance with FDIC’s rules;
|
95
CASCADE FINANCIAL CORPORATION AND SUBSIDIARIES
Notes to Consolidated Financial Statements
|
·
|
eliminate and/or correct all violations of law set forth in the Report of Visitation and the Report of Examination dated May 18, 2009, and ensure future compliance with all applicable laws and regulations;
|
|
·
|
implement a comprehensive policy for determining the adequacy of the allowance for loan losses satisfactory to the regulators and remedy any deficiency in the allowance in the calendar quarter discovered by a charge to current operating earnings;
|
|
·
|
refrain from extending additional credit with respect to loans charged-off or classified as “loss” and uncollected;
|
|
·
|
refrain from extending additional credit with respect to other adversely classified loans, without the prior approval of a majority of the directors on the Bank Board or its loan committee, and without first collecting all past due interest;
|
|
·
|
implement a liquidity and funds management policy to reduce the Bank’s reliance on brokered deposits and other non-core funding sources; and
|
|
·
|
prepare and submit periodic progress reports to the FDIC and the Washington State DFI.
|
The FDIC Order will remain in effect until modified or terminated by the FDIC and the Washington State DFI. A complete copy of the FDIC Order was filed as Exhibit 10.1 to the Form 8-K filed by the Corporation with the SEC on July 21, 2010.
FRB Written Agreement. Additionally, based on an examination concluded on March 11, 2010, the Corporation entered into a Written Agreement (FRB Agreement) with the FRB of San Francisco on November 4, 2010. Under the FRB Agreement, the Corporation cannot do any of the following without prior written approval of the FRB:
|
·
|
declare or pay any dividends;
|
|
·
|
make any distributions of principal or interest on junior subordinated debentures or trust preferred securities;
|
|
·
|
incur, increase or guarantee any debt; or
|
|
·
|
redeem any outstanding stock.
|
The FRB Agreement also requires the Corporation to:
|
·
|
take steps to ensure that the Bank complies with the FDIC Order;
|
|
·
|
submit a written capital plan that provides for sufficient capitalization of both the Corporation and the Bank within 60 days, and notify the FRB no more than 45 days after the end of any quarter in which any of the Corporation’s capital ratios fall below the approved plan’s minimum ratios;
|
|
·
|
submit a written cash flow projection plan for 2011 within 60 days;
|
|
·
|
comply with FRB regulations governing affiliate transactions, as well as submit a written plan to reimburse the Bank for all payments made by the Bank in violation of sections 23A and 23B of the Federal Reserve Act or to collateralize the loan made by the Bank to the Corporation in accordance with the requirements of sections 23A and 23B of the Federal Reserve Act;
|
|
·
|
comply with notice and approval requirements of the Federal Deposit Insurance Act (FDI Act) related to the appointment of directors and senior executive officers or change in the responsibility of any current senior executive officer;
|
|
·
|
comply with restrictions on paying or agreeing to pay certain indemnification and severance payments without prior written approval; and
|
|
·
|
submit a quarterly process report to the FRB.
|
The Board of Directors is committed to taking all actions necessary to meet each of the requirements of the FDIC Order and the FRB Agreement and believes that the Bank and the Corporation were in compliance with these regulatory actions as of December 31, 2010, except for the requirement in the FDIC Order to increase Tier 1 leverage capital to 10% and risk-based capital to 12% by November 18, 2010. The Board of Directors is working diligently to comply with the requirement to raise capital.
Subsequent Event
Proposed Merger. On March 4, 2011, the Corporation announced that the Corporation, the Bank and Opus Bank entered into a definitive agreement, providing for Opus Bank to acquire the Corporation and the Bank, and for the merger of the Bank into Opus Bank. Opus Bank is a California-chartered bank with its executive offices located in Irvine, California.
96
CASCADE FINANCIAL CORPORATION AND SUBSIDIARIES
Notes to Consolidated Financial Statements
Going Concern Considerations
The consolidated financial statements have been prepared assuming that the Corporation will continue as a going concern. The Corporation and the subsidiary Bank are considered “under-capitalized” as of December 31, 2010. Due to market conditions discussed above and other factors, there is uncertainty about the Corporation’s ability to satisfy regulatory requirements, including restoration of the Bank to capital levels stipulated in the FDIC Order issued by the FDIC and Washington State DFI in July 2010. The FDIC Order required the Bank to develop a capital plan and increase Tier 1 leverage capital to 10% of the Bank’s average total assets and increase total risk-based capital to 12% of the Bank’s risk-weighted assets. The additional capital required to satisfy the requirements of the FDIC Order as of December 31, 2010 was approximately $68.0 million. In addition, the Corporation entered into a Written Agreement with the FRB of San Francisco on November 4, 2010 which required the Corporation to take steps to ensure that the Bank complies with the FDIC Order.
As a part of its most recent capital raising efforts launched late in 2009, the Corporation engaged a highly qualified investment banking firm with expertise in the financial services sector to assist with a review of all strategic opportunities available to the Corporation. On March 4, 2011, the Corporation announced that it had entered into a definitive agreement, providing for Opus Bank to acquire Cascade Financial Corporation and Cascade Bank, and for the merger of Cascade Bank into Opus Bank. See “Proposed Merger” above.
During the second quarter of 2009, the Corporation suspended payment of a quarterly cash dividend and, effective with the fourth quarter of 2009, dividend payments on trust preferred securities were deferred in accordance with provisions of the related indentures. Efforts to improve the Bank’s capital levels through improved internal equity generation were also initiated in conjunction with various cost cutting measures implemented by the bank but elevated loan charge-offs, REO write-downs, legal expenses, foreclosure expenses and FDIC insurance premiums precluded the Corporation from improving capital levels during 2010.
During 2009 and 2010, as a result of declining real estate values, the Corporation took decisive actions to address the deterioration in the construction and land acquisition and development sectors of the loan portfolio resulting from a general and severe deterioration in residential real estate valuations and sales activity. Loan charge-offs of $56.3 million were recognized during 2010, of which over 78% were related to construction and land acquisition and development loans. Loan charge-offs of $34.7 million were recognized during 2009, of which over 87% were related to construction and land acquisition and development loans. Although additional loan loss provisions and charge-offs will likely be recognized during 2011, the Company does not expect the other segments of the portfolio will suffer from extreme losses and, accordingly, that the regulatory capital levels will not be impacted by the same magnitude in 2011 as they were in the previous two years.
Despite the restrictions on issuance and renewal of brokered certificates of deposit which became effective in July 2010, the Bank maintained an adequate liquidity position during the year ended December 31, 2010 through the strength of its core deposit base, issuance of promotional rate retail certificates of deposit and benefit of the recently increased FDIC deposit insurance limits. Additionally, the reduction in loans and the liquidity generated from the sale of foreclosed assets have contributed significantly to the Bank’s liquidity position.
As noted above, the Bank sustained significant credit losses in 2009 and 2010 as a result of the impact of the recession and the related deterioration in the real estate markets on its loan portfolios, more specifically the real estate construction portfolio. While the Bank’s credit losses are not likely to continue at the same level as in 2010, the Bank’s nonperforming assets and related costs remain elevated
97
CASCADE FINANCIAL CORPORATION AND SUBSIDIARIES
Notes to Consolidated Financial Statements
Note 3 - Restricted Assets
Federal Reserve Board regulations require that the Bank maintain certain minimum reserve balances as either cash on hand, in the vault or on deposit with the Federal Reserve Bank. No deposit was required to be held at the Federal Reserve as of December 31, 2010 and 2009, respectively.
Note 4 – Investment Securities
The following table presents the amortized cost, unrealized gains, unrealized losses and fair value of available-for-sale and held-to-maturity securities at December 31, 2010, and December 31, 2009:
|
December 31, 2010
|
||||||||||||||||
|
(Dollars in thousands)
|
Amortized
Cost
|
Gross
Unrealized
Gains
|
Gross
Unrealized
Losses
|
Fair
Value
|
||||||||||||
|
Securities available-for-sale
|
||||||||||||||||
|
Mortgage-backed securities
|
$ | 70,270 | $ | 10 | $ | (3,077 | ) | $ | 67,203 | |||||||
|
Agency notes & bonds
|
116,632 | - | (5,513 | ) | 111,119 | |||||||||||
|
US treasury notes
|
56,346 | - | (62 | ) | 56,284 | |||||||||||
|
Total
|
$ | 243,248 | $ | 10 | $ | (8,652 | ) | $ | 234,606 | |||||||
|
Securities held-to-maturity
|
||||||||||||||||
|
Mortgage-backed securities
|
$ | 25,137 | $ | 755 | $ | (383 | ) | $ | 25,509 | |||||||
|
Agency notes & bonds
|
28,000 | - | (1,216 | ) | 26,784 | |||||||||||
|
Corporate/other
|
775 | - | - | 775 | ||||||||||||
|
Total
|
$ | 53,912 | $ | 755 | $ | (1,599 | ) | $ | 53,068 | |||||||
|
December 31, 2009
|
||||||||||||||||
|
(Dollars in thousands)
|
Amortized
Cost
|
Gross
Unrealized
Gains
|
Gross
Unrealized
Losses
|
Fair
Value
|
||||||||||||
|
Securities available-for-sale
|
||||||||||||||||
|
Mortgage-backed securities
|
$ | 40,997 | $ | 729 | $ | (446 | ) | $ | 41,280 | |||||||
|
Agency notes & bonds
|
188,585 | 88 | (2,148 | ) | 186,525 | |||||||||||
|
Total
|
$ | 229,582 | $ | 817 | $ | (2,594 | ) | $ | 227,805 | |||||||
|
Securities held-to-maturity
|
||||||||||||||||
|
Mortgage-backed securities
|
$ | 15,405 | $ | 504 | $ | - | $ | 15,909 | ||||||||
|
Agency notes & bonds
|
19,997 | - | (187 | ) | 19,810 | |||||||||||
|
Corporate/other
|
775 | - | - | 775 | ||||||||||||
|
Total
|
$ | 36,177 | $ | 504 | $ | (187 | ) | $ | 36,494 | |||||||
98
CASCADE FINANCIAL CORPORATION AND SUBSIDIARIES
Notes to Consolidated Financial Statements
|
December 31, 2010
|
||||||||||||
|
(Dollars in thousands)
|
Amortized
Cost
|
Fair
Value
|
Yield
|
|||||||||
|
Securities available-for-sale (AFS)
|
||||||||||||
|
Agency and US Treasury
|
||||||||||||
|
Due after one through five years
|
$ | 72,845 | $ | 72,207 | 0.93 | % | ||||||
|
Due after five through ten years
|
100,091 | 95,154 | 2.79 | |||||||||
|
Due after ten years
|
42 | 42 | - | |||||||||
|
Subtotal
|
172,978 | 167,403 | 1.99 | |||||||||
|
Mortgage-backed securities
|
||||||||||||
|
Due less than one year
|
140 | 140 | 4.48 | |||||||||
|
Due after one through five years
|
385 | 395 | 4.89 | |||||||||
|
Due after five through ten years
|
69,745 | 66,668 | 3.05 | |||||||||
|
Subtotal
|
70,270 | 67,203 | 3.06 | |||||||||
|
Total securities AFS
|
$ | 243,248 | $ | 234,606 | 2.29 | % | ||||||
|
Securities held-to-maturity (HTM)
|
||||||||||||
|
Agency
|
||||||||||||
|
Due less than one year
|
$ | 28,000 | $ | 26,784 | 2.28 | % | ||||||
|
Due after ten years
|
775 | 775 | 7.50 | |||||||||
|
Subtotal
|
28,775 | 27,559 | 2.43 | |||||||||
|
Mortgage-backed securities
|
||||||||||||
|
Due after one through five years
|
10,106 | 10,662 | 4.55 | |||||||||
|
Due after five through ten years
|
15,031 | 14,847 | 4.18 | |||||||||
|
Subtotal
|
25,137 | 25,509 | 4.34 | |||||||||
|
Total securities HTM
|
$ | 53,912 | $ | 53,068 | 3.43 | % | ||||||
No investment securities were pledged to secure public deposits at December 31, 2010. As of December 31, 2009, the fair value of investment securities pledged to secure public deposits was $29.6 million. The fair value of investment securities pledged to the FHLB totaled $15.9 million and $15.7 million at December 31, 2010 and 2009, respectively. The fair value of investment securities pledged to fund repurchase agreements was $212.9 million at December 31, 2010, and $199.2 million at December 31, 2009.
99
CASCADE FINANCIAL CORPORATION AND SUBSIDIARIES
Notes to Consolidated Financial Statements
The following table presents gross unrealized losses and the fair value of available-for-sale and held-to-maturity securities at December 31, 2010 and December 31, 2009:
|
December 31, 2010
|
||||||||||||||||||||||||
|
Fair
Value
|
Gross
Unrealized
Losses
Less Than
1 Year
|
Fair
Value
|
Gross
Unrealized
Losses
More Than
1 Year
|
Total
|
||||||||||||||||||||
|
(Dollars in thousands)
|
Fair
Value
|
Unrealized
Losses
|
||||||||||||||||||||||
|
Securities available-for-sale
|
||||||||||||||||||||||||
|
Mortgage-backed securities
|
$ | 66,668 | $ | (3,077 | ) | $ | - | $ | - | $ | 66,668 | $ | (3,077 | ) | ||||||||||
|
Agency notes & bonds
|
110,987 | (5,513 | ) | - | - | 110,987 | (5,513 | ) | ||||||||||||||||
|
US Treasury notes
|
56,284 | (62 | ) | - | - | 56,284 | (62 | ) | ||||||||||||||||
|
Total
|
$ | 233,939 | $ | (8,652 | ) | $ | - | $ | - | $ | 233,939 | $ | (8,652 | ) | ||||||||||
|
Securities held-to-maturity
|
||||||||||||||||||||||||
|
Mortgage-backed securities
|
$ | 6,046 | $ | (383 | ) | $ | - | $ | - | $ | 6,046 | $ | (383 | ) | ||||||||||
|
Agency notes & bonds
|
26,784 | (1,216 | ) | - | - | 26,784 | (1,216 | ) | ||||||||||||||||
|
Total
|
$ | 32,830 | $ | (1,599 | ) | $ | - | $ | - | $ | 32,830 | $ | (1,599 | ) | ||||||||||
|
December 31, 2009
|
||||||||||||||||||||||||
|
Fair
Value
|
Gross
Unrealized
Losses
Less Than
1 Year
|
Fair
Value
|
Gross
Unrealized
Losses
More Than
1 Year
|
Total
|
||||||||||||||||||||
|
(Dollars in thousands)
|
Fair
Value
|
Unrealized
Losses
|
||||||||||||||||||||||
|
Securities available-for-sale
|
||||||||||||||||||||||||
|
Mortgage-backed securities
|
$ | 16,828 | $ | (375 | ) | $ | 3,597 | $ | (71 | ) | $ | 20,425 | $ | (446 | ) | |||||||||
|
Agency notes & bonds
|
140,981 | (2,148 | ) | - | - | 140,981 | (2,148 | ) | ||||||||||||||||
|
Total
|
$ | 157,809 | $ | (2,523 | ) | $ | 3,597 | $ | (71 | ) | $ | 161,406 | $ | (2,594 | ) | |||||||||
|
Securities held-to-maturity
|
||||||||||||||||||||||||
|
Agency notes & bonds
|
$ | 19,810 | $ | (187 | ) | $ | - | $ | - | $ | 19,810 | $ | (187 | ) | ||||||||||
|
Total
|
$ | 19,810 | $ | (187 | ) | $ | - | $ | - | $ | 19,810 | $ | (187 | ) | ||||||||||
At December 31, 2010, the Corporation had no securities in its available-for-sale portfolio or held-to-maturity portfolio with unrealized losses greater than one year. Securities having fair values less than amortized cost and containing unrealized losses are evaluated periodically by the Corporation for other-than-temporary impairment. In the analysis for December 31, 2010, the Corporation determined that the decline in value was temporary and related to the change in market interest rates since purchase. All investment securities were rated AAA for credit quality by at least one major rating agency. The decline in value was not related to any company or industry specific event. The Corporation anticipates full recovery of par value with respect to these securities at maturity or sooner in the event of a more favorable market interest rate environment.
Prior to June 30, 2009, the Corporation owned preferred shares issued by the Federal National Mortgage Association (FNMA) with a par value of $10.0 million and the Federal Home Loan Mortgage Corporation (FHLMC) with a par value of $10.0 million. On September 7, 2008, the Federal Housing Finance Agency (FHFA) announced it was placing FNMA and FHLMC under conservatorship and would eliminate dividends on FNMA and FHLMC common and preferred stock. The Corporation recorded a pre-tax impairment charge of $17.3 million, resulting in a charge of $11.3 million, net of taxes, to third quarter 2008 earnings. At March 31, 2009, the Corporation adjusted the value of these securities from $1.3 million to $436,000, which resulted in an additional charge of $858,000 taken in the first quarter of 2009. During the second quarter of 2009, these preferred shares of FNMA and FHLMC were sold for an aggregate amount of $425,000, resulting in an additional loss of $11,000, which was included in gain on sales/calls of securities available-for-sale.
100
CASCADE FINANCIAL CORPORATION AND SUBSIDIARIES
Notes to Consolidated Financial Statements
At December 31, 2010, the Bank held FHLB of Seattle stock with a par value of $11.9 million. The Corporation does not anticipate any impairment charges associated with these instruments. The FHLB stock does not have readily determinable fair value and the equity ownership rights are more limited than would be the case for a public company because of the Federal Housing Finance Agency’s (FHFA) oversight role in budgeting and approving dividends. FHLB stock is generally viewed as a long-term investment and as a restricted investment security, which is carried at cost. Thus, when evaluating FHLB stock for impairment, its value is determined based on the ultimate recoverability of the par value rather than by recognizing temporary declines in value.
Under FHFA regulations, a Federal Home Loan Bank that fails to meet any regulatory capital requirement may not declare a dividend or redeem or repurchase capital stock in excess of what is required for members’ current loans. Moody’s Investors Service’s (Moody’s) current assessment of the FHLB’s portfolios indicates that the true economic losses embedded in these securities are significantly less than the accounting impairments would suggest and are manageable given the FHLB’s capital levels. According to Moody’s, the large difference between the expected economic losses and the mark-to-market impairment losses for accounting purposes is attributed to market illiquidity, de-leveraging and stress in the credit market in general. Furthermore, Moody’s believes that the FHLB has the ability to hold the securities until maturity. The FHLB has access to the U.S. Government-Sponsored Enterprise Credit Facility, a secured lending facility that serves as a liquidity backstop, substantially reducing the likelihood that the FHLB would need to sell securities to raise liquidity and, thereby, cause the realization of large economic losses. In addition, the Federal Reserve has begun to purchase direct debt obligations of Freddie Mac, Fannie Mae and the FHLB. Moody’s has stated that their AAA senior debt rating and Prime-1 short-term debt rating are likely to remain unchanged based on expectations that the FHLB has a very high degree of government support. Based on the above, the Corporation has determined there is no impairment of the FHLB stock investment as of December 31, 2010.
Proceeds from the sales of securities available-for-sale and gross realized gains and losses are summarized as follows for the years ended December 31, 2010, 2009, and 2008:
|
(Dollars in thousands)
|
||||||||||||
|
Years Ended December 31,
|
Proceeds
|
Gains
|
Losses
|
|||||||||
|
2010
|
$ | 558,600 | $ | 8,790 | $ | (3 | ) | |||||
|
2009
|
189,076 | 1,599 | (11 | ) | ||||||||
|
2008
|
88,184 | 374 | (89 | ) | ||||||||
101
CASCADE FINANCIAL CORPORATION AND SUBSIDIARIES
Notes to Consolidated Financial Statements
Note 5 – Loans and Allowance for Loan Losses
A summary of loans at December 31, 2010, and 2009, follows:
|
December 31,
|
||||||||
|
(Dollars in thousands)
|
2010
|
2009
|
||||||
|
Business
|
$ | 400,047 | $ | 469,196 | ||||
|
R/E construction(1)
|
||||||||
|
Spec construction
|
25,303 | 59,360 | ||||||
|
Land acquisition & development/land
|
54,142 | 146,164 | ||||||
|
Multifamily/custom construction
|
- | 18,923 | ||||||
|
Commercial R/E construction
|
2,333 | 32,470 | ||||||
|
Total R/E construction
|
81,778 | 256,917 | ||||||
|
Commercial R/E
|
201,885 | 183,286 | ||||||
|
Multifamily
|
89,350 | 82,418 | ||||||
|
Home equity/consumer
|
29,964 | 31,738 | ||||||
|
Residential(2)
|
194,677 | 179,133 | ||||||
|
Total loans
|
$ | 997,701 | $ | 1,202,688 | ||||
|
Deferred loan fees
|
(3,934 | ) | (3,575 | ) | ||||
|
Allowance for loan losses
|
(26,106 | ) | (25,900 | ) | ||||
|
Loans, net
|
$ | 967,661 | $ | 1,173,213 | ||||
(1) Real estate construction loans are net of loans in process.
(2) Loans held-for-sale, included in Residential loans, were $0 at December 31, 2010 and $250 at December 31, 2009 and are not considered material.
The allowance for loan losses (ALLL) is an estimate of the total potential principal loss inherent in the loan portfolio as of the reporting date. The ALLL is maintained based on a review of several factors. These factors include delinquency trends, level and trend of adversely classified loans, historical loss experience, additional management judgment, peer group and industry review, impaired loan analyses and qualitative (Q) factors. These Q factors include regional/local economic trends, health of the real estate market, loan and collateral concentrations, size of borrowing relationships, change in loan delinquencies and charge-offs and changes in classifications.
The allowance consists of general and specific components. To determine the general component of the allowance, for loans not identified as impaired, the loan portfolio is separated by loan type and then by risk rating. The loan types are as follows: business and business real estate (combined below, but analyzed separately), real estate construction, commercial real estate, multifamily, home equity/consumer and residential. A loss factor is assigned based on a two-year historical loss average for each loan type. Management believes that a two-year historical loss factor is appropriate based upon the current credit cycle. Historical losses are then adjusted to incorporate Q factors as noted above. Specific Q factors are assigned to each loan type based on the risks identified in each segment of the loan portfolio. Management has also added an additional management judgment factor after thorough analysis of the historical trends and Q factors as well as the breakdown between special mention and pass loans.
For the specific portion of the reserve, loans identified as impaired are reviewed individually to determine if specific reserves are needed. A few smaller dollar loans are grouped and reviewed in pools. Any portion of the ALLL that is not allocated to the general or specific components of the reserve is considered to be unallocated.
Loan risk ratings are a critical part of the ALLL process. Credit administration management actively reviews loan risk ratings as part of their ongoing review of credits. Classified Loan Status Reports are reviewed monthly by the Asset Review Committee. At December 31, 2010, substantially all of the substandard loans were individually reviewed for impairment.
The total allowance reflects management’s estimate of loan losses inherent in the loan portfolio and management considers the allowance of $26.1 million adequate to cover loan losses at December 31, 2010.
102
CASCADE FINANCIAL CORPORATION AND SUBSIDIARIES
Notes to Consolidated Financial Statements
The following table presents the changes in the allowance for loan losses by type:
|
(Dollars in thousands)
|
Year Ended December 31, 2010
|
|||||||||||||||||||||||||||||||
|
Allowance for Loan Losses
|
Business
|
R/E
Construction
|
Commercial
R/E
|
Multi-
family
|
Home
Equity/ Consumer
|
Residential
|
Unallocated
|
Total
|
||||||||||||||||||||||||
|
Balance at beginning of period
|
$ | 8,565 | $ | 11,340 | $ | 2,845 | $ | 865 | $ | 562 | $ | 1,708 | $ | 15 | $ | 25,900 | ||||||||||||||||
|
Charge-Offs
|
(11,025 | ) | (44,344 | ) | (783 | ) | - | (647 | ) | (574 | ) | - | (57,373 | ) | ||||||||||||||||||
|
Recoveries
|
426 | 518 | - | - | 101 | - | - | 1,045 | ||||||||||||||||||||||||
|
Off-balance sheet commitments
|
- | - | - | - | - | - | 19 | 19 | ||||||||||||||||||||||||
|
Provision for losses
|
11,471 | 43,077 | 683 | 545 | 626 | 147 | (34 | ) | 56,515 | |||||||||||||||||||||||
|
Ending balance
|
$ | 9,437 | $ | 10,591 | $ | 2,745 | $ | 1,410 | $ | 642 | $ | 1,281 | $ | - | $ | 26,106 | ||||||||||||||||
|
Loans individually evaluated for impairment
|
$ | 39,619 | $ | 32,074 | $ | 55,956 | $ | 11,162 | $ | 244 | $ | 3,441 | $ | - | $ | 142,496 | ||||||||||||||||
|
Loans evaluated in a group for impairment *
|
- | - | - | - | 804 | 699 | - | 1,503 | ||||||||||||||||||||||||
|
Total impaired
|
39,619 | 32,074 | 55,956 | 11,162 | 1,048 | 4,140 | - | 143,999 | ||||||||||||||||||||||||
|
Loans not impaired
|
360,428 | 49,704 | 145,929 | 78,188 | 28,916 | 190,537 | - | 853,702 | ||||||||||||||||||||||||
|
Total loans
|
$ | 400,047 | $ | 81,778 | $ | 201,885 | $ | 89,350 | $ | 29,964 | $ | 194,677 | - | $ | 997,701 | |||||||||||||||||
* Small dollar, homogeneous loans
The following table presents the changes in the allowance for loan losses for the periods presented:
|
Years Ended December 31,
|
||||||||
|
(Dollars in thousands)
|
2009
|
2008
|
||||||
|
Beginning balance
|
$ | 16,439 | $ | 11,653 | ||||
|
Charge-offs
|
(35,013 | ) | (3,785 | ) | ||||
|
Recoveries
|
275 | 1,282 | ||||||
|
Provision for losses
|
44,175 | 7,240 | ||||||
|
Off-balance sheet commitments
|
24 | 49 | ||||||
|
Ending balance
|
$ | 25,900 | $ | 16,439 | ||||
A loan is considered impaired when, based on current information and events, the Bank determines that it is probable it will not be able to collect all amounts due according to the loan contract, including scheduled interest payments. When the Bank identifies a loan as impaired, it measures the impairment using discounted cash flows, except when the sole remaining source of the repayment for the loan is the liquidation of the collateral. In these cases, the Bank uses the current fair value of the collateral, less selling costs, instead of discounted cash flows. If the Bank determines that the value of the impaired loan is less than the recorded investment in the loan, it either recognizes an impairment reserve as a specific component to be provided for in the allowance for loan losses or charges-off the impaired balance on collateral dependent loans if it is determined that such amount represents a confirmed loss. The combination of the general allowance calculation and the specific reserve on impaired loans resulted in the total allowance for loan losses.
At December 31, 2010, the recorded investment in loans classified as impaired totaled $144.0 million. Included in this total are $40.0 million in impaired loans with a corresponding specific reserve (included in the allowance for loan losses) of $5.8 million. The remaining $104.0 million in impaired loans are considered collateral dependent and have been written-down to their estimated net realizable value. At December 31, 2009, the total recorded investment in impaired loans was $183.7 million, with a corresponding specific reserve of $6.4 million.
At December 31, 2010 and December 31, 2009, impaired loans of $63.8 million and $26.6 million, respectively, were classified as performing troubled debt restructured (TDR) loans. The restructurings were granted in response to borrower financial difficulty, and generally provide for a temporary modification of loan repayment terms. In order for a restructured loan to be considered performing and on accrual status, the loan’s collateral coverage generally will be greater than or equal to 100% of the loan balance (net of specific reserves as applicable), the loan is current on payments, and the borrower must either prefund an interest reserve or have demonstrated the ability to make payments from a verified source of cash flow.
103
CASCADE FINANCIAL CORPORATION AND SUBSIDIARIES
Notes to Consolidated Financial Statements
The following table shows the recorded investment, unpaid principal balance and specific reserve for impaired loans:
|
December 31, 2010
|
||||||||||||
|
(Dollars in thousands)
|
Recorded
Investment
(Loan Balance
Less Charge-Off)
|
Unpaid
Principal
Balance (Gross
of Charge-off)
|
Specific
Reserve
|
|||||||||
|
Impaired Loans With No Specific Reserve:
|
||||||||||||
|
Business
|
$ | 27,435 | $ | 28,315 | $ | - | ||||||
|
R/E construction
|
||||||||||||
|
Spec construction
|
14,753 | 19,410 | - | |||||||||
|
Land acquisition & development/land
|
4,303 | 16,454 | - | |||||||||
|
Total R/E construction
|
19,056 | 35,864 | - | |||||||||
|
Commercial R/E
|
51,472 | 52,812 | - | |||||||||
|
Multifamily
|
2,976 | 2,976 | - | |||||||||
|
Home equity/consumer
|
244 | 244 | - | |||||||||
|
Residential
|
2,808 | 3,055 | - | |||||||||
|
Total
|
103,991 | 123,266 | - | |||||||||
|
Impaired Loans With Specific Reserve:
|
||||||||||||
|
Business
|
12,184 | 12,218 | 1,215 | |||||||||
|
R/E construction
|
||||||||||||
|
Spec construction
|
875 | 875 | - | |||||||||
|
Land acquisition & development/land
|
12,144 | 13,615 | 2,416 | |||||||||
|
Total R/E construction
|
13,019 | 14,490 | 2,416 | |||||||||
|
Commercial R/E
|
4,483 | 4,483 | 1,148 | |||||||||
|
Multifamily
|
8,186 | 8,186 | 886 | |||||||||
|
Home equity/consumer
|
804 | 817 | 17 | |||||||||
|
Residential
|
1,332 | 1,332 | 119 | |||||||||
|
Total
|
40,008 | 41,526 | 5,801 | |||||||||
|
Total Impaired Loans:
|
||||||||||||
|
Business
|
39,619 | 40,533 | 1,215 | |||||||||
|
R/E construction
|
||||||||||||
|
Spec construction
|
15,628 | 20,285 | - | |||||||||
|
Land acquisition & development/land
|
16,447 | 30,069 | 2,416 | |||||||||
|
Total R/E construction
|
32,075 | 50,354 | 2,416 | |||||||||
|
Commercial R/E
|
55,955 | 57,296 | 1,148 | |||||||||
|
Multifamily
|
11,162 | 11,162 | 886 | |||||||||
|
Home equity/consumer
|
1,048 | 1,060 | 17 | |||||||||
|
Residential
|
4,140 | 4,387 | 119 | |||||||||
|
Total
|
$ | 143,999 | $ | 164,792 | $ | 5,801 | ||||||
104
CASCADE FINANCIAL CORPORATION AND SUBSIDIARIES
Notes to Consolidated Financial Statements
The following tables show summarized information on impaired loans:
|
December 31,
|
||||||||
|
(Dollars in thousands)
|
2010
|
2009
|
||||||
|
Impaired loans without an allowance
|
$ | 103,991 | $ | 125,443 | ||||
|
Impaired loans with an allowance
|
40,008 | 58,296 | ||||||
|
Total impaired loans
|
$ | 143,999 | $ | 183,739 | ||||
|
Allowance for loan losses related to impaired loans
|
$ | 5,801 | $ | 6,422 | ||||
|
Total nonperforming (nonaccruing) loans
|
48,098 | 106,096 | ||||||
|
Total loans past-due ninety days or more and still accruing
|
- | 247 | ||||||
|
Performing TDR loans*
|
$ | 63,773 | $ | 26,635 | ||||
|
Nonperforming TDR loans*
|
30,399 | 25,229 | ||||||
|
Total TDR loans
|
$ | 94,172 | $ | 51,864 | ||||
|
*included in total impaired loans
|
||||||||
|
Years Ended December 31,
|
||||||||||||
|
2010
|
2009
|
2008
|
||||||||||
|
Average investment in impaired loans
|
$ | 153,010 | $ | 190,399 | $ | 47,795 | ||||||
|
Interest income recognized on impaired loans
|
6,716 | 5,239 | 4,525 | |||||||||
Federal regulations provide for the classification of loans as substandard, doubtful and loss. A substandard asset is inadequately protected by the current net worth and paying capacity of the debtor or the collateral pledged. These assets have well defined weaknesses that jeopardize the liquidation of the debt. They are characterized by the distinct possibility that the Bank will sustain some loss if the deficiencies are not corrected. Loans classified doubtful have the same concerns as substandard but with additional likelihood that collection or liquidation in full, based on existing facts, conditions and values, is highly questionable and improbable. Loans designated loss should be fully charged-off since these loans are determined to be uncollectible and of such little value that their continuance as assets is not warranted.
The Bank uses an additional seven categories to describe loans that are not classified. These categories include special mention and watch loans, which include borrowers with declining earnings, strained cash flow and downward trends requiring close management attention. Loans considered pass include five separate categories of loans from substantially risk free to average risk.
The following table shows the loan portfolio by loan classification and type of loan:
|
December 31, 2010
|
||||||||||||||||||||
|
(Dollars in thousands)
|
Doubtful
|
Substandard
|
Special Mention/Watch
|
Pass
|
Total
|
|||||||||||||||
|
Business
|
$ | 337 | $ | 39,321 | $ | 67,905 | $ | 292,484 | $ | 400,047 | ||||||||||
|
R/E construction
|
||||||||||||||||||||
|
Spec construction
|
- | 15,628 | 8,104 | 1,571 | 25,303 | |||||||||||||||
|
Land acquisition & development/land
|
128 | 16,319 | 23,310 | 14,385 | 54,142 | |||||||||||||||
|
Commercial R/E construction
|
- | - | - | 2,333 | 2,333 | |||||||||||||||
|
Total R/E construction
|
128 | 31,947 | 31,414 | 18,289 | 81,778 | |||||||||||||||
|
Commercial R/E
|
- | 55,955 | 30,665 | 115,265 | 201,885 | |||||||||||||||
|
Multifamily
|
- | 11,161 | 17,506 | 60,683 | 89,350 | |||||||||||||||
|
Home equity/consumer
|
- | 1,532 | 427 | 28,005 | 29,964 | |||||||||||||||
|
Residential
|
- | 3,684 | 7,934 | 183,059 | 194,677 | |||||||||||||||
|
Total
|
$ | 465 | $ | 143,600 | $ | 155,851 | $ | 697,785 | $ | 997,701 | ||||||||||
105
CASCADE FINANCIAL CORPORATION AND SUBSIDIARIES
Notes to Consolidated Financial Statements
|
(Dollars in thousands)
|
December 31, 2010
|
|||||||||||||||||||||||
|
Age Analysis of Past Due Loans
|
30-59 Days Past Due
|
60-89 Days Past Due
|
Greater Than 90
Days Past Due
|
Total
Past Due
|
Current
|
Total
Loans
|
||||||||||||||||||
|
Business
|
$ | 1,949 | $ | 160 | $ | 2,474 | $ | 4,583 | $ | 395,464 | $ | 400,047 | ||||||||||||
|
R/E construction
|
254 | 619 | 11,537 | 12,410 | 69,368 | 81,778 | ||||||||||||||||||
|
Commercial R/E
|
- | - | 10,962 | 10,962 | 190,923 | 201,885 | ||||||||||||||||||
|
Multifamily
|
167 | - | - | 167 | 89,183 | 89,350 | ||||||||||||||||||
|
Home equity/consumer
|
95 | 157 | 697 | 949 | 29,015 | 29,964 | ||||||||||||||||||
|
Residential
|
1,087 | 744 | 796 | 2,627 | 192,050 | 194,677 | ||||||||||||||||||
|
Total
|
$ | 3,552 | $ | 1,680 | $ | 26,466 | $ | 31,698 | $ | 966,003 | $ | 997,701 | ||||||||||||
The following table shows the loan portfolio by performing and nonperforming status by type of loan:
|
December 31, 2010
|
||||||||||||
|
(Dollars in thousands)
|
Performing
|
Nonperforming
|
Total
|
|||||||||
|
Business
|
$ | 395,700 | $ | 4,347 | $ | 400,047 | ||||||
|
R/E construction
|
||||||||||||
|
Spec construction
|
15,598 | 9,705 | 25,303 | |||||||||
|
Land acquisition & development/land
|
51,294 | 2,848 | 54,142 | |||||||||
|
Commercial R/E construction
|
2,333 | - | 2,333 | |||||||||
|
Total R/E construction
|
69,225 | 12,553 | 81,778 | |||||||||
|
Commercial R/E
|
173,533 | 28,352 | 201,885 | |||||||||
|
Multifamily
|
89,350 | - | 89,350 | |||||||||
|
Home equity/consumer
|
28,916 | 1,048 | 29,964 | |||||||||
|
Residential
|
192,879 | 1,798 | 194,677 | |||||||||
|
Total
|
$ | 949,603 | $ | 48,098 | $ | 997,701 | ||||||
The following table shows the number of TDR loans and the recorded investment as of December 31, 2010. There were no TDR loans where debt was forgiven, so the recorded investment was the same before and after the modification. The Bank is committed to fund the undisbursed balance on TDR loans, totaling $253,000 as of December 31, 2010.
|
(Dollars in thousands)
|
December 31, 2010
|
|||||||
|
TDR Loans
|
Number
of Loans
|
Outstanding
Balance
|
||||||
|
Business
|
25 | $ | 19,614 | |||||
|
R/E construction
|
12 | 30,373 | ||||||
|
Commercial R/E
|
4 | 32,238 | ||||||
|
Multifamily
|
4 | 8,619 | ||||||
|
Home equity/consumer
|
1 | 244 | ||||||
|
Residential
|
5 | 3,084 | ||||||
|
Total
|
51 | $ | 94,172 | |||||
106
CASCADE FINANCIAL CORPORATION AND SUBSIDIARIES
Notes to Consolidated Financial Statements
Note 6 – Real Estate Owned
The following table presents activity of real estate owned for the periods presented:
|
December 31,
|
||||||||||||
|
(Dollars in thousands)
|
2010
|
2009
|
2008
|
|||||||||
|
Beginning balance
|
$ | 18,842 | $ | 1,446 | $ | - | ||||||
|
Additions to REO (1)
|
47,622 | 23,808 | 5,883 | |||||||||
|
Capitalized costs
|
6,329 | 1,164 | - | |||||||||
|
Paydowns/sales
|
(26,956 | ) | (6,087 | ) | (4,434 | ) | ||||||
|
Write-downs/losses
|
(11,425 | ) | (1,489 | ) | (3 | ) | ||||||
|
Ending balance
|
$ | 34,412 | $ | 18,842 | $ | 1,446 | ||||||
|
(1) Includes a $287 addition to REO related to the payoff of a first lien and $63 related to a single-family residence received in partial satisfaction of a loan.
|
||||||||||||
REO totaled $34.4 million at December 31, 2010 and $18.8 million at December 31, 2009. REO as of December 31, 2010 consisted of $23.7 million in construction/land development projects, $3.8 million in single-family residences, $1.7 million in a multifamily condominium project, $5.0 million in commercial real estate and $239,000 in residential construction.
Note 7 - Premises and Equipment
A summary of premises and equipment follows:
|
December 31,
|
|||||||||
|
(Dollars in thousands)
|
Estimated Useful Lives
|
2010
|
2009
|
||||||
|
Land
|
$ | 4,291 | $ | 4,291 | |||||
|
Buildings
|
40 years
|
13,508 | 13,197 | ||||||
|
Leasehold improvements
|
Lease term
|
2,589 | 2,589 | ||||||
|
Furniture and equipment
|
2-10 years
|
13,646 | 13,976 | ||||||
|
Subtotal
|
34,034 | 34,053 | |||||||
|
Accumulated depreciation and amortization
|
(20,709 | ) | (19,527 | ) | |||||
|
Total
|
$ | 13,325 | $ | 14,526 | |||||
Total depreciation and amortization expense was $2.0 million for the year ended December 31, 2010, $2.3 million for the year ended December 31, 2009, and $2.1 million for the year ended December 31, 2008.
Note 8 – Goodwill and Other Intangible Assets
During the second quarter of 2010, the Corporation recorded a goodwill impairment charge of $12.9 million. The non-cash goodwill impairment represented the write-off of the remaining balance of the goodwill recorded from a prior bank acquisition. The goodwill impairment charge did not impact liquidity, operations, tangible capital or regulatory capital ratios. The Corporation records impairment losses as charges to other expense and adjustments to the carrying value of goodwill.
The Corporation recorded goodwill from a previous bank acquisition. The Corporation evaluates goodwill and intangibles for impairment at least on an annual basis, and more often if a triggering event occurs. In the second quarter of 2010, the Corporation analyzed its goodwill for further impairment. In order to determine the fair value of its goodwill, the Corporation employed the Control Premium approach and the Comparable Transactions approach. The Control Premium approach used the Corporation’s trading multiples of price-to-earnings, price-to-book value and price-to-tangible book value to estimate the Corporation’s fair value and then adjusted upwards for an appropriate premium to reflect an acquisition of control. The Comparable Transactions approach reflected pricing ratios paid by third parties acquiring control of banking companies with similar characteristics in recent periods, and these multiples were used to develop a range of fair values for acquiring control of the Corporation.
107
CASCADE FINANCIAL CORPORATION AND SUBSIDIARIES
Notes to Consolidated Financial Statements
During the second quarter of 2009, the Corporation determined that goodwill impairment had occurred, and at that time wrote off $11.7 million of its $24.6 million in recorded goodwill. This was the result of the significant decline in the Corporation’s stock price and market capitalization, coupled with the significant loss recorded during the quarter and in conjunction with similar declines in the value of most financial institutions.
The Corporation had other intangible assets related to acquired depository relationships of $211,000 as of December 31, 2010, which will be fully amortized in two years.
Note 9 – Deposits
Deposits are summarized as follows:
|
December 31,
|
||||||||
|
(Dollars in thousands)
|
2010
|
2009
|
||||||
|
Noninterest-bearing checking accounts
|
$ | 110,042 | $ | 99,724 | ||||
|
Interest-bearing checking accounts
|
227,524 | 345,198 | ||||||
|
Money market deposit accounts
|
164,944 | 123,129 | ||||||
|
Savings accounts
|
12,001 | 10,001 | ||||||
|
Certificates of deposit
|
593,043 | 561,722 | ||||||
|
Total
|
$ | 1,107,554 | $ | 1,139,774 | ||||
Included in the amounts above are $105.4 million and $163.0 million in brokered deposits as of December 31, 2010 and 2009, respectively.
The following table indicates the amount of the Bank’s jumbo certificates of deposit by time remaining until maturity at December 31, 2010. Jumbo certificates of deposit require minimum deposits of $100,000 and rates paid on such accounts are negotiable.
|
December 31,
|
||||||||
|
(Dollars in thousands)
|
2010
|
2009
|
||||||
|
Three months or less
|
$ | 13,044 | $ | 63,879 | ||||
|
Over three through six months
|
5,897 | 36,476 | ||||||
|
Over six through twelve months
|
19,527 | 31,857 | ||||||
|
Over twelve months
|
2,545 | 13,963 | ||||||
|
Total
|
$ | 41,013 | $ | 146,175 | ||||
Maturities for all certificates of deposits at December 31, 2010, are as follows:
|
(Dollars in thousands)
|
||||
|
Years Ended December 31,
|
||||
|
2011
|
$ | 535,229 | ||
|
2012
|
30,917 | |||
|
2013
|
8,562 | |||
|
2014
|
13,385 | |||
|
Thereafter
|
4,950 | |||
|
Total
|
$ | 593,043 | ||
108
CASCADE FINANCIAL CORPORATION AND SUBSIDIARIES
Notes to Consolidated Financial Statements
|
Years Ended December 31,
|
||||||||||||
|
(Dollars in thousands)
|
2010
|
2009
|
2008
|
|||||||||
|
Checking and money market accounts
|
$ | 4,182 | $ | 3,951 | $ | 8,514 | ||||||
|
Savings accounts and certificates of deposits
|
10,833 | 13,113 | 18,701 | |||||||||
|
Total
|
$ | 15,015 | $ | 17,064 | $ | 27,215 | ||||||
Note 10 - FHLB Advances
FHLB advances are summarized as follows:
|
December 31,
|
||||||||||||||||
|
(Dollars in thousands)
|
2010
|
2009
|
||||||||||||||
|
Maturity Date
|
Amount
|
Weighted Average Interest Rate
|
Amount
|
Weighted Average Interest Rate
|
||||||||||||
|
December 31, 2010
|
$ | — | — | % | $ | — | — | % | ||||||||
|
2011
|
— | — | 10,000 | 3.88 | ||||||||||||
|
2012
|
— | — | 40,000 | 4.33 | ||||||||||||
|
2013
|
— | — | 30,000 | 3.61 | ||||||||||||
|
2014
|
— | — | 10,000 | 3.29 | ||||||||||||
|
2015
|
10,000 | 3.23 | — | — | ||||||||||||
|
Thereafter
|
149,000 | 3.18 | 149,000 | 4.52 | ||||||||||||
|
Total
|
$ | 159,000 | 3.19 | % | $ | 239,000 | 4.29 | % | ||||||||
|
Years Ended December 31,
|
||||||||
|
(Dollars in thousands)
|
2010
|
2009
|
||||||
|
Maximum amount of outstanding FHLB advances at any month-end
|
$ | 239,000 | $ | 249,000 | ||||
|
Average amount of outstanding FHLB advances during the year
|
220,370 | 243,904 | ||||||
During the year, the Bank transitioned from a blanket pledge collateral agreement with the FHLB of Seattle to a custodial agreement. Under the terms of this agreement, the Bank’s future borrowings from the FHLB are currently limited to overnight cash management advances (CMA), or short term advances with maturities of 90 days or less. The Bank had $159.0 million in floating-rate, option-free advances and a $40.0 million letter of credit outstanding as of December 31, 2010. The letter of credit was utilized to secure public deposits. The Bank had adequate collateral pledged to support the total credit outstanding at December 31, 2010.
FHLB advances and letters of credit are collateralized by otherwise unencumbered permanent residential mortgages, investment grade securities, and other eligible real estate mortgages. Federal statute requires all members of the FHLB to maintain collateral on FHLB borrowings and letters of credit equivalent to the amount of credit outstanding on a daily basis.
Note 11 - Securities Sold Under Agreements to Repurchase and Lines of Credit
Securities Sold Under Agreements to Repurchase
The Corporation enters into sales of securities under agreements to repurchase that are treated as financing arrangements. Accordingly, the obligations to repurchase securities sold are reflected as a liability in the consolidated balance sheets. The securities underlying the agreements are under the Corporation’s control and are held by nationally known government security dealers who are recognized as primary dealers by the Federal Reserve Board, or other investment banking firms approved by the Corporation’s Board of Directors.
109
CASCADE FINANCIAL CORPORATION AND SUBSIDIARIES
Notes to Consolidated Financial Statements
|
Underlying Securities
|
||||||||||||||||
|
Weighted
|
Book Value,
|
|||||||||||||||
|
Average
|
Including
|
|||||||||||||||
|
(Dollars in thousands)
|
Balance
|
Interest
|
Accrued
|
Fair
|
||||||||||||
|
December 31,
|
Outstanding
|
Rate
|
Interest
|
Value
|
||||||||||||
|
2010
|
$ | 145,000 | 5.86 | % | $ | 223,621 | $ | 212,921 | ||||||||
|
2009
|
145,410 | 5.85 | 202,778 | 199,183 | ||||||||||||
Financial data pertaining to repurchase agreements follows:
|
Years Ended December 31,
|
||||||||
|
(Dollars in thousands)
|
2010
|
2009
|
||||||
|
Maximum amount of outstanding agreements at any month-end
|
$ | 146,065 | $ | 147,510 | ||||
|
Average amount of outstanding agreements during the year
|
145,320 | 146,872 | ||||||
At December 31, 2010, the Corporation had non-retail repurchase agreements in place with two firms, both of which require the fair value of investments sold under agreements to repurchase to exceed the Corporation’s repurchase obligations. The following table summarizes these agreements:
|
(Dollars in thousands)
Counterparty
|
Fair Value of Securities that Collateralize Repurchase
Agreements
|
Principal Balance Owed on Repurchase Agreements
|
Accrued
& Unpaid
Interest at
December 31,
2010
|
Weighted Average Maturity
(in Years)
of Repurchase Agreements
|
||||||||||||
|
BNP Paribas
|
$ | 143,276 | $ | 95,000 | $ | 508 | 8.69 | |||||||||
|
Deutsche Bank
|
69,645 | 50,000 | 778 | 7.04 | ||||||||||||
|
Total
|
$ | 212,921 | $ | 145,000 | $ | 1,286 | ||||||||||
The Corporation had $75.0 million of non-retail repurchase agreements with an adjustable rate tied to three-month LIBOR that resets every three months until maturity and $70.0 million that are fixed for the remainder of the agreement unless the lender terminates the agreement. Under the adjustable rate pricing formula, the interest rate increases when LIBOR declines and decreases when LIBOR rises. The maximum interest rate under these agreements is 7%. The weighted average interest rate was 5.86% at December 31, 2010.
The repurchase agreements consist of a series of transactions with maturity dates ranging from 2017 to 2022. The agreements have provisions that allow the lender to periodically terminate the agreements. Termination dates typically occur once each quarter. The Bank has $50.0 million in repurchase agreements that have provisions allowing the agreements to be terminated by its counterparty. While the Bank has received no indication that the repurchase transactions will be terminated prior to maturity and the transactions are secured by securities pledged to the counterparty, management believes that the likelihood of termination of the agreements is reasonably possible. If these repurchase agreements had been terminated as of December 31, 2010, the termination fee would have been approximately $13.7 million. An additional $75.0 million in repurchase agreements have provisions allowing termination, but these agreements cannot be terminated prior to December 2012, provided the Bank offers the lender additional securities in November and December 2011. Repurchase agreements with this lender totaling $25.0 million and $50.0 million could be terminated in December 2012 and November 2013, respectively. The termination fee related to these agreements cannot be estimated.
Lines of Credit
The Bank had a $94.2 million line of credit with the Federal Reserve Bank of San Francisco collateralized by commercial, commercial real estate, construction and land loans. The Bank had no outstanding balance of borrowings against this line as of December 31, 2010. The Bank had an outstanding balance of $20.0 million in Term Auction Facility (TAF) borrowings against this line as of December 31, 2009.
110
CASCADE FINANCIAL CORPORATION AND SUBSIDIARIES
Notes to Consolidated Financial Statements
Note 12 - Junior Subordinated Debentures
On March 1, 2000, the Corporation issued $10.3 million of 11.0% junior subordinated debentures. In turn, Cascade Capital Trust I, a wholly owned business trust whose common equity is 100% owned by the Corporation, issued trust preferred securities underlying the debentures. The Trust exists for the exclusive purpose of issuing the trust preferred securities underlying the junior subordinated debentures issued by the Corporation, and engaging in only those other activities necessary, advisable or incidental to the above. The Corporation used the proceeds for general corporate purposes including stock repurchases and investment in the Bank. The junior subordinated debentures will mature on March 1, 2030, unless redeemed prior to such date if certain conditions are met.
On December 15, 2004, the Corporation issued $5.2 million in junior subordinated debentures. In turn, Cascade Capital Trust II, a wholly owned business trust whose common equity is 100% owned by the Corporation, issued trust preferred securities underlying the debentures. The Trust exists for the exclusive purpose of issuing the trust preferred securities underlying the junior subordinated debentures issued by the Corporation, and engaging in only those other activities necessary, advisable or incidental to the above. These debentures had a fixed coupon of 5.82% for the first five years and as of January 7, 2010 float at the three-month LIBOR plus 1.90% for the remaining twenty-five years. The coupon rate on the debentures was 2.19% at December 31, 2010. The debentures were callable at par after the first five years.
On March 30, 2006, the Corporation issued $10.3 million in junior subordinated debentures. In turn, Cascade Capital Trust III, a wholly owned business trust whose common equity is 100% owned by the Corporation, issued trust preferred securities underlying the debentures. The Trust exists for the exclusive purpose of issuing the trust preferred securities underlying the junior subordinated debentures issued by the Corporation, and engaging in only those other activities necessary, advisable or incidental to the above. These debentures have a fixed coupon of 6.65% for the first five years and then float, if not called, at the three-month LIBOR plus 1.40% for the remaining twenty-five years.
The junior subordinated debentures issued by the Corporation incorporate the same structure and are considered Tier 1 capital for regulatory purposes, subject to FRB restrictions.
The Corporation applied fair value accounting to the junior subordinated debentures issued by Cascade Capital Trust I. The change in fair market value of the junior subordinated debentures is recorded as a component of other income. The Corporation determines the fair value by using a discounted cash flow model. The discount rate is determined using a risk free interest rate approximating the remaining maturity of the debentures combined with a credit and liquidity spread determined based upon quotes from brokers and from valuations by holders of Cascade Capital Trust I, which were obtained from public filings. The bonds are assumed to be outstanding until maturity. For the year ended December 31, 2010, the Corporation recorded a $1.8 million fair value gain on the junior subordinated debentures. The fair value was $1.5 million at December 31, 2010 compared to $3.3 million at December 31,2009. The fair value option was not selected for the junior subordinated debentures issued in connection with Cascade Capital Trust II and III, which are reported at the combined book value of $15.5 million.
During the fourth quarter of 2009, FDIC restrictions prohibited dividend payments from the Bank to the holding company, which in turn led the Corporation to defer the payment of interest on the Trust Preferred Securities. Under the terms of each instrument deferral of payments is permitted without triggering an event of default. Generally, during any deferral period, the Corporation is prohibited from paying any dividends or distributions on, or redeem, purchase or acquire, or make a liquidation payment with respect to the Corporation’s capital stock, or make any payment of principal or interest on, or repay, repurchase or redeem any debt securities of the Corporation that rank pari passu in all respects with, or junior to, the specific instrument. In addition, during any deferral period, interest on the trust preferred securities is compounded from the date such interest would have been payable.
111
CASCADE FINANCIAL CORPORATION AND SUBSIDIARIES
Notes to Consolidated Financial Statements
Note 13 – Comprehensive (Loss) Income
Comprehensive (loss) income components and related tax effects were as follows:
|
December 31,
|
||||||||||||
|
(Dollars in thousands)
|
2010
|
2009
|
2008
|
|||||||||
|
Net (loss) income
|
$ | (70,286 | ) | $ | (23,468 | ) | $ | 2,090 | ||||
|
Unrealized holding gains on securities available-for-sale
|
1,921 | 826 | 61 | |||||||||
|
Reclassification adjustments for gains realized in income
|
(8,787 | ) | (1,588 | ) | (284 | ) | ||||||
|
Net unrealized loss
|
(6,866 | ) | (762 | ) | (223 | ) | ||||||
|
Tax (benefit) expense
|
(622 | ) | 267 | 78 | ||||||||
|
Net of tax amount
|
(7,488 | ) | (495 | ) | (145 | ) | ||||||
|
Change in fair value of derivatives used for cash flow hedges
|
3,517 | - | - | |||||||||
|
Net unrealized gain
|
3,517 | - | - | |||||||||
|
Total other comprehensive loss
|
(3,971 | ) | (495 | ) | (145 | ) | ||||||
|
Comprehensive (loss) income
|
$ | (74,257 | ) | $ | (23,963 | ) | $ | 1,945 | ||||
The following is a summary of the accumulated other comprehensive income balances, net of tax (at December 31, 2009):
|
(Dollars in thousands)
|
Balance at December 31, 2010
|
Current Period Change
|
Balance at December 31, 2009
|
|||||||||
|
Unrealized losses on securities available-for-sale
|
$ | (8,643 | ) | $ | (7,488 | ) | $ | (1,155 | ) | |||
|
Unrealized gain on interest rate caps
|
3,517 | 3,517 | - | |||||||||
|
Total
|
$ | (5,126 | ) | $ | (3,971 | ) | $ | (1,155 | ) | |||
Note 14 – Derivatives and Hedging
In the fourth quarter of 2010, the Bank entered into derivative contracts to add stability to interest income and to manage its exposure to changes in interest rates. The Bank sought to minimize the volatility that changes in interest rates have on its variable-rate debt by entering into interest rate cap agreements. The Bank purchased a series of interest rate caps from two different major financial institutions based on their credit rating and other factors. Both counterparties provide cash collateral to the Bank on the majority of the fair value of the cap to significantly mitigate credit risk of these transactions. The Bank purchased interest rate caps designated as cash flow hedges to protect against movements in interest rates above the caps’ strike rate, which is tied to three month LIBOR. The interest rate caps have an aggregate notional amount of $159.0 million, strike rates of 1.29% and a maturity date of October 20, 2015. The Bank formally documented the relationship between the hedging instruments and hedged items, as well as its risk management objective and strategy before initiating the hedge. The caps were used to hedge the variable cash flows associated with variable rate FHLB advances that reprice based upon three month LIBOR on the same day that the rate caps reprice. The fair value of the interest rate caps is based on derivative valuation models using market data inputs as of the valuation date that can generally be verified and do not typically involve significant management judgments. (Level 2 inputs). The valuation was performed on December 31, 2010 and will be performed each reporting date to determine if the hedge was effective over the reporting period, using the hypothetical derivative method, by comparing the actual changes in the hedged item to a “perfectly effective” hypothetical interest rate cap. If the ratio of the change in fair value of the actual cap to the change in fair value of the hypothetical cap falls between the effectiveness parameters the hedge will be considered to have been effective. The December 31, 2010 valuations showed the hedge to be “perfectly effective” and resulted in a mark-to-market gain on the interest rate caps totaling $3.5 million, which is included in accumulated other comprehensive loss. The Bank expects approximately $50,000 in expense to be reclassified into earnings within the next 12 months as the Bank begins to amortize the cost of the interest rate caps.
112
CASCADE FINANCIAL CORPORATION AND SUBSIDIARIES
Notes to Consolidated Financial Statements
The following table presents the notional value, strike rate, and fair value and collateral held at December 31, 2010:
|
(Dollars in thousands)
Derivatives
|
December 31, 2010
|
|||
|
Notional Value
|
$ | 159,000 | ||
|
Strike Rate
|
1.29 | % | ||
|
Fair Value
|
$ | 8,732 | ||
|
Cash Collateral
|
7,620 | |||
Note 15 - Income Taxes
Income tax (benefit) expense includes the following components:
|
Years Ended December 31,
|
||||||||||||
|
(Dollars in thousands)
|
2010
|
2009
|
2008
|
|||||||||
|
Current
|
$ | (504 | ) | $ | (12,714 | ) | $ | 7,737 | ||||
|
Deferred
|
4,369 | 5,104 | (8,176 | ) | ||||||||
|
Total
|
$ | 3,865 | $ | (7,610 | ) | $ | (439 | ) | ||||
The following table presents major components comprising the Corporation’s deferred tax assets and deferred tax liabilities and the valuation allowance that was established during the year on the Corporation’s net deferred tax assets.
The changes in the amounts of deferred tax assets and liabilities are the result of differences between financial reporting and tax bases at December 31, 2010, and December 31, 2009:
|
December 31,
|
||||||||
|
(Dollars in thousands)
|
2010
|
2009
|
||||||
|
Deferred tax assets
|
||||||||
|
Securities available-for-sale
|
$ | 3,025 | $ | 622 | ||||
|
Premises and equipment
|
417 | 343 | ||||||
|
Reserve for uncollected interest
|
392 | 524 | ||||||
|
Allowance for loan losses
|
7,066 | 7,301 | ||||||
|
REO
|
2,907 | - | ||||||
|
Tax credit carry-forward
|
778 | 856 | ||||||
|
Contribution carry-forward
|
41 | - | ||||||
|
Net operating loss (NOL) carry-forward
|
16,748 | - | ||||||
|
Alternative minimum tax (AMT) credit carry-forward
|
829 | 808 | ||||||
|
Other
|
136 | - | ||||||
|
Gross deferred tax assets
|
32,339 | 10,454 | ||||||
|
Deferred tax liabilities
|
||||||||
|
Interest rate caps
|
(1,231 | ) | - | |||||
|
Junior subordinated debentures
|
(2,894 | ) | (2,240 | ) | ||||
|
Deferred loan fees
|
(1,078 | ) | (1,293 | ) | ||||
|
Core deposit intangible
|
(74 | ) | (123 | ) | ||||
|
FHLB stock
|
(1,732 | ) | (1,732 | ) | ||||
|
Other
|
- | (75 | ) | |||||
|
Gross deferred tax liabilities
|
(7,009 | ) | (5,463 | ) | ||||
|
Subtotal deferred tax asset
|
25,330 | 4,991 | ||||||
|
Valuation allowance on deferred tax asset
|
(25,330 | ) | - | |||||
|
Net deferred tax asset
|
$ | - | $ | 4,991 | ||||
At March 31, 2010, the Corporation assessed whether it was more likely than not that it would realize the benefits of its deferred tax asset. The Corporation determined that the negative evidence associated with a cumulative three-year loss, entering into an FDIC Order (see Note 2) with its regulators, and credit deterioration in its loan portfolio outweighed the positive evidence. Therefore, during
113
CASCADE FINANCIAL CORPORATION AND SUBSIDIARIES
Notes to Consolidated Financial Statements
In the future, the Corporation’s effective tax rate could be adversely affected by several factors, many of which are outside of the Corporation’s control. The effective tax rate is affected by the proportion of revenues and income before taxes in the various domestic jurisdictions in which the Corporation operates. Further, the Corporation is subject to changing tax laws, regulations and interpretations in multiple jurisdictions in which the Corporation operates, as well as the requirements, pronouncements and rulings of certain tax, regulatory and accounting organizations. The Corporation estimates its annual effective tax rate each quarter based on a combination of actual and forecasted results of subsequent quarters. Consequently, significant changes in its actual quarterly or forecasted results may impact the effective tax rate for the current or future periods. In addition, the Corporation will not receive a tax benefit for any future losses as long as it is required to maintain a valuation allowance on its deferred tax assets. The Corporation will be required to maintain a valuation allowance on its deferred tax assets until such time that the Corporation can show a three-year history of profitability, has consistent core earnings and the probability is that taxable income will be generated in future periods.
At December 31, 2009, the Corporation had a $12.9 million current tax asset. The receivable was the result of tax carry-backs that the Corporation recognized due to losses that were recorded in 2009 and to OTTI charges taken in 2008 on Fannie Mae and Freddie Mac preferred stock. On September 7, 2008, the U.S. Treasury, the Federal Reserve and the Federal Housing Finance Agency (FHFA) announced that FHFA was placing Fannie Mae and Freddie Mac under conservatorship and would eliminate dividends on Fannie Mae and Freddie Mac common and preferred stock. The Corporation recorded a pre-tax OTTI charge of $17.3 million to third quarter 2008 earnings and an additional charge of $858,000 in the first quarter of 2009. The sale of Fannie Mae and Freddie Mac preferred stock during the year allowed the Corporation to recover more than $6.3 million in taxes paid for the 2009 tax return and accounts for a large portion of the current tax asset at December 31, 2009.
For the year ended December 31, 2010, the Corporation's effective tax rate was (5.8)% compared to 24.5% and (26.6)% for the years ended December 31, 2009 and 2008, respectively. Income tax (benefit) expense differs from that computed by applying the U.S. federal income tax rate of 35% to pretax income for the years ended December 31, 2010, 2009 and 2008, as a result of the following:
|
Years Ended December 31,
|
||||||||||||
|
(Dollars in thousands)
|
2010
|
2009
|
2008
|
|||||||||
|
Computed “expected” tax (benefit) expense
|
$ | (23,247 | ) | $ | (10,877 | ) | $ | 578 | ||||
|
Valuation allowance on deferred tax asset
|
23,536 | - | - | |||||||||
|
Goodwill
|
4,510 | 4,095 | - | |||||||||
|
Low income housing tax credit
|
(449 | ) | (468 | ) | (379 | ) | ||||||
|
Bank owned life insurance (BOLI)
|
(339 | ) | (310 | ) | (343 | ) | ||||||
|
Tax exempt interest
|
(155 | ) | (156 | ) | (111 | ) | ||||||
|
Nondeductible stock-based compensation cost
|
18 | 48 | 65 | |||||||||
|
Dividend on preferred stock
|
- | - | (223 | ) | ||||||||
|
Other, net
|
(9 | ) | 58 | (26 | ) | |||||||
|
Total
|
$ | 3,865 | $ | (7,610 | ) | $ | (439 | ) | ||||
Under certain provisions of the Internal Revenue Code, the Corporation was allowed a statutory bad debt deduction (based upon a percentage of taxable income before such deduction) for additions to tax bad debt reserves established for the purpose of absorbing losses on loans or property acquired through foreclosure. This amount represents allocations of income to bad debt deductions for tax reporting purposes only. Reduction of amounts so allocated for purposes other than tax bad debt losses will create income for tax reporting purposes only, which will be subject to the then-current corporate income tax rate.
114
CASCADE FINANCIAL CORPORATION AND SUBSIDIARIES
Notes to Consolidated Financial Statements
At December 31, 2010 and December 31, 2009, the Corporation had AMT credit carryforwards of approximately $829,000 and $808,000 and general business credits of approximately $778,000 and $856,000 respectively, which were eligible to offset future federal income taxes. AMT credits can be carried forward indefinitely. The general business credits will begin to expire in 2027.
The Corporation recognizes interest accrued and penalties related to unrecognized tax benefits in tax expense. During the years ended December 31, 2010, and 2009, the Corporation recognized no interest or penalties.
The Corporation and its subsidiaries file income tax returns in the U.S. Federal jurisdiction. With few exceptions, the Corporation is no longer subject to U.S. federal or state/local income tax examinations by tax authorities for years before 2007.
Note 16 – Commitments and Contingencies
Lease Commitments
The Bank leases space for various branches. These leases run for a period ranging from 2 to 10 years and allow for established rent increases each year. Generally, these leases require the Bank to pay all taxes, maintenance and utility costs, as well as maintain certain types of insurance.
The annual lease commitments at December 31, 2010, are as follows:
|
(Dollars in thousands)
|
||||
|
Years Ended December 31,
|
||||
|
2011
|
874 | |||
|
2012
|
874 | |||
|
2013
|
809 | |||
|
2014
|
640 | |||
|
Thereafter
|
7,093 | |||
|
Total
|
$ | 10,290 | ||
Rental expenses charged to operations were approximately $917,000, $889,000, and $825,000 for the years ended December 31, 2010, 2009, and 2008, respectively.
Loan Commitments
Commitments to extend credit under lines of credit/loans in process are agreements to lend to a customer as long as there is no violation of any condition established in the loan documents. Unfunded commitments totaled $81.9 million at December 31, 2010, and $122.7 million at December 31, 2009. Commitments generally have fixed maturity dates. Since some of the commitments are expected to expire without being drawn upon, the total commitment amounts do not necessarily represent future cash requirements. The Bank evaluates each customer's creditworthiness on a case-by-case basis. The amount of collateral obtained, if it is deemed necessary by the Bank upon extension of credit, is based on management's credit evaluation of the borrower. Collateral held varies but may include accounts receivable, inventory, property, plant and equipment, other real estate including residential, multifamily and land, and income-producing commercial properties.
Standby letters of credit and financial guarantees written are conditional commitments issued by the Bank to guarantee the performance of a customer to a third party. Those guarantees are primarily issued to support public and private borrowing arrangements, bond financing, and similar transactions. The Bank underwrites its standby letters of credit using its policies and procedures applicable to loans in general. Standby letters of credit are made on both an unsecured and secured basis. The Bank has not been required to perform on any standby letters of credit or financial guarantees during the past two years.
115
CASCADE FINANCIAL CORPORATION AND SUBSIDIARIES
Notes to Consolidated Financial Statements
The Bank did not incur any losses on its commitments for the years ended 2010 and 2009.
At December 31, 2010 and 2009, the following financial instruments with off-balance sheet risk were outstanding:
|
December 31,
|
||||||||
|
(Dollars in thousands)
|
2010
|
2009
|
||||||
|
Commitments to grant loans
|
$ | 2,100 | $ | 11,145 | ||||
|
Unfunded commitments under lines of credit/loans in process
|
81,868 | 122,714 | ||||||
|
Standby letters of credit and financial guarantees written
|
1,576 | 1,695 | ||||||
|
Unused commitments on bankcards
|
13,472 | 13,621 | ||||||
|
Total
|
$ | 99,016 | $ | 149,175 | ||||
Legal Contingencies
The Corporation is a defendant in various legal proceedings arising in connection with its business. It is the opinion of management that the financial position and the results of operations of the Corporation will not be materially adversely affected by the final outcome of these legal proceedings and will have no material effect on the Corporation’s Consolidated Financial Statements.
Loss Contingencies
The Bank has $50.0 million in repurchase agreements that have provisions allowing the agreements to be terminated by its counterparty. While the Bank has received no indication that the repurchase transactions will be terminated prior to maturity and the transactions are secured by securities pledged to the counterparty, management believes that the likelihood of termination of the agreements is reasonably possible. If these repurchase agreements had been terminated as of December 31, 2010, the termination fee would have been approximately $13.7 million. An additional $75.0 million in repurchase agreements have provisions allowing termination, but these agreements cannot be terminated prior to December 2012, provided the Bank offers the lender additional securities in November and December 2011. Repurchase agreements with this lender totaling $25.0 million and $50.0 million could be terminated in December 2012 and November 2013 respectively. The termination fee related to these agreements cannot be estimated.
Significant Concentrations of Credit Risk
Concentration of credit risk is the risk associated with a lack of diversification, such as having substantial loan concentrations in a specific type of loan within the Bank’s loan portfolio, thereby exposing the Bank to greater risks resulting from adverse economic, political, regulatory, geographic, industrial or credit developments. At December 31, 2010, the Bank’s most significant concentration of credit risk was in loans secured by real estate. These loans totaled approximately $862.3 million or 86.4% of the Bank’s total loan portfolio. Real estate construction, including land acquisition and development/land, commercial real estate, multifamily, home equity and residential loans are included in the total loans secured by real estate for purposes of this calculation. There has been deterioration in the real estate market over the last three years, which has led to an increase in nonperforming loans and the allowance for loan losses.
At December 31, 2010, the Bank’s most significant concentration of credit risk within its investment portfolio was with the U.S. Government, its agencies and Government Sponsored Enterprises. The Bank’s exposure from this source of investment credit risk was $296.8 million, or 99% of the Bank’s total investment portfolio (including FHLB stock) at December 31, 2010.
Regulatory Examinations
At periodic intervals, the Washington State DFI, the FDIC, and the FRB routinely examine the Corporation’s financial statements as part of their legally prescribed oversight of the banking industry. Based on these examinations, the regulators can direct the Corporation’s financial statements be adjusted in accordance with their findings. As a result of the Bank’s FDIC Order, it is subject to more frequent examinations by regulators.
116
CASCADE FINANCIAL CORPORATION AND SUBSIDIARIES
Notes to Consolidated Financial Statements
U.S. Treasury Department’s Capital Purchase Program – TARP
On November 21, 2008, the Corporation completed its $39.0 million capital raise as a participant in the U.S. Treasury Department’s CPP. Under the terms of the transaction, the Corporation issued 38,970 shares of Series A Fixed-Rate Cumulative Perpetual Preferred Stock and a warrant to purchase 863,442 shares of the Corporation’s common stock at an exercise price of $6.77 per share.
In determining the value of the Series A Preferred Stock and the attendant warrant from the U.S. Treasury’s CPP, the Corporation apportioned the values using the relative fair value approach. The Corporation computed the present value of the preferred stock at $23.5 million assuming a ten-year life, 5% interest rate for the first five years and 9% for the second five years (the dividend that the Corporation will pay the Treasury). A discount rate of 14% was used as the approximate current cost of capital for the Corporation.
The Corporation computed a fair value of the warrants using the Black-Scholes option valuation model. The assumptions in deriving the value were a 34% volatility rate of the Corporation’s common stock, a 2.60% annual dividend rate on the Corporation’s common stock, a 2.75% risk free interest rate, which corresponded to the yield on the five year Treasury note at the time of the issuance, and an assumed life of ten years. The present value of the warrants was computed to be $1.6 million. The present value of the preferred stock represented 93.87% of the combined present value of $25.0 million of the components of the $39.0 million received or $36.6 million. The resulting value for the warrants was 6.13% of the proceeds or $2.4 million.
During the fourth quarter of 2009, FDIC restrictions prohibited dividend payments from the Bank to the holding company, which in turn led the Corporation to defer the dividend on the preferred stock. Under the terms of the preferred stock, deferral of payment is permitted without triggering an event of default. Generally, during any deferral period, the Corporation is prohibited from paying any dividends or distributions on, and may not redeem, purchase or acquire, or make a liquidation payment with respect to the Corporation’s capital stock, or make any payment of principal or interest on, or repay, repurchase or redeem any debt securities of the Corporation that rank pari passu in all respects with, or junior to, the specific instrument. In addition, during any deferral period, dividends on the preferred stock are compounded from the date such dividends would have been payable. As of December 31, 2010, the Corporation has deferred five consecutive dividend payments on the preferred stock. Under the terms of the Capital Purchase Program, the Treasury can appoint two people of its choice to the board of directors of a corporation that misses six dividend payments.
Restrictions on Dividends
The principal source of the Corporation's revenue is dividends received from the Bank. The payment of dividends is subject to government regulation, in that regulatory authorities may prohibit banks and bank holding companies from paying dividends that would constitute an unsafe or unsound banking practice. In addition, a bank may not pay cash dividends if that payment could reduce the amount of its capital below that necessary to meet minimum applicable regulatory capital requirements. In November 2008, the Corporation issued preferred stock to the U.S. Treasury. As a provision of that issuance, the Corporation cannot increase its current cash dividend without prior approval of the U.S. Treasury for three years or until November 2011. In June 2009, the Corporation announced that it would temporarily suspend its regular quarterly cash dividend on common stock to preserve capital.
The Bank was notified by the FDIC in late September 2009 that based on an off-site review of its financial information, the Bank, among other restrictions, could not pay a cash dividend to the Corporation unless it obtained a non-objection from the FDIC and the Washington State DFI. The Bank requested a non-objection and was informed orally that the request would be denied. Therefore, the Bank is unable to pay a cash dividend to the Corporation. Dividends from the Bank are the Corporation’s primary source of cash. In addition, the FDIC Order discussed in Note 2 prevents the Bank from paying any cash dividends to its stockholder without prior written approval from the regulators.
117
CASCADE FINANCIAL CORPORATION AND SUBSIDIARIES
Notes to Consolidated Financial Statements
Under a Consent Order with the FDIC and Washington State DFI, the Bank’s regulators directed the Bank to increase its overall capital levels and, in particular, required the Bank to increase its Tier 1 leverage capital to 10% of the Bank’s average total assets and total risk based capital to 12% of the Bank’s risk weighted assets by November 18, 2010. The Bank is considered “undercapitalized” under the regulatory framework for prompt corrective action and has not met the required capital ratios provided in its FDIC Order, but the Board of Directors is working diligently to comply with these requirements.
|
(Dollars in thousands)
Cascade Bank
|
Actual
|
Minimum
Requirements
For Capital
Adequacy
|
Well-Capitalized
Requirements
|
|||||||||||||||||||||
|
December 31, 2010:
|
||||||||||||||||||||||||
|
Total risk-based capital to risk-weighted assets
|
$ | 97,456 | 9.60 | % | $ | 81,213 | 8.00 | % | $ | 101,516 | 10.00 | % | ||||||||||||
|
Tier I (core) capital to risk-weighted assets
|
84,600 | 8.58 | 40,606 | 4.00 | 60,910 | 6.00 | ||||||||||||||||||
|
Tier I (core) capital to average total assets
|
84,600 | 5.56 | 60,902 | 4.00 | 76,128 | 5.00 | ||||||||||||||||||
|
December 31, 2009:
|
||||||||||||||||||||||||
|
Total risk-based capital to risk-weighted assets
|
$ | 153,750 | 12.40 | % | $ | 99,205 | 8.00 | % | $ | 124,006 | 10.00 | % | ||||||||||||
|
Tier I (core) capital to risk-weighted assets
|
138,150 | 11.14 | 49,603 | 4.00 | 74,404 | 6.00 | ||||||||||||||||||
|
Tier I (core) capital to average total assets
|
138,150 | 8.32 | 66,425 | 4.00 | 83,032 | 5.00 | ||||||||||||||||||
The Corporation, as a bank holding company regulated by the FRB, is also subject to capital requirements that are similar to those for Cascade Bank.
|
(Dollars in thousands)
Cascade Financial Corporation
|
Actual
|
Minimum
Requirements
For Capital
Adequacy
|
Well-Capitalized
Requirements
|
|||||||||||||||||||||
|
December 31, 2010:
|
||||||||||||||||||||||||
|
Total risk-based capital to risk-weighted assets
|
$ | 101,209 | 9.98 | % | $ | 81,149 | 8.00 | % | $ | 101,437 | 10.00 | % | ||||||||||||
|
Tier I (core) capital to risk-weighted assets
|
84,556 | 8.34 | 40,574 | 4.00 | 60,862 | 6.00 | ||||||||||||||||||
|
Tier I (core) capital to average total assets
|
84,556 | 5.55 | 60,958 | 4.00 | 76,197 | 5.00 | ||||||||||||||||||
|
December 31, 2009:
|
||||||||||||||||||||||||
|
Total risk-based capital to risk-weighted assets
|
$ | 158,882 | 12.82 | % | $ | 99,124 | 8.00 | % | $ | 123,906 | 10.00 | % | ||||||||||||
|
Tier I (core) capital to risk-weighted assets
|
143,264 | 11.56 | 49,562 | 4.00 | 74,343 | 6.00 | ||||||||||||||||||
|
Tier I (core) capital to average total assets
|
143,264 | 8.62 | 66,485 | 4.00 | 83,107 | 5.00 | ||||||||||||||||||
Note 18 - Employee Benefit Plans
Savings Plan
The Corporation maintains a savings plan under section 401(k) of the Internal Revenue Code, covering substantially all full-time employees. Under the plan, employee contributions are matched by the Corporation at a rate of 50% of the first $12,000 contributed. Such matching becomes vested over a period of five years of credited service. Employees may make investments in various stock, fixed income or money market plans, or may purchase stock in the Corporation. Due to the losses suffered during the year, the Corporation suspended the 401(k) matching contribution in the second quarter of 2010. The Corporation contributed $130,000, $388,000 and $382,000 to the plan for the years ended December 31, 2010, 2009, and 2008, respectively.
118
CASCADE FINANCIAL CORPORATION AND SUBSIDIARIES
Notes to Consolidated Financial Statements
The Bank has maintained an Employee Stock Purchase Plan (ESPP) under the terms of which 213,212 shares of common stock were authorized for issuance. In July 2010, the final 54,409 shares were issued to employees participating in the ESPP. The plan allowed employees of the Bank with three months of service the opportunity to purchase common stock through accumulated salary deductions during each offering period. On the first day of each six-month offering period (January 1 and July 1 of each year), eligible employees who elected to participate were granted options to purchase a limited number of shares and unless the participant withdrew from the plan, the option was effectively exercised on the last day of each offering period. The aggregate number of shares to be purchased in any given offering was determined by dividing the accumulated salary deduction for the period by the lower of 85% of the market price of a common share at the beginning or end of an offering period, whichever was lower. The ESPP permitted for shares to be purchased in the open market or new shares could be issued from the Bank’s authorized but unissued shares. During the year, 25,449 shares were issued from the Bank’s authorized but unissued shares and 54,409 were purchased on the open market. Expense related to this plan totaled $18,000 for the year ended December 31, 2010.
Stock Options and Restricted Stock Grants
The stockholders of the Corporation approved two stock option plans to promote the best interest of the Corporation and its stockholders by providing an incentive to employees and directors. The plans permit the grant of incentive stock options and non-qualified stock options.
Options are granted to certain employees and directors at prices equal to the market value of the stock on the dates the options are granted. The options granted have a term of ten years from the grant date. Incentive stock options granted to employees vest over a five-year period. Non-qualified options granted to directors vest over a four-year period. Compensation expense is recorded as if each vesting portion of the award is a separate award. The maximum number of options that may be issued under the plan is 937,500 (as adjusted for stock splits and dividends). The Corporation had 537,151 and 442,007 shares available for grant at December 31, 2010 and 2009, respectively. The Corporation did not grant options for the years ended December 31, 2010 and December 31, 2009.
Net compensation cost charged to compensation expense, for options that vested during the last three years was $55,000 for 2010, $143,000 for 2009, and $196,000 for 2008. The total income tax benefit recognized in the income statement for stock based compensation arrangements was $0 for 2010, $4,000 for 2009, and $30,000 for 2008.
The following table provides key assumptions used for the determination of fair value for stock option grants:
|
Years Ended December 31,
|
||||||||||||
|
2010
|
2009
|
2008
|
||||||||||
|
Risk-free interest rate
|
N/A | N/A | 2.50 | % | ||||||||
|
Expected life in years
|
N/A | N/A | 6 | |||||||||
|
Expected volatility
|
N/A | N/A | 24 | % | ||||||||
|
Dividend yield
|
N/A | N/A | 2.90 | % | ||||||||
119
CASCADE FINANCIAL CORPORATION AND SUBSIDIARIES
Notes to Consolidated Financial Statements
A summary of option activity as of, and for the year ended, December 31, 2010 is as follows:
|
Options
|
Weighted-
Average
Exercise
Price per
Share
|
Weighted-
Average
Remaining
Contractual
Term
(in years)
|
Aggregate
Intrinsic
Value
|
|||||||||||||
|
Outstanding as of December 31, 2008
|
656,883 | $ | 10.41 | 5.07 | $ | 153,385 | ||||||||||
|
Granted
|
- | - | ||||||||||||||
|
Exercised
|
- | - | ||||||||||||||
|
Forfeited/Cancelled
|
(8,907 | ) | 7.20 | |||||||||||||
|
Outstanding as of December 31, 2009
|
647,976 | $ | 10.46 | 4.11 | $ | - | ||||||||||
|
Granted
|
- | - | ||||||||||||||
|
Exercised
|
- | - | ||||||||||||||
|
Forfeited/Cancelled
|
(151,767 | ) | 10.32 | |||||||||||||
|
Outstanding as of December 31, 2010
|
496,209 | $ | 10.50 | 3.19 | $ | - | ||||||||||
|
Exercisable as of December 31, 2010
|
420,161 | $ | 9.98 | 2.57 | $ | - | ||||||||||
|
Options vested and expected to vest
|
491,521 | $ | 10.48 | 0.15 | $ | - | ||||||||||
All options granted have limited rights that enable a holder upon a change in control of the Corporation to elect to receive cash equal to the difference between the exercise price of the option and the fair market value of the common stock on the date of exercise.
No options were granted or exercised during 2010 or 2009. The weighted average fair values of options granted under the Corporation's stock option plan was $2.59 for the year ended December 31, 2008. The total intrinsic value of options exercised was $133,000 during the year ended December 31, 2008. Total unrecognized compensation cost related to stock options was $47,000 as of December 31, 2010, $113,000 as of December 31, 2009, and $233,000 as of December 31, 2008. That cost is expected to be recognized over a weighted average period of 1.05 years as of December 31, 2010. Cash received from options exercised under all share-based payment arrangements was $157,000 for the year ended December 31, 2008.
During the year ended December 31, 2009, each Board member received an award of 3,582 shares of restricted stock worth approximately $12,000 on the day the shares were granted. These shares are part of the Board’s compensation package and vest in one year. All of these shares were vested as of December 31, 2010. The total number of shares of restricted stock granted during the year ended December 31, 2009 was 39,402. No shares were granted in 2010.
Deferred Compensation Plan
On January 16, 2008, the Cascade Bank Non-Qualified Deferred Compensation Plan was adopted. Participants, which include members of executive management and the Board of Directors, may contribute up to 50% of salary and 100% of any bonus payments received, net of applicable withholdings, to the Plan. In addition, the Compensation Committee has the authority to authorize an employer contribution to the Plan for these same employees. There were no employer contributions made for the years ended December 31, 2010, 2009 and 2008. The contributions are based upon the performance of the Bank as well as the individual performance of each employee. The Non-Qualified Deferred Compensation Plan is also available to Directors. Each Director may contribute up to 100% of his or her director compensation to the Plan. No Corporation contributions are made for Directors.
Employment Agreement
The Bank entered into an employment agreement with Carol K. Nelson, CEO, dated November 27, 2007 and modified November 31, 2008, which replaced a previous agreement, dated July 12, 2005. This agreement replaced a prior agreement dated March 26, 2002, and extended on January 27, 2004. The current agreement may be terminated upon 90 days written notice. The CEO’s employment agreement provides for a retirement benefit equal to two times her base compensation plus incentive before salary deferrals over the 12-month period prior to her retirement. At December 31, 2010, the Bank has accrued $255,000 for the potential payout on this retirement benefit.
120
CASCADE FINANCIAL CORPORATION AND SUBSIDIARIES
Notes to Consolidated Financial Statements
Note 19 – (Loss) Earnings per Common Share
The following table presents (loss) earnings per common share information:
|
Years Ended December 31,
|
||||||||||||
|
(Dollars in thousands)
|
2010
|
2009
|
2008
|
|||||||||
|
Net (loss) income
|
$ | (70,286 | ) | $ | (23,468 | ) | $ | 2,090 | ||||
|
Dividends on preferred stock
|
2,026 | 1,943 | 216 | |||||||||
|
Accretion of issuance discount on preferred stock
|
450 | 422 | 35 | |||||||||
|
Net (loss) income attributable to common stockholders
|
$ | (72,762 | ) | $ | (25,833 | ) | $ | 1,839 | ||||
|
Weighted average number of common shares outstanding, basic
|
12,238,802 | 12,121,113 | 12,053,084 | |||||||||
|
Effect of dilutive stock options
|
- | - | 106,090 | |||||||||
|
Weighted average number of common shares outstanding, diluted
|
12,238,802 | 12,121,113 | 12,159,174 | |||||||||
|
(Loss) earnings per common share, basic
|
$ | (5.95 | ) | $ | (2.13 | ) | $ | 0.15 | ||||
|
(Loss) earnings per common share, diluted
|
(5.95 | ) | (2.13 | ) | 0.15 | |||||||
For purposes of calculating basic and diluted (loss) earnings per common share, the numerator of net (loss) income attributable to common stockholders is the same. There were outstanding options to purchase 496,209; 647,976; and 656,883 shares of common stock at December 31, 2010, 2009, and 2008, respectively, that are considered anti-dilutive and have been excluded from the above calculation. Anti-dilutive options have an exercise price that is greater than the current market price of the stock. Also, as of December 31, 2010 and 2009, the warrant issued to the U.S. Treasury to purchase up to 863,442 shares of common stock was not included in the computation of diluted (loss) earnings per common share because the warrant’s exercise price was greater than the average market price of common shares.
Note 20 – Related Party Transactions
The following table presents the balances and activity of loans to officers and directors during 2010 and 2009:
|
December 31,
|
||||||||
|
(Dollars in thousands)
|
2010
|
2009
|
||||||
|
Balances at beginning of year
|
$ | 1,559 | $ | 1,421 | ||||
|
Net new loans or advances
|
1,374 | 157 | ||||||
|
Repayments
|
(269 | ) | (19 | ) | ||||
|
Balances at end of year
|
$ | 2,664 | $ | 1,559 | ||||
The loans (with certain directors or executive officers of the Bank) were in the ordinary course of business on substantially the same terms, including interest rates and collateral, as those prevailing at the time for comparable loans with persons not related to the Bank, and did not involve more than normal risk of collectability or present other unfavorable features.
Deposits held by executive officers and directors totaled $5.3 million at December 31, 2010, and $6.0 million at December 31, 2009. Included in these totals were $3.4 million and $3.1 million held in business accounts at December 31, 2010, and December 31 2009, respectively.
121
CASCADE FINANCIAL CORPORATION AND SUBSIDIARIES
Notes to Consolidated Financial Statements
Financial Instruments
The fair value estimates presented below are subjective in nature, involve uncertainties and matters of significant judgment and, therefore, are not necessarily indicative of the amounts the Corporation could realize in a current market exchange. The Corporation has not included certain material items in its disclosure, such as the value of the long-term relationships with the Corporation’s lending and deposit customers, since this is an intangible and not a financial instrument. Additionally, the estimates do not include any tax ramifications. There may be inherent weaknesses in any calculation technique, and changes in the underlying assumptions used, including discount rates and estimates of future cash flows, that could materially affect the results. For all of these reasons, the aggregation of the fair value calculations presented herein do not represent, and should not be construed to represent, the underlying value of the Corporation.
The following table presents a summary of the fair value of the Corporation’s financial instruments:
|
December 31,
|
||||||||||||||||
|
2010
|
2009
|
|||||||||||||||
|
(Dollars in thousands)
|
Carrying Value
|
Estimated Fair Value
|
Carrying Value
|
Estimated Fair Value
|
||||||||||||
|
Financial assets
|
||||||||||||||||
|
Cash and cash equivalents
|
$ | 131,335 | $ | 131,335 | $ | 145,595 | $ | 145,595 | ||||||||
|
Securities available-for-sale
|
234,606 | 234,606 | 227,805 | 227,805 | ||||||||||||
|
Securities held-to-maturity
|
53,912 | 53,068 | 36,177 | 36,494 | ||||||||||||
|
FHLB stock
|
11,920 | N/A | 11,920 | N/A | ||||||||||||
|
Cash surrender value of BOLI, net
|
25,489 | 25,489 | 24,522 | 24,522 | ||||||||||||
|
Loans, net
|
967,661 | 932,932 | 1,173,213 | 1,074,697 | ||||||||||||
|
Interest rate caps
|
5,215 | 8,732 | - | - | ||||||||||||
|
Financial liabilities
|
||||||||||||||||
|
Deposit accounts
|
$ | 1,107,554 | $ | 1,095,089 | $ | 1,139,774 | $ | 1,116,840 | ||||||||
|
FHLB advances
|
159,000 | 187,087 | 239,000 | 261,217 | ||||||||||||
|
Securities sold under agreements to repurchase
|
145,000 | 179,450 | 145,410 | 174,700 | ||||||||||||
|
FRB TAF borrowings
|
- | - | 20,000 | 20,000 | ||||||||||||
|
Junior subordinated debentures
|
15,465 | 1,521 | 15,465 | 8,079 | ||||||||||||
|
Junior subordinated debentures, fair value
|
1,500 | 1,500 | 3,341 | 3,341 | ||||||||||||
Cash and Cash Equivalents. The carrying amount represents fair value.
Investment securities. Fair values are based on quoted market prices or dealer quotations when available or through the use of alternate approaches, such as matrix or model pricing, when market quotes are not readily available.
FHLB Stock. The Bank’s investment in FHLB stock is carried at par value ($100 per share), and has no readily determinable fair value.
Cash Surrender Value of BOLI. The carrying amount of BOLI approximates its fair value, net of any surrender charges. Fair value of BOLI is estimated using the cash surrender value.
Loans. Fair values are estimated using current market interest rates to discount future cash flows for each of the different loan types. Interest rates used to discount the cash flows are based on published current market rates for similar products. Prepayment rates are based on expected future prepayment rates, or, where appropriate and available, market prepayment rates. Fair value for loans is reduced by the allowance for loan losses as a credit adjustment. The majority of impaired loans are individually analyzed each quarter for impairment and impairments are included with the credit adjustment factor. A liquidity and marketability adjustment is also used to adjust the fair value of loans. This factor discounts loans based upon type of loan and current loan classifications.
122
CASCADE FINANCIAL CORPORATION AND SUBSIDIARIES
Notes to Consolidated Financial Statements
FHLB advances and securities sold under agreements to repurchase. The fair value is calculated based on market price quotations and confirmed with the discounted cash flow method, adjusted for market interest rates and terms to maturity.
Junior Subordinated Debentures. The fair value is calculated based on the discounted cash flow method, adjusted for market interest rates, terms to maturity, credit and liquidity risk.
Junior Subordinated Debentures, at fair value. The Corporation determines the fair value by using a discounted cash flow model. The discount rate is determined using a risk free interest rate approximating the remaining maturity of the debentures combined with a credit and liquidity spread determined based upon quotes from brokers and from valuations by holders of Cascade Capital Trust I, which were obtained from public filings. The bonds are assumed to be outstanding until maturity.
Off-balance-sheet financial instruments. Commitments to extend credit, standby letters of credit and financial guarantees represent the principal categories of off-balance instruments. The fair value of these commitments is not considered material because they are for a short period of time and subject to customary credit terms.
Financial Assets and Liabilities Carried at Fair Value on a Recurring and Non-recurring Basis
Fair value is defined as the price that would be received to sell an asset or paid to transfer a liability in an orderly transaction between market participants on the measurement date. It also establishes a consistent framework for measuring fair value and expands disclosure requirements about fair value measurements. In determining fair value, the Bank maximizes the use of observable inputs and minimizes the use of unobservable inputs. Observable inputs reflect market data obtained from independent sources, while unobservable inputs reflect the Bank’s estimates for market assumptions.
Valuation inputs refer to the assumptions market participants would use in pricing a given asset or liability using one of the three valuation techniques. Inputs can be observable or unobservable. Observable inputs are those assumptions that market participants would use in pricing the particular asset or liability. These inputs are based on market data and are obtained from a source independent of the Bank. Unobservable inputs are assumptions based on the Bank’s own information or estimate of assumptions used by market participants in pricing the asset or liability. Unobservable inputs are based on the best and most current information available on the measurement date.
All inputs, whether observable or unobservable, are ranked in accordance with a prescribed fair value hierarchy that gives the highest ranking to quoted prices (unadjusted) in active markets for identical assets or liabilities (Level 1) and the lowest ranking to unobservable inputs (Level 3). Fair values for assets or liabilities classified as Level 2 are based on one or a combination of the following factors: (i) quoted prices for similar assets; (ii) observable inputs for the asset or liability, such as interest rates or yield curves; or (iii) inputs derived principally from or corroborated by observable market data.
Determination of fair market values
Available-for-sale securities are priced using matrix pricing based on the securities’ relationship to other benchmark quoted prices (Level 2). Inputs to the valuation methodology include quoted prices for similar assets in active markets that are observable for the asset.
The Corporation applied fair value accounting to the junior subordinated debentures issued by Cascade Capital Trust I. The change in fair market value of the junior subordinated debentures is recorded as a component of other income. The Corporation determines the fair value by using a discounted cash flow model. The discount rate is determined using a risk free interest rate approximating the remaining maturity of the debentures combined with a credit and liquidity spread determined based upon quotes from brokers and from valuations by holders of Cascade Capital Trust I, which were obtained from public filings. The bonds are assumed to be outstanding until maturity. For the year ended December 31, 2010, the Corporation recorded a $1.8 million fair value gain on the junior subordinated debentures. The fair value was $1.5 million at December 31, 2010 compared to $3.3 million at December 31, 2009. The fair value option was not selected for the junior subordinated debentures issued in connection with Cascade Capital Trust II and III, which are reported at the combined book value of $15.5 million.
123
CASCADE FINANCIAL CORPORATION AND SUBSIDIARIES
Notes to Consolidated Financial Statements
Fair values of impaired collateral dependent loans are sometimes recorded to reflect partial write-downs based on the current appraised value of the collateral or internally developed models, which contain management’s assumptions concerning the amount and timing of the cash flows associated with that loan.
Real estate owned and other repossessed assets are recorded at the lower of the carrying amount of the loan or fair value less selling costs at the time of acquisition. Any write-downs based on the asset’s fair value at the date of acquisition are charged to the allowance for loan losses. After foreclosure, management periodically performs valuations such that the real estate is carried at the lower of its new cost basis or fair value, net of estimated costs to sell.
There were no transfers between fair value categories during the year ended December 31, 2010. The following table presents the balances of assets and liabilities measured at fair value on a recurring basis at December 31, 2010 and 2009:
|
Fair Value at December 31, 2010
|
||||||||||||||||
|
(Dollars in thousands)
|
Level 1
|
Level 2
|
Level 3
|
Total
|
||||||||||||
|
Assets
|
||||||||||||||||
|
Mortgage-backed securities
|
$ | - | $ | 67,203 | $ | - | $ | 67,203 | ||||||||
|
Agency notes & bonds
|
- | 111,119 | - | 111,119 | ||||||||||||
|
U.S. Treasury notes
|
- | 56,284 | - | 56,284 | ||||||||||||
|
Interest rate caps
|
- | 8,732 | - | 8,732 | ||||||||||||
|
Total
|
$ | - | $ | 243,338 | $ | - | $ | 243,338 | ||||||||
|
Liabilities
|
||||||||||||||||
|
Junior subordinated debentures
|
$ | - | $ | - | $ | 1,500 | $ | 1,500 | ||||||||
|
Total
|
$ | - | $ | - | $ | 1,500 | $ | 1,500 | ||||||||
|
Fair Value at December 31, 2009
|
||||||||||||||||
|
(Dollars in thousands)
|
Level 1
|
Level 2
|
Level 3
|
Total
|
||||||||||||
|
Assets
|
||||||||||||||||
|
Mortgage-backed securities
|
$ | - | $ | 41,280 | $ | - | $ | 41,280 | ||||||||
|
Agency notes & bonds
|
- | 186,525 | - | 186,525 | ||||||||||||
|
Total
|
$ | - | $ | 227,805 | $ | - | $ | 227,805 | ||||||||
|
Liabilities
|
||||||||||||||||
|
Junior subordinated debentures
|
$ | - | $ | - | $ | 3,341 | $ | 3,341 | ||||||||
|
Total
|
$ | - | $ | - | $ | 3,341 | $ | 3,341 | ||||||||
The change in fair market value of the junior subordinated debentures is recorded as a component of non-operating income. The following table presents the fair value adjustments for the junior subordinated debentures, which use significant unobservable inputs (Level 3) for the years ended December 31, 2010 and 2009.
|
Fair Value Measurements Using Significant Unobservable Inputs
(Level 3)
|
||||||||
|
Years Ended December 31,
|
||||||||
|
(Dollars in thousands)
|
2010
|
2009
|
||||||
|
Beginning balance
|
$ | 3,341 | $ | 10,510 | ||||
|
Total gains recognized
|
(1,841 | ) | (7,169 | ) | ||||
|
Ending balance
|
$ | 1,500 | $ | 3,341 | ||||
124
CASCADE FINANCIAL CORPORATION AND SUBSIDIARIES
Notes to Consolidated Financial Statements
The following table presents the balance of assets measured at fair value on a nonrecurring basis at December 31, 2010 and 2009, and the total impairment resulting from these fair value adjustments for the year ended December 31, 2010 and 2009.
|
Fair Value at December 31, 2010
|
Year Ended
December 31, 2010
|
|||||||||||||||||||
|
(Dollars in thousands)
|
Level 1
|
Level 2
|
Level 3
|
Total (1)
|
Total Gains
(Losses) (2)
|
|||||||||||||||
|
Impaired loans
|
$ | - | $ | - | $ | 138,198 | $ | 138,198 | $ | (10,719 | ) | |||||||||
|
REO
|
- | - | 34,412 | 34,412 | (11,425 | ) | ||||||||||||||
|
Goodwill
|
- | - | - | - | (12,885 | ) | ||||||||||||||
|
Total
|
$ | - | $ | - | $ | 172,610 | $ | 172,610 | $ | (35,029 | ) | |||||||||
|
Fair Value at December 31, 2009
|
Year Ended
December 31, 2009
|
|||||||||||||||||||
|
(Dollars in thousands)
|
Level 1
|
Level 2
|
Level 3
|
Total (1)
|
Total Gains
(Losses) (2)
|
|||||||||||||||
|
Impaired loans
|
$ | - | $ | - | $ | 177,317 | $ | 177,317 | $ | (26,964 | ) | |||||||||
|
REO
|
- | - | 18,842 | 18,842 | (1,489 | ) | ||||||||||||||
|
Goodwill
|
- | - | 12,885 | 12,885 | (11,700 | ) | ||||||||||||||
|
Total
|
$ | - | $ | - | $ | 209,044 | $ | 209,044 | $ | (40,153 | ) | |||||||||
|
(1)
|
Impaired loans include loans on nonaccrual, classified doubtful and/or individually analyzed for impairment, adjusted by the impairment amount. REO is disclosed at the year-end book balance.
|
|
(2)
|
Total gains/losses for loans includes the actual impairment amount plus the allowance for loan loss write downs during the year for those loans considered impaired at year-end. Losses for REO are the net losses recognized during the year. In the second quarter of 2009, the Bank recorded an $11.7 million impairment charge on goodwill, which reduced the value of goodwill to $12.9 million and in the second quarter of 2010, wrote-off the remaining $12.9 million.
|
Note 22 – Operating Segments
The Corporation and the Bank are managed as a legal entity and not by operating segments. The Bank’s operations include commercial banking services, such as lending activities, business services, deposit products and other services. The performance of the Bank as a whole is reviewed by the Board of Directors and Management Committee.
The Management Committee, which is the senior decision making group of the Bank, is comprised of six members including the President/CEO. Segment information is not necessary to be presented in the notes to the Consolidated Financial Statements because operating decisions are made based on the performance of the Corporation as a whole.
Note 23 - Condensed Financial Information of Cascade Financial Corporation
Following are the condensed financial statements of Cascade Financial Corporation (parent only) for the period indicated:
|
(Dollars in thousands)
|
December 31,
|
|||||||
|
Balance Sheet
|
2010
|
2009
|
||||||
|
Assets
|
||||||||
|
Cash
|
$ | 314 | $ | 361 | ||||
|
Investment in subsidiary
|
81,342 | 155,270 | ||||||
|
Other assets
|
864 | 1,243 | ||||||
|
Total assets
|
$ | 82,520 | $ | 156,874 | ||||
|
Liabilities and stockholders’ equity
|
||||||||
|
Other liabilities
|
$ | 7,103 | $ | 3,618 | ||||
|
Junior subordinated debentures
|
16,965 | 18,806 | ||||||
|
Stockholders’ equity
|
58,452 | 134,450 | ||||||
|
Total liabilities and stockholders’ equity
|
$ | 82,520 | $ | 156,874 | ||||
125
CASCADE FINANCIAL CORPORATION AND SUBSIDIARIES
Notes to Consolidated Financial Statements
|
(Dollars in thousands)
|
Years Ended December 31,
|
|||||||||||
|
Statement of Operations
|
2010
|
2009
|
2008
|
|||||||||
|
Equity in undistributed net income of the subsidiary
|
$ | (70,013 | ) | $ | (26,536 | ) | $ | 3,071 | ||||
|
Interest income – junior subordinated debentures
|
62 | 64 | 64 | |||||||||
|
Net gain on fair value of junior subordinated debentures payable
|
1,841 | 7,169 | 912 | |||||||||
|
Operating expenses
|
(277 | ) | (399 | ) | (366 | ) | ||||||
|
Interest expense – junior subordinated debentures
|
(2,046 | ) | (2,114 | ) | (2,120 | ) | ||||||
|
(Loss) income before (benefit) provision from income taxes
|
(70,433 | ) | (21,816 | ) | 1,561 | |||||||
|
(Benefit) provision from income taxes
|
147 | (1,652 | ) | 529 | ||||||||
|
Net (loss) income
|
$ | (70,286 | ) | $ | (23,468 | ) | $ | 2,090 | ||||
|
Dividends on preferred stock
|
2,026 | 1,943 | 216 | |||||||||
|
Accretion of issuance discount on preferred stock
|
450 | 422 | 35 | |||||||||
|
Net (loss) income attributable to common stockholders
|
$ | (72,762 | ) | $ | (25,833 | ) | $ | 1,839 | ||||
|
(Dollars in thousands)
|
Years Ended December 31,
|
|||||||||||
|
Statement of Cash Flows
|
2010
|
2009
|
2008
|
|||||||||
|
Cash flows from operating activities:
|
||||||||||||
|
Net (loss) income
|
$ | (70,286 | ) | $ | (23,468 | ) | $ | 2,090 | ||||
|
Adjustments to reconcile net (loss) income to net cash used in operating activities:
|
||||||||||||
|
Equity in net income of subsidiaries
|
70,013 | 26,536 | (3,071 | ) | ||||||||
|
Increase in other assets
|
379 | 49 | 719 | |||||||||
|
Decrease in other liabilities
|
(383 | ) | (4,763 | ) | (911 | ) | ||||||
|
Net cash used in operating activities
|
(277 | ) | (1,646 | ) | (1,173 | ) | ||||||
|
Cash flows from investing activities:
|
||||||||||||
|
Dividends received from subsidiaries
|
- | 3,600 | 4,600 | |||||||||
|
Investment in subsidiary
|
- | - | (38,970 | ) | ||||||||
|
Net cash provided by (used in) investing activities
|
- | 3,600 | (34,370 | ) | ||||||||
|
Cash flows from financing activities:
|
||||||||||||
|
Issuance of common stock
|
230 | 209 | 357 | |||||||||
|
Tax benefit from stock-based compensation
|
- | 4 | 30 | |||||||||
|
Dividends paid
|
- | (2,093 | ) | (3,794 | ) | |||||||
|
Proceeds from preferred stock and warrants
|
- | - | 38,970 | |||||||||
|
Net cash provided by (used in) financing activities
|
230 | (1,880 | ) | 35,563 | ||||||||
|
Net (decrease) increase in cash and cash equivalents
|
(47 | ) | 74 | 20 | ||||||||
|
Cash and cash equivalents:
|
||||||||||||
|
Beginning of year
|
361 | 287 | 267 | |||||||||
|
End of year
|
$ | 314 | $ | 361 | $ | 287 | ||||||
126
Exhibit Index
|
Exhibit No.
|
Exhibit
|
|
2.1
|
Agreement and Plan of Reorganization with Opus Bank dated as of March 3, 2011 (Incorporated by reference to the Corporation’s Form 8-K filed March 7, 2011 (File No. 000-25286)
|
|
3.1(i)
|
Articles of Incorporation of Cascade Financial Corporation (incorporated by reference to exhibit A to the definitive proxy statement filed on March 26, 2003 (File No. 000-25286)).
|
|
3.2(i)
|
Amendment to the Articles of Incorporation of Cascade Financial Corporation, including Statement of Designations for the Series A Preferred Stock (incorporated by reference to the registrant’s Form 8-K/A filed November 26, 2008 (File No. 000-25286)).
|
|
3.3(ii)
|
Bylaws of Cascade Financial Corporation (incorporated by reference to the registrant’s registration statement on Form S-4 filed March 31, 2004 (File No. 333-114087)).
|
|
3.4(ii)
|
Amendment to the Bylaws of Cascade Financial Corporation (incorporated by reference to the Corporation’s Form 8-K filed September 27, 2005 (File No. 0-25286)).
|
|
4.1
|
Form of Series A Preferred Stock Certificate (incorporated by reference to the Corporation’s Form 8-K/A filed November 26, 2008 (File No. 000-25286)).
|
|
4.2
|
Warrant to purchase 863,442 shares of Common Stock issued on November 21, 2008 (incorporated by reference to the registrant’s Form 8-K/A filed November 26, 2008 (File No. 000-25286)).
|
|
10.1
|
Cascade Financial Corporation 1994 Employee Stock Purchase Plan (Incorporated by reference to the Corporation’s Registration Statement on Form S-4 (File No. 33-83200)).
|
|
10.2
|
Cascade Financial Corporation 1992 Stock Option and Incentive Plan (Incorporated by reference to the Corporation’s Form 10-KSB for the period ending June 30, 1995).
|
|
10.3
|
Cascade Financial Corporation Employee Stock Ownership Plan (Incorporated by reference to the Corporation’s Annual Report on Form 10-KSB for the period ending June 30, 1995).
|
|
10.4
|
Cascade Financial Corporation 1997 Stock Option Plan (Incorporated by reference to Appendix E to the Prospectus included in the Corporation’s Registration Statement on Form S-4 (File No. 333-24203)).
|
|
10.5
|
Cascade Financial Corporation 1997 Elective Equity Plan. (Incorporated by reference to Exhibit 10.7 of the Corporation’s Form 10-K for the period ending December 31, 2001).
|
|
10.8
|
Cascade Bank Non-Qualified Deferred Compensation Plan dated February 1, 2008 (Incorporated by reference to Exhibit 10.1 of the Corporation’s Form 8-K filed January 16, 2008 (File No. 000-25286)).
|
|
10.9
|
Letter Agreement, dated November 21, 2008, including Securities Purchase Agreement – Standard Terms, between the Corporation and the United States Department of the Treasury (Incorporated by reference to the Corporation’s Form 8-K/A filed November 26, 2008 (File No. 000-25286)).
|
|
10.10
|
Form of Agreement to Amend Compensation Agreements with Senior Executive Officer, executed by Carol K. Nelson, Lars H. Johnson, Robert G. Disotell, LeAnne M. Harrington, Debbie E. McLeod, and Steven R. Erickson (Incorporated by reference to the Corporation’s Form 8-K/A filed November 26, 2008 (File No. 000-25286)).
|
127
|
Exhibit No.
|
Exhibit (continued)
|
|
10.11
|
Settlement Agreement between Cascade Financial Corporation and Craig G. Skotdal, Dwayne R. Lane, Thomas H. Rainville, Christian H. Sievers, Arnold R. Hofmann, Arthur W. Skotdal, Andrew P. Skotdal, Skotdal Quality Investments, L.L.C., Skotdal Enterprises, Inc., and Arthur & Marianne Skotdal Revocable Living Trust (Incorporated by reference to the Corporation’s Form 8-K filed April 29, 2010 (File No. 000-25286)).
|
|
10.12
|
FDIC Consent Order dated July 21, 2010 (Incorporated by reference to the Corporation’s Form 8-K filed July 21, 2010 (File No. 000-25286)).
|
|
21
|
Subsidiaries.
|
|
23
|
Consent of Independent Registered Public Accounting Firm – Moss Adams LLP.
|
|
31.1
|
Certification of Chief Executive Officer pursuant to Section 302 of the Sarbanes-Oxley Act of 2002.
|
|
31.2
|
Certification of Chief Financial Officer pursuant to Section 302 of the Sarbanes-Oxley Act of 2002.
|
|
32
|
Certification of Annual Report on Form 10-K pursuant to Section 906 of the Sarbanes-Oxley Act of 2002.
|
|
99.1
|
Subsequent Year Certification of the Chief Executive Officer and Chief Financial Officer pursuant to Section 111(b) of the Emergency Economic Stabilization Act of 2008.
|
|
(b)
|
Reports on Form 8-K
|
On October 22, 2010, the Corporation filed a Form 8-K reporting an attached press release announcing that it had successfully completed a series of balance sheet restructuring transactions, under Items 8.01 and 9.01 of Form 8-K.
On October 26, 2010, the Corporation filed a Form 8-K reporting an attached press release announcing earnings information for the third quarter ended September 30, 2010, under Items 2.02 and 9.01 of Form 8-K.
On January 25, 2011, the Corporation filed a Form 8-K reporting an attached press release announcing earnings information for the fourth quarter and year ended December 31, 2010, under Items 2.02 and 9.01 of Form 8-K.
On February 3, 2011, the Corporation filed a Form 8-K reporting that the Corporation had received noticed from the Nasdaq Stock Market that it had been granted an additional 180 calendar day period, or until August 1, 2011, to regain compliance with the Nasdaq minimum $1.00 bid price per share requirement, under Item 3.01.
On March 4, 2011, the Corporation filed a Form 8-K reporting an attached press release dated as of March 4, 2011 announcing its entry into an Agreement and Plan of Reorganization with Opus Bank, under Items 1.01, 7.01 and 9.01 of Form 8-K.
On March 7, 2011, the Corporation filed a Form 8-K reporting an attached Agreement and Plan of Reorganization by and between the Corporation and Opus Bank dated as of March 3, 2011, a letter to the Corporation’s shareholders and a customer FAQ concerning the proposed transaction, under Items 1.01, 7.01 and 9.01 of Form 8-K.
128
SIGNATURES
Pursuant to the requirements of Section 13 or 15(d) of the Securities Exchange Act of 1934, the registrant has duly caused this report to be signed on its behalf by the undersigned, thereunto duly authorized.
|
CASCADE FINANCIAL CORPORATION
|
|
|
Date: March 25, 2011
|
/s/ Carol K. Nelson
|
|
By: Carol K. Nelson,
President and Chief Executive Officer
(Principal Executive Officer)
|
|
|
Date: March 25, 2011
|
/s/ Debra L. Johnson
|
|
By: Debra L. Johnson,
Executive Vice President and Chief Financial Officer
(Principal Financial and Accounting Officer)
|
Pursuant to the requirements of Section 13 or 15(d) of the Securities Exchange Act of 1934, this report has been signed below by the following persons on behalf of the registrant and in the capacities and on the dates indicated.
|
By:
|
/s/ David W. Duce
|
By:
|
/s/ Ronald E. Thompson
|
|
|
David W. Duce
Director
|
Ronald E. Thompson
Director
|
|||
|
Date:
|
March 25, 2011
|
Date:
|
March 25, 2011
|
|
|
By:
|
/s/ Janice Halladay
|
By:
|
/s/ G. Brandt Westover
|
|
|
Janice Halladay
Director
|
G. Brandt Westover
Director
|
|||
|
Date:
|
March 25, 2011
|
Date:
|
March 25, 2011
|
|
|
By:
|
/s/ David O’Connor
|
By:
|
/s/ D. R. Murphy
|
|
|
David O’Connor
Director
|
D. R. Murphy
Chair
|
|||
|
Date:
|
March 25, 2011
|
Date:
|
March 25, 2011
|
|
|
By:
|
/s/ Richard L. Anderson
|
By:
|
/s/ Marion R. Foote
|
|
|
Richard L. Anderson
Director
|
Marion R. Foote
Director
|
|||
|
Date:
|
March 25, 2011
|
Date:
|
March 25, 2011
|
|
|
By:
|
/s/ Thomas H. Rainville
|
By:
|
/s/ Jim Gaffney
|
|
|
Thomas H. Rainville
Director
|
Jim Gaffney
Director
|
|||
|
Date:
|
March 25, 2011
|
Date:
|
March 25, 2011
|
|
|
By:
|
/s/ Christian H. Sievers
|
By:
|
/s/ Arnold R. Hofmann
|
|
|
Christian H. Sievers
Director
|
Arnold R. Hofmann
Director
|
|||
|
Date:
|
March 25, 2011
|
Date:
|
March 25, 2011
|
129