Attached files
| file | filename |
|---|---|
| EX-31.2 - JEFFERSONVILLE BANCORP | v214979_ex31-2.htm |
| EX-32.2 - JEFFERSONVILLE BANCORP | v214979_ex32-2.htm |
| EX-21.1 - JEFFERSONVILLE BANCORP | v214979_ex21-1.htm |
| EX-32.1 - JEFFERSONVILLE BANCORP | v214979_ex32-1.htm |
| EX-31.1 - JEFFERSONVILLE BANCORP | v214979_ex31-1.htm |
UNITED STATES
SECURITIES AND EXCHANGE COMMISSION
WASHINGTON, D.C. 20549
FORM 10-K
|
|
ý
|
ANNUAL REPORT PURSUANT TO SECTION 13 OR 15(d) OF THE SECURITIES EXCHANGE ACT OF 1934
|
For the fiscal year ended December 31, 2010
OR
|
|
o
|
TRANSITION REPORT PURSUANT TO SECTION 13 OR 15(d) OF THE SECURITIES EXCHANGE ACT OF 1934
|
For the transition period from ____________ to____________
Commission file number: 0-19212
JEFFERSONVILLE BANCORP
(Exact name of registrant as specified in its charter)
|
New York
|
22-2385448
|
|
|
(State or other jurisdiction of incorporation or organization)
|
(I.R.S. Employer Identification No.)
|
|
|
4866 State Rte. 52, Jeffersonville, New York
|
12748
|
|
|
(Address of principal executive offices)
|
|
(Zip Code)
|
|
(845) 482-4000
|
|
(Registrant’s telephone number, including area code)
|
Securities registered pursuant to Section 12(g) of the Act:
|
Title of each class
|
Name of each exchange on which registered
|
|
|
NONE
|
|
NONE
|
Securities registered pursuant to Section 12(g) of the Act:
Title of Class: Common Stock, $0.50 Par Value
Indicate by check mark if the registrant is a well-known seasoned issuer, as defined in Rule 405 of the Securities Act.
|
Yes ¨
|
No x
|
Indicate by check mark if the registrant is not required to file reports pursuant to Section 13 or Section 15(d) of the Act.
|
Yes ¨
|
No x
|
Indicate by check mark whether the registrant (1) has filed all reports required to be filed by Section 13 or 15(d) of the Securities Exchange Act of 1934 during the preceding 12 months (or for such shorter period that the registrant was required to file such reports), and (2) has been subject to such filing requirements for the past 90 days.
|
Yes x
|
No o
|
Indicate by check mark whether the registrant has submitted electronically and posted on its corporate Web site, if any, every Interactive Data File required to be submitted and posted pursuant to Rule 405 of Regulation S-T (§ 232.405 of this chapter) during the preceding 12 months (or for such shorter period that the registrant was required to submit and post such files).
|
Yes ¨
|
No o
|
Indicate by check mark if disclosure of delinquent filers pursuant to Item 405 of Regulation S-K is not contained herein, and will not be contained, to the best of registrant’s knowledge, in definitive proxy or information statements incorporated by reference in Part III of this Form 10-K or any amendment to this Form 10-K. ¨
Indicate by check mark whether the registrant is a large accelerated filer, an accelerated filer, a non-accelerated filer or a smaller reporting company. See definitions of “large accelerated filer”, “accelerated filer” and “smaller reporting company” in Rule 12b-2 of the Exchange Act.
Large accelerated filer ¨ Accelerated filer ¨ Non-accelerated filer ¨ Smaller reporting company x
Indicate by check mark whether the registrant is a shell company (as defined in Rule 12b-2 of the Exchange Act).
|
Yes ¨
|
No x
|
As of June 30, 2010 the aggregate market value of the registrant’s common stock held by non-affiliates of the registrant was $44,636,000 based on the closing price of $11.50 as reported on the National Association of Securities Dealers Automated Quotation System National Market System.
Indicate the number of shares outstanding of each of the issuer’s classes of common stock, as of the latest practicable date.
|
Class
|
Outstanding at March 24, 2011
|
|
|
Common Stock, $0.50 par value per share
|
|
4,234,505 shares
|
DOCUMENTS INCORPORATED BY REFERENCE
|
Document
|
Parts Into Which Incorporated
|
|
|
Proxy Statement for the Annual Meeting of Stockholders to be held
|
Part III Items 10, 11, 12, 13 and 14
|
|
|
April 26, 2011 (Proxy Statement)
|
|
JEFFERSONVILLE BANCORP INDEX TO FORM 10-K
|
Page
|
||
|
PART I
|
||
|
Item 1.
|
Business
|
3
|
|
Item 1A.
|
Risk Factors
|
8
|
|
Item 1B.
|
Unresolved Staff Comments
|
12
|
|
Item 2.
|
Properties
|
12
|
|
Item 3.
|
Legal Proceedings
|
12
|
|
Item 4.
|
(Removed and Reserved)
|
|
|
PART II
|
||
|
Item 5.
|
Market for the Registrant’s Common Equity,
|
|
|
Related Stockholder Matters and Issuer Purchases of Equity Securities
|
13
|
|
|
Item 6.
|
Selected Financial Data
|
14
|
|
Item 7.
|
Management’s Discussion and Analysis of
|
|
|
Financial Condition and Results of Operations
|
15
|
|
|
Item 7A.
|
Quantitative and Qualitative Disclosures about Market Risk
|
29
|
|
Item 8.
|
Financial Statements and Supplementary Data
|
30
|
|
Item 9.
|
Changes in and Disagreements with Accountants
|
|
|
on Accounting and Financial Disclosure
|
66
|
|
|
Item 9A.
|
Controls and Procedures
|
66
|
|
Item 9B.
|
Other Information
|
66
|
|
PART III
|
||
|
Item 10.
|
Directors, Executive Officers and Corporate Governance
|
67
|
|
Item 11.
|
Executive Compensation
|
67
|
|
Item 12.
|
Security Ownership of Certain Beneficial Owners
|
|
|
and Management, and Related Stockholder Matters
|
67
|
|
|
Item 13.
|
Certain Relationships and Related Transactions and Director Independence
|
67
|
|
Item 14.
|
Principal Accountant and Fees and Services
|
67
|
|
PART IV
|
||
|
Item 15.
|
Exhibits, Financial Statement Schedules
|
68
|
|
Signatures
|
69
|
2
ITEM 1. BUSINESS
GENERAL
Jeffersonville Bancorp (the “Company”) was organized as a New York corporation on January 12, 1982, for the purpose of becoming a registered bank holding company under the Bank Holding Company Act of 1956, as amended (the “BHC Act”). Effective June 30, 1982, the Company became the registered bank holding company for The First National Bank of Jeffersonville, a bank chartered in 1913 and organized under the national banking laws of the United States (the “Bank”). The Company is engaged in the business of managing or controlling its subsidiary bank and such other business related to banking as may be authorized under the BHC Act.
At December 31, 2010 and 2009, the Company had total assets of $430.8 million and $422.7 million, securities available for sale of $104.7 million and $91.3 million, securities held to maturity of $6.0 million and $8.2 million, and net loans receivable of $277.8 million and $275.4 million, respectively. At December 31, 2010 and 2009, total deposits were $350.9 million and $352.2 million, respectively. At December 31, 2010 and 2009, stockholders’ equity was $47.5 million and $44.7 million, respectively.
The Bank is based in Sullivan County, New York. In addition to its main office and operations center in Jeffersonville, the Bank had eleven additional branch office locations in Bloomingburg, Eldred, Liberty, Loch Sheldrake, Monticello, Livingston Manor, Narrowsburg, Callicoon, Wurtsboro, White Lake and one in a Wal*Mart store in Monticello. The Bank is a full service banking institution employing approximately 131 people and serving all of Sullivan County, New York as well as some areas of adjacent counties in New York and Pennsylvania.
NARRATIVE DESCRIPTION OF BUSINESS
Through its community bank subsidiary, The First National Bank of Jeffersonville, the Company provides traditional banking related services, which constitute the Company’s only business segment. Banking services consist primarily of attracting deposits from the areas served by its banking offices and using those deposits to originate a variety of commercial, consumer, and real estate loans. The Company’s primary sources of liquidity are its deposit base; Federal Home Loan Bank (“FHLB”) borrowings; repayments and maturities on loans; short-term assets such as federal funds and short-term interest bearing deposits in banks; and maturities and sales of securities available for sale.
The Bank has three subsidiaries, FNBJ Holding Corporation, which is a Real Estate Investment Trust (REIT) and is wholly-owned by the Bank and two other wholly-owned subsidiaries which hold, and thereby limit the liability on, selected foreclosed properties of the Bank.
The Company’s filings with the Securities and Exchange Commission, including this Annual Report on Form 10-K, are available on the Company’s website, www.jeffbank.com or upon request submitted to John A. Russell, P.O. Box 398, Jeffersonville, New York 12748.
DEPOSIT AND LOAN PRODUCTS
Deposit Products. The Bank offers a variety of deposit products typical of commercial banks and has designed product offerings responsive to the needs of both individuals and businesses. Traditional demand deposit accounts, interest-bearing transaction accounts (NOW accounts) and savings accounts are offered on a competitive basis to meet customers’ basic banking needs. Money market accounts, time deposits in the form of certificates of deposit and IRA accounts provide customers with price competitive and flexible investment alternatives. The Bank does not have a single depositor or a small group of related depositors whose loss would have a material adverse effect upon the business of the Bank. See item 7, Distribution of Assets,
Liabilities & Stockholders’ Equity for average balances of deposit products at December 31, 2010, 2009 and 2008.
Loan Products. The Company originates residential and commercial real estate loans, as well as commercial, consumer and agricultural loans, to borrowers primarily in Sullivan County, New York, designed to meet the banking needs of individual customers, businesses and municipalities. A substantial portion of the loan portfolio is secured by real estate properties located in that area. The ability of the Company’s borrowers to make principal and interest payments is dependent upon, among other things, the level of overall economic activity and the real estate market conditions prevailing within the Company’s concentrated lending area. Periodically, the Company purchases loans from other financial institutions that are in markets
outside of Sullivan County.
Please see item 7, Results of Operations 2010 versus 2009 for a description of the loan portfolio and recent loan loss experience. Additional information is set forth below relating to the Bank’s loan products, including major loan categories, general loan terms, credit underwriting criteria, and risks particular to each category of loans. The Bank does not have a major loan concentration in any individual industry.
3
Commercial Loans and Commercial Real Estate Loans. The Bank offers a variety of commercial credit products and services to its customers. These include secured and unsecured loan products specifically tailored to the credit needs of the customers, underwritten with terms and conditions reflective of risk profile objectives and corporate earnings requirements. These products are offered at all branch locations. All commercial and commercial real estate loans are governed by a commercial loan policy which was developed to provide a clear framework for determining acceptable levels of credit risk, underwriting criteria, monitoring existing credits, and managing problem credit relationships. Credit risk control mechanisms have been
established and are monitored closely for compliance by the internal auditor and an external loan review company.
Risks particular to commercial loans include borrowers’ capacities to perform according to contractual terms of loan agreements during periods of unfavorable economic conditions and changing competitive environments. Management expertise and competency are critical factors affecting the customers’ performance and ultimate ability to repay their debt obligations. Commercial real estate loans and other secured commercial loans are exposed to fluctuations in collateral value.
Consumer Loans. The Bank also offers a variety of consumer loan products. These products include both open-end credit (home equity lines of credit, unsecured revolving lines of credit) and closed-end credit secured and unsecured installment loans. Most of these loans are originated at the branch level. This delivery mechanism is supported by an automated loan platform delivery system. The lending process is designed to ensure not only the efficient delivery of credit products, but also compliance with applicable consumer regulations while minimizing credit risk exposure.
Credit decisions are made under the guidance of a standard consumer loan policy, with the assistance of senior credit managers. The loan policy was developed to provide definitive guidance encompassing credit underwriting, monitoring and management. Under the policy, unsecured consumer loans are granted to customers of good character who have an assured income, with a guideline of at least one year’s steady employment, a satisfactory credit record, and a guideline debt to income ratio of 40%. The quality and condition of the consumer loan portfolio, as well as compliance with established standards, is also monitored closely.
A borrower’s ability to repay consumer debt is generally dependent upon the stability of the income stream necessary to service the debt. Adverse changes in economic conditions resulting in higher levels of unemployment increase the risk of consumer defaults. Risk of default is also affected by a customer’s total debt obligation. While the Bank can analyze a borrower’s capacity to repay at the time a credit decision is made, subsequent extensions of credit by other financial institutions may cause the customer to become over-extended, thereby increasing the risk of default.
Residential Real Estate Loans. The Company originates a variety of mortgage loan products including fixed rate mortgages and adjustable rate mortgages. All mortgage loans originated are held in the Bank’s portfolio. The Bank’s residential real estate loan policy is designed to originate a diversified mix of 15-30 year fixed and variable rate, single and multi-family home loans with loan-to-value rates ranging from 60-80%. Residential real estate loans possess risk characteristics much the same as consumer loans. Stability of the borrower’s employment is a critical factor in determining the likelihood of repayment. Mortgage loans are also subject to the risk that the value of the underlying collateral will decline due to
economic conditions or other factors.
SUPERVISION AND REGULATION
The Company is a bank holding company, registered with the Board of Governors of the Federal Reserve System (“Federal Reserve”) under the Bank Holding Company Act (“BHC Act”). As such, the Federal Reserve is the Company’s primary federal regulator, and the Company is subject to extensive regulation, examination, and supervision by the Federal Reserve. The Bank is a national banking association, chartered by the Office of the Comptroller of the Currency (“OCC”). The OCC is the Bank’s primary federal regulator, and the Bank is subject to extensive regulation, examination, and supervision by the OCC. In addition, the Federal Deposit Insurance Corporation (“FDIC”) has authority to conduct special examinations of insured depository institutions, such as the
Bank, as deposit insurer.
Each of the federal banking agencies, including the Federal Reserve and the OCC, has issued substantially similar risk-based and leverage capital guidelines applicable to the banking organizations they supervise. The guidelines apply on a consolidated basis and require bank holding companies (on a consolidated basis) and banks to maintain a minimum ratio of Tier 1 capital to total average assets (or “leverage ratio”) of 3%. For those banks that do not have the highest regulatory ratings, the minimum Tier 1 leverage ratio is 4%. The capital adequacy guidelines also require bank holding companies and banks to maintain a minimum ratio of Tier 1 capital to risk-weighted assets of 4% and a minimum ratio of qualifying total capital to risk-weighted assets of 8%. Under the Federal Reserve guidelines, certain
small bank holding companies with pro forma consolidated assets of less than $500 million, such as the Company, are not required to follow the risk-based and leverage capital guidelines. As of December 31, 2010, the Bank’s leverage ratio was 10.4%, its ratio of Tier 1 capital to risk-weighted assets was 15.7%, and its ratio of qualifying total capital to risk-weighted assets was 17.0%. The federal banking agencies may set higher minimum capital requirements for bank holding companies and banks whose circumstances warrant it, such as companies or banks anticipating significant growth or facing unusual risks. The Federal Reserve has not advised the Bank of any special capital requirement applicable to it.
4
The Federal Reserve has indicated that it will consider a bank holding company’s capital ratios and other indications of its capital strength in evaluating any proposal to expand its banking or non-banking activities. Any bank holding company whose capital does not meet the minimum capital adequacy guidelines is considered to be undercapitalized and is required to submit an acceptable plan to the Federal Reserve for achieving capital adequacy. An acceptable capital plan would likely include, among other actions, a restriction on the Company’s ability to pay dividends to its stockholders.
Any bank that is less than adequately-capitalized is subject to certain mandatory prompt corrective actions by its primary federal regulatory agency, as well as other discretionary actions, to resolve its capital deficiencies. The severity of the actions required to be taken increases as the bank’s capital position deteriorates. Among the actions that may be imposed on an undercapitalized bank is the implementation of a capital restoration plan. A bank holding company must guarantee that a subsidiary bank will meet its capital restoration plan, up to an amount equal to 5% of the subsidiary bank’s assets at the time the bank became undercapitalized or the amount required to meet regulatory capital requirements, whichever is less. In addition, under Federal Reserve policy, a bank holding company is
expected to serve as a source of financial and managerial strength, and to commit financial resources to support its subsidiary banks in times of financial stress. Any capital loans made by a bank holding company to a subsidiary bank are subordinate to the claims of the bank’s depositors and to certain other indebtedness of the subsidiary bank. In the event of the bankruptcy of a bank holding company, any commitment by the bank holding company to a federal banking regulatory agency to maintain the capital of a subsidiary bank would be assumed by the bankruptcy trustee and would be entitled to priority of payment.
The Bank also is subject to regulatory limits on its ability to pay dividends to the Company. By statue, the Bank may not pay a dividend, without prior OCC approval, if the total amount of all dividends declared during the calendar year, including the proposed dividend, exceeds the sum of its retained net income to date during the calendar year and its retained net income over the preceding two years. As of December 31, 2010, the Bank had approximately $2.2 million available for the payment of dividends without prior OCC approval. The Bank’s ability to pay dividends also is subject to the Bank being in compliance with the regulatory capital requirements described above. The Bank is currently in compliance with these requirements.
The deposits of the Bank are insured up to regulatory limits by the FDIC. The Wall Street Reform Act amended the Federal Deposit Insurance Act (the “FDIA”), effective December 31, 2010, to temporarily provide unlimited deposit insurance coverage for funds held in noninterest-bearing transaction accounts through December 31, 2012. This coverage is separate from, and in addition to, the $250,000 coverage provided to depositors with other accounts held with the Bank. While similar to the FDIC’s Transaction Account Guarantee Program, which expired December 31, 2010, low-interest Negotiable Order of Withdrawal (NOW) accounts and Interest on Lawyer Trust Accounts (IOLTAs) do not qualify for unlimited coverage.
The deposits of the Bank are subject to the deposit insurance premium assessments of the Deposit Insurance Fund (“DIF”). The FDIC currently maintains a risk-based assessment system under which assessment rates vary based on the level of risk posed by the institution to the DIF. The assessment rate may, therefore, change when that level of risk changes.
In February 2011, the FDIC adopted a final rule making certain changes to the deposit insurance assessment system, many of which were made as a result of provisions of the Wall Street Reform Act. The final rule also revises the assessment rate schedule effective April 1, 2011, and adopts additional rate schedules that will go into effect when the Deposit Insurance Fund (DIF) reserve ratio reaches various milestones. The final rule changes the deposit insurance assessment system from one that is based on domestic deposits to one that is based on average consolidated total assets minus average tangible equity. In addition, the rule suspends FDIC dividend payments if the DIF reserve ratio exceeds 1.5 percent, but provides for decreasing assessment rates when the DIF reserve ratio reaches certain thresholds.
In calculating assessment rates, the rule adopts a new “scorecard” assessment scheme for insured depository institutions with $10 billion or more in assets. It retains the risk category system for insured depository institutions with less than $10 billion in assets, such as the Bank, assigning each institution to one of four risk categories based upon the institution’s capital evaluation and supervisory evaluation, as defined by the rule. Depending on the DIF reserve ratio, the total base assessment rates for each risk category will be as follows:
| Basis Points | ||||||||||||||||
|
DIF Reserve Ratio
|
Risk Category I
|
Risk Category II
|
Risk Category III
|
Risk Category IV
|
||||||||||||
|
< 1.15%
|
2.5 – 9 | 9 – 24 | 18 – 33 | 30 – 45 | ||||||||||||
|
1.15 – 2%
|
1.5 – 7 | 7 – 22 | 14 – 29 | 25 – 40 | ||||||||||||
|
2 – 2.5%
|
1 – 6 | 5 – 20 | 12 – 27 | 23 – 38 | ||||||||||||
|
> 2.5%
|
0.5 – 5 | 4.5 – 19 | 10 – 25 | 20 – 35 | ||||||||||||
5
The rule will take effect for the quarter beginning April 1, 2011, and will be reflected in the invoices for assessments due September 30, 2011.
The FDIA provides for additional assessments to be imposed on insured depository institutions to pay for the cost of Financing Corporation (“FICO”) funding. The FICO assessments are adjusted quarterly to reflect changes in the assessment base of the DIF and do not vary depending upon a depository institution’s capitalization or supervisory evaluation. During 2010, FDIC assessments for purposes of funding FICO bond obligations ranged from an annualized $0.0106 per $100 of deposits for the first quarter of 2009 to $0.0104 per $100 of deposits for the fourth quarter of 2009. The Bank paid $33,000 of FICO assessments in 2009. For the first quarter of 2011, the FICO assessment rate is $0.0102 per $100 of deposits. The Bank paid a total of $38,000 in special and regular assessments during
2010.
As a member of the Federal Home Loan Bank of New York, the Bank is required to hold a minimum amount of the capital stock thereof. As of December 31, 2010, the Bank satisfied this requirement.
Transactions between the Bank and any affiliate, which includes the Company, are governed by sections 23A and 23B of the Federal Reserve Act. Generally, sections 23A and 23B are intended to protect insured depository institutions from suffering losses arising from transactions with non-insured affiliates by placing quantitative and qualitative limitations on covered transactions between a bank and any one affiliate as well as all affiliates of the bank in the aggregate, and requiring that such transactions be on market terms as well as terms that are consistent with safe and sound banking practices.
Under the Gramm-Leach-Bliley Act (“GLB Act”), all financial institutions, including the Company and the Bank, are required to adopt privacy policies to restrict the sharing of nonpublic customer data with nonaffiliated parties at the customer’s request, and establish procedures and practices to protect customer data from unauthorized access. The Company has developed such policies and procedures for itself and the Bank, and believes it is in compliance with all privacy provisions of the GLB Act. In addition the Fair and Accurate Credit Transactions Act (“FACT Act”) includes many provisions concerning national credit reporting standards, and permits consumers, including customers of the Company and the Bank, to opt out of information sharing among affiliated companies for marketing
purposes. The FACT Act also requires banks and other financial institutions to notify their customers if they report negative information about them to a credit bureau or if they are granted credit on terms less favorable than those generally available. The Federal Reserve and the Federal Trade Commission (“FTC”) have extensive rulemaking authority under the FACT Act, and the Company and the Bank are subject to the rules that have been promulgated by the Federal Reserve and FTC, including recent rules regarding limitations of affiliate marketing and implementation of programs to identify, detect and mitigate certain identity theft red flags.
In response to periodic disclosures by companies in various industries of the loss or theft of computer-based nonpublic customer information, several members of Congress have called for the adoption of national standards for the safeguarding of such information and the disclosure of security breaches. Several committees of both houses of Congress have conducted hearings on data security and related issues, and have legislation pending before them regarding this issue.
Under Title III of the USA PATRIOT Act, also known as the International Money Laundering Abatement and Anti-Terrorism Financing Act of 2001, all financial institutions, including the Company and the Bank, are required to take certain measures to identify their customers, prevent money laundering, monitor certain customer transactions and report suspicious activity to U.S. law enforcement agencies, and scrutinize or prohibit altogether certain transactions of special concern. Financial institutions also are required to respond to requests for information from federal banking regulatory agencies and law enforcement agencies concerning their customers and their transactions. Information-sharing among financial institutions concerning terrorist or money laundering activities is encouraged by an exemption provided
from the privacy provisions of the GLB Act and other laws. Financial institutions that hold correspondent accounts for foreign banks or provide private banking services to foreign individuals are required to take measures to avoid dealing with certain foreign individuals or entities, including foreign banks with profiles that raise money laundering concerns, and are prohibited altogether from dealing with foreign “shell banks” and persons from jurisdictions of particular concern. All financial institutions also are required to adopt internal anti-money laundering programs. The effectiveness of a financial institution in combating money laundering activities is a factor to be considered in any application submitted by the financial institution under the Bank Merger Act, which applies to the Bank, or the BHC Act, which applies to the Company. The Company and the Bank have in place a Bank Secrecy Act and USA PATRIOT Act compliance program, and they engage in very few
transactions of any kind with foreign financial institutions or foreign persons.
The Sarbanes-Oxley Act (“SOA”) implemented a broad range of measures to increase corporate responsibility, enhance penalties for accounting and auditing improprieties at publicly traded companies, and protect investors by improving the accuracy and reliability of corporate disclosures pursuant to federal securities laws. SOA applies generally to companies that have securities registered under the Securities Exchange Act of 1934, including publicly-held bank holding companies such as the Company. SOA includes very specific disclosure requirements and corporate governance rules, and the SEC and securities exchanges have adopted extensive additional disclosure, corporate governance, and other related rules pursuant to SOA’s mandate. SOA represents significant federal involvement in matters
traditionally left to state regulatory systems, such as the regulation of the accounting profession, and to state corporate law, such as the relationship between a board of directors and management and between a board of directors and its committees. In addition, the federal banking regulators have adopted generally similar requirements concerning the certification of financial statements by bank officials.
6
Home mortgage lenders, including banks, are required under the Home Mortgage Disclosure Act (“HMDA”) to make available to the public expanded information regarding the pricing of home mortgage loans, including the “rate spread” between the interest rate on loans and certain Treasury securities and other benchmarks. The availability of this information has led to increased scrutiny of higher-priced loans at all financial institutions to detect illegal discriminatory practices and to the initiation of a limited number of investigations by federal banking agencies and the U.S. Department of Justice. The Company has no information that it or its affiliates are the subject of any HMDA investigation.
Over the past several years, declining housing values have resulted in deteriorating economic conditions across the U.S., resulting in significant write-downs in the values of mortgage-backed securities and derivative securities by financial institutions, government sponsored entities, and major commercial and investment banks. This has led to decreased confidence in financial markets among borrowers, lenders, and depositors as well as extreme volatility in the capital and credit markets and the failure of some entities in the financial sector. The Company is fortunate that the markets it serves have been impacted to a lesser extent than many areas around the country.
The Wall Street Reform Act, passed into law on July 21, 2010, represents a significant overhaul of many aspects of the regulation of the financial-services industry. Among other things, the Wall Street Reform Act creates a new federal Consumer Financial Protection Bureau (CFPB), tightens capital standards, imposes clearing and margining requirements on many derivatives activities, and generally increases oversight and regulation of financial institutions and financial activities.
The CFPB will begin operations on July 21, 2011. It will have broad authority to write regulations regarding consumer financial products and services. These regulations will apply to numerous types of entities, including insured depository institutions such as the Bank. Such regulations will not be proposed until the CFPB begins operations. It is impossible to predict at this time the content or number of such regulations.
In addition to the self-implementing provisions of the statute, the Wall Street Reform Act calls for over 200 administrative rulemakings by various federal agencies to implement various parts of the legislation. While some rules have been finalized and/or issued in proposed form, many have yet to be proposed. It is impossible to predict when all such additional rules will be issued or finalized, and what the content of such rules will be. We will have to apply resources to ensure that we are in compliance with all applicable provisions of the Wall Street Reform Act and any implementing rules, which may increase our costs of operations and adversely impact our earnings.
7
TAXATION
The Company files a calendar year consolidated federal income tax return on behalf of itself and its subsidiaries. The Company reports its income and deductions using the accrual method of accounting. The components of income taxes are as follows for the years ended December 31 (in thousands):
|
Tax Expense (Benefit)
|
2010
|
2009
|
2008
|
|||||||||
|
Federal
|
$ | 559 | $ | (791 | ) | $ | 1,135 | |||||
|
State
|
60 | 57 | 57 | |||||||||
|
Deferred tax (benefit)
|
(337 | ) | 1,417 | (2,053 | ) | |||||||
|
Total income taxes
|
$ | 282 | $ | 683 | $ | (861 | ) | |||||
For a detailed discussion of income taxes please refer to note 10 in the Notes to Consolidated Financial Statements.
MONETARY POLICY AND ECONOMIC CONDITIONS
The earnings of the Company and the Bank are affected by the policies of regulatory authorities, including the Federal Reserve System. Federal Reserve System monetary policies have had a significant effect on the operating results of commercial banks in the past and are expected to continue to do so in the future. Because of the changing conditions in the national economy and in the money markets, as a result of actions by monetary and fiscal authorities, interest rates, credit availability and deposit levels may change due to circumstances beyond the control of the Company and the Bank.
COMPETITION
The Bank faces strong competition for local business in the communities it serves from other financial institutions. Throughout Sullivan County there are 42 branches of commercial banks, savings banks, savings and loan associations and other financial organizations.
With respect to most of the services that the Bank offers, there is competition from financial institutions other than commercial banks. Money market funds and internet banks actively compete with banks for deposits. Savings banks, savings and loan associations and credit institutions, as well as consumer finance companies, insurance companies and pension trusts are important competitors. The Bank’s ability to maintain profitability is also affected by competition for loans.
NUMBER OF PERSONNEL
At December 31, 2010, there were 131 persons employed by the Bank.
ITEM 1A. RISK FACTORS
Although our common stock is traded on the NASDAQ Small Cap Market, the volume of trading in our common stock has been light. As a result, shareholders may not be able to quickly and easily sell their common stock.
Although our common stock is traded on the NASDAQ Small Cap Market, and a number of brokers offer to make a market in the common stock on a regular basis, trading volume is limited. As a result, you may find it difficult to sell shares at or above the price at which you purchased them and you may lose part of your investment.
Our common stock is not FDIC-insured.
Shares of our common stock are not securities or savings or deposit accounts or other obligations of our subsidiary bank. Our common stock is not insured by the Federal Deposit Insurance Corporation (“FDIC”) or any other governmental agency and is subject to investment risk, including the possible loss of your entire investment.
8
Applicable laws and regulations restrict both the ability of the Bank to pay dividends to the Company, and the ability of the Company to pay dividends to you.
Our principal source of income consists of dividends, if any, from the Bank. Payment of dividends by the Bank to us is subject to regulatory limitations imposed by the Office of the Comptroller of the Currency (“OCC”) and the Bank must meet OCC capital requirements before and after the payment of any dividends. In addition, the Bank cannot pay a dividend, without prior OCC approval, if the total amount of all dividends declared during a calendar year, including the proposed dividend, exceeds the sum of its retained net income to date during the calendar year plus the previous two years. The OCC has discretion to prohibit any otherwise permitted capital distribution on general safety and soundness grounds. As of December 31, 2010, approximately $2.2 million was available for the payment of dividends
without prior OCC approval.
Moreover, the laws of the State of New York, where the Company is incorporated, require that dividends be paid only from capital surplus so that the net assets of the Company remaining after such dividend payments are at least equal to the amounts of the Company’s stated capital.
Any payment of dividends in the future will continue to be at the sole discretion of our board of directors and will depend on a variety of factors deemed relevant by our board of directors, including, but not limited to, earnings, capital requirements and financial condition.
We operate in a highly regulated environment and may be adversely affected by changes in laws and regulations.
We are subject to extensive regulation, supervision and examination by the Board of Governors of the Federal Reserve System (“Federal Reserve”). The OCC is the Bank’s primary regulator and the Bank is subject to extensive regulation, examination, and supervision by the OCC. The Federal Deposit Insurance Corporation (“FDIC”) also has authority to conduct special examinations of insured depository institutions, such as the Bank, a deposit insurer. Such regulation and supervision govern the activities in which a financial institution and its holding company may engage and are intended primarily for the protection of the insurance fund and depositors and are not intended for the protection of investors in our common stock. Regulatory authorities have extensive discretion in connection
with their supervisory and enforcement activities, including the imposition of restrictions on the operation of an institution, the classification of assets by the institution and the adequacy of an institution’s allowance for loan losses. Any change in such regulation and oversight, whether in the form of regulatory policy, regulations, or legislation, may have a material impact on our operations.
In addition to the tightened capital standards to be imposed as a result of the Dodd-Frank Act, the Basel Committee on Bank Supervision recently announced higher global minimum capital standards (Basel III). Basel III has not been formally adopted and, at this time, it is unclear what the effect on the Bank will be.
Compliance with the recently enacted Dodd-Frank Reform Act may adversely impact our earnings.
On July 21, 2010, President Obama signed the Dodd-Frank Wall Street Reform and Consumer Protection Act (the “Dodd-Frank Reform Act”) into law. The Dodd-Frank Reform Act represents a significant overhaul of many aspects of the regulation of the financial-services industry. Major elements in the Dodd-Frank Reform Act include the following:
|
|
·
|
The establishment of the Financial Stability Oversight Counsel, which will be responsible for identifying and monitoring systemic risks posed by financial firms, activities, and practices.
|
|
|
·
|
Enhanced supervision of large bank holding companies (i.e., those with over $50 billion in total consolidated assets), with more stringent supervisory standards to be applied to them.
|
|
|
·
|
The creation of a special regime to allow for the orderly liquidation of systemically important financial companies, including the establishment of an orderly liquidation fund.
|
|
|
·
|
The development of regulations to address derivatives markets, including clearing and exchange trading requirements and a framework for regulating derivatives-market participants.
|
|
|
·
|
Enhanced supervision of credit-rating agencies through the Office of Credit Ratings within the SEC.
|
|
|
·
|
Increased regulation of asset-backed securities, including a requirement that issuers of asset-backed securities retain at least 5% of the risk of the asset-backed securities.
|
|
|
·
|
The establishment of a Bureau of Consumer Financial Protection, within the Federal Reserve, to serve as a dedicated consumer-protection regulatory body.
|
|
|
·
|
Amendments to the Truth in Lending Act aimed at improving consumer protections with respect to mortgage originations, including originator compensation, minimum repayment standards, and prepayment considerations.
|
9
The majority of the provisions in the Dodd-Frank Reform Act are aimed at financial institutions that are significantly larger than the Company or the Bank. Nonetheless, there are provisions with which we will have to comply with. As rules and regulations are promulgated by the federal agencies responsible for implementing and enforcing the provisions in the Dodd-Frank Reform Act, we will have to work to apply resources to ensure that we are in compliance with all applicable provisions, which may adversely impact the Company’s results of operations, financial condition or liquidity, any of which may impact the market price of the Company’s common stock.
The Company’s profitability depends significantly on local and national economic conditions.
We make loans and most of our assets are located in Sullivan County, New York as well as some adjacent areas in New York and Pennsylvania. Adverse changes in economic conditions in these markets could compromise our ability to collect loans, could reduce the demand for loans, and otherwise could negatively affect our performance and financial condition. A significant decline in general economic conditions, caused by inflation, recession, acts of terrorism, outbreak of hostilities or other international or domestic occurrences, unemployment, changes in securities markets or other factors could impact these local economic conditions and, in turn, have a material adverse effect on the Company’s financial condition and results of operations.
While the stability of the financial and capital marketplaces in the United States improved in 2010, global economic troubles and weak domestic growth indicators, especially stubbornly high unemployment, continued to create uncertainty of economic recovery in the near term. Passage of the sweeping Dodd-Frank Financial Reform Act has broad implications for lenders and details of many of its provisions have yet to be fully implemented by regulatory agencies. As a consumer driven legislative initiative, the end result is expected to be negative for the banking industry as a whole.
As a lender, we may be adversely affected by general economic weaknesses, and, in particular, a sharp downturn in the housing industry in the states of New York and Pennsylvania. A depressed economy has led to higher foreclosure rates increased charges to the allowance for loan losses and the reduction in real estate values in Sullivan County. No assurance can be given that these conditions will improve or will not worsen or that such conditions will not result in an increase in delinquencies, causing a decrease in our interest income, or continue to have an adverse impact on our loan loss experience, causing an increase in our allowance for loan losses.
There can be no assurance that recent government action will help stabilize the U.S. financial system and will not have unintended adverse consequences.
In recent periods, the U.S. government and various federal agencies and bank regulators have taken steps to stabilize and stimulate the financial services industry. Changes also have been made in tax policy for financial institutions. The Emergency Economic Stabilization Act of 2008 (the “EESA”), was an initial legislative response to the financial crises affecting the banking system and financial markets and going concern threats to financial institutions. Pursuant to the EESA, the Federal Reserve was given the authority to, among other things, purchase up to $700 billion of mortgages, mortgage-backed securities and certain other financial instruments from financial institutions for the purpose of stabilizing and providing liquidity to the U.S. financial markets. The Federal Reserve’s first
efforts to maintain low long-term interest rates by purchasing mortgage backed securities ended in the spring of 2010 and was largely successful in holding those rates in check. As a European solvency crisis emerged in April, rates sank lower as investors sought the safety of the treasury market. However, a second initiative by the Federal Reserve in the fall of 2010 involving the purchase of long term U.S. Treasury bonds had the opposite of the desired effect, driving rates up nearly 100 basis points in the span of two months leading into the end of the year. Also late in 2010, Congress passed and the President signed into law an extension of current tax cuts which were set to expire at the end of the year, with an additional stimulus of a 2% reduction in Social Security payroll taxes for nearly all wage earners in 2011.
Other government action, such as the Homeowner Affordability and Stability Plan which was intended to prevent mortgage defaults and foreclosures, which may provide benefits to the economy as a whole, but may also reduce the value of certain mortgage loans or other mortgage-related securities which investors, such as the Company, may hold. There can be no assurance as to the actual impact that these or other government actions will have on the financial markets, including the extreme levels of volatility and limited credit availability currently being experienced. The failure of measures to help stabilize the financial markets and a continuation or worsening of current financial market conditions could materially and adversely affect the Company’s business, financial condition, results of operations, access
to credit or the trading price of its common stock.
Declining residential and commercial real estate values could threaten the soundness and collectability of the real estate loans in the Bank’s portfolio.
At December 31, 2010, 64.5% of the total assets of the Company, or $277,812,000, consisted of net loans. Of that amount, $247,647,000 or 89.1% of net total loans were secured by residential or commercial real estate. Based on information from the National Association of Realtors, the average residential real estate sales price in its primary market area for the quarter ended December 31, 2010 has fallen approximately 13% from the average residential real estate sales price for the comparable quarter in 2009. See Management’s Discussion and Analysis – Nonaccrual and Past Due Loans.
10
There is no assurance that we will be able to successfully compete with others for business.
We compete for loans, deposits, and investment dollars with other insured depository institutions and enterprises, such as securities firms, insurance companies, savings associations, credit unions, mortgage brokers, and private lenders, many of which have substantially greater resources. The differences in resources and regulations may make it harder for us to compete profitably, reduce the rates that we can earn on loans and investments, increase the rates we must offer on deposits and other funds, and adversely affect our overall financial condition and earnings.
Declining tax revenues could threaten the soundness of the Bank’s investments in certain securities.
The Bank owns local non-rated municipal securities which are intended to be held until maturity. At December 31, 2010 the carrying value of these investment securities was $6,021,000. If declining economic activity and real estate values result in significant reduced tax revenues to the municipal entities which issued these securities, the entities could be forced to default on repayment of the securities, having an adverse effect on the Bank’s financial condition.
Our profitability depends on maintaining our projected interest rate differentials.
Our operating income and net income depend to a great extent on ‘‘rate differentials,’’ i.e., the difference between the interest yields we receive on loans, securities and other interest bearing assets and the interest rates we pay on interest bearing deposits and other liabilities. These rates are highly sensitive to many factors which are beyond our control, including general economic conditions and the policies of various governmental and regulatory authorities, including the Federal Reserve.
Our growth and expansion may be limited by many factors.
We have pursued and intend to continue to pursue an internal growth strategy, the success of which will depend primarily on generating an increasing level of loans and deposits at acceptable risk and interest rate levels without corresponding increases in non-interest expenses. We cannot assure you that we will be successful in continuing our growth strategies, due, in part, to delays and other impediments inherent in our highly regulated industry, limited availability of qualified personnel or unavailability of suitable branch sites. The Company is committed to maintaining loan credit quality and sacrificing growth in the loan portfolio if necessary. In addition, the success of our growth strategy will depend, in part, on continued favorable economic conditions in our market area.
11
ITEM 1B. UNRESOLVED STAFF COMMENTS
Not Applicable.
ITEM 2. PROPERTIES
In addition to the main office of the Company and the Bank in Jeffersonville, New York, the Bank has eleven branch locations and an operations center all within Sullivan County. Our branches are located in Bloomingburg, Callicoon, Eldred, Liberty, Livingston Manor, Loch Sheldrake, Monticello (two), Narrowsburg, White Lake and Wurtsboro. The Bank owns the main office and operations center along with seven branches: Bloomingburg, Eldred, Liberty, Livingston Manor, Loch Sheldrake, Narrowsburg and one location in Monticello. We occupy four branch locations pursuant with a lease arrangement in Callicoon, White Lake, Wurtsboro and one located in a Wal*Mart store in Monticello.
The Company’s leases for Callicoon, Wal*Mart, Wurtsboro and White Lake expire in 2012, 2014, 2020, and 2030 respectively. A renewal options exists for Callicoon for an additional 15 years. Future minimum lease payments are disclosed under the title Contractual Obligations.
The major classifications of premises and equipment and the book value thereof were as follows at December 31, 2010 (in thousands):
|
Premises and Equipment
|
2010
|
|||
|
Land
|
$ | 1,057 | ||
|
Buildings and improvements
|
6,563 | |||
|
Furniture and fixtures
|
337 | |||
|
Equipment
|
4,191 | |||
| 12,148 | ||||
|
Less accumulated depreciation and amortization
|
6,864 | |||
|
Total premises and equipment, net
|
$ | 5,284 | ||
|
ITEM 3.
|
LEGAL PROCEEDINGS
|
The Company and the Bank are not parties to any material legal proceedings other than ordinary routine litigation incidental to business.
12
PART II
|
ITEM 5.
|
MARKET FOR THE REGISTRANT’S COMMON EQUITY, RELATED STOCKHOLDER MATTERS AND ISSUER PURCHASES OF EQUITY SECURITIES
|
The Company’s common stock is traded on the NASDAQ Small Cap Market under the symbol JFBC. There are currently no market makers for the stock but the following investment firms are known to handle Jeffersonville Bancorp stock transactions: E*TRADE Securities LLC, TD Ameritrade, Inc. and Stifel, Nicolaus & Company, Inc. The following table shows the range of high and low sale prices for the Company’s stock and cash dividends paid for the quarters indicated.
|
Cash
|
||||||||||||
|
Sales
|
Sales
|
dividends
|
||||||||||
|
For the Quarter Ended:
|
low
|
high
|
paid
|
|||||||||
|
December 31, 2010
|
$ | 10.04 | $ | 11.25 | $ | 0.13 | ||||||
|
September 30, 2010
|
$ | 10.00 | $ | 11.25 | $ | 0.13 | ||||||
|
June 30, 2010
|
$ | 11.00 | $ | 12.45 | $ | 0.13 | ||||||
|
March 31, 2010
|
$ | 9.50 | $ | 12.60 | $ | 0.13 | ||||||
|
December 31, 2009
|
$ | 9.00 | $ | 10.03 | $ | 0.13 | ||||||
|
September 30, 2009
|
$ | 8.62 | $ | 9.75 | $ | 0.13 | ||||||
|
June 30, 2009
|
$ | 8.56 | $ | 9.75 | $ | 0.13 | ||||||
|
March 31, 2009
|
$ | 8.52 | $ | 9.78 | $ | 0.13 | ||||||
Number of Holders of Record. At the close of business on February 28, 2011, the Company had 1,393 stockholders of record of the 4,234,505 shares of common stock then outstanding.
Securities Authorized for Issuance Under Equity Compensation Plan. The Company has no equity compensation plans under which its securities may be issued.
Payment of Dividends. Applicable laws and regulations restrict the ability of the Bank to pay dividends to the Company, and the ability of the Company to pay dividends to stockholders. Payment of dividends in the future will be at the sole discretion of the Company’s board of directors and will depend on a variety of factors deemed relevant by the board of directors, including, but not limited to, earnings, capital requirements and financial condition. See Item 1. Business — Supervision and Regulation.
COMPARATIVE STOCK PERFORMANCE GRAPH
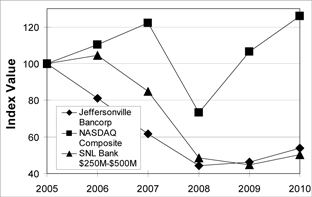
The following graph sets forth the cumulative total shareholder return on the Company’s Common Stock for the last five fiscal years. Total shareholder return is measured by dividing total dividends (assuming dividend reinvestment) for the measurement period plus share price change for a period by the share price at the beginning of the measurement period. The Company’s cumulative shareholder return over a five-year period is based on an investment of $100 on December 31, 2005 and the reinvestment of all dividends since that date to December 31, 2010 and is compared to the cumulative total return of the NASDAQ - Composite Index and the SNL Bank $250m - $500m Index. The data used was obtained from published sources and is believed to be accurate.
13
COMPARISON OF FIVE-YEAR CUMULATIVE RETURN FISCAL YEAR ENDED DECEMBER 31, 2010
|
Period Ending December 31,
|
||||||||||||||||||||||||
|
Index:
|
2005
|
2006
|
2007
|
2008
|
2009
|
2010
|
||||||||||||||||||
|
Jeffersonville Bancorp
|
100.00 | 80.99 | 61.58 | 44.22 | 46.32 | 53.74 | ||||||||||||||||||
|
NASDAQ Composite Index
|
100.00 | 110.39 | 122.15 | 73.32 | 106.57 | 125.91 | ||||||||||||||||||
|
SNL Bank $250M-$500M Index
|
100.00 | 104.48 | 84.92 | 48.50 | 44.89 | 50.24 | ||||||||||||||||||
|
ITEM 6.
|
SELECTED FINANCIAL DATA
|
FIVE-YEAR SUMMARY
(In thousands, except share and per share data)
|
December 31,
|
2010
|
2009
|
2008
|
2007
|
2006
|
|||||||||||||||
|
Results of Operations
|
||||||||||||||||||||
|
Interest income
|
$ | 21,838 | $ | 21,827 | $ | 22,953 | $ | 23,479 | $ | 23,881 | ||||||||||
|
Interest expense
|
4,365 | 5,847 | 7,228 | 8,615 | 8,211 | |||||||||||||||
|
Net interest income
|
17,473 | 15,980 | 15,725 | 14,864 | 15,670 | |||||||||||||||
|
Provision (credit) for loan losses
|
2,300 | 1,300 | 265 | (370 | ) | 90 | ||||||||||||||
|
Net income
|
3,129 | 3,084 | 2,702 | 4,275 | 4,943 | |||||||||||||||
|
Financial Condition
|
||||||||||||||||||||
|
Total assets
|
$ | 430,787 | $ | 422,684 | $ | 398,567 | $ | 387,430 | $ | 397,291 | ||||||||||
|
Total deposits
|
350,906 | 352,205 | 296,724 | 299,242 | 325,073 | |||||||||||||||
|
Gross loans
|
282,147 | 279,407 | 267,563 | 252,985 | 250,760 | |||||||||||||||
|
Stockholders’ equity
|
47,498 | 44,663 | 42,662 | 43,958 | 41,275 | |||||||||||||||
|
Average Balances
|
||||||||||||||||||||
|
Total assets
|
$ | 439,150 | $ | 415,678 | $ | 393,964 | $ | 389,384 | $ | 400,535 | ||||||||||
|
Total deposits
|
366,486 | 327,257 | 300,984 | 315,941 | 326,136 | |||||||||||||||
|
Gross loans
|
279,174 | 270,361 | 259,713 | 250,277 | 246,890 | |||||||||||||||
|
Stockholders’ equity
|
46,605 | 43,755 | 43,929 | 42,249 | 42,272 | |||||||||||||||
|
Financial Ratios
|
||||||||||||||||||||
|
Net income to average total assets
|
0.71 | % | 0.74 | % | 0.69 | % | 1.10 | % | 1.23 | % | ||||||||||
|
Net income to average stockholders’ equity
|
6.71 | % | 7.05 | % | 6.15 | % | 10.12 | % | 11.69 | % | ||||||||||
|
Average stockholders’ equity to average total assets
|
10.61 | % | 10.53 | % | 11.15 | % | 10.85 | % | 10.55 | % | ||||||||||
|
Share and Per Share Data
|
||||||||||||||||||||
|
Basic earnings per share
|
$ | 0.74 | $ | 0.73 | $ | 0.64 | $ | 1.00 | $ | 1.13 | ||||||||||
|
Dividends per share
|
$ | 0.52 | $ | 0.52 | $ | 0.52 | $ | 0.50 | $ | 0.48 | ||||||||||
|
Dividend payout ratio
|
70.4 | % | 71.4 | % | 81.5 | % | 49.9 | % | 42.4 | % | ||||||||||
|
Book value at year end
|
$ | 11.22 | $ | 10.55 | $ | 10.08 | $ | 10.38 | $ | 9.59 | ||||||||||
|
Total dividends paid
|
$ | 2,202,000 | $ | 2,202,000 | $ | 2,202,000 | $ | 2,134,000 | $ | 2,098,000 | ||||||||||
|
Average number of shares outstanding
|
4,234,459 | 4,234,321 | 4,234,321 | 4,266,397 | 4,376,494 | |||||||||||||||
|
Shares outstanding at year end
|
4,234,505 | 4,234,321 | 4,234,321 | 4,234,321 | 4,305,348 | |||||||||||||||
14
SUMMARY OF QUARTERLY RESULTS OF OPERATIONS
(Dollars in thousands, except per share data)
|
December 31,
|
September 30,
|
June 30,
|
March 31,
|
December 31,
|
September 30,
|
June 30,
|
March 31,
|
|||||||||||||||||||||||||
|
2010
|
2010
|
2010
|
2010
|
2009
|
2009
|
2009
|
2009
|
|||||||||||||||||||||||||
|
Interest income
|
$ | 5,389 | $ | 5,484 | $ | 5,572 | $ | 5,393 | $ | 5,482 | $ | 5,565 | $ | 5,407 | $ | 5,373 | ||||||||||||||||
|
Interest expense
|
(958 | ) | (1,110 | ) | (1,153 | ) | (1,144 | ) | (1,277 | ) | (1,438 | ) | (1,539 | ) | (1,593 | ) | ||||||||||||||||
|
Net interest income
|
4,431 | 4,374 | 4,419 | 4,249 | 4,205 | 4,127 | 3,868 | 3,780 | ||||||||||||||||||||||||
|
Provision for loan losses
|
(650 | ) | (650 | ) | (800 | ) | (200 | ) | (800 | ) | (350 | ) | — | (150 | ) | |||||||||||||||||
|
Non-interest income
|
844 | 673 | 654 | 786 | 993 | 890 | 854 | 891 | ||||||||||||||||||||||||
|
Non-interest expenses
|
(3,542 | ) | (3,540 | ) | (3,676 | ) | (3,961 | ) | (3,671 | ) | (3,570 | ) | (3,645 | ) | (3,655 | ) | ||||||||||||||||
|
Income before income taxes
|
1,083 | 857 | 597 | 874 | 727 | 1,097 | 1,077 | 866 | ||||||||||||||||||||||||
|
Income tax (expense) benefit
|
(142 | ) | (89 | ) | 32 | (83 | ) | (91 | ) | (281 | ) | (199 | ) | (112 | ) | |||||||||||||||||
|
Net income
|
$ | 941 | $ | 768 | $ | 629 | $ | 791 | $ | 636 | $ | 816 | $ | 878 | $ | 754 | ||||||||||||||||
|
Basic earnings per share
|
$ | 0.22 | $ | 0.18 | $ | 0.15 | $ | 0.19 | $ | 0.15 | $ | 0.19 | $ | 0.21 | $ | 0.18 | ||||||||||||||||
|
ITEM 7.
|
MANAGEMENT’S DISCUSSION AND ANALYSIS OF FINANCIAL CONDITION AND RESULTS OF OPERATIONS
|
The following is a discussion of the factors which significantly affected the consolidated results of operations and financial condition of Jeffersonville Bancorp (“Parent Company”) and its wholly-owned subsidiary, The First National Bank of Jeffersonville (“Bank”). For purposes of this discussion, references to the Company include both the Bank and the Parent Company, as the Bank is the Parent Company’s only subsidiary. This discussion should be read in conjunction with the consolidated financial statements and notes thereto, and the other financial information appearing elsewhere in this annual report.
This document contains forward-looking statements, which are based on assumptions and describe future plans, strategies and expectations of the Company. These forward-looking statements are generally identified by use of the words “believe,” “expect,” “intend,” “anticipate,” “estimate,” “project,” or similar words. The Company’s ability to predict results and the actual effect of future plans or strategies is uncertain. Factors which could have a material adverse effect on operations include, but are not limited to, changes in interest rates, general economic conditions, legislative/regulatory changes, monetary and fiscal policies of the U.S. Government, including policies of the U.S. Treasury and Federal Reserve Board, the quality or
composition of the loan or investment portfolios, demand for loan products, deposit flows, competition, demand for financial services in the Company’s market areas and accounting principles and guidelines. These risks and uncertainties should be considered in evaluating forward-looking statements. Actual results could differ materially from forward-looking statements.
GENERAL
The Parent Company is a bank holding company founded in 1982 and headquartered in Jeffersonville, New York. The Parent Company owns 100% of the outstanding shares of the Bank’s common stock and derives substantially all of its income from the Bank’s operations in the form of dividends paid to the Parent Company. The Bank is a national bank chartered in 1913 serving Sullivan County, New York with branch offices in Jeffersonville, Bloomingburg, Eldred, Liberty, Loch Sheldrake, Monticello (two), Livingston Manor, Narrowsburg, Callicoon, White Lake and Wurtsboro. The Bank’s administrative offices are located in Jeffersonville, New York.
The Company’s mission is to serve the community banking needs of its borrowers and depositors, who predominantly are individuals, small businesses and local municipal governments. The Company believes it understands its local customer needs and provides quality service with a personal touch.
The financial results of the Company are influenced by economic events that affect the communities we serve as well as national economic conditions, primarily interest rates trend, affecting the entire banking industry. Changes in net interest income and provisions for loan losses have the greatest impact on the Company’s profits. As high unemployment lingers and economic activity remains stagnant, loan delinquencies have increased. Real estate values in the nation, and particularly Sullivan County, remain depressed and a large segment of the Company’s assets are in real estate secured loans. As a result, provisions for loan losses increased by $1.0 million in 2010 as compared to 2009. This trend is not likely to reverse in the short term and similar results are expected in 2011. While long term
interest rates rose in the latter part of 2010, short term rates have remained at historic lows. This benefited the Company’s net interest margin as most of the Company’s liabilities are short term. This trend is likely to continue in 2011 as the Federal Reserve continues to indicate their intention to keep short term rates low for an extended period.
The Company has a long history of profitable operations and a strong capital base that have been the foundation of the Company since its inception. Management believes this trend will continue and the Company will be well positioned to take advantage of business opportunities when the current economic downturn reverses course.
15
CRITICAL ACCOUNTING POLICIES
Management of the Company considers the accounting policy relating to the allowance for loan losses to be a critical accounting policy given the inherent uncertainty in evaluating the levels of the allowance required to cover credit losses in the portfolio and the material effect that such judgments can have on the results of operations. The allowance for loan losses is maintained at a level deemed adequate by management based on an evaluation of such factors as economic conditions in the Company’s market area, past loan loss experience, the financial condition of individual borrowers, and underlying collateral values based on independent appraisals. While management uses available information to recognize losses on loans, future additions to the allowance for loan losses may be necessary based on changes
in economic conditions and values of real estate particularly in Sullivan County. Collateral underlying certain real estate loans could lose value which could lead to future additions to the allowance for loan losses. See Item 7 Management’s Discussion and Analysis/ Allowance for Loan Losses for further discussion. In addition, Federal regulatory agencies, as an integral part of their examination process, periodically review the Company’s allowance for loan losses and may require the Company to recognize additions to the allowance based on their judgments about information available to them at the time of their examination, which may not be currently available to management.
Foreclosed real estate consists of properties acquired through foreclosure or by acceptance of a deed in lieu of foreclosure. At the time of initial foreclosure, or when foreclosure occurs in-substance, these assets are recorded at fair value less estimated costs to sell and the excess, if any, of the loan over the fair market value of the assets received, less estimated selling costs, is charged to the allowance for loan and lease losses. Any subsequent valuation adjustments are charged or credited to other non-interest income. Operating costs associated with the properties are charged to expense as incurred. Gains on the sale of foreclosed real estate are included in income when title has passed and the sale has met all the requirements prescribed by GAAP.
Impaired securities are evaluated on at least a quarterly basis, and more frequently when market conditions warrant such an evaluation, to determine whether the impairment is other-than-temporary. To determine whether an impairment is other-than-temporary, management utilizes criteria such as the reasons underlying the impairment, the magnitude and duration of the impairment and the intent and ability of the Company to retain its investment in the security for a period of time sufficient to allow for an anticipated recovery in the fair value. The term “other-than-temporary” is not intended to indicate that the decline is permanent, but indicates that the prospects for a near-term recovery of value is not necessarily favorable, or that there is a lack of evidence to support a realizable value equal to
or greater than the carrying value of the security. In addition, the total impairment is separated into the amount of the impairment related to (a) credit loss and (b) the amount of the impairment related to all other factors, such as interest rate changes. The difference between the present value of the cash flows expected to be collected and the amortized cost basis of a security is considered to be the credit loss. Once an impairment is determined to be other-than-temporary, the impairment related to credit loss, if any, is charged to income and the amount of the impairment related to all other factors is recognized in other comprehensive income (loss).
The Company has evaluated subsequent events and transactions occurring through the date of issuance of the financial data included herein.
RECENT ACCOUNTING PRONOUNCEMENTS
For recent accounting pronouncements, turn to page 39.
FINANCIAL CONDITION
Total assets increased by $8.1 million or 1.9% to $430.8 million at December 31, 2010 from $422.7 million at December 31, 2009. The increase was primarily due to a $13.3 million or 14.6% increase in securities available for sale to $104.7 million at December 31, 2010 from $91.3 million at December 31, 2009, a $2.4 million or 0.9% increase in loans, net of allowance, from $275.4 million at December 31, 2009 to $277.8 million at December 31, 2010, and an increase in Bank owned life insurance of $971,000 to $15.6 million at December 31, 2010. Partially reducing these increases was a decrease of $5.8 million or 43.6% in cash and cash equivalents from $13.3 million at December 31, 2009 to $7.5 million at December 31, 2010, a decrease in held to maturity securities of $2.2 million or 26.7% to $6.0 million at December
31, 2010 from $8.2 million at December 31, 2009 and a decrease in other assets of $1.8 million primarily due to retirement plan amendments. Overnight borrowings were used to fund short term liquidity needs. Deposits decreased $1.3 million to $350.9 million or 0.4% at December 31, 2010. Time deposits decreased $19.9 million or 11.4% to $154.6 million at December 31, 2010 from $174.5 million at December 31, 2009. Demand deposits decreased $1.4 million or 2.2% to $62.9 million at December 31, 2010. Partially offsetting this, savings and insured money market accounts increased $19.0 million or 23.8% from $79.9 million at December 31, 2009 to $99.0 million at December 31, 2010. NOW and Super NOW deposits increased $1.0 million or 3.0% to $34.5 million at December 31, 2010. Non-deposit liabilities increased $6.6 million or 25.4% in 2010 from $25.8 million at December 31, 2009 to $32.4 million at December 31, 2010. The increase in non-deposit liabilities was primarily due to an overnight
borrowing from the Federal Home Loan Bank of New York of $9.1 million at December 31, 2010. Partially offsetting this increase was a $2.7 million decrease in other liabilities to $7.9 million at December 31, 2010 as a result of retirement plan amendments.
16
In 2010, total gross loans increased $2.7 million or 1.0% from $279.4 million at December 31, 2009 to $282.1 million at December 31, 2010. Within the loan portfolio, residential mortgages increased $4.6 million or 4.5% and commercial real estate increased by $1.0 million or 1.0%. Home equity, farmland and construction real estate loans decreased, in total, $2.7 million from prior year, and other loans for commercial and consumer purposes decreased $0.6 million or 1.6%. The growth in residential and commercial real estate loans reflects the Company’s strategy to conservatively grow the real estate portfolio. The overall loan portfolio is structured in accordance with management’s belief that loans secured by residential and commercial real estate generally result in lower loan loss levels compared to
other types of loans because of the value of the underlying collateral. The Company remains committed to maintaining loan credit quality and sacrificing growth in the loan portfolio, if necessary.
There was a $419,000 increase in foreclosed real estate at December 31, 2010 to $1.8 million, up from $1.4 million at December 31, 2009. The balance in both years consisted primarily of commercial property. This commercial property was under a lease agreement, with lease payments being recorded in income. Total nonperforming loans decreased $0.8 million from $13.3 million at December 31, 2009 to $12.5 million at December 31, 2010 primarily due to a decrease in nonperforming commercial mortgages. Net loan charge-offs increased from $482,000 in 2009 to $1,953,000 in 2010 due to increased write-offs as a result of lower property values. At December 31, 2010, the allowance for loan losses equaled $4.3 million representing 1.54% of total gross loans outstanding and 34.7% of total nonperforming loans.
Total stockholders’ equity was $47.5 million at December 31, 2010, an increase of $2.8 million over December 31, 2009 at $44.7 million. This increase was the result of $3.1 million of net income and a $1.9 million change in accumulated other comprehensive income (loss) from a loss of $1.5 million to income of $0.4 million partially offset by cash dividends of $2.2 million.
RESULTS OF OPERATIONS 2010 VERSUS 2009
Net Income
Net income for 2010 of $3.1 million increased 1.5% or $45,000 from 2009. Net interest income after provision for loan losses increased $493,000 or 3.4% to $15.2 million for the year ended December 31, 2010. This increase was comprised of a decrease in interest expense of $1.5 million or 25.3%, from $5.8 million for the year ended December 31, 2009 to $4.4 million for the same period ended December 31, 2010, partially offset by an increase in the provision for loan losses of $1.0 million to $2.3 million for the year ended December 31, 2010. A further discussion of the provision follows in the “Summary of Loan Loss Experience” below. Interest and dividend income increased $11,000 year over year. This was the net effect of an increase in interest earned on tax-exempt securities of $366,000 partially
offset by lower earnings on taxable securities in the amount of $287,000. The change in interest income was due to an increase in the amount of higher yielding tax-exempt securities and a decrease in the amount of taxable security holdings. The decrease in interest expense was primarily due to a decrease in interest expense on deposits of $0.8 million or 17.6% due to the lower interest rate environment and $0.7 million or 52.9% of interest expense on Federal Home Loan Bank borrowings due to reduced borrowing levels during 2010. Non-interest income decreased a decrease of $0.7 million or 18.5% from $3.6 million in 2009 to $3.0 million in 2010 due to a $446,000 decrease in net security gains and a $143,000 decrease in service charge income. Non-interest expense increased $178,000 primarily due to a $225,000 increase in other non-interest expense. See “Non-Interest Income and Non-Interest Expense” below for further
discussion.
Tax Equivalent Interest Income and Interest Expense
Throughout the following discussion, net interest income and its components are expressed on a tax equivalent basis which means that, where appropriate, tax exempt income is shown as if it were earned on a fully taxable basis.
The largest source of income for the Company is net interest income, which represents interest earned on loans, securities and short-term investments, less interest paid on deposits and other interest bearing liabilities. Tax equivalent net interest income of $18.7 million for 2010 represented an increase of 9.9% over 2009. Net interest margin increased 22 basis points to 4.73% in 2010 compared to 4.51% in 2009 due to reduced interest rates on interest bearing assets combined with a relatively fixed interest rate on long-term debt. The total of tax equivalent interest earning assets and interest bearing liabilities increased a net of $1.7 million as a result of a $0.2 million increase in total interest bearing assets and decrease in interest bearing liabilities of $1.5 million.
Total tax equivalent interest income for 2010 was $23.0 million, compared to $22.8 million in 2009 with the average yield on assets decreasing from 6.06% in 2009 to 5.83% in 2010. The net increase of $196,000 or 4.7% in 2010 is largely the result of a $551,000 increase in tax equivalent interest income on tax-exempt securities due primarily to an increase of $12.1 million in average balance of tax-exempt securities. This increase was partially offset by a $287,000 decrease in interest on taxable securities, as a result of a 54 basis point reduction in yield as higher-yielding securities were called or matured and replaced with lower-yielding securities, and a $58,000 decrease in interest on loans. Despite average loan balances increasing in all but the installment loan category for a net increase of $8.8 million
to $279.2 million from $270.4 million in 2009, combined yields decreased 23 basis points from 6.51% in 2009 to 6.28% in 2010. Loan growth in real estate, fixed rate home equity, and time and demand loans amounted to $6.9 million, $0.5 million and $2.1 million, respectively. The average loan yields on those loans decreased 24 basis points, 24 basis points and 0 basis points, respectively. New lower-yielding loans comprising a greater percentage of total loans resulted in the lower yields. As the variable rate on time and demand loans are tied to the Bank’s prime rate, which has remained constant, the yield on time and demand loans was 4.32% for both years.
17
Total interest expense in 2010 decreased $1.5 million to $4.4 million from $5.9 million in 2009 primarily as a result of a decrease in average rates paid on total interest bearing liabilities from 1.95% in 2009 to 1.37% in 2010. The average balance of interest bearing liabilities increased $19.0 million from $299.4 million in 2009 to $318.4 million in 2010, an increase of 6.3%. The increase was the result of a $34.6 million increase in average balance of interest bearing deposits, due to sales initiatives which caused customers to retain their funds in the relative safety of bank deposits, partially offset by a $15.6 million decrease in average federal funds purchased and long-term debt. Despite the increase in average interest bearing deposits, total interest expense decreased 58 basis points due to market
conditions and the lower-yielding environment. While average time deposits increased $13.8 million, interest paid on these deposits decreased $939,000 or 8.9% due to a 78 basis point reduction in interest rates paid from a yield of 2.63% in 2009 to 1.85% in 2010. Average savings and insured money market deposits increased $16.2 million or 20.3% to $96.0 million for 2010 with a 4 basis point or $124,000 increase in interest expense due to higher average balances despite lower interest rates. The yield on average fixed rate long-term debt decreased 11 basis points to 4.03% due to the maturities of $20.0 million in debt during 2009.
Non-Interest Income and Non-Interest Expense
Non-interest income primarily consists of service charges, commissions and fees for various banking services, earnings on bank-owned life insurance and security gains and losses. Total non-interest income of $2,957,000 in 2010 was a decrease of $671,000 over 2009. The bulk of this decrease was due to lower income generated from the sale of securities in the amount of $446,000, a decrease in service charge income of $143,000 and an $278,000 increase in foreclosed real estate expenses partially offset by $191,000 in gain on the sale of foreclosed real estate. As credit markets stabilized in 2010, fewer securities were sold for gains, resulting in lower profits from those transactions. Service charge income decreased $143,000 or 8.5% to $1,534,000 for the year ended December 31, 2010 as a result of lower overdraft
and service charge fees. Foreclosed real estate expense increased $278,000 to $341,000 for the year ended December 31, 2010 due to carrying costs associated with an increased level of foreclosed real estate.
Non-interest expense increased by $178,000 or 1.2% to $14.7 million for the year ended December 31, 2010. The increase in total non-interest expense was primarily the result of an $225,000 or 5.8% increase other non-interest expense to $4.1 million in 2010, partially offset by a $85,000 decrease in salaries and employee benefits, from $8.6 million to $8.5 million in 2010. Other non-interest expense increased due to the payment of $266,000 in real estate taxes on pre-foreclosed properties to secure the Bank’s interest, an increase of $66,000 in stationery and supplies partially offset by a decrease in FDIC assessment of $118,000 to $682,000 in 2010. Salaries and employee benefits decreased $85,000 primarily due a $245,000 reduction in profit
incentive payouts and a $208,000 decreased in benefits, primarily the result of the effect of retirement plan amendments, partially offset by an increase of $398,000 in salaries associated with the opening of two new branches and normal annual increases.
Income Tax Expense
Income tax expense totaled $0.3 million in 2010 versus $0.7 million in 2009. The effective tax rate approximated 8.3% in 2010 and 18.1% in 2009. The relatively low effective tax rates in 2010 and 2009 reflect the favorable tax treatment received on tax-exempt interest income and net earnings from bank-owned life insurance.
Provision for Loan Losses
The provision for loan losses was $2,300,000 in 2010 as compared to $1,300,000 in 2009 largely as a result of increased charge offs and higher non-accrual loan activity in 2010. Provisions for loan losses are recorded to maintain the allowance for loan losses at a level deemed adequate by management based on an evaluation of such factors as economic conditions in the Company’s market area, past loan loss experience, the financial condition of individual borrowers, and underlying collateral values based on independent appraisals. While management uses available information to recognize losses on loans, future additions to the allowance for loan losses may be necessary based on changes in economic conditions, particularly in Sullivan County. In addition, Federal regulatory agencies, as an integral part of
their examination process, periodically review the Company’s allowance for loan losses and may require the Company to recognize additions to the allowance based on their judgments about information available to them at the time of their examination, which may not be currently available to management. Based on management’s comprehensive analysis of the loan portfolio, management believes the current level of the allowance for loan losses is adequate.
Allowance for Loan Losses
The allowance for loan losses is a valuation allowance that management has determined to be necessary to absorb probable credit losses inherent in the loan portfolio. The allowance is established through provisions for losses charged to earnings. Loan losses are charged against the allowance when management believes the uncollectability of a loan balance is confirmed. Subsequent recoveries, if any, are credited to the allowance. Management evaluates the allowance quarterly using past loan loss experience to establish base allowance pool rates for commercial mortgages, commercial loans, residential loans, consumer
and other loans. Past loan loss experience is used to develop an eight quarter rolling trend analyses for special mention and substandard loans, including non-accrual loans, which are used as a base for determining base allowance rates. The method used in this calculation collects all commercial loans from one year ago, observes their status and rating at the current time, and computes the average loss for these rating categories by comparing the losses experienced by those particular loans to the loans in the different rating categories from one year ago. These allowance pool rates are then adjusted based on management’s current assessment of eight risk factors. These risk factors are:
18
|
|
1.
|
Changes in lending policies and procedures, including underwriting standards and collection, charge-off, and recovery practices.
|
|
|
2.
|
Changes in national, regional, and local economic and business conditions as well as the condition of various market segments, including the value of underlying collateral for collateral dependent loans.
|
|
|
3.
|
Changes in the nature and volume of the portfolio and terms of loans.
|
|
|
4.
|
Changes in the experience, ability, and depth of lending management and staff.
|
|
|
5.
|
Changes in volume and severity of past due, classified and nonaccrual loans as well as and other loan modifications.
|
|
|
6.
|
Changes in the quality of the Bank’s loan review system, and the degree of oversight by the Bank’s Board of Directors.
|
|
|
7.
|
The existence and effect of any concentrations of credit and changes in the level of such concentrations.
|
|
|
8.
|
The effect of external factors, such as competition and legal and regulatory requirements.
|
Each factor is assigned a value to reflect improving, stable or declining conditions based on management’s best judgment using relevant information available at the time of the evaluation. Adjustments to the factors are supported through documentation of changes in conditions in a narrative accompanying the allowance for loan loss calculation. Several specific factors are believed to have more impact on a loan’s risk rating, such as those related to national and local economic trends, lending management and staff, volume of past dues and nonaccruals, and concentrations of credit. Therefore, due to the increased risk inherent in criticized and classified loans, the values of these specific factors are increased proportionally. Management believes these increased factors provide adequate coverage for
the additional perceived risk. Doubtful loans by definition have inherent losses in which the precise amounts are dependent on likely future events. These particular loans are reserved at higher pool rates (25%) unless specifically reviewed and deemed impaired as described below.
Prior to applying the allowance pool rate, commercial mortgages and commercial loans in nonaccrual status or those with a minimum substandard rating and loan relationships of $500,000 or more are individually considered for impairment. A loan is impaired when, based on current information and events, it is probable that a creditor will be unable to collect all amounts due according to the contractual terms of the loan agreement. Loans that are considered individually for impairment and not determined to be impaired are returned to their original pools for allowance purposes. If a loan is determined to be impaired, it is evaluated under guidance which dictates that a creditor shall measure impairment based on either the present value of expected future
cash flows discounted at the loan's effective interest rate, the loan's observable market price, or the fair value of the collateral less estimated costs to sell if the loan is collateral dependent. If the measure of the impaired loan, such as the collateral value, is less than the recorded investment in the loan, a specific reserve is established in the allowance for loan losses. An uncollectible loan is charged off after all reasonable means of collection are exhausted and the recovery of the principal through the disposal of the collateral is not reasonably expected to cover the costs. Commercial mortgages and commercial loans with an original principal balance under $10,000 for unsecured loans or under $25,000 for secured loans are also not individually considered. Instead, the appropriate allowance pool rate is applied to the aggregate balance of these pools.
Residential, consumer and other loans are considered homogenous pools and are not individually considered for impairment. Instead, the appropriate allowance pool rate is applied to the aggregate balance of these pools.
The amount of the allowance is based on estimates and the ultimate losses may vary from such estimates as more information becomes available, or as later events occur or circumstances change. Allocations of the allowance may be made for specific loans, but the entire allowance is available for any loan that, in management’s judgment, should be charged off. Modifications to the methodology used in the allowance for loan losses evaluation may be necessary in the future based on economic and real estate market conditions, new information obtained regarding known problem loans, regulatory guidelines and examinations, the identification of additional problem loans, changes in general accepted accounting principles or other factors.
19
Summary of Loan Loss Experience
The following table indicates the amount of charge-offs and recoveries in the loan portfolio by category (dollars in thousands):
ANALYSIS OF THE CHANGES IN ALLOWANCE FOR LOAN LOSSES
|
2010
|
2009
|
2008
|
2007
|
2006
|
||||||||||||||||
|
Balance at beginning of year
|
$ | 3,988 | $ | 3,170 | $ | 3,352 | $ | 3,516 | $ | 3,615 | ||||||||||
|
Charge-offs:
|
||||||||||||||||||||
|
Commercial loans - financial and agriculture
|
(254 | ) | (301 | ) | (294 | ) | (106 | ) | (208 | ) | ||||||||||
|
Commercial mortgages
|
(1,458 | ) | — | — | — | — | ||||||||||||||
|
Residential mortgages(1)
|
(220 | ) | (95 | ) | (21 | ) | (5 | ) | (66 | ) | ||||||||||
|
Installment loans - consumer
|
(89 | ) | (150 | ) | (179 | ) | (118 | ) | (156 | ) | ||||||||||
|
Other loans
|
(88 | ) | (102 | ) | (153 | ) | (89 | ) | (103 | ) | ||||||||||
|
Total charge-offs
|
(2,109 | ) | (648 | ) | (647 | ) | (318 | ) | (533 | )) | ||||||||||
|
Recoveries:
|
||||||||||||||||||||
|
Commercial loans - financial and agriculture
|
51 | 25 | 80 | 388 | 187 | |||||||||||||||
|
Residential mortgages(1)
|
3 | 3 | 9 | 5 | — | |||||||||||||||
|
Installment loans - consumer
|
47 | 74 | 47 | 72 | 98 | |||||||||||||||
|
Other loans
|
55 | 64 | 64 | 59 | 59 | |||||||||||||||
|
Total recoveries
|
156 | 166 | 200 | 524 | 344 | |||||||||||||||
|
Net recoveries (charge-offs)
|
(1,953 | ) | (482 | ) | (447 | ) | 206 | (189 | ) | |||||||||||
|
Provision charged (credited) to operations
|
2,300 | 1,300 | 265 | (370 | ) | 90 | ||||||||||||||
|
Balance at end of year
|
$ | 4,335 | $ | 3,988 | $ | 3,170 | $ | 3,352 | $ | 3,516 | ||||||||||
|
Ratio of net (recoveries) charge-offs to average outstanding loans
|
0.70 | % | 0.18 | % | 0.17 | % | (0.08 | )% | 0.08 | % | ||||||||||
1 Includes home equity loans
The Company manages asset quality with a review process which includes ongoing financial analysis of credits and both internal and external loan review of existing outstanding loans and delinquencies. Management strives to identify potential nonperforming loans in a timely basis, take charge-offs promptly based on a realistic assessment of probable losses, and maintain an adequate allowance for loan losses based on the inherent risk of loss in the existing portfolio.
The provision for loan losses was $2,300,000 for the year ended December 31, 2010, up from $1,300,000 for 2009 due to increased charge-off levels which raised overall pool rates. The allowance for loan losses was $4.3 million at December 31, 2010, $4.0 million at 2009, and $3.2 million at 2008. Net loan charge-offs increased to $1,953,000 in 2010 from $482,000 in 2009 and gross charge-offs increased to $2,109,000 in 2010 from $648,000 in 2009. In 2010, $1,458,000 was charged off on commercial real estate mortgages due to lower property values in Sullivan County. There were no charge-offs or recoveries on commercial real estate mortgages for the years ended 2009 and 2008. The allowance as a percentage of total loans was 1.54% at December 31, 2010, compared to 1.43% and 1.18% at December 31, 2009 and 2008,
respectively. The allowance’s coverage of nonperforming loans was 34.7% at December 31, 2010 compared to 30.0% and 51.8% at December 31, 2009 and 2008, respectively. Total nonperforming loans decreased $817,000 million to $12.5 million at December 31, 2010 from $13.3 million at December 31, 2009. Despite the continuing high levels of nonperforming loans and the downturn in local economic conditions, the Bank is and has been committed to common sense lending practices, sacrificing loan quantity for quality. This policy is reflected in the Banks net charge-off (recovery) history in the above table. While nonperforming loans have increased, the Bank’s management believes that loans remain well collateralized. No portion of the allowance for loan losses is restricted to any loan or group of loans, as the entire allowance is available to absorb charge-offs in any loan category. The amount and timing of future charge-offs and allowance allocations may vary from current estimates
and will depend on local economic conditions. The following table shows the allocation of the allowance for loan losses to major portfolio categories and the percentage of each loan category to total loans outstanding.
Commercial nonperforming loans are evaluated individually for impairment. As of December 31, 2010, there were $10,216,000 in loans, compared to $11,421,000 as of December 31, 2009, which were considered to be impaired. A specific reserve of $831,000 has been established to help reduce the risk on these nonperforming loans in 2010 and $862,000 in 2009. On the remaining loan portfolios, the Company applies reserve factors considering historical loan loss data adjusted for current conditions.
20
DISTRIBUTION OF ALLOWANCE FOR LOAN LOSSES
(Dollars in thousands)
|
At December 31,
|
2010
|
2009
|
2008
|
2007
|
2006
|
|||||||||||||||
|
Amount of Allowance for Loan Losses:
|
||||||||||||||||||||
|
Commercial mortgages
|
$ | 2,160 | $ | 1,799 | $ | 1,327 | $ | 1,117 | $ | 1,108 | ||||||||||
|
Commercial loans – financial and agricultural
|
622 | 561 | 596 | 338 | 412 | |||||||||||||||
|
Residential mortgages(1)
|
1,213 | 1,249 | 895 | 1,483 | 1,425 | |||||||||||||||
|
Installment loans - consumer
|
106 | 132 | 113 | 151 | 207 | |||||||||||||||
|
Other loans
|
61 | 55 | 54 | 32 | 68 | |||||||||||||||
|
Unallocated
|
173 | 192 | 185 | 231 | 296 | |||||||||||||||
|
Total
|
$ | 4,335 | $ | 3,988 | $ | 3,170 | $ | 3,352 | $ | 3,516 | ||||||||||
|
Percent of Loans in Each Category to Total Loans:
|
||||||||||||||||||||
|
Commercial mortgages
|
37.2 | % | 37.3 | % | 36.0 | % | 34.9 | % | 34.6 | % | ||||||||||
|
Commercial loans – financial and agricultural
|
9.5 | 9.6 | 9.6 | 10.5 | 11.4 | |||||||||||||||
|
Residential mortgages (1)
|
50.5 | 50.2 | 51.5 | 51.0 | 50.1 | |||||||||||||||
|
Installment loans - consumer
|
2.3 | 2.4 | 2.5 | 3.2 | 3.9 | |||||||||||||||
|
Other loans
|
0.5 | 0.5 | 0.4 | 0.4 | 0.0 | |||||||||||||||
1 Includes home equity loans
Nonaccrual and Past Due Loans
The Company places a loan on nonaccrual status when collectability of principal or interest is doubtful, or when either principal or interest is 90 days or more past due and the loan is not well secured and in the process of collection. Interest payments received on nonaccrual loans are applied as a reduction of the principal balance when concern exists as to the ultimate collection of principal. A distribution of nonaccrual loans and loans 90 days or more past due and still accruing interest is shown in the following table (dollars in thousands).
|
At December 31,
|
2010
|
2009
|
2008
|
2007
|
2006
|
|||||||||||||||
|
Nonaccrual Loan Category:
|
||||||||||||||||||||
|
Commercial mortgages
|
$ | 9,150 | $ | 10,534 | $ | 3,667 | $ | 1,819 | $ | 1,520 | ||||||||||
|
Residential mortgages (1)
|
939 | 617 | 769 | 368 | 347 | |||||||||||||||
|
Commercial loans
|
1,310 | 886 | 998 | 1,574 | — | |||||||||||||||
|
Total nonaccrual loans
|
11,399 | 12,037 | 5,434 | 3,761 | 1,867 | |||||||||||||||
|
Loans 90 days or more, still accruing interest
|
1,091 | 1,270 | 686 | 883 | 13 | |||||||||||||||
|
Total nonperforming loans
|
$ | 12,490 | $ | 13,307 | $ | 6,120 | $ | 4,644 | $ | 1,880 | ||||||||||
|
Percent of Nonperforming Loans outstanding to
|
||||||||||||||||||||
|
Total Loans
|
4.4 | % | 4.8 | % | 2.3 | % | 1.8 | % | 0.8 | % | ||||||||||
1 Includes home equity loans
Total nonperforming commercial mortgages, residential mortgages and commercial loans represent 8.9%, 1.3% and 5.0% of their respective portfolios totals at December 31, 2010, compared to 10.5%, 1.1%, and 3.6% at December 31, 2009, respectively. The majority of the Company’s total nonaccrual and past due loans are secured loans and, as such, management anticipates there will be limited risk of loss in their ultimate resolution. Nonaccrual loans decreased $763,000 from $12.0 million at December 31, 2009 to $11.4 million at December 31, 2010. Except for specific reserves of $831,000 and $862,000 at 2010 and 2009 respectively, being allocated to certain impaired loans, the remaining loan balances are well collateralized with interest being recognized as received.
From time to time, loans may be renegotiated in a troubled debt restructuring when the Company determines that it will ultimately receive greater economic value under the new terms than through foreclosure, liquidation, or bankruptcy. Candidates for renegotiation must meet specific guidelines.
21
Loan Portfolio
Set forth below is selected information concerning the composition of our loan portfolio with dollar amounts and percentages as of the dates indicated (dollars in thousands).
LOAN PORTFOLIO COMPOSITION
|
At December 31,
|
2010
|
2009
|
2008
|
2007
|
2006
|
|||||||||||||||||||||||||||||||||||
|
Amount
|
Percent
|
Amount
|
Percent
|
Amount
|
Percent
|
Amount
|
Percent
|
Amount
|
Percent
|
|||||||||||||||||||||||||||||||
|
Real Estate Mortgage Loans
|
||||||||||||||||||||||||||||||||||||||||
|
Residential
|
$ | 108,397 | 38.4 | % | $ | 103,748 | 37.1 | % | $ | 103,876 | 38.9 | % | $ | 97,411 | 38.5 | % | $ | 95,520 | 38.1 | % | ||||||||||||||||||||
|
Commercial
|
100,427 | 35.6 | 99,056 | 35.5 | 92,678 | 34.6 | 84,383 | 33.4 | 82,987 | 33.1 | ||||||||||||||||||||||||||||||
|
Home equity
|
31,968 | 11.3 | 32,765 | 11.7 | 31,096 | 11.6 | 25,977 | 10.3 | 24,195 | 9.6 | ||||||||||||||||||||||||||||||
|
Farm land
|
4,551 | 1.6 | 4,926 | 1.8 | 3,879 | 1.4 | 3,883 | 1.5 | 3,726 | 1.5 | ||||||||||||||||||||||||||||||
|
Construction - residential
|
2,304 | 0.8 | 3,841 | 1.4 | 2,737 | 1.0 | 5,531 | 2.2 | 6,087 | 2.4 | ||||||||||||||||||||||||||||||
| 247,647 | 87.7 | 244,336 | 87.5 | 234,266 | 87.5 | 217,185 | 85.9 | 212,515 | 84.7 | |||||||||||||||||||||||||||||||
|
Other Loans
|
||||||||||||||||||||||||||||||||||||||||
|
Commercial loans
|
25,864 | 9.2 | 26,035 | 9.3 | 25,183 | 9.4 | 26,431 | 10.4 | 28,106 | 11.3 | ||||||||||||||||||||||||||||||
|
Consumer installment loans
|
6,375 | 2.3 | 6,752 | 2.4 | 6,642 | 2.5 | 8,054 | 3.2 | 9,773 | 3.9 | ||||||||||||||||||||||||||||||
|
Other loans
|
1,383 | 0.5 | 1,402 | 0.5 | 1,042 | 0.4 | 1,042 | 0.4 | 118 | 0.0 | ||||||||||||||||||||||||||||||
|
Agricultural loans
|
878 | 0.3 | 882 | 0.3 | 430 | 0.2 | 273 | 0.1 | 248 | 0.1 | ||||||||||||||||||||||||||||||
| 34,500 | 12.3 | 35,071 | 12.5 | 33,297 | 12.5 | 35,800 | 14.1 | 38,245 | 15.3 | |||||||||||||||||||||||||||||||
|
Total loans
|
282,147 | 100.0 | % | 279,407 | 100.0 | % | 267,563 | 100.0 | % | 252,985 | 100.0 | % | 250,760 | 100.0 | % | |||||||||||||||||||||||||
|
Allowance for loan losses
|
4,335 | (3,988 | ) | (3,170 | ) | (3,352 | ) | (3,516 | ) | |||||||||||||||||||||||||||||||
|
Total loans, net
|
$ | 277,812 | $ | 275,419 | $ | 264,393 | $ | 249,633 | $ | 247,244 | ||||||||||||||||||||||||||||||
Historical data restated to conform with current classification.
The following table indicates the amount of variable rate loans in portfolio categories according to their period to maturity (dollars in thousands). The table also indicates the dollar amount of these loans that have predetermined or fixed rates versus variable or adjustable rates.
MATURITIES AND SENSITIVITIES OF LOANS TO CHANGES IN INTEREST RATES
(In thousands)
|
One year
|
||||||||||||||||
|
One year
|
Through
|
After
|
||||||||||||||
|
At December 31, 2010
|
or less
|
five years
|
five years
|
Total
|
||||||||||||
|
Maturities of loans:
|
||||||||||||||||
|
Commercial and agricultural
|
$ | 14,572 | $ | 9,972 | $ | 2,198 | $ | 26,742 | ||||||||
|
Real estate construction
|
3,125 | — | — | 3,125 | ||||||||||||
|
Total
|
$ | 17,697 | $ | 9,972 | $ | 2,198 | $ | 29,867 | ||||||||
|
Interest sensitivity of loans:
|
||||||||||||||||
|
Predetermined rate
|
$ | 4,460 | $ | 9,310 | $ | 2,198 | $ | 15,968 | ||||||||
|
Variable rate
|
13,237 | 662 | — | 13,899 | ||||||||||||
|
Total
|
$ | 17,697 | $ | 9,972 | $ | 2,198 | $ | 29,867 | ||||||||
22
Investment Securities
The carrying amount and the fair value of the Company’s investment securities and their expected maturities are outlined in the following tables (in thousands):
INVESTMENT SECURITIES ANALYSIS
|
Summary of Investment Securities
|
||||||||||||||||||||||||
|
At December 31,*
|
2010 | 2009 | 2008 | |||||||||||||||||||||
|
Amortized
|
Fair
|
Amortized
|
Fair
|
Amortized
|
Fair
|
|||||||||||||||||||
|
cost
|
value
|
cost
|
value
|
cost
|
value
|
|||||||||||||||||||
|
Government sponsored enterprises
|
$ | 8,570 | $ | 8,587 | $ | 9,478 | $ | 9,471 | $ | 29,000 | $ | 29,128 | ||||||||||||
|
Obligations of state and political subdivisions
|
62,840 | 63,924 | 56,947 | 58,758 | 42,615 | 43,520 | ||||||||||||||||||
|
Mortgage backed securities and collateralized mortgage obligations
|
32,117 | 33,211 | 28,868 | 29,510 | 17,819 | 18,059 | ||||||||||||||||||
|
Corporate debt and certificates of deposit
|
4,616 | 4,665 | 1,502 | 1,548 | — | — | ||||||||||||||||||
|
Equity securities
|
541 | 542 | 549 | 611 | 794 | 896 | ||||||||||||||||||
|
|
$ | 108,684 | $ | 110,929 | $ | 97,344 | $ | 99,898 | $ | 90,228 | $ | 91,603 | ||||||||||||
|
*
|
The analysis shown combines the Company’s securities available for sale and held to maturity. All securities are included above at their amortized cost less impairment charges. An impairment charge of $5,162,000 was recognized for the year ended December 31, 2008. No impairment charge was recorded in 2009 or 2010.
|
The following table sets forth the maturity distribution, yield (calculated on the basis of the stated yields to maturity, considering applicable premium or discount) and amortized cost of investment securities available for sale and held to maturity (dollars in thousands):
ANALYSIS BY TYPE AND BY PERIOD TO MATURITY
|
December 31, 2010
|
Under 1 year
|
1-5 years
|
5-10 years
|
After 10 years
|
||||||||||||||||||||||||||||||||
|
Balance
|
Rate
|
Balance
|
Rate
|
Balance
|
Rate
|
Balance
|
Rate
|
Total
|
||||||||||||||||||||||||||||
|
Government sponsored enterprises
|
$ | 8,570 | 3.30 | % | $ | — | 0.00 | % | $ | — | 0.00 | % | $ | — | 0.00 | % | $ | 8,570 | ||||||||||||||||||
|
Obligations of state and political subdivisions – tax exempt(1)
|
10,524 | 3.67 | 32,592 | 3.69 | 19,280 | 3.63 | 444 | 6.00 | 62,840 | |||||||||||||||||||||||||||
|
Mortgage backed securities and collateralized mortgage obligations
|
10,972 | 3.63 | 15,523 | 4.11 | 2,395 | 4.64 | 3,227 | 4.77 | 32,117 | |||||||||||||||||||||||||||
|
Corporate debt and certificate of deposit
|
1,404 | 4.88 | 3,212 | 3.99 | — | 0.00 | — | 0.00 | 4,616 | |||||||||||||||||||||||||||
| $ | 31,470 | 3.39 | % | $ | 51,327 | 3.84 | % | $ | 21,675 | 3.74 | % | $ | 3,671 | 4.92 | % | $ | 108,143 | |||||||||||||||||||
1 Yields on tax exempt securities have not been stated on a tax equivalent basis.
RESULTS OF OPERATIONS 2009 VERSUS 2008
Net Income
Net income for 2009 of $3.1 million increased 14.1% or $382,000 from 2008’s net income of $2.7 million. The higher earnings level in 2009 reflects the interaction of a number of factors. The most significant factor which increased 2009 net income was an increase in other non-interest income of $3.8 million partially offset by an increase in income tax expense and non-interest expense of $1.5 million and $1.1 million, respectively. The increase in other non-interest income was due primarily to impairment charges of Federal Home Loan Mortgage Corporation (FHLMC or “Freddie Mac”) preferred stock in the amount of $5.1 million partially offset by $1.5 million in insurance proceeds from bank owned life insurance being recorded in 2008. The increase in income tax expense in 2009 was due to the loss
created by the FHLMC stock and related tax benefit recorded in 2008. In addition to the above, net interest income after provision for loan losses decreased $780,000 or 5.0% to $14.7 million for the year ended December 31, 2009. This decrease was comprised of a decrease in interest and dividend income of $1.2 million or 4.9%, from $23.0 million for the year ended December 31, 2008 to $21.8 million for the same period ended December 31, 2009, and an increase in the provision for loan losses of $1,035,000 to $1,300,000 for the year ended December 31, 2009. A further discussion of the provision follows in the “Summary of Loan Loss Experience” below. Partially offsetting these decreases was a decrease in interest expense of $1.4 million or 19.1% from $7.2 million to $5.8 million for the year ended December 31, 2009. The decrease in interest and dividend income was primarily the result of a $746,000 or 4.1% decrease in loan interest and fees due to lower interest rates despite
loan growth, and a net reduction of $362,000 or 7.9% in interest earned on securities. The decrease in interest expense was primarily due to a decrease in interest expense on deposits of $1.2 million or 20.6% due to the lower interest rate environment. Other interest expense decreased $120,000 due to reduced borrowing levels during 2009. Non-interest expense increased $1.1 million or 8.1% from $13.4 million in 2008 to $14.5 million in 2009 due to an $810,000 or 10.4% increase in salaries and employee benefits primarily due to retirement benefits and a $367,000 or 10.4% increase in other non-interest expense, which is discussed in more detail below.
23
Tax Equivalent Interest Income and Interest Expense
Throughout the following discussion, net interest income and its components are expressed on a tax equivalent basis which means that, where appropriate, tax exempt income is shown as if it were earned on a fully taxable basis.
The largest source of income for the Company is net interest income, which represents interest earned on loans, securities and short-term investments, less interest paid on deposits and other interest bearing liabilities. Tax equivalent net interest income of $17.0 million for 2009 represented an increase of 2.2% over 2008. Net interest margin decreased 8 basis points to 4.51% in 2009 compared to 4.59% in 2008 due to reduced interest rates on interest bearing assets combined with a relatively fixed interest rate on long-term debt. The total of tax equivalent interest earning assets and interest bearing liabilities increased a net of $0.4 million as a result of a decrease in interest bearing liabilities of $1.4 million partially offset by a $1.0 million decrease in total interest bearing assets.
Total tax equivalent interest income for 2009 was $22.8 million, compared to $23.8 million in 2008. The decrease of $1.0 million or 4.2% in 2009 is largely the result of a decrease of 53 basis points in the average yield on tax equivalent interest earning assets from 6.59% in 2008 to 6.06% in 2009. Despite average loans increasing in all categories for a total of $10.7 million to $270.4 million from $259.7 million in 2008, combined yields decreased 55 basis points from 7.06% in 2008 to 6.51% in 2009 due to new lower-yielding loans comprising a greater percentage of total loans. Loan growth in real estate, fixed rate home equity, and time and demand loans amounted to $5.3 million, $3.7 million and $0.6 million, respectively. The average loan yields on those loans decreased 41 basis points, 34 basis points and 170
basis points, respectively. Time and demand loans decreased more than the other categories due to the variable rate feature which is tied to the Bank’s prime rate. During 2009, total average tax equivalent securities and average short-term investments each increased $2.1 million with a decrease in yield of 35 basis points and 227 basis points, respectively. Yield on total tax equivalent average securities decreased as higher-yielding securities were called or matured and replaced with lower-yielding securities. The yield on average short-term investments, which are comprised primarily of federal funds sold, decreased from 2.62% to 0.35%.
Total interest expense in 2009 decreased $1.4 million to $5.8 million from $7.2 million in 2008 primarily as a result of a decrease in average rates paid on total interest bearing liabilities from 2.59% in 2008 to 1.95% in 2009. The average balance of interest bearing liabilities increased $20.7 million from $278.7 million in 2008 to $299.4 million in 2009, an increase of 7.4%. The increase was the result of a $28.9 million increase in average interest bearing deposits, due to sales initiatives and continuing market uncertainties, partially offset by an $8.1 million decrease in average federal funds purchased and long-term debt. Despite the increase in average interest bearing deposits, the yield decreased 71 basis points due to market conditions and the lower-yielding environment. While average time deposits
increased $28.7 million, interest paid on these deposits decreased $680,000 or 22.8% due to a 114 basis point reduction in interest rates paid to a yield of 2.63% in 2009. Average savings and insured money market deposits decreased $2.8 million or 3.3% to $79.8 million for 2009 with a 52 basis point or $438,000 decrease in interest expense due to lower interest rates. The yield on average federal funds purchased and other short-term debt decreased 120 basis points to 0.38% from 1.58%. The yield on average fixed rate long-term debt decreased 9 basis points to 4.14% due to the maturities of $20.0 million in debt.
Provision for Loan Losses
The allowance for loan losses is established through a provision for loan losses charged to expense. Loans are charged off against the allowance when management believes that the collectability of all or a portion of the principal is unlikely. Recoveries of loans previously charged off are credited to the allowance when realized. The provision for loan losses was $1,300,000 in 2009 as compared to $265,000 in 2008 largely as a result of increased non-accrual loan activity in 2009. Provisions for loan losses are recorded to maintain the allowance for loan losses at a level deemed adequate by management based on an evaluation of such factors as economic conditions in the Company’s market area, past loan loss experience, the financial condition of individual borrowers, and underlying collateral values based on
independent appraisals. While management used available information to recognize losses on loans, future additions to the allowance for loan losses may be necessary based on changes in economic conditions, particularly in Sullivan County. In addition, Federal regulatory agencies, as an integral part of their examination process, periodically review the Company’s allowance for loan losses and may require the Company to recognize additions to the allowance based on their judgments about information available to them at the time of their examination, which may not be currently available to management. Based on management’s comprehensive analysis of the loan portfolio, management believed the current level of the allowance for loan losses was adequate.
24
Total nonperforming loans increased $7.2 million to $13.3 million at December 31, 2009 from $6.1 million at December 31, 2008. Net loan charge-offs increased to $482,000 in 2009 from $447,000 in 2008 and gross charge-offs increased to $648,000 in 2009 from $647,000 in 2008.
Non-Interest Income and Non-Interest Expense
Non-interest income primarily consists of service charges, commissions and fees for various banking services, and security gains and losses. Total non-interest income of $3,628,000 in 2009 was an increase of $3,798,000 over 2008. The bulk of this increase was due to an impairment charge on FHLMC preferred stock during 2008 of $5.1 million, partially offset by an insurance benefit on a bank owned life insurance policy of $1.5 million received in 2008. Excluding the impairment charge and insurance benefit as discussed above, non-interest income increased primarily due to an increase in net gain on the sale of securities of $480,000, partially offset by an increase in foreclosed real estate loss of $101,000. Foreclosed real estate losses increased due to carrying costs associated with an increased level of
foreclosed real estate. Service charge income and other non-interest income, including merchant ATM and interchange fees decreased $97,000 or 5.5% and $89,000 or 7.9%, respectively.
Non-interest expense increased by $1.1 million or 8.1% to $14.5 million for the year ended December 31, 2009. The increase in total non-interest expense was primarily the result of an $810,000 or 10.4% increase in salaries and employee benefits, from $7.8 million to $8.6 million in 2009, and $367,000 or 10.4% in other non-interest expenses, from $3.5 million to $3.9 million in 2009. Salaries and employee benefits increased due to $533,000 in increased retirement benefits, a result of an increase in early retirements and the effect of plan assets declining in market value, and $206,000 in normal salary increases. Non-interest expense increased due to an increased FDIC assessment of $621,000 to $800,000 in 2009 partially offset by a reduction of $161,000 in professional and outside consulting fees, which was
primarily due to a deferment of requirements for smaller reporting companies to audit internal controls over financial reporting, and a $78,000 reduction in consulting services, a result of the termination of the previously disclosed formal agreement with the Bank’s regulators. Occupancy and equipment expenses decreased $85,000 or 4.0% to $2.0 million for 2009.
Income Tax Expense
Income tax expense (benefit) totaled $0.7 million in 2009 versus $(0.9) million in 2008. The effective tax rate approximated 18.1% in 2009 and (46.8)% in 2008. The relatively low effective tax rates in 2009 and 2008 reflect the favorable tax treatment received on tax-exempt interest income and net earnings from bank-owned life insurance. Additionally, the 2008 effective tax rate was favorably impacted by the $1.5 million tax-exempt insurance benefit.
OFF-BALANCE SHEET ARRANGEMENTS
In the normal course of operations, the Company engages in a variety of financial transactions that, in accordance with generally accepted accounting principles, are not recorded in the Consolidated Financial Statements, or are recorded in amounts that differ from the notional amounts. These transactions involve, to varying degrees, elements of credit, interest rate, and liquidity risk. Such transactions are used by us for general corporate purposes or for customer needs. Corporate purpose transactions are used to help manage credit, interest rate, and liquidity risk or to optimize capital. Customer transactions are used to manage customers’ requests for funding. See note 17 of Notes to Consolidated Financial Statements for further information concerning off-balance sheet arrangements.
LIQUIDITY
Liquidity is the ability to provide sufficient cash flow to meet financial commitments such as additional loan demand and withdrawals of existing deposits. The Company’s primary sources of liquidity are its deposit base; FHLB borrowings; repayments and maturities on loans; short-term assets, such as federal funds and short-term interest bearing deposits in banks; and maturities and sales of securities available for sale. These sources are available in amounts sufficient to provide liquidity to meet the Company’s ongoing funding requirements. The Bank’s membership in the FHLB of New York enhances liquidity in the form of overnight and 30-day lines of credit of approximately $40.5 million, which may be used to meet unforeseen liquidity demands. The Bank also has the ability to borrow at the
Federal Reserve Discount Window which had $4.0 million available in overnight primary credit at December 31, 2010 which is secured by securities held in trust. There were $9.1 million in overnight borrowings at December 31, 2010. The Bank has three separate FHLB term advances totaling $15.0 million at December 31, 2010. The Company also maintains $5.0 million unsecured lines of credit, each, with Atlantic Central Bankers Bank and First Tennessee Bank.
In 2010, cash generated from operating activities amounted to $6.5 million, and cash generated from financing activities was $5.8 million. These amounts were offset by cash used for investing activities in the amount of $18.1 million, resulting in a net decrease in cash and cash equivalents of $5.8 million. See the Consolidated Statements of Cash Flows for additional information.
25
The following table reflects the Maturities of Time Deposits of $100,000 or more and FHLB term advances (in thousands):
MATURITY SCHEDULE OF TIME DEPOSITS OF $100,000 OR MORE AND FHLB ADVANCES
|
At December 31, 2010
|
Deposits
|
FHLB Advances
|
||||||
|
Due three months or less
|
$ | 19,854 | $ | — | ||||
|
Over three months through six months
|
12,730 | — | ||||||
|
Over six months through twelve months
|
13,270 | — | ||||||
|
Over twelve months
|
18,656 | 15,000 | ||||||
|
Total
|
$ | 64,510 | $ | 15,000 | ||||
Management anticipates that most of these maturing deposits will be retained at maturity and that liquidity will be adequate to meet funding requirements.
CAPITAL ADEQUACY
One of management’s primary objectives is to maintain a strong capital position to merit the confidence of depositors, the investing public, bank regulators and stockholders. A strong capital position should help the Company withstand unforeseen adverse developments and take advantage of profitable investment opportunities when they arise. Stockholders’ equity increased $2.8 million or 6.3% in 2010 following an increase of 4.7% in 2009, primarily due to improved accumulated other comprehensive income and net income in 2010.
The Company retained $0.9 million from 2010 net income after the payment of dividends which decreased stockholders’ equity by $2.2 million. In addition, improved accumulated other comprehensive income (loss) increased stockholders’ equity by $1.9 million. In accordance with regulatory capital rules, the adjustment for the after tax net unrealized gain or loss on securities available for sale is not considered in the computation of regulatory capital ratios.
Under the Federal Reserve’s risk-based capital rules at December 31, 2010, the Bank’s Tier I risk-based capital was 15.7 % and total risk-based capital was 17.0% of risk-weighted assets. These risk-based capital ratios are well above the minimum regulatory requirements of 4.0% for Tier I capital and 8.0% for total risk-based capital. The Bank’s leverage ratio (Tier I capital to average assets) of 10.4% is well above the 4.0% minimum regulatory requirement.
The following table shows the Bank’s actual capital measurements compared to the minimum regulatory requirements (dollars in thousands).
|
As of December 31,
|
2010
|
2009
|
||||||
|
Tier I Capital
|
||||||||
|
Banks’ equity, excluding the after-tax net other comprehensive loss
|
$ | 44,786 | $ | 43,986 | ||||
|
Tier II Capital
|
||||||||
|
Allowance for loan losses (1)
|
$ | 3,570 | $ | 3,580 | ||||
|
Total risk-based capital
|
$ | 48,356 | $ | 47,566 | ||||
|
Risk-weighted assets (2)
|
$ | 284,821 | $ | 285,946 | ||||
|
Average assets
|
$ | 430,433 | $ | 418,393 | ||||
|
Ratios
|
||||||||
|
Tier I risk-based capital (minimum 4.0%)
|
15.7 | % | 15.4 | % | ||||
|
Total risk-based capital (minimum 8.0%)
|
17.0 | % | 16.6 | % | ||||
|
Leverage (minimum 4.0%)
|
10.4 | % | 10.5 | % | ||||
|
1
|
For Federal Reserve risk-based capital rule purposes, the allowance for loan losses includes allowance for credit losses on off-balance sheet letters of credit and is limited to 1.25% of risk-weighted assets
|
|
2
|
Risk-weighted assets have been reduced for the portion allowance of loan losses excluded from total risk-based capital.
|
26
CONTRACTUAL OBLIGATIONS
The Company is contractually obligated to make the following principal and interest payments on long-term debt and lease payments as of December 31, 2010 (in thousands):
|
Less than
|
1 to 3
|
3 to 5
|
More than
|
|||||||||||||||||
|
1 year
|
years
|
years
|
5 years
|
Total
|
||||||||||||||||
|
Federal Home Loan Bank borrowings
|
$ | 604 | $ | 15,664 | $ | — | $ | — | $ | 16,268 | ||||||||||
|
Building leases
|
141 | 261 | 190 | 854 | 1,445 | |||||||||||||||
|
Total
|
$ | 744 | $ | 15,925 | $ | 190 | $ | 854 | $ | 17,713 | ||||||||||
In regard to short-term borrowings, see note 8 of Notes to Consolidated Financial Statements.
27
DISTRIBUTION OF ASSETS, LIABILITIES & STOCKHOLDERS’ EQUITY:
INTEREST RATES & INTEREST DIFFERENTIAL
The following schedule presents the condensed average consolidated balance sheets for 2010, 2009, and 2008. The total dollar amount of interest income from earning assets and the resultant yields are calculated on a tax equivalent basis. The interest paid on interest-bearing liabilities, expressed in dollars and rates, are also presented with dollars in thousands.
|
For the Year Ended December 31,
|
2010 | 2009 | 2008 | |||||||||||||||||||||||||||||||||
|
Interest
|
Average
|
Interest
|
Average
|
Interest
|
Average
|
|||||||||||||||||||||||||||||||
|
Average
|
Earned
|
yield/
|
Average
|
Earned
|
yield/
|
Average
|
Earned
|
yield/
|
||||||||||||||||||||||||||||
|
balance
|
paid
|
rate
|
balance
|
paid
|
rate
|
balance
|
paid
|
rate
|
||||||||||||||||||||||||||||
|
ASSETS
|
||||||||||||||||||||||||||||||||||||
|
Securities available for sale and held to maturity: (1)
|
||||||||||||||||||||||||||||||||||||
|
Taxable securities
|
$ | 53,652 | $ | 1,974 | 3.68 | % | $ | 53,641 | $ | 2,261 | 4.22 | % | $ | 58,388 | $ | 2,844 | 4.87 | % | ||||||||||||||||||
|
Tax-exempt securities (2)
|
61,667 | 3,516 | 5.70 | 49,558 | 2,965 | 5.98 | 42,675 | 2,626 | 6.15 | |||||||||||||||||||||||||||
|
Total securities
|
115,319 | 5,490 | 4.76 | 103,199 | 5,226 | 5.06 | 101,063 | 5,470 | 5.41 | |||||||||||||||||||||||||||
|
Short-term investments
|
122 | 1 | 0.82 | 3,187 | 11 | 0.35 | 1,106 | 29 | 2.62 | |||||||||||||||||||||||||||
|
Loans
|
||||||||||||||||||||||||||||||||||||
|
Real estate mortgages
|
200,751 | 12,754 | 6.35 | 193,887 | 12,778 | 6.59 | 188,579 | 13,196 | 7.00 | |||||||||||||||||||||||||||
|
Home equity loans
|
32,386 | 1,876 | 5.79 | 31,922 | 1,926 | 6.03 | 28,244 | 1,799 | 6.37 | |||||||||||||||||||||||||||
|
Time and demand loans
|
27,579 | 1,192 | 4.32 | 25,455 | 1,100 | 4.32 | 24,849 | 1,495 | 6.02 | |||||||||||||||||||||||||||
|
Installment and other loans
|
18,458 | 1,712 | 9.28 | 19,097 | 1,788 | 9.36 | 18,041 | 1,848 | 10.24 | |||||||||||||||||||||||||||
|
Total loans (3)
|
279,174 | 17,534 | 6.28 | 270,361 | 17,592 | 6.51 | 259,713 | 18,338 | 7.06 | |||||||||||||||||||||||||||
|
Total interest earning assets
|
394,615 | 23,025 | 5.83 | 376,747 | 22,829 | 6.06 | 361,882 | 23,837 | 6.59 | |||||||||||||||||||||||||||
|
Other non-interest bearing assets
|
44,535 | 38,931 | 32,082 | |||||||||||||||||||||||||||||||||
|
Total assets
|
$ | 439,150 | $ | 415,678 | $ | 393,964 | ||||||||||||||||||||||||||||||
|
LIABILITIES AND STOCKHOLDERS’ EQUITY
|
||||||||||||||||||||||||||||||||||||
|
NOW and Super NOW deposits
|
$ | 38,376 | $ | 96 | 0.25 | % | $ | 33,719 | $ | 85 | 0.25 | % | $ | 30,731 | $ | 151 | 0.50 | % | ||||||||||||||||||
|
Savings and insured money
|
||||||||||||||||||||||||||||||||||||
|
market deposits
|
95,953 | 549 | 0.57 | 79,783 | 425 | 0.53 | 82,540 | 863 | 1.05 | |||||||||||||||||||||||||||
|
Time deposits
|
167,894 | 3,112 | 1.85 | 154,124 | 4,051 | 2.63 | 125,460 | 4,731 | 3.77 | |||||||||||||||||||||||||||
|
Total interest bearing
|
||||||||||||||||||||||||||||||||||||
|
deposits
|
302,223 | 3,757 | 1.24 | 267,626 | 4,561 | 1.70 | 238,731 | 5,745 | 2.41 | |||||||||||||||||||||||||||
|
Federal funds purchased and other
|
||||||||||||||||||||||||||||||||||||
|
short-term debt
|
1,154 | 4 | 0.35 | 799 | 3 | 0.38 | 7,778 | 123 | 1.58 | |||||||||||||||||||||||||||
|
Federal Home Loan Bank borrowings
|
15,000 | 604 | 4.03 | 30,986 | 1,283 | 4.14 | 32,156 | 1,360 | 4.23 | |||||||||||||||||||||||||||
|
Total interest bearing
|
||||||||||||||||||||||||||||||||||||
|
liabilities
|
318,377 | 4,365 | 1.37 | 299,411 | 5,847 | 1.95 | 278,665 | 7,228 | 2.59 | |||||||||||||||||||||||||||
|
Demand deposits
|
64,263 | 59,631 | 62,253 | |||||||||||||||||||||||||||||||||
|
Other non-interest bearing liabilities
|
9,905 | 12,881 | 9,117 | |||||||||||||||||||||||||||||||||
|
Total liabilities
|
392,545 | 371,923 | 350,035 | |||||||||||||||||||||||||||||||||
|
Stockholders’ equity
|
46,605 | 43,755 | 43,929 | |||||||||||||||||||||||||||||||||
|
Total liabilities and stockholders’
|
||||||||||||||||||||||||||||||||||||
|
equity
|
$ | 439,150 | $ | 415,678 | $ | 393,964 | ||||||||||||||||||||||||||||||
|
Net interest income – tax effected
|
18,660 | 16,982 | 16,609 | |||||||||||||||||||||||||||||||||
|
Less: Tax gross up on exempt securities
|
(1,187 | ) | (1,002 | ) | (884 | ) | ||||||||||||||||||||||||||||||
|
Net interest income per statements of income
|
$ | 17,473 | $ | 15,980 | $ | 15,725 | ||||||||||||||||||||||||||||||
|
Net interest spread
|
4.46 | % | 4.11 | % | 4.00 | % | ||||||||||||||||||||||||||||||
|
Net interest margin (4)
|
4.73 | % | 4.51 | % | 4.59 | % | ||||||||||||||||||||||||||||||
|
1
|
Yields on securities available for sale are based on amortized cost.
|
|
2
|
Tax exempt securities are affected using a 34% tax rate for fully tax exempt municipals and 24% for dividends.
|
|
3
|
For the purpose of this schedule, interest on nonaccruing loans has been included only to the extent reflected in the consolidated income statement. However, the nonaccrual loan balances are included in the average amount outstanding.
|
|
4
|
Computed by dividing tax effected net interest income by total interest earning assets.
|
28
VOLUME AND RATE ANALYSIS
The following schedule sets forth, for each major category of interest earning assets and interest bearing liabilities, the dollar amount of interest income (calculated on a tax equivalent basis) and interest expense, and changes therein for 2010 as compared to 2009, and 2009 as compared to 2008.
The increase and decrease in interest income and expense due to both rate and volume have been allocated to the two categories of variances (volume and rate) based on percentage relationships of such variance to each other, with dollars in thousands.
|
2010 compared to 2009
|
2009 compared to 2008
|
|||||||||||||||||||||||
|
increase (decrease)
|
increase (decrease)
|
|||||||||||||||||||||||
|
due to change in
|
due to change in
|
|||||||||||||||||||||||
|
Average
|
Average
|
Average
|
Average
|
|||||||||||||||||||||
|
Volume
|
Rate
|
Total
|
Volume
|
Rate
|
Total
|
|||||||||||||||||||
|
Interest Income
|
||||||||||||||||||||||||
|
Investment securities and
|
||||||||||||||||||||||||
|
securities available for sale (1)
|
$ | 614 | $ | (350 | ) | $ | 264 | $ | 116 | $ | (360 | ) | $ | (244 | ) | |||||||||
|
Short-term investments
|
(11 | ) | 1 | (10 | ) | 55 | (73 | ) | (18 | ) | ||||||||||||||
|
Loans
|
573 | (631 | ) | (58 | ) | 752 | (1,498 | ) | (746 | ) | ||||||||||||||
|
Total interest income
|
1,176 | (980 | ) | 196 | 923 | (1,931 | ) | (1,008 | ) | |||||||||||||||
|
Interest Expense
|
||||||||||||||||||||||||
|
NOW and Super NOW deposits
|
12 | (1 | ) | 11 | 15 | (81 | ) | (66 | ) | |||||||||||||||
|
Savings and insured money market deposits
|
86 | 38 | 124 | (29 | ) | (409 | ) | (438 | ) | |||||||||||||||
|
Time deposits
|
362 | (1,301 | ) | (939 | ) | 1,081 | (1,761 | ) | (680 | ) | ||||||||||||||
|
Federal funds purchased and other
|
||||||||||||||||||||||||
|
short-term debt
|
1 | — | 1 | (110 | ) | (10 | ) | (120 | ) | |||||||||||||||
|
Federal Home Loan Bank borrowings
|
(662 | ) | (17 | ) | (679 | ) | (49 | ) | (28 | ) | (77 | ) | ||||||||||||
|
Total interest expense
|
(201 | ) | (1,281 | ) | (1,482 | ) | 908 | (2,289 | ) | (1,381 | ) | |||||||||||||
|
Net interest income
|
$ | 1,377 | $ | 301 | $ | 1,678 | $ | 15 | $ | 358 | $ | 373 | ||||||||||||
|
1
|
Fully taxable-equivalent basis.
|
The Company’s operating results are affected by inflation to the extent that interest rates, loan demand and deposit levels adjust to inflation and impact net interest income. Management can best counter the effect of inflation over the long term by managing net interest income and controlling expenses.
|
ITEM 7A.
|
QUANTITATIVE AND QUALITATIVE DISCLOSURES ABOUT MARKET RISK
|
INTEREST RATE RISK
Measuring and managing interest rate risk is a dynamic process that the Bank’s management must continually perform to meet the objectives of maintaining stable net interest income and net interest margin. Therefore, prior to setting the term or interest rate on loans or deposits, or before purchasing investment securities or borrowing funds, management must understand the impact alternative interest rates will have on the Bank’s interest rate risk profile. This is accomplished through simulation modeling. Simulation modeling is the process of “shocking” the current balance sheet under a variety of interest rate scenarios and then measuring the impact of interest rate changes on both projected earning and the economic value of the Bank’s equity. The estimates underlying the
sensitivity analysis are based upon numerous assumptions including, but not limited to, the nature and timing of interest rate changes, prepayments on loan and securities, deposit decay rates, pricing decisions on loans and deposits, and reinvestment/replacement rates on asset and liability cash flows. While assumptions are developed based on available information and current economic and general market conditions, management cannot make any assurance as to the ultimate accuracy of these assumptions including competitive influences and customer behavior. Accordingly, actual results will differ from those predicted by simulation modeling.
29
The following table shows the projected changes in net interest income from an instantaneous shift in all market interest rates. The projected changes in net interest income are totals for the 12-month period beginning January 1, 2011 and ending December 31, 2011 under instantaneous rate shock scenarios.
INTEREST RATE SENSITIVITY TABLE
(Dollars in thousands)
|
Projected
|
||||||||||||||||||||
|
change in net
|
||||||||||||||||||||
|
Projected
|
interest income
|
|||||||||||||||||||
|
Projected
|
Projected dollar
|
Percentage
|
as a percent
|
|||||||||||||||||
|
Interest Rate
|
annualized net
|
change in net
|
change in net
|
of total stock-
|
||||||||||||||||
|
Shock (1)
|
Prime rate
|
interest income
|
interest income
|
interest income
|
holders’ equity
|
|||||||||||||||
|
3.00%
|
6.25 | % | $ | 17,397 | $ | (1,171 | ) | -6.3 | % | -14.7 | % | |||||||||
|
2.00%
|
5.25 | % | $ | 17,817 | $ | (751 | ) | -4.0 | % | -8.9 | % | |||||||||
|
1.00%
|
4.25 | % | $ | 18,240 | $ | (328 | ) | -1.8 | % | -2.7 | % | |||||||||
|
No change
|
3.25 | % | $ | 18,568 | — | — | — | |||||||||||||
|
-1.00%
|
2.25 | % | $ | 18,868 | $ | 300 | 1.6 | % | -8.4 | % | ||||||||||
|
-2.00%
|
1.25 | % | $ | 18,703 | $ | 135 | 0.7 | % | -16.4 | % | ||||||||||
|
-3.00%
|
0.25 | % | $ | 18,611 | $ | 43 | 0.2 | % | -21.3 | % | ||||||||||
|
1
|
Under an instantaneous interest rate shock, interest rates are modeled to change at once. This is a very conservative modeling technique that illustrates immediate rather than gradual increases or decreases in interest rates.
|
Many assumptions are embedded within our interest rate risk model. These assumptions are approved by the Asset and Liability Committee and are based upon both management’s experience and projections provided by investment securities companies. Assuming our prepayment and other assumptions are accurate and assuming we take reasonable actions to preserve net interest income, we project that net interest income would decline by $1,171,000 or -6.3% in a +3.00% instantaneous interest rate shock and increase by $43,000 or 0.2% in a -3.00% instantaneous interest rate shock. This is within our Asset and Liability Policy guideline which limits the maximum projected decrease in net interest income in a +3.00% or -3.00% instantaneous interest rate shock to +/-12% of the Company’s total net interest income.
Our strategy for managing interest rate risk is affected by general market conditions and customer demand. Generally we try to limit the volume and term of fixed-rate assets and fixed-rate liabilities, so that we can adjust them and pricing of assets and liabilities to mitigate net interest income volatility. The Bank purchases investments for the securities portfolio and borrows from the FHLB of NY to offset interest rate risk taken in the loan portfolio. The Bank also offers adjustable rate loan products that change as interest rates change. Approximately 35% of the Bank’s assets at December 31, 2010 were invested in adjustable rate loans.
|
ITEM 8.
|
FINANCIAL STATEMENTS AND SUPPLEMENTARY DATA
|
Management’s Statement of Responsibility.
Report of Independent Registered Public Accounting Firm
Consolidated Balance Sheets as of December 31, 2010 and December 31, 2009
Consolidated Statements of Income for the years ended December 31, 2010, December 31, 2009 and December 31, 2008
Consolidated Statements of Changes in Stockholders’ Equity for the years ended December 31, 2010, December 31, 2009 and December 31, 2008
Consolidated Statements of Cash Flows for the years ended December 31, 2010, December 31, 2009 and December 31, 2008
Notes to Consolidated Financial Statements
30
MANAGEMENT’S STATEMENT OF RESPONSIBILITY
The consolidated financial statements contained in this annual report on Form 10-K have been prepared in accordance with generally accepted accounting principles and, where appropriate, include amounts based upon management’s best estimates and judgments. Management is responsible for the integrity and the fair presentation of the consolidated financial statements and related information.
Management is responsible for designing, implementing, documenting and maintaining an adequate system of internal control over financial reporting. An adequate system of internal control over financial reporting encompasses the processes and procedures that have been established by management to maintain a system of internal controls to provide reasonable assurance that the Company’s assets are safeguarded against loss and that transactions are executed in accordance with management’s authorization and recorded properly to permit the preparation of consolidated financial statements in accordance with generally accepted accounting principles in the United States of America. These internal controls include the establishment and communication of policies and procedures, the selection and training of
qualified personnel and an internal auditing program that evaluates the adequacy and effectiveness of such internal controls, policies and procedures. Management recognizes that even a highly effective internal control system has inherent risks, including the possibility of human error and the circumvention or overriding of controls, and that the effectiveness of an internal control system can change with circumstances. However, management believes that the internal control system provides reasonable assurance that errors or irregularities that could be material to the consolidated financial statements are prevented or would be detected on a timely basis and corrected through the normal course of business.
Management is also responsible to perform an annual evaluation of the system of internal control over financial reporting, including an assessment of the effectiveness of the system. Management’s assessment is based on the criteria in Internal Control Integrated Framework issued by the Committee of Sponsoring Organizations of the Treadway Commission (COSO). The COSO framework identifies five defining characteristics of a system of internal control as follows: an appropriate control environment; an adequate risk assessment process; sufficient control activities; satisfactory communication of pertinent information; and proper monitoring controls.
Management performed an assessment of the effectiveness of its internal control over financial reporting in accordance with the COSO framework. As part of this process, consideration was given to the potential existence of deficiencies in either the design or operating effectiveness of controls. Based on this assessment, management believes the internal controls were in place and operating effectively as of December 31, 2010. Furthermore, during the conduct of management’s assessment, no material weaknesses were identified in the financial reporting control system.
The Board of Directors discharges its responsibility for the consolidated financial statements through its Audit Committee, which is comprised entirely of non-employee directors. The Audit Committee meets periodically with management, internal auditors and the independent registered public accounting firm. The internal auditor and the independent registered public accounting firm have direct full and free access to the Audit Committee and meet with it, with and without management being present, to discuss the scope and results of their audits and any recommendations regarding the system of internal controls.
/s/ Wayne V. Zanetti
Wayne V. Zanetti
President and Chief Executive Officer
/s/ John A. Russell
John A. Russell
Treasurer and Chief Financial Officer
31
REPORT OF INDEPENDENT REGISTERED PUBLIC ACCOUNTING FIRM
To the Board of Directors and
Stockholders of Jeffersonville Bancorp
We have audited the accompanying consolidated balance sheets of Jeffersonville Bancorp and Subsidiary as of December 31, 2010 and 2009, and the related consolidated statements of income, changes in stockholders’ equity, and cash flows for each of the years in the three-year period ended December 31, 2010. Jeffersonville Bancorp’s management is responsible for these consolidated financial statements. Our responsibility is to express an opinion on these consolidated financial statements based on our audits.
We conducted our audits in accordance with the standards of the Public Company Accounting Oversight Board (United States). Those standards require that we plan and perform the audit to obtain reasonable assurance about whether the financial statements are free of material misstatement. The Company is not required to have, nor were we engaged to perform, an audit of its internal control over financial reporting. Our audit included consideration of internal control over financial reporting as a basis for designing audit procedures that are appropriate in the circumstances, but not for the purpose of expressing an opinion on the effectiveness of the Company’s internal control over financial reporting. Accordingly, we express no such opinion. An audit also includes examining, on a test basis, evidence
supporting the amounts and disclosures in the financial statements, assessing the accounting principles used and significant estimates made by management, as well as evaluating the overall financial statement presentation. We believe that our audits provide a reasonable basis for our opinion.
In our opinion, the consolidated financial statements referred to above present fairly, in all material respects, the financial position of Jeffersonville Bancorp and Subsidiary as of December 31, 2010 and 2009, and the results of their operations and their cash flows for each of the years in the three-year period ended December 31, 2010 in conformity with accounting principles generally accepted in the United States of America.
/s/ ParenteBeard LLC
Harrisburg, Pennsylvania
March 24, 2011
32
Jeffersonville Bancorp and Subsidiary
Consolidated Balance Sheets
(In thousands, except share and per share data)
|
As of December 31,
|
2010
|
2009
|
||||||
|
ASSETS
|
||||||||
|
Cash and cash equivalents
|
$ | 7,518 | $ | 8,336 | ||||
|
Federal funds sold
|
— | 5,000 | ||||||
|
Total Cash and Cash Equivalents
|
7,518 | 13,336 | ||||||
|
Securities available for sale, at fair value
|
104,668 | 91,320 | ||||||
|
Securities held to maturity, estimated fair value of $6,261 at December 31, 2010 and $8,578 at December 31, 2009
|
6,021 | 8,218 | ||||||
|
Loans, net of allowance for loan losses of $4,335 at December 31, 2010 and $3,988 at December 31, 2009
|
277,812 | 275,419 | ||||||
|
Accrued interest receivable
|
2,034 | 1,954 | ||||||
|
Bank-owned life insurance
|
15,592 | 14,621 | ||||||
|
Foreclosed real estate
|
1,816 | 1,397 | ||||||
|
Premises and equipment, net
|
5,284 | 5,020 | ||||||
|
Restricted investments
|
2,806 | 2,341 | ||||||
|
Other assets
|
7,236 | 9,058 | ||||||
|
Total Assets
|
$ | 430,787 | $ | 422,684 | ||||
|
LIABILITIES AND STOCKHOLDERS’ EQUITY
|
||||||||
|
Liabilities
|
||||||||
|
Deposits:
|
||||||||
|
Demand deposits (non-interest bearing)
|
$ | 62,864 | $ | 64,266 | ||||
|
NOW and super NOW accounts
|
34,502 | 33,503 | ||||||
|
Savings and insured money market deposits
|
98,951 | 79,905 | ||||||
|
Time deposits
|
154,589 | 174,531 | ||||||
|
Total Deposits
|
350,906 | 352,205 | ||||||
|
Short-term debt
|
9,500 | 212 | ||||||
|
Federal Home Loan Bank long-term borrowings
|
15,000 | 15,000 | ||||||
|
Other liabilities
|
7,883 | 10,604 | ||||||
|
Total Liabilities
|
383,289 | 378,021 | ||||||
|
Commitments and contingent liabilities
|
||||||||
|
Stockholders’ equity
|
||||||||
|
Series A preferred stock, no par value; 2,000,000 shares authorized, none issued
|
— | — | ||||||
|
Common stock, $0.50 par value; 11,250,000 shares authorized, 4,767,786 shares issued with 4,234,505 and 4,234,321 outstanding at December 31, 2010 and 2009, respectively
|
2,384 | 2,384 | ||||||
|
Paid-in capital
|
6,483 | 6,483 | ||||||
|
Treasury stock, at cost; 533,281 shares and 533,465 shares at December 31, 2010 and 2009 respectively
|
(4,965 | ) | (4,967 | ) | ||||
|
Retained earnings
|
43,158 | 42,231 | ||||||
|
Accumulated other comprehensive income (loss)
|
438 | (1,468 | ) | |||||
|
Total Stockholders’ Equity
|
47,498 | 44,663 | ||||||
|
Total Liabilities and Stockholders’ Equity
|
$ | 430,787 | $ | 422,684 | ||||
See accompanying notes to consolidated financial statements.
33
Jeffersonville Bancorp and Subsidiary
Consolidated Statements of Income
(In thousands, except per share data)
|
For the Year Ended December 31,
|
2010
|
2009
|
2008
|
|||||||||
|
INTEREST AND DIVIDEND INCOME
|
||||||||||||
|
Loan interest and fees
|
$ | 17,534 | $ | 17,592 | $ | 18,338 | ||||||
|
Securities:
|
||||||||||||
|
Taxable
|
1,974 | 2,261 | 2,844 | |||||||||
|
Tax-exempt
|
2,329 | 1,963 | 1,742 | |||||||||
|
Federal funds sold
|
1 | 11 | 29 | |||||||||
|
Total Interest and Dividend Income
|
21,838 | 21,827 | 22,953 | |||||||||
|
INTEREST EXPENSE
|
||||||||||||
|
Deposits
|
3,757 | 4,561 | 5,745 | |||||||||
|
Federal Home Loan Bank borrowings
|
604 | 1,283 | 1,360 | |||||||||
|
Other
|
4 | 3 | 123 | |||||||||
|
Total Interest Expense
|
4,365 | 5,847 | 7,228 | |||||||||
|
Net interest income
|
17,473 | 15,980 | 15,725 | |||||||||
|
Provision for loan losses
|
2,300 | 1,300 | 265 | |||||||||
|
Net Interest Income After Provision for Loan Losses
|
15,173 | 14,680 | 15,460 | |||||||||
|
NON-INTEREST INCOME
|
||||||||||||
|
Service charges
|
1,534 | 1,677 | 1,774 | |||||||||
|
Fee income
|
888 | 869 | 908 | |||||||||
|
Earnings on bank-owned life insurance
|
470 | 494 | 529 | |||||||||
|
Net gain loss on sale of securities
|
98 | 544 | 64 | |||||||||
|
Impairment charge on securities
|
— | — | (5,162 | ) | ||||||||
|
Net gain (loss) on revaluation and sale of foreclosed real estate
|
135 | (56 | ) | (11 | ) | |||||||
|
Foreclosed real estate expense
|
(341 | ) | (63 | ) | (7 | ) | ||||||
|
Life insurance benefit
|
— | — | 1,522 | |||||||||
|
Other non-interest income
|
173 | 163 | 213 | |||||||||
|
Total Non-Interest Income (Loss)
|
2,957 | 3,628 | (170 | ) | ||||||||
|
NON-INTEREST EXPENSES
|
||||||||||||
|
Salaries and employee benefits
|
8,526 | 8,611 | 7,801 | |||||||||
|
Occupancy and equipment expenses
|
2,072 | 2,034 | 2,119 | |||||||||
|
Other non-interest expenses
|
4,121 | 3,896 | 3,529 | |||||||||
|
Total Non-Interest Expenses
|
14,719 | 14,541 | 13,449 | |||||||||
|
Income before income tax expense
|
3,411 | 3,767 | 1,841 | |||||||||
|
Income tax expense (benefit)
|
282 | 683 | (861 | ) | ||||||||
|
Net Income
|
$ | 3,129 | $ | 3,084 | $ | 2,702 | ||||||
|
Basic earnings per common share
|
$ | 0.74 | $ | 0.73 | $ | 0.64 | ||||||
|
Average common shares outstanding
|
4,235 | 4,234 | 4,234 | |||||||||
|
Cash dividends declared per share
|
$ | 0.52 | $ | 0.52 | $ | 0.52 | ||||||
See accompanying notes to consolidated financial statements.
34
Jeffersonville Bancorp and Subsidiary
Consolidated Statements of Changes in Stockholders’ Equity
(In thousands, except per share data)
|
Accumulated
|
Common
|
|||||||||||||||||||||||||||
|
other
|
shares
|
|||||||||||||||||||||||||||
|
compre-
|
Total
|
issued
|
||||||||||||||||||||||||||
|
For the years ended
|
Common
|
Paid-in
|
Treasury
|
Retained
|
hensive
|
stockholders’
|
and
|
|||||||||||||||||||||
|
December 31, 2010, 2009 and 2008
|
stock
|
capital
|
stock
|
earnings
|
income (loss)
|
equity
|
outstanding
|
|||||||||||||||||||||
|
Balance at January 1, 2008
|
$ | 2,384 | $ | 6,483 | $ | (4,967 | ) | $ | 41,104 | $ | (1,046 | ) | $ | 43,958 | 4,234 | |||||||||||||
|
Net income
|
— | — | — | 2,702 | — | 2,702 | ||||||||||||||||||||||
|
Other comprehensive loss
|
— | — | — | — | (1,541 | ) | (1,541 | ) | ||||||||||||||||||||
|
Comprehensive income
|
— | — | — | — | — | 1,161 | ||||||||||||||||||||||
|
Adjustment to initially apply ASC 715-60 on Split Dollar Life Insurance
|
— | — | — | (255 | ) | — | (255 | ) | ||||||||||||||||||||
|
Cash dividends ($0.52 per share)
|
— | — | — | (2,202 | ) | — | (2,202 | ) | ||||||||||||||||||||
|
Balance at December 31, 2008
|
2,384 | 6,483 | (4,967 | ) | 41,349 | (2,587 | ) | 42,662 | 4,234 | |||||||||||||||||||
|
Net income
|
— | — | — | 3,084 | — | 3,084 | ||||||||||||||||||||||
|
Other comprehensive income
|
— | — | — | — | 1,119 | 1,119 | ||||||||||||||||||||||
|
Comprehensive income
|
— | — | — | — | — | 4,203 | ||||||||||||||||||||||
|
Cash dividends ($0.52 per share)
|
— | — | — | (2,202 | ) | — | (2,202 | ) | ||||||||||||||||||||
|
Balance at December 31, 2009
|
2,384 | 6,483 | (4,967 | ) | 42,231 | (1,468 | ) | 44,663 | 4,234 | |||||||||||||||||||
|
Net income
|
— | — | — | 3,129 | — | 3,129 | ||||||||||||||||||||||
|
Other comprehensive income
|
— | — | — | — | 1,906 | 1,906 | ||||||||||||||||||||||
|
Comprehensive income
|
— | — | — | — | — | 5,035 | ||||||||||||||||||||||
|
Treasury stock issued
|
— | — | 2 | — | — | 2 | 1 | |||||||||||||||||||||
|
Cash dividends ($0.52 per share)
|
— | — | — | (2,202 | ) | — | (2,202 | ) | ||||||||||||||||||||
|
Balance at December 31, 2010
|
$ | 2,384 | $ | 6,483 | $ | (4,965 | ) | $ | 43,158 | $ | 438 | $ | 47,498 | 4,235 | ||||||||||||||
See accompanying notes to consolidated financial statements.
35
Consolidated Statements of Cash Flows
(In thousands)
|
For the Year Ended December 31,
|
2010
|
2009
|
2008
|
|||||||||
|
OPERATING ACTIVITIES:
|
||||||||||||
|
Net income
|
$ | 3,129 | $ | 3,084 | $ | 2,702 | ||||||
|
Adjustments to reconcile net income to net cash provided by operating activities:
|
||||||||||||
|
Provision for loan losses
|
2,300 | 1,300 | 265 | |||||||||
|
Depreciation and amortization
|
712 | 627 | 655 | |||||||||
|
Net gain on sale of fixed assets
|
21 | 8 | — | |||||||||
|
Net (gain) loss on revaluation and sale of foreclosed real estate
|
(135 | ) | 56 | 11 | ||||||||
|
Earnings on bank-owned life insurance
|
(470 | ) | (494 | ) | (529 | ) | ||||||
|
Life insurance benefit
|
— | — | (1,522 | ) | ||||||||
|
Net security gains
|
(98 | ) | (544 | ) | (64 | ) | ||||||
|
Impairment charge on securities
|
— | — | 5,162 | |||||||||
|
Deferred income tax (benefit)
|
(337 | ) | 1,417 | (2,053 | ) | |||||||
|
(Increase) decrease in accrued interest receivable
|
(80 | ) | (96 | ) | 261 | |||||||
|
(Increase) decrease in other assets
|
830 | (2,578 | ) | (257 | ) | |||||||
|
Increase (decrease) in other liabilities
|
626 | (2,042 | ) | 1,529 | ||||||||
|
Net Cash Provided by Operating Activities
|
6,498 | 738 | 6,160 | |||||||||
|
INVESTING ACTIVITIES:
|
||||||||||||
|
Proceeds from maturities and calls:
|
||||||||||||
|
Securities available for sale
|
46,166 | 39,071 | 18,859 | |||||||||
|
Securities held to maturity
|
4,954 | 2,730 | 6,475 | |||||||||
|
Proceeds from sales of securities available for sale
|
2,324 | 17,724 | 4,145 | |||||||||
|
Purchases:
|
||||||||||||
|
Securities available for sale
|
(61,929 | ) | (60,913 | ) | (21,259 | ) | ||||||
|
Securities held to maturity
|
(2,757 | ) | (5,184 | ) | (5,920 | ) | ||||||
|
Disbursement for loan originations, net of principal collections
|
(6,603 | ) | (12,665 | ) | (16,279 | ) | ||||||
|
Purchase of bank owned life insurance
|
(500 | ) | — | — | ||||||||
|
Proceeds from cash surrender value of bank owned life insurance
|
— | — | 2,055 | |||||||||
|
Purchase of Federal Home Loan Bank stock
|
(1,657 | ) | (1,023 | ) | (3,821 | ) | ||||||
|
Sale of Federal Home Loan Bank stock
|
1,211 | 2,117 | 3,384 | |||||||||
|
Net purchases of premises and equipment
|
(997 | ) | (1,343 | ) | (569 | ) | ||||||
|
Proceeds from sales of foreclosed real estate
|
1,685 | 164 | — | |||||||||
|
Net Cash Used in Investing Activities
|
(18,103 | ) | (19,322 | ) | (12,930 | ) | ||||||
|
FINANCING ACTIVITIES:
|
||||||||||||
|
Net increase (decrease) in deposits
|
(1,299 | ) | 55,481 | (2,518 | ) | |||||||
|
Proceeds from Federal Home Loan Bank borrowings
|
— | — | 15,000 | |||||||||
|
Repayments of Federal Home Loan Bank borrowings
|
— | (20,000 | ) | (10,000 | ) | |||||||
|
Net increase (decrease) in short-term borrowings
|
9,288 | (10,312 | ) | 5,015 | ||||||||
|
Cash dividends paid
|
(2,202 | ) | (2,202 | ) | (2,202 | ) | ||||||
|
Net Cash Provided by Financing Activities
|
5,787 | 22,967 | 5,295 | |||||||||
|
Net Increase (Decrease) in Cash and Cash Equivalents
|
(5,818 | ) | 4,383 | (1,475 | ) | |||||||
|
Cash and Cash Equivalents at Beginning of Year
|
13,336 | 8,953 | 10,428 | |||||||||
|
Cash and Cash Equivalents at End of Year
|
$ | 7,518 | $ | 13,336 | $ | 8,953 | ||||||
|
SUPPLEMENTAL INFORMATION:
|
||||||||||||
|
Cash paid for:
|
||||||||||||
|
Interest
|
$ | 4,470 | $ | 6,022 | $ | 7,223 | ||||||
|
Income taxes
|
101 | 221 | 875 | |||||||||
|
Transfer of loans to foreclosed real estate
|
1,910 | 339 | 1,254 | |||||||||
See accompanying notes to consolidated financial statements.
36
Jeffersonville Bancorp and Subsidiary
Notes to Consolidated Financial Statements
December 31, 2010, 2009, and 2008
|
(1)
|
Summary of Significant Accounting Policies
|
Basis of Presentation
The consolidated financial statements of Jeffersonville Bancorp (the Parent Company) include its wholly owned subsidiary, The First National Bank of Jeffersonville (the Bank). Collectively, Jeffersonville Bancorp and its subsidiary are referred to herein as the “Company” with all significant intercompany transactions having been eliminated.
The Parent Company is a bank holding company whose principal activity is the ownership of all outstanding shares of the Bank’s stock. The Bank is a commercial bank providing community banking services to individuals, small businesses and local municipal governments primarily in Sullivan County, New York. Management makes operating decisions and assesses performance based on an ongoing review of the Bank’s community banking operations, which constitute the Company’s only operating segment for financial reporting purposes.
The consolidated financial statements have been prepared, in all material respects, in conformity with accounting principles generally accepted in the United States of America. In preparing the consolidated financial statements, management is required to make estimates and assumptions that affect the reported amounts of assets, liabilities, revenues and expenses. Material estimates that are particularly susceptible to near-term change include the allowance for loan losses, the evaluation of other than temporary impairment of investment securities and the assets, liabilities and expenses associated with benefit plans which are described below. Actual results could differ from these estimates.
For purposes of the consolidated statements of cash flows, the Company considers cash, due from banks and federal funds sold, if any, to be cash equivalents.
Reclassifications have been made to prior years’ consolidated financial statements whenever necessary to conform to the current year’s presentation.
The Company has evaluated subsequent events and transactions occurring through the date of issuance of the financial data included herein.
Investment Securities
Management determines the appropriate classification of securities at the time of purchase. If management has the positive intent and ability to hold debt securities to maturity, they are classified as securities held to maturity and are stated at amortized cost. All other debt and marketable equity securities are classified as securities available for sale and are reported at fair value. Net unrealized gains or losses on securities available for sale are reported (net of income taxes) in stockholders’ equity as accumulated other comprehensive income (loss). Restricted investments, which are nonmarketable equity securities, are carried at cost.
Gains and losses on sales of securities are based on the net proceeds and the amortized cost of the securities sold, using the specific identification method. The amortization of premium and accretion of discount on debt securities is calculated using the level-yield interest method to the earlier of the call date or maturity date.
A security is considered impaired when its amortized cost basis exceeds its fair value at the balance sheet date. All securities are evaluated on at least a quarterly basis, and more frequently when market conditions warrant such an evaluation, to determine whether the impairment is other-than-temporary. To determine whether an impairment is other-than-temporary, management utilizes criteria such as the reasons underlying the impairment, and the magnitude and duration of the impairment. During 2009, the Company adopted new accounting guidance related to recognition and presentation of other-than-temporary impairment. This accounting guidance amended the recognition guidance for other-than-temporary impairment of debt securities and expanded
the financial statement disclosures for other-than-temporary impairment losses on debt and equity securities. This replaced the “intent and ability” requirement of the previous guidance, by specifying that (a) if an entity does not have the intent to sell a debt security prior to recovery and (b) it is more likely than not that it will not have to sell the debt security prior to recovery, the security would not be considered other-than-temporarily impaired unless there is a credit loss. The term “other-than-temporary” is not intended to indicate that the decline is permanent, but indicates that the prospects for a near-term recovery of value are not necessarily favorable, or that there is a lack of evidence to support a realizable value equal to or greater than the carrying value of the security. In addition, the total impairment for debt securities is separated into the amount of the impairment related
to (a) credit loss and (b) the amount of the impairment related to all other factors, such as interest rate changes. The amount of credit loss, if any, is calculated as the difference between the present value of the cash flows expected to be collected and the amortized cost basis of a security. Once an impairment is determined to be other-than-temporary, the impairment related to credit loss, if any, is charged to income and the amount of the impairment related to all other factors is recognized in other comprehensive income (loss). An impairment charge on Federal Home Loan Mortgage Corporation (FHLMC or “Freddie Mac”) preferred stock of $5,162,000 was recognized during the year ended December 31, 2008. No impairment charge was recognized during the years ended December 31, 2010 or 2009. For further discussion see Note 3.
37
Loans
Loans are stated at unpaid principal balances, less unearned discounts, deferred loan fees and costs and the allowance for loan losses. Unearned discounts on certain installment loans and deferred loan fees and costs are accreted into income using a level-yield interest method. Interest income is recognized on the accrual basis of accounting. When, in the opinion of management, the collection of interest or principal is in doubt, the loan is classified as nonaccrual. Except for residential mortgages that are well secured (loan to value 60% or less) and in the process of collection, loans past due more than 90 days are classified as nonaccrual. Thereafter, no interest is recognized as income until it is received in cash, and the loan’s collateral is adequate to support both the interest recognized and
the loan balance, or until the borrower demonstrates the ability to make scheduled payments of interest and principal, and the loan has remained current for a period of at least six months. For further discussion see Note 5.
Allowance for Loan Losses
The allowance for loan losses is established through a provision for loan losses charged to expense. Loans are charged off against the allowance when management believes that the collectability of all or a portion of the principal is unlikely. Recoveries of loans previously charged off are credited to the allowance when realized.
A loan is considered to be impaired when, based on current information and events, it is probable that the creditor will be unable to collect all principal and interest contractually due. Impaired loan disclosures and classification apply to loans that are individually evaluated for collectability in accordance with the Company’s ongoing loan review procedures, principally commercial mortgage loans and commercial loans. Smaller balance, homogeneous loans, which are collectively evaluated, such as consumer and smaller balance residential mortgage loans, are specifically excluded from the classification of impaired loans. Impaired loans are measured based on (i) the present value of expected future cash flows discounted at the loan’s effective interest rate, (ii) the loan’s
observable market price or (iii) the fair value of the collateral if the loan is collateral dependent. If the approach used results in a measurement that is less than an impaired loan’s recorded investment, an impairment loss is recognized as part of the allowance for loan losses.
The allowance for loan losses is maintained at a level deemed adequate by management based on an evaluation of such factors as economic conditions in the Company’s market area, past loan loss experience, the financial condition of individual borrowers, and underlying collateral values based on independent appraisals. While management uses available information to recognize losses on loans, future additions to the allowance for loan losses may be necessary based on changes in economic conditions, particularly in Sullivan County. In addition, Federal regulatory agencies, as an integral part of their examination process, periodically review the Company’s allowance for loan losses and may require the Company to recognize additions to the allowance based on their judgments about information available
to them at the time of their examination, which may not be currently available to management. For further discussion see Note 5.
Bank-Owned Life Insurance
The investment in bank-owned life insurance, which covers certain officers of the Bank, is carried at the policies’ cash surrender value. Additional investments are initially recorded at cost. Increases in the cash surrender value of bank-owned life insurance, net of premiums paid, are included in non-interest income. Liabilities and related compensation costs for employees that are not limited to the employee’s active service period are recognized according to ASC Topic 715 Compensation-Retirement Benefits (ASC 715).
The Company follows accounting guidance for deferred compensation and postretirement aspects of endorsement and split dollar life insurance arrangements. This guidance applies to life insurance arrangements that provide an employee with a specified benefit that is not limited to the employee’s active service period, including certain bank-owned life insurance policies and requires an employer to recognize a liability and related compensation costs for future benefits that extend to postretirement periods. The impact of its adoption resulted in a $255,000 cumulative effect adjustment to opening retained earnings in 2008. The adoption will have a minimal impact on current and future earnings, with a $9,000 and $46,000 effect on earnings for the years ended December 31, 2010 and 2009, respectively.
38
Foreclosed Real Estate
Foreclosed real estate consists of properties acquired through foreclosure and is stated on an individual-asset basis at the lower of (i) fair value less estimated costs to sell or (ii) cost which represents the fair value at initial foreclosure. When a property is acquired, any excess of the loan balance over the fair value of the property is charged to the allowance for loan losses. If necessary, subsequent write downs to reflect further declines in fair value are included in non-interest income. Fair value estimates are based on independent appraisals and other available information. While management estimates losses on foreclosed real estate using the best available information, such as independent appraisals, future write downs may be necessary based on
changes in real estate market conditions, particularly in Sullivan County, and the results of regulatory examinations. Operating costs associated with the properties are charged to expense as incurred and any rental income received from these properties is recognized as foreclosed real estate income in the period collected.
Premises and Equipment
Premises and equipment are stated at cost, less accumulated depreciation and amortization. Depreciation and amortization are provided over the estimated useful lives of the assets using straight-line or accelerated methods. Leasehold improvements are amortized over the shorter of their estimated useful lives or their respective lease terms. For further discussion see Note 6.
Restricted Investments
Included in restricted investments are nonmarketable trust preferred stock and equity securities carried at cost. As a member institution of the Federal Home Loan Bank of New York (FHLB), Federal Reserve Bank and other institutions, the Bank is required to hold a certain amount of these equity stocks. For further discussion see Note 4.
Advertising Costs
Advertising costs are expensed as incurred and are included in other expenses.
Income Taxes
Deferred tax assets and liabilities are recognized for the future tax consequences attributable to temporary differences between the financial statement carrying amounts of existing assets and liabilities and their respective tax bases. Deferred tax assets are reduced by a valuation allowance when management determines that it is more likely than not that all or a portion of the deferred tax assets will not be realized. Deferred tax assets and liabilities are measured using enacted tax rates expected to apply to taxable income in the years in which temporary differences are expected to be recovered or settled. The effect on deferred tax assets and liabilities of a change in tax rates is recognized in income in the period that includes the enactment date.
The Company recognizes the benefit of a tax position in the financial statements only after determining that the relevant tax authority would more likely than not sustain the position following an audit. For tax positions meeting the more-likely-than-not threshold, the amount recognized in the financial statements is the largest benefit that has a greater than 50 percent likelihood of being realized upon ultimate settlement with the relevant taxing authority. For these analyses, the Company may engage attorneys to provide opinions related to the positions. The Company applies this policy to all tax positions for which the statute of limitations remains open. There are no uncertain tax positions that materially impact the Company’s consolidated balance sheet or statement of operations. The Company
records any interest and penalties related to uncertain tax positions in income tax (benefit) expense in the consolidated statement of operations in the year assessed. For further discussion see Note 10.
Earnings Per Common Share
The Company has a simple capital structure. Basic earnings per share is computed by dividing net income by the weighted average number of common shares outstanding for the period.
In November 2008, the SEC released a proposed roadmap regarding the potential use by U.S. issuers of financial statements prepared in accordance with International Financial Reporting Standards (IFRS). IFRS is a comprehensive series of accounting standards published by the International Accounting Standards Board (“IASB”). Under the proposed roadmap, the Company may be required to prepare its consolidated financial statements in accordance with IFRS as early as 2014. The SEC will make a determination in 2011 regarding the mandatory adoption of IFRS. The Company is currently assessing the impact that this potential change would have on its consolidated financial statements and it will continue to monitor the development of the potential implementation of IFRS.
In July 2010, the FASB issued ASU 2010-20 Receivables (Topic 310), “Disclosures about the Credit Quality of Financing Receivables and Allowance for Credit Losses”. The main objective in developing this Update is to provide financial statement users with greater transparency about an entity’s allowance for credit losses and the credit quality of its financing receivables. Financing receivables include loans and trade accounts receivable. However, short-term trade accounts receivable, receivables measured at fair value or lower of cost or fair value, and debt securities are exempt from these disclosure amendments. This Update is intended to provide additional information to assist financial statement users in assessing an entity’s credit risk exposures and evaluating the adequacy of its allowance for credit losses. This ASU requires more information about the credit quality of financing receivables in the disclosures to financial statements, such as aging information and credit quality indicators. Both new and existing disclosures must be disaggregated by portfolio segment or class. The disaggregation of information is based on how a company develops its allowance for credit losses and how it manages its credit exposure. For public entities, the disclosures as of the end of a reporting period are effective for interim and annual reporting periods ending on or after December 15, 2010 and was adopted by the Company on December 31, 2010. The disclosures about activity that occurs during a reporting period are effective
for interim and annual reporting periods beginning on or after December 15, 2010 were early adopted by the Company in its consolidated financial statements for the year ended December 31, 2010.
39
In January 2011, FASB issued ASU 2011-01 Receivables (Topic 310), ”Deferral of the Effective Date of Disclosures about Troubled Debt Restructurings in Update No. 2010-20”. The amendments in this Update temporarily defer that effective date, enabling public-entity creditors to provide those disclosures after the Board clarifies the guidance for determining what constitutes a troubled debt restructuring. The deferral in this Update will result in more consistent disclosures about troubled debt restructurings. This amendment does not defer the effective date of the other disclosure requirements in Update 2010-20. In the proposed Update for determining what constitutes a troubled debt restructuring, the Board proposed that the clarifications would
be effective for interim and annual periods ending after June 15, 2011. The 2010-20 disclosure on trouble debt restructures will be concurrent with the effective date of the guidance for determining what constitutes a troubled debt restructuring, as presented in proposed Accounting Standards Update, Receivables (Topic 310): Clarifications to Accounting for Troubled Debt Restructurings by Creditors. Currently, that guidance is anticipated to be effective for interim and annual periods ending after June 15, 2011. The Company is reviewing the potential effects of this ASU on its consolidated financial statements.
Other accounting standards that have been issued or proposed by the FASB or other standards-setting bodies are not expected to have a material impact on the Company’s consolidated financial position, results of operations or cash flows.
(2) Cash and Due From Banks
The Bank is required to maintain certain reserves in the form of vault cash and/or deposits with the Federal Reserve Bank. The amount of this reserve requirement, which is included in cash and due from banks, was $242,000 at December 31, 2010 and $468,000 at December 31, 2009.
(3) Investment Securities
The amortized cost and estimated fair value of available for sale and held to maturity securities at December 31 are as follows (in thousands):
|
December 31, 2010
|
Amortized
|
Gross unrealized |
Estimated
|
|||||||||||||
|
Investment Securities
|
cost
|
gains
|
losses
|
fair value
|
||||||||||||
|
Available for Sale Securities:
|
||||||||||||||||
|
Government Sponsored Enterprises (GSE)
|
$ | 8,570 | $ | 105 | $ | (88 | ) | $ | 8,587 | |||||||
|
Obligations of states and political Subdivisions – New York State
|
56,819 | 1,122 | (276 | ) | 57,663 | |||||||||||
|
Mortgage-backed securities and collateralized mortgage obligations - GSE residential
|
32,117 | 1,130 | (36 | ) | 33,211 | |||||||||||
|
Corporate debt – financial services industry
|
4,518 | 49 | — | 4,567 | ||||||||||||
|
Certificates of deposit - financial services industry
|
98 | — | — | 98 | ||||||||||||
| 102,122 | 2,404 | (400 | ) | 104,126 | ||||||||||||
|
Equity securities – financial services industry
|
541 | 11 | (10 | ) | 542 | |||||||||||
| $ | 102,663 | $ | 2,415 | $ | (410 | ) | $ | 104,668 | ||||||||
|
Held to Maturity Securities- Obligations of states and political subdivisions
|
$ | 6,021 | $ | 240 | $ | — | $ | 6,261 | ||||||||
40
|
December 31, 2009
|
Amortized
|
Gross unrealized |
Estimated
|
|||||||||||||
|
Investment Securities
|
cost
|
gains
|
losses
|
fair value
|
||||||||||||
|
Available for Sale Securities:
|
||||||||||||||||
|
Government Sponsored Enterprises (GSE)
|
$ | 9,478 | $ | 64 | $ | (71 | ) | $ | 9,471 | |||||||
|
Obligations of states and political Subdivisions – New York State
|
48,729 | 1,516 | (65 | ) | 50,180 | |||||||||||
|
Mortgage-backed securities and collateralized mortgage obligations - GSE residential
|
28,868 | 725 | (83 | ) | 29,510 | |||||||||||
|
Corporate debt - financial services industry
|
1,404 | 46 | — | 1,450 | ||||||||||||
|
Certificates of deposit - financial services industry
|
98 | — | — | 98 | ||||||||||||
| 88,577 | 2,351 | (219 | ) | 90,709 | ||||||||||||
|
Equity securities – financial services industry
|
549 | 67 | (5 | ) | 611 | |||||||||||
| $ | 89,126 | $ | 2,418 | $ | (224 | ) | $ | 91,320 | ||||||||
|
Held to Maturity Securities- Obligations of state and political subdivisions
|
$ | 8,218 | $ | 360 | $ | — | $ | 8,578 | ||||||||
Included in available for sale securities are Government Sponsored Enterprises including securities of the Federal Home Loan Bank (FHLB), Federal Home Loan Mortgage Corporation (FHLMC or “Freddie Mac”), Government National Mortgage Association (GNMA or “Ginnie Mae”), and Federal National Mortgage Association (FNMA or “Fannie Mae”). FHLB, FHLMC and FNMA securities are not backed by the full faith of the U.S. government. Substantially all mortgage-backed securities and collateralized mortgage obligations consist of residential mortgage securities and are securities guaranteed by Ginnie Mae, Freddie Mac or Fannie Mae, which are U.S. government-sponsored entities. Obligations of state and political subdivisions are general obligation and revenue bonds of New York State
municipalities, agencies and authorities. General obligation bonds must have a nationally recognized statistical rating organization (NRSRO) investment grade rating in the top four categories (S&P “BBB-” or higher). Revenue bonds must have an NRSRO rating in the top three categories (S&P “A” or higher). Corporate debt securities are comprised of bonds with an NRSRO rating in the top four investment grades (S&P “BBB-” or higher).
The contractual terms of the government sponsored enterprise securities and the obligations of state and political subdivisions require the issuer to settle the securities at par upon maturity of the investment. The contractual cash flows of the mortgage backed securities and collateralized mortgage obligations are guaranteed by various government agencies or government sponsored enterprises such as FHLMC, FNMA, and GNMA.
Held to maturity securities consist of obligations of state and political subdivisions are general obligation bonds of municipalities local to the Company and are typically not rated by the NRSRO. In accordance with federal regulations, the Company performs an analysis of the finances of the municipalities to determine that the bonds are the credit equivalent of investment grade bonds.
Proceeds from sale, gross gains and gross losses realized on sales of available for sale securities were as follows for the years ended December 31 (in thousands). There were no sales of securities held to maturity during the periods ended December 31, 2010, 2009 or 2008.
|
Net Security Gains
|
2010
|
2009
|
2008
|
|||||||||
|
Gross proceeds
|
$ | 2,324 | $ | 17,724 | $ | 4,145 | ||||||
|
Gross realized gains
|
$ | 102 | $ | 545 | $ | 102 | ||||||
|
Gross realized losses
|
(4 | ) | (1 | ) | (38 | ) | ||||||
|
Net gain on sale of securities
|
$ | 98 | $ | 544 | $ | 64 | ||||||
|
Impairment charge
|
$ | — | $ | — | $ | (5,162 | ) | |||||
The 2008 impairment charge is related primarily to Freddie Mac preferred stock. The Company no longer holds any of this stock.
41
The amortized cost and estimated fair value of securities available for sale and held to maturity at December 31, 2010, by remaining period to contractual maturity, are shown in the following table (in thousands). Actual maturities will differ from contractual maturities because of security prepayments and the right of certain issuers to call or prepay their obligations.
|
Amortized
|
Estimated
|
|||||||
|
Available for Sale Securities
|
cost
|
fair value
|
||||||
|
Within one year
|
$ | 19,192 | $ | 19,340 | ||||
|
One to five years
|
33,451 | 34,271 | ||||||
|
Five to ten years
|
17,362 | 17,304 | ||||||
|
Over ten years
|
— | — | ||||||
| 70,005 | 70,915 | |||||||
|
Mortgage-backed securities
|
32,117 | 33,211 | ||||||
|
Equity securities
|
541 | 542 | ||||||
| $ | 102,663 | $ | 104,668 | |||||
|
Amortized
|
Estimated
|
|||||||
|
Held to Maturity Securities
|
cost
|
fair value
|
||||||
|
Within one year
|
$ | 1,306 | $ | 1,345 | ||||
|
One to five years
|
2,353 | 2,460 | ||||||
|
Five to ten years
|
1,918 | 1,961 | ||||||
|
Over ten years
|
444 | 495 | ||||||
| $ | 6,021 | $ | 6,261 | |||||
Available for sale securities with an estimated fair value of $42,282,000, and $60,207,000 at December 31, 2010 and 2009 respectively, were pledged to secure public funds on deposit and for other purposes.
Investment securities in a continuous unrealized loss position are reflected in the following table which groups individual securities by length of time that they have been in a continuous unrealized loss position, and then details by investment category the number of instruments aggregated with their gross unrealized losses and the fair values at December 31, 2010 and 2009 (dollars in thousands):
|
Less than 12 months
|
12 months or more
|
Total
|
||||||||||||||||||||||||||||||||||
|
December 31, 2010
|
Estimated
|
Unrealized
|
Estimated
|
Unrealized
|
Estimated
|
Unrealized
|
||||||||||||||||||||||||||||||
|
Investment Securities
|
No.
|
fair value
|
losses
|
No.
|
fair value
|
losses
|
No.
|
fair value
|
losses
|
|||||||||||||||||||||||||||
|
Available for sale:
|
||||||||||||||||||||||||||||||||||||
|
Debt Securities:
|
||||||||||||||||||||||||||||||||||||
|
Government Sponsored Enterprises
|
3 | $ | 2,433 | $ | 88 | — | $ | — | $ | — | 3 | $ | 2,433 | $ | 88 | |||||||||||||||||||||
|
Obligations of state and political subdivisions – NY State
|
68 | 12,389 | 276 | — | — | — | 68 | 12,389 | 276 | |||||||||||||||||||||||||||
|
Mortgage-backed securities and collateralized mortgage obligations
|
6 | 4,655 | 36 | — | — | — | 6 | 4,655 | 36 | |||||||||||||||||||||||||||
| 77 | 19,477 | 400 | — | — | — | 77 | 19,477 | 400 | ||||||||||||||||||||||||||||
|
Equity securities – financial services industry
|
3 | 313 | 10 | — | — | — | 3 | 313 | 10 | |||||||||||||||||||||||||||
| 80 | $ | 19,790 | $ | 410 | — | $ | — | $ | — | 80 | $ | 19,790 | $ | 410 | ||||||||||||||||||||||
42
|
Less than 12 months
|
12 months or more
|
Total
|
||||||||||||||||||||||||||||||||||
|
December 31, 2009
|
Estimated
|
Unrealized
|
Estimated
|
Unrealized
|
Estimated
|
Unrealized
|
||||||||||||||||||||||||||||||
|
Investment Securities
|
No.
|
fair value
|
losses
|
No.
|
fair value
|
losses
|
No.
|
fair value
|
losses
|
|||||||||||||||||||||||||||
|
Available for sale:
|
||||||||||||||||||||||||||||||||||||
|
Debt Securities:
|
||||||||||||||||||||||||||||||||||||
|
Government Sponsored Enterprises
|
7 | $ | 7,405 | $ | 71 | — | $ | — | $ | — | 7 | $ | 7,405 | $ | 71 | |||||||||||||||||||||
|
Obligations of state and political subdivisions – NY State
|
23 | 6,338 | 62 | 1 | 129 | 3 | 24 | 6,467 | 65 | |||||||||||||||||||||||||||
|
Mortgage-backed securities and collateralized mortgage obligations
|
3 | 3,177 | 83 | — | — | — | 3 | 3,177 | 83 | |||||||||||||||||||||||||||
| 33 | 16,920 | 216 | 1 | 129 | 3 | 34 | 17,049 | 219 | ||||||||||||||||||||||||||||
|
Equity securities – financial services industry
|
— | — | — | 1 | 105 | 5 | 1 | 105 | 5 | |||||||||||||||||||||||||||
| 33 | $ | 16,920 | $ | 216 | 2 | $ | 234 | $ | 8 | 35 | $ | 17,154 | $ | 224 | ||||||||||||||||||||||
|
Held to maturity:
|
||||||||||||||||||||||||||||||||||||
|
Obligations of state and political subdivisions
|
1 | $ | 56 | $ | — | — | $ | — | $ | — | 1 | $ | 56 | $ | — | |||||||||||||||||||||
Management evaluates securities for other-than-temporary impairment (“OTTI”) at least on a quarterly basis, and more frequently when economic or market conditions warrant such an evaluation. All of the Company’s investment securities classified as available for sale or held to maturity are evaluated for OTTI. Securities identified as other-than-temporarily impaired are written down to their current fair market value. For debt and equity securities that are intended to be sold, or that management believes will more-likely-than-not be required to be sold prior to recovery, the full impairment is recognized immediately in earnings. An impairment charge will also be recorded if there is credit related loss. There are numerous factors to be considered when estimating whether a credit loss exists and
the period over which the debt security is expected to recover. Indicators of a possible credit loss include the failure of the issuer of the security to make scheduled interest or principal payments, any changes to the rating of the security by a rating agency, additional declines in fair value after the balance sheet date. In determining whether a credit loss exists, an entity shall use its best estimate of the present value of expected cash flows expected to be collected from the debt security by discounting the expected cash flows at the effective interest rate implicit in the security at the date of acquisition. The difference between the present value of the cash flows expected to be collected and the amortized cost basis of a security is considered to be the credit loss. Once an impairment is determined to be other-than-temporary, the impairment related to credit loss, if any, is charged to income and the amount of the
impairment related to all other factors is recognized in other comprehensive income.
As of December 31, 2010, management believes that none of the unrealized losses on non-equity securities at December 31, 2010 are due to the underlying credit quality of the issuers of the securities, but instead are primarily related to market interest rates, and the full value of the securities will be realized upon maturity. Additionally, the Company does not intend to sell the securities, and it is more-likely-than-not that the Company will not be required to sell the securities before recovery of their amortized cost. In management’s opinion, the losses on equity securities are due to normal market fluctuations, and it believes they will recover and therefore no impairment was recognized on these securities. As there was no credit loss, no impairment charge was recorded for the year ended December 31,
2010 or for the year ended December 31, 2009. Management believes the unrealized losses related to the three equity securities held at December 31, 2010 do not represent other-than-temporary impairment as losses are due to market fluctuations and not credit concerns with regard to the issuers.
The impairment charge of $5,162,000 recorded in 2008 was primarily due to an investment in FHLMC preferred stock. A portion of the FHLMC preferred stock was sold in 2008 and the remaining shares were sold in 2009. Of the remaining $131,000 impairment charge at December 31, 2009, $30,000 was recorded in 2007, and the balance was recorded in 2008 on one equity security, which has fully recovered as of December 31, 2010.
(4) Restricted Investments
Restricted investments include stock held in correspondent banks, the Federal Reserve Bank and trust preferred stock. The trust preferred stock is valued at par of $1,000,000 and is fully secured by an investment grade bond. Financial statements for the trust preferred stock are evaluated quarterly for impairment and the Company believes that there was no impairment on this trust preferred stock in 2010 or 2009. The investment in correspondent banks totaled $210,000 and $192,000 as of December 31, 2010 and 2009 respectively. As a member of the Federal Home Loan Bank of New York (FHLB), the Company is required to purchase and hold stock in the FHLB to satisfy membership and borrowing requirements. This stock is restricted in that it can only be sold to the FHLB or to another member institution, and all sales of
FHLB stock must be at par value. As a result of these restrictions, FHLB stock is unlike the Company’s other investment securities insofar as there is no trading market for FHLB stock and the transfer price is determined by FHLB membership rules, not by market participants. As of December 31, 2010 and 2009, our FHLB stock totaled $1,596,000 and $1,149,000, respectively, and is included as a part of restricted investments on the consolidated balance sheets.
43
FHLB stock is held as a long-term investment, and its value is determined based on the ultimate recoverability of the par value. The Company evaluates impairment quarterly. The decision of whether impairment exists is a matter of judgment that reflects our view of the FHLB’s long-term performance, which includes factors such as:
|
|
·
|
its operating performance;
|
|
|
·
|
the severity and duration of declines in the fair value of its net assets related to its capital stock amount;
|
|
|
·
|
its commitment to make payments required by law or regulation and the level of such payments in relation to its operating performance;
|
|
|
·
|
the impact of legislative and regulatory changes on the FHLB, and accordingly, on the members of FHLB; and
|
|
|
·
|
its liquidity and funding position.
|
After evaluating all of these considerations, the Company concluded that the par value of its investment in FHLB stock will be recovered. Accordingly, no impairment charge was recorded on these securities in 2010 or 2009. Our evaluation of the factors described above in future periods could result in the recognition of impairment charges on FHLB stock.
(5) Loans
The major classifications of loans are as follows at December 31 (in thousands):
|
Loans, Net
|
2010
|
2009
|
||||||
|
Commercial
|
||||||||
|
Commercial real estate loans:
|
||||||||
|
Commercial mortgage
|
$ | 99,606 | $ | 96,264 | ||||
|
Farm land
|
4,551 | 4,926 | ||||||
|
Construction
|
821 | 2,792 | ||||||
|
Total commercial real estate loans
|
104,978 | 103,982 | ||||||
|
Other commercial loans:
|
||||||||
|
Commercial loans
|
25,864 | 26,035 | ||||||
|
Agricultural loans
|
878 | 882 | ||||||
|
Total other commercial loans
|
26,742 | 26,917 | ||||||
|
Total commercial loans
|
131,720 | 130,899 | ||||||
|
Consumer
|
||||||||
|
Consumer real estate loans:
|
||||||||
|
Residential mortgage
|
108,397 | 103,748 | ||||||
|
Home equity
|
31,968 | 32,765 | ||||||
|
Construction
|
2,304 | 3,841 | ||||||
|
Total residential real estate loans
|
142,669 | 140,354 | ||||||
|
Other commercial loans:
|
||||||||
|
Consumer installment loans
|
6,375 | 6,752 | ||||||
|
Other consumer loans
|
1,383 | 1,402 | ||||||
|
Total other loans
|
7,758 | 8,154 | ||||||
|
Total consumer loans
|
150,427 | 148,508 | ||||||
|
Total gross loans
|
282,147 | 279,407 | ||||||
|
Allowance for loan losses
|
(4,335 | ) | (3,988 | ) | ||||
|
Total loans, net
|
$ | 277,812 | $ | 275,419 | ||||
Included in the above loan amounts are unearned discounts on installment loans as well as unamortized deferred loan fees and origination costs of $661,000 and $611,000 as of December 31, 2010 and 2009, respectively.
The Company originates residential and loans primarily to borrowers in Sullivan County, New York. A substantial portion of the loan portfolio is secured by real estate properties located in that area. The ability of the Company’s borrowers to make principal and interest payments is dependent upon, among other things, the level of overall economic activity and the real estate market conditions prevailing within the Company’s concentrated lending area.
44
Nonperforming Loans
Nonperforming loans are loans which are impaired or are past due more than 90 days and still accruing. Impaired loan disclosures and classification apply to loans that are individually evaluated for collectability. A loan is impaired when, based on current information and events, it is probable that a creditor will be unable to collect all amounts due according to the contractual terms of the loan agreement. Loans restructured under the guidelines of ASC 310-40 Receivables Troubled Debt Restructures by Creditors are classified as impaired.
Information on nonperforming loans are summarized as follows at December 31(in thousands):
|
Commercial
|
Commercial
|
Residential
|
||||||||||||||
|
Nonperforming Loans
|
Total Loans
|
Real Estate
|
Other
|
Real Estate
|
||||||||||||
|
December 31, 2010:
|
||||||||||||||||
|
Nonaccrual loans
|
$ | 11,399 | $ | 9,150 | $ | 1,310 | $ | 939 | ||||||||
|
Loans past due 90 days or more and still accruing interest
|
1,091 | 143 | 33 | 915 | ||||||||||||
|
Total nonperforming loans
|
$ | 12,490 | $ | 9,293 | $ | 1,343 | $ | 1,854 | ||||||||
|
December 31, 2009:
|
||||||||||||||||
|
Nonaccrual loans
|
$ | 12,037 | $ | 10,460 | $ | 960 | $ | 617 | ||||||||
|
Loans past due 90 days or more and still accruing interest
|
1,270 | 412 | — | 858 | ||||||||||||
|
Total nonperforming loans
|
$ | 13,307 | $ | 10,872 | $ | 960 | $ | 1,475 | ||||||||
There were no nonperforming loans in the consumer loan or other classes.
The nonaccrual loan income recognition policy of the Bank is that interest is not recognized as income until it is received in cash, and the loan’s collateral is adequate to support both the interest recognized plus the loan balance, or until the borrower demonstrates the ability to make scheduled payments of interest and principal, and the loan has remained current for a period of at least six months.
The table below includes impaired loans as of December 31 and their effect on interest income for the years ended December 31 (in thousands):
|
Commercial
|
Commercial
|
|||||||||||
|
Impaired Loans
|
Total Loans
|
Real Estate
|
Other
|
|||||||||
|
2010:
|
||||||||||||
|
Unpaid principal balance
|
$ | 11,806 | $ | 10,332 | $ | 1,474 | ||||||
|
Recorded investment
|
10,216 | 8,906 | 1,310 | |||||||||
|
Average balance
|
12,448 | 11,003 | 1,445 | |||||||||
|
Interest income:
|
||||||||||||
|
Interest contractually due at original rates
|
750 | 701 | 49 | |||||||||
|
Interest income recognized
|
229 | 178 | 51 | |||||||||
|
Impaired loans:
|
||||||||||||
|
Loans with no allowance
|
$ | 6,407 | $ | 5,702 | $ | 705 | ||||||
|
Loans with an allowance recorded
|
3,809 | 3,204 | 605 | |||||||||
|
Related specific allowance
|
$ | 831 | $ | 608 | $ | 223 | ||||||
45
|
Commercial
|
Commercial
|
|||||||||||
|
Impaired Loans (continued)
|
Total Loans
|
Real Estate
|
Other
|
|||||||||
|
2009:
|
||||||||||||
|
Unpaid principal balance
|
$ | 11,575 | $ | 9,708 | $ | 1,867 | ||||||
|
Recorded investment
|
11,421 | 9,561 | 1,860 | |||||||||
|
Average balance
|
12,802 | 11,410 | 1,392 | |||||||||
|
Interest income:
|
||||||||||||
|
Interest contractually due at original rates
|
757 | 728 | 29 | |||||||||
|
Interest income recognized
|
162 | 153 | 9 | |||||||||
|
Impaired loans:
|
||||||||||||
|
Loans with no allowance
|
$ | 7,831 | $ | 6,871 | $ | 960 | ||||||
|
Loans with an allowance recorded
|
3,590 | 2,690 | 900 | |||||||||
|
Related specific allowance
|
$ | 862 | $ | 762 | $ | 100 | ||||||
|
2008:
|
||||||||||||
|
Average loan balance
|
$ | 6,095 | ||||||||||
|
Interest income:
|
||||||||||||
|
Interest contractually due at original rates
|
135 | |||||||||||
|
Interest income recognized
|
56 | |||||||||||
Credit Quality Information
The Bank’s management and board of directors are actively engaged in the underwriting and monitoring of loans. Loans are underwritten and reviewed in conjunction with a board of director’s approved loan credit policy with the balanced goal of maintaining underwriting, documentation and review standards with satisfactory interest income and minimal credit losses. Loans are reviewed and approved at various levels depending upon the amount of credit exposure including: board of directors, board loan committee, senior loan committee and individual officer level. At underwriting, consumer loan approval is based upon an independent analysis of the applicant’s financial strength. Commercial loans are underwritten and reviewed consistent with the Bank’s loan credit policy. The Bank monitors the
commercial loan portfolio based upon a board of directors approved loan review and risk identification policy. The policy dictates the process for internal loan risk identification, periodic annual review of larger commercial loan relationships and external loan review.
The credit policy of the Bank ensures conformity in loan pricing, sets forth standards for distribution of loans by class, types of credit, limitations on concentrations of credit, maximum maturities by types of credit, legal documentation requirements, commercial loan underwriting standards, acceptable forms of collateral, use of financial covenants for commercial loans, financial statement requirements, loan participations, and appraisal standards, among many other items.
At underwriting, all unsecured commercial loans in excess of $10,000 and secured commercial loans in excess of $25,000 are assigned a risk rating in conformity with the loan review and risk identification policy. All commercial loans with aggregate relationship exposure of $100,000 or more are required to be reviewed annually. The analysis is compared to any financial covenants to ensure conformity. If the analysis reveals non-conformity, the applicable lending officer or loan committee may recommend corrective action including a revised loan risk rating, non-renewal of lines of credit, reduction in lines of credit or collection action. Once a loan is underwritten, the risk rating is updated if the lending officer notes either positive or negative characteristics in the loan.
The Bank has a loan rating system that ranges from “Pass” to “Loss” based upon the commensurate severity of credit risk. “Pass” rated loans are generally loans to un-leveraged borrowers with strong liquidity, available cash flow to service debt obligations and the ability to make payments as agreed. “Pass watch” loans are stronger than loans in the special mention category, as discussed below, but would not fall in the “Pass” category for reasons such as follows: the loans are comprised of financially strong individuals not meeting agreed upon repayment programs, are unseasoned smaller loans, or have excessive vulnerability to competition or other dependencies. Special mention loans are currently protected, but are potentially weak. These loans
constitute an undue and unwarranted risk, but not to the point of justifying a classification of substandard. The credit risk may be relatively minor, yet constitute an unwarranted risk in light of the circumstances surrounding a specific loan. The loan may have potential weaknesses which may, if not checked or corrected, weaken the loan or inadequately protect the Bank’s credit position at some future date. Substandard loans have a well-defined weakness that jeopardizes the liquidity of the debt. They are characterized by the distinct possibility that the Bank will sustain some loss if the deficiencies are not corrected. Doubtful loans that have all the weaknesses inherent in a loan classified as substandard, with the added characteristics that the weaknesses make collection or liquidation in full, on the basis of currently existing facts, conditions, and values, highly questionable and improbable. The possibility of loss is extremely high, but because of certain important and
reasonably specific pending factors which may work to the advantage and strengthening of the assets, its classification as a loss is deferred until its more exact status may be determined. Loans which become “Loss” rated, are fully charged off as they are considered uncollectible and their continuance as bankable assets is no longer warranted and are therefore excluded below. Loans that are non-reviewed on an ongoing basis are consumer loans and small balance commercial loans, which pose less of a credit risk.
46
Management reviews risk ratings on a monthly basis and the following illustrates total loans by credit risk profiles based on internally assigned grades and category for the years ended December 31 (in thousands):
|
Commercial
|
Consumer
|
|||||||||||||||||||||||
|
Loans by Risk Ratings
|
Total
|
Real Estate
|
Other
|
Real Estate
|
Installment
|
Other
|
||||||||||||||||||
|
December 31, 2010:
|
||||||||||||||||||||||||
|
Pass
|
$ | 45,078 | $ | 33,538 | $ | 11,540 | ||||||||||||||||||
|
Pass watch
|
53,754 | 43,046 | 10,708 | |||||||||||||||||||||
|
Special mention
|
6,008 | 5,026 | 982 | |||||||||||||||||||||
|
Substandard
|
24,640 | 22,694 | 1,946 | |||||||||||||||||||||
|
Doubtful
|
831 | 429 | 402 | |||||||||||||||||||||
|
Non-reviewed
|
151,836 | 245 | 1,164 | $ | 142,669 | $ | 6,375 | $ | 1,383 | |||||||||||||||
|
Total
|
$ | 282,147 | $ | 104,978 | $ | 26,742 | $ | 142,669 | $ | 6,375 | $ | 1,383 | ||||||||||||
|
December 31, 2009:
|
||||||||||||||||||||||||
|
Pass
|
$ | 46,535 | $ | 33,256 | $ | 13,279 | ||||||||||||||||||
|
Pass watch
|
56,811 | 49,256 | 7,555 | |||||||||||||||||||||
|
Special mention
|
5,105 | 4,237 | 868 | |||||||||||||||||||||
|
Substandard
|
21,165 | 16,895 | 4,270 | |||||||||||||||||||||
|
Doubtful
|
404 | 130 | 274 | |||||||||||||||||||||
|
Non-reviewed
|
149,387 | 208 | 671 | $ | 140,354 | $ | 6,752 | $ | 1,402 | |||||||||||||||
|
Total
|
$ | 279,407 | $ | 103,982 | $ | 26,917 | $ | 140,354 | $ | 6,752 | $ | 1,402 | ||||||||||||
The following table illustrates the aging of past due loans by category for the years ended December 31 (in thousands):
|
Greater
|
Over 90
|
|||||||||||||||||||||||||||
|
30-59 Days
|
60-89 Days
|
than
|
Total
|
Total
|
and
|
|||||||||||||||||||||||
|
Category of loans
|
past due
|
past due
|
90 Days
|
past due
|
Current
|
loans
|
accruing
|
|||||||||||||||||||||
|
2010:
|
||||||||||||||||||||||||||||
|
Commercial real estate
|
$ | 4,333 | $ | 890 | $ | 6,837 | $ | 12,060 | $ | 92,918 | $ | 104,978 | $ | 143 | ||||||||||||||
|
Residential real estate
|
2,840 | 1,946 | 1,723 | 6,509 | 136,160 | 142,669 | 915 | |||||||||||||||||||||
|
Commercial other
|
176 | 67 | 95 | 338 | 26,404 | 26,742 | 33 | |||||||||||||||||||||
|
Consumer installment
|
107 | 260 | — | 367 | 6,008 | 6,375 | — | |||||||||||||||||||||
|
Other consumer
|
4 | — | — | 4 | 1,379 | 1,383 | — | |||||||||||||||||||||
|
Total
|
$ | 7,460 | $ | 3,163 | $ | 8,655 | $ | 19,278 | $ | 262,869 | $ | 282,147 | $ | 1,091 | ||||||||||||||
|
2009:
|
||||||||||||||||||||||||||||
|
Commercial real estate
|
$ | 2,002 | $ | 2,253 | $ | 6,259 | $ | 10,514 | $ | 93,468 | $ | 103,982 | $ | 412 | ||||||||||||||
|
Residential real estate
|
2,559 | 1,978 | 959 | 5,496 | 134,858 | 140,354 | 858 | |||||||||||||||||||||
|
Commercial other
|
467 | 20 | — | 487 | 26,430 | 26,917 | — | |||||||||||||||||||||
|
Consumer installment
|
101 | 73 | — | 174 | 6,578 | 6,752 | — | |||||||||||||||||||||
|
Other consumer
|
— | — | — | — | 1,402 | 1,402 | — | |||||||||||||||||||||
|
Total
|
$ | 5,129 | $ | 4,324 | $ | 7,218 | $ | 16,671 | $ | 262,736 | $ | 279,407 | $ | 1,270 | ||||||||||||||
As of December 31, 2010 and 2009, nonaccrual loans included $3.8 million and $6.1 million of loans, respectively, which are paying currently but have not met the specific criteria to be placed on accrual status.
47
Allowance for Loan Losses
The allowance for loan losses is a valuation allowance that management has determined to be necessary to absorb probable incurred credit losses inherent in the loan portfolio. The allowance is established through provisions for losses charged to earnings. Loan losses are charged against the allowance when management believes the uncollectability of a loan balance is confirmed. Subsequent recoveries, if any, are credited to the allowance. Management evaluates the allowance quarterly using past loan loss experience to establish base allowance pool rates for commercial real estate, other commercial loans, residential real estate loans, consumer installment and other consumer loans. Reviewed and Pass-rated commercial mortgage/loan pool rates are determined based on adjusted pool rates, which include weighted three-year average loss percentages adjusted for the eight risk factors as discussed below.
Special mention and substandard pool rates are determined by the adjusted pool rates plus the greater of the Bank’s average historical loss rolling average of the prior eight quarters or the weighted three-year average loss percentages. The method used in this calculation collects all commercial loans from one year ago, observes their status and rating at the current time, and computes the average loss for these rating categories by comparing the losses experienced by those particular loans to the loans in the different rating categories from one year ago. These allowance pool rates are then adjusted based on management’s current assessment of eight risk factors.
These risk factors are:
|
1.
|
Changes in lending policies and procedures, including underwriting standards and collection, charge-off, and recovery practices.
|
|
2.
|
Changes in national, regional, and local economic and business conditions as well as the condition of various market segments, including the value of underlying collateral for collateral dependent loans.
|
|
3.
|
Changes in the nature and volume of the portfolio and terms of loans.
|
|
4.
|
Changes in the experience, ability, and depth of lending management and staff.
|
|
5.
|
Changes in volume and severity of past due, classified and nonaccrual loans as well as and other loan modifications.
|
|
6.
|
Changes in the quality of the Bank’s loan review system, and the degree of oversight by the Bank’s board of directors.
|
|
7.
|
The existence and effect of any concentrations of credit and changes in the level of such concentrations.
|
|
8.
|
The effect of external factors, such as competition and legal and regulatory requirements.
|
Each factor is assigned a value to reflect improving, stable or declining conditions based on management’s best judgment using relevant information available at the time of the evaluation. Adjustments to the factors are supported through documentation of changes in conditions in a narrative accompanying the allowance for loan loss calculation. Several specific factors are believed to have more impact on a loan’s risk rating, such as those related to national and local economic trends, lending management and staff, volume of past dues and nonaccruals, and concentrations of credit. Therefore, due to the increased risk inherent in criticized and classified loans, the values of these specific factors are increased proportionally. Management believes these increased factors provide adequate coverage for
the additional perceived risk. Doubtful loans by definition have inherent losses in which the precise amounts are dependent on likely future events. These particular loans are reserved at higher pool rates (25%) unless specifically reviewed and deemed impaired as described below.
The commercial portfolio segment is comprised of commercial real estate and other commercial loans. This segment is subject to all of the risk factors considered in management’s assessment of the allowance. Examples of specific risks applicable to the entire segment include changes in economic conditions that reduce business and consumer spending leading to a loss of revenue, concentrations of credit in business categories that are disproportionately impacted by current economic conditions, the quality of the Bank’s loan review system and its ability to identify potential problem loans, and the availability of acceptable new loans to replace maturing, amortizing and refinanced loans. In addition, risks specific to commercial mortgages and secured commercial loans would include
economic conditions that lead to declines in property and other collateral values. Prior to applying the allowance pool rate, commercial real estate and other commercial loans in nonaccrual status or those with a minimum substandard rating and loan relationships of $500,000 or more are individually considered for impairment. Loans that are considered individually for impairment and not determined to be impaired are returned to their original pools for allowance purposes. If a loan is determined to be impaired, it is evaluated under guidance which dictates that a creditor shall measure impairment based on either the present value of expected future cash flows discounted at the loan's effective interest rate, the loan's observable market price, or the fair value of the collateral less estimated costs to sell if the loan is collateral dependent. If the measure of
the impaired loan, such as the collateral value, is less than the recorded investment in the loan, a specific reserve is established in the allowance for loan losses. An uncollectible loan is charged off after all reasonable means of collection are exhausted and the recovery of the principal through the disposal of the collateral is not reasonably expected to cover the costs. Commercial real estate and other commercial loans with an original principal balance under $10,000 for unsecured loans or under $25,000 for secured loans are also not individually considered. Instead, the appropriate allowance pool rate is applied to the aggregate balance of these pools.
48
The consumer portfolio segment is comprised of residential real estate, consumer installment and other consumer loans. This segment is also subject to all of the risk factors considered in management’s assessment of the allowance. Examples of specific risks applicable to the entire segment include changes in economic conditions that increase unemployment which reduces a consumer’s ability to repay their debt, changes in legal and regulatory requirements that make it more difficult to originate new loans and collect on existing loans, and competition from non-local lenders who originate loans in the Bank’s market area at lower rates than the Bank can profitably offer. In addition, risks specific to residential mortgages and secured consumer loans would include economic conditions that lead to
declines in property and other collateral values. Residential real estate, consumer installment and other consumer loans are considered homogenous pools and are not individually considered for impairment. Instead, the appropriate allowance pool rate is applied to the aggregate balance of these pools. The other portfolio segment is comprised of primarily of check-loans and loans in-process. These loans are considered homogenous pools and are not individually considered for impairment and a pool rating is applied to the aggregate balance of these pools.
The amount of the allowance is based on estimates and the ultimate losses may vary from such estimates as more information becomes available, or as later events occur or circumstances change. Allocations of the allowance may be made for specific loans, but the entire allowance is available for any loan that, in management’s judgment, should be charged off. Modifications to the methodology used in the allowance for loan losses evaluation may be necessary in the future based on economic and real estate market conditions, new information obtained regarding known problem loans, regulatory guidelines and examinations, the identification of additional problem loans, changes in general accepted accounting principles or other factors.
Changes in the allowance for loan losses and the related loans evaluated for credit losses are summarized as follows for the years ended December 31 (in thousands):
|
Commercial
|
Consumer
|
|||||||||||||||||||||||||||
|
Allowance for Loan Losses
|
Total
|
Real Estate
|
Other
|
Real Estate
|
Installment
|
Other
|
Unallocated
|
|||||||||||||||||||||
|
December 31, 2010:
|
||||||||||||||||||||||||||||
|
Beginning balance January 1
|
$ | 3,988 | $ | 1,799 | $ | 561 | $ | 1,249 | $ | 132 | $ | 55 | $ | 192 | ||||||||||||||
|
Charge-offs
|
(2,109 | ) | (1,458 | ) | (254 | ) | (220 | ) | (89 | ) | ( 88 | ) | — | |||||||||||||||
|
Recoveries
|
156 | — | 51 | 3 | 47 | 55 | — | |||||||||||||||||||||
|
Provision
|
2,300 | 1,819 | 264 | 181 | 16 | 39 | (19 | ) | ||||||||||||||||||||
|
Ending balance December 31
|
$ | 4,335 | $ | 2,160 | $ | 622 | $ | 1,213 | $ | 106 | $ | 61 | $ | 173 | ||||||||||||||
|
Ending balance as related to loans:
|
||||||||||||||||||||||||||||
|
Evaluated collectively [general reserve]
|
$ | 3,504 | $ | 1,552 | $ | 399 | $ | 1,213 | $ | 106 | $ | 61 | $ | 173 | ||||||||||||||
|
Evaluated individually [specific reserve]
|
831 | 608 | 223 | — | — | — | — | |||||||||||||||||||||
|
Total loans
|
$ | 282,147 | $ | 104,978 | $ | 26,742 | $ | 142,669 | $ | 6,375 | $ | 1,383 | ||||||||||||||||
|
Loans evaluated for impairment
|
||||||||||||||||||||||||||||
|
Loans evaluated collectively
|
271,931 | 96,072 | 25,432 | 142,669 | 6,375 | 1,383 | ||||||||||||||||||||||
|
Loans evaluated individually
|
10,216 | 8,906 | 1,310 | — | — | — | ||||||||||||||||||||||
|
December 31, 2009:
|
||||||||||||||||||||||||||||
|
Beginning balance January 1
|
$ | 3,170 | $ | 1,327 | $ | 596 | $ | 895 | $ | 113 | $ | 54 | $ | 185 | ||||||||||||||
|
Charge-offs
|
(648 | ) | — | (300 | ) | (95 | ) | (151 | ) | (102 | ) | — | ||||||||||||||||
|
Recoveries
|
166 | — | 25 | 3 | 74 | 64 | — | |||||||||||||||||||||
|
Provision
|
1,300 | 472 | 241 | 446 | 95 | 39 | 7 | |||||||||||||||||||||
|
Ending balance December 31
|
$ | 3,988 | $ | 1,799 | $ | 561 | $ | 1,249 | $ | 132 | $ | 55 | $ | 192 | ||||||||||||||
|
Ending balance as related to loans:
|
||||||||||||||||||||||||||||
|
Evaluated collectively [general reserve]
|
$ | 3,126 | $ | 1,037 | $ | 461 | $ | 1,249 | $ | 132 | $ | 55 | $ | 192 | ||||||||||||||
|
Evaluated individually [specific reserve]
|
862 | 762 | 100 | — | — | — | — | |||||||||||||||||||||
|
Total loans
|
$ | 279,407 | $ | 103,982 | $ | 26,917 | $ | 140,354 | $ | 6,752 | $ | 1,402 | ||||||||||||||||
|
Loans evaluated for impairment
|
||||||||||||||||||||||||||||
|
Loans evaluated collectively
|
267,986 | 94,421 | 25,057 | 140,354 | 6,752 | 1,402 | ||||||||||||||||||||||
|
Loans evaluated individually
|
11,421 | 9,561 | 1,860 | — | — | — | ||||||||||||||||||||||
49
|
Commercial
|
Consumer
|
|||||||||||||||||||||||||||
|
Allowance for Loan Losses (Continued)
|
Total
|
Real Estate
|
Other
|
Real Estate
|
Installment
|
Other
|
Unallocated
|
|||||||||||||||||||||
|
December 31, 2008:
|
||||||||||||||||||||||||||||
|
Beginning balance January 1
|
$
|
3,352
|
$
|
1,117
|
$
|
338
|
$
|
1,483
|
$
|
151
|
$
|
32
|
$
|
231
|
||||||||||||||
|
Charge-offs
|
(647
|
)
|
—
|
(294
|
)
|
(21
|
)
|
(178
|
)
|
(154
|
)
|
—
|
||||||||||||||||
|
Recoveries
|
200
|
—
|
80
|
9
|
47
|
64
|
—
|
|||||||||||||||||||||
|
Provision
|
265
|
210
|
472
|
(576
|
)
|
94
|
111
|
(46
|
)
|
|||||||||||||||||||
|
Ending balance December 31
|
$
|
3,170
|
$
|
1,327
|
$
|
596
|
$
|
895
|
$
|
113
|
$
|
54
|
$
|
185
|
||||||||||||||
There are no commitments to lend additional funds on the above noted non-performing loans. Despite the increase in the amount of non-performing loans, management has determined that the majority of these loans remain well collateralized. Based on its comprehensive analysis of the loan portfolio, and since the Company has no exposure to subprime loans, management believes the current level of the allowance for loan losses is adequate.
(6) Premises and Equipment
The major classifications of premises and equipment were as follows at December 31 (in thousands):
|
Premise and Equipment, Net
|
2010
|
2009
|
||||||
|
Land
|
$ | 1,057 | $ | 1,057 | ||||
|
Buildings and improvements
|
6,563 | 6,168 | ||||||
|
Furniture and fixtures
|
337 | 226 | ||||||
|
Equipment
|
4,191 | 4,323 | ||||||
| 12,148 | 11,774 | |||||||
|
Less accumulated depreciation and amortization
|
(6,864 | ) | (6,754 | ) | ||||
| $ | 5,284 | $ | 5,020 | |||||
Depreciation and amortization expense was $712,000, $627,000, and $655,000 in 2010, 2009, and 2008, respectively.
The Company’s leases for four branch locations Callicoon, Wal*Mart, Wurtsboro and White Lake expire in 2012, 2014, 2020, and 2030 respectively. A renewal options exists for Callicoon for an additional 15 years. Total rent expense for the years ended December 31, 2010 and 2009 was $123,000 and $81,000, respectively. The Company’s contractual obligation on future minimum lease payments as of December 31, 2010, are as follows (in thousands):
|
Future Minimum Lease Payments, for the years ended:
|
||||
|
2011
|
$ | 141 | ||
|
2012
|
135 | |||
|
2013
|
126 | |||
|
2014
|
114 | |||
|
2015
|
76 | |||
|
2016 and thereafter
|
854 | |||
|
|
$ |
1,445
|
||
(7) Time Deposits
The following is a summary of time deposits at December 31, 2010 by remaining period to contractual maturity (in thousands):
|
Within one year
|
$ | 104,603 | ||
|
One to two years
|
36,261 | |||
|
Two to three years
|
4,473 | |||
|
Three to four years
|
3,980 | |||
|
Four to five years
|
5,218 | |||
|
Over five years
|
54 | |||
|
|
$ |
154,589
|
50
Time deposits of $100,000 or more totaled $64,510,000 and $80,737,000 at December 31, 2010 and 2009, respectively. Interest expense related to time deposits over $100,000 was $1,216,000, $1,471,000 and $1,634,000 for 2010, 2009 and 2008, respectively.
For the year ended December 31, 2008, total time deposits include brokered time deposits obtained from the national market. During 2008, these deposits averaged $3,285,000 but were repaid by year-end and not replaced during 2009 or 2010. The rates of interest paid on time deposits obtained from the national market averaged 4.75% during 2008.
(8) Short-Term Borrowings
Short-term borrowings at December 31, 2010 are primarily comprised of secured overnight Federal Home Loan Bank (FHLB) borrowings. The Bank maintains unsecured lines of credit with Atlantic Central Bankers Bank and First Tennessee Bank. The Bank has access to a primary credit line with the Federal Reserve Discount Window (“FED”) which is secured by securities held in trust. The maximum borrowing capacity at FED was $4.0 million as of both December 31, 2010 and 2009.The Bank, as a member of the FHLB, has access to a line of credit program with a maximum borrowing capacity of $40.5 million and $40.7 million as of December 31, 2010 and 2009, respectively. There were $9.1 million in FHLB overnight borrowings at December 31, 2010 at a rate of 0.40%. At December 31, 2009, there were no
overnight borrowings. The Bank pledges mortgage loans and FHLB stock as collateral on these borrowings. During 2010, the maximum month-end balance was $9.1 million, the average balance was $0.9 million, and the average interest rate was 0.46%. During 2009, the maximum month-end balance was $1.2 million, the average balance was $0.5 million, and the average interest rate was 0.50%. Short-term borrowings at December 31, 2010 and 2009 also included demand notes of $400,000 and $212,000, respectively.
(9) Federal Home Loan Bank Borrowings
The following is a summary of FHLB securities sold under agreements to repurchase, by maturity date at December 31 (dollars in thousands):
|
2010
|
2009
|
|||||||||||||||
|
FHLB Maturities
|
Amount
|
Rate
|
Amount
|
Rate
|
||||||||||||
|
Maturing in 2012
|
$ | 5,000 | 3.79 | % | $ | 5,000 | 3.79 | % | ||||||||
|
Maturing in 2013
|
10,000 | 4.14 | 10,000 | 4.14 | ||||||||||||
| $ | 15,000 | 4.02 | % | $ | 15,000 | 4.02 | % | |||||||||
Borrowings are secured by the Bank’s investment in FHLB stock and by a blanket security agreement. This agreement requires the Bank to maintain as collateral certain qualifying assets (principally residential mortgage loans) not otherwise pledged. The carrying value of the total qualifying residential mortgage loan and security collateral at December 31, 2010 and 2009 was $55.5 million and $50.4 million respectively, which satisfied the collateral requirements of the FHLB.
(10) Income Taxes
Income taxes for the years ended December 31 consisted of the following (in thousands):
|
Income Tax Expense (Benefit)
|
2010
|
2009
|
2008
|
|||||||||
|
Current:
|
||||||||||||
|
Federal
|
$ | 559 | $ | (791 | ) | $ | 1,135 | |||||
|
State
|
60 | 57 | 57 | |||||||||
|
Deferred
|
(337 | ) | 1,417 | (2,053 | ) | |||||||
| $ | 282 | $ | 683 | $ | (861 | ) | ||||||
The current federal tax benefit for the year ended December 31, 2009 was the result of a net operating loss (NOL) income tax carryback and carryover arose primarily due to the loss on the sale of Federal Home Loan Mortgage Corporation (FHLMC or “Freddie Mac”) preferred stock.
51
Items creating the differences between income tax expense and taxes computed by applying the statutory Federal tax rate of 34% to income before income taxes are as follows (dollars in thousands):
|
Income Tax
|
2010
|
2009
|
2008
|
|||||||||||||||||||||
|
Expense (Benefit)
|
Amount
|
%(1) |
Amount
|
%(1) |
Amount
|
%(1) | ||||||||||||||||||
|
Tax at statutory rate
|
$ | 1,160 | 34 | % | $ | 1,281 | 34 | % | $ | 626 | 34 | % | ||||||||||||
|
State taxes, net of Federal tax benefit
|
32 | 1 | 192 | 5 | (211 | ) | (11 | ) | ||||||||||||||||
|
Tax-exempt interest and dividends
|
(780 | ) | (23 | ) | (670 | ) | (18 | ) | (570 | ) | (31 | ) | ||||||||||||
|
Interest expense allocated to tax-exempt securities
|
42 | 1 | 44 | 1 | 53 | 3 | ||||||||||||||||||
|
Bank-owned life insurance
|
(160 | ) | (5 | ) | (168 | ) | (4 | ) | (697 | ) | (38 | ) | ||||||||||||
|
Other adjustments
|
(12 | ) | (0 | ) | 4 | (0 | ) | (62 | ) | (4 | ) | |||||||||||||
|
Income tax expense (benefit)
|
$ | 282 | 8 | % | $ | 683 | 18 | % | $ | (861 | ) | (47 | )% | |||||||||||
(1) Percentage is of pre-tax income
The tax effects of temporary differences that give rise to deferred tax assets and liabilities at December 31 are presented below (in thousands):
|
Deferred Tax Asset, Net
|
2010
|
2009
|
||||||
|
Deferred tax assets:
|
||||||||
|
Allowance for loan losses in excess of tax bad debt reserve
|
$ | 1,442 | $ | 1,395 | ||||
|
Impairment charge on securities
|
— | 51 | ||||||
|
Retirement benefits
|
2,140 | 1,907 | ||||||
|
Deferred compensation
|
— | 58 | ||||||
|
NOL and tax credit carryover
|
620 | 353 | ||||||
|
Depreciation
|
370 | 444 | ||||||
|
Other
|
— | 9 | ||||||
|
Total deferred tax assets
|
4,572 | 4,217 | ||||||
|
Deferred tax liabilities:
|
||||||||
|
Prepaid expenses
|
(185 | ) | (187 | ) | ||||
|
Other
|
(20 | ) | — | |||||
|
Total deferred tax liabilities
|
(205 | ) | (187 | ) | ||||
|
Net deferred tax asset (included in other assets)
|
$ | 4,367 | $ | 4,030 | ||||
In addition to the preceding table, the Company had the following deferred tax assets and liabilities in accumulated other comprehensive income (loss) at December 31 (in thousands):
|
Deferred Tax Asset, Net
|
||||||||
|
In Accumulated Other Comprehensive Income (Loss)
|
2010
|
2009
|
||||||
|
Deferred tax assets:
|
||||||||
|
Pension benefits
|
$ | 1,151 | $ | 1,573 | ||||
|
Other retirement benefits
|
306 | 334 | ||||||
|
Total deferred tax assets
|
1,457 | 1,907 | ||||||
|
Deferred tax liabilities:
|
||||||||
|
Post retirement benefits
|
(946 | ) | (51 | ) | ||||
|
Unrealized gain on securities available for sale
|
(802 | ) | (877 | ) | ||||
|
Total deferred tax liabilities
|
(1,748 | ) | (928 | ) | ||||
|
Net deferred tax asset (liability)
|
$ | (291 | ) | $ | 979 | |||
In assessing the ability to realize the Company’s total deferred tax assets, management considers whether it is more likely than not that some portion or all of those assets will not be realized. Based upon management’s consideration of historical and anticipated future pre-tax income, as well as the reversal period for the items giving rise to the deferred tax assets and liabilities, a valuation allowance for deferred tax assets was not considered necessary at December 31, 2010 and 2009.
52
The Company’s deferred tax asset includes a net operating loss (NOL) carry forward of $620,000 of which all expires in 2028 if not utilized. The Company anticipates fully utilizing its NOL prior to its statutory expiration date, as a result no valuation allowance was recorded as of December 31, 2010 or 2009. No unrecognized tax benefits are expected to arise within the next twelve months. The Company recognizes penalties in income expense for all periods presented. Amounts included in expense for the years ended 2008 through 2010 were not material. The Company files income tax returns in the both the US Federal and New York State tax jurisdictions. Generally, the Company is no longer subject to examination by the US Federal and NYS taxing authorities for years before 2007.
(11) Other Non-Interest Expenses
The major components of other non-interest expenses are as follows for the years ended December 31 (in thousands):
|
Other Non-Interest Expense
|
2010
|
2009
|
2008
|
|||||||||
|
Stationery and supplies
|
$ | 301 | $ | 235 | $ | 285 | ||||||
|
Advertising expense
|
268 | 251 | 247 | |||||||||
|
Director expenses
|
228 | 239 | 239 | |||||||||
|
Merchant ATM and interchange fees
|
438 | 436 | 532 | |||||||||
|
Professional services
|
520 | 561 | 824 | |||||||||
|
FDIC assessments
|
682 | 800 | 179 | |||||||||
|
Pre-foreclosure expense
|
347 | 76 | 28 | |||||||||
|
Other expenses
|
1,337 | 1,298 | 1,195 | |||||||||
| $ | 4,121 | $ | 3,896 | $ | 3,529 | |||||||
(12) Regulatory Capital Requirements
National banks are required to maintain minimum levels of regulatory capital in accordance with regulations of the Office of the Comptroller of the Currency (OCC). The OCC regulations require a minimum leverage ratio of Tier I capital to total adjusted assets of 4.0%, and minimum ratios of Tier I and total capital to risk-weighted assets of 4.0% and 8.0%, respectively.
Under its prompt corrective action regulations, the OCC is required to take certain supervisory actions (and may take additional discretionary actions) with respect to an undercapitalized bank. Such actions could have a direct material effect on a company’s financial statements. The regulations establish a framework for the classification of banks into five categories: well capitalized, adequately capitalized, undercapitalized, significantly undercapitalized, and critically undercapitalized. Generally, a bank is considered well capitalized if it has a leverage (Tier I) capital ratio of at least 5.0%, a Tier I risk-based capital ratio of at least 6.0%, and a total risk-based capital ratio of at least 10.0%.
The foregoing capital ratios are based in part on specific quantitative measures of assets, liabilities and certain off-balance-sheet items as calculated under regulatory accounting practices. Capital amounts and classifications are also subject to qualitative judgments by the regulators about capital components, risk weightings and other factors.
Management believes that, as of December 31, 2010 and 2009, the Bank met all capital adequacy requirements to which it is subject. Further, the most recent OCC notification categorized the Bank as a well-capitalized bank under the prompt corrective action regulations. There have been no conditions or events since that notification that management believes have changed the Bank’s capital classification.
53
The following is a summary of the actual capital amounts and ratios as of December 31, 2010 and 2009 for the Bank compared to the required ratios for minimum capital adequacy and for classification as well-capitalized (dollars in thousands):
|
Actual
|
Required Ratios | |||||||||||||||
|
Minimum
|
Well
|
|||||||||||||||
|
Regulatory
|
|
|
capital
|
Capit-
|
||||||||||||
|
Capital
|
Amount
|
Ratio
|
adequacy | alized | ||||||||||||
|
December 31, 2010:
|
||||||||||||||||
|
Leverage (Tier I) capital
|
$ | 44,786 | 10.4 | % | 4.0 | % | 5.0 | % | ||||||||
|
Risk-based capital:
|
||||||||||||||||
|
Tier I
|
44,786 | 15.7 | 4.0 | 6.0 | ||||||||||||
|
Total
|
48,356 | 17.0 | 8.0 | 10.0 | ||||||||||||
|
December 31, 2009:
|
||||||||||||||||
|
Leverage (Tier I) capital
|
$ | 43,986 | 10.5 | % | 4.0 | % | 5.0 | % | ||||||||
|
Risk-based capital:
|
||||||||||||||||
|
Tier I
|
43,986 | 15.4 | 4.0 | 6.0 | ||||||||||||
|
Total
|
47,566 | 16.6 | 8.0 | 10.0 | ||||||||||||
Jeffersonville Bancorp is a small bank holding company, and is exempt from regulatory capital requirements administered by the federal banking agencies.
(13) Stockholders’ Equity
Dividend Restrictions
Dividends paid by the Bank are the primary source of funds available to the Parent Company for payment of dividends to its stockholders and for other working capital needs. Applicable Federal statutes, regulations and guidelines impose restrictions on the amount of dividends that may be declared by the Bank. Under these restrictions, the dividends declared and paid by the Bank to the Parent Company may not exceed the total amount of the Bank’s net profit retained in the current year plus its retained net profits, as defined, from the two preceding years. The Bank’s retained net profits available for dividends at December 31, 2010 totaled $2,189,000.
(14) Comprehensive Income (Loss)
Comprehensive income (loss) represents the sum of net income and items of “other comprehensive income (loss)” which are reported directly in stockholders’ equity, such as the net unrealized gain or loss on securities available for sale and unrecognized deferred costs of the Company’s defined benefit pension plan, other postretirement benefits plan, and the supplemental retirement plans. The Company has reported its comprehensive income (loss) for 2010, 2009, and 2008 in the consolidated statements of changes in stockholders’ equity.
The Company’s other comprehensive income (loss) consisted of the following components for the years ended December 31 (in thousands):
|
Other Comprehensive Income (Loss), Net of Tax
|
2010
|
2009
|
2008
|
|||||||||
|
Securities available for sale:
|
||||||||||||
|
Net unrealized holding gains (losses) arising during the year
|
$ | (91 | ) | $ | 1,396 | $ | (4,515 | ) | ||||
|
Reclassification adjustment for net realized gains included in income
|
(98 | ) | (544 | ) | (64 | ) | ||||||
|
Reclassification adjustment for impairment charges included in income
|
— | — | 5,162 | |||||||||
|
Amortization of pension and post retirement liabilities’ gains and losses
|
3,365 | 1,012 | (3,152 | ) | ||||||||
|
Other comprehensive income (loss), before tax
|
3,176 | 1,864 | (2,569 | ) | ||||||||
|
Income tax benefit (expense) related to other comprehensive income (loss)
|
(1,270 | ) | (745 | ) | 1,028 | |||||||
| $ | 1,906 | $ | 1,119 | $ | (1,541 | ) | ||||||
54
At December 31, 2010 and 2009, the components of accumulated other comprehensive income (loss) are as follows (in thousands):
|
Accumulated Other Comprehensive Income (Loss), Net of Tax
|
2010
|
2009
|
||||||
|
Supplemental executive retirement plan
|
$ | (765 | ) | $ | (834 | ) | ||
|
Postretirement benefits
|
2,365 | 126 | ||||||
|
Defined benefit pension liability
|
(2,876 | ) | (3,933 | ) | ||||
|
Net unrealized holding gains (losses) on securities available for sale
|
2,005 | 2,194 | ||||||
|
Accumulated other comprehensive income (loss), before tax
|
729 | (2,447 | ) | |||||
|
Income tax benefit (expense) related to accumulated other comprehensive loss
|
(291 | ) | 979 | |||||
| $ | 438 | $ | (1,468 | ) | ||||
(15) Related Party Transactions
Certain directors and executive officers of the Company, as well as certain affiliates of these directors and officers, have engaged in loan transactions with the Company. Such loans were made in the ordinary course of business at the Company’s normal terms, including interest rates and collateral requirements, and do not represent more than normal risk of collection. Outstanding loans to these related parties are summarized as follows at December 31 (in thousands):
|
Related Party Transactions
|
2010
|
2009
|
||||||
|
Directors
|
$ | 2,854 | $ | 2,820 | ||||
|
Executive officers (non-directors)
|
398 | 416 | ||||||
| $ | 3,251 | $ | 3,236 | |||||
During 2010, total advances to these directors and officers were $527,000, and total payments made on these loans were $512,000. Directors and officers had unused lines of credit with the Company of $555,000 and $535,000 at December 31, 2010 and 2009, respectively.
(16) Employee Benefit Plans
Pension and Other Postretirement Benefits
The Company has a noncontributory defined benefit pension plan covering substantially all of its employees. The plan was amended on December 31, 2010. The amendment reduced the percentage amount credited for future accruals toward normal retirement. In addition, the amendment decreased benefits payable on early retirement by changing from a flat rate formula to an actuarial equivalent for future accruals. The impact of the amendment was to reduce the pension liability by $1.6 million and reduced other comprehensive income, net of tax by $1.0 million. The Company’s funding policy is to contribute annually an amount sufficient to satisfy the minimum funding requirements of the Employee Retirement Income Security Act, but not greater than the maximum amount that can be deducted for Federal income tax purposes.
Contributions are intended to provide not only for benefits attributed to service to date, but also for benefits expected to be earned in the future.
The Company also sponsors a postretirement medical, dental and life insurance benefit plan for retirees in the pension plan. Employees attaining age 55 or later, and whose age plus service is greater than or equal to 85 are eligible for medical benefits. The plan is unfunded. The Company accounts for the cost of these postretirement benefits in accordance with ASC 715 Compensation - Retirement Benefits. Accordingly, the cost of these benefits is recognized on an accrual basis as employees perform services to earn the benefits. During 2010, the plan was amended to reduce benefits payable under the plan for both active and retired employees from a variable percentage of individual, and family group health plans to a reduced percentage of the lowest cost
individual group health plan. The plan was closed to new employees. The benefit payable will be fixed at retirement for active employees, and the current benefit was frozen for retired employees. The impact of the amendment was to reduce the postretirement liability by $2.0 million and reduced other comprehensive income, net of tax by $1.2 million.
In December 2004, the Medicare Prescription Drug, Improvement and Modernization Act of 2004 (Medicare Act) was signed into law. The Medicare Act introduced both a Medicare prescription-drug benefit and a federal subsidy to sponsors of retiree health-care plans that provide a benefit at least “actuarially equivalent” to the Medicare benefit. These provisions of the Medicare Act will affect accounting measurements under ASC 715. Accordingly, the FASB staff has issued guidance allowing companies to recognize or defer recognizing the effects of the Medicare Act in annual financial statements for fiscal years ending after enactment of the Medicare Act. The Company has elected to defer recognizing the effects of the Medicare Act in its December 31, 2010 and 2009 consolidated financial statements.
Accordingly, the reported measures of the accumulated postretirement benefit obligation and net periodic postretirement benefit cost do not include the effects of the Medicare Act. When issued, the specific authoritative literature on accounting for the federal subsidy could require the Company to revise its previously reported information.
55
The Company expects to contribute $750,000 to its pension plan and $86,000 to its other postretirement benefit plan in 2011. The Company’s minimum required pension contribution for 2011 is $474,000. Benefits, which reflect estimated future employee service, are expected to be paid as follows (in thousands):
|
Pension
|
Postretirement
|
|||||||
|
Estimated Future Benefits
|
benefit
|
benefit
|
||||||
|
2011
|
$ | 596 | $ | 175 | ||||
|
2012
|
628 | 187 | ||||||
|
2013
|
651 | 192 | ||||||
|
2014
|
660 | 212 | ||||||
|
2015
|
671 | 214 | ||||||
|
Years 2016-2020
|
3,426 | 1,110 | ||||||
The following is a summary of changes in the benefit obligations and plan assets for the pension plan and postretirement benefit plans for the years ended December 31, 2009 and 2010 measurement dates, together with a reconciliation of each plan’s funded status to the amounts recognized in the consolidated balance sheets. The expense related to the change in the benefit obligation totaled $82,000 and was included in net periodic pension cost for the year ended December 31, 2009 (in thousands).
|
Changes in Benefit Obligations, Plan Assets and Funded Status
|
Pension benefit
|
Postretirement benefit
|
||||||||||||||
|
As of the Measurement Date, December 31,
|
2010
|
2009
|
2010
|
2009
|
||||||||||||
|
Change in benefit obligation:
|
||||||||||||||||
|
Beginning of year
|
$ | 10,288 | $ | 10,410 | $ | 3,706 | $ | 3,656 | ||||||||
|
Service cost
|
435 | 454 | 148 | 162 | ||||||||||||
|
Interest cost
|
587 | 568 | 209 | 207 | ||||||||||||
|
Actuarial (gain) loss
|
1,169 | (586 | ) | (361 | ) | (254 | ) | |||||||||
|
Benefits paid
|
(628 | ) | (558 | ) | (103 | ) | (96 | ) | ||||||||
|
Adjustment for plan amendments
|
(1,639 | ) | — | (1,920 | ) | — | ||||||||||
|
Contributions by plan participants
|
— | — | 33 | 31 | ||||||||||||
|
End of year
|
10,212 | 10,288 | 1,712 | 3,706 | ||||||||||||
|
Changes in fair value of plan assets:
|
||||||||||||||||
|
Beginning of year
|
7,439 | 5,285 | — | — | ||||||||||||
|
Actual return on plan assets
|
812 | 672 | — | — | ||||||||||||
|
Employer contributions
|
750 | 2,096 | 69 | 65 | ||||||||||||
|
Contributions by plan participants
|
— | — | 33 | 31 | ||||||||||||
|
Benefits paid
|
(617 | ) | (614 | ) | (102 | ) | (96 | ) | ||||||||
|
End of year
|
8,384 | 7,439 | — | — | ||||||||||||
|
Unfunded status at end of year, recognized in Other liabilities on the balance sheet
|
$ | (1,828 | ) | $ | (2,849 | ) | $ | (1,712 | ) | $ | (3,706 | ) | ||||
|
Amounts recognized in accumulated other comprehensive income (loss) consists of:
|
||||||||||||||||
|
Unrecognized actuarial gain (loss)
|
$ | (2,876 | ) | $ | (3,826 | ) | $ | (46 | ) | $ | (410 | |||||
|
Unrecognized prior service (cost) credit
|
— | (107 | ) | 2,411 | 536 | |||||||||||
|
Net amount recognized
|
$ | (2,876 | ) | $ | (3,933 | ) | $ | 2,365 | $ | 126 | ||||||
The accumulated benefit obligation for the pension plan was $10,026,000 and $9,347,000 at December 31, 2010 and 2009, respectively.
56
The components of the net periodic benefit cost for the years ended December 31, for these plans were as follows (in thousands):
|
Net Periodic Benefit Cost
|
Pension benefit
|
Postretirement benefit
|
||||||||||||||||||||||
|
For the year ended December 31,
|
2010
|
2009
|
2008
|
2010
|
2009
|
2008
|
||||||||||||||||||
|
Net periodic benefit cost:
|
||||||||||||||||||||||||
|
Service cost
|
$ | 435 | $ | 454 | $ | 372 | $ | 148 | $ | 162 | $ | 147 | ||||||||||||
|
Interest cost
|
587 | 568 | 557 | 209 | 207 | 183 | ||||||||||||||||||
|
Expected return on plan assets
|
(536 | ) | (406 | ) | (511 | ) | — | — | — | |||||||||||||||
|
Amortization of prior service cost
|
25 | 24 | 25 | (45 | ) | (45 | ) | (45 | ) | |||||||||||||||
|
Curtailment gain
|
83 | — | — | — | — | — | ||||||||||||||||||
|
Recognized net actuarial loss
|
192 | 232 | 80 | 2 | 15 | 12 | ||||||||||||||||||
|
Net amount recognized
|
$ | 786 | $ | 872 | $ | 523 | $ | 314 | $ | 339 | $ | 297 | ||||||||||||
The estimated net loss for the defined benefit pension plan that will be amortized from accumulated other comprehensive loss into net periodic benefit cost over the next fiscal year is $138,000. The estimated prior service cost for the postretirement plan that will be amortized from accumulated other comprehensive income (loss) into net periodic benefit credit over the next fiscal year is $158,000.
Assumptions used to determine benefit obligations for the pension plan and for the other postretirement benefits plan as of a December 31 measurement date were as follows:
|
Pension
|
Postretirement
|
|||||||||||||||
|
Benefit Obligation
|
benefits
|
benefits
|
||||||||||||||
|
Assumptions
|
2010
|
2009
|
2010
|
2009
|
||||||||||||
|
Discount rate
|
5.68 | % | 5.87 | % | 5.68 | % | 5.75 | % | ||||||||
|
Rate of compensation increase
|
3.00 | 3.00 | — | — | ||||||||||||
Assumptions used to determine net periodic benefit cost were as follows:
|
Pension
|
Postretirement
|
|||||||||||||||
|
Net Periodic Benefit
|
benefits
|
benefits
|
||||||||||||||
|
Cost Assumptions
|
2010
|
2009
|
2010
|
2009
|
||||||||||||
|
Discount rate
|
5.87 | % | 5.75 | % | 5.75 | % | 5.75 | % | ||||||||
|
Expected long-term rate of return on plan assets
|
7.50 | 7.50 | — | — | ||||||||||||
|
Rate of compensation increase
|
3.00 | 5.00 | — | — | ||||||||||||
The Company’s expected long-term rate of return on plan assets reflects long-term earnings expectations and was determined based on historical returns earned by existing plan assets adjusted to reflect expectations of future returns as applied to plan’s targeted allocation of assets.
The assumed health care cost trend rate for retirees which was used to determine the benefit obligation for the other postretirement benefits plan at December 31, 2010 was 7.0%, declining gradually to 4.0% in 2014 and remaining at that level thereafter. Age adjusted factors were applied to under age 65 retiree medical costs in addition to the trend rates. Increasing the assumed health care cost trend rates by one percentage point in each year would increase the benefit obligation at December 31, 2010 by approximately $153,000 and the net periodic benefit cost for the year by approximately $90,000; a one percentage point decrease would decrease the benefit obligation and benefit cost by approximately $125,000 and $66,000, respectively.
The Company’s pension plan asset allocation at December 31, by asset category is as follows:
|
Pension Plan Asset Allocation
|
2010
|
2009
|
||||||
|
Asset category:
|
||||||||
|
Equity securities
|
55 | % | 47 | % | ||||
|
Debt securities
|
40 | 27 | ||||||
|
Other
|
5 | 26 | ||||||
57
The following table presents pension plan assets measured at fair value on a recurring basis by their level within the fair value hierarchy as of December 31, 2010 and 2009, dollars in thousands. Financial assets are classified based on the lowest level of input that is significant to their fair value measurement.
|
(Level 1)
|
||||||||||||||||
|
Quoted
|
||||||||||||||||
|
Prices in
|
(Level 2)
|
|||||||||||||||
|
Active
|
Significant
|
(Level 3)
|
||||||||||||||
|
Markets for
|
Other
|
Significant
|
||||||||||||||
|
Fair Value Hierarchy
|
Identical
|
Observable
|
Unobservable
|
|||||||||||||
|
For Pension Plan Assets
|
Total
|
Assets
|
Inputs
|
Inputs
|
||||||||||||
|
Asset category as of December 31, 2010:
|
||||||||||||||||
|
Cash and cash equivalents
|
$ | 405 | $ | 405 | $ | — | $ | — | ||||||||
|
Bonds:
|
||||||||||||||||
|
U.S. Government Agency
|
806 | — | 806 | — | ||||||||||||
|
Municipal
|
683 | — | 683 | — | ||||||||||||
|
U.S. corporate
|
301 | — | 301 | — | ||||||||||||
|
Foreign corporate
|
202 | — | 202 | — | ||||||||||||
|
Equity securities:
|
||||||||||||||||
|
U.S. companies
|
3,168 | 3,168 | — | — | ||||||||||||
|
International companies
|
27 | 27 | — | — | ||||||||||||
|
Real Estate Investment Trusts
|
41 | 41 | — | — | ||||||||||||
|
Mutual funds:
|
||||||||||||||||
|
U.S. companies
|
916 | 916 | — | — | ||||||||||||
|
International companies
|
470 | 470 | — | — | ||||||||||||
|
Fixed income
|
1,365 | 1,365 | — | — | ||||||||||||
| $ | 8,384 | $ | 6,392 | $ | 1,992 | $ | — | |||||||||
|
Asset category as of December 31, 2009:
|
||||||||||||||||
|
Cash and cash equivalents
|
$ | 1,937 | $ | 1,937 | $ | — | $ | — | ||||||||
|
Municipal bonds
|
292 | — | 292 | — | ||||||||||||
|
Equity securities:
|
||||||||||||||||
|
U.S. companies
|
1,232 | 1,232 | — | — | ||||||||||||
|
International companies
|
14 | 14 | — | — | ||||||||||||
|
Mutual funds:
|
||||||||||||||||
|
U.S. companies
|
377 | 377 | — | — | ||||||||||||
|
International companies
|
536 | 536 | — | — | ||||||||||||
|
Common funds:
|
||||||||||||||||
|
Equity (a)
|
1,366 | — | 1,366 | — | ||||||||||||
|
Fixed income (b)
|
1,685 | — | 1,685 | — | ||||||||||||
| $ | 7,439 | $ | 4,096 | $ | 3,343 | $ | — | |||||||||
|
(a)
|
This class comprises low-cost equity index funds not actively managed that track the S&P 500 Index, the S&P Midcap Index, the Russell 2000 Index and the Morgan Stanley Capital International EAFE Index.
|
|
(b)
|
This class comprises low-cost fixed income index funds not actively managed that track the Barclays Capital Mortgage-Backed Securities Index, the Barclays Capital Intermediate Government Credit Bond Index and the Barclays Capital U.S. Treasury Inflation Protected Securities (TIPS) Index.
|
58
During 2009, the Company changed pension providers and established a Funding Agreement with RBS Citizens, NA (Citizens) to act as the Funding Agent of the assets of the Plan. Citizens has been given discretion by the Company to determine the appropriate strategic asset allocation as governed by the Company’s Investment Policy Statement and Guidelines which provides specific targeted asset allocations for each investment category as follows:
|
Asset Allocation Targets
|
Allocation Range
|
|||
|
Large Cap Domestic Equity
|
30% - 40 | % | ||
|
Mid Cap Domestic Equity
|
5% - 15 | % | ||
|
Small Cap Domestic Equity
|
0% - 10 | % | ||
|
International Equity
|
5% - 20 | % | ||
|
Real Estate
|
0% - 10 | % | ||
|
Core Investment Grade Bonds
|
15% - 30 | % | ||
|
Mortgages
|
0% - 15 | % | ||
|
Money Market
|
0% - 10 | % | ||
The actual asset allocations at December 31, 2010 were over-weighted toward money market investments due to the change in pension providers and progress toward meeting the allocations in the table above is ongoing.
Directors Survival Insurance
The Company maintains a separate insurance program for Directors not insurable under the postretirement plan. The benefits accrued under this plan totaled $102,000 at December 31, 2010 and $150,000 at December 31, 2009 and are unfunded. The Company recorded an expense of $8,000, $62,000 and $13,000 relating to this plan during the years ended December 31, 2010, 2009 and 2008, respectively.
Profit Incentive Program
The Company maintains a profit incentive program for all employees. The benefits accrued under this plan totaled $35,000 at December 31, 2009 and are unfunded. There was no accrued benefit at December 31, 2010. The Company recorded an expense of $174,000, $419,000 and $427,000 relating to this plan during the years ended December 31, 2010, 2009 and 2008, respectively.
Tax-Deferred Savings Plan
The Company maintains a qualified 401(k) plan for all employees, which permits tax-deferred employee contributions up to the greater of 75% of salary or the maximum allowed by law and provides for matching contributions by the Company. The Company matches 100% of employee contributions up to 4% of the employee’s salary and 25% of the next 2% of the employee’s salary. The Company incurred annual expenses of $192,000, $173,000 and $160,000 in 2010, 2009 and 2008, respectively.
Supplemental Executive Retirement Plan
The Company maintains a Supplemental Executive Retirement Plan for certain executive officers primarily to restore benefits reduction in certain employee benefit plans due to Internal Revenue Service regulations. The benefits accrued under this plan totaled $2,194,000 at December 31, 2010 and $2,058,000 at December 31, 2009 and are unfunded. The Company recorded an expense of $311,000, $314,000 and $152,000 relating to this plan during the years ended December 31, 2010, 2009 and 2008, respectively.
Director Retirement Plan
In 2003, the Company established a Director Retirement Plan in order to provide certain retirement benefits to participating directors. Generally, each participating director receives an annual retirement benefit of eighty percent of their average annual cash compensation during the three calendar years preceding their retirement date, as defined in the plan. This annual retirement benefit is payable until death and may not exceed $40,000 per year. The plan was amended in 2010 to change the calculation of benefits for normal and early retirement from strictly age based to a combination of age and years of service. The effect of the amendment was to reduce penalties for retirement before age 75 if years of service criteria are met. The benefits accrued under this plan totaled $656,000 and $666,000 at
December 31, 2010 and 2009, respectively, and are unfunded. The Company recorded an expense of $41,000, $59,000 and $74,000 relating to this plan during the years ended December 31, 2010, 2009 and 2008, respectively.
(17) Commitments and Contingent Liabilities
Legal Proceedings
The Company and the Bank are, from time to time, defendants in legal proceedings relating to the conduct of their business. In the best judgment of management, the consolidated financial position and results of operations of the Company will not be affected materially by the outcome of any pending legal proceedings.
59
Off-Balance-Sheet Financial Instruments
The Company is a party to certain financial instruments with off-balance-sheet risk in the normal course of business to meet the financing needs of its customers. These are limited to commitments to extend credit and standby letters of credit which involve, to varying degrees, elements of credit risk in excess of the amounts recognized in the consolidated balance sheets. The contract amounts of these instruments reflect the extent of the Company’s involvement in particular classes of financial instruments.
The Company’s maximum exposure to credit loss in the event of nonperformance by the other party to these instruments represents the contract amounts, assuming that they are fully funded at a later date and any collateral proves to be worthless. The Company uses the same credit policies in making commitments as it does for on-balance-sheet extensions of credit.
Contractual amounts of financial instruments that represent agreements to extend credit are as follows at December 31 (in thousands):
|
Off-Balance Sheet
|
||||||||
|
Financial Instruments
|
2010
|
2009
|
||||||
|
Loan origination commitments and unused lines of credit:
|
||||||||
|
Commercial and residential mortgages
|
$ | 3,247 | $ | 6,197 | ||||
|
Commercial loans
|
21,486 | 21,422 | ||||||
|
Home equity lines
|
13,219 | 13,606 | ||||||
| 37,952 | 41,225 | |||||||
|
Standby letters of credit
|
570 | 858 | ||||||
| $ | 38,522 | $ | 42,083 | |||||
These agreements to extend credit have been granted to customers within the Company’s lending area described in note 5 and relate primarily to fixed-rate loans.
Loan origination commitments and lines of credit are agreements to lend to a customer as long as there is no violation of any condition established in the contract. These agreements generally have fixed expiration dates or other termination clauses and may require payment of a fee by the customer. Since commitments and lines of credit may expire without being fully drawn upon, the total contract amounts do not necessarily represent future cash requirements.
The Company evaluates each customer’s creditworthiness on a case-by-case basis. Mortgage commitments are secured by liens on real estate. Collateral on extensions of credit for commercial loans varies but may include accounts receivable, equipment, inventory, livestock, and income-producing commercial property.
The Company does not issue any guarantees that would require liability-recognition or disclosure, other than its standby letters of credit. The Company has issued conditional commitments in the form of standby letters of credit to guarantee payment on behalf of a customer and guarantee the performance of a customer to a third party. Standby letters of credit generally arise in connection with lending relationships. The credit risk involved in issuing these instruments is essentially the same as that involved in extending loans to customers. Contingent obligations under standby letters of credit totaled $570,000 and $858,000 at December 31, 2010 and 2009, respectively, and represent the maximum potential future payments the Company could be required to make. Typically, these instruments have terms of twelve
months or less and expire unused; therefore, the total amounts do not necessarily represent future cash requirements. Each customer is evaluated individually for creditworthiness under the same underwriting standards used for commitments to extend credit and on-balance-sheet instruments. Company policies governing loan collateral apply to standby letters of credit at the time of credit extension. Loan-to-value ratios are generally consistent with loan-to-value requirements for other commercial loans secured by similar types of collateral. The fair value of the Company’s standby letters of credit at December 31, 2010 and 2009 was not significant.
(18) Fair Values of Financial Instruments
The Company follows ASC Topic 820 Fair Value Measurements and Disclosures (ASC 820), which provides a framework for measuring and disclosing fair value under generally accepted accounting principles. ASC 820 requires disclosures about the fair value of assets and liabilities recognized in the consolidated balance sheet in periods subsequent to initial recognition, whether the measurements are made on a recurring basis (for example, available-for-sale investment securities) or on a nonrecurring basis (for example, impaired loans).
60
ASC 820 defines fair value as the exchange price that would be received for an asset or paid to transfer a liability (an exit price) in the principal or most advantageous market for the asset or liability in an orderly transaction between market participants on the measurement date. ASC 820 also establishes a fair value hierarchy which requires an entity to maximize the use of observable inputs and minimize the use of unobservable inputs when measuring fair value. The standard established a fair value hierarchy that prioritizes the inputs to valuation methods used to measure fair value. The hierarchy gives the highest priority to unadjusted quoted prices in active markets for identical assets or liabilities (Level 1 measurements) and the lowest priority to unobservable inputs (Level 3 measurements). The
three levels of the fair value hierarchy are as follows:
|
Level 1:
|
Unadjusted quoted prices in active markets that are accessible at the measurement date for identical, unrestricted assets or liabilities. Since valuations are based on quoted prices that are readily and regularly available in an active market, valuation of these products does not entail a significant degree of judgment.
|
|
Level 2:
|
Quoted prices in markets that are not active, or inputs that are observable either directly or indirectly, for substantially the full term of the asset or liability.
|
|
Level 3:
|
Prices or valuation techniques that require inputs that are both significant to the fair value measurement and unobservable (i.e., supported with little or no market activity).
|
In instances where inputs used to measure fair value fall into different levels in the above fair value hierarchy, an asset’s or liability’s level is based on the lowest level of input that is significant to the fair value measurement.
For assets measured at fair value on a recurring and non-recurring basis, the fair value measurements by level within the fair value hierarchy used at December 31, 2010 and 2009, respectively are as follows (in thousands):
|
(Level 1)
|
||||||||||||||||
|
Quoted
|
||||||||||||||||
|
Prices in
|
(Level 2)
|
|||||||||||||||
|
Active
|
Significant
|
(Level 3)
|
||||||||||||||
|
Fair Value Hierarchy
|
Markets for
|
Other
|
Significant
|
|||||||||||||
|
For Assets Valued on a
|
Identical
|
Observable
|
Unobservable
|
|||||||||||||
|
Recurring and Non-recurring Basis
|
Total
|
Assets
|
Inputs
|
Inputs
|
||||||||||||
|
December 31, 2010:
|
||||||||||||||||
|
Recurring:
|
||||||||||||||||
|
Available for sale securities
|
||||||||||||||||
|
Government sponsored enterprises (GSE) (a)
|
$ | 8,587 | $ | — | $ | 8,587 | $ | — | ||||||||
|
Obligations of state and political subdivisions – New York state (a)
|
57,663 | — | 57,663 | — | ||||||||||||
|
Mortgage backed securities and collateralized mortgage obligations – GSE residential (a)
|
33,211 | — | 33,211 | — | ||||||||||||
|
Corporate Debt – financial services industry
|
4,567 | — | 4,567 | — | ||||||||||||
|
Certificates of deposit – financial services industry
|
98 | 98 | — | — | ||||||||||||
|
Equity securities – financial services industry
|
542 | 542 | — | — | ||||||||||||
| $ | 104,668 | $ | 640 | $ | 104,028 | $ | — | |||||||||
|
Non-recurring:
|
||||||||||||||||
|
Foreclosed real estate
|
$ | 40 | $ | — | $ | — | $ | 40 | ||||||||
|
Impaired loans
|
2,978 | — | — | 2,978 | ||||||||||||
| $ | 3,018 | $ | — | $ | — | $ | 3,018 | |||||||||
61
|
(Level 1)
|
||||||||||||||||
|
Quoted
|
||||||||||||||||
|
Prices in
|
(Level 2)
|
|||||||||||||||
|
Active
|
Significant
|
(Level 3)
|
||||||||||||||
|
Fair Value Hierarchy
|
Markets for
|
Other
|
Significant
|
|||||||||||||
|
For Assets Valued on a
|
Identical
|
Observable
|
Unobservable
|
|||||||||||||
|
Recurring and Non-recurring Basis (Continued)
|
Total
|
Assets
|
Inputs
|
Inputs
|
||||||||||||
|
December 31, 2009:
|
||||||||||||||||
|
Recurring:
|
||||||||||||||||
|
Available for sale securities
|
||||||||||||||||
|
Government sponsored enterprises (GSE) (a)
|
$ | 9,471 | $ | — | $ | 9,471 | $ | — | ||||||||
|
Obligations of state and political subdivisions – New York state (a)
|
50,180 | — | 50,180 | — | ||||||||||||
|
Mortgage backed securities and collateralized mortgage obligations – GSE residential (a)
|
29,510 | — | 29,510 | — | ||||||||||||
|
Corporate Debt – financial services industry
|
1,450 | — | 1,450 | — | ||||||||||||
|
Certificates of deposit – financial services industry
|
98 | 98 | — | — | ||||||||||||
|
Equity securities – financial services industry
|
611 | 570 | 41 | — | ||||||||||||
| $ | 91,320 | $ | 668 | $ | 90,652 | $ | — | |||||||||
|
Non-recurring:
|
||||||||||||||||
|
Impaired loans
|
$ | 2,728 | $ | — | $ | — | $ | 2,728 | ||||||||
(a) Based on its analysis of the nature and risks of these investments, the Company has determined that presenting them as a single class is appropriate.
There were no transfers of assets between Level 1 and Level 2 for recurring assets.
Foreclosed assets consist primarily of commercial real estate and are not revalued on a recurring basis. At the time of foreclosure, foreclosed real estate assets are adjusted to fair value less estimated costs to sell upon transfer of the loans, establishing a new cost basis. Occasionally, additional valuation adjustments are made based on updated appraisals and other factors and are recorded as recognized. At that time, they are reported in the Company’s fair value disclosures in the non-recurring table above.
ASC Topic 825 Financial Instruments (ASC 825) requires disclosure of fair value information about financial instruments whether or not recognized on the balance sheet, for which it is practicable to estimate fair value. Fair value estimates are made as of a specific point in time based on the characteristics of the financial instruments and the relevant market information. Where available, quoted market prices are used. In other cases, fair values are based on estimates using present value or other valuation techniques. These techniques involve uncertainties and are significantly affected by the assumptions used and the judgments made regarding risk characteristics of various financial instruments, discount rates, prepayments, estimates of future cash
flows, future expected loss experience and other factors. Changes in assumptions could significantly affect these estimates. Derived fair value estimates cannot be substantiated by comparison to independent markets and, in many cases, may or may not be realized in an immediate sale of the instrument.
Under ASC 825, fair value estimates are based on existing financial instruments without attempting to estimate the value of anticipated future business and the value of the assets and liabilities that are not financial instruments. Accordingly, the aggregate fair value amounts of existing financing instruments do not represent the underlying value of those instruments on the books of the Company.
The following information should not be interpreted as an estimate of the fair value of the entire Company since a fair value calculation is only provided for a limited portion of the Company’s assets and liabilities. Due to a wide range of valuation techniques and the degree of subjectivity used in making the estimates, comparisons between the Company’s disclosures and those of other companies may not be meaningful. The following methods and assumptions were used to estimate the fair values of the Company’s financial instruments at December 31, 2010 and 2009:
Cash and Cash Equivalents
The carrying amounts reported in the consolidated balance sheet for cash and short-term instruments approximate those assets’ fair values.
62
Securities
The fair value of securities available for sale (carried at fair value) and held to maturity (carried at amortized cost) are determined by obtaining quoted market prices on nationally recognized securities exchanges (Level 1), or matrix pricing (Level 2), which is a mathematical technique used widely in the industry to value debt securities without relying exclusively on quoted market prices for the specific securities but rather by relying on the securities’ relationship to other benchmark quoted prices. The carrying values for securities maturing within 90 days approximate fair values because there is little interest rate or credit risk associated with these instruments.
Loans
Fair values are estimated for portfolios of loans with similar financial characteristics. Loans are segregated by type such as commercial, consumer, real estate and other loans. Each loan category is further segregated into fixed and adjustable rate interest terms and by performing and nonperforming categories. The fair values of performing loans are calculated by discounting scheduled cash flows through estimated maturity using estimated market discount rates that reflect the credit and interest rate risks inherent in the loans. Estimated maturities are based on contractual terms and repricing opportunities.
Impaired Loans
Impaired loans, which are predominately commercial real estate loans where it is probable that the Bank will be unable to collect all amounts due per the contractual terms of the loan agreement, are those in which the Bank has measured impairment generally based on the fair value of the loan’s collateral. Fair value is generally determined based upon independent third-party appraisals of the properties, liquidation value or discounted cash flows based upon the expected proceeds. These assets are included as Level 3 fair values, based upon the lowest level of input that is significant to the fair value measurements. Impaired loans are transferred out of the Level 3 fair value hierarchy when payments reduce the outstanding loan balance below the fair value of the loan’s collateral or the loan is
foreclosed upon. If the financial condition of the borrower improves such that collectability of all contractual amounts due is probable, and payments are current for six months, the loan is transferred out of impaired status. As of December 31, 2010 and 2009, the fair values of collateral-dependent impaired loans were calculated using an outstanding balance of $3,809,000 and $3,590,000, less a valuation allowance of $831,000 and $862,000, respectively. Impaired loans not requiring an allowance represent loans for which the fair value of the expected repayments or collateral exceed the recorded investments in such loans.
Accrued Interest Receivable and Payable
The carrying amount of accrued interest receivable and accrued interest payable approximates its fair value.
Restricted Investments
The carrying amount of restricted investments approximates fair value and considers the limited marketability of such securities.
Deposit Liabilities
The fair values disclosed for demand deposits (e.g., interest and noninterest checking, passbook savings and money market accounts) are, by definition, equal to the amount payable on demand at the reporting date (i.e., their carrying amounts). Fair values for fixed-rate certificates of deposit are estimated using a discounted cash flow calculation that applies interest rates currently being offered in the market on certificates to a schedule of aggregated expected monthly maturities on time deposits.
Short-Term Debt
The carrying amounts of short-term debt approximate their fair values.
Federal Home Loan Bank Borrowings
Fair values of FHLB borrowings are estimated using discounted cash flow analysis, based on quoted prices for new FHLB borrowings with similar credit risk characteristics, terms and remaining maturity. These prices obtained from this active market represent a market value that is deemed to represent the transfer price if the liability were assumed by a third party.
Off-Balance-Sheet Financial Instruments
Fair values for the Bank’s off-balance-sheet financial instruments (lending commitments and letters of credit) are based on fees currently charged in the market to enter into similar agreements, taking into account the remaining terms of the agreements and the counterparties’ credit standing.
For fixed rate loan commitments, fair value estimates also consider the difference between current market interest rates and the committed rates. At December 31, 2010 and December 31, 2009, the fair values of these financial instruments approximated the related carrying values which were not significant.
63
The following is a summary of the net carrying amounts and estimated fair values of the Company’s financial assets and liabilities (none of which were held for trading purposes) at December 31 (in thousands):
|
2010
|
2009
|
|||||||||||||||
|
Net carrying
|
Estimated
|
Net carrying
|
Estimated
|
|||||||||||||
|
Financial Assets and Liabilities
|
amount
|
fair value
|
amount
|
fair value
|
||||||||||||
|
Financial assets:
|
||||||||||||||||
|
Cash and cash equivalents
|
$ | 7,518 | $ | 7,518 | $ | 13,336 | $ | 13,336 | ||||||||
|
Securities available for sale
|
104,668 | 104,668 | 91,320 | 91,320 | ||||||||||||
|
Securities held to maturity
|
6,021 | 6,261 | 8,218 | 8,578 | ||||||||||||
|
Loans, net
|
277,812 | 277,134 | 275,419 | 274,618 | ||||||||||||
|
Accrued interest receivable
|
2,034 | 2,034 | 1,954 | 1,954 | ||||||||||||
|
Restricted investments
|
2,806 | 2,806 | 2,341 | 2,341 | ||||||||||||
|
Financial liabilities:
|
||||||||||||||||
|
Demand deposits (non-interest-bearing)
|
62,864 | 62,864 | 64,266 | 64,266 | ||||||||||||
|
Interest-bearing deposits
|
288,042 | 277,764 | 287,939 | 276,429 | ||||||||||||
|
Accrued interest payable
|
273 | 273 | 378 | 378 | ||||||||||||
|
Short-term debt
|
9,500 | 9,500 | 212 | 212 | ||||||||||||
|
Federal Home Loan Bank borrowings
|
15,000 | 15,857 | 15,000 | 15,951 | ||||||||||||
|
Off balance sheet financial instruments:
|
||||||||||||||||
|
Lending commitments
|
— | — | — | — | ||||||||||||
|
Letters of credit
|
— | — | — | — | ||||||||||||
(19) Condensed Parent Company Financial Statements
The following are the condensed, parent company-only financial statements for Jeffersonville Bancorp (in thousands):
|
Balance Sheets
|
||||||||
|
As of December 31,
|
2010
|
2009
|
||||||
|
Assets
|
||||||||
|
Cash
|
$ | 118 | $ | 33 | ||||
|
Securities available for sale
|
542 | 611 | ||||||
|
Investment in subsidiary
|
45,223 | 42,481 | ||||||
|
Premises and equipment, net
|
974 | 1,017 | ||||||
|
Other assets
|
642 | 546 | ||||||
|
Total Assets
|
$ | 47,499 | $ | 44,688 | ||||
|
Liabilities and Stockholders’ Equity
|
||||||||
|
Liabilities
|
$ | 1 | $ | 25 | ||||
|
Stockholders’ equity
|
47,498 | 44,663 | ||||||
|
Total Liabilities and Stockholders’ Equity
|
$ | 47,499 | $ | 44,688 | ||||
64
|
Statements of Income
|
||||||||||||
|
For the Year Ended December 31,
|
2010
|
2009
|
2008
|
|||||||||
|
Dividend income from subsidiary
|
$ | 2,450 | $ | 2,400 | $ | 2,475 | ||||||
|
Dividend income on securities available for sale
|
39 | 47 | 43 | |||||||||
|
Gain on sale of securities
|
89 | — | 63 | |||||||||
|
Impairment charge on securities
|
— | — | (101 | ) | ||||||||
|
Other non-interest income
|
6 | 17 | — | |||||||||
| 2,584 | 2,464 | 2,480 | ||||||||||
|
Occupancy and equipment expenses
|
116 | 118 | 116 | |||||||||
|
Other non-interest expenses
|
139 | 167 | 146 | |||||||||
| 255 | 285 | 262 | ||||||||||
|
Income before income taxes and undistributed income of subsidiary
|
2,329 | 2,179 | 2,218 | |||||||||
|
Income tax expense
|
— | — | — | |||||||||
|
Income before undistributed income of subsidiary
|
2,329 | 2,179 | 2,218 | |||||||||
|
Equity in undistributed income of subsidiary
|
800 | 905 | 484 | |||||||||
|
Net Income
|
$ | 3,129 | $ | 3,084 | $ | 2,702 | ||||||
|
Statements of Cash Flows
|
||||||||||||
|
For the Year Ended December 31,
|
2010
|
2009
|
2008
|
|||||||||
|
Operating activities:
|
||||||||||||
|
Net income
|
$ | 3,129 | $ | 3,084 | $ | 2,702 | ||||||
|
Equity in undistributed income of subsidiary
|
(800 | ) | (905 | ) | (484 | ) | ||||||
|
Depreciation and amortization
|
43 | 51 | 62 | |||||||||
|
Gain on sale of securities
|
(89 | ) | — | (63 | ) | |||||||
|
Impairment charge on securities
|
— | — | 101 | |||||||||
|
Other adjustments, net
|
(76 | ) | (99 | ) | (66 | ) | ||||||
|
Net Cash Provided by Operating Activities
|
2,207 | 2,131 | 2,252 | |||||||||
|
Investing activities:
|
||||||||||||
|
Proceeds from sale of securities available for sale
|
787 | 130 | 334 | |||||||||
|
Purchase of securities available for sale
|
(709 | ) | (131 | ) | (332 | ) | ||||||
|
Purchases of premises and equipment
|
— | (3 | ) | — | ||||||||
|
Net Cash Provided by (Used in) Investing Activities
|
78 | (4 | ) | 2 | ||||||||
|
Financing activities:
|
||||||||||||
|
Issuance of treasury stock
|
2 | — | — | |||||||||
|
Cash dividends paid
|
(2,202 | ) | (2,202 | ) | (2,202 | ) | ||||||
|
Net Cash Used in Financing Activities
|
(2,200 | ) | (2,202 | ) | (2,202 | ) | ||||||
|
Net Increase (Decrease) in Cash
|
85 | (75 | ) | 52 | ||||||||
|
Cash at Beginning of Year
|
33 | 108 | 56 | |||||||||
|
Cash at End of Year
|
$ | 118 | $ | 33 | $ | 108 | ||||||
65
|
ITEM 9.
|
CHANGES IN AND DISAGREEMENTS WITH ACCOUNTANTS ON ACCOUNTING AND FINANCIAL DISCLOSURE
|
Nothing to disclose.
|
ITEM 9A.
|
CONTROLS AND PROCEDURES
|
EVALUATION OF DISCLOSURE CONTROLS AND PROCEDURES
The Company’s principal executive officer and principal financial officer have evaluated the disclosure controls and procedures (as defined in Rules 13a-15(e) or 15d-15(e) under the Exchange Act as of December 31, 2010. Based on this evaluation, the principal executive officer and principal financial officer have concluded that the disclosure controls and procedures effectively ensure that information required to be disclosed in the Company’s filings and submissions with the Securities and Exchange Commission under the Exchange Act, is recorded, processed, summarized and reported within the time periods specified by the Securities and Exchange Commission. In addition, the Company has reviewed its internal controls and there have been no significant changes in its internal controls over financial
reporting or in other factors during the Company’s most recent fiscal quarter that have or are likely to materially affect internal control over financial reporting.
MANAGEMENT’S REPORT ON INTERNAL CONTROL OVER FINANCIAL REPORTING
Management is responsible for establishing and maintaining adequate internal control over financial reporting, as such term is defined in Exchange Act Rule 13a-15(f) or 15d-15(f). The Company’s internal control system was designed to provide reasonable assurance to the Company’s management and board of directors regarding the preparation and fair presentation of published financial statements. Under the supervision and with the participation of the Company’s management, including its principal executive officer and principal financial officer, an evaluation of the effectiveness of internal controls over financial reporting was conducted, based on the framework in Internal Control – Integrated Framework issued by the Committee of
Sponsoring Organizations of the Treadway Commission. Based on the evaluation under the framework in Internal Control – Integrated Framework, management concluded that the internal controls over financial reporting were effective as of December 31, 2010.
Since the Company is a “smaller reporting company” under SEC rules, it is not required to have an attestation report of the Company’s registered pubic accounting firm regarding internal control over financial reporting.
|
ITEM 9B.
|
OTHER INFORMATION
|
Nothing to disclose.
66
|
ITEM 10.
|
DIRECTORS, EXECUTIVE OFFICERS AND CORPORATE GOVERNANCE
|
Certain portions of the information required by this Item will be included in the 2011 Proxy Statement, which will be filed with the Securities and Exchange Commission within 120 days of the Company’s 2010 fiscal year end, in the Election of Directors section, the Management section, the Executive Compensation And Other Information section, and the corporate governance disclosures which sections is incorporated herein by reference.
|
ITEM 11.
|
EXECUTIVE COMPENSATION
|
The information required by this Item will be included in the 2011 Proxy Statement in the Compensation of Directors and Executive Officer Compensation and Other Information section, and is incorporated herein by reference.
|
ITEM 12.
|
SECURITY OWNERSHIP OF CERTAIN BENEFICIAL OWNERS AND MANAGEMENT AND RELATED STOCKHOLDER MATTERS
|
The information required by this Item will be included in the 2011 Proxy Statement in the Security Ownership of Certain Beneficial Owners and of Management section, and is incorporated herein by reference.
|
ITEM 13.
|
CERTAIN RELATIONSHIPS AND RELATED TRANSACTIONS AND DIRECTOR INDEPENDENCE
|
The information required by this Item will be included in the 2011 Proxy Statement in the Transactions with Management section, and is incorporated herein by reference.
|
ITEM 14.
|
PRINCIPAL ACCOUNTANT FEES AND SERVICES
|
The information required by this Item will be included in the 2011 Proxy Statement in the Report of the Audit Committee section, and is incorporated herein by reference.
67
|
ITEM 15.
|
EXHIBITS, FINANCIAL STATEMENT SCHEDULES
|
|
(a) 1.
|
The consolidated financial statements and schedules of the Company and Bank are included in item 8 of Part II.
|
|
(a) 2.
|
All schedules are omitted since the required information is not applicable, not required or contained in the respective consolidated financial statements or in the notes thereto.
|
|
(a) 3.
|
Exhibits (numbered in accordance with Item 601 of Regulation S-K).
|
|
3.1
|
Certificate of Incorporation of the Company (Incorporation by Reference to Exhibit 3.1, 3.2, 3.3 and 3.4 to Form 8 Registration Statement, effective June 29, 1991)
|
|
3.2
|
The Amended and Restated Bylaws of the Company (Incorporated by Reference to Exhibit 3.1 to Form 8-K filed on December 31, 2007)
|
|
4.1
|
Instruments defining the Rights of Security Holders. (Incorporated by Reference to Exhibit 4 to Form 8 Registration Statement, effective June 29, 1991)
|
|
21.1
|
Subsidiaries of the Company
|
|
31.1
|
Section 302 Certification of Chief Executive Officer
|
|
31.2
|
Section 302 Certification of Chief Financial Officer
|
|
32.1
|
906 certification of Chief Executive Officer
|
|
32.2
|
906 certification of Chief Financial Officer
|
|
(b)
|
Exhibits to this Form 10-K are attached or incorporated herein by reference.
|
68
Pursuant to the requirements of Section 13 or 15(d) of the Securities and Exchange Act of 1934, the Registrant has duly caused this report to be signed on its behalf by the undersigned, thereunto duly authorized.
|
Dated: March 24, 2011
|
By:
|
/s/ Wayne V. Zanetti
|
By:
|
/s/ John A. Russell
|
|
Wayne V. Zanetti
|
John A. Russell
|
|||
|
Chief Executive Officer
|
Chief Financial Officer
|
Pursuant to the requirements of the Securities Exchange Act of 1934, this report has been signed below by the following persons on behalf of the Registrant and in the capacities and on the dates indicated.
|
SIGNATURE
|
TITLE
|
DATE
|
||
|
/s/ Kenneth C. Klein
|
Chairman–Director
|
March 24, 2011
|
||
|
Kenneth C. Klein
|
||||
|
/s/ Raymond Walter
|
Vice Chairman–Director
|
March 24, 2011
|
||
|
Raymond Walter
|
||||
|
/s/ Wayne V. Zanetti
|
Chief Executive Officer
|
March 24, 2011
|
||
|
Wayne V. Zanetti
|
President–Director
|
|||
|
/s/ John K. Gempler
|
Secretary–Director
|
March 24, 2011
|
||
|
John K. Gempler
|
||||
|
/s/ John W. Galligan
|
Director
|
March 24, 2011
|
||
|
John W. Galligan
|
||||
|
/s/ Douglas A. Heinle
|
Director
|
March 24, 2011
|
||
|
Douglas A. Heinle
|
||||
|
/s/ Donald L. Knack
|
Director
|
March 24, 2011
|
||
|
Donald L. Knack
|
||||
|
/s/ James F. Roche
|
Director
|
March 24, 2011
|
||
|
James F. Roche
|
||||
|
/s/ Edward T. Sykes
|
Director
|
March 24, 2011
|
||
|
Edward T. Sykes
|
69