Attached files
| file | filename |
|---|---|
| 8-K - 8-K - ATLANTIC POWER CORP | a11-8688_18k.htm |
Exhibit 99.1
|
|
1 Atlantic Power Corporation March 2011 |
|
|
2 Disclaimer Certain statements in this presentation may constitute “forward-looking statements”, which reflect the expectations of management regarding the future growth, results of operations, performance and business prospects and opportunities of our Company and our projects. These statements, which are based on certain assumptions and describe our future plans, strategies and expectations, can generally be identified by the use of the words "may," "will," "project," "continue," "believe," "intend," "anticipate," "expect" or similar expressions that are predictions of or indicate future events or trends and which do not relate solely to present or historical matters. Forward-looking statements involve significant risks and uncertainties, should not be read as guarantees of future performance or results, and will not necessarily be accurate indications of whether or not or the times at or by which such performance or results will be achieved. Please refer to the factors discussed under "Risk Factors" in the Company's periodic reports as filed with the Securities and Exchange Commission from time to time for a detailed discussion of the risks and uncertainties affecting our Company. Although the forward-looking statements contained in this presentation are based upon what are believed to be reasonable assumptions, investors cannot be assured that actual results will be consistent with these forward-looking statements, and the differences may be material. These forward-looking statements are made as of the date of this presentation and, except as expressly required by applicable law, the Company assumes no obligation to update or revise them to reflect new events or circumstances. The financial outlook information contained in this presentation is presented to provide readers with guidance on the cash distributions expected to be received by the Company and to give readers a better understanding of the Company’s ability to pay its current level of distributions into the future. Readers are cautioned that such information may not be appropriate for other purposes. Project Adjusted EBITDA and Cash Available for Distribution as used in this presentation are non-GAAP measures. Project Adjusted EBITDA is defined as project income less interest, taxes, depreciation and amortization (including non-cash impairment charges) and changes in fair value of derivative instruments. Project Adjusted EBITDA is not a measure recognized under GAAP and does not have a standardized meaning prescribed by GAAP and is therefore unlikely to be comparable to similar measures presented by other companies. The Company uses unaudited Project Adjusted EBITDA to provide comparative information about project performance without considering how projects are capitalized or whether they contain derivative contracts that are required to be recorded at fair value. Investors are cautioned that the Company may calculate this measure in a manner that is different from other companies. |
|
|
3 Management Representatives Barry Welch President and CEO Patrick Welch Chief Financial Officer Paul Rapisarda Managing Director of Acquisitions and Asset Management |
|
|
4 A Unique Yield-Oriented Infrastructure Company Headquartered in Boston, MA Diversified fleet of power generation projects and a transmission project located in the United States 13 operational unregulated power generation projects across ten states (net ownership of 878 MW) 84-mile, federally regulated electric transmission line located in California 52 MW Piedmont Green Power biomass project under construction in Georgia 60% interest in biomass power development company Business model focused on long-term sustainability of our monthly dividend Yield Oriented Business Model Power and Other Infrastructure Assets |
|
|
Atlantic Power Overview Dual listed in Canada and U.S. (TSX: ATP, NYSE: AT) $1.7 billion enterprise value $1.1 billion market capitalization Demonstrated organic growth and acquisitions since IPO in 2004 Eight acquisitions including two at existing projects Raised over US$800 million in public and private transactions Three distribution increases Numerous initiatives to enhance project cash flows and reduce risk, including three gas turbine upgrades, five contract extensions and gas price hedging Late stage development opportunities include several biomass projects Stable dividends Approximately 95% of portfolio’s net MW contracted through 2013 Investment grade customers under medium to long-term contracts Over half of generating plants’ revenues from capacity payments 86% of expected Cdn$ dividends and interest obligations hedged through 2013 86% of all the Company’s interest rate exposure fixed Ability to maintain current dividend level into 2016 with no acquisitions or organic growth Highly experienced management team and partners Lessons learned from many cycles and episodes in the independent power industry Operating and maintenance partners have significant experience in power sector 5 |
|
|
6 History and Key Milestones 2004 2005 2006 2007 2008 2009 2010 Nov ‘04 Completion of Cdn$368 million IPO Sept ‘05 Cdn$0.03 per IPS distribution increase Oct ‘05 Private placement of Cdn$75 million IPSs Sept ‘06 Acquired Path 15 Project Transmission Line Dec ‘06 Private placement of Cdn$86 million IPSs and Cdn$3.0 million principal amount of 11% subordinated notes due 2016 Dec ‘07 Acquired remaining 50% interest in Pasco Cogeneration Project Nov ‘08 Acquired Auburndale Power Partners, LP Aug ‘05 Acquired 40% interest in Chambers Project Sept ‘06 Cdn$0.03 per IPS distribution increase Nov ‘08 Cdn$0.034 per IPS distribution increase Mar ‘09 Acquired 40% interest in Rollcast Energy, Inc.; forms Onondaga Renewables Joint Venture Oct ‘06 Public offering of Cdn$90 million of IPSs and Cdn$60 million of 6.25% convertible debentures Nov ‘09 Sale of interests in Stockton and Mid Georgia Oct ‘09 Announced conversion to common share company, mgmt. internalization and planned NYSE listing Dec ‘09 Public offering of Cdn$86 million of 6.25% convertible debentures and redemption of subordinated notes Jul ‘10 Listed on NYSE Jul ‘10 Acquired 27.6% interest in 183 MW Idaho Wind Partners Oct ‘10 $152 million raised in convertible debentures and first US common share offer $133 million Project-level financing for Piedmont Green Power, first biomass project Dec ‘10 Acquired Cadillac Renewable Energy, 39.6MW wood fired facility |
|
|
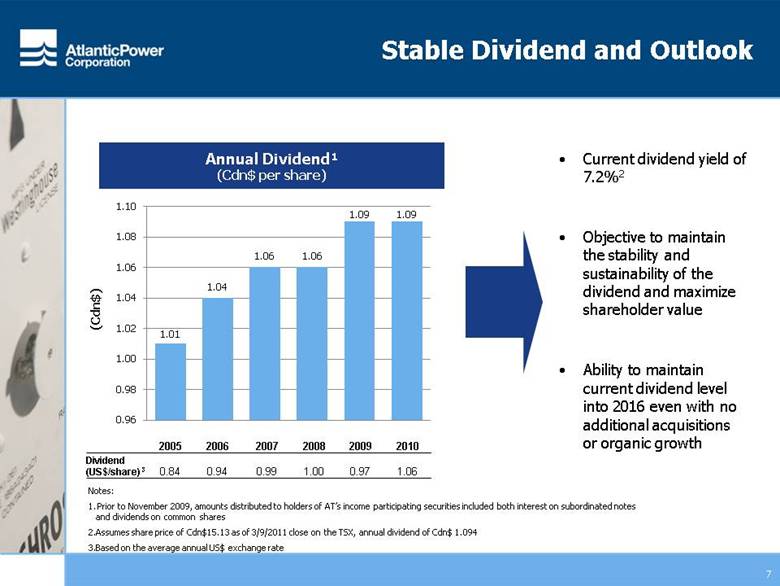
7 Stable Dividend and Outlook Current dividend yield of 7.2%2 Objective to maintain the stability and sustainability of the dividend and maximize shareholder value Ability to maintain current dividend level into 2016 even with no additional acquisitions or organic growth Annual Dividend¹ (Cdn$ per share) Notes: Prior to November 2009, amounts distributed to holders of AT’s income participating securities included both interest on subordinated notes and dividends on common shares Assumes share price of Cdn$15.13 as of 3/9/2011 close on the TSX, annual dividend of Cdn$ 1.094 Based on the average annual US$ exchange rate 2005 2006 2007 2008 2009 2010 Dividend (US$/share) 3 0.84 0.94 0.99 1.00 0.97 1.06 |
|
|
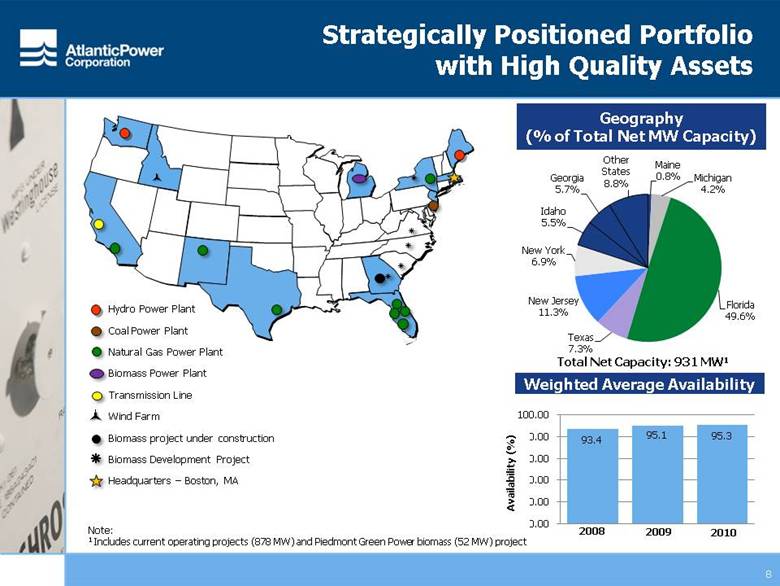
2008 2009 2010 8 Strategically Positioned Portfolio with High Quality Assets Geography (% of Total Net MW Capacity) Total Net Capacity: 931 MW1 Note: 1 Includes current operating projects (878 MW) and Piedmont Green Power biomass (52 MW) project Weighted Average Availability Hydro Power Plant Coal Power Plant Natural Gas Power Plant Biomass Power Plant Transmission Line Wind Farm Biomass project under construction Biomass Development Project Headquarters – Boston, MA |
|
|
9 Long-Term Contracts. All but one of the generation projects currently have power purchase agreements Predictable and stable revenue, margins and cashflows Approximately 95% of generation portfolio net MW currently contracted through 2013 Fuel price pass through mechanisms in power purchase agreements generally protect operating margins Track record of re-contracting five expiring PPAs Additions of Idaho Wind, Piedmont and Cadillac in 2010 will substantially increase average remaining PPA life to 8.9 years Notes: Transmission line with a 30 year regulatory life through 2034 Construction of Piedmont biomass plant began in Q4 2010. Commercial operation is expected to begin in the last half of 2012 Contract with Reedy Creek (19 net MW) expires in 2013, but Progress Energy agreed to buy this output, subject to certain conditions Contract with Sherwin Alumina (9 net MW) expires in 2020 Historically Topsham and Badger Creek, combined, have contributed less than 5% of Project Adjusted EBITDA Existing PPA Overview 1 2 3 4 5 5 |
|
|
10 with Credit-Worthy Customers Customers and Ratings (% of Total Net MW Capacity) Atlantic Power’s customers are primarily large utilities with investment-grade credit ratings Total Net Capacity: 931 MW1 Note: 1 Includes current operating projects (878 MW) and Piedmont Green Power (52 MW) project |
|
|
11 Strong Track Record and Platform for Growth Organic Growth Acquisition Growth Asset Management Opportunities Atlantic Power has a successful track record of growth, built on its strong asset management and development platform Upgraded three gas turbines for better efficiency and output Piedmont Green Power biomass development Eight acquisitions of interests in operating projects since IPO, including buyout of partners at two existing projects and acquisition of Cadillac Renewable Energy in Q4 2010 Acquisition of 27.6% interest in Idaho Wind in July 2010 Investment in Rollcast; biomass development company Replaced or extended five expiring PPAs and several fuel agreements since IPO Hedging of cashflows—currency, interest rates and commodity prices Sold interests in five projects since IPO Optimization of existing projects to upgrade performance, plant configuration and economics Brownfield biomass project/other green-field development opportunities Increase ownership in existing projects Accretive corporate and asset acquisitions in US and Canada Late stage development joint-ventures Targeting renewable / natural gas generation and transmission; minimum of $150 million of equity investments expected in 2011 Optimization of commercial arrangements and operations Ongoing hedging arrangements Growth Category Track Record Potential |
|
|
12 Experienced Executive Team Extensive power generation development, project operations, finance, M&A and asset management experience Proven track record of performance Strong independent board with extensive industry experience in Canada and the US Name Experience Management Team Barry Welch Head of John Hancock’s Bond & Corporate Finance Group IPP developer with Thermo Electron Patrick Welch VP & Controller of DCP Midstream VP & Controller of Dynegy Generation Paul Rapisarda 25 year Wall Street career Involved in numerous advisory and principal transactions in the energy & power sectors Board of Directors Irving Gerstein Member of Senate of Canada; also on boards of Student Transportation of America and Medical Facilities Corporation Ken Hartwick President, CEO and Director, Just Energy, independent energy supplier in Canada and the US (TSX: JE.UN) John McNeil President, BDR North America Inc., Canadian consulting firm focused on electricity and natural gas industries Holli Nichols Executive Vice President and Chief Financial Officer, SCF Partners R. Foster Duncan Managing Director, Advantage Capital Partners, a U.S. venture capital partnership Formerly, Chief Financial Officer of Cinergy Corporation Barry Welch President and CEO, Atlantic Power |
|
|
13 Portfolio Overview |

|
|
14 Portfolio Diversity 2010 Project Adjusted EBITDA by Segment2 Generation Fuel Type (by net MW)1 Notes: 1 Includes current operating projects (878 MW) and Piedmont Green Power (52MW) projects 2 Based on current net operating capacity; Other segment includes Badger Creek, Topsham, Delta-Person, Koma Kulshan, Rollcast and Other High quality asset portfolio, diversified by fuel type and EBITDA contribution |
|
|
Overview of 2010 Renewables Growth 15 Idaho Wind Partners Piedmont Green Power Cadillac Renewable Energy Fuel Type Wind Biomass Biomass MW 183 MW 53.5 MW 39.6 MW Location Near Twin Falls, ID Barnesville, GA Cadillac, MI Current Status Construction completed Construction began Q4 2010 Closed acquisition in Q4 2010 COD Q1 2011 Late 2012 Operating since 1993 PPA 20 year – Idaho Power Company (BBB) 20 year – Georgia Power Company (A) 17 year – Consumers Power Company (BBB-) Atlantic Investment $40 mm $75 mm $37 mm Atlantic Equity Ownership 27.6% ~ 98% 100% |
|
|
16 Summary of Operating Projects Operating projects are diversified across geography and investment-grade utility customers Project Name Location Type Total MW Economic Interest Net MW Electricity Purchaser Contract Expiry S&P Credit Rating 2010 Project Adjusted EBITDA ($mm) Auburndale Florida Natural Gas 155 100% 155 Progress Energy Florida 2013 BBB+ 34 Idaho Wind Idaho Wind 183 27.6% 50 Idaho Power Company 2030 BBB Lake Florida Natural Gas 121 100% 121 Progress Energy Florida 2013 BBB+ 31 Pasco Florida Natural Gas 121 100% 121 Tampa Electric Co. 2018 BBB 5 Cadillac Michigan Woody Biomass 39 100% 40 Consumers of Michigan 2028 BBB- Chambers New Jersey Coal 262 40% 89 Atlantic City Electric 2024 BBB 19 16 DuPont 2024 A Path 15 California Transmission N/A 100% N/A California Utilities via CAISO N/A BBB+ to A 29 Orlando Florida Natural Gas 129 50% 46 Progress Energy Florida 2023 BBB+ 8 19 Reedy Creek Improvement District 2013 A- Selkirk New York Natural Gas 345 17.7% 49 Consolidated Edison 2014 A- 15 15 Merchant N/A N/R Gregory Texas Natural Gas 400 17.1% 59 Fortis Energy Marketing and Trading 2013 A- 5 9 Sherwin Alumina 2020 N/R Topsham Maine Hydro 14 50% 7 Central Maine Power 2011 BBB+ 2 Badger Creek California Natural Gas 46 50% 23 Pacific Gas & Electric 2011 BBB+ 3 Koma Kulshan Washington Hydro 13 49.8% 6 Puget Sound Energy 2037 BBB 1 Delta-Person New Mexico Natural Gas 132 40% 53 Public Service of New Mexico 2020 BB- 2 |
|
|
17 Financial Overview |
|
|
18 Financial Strategy 1 Sustain and grow cash flows Optimize contractual agreements Optimize and expand existing assets in portfolio Pursue development opportunities 2 Make accretive acquisitions Actively seek and evaluate proprietary acquisition opportunities in North America Focus on opportunities with contracted cash flows, credit-worthy counterparties, minimal fuel price risk and attractive power markets 3 Enhance financial flexibility Maintain conservative and flexible capital structure Access to public markets in both U.S. and Canada NYSE listing increases liquidity and broadens investor base, reducing cost of capital 4 Generate strong returns Contracted business model for predictable cash flow generation Historical total returns have exceeded market benchmarks Attractive dividend for yield-focused investors |
|
|
19 Total Shareholder Return Performance Atlantic Power’s historical total shareholder return has significantly exceeded market benchmarks 159% 95% TSX Income Trust 134% Alerian MLP Index 75% S&P TSX 19% S&P 500 Source: Bloomberg Date Range: 12/31/04 – 3/17/11 -50 0 50 100 150 200 (%) Atlantic Power Corp. S&P TSX TSX Income Trust S&P 500 Alerian MLP |
|
|
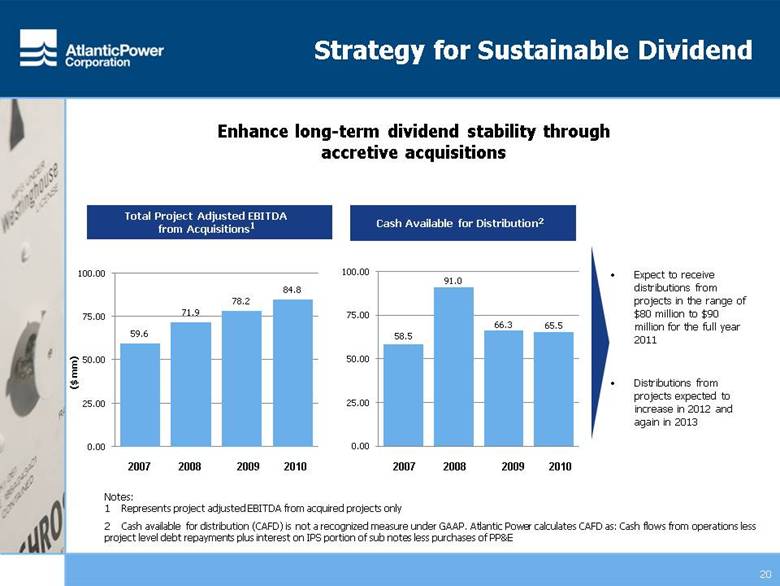
20 Strategy for Sustainable Dividend Cash Available for Distribution2 Enhance long-term dividend stability through accretive acquisitions Notes: 1 Represents project adjusted EBITDA from acquired projects only 2 Cash available for distribution (CAFD) is not a recognized measure under GAAP. Atlantic Power calculates CAFD as: Cash flows from operations less project level debt repayments plus interest on IPS portion of sub notes less purchases of PP&E Expect to receive distributions from projects in the range of $80 million to $90 million for the full year 2011 Distributions from projects expected to increase in 2012 and again in 2013 Total Project Adjusted EBITDA from Acquisitions1 2007 2008 2009 2010 2007 2008 2009 2010 |
|
|
21 Year-end 2011 project debt (excluding Piedmont project in construction) is expected to be $361 million, including $233 million at four consolidated projects and $128 million at five equity investments Virtually all project level debt fully amortizes before the respective power purchase agreements expire Project debt is non-recourse, with a minor amount of contingent credit support provided by Atlantic Power Significant Deleveraging of Project Level Debt Forecasted Project Level Debt |
|
|
22 Atlantic Power – A Unique Infrastructure Opportunity Strategically Positioned Portfolio with High Quality Assets Long Term Contracts with Credit Worthy Customers Partnerships with Experienced O&M Managers Proven Track Record and Platform for Growth Experienced Executive Team Sustainable Dividend |