Attached files
| file | filename |
|---|---|
| 8-K - FORM 8-K - US AIRWAYS GROUP INC | c14459e8vk.htm |
Exhibit 99.1
| J.P. Morgan Aviation Transportation & Defense ConferenceMarch 22, 2011Scott KirbyPresidentUS Airways Group, Inc. |
| Forward-Looking Statements Certain of the statements contained or referred to herein should be considered "forward-looking statements" within the meaning of the Private Securities Litigation Reform Act of 1995. These forward-looking statements may be identified by words such as "may," "will," "expect," "intend," "anticipate," "believe," "estimate," "plan," "project," "could," "should," and "continue" and similar terms used in connection with statements regarding, among others, the outlook, expected fuel costs, revenue and pricing environment, and expected financial performance and liquidity position of US Airways Group (the "Company"). Such statements include, but are not limited to, statements about future financial and operating results, the Company's plans, objectives, expectations and intentions, and other statements that are not historical facts. These statements are based upon the current beliefs and expectations of the Company's management and are subject to significant risks and uncertainties that could cause the Company's actual results and financial position to differ materially from these statements. Such risks and uncertainties include, but are not limited to, the following: the impact of significant operating losses in the future; downturns in economic conditions and their impact on passenger demand and related revenues; increased costs of financing, a reduction in the availability of financing and fluctuations in interest rates; the impact of the price and availability of fuel and significant disruptions in the supply of aircraft fuel; our high level of fixed obligations and our ability to fund general corporate requirements, obtain additional financing and respond to competitive developments; any failure to comply with the liquidity covenants contained in our financing arrangements; provisions in our credit card processing and other commercial agreements that may affect our liquidity; the impact of union disputes, employee strikes and other labor-related disruptions; our inability to maintain labor costs at competitive levels; interruptions or disruptions in service at one or more of our hub airports; our reliance on third-party regional operators or third- party service providers; our reliance on and costs of third-party distribution channels, including those provided by global distribution systems and online travel agents; changes in government legislation and regulation; our reliance on automated systems and the impact of any failure or disruption of these systems; the impact of changes to our business model; competitive practices in the industry, including the impact of industry consolidation; the loss of key personnel or our ability to attract and retain qualified personnel; the impact of conflicts overseas or terrorist attacks, and the impact of ongoing security concerns; our ability to operate and grow our route network; the impact of environmental laws and regulations; costs of ongoing data security compliance requirements and the impact of any data security breach; the impact of any accident involving our aircraft or the aircraft of our regional operators; delays in scheduled aircraft deliveries or other loss of anticipated fleet capacity; the impact of weather conditions and seasonality of airline travel; the impact of possible future increases in insurance costs and disruptions to insurance markets; the impact of global events that affect travel behavior, such as an outbreak of a contagious disease; the impact of foreign currency exchange rate fluctuations; our ability to use NOLs and certain other tax attributes; and other risks and uncertainties listed from time to time in our reports to and filings with the Securities and Exchange Commission. There may be other factors not identified above of which the Company is not currently aware that may affect matters discussed in the forward-looking statements, and may also cause actual results to differ materially from those discussed. The Company assumes no obligation to publicly update or supplement any forward-looking statement to reflect actual results, changes in assumptions or changes in other factors affecting such estimates other than as required by law. Additional factors that may affect the future results of the Company are set forth in the section entitled "Risk Factors" in the Company's Report on Form 10-K for the fiscal year ended December 31, 2010 and in the Company's other filings with the SEC, which are available at www.usairways.com. |
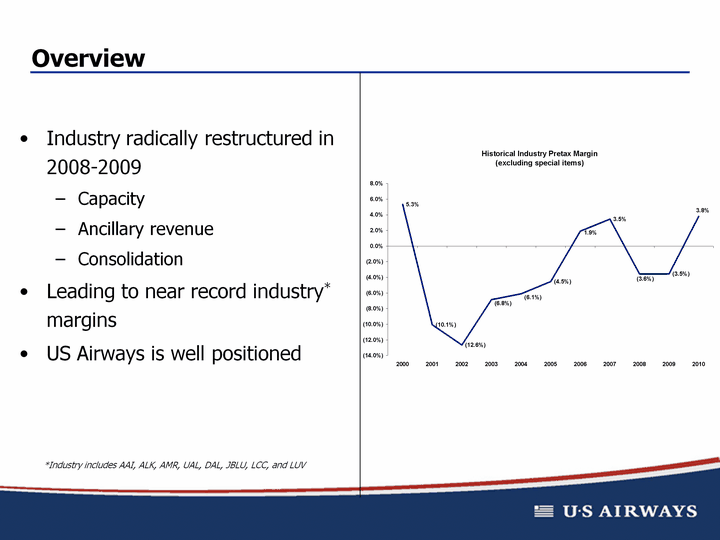
| Overview Industry radically restructured in 2008-2009CapacityAncillary revenueConsolidationLeading to near record industry* marginsUS Airways is well positioned *Industry includes AAI, ALK, AMR, UAL, DAL, JBLU, LCC, and LUV |
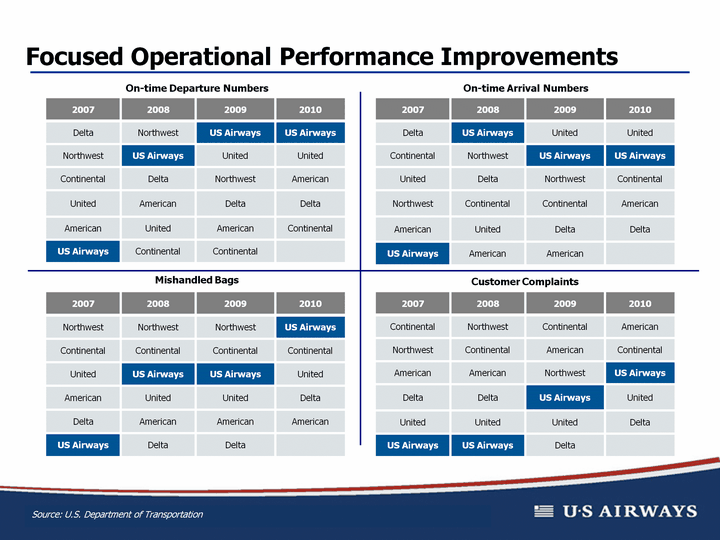
| Focused Operational Performance Improvements 2007 2008 2009 2010 Delta Northwest US Airways US Airways Northwest US Airways United United Continental Delta Northwest American United American Delta Delta American United American Continental US Airways Continental Continental US Airways Continental Continental 2007 2008 2009 2010 Northwest Northwest Northwest US Airways Continental Continental Continental Continental United US Airways US Airways United American United United Delta Delta American American American US Airways Delta Delta 2007 2008 2009 2010 Continental Northwest Continental American Northwest Continental American Continental American American Northwest US Airways Delta Delta US Airways United United United United Delta US Airways US Airways Delta Mishandled Bags Customer Complaints Source: U.S. Department of Transportation On-time Departure Numbers On-time Arrival Numbers |

| Consolidated Total RASM UAL LUV LCC DAL AMR ALK AAI JBLU 0.202 0.166 0.129 0.118 0.101 0.098 0.093 0.084 Despite zero exposure to the Pacific, US Airways continues to perform well in total revenue production * Stage Adjusted to US Airways' stage length of 981 miles |
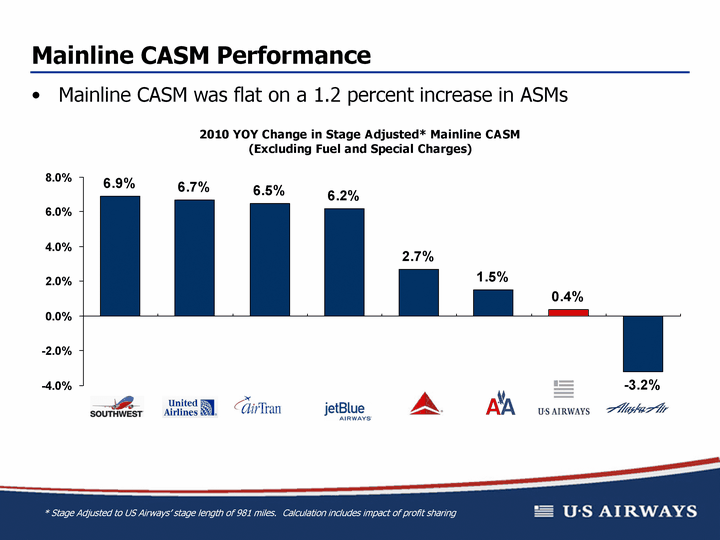
| Mainline CASM Performance Mainline CASM was flat on a 1.2 percent increase in ASMs LUV UAL AAI JBLU DAL AMR LCC ALK 0.069 0.067 0.065 0.062 0.027 0.015 0.004 -0.032 * Stage Adjusted to US Airways' stage length of 981 miles. Calculation includes impact of profit sharing |
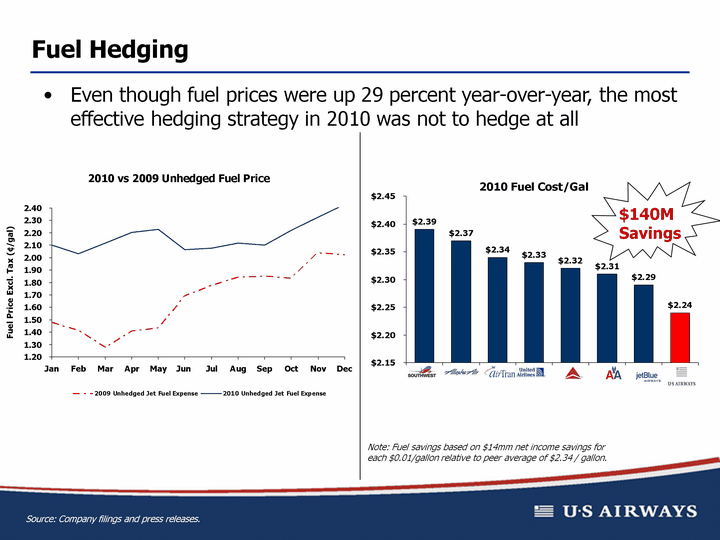
| Fuel Hedging LUV ALK AAI UAL DAL AMR JBLU LCC 2.39 2.37 2.34 2.33 2.32 2.31 2.29 2.24 $140MSavings Even though fuel prices were up 29 percent year-over-year, the most effective hedging strategy in 2010 was not to hedge at all Source: Company filings and press releases. Note: Fuel savings based on $14mm net income savings for each $0.01/gallon relative to peer average of $2.34 / gallon. 2009 Unhedged Jet Fuel Expense 2010 Unhedged Jet Fuel Expense 2010 Effective Hedged Expense Jan 1.4783 2.1019 2.1019 Feb 1.412 2.0306 2.0306 Mar 1.2779 2.1157 2.1157 Apr 1.4076 2.2054 2.2054 May 1.4354 2.23 2.23 Jun 1.6925 2.0655 2.0655 Jul 1.7759 2.0773 2.0773 Aug 1.8431 2.1175 2.1175 Sep 1.8499 2.0998 2.0998 Oct 1.8332 2.2215 2.2215 Nov 2.039 2.3258 2.3258 Dec 2.0222 2.4284 2.4284 |
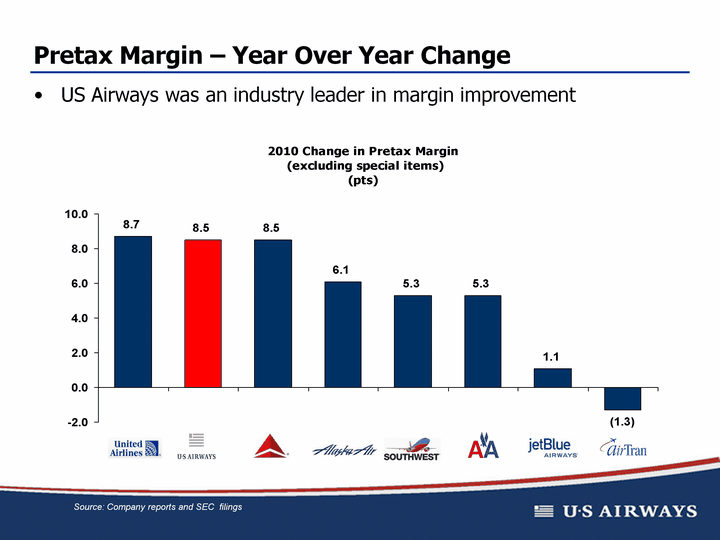
| UAL LCC DAL ALK LUV AMR JBLU AAI 8.7 8.5 8.5 6.1 5.3 5.3 1.1 -1.3 Source: Company reports and SEC filings Pretax Margin - Year Over Year Change US Airways was an industry leader in margin improvement |

| Outlook Going Forward |

| Accelerating RASM Environment 10/1/2010 11/1/2010 12/1/2010 1/1/2011 2/1/2011 YOY PRASM 0.07 0.06 0.05 0.07 0.1 Despite difficult year-over-year comps, the revenue environment has been strong |
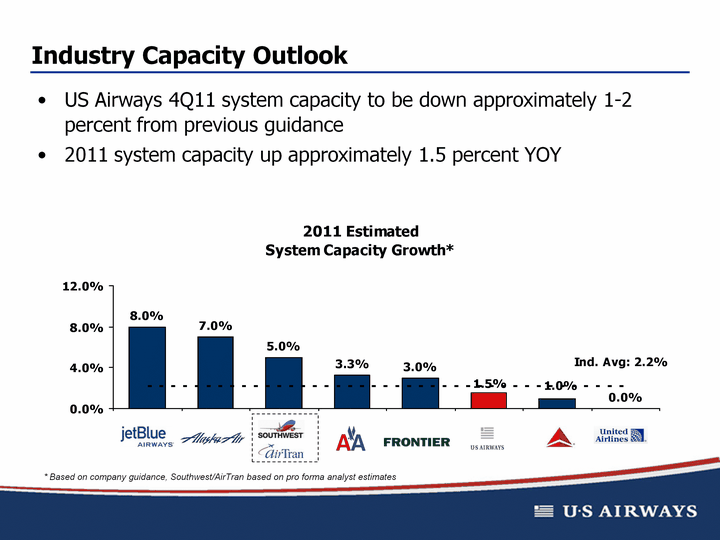
| JBLU ALK LUV PF AMR FRNT LCC DAL UAL 0.08 0.07 0.05 0.033 0.03 0.015 0.01 0 0.022 0.022 0.022 0.022 0.022 0.022 0.022 0.022 Industry Capacity Outlook US Airways 4Q11 system capacity to be down approximately 1-2 percent from previous guidance2011 system capacity up approximately 1.5 percent YOY * Based on company guidance, Southwest/AirTran based on pro forma analyst estimates |
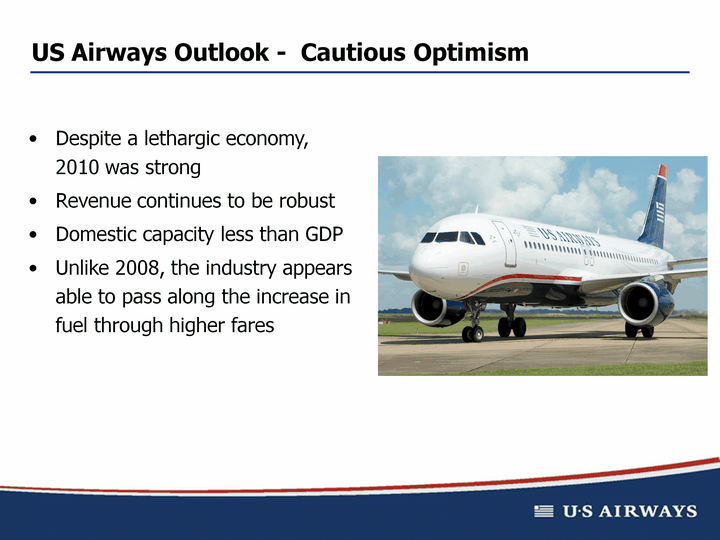
| US Airways Outlook - Cautious Optimism Despite a lethargic economy, 2010 was strongRevenue continues to be robustDomestic capacity less than GDPUnlike 2008, the industry appears able to pass along the increase in fuel through higher fares |
| APPENDIX |
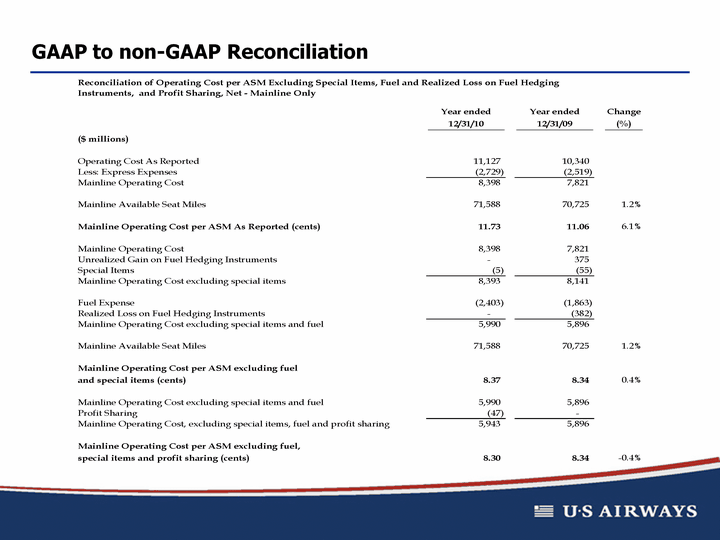
| GAAP to non-GAAP Reconciliation |
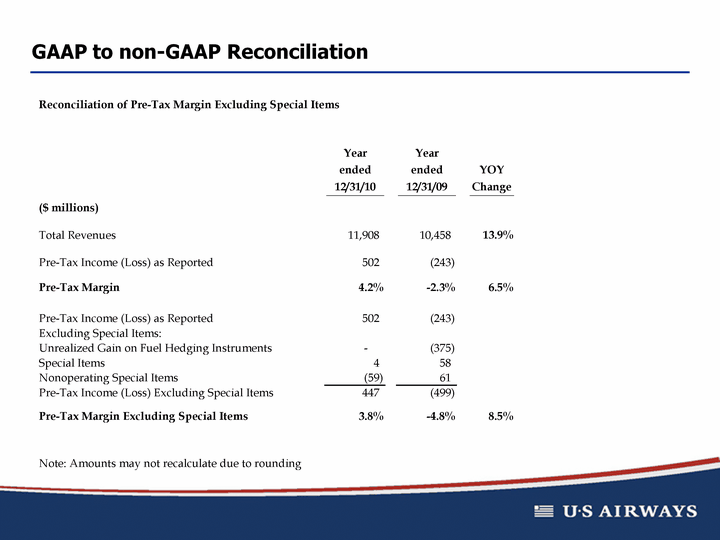
| GAAP to non-GAAP Reconciliation |
| Questions? |
