As filed with the Securities and Exchange
Commission on March 18, 2011.
Registration
No. 333-168397
UNITED STATES SECURITIES AND
EXCHANGE COMMISSION
Washington, D.C.
20549
Amendment No. 3
to
Form S-1
REGISTRATION
STATEMENT
UNDER
THE SECURITIES ACT OF
1933
SIGE SEMICONDUCTOR,
INC.
(Exact name of Registrant as
specified in its charter)
| |
|
|
|
|
|
Delaware
|
|
3674
|
|
98-0395854
|
(State or other jurisdiction of
incorporation or organization)
|
|
(Primary Standard Industrial
Classification Code Number)
|
|
(I.R.S. Employer
Identification Number)
|
200 Brickstone Square
Suite 203
Andover, MA 01810
(978) 327-6850
(Address, including zip code, and
telephone number, including area code,
of registrant’s principal executive offices)
Sohail A. Khan
President and Chief Executive Officer
SiGe Semiconductor, Inc.
200 Brickstone Square
Suite 203
Andover, MA 01810
(978) 327-6850
(Name, address, including zip code,
and telephone number, including area code, of agent for service)
Copies to:
| |
|
|
Jocelyn M. Arel, Esq.
James R. Kasinger, Esq.
Goodwin Procter LLP
Exchange Place
Boston, MA 02109
Telephone: (617) 570-1000
Facsimile:
(617) 523-1231
|
|
D. Rhett Brandon, Esq.
Simpson Thacher & Bartlett LLP
425 Lexington Avenue
New York, NY 10017
Telephone: (212) 455-2000
Facsimile: (212) 455-2502
|
Approximate date of commencement of proposed sale to the
public: As soon as practicable after the effective
date of this registration statement.
If any of the securities being registered on this Form are to be
offered on a delayed or continuous basis pursuant to
Rule 415 under the Securities Act of 1933, check the
following
box. o
If this Form is filed to register additional securities for an
offering pursuant to Rule 462(b) under the Securities Act,
please check the following box and list the Securities Act
registration statement number of the earlier effective
registration statement for the same
offering. o
If this Form is a post-effective amendment filed pursuant to
Rule 462(c) under the Securities Act, check the following
box and list the Securities Act registration statement number of
the earlier effective registration statement for the same
offering. o
If this Form is a post-effective amendment filed pursuant to
Rule 462(d) under the Securities Act, check the following
box and list the Securities Act registration statement number of
the earlier effective registration statement for the same
offering. o
Indicate by check mark whether the registrant is a large
accelerated filer, an accelerated filer, a non-accelerated
filer, or a smaller reporting company. See the definitions of
“large accelerated filer,” “accelerated
filer” and “smaller reporting company” in Rule
12b-2 of the
Exchange Act. (Check one):
|
|
|
|
| Large
accelerated
filer o
|
Accelerated
filer o
|
Non-accelerated
filer x
|
Smaller reporting
company o
|
(Do not check if a smaller
reporting company)
The registrant hereby amends this registration statement on
such date or dates as may be necessary to delay its effective
date until the registrant shall file a further amendment which
specifically states that this registration statement shall
thereafter become effective in accordance with Section 8(a)
of the Securities Act of 1933 or until the registration
statement shall become effective on such date as the Securities
and Exchange Commission, acting pursuant to such
Section 8(a), may determine.
The
information in this prospectus is not complete and may be
changed. Neither we nor the selling stockholders may sell these
securities until the registration statement filed with the
Securities and Exchange Commission is effective. This prospectus
is not an offer to sell these securities and neither we nor the
selling stockholders is soliciting an offer to buy these
securities in any jurisdiction where the offer or sale is not
permitted.
|
Subject
to Completion, dated March 18, 2011
PROSPECTUS
Shares
Common
Stock
This is an
initial public offering of shares of common stock of SiGe
Semiconductor, Inc. We are
offering shares
of our common stock and the selling stockholders identified in
this prospectus are offering an
additional shares
of our common stock. We will not receive any of the proceeds
from the sale of the shares of our common stock offered by the
selling stockholders. Prior to this offering, there has been no
public market for our common stock.
We have
applied to have our common stock listed on the NASDAQ Global
Market under the symbol “SIGE.”
It is
currently estimated that the initial public offering price per
share will be between $ and
$ .
See
“Risk Factors” beginning on page 11 to read about
factors you should consider before buying shares of our common
stock.
Neither
the Securities and Exchange Commission nor any other regulatory
body has approved or disapproved of these securities or passed
upon the accuracy or adequacy of this prospectus. Any
representation to the contrary is a criminal offense.
| |
|
|
|
|
|
|
|
|
|
|
|
Per
Share
|
|
Total
|
|
|
|
Initial public offering price
|
|
$
|
|
|
|
$
|
|
|
|
Underwriting discounts and commissions
|
|
|
|
|
|
|
|
|
|
Proceeds, before expenses, to SiGe Semiconductor, Inc.
|
|
|
|
|
|
|
|
|
|
Proceeds, before expenses, to the selling stockholders
|
|
|
|
|
|
|
|
|
To the
extent that the underwriters sell more
than shares
of common stock, the underwriters have a
30-day
option to purchase up to an
additional shares from the selling
stockholders at the initial public offering price, less the
underwriting discount.
The
underwriters expect to deliver the shares against payment on or
about ,
2011
|
|
| Barclays
Capital
|
Deutsche Bank Securities
|
|
|
|
|
| RBC
Capital Markets
|
Needham & Company, LLC
|
Canaccord Genuity
|
Raymond James
|
The date of
this prospectus
is ,
2011.
TABLE OF
CONTENTS
You should rely only on the information contained in this
prospectus, any free writing prospectus prepared by or on behalf
of us or any information to which we have referred you. Neither
we, the selling stockholders nor the underwriters have
authorized anyone to provide you with information different from
that contained in this prospectus. We and the selling
stockholders are offering to sell, and seeking offers to buy,
shares of common stock only in jurisdictions where offers and
sales are permitted.
Until ,
2011 (25 days after commencement of this offering), all
dealers that buy, sell, or trade our shares of common stock,
whether or not participating in this offering, may be required
to deliver a prospectus. This delivery requirement is in
addition to the obligation of dealers to deliver a prospectus
when acting as underwriters and with respect to their unsold
allotments or subscriptions.
For investors outside the United
States: Neither we, the selling stockholders nor
any of the underwriters have done anything that would permit
this offering or possession or distribution of this prospectus
in any jurisdiction where action for that purpose is required,
other than in the United States. You are required to inform
yourselves about and to observe any restrictions relating to
this offering and the distribution of this prospectus.
PROSPECTUS
SUMMARY
This summary highlights information contained elsewhere in
this prospectus and does not contain all of the information you
should consider in making your investment decision. You should
read this summary together with the more detailed information,
including our historical financial statements and the related
notes, elsewhere in this prospectus. You should carefully
consider, among other things, the matters discussed in
“Risk Factors.” As used in this prospectus,
“we,” “SiGe,” the “company,”
“us,” “our” and similar designations refer
to SiGe Semiconductor, Inc. on a consolidated basis, unless
otherwise indicated. Unless otherwise stated, all years refer to
our fiscal year.
Overview
We are a leading provider of highly integrated radio frequency,
which we refer to as RF, semiconductor front end solutions that
enable wireless connectivity across a wide range of
applications. Our innovative solutions integrate multiple RF
functions into a single semiconductor device to deliver an
optimal combination of performance, size, power output and
efficiency. Our predominant use of standard silicon based
processes and fabless manufacturing model enables us to achieve
high levels of functional integration, leverage the economies of
scale of high volume manufacturing technology, maintain low
costs and accelerate our
time-to-market.
We have shipped more than 700 million front end solutions
since our inception, primarily consisting of Wi-Fi front end
modules and power amplifiers.
Our solutions are incorporated into a broad range of products,
including desktop and laptop computers and peripherals, consumer
and enterprise networking equipment and home entertainment
devices. We have recently entered the smartphone and mobile
Internet device markets and recently began shipping Wi-Fi front
end modules to one of the world’s leading mobile handset
manufacturers. Though our revenues to date from this
manufacturer have not been material, we aim to steadily increase
these revenues and expand our sales of Wi-Fi front end modules
in the smartphone and mobile Internet device markets. In
addition, we recently introduced our first solutions for
cellular infrastructure and smart energy applications. We have
developed RF front end solutions for a variety of wireless
communications protocols, including Wi-Fi, Global Positioning
System, which we refer to as GPS, Bluetooth and certain smart
energy protocols including ZigBee. We have also developed RF
components for several 3G and 4G wireless broadband protocols.
While we have historically used a combination of silicon and
non-silicon based process technologies to meet the needs of our
customers, we believe our predominant use of silicon based
technologies positions us to effectively meet the integration
and performance demands of an array of high volume RF
applications.
We work with leading reference design partners such as Atheros
Communications Inc., Broadcom Corporation, Cambridge Silicon
Radio plc, Marvell Technology Group Ltd., and Ralink Technology
Corporation to qualify and market our products. According to
publicly available information, our products have been
incorporated into devices branded by leading original equipment
manufacturers, which we refer to as OEMs, including Apple Inc.,
Cisco Systems, Inc., Hewlett-Packard Company, Lenovo Group
Limited, NETGEAR, Inc., Nintendo Co., Ltd., Panasonic
Corporation, Samsung Group, and Technicolor S.A. (formerly known
as Thomson S.A.). We primarily sell our solutions to original
design manufacturers, which we refer to as ODMs, including Hon
Hai Precision Industry Company Ltd., together with its
subsidiaries Ambit Microsystems Ltd. and Foxconn Electronics
Inc. (collectively referred to as Hon Hai), and Universal
Scientific Industrial Co., Ltd., to distributors such as
Promaster Technology Corp. and RichPower Electronic Devices Co.
and, to a lesser extent, directly to OEMs. Substantially all of
our sales are made on a purchase order basis, not under
long-term supply contracts, and we depend on a small number of
customers for a substantial portion of our revenue.
We have grown our revenue by more than 40% annually in six of
the last eight fiscal years. For the fiscal year ended December
31, 2010, we generated revenue of $103.3 million and net
income of $7.0 million. We had an accumulated deficit of
$108.0 million as of December 31, 2010. Our product
1
mix has changed over time in response to greater demand for
more integrated solutions and a relative decrease in demand for
discrete components. Our revenue from the sale of integrated
front end solutions grew from less than 20% of revenue in fiscal
2004 to more than 75% of revenue in fiscal 2010.
Our
Industry
Wireless connectivity continues to evolve from delivering basic
voice and data services to enabling rich multimedia experiences
through always-connected devices. The expansion of broadband
multimedia content, including Voice over Internet Protocol,
streaming video, online gaming and social networking, as well as
the proliferation of smart energy technologies, are driving
increasing demand for wireless connectivity. Wi-Fi has become
the standard protocol for residential and office wireless
networking. Many cellular service providers are actively
expanding the use of Wi-Fi networks in addition to their 3G and
4G cellular networks to help manage increases in data traffic
and to address gaps in network coverage. Other wireless
protocols, including 3G and 4G cellular, GPS, Bluetooth and
certain protocols for smart energy networking are being used for
applications such as voice and data services, location-based
services, wireless peripherals and smart energy devices. Based
on estimates published by IDC, a leading independent market
research firm, total unit shipments of Wi-Fi and GPS
semiconductors are expected to increase from 609 million in
2010 to 962 million in 2013, representing a compound annual
growth rate of 17%.
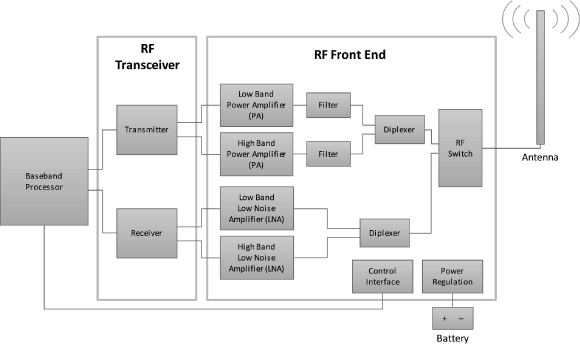
RF semiconductors are fundamental to enabling wireless
connectivity, serving two basic functions: converting RF signals
into analog signals suitable for conversion to digital signals,
and converting analog signals into RF waves suitable for
transmission through the air. Key components of a wireless
semiconductor chipset include a baseband processor, a
transceiver or receiver and an RF front end, which incorporates
one or more power amplifiers, low noise amplifiers, filters,
diplexers, RF switches, power regulators, and control
interfaces. RF semiconductors often must enable multiple inputs,
outputs and frequency bands while minimizing the interference
between components, all of which increase the complexity of RF
integration. A high-end smartphone, for example, can have
multiple RF front ends to support dual-band cellular, Wi-Fi,
GPS, and Bluetooth functionality. These requirements for greater
RF functionality have led to an increase in RF semiconductor
content in wireless devices. As RF semiconductor content
continues to increase, we believe there are significant
opportunities for further advancements in RF integration, while
also improving performance, range, power efficiency and
interoperability.
Our Solution and
Competitive Strengths
We believe that in the market for Wi-Fi, GPS, Bluetooth and
smart energy wireless networking, RF front ends, and in the
market for certain 3G and 4G cellular RF components, many of our
silicon based solutions achieve equal or better performance than
products manufactured with specialty materials, such as gallium
arsenide, which we refer to as GaAs, while simultaneously
exceeding the functional integration limits, heat dissipation
properties and production yields typical of solutions based on
these specialty materials. While solutions based on specialty
materials generally outperform silicon based solutions in
certain wireless markets, we believe our solutions are optimized
for performance, size, power output and efficiency in the
markets we target. The strengths of our solution and of our
business include:
|
|
|
| |
•
|
Ability to Deliver High Performance RF Front End
Solutions. Our product development expertise is
based on deep RF design capabilities and understanding of the
manufacturing process technologies required to produce
high-performance RF front end semiconductors. We believe our
ability to incorporate multiple communications channels and
protocols into a single semiconductor device enables us to
deliver
plug-and-play
solutions that increase overall system performance.
|
2
|
|
|
| |
•
|
Highly Integrated, Silicon Based RF Front End
Solutions. Our use of silicon based materials has
enabled us to develop single device, integrated RF front end
solutions that include power amplifiers, RF switches, low noise
amplifiers, filters, diplexers, control interfaces, power
regulators and related passive circuitry. Increased functional
integration reduces the physical footprint, power consumption
and cost of our RF front end solutions.
|
| |
| |
•
|
Improved
Ease-of-Use
and Support for our Customers. We believe our
ability to integrate various RF front end functions into a
single semiconductor device enables us to provide
plug-and-play
solutions that are easier for our customers to integrate into
their end products, reducing
time-to-market.
We work with many leading wireless reference design partners,
OEMs and ODMs to develop RF solutions that further simplify the
adoption of our products by end customers and provide local
application technical support to ensure our RF front end
solutions meet the specifications of our end customers.
|
|
|
|
| |
•
|
Advanced RF Engineering Capabilities Utilizing Silicon Based
Processes. Our 15 year operating history has
provided us with expertise in a range of silicon and non-silicon
semiconductor materials and processes. We believe our
predominant use of silicon technologies, which have more mature
design and simulation tools, enables us to better test our
designs prior to fabrication, shorten the time from development
to production, and improve production yields.
|
|
|
|
| |
•
|
Market Leadership in High Volume Markets. We
have shipped over 700 million units since our inception and
have been recognized as the global market leader in Wi-Fi front
end modules and power amplifiers. In addition, we believe we
hold significant market share in high volume markets such as
desktop and laptop computers, consumer and enterprise networking
equipment, home entertainment devices and printers.
|
|
|
|
| |
•
|
Highly Efficient and Scalable Fabless Business
Model. We benefit from a fully outsourced
manufacturing model using third party semiconductor foundries
and assembly and test contractors. By using this model, we incur
lower capital expenditures, require fewer personnel and avoid
operating costs stemming from idle capacity while maintaining
greater flexibility to obtain additional production capacity
during periods of increased demand.
|
| |
| |
•
|
Established Base of Leading OEM and ODM Customers and
Reference Design Partners. We have established
strong relationships with multiple leading global reference
design partners, OEMs and ODMs that integrate our RF front end
solutions into their reference designs and products. These close
relationships have enabled us to obtain visibility into our
partners’ and our customers’ future feature and
functionality requirements and to develop substantial
system-level knowledge to optimize our products and accelerate
our
time-to-market.
|
Our Growth
Strategies
We intend to maintain and extend our position as a leading
provider of highly integrated RF semiconductor front end
solutions that enable wireless connectivity across a wide range
of applications by pursuing the following growth strategies:
|
|
|
| |
•
|
Pursue Opportunities in Rapidly-Growing, High Volume
Markets. We intend to maintain our leadership in
existing markets while also pursuing opportunities in new
rapidly-growing, high volume markets. Our strategy to continue
this expansion includes targeting markets that require large
manufacturing volumes, high performance and quality
specifications, and functional integration for wireless
connectivity.
|
| |
| |
•
|
Expand Product Portfolio to Capture Additional RF
Semiconductor Content. We plan to expand our
range of silicon based RF front end solutions through continued
integration of RF functionality to capture additional RF
semiconductor content in wirelessly connected devices.
|
3
|
|
|
| |
•
|
Leverage Our Silicon Design Expertise in RF
Semiconductors. We intend to continue optimizing
our existing designs to provide enhanced functionality for RF
applications. Utilizing silicon based technologies, we plan to
continue to meet customers’ increasing demand for wireless
RF solutions that support multiple communications protocols with
faster transmission speeds, greater numbers of simultaneous
connections, better signal integrity and performance
characteristics, smaller size, and lower cost.
|
| |
| |
•
|
Increase Breadth and Depth of our Customer and Partner
Relationships Through Collaboration. We intend to
continue expanding our end customer and reference design partner
relationships through collaboration on critical design and
product development activities to enable the optimization of
their products for performance, yield, cost and
time-to-market.
In addition, we have invested capital to significantly expand
our reference design activities with new design partners to
pursue opportunities in existing and new markets.
|
Risks Related to
Our Business
Investing in our company entails a high degree of risk,
including those summarized below and those more fully described
in the “Risk Factors” section beginning on
page 11 of this prospectus. You should consider such risks
carefully before deciding to invest in our common stock. These
risks include, among others:
|
|
|
| |
•
|
We depend on a small number of customers for a substantial
portion of our revenue, and the loss of, or a significant
reduction in orders from, one or more of our major customers
could have a material adverse effect on our revenue and
operating results;
|
| |
| |
•
|
We depend on a small number of reference design partners, and
changes in, or termination of, our relationship with a reference
design partner could have a material adverse effect on our
operating results. In addition, winning business is subject to
competitive selection processes that require us to incur
significant expenditures without any assurance of corresponding
revenue and, even if we win business, if the product offerings
of our reference design partners, OEMs and ODMs are not
commercially successful, our revenue and business could suffer;
|
| |
| |
•
|
If our reference design partners successfully integrate RF front
end capability into other semiconductors in a cost effective
manner and they prefer these semiconductors over our solutions,
we may not be able to compete effectively, our revenue will
decline and our business will be harmed;
|
| |
| |
•
|
We have a history of net losses since inception, and we may not
achieve or sustain profitability in the future;
|
|
|
|
| |
•
|
We may not sustain our growth rate, and we may not be able to
manage any future growth effectively; and
|
|
|
|
| |
•
|
Our operating results are subject to substantial quarterly and
annual fluctuations, including seasonal fluctuations, and may
fluctuate significantly due to a number of factors that could
adversely affect our business and our stock price.
|
Corporate
Information
We commenced operations in Canada in 1996. We initially
conducted operations through SiGe Microsystems Inc., a Canadian
company, which was renamed SiGe Semiconductor Inc. in 2001. We
also refer to SiGe Semiconductor Inc. as SiGe Canada. In 2002,
the stockholders of SiGe Canada voted to effect a corporate
reorganization under which SiGe Semiconductor, Inc., the issuer
of shares in this offering, was incorporated in Delaware to
become the parent company of SiGe Canada. In connection with
this corporate reorganization, holders of outstanding shares of
SiGe Canada received exchangeable shares of SiGe Canada that are
exchangeable for shares of SiGe Semiconductor, Inc.,
4
and both SiGe Semiconductor, Inc. and SiGe Canada issued
preferred stock in an equity financing transaction. The
consummation of the corporate reorganization was a condition to
the investment by the investors in the equity financing.
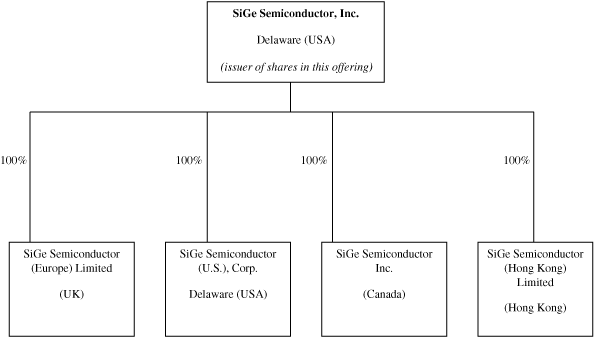
As of the date of this prospectus, we have four direct
wholly-owned subsidiaries as set forth below under
“Corporate Organization.” SiGe Canada is our operating
company located in Canada, which engages primarily in
engineering, quality, manufacturing logistics, finance, legal,
information systems, purchasing and customer invoicing
activities. SiGe Semiconductor (U.S.), Corp. is our operating
company located in the United States, which engages primarily in
engineering, marketing and administrative activities. SiGe
Semiconductor (Europe) Limited is our operating company located
in the United Kingdom, which engages primarily in engineering
activities. SiGe Semiconductor (Hong Kong) Limited is our
operating company located in Hong Kong, which engages primarily
in engineering, customer engineering support, manufacturing
logistics and sales activities.
We are headquartered in Andover, Massachusetts, with offices in
Canada, Hong Kong, England and California. Our principal
executive offices are located at 200 Brickstone Square,
Suite 203, Andover, Massachusetts 01810, and our telephone
number is
(978) 327-6850.
Our web site address is www.sige.com. The information on, or
accessible through, our web site is not part of this prospectus.
We use various trademarks and trade names including, without
limitation, “SiGe” and “SiGe Semiconductor,
enabling wireless multimedia.” This prospectus also
includes other trademarks of SiGe Semiconductor, Inc. and
trademarks of other persons that are the property of their
respective holders.
5
Corporate
Organization
The following chart reflects our organizational structure as of
the date of this prospectus:
6
THE
OFFERING
|
|
|
|
Common stock offered by us |
|
shares |
| |
|
Common stock offered by selling stockholders
|
|
shares |
| |
|
Common stock to be outstanding immediately after this offering
|
|
shares |
| |
|
Underwriters’ option to purchase additional shares
|
|
The underwriters have an option to purchase a maximum
of additional
shares of common stock from the selling stockholders. The
underwriters can exercise this option at any time within
30 days from the date of this prospectus. |
| |
|
Use of Proceeds |
|
We estimate that we will receive net proceeds from the sale of
shares of our common stock in this offering of approximately
$ , after deducting underwriting
discounts and commissions and estimated offering expenses
payable by us. We intend to use our net proceeds from this
offering for working capital and other general corporate
purposes. We will not receive any proceeds from the common stock
sold by the selling stockholders in this offering. See “Use
of Proceeds” in this prospectus. |
| |
|
Proposed NASDAQ Global Market symbol
|
|
SIGE |
The number of shares of common stock to be outstanding
immediately after this offering is based on
78,995,688 shares outstanding as of December 31, 2010
and excludes:
|
|
|
| |
•
|
19,863,355 shares of common stock issuable upon exercise of
outstanding options as of December 31, 2010 at a weighted
average exercise price of $0.31 per share (of which, options to
acquire 15,131,893 shares of common stock are vested as of
December 31, 2010);
|
|
|
|
| |
•
|
shares
of common stock reserved for future issuance under our 2011
Stock Option and Incentive Plan, which will become effective in
connection with this offering (which includes
540,957 shares reserved for future grant or issuance under
our 2002 Stock Plan, as amended, which will be added to the
shares to be reserved under our 2011 Stock Option and Incentive
Plan upon the effectiveness of the 2011 Stock Option and
Incentive Plan);
|
|
|
|
| |
•
|
shares
of our common stock reserved for future issuance under our 2011
Employee Stock Purchase Plan, which will become effective in
connection with this offering;
|
|
|
|
| |
•
|
255,000 options to purchase Standard Common Stock approved by
our Board of Directors on February 16, 2011; and
|
|
|
|
| |
•
|
986,500 options to purchase Standard Common Stock approved by
our Board of Directors subject to a 3,000,000 increase in the
number of shares of Standard Common Stock reserved under the
2002 Plan which was approved by stockholders on March 15,
2011.
|
7
Except as otherwise indicated, all information in this
prospectus:
|
|
|
| |
•
|
gives effect to the issuance of an aggregate of
14,167,285 shares of our common stock issuable upon the
automatic exchange of all of the outstanding common exchangeable
shares of our subsidiary SiGe Semiconductor Inc., a company
organized under the laws of Canada, which we also refer to as
SiGe Canada, in connection with this offering, as described in
“Description of Capital Stock — Exchangeable
Shares” elsewhere in this prospectus;
|
|
|
|
| |
•
|
gives effect to the automatic conversion of all outstanding
shares of our preferred stock, including all shares of our
preferred stock issued in exchange for all of the outstanding
Class A-1
Exchangeable Shares, or preferred exchangeable shares, of SiGe
Canada, into an aggregate of 19,353,591 shares of our
common stock in connection with this offering, as described in
“Description of Capital Stock — Exchangeable
Shares” elsewhere in this prospectus;
|
|
|
|
| |
•
|
gives effect to the filing of our amended and restated
certificate of incorporation and the adoption of our amended and
restated by-laws immediately upon the completion of this
offering; and
|
|
|
|
| |
•
|
assumes no exercise by the underwriters of their option to
purchase up to an
additional shares
of common stock from the selling stockholders.
|
8
SUMMARY
CONSOLIDATED FINANCIAL DATA
The summary consolidated statement of operations data presented
below for the years ended January 2, 2009, or fiscal 2008,
January 1, 2010, or fiscal 2009, and December 31,
2010, or fiscal 2010, have been derived from our audited annual
consolidated financial statements included elsewhere in this
prospectus.
Our historical results are not necessarily indicative of future
operating results. You should read this summary consolidated
financial data in conjunction with the sections entitled
“Risk Factors,” “Capitalization,”
“Selected Consolidated Financial Data,”
“Management’s Discussion and Analysis of Financial
Condition and Results of Operations” and our consolidated
financial statements and related notes, all included elsewhere
in this prospectus.
| |
|
|
|
|
|
|
|
|
|
|
|
|
|
|
|
|
|
|
|
Fiscal
|
|
|
|
|
|
|
|
2008
|
|
|
2009
|
|
|
2010
|
|
|
|
|
|
|
|
(in thousands, except per share amounts)
|
|
|
|
|
|
|
|
Consolidated Statement of Operations Data:
|
|
|
|
|
|
|
|
|
|
|
|
|
|
|
|
|
|
Revenue
|
|
$
|
96,921
|
|
|
$
|
82,602
|
|
|
$
|
103,318
|
|
|
|
|
|
|
Cost of revenue
|
|
|
63,233
|
|
|
|
53,584
|
|
|
|
66,526
|
|
|
|
|
|
|
|
|
|
|
|
|
|
|
|
|
|
|
|
|
|
|
|
|
Gross profit
|
|
|
33,688
|
|
|
|
29,018
|
|
|
|
36,792
|
|
|
|
|
|
|
Operating expenses:
|
|
|
|
|
|
|
|
|
|
|
|
|
|
|
|
|
|
Research and development
|
|
|
16,402
|
|
|
|
15,052
|
|
|
|
14,449
|
|
|
|
|
|
|
Selling, general and administrative
|
|
|
21,569
|
|
|
|
18,489
|
|
|
|
17,846
|
|
|
|
|
|
|
Restructuring
|
|
|
(120
|
)
|
|
|
—
|
|
|
|
—
|
|
|
|
|
|
|
|
|
|
|
|
|
|
|
|
|
|
|
|
|
|
|
|
|
|
|
|
37,851
|
|
|
|
33,541
|
|
|
|
32,295
|
|
|
|
|
|
|
|
|
|
|
|
|
|
|
|
|
|
|
|
|
|
|
|
|
(Loss) income from operations
|
|
|
(4,163
|
)
|
|
|
(4,523
|
)
|
|
|
4,497
|
|
|
|
|
|
|
Interest income, net
|
|
|
380
|
|
|
|
167
|
|
|
|
32
|
|
|
|
|
|
|
|
|
|
|
|
|
|
|
|
|
|
|
|
|
|
|
|
|
(Loss) income before income taxes
|
|
|
(3,783
|
)
|
|
|
(4,356
|
)
|
|
|
4,529
|
|
|
|
|
|
|
Income taxes (recovery)
|
|
|
17
|
|
|
|
21
|
|
|
|
(2,515
|
)
|
|
|
|
|
|
|
|
|
|
|
|
|
|
|
|
|
|
|
|
|
|
|
|
Net (loss) income and comprehensive (loss) income
|
|
|
(3,800
|
)
|
|
|
(4,377
|
)
|
|
|
7,044
|
|
|
|
|
|
|
Accretion to redemption value of preferred stock
|
|
|
(39
|
)
|
|
|
(39
|
)
|
|
|
(40
|
)
|
|
|
|
|
|
Net income allocated to redeemable convertible preferred
stockholders
|
|
|
—
|
|
|
|
—
|
|
|
|
(2,920
|
)
|
|
|
|
|
|
|
|
|
|
|
|
|
|
|
|
|
|
|
|
|
|
|
|
Net (loss) income attributable to common stockholders
|
|
$
|
(3,839
|
)
|
|
$
|
(4,416
|
)
|
|
$
|
4,084
|
|
|
|
|
|
|
|
|
|
|
|
|
|
|
|
|
|
|
|
|
|
|
|
9
| |
|
|
|
|
|
|
|
|
|
|
|
|
|
|
|
|
|
|
|
Fiscal
|
|
|
|
|
|
|
|
2008
|
|
|
2009
|
|
|
2010
|
|
|
|
|
|
|
|
(in thousands, except per share amounts)
|
|
|
|
|
|
|
|
Net (loss) income per
share:(1)
|
|
|
|
|
|
|
|
|
|
|
|
|
|
|
|
|
|
Net (loss) income per share attributable to common stockholders
|
|
|
|
|
|
|
|
|
|
|
|
|
|
|
|
|
|
Basic
|
|
$
|
(0.06
|
)
|
|
$
|
(0.07
|
)
|
|
$
|
0.07
|
|
|
|
|
|
|
|
|
|
|
|
|
|
|
|
|
|
|
|
|
|
|
|
|
Diluted
|
|
|
(0.06
|
)
|
|
|
(0.07
|
)
|
|
|
0.06
|
|
|
|
|
|
|
|
|
|
|
|
|
|
|
|
|
|
|
|
|
|
|
|
|
Shares used to compute net (loss) income per share attributable
to common stockholders
|
|
|
|
|
|
|
|
|
|
|
|
|
|
|
|
|
|
Basic
|
|
|
59,763
|
|
|
|
60,100
|
|
|
|
59,898
|
|
|
|
|
|
|
Diluted
|
|
|
59,763
|
|
|
|
60,100
|
|
|
|
72,908
|
|
|
|
|
|
|
Pro forma net income per share attributable to common
stockholders
(unaudited)(2)
|
|
|
|
|
|
|
|
|
|
|
|
|
|
|
|
|
|
Basic
|
|
|
|
|
|
|
|
|
|
$
|
0.09
|
|
|
|
|
|
|
|
|
|
|
|
|
|
|
|
|
|
|
|
|
|
|
|
|
Diluted
|
|
|
|
|
|
|
|
|
|
|
0.08
|
|
|
|
|
|
|
|
|
|
|
|
|
|
|
|
|
|
|
|
|
|
|
|
|
Shares used to compute pro forma net income per share
attributable to common stockholders
(unaudited)(2)
|
|
|
|
|
|
|
|
|
|
|
|
|
|
|
|
|
|
Basic
|
|
|
|
|
|
|
|
|
|
|
79,252
|
|
|
|
|
|
|
Diluted
|
|
|
|
|
|
|
|
|
|
|
92,262
|
|
|
|
|
|
| |
|
|
|
|
|
|
|
|
|
|
|
|
|
|
|
As of December 31, 2010
|
|
|
|
|
|
|
|
|
|
|
Pro Forma
|
|
|
|
|
Actual
|
|
|
Pro
Forma(2)
|
|
|
As
Adjusted(3)
|
|
|
|
|
(in thousands)
|
|
|
|
|
Balance Sheet Data:
|
|
|
|
|
|
|
|
|
|
|
|
|
|
Cash and cash equivalents
|
|
$
|
10,392
|
|
|
$
|
10,392
|
|
|
|
|
|
|
Working
capital(4)
|
|
|
22,521
|
|
|
|
22,521
|
|
|
|
|
|
|
Total assets
|
|
|
42,479
|
|
|
|
42,479
|
|
|
|
|
|
|
Redeemable convertible preferred stock
|
|
|
19,947
|
|
|
|
—
|
|
|
|
|
|
|
Total stockholders’ equity
|
|
|
8,609
|
|
|
|
28,556
|
|
|
|
|
|
|
|
|
|
(1)
|
|
See note 1(q) to our
consolidated financial statements included elsewhere in this
prospectus for an explanation of the method used to calculate
net (loss) income per share attributable to common stockholders,
including the method used to calculate the number of shares used
in the computation of the per share amounts.
|
|
|
|
|
(2)
|
|
The pro forma data in the tables
above reflects (i) the issuance of an aggregate of
14,167,285 shares of our common stock issuable upon the
automatic exchange of all of the outstanding common exchangeable
shares of SiGe Canada in connection with this offering, as
described in “Description of Capital Stock —
Exchangeable Shares” elsewhere in this prospectus; and
(ii) the automatic conversion of all outstanding shares of
our preferred stock, including all shares of our preferred stock
issued in exchange for all of the outstanding preferred
exchangeable shares of SiGe Canada, into an aggregate of
19,353,591 shares of our common stock in connection with
this offering, as described in “Description of Capital
Stock — Exchangeable Shares” elsewhere in this
prospectus.
|
|
|
|
|
(3)
|
|
The pro forma as adjusted balance
sheet data in the table above reflects our receipt of the
estimated net proceeds from our sale of shares of common stock
in this offering at an assumed initial public offering price of
$ per share, the mid-point of the
price range set forth on the cover of this prospectus, after
deducting underwriting discounts and commissions and estimated
offering expenses payable by us.
|
| |
|
(4)
|
|
Working capital is equal to current
assets less current liabilities.
|
10
RISK
FACTORS
Investing in our common stock involves a high degree of risk.
You should carefully consider the following risk factors, as
well as the other information in this prospectus, before
deciding whether to invest in shares of our common stock. The
occurrence of any of the following risks, or other risks that
are currently unknown or unforeseen by us, could harm our
business, financial condition, results of operations or growth
prospects. In that case, the trading price of our common stock
could decline, and you may lose all or part of your
investment.
Risks Related to
Our Business
We depend on a
small number of customers for a substantial portion of our
revenue, and the loss of, or a significant reduction in orders
from, one or more of our major customers could have a material
adverse effect on our revenue and operating
results.
In fiscal 2010, Hon Hai, Promaster, Universal Scientific
Industrial and RichPower accounted for 26%, 27%, 10% and 15% of
our revenue, respectively, and collectively accounted for 78% of
our revenue for this period. Our operating results for the
foreseeable future will continue to depend on sales to a
relatively small number of customers and on the ability of these
customers to sell products that incorporate our RF front end
solutions. In addition, adverse economic conditions have caused
in the past, and in the future may cause, sales of our solutions
to decrease. Substantially all of our sales to date have been
made on a purchase order basis, which permits our customers to
cancel, change or delay product purchase commitments with little
or no notice to us. In the future, these customers may decide
not to purchase our solutions at all, may purchase fewer
solutions than they did in the past, or may otherwise alter
their purchasing patterns. To attract new customers or retain
existing customers, we may offer favorable prices on our
solutions, which could adversely affect our average selling
prices and gross margins.
We depend on a
small number of reference design partners, and changes in, or
termination of, our relationship with a reference design partner
could have a material adverse effect on our operating results.
In addition, winning business is subject to competitive
selection processes that require us to incur significant
expenditures without any assurance of corresponding revenue and,
even if we win business, if the product offerings of our
reference design partners, OEMs and ODMs are not commercially
successful, our revenue and business could suffer.
We work closely with our reference design partners on the
development of reference designs that incorporate our RF front
end solutions and the qualification of these designs at OEMs and
ODMs. We collaborate with a small number of reference design
partners to market and sell our solutions to OEMs and ODMs.
Adverse changes in, or termination of, our relationship with any
reference design partner could result in a reduction in our
sales to key customers or an inability to attract new customers
and could materially and adversely affect our revenue and
results of operations. A reference design typically consists of
a fully functional and fully tested wireless chipset solution
consisting of a front end solution, a transceiver and a baseband
processor, which is evaluated as a whole by OEMs and ODMs
through a rigorous design selection process. These selection
processes are typically lengthy and can require us to incur
significant design and development expenditures and dedicate
scarce engineering resources in pursuit of a single customer
opportunity. Our reference design partners may not win the
competitive selection process, and we may never generate any
revenue despite incurring significant design and development
expenditures. These risks are exacerbated by the fact that some
of our customers’ products have short life cycles. Failure
to obtain a design win could prevent us from earning any revenue
from an entire generation of an end customer’s product.
This could cause us to lose revenue, require us to write off
obsolete inventory and weaken our position in future competitive
selection processes.
11
Our OEM and ODM customers generally take a considerable amount
of time to evaluate a reference design. The period from early
engagement to high volume production typically takes six to
12 months for existing customers and 12 to 18 months
for new customers. The delays inherent in these lengthy sales
cycles increase the risk that a customer will decide to cancel,
curtail, reduce or delay its product plans, causing us to lose
anticipated sales, which could materially and adversely affect
our business, financial condition and results of operations.
If our reference design partners fail to obtain design wins that
include our solutions, our business could be materially and
adversely affected. Furthermore, even if our solutions are
incorporated into a reference design and an OEM’s end
product, we cannot be assured that the product offering will be
commercially successful or that we will receive any revenue. If
the products incorporating our solutions fail to meet customer
demands or otherwise fail to achieve market acceptance, our
revenue and business will suffer.
If our
reference design partners successfully integrate RF front end
capability into other semiconductors in a cost effective manner
and they prefer these semiconductors over our solutions, we may
not be able to compete effectively, our revenue will decline and
our business will be harmed.
Our solutions provide RF signal amplification, switching and
filtering as part of a multi-chip or multi-component wireless
chipset solution. Certain of our reference design partners
integrate some of the RF front end capabilities that our
solutions provide into other semiconductors. If they are able to
produce these integrated solutions in a cost-effective manner
and if some or all of the wireless functionality that our
solutions provide becomes commonly integrated with other
functionality that we are unable to provide, the demand for our
solutions may decline, our revenue may decline and our business
may be harmed.
We have a
history of net losses, and we may not achieve or sustain
profitability in the future.
We have incurred net losses in the past. We experienced net
losses of $3.8 million and $4.4 million in fiscal 2008
and 2009, respectively. As of December 31, 2010, our
accumulated deficit was $108.0 million. We expect to incur
significant expense related to the development of our solutions
and expansion of our business, including research and
development and sales and administrative expenses. As a public
company, we will also incur significant legal, accounting and
other expenses that we did not incur as a private company.
Additionally, we may encounter unforeseen difficulties,
complications, solution delays and other unknown factors that
require additional expense. As a result of these increased
expenditures, we will have to generate and sustain substantially
increased revenue to achieve future profitability.
We may not
sustain our growth rate, and we may not be able to manage any
future growth effectively.
We have experienced significant growth in a short period of
time. Our revenue increased from $48.5 million in fiscal
2006 to $103.3 million in fiscal 2010. We may not achieve
similar growth rates in future periods. You should not rely on
our historical operating results for any prior quarterly,
semi-annual or annual periods as an indication of our future
operating performance. If we are unable to maintain adequate
revenue growth, our financial results could suffer and our stock
price could decline.
To manage our growth successfully and handle the
responsibilities of being a public company, we believe we must
effectively, among other things:
|
|
|
| |
•
|
recruit, hire, train and manage additional qualified engineers,
especially in the positions of design engineering, product and
test engineering and applications engineering;
|
| |
| |
•
|
add additional sales personnel and expand sales offices;
|
| |
| |
•
|
add additional finance personnel; and
|
12
|
|
|
| |
•
|
implement and improve our administrative, financial and
operational systems, procedures and controls.
|
If we are unable to manage our growth effectively, we may not be
able to take advantage of market opportunities or develop new
solutions and we may fail to satisfy customer requirements,
maintain solution quality, execute our business plan or respond
to competitive pressures.
Our business
is subject to seasonal fluctuations, which may cause our
operating results to fluctuate from quarter to quarter. This may
result in volatility or adversely affect our stock
price.
We experience, and expect to continue to experience, seasonal
fluctuations in our revenue because the markets in which we
operate are subject to seasonal fluctuations. We typically
generate the largest portion of our revenue in the second and
third quarters, largely as a result of increased demand in the
personal computer and video game markets. These fluctuations
could result in volatility in our operating results and
adversely affect our stock price.
Our operating
results are subject to substantial quarterly and annual
fluctuations and may fluctuate significantly due to a number of
factors that could adversely affect our business and our stock
price.
Our revenue and operating results have fluctuated in the past
and are likely to fluctuate in the future. These fluctuations
may occur on a quarterly and annual basis and are due to a
number of factors, many of which are beyond our control. These
factors include, among others:
|
|
|
| |
•
|
potentially adverse economic conditions and their effects on
consumer spending;
|
| |
| |
•
|
changes in end-user demand for the products manufactured and
sold by our customers;
|
| |
| |
•
|
the receipt, reduction or cancellation of significant orders by
customers;
|
| |
| |
•
|
fluctuations in the levels of component inventories held by our
customers;
|
| |
| |
•
|
the gain or loss of significant customers;
|
| |
| |
•
|
market acceptance of our solutions and our end customers’
products;
|
| |
| |
•
|
our ability to develop, introduce and market new solutions and
technologies on a timely basis;
|
| |
| |
•
|
the timing and extent of solution development costs;
|
|
|
|
| |
•
|
incurrence of research and development and related new solution
expenditures;
|
|
|
|
| |
•
|
fluctuations in integrated circuit manufacturing yields of our
foundry partners;
|
| |
| |
•
|
changes in our solution mix or customer mix;
|
| |
| |
•
|
intellectual property disputes;
|
| |
| |
•
|
loss of key personnel or the shortage of available skilled
workers;
|
| |
| |
•
|
the productivity and growth of our sales force; and
|
| |
| |
•
|
the effects of competitive pricing pressures, including
decreases in average selling prices of our solutions.
|
The foregoing factors are difficult to forecast, and these, as
well as other factors, could materially adversely affect our
operating results. We typically are required to incur
substantial development costs in advance of a prospective sale
with no certainty that we will ever recover these costs. A
substantial amount of time may pass between a design win and the
generation of revenue related to the expenses previously
incurred, which can potentially cause our operating results to
fluctuate
13
significantly from period to period. In addition, a significant
amount of our operating expenses are related to personnel. Any
failure to adjust our personnel levels quickly enough to
compensate for a revenue shortfall could magnify its adverse
impact on our results of operations.
If we fail to
develop and introduce new or enhanced solutions on a timely
basis, our ability to attract and retain customers will be
impaired and our competitive position could be
harmed.
We operate in a dynamic environment characterized by rapidly
changing technologies and industry standards and technological
obsolescence. To compete successfully, we must design, develop,
market and sell new or enhanced solutions that provide
increasingly higher levels of performance and reliability while
meeting the cost expectations of our customers. The introduction
of new products by our competitors, the market acceptance of
products based on new or alternative technologies or the
emergence of new industry standards could render our existing or
future solutions obsolete. Our failure to anticipate or develop
new or enhanced solutions could result in loss of business and
decreased revenue. In particular, we may experience difficulties
with solution design, manufacturing, marketing or qualification
that could delay or prevent our development, introduction or
marketing of new or enhanced solutions. If we are not successful
in having our solutions qualified within a particular reference
design or if we fail to introduce new or enhanced solutions that
meet the needs of our customers or penetrate new markets in a
timely fashion, we will lose market share and our operating
results will be adversely affected.
To date, the
vast majority of our revenue has been attributable to demand for
our solutions in the computing, networking and home
entertainment device markets and the overall growth of these
markets. These markets may not grow and develop in ways that we
currently expect and are subject to substantial market risks,
any of which could have a material adverse effect on our
business, revenue and operating results.
Sales of our solutions to customers in the computing, networking
and home entertainment device markets have accounted for the
vast majority of our revenue since inception. We believe that
sales of our solutions to customers in these markets accounted
for more than 90% of our revenue in the fiscal year ended
December 31, 2010, based on our knowledge of ODMs’ and
OEMs’ usage of our solutions and our estimates of the usage
of our solutions by our distributors’ customers. The market
for wireless devices will depend on consumer spending, global
economic conditions and the continued adoption of wireless
technology in various applications, among other factors.
Predicting how the global market for our solutions will develop
is difficult because this market is relatively new and subject
to substantial regulatory requirements and consumer adoption
rates and demand, each of which vary from country to country.
For example, with respect to regulation, wireless networks can
only operate in the frequency bands, or spectrum, allowed by
regulators. We are also subject to restrictions on lead and
certain other substances in electronics that apply to specified
electronics products sold in the European Union under the
Restriction of Hazardous Substances in Electrical and Electronic
Equipment Directive. In addition, we are subject to laws and
other legal requirements, including packaging, product content,
labor and import/export regulations.
Delays in the development of, or unexpected developments in, the
market for wireless devices could have an adverse effect on
order activity by device manufacturers and, as a result, on our
business, revenue, operating results and financial condition.
If we fail to
further penetrate our existing markets or enter new markets, our
revenue and financial condition could be materially and
adversely affected.
Currently, we sell most of our solutions to OEMs and ODMs that
build wireless devices for the computing, networking and home
entertainment device markets. Our future revenue growth, if any,
will depend in part on our ability to increase our penetration
within these existing markets and penetrate relatively new
markets, particularly the markets for mobile phones, smart
energy and cellular infrastructure. If any of these markets does
not develop as we currently anticipate or if we are unable
14
to penetrate any of these markets successfully, it could
materially and adversely affect our revenue and revenue growth
rate, if any.
Moreover, because of differences in international wireless
standards, we expect substantial differences in the development
of wireless markets across different geographic markets. Major
geographic markets have selected different wireless standards
and, once a standard is chosen, substantial network and
infrastructure changes may be required to implement the standard
and make wireless communications generally available. If we fail
to correctly align our development efforts with wireless
standards that are eventually used in large, high volume
markets, we could lose revenue and market share.
The fixed and mobile wireless device market is uncertain and
extremely fluid. We can win and lose customers with very little
notice. Securing design wins with reference design partners will
require a substantial investment of our time and resources. In
addition, our solutions will need to be compatible with other
components in our customers’ designs, including components
produced by our competitors or potential competitors. There can
be no assurance that our OEMs and ODMs will support or continue
to support our solutions.
If we fail to further penetrate our existing markets or enter
new markets that we have targeted, our revenue could decrease
over time and our financial condition could suffer.
We face
intense competition and expect competition to increase in the
future, which could have an adverse effect on our revenue and
market share.
The global semiconductor market in general and the RF
semiconductor market in particular are highly competitive and
tend to commoditize quickly. We compete in different target
markets to varying degrees on the basis of a number of principal
competitive factors, including our solutions’ performance,
features and functionality, energy efficiency, size, ease of
system design, reliability and price, as well as on the basis of
our customer support, the quality of our product roadmap and our
reputation. We expect competition to increase and intensify as
new and established semiconductor companies may decide to enter
our markets. Increased competition could result in price
pressure, reduced profitability and loss of market share, any of
which could materially and adversely affect our business,
revenue and operating results.
Our competitors range from large, international companies
offering a wide range of semiconductor products to smaller
companies specializing in narrow markets. Our primary
competitors include Anadigics Inc., Analog Devices, Inc.,
Hitachi Metals America, Ltd., Hittite Microwave Corporation,
Maxim Integrated Products, Inc., Microsemi Corporation,
Microchip Technology, Inc., Murata Manufacturing Co., Ltd., RF
Micro Devices, Inc., Richwave Technology Corp., Skyworks
Solutions, Inc., and TriQuint Semiconductor, Inc. We expect
competition in the markets in which we participate to increase
in the future as existing competitors improve or expand their
product offerings. In addition, we believe that a number of
other public and private companies are in the process of
developing competing products for wireless applications or are
developing products that integrate various RF front end
capabilities in their transceiver solutions. Atheros, Broadcom
and Intel Corporation, currently offer or are developing certain
semiconductor products that have integrated RF power amplifiers,
sales of which could diminish demand for our RF power amplifiers.
Our ability to compete successfully depends on elements both
within and outside of our control, including industry and
general economic trends. During past periods of downturns in our
industry, competition in the markets in which we operate
intensified as manufacturers of semiconductors reduced prices in
order to address production overcapacity and high inventory
levels. In particular, vertically integrated manufacturers of RF
semiconductors using GaAs technology have captive manufacturing
facilities that can be operated at a loss to compete with our
solutions. Many of our competitors have substantially greater
financial and other resources with which to withstand similar
adverse economic or market conditions in the future. Any
inability to compete successfully in our chosen markets could
materially and adversely affect our business, revenue and
operating results.
15
We outsource
our wafer fabrication, assembly, testing and shipping operations
to third parties, and if these parties fail to produce and
deliver our solutions according to requested demands regarding
specification, quantity, cost and time, our reputation, customer
relationships and operating results could suffer.
We do not have our own manufacturing facilities. We operate an
outsourced manufacturing model that utilizes third party foundry
and assembly and test capabilities. As a result, we rely on
third party foundry wafer fabrication and assembly and test
capacity, which is sole-sourced for many of our solutions. We
currently outsource silicon wafer fabrication to IBM
Microelectronics, GaAs wafer fabrication to WIN Semiconductor
Corp. and integrated passive device manufacturing to STATS
ChipPAC Ltd. Our primary assembly and test contractors include
Unisem (M) Berhad, Foxconn and Tong Hsing Electronic
Industries Ltd.
Relying on third party manufacturing, assembly and testing
presents significant risks to us, including the following:
|
|
|
| |
•
|
failure by us, our customers, or their end customers to qualify
a selected supplier;
|
| |
| |
•
|
capacity shortages in test, assembly, or wafer manufacturing
during periods of high demand;
|
| |
| |
•
|
reduced control over delivery schedules and quality;
|
| |
| |
•
|
shortages of materials;
|
| |
| |
•
|
misappropriation of our intellectual property;
|
| |
| |
•
|
limited warranties on wafers or products supplied to us; and
|
| |
| |
•
|
potential increases in prices.
|
The ability and willingness of our third party contractors to
perform their obligations is largely outside our control. If one
or more of our contract manufacturers or other outsourcers fails
to perform its obligations in a timely manner or at satisfactory
quality levels, our ability to bring solutions to market and our
reputation could suffer. For example, in the event there is a
significant and sudden increase in demand, or if manufacturing
capacity is reduced or eliminated at one or more facilities, in
either case including in response to a downturn in the
semiconductor industry, we could have difficulties fulfilling
our customer orders and our revenue could decline. In addition,
if these third parties fail to deliver quality products and
services on time and at reasonable prices, we could have
difficulties fulfilling our customer orders, our revenue could
decline and our business, financial condition and results of
operations would be adversely affected.
If our foundry
vendors or assembly and test contractors do not achieve
satisfactory yields or quality, or are unable to meet our
customers’ delivery requirements, our reputation and
customer relationships could be harmed.
The fabrication, assembly and testing of RF semiconductors are
complex and technically demanding processes. Minor deviations
can cause substantial changes in RF performance, and in some
cases, cause production to be suspended. Our foundry vendors or
our assembly and test contractors could, from time to time,
experience defects and reduced yields. Moreover, we may not be
aware of problems in their processes until large quantities of
products have been produced. For example, changes in
manufacturing processes or the inadvertent use of defective or
contaminated materials by our foundry vendors could result in
lower than anticipated manufacturing yields or unacceptable
performance. Many of these problems are difficult to detect at
an early stage and may be time consuming and expensive to
correct. Poor yields from our foundry vendors or our assembly
and test contractors or defects, integration problems or other
performance problems in our products could cause us significant
customer relations and reputation problems, harm our financial
results and result in financial or other damages to our
customers or reference design partners. Our customers
16
could also seek damages from us for their losses. A product
liability claim brought against us, even if unsuccessful, would
likely be time consuming and costly to defend.
If we experience manufacturing or test and assembly problems at
a particular location, we would be required to transfer the
affected operations to a backup location or supplier. Converting
or transferring operations from a primary location or supplier
to a backup facility could be expensive and could take a year or
more. During such a transition, we would be required to meet
customer demand from our then-existing inventory. We do not seek
to maintain sufficient inventory to address a lengthy transition
period because we believe it is uneconomical to keep more than
minimal inventory on hand. As a result, we may not be able to
meet customer needs during such a transition, which could delay
shipments, cause production delays or stoppages for our
customers, result in a decline in our sales and damage our
relationships with our customers and reference design partners.
In addition, a significant portion of our sales are to customers
that practice
just-in-time
order management from their suppliers, which gives us a very
limited amount of time in which to process and complete these
orders. As a result, delays in our production or shipping by the
parties to whom we outsource these functions could reduce our
sales, damage our customer relationships and our reputation in
the marketplace, any of which could harm our business, results
of operations and financial condition.
We may
experience difficulties in transitioning to new wafer
fabrication process technologies or in achieving higher levels
of design integration, which may result in reduced manufacturing
yields, delivery delays and increased costs.
To remain competitive, we expect to continue to transition our
semiconductor solutions to higher levels of functional
integration and to achieve higher levels of RF performance.
These ongoing efforts require us from time to time to
incorporate new manufacturing processes for our solutions and to
redesign some solutions, which in turn may result in delivery
delays. We periodically evaluate the benefits of migrating to
new process technologies to reduce cost and improve performance.
We may face difficulties, delays and increased expenses as we
transition our solutions to new processes and potentially to new
foundries. We depend on our relationships with IBM
Microelectronics and WIN Semiconductor to transition to new
processes successfully. We cannot assure you that IBM
Microelectronics or WIN Semiconductor will be able to
effectively manage the transition or that we will be able to
maintain our relationship with IBM Microelectronics or WIN
Semiconductor or develop relationships with new foundries. As
new processes become more prevalent, we expect to continue to
integrate greater levels of functionality into our solutions.
However, we may not be able to achieve higher levels of design
integration or deliver new integrated solutions on a timely
basis.
Any increase
in the costs of the raw goods used in our solutions or in the
manufacturing or assembly and test costs of our solutions could
reduce our gross margins and operating profit.
Our solutions incorporate commodities such as gold, platinum,
copper and silicon. The price of gold and other commodities used
in our business fluctuate from time to time. From
January 2, 2009 to December 31, 2010, the price of
gold increased 61%, from $875.40 per ounce to $1,405.50 per
ounce. Currently, we do not hedge our exposure to fluctuations
in the prices of these commodities. Our failure to obtain
sufficient quantities of raw materials at reasonable prices or
our inability to pass on higher materials costs to our customers
could have a material adverse effect on our business, financial
condition and results of operations.
In addition, the semiconductor business exhibits ongoing
competitive pricing pressure from customers and competitors. Any
increase in the cost of the components used to build our
solutions or otherwise in the cost of manufacturing, assembling
or testing our solutions will reduce our gross margins and
operating profit. We do not have any long-term supply agreements
with our foundry vendors, other than IBM Microelectronics, or
our assembly and test contractors, and we negotiate pricing
periodically. Consequently, we may not be able to obtain price
reductions or anticipate or prevent future price increases from
our suppliers. We cannot assure that our foundry partners will
be able to deliver enough semiconductor wafers to our assembly
and test contractors, or that our
17
assembly and test contractors will be able to delivery
satisfactory services to us, at reasonable prices. These and
other related factors could impair our ability to meet our
customers’ needs and have a material and adverse effect on
our operating results.
We do not have
any long-term supply contracts with our contract manufacturers
or suppliers, and any disruption in our supply of products,
materials or services could have a material adverse affect on
our business, revenue and operating results.
We currently do not have long-term supply contracts with any of
our third party vendors except for IBM Microelectronics. We make
substantially all of our purchases on a purchase order basis,
and none of our foundry partners or assembly and test
contractors are required to supply us products, materials or
services for any specific period or in any specific quantity. We
expect that it would take a year or more to transition
production from our foundry vendors or assembly and testing
contractors to new providers. Such a transition would likely
require a re-qualification process by our OEMs and ODMs.
We generally place orders for products with our vendors and
contractors approximately three to five months prior to the
anticipated delivery date, with order volumes based on our
forecasts of demand from our customers. Accordingly, if we
inaccurately forecast demand for our solutions, we may be unable
to obtain adequate and cost-effective foundry or assembly and
test capacity from our third party contractors to meet our
customers’ delivery requirements, or we may accumulate
excess inventories. On occasion, we have been unable to
adequately respond to unexpected increases in customer purchase
orders and therefore were unable to benefit from this
incremental demand. None of our third party contractors has
provided any assurance to us that adequate capacity will be
available to us within the time required to meet additional
demand for our solutions.
In the past, we have experienced limitations in test capacity.
We have been required to make capital expenditures for our own
automated testing equipment placed at and maintained by our test
subcontractors in order to meet forecasted demand for our
solutions. We may be required to purchase additional testing
equipment in the future to satisfy increasing volumes of
production.
Average
selling prices for our products have historically decreased
consistently over time and will likely do so in the future,
which could have a material adverse effect on our revenue and
gross margins.
We may experience substantial
period-to-period
fluctuations in future operating results due to the erosion of
average selling prices in the markets for our products. Because
our new products are often designed with improved performance
specifications and increased functionality compared to previous
generation products, it is difficult to isolate and quantify the
impact of price erosion on our results of operations in a given
period. Over time, however, we believe that the markets for our
products have historically exhibited a consistent pattern of
price erosion, especially as a new generation of a product is
introduced. From time to time, we have reduced the average unit
price of our solutions in anticipation of competitive pricing
pressures, new product introductions by us or our competitors
and for other reasons. If we are unable to offset any direct or
indirect reductions in our average selling prices by increasing
our sales volumes, improving the gross margins of our existing
solutions or introducing new solutions with higher gross
margins, our revenue and gross margins will suffer. To maintain
our gross margins, we must develop and introduce new solutions
and enhancements on a timely basis and continually reduce our
costs. Failure to do so would cause our revenue and gross
margins to decline.
18
We are subject
to risks associated with our distributors’ inventories and
sell-through. If any of our distributors reduce their sales of
our solutions or stop selling our solutions, our business would
suffer.
We currently supply some of our solutions to end customers
through sales to our distributors, who maintain their own
inventories of our solutions. Sales to our two largest
distributors accounted for approximately 42% of our revenue in
fiscal 2010. If our distributors are unable to sell an adequate
amount of their inventories of our solutions in a given fiscal
period or if they decide to decrease their inventories of our
solutions for any reason, our sales to these distributors and
our revenue may decline. In addition, if some distributors
decide to purchase more of our solutions than are required to
satisfy end customer demand in any particular fiscal period,
inventories at these distributors would grow in that fiscal
period. These distributors likely would reduce future orders
until inventory levels realign with end customer demand, which
could adversely affect our revenue in subsequent periods.
Our reserve estimates with respect to the solutions stocked by
our distributors are based principally on reports provided to us
by our distributors, typically on a monthly basis, as well as on
our historical results. To date, we believe that this data
generally has been accurate. To the extent that this resale and
channel inventory data is inaccurate or not received in a timely
manner, we may not be able to make reserve estimates for future
periods accurately or at all.
We are subject
to order and shipment uncertainties, and differences between our
estimates of customer demand and product mix and our actual
results could negatively affect our inventory levels, sales and
operating results.
Our revenue is generated on the basis of purchase orders with
our customers rather than long-term purchase commitments. In
addition, our customers can cancel purchase orders or defer the
shipments of our solutions at any time and for any reason. Our
solutions are manufactured, assembled and tested by our foundry
partners and assembly and test contractors according to our
estimates of customer demand, which require us to make demand
forecast assumptions for every customer, each of which may
introduce significant variability into our aggregate estimate.
Moreover, because certain of our target markets are relatively
new, many of our customers have difficulty accurately
forecasting their product requirements and estimating the timing
of their new product introductions, which ultimately affects
their demand for our solutions. We have established
relationships with multiple reference design partners, OEMs and
ODMs that integrate our RF front end solutions into their
reference designs and products. These relationships have enabled
us to obtain visibility into our partners’ and our
customers’ future feature and functionality requirements
and to develop system-level knowledge to optimize our products.
While these relationships have enabled us to develop products
that our customers may need, we have limited visibility into
future customer demand and the product mix that our customers
will require, which could adversely affect the accuracy of our
revenue forecasts. Demand for consumer electronic devices has
been, and will continue to be, significantly impacted by global
economic conditions. Historically, because of this limited
visibility, actual results have been different from our
forecasts of customer demand. Some of these differences have
been material, leading to excess inventory or product shortages
and revenue and margin forecasts above those we were actually
able to achieve. These differences may continue to occur in the
future, and the adverse impact of these differences between
forecasts and actual results could grow.
In addition, the rapid pace of innovation in our industry could
render significant portions of our inventory obsolete. Excess or
obsolete inventory levels could result in unexpected expenses or
increases in our reserves that could adversely affect our
business, operating results and financial condition. Conversely,
if we were to underestimate customer demand or if sufficient
manufacturing capacity were unavailable, we could forego revenue
opportunities, potentially lose market share, damage our
customer relationships or damage our relationships with our
reference design partners. Any significant future cancellations
or deferrals of product introductions and orders or the return
of previously sold products due to manufacturing defects could
materially and adversely impact our
19
revenue and profit margins, increase our write-offs due to
product obsolescence and restrict our ability to fund our
operations.
We may be
unable to make the substantial and productive research and
development investments required to remain competitive in our
business.
The semiconductor industry requires substantial investment in
research and development in order to develop and bring to market
new and enhanced technologies and solutions. Our research and
development expense, net of government and other funding, was
$16.4 million in fiscal 2008, $15.1 million in fiscal
2009 and $14.4 million in fiscal 2010. Although we had
reduced research and development spending in connection with the
2009 economic downturn, we are committed to investing in new
product development in order to stay competitive in our markets,
and we plan to continue investing in our research and
development capabilities. We do not know whether we will have
sufficient resources to maintain the level of investment in
research and development required to remain competitive. In
addition, we cannot assure you that the technologies which are
the focus of our research and development expenditures will
become commercially successful.
Our business
would be adversely affected by the departure of existing members
of our senior management team.
Our success depends, in large part, on the continued
contributions of our senior management team, in particular, the
services of Sohail A. Khan, our President and Chief Executive
Officer, Peter L. Gammel, Ph.D., our Chief Technical Officer and
Vice President of Engineering, and George W. Haberlin, our Chief
Operating Officer and Vice President, Worldwide Sales. None of
our senior management team is contractually bound to remain with
us for a specified period, and we do not currently maintain key
person life insurance covering our senior management. In
addition, we have entered into non-compete agreements in respect
of the services of Mr. Khan and Dr. Gammel but no
other member of our executive management team. A significant
portion of the options we have granted to our senior management
team are vested. The loss of any member of our senior management
team could harm our ability to implement our business strategy
and respond to the rapidly changing market conditions in which
we operate.
If we are
unable to attract, train and retain qualified personnel,
especially our design and technical personnel, we may not be
able to execute our business strategy effectively.
Our future success depends on our ability to attract, motivate
and retain qualified personnel, including our management, sales
and marketing and finance, and especially our design and
technical personnel. We do not know whether we will be able to
retain all of these personnel as we continue to pursue our
business strategy. We may have to establish new offices in new
locations, which will include engineering teams, in order to
pursue our business strategy. Historically, we have encountered
difficulties in hiring and retaining qualified engineers because
there is a limited pool of engineers with the expertise required
in our field and in our research and development locations.
Competition for these personnel is intense in the semiconductor
industry. As the source of our technological and product
innovations, our design and technical personnel represent a
significant asset. The loss of the services of one or more of
our key employees, especially our key design and technical
personnel, or our inability to retain, attract and motivate
qualified design and technical personnel, could have a material
adverse effect on our business, financial condition and results
of operations.
20
The complexity
of our semiconductor solutions could result in unforeseen delays
or expenses from undetected defects, errors or bugs in hardware
or software, which could reduce the market acceptance for our
new semiconductor solutions, damage our reputation with current
or prospective customers or reference design partners and
adversely affect our operating costs.
Highly complex semiconductor products such as our RF front end
solutions may contain defects and undetected performance flaws
when they are first introduced to market. Moreover, both
qualification and production testing can be limited or provide
erroneous results that lead us to believe that a product is
ready for the market. We have in the past experienced, and may
in the future experience, defects and flaws in our products. If
any of our solutions contains defects or flaws, or has
reliability, quality or compatibility problems, we may not be
able to successfully correct these problems. Consequently, our
reputation may be damaged. Customers may not be able to ship
their products and customers may be reluctant to buy our
solutions, which could materially and adversely affect our
ability to retain existing customers and attract new customers,
and adversely affect our financial results. In addition, these
defects could interrupt or delay sales to our customers. If any
of these problems are not found until after we have commenced
commercial production of a new product, we may be required to
incur additional development costs and product recall, repair or
replacement costs. These problems may also result in claims
against us by our customers or others. As a result, our
operating costs could be adversely affected.
We are subject
to warranty claims, product liability and product
recalls.
From time to time, we may be subject to warranty or product
liability claims that may require us to make significant
expenditures to defend these claims or pay compensation to our
customers. We maintain product liability insurance, but this
insurance is limited in amount and subject to significant
deductibles. There is no guarantee that our insurance will be
available or adequate to protect against all claims. We also may
incur costs and expenses relating to a recall of one of our
customers’ products if one of our devices included in that
product is subject to defects, warranty claims or product
recalls. The process of identifying a recalled product in
devices that have been widely distributed may be lengthy and
require significant resources, and we may incur significant
replacement costs, contract damage claims from our customers and
reputational harm. Costs or payments made in connection with
warranty and product liability claims and product recalls could
materially affect our financial condition and results of
operations.
We support our
research and development efforts in part through a grant from
the Government of Ontario that is subject to certain
conditions.
In March 2010, the Government of Ontario, Canada awarded us a
five year grant under the Next Generation of Jobs Fund,
effective as of August 17, 2009, which we refer to as
NGOJF. Under the NGOJF grant, certain of our research and
development costs and expenses associated with our research and
development activities incurred between August 2009 and August
2014 may be reimbursed on a quarterly basis up to a total
of CDN$7.0 million. In order to be eligible to receive
reimbursements under the NGOJF grant, we must incur expenses
that meet certain criteria, such as expenses for machinery and
equipment, labor, research and development, training and
overhead relating to a particular project, and we must hire and
retain a minimum number of employees in the Province of Ontario.
During the grant period through August 2014, we have committed
to hire 31 new employees and retain the 45 Ontario employees
that we had at the beginning of the grant period. If we fail to
maintain compliance with, or fail to incur qualified expenses
under, the terms of the NGOJF grant, we would not be eligible to
receive grant funds under the NGOJF, which could materially and
adversely affect our financial condition. In addition, subject
to the Ontario Government’s final review and audit of the
NGOJF project and associated expenses, we may be obligated to
repay some portion of the grant if the Ontario Government
determines that we have inappropriately claimed certain research
and development expenses or failed to achieve the employee
hiring and retaining
21
commitments at the conclusion of the five year term. We believe
we are in material compliance with the terms of the NGOJF grant
as of December 31, 2010.
We may face
claims of intellectual property infringement, which could be
time-consuming, costly to defend or settle and result in the
loss of significant rights.
The semiconductor industry is characterized by companies that
hold large numbers of patents and other intellectual property
rights and that vigorously pursue, protect and enforce
intellectual property rights. From time to time, third parties
may assert against us, our customers and our distributors their
patent and other intellectual property rights to technologies
that are important to our business. In addition, one or more
inventors may assert a claim of ownership rights on technology
owned by us.
Claims that our solutions, processes or technology infringe
third party intellectual property rights, regardless of their
merit or resolution, could be costly to defend or settle and
could divert the efforts and attention of our management and
technical personnel. In addition, many of our customer and
distributor agreements require us to indemnify and defend our
customers or distributors from third party infringement claims
and pay damages in the case of adverse rulings. Claims of this
sort also could harm our relationships with our customers or
distributors and might deter future customers from doing
business with us. We do not know whether we will prevail in
these proceedings given the complex technical issues and
inherent uncertainties in intellectual property litigation. If
any future proceedings result in an adverse outcome, we could be
required to:
|
|
|
| |
•
|
cease the manufacture, use or sale of the infringing products,
processes or technology;
|
| |
| |
•
|
pay substantial damages for infringement;
|
| |
| |
•
|
expend significant resources to develop non-infringing products,
processes or technology;
|
| |
| |
•
|
license technology from the party claiming infringement, which
license may not be available on commercially reasonable terms,
or at all;
|
| |
| |
•
|
cross-license our technology to a competitor to resolve an
infringement claim, which could weaken our ability to compete
with that competitor; or
|
| |
| |
•
|
pay substantial damages to our customers or end users to
discontinue their use of or to replace infringing technology
sold to them with non-infringing technology.
|
Any of the foregoing results could have a material adverse
effect on our business, financial condition and results of
operations.
We utilize a
significant amount of intellectual property in our business. If
we are unable to protect our intellectual property, our business
could be adversely affected.
Our success depends in part upon our ability to protect our
intellectual property. To accomplish this, we rely on a
combination of intellectual property laws, including patent,
copyright, trademark and trade secret laws in the United States
and in selected foreign countries where we believe filing for
such protection is appropriate. We also rely on trade secrets,
technical know-how and continuing innovation to develop and
maintain our competitive position.
We cannot guarantee that:
|
|
|
| |
•
|
any of our present or future patents or patent claims will not
lapse or be invalidated, circumvented, challenged or abandoned;
|
| |
| |
•
|
our intellectual property rights will provide competitive
advantages to us;
|
| |
| |
•
|
our ability to assert our intellectual property rights against
potential competitors or to settle current or future disputes
will not be limited by our agreements with third parties;
|
22
|
|
|
| |
•
|
any of our pending or future patent applications will be issued
or have the coverage originally sought;
|
| |
| |
•
|
our intellectual property rights will be enforced in
jurisdictions where competition may be intense or where legal
protection may not be as protective as in the United States;
|
| |
| |
•
|
any of the trademarks, copyrights, trade secrets or other
intellectual property rights that we presently employ in our
business will not lapse or be invalidated, circumvented,
challenged or abandoned; or
|
| |
| |
•
|
we will not lose the ability to assert our intellectual property
rights against or to license our technology to others and
collect royalties or other payments.
|
In addition, our competitors or others may design around our
protected patents or technologies. Effective intellectual
property protection may be unavailable or more limited in one or
more relevant jurisdictions relative to those protections
available in the United States, or may not be applied for in one
or more relevant jurisdictions. As a result, we may not be able
to effectively prevent competitors outside the United States
from using our intellectual property, which could limit our
ability to assert our intellectual property rights, impede our
ability to compete, limit the value of our technology or
otherwise negatively impact our business, financial condition
and results of operations.
Monitoring unauthorized use of our intellectual property is
difficult and costly. Unauthorized use of our intellectual
property may have occurred or may occur in the future. Our
failure to identify unauthorized use and otherwise adequately
protect our intellectual property may adversely affect our
business. Moreover, if we are required to commence litigation,
whether as a plaintiff or defendant, not only would this be
time-consuming, but we would also be forced to incur significant
costs and such litigation could divert the attention and efforts
of our management and employees, which could, in turn, result in
lower revenue and higher expenses. An adverse decision in any of
these legal actions could limit our ability to assert our
intellectual property rights, limit the value of our technology,
or otherwise negatively impact our business, financial condition
and results of operations.
We also rely on customary contractual protections with our
customers, suppliers, distributors, employees and consultants,
and we implement security measures to protect our trade secrets.
We cannot assure you that these contractual protections and
security measures will not be breached, that we will have
adequate remedies for any such breach or that our suppliers,
employees or consultants will not assert rights to intellectual
property arising out of such contracts.
In addition, we have a number of third party patent and
intellectual property license agreements under which we license
intellectual property which, although important for the
business, is not material, as it can be removed or replaced with
existing third party technology. In the future, we may need to
obtain additional licenses, renew existing license agreements or
otherwise replace existing technology. Although we are confident
that there are third party vendors that can provide the
technology that we currently license, we are unable to predict
whether these licenses can be obtained, renewed or replaced on
acceptable terms, or at all.
We have been
adversely affected by global recessions and limited availability
of credit, and future global recessions and continued credit
tightening could adversely affect us.
Our sales were adversely affected by the recent global recession
and corresponding tightening of credit. If uncertain economic
conditions continue or worsen, our customers could experience
financial difficulties and as a result modify, delay or cancel
plans to purchase our solutions or services or become unable to
make payment to us for amounts due and owing. In addition, our
suppliers could experience credit or other financial
difficulties that could result in delays in their ability to
supply us with necessary raw materials, components or finished
products. These conditions may make it extremely difficult for
our customers, our suppliers and us to accurately forecast and
plan future business activities and could result in asset
impairments. The occurrence of any of these factors could have
an adverse effect on our business, financial condition and
results of operations.
23
Our business,
financial condition and results of operations could be adversely
affected by the political and economic conditions of the
countries in which we conduct business and other factors related
to our international operations.
Sales to customers in Asia accounted for over 90% of our revenue
in fiscal 2010. All of our solutions are assembled and tested in
Asia, and our major distributors are located in Asia. In
addition, as of December 31, 2010, 36 of our employees are
located in Asia. Multiple factors relating to our international
operations and to particular countries in which we operate could
have a material adverse effect on our business, financial
condition and results of operations. These factors include:
|
|
|
| |
•
|
changes in political, regulatory, legal or economic conditions;
|
| |
| |
•
|
restrictive governmental actions, such as restrictions on the
transfer or repatriation of funds and foreign investments and
trade protection measures, including export duties and quotas
and customs duties and tariffs;
|
| |
| |
•
|
disruptions of capital and trading markets;
|
| |
| |
•
|
changes in import or export licensing requirements;
|
| |
| |
•
|
transportation delays;
|
| |
| |
•
|
civil disturbances or political instability;
|
| |
| |
•
|
geopolitical turmoil, including terrorism, war or political or
military coups;
|
| |
| |
•
|
the escalation of tension, and potential hostilities, on the
Korean peninsula;
|
| |
| |
•
|
public health emergencies;
|
| |
| |
•
|
differing employment practices and labor standards;
|
| |
| |
•
|
limitations on our ability under local laws to protect our
intellectual property;
|
| |
| |
•
|
local business and cultural factors that differ from our
customary standards and practices;
|
| |
| |
•
|
nationalization and expropriation;
|
| |
| |
•
|
changes in tax laws;
|
| |
| |
•
|
currency fluctuations relating to our international operating
activities; and
|
| |
| |
•
|
difficulty in obtaining distribution and support.
|
In addition, if the government of any country in which our
solutions are manufactured or sold sets technical standards for
products manufactured in or imported into their country that are
not widely shared, it may lead some of our customers to suspend
imports of their products into that country, require
manufacturers in that country to manufacture products with
different technical standards and disrupt cross-border
manufacturing relationships which, in each case, could have a
material adverse effect on our business, financial condition and
results of operations.
Our third
party contractors are concentrated primarily in Taiwan, China
and Malaysia, areas subject to earthquakes and other risks. Any
disruption to the operations of these contractors could cause
significant delays in the production or shipment of our
solutions.
A significant portion of our solutions are manufactured by third
party contractors located in Taiwan, China, and Malaysia. The
risk of an earthquake or tsunami in those areas and elsewhere in
the Pacific Rim region is significant due to the proximity of
major earthquake fault lines to the facilities of our assembly
and test subcontractors. For example, in December 2006 and June
2003, major earthquakes occurred in Taiwan. Although our third
party contractors did not suffer any significant damage as a
result of these most recent earthquakes, the occurrence of
additional earthquakes, fires, flooding or other natural
disasters or political unrest, war, labor strikes, work
stoppages or public
24
health crises such as outbreaks of H1N1 flu, could result in the
disruption of our foundry or assembly and test capacity. Any
disruption resulting from such events could cause significant
delays in the production or shipment of our solutions until we
are able to shift our manufacturing, assembling or testing from
the affected contractor to another third party vendor. We may
not be able to obtain alternate capacity on favorable terms, if
at all.
Our results of
operations could be affected by natural events in the locations
in which our customers or suppliers operate.
Several of our customers and suppliers have operations in
locations that are subject to natural disasters, such as severe
weather and geological events, which could disrupt the
operations of those customers and suppliers as well as our
operations. For example, in March 2011, the northern region of
Japan experienced a severe earthquake followed by a tsunami.
These geological events caused significant damage in that region
and have adversely affected Japan’s infrastructure and
economy. Several of our customers and suppliers are located in
Japan and they have experienced, and may experience in the
future, shutdowns as a result of these events, and their
operations may be negatively impacted by these events. Since our
solutions are one of many components used by our ODMs in
manufacturing their products for their customers, if one or more
of those component suppliers, many of whom are located in Japan,
are negatively impacted by these events, then our ODMs may be
forced to delay or otherwise cease manufacturing the products in
which our solutions are used. If any of these were to occur,
some or all of those customers may reduce their orders for our
solutions, which could adversely affect our revenue and results
of operations. In addition, some or all of our suppliers may be
unable to provide us with components consistent with our
requirements as to quality, quantity and timeliness, which could
harm our business by causing delays, loss of sales, increases in
costs and lower gross profit margins. Furthermore, if we are
required to obtain one or more new suppliers for components or
use alternative components in our solutions, we may need to
conduct additional testing of our solutions to ensure those
components meet our quality and performance standards, all of
which could delay shipments to our customers and adversely
affect our financial condition and results of operations.
In addition to the negative direct economic effects of recent
events on the Japanese economy and on our customers and
suppliers located in Japan, economic conditions in Japan could
also adversely affect regional and global economic conditions.
The degree to which these events, as well as future events, in
Japan will adversely affect regional and global economies
remains uncertain at this time. However, if these events cause a
decrease in demand for our solutions, our financial condition
and operations could be adversely affected.
If our
operations are interrupted as a result of service downtime or
interruptions, our business and reputation could
suffer.
Our operations and those of our subcontractors are vulnerable to
interruption as a result of technical breakdowns, computer
hardware and software malfunctions, software viruses,
infrastructure failures, fire, earthquake, power loss,
telecommunications failure, terrorist attacks, wars, Internet
failures and other events beyond our control. Any disruption in
our services or operations could harm our ability to perform our
services effectively, which in turn could result in a reduction
in revenue or a claim for substantial damages against us,
regardless of whether we are responsible for that failure. We
rely on our computer equipment, database storage facilities and
other office equipment, which are located primarily in Andover,
Massachusetts, and Ottawa, Ontario. If we suffer a significant
database or network facility outage, our business could
experience disruption until we fully implement our
back-up
systems.
25
The enactment
of legislation implementing changes in U.S. taxation of
international business activities or the adoption of other tax
reform policies could materially impact our financial position
and results of operations.
Several tax bills have been introduced to reform
U.S. taxation of international business activities.
Depending on the final form of legislation enacted, if any, the
consequences may be significant for us due to the large scale of
our international business activities. If any of these proposals
are enacted into legislation, they could have material adverse
consequences on the amount of tax we pay and thereby on our
financial position and results of operations.
We are subject
to currency exchange risks that could adversely affect our
operations.
Our results of operations and cash flows are subject to
fluctuations in foreign currency exchange rates, particularly
changes in the Canadian dollar, due to our compensation expenses
payable in local currencies. Although a majority of our revenue
and operating expenses is denominated in U.S. dollars and
we prepare our financial statements in U.S. dollars, a
portion of our expenses is paid in foreign currencies. As a
result, we are subject to currency risks that could adversely
affect our operations, including:
|
|
|
| |
•
|
risks resulting from changes in currency exchange rates and the
implementation of exchange controls; and
|
| |
| |
•
|
limitations on our ability to reinvest earnings from operations
in one country to fund the capital needs of our operations in
other countries.
|
Changes in exchange rates affect our costs and earnings, and may
also affect the book value of our assets located outside the
United States and the amount of our stockholders’ equity.
We will be
subject to additional regulatory compliance requirements,
including section 404 of the Sarbanes-Oxley Act of 2002, as
a result of becoming a public company, and our management has
limited experience managing a public company. In addition, we
may fail to maintain an effective system of internal controls,
which would significantly harm our reputation and our
business.
We have never operated as a public company and will incur
significant legal, accounting and other expenses that we did not
incur as a private company. The individuals who constitute our
management team have limited experience managing a publicly
traded company, and limited experience complying with the
increasingly complex and changing laws pertaining to public
companies. Our management team and other personnel will need to
devote a substantial amount of time to new compliance
requirements, and we may not successfully or efficiently manage
our transition to a public company. In connection with our
transition to a public company, we intend to hire additional
accounting and finance personnel with technical accounting and
financial reporting experience. Any inability to recruit and
retain the finance personnel we require would have an adverse
impact on our ability to accurately and timely prepare our
financial statements. We may be unable to locate and hire
qualified finance professionals with requisite technical and
public company experience when and as needed.
As a public company, our ongoing compliance with various rules
and regulations, including the Sarbanes-Oxley Act of 2002, will
increase our legal and finance compliance costs and will make
some activities more time-consuming and costly. These rules and
requirements may be modified, supplemented or amended from time
to time. Implementing these changes may take a significant
amount of time and may require specific compliance training of
our personnel. For example, Section 404 of the
Sarbanes-Oxley Act requires that our management report on, and
our independent auditors attest to, the effectiveness of our
internal control structure and procedures for financial
reporting in our annual reports filed with the Securities and
Exchange Commission. Section 404 compliance may divert
internal resources and will take a significant amount of time
and effort to
26
complete. We may not be able to successfully complete the
procedures and certification and attestation requirements of
Section 404 by the time we will be required to do so. If we
fail to do so, or if in the future our Chief Executive Officer,
Chief Financial Officer or independent registered public
accounting firm determines that our internal controls over
financial reporting are not effective as defined under
Section 404, we could be subject to sanctions or
investigations by The NASDAQ Global Market, the Securities and
Exchange Commission, or other regulatory authorities. As a
result, investor perceptions of our company may suffer, and this
could cause a decline in the market price of our stock.
Irrespective of compliance with these rules and regulations,
including the requirements under the Sarbanes-Oxley Act, any
failure of our internal controls could have a material adverse
effect on our stated results of operations and harm our
reputation. If we are unable to implement these changes
effectively or efficiently, it could harm our operations,
financial reporting or financial results and could result in an
adverse opinion on internal controls from our independent
auditors.
We may pursue
acquisitions, dispositions, investments, strategic alliances and
joint ventures, which could affect our results of
operations.
We may engage in various transactions, including purchases or
sales of assets, acquisitions of design teams or businesses, or
entering into investments or contractual arrangements, such as
strategic alliances or joint ventures. These transactions may be
intended to result in the realization of cost savings, the
generation of cash or income or the reduction of risk. These
transactions may also affect our consolidated results of
operations. We cannot assure you that we will be able to
identify suitable acquisition, investment, alliance, or joint
venture opportunities or that we will be able to consummate any
such transactions or relationships on terms and conditions
acceptable to us, or that such transactions or relationships
will be successful. We also cannot assure you that we will be
able to retain any design teams that we acquire on terms and
conditions acceptable to us, or that such transactions or
relationships will be successful.
These transactions or any other acquisitions or dispositions
involve risks and uncertainties. For example, the integration of
acquired businesses may not be successful and could result in
disruption to other parts of our business. In addition, the
integration may require that we incur significant restructuring
charges. To integrate acquired businesses or assets, we must
implement our management information systems, operating systems
and internal controls, and assimilate and manage the personnel
of the acquired operations. The difficulties of the integrations
may be further complicated by such factors as:
|
|
|
| |
•
|
geographic distances;
|
| |
| |
•
|
lack of experience operating in the geographic market or
industry sector of the acquired business;
|
| |
| |
•
|
delays and challenges associated with integrating the business
or assets with our existing businesses;
|
| |
| |
•
|
diversion of management’s attention from daily operations
of the business;
|
| |
| |
•
|
potential loss of key employees and customers of the acquired
business;
|
| |
| |
•
|
the potential for deficiencies in internal controls at the
acquired or combined business or assets;
|
| |
| |
•
|
performance problems with the acquired business’ technology;
|
| |
| |
•
|
difficulties in entering markets in which we have no or limited
direct prior experience;
|
| |
| |
•
|
exposure to unanticipated liabilities of the acquired business;
|
| |
| |
•
|
insufficient revenue to offset increased expenses associated
with the acquisition; and
|
27
|
|
|
| |
•
|
our potential inability to achieve the growth prospects and
synergies expected from any acquisition.
|
Even when an acquired business has already developed and
marketed products, there can be no assurance that product
enhancements will be made in a timely fashion or that all
pre-acquisition due diligence will have identified all material
problems that might arise with respect to such acquired assets.
Any acquisition may also cause us to assume liabilities, acquire
goodwill and
non-amortizable
intangible assets that will be subject to impairment testing and
potential impairment charges, incur amortization expense related
to certain intangible assets, increase our expenses and working
capital requirements, and subject us to litigation, which would
reduce our return on invested capital. Failure to manage and
successfully integrate the acquisitions we make could materially
harm our business and operating results.
Any future acquisitions may require additional debt or equity
financing, which, in the case of debt financing, would increase
our leverage and potentially affect our creditworthiness, and in
the case of equity financing, would be dilutive to our existing
stockholders. Any deterioration in our creditworthiness or our
future credit ratings associated with an acquisition could
adversely affect our ability to borrow by resulting in more
restrictive borrowing terms. As a result of the foregoing, we
may not be able to complete acquisitions or strategic customer
transactions in the future. These and other factors could harm
our ability to achieve anticipated levels of profitability at
acquired operations or realize other anticipated benefits of an
acquisition, and could adversely affect our business, financial
condition and results of operations.
We are subject
to the cyclical nature of the semiconductor
industry.
The semiconductor industry is highly cyclical and is
characterized by constant and rapid technological change, rapid
product obsolescence and price erosion, evolving standards,
short product life cycles and wide fluctuations in product
supply and demand. The industry is experiencing an upturn as
world economies recover from the recent global recession.
Upturns have historically been characterized by lower available
production capacity, low inventory levels and the entry of new
competitors. The current upturn and any future downturns could
have a material adverse effect on our business and operating
results. We are dependent on the availability of third party
manufacturing, assembly and test capacity to manufacture and
assemble our solutions. None of our third party foundry or
assembly contractors has provided assurances that adequate
capacity will be available to us in the future. Even in respect
of product development, tight capacity on wafer manufacturing
and assembly means that it takes longer to complete design
cycles because prototypes of our designs take longer to be
delivered to us. Longer design cycles increase the risk that we
may not be able to win design slots in a timely manner. We may
experience significant fluctuations in our future financial
results as a result of these factors.
Our solutions
must conform to industry standards in order to be accepted by
end users in our markets.
Generally, our solutions comprise only one part of a wireless
communications device. All components of these devices must
uniformly comply with industry standards in order to operate
efficiently together. For example, signal emissions above a
certain threshold level within a frequency band may be regulated
by the U.S. Federal Communications Commission, which we
refer to as the FCC. We depend on companies that provide other
components of the devices to support prevailing industry
standards and regulations. Many of these companies are
significantly larger and more influential in driving industry
standards than we are. Some industry standards may not be widely
adopted or implemented uniformly, and competing standards may
emerge that may be preferred by our customers or end users. If
larger companies do not support the same industry standards that
we do, or if competing standards emerge, market acceptance of
our solutions could be adversely affected, which would harm our
business.
28
Changes in
current laws or regulations or the imposition of new laws or
regulations could impede the sale of our solutions or otherwise
harm our business.
Wireless networks can only operate in the frequency bands, or
spectrum, allowed by regulators and in accordance with rules
governing how the spectrum can be used. The FCC, as well as
regulators in foreign countries, have broad jurisdiction over
the allocation of frequency bands for wireless networks. We
therefore rely on the FCC and international regulators to
provide sufficient spectrum and usage rules. For example,
countries such as China, India, Japan or Korea heavily regulate
all aspects of their wireless communication industries, and may
restrict spectrum allocation or usage. If further restrictions
were to be imposed over the frequency range where our
semiconductor solutions are designed to operate, we may have
difficulty selling our solutions in those regions. In addition,
some of our semiconductor solutions operate in the 2.4 GHz
and 5 GHz bands, which in some countries are also used by
government and commercial services such as military and
commercial aviation. The FCC and European regulators have
traditionally protected government uses of the 2.4 GHz and
5 GHz bands by setting power limits and indoor and outdoor
designation and by requiring that wireless local area networking
devices not interfere with other users of the band such as
government and civilian satellite services. Changes in current
laws or regulations or the imposition of new laws and
regulations in the United States or elsewhere regarding the
allocation and usage of the 2.4 GHz and 5 GHz bands on
us, our customers or the industries in which we operate may
materially and adversely impact the sale of our solutions and
our business, financial condition and results of operations.
If wireless
devices pose safety risks, we may be subject to new regulations,
and demand for our solutions and those of our licensees and
customers may decrease.
Concerns over the effects of radio frequency emissions, even if
unfounded, may have the effect of discouraging the use of
wireless devices, which may decrease demand for our solutions
and those of our licensees and customers. In recent years, the
FCC and foreign regulatory agencies have updated the guidelines
and methods they use for evaluating radio frequency emissions
from radio equipment, including wireless phones and other
wireless devices. In addition, interest groups have requested
that the FCC investigate claims that wireless communications
technologies pose health concerns and cause interference with
airbags, hearing aids and medical devices. Concerns have also
been expressed over the possibility of safety risks due to a
lack of attention associated with the use of wireless devices
while driving. Any legislation that may be adopted in response
to these expressions of concern could reduce demand for our
solutions and those of our licensees and customers in the United
States as well as foreign countries.
Our ability to
use our United States federal net operating loss carryforwards
may be limited.
As of December 31, 2010, for United States federal tax
purposes, we had net operating loss, which we refer to as NOL,
carryforwards of $23.7 million to offset future taxable
income, which will expire gradually from 2020-2030 if not
utilized. Under the relevant provisions of the Internal Revenue
Code of 1986, as amended, which we refer to as the Code, certain
substantial cumulative changes in our ownership may limit the
amount of NOL carryforwards that can be utilized annually in the
future to offset taxable income. Section 382 of the Code
imposes limitations on a company’s ability to use NOL
carryforwards if such company experiences a more-than-50-percent
ownership change (an “ownership change”) over a
three-year testing period. We believe that, as a result of this
offering or as a result of future issuances of our capital
stock, it is possible that such an ownership change may occur.
Although we do not currently anticipate a significant limitation
as a result of an ownership change in connection with this
offering, if we experience an ownership change in connection
with or subsequent to this offering, our ability to use our
United States federal NOL carryforwards in any future periods
may be restricted. If we are limited in our ability to use our
NOL carryforwards, we will pay more taxes than if we were able
to utilize such NOL carryforwards fully. As a result, any
inability to use our NOL carryforwards could adversely affect
our financial condition and results of operations.
29
Risks Related to
Our Common Stock
Our stock
price may fluctuate significantly.
Prior to this offering, there has been no public market for
shares of our common stock. An active public market for our
common stock may not develop or be sustained after the
completion of this offering. We will negotiate and determine the
initial public offering price with the underwriters. This price
may vary from the market price of our common stock after this
offering. You may be unable to sell your shares of common stock
at or above the initial offering price. The stock market,
particularly in recent years, has experienced significant
volatility, particularly with respect to technology stocks. The
volatility of technology stocks often does not relate to the
operating performance of the companies represented by the stock.
Factors that could cause volatility in the market price of our
common stock include:
|
|
|
| |
•
|
market conditions affecting our customers’ businesses,
including the level of mergers and acquisitions activity;
|
| |
| |
•
|
the loss of any major customers or the acquisition of new
customers for our services;
|
| |
| |
•
|
announcements of new services or functions by us or our
competitors;
|
| |
| |
•
|
developments concerning intellectual property rights;
|
| |
| |
•
|
comments by securities analysts, including the publication of
their estimates of our operating results;
|
| |
| |
•
|
actual and anticipated fluctuations in our quarterly operating
results;
|
| |
| |
•
|
rumors relating to us or our competitors;
|
| |
| |
•
|
actions of stockholders, including sales of shares by our
directors and executive officers;
|
| |
| |
•
|
additions or departures of key personnel; and
|
| |
| |
•
|
developments concerning current or future strategic alliances or
acquisitions.
|
These and other factors may cause the market price and demand
for our common stock to fluctuate substantially, which may limit
or prevent investors from readily selling their shares of common
stock and may otherwise negatively affect the liquidity of our
common stock. In addition, in the past, when the market price of
a stock has been volatile, holders of that stock have instituted
securities class action litigation against the company that
issued the stock. If any of our stockholders brought a lawsuit
against us, we could incur substantial costs defending the
lawsuit. Such a lawsuit could also divert the time and attention
of our management.
Our principal
stockholders will exercise significant control over our
company.
After this offering,
our
largest stockholders will beneficially own, in the aggregate,
shares representing approximately %
of our outstanding capital stock, assuming no exercise by the
underwriters of their option to purchase additional shares from
the selling stockholders. Although we are not aware of any
voting arrangements that will be in place among these
stockholders following this offering, if these stockholders were
to choose to act together, as a result of their stock ownership,
they would be able to influence our management and affairs and
control all matters submitted to our stockholders for approval,
including the election of directors and approval of any merger,
consolidation or sale of all or substantially all of our assets.
This concentration of ownership may have the effect of delaying
or preventing a change in control of our company and might
affect the market price of our common stock.
30
Future sales
of shares by existing stockholders could cause our stock price
to decline.
If our existing stockholders sell, or indicate an intent to
sell, substantial amounts of our common stock in the public
market after the
180-day
contractual
lock-up and
other legal restrictions on resale discussed in this prospectus
lapse, the trading price of our common stock could decline
significantly and could decline below the initial public
offering price. Based on shares outstanding as of
December 31, 2010, upon the completion of this offering, we
will have
outstanding shares
of common stock, assuming no exercise of outstanding options. Of
these
shares, shares
of common stock, plus any shares sold pursuant to the
underwriters’ option to purchase additional shares, will be
immediately freely tradable, without restriction, in the public
market. Barclays Capital Inc. and Deutsche Bank Securities Inc.
may, in their sole discretion, permit our officers, directors,
employees and current stockholders to sell shares prior to the
expiration of the
lock-up
agreements. Moreover, a relatively small number of our
stockholders own large blocks of shares. We cannot predict the
effect, if any, that public sales of these shares or the
availability of these shares for sale will have on the market
price of our common stock.
After the
lock-up
agreements pertaining to this offering expire, based on shares
outstanding as of December 31, 2010 and assuming no
exercise by the underwriters of their option to purchase
additional shares from the selling stockholders, an
additional shares
will be eligible for sale in the public market. In addition,
the shares
subject to outstanding options under our equity incentive plans
and
the shares
reserved for future issuance under our equity incentive plans
will become eligible for sale in the public market in the
future, subject to certain legal and contractual limitations.
Moreover, 180 days after the completion of this offering,
holders of
approximately shares
of our common stock, assuming no exercise by the underwriters of
their option to purchase additional shares from the selling
stockholders, will have the right to require us to register
these shares under the Securities Act of 1933, as amended, or
the Securities Act, pursuant to an investor rights agreement. If
our existing stockholders sell substantial amounts of our common
stock in the public market, or if the public perceives that such
sales could occur, this could have an adverse impact on the
market price of our common stock, even if there is no
relationship between such sales and the performance of our
business.
We will have
broad discretion in how we use the proceeds of this offering. We
may not use these proceeds effectively, which could affect our
results of operations and cause our stock price to
decline.
We will have considerable discretion in the application of the
net proceeds of this offering. We currently intend to use the
net proceeds of this offering for working capital and other
general corporate purposes, including possible investments in,
or acquisitions of, complementary businesses, services or
technologies. As a result, investors will be relying upon
management’s judgment with only limited information about
our specific intentions for the use of the net proceeds of this
offering. We may use the net proceeds for purposes that do not
yield a significant return or any return at all for our
stockholders. In addition, pending their use, we may invest the
net proceeds from this offering in a manner that does not
produce income or that loses value.
Provisions of
Delaware law and our charter documents could delay or prevent an
acquisition of our company, even if the acquisition would be
beneficial to our stockholders, and could make it more difficult
for you to change management or members of our board of
directors.
Provisions of Delaware law, our amended and restated certificate
of incorporation and amended and restated by-laws, which will
become effective upon the completion of this offering, may
discourage, delay or prevent a merger, acquisition or other
change in control that stockholders may consider favorable,
including transactions in which stockholders might otherwise
receive a premium for
31
their shares. These provisions may also prevent or delay
attempts by stockholders to replace or remove our current
management or members of our board of directors. These
provisions include:
|
|
|
| |
•
|
a classified board of directors;
|
| |
| |
•
|
limitations on the removal of directors;
|
| |
| |
•
|
advance notice requirements for stockholder proposals and
nominations;
|
| |
| |
•
|
the inability of stockholders to act by written consent or to
call special meetings;
|
| |
| |
•
|
the ability of our board of directors to make, alter or repeal
our amended and restated by-laws; and
|
| |
| |
•
|
the authority of our board of directors to issue preferred stock
with such terms as our board of directors may determine.
|
The affirmative vote of the holders of not less than 75% of the
outstanding shares of our capital stock entitled to vote
thereon, and not less than 75% of the outstanding shares of each
class entitled to vote thereon as a class, is necessary to amend
or repeal the above provisions that are contained in our amended
and restated certificate of incorporation. Also, absent approval
of our board of directors, our amended and restated by-laws may
only be amended or repealed by the affirmative vote of the
holders of at least 75% of the outstanding shares of our capital
stock entitled to vote thereon.
In addition, upon the closing of this offering, we will be
subject to the provisions of Section 203 of the Delaware
General Corporation Law, which limits business combination
transactions with stockholders of 15% or more of our outstanding
voting stock that our board of directors has not approved. These
provisions and other similar provisions make it more difficult
for stockholders or potential acquirers to acquire us without
negotiation. These provisions may apply even if some
stockholders may consider the transaction beneficial to them.
As a result, these provisions could limit the price that
investors are willing to pay in the future for shares of our
common stock. These provisions might also discourage a potential
acquisition proposal or tender offer, even if the acquisition
proposal or tender offer is at a premium over the then current
market price for our common stock.
The Investment
Canada Act or the Competition Act (Canada) may apply to prevent
or delay a change of control of our company.
Under the Investment Canada Act, any investment by a
“non-Canadian” (which includes any entity which is not
controlled or beneficially owned by Canadians) involving the
acquisition of control of a “Canadian Business” is
subject to review by the Investment Review Division of Industry
Canada if, in the case of an investment by or from an investor
from a state that is a member of the World Trade Organization,
the asset value of the entity or entities being acquired is
equal to or exceeds CDN$299 million. A “Canadian
Business” is defined to comprise any business carried on in
Canada that has:
|
|
|
| |
•
|
a place of business in Canada;
|
| |
| |
•
|
one or more employees or self-employed individuals working in
connection with the business; and
|
| |
| |
•
|
assets in Canada used in carrying out the business.
|
Based on this definition, we currently have a Canadian Business
which is operated through our wholly-owned Canadian subsidiary,
SiGe Canada. A reviewable acquisition may not proceed unless the
relevant Minister is satisfied that the investment is likely to
be a net benefit to Canada. An investment by a non-Canadian
involving the acquisition of control of a Canadian Business that
does not meet the CDN$299 million threshold is still
required under the Investment Canada Act to be formally notified
within 30 days of closing.
32
The sale of our company may also be subject to formal
pre-notification obligations under Canada’s Competition Act
if certain thresholds are met. In general, the thresholds are
CDN$400 million for the combined size of the parties to the
transaction and their affiliates, and CDN$70 million for
the size of the target company. Independent of pre-notification
obligations, the sale of our company may also raise competition
law issues for which pre-approval of the Canadian Commissioner
of Competition may be warranted.
The application of the Investment Canada Act or the Competition
Act (Canada) could prevent or delay an acquisition of control of
our company and may limit strategic opportunities for our
stockholders to sell their common stock.
We have never
paid dividends on our capital stock and we do not anticipate
paying any dividends in the foreseeable future.
We have not paid dividends on any of our classes of capital
stock to date and we currently intend to retain our future
earnings, if any, to fund the development and growth of our
business. In addition, any future indebtedness that we may incur
could preclude us from paying dividends. As a result, capital
appreciation, if any, of our common stock will likely be your
sole source of gain for the foreseeable future. Consequently, in
the foreseeable future, you will likely only experience a gain
from your investment in our common stock if the price of our
common stock increases.
An active
trading market for our common stock may not develop, and you may
not be able to resell your shares at or above the initial public
offering price.
Prior to this offering, there has been no public market for
shares of our common stock. Although we have applied to have our
common stock listed on the NASDAQ Global Market in connection
with this offering, an active trading market for our shares may
never develop or be sustained following this offering. The
initial public offering price of our common stock will be
determined through negotiations between us and the underwriters.
This initial public offering price may not be indicative of the
market price of our common stock after this offering. In the
absence of an active trading market for our common stock,
investors may not be able to sell their common stock at or above
the initial public offering price or at the time that they would
like to sell.
Investors in
this offering will pay a much higher price than the book value
of our common stock.
If you purchase common stock in this offering, you will incur
immediate and substantial dilution of
$ per share, representing the
difference between our pro forma net tangible book value per
share after giving effect to this offering and an assumed
initial public offering price of $
per share, the midpoint of the price range set forth on the
cover of this prospectus. In the past, we issued options to
acquire common stock at prices significantly below the assumed
initial public offering price. To the extent these outstanding
options are ultimately exercised, you will sustain further
dilution.
If equity
research analysts do not publish research reports about our
business or if they issue unfavorable commentary or downgrade
our common stock, the price of our common stock could
decline.
The trading market for our common stock will rely in part on the
research and reports that equity research analysts publish about
us and our business. We do not control these analysts. The price
of our common stock could decline if one or more equity analysts
downgrade our common stock, issue other unfavorable commentary
or cease publishing reports about us or our business.
33
CAUTIONARY
NOTE REGARDING FORWARD-LOOKING STATEMENTS
This prospectus contains forward-looking statements that are
based on our management’s belief and assumptions and on
information currently available to our management. Although we
believe that the expectations reflected in these forward-looking
statements are reasonable, these statements relate to future
events or our future financial performance, and involve known
and unknown risks, uncertainties and other factors that may
cause our actual results, levels of activity, performance or
achievements to be materially different from any future results,
levels of activity, performance or achievements expressed or
implied by these forward-looking statements. Forward-looking
statements include information concerning our possible or
assumed future results of operations, business strategies,
financing plans, competitive position, industry environment,
potential growth opportunities and the effects of competition.
In some cases, you can identify forward-looking statements by
terminology such as “may,” “will,”
“should,” “expects,” “intends,”
“plans,” “anticipates,”
“believes,” “estimates,”
“predicts,” “potential,”
“continue” or the negative of these terms or other
comparable terminology. These statements are only predictions.
You should not place undue reliance on forward-looking
statements because they involve known and unknown risks,
uncertainties and other factors, which are, in some cases,
beyond our control and which could materially affect our
results. Factors that may cause actual results to differ
materially from current expectations include, among other
things, those described under “Risk Factors” and
elsewhere in this prospectus. If one or more of these risks or
uncertainties occur, or if our underlying assumptions prove to
be incorrect, actual events or results may vary significantly
from those expressed or implied by the forward-looking
statements. No forward-looking statement is a guarantee of
future performance. You should read this prospectus and the
documents that we reference in this prospectus and have filed
with the Securities and Exchange Commission as exhibits to the
registration statement, of which this prospectus is a part,
completely and with the understanding that our actual future
results may be materially different from any future results
expressed or implied by these forward-looking statements.
The forward-looking statements in this prospectus represent our
views as of the date of this prospectus. We anticipate that
subsequent events and developments will cause our views to
change. However, while we may elect to update these
forward-looking statements at some point in the future, we have
no current intention of doing so except to the extent required
by applicable law. You should, therefore, not rely on these
forward-looking statements as representing our views as of any
date subsequent to the date of this prospectus.
INDUSTRY AND
MARKET DATA
We obtained the industry, market and competitive position data
used throughout this prospectus from our own internal estimates
and research as well as from industry publications and research,
surveys and studies conducted by third parties. Industry
publications, research, surveys and studies generally state that
they have been obtained from sources believed to be reliable,
although they do not guarantee the accuracy or completeness of
such information. While we believe that such publications,
research, surveys and studies are reliable, we have not
independently verified industry, market and competitive position
data from third party sources. While we believe our internal
business research is reliable and market definitions are
appropriate, neither such research nor these definitions have
been verified by any independent source.
The Gartner report described herein represents data, research
opinion or viewpoints published, as part of a syndicated
subscription service, by Gartner, Inc., and are not
representations of fact by Gartner. Each Gartner report speaks
as of its original publication date (and not as of the date of
this prospectus) and the opinions expressed in the Gartner
report are subject to change without notice.
34
USE OF
PROCEEDS
We estimate that the net proceeds from our sale of shares of our
common stock in this offering will be approximately
$ million based upon an
assumed public offering price of $
per share, the mid-point of the price range set forth on the
cover of this prospectus, after deducting underwriting discounts
and commissions and estimated offering expenses payable by us.
We will not receive any proceeds from the common stock sold by
the selling stockholders in this offering. A
$ increase (decrease) in the
assumed initial public offering price of
$ per share would increase
(decrease) the net proceeds to us from this offering by
$ million, assuming that the
number of shares offered by us, as set forth on the cover page
of this prospectus, remains the same and after deducting
underwriting discounts and commissions and estimated offering
expenses payable by us.
The principal purposes of this offering are to create a public
market for our common stock, obtain additional capital,
facilitate our future access to the public equity markets and
improve our competitive position.
We currently intend to use our net proceeds from this offering
for working capital and other general corporate purposes,
including possible investments in, or acquisitions of,
complementary businesses, services or technologies. We have no
current agreements or commitments with respect to any investment
or acquisition, and we currently are not engaged in negotiations
with respect to any investment or acquisition. In addition, the
amount and timing of any actual spending for these purposes may
vary significantly and will depend on a number of factors,
including our future revenue and cash generated by operations
and other factors described under “Risk Factors” in
this prospectus. Accordingly, our management will have broad
discretion in applying our net proceeds of this offering.
Pending these uses, we intend to invest the net proceeds in high
quality, investment grade, short-term fixed income instruments
which include corporate, financial institution, federal agency
or U.S. government obligations.
DIVIDEND
POLICY
We have never declared or paid dividends on our capital stock.
We do not anticipate paying any dividends on our capital stock
in the foreseeable future. We currently intend to retain all
available funds and any future earnings to fund the development
and growth of our business. Any future determination to declare
dividends will be subject to the discretion of our board of
directors and will depend on various factors, including
applicable laws, our results of operations, financial condition,
future prospects and any other factors deemed relevant by our
board of directors. Investors should not purchase our common
stock with the expectation of receiving cash dividends.
35
CAPITALIZATION
The following table sets forth our capitalization as of
December 31, 2010:
|
|
|
| |
•
|
on a pro forma basis to reflect (1) the issuance of an
aggregate of 14,167,285 shares of our common stock issuable
upon the automatic exchange of all of the outstanding common
exchangeable shares of SiGe Canada in connection with this
offering, as described in “Description of Capital
Stock — Exchangeable Shares” elsewhere in this
prospectus; and (2) the automatic conversion of all
outstanding shares of our preferred stock, including all shares
of our preferred stock issued in exchange for all of the
outstanding preferred exchangeable shares of SiGe Canada, into
an aggregate of 19,353,591 shares of our common stock in
connection with this offering, as described in “Description
of Capital Stock — Exchangeable Shares” elsewhere
in this prospectus; and
|
|
|
|
| |
•
|
on a pro forma as adjusted basis to further reflect our receipt
of the estimated net proceeds from our sale
of shares
of common stock in this offering at an assumed initial public
offering price of $ per share, the
mid-point of the price range set forth on the cover of this
prospectus, after deducting underwriting discounts and
commissions and estimated offering expenses payable by us.
|
The information below is illustrative only and our
capitalization following the completion of this offering will be
adjusted based on the actual initial public offering price and
other terms of this offering determined at pricing. You should
read this table together with “Management’s Discussion
and Analysis of Financial Condition and Results of
Operations” and our consolidated financial statements and
the related notes appearing elsewhere in this prospectus.
| |
|
|
|
|
|
|
|
|
|
|
|
|
|
|
|
As of December 31, 2010
|
|
|
|
|
|
|
|
|
|
|
Pro Forma as
|
|
|
|
|
Actual
|
|
|
Pro Forma
|
|
|
Adjusted(1)
|
|
|
|
|
(in thousands, except share and
|
|
|
|
|
per share amounts)
|
|
|
|
|
(unaudited)
|
|
|
|
|
Redeemable convertible preferred
stock:(2)
|
|
|
|
|
|
|
|
|
|
|
|
|
|
Series A-1
Preferred Stock, $0.0001 par value, voting, redeemable;
authorized 19,353,591 shares; issued
16,751,585 shares, redemption value $17,311, actual; no
shares issued, pro forma and pro forma as adjusted
|
|
$
|
17,262
|
|
|
$
|
—
|
|
|
$
|
|
|
|
Class A-1
Exchangeable Shares, no par value, voting, redeemable; unlimited
shares authorized; issued 2,602,006 shares, redemption
value $2,689, actual; no shares issued, pro forma and pro forma
as adjusted
|
|
|
2,685
|
|
|
|
—
|
|
|
|
|
|
|
Stockholders’
equity:(3)
|
|
|
|
|
|
|
|
|
|
|
|
|
|
Standard Common Stock, $0.0001 par value; authorized
104,999,999 shares, issued 45,474,812 shares, actual;
authorized 104,999,999 shares, issued
78,995,688 shares, pro forma;
authorized shares,
issued shares, pro forma as
adjusted
|
|
|
5
|
|
|
|
8
|
|
|
|
|
|
|
Common Exchangeable Shares, no par value, voting; authorized
unlimited shares; issued 14,167,285 shares, actual; no
shares issued, pro forma and pro forma as adjusted
|
|
|
36,252
|
|
|
|
—
|
|
|
|
|
|
|
Additional paid-in
capital(1)
|
|
|
80,357
|
|
|
|
136,558
|
|
|
|
|
|
|
Deficit
|
|
|
(108,005
|
)
|
|
|
(108,005
|
)
|
|
|
|
|
|
|
|
|
|
|
|
|
|
|
|
|
|
|
|
Total stockholders’
equity(1)
|
|
|
8,609
|
|
|
|
28,561
|
|
|
|
|
|
|
|
|
|
|
|
|
|
|
|
|
|
|
|
|
Total
capitalization(1)
|
|
$
|
28,561
|
|
|
$
|
28,561
|
|
|
$
|
|
|
|
|
|
|
|
|
|
|
|
|
|
|
|
|
36
|
|
|
|
(1)
|
|
A $1.00 increase (decrease) in the
assumed initial public offering price of
$ per share, the midpoint of the
range set forth on the cover page of this prospectus, would
increase (decrease) each of additional paid-in capital, total
stockholders’ equity and total capitalization by
$ million, assuming that the
number of shares of common stock offered by us, as set forth on
the cover page of this prospectus, remains the same, and after
deducting underwriting discounts and commissions and estimated
offering expenses payable by us. Similarly, each increase
(decrease) of 1 million shares in the number of shares of
common stock offered by us would increase (decrease) each of
additional paid-in capital, total stockholders’ equity and
total capitalization by
$ million. The pro forma as
adjusted information presented above is illustrative only and
will be adjusted based on the actual public offering price and
other terms of this offering determined at pricing.
|
|
|
|
|
(2)
|
|
Does not reflect Special A-1
Voting Stock, $0.0001 par value per share: one share
authorized and issued as of December 31, 2010, no shares
authorized and no shares issued pro forma or pro forma as
adjusted. The Special A-1 Voting Stock will be cancelled in
connection with this offering upon the exchange of all of the
outstanding Class A-1 Exchangeable Shares of SiGe Canada
into shares of our preferred stock.
|
|
|
|
|
(3)
|
|
Does not reflect Special Common
Voting Stock, $0.0001 par value per share: one share
authorized and issued as of December 31, 2010, no shares
authorized and no shares issued pro forma or pro forma as
adjusted. The Special Common Voting Stock will be cancelled in
connection with this offering upon the exchange of all of the
outstanding Common Exchangeable Shares of SiGe Canada into
shares of our common stock.
|
The number of shares of common stock to be outstanding following
this offering is based on 78,995,688 shares of our common
stock outstanding as of December 31, 2010, and does not
reflect:
|
|
|
| |
•
|
19,863,355 shares of common stock issuable upon exercise of
outstanding options as of December 31, 2010, at a weighted
average exercise price of $0.31 per share (of which, options to
acquire 15,131,893 shares of common stock were vested as of
December 31, 2010);
|
|
|
|
| |
•
|
shares of our common stock
reserved for future issuance under our 2011 Stock Option and
Incentive Plan, which will become effective in connection with
this offering (which includes 540,957 shares reserved for future
grant or issuance under our 2002 Stock Plan, which will be added
to the shares to be reserved under our 2011 Stock Option and
Incentive Plan upon the effectiveness of the 2011 Stock Option
and Incentive Plan);
|
|
|
|
| |
•
|
shares of common stock
reserved for future issuance under our 2011 Employee Stock
Purchase Plan, which will become effective in connection with
this offering;
|
|
|
|
| |
•
|
255,000 options to purchase Standard Common Stock approved by
our Board of Directors on February 16, 2011; and
|
|
|
|
| |
•
|
986,500 options to purchase Standard Common Stock approved by
our Board of Directors subject to a 3,000,000 increase in the
number of shares of Standard Common Stock reserved under the
2002 Plan which was approved by stockholders on March 15,
2011.
|
37
DILUTION
If you invest in our common stock, your investment will be
diluted immediately to the extent of the difference between the
initial public offering price per share of our common stock in
this offering and the pro forma net tangible book value per
share of our common stock immediately after completion of this
offering.
This discussion and the tables below are based on
78,995,688 shares of our common stock issued and
outstanding as of December 31, 2010 and also include:
|
|
|
| |
•
|
the issuance of an aggregate of 14,167,285 shares of our
common stock issuable upon the automatic exchange of all of the
outstanding common exchangeable shares of SiGe Canada in
connection with this offering, as described in “Description
of Capital Stock — Exchangeable Shares” elsewhere
in this prospectus; and
|
|
|
|
| |
•
|
the automatic conversion of all outstanding shares of our
preferred stock, including all shares of our preferred stock
issued in exchange for all of the outstanding preferred
exchangeable shares of SiGe Canada, into an aggregate of
19,353,591 shares of our common stock in connection with
this offering, as described in “Description of Capital
Stock — Exchangeable Shares” elsewhere in this
prospectus.
|
This discussion and the tables below do not reflect:
|
|
|
| |
•
|
19,863,355 shares of common stock issuable upon the
exercise of options outstanding as of December 31, 2010 at
a weighted average exercise price of $0.31 per share (of which,
options to acquire 15,131,893 shares of common stock were
vested as of December 31, 2010);
|
|
|
|
| |
•
|
shares
of our common stock reserved for future issuance under our 2011
Stock Option and Incentive Plan, which will become effective in
connection with this offering (which includes
540,957 shares reserved for future grant or issuance under
our 2002 Stock Plan, which will be added to the shares to be
reserved under our 2011 Stock Option and Incentive Plan upon the
effectiveness of the 2011 Stock Option and Incentive Plan);
|
|
|
|
| |
•
|
shares
of our common stock reserved for future issuance under our 2011
Employee Stock Purchase Plan, which will become effective in
connection with this offering;
|
|
|
|
| |
•
|
255,000 options to purchase Standard Common Stock approved by
our Board of Directors on February 16, 2011; and
|
|
|
|
| |
•
|
986,500 options to purchase Standard Common Stock approved by
our Board of Directors subject to a 3,000,000 increase in the
number of shares of Standard Common Stock reserved under the
2002 Plan which was approved by stockholders on March 15,
2011.
|
Our historical net tangible book value as of December 31,
2010 was approximately $ , or
$ per share, based
on shares
of common stock outstanding as of that date. Historical net
tangible book value per share is determined by dividing our
total tangible assets (total assets less intangible assets) less
total liabilities and our preferred stock by the actual number
of outstanding shares of our common stock. Our pro forma net
tangible book value as of December 31, 2010 was
approximately $ , or approximately
$ per share, based
on shares
of common stock outstanding after giving effect to (1) the
issuance of an aggregate of 14,167,285 shares of our common
stock issuable upon the automatic exchange of all of the
outstanding common exchangeable shares of SiGe Canada in
connection with this offering, as described in “Description
of Capital Stock — Exchangeable Shares” elsewhere
in this prospectus; and (2) the automatic conversion of all
outstanding shares of our preferred stock, including all shares
of our preferred stock issued in exchange for all of the
outstanding preferred exchangeable shares of SiGe Canada, into
an aggregate of 19,353,591 shares of our common stock in
connection with this offering, as described in “Description
of Capital Stock — Exchangeable Shares” elsewhere
in this prospectus. Pro forma net tangible book value per share
represents the amount of our total tangible assets (total assets
less intangible assets) less total liabilities, divided by the
pro forma number of shares of common stock outstanding before
giving effect to this offering.
After giving effect to our sale
of shares
of common stock in this offering based on an assumed initial
public offering price of $ per
share, the mid-point of the price range set forth on
38
the cover of this prospectus, less underwriting discounts and
commissions and estimated offering expenses payable by us, our
pro forma net tangible book value after this offering would have
been $ per share. This represents
an immediate increase in pro forma net tangible book value per
share of $ to existing
stockholders and immediate dilution in pro forma net tangible
book value of $ per share to new
investors purchasing our common stock in this offering at the
initial public offering price. Dilution per share to new
investors is determined by subtracting pro forma net tangible
book value per share after this offering from the assumed
initial public offering price per share paid by a new investor.
The following table illustrates the per share dilution to new
investors:
| |
|
|
|
|
|
|
|
|
|
Assumed initial public offering price per
share(1)
|
|
|
|
|
|
$
|
|
|
|
Historical net tangible book value per share as of
December 31, 2010
|
|
$
|
|
|
|
|
|
|
|
Increase per share due to the conversion of all exchangeable
common stock and preferred stock
|
|
|
|
|
|
|
|
|
|
|
|
|
|
|
|
|
|
|
|
Pro forma net tangible book value per share as of
December 31, 2010
|
|
|
|
|
|
|
|
|
|
Increase per share attributable to new investors
|
|
|
|
|
|
|
|
|
|
|
|
|
|
|
|
|
|
|
|
Pro forma net tangible book value per share after this offering
|
|
|
|
|
|
|
|
|
|
|
|
|
|
|
|
|
|
|
|
Dilution per share to new investors
|
|
|
|
|
|
$
|
|
|
|
|
|
|
|
|
|
|
|
|
|
|
|
|
(1)
|
|
The mid-point of the price range
set forth on the cover of this prospectus.
|
A $ increase (decrease) in the
assumed initial public offering price of
$ per share, the mid-point of the
price range set forth on the cover of this prospectus, would
increase (decrease) the pro forma net tangible book value per
share after giving effect to this offering by
$ per share and would increase
(decrease) the dilution in pro forma net tangible book value per
share to investors in this offering by
$ per share. This calculation
assumes that the number of shares offered by us, as set forth on
the cover page of this prospectus, remains the same and after
deducting underwriting discounts and commissions and estimated
offering expenses payable by us.
The following table summarizes as of December 31, 2010 the
number of shares of our common stock purchased from us, the
total cash consideration paid to us and the average price per
share paid to us by existing stockholders and by new investors
in this offering at an assumed initial public offering price of
$ per share, the mid-point of the
price range set forth on the cover of this prospectus, before
deducting underwriting discounts and commissions and estimated
offering expenses payable by us.
| |
|
|
|
|
|
|
|
|
|
|
|
|
|
|
|
|
|
|
|
|
|
|
|
Shares Purchased
|
|
|
Total Consideration
|
|
|
|
|
|
|
|
|
|
|
|
|
|
|
|
|
|
|
|
|
|
|
|
|
|
|
|
Average
|
|
|
|
|
|
|
|
|
|
|
|
|
|
|
|
|
Price Per
|
|
|
|
|
Number
|
|
|
Percent
|
|
|
Amount
|
|
|
Percent
|
|
|
Share
|
|
|
|
|
(in thousands, except per share numbers)
|
|
|
|
|
|
|
|
Existing stockholders
|
|
|
|
|
|
|
|
%
|
|
$
|
|
|
|
|
|
%
|
|
$
|
|
|
|
New investors
|
|
|
|
|
|
|
|
|
|
|
|
|
|
|
|
|
|
|
|
|
|
|
|
|
|
|
|
|
|
|
|
|
|
|
|
|
|
|
|
|
|
|
|
Total
|
|
|
|
|
|
|
|
%
|
|
$
|
|
|
|
|
|
%
|
|
|
|
|
|
|
|
|
|
|
|
|
|
|
|
|
|
|
|
|
|
|
|
|
|
|
To the extent that outstanding options are exercised, you will
experience further dilution. In addition, we may choose to raise
additional capital due to market conditions or strategic
considerations even if we believe we have sufficient funds for
our current or future operating plans. To the extent that
additional capital is raised through the sale of equity or
convertible debt securities, the issuance of these securities
may result in further dilution to our stockholders.
Sales by the selling stockholders in this offering will cause
the number of shares held by the existing stockholders to be
reduced
to shares
or % of the total number of shares
of our common stock outstanding after this offering. If the
underwriters exercise their option to
purchase
additional shares of our common stock from the selling
stockholders in this offering, the number of shares held by the
existing stockholders after this offering would be reduced
to % of the total number of shares
of our common stock outstanding after this offering, and the
number of shares held by new investors will increase
to million
shares of our common stock, or % of
the total number of shares of our common stock outstanding after
this offering.
39
SELECTED
CONSOLIDATED FINANCIAL DATA
The selected consolidated statement of operations data presented
below for the year ended December 31, 2006, or fiscal 2006,
the year ended December 28, 2007, or fiscal 2007, and the
summary consolidated balance sheet data as of December 31,
2006, December 28, 2007 and January 2, 2009 have been
derived from our audited annual consolidated financial
statements not included in this prospectus. The selected
consolidated statement of operations data presented below for
fiscal 2008, fiscal 2009 and fiscal 2010, and the consolidated
balance sheet data as of January 1, 2010 and
December 31, 2010 have been derived from our audited annual
consolidated financial statements included elsewhere in this
prospectus.
Our historical results are not necessarily indicative of future
operating results. You should read this selected consolidated
financial data in conjunction with the sections entitled
“Risk Factors,” “Capitalization,”
“Management’s Discussion and Analysis of Financial
Condition and Results of Operations” and our consolidated
financial statements and related notes, all included elsewhere
in this prospectus.
| |
|
|
|
|
|
|
|
|
|
|
|
|
|
|
|
|
|
|
|
|
|
|
|
Fiscal
|
|
|
|
|
2006(1)
|
|
|
2007(1)
|
|
|
2008
|
|
|
2009
|
|
|
2010
|
|
|
|
|
(in thousands, except per share amounts)
|
|
|
|
|
Consolidated Statement of Operations Data:
|
|
|
|
|
|
|
|
|
|
|
|
|
|
|
|
|
|
|
|
|
|
Revenue
|
|
|
$48,518
|
|
|
|
$68,798
|
|
|
|
$96,921
|
|
|
|
$82,602
|
|
|
|
$103,318
|
|
|
Cost of revenue
|
|
|
33,671
|
|
|
|
43,241
|
|
|
|
63,233
|
|
|
|
53,584
|
|
|
|
66,526
|
|
|
|
|
|
|
|
|
|
|
|
|
|
|
|
|
|
|
|
|
|
|
|
|
Gross profit
|
|
|
14,847
|
|
|
|
25,557
|
|
|
|
33,688
|
|
|
|
29,018
|
|
|
|
36,792
|
|
|
Operating expenses:
|
|
|
|
|
|
|
|
|
|
|
|
|
|
|
|
|
|
|
|
|
|
Research and development
|
|
|
19,996
|
|
|
|
17,407
|
|
|
|
16,402
|
|
|
|
15,052
|
|
|
|
14,449
|
|
|
Selling, general and administrative
|
|
|
9,413
|
|
|
|
14,570
|
|
|
|
21,569
|
|
|
|
18,489
|
|
|
|
17,846
|
|
|
Restructuring
|
|
|
671
|
|
|
|
—
|
|
|
|
(120
|
)
|
|
|
—
|
|
|
|
—
|
|
|
|
|
|
|
|
|
|
|
|
|
|
|
|
|
|
|
|
|
|
|
|
|
|
|
|
30,080
|
|
|
|
31,977
|
|
|
|
37,851
|
|
|
|
33,541
|
|
|
|
32,295
|
|
|
|
|
|
|
|
|
|
|
|
|
|
|
|
|
|
|
|
|
|
|
|
|
(Loss) income from operations
|
|
|
(15,233
|
)
|
|
|
(6,420
|
)
|
|
|
(4,163
|
)
|
|
|
(4,523
|
)
|
|
|
4,497
|
|
|
Interest income, net
|
|
|
262
|
|
|
|
628
|
|
|
|
380
|
|
|
|
167
|
|
|
|
32
|
|
|
|
|
|
|
|
|
|
|
|
|
|
|
|
|
|
|
|
|
|
|
|
|
(Loss) income before income taxes
|
|
|
(14,971
|
)
|
|
|
(5,792
|
)
|
|
|
(3,783
|
)
|
|
|
(4,356
|
)
|
|
|
4,529
|
|
|
Income taxes (recovery)
|
|
|
—
|
|
|
|
14
|
|
|
|
17
|
|
|
|
21
|
|
|
|
(2,515
|
)
|
|
|
|
|
|
|
|
|
|
|
|
|
|
|
|
|
|
|
|
|
|
|
|
Net (loss) income and comprehensive (loss) income
|
|
|
(14,971
|
)
|
|
|
(5,806
|
)
|
|
|
(3,800
|
)
|
|
|
(4,377
|
)
|
|
|
7,044
|
|
|
Accretion to redemption value of preferred stock
|
|
|
(9,826
|
)
|
|
|
(25
|
)
|
|
|
(39
|
)
|
|
|
(39
|
)
|
|
|
(40
|
)
|
|
Net income allocated to redeemable convertible preferred
stockholders
|
|
|
—
|
|
|
|
—
|
|
|
|
—
|
|
|
|
—
|
|
|
|
(2,920
|
)
|
|
|
|
|
|
|
|
|
|
|
|
|
|
|
|
|
|
|
|
|
|
|
|
Net (loss) income attributable to common stockholders
|
|
|
$(24,797
|
)
|
|
|
$(5,831
|
)
|
|
|
$(3,839
|
)
|
|
|
$(4,416
|
)
|
|
|
$4,084
|
|
|
|
|
|
|
|
|
|
|
|
|
|
|
|
|
|
|
|
|
|
|
|
40
| |
|
|
|
|
|
|
|
|
|
|
|
|
|
|
|
|
|
|
|
|
|
|
|
Fiscal
|
|
|
|
|
2006(1)
|
|
|
2007(1)
|
|
|
2008
|
|
|
2009
|
|
|
2010
|
|
|
|
|
(in thousands, except per share amounts)
|
|
|
|
|
Net (loss) income per
share:(2)
|
|
|
|
|
|
|
|
|
|
|
|
|
|
|
|
|
|
|
|
|
|
Net (loss) income per share attributable to common stockholders
|
|
|
|
|
|
|
|
|
|
|
|
|
|
|
|
|
|
|
|
|
|
Basic
|
|
|
$(6.55
|
)
|
|
|
$(0.15
|
)
|
|
|
$(0.06
|
)
|
|
|
$(0.07
|
)
|
|
|
$0.07
|
|
|
|
|
|
|
|
|
|
|
|
|
|
|
|
|
|
|
|
|
|
|
|
|
Diluted
|
|
|
(6.55
|
)
|
|
|
(0.15
|
)
|
|
|
(0.06
|
)
|
|
|
(0.07
|
)
|
|
|
0.06
|
|
|
|
|
|
|
|
|
|
|
|
|
|
|
|
|
|
|
|
|
|
|
|
|
Shares used to compute net (loss) income per share attributable
to common stockholders
|
|
|
|
|
|
|
|
|
|
|
|
|
|
|
|
|
|
|
|
|
|
Basic
|
|
|
3,787
|
|
|
|
39,506
|
|
|
|
59,763
|
|
|
|
60,100
|
|
|
|
59,898
|
|
|
Diluted
|
|
|
3,787
|
|
|
|
39,506
|
|
|
|
59,763
|
|
|
|
60,100
|
|
|
|
72,908
|
|
|
Pro forma net income per share attributable to common
stockholders
(unaudited)(3)
|
|
|
|
|
|
|
|
|
|
|
|
|
|
|
|
|
|
|
|
|
|
Basic
|
|
|
|
|
|
|
|
|
|
|
|
|
|
|
|
|
|
|
$0.09
|
|
|
|
|
|
|
|
|
|
|
|
|
|
|
|
|
|
|
|
|
|
|
|
|
Diluted
|
|
|
|
|
|
|
|
|
|
|
|
|
|
|
|
|
|
|
0.08
|
|
|
|
|
|
|
|
|
|
|
|
|
|
|
|
|
|
|
|
|
|
|
|
|
Shares used to compute pro forma net income per share
attributable to common stockholders
(unaudited)(3)
|
|
|
|
|
|
|
|
|
|
|
|
|
|
|
|
|
|
|
|
|
|
Basic
|
|
|
|
|
|
|
|
|
|
|
|
|
|
|
|
|
|
|
79,252
|
|
|
Diluted
|
|
|
|
|
|
|
|
|
|
|
|
|
|
|
|
|
|
|
92,262
|
|
| |
|
|
|
|
|
|
|
|
|
|
|
|
|
|
|
|
|
|
|
|
|
|
|
As of
|
|
|
|
|
December 31,
|
|
|
December 28,
|
|
|
January 2,
|
|
|
January 1,
|
|
|
December 31,
|
|
|
|
|
2006
|
|
|
2007
|
|
|
2009
|
|
|
2010
|
|
|
2010
|
|
|
|
|
(in thousands)
|
|
|
|
|
Consolidated Balance Sheet Data:
|
|
|
|
|
|
|
|
|
|
|
|
|
|
|
|
|
|
|
|
|
|
Cash and cash equivalents
|
|
|
$5,644
|
|
|
|
$22,570
|
|
|
|
$15,643
|
|
|
|
$11,002
|
|
|
|
$10,392
|
|
|
Working
capital(4)
|
|
|
10,397
|
|
|
|
25,828
|
|
|
|
21,742
|
|
|
|
18,352
|
|
|
|
22,521
|
|
|
Total assets
|
|
|
22,617
|
|
|
|
39,758
|
|
|
|
40,893
|
|
|
|
32,911
|
|
|
|
42,479
|
|
|
Redeemable convertible preferred stock
|
|
|
144,248
|
|
|
|
19,828
|
|
|
|
19,868
|
|
|
|
19,907
|
|
|
|
19,947
|
|
|
Total stockholders’ equity (deficit)
|
|
|
(130,988
|
)
|
|
|
7,991
|
|
|
|
4,851
|
|
|
|
1,390
|
|
|
|
8,609
|
|
|
|
|
|
(1)
|
|
Effective January 1, 2006, we
adopted authoritative guidance for share-based payments which
requires us to recognize compensation costs for all share-based
payments granted, modified, or settled after January 1,
2006, as well as for any awards granted prior to January 1,
2006 which are subsequently modified or repurchased. For fiscal
2005, we used the intrinsic value method of measuring stock
options.
|
|
|
|
|
(2)
|
|
See note 1(q) to our
consolidated financial statements included elsewhere in this
prospectus for an explanation of the method used to calculate
net (loss) income per share attributable to common stockholders,
including the method used to calculate the number of shares used
in the computation of the per share amounts.
|
|
|
|
|
(3)
|
|
The pro forma data above reflects
(i) the issuance of an aggregate of 14,167,285 shares
of our common stock issuable upon the automatic exchange of all
of the outstanding common exchangeable shares of SiGe Canada in
connection with this offering, as described in “Description
of Capital Stock — Exchangeable Shares” elsewhere
in this prospectus; and (ii) the automatic conversion of
all outstanding shares of our preferred stock, including all
shares of our preferred stock issued in exchange for all of the
outstanding preferred exchangeable shares of SiGe Canada, into
an aggregate of 19,353,591 shares of our common stock in
connection with this offering, as described in “Description
of Capital Stock — Exchangeable Shares” elsewhere
in this prospectus.
|
|
|
|
|
(4)
|
|
Working capital is equal to current
assets less current liabilities.
|
41
MANAGEMENT’S DISCUSSION AND ANALYSIS OF
FINANCIAL CONDITION AND RESULTS OF OPERATIONS
This Management’s Discussion and Analysis of Financial
Condition and Results of Operations should be read in
conjunction with “Selected Consolidated Financial
Data” and our consolidated financial statements and notes
thereto which appear elsewhere in this prospectus. This
discussion and analysis of our financial condition may contain
forward-looking statements based upon current expectations that
involve risks and uncertainties. Our actual results may differ
materially from those anticipated in these forward-looking
statements as a result of various factors, including those set
forth under the caption “Risk Factors” or in other
parts of this prospectus.
Overview
We are a leading provider of highly integrated RF semiconductor
front end solutions that enable wireless connectivity across a
wide range of applications. Our innovative solutions integrate
multiple RF functions into a single semiconductor device to
deliver an optimal combination of performance, size, power
output and efficiency. We have shipped more than
700 million front end solutions since our inception,
primarily consisting of Wi-Fi front end modules and power
amplifiers.
We are a fabless semiconductor company and we outsource all of
our manufacturing operations to leading semiconductor foundries
and assembly and test contractors. This manufacturing model
enhances our ability to rapidly scale production volumes, is
highly capital efficient and affords us the flexibility to
select the optimal technologies for each product. We have
historically used a combination of silicon and non-silicon based
process technologies to meet the needs of our customers, and we
believe our predominant use of silicon based technologies
positions us to effectively meet the technical demands of an
array of high volume RF applications. We outsource silicon
wafer fabrication to IBM Microelectronics, GaAs wafer
fabrication to WIN Semiconductor and integrated passive device
manufacturing to STATS ChipPAC. Our primary assembly and test
contractors include Unisem, Foxconn and Tong Hsing.
We work closely with our reference design partners to
incorporate our RF front end solutions into their reference
designs. Our reference design partners include, among others,
Atheros, Broadcom, CSR, Marvell and Ralink. We also work with
our reference design partners to qualify and market our
solutions to leading global OEMs and ODMs. We primarily sell our
solutions to ODMs, distributors such as Promaster and Richpower
and, to a lesser extent, directly to OEMs. According to publicly
available information, our products have been incorporated into
devices branded by leading OEMs, including Apple, Cisco,
Hewlett-Packard, Lenovo, NetGear, Nintendo, Panasonic, Samsung
and Thomson. We primarily sell our solutions to ODMs, including
Hon Hai and Universal Scientific Industrial, to
distributors such as Promaster and RichPower, and, to a lesser
extent, directly to OEMs. Substantially all of our sales are
made on a purchase order basis, not under long-term supply
contracts.
Historically, a small number of customers represented a
significant portion of our revenue. For fiscal 2010, Hon Hai,
Promaster, Universal Scientific Industrial and RichPower
accounted for 26%, 27%, 10% and 15% of our revenue,
respectively, and collectively accounted for 78% of our revenue
for this period. We expect to continue to experience customer
concentration in future periods.
Our typical sales cycle consists of a multi-month sales and
development process and requires a substantial expenditure of
resources before we receive revenue from product sales, if at
all. The period from early engagement to high volume production
typically takes six to 12 months for existing customers and
12 to 18 months for new customers. Our solutions typically
remain part of a reference design during the life cycle of a
product, which typically spans one to three years for computing,
home entertainment and mobile applications and three to five
years for networking applications.
Because our new products are often designed with improved
performance specifications and increased functionality compared
to previous generation products, it is difficult to isolate and
quantify
42
the impact of price erosion on our results of operations in a
given period. Over time, however, we believe that the markets
for our products have historically exhibited a consistent
pattern of price erosion, especially as a new generation of a
product is introduced to the market. In addition, we are
constantly working with our customers to redesign their products
to incorporate new technology and to further reduce costs. Both
of these trends are typical of the semiconductor industry and we
expect these trends to continue in the future. Historically, our
gross margins have not been significantly affected by declines
in average selling prices because lower average selling prices
associated with newer generation products are typically offset
by lower costs and because the pricing for our solutions is
typically fixed for the life of a product once our solutions
have been incorporated into a reference design. Sales are
generally made pursuant to purchase orders at previously agreed
upon prices over the lifespan of a reference design and not
pursuant to long-term purchase commitments. These purchase
orders are made without deposits and may be rescheduled,
canceled or modified on relatively short notice, and in most
cases without substantial penalty.
To maintain our gross margins, we must continue to develop and
introduce new solutions and enhancements on a timely basis and
seek to reduce our costs. Failure to do so would cause our
revenue and gross margins to decline.
Typically, our revenue has been higher in the second and third
quarters due to seasonal consumer buying patterns. We believe
our focus on multiple target markets and an expanding base of
end applications will help to mitigate our exposure to
volatility in any single target market.
Uncertainty in global economic conditions poses several risks to
our business, as customers may defer purchases in response to
higher unemployment, tighter credit, negative economic trends
and inventory corrections, which would negatively affect demand
for our solutions and our results of operations. For example, as
a result of the recent global recession and a decline in
consumer spending, our revenue decreased significantly during
the three months ended January 2, 2009, or the fourth
quarter of fiscal 2008, and the three months ended April 3,
2009, or the first quarter of fiscal 2009. In response, we
reduced headcount, including seven engineering employees, four
sales and marketing employees, one finance employee and one
information technology employee, and took other actions to
reduce operating expenses, including implementing a salary
freeze in fiscal 2009, which was subsequently lifted in the
three months ended April 2, 2010, or the first quarter of
fiscal 2010. Our operating results for the fourth quarter of
fiscal 2008 and the first quarter of fiscal 2009 were adversely
affected by revenue declines and the costs associated with the
steps we took to reduce operating expenses.
Revenue
Substantially all of our revenue is derived from the sale of RF
front end semiconductor solutions and power amplifiers to ODMs
and distributors and, to a lesser extent, directly to OEMs.
Substantially all of our sales are made on a purchase order
basis, not under long-term supply contracts, and we depend on a
small number of customers for a substantial portion of our
revenue. Our solutions are incorporated into a broad range of
devices including desktop and laptop computers and peripherals,
consumer and enterprise networking equipment and home
entertainment devices. We have recently entered the smartphone
and mobile Internet device markets and began shipping
Wi-Fi front
end modules to one of the world’s leading mobile handset
manufacturers. Though our revenues to date from this
manufacturer have not been material, we aim to steadily increase
these revenues and expand our sales of Wi-Fi front end modules
in the smartphone and mobile Internet device markets. We also
recently introduced our first solutions for cellular
infrastructure and smart energy applications.
Cost and
Expenses
Cost of revenue. Cost of revenue consists
primarily of the cost of semiconductor wafers and other
component parts, assembly, test and packaging costs and
depreciation of automated test equipment. Cost of revenue also
includes personnel and overhead costs associated with operations
43
and logistics, as well as stock based compensation and occupancy
costs. Cost of revenue also includes product fulfillment costs,
warranty provisions and inventory reserves or write-offs.
Research and development. Research and
development expense includes personnel related costs, including
stock based compensation, new product engineering mask costs,
computer-aided design software costs, prototype design and
development costs, depreciation and allocated occupancy and
overhead costs. We receive government and other funding to
support a portion of our research and development activities.
Research and development costs are expensed as incurred and are
presented net of funding earned. Research and development
activities include new product design, refinement of existing
solutions for use in next generation parts and design of test
methodologies to ensure compliance with product specifications.
Selling, general and administrative. Selling
expense consists primarily of third party commissions, as well
as personnel related costs, including stock based compensation.
During fiscal 2008, 2009 and 2010, we incurred expenses of
$11.3 million, $9.2 million and $7.4 million,
respectively, under an incentive agreement with an unaffiliated
third party pursuant to which we paid commissions in connection
with our sale of specified products covered by the agreement. In
July 2010, we entered into a payment agreement with that third
party and at the same time terminated the incentive agreement.
Under our new payment agreement, we have agreed to pay
commissions in connection with our sale of certain of the
specified products covered by the terminated incentive
agreement. No new products have been added to either the
incentive agreement or the payment agreement since April 2008.
The payment agreement has an initial term that expires on
December 31, 2013 and automatically renews each year
thereafter for successive one-year terms unless either party
provides written notice of its intention to terminate. We expect
commissions payable under the payment agreement to decline over
the term of this agreement as the products covered by this
agreement are replaced by next generation products or are
transitioned to end of life status.
Also included in selling expenses are field application
engineering support costs, travel costs for direct sales and
marketing personnel and allocated occupancy and overhead costs.
General and administrative expense consists primarily of
compensation and associated costs for executive management, and
finance, legal and human resources staff, including stock based
compensation, as well as outside professional fees, allocated
occupancy and overhead costs and depreciation.
Interest income, net. Interest income, net
consists of interest earned on our cash and cash equivalents
less interest expense.
Provision for income taxes. From inception
through 2009, we incurred annual losses, and accordingly, we
determined that a valuation allowance should be recorded against
all of our deferred tax assets. In the fourth quarter of fiscal
2010 we determined that, based on the company’s prospects
and business outlook, it was reasonable to conclude that it is
more likely than not that a portion of our deferred tax assets
in one foreign tax jurisdiction will be realized. Accordingly,
we released a portion of the valuation allowance recorded
against our deferred tax assets based on the weight of positive
evidence that existed at December 31, 2010. In the future,
our effective tax rate will vary based on a number of factors
including overall profitability, the level of profitability by
tax jurisdiction, the tax rates of those jurisdictions and our
ability to utilize significant loss and credit carry-forwards to
offset income taxes. Our historical income tax provisions are
not necessarily reflective of our future results of operations.
For United States federal and United Kingdom tax purposes, we
had NOL carryforwards of approximately $23.7 million and
$25.5 million, respectively, as of December 31, 2010.
The NOL carryforwards for United States federal tax purposes
expire gradually from 2019 through 2030 and the NOL
carryforwards for United Kingdom tax purposes do not expire. We
also have Canadian research and development expense
carryforwards and investment tax credits of $19.3 million
and $8.4 million, respectively. The Canadian research and
development expense carryforwards are available to reduce
44
any future Canadian taxable income and do not expire. The
Canadian investment tax credits are available to reduce taxes
payable and expire gradually from 2018 through 2030.
As discussed in more detail under “Risk Factors —
Risks Related to Our Business — Our ability to use our
United States federal net operating loss carryforwards may be
limited,” under the Code, certain substantial cumulative
changes in ownership could result in an annual limitation on the
amount of NOL carryforwards that can be utilized in future years
to offset future taxable income. Annual limitations may result
in the expiration of NOL carryforwards before they are used.
Fiscal Period
Presentation
During fiscal 2007, we changed our fiscal year end to be the
Friday closest to December 31. Fiscal 2007 consisted of
52 weeks and ended on December 28, 2007. Fiscal 2008
consisted of 53 weeks and ended on January 2, 2009.
Fiscal 2009 consisted of 52 weeks and ended on
January 1, 2010. Fiscal 2010 consisted of 52 weeks and
ended on December 31, 2010.
Critical
Accounting Policies and Estimates
The preparation of financial statements in conformity with
accounting principles generally accepted in the United States of
America requires our management to make estimates and
assumptions that affect the reported amounts of assets and
liabilities and disclosure of contingent assets and liabilities
at the dates of the financial statements and the reported
amounts of revenue and expenses during the relevant period.
Actual results could differ significantly from these estimates.
We believe that the following accounting policies involve a
greater degree of judgment and complexity than our other
accounting policies. Accordingly, these are the policies we
believe are the most critical to understanding and evaluating
our consolidated financial condition and results of operations.
Revenue recognition. Revenue from product
sales is recognized when evidence of an arrangement exists, the
product is shipped to the customer and customer acceptance
provisions and specifications have been met, the selling price
is fixed or determinable and collectability is reasonably
assured. Certain product sales are made to electronic component
distributors under agreements allowing for price protection
and/or a
right of return on unsold products. A reserve for sales returns
and allowances for customers is recorded based on historical
experience or specific identification of an event necessitating
a reserve. The allowance is based on our estimate of historical
experience rates as well as consideration of economic conditions
and contractual terms.
Inventory. Inventory is valued at the lower of
cost or market. Cost is determined using the
first-in,
first-out method. Provision is made for inventory on hand that
is in excess of forecasted demand. These reserves are equal to
the cost basis of the excess or obsolete inventory and once
recorded are considered permanent adjustments. Calculation of
the reserves requires management to use judgment and make
assumptions about forecasted demand in relation to the inventory
on hand, competitiveness of our product offerings, general
market conditions and product life cycles upon which the
reserves are based. When inventory on hand exceeds foreseeable
demand, reserves are established for the value of such inventory
that is not expected to be sold at the time of the review.
If actual demand and market conditions are less favorable than
those we project, additional inventory reserves may be required
and our results of operations could be materially affected. Some
or all of the inventories that have been reserved may be
retained and made available for sale, however, they are
generally scrapped over time. To the extent we are able to sell
inventory that has been previously provisioned, we reverse the
reserve and credit cost of revenue.
Stock based compensation. Stock options are
measured at the grant date based on the fair value of the award.
For purposes of estimating the grant date fair value of stock
based compensation, we use the Black-Scholes option-pricing
model. The fair value of awards granted is recognized as
compensation expense over the period that the employee is
required to provide services in exchange for the options
granted, typically the vesting period. We classify these amounts
as compensation
45
expense in the statements of operations based on the function
performed by the employee. We recognized stock based
compensation in the statements of operations as follows:
| |
|
|
|
|
|
|
|
|
|
|
|
|
|
|
|
Fiscal
|
|
|
|
|
2008
|
|
|
2009
|
|
|
2010
|
|
|
|
|
(in thousands)
|
|
|
|
|
Cost of revenue
|
|
$
|
17
|
|
|
$
|
37
|
|
|
$
|
23
|
|
|
Research and development
|
|
|
161
|
|
|
|
262
|
|
|
|
295
|
|
|
Selling, general and administrative
|
|
|
498
|
|
|
|
615
|
|
|
|
485
|
|
|
|
|
|
|
|
|
|
|
|
|
|
|
|
|
Total
|
|
$
|
676
|
|
|
$
|
914
|
|
|
$
|
803
|
|
|
|
|
|
|
|
|
|
|
|
|
|
|
|
The total unrecognized compensation cost related to unvested
stock option grants as of January 1, 2010 and
December 31, 2010 was $1.0 million and
$1.8 million, respectively, and the weighted average period
over which these grants are expected to vest is 0.9 years
and 1.3 years, respectively.
The fair value of options on their date of grant was determined
using the Black-Scholes option-pricing model with the following
assumptions:
| |
|
|
|
|
|
|
|
|
|
|
|
|
|
|
|
Fiscal
|
|
|
|
|
2008
|
|
|
2009
|
|
|
2010
|
|
|
|
|
Risk-free interest rate
|
|
|
2.82
|
%
|
|
|
2.80
|
%
|
|
|
2.26
|
%
|
|
Dividend yield
|
|
|
—
|
|
|
|
—
|
|
|
|
—
|
|
|
Expected life of options (years)
|
|
|
4.0
|
|
|
|
6.1
|
|
|
|
6.1
|
|
|
Volatility
|
|
|
58.0
|
%
|
|
|
70.0
|
%
|
|
|
61.4
|
%
|
The risk-free interest rate assumption was based on United
States Treasury rates for zero-coupon bonds with maturities
similar to those of the expected term of the award being valued.
The assumed dividend yield reflects our expectation of not
paying dividends in the foreseeable future. The weighted average
expected life of options was calculated using the simplified
method as prescribed by guidance provided by the Securities and
Exchange Commission. The decision to use the simplified method
was based on the lack of relevant historical data due to our
limited operating history. Because of our lack of public trading
history and the lack of historical data on the volatility of our
common stock, we estimated our expected volatility based upon
the historical volatilities of comparable companies within the
semiconductor industry whose share prices are publicly
available. When making the selections of our comparable
companies to be used in the volatility calculation, we
considered their industry, stage of development, size and
financial leverage. The most important selection criteria is
that the peer companies be in the same industry with similar or
competing products. Since the semiconductor industry is
cyclical, we believe it is very important to choose companies in
our industry and whose products are similar to or competing with
our products. As we began pursuing our initial public offering
in May 2010, we reviewed the impact of the recent changes in our
size and life-cycle on the volatility calculation. As a result
of this review and beginning with the grant of stock options in
the third quarter of fiscal 2010, we expanded our volatility
peer group with three additional semiconductor companies that
have similar size and life-cycle to us.
As we obtain our own public stock price history we expect to use
our volatility once sufficient history exists, in combination
with other volatility measures, such as the volatility of peer
companies as we use today, as an input to determine the fair
value of stock options. Eventually we expect to use solely our
volatility, but only after a longer history has been
established. This change in approach towards determining
volatility over time could significantly change the fair value
calculated for our future stock option grants. Higher volatility
would result in an increase to stock-based compensation cost
determined at the date of grant.
If in the future we determine that other methods are more
reasonable, or other methods for calculating these assumptions
are prescribed by authoritative guidance, the fair value
calculated for
46
our stock options could change significantly. Higher volatility
and longer expected lives result in an increase to stock-based
compensation expense determined at the date of grant.
Given the absence of a public market for our common stock, our
board of directors estimated the fair value of our common stock
for purposes of determining stock based compensation expense for
the relevant periods. Our board of directors, which includes
members who are experienced in valuing the securities of
privately-held companies, considered objective and subjective
factors in determining the estimated fair value of our common
stock on each grant date. Factors considered by our board of
directors included:
|
|
|
| |
•
|
the rights, preferences and privileges of our convertible
preferred stock relative to those of our common stock;
|
| |
| |
•
|
our historical operating results, current financial position and
forecasted financial and operational performance;
|
| |
| |
•
|
the valuation multiples of publicly traded comparable companies;
|
| |
| |
•
|
the fact that our option grants involve illiquid securities in a
private company;
|
| |
| |
•
|
the prices of our convertible preferred stock and our common
stock sold by existing investors to outside investors in
arm’s-length transactions;
|
| |
| |
•
|
the risks inherent in the development of our products and
expansion of our target markets; and
|
| |
| |
•
|
the likelihood of a liquidity event such as an initial public
offering of our common stock or sale of our company, given
prevailing market conditions.
|
Our board of directors performed valuations of our common stock
on April 30, 2006, July 31, 2007, December 31,
2008, May 13, 2010 and September 23, 2010 to determine
the fair value for options granted from March 31, 2006
through March 1, 2011. The April 30, 2006 valuation
was prepared using the market-comparable approach and the income
approach to estimate the aggregate enterprise value. The three
other valuations were prepared using the option-pricing method
using recent transactions involving the sale of shares of our
preferred stock. The market comparable and income approaches
rely on forecasts and assumptions related to a limited range of
identified future outcomes for our company. Our performance in
fiscal 2006 and fiscal 2007 did not match the forecasts we
relied on for the April 30, 2006 valuation. Further, we
restructured our equity capital in April 2007, an event we had
not predicted in connection with the prior valuation.
Accordingly, we decided to change to the option-pricing method
because it is a more appropriate methodology to use when the
range of possible future outcomes for a company is too difficult
to predict, rendering valuation based on forecasts highly
speculative.
The market-comparable approach indicates the fair value of a
business based on a comparison with comparable firms in similar
lines of business that are publicly traded, as well as prior
subject company transactions. Each comparable company was
selected based on various factors, including, but not limited
to, industry similarity, company size, financial risk,
profitability, adequate financial data and an actively traded
stock price.
The income approach indicates the fair value based on the cash
flows that a business can be expected to generate over its
remaining life. This approach begins with an estimation of the
annual cash flows an investor would expect the subject company
to generate over a discrete projection period. The estimated
cash flows for each of the years are then converted to their
present value using a rate of return appropriate for the risk of
achieving the business’ projected cash flows. The present
value of the estimated cash flows are then added to the present
value equivalent of the residual value of the business at the
end of the discrete projection period to arrive at an estimated
fair value of the business.
47
Under the option-pricing method, each class of stock is modeled
as a call option with a distinct claim on the equity value of
the company. If at the date of a liquidity event, the equity
value is less than the total liquidation preference of the
preferred stock, the value of the common stock is zero.
Conversely, if the equity value exceeds the total liquidation
preference of the preferred stock, the common stock will be
worth $1.00 for each dollar of enterprise value in excess of the
total liquidation preference. In this case, the common stock is
equal to a call option until the exercise price equals the
liquidation value of the preferred stock.
We provided a financial forecast for each valuation to be used
in the valuations discussed above. The financial forecasts took
into account past experience and future expectations. There is
inherent uncertainty in these estimates.
We also considered the fact that our stockholders cannot
transfer their shares in the public markets or otherwise, except
for very limited transfers amongst related entities. The
estimated fair value of our common stock at each grant date
reflected a discount for such lack of marketability partially
based on the anticipated likelihood and timing of a liquidity
event. The discount for lack of marketability was 30% for the
April 30, 2006 valuation, zero for the July 31, 2007
valuation due to the recent pricing of shares of our preferred
stock, 22% for the December 31, 2008 valuation, 15% for the
May 13, 2010 valuation, and 8% for the September 23,
2010 valuation. The discount for lack of marketability was
reduced in May 2010 and September 2010 as we were
contemplating an initial public offering and there had been
several recent arms-length sales among holders of our preferred
stock.
The valuations as of April 30, 2006, July 31, 2007,
December 31, 2008, May 13, 2010 and September 23,
2010 resulted in valuations of our common stock at $0.45, $0.21,
$0.21, $1.04, and $1.75, respectively. The principal reasons for
the decrease in the estimated value of our common stock from
April 30, 2006 to July 31, 2007 were as follows:
(1) financial performance at a level lower than targeted
plan performance, (2) projected operating losses,
(3) changes in senior management, and (4) increased
competitive pressures. The principal reasons for the increase in
the estimated fair value of our common stock from July 31,
2007 to September 23, 2010 are as follows:
(1) improved financial performance, (2) successful
collaboration with new reference design partners and entry into
new target markets, (3) improved financial and operational
forecasts, and (4) recent third party arms-length sales
among holders of our preferred stock at higher prices.
The following table shows the common stock option activity over
the past four quarters and for the period from January 1,
2011 through March 15, 2011 including weighted average
exercise price per share:
| |
|
|
|
|
|
|
|
|
|
|
|
|
|
Weighted Average
|
|
|
|
Number of
|
|
Exercise Price per
|
|
Three Months Ended:
|
|
Options Granted
|
|
Share
|
|
|
|
April 2, 2010
|
|
|
486,000
|
|
|
$
|
0.21
|
|
|
July 2, 2010
|
|
|
742,000
|
|
|
$
|
1.04
|
|
|
October 1, 2010
|
|
|
644,000
|
|
|
$
|
1.75
|
|
|
December 31, 2010
|
|
|
195,000
|
|
|
$
|
1.75
|
|
|
January 1, 2011 through March 15, 2011
|
|
|
1,241,500
|
|
|
$
|
1.75
|
|
In June 2010, one of our stockholders notified us of its
intention to sell 600,000 shares of common stock at $1.00
per share to a holder of our preferred stock. We exercised our
right of first refusal to purchase these shares and we closed
this transaction on July 5, 2010.
We believe that we have used reasonable approaches,
methodologies and assumptions consistent with the American
Institute of Certified Public Accountants Practice Guide,
“Valuation of Privately-Held-Company Equity Securities
Issued as Compensation,” to determine the fair value of our
common stock. If we had made different assumptions and estimates
than those described above, the amount of our recognized and to
be recognized stock based compensation expense and net income
(loss) amounts could have been materially different.
48
Based on the initial public offering price of
$ per share, the aggregate
intrinsic values of vested and unvested options to purchase our
common stock outstanding at December 31, 2010 were
approximately $ and
$ , respectively.
Warranty costs. Our products are covered by
product warranty plans that generally are for a period of one
year. A liability for the expected cost of warranty-related
claims is established when products are sold and the related
revenue is recognized. The amount of the warranty liability
accrued reflects an estimate of the expected future costs of
honoring obligations under the warranty plan. In estimating the
warranty liability, historical material replacement costs and
other historical warranty costs are considered along with
consideration of the life cycle of products and actual returns
experience. Should future warranty claims differ from historical
levels, revisions to the estimated warranty liability may be
required and our results of operations could be materially
affected.
Income taxes. We apply the asset and liability
method of recognizing deferred income taxes. Under this method,
the differences between the financial statement carrying amounts
of assets and liabilities and their respective tax bases are
recognized on our balance sheet as deferred income tax assets or
liabilities. Deferred income taxes are adjusted to reflect the
effects of changes in tax laws or enacted tax rates. We have
deferred tax assets, which are subject to periodic
recoverability assessments. Valuation allowances are
established, when necessary, to reduce deferred tax assets to
the amount that is likely to be realized.
From inception through 2009, we incurred annual losses, and
accordingly, we determined that a valuation allowance should be
recorded against all of our deferred tax assets. We considered
future taxable income and prudent and feasible tax planning
strategies in determining the need for a valuation allowance and
evaluated the need for a valuation allowance on a regular basis.
The determination of recording or releasing a tax valuation
allowance is made, in part, pursuant to an assessment performed
by management regarding the likelihood that we will generate
sufficient future taxable income against which the benefits of
our deferred tax assets may or may not be realized. This
assessment requires management to exercise significant judgment
and make estimates with respect to our ability to generate
revenue, gross profits, operating income and taxable income in
future periods. Among other factors, management must make
assumptions regarding current and projected overall business and
semiconductor industry conditions, operating efficiencies, our
ability to timely develop, introduce and consistently
manufacture new products to meet our customers’ needs and
specifications, our ability to adapt to technological changes
and the competitive environment, which may impact our ability to
generate taxable income and, in turn, realize the value of our
deferred tax assets. Significant cumulative operating losses in
fiscal 2009 and prior years and significant economic
uncertainties in the market made management’s ability to
project future taxable income highly uncertain and volatile at
January 1, 2010. Therefore we concluded as of
January 1, 2010 that it was not more likely than not that
our net deferred tax assets would be realized.
During 2010, we recorded cumulative earnings in the past three
years in one foreign tax jurisdiction where we operate.
Additionally by the end of fiscal 2010 visibility into the
future was such that management concluded the recent trend of
profitability in this tax jurisdiction would more likely than
not continue. Based on these facts management reassessed the
need for a valuation allowance at December 31, 2010 and
concluded that a change in circumstances had occurred. We
determined that, based on the company’s prospects and
business outlook, it was reasonable to conclude that it is more
likely than not that a portion of the our deferred tax assets in
this tax jurisdiction will be realized. Accordingly, we released
a portion of the valuation allowance recorded against our
deferred tax assets based on the weight of positive evidence
that existed at December 31, 2010. Significant judgment is
required to determine the timing and extent of a valuation
allowance release and our ability to utilize deferred tax assets
will continue to be dependent on the ability to generate
sufficient taxable income in future periods.
We account for refundable investment tax credits related to
eligible research and development projects as a reduction of
research and development expense. Refundable investment tax
credits are
49
accrued in the period the eligible expenditures are incurred
and management believes recovery of such claims is probable. We
account for non-refundable investment tax credits using the
flow-through method whereby investment tax credits are accrued
and applied to reduce tax.
Backlog
Our sales are generally made pursuant to short-term purchase
orders at previously agreed upon prices over the lifespan of a
reference design and not pursuant to long-term purchase
commitments. These purchase orders are made without deposits and
may be rescheduled, canceled or modified on relatively short
notice, and in most cases without substantial penalty. For these
reasons, we believe that purchase orders and backlog are not
reliable indicators of future sales.
Results of
Operations
Fiscal 2009
Compared to Fiscal 2010
| |
|
|
|
|
|
|
|
|
|
|
|
|
|
|
|
|
|
|
|
Fiscal
|
|
|
|
|
2009
|
|
|
2010
|
|
|
2009
|
|
|
2010
|
|
|
|
|
(in thousands)
|
|
|
(as a percentage
|
|
|
|
|
|
|
|
of revenue)
|
|
|
|
|
Statement of Operations Data:
|
|
|
|
|
|
|
|
|
|
|
|
|
|
|
|
|
|
Revenue
|
|
$
|
82,602
|
|
|
$
|
103,318
|
|
|
|
100
|
%
|
|
|
100
|
%
|
|
Cost of revenue
|
|
|
53,584
|
|
|
|
66,526
|
|
|
|
65
|
%
|
|
|
64
|
%
|
|
|
|
|
|
|
|
|
|
|
|
|
|
|
|
|
|
|
|
Gross profit
|
|
|
29,018
|
|
|
|
36,792
|
|
|
|
35
|
%
|
|
|
36
|
%
|
|
Research and development
|
|
|
15,052
|
|
|
|
14,449
|
|
|
|
18
|
%
|
|
|
14
|
%
|
|
Selling, general and administration
|
|
|
18,489
|
|
|
|
17,846
|
|
|
|
22
|
%
|
|
|
17
|
%
|
|
|
|
|
|
|
|
|
|
|
|
|
|
|
|
|
|
|
|
Total operating expenses
|
|
|
33,541
|
|
|
|
32,295
|
|
|
|
41
|
%
|
|
|
31
|
%
|
|
|
|
|
|
|
|
|
|
|
|
|
|
|
|
|
|
|
|
Operating income (loss)
|
|
|
(4,523
|
)
|
|
|
4,497
|
|
|
|
(5
|
)%
|
|
|
4
|
%
|
|
Interest income, net
|
|
|
167
|
|
|
|
32
|
|
|
|
—
|
|
|
|
—
|
|
|
|
|
|
|
|
|
|
|
|
|
|
|
|
|
|
|
|
|
Income (loss) before income taxes
|
|
|
(4,356
|
)
|
|
|
4,529
|
|
|
|
(5
|
)%
|
|
|
4
|
%
|
|
Income taxes
|
|
|
21
|
|
|
|
(2,515
|
)
|
|
|
—
|
|
|
|
—
|
|
|
|
|
|
|
|
|
|
|
|
|
|
|
|
|
|
|
|
|
Net income (loss)
|
|
$
|
(4,377
|
)
|
|
$
|
7,044
|
|
|
|
(5
|
)%
|
|
|
7
|
%
|
|
|
|
|
|
|
|
|
|
|
|
|
|
|
|
|
|
|
Revenue
Revenue for fiscal 2010 increased $20.7 million, or 25%, to
$103.3 million from $82.6 million for fiscal 2009. A significant
amount of the year over year increase reflected a new design win
for computing solutions which accounted for an increase of $9.4
million, two new design wins for home entertainment solutions
accounting for an increase of $6.9 million, initial
revenues into smartphones of $1.6 million and increased GPS
revenues of $1.8 million.
Cost of
revenue
Cost of revenue for fiscal 2010 increased by $12.9 million, or
24%, to $66.5 million from $53.6 million for fiscal 2009.
This increase primarily reflects an increase in units shipped
during fiscal 2010. Gross profit as a percentage of revenue for
fiscal 2010 was 36% as compared to 35% for fiscal 2009. The
increase is primarily attributable to lower product costs on
certain high volume products due to yield improvements and
negotiated cost reductions.
Research and
development
Research and development expense for fiscal 2010 decreased by
$0.6 million, or 4%, to $14.4 million from $15.1 million in
fiscal 2009. This decrease was primarily attributable to an
increase in funded research and development, from $1.6 million
in fiscal 2009 to $4.0 million in fiscal 2010.
50
This increase in funded research and development largely
reflects reimbursed costs constituting a portion of a five-year
funding grant awarded to us in March 2010 by the Government of
Ontario. Research and development expense in fiscal 2009 also
included approximately $182,000 of severance costs related to
the termination of nine employees in research and development.
The increase in funded research and development and reduction in
severance costs was offset by increased compensation costs
related to hiring and engineering mask costs of
$1.3 million and $550,000, respectively, in fiscal 2010 as
compared to fiscal 2009.
Selling, general
and administrative
Selling, general and administrative costs for fiscal 2010
decreased $0.6 million, or 3%, to $17.8 million from $18.5
million in fiscal 2009. Third party commissions related to the
incentive and payment agreements decreased $1.9 million to $7.4
million in fiscal 2010 as compared to $9.2 million in fiscal
2009, resulting from lower unit sales of products covered under
those agreements. Fiscal 2009 also included severance costs of
$83,000 associated with the termination of four selling, general
and administrative employees. The decrease in third party
commissions and severance costs in fiscal 2010 was offset by an
increase in compensation costs of $695,000 due to hiring of new
employees, increased travel costs of $291,000, increased legal
fees of $127,000 and an increase in facility and communication
costs of $240,000 in fiscal 2010 as compared to fiscal 2009.
Interest income,
net
Interest income, net for fiscal 2010 decreased by $135,000, or
81%, to $32,000 from $167,000 for fiscal 2009. The decrease was
primarily due to lower cash balances during fiscal 2010, as well
as lower yields earned on invested cash.
Income
taxes
For fiscal 2010 we recorded a net tax benefit of $2.5 million,
which reflects an effective tax rate benefit of 55%. The
effective tax rate benefit of 55% differs from the statutory
expense rate of 34% primarily due to a partial release of our
deferred tax valuation allowance and, to a lesser extent,
research and development tax credits, foreign income taxes
provided at lower rates and changes in exchange rates. For
fiscal 2009, our effective tax rate was zero percent due to the
net loss realized and a full valuation allowance on our deferred
tax assets.
Fiscal 2008
Compared to Fiscal 2009
| |
|
|
|
|
|
|
|
|
|
|
|
|
|
|
|
|
|
|
|
Fiscal
|
|
|
|
|
2008
|
|
|
2009
|
|
|
2008
|
|
|
2009
|
|
|
|
|
(in thousands)
|
|
|
(as a percentage of revenue)
|
|
|
|
|
Statement of Operations Data:
|
|
|
|
|
|
|
|
|
|
|
|
|
|
|
|
|
|
Revenue
|
|
$
|
96,921
|
|
|
$
|
82,602
|
|
|
|
100
|
%
|
|
|
100
|
%
|
|
Cost of revenue
|
|
|
63,233
|
|
|
|
53,584
|
|
|
|
65
|
|
|
|
65
|
|
|
|
|
|
|
|
|
|
|
|
|
|
|
|
|
|
|
|
|
Gross profit
|
|
|
33,688
|
|
|
|
29,018
|
|
|
|
35
|
|
|
|
35
|
|
|
Research and development
|
|
|
16,402
|
|
|
|
15,052
|
|
|
|
17
|
|
|
|
18
|
|
|
Selling, general and administrative
|
|
|
21,569
|
|
|
|
18,489
|
|
|
|
22
|
|
|
|
22
|
|
|
Restructuring
|
|
|
(120
|
)
|
|
|
—
|
|
|
|
—
|
|
|
|
—
|
|
|
|
|
|
|
|
|
|
|
|
|
|
|
|
|
|
|
|
|
Total operating expenses
|
|
|
37,851
|
|
|
|
33,541
|
|
|
|
39
|
|
|
|
40
|
|
|
|
|
|
|
|
|
|
|
|
|
|
|
|
|
|
|
|
|
Operating income (loss)
|
|
|
(4,163
|
)
|
|
|
(4,523
|
)
|
|
|
(4
|
)
|
|
|
(5
|
)
|
|
Interest income, net
|
|
|
380
|
|
|
|
167
|
|
|
|
—
|
|
|
|
—
|
|
|
|
|
|
|
|
|
|
|
|
|
|
|
|
|
|
|
|
|
Income (loss) before income taxes
|
|
|
(3,783
|
)
|
|
|
(4,356
|
)
|
|
|
(4
|
)
|
|
|
(5
|
)
|
|
Income taxes
|
|
|
17
|
|
|
|
21
|
|
|
|
—
|
|
|
|
—
|
|
|
|
|
|
|
|
|
|
|
|
|
|
|
|
|
|
|
|
|
Net income (loss)
|
|
$
|
(3,800
|
)
|
|
$
|
(4,377
|
)
|
|
|
(4
|
)%
|
|
|
(5
|
)%
|
|
|
|
|
|
|
|
|
|
|
|
|
|
|
|
|
|
|
51
Revenue
Revenue for fiscal 2009 decreased by $14.3 million, or 15%,
to $82.6 million from $96.9 million for fiscal 2008.
The decrease in revenue during fiscal 2009 was primarily
attributable to a reduction in customer orders, including a
reduction in orders on two products with average selling prices
that are higher than our average. Revenue from products used in
personal navigation devices and home entertainment applications
both decreased during fiscal 2009 due to a decrease in unit
volume shipments for these products resulting from decreased
consumer spending. Revenue from products used in personal
navigation devices was also negatively affected by a decrease in
the average selling price for our solutions used in those
devices.
Cost of
revenue
Cost of revenue for fiscal 2009 decreased by $9.6 million,
or 15%, to $53.6 million from $63.2 million for fiscal
2008. This decrease primarily reflects a decline in units
shipped during fiscal 2009. Gross profit as a percentage of
revenue for both fiscal years was 35%. Despite improved
production yields on certain products introduced in the second
half of fiscal 2008, our gross profit as a percentage of revenue
remained flat due to fixed operating costs applied against a
lower revenue base, as well as increases in costs of raw
materials, such as gold, used in certain of our products.
Research and
development
Research and development expense for fiscal 2009 decreased by
$1.4 million, or 8%, to $15.1 million from
$16.4 million for fiscal 2008. The decrease in research and
development expense is primarily attributable to an increase in
funded research and development, as well as lower compensation
costs for employees located in our Ottawa design center due to
lower headcount and a favorable change in the exchange rate for
the Canadian dollar against the U.S. dollar during fiscal
2009 as compared to fiscal 2008. During the first quarter of
fiscal 2009, in response to the global economic recession, we
eliminated nine employees in research and development.
Selling, general
and administrative
Selling, general and administrative costs for fiscal 2009
decreased by $3.1 million, or 14%, to $18.5 million
from $21.6 million for fiscal 2008. Third party commissions
related to our incentive agreement decreased by
$2.1 million to $9.2 million for fiscal 2009 as
compared to $11.3 million in fiscal 2008, reflecting lower
unit shipments of products covered under the incentive
agreement. Travel and other costs also decreased significantly
in fiscal 2009 as compared to fiscal 2008 as a result of our
efforts to reduce operating expenses.
Interest income,
net
Interest income, net for fiscal 2009 decreased by $213,000, or
56%, to $167,000 from $380,000 during fiscal 2008. The decrease
was primarily due to lower cash balances in fiscal 2009 as well
as lower yields earned on invested cash.
Income
taxes
We had a nil% tax rate for both years due to net losses realized
and a full valuation allowance on our deferred tax assets.
52
Selected
Quarterly Results of Operations (Unaudited)
The following table presents unaudited quarterly results of
operations for each of the eight quarters ended December 31,
2010. This unaudited quarterly information has been prepared on
the same basis as our audited consolidated financial statements
and includes all adjustments, consisting only of normal
recurring adjustments, necessary for a fair presentation of the
information for the quarters presented. You should read these
unaudited quarterly results of operations together with our
consolidated financial statements and the related notes thereto
included in this prospectus. Our results of operations for any
quarter are not necessarily indicative of our results that may
be expected for any future period.
| |
|
|
|
|
|
|
|
|
|
|
|
|
|
|
|
|
|
|
|
|
|
|
|
|
|
|
|
|
|
|
|
|
|
|
|
Three Months Ended
|
|
|
|
|
April 3,
|
|
|
July 3,
|
|
|
October 2,
|
|
|
January 1,
|
|
|
April 2,
|
|
|
July 2,
|
|
|
October 1,
|
|
|
December 31,
|
|
|
|
|
2009
|
|
|
2009
|
|
|
2009
|
|
|
2010
|
|
|
2010
|
|
|
2010
|
|
|
2010
|
|
|
2010
|
|
|
|
|
(in thousands)
|
|
|
|
|
Revenue
|
|
$
|
16,437
|
|
|
$
|
22,005
|
|
|
$
|
22,988
|
|
|
$
|
21,172
|
|
|
$
|
20,690
|
|
|
$
|
28,114
|
|
|
$
|
32,232
|
|
|
$
|
22,282
|
|
|
Cost of revenue
|
|
|
10,834
|
|
|
|
13,990
|
|
|
|
14,988
|
|
|
|
13,772
|
|
|
|
13,046
|
|
|
|
17,830
|
|
|
|
20,346
|
|
|
|
15,304
|
|
|
|
|
|
|
|
|
|
|
|
|
|
|
|
|
|
|
|
|
|
|
|
|
|
|
|
|
|
|
|
|
|
|
|
|
Gross profit
|
|
|
5,603
|
|
|
|
8,015
|
|
|
|
8,000
|
|
|
|
7,400
|
|
|
|
7,644
|
|
|
|
10,284
|
|
|
|
11,886
|
|
|
|
6,978
|
|
|
Research and development
|
|
|
3,876
|
|
|
|
3,711
|
|
|
|
3,528
|
|
|
|
3,937
|
|
|
|
3,210
|
|
|
|
3,800
|
|
|
|
3,982
|
|
|
|
3,457
|
|
|
Selling, general and administrative
|
|
|
4,418
|
|
|
|
5,147
|
|
|
|
4,543
|
|
|
|
4,381
|
|
|
|
4,283
|
|
|
|
5,015
|
|
|
|
4,768
|
|
|
|
3,780
|
|
|
|
|
|
|
|
|
|
|
|
|
|
|
|
|
|
|
|
|
|
|
|
|
|
|
|
|
|
|
|
|
|
|
|
|
Total operating expenses
|
|
|
8,294
|
|
|
|
8,858
|
|
|
|
8,071
|
|
|
|
8,318
|
|
|
|
7,493
|
|
|
|
8,815
|
|
|
|
8,750
|
|
|
|
7,237
|
|
|
|
|
|
|
|
|
|
|
|
|
|
|
|
|
|
|
|
|
|
|
|
|
|
|
|
|
|
|
|
|
|
|
|
|
Operating income (loss)
|
|
|
(2,691
|
)
|
|
|
(843
|
)
|
|
|
(71
|
)
|
|
|
(918
|
)
|
|
|
151
|
|
|
|
1,469
|
|
|
|
3,136
|
|
|
|
(259
|
)
|
|
Interest income, net
|
|
|
52
|
|
|
|
46
|
|
|
|
43
|
|
|
|
26
|
|
|
|
9
|
|
|
|
12
|
|
|
|
5
|
|
|
|
6
|
|
|
|
|
|
|
|
|
|
|
|
|
|
|
|
|
|
|
|
|
|
|
|
|
|
|
|
|
|
|
|
|
|
|
|
|
Income (loss) before income taxes
|
|
|
(2,639
|
)
|
|
|
(797
|
)
|
|
|
(28
|
)
|
|
|
(892
|
)
|
|
|
160
|
|
|
|
1,481
|
|
|
|
3,141
|
|
|
|
(253
|
)
|
|
Income taxes
|
|
|
5
|
|
|
|
5
|
|
|
|
5
|
|
|
|
6
|
|
|
|
6
|
|
|
|
6
|
|
|
|
8
|
|
|
|
(2,535
|
)
|
|
|
|
|
|
|
|
|
|
|
|
|
|
|
|
|
|
|
|
|
|
|
|
|
|
|
|
|
|
|
|
|
|
|
|
Net income (loss)
|
|
$
|
(2,644
|
)
|
|
$
|
(802
|
)
|
|
$
|
(33
|
)
|
|
$
|
(898
|
)
|
|
$
|
154
|
|
|
$
|
1,475
|
|
|
$
|
3,133
|
|
|
$
|
2,282
|
|
|
|
|
|
|
|
|
|
|
|
|
|
|
|
|
|
|
|
|
|
|
|
|
|
|
|
|
|
|
|
|
|
|
|
| |
|
|
|
|
|
|
|
|
|
|
|
|
|
|
|
|
|
|
|
|
|
|
|
|
|
|
|
|
|
|
|
|
|
|
|
Three Months Ended
|
|
|
|
|
April 3,
|
|
|
July 3,
|
|
|
October 2,
|
|
|
January 1,
|
|
|
April 2,
|
|
|
July 2,
|
|
|
October 1,
|
|
|
December 31,
|
|
|
|
|
2009
|
|
|
2009
|
|
|
2009
|
|
|
2010
|
|
|
2010
|
|
|
2010
|
|
|
2010
|
|
|
2010
|
|
|
|
|
(as a percentage of revenue)
|
|
|
|
|
Revenue
|
|
|
100
|
%
|
|
|
100
|
%
|
|
|
100
|
%
|
|
|
100
|
%
|
|
|
100
|
%
|
|
|
100
|
%
|
|
|
100
|
%
|
|
|
100
|
%
|
|
Cost of revenue
|
|
|
66
|
|
|
|
64
|
|
|
|
65
|
|
|
|
65
|
|
|
|
63
|
|
|
|
63
|
|
|
|
63
|
|
|
|
69
|
|
|
|
|
|
|
|
|
|
|
|
|
|
|
|
|
|
|
|
|
|
|
|
|
|
|
|
|
|
|
|
|
|
|
|
|
Gross profit
|
|
|
34
|
|
|
|
36
|
|
|
|
35
|
|
|
|
35
|
|
|
|
37
|
|
|
|
37
|
|
|
|
37
|
|
|
|
31
|
|
|
Research and development
|
|
|
23
|
|
|
|
17
|
|
|
|
15
|
|
|
|
18
|
|
|
|
15
|
|
|
|
14
|
|
|
|
12
|
|
|
|
16
|
|
|
Selling, general and administrative
|
|
|
27
|
|
|
|
23
|
|
|
|
20
|
|
|
|
21
|
|
|
|
21
|
|
|
|
18
|
|
|
|
15
|
|
|
|
17
|
|
|
|
|
|
|
|
|
|
|
|
|
|
|
|
|
|
|
|
|
|
|
|
|
|
|
|
|
|
|
|
|
|
|
|
|
Total operating expenses
|
|
|
50
|
|
|
|
40
|
|
|
|
35
|
|
|
|
39
|
|
|
|
36
|
|
|
|
32
|
|
|
|
27
|
|
|
|
32
|
|
|
|
|
|
|
|
|
|
|
|
|
|
|
|
|
|
|
|
|
|
|
|
|
|
|
|
|
|
|
|
|
|
|
|
|
Operating income (loss)
|
|
|
(16
|
)
|
|
|
(4
|
)
|
|
|
—
|
|
|
|
(4
|
)
|
|
|
1
|
|
|
|
5
|
|
|
|
10
|
|
|
|
(1
|
)
|
|
Interest income, net
|
|
|
—
|
|
|
|
—
|
|
|
|
—
|
|
|
|
—
|
|
|
|
—
|
|
|
|
—
|
|
|
|
—
|
|
|
|
—
|
|
|
|
|
|
|
|
|
|
|
|
|
|
|
|
|
|
|
|
|
|
|
|
|
|
|
|
|
|
|
|
|
|
|
|
|
Income (loss) before income taxes
|
|
|
(16
|
)
|
|
|
(4
|
)
|
|
|
—
|
|
|
|
(4
|
)
|
|
|
1
|
|
|
|
5
|
|
|
|
10
|
|
|
|
(1
|
)
|
|
Income taxes
|
|
|
—
|
|
|
|
—
|
|
|
|
—
|
|
|
|
—
|
|
|
|
—
|
|
|
|
—
|
|
|
|
—
|
|
|
|
(11
|
)
|
|
|
|
|
|
|
|
|
|
|
|
|
|
|
|
|
|
|
|
|
|
|
|
|
|
|
|
|
|
|
|
|
|
|
|
Net income (loss)
|
|
|
(16
|
)%
|
|
|
(4
|
)%
|
|
|
—
|
%
|
|
|
(4
|
)%
|
|
|
1
|
%
|
|
|
5
|
%
|
|
|
10
|
%
|
|
|
10
|
%
|
|
|
|
|
|
|
|
|
|
|
|
|
|
|
|
|
|
|
|
|
|
|
|
|
|
|
|
|
|
|
|
|
|
|
53
Revenue increased significantly in the second quarter of fiscal
2009 as the global recession and the financial and credit crisis
eased. Unit shipments of products used in computing and
networking applications both increased significantly over the
first quarter of fiscal 2009. Revenue in the second and third
quarters is also typically higher due to buying patterns for
certain computing and networking products. In addition, revenue
in the third and fourth quarters of fiscal 2009 was higher
because of buying patterns for certain computing and home
entertainment applications. Revenue increased significantly in
the three months ended July 2, 2010 and October 1,
2010, or the second and third quarters of fiscal 2010, due to
increased sales of products used in the home entertainment
device market, the launch of a new product used in the computing
market and increased sales of a new GPS part. Revenue declined
significantly in the three months ended December 31, 2010,
or the fourth quarter of fiscal 2010, due to a slowdown in
consumer demand particularly for computing solutions. Revenue
from products used primarily for computing and home
entertainment applications decreased by $5.6 million and
$3.7 million, respectively, as compared to the third
quarter of fiscal 2010.
Cost of revenue was higher as a percentage of revenue in the
first quarter of fiscal 2009 as fixed operating costs were
allocated across a lower revenue base. Gross profit as a
percentage of revenue varies from period to period based
primarily on changes in product mix and as cost efficiencies are
achieved on new products. Gross profit decreased significantly
in the three months ended December 31, 2010, or the fourth
quarter of fiscal 2010, due primarily to lower yields and higher
warranty charges for a high volume part introduced in the fourth
quarter, negative changes in product mix and fixed logistics
costs over a smaller revenue base.
During the past eight quarters, we have increased the number of
reference design partners that we collaborate with. This was one
factor behind an increase in research and development expense
(before reflecting funded research and development) in certain
quarters. Externally funded research and development for the
first, second, third and fourth quarters of fiscal 2009 and
during the first, second, third and fourth quarters of fiscal
2010 was $258,000, $271,000, $544,000, $495,000,
$1.1 million, $898,000, $796,000 and $1.2 million
respectively. The large funding increase in the first quarter of
fiscal 2010 reflected our receipt of a grant by the Government
of Ontario in March 2010 for up to CDN$7.0 million over a
five-year period. The funding increase in the fourth quarter of
fiscal 2010 reflected an increase in eligible spending related
to the March 2010 Government of Ontario grant. Research and
development expense, before reflecting funded research and
development, increased in the fourth quarter of fiscal 2009 and
second quarter of fiscal 2010, reflecting increased prototype
design and development costs for new products.
Selling, general and administrative costs vary each period due
to third party commissions paid by us under our incentive
agreement. Selling, general and administrative costs increased
17% during the second quarter of fiscal 2009 due primarily to
third party commissions. Third party commissions continued to
decrease over the fourth quarter of fiscal 2009 and first
quarter of fiscal 2010 due to changes in our product mix and
lower unit sales of the products covered under our incentive
agreement. Selling, general and administrative costs increased
17% during the second quarter of fiscal 2010 due primarily to
increased commissions on the significant revenue increase,
higher compensation due to recent new hires and increased travel
costs due to an annual sales conference held in May 2010.
Selling, general and administrative costs decreased 21% during
the fourth quarter of fiscal 2010 due primarily to lower
commissions due to the revenue decline.
During the fourth quarter of fiscal 2010, we determined that we
were more likely than not to realize a tax benefit of
$2.5 million in one tax jurisdiction. This decision was
based in part on a recent trend of profitability in this
jurisdiction and on our prospects and business outlook.
Significant judgment is required to determine the timing and
extent of a valuation allowance release and an ability to
utilize deferred tax assets will depend on the ability to
generate sufficient taxable income in future periods.
54
Liquidity and
Capital Resources
Since inception, we have financed our operations primarily
through private sales of shares of our preferred stock. We have
raised gross proceeds from the sale of preferred stock of
$130.7 million since inception. Our principal source of
liquidity as of December 31, 2010 consisted of
$10.4 million of cash and cash equivalents. We believe we
have sufficient cash resources, before receiving the net
proceeds from our sale of shares in this offering, to continue
in operation for at least the next twelve months.
The primary uses for our cash are to fund operating expenses, to
finance growth in accounts receivable, to purchase inventory,
and to purchase property and equipment. Cash used to fund
operating expenses excludes the impact of non-cash items, such
as depreciation and stock based compensation, and is affected by
the required timing for our payment of certain operating
expenses, as reflected by changes in our outstanding accounts
payable and accrued liabilities.
Our primary source of cash is cash receipts on accounts
receivable from the sale of our products. Our last sale of
preferred stock closed in May 2007, and we raised
$20.0 million in gross proceeds from that sale. In March
2010, we also received CDN$1.4 million from the Government
of Ontario related to a conditional grant. This grant is
intended to cover eligible research and development costs over
the next five years and we expect to receive a total of
approximately CDN$7.0 million from this grant over the
five-year period, including the CDN$1.4 million received in
March 2010.
Below is a summary of our cash flows provided by (used in)
operating activities, investing activities and financing
activities for the periods indicated:
| |
|
|
|
|
|
|
|
|
|
|
|
|
|
|
|
Fiscal 2008
|
|
|
Fiscal 2009
|
|
|
Fiscal 2010
|
|
|
|
|
(in thousands)
|
|
|
|
|
Cash provided by (used in) operating activities
|
|
$
|
(4,714
|
)
|
|
$
|
(3,523
|
)
|
|
$
|
3,993
|
|
|
Cash used in investing activities
|
|
|
(2,291
|
)
|
|
|
(1,243
|
)
|
|
|
(1,942
|
)
|
|
Cash provided by (used in) financing activities
|
|
|
23
|
|
|
|
41
|
|
|
|
(2,697
|
)
|
|
Effect of exchange rates on cash and cash equivalents
|
|
|
55
|
|
|
|
84
|
|
|
|
36
|
|
|
|
|
|
|
|
|
|
|
|
|
|
|
|
|
Net increase (decrease) in cash and cash equivalents
|
|
$
|
(6,927
|
)
|
|
$
|
(4,641
|
)
|
|
$
|
(610
|
)
|
|
|
|
|
|
|
|
|
|
|
|
|
|
|
Cash Flows for
Fiscal 2009 and Fiscal 2010
Cash used in operating activities of $3.5 million in fiscal
2009 reflected the net loss of $4.4 million, offset in part
by non-cash depreciation and stock based compensation. Decreases
in inventory were offset by an increase in accounts receivable
and decreases in accounts payable and accrued liabilities. The
increase in cash provided by operating activities in fiscal 2010
compared to the corresponding period in fiscal 2009 primarily
reflects net income of $7.0 million during the period as
compared to a net loss of $4.4 million during fiscal 2009.
Significant changes in operating assets and liabilities during
fiscal 2010 included a $6.1 million increase in inventory
offset in part by a $2.1 million increase in accounts
payable. Accounts payable increased in support of our increased
production volumes and inventory increased as a result of an
increase in demand.
Cash used in investing activities increased by $699,000 during
fiscal 2010 as compared to fiscal 2009 due primarily to the
purchase of laboratory equipment.
Cash used in financing activities in fiscal 2010 reflected legal
and other costs of $2.1 million related to our planned
initial public offering of stock and the purchase of
600,000 shares of common stock for $600,000.
Cash Flows For
Fiscal 2008 and 2009
Cash used in operating activities for fiscal 2008 and 2009 was
$4.7 million and $3.5 million, respectively. Cash used
in operating activities for fiscal 2008 and 2009 primarily
reflected net losses of $3.8 million and $4.4 million,
respectively. These net losses were offset in part by non-cash
charges for depreciation and stock based compensation of
$2.0 million in fiscal 2008 and $2.2 million in fiscal
55
2009. During fiscal 2008, we used $2.8 million to fund
changes in operating assets and liabilities, primarily related
to a $6.0 million increase in inventory along with a
$0.8 million increase in accounts receivable, offset in
part by a $4.6 million increase in accounts payable.
Inventory increased due to the sharp fall in revenue associated
with the global recession, which affected us most significantly
during the six month period from October 2008 through March
2009. During this period, customers attempted to delay shipments
for orders previously booked and some orders were cancelled,
resulting in an inventory increase at the end of fiscal 2008.
Accounts receivable increased as customers delayed payment at
year end in response to the downturn, and we increased accounts
payable to conserve cash. During fiscal 2009, we used
$1.3 million to fund changes in operating assets and
liabilities, primarily due to a $3.6 million decrease in
inventory, offset by an aggregate $4.6 million decrease in
accounts payable and accrued liabilities. The decrease in
inventory was a result of sales and production being more
closely matched in 2009. The decrease in accounts payable and
accrued liabilities was due to lower inventory and production
purchasing in 2009.
Cash used in investing activities during fiscal years 2008 and
2009 was $2.3 million and $1.2 million, respectively.
The increase in cash used in investing activities during fiscal
2008 primarily related to the purchase and implementation of a
corporate financial and inventory management software package,
along with the purchase of automated test equipment.
Cash provided by financing activities was less than $50,000 in
both fiscal 2008 and 2009.
Contractual
Obligations, Commitments and Contingencies
The following table summarizes our outstanding contractual
obligations as of December 31, 2010:
| |
|
|
|
|
|
|
|
|
|
|
|
|
|
|
|
|
|
|
|
|
|
|
|
Payments Due by Period
|
|
|
|
|
|
|
|
Less
|
|
|
|
|
|
|
|
|
More
|
|
|
|
|
|
|
|
Than 1
|
|
|
1-3
|
|
|
3-5
|
|
|
Than 5
|
|
|
|
|
Total
|
|
|
Year
|
|
|
Years
|
|
|
Years
|
|
|
Years
|
|
|
|
|
Operating lease obligations
|
|
|
2,850
|
|
|
|
1,552
|
|
|
|
1,298
|
|
|
|
—
|
|
|
|
—
|
|
|
Purchase obligations
|
|
|
19,994
|
|
|
|
19,994
|
|
|
|
—
|
|
|
|
—
|
|
|
|
—
|
|
|
|
|
|
|
|
|
|
|
|
|
|
|
|
|
|
|
|
|
|
|
|
|
Total contractual obligations
|
|
$
|
22,844
|
|
|
$
|
21,546
|
|
|
$
|
1,298
|
|
|
$
|
—
|
|
|
$
|
—
|
|
|
|
|
|
|
|
|
|
|
|
|
|
|
|
|
|
|
|
|
|
|
|
Our cash flows from operations are dependent upon a number of
factors, including fluctuations in our operating results, timing
of accounts receivable collections, inventory management, and
the timing of payments for accounts payable and accrued
liabilities. As a result, the impact of contractual obligations
on our liquidity and capital resources in future periods should
be analyzed in conjunction with such factors.
We have entered into operating lease agreements for office space
and have commitments for computer aided design tools that expire
between 2011 and 2013. Our obligations under these agreements
are $1.6 million in fiscal 2011, $703,000 in fiscal 2012
and $595,000 in fiscal 2013.
Our Ottawa lease that ends in 2016 provides for optional
termination anytime after March 2011 upon payment of a penalty
computed as three months rent plus the unamortized portion of
the lease inducement. In the above table we assume early
termination of the lease and show $186,000 as a contractual
obligation representing the early termination penalty.
In January 2011, we renewed our Andover lease which is expiring
in April 2011. The renewed lease ends in June 2016. Future
minimum annual payments under this operating lease for the years
2011, 2012, 2013, 2014 and 2015 and thereafter are approximately
$0, $167,000, $211,000, $217,000 and $335,000 respectively.
We had firm purchase order commitments primarily for the
acquisition of inventory as of December 31, 2010 of
$20.0 million.
In March 2010, we signed an agreement with the Government of
Ontario which provides for a conditional grant of up to
CDN$7.0 million over a period of five years under the
government’s Next Generation of Jobs Fund. The grant is
intended to fund 15% of eligible costs (primarily research
and development, labor, material and overhead) over the next
five years. If we fail to meet certain hiring
56
and spending criteria over the next five years, a pro rata
amount of monies received may become repayable at the end of
five years.
Indebtedness
On August 27, 2010, we amended our $7.5 million credit
facility with the Royal Bank of Canada. As of December 31,
2010, no borrowings were outstanding under the credit facility.
The credit facility is among the Royal Bank of Canada, as
lender, SiGe Canada, as borrower, and our company, as guarantor.
The amended credit facility of $12.0 million consists of a
$10.0 million demand facility and a $2.0 million term
loan facility. The demand facility is available at the
lender’s U.S. prime rate plus 0.50% and is subject to
a borrowing limit of up to specified percentages of certain
accounts receivable balances. The $2.0 million term loan
facility is repayable over a maximum of three years at either a
variable interest rate of the lender’s Canadian prime rate
plus 2.10% or a fixed interest rate determined on the borrowing
date. The $12 million credit facility is secured by a
general security agreement covering all of our personal property
and is subject to a debt to EBITDA requirement of no greater
than 3.0 to 1, calculated on a rolling four quarters basis.
Off-Balance Sheet
Arrangements
We did not have at December 31, 2010, and we do not
currently have, any off-balance sheet arrangements, as defined
under Securities and Exchange Commission rules, except for our
operating leases described above.
Recent Accounting
Pronouncements
Effective for fiscal 2009, we adopted the Financial Accounting
Standards Board’s revised authoritative guidance for
business combinations. This revised guidance requires an
acquiring company to measure all assets acquired and liabilities
assumed, including contingent considerations and all contractual
contingencies, at fair value as of the acquisition date. For
pre-acquisition contingencies in a business combination an
acquirer is required to recognize at fair value an asset
acquired or liability assumed in a business combination that
arises from a contingency if the acquisition-date fair value of
the asset or liability can be determined during the measurement
period. If the acquisition-date fair value cannot be determined,
the acquirer will apply the authoritative guidance used to
evaluate contingencies to determine whether the contingency
should be recognized as of the acquisition date or after the
acquisition date. In addition, an acquiring company is required
to capitalize in-process research and development and either
amortize it over the life of the product, or write it off if the
project is abandoned or impaired. Previously, post-acquisition
adjustments related to business combination deferred tax asset
valuation allowances and liabilities for uncertain tax positions
were generally required to be recorded as an increase or
decrease to goodwill. The revised guidance does not permit this
accounting and, generally, requires any such changes to be
recorded in current period income tax expense. Thus, all changes
to valuation allowances and liabilities for uncertain tax
positions established in acquisition accounting, regardless of
the guidance used to initially account for the business
combination, will be recognized in current period income tax
expense. The adoption of the revised guidance did not have an
impact on our consolidated financial statements, but the nature
and magnitude of the specific effects will depend upon the
nature, terms and size of the acquisitions consummated after the
effective date of January 3, 2009.
During fiscal 2009 we adopted Financial Accounting Standards
Board’s revised authoritative guidance for fair value
measurements, which clarifies the measurement of fair value in a
market that is not active, and is effective as of the issue
date, including application to prior periods for which financial
statements have not been issued. We also adopted additional
authoritative guidance for determining whether a market is
active or inactive, and whether a transaction is distressed, is
applicable to all assets and liabilities (financial and
nonfinancial) and which requires enhanced disclosures. The
adoption of this guidance did not have a material impact on our
consolidated financial position, results of operations or cash
flows.
57
Effective January 2, 2010, we adopted the provisions of the
FASB’s updated guidance related to fair value measurements
and disclosures, which require new disclosures about significant
transfers in and out of Levels 1 and 2 fair value
measurements and separate disclosures about purchases, sales,
issuances and settlements relating to Level 3 fair value
measurements. The updated guidance also clarifies existing
disclosure requirements regarding inputs and valuation
techniques, as well as the level of disaggregation for each
class of assets and liabilities for which separate fair value
measurements should be disclosed. The guidance was effective
January 1, 2010, except for the separate disclosures about
purchases, sales, issuances and settlements relating to
Level 3 measurements, which are effective for us beginning
in the first quarter of fiscal year 2011. Our adoption of the
updated guidance did not have an impact on our consolidated
financial statements and the deferred provisions are not
expected to significantly impact our consolidated financial
statements.
In October 2009, the FASB issued new standards for revenue
recognition with multiple deliverables. These new standards
impact the determination of when the individual deliverables
included in a multiple-element arrangement should be treated as
separate units of accounting. Additionally, these new standards
modify the manner in which the transaction consideration is
allocated across the separately identified deliverables by no
longer permitting the residual method of allocating arrangement
consideration. These new standards are effective for us
beginning in the first quarter of fiscal year 2011, however
early adoption is permitted. We do not expect these new
standards to significantly impact our consolidated financial
statements.
Quantitative and
Qualitative Disclosures about Market Risk
The following discussion should be read in conjunction with our
audited consolidated financial statements included elsewhere in
this prospectus.
Interest Rate
Sensitivity
We had $10.4 million of cash and cash equivalents at
December 31, 2010, which was held for general corporate
purposes. We do not enter into investments for trading or
speculative purposes. Due to the short-term nature of the
investments we hold, we do not believe we have any material
exposure to changes in the fair value of our investments as a
result of changes in interest rates. Declines in interest rates
however, will reduce future interest income.
Foreign
Currency Exchange Risk
Our results of operations and cash flows are subject to
fluctuations in foreign currency exchange rates, particularly
changes in the Canadian dollar, due to our compensation expenses
payable in local currencies. Although substantially all of our
fiscal 2010 revenue was generated from sales to customers in
countries outside of the United States, all of the contracts we
have entered into with our customers are based on the
U.S. dollar. To date, we have not entered into any foreign
currency hedging contracts, since exchange rate fluctuations
have had little impact on our operating results and cash flows.
Inflation
Risk
Our monetary assets, consisting of cash and cash equivalents and
accounts receivable, are not affected significantly by inflation
because they are short-term. We believe the impact of inflation
on replacement costs of our equipment, furniture and leasehold
improvements will not materially affect our operations. The rate
of inflation affects our cost of revenue and expenses, however,
such as those for employee compensation.
58
BUSINESS
Overview
We are a leading provider of highly integrated RF semiconductor
front end solutions that enable wireless connectivity across a
wide range of applications. Our innovative solutions integrate
multiple RF functions into a single semiconductor device to
deliver an optimal combination of performance, size, power
output and efficiency. Our predominant use of standard silicon
based processes and fabless manufacturing model enables us to
achieve high levels of functional integration, leverage the
economies of scale of high volume manufacturing technology,
maintain low costs and accelerate our
time-to-market.
We have shipped more than 700 million front end solutions
since our inception, primarily consisting of Wi-Fi front end
modules and power amplifiers.
Wireless connectivity continues to evolve from delivering basic
voice and data services to enabling rich multimedia experiences
through always-connected devices. The expansion of broadband
multimedia content, including Voice over Internet Protocol,
streaming video, online gaming and social networking, as well as
the proliferation of smart energy technologies, are driving
increasing demand for wireless connectivity. Based on estimates
published by IDC, total unit shipments of Wi-Fi and GPS
semiconductors are expected to increase from 609 million in
2010 to 962 million in 2013, representing a compound annual
growth rate of 17%.
Our solutions are incorporated into a broad range of products,
including desktop and laptop computers and peripherals, consumer
and enterprise networking equipment and home entertainment
devices. We have recently entered the smartphone and mobile
Internet device markets and recently began shipping Wi-Fi front
end modules to one of the world’s leading mobile handset
manufacturers. Though our revenues to date from this
manufacturer have not been material, we aim to steadily increase
these revenues and expand our sales of Wi-Fi front end modules
in the smartphone and mobile Internet device markets. In
addition, we recently introduced our first solutions for
cellular infrastructure and smart energy applications.
We work with leading reference design partners such as Atheros,
Broadcom, Cambridge Silicon Radio, Marvell, and Ralink to
qualify and market our products. According to publicly available
information, our products have been incorporated into devices
branded by leading OEMs, including Apple, Cisco,
Hewlett-Packard, Lenovo, NetGear, Nintendo, Panasonic, Samsung,
and Thomson. We primarily sell our solutions to ODMs, including
Hon Hai and Universal Scientific Industrial, to distributors
such as Promaster and RichPower, and, to a lesser extent,
directly to OEMs. Substantially all of our sales are made on a
purchase order basis, not under long-term supply contracts and
we depend on a small number of customers for a substantial
portion of our revenue.
We believe we are well positioned for growth as:
|
|
|
| |
•
|
the proliferation of wireless connectivity solutions into fixed
and mobile devices continues;
|
|
|
|
| |
•
|
the percentage of devices that are Wi-Fi, GPS and Bluetooth
enabled increases;
|
|
|
|
| |
•
|
high bandwidth, multi-stream communications drive the demand for
additional RF semiconductor solutions in these devices;
|
|
|
|
| |
•
|
the number of wirelessly connected smart energy devices
increases; and
|
|
|
|
| |
•
|
the number of 3G and 4G cellular radio access points increases
to support growing wireless broadband usage.
|
We outsource all of our manufacturing operations to leading
semiconductor foundries and assembly and test contractors. Our
fabless manufacturing model enhances our ability to rapidly
scale production volumes, is highly capital efficient and
affords us the flexibility to select the optimal technologies
for each product. We have historically used a combination of
silicon and non-silicon based process technologies to meet the
needs of our customers, and we believe our predominant use
59
of silicon based technologies positions us to effectively meet
the integration and performance demands of an array of high
volume RF applications.
We commenced operations in Canada in 1996. We initially
conducted operations through SiGe Microsystems Inc., a Canadian
company, which was renamed SiGe Semiconductor Inc. in 2001. We
also refer to SiGe Semiconductor Inc. as SiGe Canada. In 2002,
the stockholders of SiGe Canada voted to effect a corporate
reorganization under which SiGe Semiconductor, Inc., the issuer
of shares in this offering, was incorporated in Delaware to
become the parent company of SiGe Canada. In connection with
this corporate reorganization, holders of outstanding shares of
SiGe Canada received exchangeable shares of SiGe Canada that are
exchangeable for shares of SiGe Semiconductor, Inc., and both
SiGe Semiconductor, Inc. and SiGe Canada issued preferred stock
in an equity financing transaction. The consummation of the
corporate reorganization was a condition to the investment by
the investors in the equity financing.
As of the date of this prospectus, we have four direct
wholly-owned subsidiaries as set forth under “Prospectus
Summary — Corporate Organization.” SiGe Canada is
our operating company located in Canada, which engages primarily
in engineering, quality, manufacturing logistics, finance,
legal, information systems, purchasing and customer invoicing
activities. SiGe Semiconductor (U.S.), Corp. is our operating
company located in the United States, which engages primarily in
engineering, marketing and administrative activities. SiGe
Semiconductor (Europe) Limited is our operating company located
in the United Kingdom, which engages primarily in engineering
activities. SiGe Semiconductor (Hong Kong) Limited is our
operating company located in Hong Kong, which engages primarily
in engineering, customer engineering support, manufacturing
logistics and sales activities. We are headquartered in Andover,
Massachusetts, with offices in Canada, Hong Kong, England and
California.
We have grown our revenue by more than 40% annually in six of
the last eight fiscal years. For the fiscal year ended
December 31, 2010, we generated revenue of
$103.3 million and a net income of $7.0 million. We
had an accumulated deficit of $108.0 million as of
December 31, 2010. Our product mix has changed over time in
response to greater demand for more integrated solutions and a
relative decrease in demand for discrete components. Our revenue
from the sale of integrated front end solutions grew from less
than 20% of revenue in fiscal 2004 to more than 75% of revenue
in fiscal 2010.
Industry
Overview
Wireless
Connectivity
Wireless connectivity continues to evolve from delivering basic
voice and data services to enabling rich multimedia experiences
through always-connected devices. In addition, consumer demand
for fixed and mobile wirelessly connected devices, such as
smartphones, laptop computers, netbooks, gaming consoles,
portable media players and personal navigation devices continues
to increase rapidly. Many consumers now demand always-connected
wireless broadband access to support Internet access, Voice over
Internet Protocol, streaming video, on-line gaming, social
networking and other applications in their workplaces, at home,
and increasingly while on the go. A variety of wireless
communications protocols have been developed to connect devices,
including Wi-Fi (Institute for Electrical and Electronics
Engineers, which we refer to as IEEE, Standard 802.11), GPS,
Bluetooth (IEEE Standard 802.15.1), ZigBee (an implementation of
IEEE Standard 802.15.4) and cellular standards including WiMAX
(Worldwide Interoperability for Microwave Access, or IEEE
Standard 802.16).
Wi-Fi has become the standard protocol for residential and
office wireless networking. Wi-Fi capability is included in
almost all laptops today, and residential broadband service
providers increasingly include Wi-Fi in their home routers to
enable wireless home networking and reduce in-home cabling
requirements. The most recent version of the Wi-Fi standard,
IEEE 802.11n, includes higher data transfer rates, enabling the
transmission of higher definition streaming video for home
60
entertainment and other high-bandwidth applications. Wi-Fi is
increasingly being offered in public spaces such as coffee
shops, retail locations, airports, schools, libraries, airplanes
and trains. In addition, some metropolitan areas and corporate
campuses are deploying outdoor Wi-Fi networking to deliver
wireless broadband access throughout their geographies. Cellular
devices are increasingly incorporating Wi-Fi to enable Internet
access. Many cellular service providers are actively expanding
the use of Wi-Fi networks in addition to their cellular networks
to help manage increases in data traffic and to address gaps in
network coverage. IDC has projected that by 2013 there will be
six times as many non-PC devices connected to Wi-Fi networks as
personal computers.
Other wireless protocols, including 3G and 4G cellular, GPS,
Bluetooth and certain protocols for smart energy networking are
being used for applications such as voice and data services,
location-based services, wireless peripherals and smart energy
devices. 3G wireless broadband networks, including W-CDMA and
HSPA+, have been deployed broadly to support the initial
generation of wireless broadband communications. 4G wireless
broadband networks, including LTE, are currently being deployed,
with the first commercially-available networks arriving in late
2010, to support the next generation of higher performance
wireless broadband communications. The market for GPS receivers
has developed to support personal and automotive navigation
devices. More recently, GPS functionality is being incorporated
into other mobile devices, such as handsets and laptops, to
enable additional location-based services. Bluetooth has become
the predominant personal-area networking technology, used in a
wide range of devices including wireless headsets, keyboards and
other peripherals for personal computers. Bluetooth is also
becoming a key part of the expansion of wireless connectivity
into the automotive market. ZigBee is an emerging standard for
low power wireless mesh networking, enabling communications
between smart meters and smart energy-enabled devices for home
and building automation such as heating, lighting, power
management, security and audio/video services. Although the
market for smart energy enabled devices is still developing,
ZigBee has been selected by several leading smart meter, home
automation control system and smart appliance manufacturers. In
addition to ZigBee, there are additional smart energy wireless
networking standards operating at 900 MHZ and 2.4 GHZ.
The market for wireless connectivity can be defined to include
Wi-Fi and GPS semiconductors and, based on estimates published
by IDC, total unit shipments of these semiconductors are
expected to increase from 609 million in 2010 to
962 million in 2013, representing a compound annual growth
rate of 17%. We believe embedded wireless connectivity in mobile
handsets represents one of the fastest growing markets today.
Based on the most recent data published by IDC, the percentage
of mobile phones with Wi-Fi capabilities is expected to grow
from 10% in 2009 to 23% in 2014. For the same period, IDC
forecasts that the percentage of mobile phones with GPS is
expected to grow from 25% to 44% and with Bluetooth from 59% to
82%.
In addition, we believe wireless connectivity solutions enabling
smart energy applications are poised for significant growth.
According to 2010 projections by L.E.K. Consulting, between
400 million and 500 million smart meters will be sold
worldwide between 2010 and 2019. We believe smart meters
represent only a fraction of the total potential smart energy
market, as multiple devices in each home, including heating and
cooling systems and other appliances, will eventually connect to
smart meters as part of a larger home automation network.
61
RF
Semiconductors
RF semiconductors are fundamental to enabling wireless
connectivity and serve two basic functions: converting RF
signals into analog signals suitable for conversion to digital
signals, and converting analog signals into RF waves suitable
for transmission through the air. Key components of a wireless
semiconductor chipset include a baseband processor, a
transceiver or receiver and an RF front end, which incorporates
one or more power amplifiers, low noise amplifiers, filters,
diplexers, RF switches, power regulators, and control
interfaces. Power amplifiers boost the transmitter output to
enable connection with the network. Low noise amplifiers amplify
the weak signals captured by the antenna for processing by the
receiver. Filters remove noise along the transmit and receive
path. Diplexers are passive devices that combine or separate
multiple RF signals in different frequency bands, facilitating
the sharing of a single transmission path. RF switches connect
the amplifiers to the antenna and allow a wireless device to
share a single antenna between transmit and receive functions
and between amplifiers operating on different frequencies or
protocols. Power regulators maintain a constant load voltage
over a range of input voltage and load current variations.
Control interfaces permit the baseband processor to set the
desired RF output power and operating frequency band. Together,
the functions of the components that make up the RF front end
are critical in ensuring the quality of wireless communications.
The business of RF solution providers is subject to various
regulations. For example, wireless networks can only operate in
the frequency bands, or spectrum, allowed by regulators. In
addition, RF solution providers are subject to restrictions on
lead and certain other substances in electronics that apply to
specified electronics products sold in the European Union under
the Restriction of Hazardous Substances in Electrical and
Electronic Equipment Directive. Compliance with these
regulations, as well as other regulations, can be costly and
time consuming.
Illustrative
Wireless Semiconductor Chipset Block Diagram:
The challenges faced by RF solution providers to deliver
satisfactory quality of service have increased with the
proliferation of streaming video and other multimedia
applications that require high bandwidth, real-time delivery. RF
semiconductors must enable multiple inputs, outputs and
frequency
62
bands while minimizing the interference between components, all
of which increase the complexity of RF integration. A high-end
smartphone, for example, can have multiple RF front ends to
support dual-band cellular, Wi-Fi, Global Positioning System,
and Bluetooth functionality. These requirements for greater RF
functionality have led to an increase in RF semiconductor
content in wireless devices. As RF semiconductor content
continues to increase, we believe there are significant
opportunities for further advancements in RF integration, while
also improving performance, range, power efficiency and
interoperability.
Suppliers of RF front end semiconductor devices and RF power
amplifiers face numerous challenges, including:
|
|
|
| |
•
|
Eliminating the Need for Specialty Process
Technologies. RF front ends and power amplifiers
must satisfy exacting standards for speed, signal integrity,
power consumption and heat dissipation. Historically, these
requirements were met using specialty semiconductor materials
such as GaAs and indium phosphide. These manufacturing processes
require specialized design tools, proprietary process
technologies and expensive materials, which limit RF integration
and the ability to use high volume commercial foundries.
However, silicon based technologies are used to manufacture the
overwhelming majority of semiconductors today. Based on the most
recent data published by Gartner, a leading independent market
research firm, GaAs represents approximately 1% of worldwide
fabrication capacity, compared to more than 90% for silicon, as
measured in current 200mm equivalent wafer start capacity per
month.1
Although silicon based solutions utilize design tools and
methodologies common across the semiconductor industry, the
industry’s relative inexperience with these processes has
limited the advancement of silicon in RF front ends and power
amplifiers.
|
|
|
|
| |
•
|
Overcoming Reliance on the Integrated Design and
Manufacturing Model. RF semiconductor suppliers
have traditionally followed an integrated design and
manufacturing model involving ownership of their own fabrication
facilities. While many in the semiconductor industry have
realized the benefits of outsourcing manufacturing processes,
the complexities of RF semiconductor devices and reliance on
specialty process technologies have limited outsourcing for RF
front end solutions and power amplifiers. The financial
commitment required to build and maintain a fab and to continue
investing in proprietary process technologies reduces the
capital available to invest in developing new products and
limits flexibility to utilize advances in mainstream process
technologies and to respond to changing customer demands.
|
| |
| |
•
|
Optimizing for Performance, Size and
Cost. Demand for higher data rates and extended
range results in a need for increased power amplification and
functionality in the RF front end, which can often result in
designs with larger size, increased power consumption,
inadequate heat dissipation and higher cost. Because improving
one specification can negatively impact another, an ideal RF
solution will provide the right balance to meet all customer
requirements.
|
| |
| |
•
|
Enabling Ease of Use and Minimizing
Time-to-Market
for Customers. Due to the complexity and unique
skills required to deliver quality RF solutions, many OEMs and
ODMs rely on the technical expertise of RF semiconductor
providers to help in the design, testing and quality assurance
of the RF subsystem. Additionally, customers in consumer-driven
end markets have short product cycles and the ability to bring
products to market quickly can be a critical competitive
differentiator. Customers seek RF semiconductor suppliers who
can provide fully integrated products as part of reference
design solutions and high quality technical support for their
solutions to maximize ease of use and minimize
time-to-market.
|
1 Gartner,
Inc. Fab Database: Worldwide, 4Q10 Update, by David Christensen,
Bob Johnson, Masatsune Yamaji, Maria Valenzuela and Barbara Van,
December 10, 2010.
63
|
|
|
| |
•
|
Ensuring Quality of Service. The delivery of a
satisfactory user experience for today’s data, video, and
multimedia applications requires high quality, high bandwidth
transmission of wireless signals. The higher bandwidth
requirements for these applications increase the risk of data
communication errors and even small errors are readily apparent
to end users. Factors that commonly impede the quality of these
signals include noise, distortion, and interference, and once a
signal has been degraded, there is little that a receiver can do
to recover the damaged data. Given that consumer loyalty is
increasingly dependent on the reliability of service, it is
critically important that RF semiconductor providers design
solutions that consistently maintain the integrity and quality
of wireless signals.
|
Our
Solution
We are a leading provider of highly integrated RF semiconductor
front end solutions that enable wireless connectivity across a
wide range of applications. We have a comprehensive
understanding of how to use silicon based semiconductor
technologies for RF front end solutions. We believe that in the
market for Wi-Fi, GPS, Bluetooth and smart energy wireless
networking, RF front ends, and in the market for certain 3G and
4G cellular RF components, many of our silicon based solutions
achieve equal or better performance than products manufactured
with specialty materials, such as GaAs, while simultaneously
exceeding the functional integration limits, heat dissipation
properties and production yields typical of solutions based on
these specialty materials. While solutions based on specialty
materials generally outperform silicon based solutions in
certain wireless markets, we believe our solutions are optimized
for performance, size, power output and efficiency in the
markets we target.
Strengths of
our solution include:
|
|
|
| |
•
|
Ability to Deliver High Performance RF Front End
Solutions. Our solutions deliver the high levels
of performance required for today’s computing, networking
and mobile applications. Our product development expertise is
based on deep RF design capabilities and understanding of the
manufacturing process technologies required to produce
high-performance RF front end semiconductors. We believe our
ability to incorporate multiple communications channels and
protocols into a single semiconductor device, such as concurrent
Wi-Fi and Bluetooth support or multi-in multi-out streaming and
dual-band 2.4 GHz / 5 GHz operation for IEEE 802.11n,
enables us to deliver
plug-and-play
solutions that increase overall system performance.
|
|
|
|
| |
•
|
Highly Integrated, Silicon Based RF Front End
Solutions. Our use of silicon based materials has
enabled us to develop single device, integrated RF front end
solutions that include RF power amplifiers, RF switches, low
noise amplifiers, filters, control interfaces, power regulators,
diplexers and related passive circuitry. In response to market
demand for more integrated solutions, we have incorporated these
key functions into several semiconductor devices, or in some
cases, a single semiconductor device, reducing the physical
footprint, power consumption and cost of our RF front end
solutions. Our revenue from the sale of integrated front end
solutions has grown significantly, from less than 20% of revenue
in fiscal 2004 to more than 65% of revenue in fiscal 2010.
|
64
The following diagram illustrates how our Wi-Fi front end
modules for personal computers have evolved from 2005 to 2010.
Each successive module has increased functionality, better
performance, similar or smaller size, and lower cost than its
predecessor.
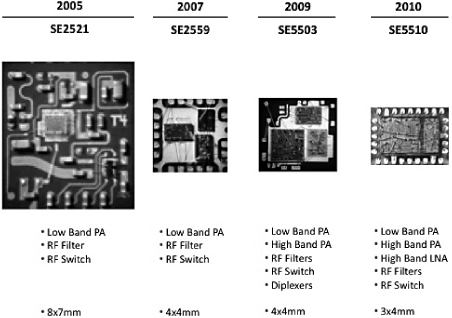
|
|
|
| |
•
|
Improved
Ease-of-Use
and Support for our Customers. We believe our
ability to integrate various RF front end functions into a
single semiconductor device enables us to provide
plug-and-play
solutions that are easier for our customers to integrate into
their end products, reducing
time-to-market.
We work with many leading wireless reference design partners,
OEMs and ODMs to develop RF solutions that further simplify the
adoption of our products by end customers. In addition, we
leverage our packaging expertise and work with assembly and test
contractors to implement our solutions in small
industry-standard packaging. We also provide local application
technical support to ensure our RF front end solutions meet the
specifications of our end customers.
|
|
|
|
| |
•
|
Advanced RF Engineering Capabilities Utilizing Silicon Based
Processes. Over our 15 year operating
history, we have developed extensive expertise in a range of
silicon and non-silicon semiconductor materials and processes,
which we believe differentiates us from our competitors by
enabling us to select the best process technologies for each
product. With our advanced RF design capabilities and our
innovative use of silicon based processes, we believe we are
able to match or exceed the performance levels of solutions
manufactured with specialty non-silicon materials, such as GaAs,
while simultaneously exceeding the functional integration
limits, heat dissipation properties and production yields of
GaAs-based solutions. We believe our predominant use of silicon
technologies, which have more mature design and simulation
tools, enables us to better test our designs prior to
fabrication, shorten the time from development to production,
and improve production yields. We have a significant number of
issued U.S. and foreign patents and patent applications
encompassing many of the product features and circuit designs we
have developed.
|
65
Other
competitive strengths include:
|
|
|
| |
•
|
Market Leadership in High Volume Markets. We
have shipped over 700 million units since our inception and
have been recognized as the global market leader in Wi-Fi front
end modules and power amplifiers. In addition, we believe we
hold significant market share in high volume markets such as
desktop and laptop computers, consumer and enterprise networking
equipment, home entertainment devices and printers.
|
|
|
|
| |
•
|
Highly Efficient and Scalable Fabless Business
Model. We benefit from a fully outsourced
manufacturing model using third party semiconductor foundries
and assembly and test contractors. We use leading foundries with
expertise in various silicon and GaAs process technologies. By
using a fabless production model, we incur lower capital
expenditures, require fewer personnel and avoid operating costs
stemming from idle capacity while maintaining greater
flexibility to obtain additional production capacity during
periods of increased demand. We work with our foundry partner
IBM Microelectronics to apply the latest advances in silicon
process technologies, initially developed to support
microprocessor manufacturing, to the manufacture of our RF front
end solutions.
|
| |
| |
•
|
Established Base of Leading OEM and ODM Customers and
Reference Design Partners. We have a long history
of supplying our RF front end solutions to some of the
world’s leading electronics companies. Through years of
collaborative product development and technical support, we have
established strong relationships with multiple leading global
reference design partners, OEMs and ODMs that integrate our RF
front end solutions into their reference designs and products.
These close relationships have enabled us to obtain visibility
into our partners’ and our customers’ future feature
and functionality requirements and to develop substantial
system-level knowledge to optimize our products and accelerate
our
time-to-market.
|
Our Growth
Strategies
We intend to maintain and extend our position as a leading
provider of highly integrated RF semiconductor front end
solutions that enable wireless connectivity across a wide range
of applications by pursuing the following growth strategies:
|
|
|
| |
•
|
Pursue Opportunities in Rapidly-Growing, High Volume
Markets. We intend to maintain our leadership in
existing markets while also pursuing opportunities in new
rapidly-growing, high volume markets. For example, we have
recently entered the smartphone and mobile Internet device
markets, and began shipping Wi-Fi front end modules to one of
the world’s leading mobile handset manufacturers. Though
our revenues to date from this manufacturer have not been
material, we aim to steadily increase these revenues and expand
our sales of Wi-Fi front end modules in the smartphone and
mobile Internet device markets. We are also building on our
expertise in RF front end solutions to expand into cellular
infrastructure and smart energy applications. Our strategy to
continue this expansion includes targeting markets that require
large manufacturing volumes, high performance and quality
specifications, and functional integration for wireless
connectivity. We believe our product expertise, engineering
talent, intellectual property portfolio and ability to innovate
will enable us to continue developing high value solutions for
wireless applications.
|
|
|
|
| |
•
|
Expand Product Portfolio to Capture Additional RF
Semiconductor Content. We plan to expand our
range of silicon based RF front end solutions through continued
integration of RF functionality to capture additional RF
semiconductor content in wirelessly connected devices. To
achieve this, we are strategically focused on the integration of
the entire front end solution into a single integrated circuit
for a variety of applications. In addition, we intend to
continue to build our engineering capabilities in silicon based
semiconductor devices and to invest in research and development
talent to broaden our product portfolio. We believe an expanded
range of product offerings will enable us to grow our installed
base and market share.
|
66
|
|
|
| |
•
|
Leverage Our Silicon Design Expertise in RF
Semiconductors. We intend to continue optimizing
our existing designs to provide enhanced functionality for RF
applications. Utilizing silicon based technologies, we plan to
continue to meet customers’ increasing demand for wireless
RF solutions with faster transmission speeds, greater numbers of
simultaneous connections, better signal integrity and
performance characteristics, smaller size, and lower cost. We
will continue to apply our design expertise in silicon based
technologies both to develop integrated solutions that replace
discrete RF components as well as to integrate multiple
protocols, such as Wi-Fi and Bluetooth, into a single
semiconductor device. In addition, our relationships with
foundry partners and our commitment to industry-standard silicon
based process technologies allow us to leverage manufacturing
advances developed for the microprocessor industry to drive
innovative silicon based RF solutions.
|
| |
| |
•
|
Increase Breadth and Depth of our Customer and Partner
Relationships Through Collaboration. We intend to
continue expanding our end customer and reference design partner
relationships through collaboration on critical design and
product development activities to enable the optimization of
their products for performance, yield, cost, and
time-to-market.
In addition, we have invested capital to significantly expand
our reference design activities with new design partners to
pursue opportunities in existing and new markets. To enhance our
customer relationships in high-growth regions such as Asia
Pacific, we have expanded and will continue to expand our local
design presence and support network. We believe our
collaborative relationships with our customers position us well
to anticipate their needs and industry trends, gain market
share, and effectively penetrate new markets.
|
Products
Our products range from discrete RF power amplifiers to complex
RF front end solutions that are incorporated into a broad range
of devices including desktop and laptop computers and
peripherals, consumer and enterprise networking equipment and
home entertainment devices. We have developed
plug-and-play
front end solutions — integrating circuitry which
simplifies the interconnections between our front end solutions
and the antenna, battery and baseband processor — for
a variety of wireless communications protocols to connect these
devices, including Wi-Fi, GPS, Bluetooth and ZigBee. We have
also developed RF components for certain 3G and 4G wireless
broadband standards. We provide solutions for the following
markets:
Computing
We provide the computing market with a range of Wi-Fi solutions,
from discrete power amplifiers to dual-band 2.4 GHz /
5 GHz RF front end modules and front end integrated
circuits incorporating power amplifiers, low noise amplifiers,
filters, RF switches, power regulators and control interfaces.
Our solutions are designed to support Class 1 Bluetooth
products. We also supply full band 2.3 GHz to 2.7 GHz
WiMAX RF power amplifiers. Our solutions enable wireless
connectivity in desktop and laptop computers, printers, USB
dongles and data storage devices.
Networking
We provide the networking market with a suite of Wi-Fi solutions
that provide a full range of functional integration across power
levels from 16 dBm to 26 dBm in both 2.4 GHz and 5 GHz
frequency bands. These solutions are incorporated into a range
of consumer and enterprise network access points and routers as
well as wireless-enabled DSL and cable modems. Our
single-transmit/single-receive, or 1x1, “slice”
solutions for 2.4 GHz and 5 GHz frequency bands are
key RF building blocks enabling networking OEMs to design a
single motherboard for manufacturing flexibility in up to 4x4
multiple-input-multiple-output solutions.
67
Home
Entertainment Devices
We provide the home entertainment devices market with various
Wi-Fi solutions. Our dual band solutions support high quality
video transmission between set-top boxes, media players,
handheld video recording devices and video storage servers. Our
dual band solutions are also incorporated into flat-panel
televisions for access to streaming Internet Protocol television
services including
video-on-demand.
In gaming consoles, our RF front ends with antenna diversity
facilitate wireless real-time online gaming with others using
residential and public Wi-Fi access points.
Mobile
Devices
We provide the mobile devices market with solutions in two
principal segments: personal navigation devices and mobile
handsets including smartphones. Our GPS RF receivers are
incorporated into personal navigation devices and mobile
handsets to support navigation and other location-based
services. In mobile handsets, our Wi-Fi solutions deliver
connectivity and support antenna sharing between Wi-Fi and
Bluetooth functions while minimizing interference from cellular
RF transmissions. In addition, our solutions allow the RF front
end to connect directly to the battery, which reduces the need
for regulators and extends the life from a single charge by
maximizing low voltage operation.
Smart
Energy
In fiscal 2010, we introduced solutions in the smart energy
market that support ZigBee and other 802.15.4 wireless
standards. These RF front end solutions are small, have low
standby power consumption and deliver coverage range within
structures as well as outdoors. Our solutions covering the
2.4 GHz band enable connectivity between the smart meter
and the utility company. In addition, we believe our expertise
in RF front end solutions and power amplifiers covering the
900 MHz band will enable us to deliver connectivity
solutions between the smart meter and wirelessly enabled
appliances and sensors used in businesses and residences.
Cellular
Infrastructure
In fiscal 2010, we introduced small-signal transmit and receive
RF signal processing components for the cellular infrastructure
market, including digital attenuators and mixers for both
cellular base stations and microwave backhaul equipment. As
demand for broadband Internet access continues to grow among
mobile phone subscribers, 3G and 4G cellular network operators
continue to invest in network capacity and improved coverage
quality. Our solutions are delivering increasing levels of
functional integration in the RF signal chain, which is becoming
more important as cellular base stations decrease in size for
space-constrained urban and suburban cell sites. We believe
demand for mobile broadband will likely lead to an increase in
microwave connections between the remote base station and the
central switching office to significantly increase cell capacity.
Over the past five years, we have transitioned from a company
that principally provided discrete power amplifiers for use in a
limited number of wireless applications to a company that
principally provides integrated front end solutions for use in
the computing, networking, home entertainment and mobile devices
markets. The table below describes the key features of our
solutions in our principal markets.
68
Key Solution
Features
| |
|
|
|
|
|
|
|
Discrete
|
|
Front End Module
|
|
Front End IC
|
|
RF Receiver
|
|
|
|
|
|
|
|
|
|
|
|
|
|
Computing
|
|
|
|
|
|
|
|
|
|
|
|
• Low (2.4 GHz) Wi-Fi
frequency band
• Medium-to-high RF
power (18 dBm-26 dBm)
• Integrates some front
end functions
|
|
• Low and high (5 GHz)
Wi-Fi frequency bands
(single-channel and
multi-channel
configurations)
• Medium RF power
(18 dBm-22 dBm)
• Integrates all front end
functions
|
|
|
|
|
| |
|
|
|
|
|
|
|
|
|
|
|
|
|
|
|
|
|
Networking
|
|
|
|
|
|
|
|
|
|
|
|
• Low and high Wi-Fi
frequency bands
• Medium-to-high RF power
• Integrates some front
end functions
|
|
• Low and high Wi-Fi
frequency bands
• Medium RF power
• Integrates all front end
functions
|
|
|
|
|
|
|
|
|
|
|
|
|
|
|
|
Home Entertainment Devices
|
|
|
|
|
|
|
|
|
|
|
|
• Low and high Wi-Fi
frequency bands
|
|
• Low and high Wi-Fi
frequency bands
|
|
|
|
|
|
• Medium-to-high RF
|
|
• Medium RF power
|
|
|
|
|
|
power
|
|
• Integrates all front end
|
|
|
|
|
|
• Integrates some front
end functions
|
|
functions
|
|
|
|
|
|
|
|
|
|
|
|
|
|
|
|
Mobile Devices
|
|
|
|
|
|
|
|
|
|
|
|
• Low and high Wi-Fi frequency
bands
• Low (2.3-2.7 GHz)
WiMAX frequency
band
• Medium-to-high RF power
• Integrates some front
end functions
|
|
• Low and high Wi-Fi
frequency bands
• Medium RF power
• Integrates all front end
functions, enables
cellular coexistence
and operates directly
from battery
|
|
• Low and high Wi-Fi
frequency bands
• Integrates all front end
functions, enables
cellular coexistence
and operates directly
from battery
|
|
• GPS frequency band
• Integrates all front end
and receiver functions
|
|
|
|
|
|
|
|
|
|
|
|
Smart Energy
|
|
|
|
|
|
|
|
|
|
|
|
|
|
• Low (900 MHz) and high
(2.4 GHz) ZigBee and 802.15.4 frequency bands
|
|
|
|
|
|
|
|
• Medium RF power
|
|
|
|
|
|
|
|
• Low standby power
|
|
|
|
|
|
|
|
• Integrates all front end
functions
|
|
|
|
|
|
|
|
|
|
|
|
|
|
|
|
Cellular Infrastructure
|
|
|
|
|
|
|
|
|
|
|
|
• Frequency converter
|
|
|
|
|
|
|
|
• Digital variable attenuator
|
|
|
|
|
|
|
69
Sales and
Marketing
We collaborate first with our reference design partners to
develop reference designs that incorporate our RF front end
solutions and then to market and sell our solutions to OEMs and
ODMs. We also sell our solutions to distributors that sell to
OEMs and ODMs. ODMs generally design and manufacture products
that are branded by another company for sale to their end
customers. OEMs generally design and manufacture wireless
devices for sale to their end customers under their own brand
names. Our solutions are integrated into a wide variety of
wireless enabled devices manufactured and distributed by leading
suppliers of computing, networking and home entertainment and
mobile devices.
Our reference design partners include, among others, Atheros,
Broadcom, Cambridge Silicon Radio, Marvell and Ralink. We
continue to expand our relationships with these and other
reference design partners that are specifically focused on
rapidly-growing, high volume computing, networking, home
entertainment, mobile and smart energy markets. We work closely
with these partners on the development of reference designs that
incorporate our RF front end solutions and the qualification of
these designs at OEMs and ODMs. A reference design typically
consists of a fully functional and fully tested wireless chipset
solution consisting of a front end solution, a transceiver and a
baseband processor, which is evaluated as a whole by OEMs and
ODMs through a rigorous design selection process. The typical
selection process is lengthy and can require us to incur
significant design and development expenditures. Once our
reference design partner’s solution has been selected by an
OEM, we negotiate pricing and supply with their ODM and we
provide technical and logistical support to both the OEM and
their ODM. Every reference design must meet applicable
regulatory standards and, once certified, the design then
becomes difficult to change throughout its production life.
After collaborating with reference design partners, we also work
with distributors and sales representatives to sell our
solutions throughout the world. These relationships are
non-exclusive. Each distributor and sales representative is
allowed to sell our solutions into specified customer accounts.
Sales to distributors accounted for approximately 32% of our
revenue in fiscal 2009 and approximately 46% of our revenue for
fiscal 2010. Our principal global distributors are Promaster and
RichPower, complemented by a number of specialty regional
distributors with customer relationships based on their
respective product portfolios. Many of our distributors also
provide technical and logistical support capabilities to our
customers.
Our typical sales cycle consists of a multi-month sales and
development process and requires a substantial expenditure of
resources before we receive revenue from product sales, if at
all. The period from early engagement to high volume production
typically takes six to 12 months for existing customers and
12 to 18 months for new customers. If our solutions are
incorporated into an OEM’s design for a product, our
solutions typically remain part of that reference design
throughout the life cycle of that product, which typically spans
one to three years for computing, home entertainment and mobile
applications and three to five years for networking applications.
We provide customer support to our OEM and ODM customers and
reference design partners as well as to our distributors and
sales representatives. In addition, we service our OEM and ODM
customers through our direct regional sales force, a regional
network of distributors and a regional network of independent
sales representatives.
We generate revenue on the basis of purchase orders with our
customers rather than through long-term purchase commitments.
Our customers can cancel these purchase orders or defer the
shipments of our solutions at any time and for any reason.
Our marketing team is responsible for our product strategy,
product development road maps and competitive analysis. We work
closely with our reference design partners as well as OEMs and
ODMs to ensure that our solutions meet their needs and the needs
of their customers. We also work with these entities to
influence their product requirements to ensure their products
continue to perform at a high level when using our solutions.
70
As of December 31, 2010, our sales and marketing
organization consisted of 25 employees. Our sales and
marketing employees have responsibility for reference design
partner relationships, account support, field application
support and customer fulfillment. We have seven sales offices
located in seven countries, including in key centers of the
worldwide electronics supply chain in China, Taiwan, Japan and
South Korea. We also maintain a regional customer support center
in Hong Kong, China.
Customers
We primarily sell our solutions to ODMs, distributors, and, to a
lesser extent, directly to OEMs. Substantially all of our sales
are made on a purchase order basis, not under long-term supply
contracts and we depend on a small number of customers for a
substantial portion of our revenue.
In fiscal 2010, our top four customers collectively accounted
for 78% of our revenue. Sales to Promaster and RichPower, our
two largest independent distributors, represented approximately
27% and 15% of our revenue, respectively, during that period.
Sales to Hon Hai and Universal Scientific Industrial, both
leading ODMs, represented approximately 26% and 10%,
respectively, of our revenue during that period. No other
customer represented more than 10% of our revenue during fiscal
year 2010.
Manufacturing
We outsource all of our wafer fabrication to third party
semiconductor foundries and all of our assembly and testing
operations to third party assembly and test contractors. Our
fully outsourced manufacturing model is critical to our ability
to respond effectively to the variations in customer demand
common in the consumer electronics industry.
Wafer Fabrication. We use several
semiconductor technologies and semiconductor foundries to meet
our customer needs. We outsource silicon wafer fabrication to
IBM Microelectronics, GaAs wafer fabrication to WIN
Semiconductor and integrated passive device manufacturing to
STATS ChipPAC. We maintain close relationships with these
foundries, which allow us to leverage wafer capacity and
technologies to meet our customers’ needs.
Assembly and Test. Finished wafers from our
semiconductor foundries are shipped to our third party assembly
and test contractors, who test the wafers, assemble them into
parts, perform final testing, and pack and ship our solutions to
end customers, increasingly from a single factory. This process
results in rapid cycle times and enables us to manage inventory
levels and respond quickly to customer demands. Our assembly and
test contractors include Unisem, Foxconn and Tong Hsing.
We have implemented quality assurance procedures to ensure our
suppliers maintain high levels of product quality. We require
our suppliers to have both quality assurance and environmental
manufacturing systems certified to ISO 9000 and ISO 14000
compliance levels. Our design engineers develop assembly
solutions and our test engineers develop all test solutions for
our products. We then release these solutions to our assembly
and test contractors through business-to-business software
systems and we work closely with our assembly and test
contractors to ensure our solutions are properly implemented.
The use of lead in the design and manufacture of electronic
products is an increasing environmental concern. In support of
industry-wide initiatives to protect the environment, all
products we ship today are lead-free and Restriction of
Hazardous Substances (RoHS) compliant.
Research and
Development
We are committed to continuous investment in product
development. We focus our research and development activities on
the advancement of silicon based technologies and design
methodologies to replace GaAs based technologies currently in
use in various wireless connectivity applications. We invest in
novel circuit architectures for energy-efficient and low-loss RF
functions. We also invest in RF semiconductor device modeling
and evaluation as a foundation for establishing our standardized
71
intellectual property block design environment and advancing
development in our RF front end products. Continued device
modeling and evaluation, along with partnerships for RF
packaging for single and multi-die solutions, is critical to our
time-to-market performance and the
plug-and-play
nature of our solutions.
We have received government and other funding to support our
research and development activities. We will continue to pursue
other opportunities to obtain additional funding to further
subsidize our research and development activities.
As of December 31, 2010, our research and development
organization consisted of 79 employees. Our research and
development organization includes eight employees with PhDs and
28 employees with Masters degrees.
Competition
The global semiconductor market is highly competitive. While no
single company competes against us in all of our markets, our
competitors range from large, international companies that offer
a wide range of products to smaller companies that specialize in
narrow markets. Our competitors include companies with longer
operating histories, greater name recognition, a larger base of
existing customers and substantially greater financial,
technical and operational resources. Our competitors include
Anadigics, Analog Devices, Hitachi Metals, Hittite, Maxim,
Microsemi, Microchip, Murata, RFMD, Richwave, Skyworks and
TriQuint. To a lesser degree, we also compete with certain
reference design partners, including Atheros, Broadcom and
Intel, in connection with certain of their semiconductor
products that have integrated RF power amplifiers in their
transceiver solutions.
Our ability to compete effectively depends on a number of
factors, including quality, technical performance, price,
product features, product system compatibility, RF system
functionality, engineering expertise, responsiveness to
customers, new product innovation, product availability,
delivery timing and reliability and customer sales and technical
support. We believe we compare favorably against our competitors
on each of these factors.
Intellectual
Property Rights
Our success depends in part upon our ability to establish and
protect our intellectual property and confidential information.
We rely on a combination of intellectual property laws,
including patent, copyright, trademark and trade secret laws of
the United States and in selected foreign countries where we
believe filing for such protection is appropriate. We also rely
on trade secrets, technical know-how and continuing innovation
to develop and maintain our competitive position. In addition,
we seek to protect our confidential information and proprietary
rights by requiring our employees, consultants, contractors,
outside partners and other advisers to execute, as appropriate,
nondisclosure and assignment of invention agreements upon
commencement of their employment or engagement. We also require
our customers and suppliers to enter into confidentiality
agreements with any third parties that receive our confidential
data or materials.
We have applied for registration of more than 100 patents in the
U.S. and certain foreign countries, some of which have been
issued. Our patents and patent applications are related to a
broad range of technologies and methods, including power
amplifiers and Wi-Fi technology. Our issued patents have varied
terms of expiration ranging from 2020 to 2030. In addition, we
own a limited number of trademarks in the U.S. and Canada.
We have and intend to continue to apply for patents to protect
our inventions, and we will pursue such applications as
appropriate.
Employees
As of December 31, 2010, we had 143 employees,
including 79 in research and development and 25 in sales and
marketing. None of our employees is represented by a labor
organization or a party to a collective bargaining agreement. We
consider our employee relations to be good.
72
Facilities
Our principal executive offices are located at a facility in
Andover, Massachusetts consisting of 12,150 square feet
under a lease that expires in June 2016. The principal functions
performed at our Andover, Massachusetts facility are
administration, marketing and research and development. Our
principal operating facilities are located in Ottawa, Ontario,
Canada and Hong Kong, China. Our Ottawa facility, which consists
of 14,619 square feet, is under a lease that expires in
March 2016 (with an option to terminate in March 2011) and
accommodates administration, marketing, research and development
and operations support functions. Our Hong Kong facility, which
consists of 7,522 square feet, is under a lease that
expires in August 2013 and accommodates research and
development, operations, sales and marketing and product support
functions. We believe that our current facilities are adequate
for our present operations.
Legal
Proceedings
From time to time, we are involved in legal proceedings of the
type that we believe is common to companies engaged in our line
of business, including commercial, intellectual property and
employment disputes. We are not currently a party to any
material legal proceedings that we believe would likely have a
material adverse effect on our financial condition, results of
operations or cash flows.
73
MANAGEMENT
Executive
Officers and Directors
The following table sets forth certain information about our
executive officers and directors as of the date of this
prospectus.
| |
|
|
|
|
|
|
|
Name
|
|
Age
|
|
Position(s)
|
|
|
|
Sohail A. Khan
|
|
|
56
|
|
|
President, Chief Executive Officer and Director
|
|
William H. Burke
|
|
|
49
|
|
|
Chief Financial Officer, Treasurer and Secretary
|
|
George W. Haberlin
|
|
|
48
|
|
|
Chief Operating Officer and Vice President, Worldwide Sales
|
|
Peter L. Gammel
|
|
|
50
|
|
|
Chief Technology Officer and Vice President, Engineering
|
|
Alistair P. Manley
|
|
|
58
|
|
|
Vice President, Marketing
|
|
Morrison C. Tan
|
|
|
48
|
|
|
Vice President, Operations
|
|
John Brewer, Jr.
|
|
|
49
|
|
|
Vice President, Corporate and Business Development
|
|
Theodore Shlapak
|
|
|
67
|
|
|
Chairman of the Board
|
|
Bill Byun
|
|
|
42
|
|
|
Director
|
|
Patrick DiPietro
|
|
|
55
|
|
|
Director
|
|
Matthew S. Engel
|
|
|
33
|
|
|
Director
|
|
Karen Roscher
|
|
|
51
|
|
|
Director Nominee
|
|
|
|
|
(1)
|
|
Member of the Audit Committee.
|
| |
|
(2)
|
|
Member of the Compensation
Committee.
|
| |
|
(3)
|
|
Member of the Nominating and
Corporate Governance Committee.
|
The following biographical descriptions set forth certain
information as of the date of this prospectus about our
executive officers and directors. The last sentence of each
director’s biography includes information about each of our
director’s specific experience, qualifications, attributes
and skills that led our board of directors to the conclusion
that each should serve as a director.
Sohail A. Khan has served as our President, Chief
Executive Officer and Director since April 2007. Prior to
joining us, Mr. Khan served as an operating partner at
Bessemer Venture Partners, a venture capital firm, from March
2006 to March 2007 where he assisted in the evaluation of new
investment opportunities and provided support to portfolio
companies. From 2001 to 2005, Mr. Khan held various senior
management positions with Agere Systems, Inc. (acquired by LSI
Logic Corporation), which was a publicly traded global leader in
semiconductors and software solutions for storage, mobility, and
networking markets, including executive vice president of
infrastructure systems and executive vice president of strategy
and development. Mr. Khan held senior management positions
at Lucent Technologies, Inc. from 1996 to 2001, AT&T Inc.
from 1990 to 1996, NEC Electronics Corporation (now Renesas
Electronics Corporation) from 1984 to 1989, and Intel from 1982
to 1984. Mr. Khan serves on the board of directors of
LightPath Technologies, Inc. and GainSpan Corporation. He holds
a Master of Business Administration from the University of
California at Berkeley and a Bachelor of Science in electrical
engineering from the University of Engineering in Lahore,
Pakistan. Mr. Khan brings his executive management
experience and extensive experience in the semiconductor
industry to our board of directors.
William H. Burke has served as our Chief Financial
Officer and Treasurer since December 2005 and Secretary since
2010. Prior to joining us, Mr. Burke served as executive
vice president, chief financial officer and executive vice
president of business development at Riverdeep/The Learning
Company, a developer of interactive learning solutions, from
2000 to 2004 where he led a dual-listed initial public offering.
From 1997 to 1999, Mr. Burke served as vice president of
finance and administration at AXS-One, Inc. (formerly Computron
Software Corporation), a provider of archiving software
solutions. From 1985 to 1997, Mr. Burke held several
positions, including senior audit
74
manager at Andersen LLP, a public accounting firm.
Mr. Burke earned his Bachelor of Business Administration in
accounting with Honors at Northeastern University.
George W. Haberlin has served as our Chief
Operating Officer since May 2005 and Vice President, Worldwide
Sales since September 2001. Mr. Haberlin also served as our
President from August 2005 to April 2007. Prior to joining us,
Mr. Haberlin was a sales director at Zarlink Semiconductor
Inc., a provider of solutions for voice and data networks,
medical telemetry applications and optical interconnect, from
1998 to 2001 where he was responsible for applications support,
product introductions and global customer relationships. From
1995 to 1998, Mr. Haberlin was regional sales manager at
GEC Plessey Semiconductors, Inc. From 1991 to 1995,
Mr. Haberlin was vice president of sales, and from 1986 to
1990, sales engineer at Stone Component Sales Corporation.
Mr. Haberlin holds a Bachelor of Arts degree in political
science from the University of Wisconsin.
Peter L. Gammel has served as our Chief Technology
Officer and Vice President, Engineering since June 2007. Prior
to joining us, Mr. Gammel served as vice president,
engineering at Renaissance Wireless Corporation, a
venture-backed startup, from August 2006 to 2007 where he
assembled and managed a
15-person
team to develop RF acoustic wave products. From 2005 to 2006,
Mr. Gammel was the chief technology officer at
AdvanceNanotech, Inc., a development-stage company specializing
in the commercialization of nanotechnology, where he developed
and managed an early stage development fund for a publicly
traded company. From 2000 to 2005, Mr. Gammel worked at
Agere Systems, Inc. (acquired by LSI Logic Corporation), where
he was chief technology officer in the analogue products
business unit from 2002 to 2005 and director, MEMS research from
2000 to 2002. From 1986 to 2000, Mr. Gammel was a research
director at Bell Laboratories, a research and development
organization of Alcatel-Lucent. He holds a PhD in physics from
Cornell University and Bachelor of Science degrees in physics
and mathematics from Massachusetts Institute of Technology.
Alistair P. Manley has served as our Vice
President, Marketing since December 2007 and from 2002 to 2007,
Mr. Manley held various positions at our company, including
Director of Sales in North America, Senior Director of Marketing
and Vice President, Partner Development. Prior to joining us,
Mr. Manley managed business development, product
definition, field sales and training and strategic accounts for
set-top box and cellular products at Mitel Corporation (now
Zarlink Semiconductor Inc.) from 1984 to 2002. Mr. Manley
held various marketing and engineering positions at GEC Plessey
Semiconductors, Inc. from 1978 to 1984 and at Texas Instruments
Inc. from 1969 to 1978. He holds a Higher National Diploma from
the Northampton College of Technology.
Morrison C. Tan has served as our Vice President,
Operations since July 2005. Prior to joining us, Mr. Tan
was director of operations for worldwide new product
introductions and product engineering at Zarlink Semiconductor
Inc. from 1996 to 2005. During his 10 years at Zarlink,
Mr. Tan occupied a variety of increasingly senior product
engineering, process engineering and quality-based roles. From
1994 to 1996, Mr. Tan was a software engineer at Softline
Systems Inc. and from 1992 to 1994, Mr. Tan was founder and
president of Software Solutions, Inc. From 1984 to 1992,
Mr. Tan was product quality and reliability engineering
section manager at Intel. Mr. Tan holds a Bachelor of
Science degree in electronics & communications
engineering from De La Salle University.
John Brewer, Jr. has served as our Vice
President, Corporate and Business Development since October 2007
and was previously our Vice President, Marketing from April 2006
to October 2007. Prior to joining us, Mr. Brewer was chief
executive officer, president and a member of the board of
directors of Xindium Technologies, Inc., a company providing RF
power amplifiers for next-generation mobile handsets and
terminals, from 2003 to 2005 where he focused on business
development, marketing and sales. From 2000 to 2003,
Mr. Brewer worked at Vincio LLC and from 1997 to 2000, at
Tropian, Inc. Mr. Brewer successfully grew wireless
transceiver product lines in management positions at SEIKO
Communications Systems, Inc. from 1995 to 1997, Analog Devices,
Inc. from 1994 to 1995
75
and Tektronix, Inc. from 1990 to 1994. He holds a Bachelor of
Science degree in electrical engineering from Santa Clara
University.
Theodore Shlapak has served on our board of
directors as Chairman since June 2007. From 1971 until his
retirement in 2004, Mr. Shlapak worked at Motorola
Corporation, a provider of wireless telecommunication products,
where he most recently served as president and chief executive
officer of the semiconductor products sector. Mr. Shlapak
also led European and Canadian semiconductor operations at
Motorola. Mr. Shlapak also serves on the board of directors
of Applied Micro Circuits Corporation and Gennum Corporation and
formerly served on the board or directors of Tundra
Semiconductor Corporation. Mr. Shlapak holds Bachelor of
Science and Master of Science degrees in electrical engineering
from the University of Waterloo. Mr. Shlapak brings his
extensive experience in the semiconductor industry to our board
of directors.
Bill Byun has served on our board of directors
since April 2007. Mr. Byun has been a general partner of 7
Capital LLC since August 2010. Mr. Byun was a managing
director at Samsung Ventures Investment Corporation, a firm that
manages venture investments, from January 2005 to July 2010.
Prior to his tenure at Samsung Ventures, Mr. Byun held
executive sales and marketing positions with Philips
Semiconductor (now known as NXP Semiconductors Inc.), a producer
of semiconductors and software that delivers enhanced sensory
service in electronic devices, from 2001 to 2005, KLA-Tencor,
Inc., a supplier of process control and yield management
solutions for the semiconductor and related industries, from
1999 to 2001, and Etec Systems, Inc. (now a subsidiary of
Applied Materials, Inc.), a provider of photomask semiconductor
systems, from 1996 to 1999. Mr. Byun received a Bachelor of
Science in mechanical engineering from the University of
California at Santa Barbara and a Master of Business
Administration from Oxford University. Mr. Byun brings his
executive sales and marketing experience and knowledge of the
semiconductor industry to our board of directors.
Patrick DiPietro has served on our board of
directors since December 2002. Mr. DiPietro is the
founder of Sanmite Technologies Inc., a company that invests in
next generation communications technology. Mr. DiPietro was
previously a managing general partner at VenGrowth Asset
Management Inc., a private equity and venture capital firm, from
August 2004 to July 2010, after having joined
VenGrowth in 2001. From 1999 to 2001 Mr. DiPietro was a
vice president of 3G wireless systems at Nortel Networks,
Inc., a telecommunications equipment manufacturer.
Mr. DiPietro previously occupied senior managerial roles in
research and development and operations at Nortel and
Bell-Northern Research, Inc. Mr. DiPietro also serves as a
director of BelAir Networks Inc. Mr. DiPietro was formerly
on the board of directors of Sandvine Incorporated from 2002 to
2007, now a public company and was also on the board of
directors of BTI Systems Inc. from 2002 to 2009. He also served
on the boards of Nakina Systems Inc. and Liquid Computing
Corporation, and was chairman of the board of directors of
Neterion Inc. Mr. DiPietro holds a Bachelor of Science in
electrical engineering from Queen’s University.
Mr. DiPietro brings his extensive experience in venture
capital investing and over 20 years in high technology to
our board of directors.
Matthew S. Engel has served on our board of
directors since November 2010. Mr. Engel has been a partner
at Prism Venture Management LLC, an early stage technology and
life sciences venture capital firm, since 2007. Prior to
returning to Prism in 2007, Mr. Engel was the senior
manager of business development and the vice president of
finance at GeoTrust, Inc., which was acquired by Verisign, Inc.
in 2006. He is currently on the board of Six Degree Games, Inc.
and Sonian, Inc. Mr. Engel holds a Bachelor of Science
degree in accountancy from Villanova University. Mr. Engel
brings his extensive experience in venture capital investing and
his financial expertise to our board of directors.
Karen Roscher has agreed to serve on our board of
directors upon the completion of this offering. Ms. Roscher
has been the senior vice president and chief financial officer
of Welch Allyn, Inc., a medical device manufacturer, since July
2009. From September 2007 through December 2008,
Ms. Roscher was senior vice president and chief financial
officer of Conexant Systems, Inc., a fabless semiconductor
manufacturer. From 1981 through September 2007, Ms. Roscher
was in various
76
financial and operational roles at Motorola Corporation’s
semiconductor products sector and at Freescale Semiconductor
Inc., a semiconductor manufacturer, where she most recently
served as vice president of corporate financial planning and
analysis. Ms. Roscher holds a Master of Business
Administration and a Bachelor of Science in Accounting from
Arizona State University and is a certified public accountant.
Ms. Roscher brings extensive financial and semiconductor
knowledge and experience to our board of directors.
Composition of
our Board of Directors
Our board of directors currently consists of five members, all
of whom were elected pursuant to the board composition
provisions of our stockholders agreement, which is described
under “Certain Relationships and Related Party
Transactions — Recapitalization and Private Placements
of Securities — Stockholders Agreement” in this
prospectus. These board composition provisions will terminate
immediately prior to the completion of this offering. Upon the
termination of these provisions, there will be no further
contractual obligations regarding the election of our directors.
Our nominating and corporate governance committee and board of
directors may therefore consider a broad range of factors
relating to the qualifications and background of nominees, which
may include diversity, which is not limited to race, gender or
national origin. We have no formal policy regarding board
diversity. Our nominating and corporate governance
committee’s and board of directors’ priority in
selecting board members is identification of persons who will
further the interests of our stockholders through their
established records of professional accomplishment, the ability
to contribute positively to the collaborative culture among
board members, and professional and personal experiences and
expertise relevant to our growth strategy.
Director Independence. We have applied to have
our common stock listed on the NASDAQ Global Market. Our board
of directors has determined
that ,
and
are independent under the applicable rules and regulations of
the Securities and Exchange Commission and the NASDAQ Global
Market. Upon the completion of this offering, we expect that the
composition and functioning of our board of directors and each
of our board committees will comply with all applicable rules
and regulations of the Securities and Exchange Commission and
the NASDAQ Global Market. There are no family relationships
among any of our directors or executive officers.
Staggered Board. Immediately prior to the
completion of this offering, our board of directors will be
divided into three staggered classes of directors of the same or
nearly the same number and each will be assigned to one of the
three classes. At each annual meeting of the stockholders, a
class of directors will be elected for a three year term to
succeed the directors of the same class whose terms are then
expiring. The terms of the directors will expire upon the
election and qualification of successor directors at the annual
meeting of stockholders to be held during 2012 for Class I
directors, 2013 for Class II directors and 2014 for
Class III directors.
|
|
|
| |
•
|
Our Class I directors will
be ;
|
| |
| |
•
|
Our Class II directors will
be
; and
|
| |
| |
•
|
Our Class III directors will
be .
|
Our amended and restated certificate of incorporation and
amended and restated by-laws, each of which will become
effective upon the completion of this offering, provide that the
number of our directors shall be fixed from time to time by a
resolution of the majority of our board of directors. Any
additional directorships resulting from an increase in the
number of directors will be distributed among the three classes
so that, as nearly as possible, each class shall consist of
one-third of our board of directors.
The division of our board of directors into three classes with
staggered three-year terms may delay or prevent stockholder
efforts to effect a change of our management or a change in
control.
77
Board Leadership
Structure and Board’s Role in Risk Oversight
The positions of chairman of the board and chief executive
officer are presently separated and have historically been
separated at our company. We believe that separating these
positions allows our chief executive officer to focus on our
day-to-day
business, while allowing the chairman of the board to lead our
board of directors in its fundamental role of providing advice
to and independent oversight of management. Our board of
directors recognizes the time, effort and energy that the chief
executive officer is required to devote to his position in the
current business environment, as well as the commitment required
to serve as our chairman, particularly as our board of
directors’ oversight responsibilities continue to grow.
While our amended and restated by-laws, which will become
effective upon the completion of this offering, and our
corporate governance guidelines do not require that our chairman
and chief executive officer positions be separate, our board of
directors believes that having separate positions is the
appropriate leadership structure for us at this time and
demonstrates our commitment to good corporate governance.
Risk is inherent with every business, and how well a business
manages risk can ultimately determine its success. We face a
number of risks, including risks relating to our operations,
strategic direction and intellectual property as more full
discussed under “Risk Factors” in this prospectus.
Management is responsible for the
day-to-day
management of risks we face, while our board of directors, as a
whole and through its committees, has responsibility for the
oversight of risk management. In its risk oversight role, our
board of directors has the responsibility to satisfy itself that
the risk management processes designed and implemented by
management are adequate and functioning as designed.
The role of our board of directors in overseeing the management
of our risks is conducted primarily through committees of the
board of directors, as disclosed in the descriptions of each of
the committees below and in the charters of each of the
committees. The full board of directors (or the appropriate
board committee in the case of risks that are under the purview
of a particular committee) discusses with management our major
risk exposures, their potential impact on us, and the steps we
take to manage them. When a board committee is responsible for
evaluating and overseeing the management of a particular risk or
risks, the chairman of the relevant committee reports on the
discussion to the full board of directors during the committee
reports portion of the next board meeting. This enables our
board of directors and its committees to coordinate the risk
oversight role, particularly with respect to risk
interrelationships.
Committees of our
Board of Directors
Our board of directors has established an audit committee, a
compensation committee and a nominating and corporate governance
committee, each of which operates pursuant to a charter adopted
by our board of directors. Upon the completion of this offering,
the composition and functioning of all of our committees will
comply with all applicable requirements of the Sarbanes-Oxley
Act of 2002, Securities and Exchange Commission and NASDAQ
Global Market rules and regulations.
Audit committee.
,
and
currently serve on the audit committee, which is chaired
by .
Ms. Roscher has agreed to serve on the Audit Committee upon
the completion of this offering. Our board of directors has
determined
that ,
and
are independent under the applicable rules and regulations of
the Securities and Exchange Commission and the NASDAQ Global
Market. Our board of directors has
designated
as an “audit committee financial expert,” as defined
under the applicable rules of the Securities and Exchange
Commission. The audit committee’s responsibilities include:
|
|
|
| |
•
|
appointing, approving the compensation of, and assessing the
independence of our independent registered public accounting
firm;
|
| |
| |
•
|
pre-approving auditing and permissible non-audit services, and
the terms of such services, to be provided by our independent
registered public accounting firm;
|
78
|
|
|
| |
•
|
reviewing the overall audit plan with the independent registered
public accounting firm and members of management responsible for
preparing our financial statements;
|
| |
| |
•
|
reviewing and discussing with management and the independent
registered public accounting firm our annual and quarterly
financial statements and related disclosures as well as critical
accounting policies and estimates used by us;
|
| |
| |
•
|
coordinating the oversight and reviewing the adequacy of our
internal control over financial reporting;
|
| |
| |
•
|
establishing policies and procedures for the receipt and
retention of accounting-related complaints and concerns;
|
| |
| |
•
|
recommending, based upon the audit committee’s review and
discussions with management and the independent registered
public accounting firm, whether our audited financial statements
shall be included in our Annual Report on
Form 10-K;
|
| |
| |
•
|
monitoring the integrity of our financial statements and our
compliance with legal and regulatory requirements as they relate
to our financial statements and accounting matters;
|
| |
| |
•
|
preparing the audit committee report required by Securities and
Exchange Commission rules to be included in our annual proxy
statement;
|
| |
| |
•
|
reviewing all related party transactions for potential conflict
of interest situations and approving all such
transactions; and
|
| |
| |
•
|
reviewing quarterly earnings releases and scripts.
|
Compensation
committee. , and
currently serve on the compensation committee, which is chaired
by .
Our board of directors has determined
that , and
are independent under the applicable rules and regulations of
the NASDAQ Global Market. The compensation committee’s
responsibilities include:
|
|
|
| |
•
|
annually reviewing and approving corporate goals and objectives
relevant to the compensation of our chief executive officer;
|
| |
| |
•
|
evaluating the performance of our chief executive officer in
light of such corporate goals and objectives and determining the
compensation of our chief executive officer;
|
| |
| |
•
|
reviewing and approving the compensation of our other executive
officers;
|
| |
| |
•
|
reviewing and establishing our overall management compensation,
philosophy and policy;
|
| |
| |
•
|
overseeing and administering our compensation and similar plans;
|
| |
| |
•
|
reviewing and approving our policies and procedures for the
grant of equity-based awards;
|
| |
| |
•
|
reviewing and making recommendations to our board of directors
with respect to director compensation;
|
| |
| |
•
|
reviewing and discussing with management the compensation
discussion and analysis to be included in our annual proxy
statement or Annual Report on
Form 10-K; and
|
| |
| |
•
|
reviewing and discuss with our board of directors corporate
succession plans for the chief executive officer and other key
officers.
|
Nominating and corporate governance
committee. , and
currently serve on the nominating and corporate governance
committee, which is chaired
by .
Our board of directors has determined
that , and are
independent under the
79
applicable rules and regulations of the NASDAQ Global Market.
The nominating and corporate governance committee’s
responsibilities include:
|
|
|
| |
•
|
developing and recommending to our board of directors criteria
for board and committee membership;
|
| |
| |
•
|
establishing procedures for identifying and evaluating board of
director candidates, including nominees recommended by
stockholders;
|
| |
| |
•
|
reviewing the size and composition of our board of directors to
ensure that it is composed of members possessing the appropriate
skills and expertise to advise us;
|
| |
| |
•
|
identifying individuals qualified to become members of our board
of directors;
|
| |
| |
•
|
recommending to our board of directors the persons to be
nominated for election as directors and to each of the
board’s committees;
|
| |
| |
•
|
developing and recommending to our board of directors a code of
business conduct and ethics and a set of corporate governance
guidelines;
|
| |
| |
•
|
developing a mechanism by which violations of the code of
business conduct and ethics can be reported in a confidential
manner; and
|
| |
| |
•
|
overseeing the evaluation of our board of directors and
management.
|
Our board of directors may from time to time establish other
committees.
Compensation
Committee Interlocks and Insider Participation
None of the members of our compensation committee has at any
time during the prior three years been one of our officers or
employees. None of our executive officers currently serves, or
in the past fiscal year has served, as a member of our board of
directors or the compensation committee of any entity that has
one or more executive officers serving on our board of directors
or compensation committee.
Corporate
Governance
We have adopted a code of business conduct and ethics that
applies to all of our employees, officers and directors,
including those officers responsible for financial reporting.
Upon the completion of this offering, our code of business
conduct and ethics will be available on our website at
www.sige.com. We intend to disclose any amendments to the code,
or any waivers of its requirements, on our website.
80
COMPENSATION
DISCUSSION AND ANALYSIS
This section discusses our executive compensation policies
and arrangements as they relate to our named executive officers
who are listed in the compensation tables set forth below. The
following discussion should be read together with the
compensation tables and related disclosures set forth below.
Overview
We are a leading provider of highly integrated RF semiconductor
front end solutions that enable wireless connectivity across a
wide range of applications. With that in mind, we designed, and
intend to modify as necessary, our compensation and benefits
program and philosophy to attract, retain and incentivize
talented, qualified and committed executive officers that share
our philosophy and desire to work toward our goals. To support
these compensation objectives, we strive to provide a
competitive total compensation package to our executive officers
that we believe:
|
|
|
| |
•
|
motivates and rewards executives whose skills, knowledge and
performance are critical to our success;
|
| |
| |
•
|
is informed by the external environment allowing for
competitiveness of the total package;
|
| |
| |
•
|
aligns the interests of our executive officers with those of our
stockholders and supports the strategic direction of our
business;
|
| |
| |
•
|
encourages behavior consistent with our values and reinforces
ethical business practices;
|
| |
| |
•
|
reflects the level of accountability and future potential of
each executive and the achievement of outstanding individual
results; and
|
| |
| |
•
|
links executive compensation to the achievement of objectives
set for the executive at the beginning of each year.
|
We use a combination of base salary, annual performance-based
cash incentive compensation and a long-term equity incentive
compensation program to create a competitive compensation
package for our executive officers. We generally apply the same
compensation philosophy for our executive officers to all levels
of senior managerial employees.
Role of
Compensation Committee and Executive Officers
Our executive compensation program is administered by the
compensation committee of our board of directors. Our
compensation committee has overall responsibility for overseeing
our executive compensation policies, plans and programs,
reviewing our achievements as a company and the achievements of
our individual officers and determining the type and level of
compensation of our Chief Executive Officer, our other executive
officers and our directors. In reviewing and approving these
matters, our compensation committee considers such matters as it
deems appropriate, including our financial and operating
performance, the alignment of the interests of our named
executive officers and our stockholders, the compensation paid
to our peer group companies and our ability to attract and
retain qualified and committed individuals.
For executive officers other than our Chief Executive Officer,
the compensation committee typically seeks and considers input
from Mr. Khan, our Chief Executive Officer, regarding such
executive officers’ responsibilities, performance and
compensation. Specifically, our Chief Executive Officer makes
recommendations regarding base salary increases, annual
performance-based cash incentive compensation and the grant of
long-term equity incentive compensation to our named executive
officers other than himself. These recommendations reflect
compensation levels that our Chief Executive Officer believes
are qualitatively commensurate with a named executive
officer’s individual qualifications, experience,
responsibility level, functional role, knowledge, skills and
individual performance, as well as our company’s
performance and the market for the position.
81
Mr. Khan also generally participates in our compensation
committee’s deliberations about executive compensation
matters but does not participate in the deliberation or
determination of his own compensation. Our compensation
committee considers our Chief Executive Officer’s
recommendations with respect to our named executive officers
other than himself but is not required to follow any of his
recommendations and may adjust compensation up or down as it
determines in its discretion. Our compensation committee then
approves the type and amount of compensation for all of our
named executive officers, including Mr. Khan.
Peer Group
Information
In determining compensation for our named executive officers, we
review market compensation data of our peer group companies as
reported by Radford, a division of Aon Consulting Inc., in its
Global Technology Survey. The peer group companies that we
review from the 2010 Global Technology Survey are semiconductor
companies with revenues of between $50 million and
$200 million and consist of the following: Advanced
Analogic Technologies Incorporated, Aeroflex Colorado Springs,
Inc., Cirrus Logic, Inc., Cortina Systems, Inc., DpiX, LLC,
Ebara Technologies, Inc., Exar Corporation, Entropic
Communications, Inc., Gennum, Ikanos Communications, Inc., JSR
Micro, Inc., Magnum Semiconductor Inc., Mellanox Technologies,
Ltd (Israel), Mellanox Technologies, Ltd, Microtune, Inc.,
Mindspeed Technologies, Inc., Mips Technologies, Inc.,
Monolithic Power Systems, Inc., Netlogic Microsystems, Inc.,
Pericom Semiconductor Corporation, PLX Technology, Inc., Rambus
Inc., Rohm Semiconductor USA, LLC, Supertex, Inc., Telegent
Systems, Inc., Trident Microsystems, Inc., Tower Semiconductor
Ltd., Jazz Semiconductor, Virage Logic Corporation, Volterra
Semiconductor Corporation and Zarlink Semiconductor Inc. We also
review the public filings of other peer semiconductor companies,
including Advanced Analogic Technologies Incorporated,
Anadigics, Atheros, Beceem Communications Inc., Broadcom, Cirrus
Logic, Inc., Cambridge Silicon Radio, Entropic Communications,
Inc., Hittite, MaxLinear, Inc., Marvell, Microsemi, Microtune,
Inc., Pericom Semiconductor Corporation, RFMD, Skyworks and
TriQuint. We believe that our peer group companies are
representative of the types of companies with which we compete
for executive talent. We may replace some or all of these
companies with others from time to time as changes in market
positions and company size, including our own, may suggest more
representative peer group companies.
We generally use the peer group compensation data primarily as a
reference in determining competitive compensation for our named
executive officers. In determining competitive levels of
compensation for our named executive officers, we refer to the
peer group company data and make appropriate adjustments for our
business, its financial condition and its prospects. The types
and amounts of compensation paid to our named executive officers
relative to our peer group companies may change from time to
time as a result of such factors as our company’s
performance relative to our peer group and the individual
contributions of our named executive officers. While peer group
market data provides a useful starting point for compensation
decisions, our compensation committee considers such matters as
it deems appropriate, including our financial and operating
performance, the alignment of the interests of our named
executive officers and our stockholders and our ability to
attract and retain qualified and committed individuals, in
arriving at final compensation decisions. Based on the
foregoing, we believe the compensation levels for our named
executive officers are competitive with the compensation levels
of our peer group.
Our compensation committee may in its discretion engage the
services of outside consultants and advisors in the future to
assist it in making decisions regarding our compensation
programs and philosophies.
Elements of
Compensation
The elements of our executive compensation program include the
following:
82
|
|
|
| |
•
|
annual performance-based cash incentive compensation;
|
| |
| |
•
|
long-term equity incentive compensation in the form of stock
options; and
|
| |
| |
•
|
severance and change in control arrangements.
|
In addition, our named executive officers are eligible to
participate in all of our employee benefit plans, such as
medical, dental, disability, vision, group life and accidental
death and dismemberment insurance and our 401(k) plan, in each
case on the same basis as other
U.S.-based
salaried employees. We also offer certain perquisites to certain
of our named executive officers.
Our compensation committee has not established any formal
policies or guidelines for allocating compensation between
current and long-term equity incentive compensation or between
cash and non-cash compensation. In determining the amount and
mix of compensation elements and whether each element provides
the correct incentives and rewards for performance consistent
with our short-term and long-term goals and objectives, our
compensation committee relies on its judgment rather than
adopting a formulaic approach to compensatory decisions.
Base
Salary
We provide base salaries to our named executive officers and
other employees to compensate them for services rendered on a
day-to-day
basis during the fiscal year. Base salary also provides
guaranteed cash compensation to secure the services of our
executive talent. The base salaries of our named executive
officers are primarily established annually based on the scope
of their responsibilities, experience, performance and
contributions, taking into account the Radford peer group data
and based upon our compensation committee’s understanding
of compensation paid to similarly situated executives.
Mr. Khan typically recommends base salaries for our named
executive officers other than himself to our compensation
committee for consideration and approval during the first
quarter of each fiscal year. Our compensation committee
considers Mr. Khan’s recommendations with respect to
our named executive officers other than himself but is not
required to follow any of his recommendations and may adjust the
amount of a recommended base salary up or down as it determines
in its discretion. Our compensation committee also determines
Mr. Khan’s base salary during the first quarter of
each fiscal year.
Adjustments are made as necessary to recruit or retain specific
individuals. We may increase the base salary of an executive
officer at any time if a change in the scope of the
executive’s responsibilities, such as promotion, justifies
such consideration. Named executive officer base salaries are
generally set at levels that are proportionately higher than
other managers in our company to recognize their greater role in
our success and additional roles and managerial responsibilities.
We believe that a competitive base salary relative to the
companies with which we compete for executives is a necessary
element of any compensation program that is designed to attract
and retain talented and experienced executives. We also believe
that attractive base salaries can motivate and reward our named
executive officers for their overall performance.
Based on general economic conditions, following its annual
evaluation of base salaries for fiscal 2010 for our named
executive officers, our compensation committee determined not to
increase the base salaries of Messrs. Khan, Burke,
Haberlin, Gammel and Manley, which were $325,000, $235,000,
$265,000, $220,000 and $190,000, respectively, in fiscal 2010.
Annual
Performance-Based Cash Incentive Compensation
We believe that a portion of annual cash compensation for our
named executive officers should be contingent upon successful
company and individual performance. Therefore, our named
executive officers are eligible to receive annual
performance-based cash incentive compensation, referred to as a
performance bonus, which is generally tied to overall company
performance and individual performance. Each named executive
officer has a target performance bonus under his employment
83
agreement, in the case of Mr. Khan, or employment offer
letter, in the case of the other named executive officers, as
follows: Mr. Khan — up to $150,000,
Mr. Burke — up to $75,000,
Mr. Haberlin — up to 50% of his annual base
salary, Mr. Gammel — up to 30% of his annual base
salary and Mr. Manley — up to $60,000. The
targets are subject to the achievement of performance objectives
and are generally earned if the named executive officer exceeds
the performance objectives. Our compensation committee has
discretion to pay performance bonuses that are below, meet or
exceed the targets.
Mr. Khan typically recommends corporate performance
objectives to our compensation committee for approval during the
first quarter of each fiscal year. Corporate performance
objectives vary from year to year and may include performance
relative to certain goals relating to revenue, gross margins,
expenses, inventory turns and product development. In addition
to the corporate performance objectives applicable to our named
executive officers, our named executive officers other than
Mr. Khan submit their own individual performance objectives
for the fiscal year to Mr. Khan for his approval.
Individual performance objectives vary from year to year and may
include performance relative to certain strategic goals and
leadership skills.
At the beginning of the following fiscal year, our compensation
committee typically seeks and considers input from Mr. Khan
regarding the performance of our named executive officers other
than himself in relation to the corporate and individual
performance objectives established for the particular year and
the amount of any performance bonus for those named executive
officers. Our compensation committee reviews the performance of
our company and of our named executive officers and determines
the amount of the performance bonus to be paid to each named
executive officer. Our compensation committee considers
Mr. Khan’s recommendations with respect to our named
executive officers other than himself but is not required to
follow any of his recommendations and may adjust the amount of a
recommended performance bonus up or down as it determines in its
discretion.
Corporate objectives and individual objectives are designed to
focus our named executive officers on individual and team
behaviors that support our overall performance and success.
Individual objectives are based on pre-determined individual or
group goals, which are tailored to gauge the performance of
named executive officers in their respective roles. In general,
actual results against target objectives result in a bonus
payment between 0% and 100% of the target bonus amount. Over
achievement against target objectives can result in a bonus
payment in excess of the targeted bonus amount. Our compensation
committee can, at its sole discretion, vary the payments
depending on factors such as the general economic outlook or
existing market conditions. In general, awards earned will be
payable in cash after the end of the performance period during
which the award was earned, but may also be payable in the form
of an equity award under our equity incentive plan.
Setting corporate and individual performance objectives for
fiscal 2010 was difficult due to the financial downturn that
impacted the semiconductor industry in 2008 and into early 2009.
Our compensation committee considered and approved certain
corporate and individual performance objectives including
revenue and certain other non-GAAP financial targets as well as
other strategic and operational objectives including market
position, new product introductions, customer expansion and
customer and employee satisfaction, receivables and inventory
turns. In addition, Mr. Khan approved individual
performance objectives associated with each named executive
officer’s specific responsibilities. In early fiscal 2011,
the actual performance of each named executive officer against
the target objectives was reviewed by Mr. Khan.
Mr. Khan provided each named executive officer individual
performance reviews and recommended to our compensation
committee the bonus amounts. For Mr. Khan, the compensation
committee reviewed his actual performance against the approved
corporate and individual performance objectives. Based on the
foregoing, our compensation committee determined to award
performance bonuses to our named executive officers for fiscal
2010 as follows: Mr. Khan — $150,000,
Mr. Burke — $75,000,
Mr. Haberlin — $130,000,
Mr. Gammel — $60,000 and
Mr. Manley — $50,000.
84
Long-Term
Equity Incentive Compensation
Long-term equity incentive compensation is an integral part of
our overall compensation program. Providing our named executive
officers with the opportunity to earn compensation through stock
ownership is viewed as a powerful tool to attract and retain
highly qualified executives, to achieve strong long-term stock
price performance and to help align our executives’
interests with our stockholders’ interests. In addition,
the vesting feature of our equity grants contributes to
executive retention because this feature provides an incentive
to our named executive officers to remain in our employ during
the vesting period. These stock based incentives, which have
consisted solely of stock option awards to date, are based on
our compensation committee’s analysis of relevant
compensation information, with the intention of keeping the
overall compensation of our named executive officers, including
the equity component of that compensation, at a competitive
level. We have generally granted stock options to our named
executive officers upon their commencement of employment with us
and periodically thereafter.
To date, we have not had an established set of criteria for
granting equity awards. Instead, the compensation committee
exercised its judgment and discretion, in consultation with our
Chief Executive Officer for awards to named executive officers
other than himself, and considered, among other things, the role
and responsibility of each named executive officer, the market
analyses provided by Radford, his or her past performance,
anticipated future contributions, amount of unvested stock
options held by the named executive officer, the amount of stock
based equity compensation already held by the named executive
officer and the other elements of the named executive
officer’s compensation in approving equity awards. Our
compensation committee also considers the number of shares of
common stock outstanding, the number of shares of common stock
authorized for issuance under its equity compensation plans, the
number and value at various stock prices of stock options and
shares held by the named executive officer for whom an award is
being considered and our compensation objectives and policies
described above. As with the determination of base salaries and
performance bonuses, our compensation committee exercises
subjective judgment and discretion after taking into account the
above criteria.
In 2011, we adopted an equity award grant policy, effective as
of the date of this prospectus, which formalizes how we grant
equity awards to our officers and employees in the future. Under
our equity award grant policy, all grants must be approved by
our board of directors or our compensation committee. All equity
awards will be made at fair market value based on the closing
market price of our common stock on the effective date of grant.
While our current equity incentive plans may permit the granting
of equity awards at any time, our equity award grant policy
provides that we will generally only grant equity awards on a
regularly scheduled basis, as follows:
|
|
|
| |
•
|
grants made in connection with the hiring of a new employee or
promotion of an existing employee will be made effective and
priced on a monthly basis on the first trading day following the
month in which the grant was approved; and
|
| |
| |
•
|
grants made to existing employees, other than in connection with
a promotion will be made, if at all, on an annual basis.
|
The material terms of our 2002 Stock Plan and the material terms
of our 2011 Stock Option and Incentive Plan that will become
effective upon the completion of our initial public offering are
described under “— Benefit Plans” elsewhere
in this prospectus.
Severance and
Change in Control Arrangements
We have severance and change in control arrangements with our
named executive officers Messrs. Khan, Burke, Haberlin, Gammel
and Manley pursuant to which they are entitled to receive
compensation and other benefits in connection with certain
terminations of employment and terminations of employment in
connection with a change in control (or acquisition event, in
the case of Mr. Khan). These arrangements are described in
more detail under “Employment Agreement, Employment Offer
Letters and Change in Control Arrangements” elsewhere in
this prospectus.
85
Our goal in providing certain severance and change in control
benefits is to offer sufficient cash continuity protection such
that our executives will focus their full time and attention on
the requirements of the business rather than the potential
implications for their respective positions. We prefer to have
certainty regarding the potential severance amounts payable to
our named executive officers under certain circumstances, rather
than negotiating severance at the time that a named executive
officer’s employment terminates. We have also determined
that accelerated vesting provisions in connection with certain
acquisition events contained in stock option agreements with our
named executive officers and in our employment agreement with
Mr. Khan in connection with a termination following certain
acquisition events are appropriate because they will encourage
our named executive officers to stay focused in such
circumstances, rather than the potential implications for them.
Other
Benefits
We believe that establishing competitive benefit packages for
our employees is an important factor in attracting and retaining
highly qualified personnel. Our named executive officers are
eligible to participate in all of our employee benefit plans,
such as medical, dental, disability, vision, group life and
accidental death and dismemberment insurance and our 401(k)
plan, in each case on the same basis as other
U.S.-based
salaried employees. We also offer certain perquisites to certain
of our named executive officers. We leased an apartment in Hong
Kong, China for Mr. Haberlin because we required him to
spend a significant amount of time in our Hong Kong office. We
leased an apartment in Andover, Massachusetts for
Messrs. Khan and Gammel because we required them to spend a
significant amount of time at our corporate headquarters.
Tax and
Accounting Considerations
We have provided our named executive officers with a
gross-up or
other reimbursement for tax amounts they might pay pursuant to
Section 280G of the Code. See “Employment Agreement,
Employment Offer Letters and Change in Control
Arrangements” elsewhere in this prospectus.
Section 280G and related Code sections provide that
executive officers, directors who hold significant stockholder
interests and certain other service providers could be subject
to significant additional taxes if they receive payments or
benefits in connection with a change in control of our company
that exceeds certain limits, and that we or our successor could
lose a deduction on the amounts subject to the additional tax.
For our financial statements, cash compensation, such as salary
and bonus, is expensed and for our income tax returns, cash
compensation is generally deductible except as set forth below.
For equity-based compensation, we expense the fair value of such
grants over the vesting period.
Section 162(m) of the Code imposes a $1 million cap on
federal income tax deduction for compensation paid to our Chief
Executive Officer and to certain other highly compensated
officers during any fiscal year unless the compensation is
“performance-based” under Section 162(m). Under a
special Section 162(m) exception, any compensation paid
pursuant to a compensation plan in existence before the
effective date of this initial public offering will not be
subject to the $1 million limitation until the earliest of:
(i) the expiration of the compensation plan, (ii) a
material modification of the compensation plan (as determined
under Section 162(m)), (iii) the issuance of all the
employer stock and other compensation allocated under the
compensation plan, or (iv) the first meeting of
stockholders at which directors are elected after the close of
the third calendar year following the year in which the public
offering occurs. While the compensation committee cannot predict
how the deductibility limit may impact our compensation program
in future years, the compensation committee intends to maintain
an approach to executive compensation that strongly links pay to
performance. In addition, while the compensation committee has
not adopted a formal policy regarding tax deductibility of
compensation paid to our named executive officers, the
accounting and tax treatment of compensation pursuant to
Section 162(m) and other applicable rules is a factor in
determining the amounts of compensation for our named executive
officers.
86
Summary
Compensation Table
The following table reflects the compensation paid during fiscal
2010 to our named executive officers.
SUMMARY
COMPENSATION TABLE
The following table sets forth information about compensation
earned by our chief executive officer, our chief financial
officer and each of our three other most highly compensated
executive officers for fiscal 2010. We refer to these executive
officers in this prospectus as our named executive officers.
| |
|
|
|
|
|
|
|
|
|
|
|
|
|
|
|
|
|
|
|
|
|
|
|
|
|
|
|
|
|
|
|
|
|
|
|
|
Non-Equity
|
|
|
|
|
|
|
|
|
|
|
|
|
|
|
|
|
Option
|
|
|
Incentive Plan
|
|
|
All Other
|
|
|
|
|
Name and Principal
|
|
|
|
|
Salary
|
|
|
Awards
|
|
|
Compensation
|
|
|
Compensation
|
|
|
Total
|
|
|
Position
|
|
Year
|
|
|
($)(1)
|
|
|
($)
|
|
|
($)(2)
|
|
|
($)
|
|
|
($)
|
|
|
|
|
|
|
|
|
|
|
|
|
|
|
|
|
|
|
|
|
|
|
|
|
|
|
|
|
|
|
Sohail A. Khan
|
|
|
2010
|
|
|
|
325,000
|
|
|
|
0
|
|
|
|
150,000
|
|
|
|
25,878
|
(3)
|
|
|
500,878
|
|
|
President and Chief
|
|
|
|
|
|
|
|
|
|
|
|
|
|
|
|
|
|
|
|
|
|
|
|
|
|
Executive Officer
|
|
|
|
|
|
|
|
|
|
|
|
|
|
|
|
|
|
|
|
|
|
|
|
|
|
William H. Burke
|
|
|
2010
|
|
|
|
235,000
|
|
|
|
0
|
|
|
|
75,000
|
|
|
|
300
|
(4)
|
|
|
310,300
|
|
|
Chief Financial Officer,
Treasurer and Secretary
|
|
|
|
|
|
|
|
|
|
|
|
|
|
|
|
|
|
|
|
|
|
|
|
|
|
George W. Haberlin
|
|
|
2010
|
|
|
|
265,000
|
|
|
|
0
|
|
|
|
130,000
|
|
|
|
29,994
|
(5)
|
|
|
424,994
|
|
|
Chief Operating Officer
and Vice President,
Worldwide Sales
|
|
|
|
|
|
|
|
|
|
|
|
|
|
|
|
|
|
|
|
|
|
|
|
|
|
Peter L. Gammel
|
|
|
2010
|
|
|
|
220,000
|
|
|
|
0
|
|
|
|
60,000
|
|
|
|
17,365
|
(6)
|
|
|
297,365
|
|
|
Chief Technology Officer
and Vice President, Engineering
|
|
|
|
|
|
|
|
|
|
|
|
|
|
|
|
|
|
|
|
|
|
|
|
|
|
Alistair P. Manley
|
|
|
2010
|
|
|
|
190,000
|
|
|
|
0
|
|
|
|
50,000
|
|
|
|
7,200
|
(7)
|
|
|
247,200
|
|
|
Vice President, Marketing
|
|
|
|
|
|
|
|
|
|
|
|
|
|
|
|
|
|
|
|
|
|
|
|
|
|
|
|
|
(1)
|
|
Amounts represent the base salaries
earned by our named executive officers in fiscal 2010.
|
|
|
|
|
(2)
|
|
Amounts represent the performance
bonuses earned by our named executive officers in fiscal 2010,
which were paid in fiscal 2011.
|
|
|
|
|
(3)
|
|
Represents payments in the amount
of (a) $12,950 under a lease for an apartment as temporary
accommodation near our principal executive offices in Andover,
Massachusetts, (b) $8,607 under an automobile lease,
(d) $4,321 for reimbursement of travel expenses.
|
|
|
|
|
(4)
|
|
Represents payments for a gym
membership.
|
|
|
|
|
(5)
|
|
Represents payments in the amount
of (a) $23,994 under a lease for an apartment in Hong Kong,
China and (b) $6,000 for reimbursement of automobile
expenses.
|
|
|
|
|
(6)
|
|
Represents payments in the amount
of (a) $12,950 under a lease for an apartment as temporary
accommodation near our principal executive offices in Andover,
Massachusetts and (b) $3,707 for reimbursement of travel
expenses (c) $708 for a gym membership.
|
|
|
|
|
(7)
|
|
Represents payments for
reimbursement of automobile expenses.
|
87
Grants of
Plan-Based Awards
The following table sets forth information regarding grants of
stock option awards during fiscal 2010 to each of our named
executive officers.
GRANTS OF PLAN
BASED AWARDS
| |
|
|
|
|
|
|
|
|
|
|
|
|
|
|
|
|
|
|
|
|
|
|
|
|
|
|
|
|
|
|
|
|
|
|
|
|
|
|
|
|
|
|
|
All Other
|
|
|
|
|
|
|
|
|
|
|
|
|
|
|
|
|
|
|
|
|
|
|
Option
|
|
|
|
|
|
|
|
|
|
|
|
|
|
|
|
|
|
|
|
|
|
|
Awards:
|
|
|
Exercise
|
|
|
Grant Date
|
|
|
|
|
|
|
|
|
|
|
|
|
|
|
|
|
Number of
|
|
|
Price of
|
|
|
Fair Value
|
|
|
|
|
|
|
|
|
|
|
|
|
|
|
|
|
Securities
|
|
|
Option
|
|
|
of Stock
|
|
|
|
|
|
|
|
Estimated Possible Payouts Under Non-Equity Incentive Plan
Awards
|
|
|
Underlying
|
|
|
Award
|
|
|
and Option
|
|
|
|
|
|
|
|
Threshold
|
|
|
Target
|
|
|
Maximum
|
|
|
Options
|
|
|
($ Per
|
|
|
Awards
|
|
|
Name
|
|
Grant Date
|
|
|
($)
|
|
|
($)(1)
|
|
|
($)
|
|
|
(#)
|
|
|
Share)
|
|
|
($)
|
|
|
|
|
Sohail A. Khan
|
|
|
—
|
|
|
|
|
|
|
$
|
150,000
|
|
|
|
|
|
|
|
—
|
|
|
|
—
|
|
|
|
—
|
|
|
William H. Burke
|
|
|
—
|
|
|
|
|
|
|
$
|
75,000
|
|
|
|
|
|
|
|
—
|
|
|
|
—
|
|
|
|
—
|
|
|
George W. Haberlin
|
|
|
|
|
|
|
|
|
|
$
|
132,500
|
|
|
|
|
|
|
|
|
|
|
|
|
|
|
|
|
|
|
Peter L. Gammel
|
|
|
—
|
|
|
|
|
|
|
$
|
66,000
|
|
|
|
|
|
|
|
—
|
|
|
|
—
|
|
|
|
—
|
|
|
Alistair P. Manley
|
|
|
—
|
|
|
|
|
|
|
$
|
60,000
|
|
|
|
|
|
|
|
—
|
|
|
|
—
|
|
|
|
—
|
|
|
|
|
|
(1)
|
|
Represents the target performance
bonus under Mr. Khan’s employment agreement and the
employment offer letters of Messrs. Burke, Haberlin, Gammel
and Manley with respect to fiscal 2010. Actual performance bonus
amounts for fiscal 2010 are reflected in the Non-Equity
Incentive Plan Compensation column of the Summary Compensation
Table elsewhere in this prospectus.
|
88
Outstanding
Equity Awards
The following table sets forth grants of stock options
outstanding on December 31, 2010, the last day of fiscal
2010, to each of our named executive officers.
Outstanding
Equity Awards at 2010 Fiscal Year End
| |
|
|
|
|
|
|
|
|
|
|
|
|
|
|
|
|
|
|
|
Option Awards
|
|
|
|
|
Number of
|
|
|
Number of
|
|
|
|
|
|
|
|
|
|
|
Securities
|
|
|
Securities
|
|
|
|
|
|
|
|
|
|
|
Underlying
|
|
|
Underlying
|
|
|
Option
|
|
|
|
|
|
|
|
Unexercised
|
|
|
Unexercised
|
|
|
Exercise
|
|
|
Option
|
|
|
|
|
Options (#)
|
|
|
Options (#)
|
|
|
Price
|
|
|
Expiration
|
|
|
Name
|
|
Exercisable
|
|
|
Unexercisable
|
|
|
($)
|
|
|
Date(11)
|
|
|
|
|
Sohail A. Khan
|
|
|
5,329,539
|
|
|
|
484,504
|
(1)
|
|
|
0.21
|
|
|
|
11/9/2017
|
|
|
William H. Burke
|
|
|
699,555
|
|
|
|
—
|
(2)
|
|
|
0.21
|
|
|
|
12/27/2017
|
|
|
|
|
|
170,748
|
|
|
|
—
|
(3)
|
|
|
0.21
|
|
|
|
12/27/2017
|
|
|
|
|
|
237,500
|
|
|
|
62,500
|
(4)
|
|
|
0.21
|
|
|
|
7/11/2017
|
|
|
|
|
|
31,250
|
|
|
|
68,750
|
(5)
|
|
|
0.21
|
|
|
|
9/9/2019
|
|
|
George W. Haberlin
|
|
|
621,360
|
|
|
|
—
|
|
|
|
0.21
|
|
|
|
12/27/2017
|
|
|
|
|
|
245,878
|
|
|
|
—
|
(7)
|
|
|
0.21
|
|
|
|
12/27/2017
|
|
|
|
|
|
395,833
|
|
|
|
104,167
|
(4)
|
|
|
0.21
|
|
|
|
7/11/2017
|
|
|
|
|
|
78,125
|
|
|
|
171,875
|
(5)
|
|
|
0.21
|
|
|
|
9/9/2019
|
|
|
Peter L. Gammel
|
|
|
875,000
|
|
|
|
125,000
|
(8)
|
|
|
0.21
|
|
|
|
12/27/2012
|
|
|
|
|
|
395,833
|
|
|
|
104,167
|
(4)
|
|
|
0.21
|
|
|
|
9/17/2017
|
|
|
Alistair P. Manley
|
|
|
96,667
|
|
|
|
—
|
|
|
|
0.21
|
|
|
|
12/27/2017
|
|
|
|
|
|
85,497
|
|
|
|
—
|
(10)
|
|
|
0.21
|
|
|
|
12/27/2017
|
|
|
|
|
|
197,917
|
|
|
|
52,083
|
(4)
|
|
|
0.21
|
|
|
|
9/17/2017
|
|
|
|
|
|
23,438
|
|
|
|
51,563
|
(5)
|
|
|
0.21
|
|
|
|
9/9/2019
|
|
|
|
|
|
(1)
|
|
Represents a stock option award
granted on December 27, 2007 under our 2002 Stock Plan
under which 25% of the shares subject to the award vested on
April 9, 2008, and the remainder of the shares vest monthly
with respect to 1/48th of the total number of shares subject to
the award on a monthly basis thereafter.
|
| |
|
(2)
|
|
Represents a stock option award
granted on December 27, 2007 under our 2002 Stock Plan
under which 335,203 of the shares subject to the award vested on
the grant date, and the remainder of the shares vest monthly
with respect to
1/48th of
the total number of shares subject to the award on a monthly
basis thereafter.
|
| |
|
(3)
|
|
Represents a stock option award
granted on December 27, 2007 under our 2002 Stock Plan
under which 71,145 of the shares subject to the award vested on
the grant date, and the remainder of the shares vest monthly
with respect to
1/48th of
the total number of shares subject to the award on a monthly
basis thereafter.
|
| |
|
(4)
|
|
Represents a stock option award
granted on September 17, 2007 under our 2002 Stock Plan
under which 25% of the shares subject to the award vested on
October 1, 2008, and the remainder of the shares vest
monthly with respect to
1/48th of
the total number of shares subject to the award on a monthly
basis thereafter.
|
| |
|
(5)
|
|
Represents a stock option award
granted on September 9, 2009 under our 2002 Stock Plan
under which the shares subject to the award vest in 48 equal
monthly installments.
|
| |
|
(6)
|
|
Represents a stock option award
granted on December 27, 2007 under our 2002 Stock Plan
under which 388,350 of the shares subject to the award vested on
the grant date, and the remainder of the shares vest monthly
with respect to
1/48th of
the total number of shares subject to the award on a monthly
basis thereafter.
|
| |
|
(7)
|
|
Represents a stock option award
granted on December 27, 2007 under our 2002 Stock Plan
under which 102,449 of the shares subject to the award vested on
the grant date, and the remainder of the shares vest monthly
with respect to
1/48th of
the total number of shares subject to the award on a monthly
basis thereafter.
|
| |
|
(8)
|
|
Represents a stock option award
granted on December 27, 2007 under our 2002 Stock Plan
under which 250,000 of the shares subject to the award vested on
June 1, 2008, and the remainder of the shares vest monthly
with respect to 1/48th of the total number of shares subject to
the award on a monthly basis thereafter.
|
89
|
|
|
|
(9)
|
|
Represents a stock option award
granted on December 27, 2007 under our 2002 Stock Plan
under which 82,570 of the shares subject to the award vested on
the grant date, and the remainder of the shares vest monthly
with respect to
1/48th of
the total number of shares subject to the award on a monthly
basis thereafter.
|
| |
|
(10)
|
|
Represents a stock option award
granted on December 27, 2007 under our 2002 Stock Plan
under which 35,624 of the shares subject to the award vested on
the grant date, and the remainder of the shares vest monthly
with respect to
1/48th of
the total number of shares subject to the award on a monthly
basis thereafter.
|
| |
|
(11)
|
|
On May 7, 2009, our board of
directors voted to extend the term of all outstanding stock
options from 5 years to 10 years. The option
expiration dates reflect the
5-year
extension from the original expiration date of each option.
|
Option Exercises
for Fiscal 2010
Our named executive officers did not exercise any stock options
during fiscal 2010.
Pension
Benefits
None of our named executive officers participates in or has
account balances in qualified or non-qualified defined benefit
plans sponsored by us.
Nonqualified
Deferred Compensation
None of our named executive officers participates in or has
account balances in non-qualified defined contribution plans or
other deferred compensation plans maintained by us.
Employment
Agreement, Employment Offer Letters and Change in Control
Arrangements
We entered into an employment agreement with Mr. Khan in
April 2007 to serve as our President and Chief Executive
Officer. Mr. Khan’s employment agreement was amended
in October 2009. The term of Mr. Khan’s employment
will continue until terminated in accordance with the terms of
the employment agreement. The employment agreement provides for
an initial annual base salary of $325,000, which may be reviewed
annually for increase, but not decrease. Mr. Khan’s
annual base salary may also be reduced to save costs if the
reduction is consistently applied to other of our similarly
situated executives. In addition to Mr. Khan’s annual
base salary, he is eligible to receive a target performance
bonus of $150,000 annually based on achievement of performance
goals, subject to increase from time to time in the discretion
of our board or our compensation committee. Mr. Khan is
also eligible to receive equity grants and was initially granted
an option to purchase 5,814,042 shares of our common stock
upon entering into the employment agreement. The initial option
grant vests 25% on the first anniversary of the date of grant
and the remaining 75% vests monthly thereafter over a
3-year
period, subject to Mr. Khan’s continued employment
with us and acceleration of vesting under certain circumstances.
Mr. Khan’s employment agreement also entitles him to
participate in our benefit plans, to receive three weeks of
vacation per year and to be reimbursed for certain
out-of-pocket,
commuting and relocation expenses. Mr. Khan is subject to
confidentiality obligations and also to non-competition and
non-solicitation covenants for the term of his employment and
for one year after termination of his employment. The employment
agreement also provides for assignment to us of the rights to
certain intellectual property developed during
Mr. Khan’s employment.
Our employment agreement with Mr. Khan provides for the
payment of severance upon the termination of his employment by
us without cause or by Mr. Khan for good reason. If we
terminate Mr. Khan’s employment without cause or
Mr. Khan terminates his employment for good reason,
Mr. Khan is entitled to receive (i) his then current
annual base salary for a period of 12 months,
(ii) continued payments of premiums for medical benefits
for a period of 12 months, (iii) continued vesting of
his then outstanding stock options and restricted stock awards
for a period of 12 months and (iv) a performance bonus
in the amount of Mr. Khan’s target performance bonus
for the applicable award period prorated for the period served
during the award period. In addition, in
90
connection with such termination of employment, Mr. Khan
shall have the right to exercise any vested stock options within
24 months after his last date of employment. Upon
termination of employment as described above and assuming a
termination date of December 31, 2010, Mr. Khan would
have been entitled to receive $325,000 in base salary, continued
payments of premiums for medical benefits in the amount of
$15,103, continued vesting of 484,504 stock options until full
vesting in April 2011 and a performance bonus in the amount of
$150,000.
If we terminate Mr. Khan’s employment without cause or
Mr. Khan terminates his employment for good reason within
12 months following, or not more than 3 months prior
to, an acquisition event relating to our company in which the
consideration received by us or our stockholders is less than
$150 million, Mr. Khan is entitled to receive
(i) 3 times the sum of his aggregate base salary and
performance bonuses during the preceding 12 months to be
paid in 12 equal monthly installments following his termination
and (ii) continued payments of premiums for medical
benefits for a period of 12 months. In accordance with the
amendments made in October 2009 to Mr. Khan’s employment
agreement and incentive stock option agreement, if Mr. Khan is
either employed by our company on the occurrence of an
acquisition event or subject to an involuntary termination
during the 3 month period immediately prior to the closing
of an acquisition event or within 12 months following the
closing of the acquisition event, then all of
Mr. Khan’s stock options shall become fully vested.
Upon termination of employment as described above and assuming a
termination date of December 31, 2010, Mr. Khan would
have been entitled to receive $1,425,000 in base salary and
performance bonus, continued payments of premiums for medical
benefits in the amount of $15,103 and the vesting of
approximately 484,504 stock options. Mr. Khan’s
employment agreement contains a Section 280G cut-back
provision that limits his severance provided under this
paragraph to an amount that will not exceed three times the
“base amount” within the meaning of
Section 280G(b)(3) of the Code and the regulations
promulgated thereunder if such cut-back would result in a
greater amount of after tax proceeds to Mr. Khan. Upon
termination of employment as described above and assuming a
termination date of December 31, 2010, the amount of such
cut-back would have been approximately $227,292.
Our employment agreement with Mr. Khan also provides for
certain payments in the event of Mr. Khan’s death or
disability. Upon his death, Mr. Khan’s estate
and/or
family members is entitled to (i) continued payments of
premiums for medical benefits for a period of 12 months and
(ii) continued vesting of his then outstanding stock
options for a period of 12 months. In the event of his
death and assuming such death occurs on December 31, 2010,
Mr. Khan’s estate would have been entitled to receive
continued payments of premiums for medical benefits in the
amount of $15,103 and the vesting of approximately 484,504 stock
options until April 2011 when fully vested. Upon disability,
Mr. Khan is entitled to receive continued payment of his
base salary and benefits for a period of 6 months. In the
event of his disability and assuming such disability occurs on
December 31, 2010, Mr. Khan would have been entitled
to receive $162,500 in base salary and continued payments of
premiums for medical benefits in the amount of $7,552.
We entered into an employment offer letter with Mr. Burke
in December 2005 to serve as our Chief Financial Officer. The
employment offer letter provides for Mr. Burke’s
employment at-will. The employment offer letter provides for an
initial annual base salary of $225,000. In addition to
Mr. Burke’s annual base salary, he is eligible to
receive a performance bonus of up to $75,000 annually based on
achievement of performance goals. Mr. Burke was initially
granted an option to purchase 695,555 shares of our common
stock upon entering into the employment offer letter. The
initial option grant vests 25% per year over a four-year period.
Mr. Burke’s employment offer letter also entitles him
to participate in our benefit plans and to receive three weeks
of vacation per year. The employment offer letter also requires
Mr. Burke to sign a proprietary information agreement,
which contains confidentiality provisions and provisions
relating to our intellectual property. If we terminate
Mr. Burke’s employment without cause, he is entitled
to receive severance in the amount of 6 months of his base
salary, which would have been in the aggregate amount of
$117,500 if he had been terminated on December 31, 2010. If
we terminate the employment of Mr. Burke without cause one month
prior to, or 12 months following, certain sale events involving
our company, subject to
91
Mr. Burke signing a release and non-solicitation
agreement, Mr. Burke would be entitled to receive (i)
12 months of his base salary to be paid in a lump sum
following his termination of employment, (ii) continued payments
of premiums for medical benefits for a period of 12
months, (iii) a performance bonus based on his target
performance bonus prorated for the period served during the
award period and (iv) full vesting of his then outstanding stock
options, which may be exercised for a period of 12 months
following his termination of employment. In the event that the
payments made to Mr. Burke in connection with a change in
control trigger excise taxes under Section 280G of the Code, we
will pay the first $100,000 of those taxes. Assuming such a
termination of employment had occurred on December 31,
2010, Mr. Burke would have been entitled to receive his
base salary in the amount of $235,000 to be paid in a lump sum;
continued payments of premiums for medical benefits for a period
of 12 months, with a value equal to $15,103; a performance
bonus in the amount of $75,000; and the full vesting of 131,250
unvested stock options.
Under the terms of our stock option award agreements with
Mr. Burke, any stock options held by Mr. Burke that
are unvested upon the occurrence of an acquisition event will
become vested with respect to those options that would have
become vested during the 12 months immediately following
the acquisition event. Assuming an acquisition event had
occurred on December 31, 2010, Mr. Burke’s then
unvested stock options would have become vested with respect to
87,500 stock options.
We entered into an employment offer letter with
Mr. Haberlin in September 2001 to serve as our Vice
President, Sales. The employment offer letter provides for
Mr. Haberlin’s employment at-will. The employment
offer letter provides for an initial annual base salary of
$198,000. In addition to Mr. Haberlin’s annual base
salary, he was eligible to receive a performance bonus of up to
$70,000 in his first year of employment based on achievement of
performance goals. Mr. Haberlin was initially granted an
option to purchase 386,000 shares of our common stock upon
entering into the employment offer letter. The initial option
grant vests 25% per year over a four-year period.
Mr. Haberlin’s employment offer letter also entitles
him to participate in our benefit plans, to 4 weeks of
vacation per year and to a $6,000 annual car allowance. The
employment offer letter also requires Mr. Haberlin to sign
a proprietary information agreement, which contains
confidentiality provisions and provisions relating to our
intellectual property. Upon his promotion to chief operating
officer, we entered into a letter agreement with
Mr. Haberlin in May 2005 which provides for an initial
annual base salary of $250,000. In addition to
Mr. Haberlin’s annual base salary, he is eligible to
receive a performance bonus of up to 50% of his annual base
salary based on achievement of performance goals.
Mr. Haberlin was also granted an option to purchase
1,864,078 shares of our common stock. We entered into a
letter agreement with Mr. Haberlin in January 2007 under
which Mr. Haberlin agrees to spend at least 20 weeks
per year working from our Hong Kong office in order to perform
his role as Chief Operating Officer. If we terminate
Mr. Haberlin’s employment without cause, he is
entitled to receive severance in the amount of 12 months of
his base salary, which would have been in the aggregate amount
of $265,000 if he had been terminated on December 31, 2010.
If we terminate the employment of Mr. Haberlin without
cause one month prior to, or 12 months following, certain sale
events involving our company, subject to Mr. Haberlin
signing a release and non-solicitation agreement,
Mr. Haberlin would be entitled to receive (i) 12 months of
his base salary to be paid in a lump sum following his
termination of employment, (ii) continued payments of premiums
for medical benefits for a period of 12 months, (iii) a
performance bonus based on his target performance bonus prorated
for the period served during the award period and (iv) full
vesting of his then outstanding stock options, which may be
exercised for a period of 12 months following his
termination of employment. In the event that the payments made
to Mr. Haberlin in connection with a change in control
trigger excise taxes under Section 280G of the Code, we will pay
the first $100,000 of those taxes. Assuming such a termination
of employment had occurred on December 31, 2010,
Mr. Haberlin would have been entitled to receive his base
salary in the amount of $265,000 to be paid in a lump sum;
continued payments of premiums for medical benefits for a period
of 12 months, with a value equal to $15,103; a performance
bonus in the amount of $132,500; and the full vesting of 276,042
unvested stock options.
92
Under the terms of our stock option award agreements with
Mr. Haberlin, any stock options held by Mr. Haberlin
that are unvested upon the occurrence of an acquisition event
will become vested with respect to those options that would have
become vested during the 12 months immediately following
the acquisition event. Assuming an acquisition event had
occurred on December 31, 2010, Mr. Haberlin’s
then unvested stock options would have become vested with
respect to 166,667 stock options.
We entered into an employment offer letter with Mr. Gammel
in June 2007, which was amended in December 2008, to serve as
our Chief Technology Officer. The employment offer letter
provides for Mr. Gammel’s employment at-will. The
employment offer letter provides for an initial annual base
salary of $210,000. In addition to Mr. Gammel’s annual
base salary, he is eligible to receive a performance bonus of up
to up to 30% of his annual base salary based on achievement of
performance goals. Mr. Gammel was initially granted an
option to purchase 1,000,000 shares of our common stock.
The initial option grant vests 25% after one year and monthly
thereafter over a
3-year
period. Mr. Gammel’s employment offer letter also
entitles him to participate in our benefit plans, to
3 weeks of vacation per year and to the reimbursement of
certain commuting and relocation expenses. The employment offer
letter also requires Mr. Gammel to sign a proprietary
information agreement, which contains confidentiality provisions
and provisions relating to our intellectual property, and a
non-competition agreement. If we terminate
Mr. Gammel’s employment without cause, he is entitled
to receive severance in the amount of 6 months of his base
salary, which would have been in the aggregate amount of
$105,000 if he had been terminated on December 31, 2010. If
we terminate the employment of Mr. Gammel without cause one
month prior to, or 12 months following, certain sale events
involving our company, subject to Mr. Gammel signing a
release and non-solicitation agreement, Mr. Gammel would be
entitled to receive (i) 12 months of his base salary to be
paid in a lump sum following his termination of employment, (ii)
continued payments of premiums for medical benefits for a period
of 12 months, (iii) a performance bonus based on his
target performance bonus prorated for the period served during
the award period and (iv) full vesting of his then outstanding
stock options, which may be exercised for a period of
12 months following his termination of employment. In the
event that the payments made to Mr. Gammel in connection
with a change in control trigger excise taxes under Section 280G
of the Code, we will pay the first $100,000 of those taxes.
Assuming such a termination of employment had occurred on
December 31, 2010, Mr. Gammel would have been entitled
to receive his base salary in the amount of $220,000 to be paid
in a lump sum; continued payments of premiums for medical
benefits for a period of 12 months, with a value equal to
$15,103; a performance bonus in the amount of $66,000; and the
full vesting of 229,167 unvested stock options.
Under the terms of our stock option award agreements with
Mr. Gammel, any stock options held by Mr. Gammel that
are unvested upon the occurrence of an acquisition event will
become vested with respect to those options that would have
become vested during the 12 months immediately following
the acquisition event. Assuming an acquisition event had
occurred on December 31, 2010, Mr. Gammel’s then
unvested stock options would have become vested with respect to
229,167 stock options.
We entered into an employment offer letter with Mr. Manley
in January 2002 to serve as our Director of Sales in North
America. The employment offer letter provides for an initial
annual base salary of $165,000. In addition to
Mr. Manley’s annual base salary, he is eligible to
receive a performance bonus of up to $50,000 annually based on
achievement of performance goals. Mr. Manley was initially
granted an option to purchase 96,334 shares of our common
stock. The initial option grant vests 25% per year over a
four-year period. Mr. Manley’s employment offer letter
also entitles him to participate in our benefit plans, to
4 weeks of vacation per year and to a $600 monthly car
allowance. The employment offer letter also requires
Mr. Manley to sign a proprietary information agreement,
which contains confidentiality provisions and provisions
relating to our intellectual property. We entered into a letter
agreement with Mr. Manley in June 2007 that provided for
Mr. Manley’s employment as our Vice President,
Marketing, provided that his then current annual base salary of
93
$180,000 be reviewed at Mr. Manley’s next annual
review and provided that Mr. Manley is eligible to receive
a performance bonus of up to $60,000 annually based on
achievement of performance goals. The letter agreement also
provides for relocation expenses of up to $45,000 for
Mr. Manley’s relocation from California to
Massachusetts. If we terminate Mr. Manley’s employment
without cause, at our option, we may provide either written
notice or pay in lieu of notice, plus applicable statutory
severance in accordance with the Employment Standards Act
(Ontario), which would have been in the aggregate amount of
$58,462 if he had been terminated on December 31, 2010. If
we terminate the employment of Mr. Manley without cause one
month prior to, or 12 months following, certain sale events
involving our company, subject to Mr. Manley signing a
release and non-solicitation agreement, Mr. Manley would be
entitled to receive (i) six months of his base salary to be paid
in a lump sum following his termination of employment, (ii)
continued payments of premiums for medical benefits for a period
of six months, (iii) a performance bonus based on his target
performance bonus prorated for the period served during the
award period and (iv) full vesting of his then outstanding stock
options, which may be exercised for a period of six months
following his termination of employment. In the event that the
payments made to Mr. Manley in connection with a change in
control trigger excise taxes under Section 280G of the
Code, we will pay the first $100,000 of those taxes. Assuming
such a termination of employment had occurred on
December 31, 2010, Mr. Manley would have been entitled
to receive base salary in the amount of $95,000 to be paid in a
lump sum; continued payments of premiums for medical benefits
for a period of six months, with a value equal to $7,552; a
performance bonus in the amount of $60,000; and the full vesting
of 103,646 unvested stock options.
Under the terms of our stock option award agreements with
Mr. Manley, any stock options held by Mr. Manley that
are unvested upon the occurrence of an acquisition event will
become vested with respect to those options that would have
become vested during the 12 months immediately following
the acquisition event. Assuming an acquisition event had
occurred on December 31, 2010, Mr. Manley’s then
unvested stock options would have become vested with respect to
70,833 stock options.
2002 Stock
Plan
In addition, pursuant to the terms of certain stock option award
agreements under our 2002 Stock Plan, the stock options granted
to our executive officers that are unvested upon the occurrence
of an acquisition event will become vested with respect to those
options that would have become vested during the 12 months
immediately following the acquisition event.
2011 Stock
Option and Incentive Plan
Under our 2011 Stock Option and Incentive Plan, the vesting of
equity awards granted to our named executive officers may
accelerate in full if not assumed in connection with a sale
event of our company.
Benefit
Plans
Our employees are entitled to participate in various benefit
plans as described below. Our executive officers participate in
our 2011 Stock Option and Incentive Plan, 2002 Stock Plan and
2011 Employee Stock Purchase Plan.
2011 Stock
Option and Incentive Plan
Introduction. Our 2011 Stock Option and
Incentive Plan was adopted by our board of directors and
approved by our stockholders
on ,
2011 and will become effective upon the completion of this
offering. The 2011 Stock Option and Incentive Plan permits us to
make grants of stock options (both incentive stock options and
non-qualified stock options), stock appreciation rights,
restricted stock, restricted stock units, unrestricted stock,
cash-based awards, performance shares and dividend equivalent
rights to our executives, employees, non-employee directors and
consultants.
94
Share Reserve. The available shares under our
2002 Stock Plan, at the time of this offering will be reserved
for the issuance of awards under the 2011 Stock Option and
Incentive Plan. This number is subject to adjustment in the
event of a stock split, stock dividend or other change in our
capitalization. Generally, shares that are forfeited or canceled
from awards under the 2011 Stock Option and Incentive Plan and
the 2002 Stock Plan also will be available for future awards. As
of the date of this prospectus, no awards had been granted under
the 2011 Stock Option and Incentive Plan.
Administration. The 2011 Stock Option and
Incentive Plan is administered by either the board or the
compensation committee of our board of directors (in either
case, the “administrator”). The administrator has full
power and authority to select the participants to whom awards
will be granted, to make any combination of awards to
participants, to accelerate the exercisability or vesting of any
award and to determine the specific terms and conditions of each
award, subject to the provisions of the 2011 Stock Option and
Incentive Plan.
Eligibility. All full-time and part-time
officers, employees, non-employee directors and other key
persons (including consultants and prospective employees) are
eligible to participate in the 2011 Stock Option and Incentive
Plan, subject to the discretion of the administrator. There are
certain limits on the number of awards that may be granted under
the 2011 Stock Option and Incentive Plan. For example, no more
than shares
of common stock may be granted in the form of stock options or
stock appreciation rights to any one individual during any one
calendar year period. The maximum performance-based award
payable to any grantee in a performance cycle
is shares
of common stock or $ if the award
is payable in cash. These limits are intended to comply with
Section 162(m) of the Code and will become effective when
the reliance period for a newly public company ends.
Types of Awards. The types of awards that are
available for grant under the 2011 Stock Option and Incentive
Plan are:
|
|
|
| |
•
|
incentive stock options;
|
| |
| |
•
|
nonstatutory stock options;
|
| |
| |
•
|
stock appreciation rights;
|
| |
| |
•
|
restricted stock awards and units;
|
| |
| |
•
|
unrestricted stock awards;
|
| |
| |
•
|
performance share awards;
|
| |
| |
•
|
cash based awards;
|
| |
| |
•
|
dividend equivalent rights; and
|
| |
| |
•
|
combinations of the above awards.
|
The exercise price of stock options awarded under the 2011 Stock
Option and Incentive Plan may not be less than the fair market
value of our common stock on the date of the option grant and
the term of each option may not exceed ten years from the date
of grant. The administrator will determine at what time or times
each option may be exercised and, subject to the provisions of
the 2011 Stock Option and Incentive Plan, the period of time, if
any, after retirement, death, disability or other termination of
employment during which options may be exercised. To qualify as
incentive stock options, stock options must meet additional
federal tax requirements, including a $100,000 limit on the
value of shares subject to incentive options which first become
exercisable in any one calendar year, and a shorter term and
higher minimum exercise price in the case of certain large
stockholders.
95
Stock appreciation rights allow the recipient to receive the
appreciation in the fair market value of our common stock
between the exercise date and the date of grant. The
administrator determines the terms of stock appreciation rights.
Restricted stock awards are shares of our common stock that vest
in accordance with terms and conditions established by the
administrator. The administrator may also award restricted stock
units, which entitle the participant to receive one share of
common stock at the time the unit vests. The administrator may
impose whatever conditions to vesting it determines to be
appropriate. For example, the administrator may set restrictions
based on the achievement of specific performance goals. Shares
of restricted stock that do not vest are subject to our right of
repurchase or forfeiture. The administrator will determine the
number of shares of restricted stock or restricted stock units
granted to any employee. Our 2011 Stock Option and Incentive
Plan also gives the administrator discretion to grant stock
awards free of any restrictions.
Performance share awards are awards entitling the grantee to
receive shares of our common stock upon the attainment of
performance goals.
Dividend equivalent rights are awards entitling the grantee to
current or deferred payments equal to dividends on a specified
number of shares of stock. Dividend equivalent rights may be
settled in cash or shares and are subject to other conditions as
the administrator shall determine.
In connection with performance-based awards (other than stock
options or stock appreciation rights) that are intended to
satisfy the requirements of Section 162(m) of the Code,
each eligible participant’s stock or cash award will be
based on one or more pre-established performance targets
determined in the discretion of the administrator. Each
cash-based award shall specify a cash-denominated payment
amount, formula or payment ranges as determined by the
administrator. Payment, if any, with respect to a cash-based
award may be made in cash or in shares of stock, as the
administrator determines.
Transferability. Unless otherwise determined
by the administrator or provided for in a written agreement
evidencing an award, our 2011 Stock Option and Incentive Plan
does not allow for the transfer of awards and only the recipient
of an award may exercise an award during his or her lifetime.
Change in Control. Except as otherwise
provided by the administrator and evidenced in a particular
award, in the event of a merger, sale or dissolution, or a
similar change in control unless assumed or continued by any
successor entity, all stock options and stock appreciation
rights granted under the 2011 Stock Option and Incentive Plan
will terminate automatically unless the successor entity agrees
to assume the awards. In the event the awards are to be
terminated, the administrator may provide for payment in
exchange for the termination of the awards. Furthermore, at any
time the administrator may provide for the acceleration of
exercisability
and/or
vesting of an award.
Term. Unless earlier terminated by our board
of directors, the 2011 Stock Option and Incentive Plan will
expire on the tenth anniversary of the latest date our
stockholders approved the plan, including any subsequent
amendment or restatement. No awards will be granted under the
2011 Stock Option and Incentive Plan after that date.
Amendment or Termination. Our board of
directors may amend, suspend, or terminate the 2011 Stock Option
and Incentive Plan in any respect at any time, subject to
stockholder approval where such approval is required by
applicable law or stock exchange rules. Further, any material
amendments to the 2011 Stock Option and Incentive Plan will be
subject to approval by our stockholders, including any amendment
that increases the number of shares available for issuance under
the 2011 Stock Option and Incentive Plan or expands the types of
awards available under, the eligibility to participate in, or
the duration of, the plan. No amendment to the 2011 Stock Option
and Incentive Plan may materially impair any of the rights of a
participant under any awards previously granted without his or
her written consent. The administrator may not, without prior
stockholder approval reduce the exercise price of outstanding
stock options or stock appreciation rights or effect
96
repricing through cancellation and re-grants or cancellation of
stock options or stock appreciation rights in exchange for cash.
2002 Stock
Plan
Introduction. Our 2002 Stock Plan was adopted
by our board of directors on January 21, 2003, effective
December 20, 2002, and approved by our stockholders. The
2002 Stock Plan was amended and restated by our board of
directors on August 20, 2004 and subsequently amended by
our board of directors on February 17, 2006, April 5,
2007, April 24, 2007, May 7, 2009 and March 1,
2011. The 2002 Stock Plan permits us to make grants of
non-qualified stock options, stock purchase authorizations and
stock bonus awards to our executives, employees, non-employee
directors and consultants. Incentive stock options may also be
granted to our executives and employees. As of December 31,
2010, stock options to purchase an aggregate of
19,863,355 shares of our common stock were outstanding
under the 2002 Stock Plan, and 659,863 shares of our common
stock remained available for future grant under the terms of the
2002 Stock Plan.
In the event that any outstanding awards under the 2002 Stock
Plan are cancelled, forfeited or otherwise terminated without
being exercised, the number of shares underlying such award
becomes available for grant under the 2011 Stock Option and
Incentive Plan. Until May 7, 2009, options granted under
this plan expired five years after the date of grant. On
May 7, 2009, our board of directors voted to extend the
term of all outstanding stock options from five years to ten
years. All options granted under this plan on and after
May 7, 2009 expire ten years after the date of grant.
Effective upon the adoption of our 2011 Stock Option and
Incentive Plan, our board of directors decided not to grant any
further awards under our 2002 Stock Plan.
Share Reserve. There were
29,133,104 shares authorized under our 2002 Stock Plan as
of March 1, 2011. This number is subject to adjustment in
the event of a stock split, stock dividend or other change in
our capitalization. The available shares under our 2002 Stock
Plan at the time of this offering will be reserved for the
issuance of awards under the 2011 Stock Option and Incentive
Plan. Generally, shares that are forfeited or canceled from
awards under the 2011 Stock Option and Incentive Plan and our
2002 Stock Plan also will be available for future awards. As of
the date of this prospectus, no shares had been granted under
the 2011 Stock Option and Incentive Plan.
Administration. The 2002 Stock Plan is
administered by either our board of directors or a committee of
our board of directors (in all cases, the
“administrator”). The administrator has full power and
authority to select the participants to whom awards will be
granted, to make any combination of awards to participants, to
accelerate the exercisability or vesting of any award and to
determine the specific terms and conditions of each award,
subject to the provisions of the 2002 Stock Plan.
Eligibility. All of our employees, directors,
consultants and other contributors are eligible to participate
in the 2002 Stock Plan, subject to the discretion of the
administrator.
Types of Awards. The types of awards that are
available for grant under the 2002 Stock Plan are:
|
|
|
| |
•
|
incentive stock options;
|
| |
| |
•
|
nonstatutory stock options;
|
| |
| |
•
|
purchase authorizations;
|
| |
| |
•
|
stock bonus awards; and
|
| |
| |
•
|
any combination of the above awards.
|
The exercise price of stock options awarded under the 2002 Stock
Plan may not be less than the fair market value of our common
stock on the date of the option grant and the term of each
option may not exceed ten years from the date of grant. The
administrator will determine at what time or
97
times each stock option may be exercised and, subject to the
provisions of the 2002 Stock Plan, the period of time, if any,
after retirement, resignation, death, disability or other
termination of employment during which options may be exercised.
To qualify as incentive stock options, stock options must meet
additional federal tax requirements, including a $100,000 limit
on the value of shares subject to incentive options which first
become exercisable in any one calendar year, and a shorter term
and higher minimum exercise price in the case of certain large
stockholders. The exercise price of any non-qualified stock
option granted under a purchase authorization may not be less
than 85% of the fair market value of our common stock on the
date of the purchase authorization grant.
Transferability. Unless otherwise determined
by the administrator or provided for in a written agreement
evidencing an award, our 2002 Stock Plan does not permit the
transfer of stock options or purchase authorizations except in
the event of death and only the recipient of a stock option or
purchase authorization may exercise an award during the
recipient’s lifetime.
Repurchase of Shares. Shares of our common
stock acquired upon exercise of a stock option or under a
purchase authorization or stock bonus and any gain realized upon
exercise of any stock option may be subject to repurchase by, or
forfeiture to, at the discretion of our board of directors if
the applicable award agreement provides for the repurchase.
Change in Control. Except as otherwise
provided by the administrator and evidenced in a particular
award, in the event of a merger or consolidation, sale of all or
substantially all of our assets or capital stock or a similar
change in control, the administrator or the successor entity may
assume outstanding awards, provide that the awards must be
exercised within a specified period of time or terminate the
awards in exchange for a cash payment. Furthermore, subject to
certain limitations, the administrator may provide for the
acceleration of exercisability
and/or
vesting of an award.
Term. Unless earlier terminated by our board
of directors, the 2002 Stock Plan will expire on
December 20, 2012. No awards may be granted under the 2002
Stock Plan after the expiration date.
Amendment or Termination. The administrator
may amend, suspend, or terminate the 2002 Stock Plan in any
respect at any time, subject to stockholder approval where such
approval is required by applicable law or stock exchange rules.
Further, any material amendments to the 2002 Stock Plan will be
subject to approval by our stockholders, including any amendment
that increases the number of shares available for issuance under
the 2002 Stock Plan or expands the types of awards available
under, the eligibility to participate in, or the duration of,
the plan. No amendment to the 2002 Stock Plan may materially
impair any of the rights of a participant under any awards
previously granted without his or her written consent.
2011 Employee
Stock Purchase Plan
Our 2011 Employee Stock Purchase Plan was adopted by our board
of directors and approved by our stockholders
on ,
2011 and will become effective upon completion of this offering.
Our 2011 Employee Stock Purchase Plan authorizes the issuance of
up to a total
of shares
of our common stock to participating employees.
All of our employees and employees of our designated
subsidiaries who have been employed by us for at least
90 days and whose customary employment is for more than
20 hours a week are eligible to participate in our 2011
Employee Stock Purchase Plan.
We will make one or more offerings each year to our employees to
purchase stock under our 2011 Employee Stock Purchase Plan. The
first offering will begin on the date of the completion of this
offering and will end on June 30, 2011. Subsequent
offerings will usually begin on each July 1 and
January 1 and will continue for six-month periods, referred
to as offering periods. Each employee eligible to participate on
the date of the completion of this offering will automatically
be deemed to be a participant in the initial offering period.
98
Each employee who is a participant in our 2011 Employee Stock
Purchase Plan may purchase shares by authorizing payroll
deductions of up to 10% of his or her base compensation during
an offering period. Unless the participating employee has
previously withdrawn from the offering, his or her accumulated
payroll deductions will be used to purchase common stock on the
last business day of the offering period at a price equal to 85%
of the fair market value of the common stock on the first
business day or the last business day of the offering period,
whichever is lower, provided that no more than 5,000 shares
of common stock may be purchased by any one employee during each
offering period. Under applicable tax rules, an employee may
purchase no more than $25,000 worth of common stock, valued at
the start of the purchase period, under our 2011 Employee Stock
Purchase Plan in any calendar year.
The accumulated payroll deductions of any employee who is not a
participant on the last day of an offering period will be
refunded. An employee’s rights under our 2011 Employee
Stock Purchase Plan terminate upon voluntary withdrawal from the
plan or when the employee ceases employment for any reason.
Following a Participant’s voluntary withdrawal, we will
promptly refund such individual’s entire account balance
under the 2011 Employee Stock Purchase Plan.
Our 2011 Employee Stock Purchase Plan may be terminated or
amended by our board of directors at any time with certain
exceptions, such as when an amendment is to increase the number
of shares available under the 2011 Employee Stock Purchase Plan.
An amendment that increases the number of shares of our common
stock that is authorized under our 2011 Employee Stock Purchase
Plan and certain other amendments require the approval of our
stockholders.
401(k)
Plan
We maintain a tax-qualified retirement plan that provides all
U.S. eligible employees with an opportunity to save for
retirement on a tax-advantaged basis. Under the 401(k) plan,
participants may elect to defer a portion of their compensation
on a pre-tax basis and have it contributed to the plan subject
to applicable annual Code limits. Pre-tax contributions are
allocated to each participant’s individual account and are
then invested in selected investment alternatives according to
the participants’ directions. Employee elective deferrals
are 100% vested at all times. The 401(k) plan allows for
matching contributions to be made by us, but currently there is
no company matching under the 401(k) plan. As a tax-qualified
retirement plan, contributions to the 401(k) plan and earnings
on those contributions are not taxable to the employees until
distributed from the 401(k) plan and all contributions are
deductible by us when made. Our
non-U.S. employees
are eligible to participate in plans that are comparable to our
401(k) plan.
Compensation Risk
Assessment
We have reviewed our compensation policies and practices for all
employees and concluded that these policies and programs are not
designed to be reasonably likely to have a material adverse
effect on our company. The compensation committee believes that
the mix and design of the elements of executive compensation do
not encourage our named executive officers to assume excessive
risks. The compensation committee reviewed the elements of
executive compensation to determine whether any portion of
executive compensation encouraged excessive risk taking and
concluded:
|
|
|
| |
•
|
our allocation of compensation between cash compensation and
long-term equity compensation, combined with our typically
48-month
vesting schedule, discourages short-term risk taking;
|
| |
| |
•
|
our approach of goal setting, setting of targets with payouts at
multiple levels of performance, capping the amount of our
incentive payouts, and evaluation of performance results assist
in mitigating excessive risk-taking;
|
99
|
|
|
| |
•
|
our compensation decisions include subjective considerations,
which restrain the influence of formulae or objective factors on
excessive risk taking; and
|
| |
| |
•
|
our business does not face the same level of risks associated
with compensation for employees at financial services (traders
and instruments with a high degree of risk).
|
Director
Compensation
We do not pay any compensation for serving on our board of
directors to any employee directors. Accordingly, Mr. Khan
does not receive additional compensation for his services as a
member of our board of directors. On June 19, 2007, we
granted options to purchase 485,000 shares of our common
stock to Mr. Shlapak, which, after the December 2007
modification of terms by our board of directors, have an
exercise price of $0.21 per share and which vest over a period
of four years. In the event of a change in control, these stock
options would fully vest. In addition, Mr. Shlapak is
eligible for a bonus at the sole discretion of our board of
directors if we achieve annual revenue of at least
$160 million with a profit of at least 10% within four
years of June 19, 2007. On February 16, 2011, we
granted to each of Messrs. Shlapak and DiPietro options to
purchase 20,000 and 60,000, respectively, shares of our common
stock, which have an exercise price of $1.75 per share and which
vest over a period of four years.
We reimburse all non-employee directors for their reasonable
out-of-pocket
expenses incurred in attending meetings of our board of
directors or any committees thereof.
We did not pay any compensation to the members of our board of
directors for serving as directors during fiscal 2010.
Limitation of
Liability and Indemnification Arrangements
As permitted by the Delaware General Corporation Law, we intend
to adopt provisions in our amended and restated certificate of
incorporation and amended and restated by-laws, which will
become effective upon the completion of this offering, that
limit or eliminate the personal liability of our directors.
Consequently, a director will not be personally liable to us or
our stockholders for monetary damages for breach of fiduciary
duty as a director, except for liability for:
|
|
|
| |
•
|
any breach of the director’s duty of loyalty to us or our
stockholders;
|
| |
| |
•
|
any act or omission not in good faith or that involves
intentional misconduct or a knowing violation of law;
|
| |
| |
•
|
any unlawful payments related to dividends or unlawful stock
repurchases, redemptions or other distributions; or
|
| |
| |
•
|
any transaction from which the director derived an improper
personal benefit.
|
These limitations of liability do not alter director liability
under the federal securities laws and do not affect the
availability of equitable remedies such as an injunction or
rescission.
In addition, our amended and restated by-laws, which will become
effective upon the completion of this offering, provide that:
|
|
|
| |
•
|
we will indemnify our directors, officers and, in the discretion
of our board of directors, certain employees to the fullest
extent permitted by the Delaware General Corporation
Law; and
|
| |
| |
•
|
advance expenses, including attorneys’ fees, to our
directors and, in the discretion of our board of directors, to
our officers and certain employees, in connection with legal
proceedings, subject to limited exceptions.
|
100
We have also entered into indemnification agreements with each
of our directors. These agreements provide that we will
indemnify each of our directors to the fullest extent permitted
by the Delaware General Corporation Law and advance expenses to
each indemnitee in connection with any proceeding in which
indemnification is available.
We also maintain general liability insurance to provide
insurance coverage to our directors and officers for losses
arising out of claims based on acts or omissions in their
capacities as directors or officers, including liabilities under
the Securities Act. Insofar as indemnification for liabilities
arising under the Securities Act may be permitted to directors,
officers, or persons controlling the registrant pursuant to the
foregoing provisions, we have been informed that in the opinion
of the Securities and Exchange Commission such indemnification
is against public policy as expressed in the Securities Act and
is therefore unenforceable.
These provisions may discourage stockholders from bringing a
lawsuit against our directors in the future for any breach of
their fiduciary duty. These provisions may also have the effect
of reducing the likelihood of derivative litigation against
directors and officers, even though such an action, if
successful, might otherwise benefit us and our stockholders.
Furthermore, a stockholder’s investment may be adversely
affected to the extent we pay the costs of settlement and damage
awards against directors, officers and certain employees
pursuant to these indemnification provisions. We believe that
these provisions, the indemnification agreements and the
insurance are necessary to attract and retain talented and
experienced directors and officers.
At present, there is no pending litigation or proceeding
involving any of our directors, officers or employees in which
indemnification will be required or permitted. We are not aware
of any threatened litigation or proceeding that might result in
a claim for such indemnification.
101
CERTAIN
RELATIONSHIPS AND RELATED PARTY TRANSACTIONS
Other than the compensation agreements and other arrangements
described under “Compensation Discussion and Analysis”
in this prospectus and the transactions described below, since
January 1, 2008, there has not been and there is not
currently proposed, any transaction or series of similar
transactions to which we were or will be a party in which the
amount involved exceeded or will exceed $120,000 and in which
any director, executive officer, holder of five percent or more
of any class of our capital stock or any member of the immediate
family of, or entities affiliated with, any of them, had or will
have a direct or indirect material interest.
In connection with this offering, we have adopted a written
policy that requires all future transactions between us and any
director, executive officer, holder of five percent or more of
any class of our capital stock or any member of the immediate
family of, or entities affiliated with, any of them, or any
other related persons (as defined in Item 404 of
Regulation S-K)
or their affiliates, in which the amount involved is equal to or
greater than $120,000, be approved in advance by our audit
committee. In approving or rejecting any such request for
advance approval, our audit committee is to consider the
relevant facts and circumstances available and deemed relevant
to the audit committee, including, but not limited to, the
extent of the related party’s interest in the transaction,
and whether the transaction is on terms no less favorable to us
than terms we could have generally obtained from an unaffiliated
third party under the same or similar circumstances.
All of the transactions described below were entered into prior
to the adoption of this written policy, but each was approved or
ratified by a majority of our board of directors. We believe
that we have executed all of the transactions set forth below on
terms no less favorable to us than we could have obtained from
unaffiliated third parties.
Recapitalization
and Private Placements of Securities
In May 2007, we consummated a recapitalization in which the then
outstanding shares of our Series A Preferred Stock,
Series B Preferred Stock, Series C Preferred Stock and
Series D Preferred Stock converted into shares of our
common stock and the then outstanding Class A Exchangeable
Shares, Class B Exchangeable Shares, Class C
Exchangeable Shares and Class D Exchangeable Shares of SiGe
Canada converted into common exchangeable shares of SiGe Canada.
Immediately after the conversion, the as-converted shares of our
common stock underwent a
1-for-3
reverse stock split and the as-converted common exchangeable
shares of SiGe Canada underwent a
1-for-3
reverse stock split, in each case on May 7, 2007.
In May 2007 and in connection with this recapitalization, we
issued and sold an aggregate of 10,564,018 shares of our
preferred stock for an aggregate purchase price of $10,916,856,
and SiGe Canada issued and sold an aggregate of 2,602,006
preferred exchangeable shares for an aggregate purchase price of
$2,688,913. In addition, we issued and sold in a rights offering
an aggregate of 3,720,560 shares of our preferred stock for
an aggregate purchase price of $3,844,827, and SiGe Canada
issued and sold in a rights offering an aggregate of 2,467,007
preferred exchangeable shares for an aggregate purchase price of
$2,549,405. The preferred exchangeable shares of SiGe Canada are
convertible into shares of our preferred stock on a 1 for 1
basis subject to anti-dilution adjustments. The recapitalization
was effected under a stock purchase agreement we entered into
with SiGe Canada and the stockholders named in the agreement.
Shares of our preferred stock and of SiGe Canada’s
preferred exchangeable shares were purchased by certain of our
stockholders holding 5% or more of our then outstanding capital
stock in the following amounts and for the following purchase
prices:
|
|
|
| |
•
|
Prism Venture Partners IV, L.P. purchased 2,779,599 shares
of our preferred stock for an aggregate price of $2,872,438;
|
| |
| |
•
|
3i Technology Partners L.P. purchased 1,857,716 shares of
our preferred stock for an aggregate price of $1,919,764;
|
102
|
|
|
| |
•
|
TD Capital Group Limited purchased 2,055,984 shares of our
preferred stock at an aggregate purchase price of
$2,124,654; and
|
| |
| |
•
|
affiliates of The VenGrowth Investment Fund Inc. purchased
2,602,006 preferred exchangeable shares for an aggregate price
of $2,688,913.
|
In addition, Prism Venture Partners IV, L.P. purchased
560,652 shares of our preferred stock at an aggregate price
of $579,378 in the rights offering. SVIC No. 4 New
Technology Business Investment L.L.P., an affiliate of Samsung
Ventures Investment Corporation, of which Mr. Byun, a
member of our board of directors, was a managing director,
purchased 3,870,719 shares of our preferred stock for an
aggregate price of $4,000,001.
The purpose of the recapitalization was to modify and simplify
the capital structure of the company in order to attract
additional financing for the company. We believe that the
recapitalization was successful in attracting the additional
financing that we received in connection with our issuance of
preferred stock and SiGe Canada’s issuance of preferred
exchangeable shares in May 2007.
In connection with the stock purchase agreement, the parties
also entered into an amended and restated investor rights
agreement, or investor rights agreement, and an amended and
restated stockholders agreement, or stockholders agreement, as
described below.
Investor
Rights Agreement
We entered into an amended and restated investor rights
agreement in May 2007 with the investors that participated in
the recapitalization and private placements described under
“— Recapitalization and Private Placements of
Securities,” including Prism Venture Partners IV, L.P., 3i
Technology Partners L.P., TD Capital Group Limited, Toronto
Dominion Investments, Inc., affiliates of The VenGrowth
Investment Fund Inc. and SVIC No. 4 New Technology
Business Investment L.L.P. The agreement provides for
registration rights with respect to certain shares of our common
stock, including shares of our common stock into which the
shares of our preferred stock sold in the recapitalization and
private placements described above are convertible. The
agreement provides that the holders party to the agreement have
the right to demand that we file a registration statement or
request that their shares be covered by a registration statement
that we are otherwise filing. See “Description of Capital
Stock — Registration Rights” in this prospectus.
This investor rights agreement will automatically terminate upon
completion of this offering, except for the provisions relating
to registration rights, provided that the price per share of our
common stock to the public in this offering is at least $2.5835
and the gross proceeds to us from this offering are at least
$30 million.
Stockholders
Agreement
We also entered into a stockholders agreement with the investors
in the recapitalization and private placements described under
“— Recapitalization and Private Placements of
Securities,” including Prism Venture Partners IV, L.P., 3i
Technology Partners L.P., TD Capital Group Limited, Toronto
Dominion Investments, Inc., affiliates of The VenGrowth
Investment Fund Inc. and SVIC No. 4 New Technology
Business Investment L.L.P. The agreement provides for certain
rights relating to the election of nominees to our board of
directors. The agreement also provides us and the investors
party to the agreement with certain rights of first refusal and
provides the investors with certain co-sale and drag-along
rights in the event the other investors party to the agreement
seek to sell their shares. The stockholders agreement will
automatically terminate upon completion of this offering
provided that the price per share of our common stock to the
public in this offering is at least $2.5835 and the gross
proceeds to us from this offering are at least $30 million.
103
Transactions with
our Executive Officers and Directors
Employment
Agreement, Employment Offer Letters and Change in Control
Arrangements
We have an employment agreement with Mr. Khan and
employment offer letters with Messrs. Burke, Haberlin,
Gammel and Manley, which provide for certain salary, bonus,
stock option and severance compensation. For more information
regarding these agreements, see “Employment Agreement,
Employment Offer Letters and Change in Control
Arrangements” elsewhere in this prospectus.
Indemnification
of Officers and Directors
Upon completion of this offering, our amended and restated
certificate of incorporation and amended and restated by-laws
will provide that we will indemnify each of our directors and
executive officers to the fullest extent permitted by Delaware
law. In addition, we have entered into indemnification
agreements with each of our directors, which will become
effective upon the completion of this offering, providing for
indemnification against expenses and liabilities reasonably
incurred in connection with their service for us on our behalf.
For more information regarding these agreements, see
“Compensation Discussion and Analysis —
Limitation of Liability and Indemnification Arrangements”
in this prospectus.
Stock Option
Awards
For information regarding stock options granted to our executive
officers and directors, see “Compensation Discussion and
Analysis — Elements of Compensation” and
“Compensation Discussion and Analysis — Director
Compensation.”
Product Sales to
Samsung Electro-Mechanics America, Inc. and Samsung
Electro-Mechanics (Thailand) Co., Ltd.
In fiscal 2008, we sold products to Samsung Electro-Mechanics
America, Inc. and Samsung Electro-Mechanics (Thailand) Co., Ltd.
in the aggregate amount of $174,750. Mr. Byun, a member of
our board of directors, was a managing director of Samsung
Ventures Investment Corporation, an affiliate of Samsung
Electro-Mechanics America, Inc. and Samsung Electro-Mechanics
(Thailand) Co., Ltd.
104
PRINCIPAL AND
SELLING STOCKHOLDERS
The table below presents information concerning the beneficial
ownership of shares of our common stock as of March 1, 2011
by:
|
|
|
| |
•
|
each person we know to be the beneficial owner of 5% or more of
our outstanding shares of common stock;
|
| |
| |
•
|
each of our named executive officers;
|
| |
| |
•
|
each of our directors;
|
| |
| |
•
|
all of our executive officers and directors as a group; and
|
| |
| |
•
|
each of the selling stockholders.
|
We have determined beneficial ownership in accordance with
Securities and Exchange Commission rules. The information does
not necessarily indicate beneficial ownership for any other
purpose. Under these rules, a person is deemed to be a
beneficial owner of our common stock if that person has a right
to acquire ownership within 60 days by the exercise of
vested options or the conversion of our preferred stock. A
person is also deemed to be a beneficial holder of our common
stock if that person has or shares voting power, which includes
the power to vote or direct the voting of our common stock, or
investment power, which includes the power to dispose of or to
direct the disposition of such common stock. Except in cases
where community property laws apply or as indicated in the
footnotes to this table, we believe that each stockholder
identified in the table possesses sole voting and investment
power over all shares of common stock shown as beneficially
owned by the stockholder.
In the table below, percentage of beneficial ownership prior to
this offering is presented based on 78,999,688 shares of
common stock deemed to be outstanding as of March 1, 2011,
and percentage of beneficial ownership subsequent to this
offering in the table below is presented based
on shares
of common stock deemed to be outstanding as of March 1,
2011, in each case giving effect to (1) the issuance of an
aggregate of 14,167,285 shares of our common stock issuable
upon the automatic exchange of all of the outstanding common
exchangeable shares of SiGe Canada in connection with this
offering, as described in “Description of Capital
Stock — Exchangeable Shares” elsewhere in this
prospectus; (2) the automatic conversion of all outstanding
shares of our preferred stock, including all shares of our
preferred stock issued in exchange for all of the outstanding
preferred exchangeable shares of SiGe Canada, into an aggregate
of 19,353,591 shares of our common stock in connection with
this offering, as described in “Description of Capital
Stock — Exchangeable Shares” elsewhere in this
prospectus; and
(3) shares
of our common stock to be newly issued and sold by us in this
offering. Shares of our common stock subject to options that are
currently exercisable or exercisable within 60 days of
March 1, 2011 are considered outstanding and beneficially
owned by the person holding the options for the purpose of
computing the percentage ownership of that person, but are not
treated as outstanding for the purpose of computing the
percentage ownership of any other person. Unless indicated
below, the address of each individual listed below is
c/o SiGe
Semiconductor, Inc., 200 Brickstone Square, Suite 203,
Andover, Massachusetts 01810.
105
| |
|
|
|
|
|
|
|
|
|
|
|
|
|
|
|
|
|
|
|
|
|
|
|
|
|
|
|
|
|
|
|
|
|
|
|
|
|
|
|
|
|
|
|
|
Shares
|
|
|
Percentage of Shares
|
|
|
|
|
|
|
|
|
|
|
|
|
|
Beneficially Owned
|
|
|
Beneficially Owned
|
|
|
|
|
|
|
|
|
|
|
|
|
|
|
|
|
After this
|
|
|
|
|
|
|
|
|
After this
|
|
|
|
|
Shares
|
|
|
|
|
|
|
|
|
|
|
|
Offering,
|
|
|
|
|
|
|
|
|
Offering,
|
|
|
|
|
Beneficially
|
|
|
|
|
|
|
|
|
|
|
|
Assuming
|
|
|
|
|
|
|
|
|
Assuming
|
|
|
|
|
Owned
|
|
|
|
|
|
Shares
|
|
|
|
|
|
Underwriters’
|
|
|
|
|
|
|
|
|
Underwriters’
|
|
|
|
|
Prior to
|
|
|
Shares
|
|
|
Subject to
|
|
|
After
|
|
|
Option
|
|
|
Prior to
|
|
|
After
|
|
|
Option
|
|
|
|
|
this
|
|
|
Being
|
|
|
Underwriters’
|
|
|
this
|
|
|
Exercised
|
|
|
this
|
|
|
this
|
|
|
Exercised
|
|
|
|
|
Offering
|
|
|
Offered
|
|
|
Option
|
|
|
Offering
|
|
|
in Full
|
|
|
Offering
|
|
|
Offering
|
|
|
in Full
|
|
|
|
|
5% Stockholders
|
|
|
|
|
|
|
|
|
|
|
|
|
|
|
|
|
|
|
|
|
|
|
|
|
|
|
|
|
|
|
|
|
|
|
|
|
|
|
|
|
|
|
|
|
|
|
|
|
|
|
|
|
|
|
|
|
|
|
|
|
|
|
|
|
|
|
|
Prism Venture Partners IV, L.P.
(1)
|
|
|
18,762,647
|
|
|
|
|
|
|
|
|
|
|
|
|
|
|
|
|
|
|
|
23.8
|
%
|
|
|
|
|
|
|
|
|
|
The VenGrowth Investment Fund Inc. and affiliated entities
(2)
|
|
|
12,379,289
|
|
|
|
|
|
|
|
|
|
|
|
|
|
|
|
|
|
|
|
15.7
|
%
|
|
|
|
|
|
|
|
|
|
W Capital Partners II, L.P.
(3)
|
|
|
9,348,437
|
|
|
|
|
|
|
|
|
|
|
|
|
|
|
|
|
|
|
|
11.8
|
%
|
|
|
|
|
|
|
|
|
|
Toronto Dominion (New York) LLC
(4)
|
|
|
5,200,817
|
|
|
|
|
|
|
|
|
|
|
|
|
|
|
|
|
|
|
|
6.6
|
%
|
|
|
|
|
|
|
|
|
|
Caisse de dépôt et placement du Québec
(5)
|
|
|
4,699,461
|
|
|
|
|
|
|
|
|
|
|
|
|
|
|
|
|
|
|
|
6.0
|
%
|
|
|
|
|
|
|
|
|
|
TD Capital Group
Limited (6)
|
|
|
4,580,725
|
|
|
|
|
|
|
|
|
|
|
|
|
|
|
|
|
|
|
|
5.8
|
%
|
|
|
|
|
|
|
|
|
|
|
|
|
|
|
|
|
|
|
|
|
|
|
|
|
|
|
|
|
|
|
|
|
|
|
|
|
|
|
|
|
|
|
|
Executive Officers and Directors
|
|
|
|
|
|
|
|
|
|
|
|
|
|
|
|
|
|
|
|
|
|
|
|
|
|
|
|
|
|
|
|
|
|
Sohail A. Khan
(7)
|
|
|
5,814,042
|
|
|
|
|
|
|
|
|
|
|
|
|
|
|
|
|
|
|
|
6.9
|
%
|
|
|
|
|
|
|
|
|
|
William H. Burke
(8)
|
|
|
1,172,386
|
|
|
|
|
|
|
|
|
|
|
|
|
|
|
|
|
|
|
|
1.5
|
%
|
|
|
|
|
|
|
|
|
|
George W. Haberlin
(9)
|
|
|
1,798,696
|
|
|
|
|
|
|
|
|
|
|
|
|
|
|
|
|
|
|
|
2.2
|
%
|
|
|
|
|
|
|
|
|
|
Peter L. Gammel
(10)
|
|
|
1,395,833
|
|
|
|
|
|
|
|
|
|
|
|
|
|
|
|
|
|
|
|
1.7
|
%
|
|
|
|
|
|
|
|
|
|
Alistair P. Manley
(11)
|
|
|
526,936
|
|
|
|
|
|
|
|
|
|
|
|
|
|
|
|
|
|
|
|
*
|
|
|
|
|
|
|
|
|
|
|
Morris C. Tan
(12)
|
|
|
523,001
|
|
|
|
|
|
|
|
|
|
|
|
|
|
|
|
|
|
|
|
*
|
|
|
|
|
|
|
|
|
|
|
John Brewer, Jr.
(13)
|
|
|
319,792
|
|
|
|
|
|
|
|
|
|
|
|
|
|
|
|
|
|
|
|
*
|
|
|
|
|
|
|
|
|
|
|
Theodore Shlapak
(14)
|
|
|
456,354
|
|
|
|
|
|
|
|
|
|
|
|
|
|
|
|
|
|
|
|
*
|
|
|
|
|
|
|
|
|
|
|
Bill Byun
(15)
|
|
|
4,334,428
|
|
|
|
|
|
|
|
|
|
|
|
|
|
|
|
|
|
|
|
4.9
|
%
|
|
|
|
|
|
|
|
|
|
Patrick DiPietro
(16)
|
|
|
5,000
|
|
|
|
|
|
|
|
|
|
|
|
|
|
|
|
|
|
|
|
*
|
|
|
|
|
|
|
|
|
|
|
Matthew S. Engel
(17)
|
|
|
—
|
|
|
|
|
|
|
|
|
|
|
|
|
|
|
|
|
|
|
|
*
|
|
|
|
|
|
|
|
|
|
|
All executive officers and directors as a group
(11 persons)
(18)
|
|
|
16,346,468
|
|
|
|
|
|
|
|
|
|
|
|
|
|
|
|
|
|
|
|
18.0
|
%
|
|
|
|
|
|
|
|
|
|
|
|
|
|
|
|
|
|
|
|
|
|
|
|
|
|
|
|
|
|
|
|
|
|
|
|
|
|
|
|
|
|
|
|
Other Selling Stockholders as a Group
|
|
|
|
|
|
|
|
|
|
|
|
|
|
|
|
|
|
|
|
|
|
|
|
|
|
|
|
|
|
|
|
|
|
|
|
|
*
|
|
Indicates beneficial ownership of
less than one percent.
|
|
|
|
|
(1)
|
|
Prism Venture Partners IV, LLC is
the general partner of Prism Investment Partners IV, L.P., which
is the general partner of Prism Venture Partners IV, L.P. Prism
Venture Partners IV, LLC and Prism Investment Partners IV, L.P.
are beneficial owners of more than 5% of our voting securities.
Steven J. Benson is a managing member of Prism Venture Partners
IV, LLC and may be deemed to have sole voting and investment
power over such shares. Mr. Engel, a member of our board of
directors, is affiliated with Prism Venture Partners IV, LLC.
Each of Messrs. Benson and Engel disclaims beneficial ownership
of all such shares, except to the extent of his pecuniary
interest therein. The address of Prism Venture Partners IV, L.P.
is 117 Kendrick Street, Suite 200, Needham, Massachusetts
02494.
|
|
|
|
|
(2)
|
|
Includes 5,924,773 shares held
by The VenGrowth Investment Fund Inc.,
6,332,091 shares held by The VenGrowth II Investment
Fund Inc. and 122,425 shares held by The
VenGrowth III Investment Fund Inc. Each of The
VenGrowth Investment Fund Inc., The VenGrowth II
Investment Fund Inc. and The VenGrowth III Investment
Fund Inc. is a widely held mutual fund. No person owns more
than 1% of the outstanding Class A Shares of any of such
mutual funds. Michael Cohen, Allen Lupyrypa and A. David
Ferguson are senior officers and directors of each of such
mutual funds and may be deemed to share voting and investment
power over the shares of our company held by such mutual funds.
Each of Messrs. Cohen, Lupyrypa and Ferguson disclaims
beneficial ownership of the securities except to the extent of
any pecuniary interest therein. The address of The VenGrowth
Investment Fund Inc., The VenGrowth II Investment
Fund Inc. and VenGrowth III Investment Fund Inc.
is 105 Adelaide Street, Suite 1000, Toronto, Ontario M5H
1P9 Canada.
|
106
|
|
|
|
(3)
|
|
The sole general partner of W
Capital Partners II, L.P. is WCP GP II, L.P., and the sole
general partner of WCP GP II, L.P. is WCP GP II, LLC. The
managing members of WCP GP II, LLC exercise voting and
investment power over securities held by W Capital Partners II,
L.P. The managing members of WCP GP II, LLC are Stephen
Wertheimer, David Wachter and Robert Migliorino, each of whom
disclaims beneficial ownership of the securities held by W
Capital Partners II, L.P., except to the extent of any pecuniary
interest therein. The address of W Capital Partners II, L.P. is
One East 52nd Street, 5th Floor, New York, NY 10022.
|
| |
|
(4)
|
|
Toronto Dominion (New York) LLC is
a subsidiary of The Toronto-Dominion Bank. Each of Linda
Dougherty and Rick Greene has voting power over the shares of
our company held by Toronto Dominion (New York) LLC with respect
to voting on matters deemed in the ordinary course of business.
Bob Dorrance, as a member of an investment committee, with input
from Mark Chauvin and Riaz Ahmed, as the other members of such
investment committee, has voting power over such shares with
respect to matters deemed outside the ordinary course of
business and has dispositive power over such shares. Each of
Linda Dougherty, Rick Greene, Bob Dorrance, Mark Chauvin and
Riaz Ahmed disclaims beneficial ownership of the securities
except to the extent of any pecuniary interest therein. The
address of Toronto Dominion (New York) LLC is 31 West
52nd Street, New York, New York 10019.
|
|
|
|
|
(5)
|
|
Caisse de dépôt et
placement du Québec is a non-governmental legal entity
without share capital created under law by the Legislature of
the Province of Quebec. An investment committee comprised of
Nomand Provost, Luc Houle, Dominique Boies, Robert
Côté, Pierre Fortier, Marcel Gagnon, Mario Therrien
and Cyrille Vittecoq has voting and investment power over the
shares of our company held by Caisse de dépôt et
placement du Québec. Each investment committee member
disclaims beneficial ownership of the securities except to the
extent of any pecuniary interest therein. The address of Caisse
de dépôt et placement du Québec is 1000, place
Jean-Paul-Riopelle, Montréal, Québec Canada H2Z 2B3.
|
|
|
|
|
(6)
|
|
TD Capital Group Limited is a
subsidiary of The Toronto-Dominion Bank. Each of Linda Dougherty
and Rick Greene has voting power over the shares of our company
held by TD Capital Group Limited with respect to voting on
matters deemed in the ordinary course of business. Bob Dorrance,
as a member of an investment committee, with input from Mark
Chauvin and Riaz Ahmed, as the other members of such investment
committee, has voting power over such shares with respect to
matters deemed outside the ordinary course of business and has
dispositive power over such shares. Each of Linda Dougherty,
Rick Greene, Bob Dorrance, Mark Chauvin and Riaz Ahmed disclaims
beneficial ownership of the securities except to the extent of
any pecuniary interest therein. The address of TD Capital Group
Limited is 66 Wellington Street W., 10th Floor,
PO Box 1, TD Bank Tower, Toronto, ON M5K 1A2 Canada.
|
|
|
|
|
(7)
|
|
Consists of 5,814,042 shares
issuable upon exercise of options held by Mr. Khan that may
be exercised within 60 days of March 1, 2011.
|
|
|
|
|
(8)
|
|
Consists of 1,172,386 shares
issuable upon exercise of options held by Mr. Burke that
may be exercised within 60 days of March 1, 2011.
|
|
|
|
|
(9)
|
|
Includes 1,798,696 shares
issuable upon exercise of options held by Mr. Haberlin that
may be exercised within 60 days of March 1, 2011.
|
|
|
|
|
(10)
|
|
Consists of 1,395,833 shares
issuable upon exercise of options held by Mr. Gammel that
may be exercised within 60 days of March 1, 2011.
|
|
|
|
|
(11)
|
|
Includes 526,936 shares
issuable upon exercise of options held by Mr. Manley that
may be exercised within 60 days of March 1, 2011.
|
|
|
|
|
(12)
|
|
Consists of 523,001 shares
issuable upon exercise of options held by Mr. Tan that may
be exercised within 60 days of March 1, 2011.
|
|
|
|
|
(13)
|
|
Consists of 319,792 shares
issuable upon exercise of options held by Mr. Brewer that
may be exercised within 60 days of March 1, 2011.
|
|
|
|
|
(14)
|
|
Consists of 456,354 shares
issuable upon exercise of options held by Mr. Shlapak that
may be exercised within 60 days of March 1, 2011.
|
|
|
|
|
(15)
|
|
Mr. Byun is a general partner
of 7 Capital LLC, which is the general partner of Emerging
Technology I, L.P. Emerging Technology I, L.P. owns
the reported shares, and Mr. Byun may be deemed to share
voting and investment power over such shares. Mr. Byun
disclaims beneficial ownership of the securities except to the
extent of any pecuniary interest therein.
|
|
|
|
|
(16)
|
|
Consists of 5,000 shares
issuable upon exercise of options held by Mr. DiPietro that
may be exercised within 60 days of March 1, 2011.
|
|
|
|
|
(17)
|
|
Mr. Engel is affiliated with
Prism Venture Partners IV, LLC, the general partner of Prism
Investment Partners IV, L.P. Mr. Engel disclaims beneficial
ownership of all such shares, except to the extent of his
pecuniary interest therein. See note 1 above.
|
|
|
|
|
(18)
|
|
Includes 12,012,040 shares
issuable upon exercise of options held by Messrs. Khan,
Burke, Haberlin, Gammel, Manley, Tan, Brewer, DiPietro and
Shlapak that may be exercised within 60 days of
March 1, 2011.
|
107
DESCRIPTION OF
CAPITAL STOCK
Upon the completion of this offering, our authorized capital
stock will consist
of shares
of common
stock, par value $0.0001 per share,
and shares
of preferred stock, par value $0.0001 per share, and there will
be shares
of common stock outstanding and no shares of preferred stock
outstanding. As of March 1, 2011, we had approximately 232
record holders of our capital stock. All of the outstanding
common exchangeable shares of SiGe Canada will be automatically
exchanged for shares of our common stock in connection with this
offering. In addition, all of the outstanding shares of our
preferred stock, including all shares of our preferred stock
issued in exchange for all of the outstanding preferred
exchangeable shares of SiGe Canada, will automatically convert
into shares of our common stock in connection with this
offering. In addition, upon completion of this offering, options
to
purchase shares
of our common stock will be outstanding
and shares
of our common stock will be reserved for future grants under our
2011 Stock Option and Incentive Plan. Upon completion of this
offering, our 2011 Employee Stock Purchase Plan will authorize
the issuance of up to a total
of shares
of our common stock to participating employees.
The following description of our capital stock and provisions of
our amended and restated certificate of incorporation and
amended and restated by-laws are summaries of material terms and
provisions and are qualified by reference to our amended and
restated certificate of incorporation and amended and restated
by-laws, copies of which have been filed with the Securities and
Exchange Commission as exhibits to the registration statement of
which this prospectus is a part. The descriptions of our common
stock and preferred stock reflect the provisions of our amended
and restated certificate of incorporation and amended and
restated by-laws that will become effective upon the completion
of this offering.
Common
Stock
Upon the completion of this offering, we will be authorized to
issue one class of common stock. Holders of our common stock are
entitled to one vote for each share of common stock held of
record for the election of directors and on all matters
submitted to a vote of stockholders. Holders of our common stock
are entitled to receive dividends ratably, if any, as may be
declared by our board of directors out of legally available
funds, subject to any preferential dividend rights of any
preferred stock then outstanding. Upon our dissolution,
liquidation or winding up, holders of our common stock are
entitled to share ratably in our net assets legally available
after the payment of all our debts and other liabilities,
subject to the preferential rights of any preferred stock then
outstanding. Holders of our common stock have no preemptive,
subscription, redemption or conversion rights. The rights,
preferences and privileges of holders of common stock are
subject to, and may be adversely affected by, the rights of the
holders of shares of any series of preferred stock that we may
designate and issue in the future. Except as described under
“— Antitakeover Effects of Applicable Law and
Provisions of our Amended and Restated Certificate of
Incorporation and Amended and Restated By-laws” below, a
majority vote of the holders of common stock is generally
required to take action under our amended and restated
certificate of incorporation and amended and restated by-laws.
Preferred
Stock
Upon the completion of this offering, our board of directors
will be authorized, without action by the stockholders, to
designate and issue up to an aggregate
of shares
of preferred stock in one or more series. Our board of directors
can designate the rights, preferences and privileges of the
shares of each series and any of its qualifications, limitations
or restrictions. Our board of directors may authorize the
issuance of preferred stock with voting or conversion rights
that could adversely affect the voting power or other rights of
the holders of common stock. The issuance of preferred stock,
while providing flexibility in connection with possible future
financings and acquisitions and other corporate purposes, could,
under certain circumstances, have the effect of restricting
dividends on our common stock, diluting the voting power of our
common stock, impairing the liquidation rights
108
of our common stock, or delaying, deferring or preventing a
change in control of our company, which might harm the market
price of our common stock. See also
“— Antitakeover Effects of Applicable Law and
Provisions of our Amended and Restated Certificate of
Incorporation and Amended and Restated By-laws —
Provisions of our Amended and Restated Certificate of
Incorporation and Amended and Restated By-laws —
Undesignated Preferred Stock” below.
Our board of directors will make any determination to issue such
shares based on its judgment as to our company’s best
interests and the best interests of our stockholders. Upon the
completion of this offering, we will have no shares of preferred
stock outstanding and we have no current plans to issue any
shares of preferred stock.
Exchangeable
Shares
Certain of our stockholders hold common exchangeable shares
and/or
preferred exchangeable shares of SiGe Canada. These exchangeable
shares enable Canadian resident holders to defer the imposition
of certain taxes under Canadian law until such time as they
elect to exchange their common exchangeable shares for shares of
our common stock
and/or
exchange their preferred exchangeable shares for shares of our
preferred stock.
In connection with this offering, each common exchangeable share
of SiGe Canada will automatically be exchanged for one share of
our common stock, plus any declared and unpaid dividend, and
each preferred exchangeable share of SiGe Canada will
automatically be exchanged for one share of our preferred stock,
plus any declared and unpaid dividend. Any shares of our
preferred stock outstanding immediately prior to this offering,
including the shares of our preferred stock issued in exchange
for preferred exchangeable shares, will automatically convert
into shares of our common stock on a
one-for-one
basis, subject to anti-dilution adjustments, in connection with
this offering, provided that the price per share of our common
stock to the public in this offering is at least $2.5835 and the
gross proceeds to us from this offering are at least
$30 million.
Registration
Rights
In connection with the private placements of our preferred stock
described under “Certain Relationships and Related Party
Transactions — Recapitalization and Private Placements
of Securities” in this prospectus, we entered into an
amended and restated investor rights agreement with investors
participating in our May 2007 recapitalization and private
placements, which provides for registration rights with respect
to certain shares of our common stock, including shares of our
common stock into which the shares of our preferred stock sold
in such transactions are convertible. The summary of the
registration rights below is qualified by reference to the
amended and restated investor rights agreement, a copy of which
is attached as an exhibit to the registration statement of which
this prospectus is a part.
Demand
Registration Rights
After the completion of this offering, the holders of
approximately shares
of our common stock will be entitled to certain demand
registration rights. If the holders of at least 25% of the
registrable securities then outstanding request a registration,
we may be required to register their shares. In addition, if the
holders of less than the aforementioned 25% make such a request
and the registrable securities for which registration is
requested have a reasonably anticipated aggregate price to the
public of at least $5,000,000, we may be required to register
their shares. After the expiration of a
180-day
period following the completion of this offering, certain
holders have the right to make two requests that we register all
or a portion of their shares of our common stock.
Piggyback
Registration Rights
After the completion of this offering, in the event that we
propose to register any of our securities under the Securities
Act, either for our own account or for the account of other
stockholders, the
109
holders of
approximately shares
of our common stock will be entitled to certain
“piggyback” registration rights allowing the holders
to include their shares in such registration, subject to certain
marketing and other limitations. As a result, whenever we
propose to file a registration statement under the Securities
Act, other than with respect to a registration related to an
initial public offering or employee benefit plans, the holders
of these shares of our common stock are entitled to notice of
the registration and have the right, subject to limitations that
the underwriters may impose on the number of shares included in
the registration, to include their shares in the registration.
Form S-3
Registration Rights
After the completion of this offering, the holders of
approximately shares
of our common stock will be entitled to certain
Form S-3
registration rights. If the holders of at least 30% of the
registrable securities then outstanding request a registration
having a reasonably anticipated aggregate price to the public of
at least $1,000,000, we may be required to register their shares
if we are eligible to use a
Form S-3
registration statement. These holders may make an unlimited
number of requests for registration on a
Form S-3
registration statement, but we will not be required to register
their shares on a
Form S-3
registration statement if we have previously effected two such
registrations in any
12-month
period.
We will pay certain registration expenses of the holders of the
shares registered pursuant to any demand, piggyback and
Form S-3
registrations described above.
Canadian
Prospectus Requirements
In connection with an initial public offering, unless waived and
subject to certain exceptions, Canadian resident holders of at
least 20% in interest of the registrable securities may request
that we concurrently file a prospectus in Canada.
Antitakeover
Effects of Applicable Law and Provisions of our Amended and
Restated Certificate of Incorporation and Amended and Restated
By-laws
Certain provisions of the Delaware General Corporation Law and
applicable Canadian securities law, as well as certain
provisions of our amended and restated certificate of
incorporation and amended and restated by-laws, which will
become effective upon the completion of this offering, could
have the effect of delaying, deferring or discouraging another
party from acquiring control of us. These provisions, which are
summarized below, are expected to discourage certain types of
coercive takeover practices and inadequate takeover bids and, as
a consequence, they might also inhibit temporary fluctuations in
the market price of our common stock that often result from
actual or rumored hostile takeover attempts. These provisions
are also designed in part to encourage anyone seeking to acquire
control of us to first negotiate with our board of directors.
These provisions might also have the effect of preventing
changes in our management. It is possible that these provisions
could make it more difficult to accomplish transactions that
stockholders might otherwise deem to be in their best interests.
However, we believe that the advantages gained by protecting our
ability to negotiate with any unsolicited and potentially
unfriendly acquirer outweigh the disadvantages of discouraging
such proposals, including those priced above the then-current
market value of our common stock, because, among other reasons,
the negotiation of such proposals could improve their terms.
Delaware
Takeover Statute
We are subject to the provisions of Section 203 of the
Delaware General Corporation Law. In general, Section 203
prohibits a publicly held Delaware corporation from engaging in
a “business combination” with an “interested
stockholder” for a three-year period following the time
that this stockholder becomes an interested stockholder, unless
the business combination is approved in a prescribed manner. A
“business combination” includes, among other things, a
merger, asset or stock
110
sale or other transaction resulting in a financial benefit to
the interested stockholder. An “interested
stockholder” is a person who, together with affiliates and
associates, owns, or did own within three years prior to the
time of determination of interested stockholder status, 15% or
more of the corporation’s outstanding voting stock. Under
Section 203, a business combination between a corporation
and an interested stockholder is prohibited unless it satisfies
one of the following conditions:
|
|
|
| |
•
|
before the time the stockholder became interested, the board of
directors approved either the business combination or the
transaction which resulted in the stockholder becoming an
interested stockholder;
|
| |
| |
•
|
upon consummation of the transaction which resulted in the
stockholder becoming an interested stockholder, the interested
stockholder owned at least 85% of the voting stock of the
corporation outstanding at the time the transaction commenced,
excluding for purposes of determining the voting stock
outstanding, shares owned by persons who are directors and also
officers, and employee stock plans, in some instances; or
|
| |
| |
•
|
at or after the time the stockholder became interested, the
business combination was approved by the board of directors of
the corporation and authorized at an annual or special meeting
of the stockholders by the affirmative vote of at least
two-thirds of the outstanding voting stock which is not owned by
the interested stockholder.
|
Summary of
Applicable Canadian Take-over Bid Regulations
Although we are incorporated in Delaware and will, after the
completion of this offering, be regulated by the Securities and
Exchange Commission, in the event of an attempted take-over of
our company, we may also become subject to certain Canadian
securities laws pertaining to take-over bids as a result of the
percentage of ownership of our shares by Canadian residents.
Assuming the take-over bid offer is made to Canadian residents
on terms at least as favorable as the terms that apply to the
rest of the holders of the class of securities that is the
subject of the bid, take-over bid rules in Canada require,
regardless of percentage of ownership of our shares of common
stock by Canadian residents, the offeror to send the bid and a
take-over bid circular to each of our security holders resident
in Canada and also require the public dissemination of
information with respect to the bid. Additional Canadian formal
take-over bid requirements will also apply to any attempted
take-over of our company unless, among other conditions:
|
|
|
| |
•
|
security holders whose last address as shown on our books is in
Canada (“Identifiable Canadian Residents”) hold less
than 10% of the outstanding securities of the class subject to
the bid at the commencement of the bid; and
|
| |
| |
•
|
the offeror reasonably believes that security holders in Canada
beneficially own less than 10% of the outstanding securities of
the class subject to the bid at the commencement of the bid.
|
As of March 1, 2011, we believe approximately 37.5% of our
stock was owned by Identifiable Canadian Residents.
If the conditions listed above are not satisfied, additional
Canadian regulations governing take-over bids will apply. The
exact nature of the additional applicable Canadian regulation
will generally depend on the level of Canadian ownership of
securities of the class that are the subject of the bid:
Less than 20% Canadian Ownership: If less than
20% of each class of our securities that is the subject of the
bid is held by Identifiable Canadian Residents, National
Instrument
71-101 - The
Multijurisdictional Disclosure System of the Canadian Securities
Administrators, or the MJDS Instrument, will, if all of the
provisions of the instrument are satisfied, allow take-over bid
circulars and directors’ circulars filed in the United
States to be used to satisfy Canadian take-over bid circular and
directors’ circular requirements, and will exempt any
offeror and our directors from many other aspects of Canadian
take-over bid regulation.
111
Between 20% and 40% Canadian Ownership: If
between 20% and 40% of the class of our securities that is the
subject of the bid is held by Identifiable Canadian Residents,
the MJDS Instrument will, if all of the provisions of the
instrument are satisfied, allow take-over bid circulars and
directors’ circulars filed in the United States to be used
to satisfy Canadian take-over bid circular and directors’
circular requirements. However, other aspects of Canadian
take-over regulation will apply. For example, the take-over will
be subject to Canadian pre-bid integration rules that may
restrict acquisitions of securities by the offeror preceding a
formal take-over bid. In addition, a take-over bid by certain
insiders (including holders of more than 10% of the class of our
securities that is the subject of the bid) will also be subject
to Multilateral Instrument
61-101 —
Protection of Minority Security Holders in Special Transactions
of the Canadian Securities Administrators, or MI
61-101,
which generally requires, among other things, a formal third
party valuation that complies with MI
61-101 in
order for the transaction to proceed.
More than 40% Canadian Ownership: If more than
40% of any class of securities that is the subject of the bid is
held by Identifiable Canadian Residents, the full Canadian
take-over bid regime will apply, including rules that require a
prospective acquirer to have, at the time of the bid, adequate
arrangements to ensure that funds will be available for
securities deposited under the bid.
Compliance with Canadian take-over bid regulations may make it
more difficult for a third party, including an insider, to
acquire our company or could increase the cost of acquiring our
company, whether or not the acquisition is desired by, or
beneficial to, our stockholders.
Provisions of
our Amended and Restated Certificate of Incorporation and
Amended and Restated By-laws
Our amended and restated certificate of incorporation and
amended and restated by-laws, each of which will become
effective upon the completion of this offering, will include a
number of provisions that may have the effect of delaying,
deferring or discouraging another party from acquiring control
of us and encouraging persons considering unsolicited tender
offers or other unilateral takeover proposals to negotiate with
our board of directors rather than pursue non-negotiated
takeover attempts. These provisions include the items described
below.
Board composition and filling vacancies. In
accordance with our amended and restated certificate of
incorporation, our board is divided into three classes serving
staggered three-year terms, with one class being elected each
year. Our amended and restated certificate of incorporation also
provides that directors may be removed only for cause and then
only by the affirmative vote of the holders of 75% or more of
the shares then entitled to vote at an election of directors.
Furthermore, any vacancy on our board of directors, however
occurring, including a vacancy resulting from an increase in the
size of our board, may only be filled by the affirmative vote of
a majority of our directors then in office even if less than a
quorum.
No written consent of stockholders. Our
amended and restated certificate of incorporation provides that
all stockholder actions are required to be taken by a vote of
the stockholders at an annual or special meeting, and that
stockholders may not take any action by written consent in lieu
of a meeting. This limit may lengthen the amount of time
required to take stockholder actions and would prevent the
amendment of our by-laws or removal of directors by our
stockholder without holding a meeting of stockholders.
Meetings of stockholders. Our amended and
restated by-laws provide that only a majority of the members of
our board of directors then in office may call special meetings
of stockholders and only those matters set forth in the notice
of the special meeting may be considered or acted upon at a
special meeting of stockholders. Our by-laws limit the business
that may be conducted at an annual meeting of stockholders to
those matters properly brought before the meeting.
Advance notice requirements. Our amended and
restated by-laws establish advance notice procedures with regard
to stockholder proposals relating to the nomination of
candidates for election
112
as directors or new business to be brought before meetings of
our stockholders. These procedures provide that notice of
stockholder proposals must be timely given in writing to our
corporate secretary prior to the meeting at which the action is
to be taken. Generally, to be timely, notice must be received at
our principal executive offices not less than 90 days or
more than 120 days prior to the first anniversary date of
the annual meeting for the preceding year. The notice must
contain certain information specified in our amended and
restated by-laws.
Amendment to certificate of incorporation and
by-laws. As required by the Delaware General
Corporation Law, any amendment of our amended and restated
certificate of incorporation must first be approved by a
majority of our board of directors, and if required by law or
our amended and restated certificate of incorporation, must
thereafter be approved by a majority of the outstanding shares
entitled to vote on the amendment, and a majority of the
outstanding shares of each class entitled to vote thereon as a
class. The amendment of the provisions in our amended and
restated certificate of incorporation relating to stockholder
action, directors, the authority of our board of directors to
issue preferred stock, limitation of liability and the amendment
of our amended and restated certificate of incorporation must be
approved by not less than 75% of the outstanding shares of our
capital stock entitled to vote on the amendment, and not less
than 75% of the outstanding shares of each class entitled to
vote thereon as a class, or, if the board of directors
recommends that the stockholders approve the amendment, by the
affirmative vote of the majority of the outstanding shares of
our capital stock entitled to vote on the amendment. Our amended
and restated by-laws may be amended by the affirmative vote of a
majority of the directors then in office, subject to any
limitations set forth in the by-laws, and may also be amended by
the affirmative vote of at least 75% of the outstanding shares
of our capital stock entitled to vote on the amendment, or, if
the board of directors recommends that the stockholders approve
the amendment, by the affirmative vote of the majority of the
outstanding shares entitled to vote on the amendment, in each
case voting together as a single class.
Undesignated preferred stock. Our amended and
restated certificate of incorporation provides for
authorized shares
of preferred stock. The existence of authorized but unissued
shares of preferred stock may enable our board of directors to
render more difficult or to discourage an attempt to obtain
control of us by means of a merger, tender offer, proxy contest
or otherwise. For example, if in the due exercise of its
fiduciary obligations, our board of directors were to determine
that a takeover proposal is not in the best interests of us or
our stockholders, our board of directors could cause shares of
preferred stock to be issued without stockholder approval in one
or more private offerings or other transactions that might
dilute the voting or other rights of the proposed acquirer or
insurgent stockholder or stockholder group. In this regard, our
amended and restated certificate of incorporation grants our
board of directors broad power to establish the rights and
preferences of authorized and unissued shares of preferred
stock. The issuance of shares of preferred stock could decrease
the amount of earnings and assets available for distribution to
holders of shares of common stock. The issuance may also
adversely affect the rights and powers, including voting rights,
of these holders and may have the effect of delaying, deterring
or preventing a change in control of our company.
Transfer Agent
and Registrar
We intend for the transfer agent and registrar for our common
stock to
be .
address
is ,
and its telephone number
is .
Listing
We have applied to have our common stock listed on the NASDAQ
Global Market under the symbol “SIGE.”
113
SHARES ELIGIBLE
FOR FUTURE SALE
Prior to this offering, there has been no public market for our
common stock. Future sales of our common stock in the public
market, or the availability of such shares for sale in the
public market, could adversely affect market prices prevailing
from time to time. As described below, only a limited number of
shares will be available for sale shortly after this offering
due to contractual and legal restrictions on resale.
Nevertheless, sales of our common stock in the public market
after such restrictions lapse, or the perception that those
sales may occur, could adversely affect the prevailing market
price at such time and our ability to raise equity capital in
the future.
Based on 78,999,688 shares of common stock outstanding as
of March 1, 2011, upon completion of this
offering, shares
of common stock will be outstanding,
or shares
of common stock assuming the underwriters exercise their option
in full, in each case giving effect to
(1) shares
of our common stock to be newly issued and sold by us in this
offering; (2) the issuance of an aggregate of
14,167,285 shares of our common stock issuable upon the
automatic exchange of all of the outstanding common exchangeable
shares of SiGe Canada, as described in “Description of
Capital Stock — Exchangeable Shares” elsewhere in
this prospectus; and (3) the automatic conversion of
all outstanding shares of our preferred stock, including all
shares of our preferred stock issued in exchange for all of the
outstanding preferred exchangeable shares of SiGe Canada, into
an aggregate of 19,353,591 shares of our common stock in
connection with this offering, as described in “Description
of Capital Stock — Exchangeable Shares” elsewhere
in this prospectus. All of the shares sold in this offering will
be freely tradable for U.S. securities law purposes unless
purchased by our affiliates. The
remaining shares
of common stock outstanding after this offering will be
restricted as a result of securities laws or
lock-up
agreements as described below. Following the expiration of the
lock-up
period, all shares will be eligible for resale in compliance
with Rule 144 or Rule 701 under the Securities Act.
“Restricted securities” as defined under Rule 144
of the Securities Act were issued and sold by us in reliance on
exemptions from the registration requirements of the Securities
Act. These shares may be sold in the public market only if
registered or pursuant to an exemption from registration, such
as Rule 144 or Rule 701 under the Securities Act.
Rule 144
In general, under Rule 144 under the Securities Act, as in
effect on the date of this prospectus, a person who is one of
our affiliates and has beneficially owned shares of our common
stock for at least six months would be entitled to sell within
any three-month period a number of shares that does not exceed
the greater of:
|
|
|
| |
•
|
one percent of the number of shares of common stock then
outstanding, which will equal
approximately shares
immediately after the completion of this offering; or
|
| |
| |
•
|
the average weekly trading volume of our common stock on the
NASDAQ Global Market during the four calendar weeks preceding
the filing of a notice on Form 144 with respect to the sale.
|
Sales under Rule 144 by our affiliates or persons selling
shares on behalf of our affiliates are also subject to manner of
sale provisions and notice requirements and to the availability
of current public information about us.
In general, under Rule 144 under the Securities Act, as in
effect on the date of this prospectus, a person who is not
deemed to have been one of our affiliates at any time during the
90 days preceding a sale, and who has beneficially owned
the shares proposed to be sold for at least six months,
including the holding period of any prior owner other than an
affiliate, is entitled to sell the shares without complying with
the manner of sale, volume limitation or notice provisions of
Rule 144, and will be subject only to the public
information requirements of Rule 144. If such a person has
beneficially owned the shares proposed to be sold for at least
one year, including the holding period of any prior
114
owner other than our affiliates, then such person is entitled to
sell such shares without complying with any of the requirements
of
Rule 144. shares
of our common stock will qualify for resale under Rule 144
within 180 days of the date of this prospectus, subject to
the lock-up
agreements as described under
“— Lock-up
Agreements” below and under “Underwriting” in
this prospectus, and to the extent such shares have been
released from any repurchase option that we may hold.
Rule 701
Rule 701 under the Securities Act, or Rule 701, as in
effect on the date of this prospectus, permits resales of shares
in reliance upon Rule 144 but without compliance with
certain restrictions of Rule 144, including the holding
period requirement. Most of our employees, executive officers or
directors who purchased shares under a written compensatory plan
or contract may be entitled to rely on the resale provisions of
Rule 701, but all holders of Rule 701 shares are
required to wait until 90 days after the date of this
prospectus before selling their shares. However, substantially
all Rule 701 shares are subject to
lock-up
agreements as described below and under “Underwriting”
in this prospectus and will become eligible for sale upon the
expiration of the restrictions set forth in those agreements.
Lock-up
Agreements
In connection with this offering, we, all of our directors and
executive officers and holders of more
than % of our total outstanding
shares of common stock, including the selling stockholders, have
agreed that, subject to certain exceptions, without the prior
written consent of Barclays Capital Inc. and Deutsche Bank
Securities Inc., we and they will not, during the period ending
180 days after the date of this prospectus (as such period
may be extended under certain circumstances), (1) offer for
sale, sell, pledge or otherwise dispose of any shares of common
stock or any securities convertible into, or exercisable or
exchangeable for, common stock, or, solely in our case, sell or
grant options, rights or warrants with respect to any shares of
common stock or securities convertible or exercisable or
exchangeable for common stock (other than the grant of options
pursuant to compensatory option plans existing on the date of
this prospectus), (2) enter into any swap or other
derivatives transaction that transfers to another, in whole or
in part, any of the economic benefits or risks of ownership of
the common stock, (3) file or cause to be filed a
registration statement with respect to the registration of any
shares of common stock or securities convertible, exercisable or
exchangeable into common stock or any of our other securities,
or (4) publicly disclose the intention to do any of the
foregoing. See “Underwriting —
Lock-Up
Agreements” elsewhere in this prospectus.
The 180-day
restricted period described above will be extended if:
|
|
|
| |
•
|
during the last 17 days of the
180-day
restricted period we issue an earnings release or material news
or a material event relating to us occurs; or
|
| |
| |
•
|
prior to the expiration of the
180-day
restricted period, we announce that we will release earnings
results during the
16-day
period beginning on the last day of the
180-day
period,
|
in which case the restrictions described in the preceding
paragraph will continue to apply until the expiration of the
18-day
period beginning on the issuance of the earnings release or the
announcement of the material news or occurrence of the material
event, unless such extension is waived, in writing, by Barclays
Capital Inc. and Deutsche Bank Securities Inc.
Registration
Rights
In connection with the recapitalization and private placements
of our preferred stock described under “Certain
Relationships and Related Party Transactions —
Recapitalization and Private Placements of Securities” in
this prospectus, we entered into an amended and restated
investor rights
115
agreement with investors participating in our May 2007
recapitalization and private placements, which provides for
registration rights with respect to certain shares of our common
stock, including shares of our common stock into which the
shares of our preferred stock sold in such transactions are
convertible. The description of the registration rights in this
prospectus is qualified by reference to the amended and restated
investor rights agreement, a copy of which is attached as an
exhibit to the registration statement of which this prospectus
is a part.
Stock
Plans
As soon as practicable after the completion of this offering, we
intend to file a
Form S-8
registration statement under the Securities Act to register
shares of our common stock subject to options outstanding or
reserved for issuance under our 2002 Stock Plan and our 2011
Stock Option and Incentive Plan. Such registration statement
will become effective immediately upon filing, and shares
covered by such registration statement will thereupon be
eligible for sale in the public markets, subject to
Rule 144 limitations applicable to affiliates and any
lock-up
agreements. For a more complete discussion of our stock plans,
see “Compensation Discussion and Analysis —
Benefit Plans.”
116
UNDERWRITING
Barclays Capital Inc. and Deutsche Bank Securities Inc. are
acting as the representatives of the underwriters and the joint
book-running managers of this offering. Under the terms of an
underwriting agreement, which will be filed as an exhibit to the
registration statement, each of the underwriters named below has
severally agreed to purchase from us and the selling
stockholders the respective number of shares of common stock
shown opposite its name below:
| |
|
|
|
|
|
|
|
Number of
|
|
|
Underwriters
|
|
Shares
|
|
|
|
|
Barclays Capital Inc.
|
|
|
|
|
|
Deutsche Bank Securities Inc.
|
|
|
|
|
|
RBC Capital Markets
|
|
|
|
|
|
Needham & Company, LLC
|
|
|
|
|
|
Canaccord Genuity Inc.
|
|
|
|
|
|
Raymond James & Associates, Inc.
|
|
|
|
|
|
|
|
|
|
|
|
Total
|
|
|
|
|
|
|
|
|
|
|
The underwriting agreement provides that the underwriters’
obligation to purchase shares of common stock depends on the
satisfaction of the conditions contained in the underwriting
agreement including:
|
|
|
| |
•
|
the obligation to purchase all of the shares of common stock
offered hereby (other than those shares of common stock covered
by their option to purchase additional shares as described
below), if any of the shares are purchased;
|
| |
| |
•
|
the representations and warranties made by us and the selling
stockholders to the underwriters are true;
|
| |
| |
•
|
there is no material adverse change in our business or the
financial markets; and
|
| |
| |
•
|
we deliver customary closing documents to the underwriters.
|
Commissions and
Expenses
The following table summarizes the underwriting discounts and
commissions we and the selling stockholders will pay to the
underwriters. These amounts are shown assuming both no exercise
and full exercise of the underwriters’ option to purchase
additional shares. The underwriting fee is the difference
between the initial price to the public and the amount the
underwriters pay to us and the selling stockholders for the
shares.
| |
|
|
|
|
|
|
|
|
|
|
|
|
|
|
|
|
|
|
Total
|
|
|
|
|
|
|
|
No Exercise
|
|
|
Full Exercise
|
|
|
|
|
|
|
|
of the
|
|
|
of the
|
|
|
|
|
Per
|
|
|
Underwriters’
|
|
|
Underwriters’
|
|
|
|
|
Share
|
|
|
Option
|
|
|
Option
|
|
|
|
|
Discounts and commissions paid by us
|
|
$
|
|
|
|
$
|
|
|
|
$
|
|
|
|
Discounts and commissions by the selling stockholders
|
|
|
|
|
|
|
|
|
|
|
|
|
The representatives of the underwriters have advised us that the
underwriters propose to offer the shares of common stock
directly to the public at the public offering price on the cover
of this prospectus and to selected dealers, which may include
the underwriters, at such offering price less a selling
concession not in excess of $ per
share. After this offering, the representatives of the
underwriters may change the offering price and other selling
terms. Sales of shares made outside of the United States may be
made by affiliates of the underwriters.
117
The expenses of the offering that are payable by us are
estimated to be $ (excluding
underwriting discounts and commissions). The selling
stockholders have agreed to pay their own expenses incurred in
connection with the offering.
Option to
Purchase Additional Shares
The selling stockholders have granted the underwriters an option
exercisable for 30 days after the date of the underwriting
agreement, to purchase, from time to time, in whole or in part,
up to an aggregate
of shares
at the public offering price less underwriting discounts and
commissions. This option may be exercised if the underwriters
sell more
than shares
in connection with this offering. To the extent that this option
is exercised, each underwriter will be obligated, subject to
certain conditions, to purchase its pro rata portion of these
additional shares based on the underwriter’s underwriting
commitment in the offering as indicated in the table at the
beginning of this “Underwriting” section.
Lock-Up
Agreements
We, all of our directors and executive officers and holders of
more than % of our total
outstanding shares of common stock, including the selling
stockholders, have agreed that, subject to certain exceptions,
without the prior written consent of Barclays Capital Inc. and
Deutsche Bank Securities Inc., we and they will not directly or
indirectly, (1) offer for sale, sell, pledge, or otherwise
dispose of (or enter into any transaction or device that is
designed to, or could be expected to, result in the disposition
by any person at any time in the future of) any shares of common
stock (including, without limitation, shares of common stock
that may be deemed to be beneficially owned by us or them in
accordance with the rules and regulations of the Securities and
Exchange Commission and shares of common stock that may be
issued upon exercise of any options or warrants) or securities
convertible into or exercisable or exchangeable for common
stock, or, solely in our case, sell or grant options, rights or
warrants with respect to any shares of common stock or
securities convertible or exercisable or exchangeable for common
stock (other than the grant of options pursuant to compensatory
option plans existing on the date of this prospectus),
(2) enter into any swap or other derivatives transaction
that transfers to another, in whole or in part, any of the
economic consequences of ownership of the common stock,
(3) file or cause to be filed a registration statement with
respect to the registration of any shares of common stock or
securities convertible, exercisable or exchangeable into common
stock or any of our other securities, or (4) publicly
disclose the intention to do any of the foregoing for a period
of 180 days after the date of this prospectus.
In the case of our directors and executive officers and
stockholders who have executed a
lock-up
letter agreement setting out the restrictions described above,
the exceptions include bona fide gifts, sales or other
dispositions that (a) are made exclusively between
and/or among
the restricted party or members of the restricted party’s
immediate family, (b) are made exclusively between the
restricted party and a trust for the direct or indirect benefit
of the restricted party or members of the restricted
party’s immediate family, (c) are made exclusively
between the restricted party and any third party granted an
interest in the restricted party’s will or under the laws
of descent, (d) are made exclusively between affiliates of
the restricted party, including partners (if a partnership) or
members (if a limited liability company), (e) consist
exclusively of shares of common stock acquired by the restricted
party in open market transactions after the completion of this
offering, (f) consist exclusively of the shares of common
stock offered and sold by the restricted party in this offering,
(g) are sales made pursuant to a trading plan that complies
with
Rule 10b5-1
under the Securities Exchange Act of 1934, and (h) consist
exclusively of shares of common stock issued by us to the
restricted party as a result of the cashless exercise by the
restricted party of stock options issued and outstanding on the
date of the respective
lock-up
letter agreement; provided that, (1) in the cases of
clauses (a) through (d) above, it shall be a condition
to any such transfer that (i) the transferee/donee agrees
in writing to be bound by the terms of the
lock-up
letter agreement to the same extent as if the transferee/donee
were a party thereto, (ii) no filing by any party (donor,
donee, transferor or transferee) under the
118
Securities Exchange Act shall be required or shall be
voluntarily made in connection with such transfer or
distribution, and (iii) each party (donor, donee,
transferor or transferee) shall not be required by law
(including without limitation the disclosure requirements of the
Securities Act and the Securities Exchange Act) to make, and
shall agree to not voluntarily make, any public announcement of
any such transfer or disposition and (2) in the case of
clauses (e), (g) and (h) above, any securities of our
company received by the restricted party upon such acquisition
or exercise, as applicable, will be subject to all of the
restrictions set forth in the immediately preceding paragraph.
The 180-day
restricted period described in the preceding paragraph will be
extended if:
|
|
|
| |
•
|
during the last 17 days of the
180-day
restricted period we issue an earnings release or material news
or a material event relating to us occurs; or
|
| |
| |
•
|
prior to the expiration of the
180-day
restricted period, we announce that we will release earnings
results during the
16-day
period beginning on the last day of the
180-day
period,
|
in which case the restrictions described in the preceding
paragraph will continue to apply until the expiration of the
18-day
period beginning on the issuance of the earnings release or the
announcement of the material news or occurrence of material
event unless such extension is waived in writing by Barclays
Capital Inc. and Deutsche Bank Securities Inc.
Barclays Capital Inc. and Deutsche Bank Securities Inc., in
their sole discretion, may release the common stock and other
securities subject to the
lock-up
agreements described above in whole or in part at any time with
or without notice. When determining whether or not to release
common stock and other securities from
lock-up
agreements, Barclays Capital Inc. and Deutsche Bank Securities
Inc. will consider, among other factors, the reasons for
requesting the release, the number of shares of common stock and
other securities for which the release is being requested and
market conditions at the time.
Offering Price
Determination
Prior to this offering, there has been no public market for our
common stock. The initial public offering price will be
negotiated between the representatives of the underwriters and
us. In determining the initial public offering price of our
common stock, the representatives of the underwriters will
consider:
|
|
|
| |
•
|
the history and prospects for the industry in which we compete;
|
| |
| |
•
|
our financial information;
|
| |
| |
•
|
the ability of our management and our business potential and
earning prospects;
|
| |
| |
•
|
the prevailing securities markets at the time of this
offering; and
|
| |
| |
•
|
recent market prices of, and the demand for, publicly traded
shares of generally comparable companies.
|
Indemnification
We and the selling stockholders have agreed to indemnify the
underwriters against certain liabilities, including liabilities
under the Securities Act, and we and the selling stockholders
have agreed to contribute to payments that the underwriters may
be required to make for these liabilities.
Stabilization,
Short Positions and Penalty Bids
The representatives of the underwriters may engage in
stabilizing transactions, short sales and purchases to cover
positions created by short sales, and penalty bids or purchases
for the purpose of
119
pegging, fixing or maintaining the price of the common stock, in
accordance with Regulation M under the Securities Exchange
Act of 1934:
|
|
|
| |
•
|
Stabilizing transactions permit bids to purchase the underlying
security so long as the stabilizing bids do not exceed a
specified maximum.
|
| |
| |
•
|
A short position involves a sale by the underwriters of shares
in excess of the number of shares the underwriters are obligated
to purchase in the offering, which creates the syndicate short
position. This short position may be either a covered short
position or a naked short position. In a covered short position,
the number of shares involved in the sales made by the
underwriters in excess of the number of shares they are
obligated to purchase is not greater than the number of shares
that they may purchase by exercising their option to purchase
additional shares. In a naked short position, the number of
shares involved is greater than the number of shares in their
option to purchase additional shares. The underwriters may close
out any short position by either exercising their option to
purchase additional shares
and/or
purchasing shares in the open market. In determining the source
of shares to close out the short position, the underwriters will
consider, among other things, the price of shares available for
purchase in the open market as compared to the price at which
they may purchase shares through their option to purchase
additional shares. A naked short position is more likely to be
created if the underwriters are concerned that there could be
downward pressure on the price of the shares in the open market
after pricing that could adversely affect investors who purchase
in the offering.
|
| |
| |
•
|
Syndicate covering transactions involve purchases of the common
stock in the open market after the distribution has been
completed in order to cover syndicate short positions.
|
| |
| |
•
|
Penalty bids permit the representatives of the underwriters to
reclaim a selling concession from a syndicate member when the
common stock originally sold by the syndicate member is
purchased in a stabilizing or syndicate covering transaction to
cover syndicate short positions.
|
These stabilizing transactions, syndicate covering transactions
and penalty bids may have the effect of raising or maintaining
the market price of our common stock or preventing or retarding
a decline in the market price of the common stock. As a result,
the price of the common stock may be higher than the price that
might otherwise exist in the open market. These transactions may
be effected on NASDAQ Global Market or otherwise and, if
commenced, may be discontinued at any time.
Neither we nor any of the underwriters make any representation
or prediction as to the direction or magnitude of any effect
that the transactions described above may have on the price of
our common stock. In addition, neither we nor any of the
underwriters make representation that the representatives of the
underwriters will engage in these stabilizing transactions or
that any transaction, once commenced, will not be discontinued
without notice.
Electronic
Distribution
A prospectus in electronic format may be made available on the
Internet sites or through other online services maintained by
one or more of the underwriters
and/or
selling group members participating in this offering, or by
their affiliates. Other than the prospectus in electronic
format, the information on any underwriter’s or selling
group member’s website and any information contained in any
other web site maintained by an underwriter or selling group
member is not part of the prospectus or the registration
statement of which this prospectus forms a part.
NASDAQ Global
Market
We have applied to list our shares of common stock for quotation
on the NASDAQ Global Market under the symbol “SIGE.”
120
Discretionary
Sales
The underwriters have informed us that they do not intend to
confirm sales to discretionary accounts that exceed 5% of the
total number of shares offered by them.
Stamp
Taxes
Non-U.S. investors who purchase shares of common stock offered
in this prospectus may be required to pay stamp taxes and other
charges under the laws and practices of the country of purchase,
in addition to the offering price listed on the cover page of
this prospectus.
Relationships
Needham & Company, LLC provided us with investment
banking services in 2009 — 2010 in connection with a
proposed transaction that ultimately was not consummated. Though
we did not pay Needham & Company any investment
banking fees or commissions, we reimbursed certain of
Needham & Company’s
out-of-pocket
expenses in connection with the proposed transaction.
The underwriters and their affiliates may provide investment
banking services to us in the future.
Selling
Restrictions
European
Economic Area
In relation to each member state of the European Economic Area
that has implemented the Prospectus Directive (each, a
“relevant member state”), with effect from and
including the date on which the Prospectus Directive is
implemented in that relevant member state (the “relevant
implementation date”), an offer of securities described in
this prospectus may not be made to the public in that relevant
member state other than:
|
|
|
| |
•
|
to any legal entity that is authorized or regulated to operate
in the financial markets or, if not so authorized or regulated,
whose corporate purpose is solely to invest in securities;
|
| |
| |
•
|
to any legal entity that has two or more of (1) an average
of at least 250 employees during the last financial year;
(2) a total balance sheet of more than €43,000,000 and
(3) an annual net turnover of more than €50,000,000,
as shown in its last annual or consolidated accounts;
|
| |
| |
•
|
to fewer than 100 natural or legal persons (other than qualified
investors as defined in the Prospectus Directive) subject to
obtaining the prior consent of the representatives; or
|
| |
| |
•
|
in any other circumstances that do not require the publication
of a prospectus pursuant to Article 3 of the prospectus
Directive;
|
provided that no such offer of securities shall require us or
any underwriter to publish a prospectus pursuant to
Article 3 of the Prospectus Directive.
For purposes of this provision, the expression an “offer of
securities to the public” in any relevant member state
means the communication in any form and by any means of
sufficient information on the terms of the offer and the
securities to be offered so as to enable an investor to decide
to purchase or subscribe the securities, as the expression may
be varied in that member state by any measure implementing the
Prospectus Directive in that member state, and the expression
“Prospectus Directive” means Directive 2003/71/EC and
includes any relevant implementing measure in each relevant
member state.
We and the selling stockholders have not authorized and do not
authorize the making of any offer of securities through any
financial intermediary on their behalf, other than offers made
by the underwriters with a view to the final placement of the
securities as contemplated in this prospectus. Accordingly, no
purchaser of the securities, other than the underwriters, is
authorized to make any further offer of the securities on behalf
of us, the selling stockholders or the underwriters.
121
United
Kingdom
This prospectus is only being distributed to, and is only
directed at, persons in the United Kingdom that are qualified
investors within the meaning of Article 2(1)(e) of the
Prospectus Directive (“Qualified Investors”) that are
also (i) investment professionals falling within
Article 19(5) of the Financial Services and Markets Act
2000 (Financial Promotion) Order 2005 (the “Order”) or
(ii) high net worth entities, and other persons to whom it
may lawfully be communicated, falling within
Article 49(2)(a) to (d) of the Order (all such persons
together being referred to as “relevant persons”).
This prospectus and its contents are confidential and should not
be distributed, published or reproduced (in whole or in part) or
disclosed by recipients to any other persons in the United
Kingdom. Any person in the United Kingdom that is not a relevant
person should not act or rely on this document or any of its
contents.
Hong
Kong
The shares may not be offered or sold by means of any document
other than (i) in circumstances which do not constitute an
offer to the public within the meaning of the Companies
Ordinance (Cap. 32, Laws of Hong Kong), or (ii) to
“professional investors” within the meaning of the
Securities and Futures Ordinance (Cap. 571, Laws of Hong Kong)
and any rules made thereunder, or (iii) in other
circumstances which do not result in the document being a
“prospectus” within the meaning of the Companies
Ordinance (Cap. 32, Laws of Hong Kong), and no advertisement,
invitation or document relating to the shares may be issued or
may be in the possession of any person for the purpose of issue
(in each case whether in Hong Kong or elsewhere), which is
directed at, or the contents of which are likely to be accessed
or read by, the public in Hong Kong (except if permitted to do
so under the laws of Hong Kong) other than with respect to
shares which are or are intended to be disposed of only to
persons outside Hong Kong or only to “professional
investors” within the meaning of the Securities and Futures
Ordinance (Cap. 571, Laws of Hong Kong) and any rules made
thereunder.
Japan
The securities have not been and will not be registered under
the Financial Instruments and Exchange Law of Japan (the
Financial Instruments and Exchange Law) and each underwriter has
agreed that it will not offer or sell any securities, directly
or indirectly, in Japan or to, or for the benefit of, any
resident of Japan (which term as used herein means any person
resident in Japan, including any corporation or other entity
organized under the laws of Japan), or to others for re-offering
or resale, directly or indirectly, in Japan or to a resident of
Japan, except pursuant to an exemption from the registration
requirements of, and otherwise in compliance with, the Financial
Instruments and Exchange Law and any other applicable laws,
regulations and ministerial guidelines of Japan.
Singapore
This prospectus has not been registered as a prospectus with the
Monetary Authority of Singapore. Accordingly, this prospectus
and any other document or material in connection with the offer
or sale, or invitation for subscription or purchase, of the
shares may not be circulated or distributed, nor may the shares
be offered or sold, or be made the subject of an invitation for
subscription or purchase, whether directly or indirectly, to
persons in Singapore other than (i) to an institutional
investor under Section 274 of the Securities and Future
Act, Chapter 289 of Singapore (the “SFA”),
(ii) to a “relevant person” as defined in
Section 275(2) of the SFA, or any person pursuant to
Section 275 (1A), and in accordance with the conditions,
specified in Section 275 of the SFA or (iii) otherwise
pursuant to, and in accordance with the conditions of, any other
applicable provision of the SFA.
Where the shares are subscribed and purchased under
Section 275 of the SFA by a relevant person which is:
|
|
|
| |
(a)
|
a corporation (which is not an accredited investor (as defined
in Section 4A of the SFA)) the sole business of which is to
hold investments and the entire share capital of which is owned
by one or more individuals, each of whom is an accredited
investor; or
|
122
|
|
|
| |
(b)
|
a trust (where the trustee is not an accredited investor (as
defined in Section 4A of the SFA)) whose sole whole purpose
is to hold investments and each beneficiary is an accredited
investor,
|
shares, debentures and units of shares and debentures of that
corporation or the beneficiaries’ rights and interest
(howsoever described) in that trust shall not be transferable
within six months after that corporation or that trust has
acquired the shares under Section 275 of the SFA except:
|
|
|
| |
(i)
|
to an institutional investor under Section 274 of the SFA
or to a relevant person (as defined in Section 275(2) of
the SFA) and in accordance with the conditions, specified in
Section 275 of the SFA;
|
(ii) where no consideration is given for the
transfer; or
(iii) by operation of law.
By accepting this prospectus, the recipient hereof represents
and warrants that he is entitled to receive it in accordance
with the restrictions set forth above and agrees to be bound by
limitations contained herein. Any failure to comply with these
limitations may constitute a violation of law.
Dubai
International Financial Centre
This document relates to an Exempt Offer, as defined in the
Offered Securities Rules module of the Dubai Financial Services
Authority Rulebook, in accordance with the Offered Securities
Rules of the Dubai Financial Services Authority. This document
is intended for distribution only to persons, as defined in the
Offered Securities Rules, of a type specified in those rules. It
must not be delivered to, or relied on by, any other person. The
Dubai Financial Services Authority has no responsibility for
reviewing or verifying any documents in connection with Exempt
Offers. The Dubai Financial Services Authority has not approved
this document nor taken steps to verify the information set out
in it, and has no responsibility for it. The shares to which
this document relates may be illiquid
and/or
subject to restrictions on their resale. Prospective purchasers
of the shares offered should conduct their own due diligence on
the shares. If you do not understand the contents of this
document you should consult an authorized financial adviser.
Switzerland
This document, as well as any other offering or marketing
material relating to the shares which are the subject of the
offering contemplated by this prospectus, neither constitutes a
prospectus pursuant to Article 652a or Article 1156 of
the Swiss Code of Obligations nor a simplified prospectus as
such term is understood pursuant to article 5 of the Swiss
Federal Act on Collective Investment Schemes. The shares will
not be listed on the SIX Swiss Exchange and, therefore, the
documents relating to the shares, including, but not limited to,
this document, do not claim to comply with the disclosure
standards of the listing rules of SIX Swiss Exchange and
corresponding prospectus schemes annexed to the listing rules of
the SIX Swiss Exchange.
The shares are being offered in Switzerland by way of a private
placement, i.e., to a small number of selected investors only,
without any public offer and only to investors who do not
purchase the shares with the intention to distribute them to the
public. The investors will be individually approached from time
to time. This document, as well as any other offering or
marketing material relating to the shares, is confidential and
it is exclusively for the use of the individually addressed
investors in connection with the offer of the shares in
Switzerland and it does not constitute an offer to any other
person. This document may only be used by those investors to
whom it has been handed out in connection with the offering
described herein and may neither directly nor indirectly be
distributed or made available to other persons without our
express consent. It may not be used in connection with any other
offer and shall in particular not be copied
and/or
distributed to the public in or from Switzerland.
123
MATERIAL U.S.
FEDERAL INCOME TAX CONSIDERATIONS
The following is a summary of material U.S. federal income
tax considerations relating to the acquisition, ownership and
disposition of shares of our common stock. Except where noted,
this summary deals only with shares of our common stock
purchased for cash in this offering and held as a capital asset
by a stockholder, and does not discuss the U.S. federal
income tax considerations applicable to a stockholder that is
subject to special treatment under U.S. federal income tax
laws, including (without limitation): a dealer in securities or
currencies; a financial institution; a regulated investment
company; a real estate investment trust; a tax exempt
organization; an insurance company; a person holding shares of
our common stock as part of a hedging, integrated, conversion or
straddle transaction or a person deemed to sell shares of our
common stock under the constructive sale provisions of the Code;
a trader in securities that has elected the
mark-to-market
method of accounting; a person liable for alternative minimum
tax; an entity that is treated as a partnership or other
pass-through entity for U.S. federal income tax purposes; a
person that received such shares of our common stock in
connection with services provided; a U.S. person whose
“functional currency” is not the U.S. dollar; a
“controlled foreign corporation”; a “passive
foreign investment company”; or a U.S. expatriate.
This summary is based upon provisions of the Code, and
applicable U.S. Treasury regulations, rulings and judicial
decisions in effect as of the date hereof. Those authorities may
be changed, perhaps retroactively, or may be subject to
differing interpretations, so as to result in U.S. federal
income tax consequences different from those discussed below.
This summary does not address all aspects of U.S. federal
income tax, does not deal with all tax considerations that may
be relevant to stockholders in light of their personal
circumstances and does not address any state, local, foreign,
gift or estate tax considerations.
For purposes of this discussion, a “U.S. holder”
is a beneficial holder of shares of our common stock that is:
(i) an individual citizen or resident of the United States;
(ii) a corporation (or any other entity treated as a
corporation for U.S. federal income tax purposes) created
or organized in or under the laws of the United States, any
state thereof or the District of Columbia; (iii) an estate
the income of which is subject to U.S. federal income
taxation regardless of its source; or (iv) a trust if it
(A) is subject to the primary supervision of a court within
the United States and one or more U.S. persons have the
authority to control all substantial decisions of the trust or
(B) has a valid election in effect under applicable
U.S. Treasury regulations to be treated as a
U.S. person.
For purposes of this discussion, a
“non-U.S. holder”
is a beneficial holder of shares of our common stock (other than
a partnership or any other entity that is treated as a
partnership for U.S. federal income tax purposes) that is
not a U.S. holder.
If a partnership (or any other entity that is treated as a
partnership for U.S. federal income tax purposes) holds
shares of our common stock, the tax treatment of a partner will
generally depend upon the status of the partner and the
activities of the partnership. A partner of a partnership
holding shares of our common stock is urged to consult its own
tax advisors.
Holders of shares of our common stock are urged to consult
their own tax advisors concerning their particular
U.S. federal income tax consequences in light of their
specific situations, as well as the tax consequences arising
under the laws of any other taxing jurisdiction.
U.S.
Holders
Ownership and Disposition of Shares of Our Common
Stock. The following discussion is a summary of
material U.S. federal income tax considerations relevant to
a U.S. holder of shares of our common stock.
U.S. investors should also refer to “Information
Reporting and Backup Withholding Tax” and “New
Legislation Relating to Foreign Accounts” (below).
124
Distributions with respect to shares of our common stock, if
any, will be includible in the gross income of a
U.S. holder as ordinary dividend income to the extent paid
out of current or accumulated earnings and profits, as
determined for U.S. federal income tax purposes. Any
portion of a distribution in excess of such current or
accumulated earnings and profits would be treated as a return of
the holder’s tax basis in its shares of our common stock
and then as gain from the sale or exchange of the shares of our
common stock. Under current law, if certain requirements are
met, a maximum 15% U.S. federal income tax rate will apply
to any dividends paid prior to January 1, 2011 to a
U.S. holder of shares of our common stock who is an
individual. Unless the reduced rate provision is extended by
subsequent legislation, for tax years beginning on or after
January 1, 2011, dividends will be taxed at regular
ordinary income rates.
Dividend distributions to U.S. holders that are
corporations may qualify for the 70% “dividends received
deduction” (“DRD”), which is generally available
to corporations that own less than 20% of the voting power or
value of the outstanding stock of the distributing
U.S. corporation. A U.S. holder that is a corporation
holding 20% or more of the voting power and value of the
outstanding stock of the distributing U.S. corporation may
be eligible for an 80% DRD. No assurance can be given that we
will have sufficient earnings and profits (as determined for
U.S. federal income tax purposes) to cause any
distributions to be eligible for a DRD. In addition, a DRD is
available only if certain holding period and other taxable
income requirements are satisfied. The length of time that a
stockholder has held stock is reduced by any period during which
the stockholder’s risk of loss with respect to the stock is
diminished by reason of the existence of certain options,
contracts to sell, short sales, or other similar transactions.
Also, to the extent that a corporation incurs indebtedness that
is directly attributable to an investment in the stock on which
the dividend is paid, all or a portion of the DRD may be
disallowed. In addition, any dividend received by a corporation
may also be subject to the extraordinary distribution provisions
of the Code.
A U.S. holder of shares of our common stock will generally
recognize gain or loss on the taxable sale, exchange, or other
disposition of such stock in an amount equal to the difference
between such U.S. holder’s amount realized on the sale
and its tax basis in the shares of our common stock sold. A
U.S. holder’s amount realized is generally equal to
the amount of cash and the fair market value of any property
received in consideration of its stock, and such holder’s
tax basis is generally its purchase price for such stock in this
offering. The gain or loss generally is capital gain or loss if
the U.S. holder holds shares of our common stock as a
capital asset, and long-term capital gain or loss if the shares
of our common stock are held for more than one year at the time
of disposition. Capital loss can generally only be used to
offset capital gain (individuals may also offset excess capital
losses against up to $3,000 of ordinary income per tax year).
Under current law, long-term capital gain recognized by an
individual U.S. holder prior to January 1, 2011 is
subject to a maximum 15% U.S. federal income tax rate.
Non-U.S.
Holders
Ownership and Disposition of Shares of Our Common
Stock. The following discussion is a summary of
material U.S. federal income tax considerations relevant to
a
non-U.S. holder
of shares of our common stock.
Non-U.S. investors
should also refer to “Information Reporting and Backup
Withholding Tax” and “New Legislation Relating to
Foreign Accounts” (below).
Distributions treated as dividends that are paid to a
non-U.S. holder,
if any, with respect to shares of our common stock will
generally be subject to withholding tax at a 30% rate (or lower
applicable income tax treaty rate) unless the dividends are
effectively connected with the
non-U.S. holder’s
conduct of a trade or business in the United States. If a
non-U.S. holder
is engaged in a trade or business in the United States and
dividends with respect to shares of our common stock are
effectively connected with the conduct of that trade or business
and, if required by an applicable income tax treaty, are
attributable to a U.S. permanent establishment, then the
non-U.S. holder
will be subject to U.S. federal income tax on those
dividends on a net income basis (although the dividends will be
exempt from the 30% U.S. federal withholding tax, provided
certain certification and disclosure
125
requirements are satisfied) in the same manner as if received by
a U.S. person as defined under the Code. Any such
effectively connected income received by a
non-U.S. corporation
may, under certain circumstances, be subject to an additional
branch profits tax at a 30% rate (or lower applicable income tax
treaty rate). To claim the exemption from withholding for
effectively connected income, the
non-U.S. holder
must generally furnish to us or our paying agent a properly
executed Internal Revenue Service (“IRS”)
Form W-8ECI
(or applicable successor form).
A
non-U.S. holder
of shares of our common stock who wishes to claim the benefit of
an exemption or reduced rate of withholding tax under an
applicable income tax treaty must furnish to us or our paying
agent a valid IRS
Form W-8BEN
(or applicable successor form) certifying that such holder is
not a U.S. person as defined under the Code and such
holder’s qualification for the exemption or reduced rate.
Special certification and other requirements apply to certain
non-U.S. holders
that hold shares of our common stock through certain foreign
intermediaries or that are pass-through entities rather than
corporations or individuals. If a
non-U.S. holder
is eligible for a reduced rate of U.S. withholding tax
pursuant to an income tax treaty, it may obtain a refund of any
excess amounts withheld by timely filing an appropriate claim
for refund with the IRS.
Non-U.S. holders
may recognize gain upon the sale, exchange, redemption or other
taxable disposition of shares of our common stock. Such gain
generally will not be subject to U.S. federal income tax
unless: (i) that gain is effectively connected with the
conduct of a trade or business in the United States (and, if
required by an applicable income tax treaty, is attributable to
a U.S. permanent establishment) by a
non-U.S. holder;
(ii) the
non-U.S. holder
is a non-resident alien individual who is present in the United
States for 183 days or more in the taxable year of that
disposition, and certain other conditions are met; or
(iii) we are or have been a “U.S. real property
holding corporation” for U.S. federal income tax
purposes. We believe that we are not, and we do not anticipate
becoming, a “U.S. real property holding
corporation” for U.S. federal income tax purposes.
If a
non-U.S. holder
is an individual described in clause (i) of the preceding
paragraph, the
non-U.S. holder
will generally be subject to tax on the net gain at regular
graduated U.S. federal income tax rates. If a
non-U.S. holder
is a foreign corporation that falls under clause (i) of the
preceding paragraph, it will generally be subject to tax on its
net gain in the same manner as if it were a U.S. person as
defined under the Code and, in addition, the
non-U.S. holder
may be subject to the branch profits tax at a rate equal to 30%
of its effectively connected earnings and profits or at such
lower rate as may be specified by an applicable income tax
treaty. If the
non-U.S. holder
is an individual described in clause (ii) of the preceding
paragraph, the
non-U.S. holder
will generally be subject to a flat 30% tax on the gain, which
may be offset by U.S. source capital losses even though the
non-U.S. holder
is not considered a resident of the United States.
Information
Reporting and Backup Withholding Tax
We will report to our U.S. holders and the IRS the amount
of dividends paid during each calendar year, if any, and the
amount of any tax withheld. All distributions to holders of
shares of our common stock are subject to any applicable
withholding. Under U.S. federal income tax law, interest,
dividends, and other reportable payments may, under certain
circumstances, be subject to “backup withholding” at
the then applicable rate (currently 28%). Backup withholding
generally applies to a U.S. holder if the holder
(i) fails to furnish its social security number or other
taxpayer identification number (“TIN”),
(ii) furnishes an incorrect TIN, (iii) fails to
properly report interest or dividends, or (iv) under
certain circumstances, fails to provide a certified statement,
signed under penalty of perjury, that the TIN provided is its
correct number and that it is a U.S. person that is not
subject to backup withholding. Backup withholding is not an
additional tax but merely an advance payment, which may be
refunded to the extent it results in an overpayment of tax and
the appropriate information is timely supplied to the IRS.
Certain persons are exempt from backup withholding, including,
in certain circumstances, corporations and financial
institutions.
126
We will report to our
non-U.S. holders
and the IRS the amount of dividends paid during each calendar
year, if any, and the amount of any tax withheld. These
information reporting requirements apply even if no withholding
was required because the distributions were effectively
connected with the
non-U.S. holder’s
conduct of a United States trade or business, or withholding was
reduced or eliminated by an applicable income tax treaty. This
information also may be made available under a specific treaty
or agreement with the tax authorities in the country in which
the
non-U.S. holder
resides or is established. Backup withholding, however,
generally will not apply to distributions to a
non-U.S. holder
of shares of our common stock provided the
non-U.S. holder
furnishes to us or our paying agent the required certification
as to its
non-U.S. status,
such as by providing a valid IRS
Form W-8BEN
or IRS
Form W-8ECI,
or certain other requirements are met. Notwithstanding the
foregoing, backup withholding may apply if either we or our
paying agent has actual knowledge, or reason to know, that the
non-U.S. holder
is a U.S. person as defined under the Code that is not an
exempt recipient. Backup withholding is not an additional tax
but merely an advance payment, which may be refunded to the
extent it results in an overpayment of tax and the appropriate
information is timely supplied to the IRS.
New Legislation
Relating to Foreign Accounts
Newly enacted legislation may impose withholding taxes on
certain types of payments made to “foreign financial
institutions” and certain other
non-U.S. entities.
Under this legislation, the failure to comply with additional
certification, information reporting and other specified
requirements could result in withholding tax being imposed on
payments of dividends and sales proceeds to
U.S. stockholders who own the shares through foreign
accounts or foreign intermediaries and certain
non-U.S.
stockholders. The legislation imposes a 30% withholding tax on
dividends on, and gross proceeds from the sale or other
disposition of, shares of our common stock paid to a foreign
financial institution or to a foreign non-financial entity that
is the beneficial owner of the payment, unless (i) the
foreign financial institution undertakes certain diligence and
reporting obligations or (ii) the foreign non-financial
entity either certifies it does not have any substantial
U.S. owners or furnishes identifying information regarding
each substantial U.S. owner. If the payee is a foreign
financial institution, it must enter into an agreement with the
U.S. Treasury requiring, among other things, that it
undertake to identify accounts held by certain U.S. persons
or
U.S.-owned
foreign entities, annually report certain information about such
accounts, and withhold 30% on payments to account holders whose
actions prevent it from complying with these reporting and other
requirements. The legislation would apply to payments made after
December 31, 2012. Prospective investors should consult
their tax advisors regarding this legislation.
127
LEGAL
MATTERS
The validity of the common stock offered hereby will be passed
upon for us by Goodwin Procter LLP. Certain legal matters in
connection with this offering will be passed upon for the
underwriters by Simpson Thacher & Bartlett LLP.
EXPERTS
The consolidated financial statements of SiGe Semiconductor,
Inc. as of January 1, 2010 and December 31, 2010 and
for the years ended January 2, 2009, January 1, 2010
and December 31, 2010 included in this prospectus have been
so included in reliance on the report of KPMG LLP, an
independent registered public accounting firm, appearing
elsewhere herein, and upon the authority of said firm as experts
in auditing and accounting.
WHERE YOU CAN
FIND MORE INFORMATION
We have filed with the Securities and Exchange Commission a
registration statement on
Form S-1
under the Securities Act that registers the shares of our common
stock to be sold in this offering. This prospectus does not
contain all of the information set forth in the registration
statement and the exhibits and schedules filed as part of the
registration statement. For further information with respect to
us and our common stock, we refer you to the registration
statement and the exhibits and schedules filed as a part of the
registration statement. Statements contained in this prospectus
concerning the contents of any contract or any other document
are not necessarily complete. If a contract or document has been
filed as an exhibit to the registration statement, we refer you
to the copy of the contract or document that has been filed.
Each statement in this prospectus relating to a contract or
document filed as an exhibit is qualified in all respects by the
filed exhibit.
The reports and other information we file with the Securities
and Exchange Commission can be read and copied at the Securities
and Exchange Commission’s Public Reference Room at
100 F Street, NE, Washington D.C. 20549. Copies of
these materials can be obtained at prescribed rates from the
Public Reference Section of the Securities and Exchange
Commission at the principal offices of the Securities and
Exchange Commission, 100 F Street, NE, Washington D.C.
20549. You may obtain information regarding the operation of the
public reference room by calling 1 (800) SEC-0330. The
Securities and Exchange Commission also maintains a web site
(http://www.sec.gov)
that contains reports, proxy and information statements and
other information regarding issuers like us that file
electronically with the Securities and Exchange Commission.
Upon completion of this offering, we will become subject to the
reporting and information requirements of the Securities
Exchange Act of 1934 and, as a result, will file periodic
reports, proxy statements and other information with the
Securities and Exchange Commission. These periodic reports,
proxy statements and other information will be available for
inspection and copying at the Securities and Exchange
Commission’s public reference room and the web site of the
Securities and Exchange Commission referred to above.
128
| |
|
|
|
|
|
|
|
Page
|
|
|
|
|
|
|
F-2
|
|
|
|
|
|
F-3
|
|
|
|
|
|
F-4
|
|
|
|
|
|
F-5
|
|
|
|
|
|
F-6
|
|
|
|
|
|
F-7
|
|
F-1
REPORT OF
INDEPENDENT REGISTERED PUBLIC ACCOUNTING FIRM
The Board of Directors and Stockholders of SiGe Semiconductor,
Inc.
We have audited the accompanying consolidated balance sheets of
SiGe Semiconductor, Inc. as of January 1, 2010 and
December 31, 2010 and the related consolidated statements
of operations, stockholders’ equity and redeemable
convertible preferred stock and cash flows for the years ended
January 2, 2009, January 1, 2010 and December 31,
2010. In connection with our audits of the consolidated
financial statements, we also have audited the related
consolidated financial statement schedule “Valuation and
Qualifying Accounts”. These consolidated financial
statements and consolidated financial statement schedule are the
responsibility of the Company’s management. Our
responsibility is to express an opinion on these consolidated
financial statements and consolidated financial statement
schedule based on our audits.
We conducted our audits in accordance with the standards of the
Public Company Accounting Oversight Board (United States). Those
standards require that we plan and perform the audit to obtain
reasonable assurance about whether the financial statements are
free of material misstatement. An audit includes examining, on a
test basis, evidence supporting the amounts and disclosures in
the financial statements. An audit also includes assessing the
accounting principles used and significant estimates made by
management, as well as evaluating the overall financial
statement presentation. We believe that our audits provide a
reasonable basis for our opinion.
In our opinion, the consolidated financial statements referred
to above present fairly, in all material respects, the financial
position of SiGe Semiconductor, Inc. as of January 1, 2010
and December 31, 2010 and the results of its operations and
its cash flows for the years ended January 2, 2009,
January 1, 2010 and December 31, 2010, in conformity
with U.S. generally accepted accounting principles. Also in
our opinion, the related consolidated financial statement
schedule, when considered in relation to the basic consolidated
financial statements taken as a whole, presents fairly in all
material respects the information set forth therein.
Chartered Accountants, Licensed Public Accountants
Ottawa, Canada
March 18, 2011
F-2
SiGe
SEMICONDUCTOR, INC.
CONSOLIDATED
BALANCE SHEETS
(in
thousands of U.S. dollars and shares, except par
amounts)
| |
|
|
|
|
|
|
|
|
|
|
|
January 1,
|
|
|
December 31,
|
|
|
|
|
2010
|
|
|
2010
|
|
|
|
|
ASSETS
|
|
|
|
|
|
|
|
|
|
Current assets:
|
|
|
|
|
|
|
|
|
|
Cash and cash equivalents
|
|
$
|
11,002
|
|
|
$
|
10,392
|
|
|
Accounts receivable
|
|
|
9,922
|
|
|
|
8,719
|
|
|
Inventory
|
|
|
6,603
|
|
|
|
12,710
|
|
|
Investment tax credits receivable
|
|
|
1,143
|
|
|
|
827
|
|
|
Deferred tax assets
|
|
|
—
|
|
|
|
2,078
|
|
|
Prepaid expenses and other current assets
|
|
|
1,076
|
|
|
|
1,527
|
|
|
|
|
|
|
|
|
|
|
|
|
Total current assets
|
|
|
29,746
|
|
|
|
36,253
|
|
|
Property and equipment
|
|
|
3,165
|
|
|
|
3,651
|
|
|
Deferred costs of equity offering
|
|
|
—
|
|
|
|
2,109
|
|
|
Deferred tax assets
|
|
|
—
|
|
|
|
466
|
|
|
|
|
|
|
|
|
|
|
|
|
Total assets
|
|
$
|
32,911
|
|
|
$
|
42,479
|
|
|
|
|
|
|
|
|
|
|
|
|
|
|
|
|
|
|
|
|
|
|
LIABILITIES AND STOCKHOLDERS’ EQUITY
|
|
|
|
|
|
|
|
|
|
Current liabilities:
|
|
|
|
|
|
|
|
|
|
Accounts payable
|
|
$
|
6,833
|
|
|
$
|
8,901
|
|
|
Accrued liabilities
|
|
|
4,561
|
|
|
|
4,831
|
|
|
|
|
|
|
|
|
|
|
|
|
Total current liabilities
|
|
|
11,394
|
|
|
|
13,732
|
|
|
Lease inducement, less accumulated amortization of $109 and
$138, respectively
|
|
|
220
|
|
|
|
191
|
|
|
Redeemable convertible preferred stock:
|
|
|
|
|
|
|
|
|
|
Series A-1
Preferred Stock, $0.0001 par value, voting, redeemable;
Authorized 19,354 shares; issued 14,285 at January 1,
2010 and 16,752 at December 31, 2010; redemption value
$14,762 at January 1, 2010 and $17,311 at December 31,
2010
|
|
|
14,678
|
|
|
|
17,262
|
|
|
Class A-1
Exchangeable Shares, no par value, voting, redeemable; Unlimited
shares authorized; issued 5,069 at January 1, 2010 and
2,602 at December 31, 2010; redemption value $5,238 at
January 1, 2010 and $2,689 at December 31, 2010
|
|
|
5,229
|
|
|
|
2,685
|
|
|
Special A-1
Voting Stock, $0.0001 par value; Authorized and issued one
share at each period end
|
|
|
—
|
|
|
|
—
|
|
|
|
|
|
|
|
|
|
|
|
|
Stockholders’ equity:
|
|
|
|
|
|
|
|
|
|
Standard Common Stock, $0.0001 par value; Authorized
105,000 shares; issued 44,238 at January 1, 2010 and
45,475 at December 31, 2010
|
|
|
4
|
|
|
|
5
|
|
|
Special Common Voting Stock, $0.0001 par value; Authorized
and issued one share at each period end
|
|
|
—
|
|
|
|
—
|
|
|
Common Exchangeable Shares, no par value, voting; Unlimited
shares authorized; issued 15,945 at January 1, 2010 and
14,167 at December 31, 2010
|
|
|
41,454
|
|
|
|
36,252
|
|
|
Additional paid-in capital
|
|
|
74,981
|
|
|
|
80,357
|
|
|
Accumulated deficit
|
|
|
(115,049
|
)
|
|
|
(108,005
|
)
|
|
|
|
|
|
|
|
|
|
|
|
Total stockholders’ equity
|
|
|
1,390
|
|
|
|
8,609
|
|
|
Guarantees and commitments
|
|
|
|
|
|
|
|
|
|
|
|
|
|
|
|
|
|
|
|
Total liabilities and equity
|
|
$
|
32,911
|
|
|
$
|
42,479
|
|
|
|
|
|
|
|
|
|
|
|
See accompanying notes to consolidated financial statements.
F-3
SiGe
SEMICONDUCTOR, INC.
CONSOLIDATED
STATEMENTS OF OPERATIONS
(in
thousands of U.S. dollars and shares, except per share
amounts)
| |
|
|
|
|
|
|
|
|
|
|
|
|
|
|
|
Year Ended
|
|
|
Year Ended
|
|
|
Year Ended
|
|
|
|
|
January 2,
|
|
|
January 1,
|
|
|
December 31,
|
|
|
|
|
2009
|
|
|
2010
|
|
|
2010
|
|
|
|
|
Revenue
|
|
$
|
96,921
|
|
|
$
|
82,602
|
|
|
$
|
103,318
|
|
|
Cost of revenue
|
|
|
63,233
|
|
|
|
53,584
|
|
|
|
66,526
|
|
|
|
|
|
|
|
|
|
|
|
|
|
|
|
|
Gross profit
|
|
|
33,688
|
|
|
|
29,018
|
|
|
|
36,792
|
|
|
Operating expenses:
|
|
|
|
|
|
|
|
|
|
|
|
|
|
Research and development
|
|
|
16,402
|
|
|
|
15,052
|
|
|
|
14,449
|
|
|
Selling, general and administrative
|
|
|
21,569
|
|
|
|
18,489
|
|
|
|
17,846
|
|
|
Restructuring
|
|
|
(120
|
)
|
|
|
—
|
|
|
|
—
|
|
|
|
|
|
|
|
|
|
|
|
|
|
|
|
|
|
|
|
37,851
|
|
|
|
33,541
|
|
|
|
32,295
|
|
|
|
|
|
|
|
|
|
|
|
|
|
|
|
|
(Loss) income from operations
|
|
|
(4,163
|
)
|
|
|
(4,523
|
)
|
|
|
4,497
|
|
|
Interest income, net
|
|
|
380
|
|
|
|
167
|
|
|
|
32
|
|
|
|
|
|
|
|
|
|
|
|
|
|
|
|
|
(Loss) income before income taxes
|
|
|
(3,783
|
)
|
|
|
(4,356
|
)
|
|
|
4,529
|
|
|
Income taxes (recovery)
|
|
|
17
|
|
|
|
21
|
|
|
|
(2,515
|
)
|
|
|
|
|
|
|
|
|
|
|
|
|
|
|
|
Net (loss) income and comprehensive (loss) income
|
|
|
(3,800
|
)
|
|
|
(4,377
|
)
|
|
|
7,044
|
|
|
|
|
|
|
|
|
|
|
|
|
|
|
|
|
Accretion to redemption value of preferred stock
|
|
|
(39
|
)
|
|
|
(39
|
)
|
|
|
(40
|
)
|
|
Net income allocated to redeemable convertible preferred
stockholders
|
|
|
—
|
|
|
|
—
|
|
|
|
(2,920
|
)
|
|
|
|
|
|
|
|
|
|
|
|
|
|
|
|
Net (loss) income attributable to common stockholders
|
|
$
|
(3,839
|
)
|
|
$
|
(4,416
|
)
|
|
$
|
4,084
|
|
|
|
|
|
|
|
|
|
|
|
|
|
|
|
|
Net (loss) income per share attributable to common stockholders
|
|
|
|
|
|
|
|
|
|
|
|
|
|
Basic
|
|
$
|
(0.06
|
)
|
|
$
|
(0.07
|
)
|
|
$
|
0.07
|
|
|
|
|
|
|
|
|
|
|
|
|
|
|
|
|
Diluted
|
|
$
|
(0.06
|
)
|
|
$
|
(0.07
|
)
|
|
$
|
0.06
|
|
|
|
|
|
|
|
|
|
|
|
|
|
|
|
|
Shares used to compute net (loss) income per share attributable
to common stockholders
|
|
|
|
|
|
|
|
|
|
|
|
|
|
Basic
|
|
|
59,763
|
|
|
|
60,100
|
|
|
|
59,898
|
|
|
Diluted
|
|
|
59,763
|
|
|
|
60,100
|
|
|
|
72,908
|
|
|
Pro forma net income per share attributable to common
stockholders (unaudited)
|
|
|
|
|
|
|
|
|
|
|
|
|
|
Basic
|
|
|
|
|
|
|
|
|
|
$
|
0.09
|
|
|
|
|
|
|
|
|
|
|
|
|
|
|
|
|
Diluted
|
|
|
|
|
|
|
|
|
|
$
|
0.08
|
|
|
|
|
|
|
|
|
|
|
|
|
|
|
|
|
Shares used to compute pro forma net income per share
attributable to common stockholders (unaudited)
|
|
|
|
|
|
|
|
|
|
|
|
|
|
Basic
|
|
|
|
|
|
|
|
|
|
|
79,252
|
|
|
Diluted
|
|
|
|
|
|
|
|
|
|
|
92,262
|
|
See accompanying notes to consolidated financial statements.
F-4
SiGe
SEMICONDUCTOR, INC.
CONSOLIDATED
STATEMENTS OF STOCKHOLDERS’ EQUITY AND REDEEMABLE
CONVERTIBLE PREFERRED STOCK
(in
thousands of U.S. dollars and shares)
| |
|
|
|
|
|
|
|
|
|
|
|
|
|
|
|
|
|
|
|
|
|
|
|
|
|
|
|
|
|
|
|
|
|
|
|
|
|
|
|
|
|
|
|
|
|
|
|
|
|
|
|
|
|
|
|
Redeemable Convertible Preferred Stock
|
|
|
|
Stockholders’ Equity
|
|
|
|
|
|
|
|
|
|
|
|
|
|
|
|
|
|
|
|
|
|
|
|
|
|
|
|
|
|
|
|
|
|
|
|
|
|
|
Total
|
|
|
|
|
|
|
|
|
|
|
|
|
|
Previously
|
|
|
|
Standard
|
|
|
Common
|
|
|
Special
|
|
|
|
|
|
|
|
|
Stock-
|
|
|
|
|
Series A-1
|
|
|
Special A-1
|
|
|
Class A-1-
|
|
|
Issued
|
|
|
|
Common
|
|
|
Exchange-
|
|
|
Common
|
|
|
|
|
|
|
|
|
holders’
|
|
|
|
|
Preferred
|
|
|
Voting
|
|
|
Exchange-
|
|
|
Preferred
|
|
|
|
Stock
|
|
|
able Shares
|
|
|
Voting
|
|
|
Paid-in
|
|
|
|
|
|
Equity
|
|
|
|
|
Stock
|
|
|
Stock(1)
|
|
|
able Shares
|
|
|
Stock
|
|
|
|
Shares
|
|
|
Amount
|
|
|
Shares
|
|
|
Amount
|
|
|
Stock(1)
|
|
|
Capital
|
|
|
Deficit
|
|
|
(Deficit)
|
|
|
Balance, December 28, 2007
|
|
$
|
14,608
|
|
|
$
|
—
|
|
|
$
|
5,221
|
|
|
$
|
—
|
|
|
|
|
43,732
|
|
|
$
|
4
|
|
|
|
15,945
|
|
|
$
|
41,454
|
|
|
$
|
—
|
|
|
$
|
73,405
|
|
|
$
|
(106,872
|
)
|
|
$
|
7,991
|
|
|
Issuance of 262 Standard Common Stock on exercise of stock
options
|
|
|
—
|
|
|
|
—
|
|
|
|
—
|
|
|
|
—
|
|
|
|
|
262
|
|
|
|
—
|
|
|
|
—
|
|
|
|
—
|
|
|
|
—
|
|
|
|
23
|
|
|
|
—
|
|
|
|
23
|
|
|
Stock-based compensation
|
|
|
—
|
|
|
|
—
|
|
|
|
—
|
|
|
|
—
|
|
|
|
|
—
|
|
|
|
—
|
|
|
|
—
|
|
|
|
—
|
|
|
|
—
|
|
|
|
676
|
|
|
|
—
|
|
|
|
676
|
|
|
Accretion of redeemable convertible preferred stock
|
|
|
35
|
|
|
|
—
|
|
|
|
4
|
|
|
|
—
|
|
|
|
|
—
|
|
|
|
—
|
|
|
|
—
|
|
|
|
—
|
|
|
|
—
|
|
|
|
(39
|
)
|
|
|
—
|
|
|
|
(39
|
)
|
|
Net loss and comprehensive loss
|
|
|
—
|
|
|
|
—
|
|
|
|
—
|
|
|
|
—
|
|
|
|
|
—
|
|
|
|
—
|
|
|
|
—
|
|
|
|
—
|
|
|
|
—
|
|
|
|
—
|
|
|
|
(3,800
|
)
|
|
|
(3,800
|
)
|
|
|
|
|
|
|
|
|
|
|
|
|
|
|
|
|
|
|
|
|
|
|
|
|
|
|
|
|
|
|
|
|
|
|
|
|
|
|
|
|
|
|
|
|
|
|
|
|
|
|
|
|
Balance, January 2, 2009
|
|
|
14,643
|
|
|
|
—
|
|
|
|
5,225
|
|
|
|
—
|
|
|
|
|
43,994
|
|
|
|
4
|
|
|
|
15,945
|
|
|
|
41,454
|
|
|
|
—
|
|
|
|
74,065
|
|
|
|
(110,672
|
)
|
|
|
4,851
|
|
|
Issuance of 244 Standard Common Stock on exercise of stock
options
|
|
|
—
|
|
|
|
—
|
|
|
|
—
|
|
|
|
—
|
|
|
|
|
244
|
|
|
|
—
|
|
|
|
—
|
|
|
|
—
|
|
|
|
—
|
|
|
|
41
|
|
|
|
—
|
|
|
|
41
|
|
|
Stock-based compensation
|
|
|
—
|
|
|
|
—
|
|
|
|
—
|
|
|
|
—
|
|
|
|
|
—
|
|
|
|
—
|
|
|
|
—
|
|
|
|
—
|
|
|
|
—
|
|
|
|
914
|
|
|
|
—
|
|
|
|
914
|
|
|
Accretion of redeemable convertible preferred stock
|
|
|
35
|
|
|
|
—
|
|
|
|
4
|
|
|
|
—
|
|
|
|
|
—
|
|
|
|
—
|
|
|
|
—
|
|
|
|
—
|
|
|
|
—
|
|
|
|
(39
|
)
|
|
|
—
|
|
|
|
(39
|
)
|
|
Net loss and comprehensive loss
|
|
|
—
|
|
|
|
—
|
|
|
|
—
|
|
|
|
—
|
|
|
|
|
—
|
|
|
|
—
|
|
|
|
—
|
|
|
|
—
|
|
|
|
—
|
|
|
|
—
|
|
|
|
(4,377
|
)
|
|
|
(4,377
|
)
|
|
|
|
|
|
|
|
|
|
|
|
|
|
|
|
|
|
|
|
|
|
|
|
|
|
|
|
|
|
|
|
|
|
|
|
|
|
|
|
|
|
|
|
|
|
|
|
|
|
|
|
|
Balance, January 1, 2010
|
|
|
14,678
|
|
|
|
—
|
|
|
|
5,229
|
|
|
|
—
|
|
|
|
|
44,238
|
|
|
|
4
|
|
|
|
15,945
|
|
|
|
41,454
|
|
|
|
—
|
|
|
|
74,981
|
|
|
|
(115,049
|
)
|
|
|
1,390
|
|
|
Exchange of 2,467
Class A-1
Exchangeable Shares to 2,467
Series A-1
Preferred Stock
|
|
|
2,546
|
|
|
|
—
|
|
|
|
(2,546
|
)
|
|
|
—
|
|
|
|
|
—
|
|
|
|
—
|
|
|
|
—
|
|
|
|
—
|
|
|
|
—
|
|
|
|
—
|
|
|
|
—
|
|
|
|
—
|
|
|
Exchange of 1,778 Common Exchangeable Shares to 1,778 Standard
Common Stock
|
|
|
—
|
|
|
|
—
|
|
|
|
—
|
|
|
|
—
|
|
|
|
|
1,778
|
|
|
|
1
|
|
|
|
(1,778
|
)
|
|
|
(5,202
|
)
|
|
|
—
|
|
|
|
5,201
|
|
|
|
—
|
|
|
|
—
|
|
|
Issuance of 59 Standard Common Stock on exercise of stock
options
|
|
|
—
|
|
|
|
—
|
|
|
|
—
|
|
|
|
—
|
|
|
|
|
59
|
|
|
|
—
|
|
|
|
—
|
|
|
|
—
|
|
|
|
—
|
|
|
|
12
|
|
|
|
—
|
|
|
|
12
|
|
|
Purchase of 600 Standard Common Stock
|
|
|
—
|
|
|
|
—
|
|
|
|
—
|
|
|
|
—
|
|
|
|
|
(600
|
)
|
|
|
—
|
|
|
|
—
|
|
|
|
—
|
|
|
|
—
|
|
|
|
(600
|
)
|
|
|
—
|
|
|
|
(600
|
)
|
|
Stock-based compensation
|
|
|
—
|
|
|
|
—
|
|
|
|
—
|
|
|
|
—
|
|
|
|
|
—
|
|
|
|
—
|
|
|
|
—
|
|
|
|
—
|
|
|
|
—
|
|
|
|
803
|
|
|
|
—
|
|
|
|
803
|
|
|
Accretion of redeemable convertible preferred stock
|
|
|
38
|
|
|
|
—
|
|
|
|
2
|
|
|
|
—
|
|
|
|
|
—
|
|
|
|
—
|
|
|
|
—
|
|
|
|
—
|
|
|
|
—
|
|
|
|
(40
|
)
|
|
|
—
|
|
|
|
(40
|
)
|
|
Net income and comprehensive income
|
|
|
—
|
|
|
|
—
|
|
|
|
—
|
|
|
|
—
|
|
|
|
|
—
|
|
|
|
—
|
|
|
|
—
|
|
|
|
—
|
|
|
|
—
|
|
|
|
—
|
|
|
|
7,044
|
|
|
|
7,044
|
|
|
|
|
|
|
|
|
|
|
|
|
|
|
|
|
|
|
|
|
|
|
|
|
|
|
|
|
|
|
|
|
|
|
|
|
|
|
|
|
|
|
|
|
|
|
|
|
|
|
|
|
|
Balance, December 31, 2010
|
|
$
|
17,262
|
|
|
$
|
—
|
|
|
$
|
2,685
|
|
|
$
|
—
|
|
|
|
|
45,475
|
|
|
$
|
5
|
|
|
|
14,167
|
|
|
$
|
36,252
|
|
|
$
|
—
|
|
|
$
|
80,357
|
|
|
$
|
(108,005
|
)
|
|
$
|
8,609
|
|
|
|
|
|
|
|
|
|
|
|
|
|
|
|
|
|
|
|
|
|
|
|
|
|
|
|
|
|
|
|
|
|
|
|
|
|
|
|
|
|
|
|
|
|
|
|
|
|
|
|
|
|
|
|
|
(1) |
|
Activity and balances amount to less than $1. |
See accompanying notes to consolidated financial statements.
F-5
SiGe
SEMICONDUCTOR, INC.
CONSOLIDATED
STATEMENTS OF CASH FLOWS
(in
thousands of U.S. dollars)
| |
|
|
|
|
|
|
|
|
|
|
|
|
|
|
|
|
|
|
|
|
|
|
|
Year Ended
|
|
|
Year Ended
|
|
|
Year Ended
|
|
|
|
|
|
|
|
|
|
|
January 2,
|
|
|
January 1,
|
|
|
December 31,
|
|
|
|
|
|
|
|
|
|
|
2009
|
|
|
2010
|
|
|
2010
|
|
|
|
|
|
|
|
|
|
|
Operating activities:
|
|
|
|
|
|
|
|
|
|
|
|
|
|
|
|
|
|
|
|
|
|
Net (loss) income
|
|
$
|
(3,800
|
)
|
|
$
|
(4,377
|
)
|
|
$
|
7,044
|
|
|
|
|
|
|
|
|
|
|
Items not involving cash:
|
|
|
|
|
|
|
|
|
|
|
|
|
|
|
|
|
|
|
|
|
|
Depreciation
|
|
|
1,276
|
|
|
|
1,315
|
|
|
|
1,459
|
|
|
|
|
|
|
|
|
|
|
Amortization of lease inducement
|
|
|
(27
|
)
|
|
|
(26
|
)
|
|
|
(29
|
)
|
|
|
|
|
|
|
|
|
|
Stock-based compensation
|
|
|
676
|
|
|
|
914
|
|
|
|
803
|
|
|
|
|
|
|
|
|
|
|
Deferred income taxes
|
|
|
—
|
|
|
|
—
|
|
|
|
(2,544
|
)
|
|
|
|
|
|
|
|
|
|
Change in non-cash operating working capital:
|
|
|
|
|
|
|
|
|
|
|
|
|
|
|
|
|
|
|
|
|
|
Accounts receivable
|
|
|
(771
|
)
|
|
|
(87
|
)
|
|
|
1,203
|
|
|
|
|
|
|
|
|
|
|
Investment tax credits receivable
|
|
|
(469
|
)
|
|
|
(190
|
)
|
|
|
292
|
|
|
|
|
|
|
|
|
|
|
Inventory
|
|
|
(5,994
|
)
|
|
|
3,587
|
|
|
|
(6,107
|
)
|
|
|
|
|
|
|
|
|
|
Prepaid expenses and other current assets
|
|
|
129
|
|
|
|
(101
|
)
|
|
|
(451
|
)
|
|
|
|
|
|
|
|
|
|
Accounts payable
|
|
|
4,649
|
|
|
|
(3,848
|
)
|
|
|
2,053
|
|
|
|
|
|
|
|
|
|
|
Accrued liabilities
|
|
|
(75
|
)
|
|
|
(710
|
)
|
|
|
270
|
|
|
|
|
|
|
|
|
|
|
Restructuring liability
|
|
|
(308
|
)
|
|
|
—
|
|
|
|
—
|
|
|
|
|
|
|
|
|
|
|
|
|
|
|
|
|
|
|
|
|
|
|
|
|
|
|
|
|
|
|
|
|
Cash provided by (used in) operating activities
|
|
|
(4,714
|
)
|
|
|
(3,523
|
)
|
|
|
3,993
|
|
|
|
|
|
|
|
|
|
|
Investing activities:
|
|
|
|
|
|
|
|
|
|
|
|
|
|
|
|
|
|
|
|
|
|
Purchase of property and equipment
|
|
|
(2,291
|
)
|
|
|
(1,243
|
)
|
|
|
(1,942
|
)
|
|
|
|
|
|
|
|
|
|
|
|
|
|
|
|
|
|
|
|
|
|
|
|
|
|
|
|
|
|
|
|
Cash used in investing activities
|
|
|
(2,291
|
)
|
|
|
(1,243
|
)
|
|
|
(1,942
|
)
|
|
|
|
|
|
|
|
|
|
Financing activities:
|
|
|
|
|
|
|
|
|
|
|
|
|
|
|
|
|
|
|
|
|
|
Proceeds on exercise of Standard Common Stock options
|
|
|
23
|
|
|
|
41
|
|
|
|
12
|
|
|
|
|
|
|
|
|
|
|
Purchase of Standard Common Stock
|
|
|
—
|
|
|
|
—
|
|
|
|
(600
|
)
|
|
|
|
|
|
|
|
|
|
Increase in deferred costs of equity offering
|
|
|
—
|
|
|
|
—
|
|
|
|
(2,109
|
)
|
|
|
|
|
|
|
|
|
|
|
|
|
|
|
|
|
|
|
|
|
|
|
|
|
|
|
|
|
|
|
|
Cash provided by (used in) financing activities
|
|
|
23
|
|
|
|
41
|
|
|
|
(2,697
|
)
|
|
|
|
|
|
|
|
|
|
Effect of exchange rates on cash
|
|
|
55
|
|
|
|
84
|
|
|
|
36
|
|
|
|
|
|
|
|
|
|
|
|
|
|
|
|
|
|
|
|
|
|
|
|
|
|
|
|
|
|
|
|
|
Decrease in cash and cash equivalents
|
|
|
(6,927
|
)
|
|
|
(4,641
|
)
|
|
|
(610
|
)
|
|
|
|
|
|
|
|
|
|
Cash and cash equivalents, beginning of period
|
|
|
22,570
|
|
|
|
15,643
|
|
|
|
11,002
|
|
|
|
|
|
|
|
|
|
|
|
|
|
|
|
|
|
|
|
|
|
|
|
|
|
|
|
|
|
|
|
|
Cash and cash equivalents, end of period
|
|
$
|
15,643
|
|
|
$
|
11,002
|
|
|
|
10,392
|
|
|
|
|
|
|
|
|
|
|
|
|
|
|
|
|
|
|
|
|
|
|
|
|
|
|
|
|
|
|
|
|
Supplementary disclosures of cash flow information:
|
|
|
|
|
|
|
|
|
|
|
|
|
|
|
|
|
|
|
|
|
|
Cash paid for interest
|
|
$
|
—
|
|
|
$
|
—
|
|
|
$
|
9
|
|
|
|
|
|
|
|
|
|
|
Cash paid for taxes
|
|
|
—
|
|
|
|
—
|
|
|
|
—
|
|
|
|
|
|
|
|
|
|
|
Supplementary disclosure of non cash items:
|
|
|
|
|
|
|
|
|
|
|
|
|
|
|
|
|
|
|
|
|
|
Accretion of Redeemable Convertible Preferred Stock
|
|
|
39
|
|
|
|
39
|
|
|
|
40
|
|
|
|
|
|
|
|
|
|
|
|
|
|
|
|
|
|
|
|
|
|
|
|
|
|
|
|
|
|
|
|
See accompanying notes to consolidated financial statements.
F-6
SiGe
SEMICONDUCTOR, INC.
(in thousands of U.S.
dollars and shares, except per share amounts.)
SiGe Semiconductor, Inc. (“SiGe U.S.” or the
“Company”) is a fabless semiconductor company that
designs and supplies high performance front end solutions for
wireless products. SiGe U.S. was incorporated in the State
of Delaware on December 19, 2002 in connection with the
sale of the Company’s Series B Preferred Stock.
Previously the business was operated as SiGe Semiconductor Inc.
(“SiGe Canada”), which is now the Canadian subsidiary
of SiGe U.S. As the context dictates, SiGe U.S. or the
Company refers either to the consolidated group of companies or
to SiGe U.S. as a legal entity.
|
|
|
1.
|
Significant
Accounting Policies
|
|
|
|
(a)
|
Basis of
Consolidation
|
The consolidated financial statements include the accounts of
the Company and its subsidiaries, SiGe Semiconductor Inc.
(“SiGe Canada”), SiGe Semiconductor (Europe) Limited,
SiGe Semiconductor (U.S.), Corp (“SiGe Corp.”), SiGe
Semiconductor (Hong Kong) Limited, SiGe Semiconductor Canada
(Canadian partnership) and SiGe Holdings Inc. All significant
intercompany balances and transactions have been eliminated.
|
|
|
(b)
|
Estimates and
Assumptions
|
The preparation of financial statements in conformity with
accounting principles generally accepted in the United States of
America requires management to make estimates and assumptions
that affect the reported amounts of assets and liabilities and
disclosure of contingent assets and liabilities at the dates of
the financial statements and the reported amounts of revenues
and expenses during the year. Actual results could differ from
these estimates. Significant management estimates include
assumptions used in the valuation of accounts receivable, the
determination of inventory reserves, stock-based compensation
expense, warranty reserves, sales returns reserves and
allowances, income tax valuation allowance and estimating the
investment tax credits receivable.
The Company uses a 52- or 53-week fiscal year ending on the
Friday closest to December 31 of each year. Fiscal 2008
consisted of 53 weeks and ended on January 2, 2009,
fiscal 2009 consisted of 52 weeks and ended on
January 1, 2010 and fiscal 2010 consisted of 52 weeks
and ended on December 31, 2010.
Cash equivalents are highly liquid investments with original
maturities of three months or less and are carried at cost,
which approximates market value.
Inventory is stated at the lower of cost and market. Cost is
determined using the
first-in,
first-out method. The Company periodically reviews inventory for
evidence of slow moving or obsolete parts, and the estimated
reserve is based on management’s review of inventory on
hand, compared to forecasted sales and assumptions about the
likelihood of obsolescence.
F-7
SiGe
SEMICONDUCTOR, INC.
NOTES TO
CONSOLIDATED FINANCIAL
STATEMENTS — (Continued)
(in thousands of U.S. dollars
and shares, except per share amounts.)
|
|
|
(f)
|
Fair Value of
Financial Instruments
|
The carrying amount of cash and cash equivalents, accounts
receivable, accounts payable and accrued liabilities are
considered to be representative of the respective fair value
because of the short-term nature of these items.
|
|
|
(g)
|
Property and
Equipment
|
Property and equipment are recorded at cost after deducting
applicable investment tax credits. Property and equipment under
capital leases are recorded at the present value of minimum
lease payments. Depreciation is provided on a straight-line
basis beginning when an asset is put into service and amortized
over the estimated useful lives of the asset.
|
|
|
(h)
|
Impairment of
Long-Lived Assets
|
The Company periodically reviews the useful lives and the
carrying values of its long-lived assets. The Company reviews
its long-lived assets for impairment whenever events or changes
in circumstances indicate that the carrying amount of the assets
may not be recoverable. If the sum of the undiscounted expected
future cash flows expected to result from the use and eventual
disposition of an asset is less than its carrying amount, it is
considered to be impaired. An impairment loss is measured as the
amount by which the carrying amount of the asset exceeds its
fair value, which is estimated as the expected future cash flows
discounted at a rate commensurate with the risks associated with
the recovery of the asset.
The lease inducement represents a tenant improvement allowance
provided to the Company by a lessor in connection with a leased
property. This allowance has been deferred as a lease inducement
and is being amortized as a reduction in rent expense over the
term of the lease.
The Company recognizes revenue, net of trade discounts and
allowances, provided that (i) persuasive evidence of an
arrangement exists, (ii) delivery has occurred,
(iii) the price is fixed or determinable and
(iv) collectibility is reasonably assured. Persuasive
evidence of arrangement exists when there is evidence of an
exchange agreement with a buyer that clearly specifies the terms
of the arrangement. Delivery is considered to have occurred when
title and risk of loss have transferred to the customer and
customer acceptance provisions and specifications have been met.
The Company considers the price to be fixed or determinable when
the price is not subject to refund or adjustments or when any
such adjustments are accounted for. The Company evaluates the
creditworthiness of its customers to determine that appropriate
credit limits are established prior to the acceptance of an
order. Revenue, including sales to distributors, is reduced for
estimated returns and distributor allowances. The Company
recognizes revenue from sales of its products to distributors
upon delivery of products to the distributors. An allowance for
distributor credits covering price adjustments and return
allowances is made at the time of sale based on the
Company’s estimate of historical experience rates as well
as considering economic conditions and contractual terms.
Revenues are recorded net of any sales taxes.
F-8
SiGe
SEMICONDUCTOR, INC.
NOTES TO
CONSOLIDATED FINANCIAL
STATEMENTS — (Continued)
(in thousands of U.S. dollars
and shares, except per share amounts.)
The Company’s products are covered by product warranty
plans that generally cover a one-year period. A liability for
the expected cost of warranty-related claims is established when
products are sold and the related revenue is recognized. The
amount of the warranty liability accrued reflects an estimate of
the expected future costs of honoring obligations under the
warranty plan. In estimating the warranty liability, historical
material replacement costs and any other historical warranty
costs are considered along with consideration of the life cycle
of products and actual return experience. Should future warranty
claims differ from historical levels, revisions to the estimated
warranty liability may be required.
The following table summarizes changes in the accrued warranty
liability:
| |
|
|
|
|
|
|
|
|
|
|
|
|
|
|
|
Years Ended
|
|
|
|
|
January 2,
|
|
|
January 1,
|
|
|
December 31,
|
|
|
|
|
2009
|
|
|
2010
|
|
|
2010
|
|
|
|
|
Beginning of period
|
|
$
|
347
|
|
|
$
|
201
|
|
|
$
|
342
|
|
|
Charged to cost of revenue
|
|
|
42
|
|
|
|
141
|
|
|
|
385
|
|
|
Utilized
|
|
|
(188
|
)
|
|
|
—
|
|
|
|
(306
|
)
|
|
|
|
|
|
|
|
|
|
|
|
|
|
|
|
End of period
|
|
$
|
201
|
|
|
$
|
342
|
|
|
$
|
421
|
|
|
|
|
|
|
|
|
|
|
|
|
|
|
|
|
|
|
(l)
|
Research and
Development
|
Costs related to research, design and development of the
Company’s products are charged to research and development
expense as incurred and are presented net of any associated
funding.
|
|
|
(m)
|
Government and
Other Funded Research and Development
|
The Company receives government and other funding towards
research and development projects. The Company accrues funding
when it meets the eligibility criteria as specified in the
contract and when receipt of the funding is probable. The
funding is recognized as a reduction of the related expenses. To
the extent funding recognized to date exceeds amounts received,
this amount is recorded in other current assets. Government
funding received in excess of amounts earned are recorded as
deferred research and development funding.
Certain funding is repayable through royalties in the event the
related research and development projects are successfully
commercialized. Royalty payments to date have been immaterial
and are recognized as an expense in the same period as the
related revenue is recognized. Certain funding can become
repayable if specified criteria or expenditure levels are not
met by the Company.
The Company accounts for refundable investment tax credits
related to eligible research and development projects as a
reduction of research and development expenses. Refundable
investment tax credits are accrued in the year the eligible
expenditure is incurred when management believes recovery of
such claims is probable.
The Company recognized $666, $1,568 and $4,024 as a reduction in
research and development expenses for fiscal 2008, 2009 and
2010, respectively.
The Company applies the asset and liability method of
recognizing deferred income taxes. Under this method, the
differences between the financial statement carrying amounts of
assets and liabilities
F-9
SiGe
SEMICONDUCTOR, INC.
NOTES TO
CONSOLIDATED FINANCIAL
STATEMENTS — (Continued)
(in thousands of U.S. dollars
and shares, except per share amounts.)
and their respective tax bases are recognized on the
Company’s balance sheet as deferred income tax assets or
liabilities using currently enacted tax rates. Deferred income
taxes are adjusted to reflect the effects of changes in tax laws
or enacted tax rates.
The Company has deferred tax assets, which are subject to
periodic recoverability assessments. Valuation allowances are
established, when necessary, to reduce deferred tax assets to
the amount that more likely than not will be realized. In
determining whether the deferred tax asset will be realized the
Company must make judgments regarding future taxable income that
can change in the near term due to changes in market conditions
and demand for the Company’s products or other factors. If
the Company’s assumptions and consequently its estimates
change in the future, the valuation allowance the Company has
established may be increased or decreased, resulting in a
material respective increase or decrease in income tax expense
(recovery) and related impact on the Company’s reported net
income (loss).
The Company has adopted a recognition threshold and measurement
methodology for the financial statement recognition and
measurement of a tax position taken or expected to be taken in a
tax return. The Company recognizes in the financial statements
the impact of a tax position, if that position is more likely
than not of being sustained on audit, based on technical merits
of the position. The policy used by the Company is to recognize
a tax exposure when it is more likely than not that the position
will not be upheld on its merits if challenged by the tax
authorities. Once the tax exposure meets this threshold, the
amount is measured as the largest amount of the benefit that is
greater than 50% likely of being realized upon settlement.
The Company accounts for non-refundable investment tax credits
using the flow-through method whereby investment tax credits are
accrued and applied to reduce tax.
|
|
|
(o)
|
Foreign
Currency Translation
|
The U.S. dollar is both the reporting and functional
currency for the financial statements of the Company and its
subsidiaries. The financial statements of the Company’s
subsidiaries are remeasured from the local currency to
U.S. dollars, as follows: monetary assets and liabilities
are translated at the exchange rate in effect at the balance
sheet date and non-monetary items at exchange rates in effect
when the assets were acquired or non-monetary liabilities
incurred. Revenue and expenses are measured at the average
exchange rates prevailing during the month of the transaction.
Foreign exchange gains or losses are included in operations in
the period. Foreign currency transactions are accorded similar
treatment.
All stock options granted by the Company to its employees are
recognized as expenses, based on the fair value of the
share-based payments at the date of grant. For purposes of
estimating the grant date fair value of stock-based compensation
the Company uses the Black Scholes option-pricing model. The
fair value of awards granted is recognized as compensation
expense over the requisite service period of the award.
|
|
|
(q)
|
Net (Loss)
Income Per Share
|
The Company follows the authoritative guidance which establishes
standards regarding the computation of earnings per share, or
EPS, by companies that have issued securities other than common
stock that contractually entitle the holder to participate in
dividends and earnings of the Company. The guidance requires
earnings available to common stockholders for the period, after
F-10
SiGe
SEMICONDUCTOR, INC.
NOTES TO
CONSOLIDATED FINANCIAL
STATEMENTS — (Continued)
(in thousands of U.S. dollars
and shares, except per share amounts.)
deduction of preferred stock dividends whether or not declared,
and accretion of preferred stock to its redemption value, to be
allocated between the common and preferred stockholders based on
their respective rights to receive dividends, whether or not
declared. Basic net (loss) income per share is then calculated
by dividing income allocable to common stockholders (after the
reduction for any preferred stock dividends and accretion
assuming current income for the period had been distributed) by
the weighted average number of shares of common stock
outstanding, net of shares repurchased by the Company, during
the period. The guidance does not require the presentation of
basic and diluted net (loss) income per share for securities
other than common stock; therefore, the following net (loss)
income per share amounts only pertain to the Company’s
common stock. The Company calculates diluted net (loss) income
per share under the as-if-converted method unless the conversion
of the preferred stock is anti-dilutive to basic net (loss)
income per share under the two-class method. The diluted net
(loss) income per share calculation uses the treasury stock
method to consider the impact of employee stock options.
| |
|
|
|
|
|
|
|
|
|
|
|
|
|
|
|
Years Ended
|
|
|
|
|
January 2,
|
|
|
January 1,
|
|
|
December 31,
|
|
|
|
|
2009
|
|
|
2010
|
|
|
2010
|
|
|
|
|
Historical
|
|
|
|
|
|
|
|
|
|
|
|
|
|
Numerator:
|
|
|
|
|
|
|
|
|
|
|
|
|
|
Net (loss) income
|
|
$
|
(3,800
|
)
|
|
$
|
(4,377
|
)
|
|
$
|
7,044
|
|
|
Accretion to redemption value of Preferred Stock
|
|
|
(39
|
)
|
|
|
(39
|
)
|
|
|
(40
|
)
|
|
Net income allocable to Redeemable Convertible Preferred
Stockholders
|
|
|
—
|
|
|
|
—
|
|
|
|
(2,920
|
)
|
|
|
|
|
|
|
|
|
|
|
|
|
|
|
|
Net (loss) income attributable to common stockholders
|
|
$
|
(3,839
|
)
|
|
$
|
(4,416
|
)
|
|
$
|
4,084
|
|
|
|
|
|
|
|
|
|
|
|
|
|
|
|
|
Denominator
|
|
|
|
|
|
|
|
|
|
|
|
|
|
Weighted average Standard Common shares outstanding
|
|
|
43,818
|
|
|
|
44,155
|
|
|
|
44,031
|
|
|
Weighted average Common Exchangeable Shares outstanding
|
|
|
15,945
|
|
|
|
15,945
|
|
|
|
15,867
|
|
|
|
|
|
|
|
|
|
|
|
|
|
|
|
|
Weighted average common shares outstanding — basic
|
|
|
59,763
|
|
|
|
60,100
|
|
|
|
59,898
|
|
|
Incremental shares for dilutive effect of stock options
|
|
|
—
|
|
|
|
—
|
|
|
|
13,010
|
|
|
|
|
|
|
|
|
|
|
|
|
|
|
|
|
Weighted average common shares outstanding — diluted
|
|
|
59,763
|
|
|
|
60,100
|
|
|
|
72,908
|
|
|
|
|
|
|
|
|
|
|
|
|
|
|
|
|
Net (loss) income per share attributable to common stockholders
|
|
|
|
|
|
|
|
|
|
|
|
|
|
Basic
|
|
$
|
(0.06
|
)
|
|
$
|
(0.07
|
)
|
|
$
|
0.07
|
|
|
|
|
|
|
|
|
|
|
|
|
|
|
|
|
Diluted
|
|
$
|
(0.06
|
)
|
|
$
|
(0.07
|
)
|
|
$
|
0.06
|
|
|
|
|
|
|
|
|
|
|
|
|
|
|
|
|
Historical outstanding anti-dilutive securities not included in
diluted net (loss) income per share calculation:
|
|
|
|
|
|
|
|
|
|
|
|
|
|
Redeemable Convertible Preferred Stock (as converted)
|
|
|
19,354
|
|
|
|
19,354
|
|
|
|
19,354
|
|
|
Common stock options
|
|
|
17,003
|
|
|
|
18,139
|
|
|
|
839
|
|
|
|
|
|
|
|
|
|
|
|
|
|
|
|
|
|
|
|
36,357
|
|
|
|
37,493
|
|
|
|
20,193
|
|
|
|
|
|
|
|
|
|
|
|
|
|
|
|
F-11
SiGe
SEMICONDUCTOR, INC.
NOTES TO
CONSOLIDATED FINANCIAL
STATEMENTS — (Continued)
(in thousands of U.S. dollars
and shares, except per share amounts.)
| |
|
|
|
|
|
|
|
Year Ended
|
|
|
|
|
December 31,
|
|
|
|
|
2010
|
|
|
|
|
Pro Forma (unaudited)
|
|
Net income
|
|
$
|
7,044
|
|
|
|
|
|
|
|
|
Pro forma basic and diluted net income per share attributable to
common stockholders
|
|
|
|
|
|
Basic
|
|
$
|
0.09
|
|
|
|
|
|
|
|
|
Diluted
|
|
|
0.08
|
|
|
|
|
|
|
|
|
Weighted average common shares outstanding — basic
|
|
|
59,898
|
|
|
Pro forma adjustments to reflect assumed weighted average effect
of conversion of Preferred Stock
|
|
|
19,354
|
|
|
|
|
|
|
|
|
Pro forma shares used to compute basic net income per share
attributable to common stockholders
|
|
|
79,252
|
|
|
Pro forma equivalent shares from common stock options
|
|
|
13,010
|
|
|
|
|
|
|
|
|
Pro forma shares used to compute diluted net income per share
attributable to common stockholders
|
|
|
92,262
|
|
|
|
|
|
|
|
Pro forma EPS is presented to demonstrate the effect on EPS
assuming outstanding redeemable convertible preferred stock will
convert to common stock at the beginning of the period presented
because conversion upon a qualifying initial public offering is
mandatory.
As a result on a pro forma basis the number of shares of
Standard Common Stock outstanding will be adjusted to reflect
1) the issuance of an aggregate of 14,167 shares of
the Company’s Common Stock issuable upon the automatic
exchange of all of the outstanding Common Exchangeable Shares of
SiGe Canada, as described in note 6 “Common
Exchangeable Shares” and (2) the automatic conversion
of all outstanding shares of the Company’s Redeemable
Convertible Preferred Stock, including all shares of the
Company’s Preferred Stock issued in exchange for all of the
outstanding Preferred Exchangeable Shares of SiGe Canada, into
an aggregate of 19,354 shares of the Company’s common
stock upon the completion of a qualifying initial public
offering.
|
|
|
(r)
|
Recent
Accounting Pronouncements
|
Effective for fiscal 2009, the Company adopted the Financial
Accounting Standards Board’s revised authoritative guidance
for business combinations. This revised guidance requires an
acquiring company to measure all assets acquired and liabilities
assumed, including contingent considerations and all contractual
contingencies, at fair value as of the acquisition date. For
pre-acquisition contingencies in a business combination an
acquirer is required to recognize at fair value an asset
acquired or liability assumed in a business combination that
arises from a contingency if the acquisition-date fair value of
the liability can be determined during the measurement period.
If the acquisition-date fair value cannot be determined, the
acquirer will apply the authoritative guidance used to evaluate
contingencies to determine whether the contingency should be
recognized as of the acquisition date or after the acquisition
date. In addition, an acquiring company is required to
capitalize in-process research and development and either
amortize it over the life of the product, or write it off if the
project is abandoned or impaired. Previously, post-acquisition
adjustments related to business combination deferred tax asset
valuation allowances and liabilities for uncertain tax positions
were generally required to be recorded as an increase or
decrease to goodwill. The revised guidance does not permit this
accounting and, generally, requires any such changes to be
recorded in current period income tax expense. Thus, all changes
to valuation allowances and liabilities for uncertain tax
F-12
SiGe
SEMICONDUCTOR, INC.
NOTES TO
CONSOLIDATED FINANCIAL
STATEMENTS — (Continued)
(in thousands of U.S. dollars
and shares, except per share amounts.)
positions established in acquisition accounting, regardless of
the guidance used to initially account for the business
combination, will be recognized in current period income tax
expense. The adoption of the revised guidance did not have an
impact on the consolidated financial statements, but the nature
and magnitude of the specific effects will depend upon the
nature, terms and size of the acquisitions consummated after the
effective date of January 3, 2009.
During fiscal 2009 the Company adopted Financial Accounting
Standards Board’s revised authoritative guidance for fair
value measurements, which clarifies the measurement of fair
value in a market that is not active, and is effective as of the
issue date, including application to prior periods for which
financial statements have not been issued. The Company also
adopted additional authoritative guidance for determining
whether a market is active or inactive, and whether a
transaction is distressed, is applicable to all assets and
liabilities (financial and nonfinancial) and which requires
enhanced disclosures. The adoption of this guidance did not have
a material impact on the consolidated financial position,
results of operations or cash flows.
Effective January 2, 2010, the Company adopted the
provisions of the FASB’s updated guidance related to fair
value measurements and disclosures, which require new
disclosures about significant transfers in and out of
Levels 1 and 2 fair value measurements and separate
disclosures about purchases, sales, issuances and settlements
relating to Level 3 fair value measurements. The updated
guidance also clarifies existing disclosure requirements
regarding inputs and valuation techniques, as well as the level
of disaggregation for each class of assets and liabilities for
which separate fair value measurements should be disclosed. The
guidance was effective January 1, 2010, except for the
separate disclosures about purchases, sales, issuances and
settlements relating to Level 3 measurements, which are
effective for the Company beginning in the first quarter of
fiscal year 2011. The Company’s adoption of the updated
guidance did not have an impact on its consolidated financial
statements and the deferred provisions are not expected to
significantly impact its consolidated financial statements.
In October 2009, the FASB issued new standards for revenue
recognition with multiple deliverables. These new standards
impact the determination of when the individual deliverables
included in a multiple-element arrangement should be treated as
separate units of accounting. Additionally, these new standards
modify the manner in which the transaction consideration is
allocated across the separately identified deliverables by no
longer permitting the residual method of allocating arrangement
consideration. These new standards are effective for the Company
beginning in the first quarter of fiscal year 2011, however
early adoption is permitted. The Company does not expect these
new standards to significantly impact its consolidated financial
statements.
| |
|
|
|
|
|
|
|
|
|
|
|
January 1,
|
|
|
December 31,
|
|
|
|
|
2010
|
|
|
2010
|
|
|
|
|
Trade accounts receivable
|
|
$
|
9,933
|
|
|
$
|
8,739
|
|
|
Allowance for doubtful accounts
|
|
|
(11
|
)
|
|
|
(20
|
)
|
|
|
|
|
|
|
|
|
|
|
|
|
|
$
|
9,922
|
|
|
$
|
8,719
|
|
|
|
|
|
|
|
|
|
|
|
F-13
SiGe
SEMICONDUCTOR, INC.
NOTES TO
CONSOLIDATED FINANCIAL
STATEMENTS — (Continued)
(in thousands of U.S. dollars
and shares, except per share amounts.)
| |
|
|
|
|
|
|
|
|
|
|
|
January 1,
|
|
|
December 31,
|
|
|
|
|
2010
|
|
|
2010
|
|
|
|
|
Work-in-process
|
|
$
|
5,594
|
|
|
$
|
9,505
|
|
|
Finished goods
|
|
|
1,009
|
|
|
|
3,205
|
|
|
|
|
|
|
|
|
|
|
|
|
|
|
$
|
6,603
|
|
|
$
|
12,710
|
|
|
|
|
|
|
|
|
|
|
|
|
|
|
4.
|
Property and
Equipment
|
| |
|
|
|
|
|
|
|
|
|
|
|
|
|
Useful life
|
|
January 1,
|
|
|
December 31,
|
|
|
|
|
(in years)
|
|
2010
|
|
|
2010
|
|
|
|
|
Computer hardware
|
|
3
|
|
$
|
840
|
|
|
$
|
1,067
|
|
|
Computer software
|
|
3
|
|
|
1,389
|
|
|
|
1,507
|
|
|
Furniture and fixtures
|
|
8
|
|
|
94
|
|
|
|
97
|
|
|
Laboratory and test equipment
|
|
5
|
|
|
3,224
|
|
|
|
4,794
|
|
|
Leasehold improvements
|
|
Shorter of
useful life and
lease term
|
|
|
935
|
|
|
|
939
|
|
|
|
|
|
|
|
|
|
|
|
|
|
|
|
|
|
|
|
6,482
|
|
|
|
8,404
|
|
|
Less accumulated depreciation and amortization
|
|
|
|
|
(3,317
|
)
|
|
|
(4,753
|
)
|
|
|
|
|
|
|
|
|
|
|
|
|
|
|
|
|
|
$
|
3,165
|
|
|
$
|
3,651
|
|
|
|
|
|
|
|
|
|
|
|
|
|
Depreciation expense related to property and equipment for the
fiscal years 2008, 2009 and 2010 was $1,276, $1,315 and $1,459
respectively.
| |
|
|
|
|
|
|
|
|
|
|
|
January 1,
|
|
|
December 31,
|
|
|
|
|
2010
|
|
|
2010
|
|
|
|
|
Warranty
|
|
$
|
342
|
|
|
$
|
421
|
|
|
Professional fees
|
|
|
206
|
|
|
|
372
|
|
|
Compensation related accruals
|
|
|
1,367
|
|
|
|
1,663
|
|
|
Third party commissions
|
|
|
2,277
|
|
|
|
2,088
|
|
|
Other
|
|
|
369
|
|
|
|
287
|
|
|
|
|
|
|
|
|
|
|
|
|
|
|
$
|
4,561
|
|
|
$
|
4,831
|
|
|
|
|
|
|
|
|
|
|
|
|
|
|
6.
|
Redeemable
Convertible Preferred Stock and Stockholders’
Equity
|
SiGe U.S. has issued
Series A-1,
Series D, Series C, Series B and Series A,
Redeemable Convertible Preferred Stock, Standard Common Stock,
Special A-1,
Special D, Special C, Special B, Special A and Special Common
Voting Stock and, SiGe Canada has issued
Class A-1,
Class D, Class C, Class B, Class A, and
Common Exchangeable Shares (collectively, the “Exchangeable
Shares”).
F-14
SiGe
SEMICONDUCTOR, INC.
NOTES TO
CONSOLIDATED FINANCIAL
STATEMENTS — (Continued)
(in thousands of U.S. dollars
and shares, except per share amounts.)
In May 2007, the Company completed its
Series A-1
round of financing, raising a total of $20,000 through the sale
of
Series A-1
Redeemable Convertible Preferred Stock and
Class A-1
Exchangeable Shares.
Immediately prior to the close of the
Series A-1
financing, the Series D, Series C, Series B and
Series A Preferred Stock of SiGe U.S. were converted
into Standard Common Stock of SiGe U.S. Correspondingly,
the Class D, Class C, Class B, Class A
Exchangeable Shares of SiGe Canada were converted into Common
Exchangeable Shares of SiGe Canada. Following conversion, a
reverse split of 3 to 1 was completed in respect of both the
Standard Common Stock of SiGe U.S. and the Common
Exchangeable Shares of SiGe Canada. All stock and option numbers
for prior periods have been adjusted to account for the 3 to 1
reverse split.
Upon the conversion of the Class D, Class C,
Class B, and Class A Exchangeable Shares into the
Common Exchangeable Shares of SiGe Canada the Special D, Special
C, Special B, and Special A Voting Stock of SiGe U.S. were
cancelled in accordance with the Amended and Restated
Certificate of Incorporation of SiGe U.S.
The
Class A-1
and Common Exchangeable Shares of SiGe Canada are exchangeable
into
Series A-1
Redeemable Convertible Preferred Stock and Standard Common Stock
of SiGe U.S. respectively, and the economic rights of the
shares of SiGe Canada, such as dividend, liquidation and
redemption payments, are determined by the rights of the
corresponding series of SiGe U.S. stock for which such
shares are exchangeable.
In June 2010, the Company received notification from one of its
stockholders of its intention to sell 600 shares of the
Company’s Standard Common Stock to a preferred shareholder.
The Company exercised its right of first refusal related to this
notification and purchased the Standard Common Stock for $600 on
July 6, 2010.
|
|
|
(a)
|
Series A-1
Redeemable Convertible Preferred Stock of SiGe
U.S.
|
As of December 31, 2010, SiGe U.S. had
Series A-1
Redeemable Convertible Preferred Stock (“Preferred
Stock”) and had reserved 19,354 shares of its Standard
Common Stock for the conversion of all the
Series A-1
Preferred Stock, including the
Series A-1
Preferred Stock issuable upon the exchange of the
Class A-1
Exchangeable Shares issued by SiGe Canada.
In the event of liquidation, dissolution or winding up of the
Company, including a merger or acquisition of the Company, a
sale of substantially all of the assets of the Company and other
similar events, any proceeds will be distributed in the
following priority sequence:
|
|
|
| |
(i)
|
The holders of the
Series A-1
Preferred Stock are entitled to share rateably the proceeds up
to their respective liquidation preferences of $1.2917 per share.
|
| |
| |
(ii)
|
The holders of the
Series A-1
Preferred Stock are entitled to receive an 8% dividend (when and
if declared) and any declared but unpaid dividends on their
stock.
|
| |
| |
(iii)
|
Any remaining proceeds would be distributed pro rata to all
stockholders, on an “as converted” to Standard Common
Stock basis.
|
Dividends declared and paid to the holders of any of the
Series A-1
Preferred Stock must also be paid to the holders of the
corresponding series of Exchangeable Shares. Any dividends to be
paid must be declared by the Board, and no dividends are due in
the event that the Preferred Stock is converted into Common
Stock. No dividends shall be declared or paid on Standard Common
Stock until the dividends on the
Series A-1
Preferred Stock have been paid. In fiscal 2007, as part of the
conversion of
F-15
SiGe
SEMICONDUCTOR, INC.
NOTES TO
CONSOLIDATED FINANCIAL
STATEMENTS — (Continued)
(in thousands of U.S. dollars
and shares, except per share amounts.)
the Series D, Series C, Series B and
Series A Preferred Stock of SiGe U.S. and the
conversion of the Class D, Class C, Class B and
Class A Exchangeable Shares of SiGe Canada, all rights to
accruing dividends were abandoned by the holders of the
Preferred Stock in SiGe U.S. and Exchangeable Shares of
SiGe Canada. At December 31, 2010, accruing non-cumulative
dividends totalled $1,600 on the
Series A-1
Preferred Stock and
Class A-1
Exchangeable Shares or $0.08 per share per annum but were not
declared or payable. As a result, no dividends have been accrued
in the financial statements.
The conversion of the
Series A-1
Preferred Stock of SiGe U.S. into Standard Common Stock of
SiGe U.S. is based on specified formulas, subject to
anti-dilution adjustments, and may be made at any time, at the
option of the holder. In addition, all of the
Series A-1
Preferred Stock is subject to mandatory conversion into Standard
Common Stock upon (a) the election of the holders of a
majority of the
Series A-1
Preferred Stock, voting as a single class; or (b) when the
Company makes a firm commitment underwritten public offering of
its Common Stock on a prescribed exchange at a price of at least
$2.5835 (adjusted as appropriate for stock splits, stock
dividends etc.) per share that results in net proceeds to the
Company of at least $30,000. The
Series A-1
Preferred Stock is convertible at the option of the holder into
Standard Common Stock at a rate of one share of Standard Common
Stock for each share of
Series A-1
Preferred Stock (as adjusted as appropriate for stock splits,
stock dividends etc. and subject to anti-dilution adjustments).
All of the
Series A-1
Preferred Stock shall be redeemed at any time after May 8,
2012, upon the written request of the holders of at least 67% of
the Preferred Stock, voting as a single class. The Company shall
redeem in three annual installments commencing on a date no more
than 90 days after the receipt of the request by the
Company (each payment date being referred to herein as a
“Redemption Date”), from any source of funds
legally available therefore, at the
Series A-1
Redemption Price (as defined below) all of the outstanding
Series A-1
Preferred Stock, plus any
Series A-1
Preferred Stock, thereafter issued on the exchange of
Class A-1
Exchangeable Shares (together with the
Series A-1
Preferred Stock, the “Redeemable Shares”). The number
of Redeemable Shares that the Company shall be required to
redeem on any one Redemption Date shall be equal to the
amount determined by dividing (i) the aggregate number of
Redeemable Shares outstanding immediately prior to such
Redemption Date by (ii) the number of remaining
Redemption Dates (including the Redemption Date to
which such calculation applies).
The
Series A-1
Preferred Stock to be redeemed on each Redemption Date
shall be redeemed by paying for each share in cash an amount
equal to the Original
Series A-1
Issue Price (as adjusted as appropriate for stock splits, stock
dividends etc. and subject to anti-dilution adjustments) plus
the amount of any declared but unpaid dividends on such share,
such amount being referred to as the
“Series A-1
Redemption Price.”
|
|
|
(b)
|
Capital Stock
of SiGe Canada
|
Each of the
Class A-1
and Common Exchangeable Shares of SiGe Canada are exchangeable
for shares of
Series A-1
Preferred Stock and Standard Common Stock of SiGe U.S.,
respectively, on a
share-for-share
basis (subject to adjustment). The exchange as to any
shareholder’s Exchangeable Shares may be completed at the
election of the shareholder at any time. The exchange of all of
the outstanding Exchangeable Shares shall be completed upon the
initial public offering of the Common Stock of SiGe U.S., or at
the option of the holders of a majority of the Exchangeable
Shares or the Board of Directors of SiGe U.S. upon a
merger, acquisition or any other specified change of control
event. The
Class A-1
and Common Exchangeable Shares, pursuant to their terms and
certain ancillary agreements entered into by the Company for the
benefit of holders of those Exchangeable Shares, entitle the
holders to dividend, liquidation, redemption and other rights
economically equivalent to the rights of the corresponding class
or series of shares of SiGe U.S.
F-16
SiGe
SEMICONDUCTOR, INC.
NOTES TO
CONSOLIDATED FINANCIAL
STATEMENTS — (Continued)
(in thousands of U.S. dollars
and shares, except per share amounts.)
As of December 31, 2010, SiGe U.S. had reserved
16,769 shares of its Standard Common Stock for issuance
upon the exchange of
Class A-1
Exchangeable Shares and Common Exchangeable Shares issued by
SiGe Canada.
All of the Class A Common Shares of SiGe Canada are
currently held by SiGe U.S. The Class A Common Shares
are the only voting and participating shares of SiGe Canada.
On April 1, 2010, two shareholders exchanged 1,713
Class A-1
Exchangeable Shares of SiGe Canada into 1,713
Series A-1
Preferred Stock of SiGe U.S.
On December 15, 2010, one shareholder exchanged
1,778 shares of Common Exchangeable Voting Stock and 754
Class A-1
Exchangeable Shares of SiGe Canada into 1,778 shares of
Standard Common Stock and 754
Series A-1
Preferred Stock of SiGe U.S. respectively.
The votes of each of the
Series A-1
Preferred Stock include the votes attributable to the one share
of the Special
A-1 Voting
Stock and Special Common Voting Stock of SiGe U.S. These
shares of Special Voting Stock are held by a trustee for the
benefit of the holders of Class
A-1 and
Common Exchangeable Shares of SiGe Canada. These shares of
Special Voting Stock carry that number of votes in SiGe
U.S. equal to the number of votes attributable to the
shares of SiGe U.S. issuable on the exchange of the
outstanding Exchangeable Shares. As a result, the holders of
Exchangeable Shares have voting rights in SiGe
U.S. substantially equivalent to the voting rights they
would hold if they exchanged shares of the applicable class of
SiGe Canada for the corresponding series of stock of SiGe U.S.
The Company has two stock option plans, the 1998 Stock Option
Plan (“1998 Plan”) and the 2002 Stock Plan (“2002
Plan”).
Under the 1998 Plan, the Company granted to its employees and
directors options to purchase common stock. Options generally
vest over a four-year period and expire on the fifth anniversary
date of the grant. In the event of an acquisition or an initial
public offering, options under this Plan vest immediately.
No new options have been granted from the 1998 Plan since 2002.
No options remain available for grant under this plan at
December 31, 2010.
Under the 2002 Plan, the Company can grant to its employees,
directors and consultants options to purchase up to 26,133
Standard Common Stock, including any options surrendered under
the 1998 Plan due to the departure of employees, directors and
consultants. Options currently granted vest generally over a
four-year period and expire on the tenth anniversary date of the
grant. For most employees, in the event of an acquisition, the
initial vesting period is accelerated by one year. There were
2,324 and 541 options available for grant under the 2002 Plan as
of January 1, 2010 and December 31, 2010, respectively.
F-17
SiGe
SEMICONDUCTOR, INC.
NOTES TO
CONSOLIDATED FINANCIAL
STATEMENTS — (Continued)
(in thousands of U.S. dollars
and shares, except per share amounts.)
The following is a summary of the activity for the
Company’s stock option plans for the years ended
January 2, 2009, January 1, 2010 and December 31,
2010:
| |
|
|
|
|
|
|
|
|
|
|
|
|
|
|
|
|
|
|
|
|
|
|
Weighted
|
|
|
|
|
|
Weighted
|
|
|
|
|
|
|
|
Average
|
|
|
Aggregate
|
|
|
Average
|
|
|
|
|
Number of
|
|
|
Exercise
|
|
|
Intrinsic
|
|
|
Contractual
|
|
|
|
|
Options
|
|
|
Price
|
|
|
Value
|
|
|
Term (Years)
|
|
|
|
|
Outstanding as at December 28, 2007
|
|
|
15,976
|
|
|
|
0.22
|
|
|
|
31
|
|
|
|
|
|
|
Granted
|
|
|
1,587
|
|
|
|
0.21
|
|
|
|
—
|
|
|
|
|
|
|
Exercised
|
|
|
(262
|
)
|
|
|
0.09
|
|
|
|
33
|
|
|
|
|
|
|
Forfeited
|
|
|
(298
|
)
|
|
|
0.86
|
|
|
|
—
|
|
|
|
|
|
|
|
|
|
|
|
|
|
|
|
|
|
|
|
|
|
|
|
|
Outstanding as at January 2, 2009
|
|
|
17,003
|
|
|
|
0.21
|
|
|
|
10
|
|
|
|
|
|
|
Granted
|
|
|
1,805
|
|
|
|
0.21
|
|
|
|
—
|
|
|
|
|
|
|
Exercised
|
|
|
(244
|
)
|
|
|
0.17
|
|
|
|
11
|
|
|
|
|
|
|
Forfeited
|
|
|
(425
|
)
|
|
|
0.21
|
|
|
|
—
|
|
|
|
|
|
|
|
|
|
|
|
|
|
|
|
|
|
|
|
|
|
|
|
|
Outstanding as at January 1, 2010
|
|
|
18,139
|
|
|
|
0.21
|
|
|
|
—
|
|
|
|
|
|
|
Granted
|
|
|
2,067
|
|
|
|
1.13
|
|
|
|
1,007
|
|
|
|
|
|
|
Exercised
|
|
|
(59
|
)
|
|
|
0.21
|
|
|
|
83
|
|
|
|
|
|
|
Forfeited
|
|
|
(284
|
)
|
|
|
0.28
|
|
|
|
380
|
|
|
|
|
|
|
|
|
|
|
|
|
|
|
|
|
|
|
|
|
|
|
|
|
Outstanding as at December 31, 2010
|
|
|
19,863
|
|
|
$
|
0.31
|
|
|
$
|
26,209
|
|
|
|
7.3
|
|
|
|
|
|
|
|
|
|
|
|
|
|
|
|
|
|
|
|
|
Vested and exercisable at January 2, 2009
|
|
|
7,702
|
|
|
$
|
0.21
|
|
|
|
|
|
|
|
|
|
|
|
|
|
|
|
|
|
|
|
|
|
|
|
|
|
|
|
|
Vested and exercisable at January 1, 2010
|
|
|
11,371
|
|
|
$
|
0.21
|
|
|
|
|
|
|
|
|
|
|
|
|
|
|
|
|
|
|
|
|
|
|
|
|
|
|
|
|
Vested and exercisable at December 31, 2010
|
|
|
15,132
|
|
|
$
|
0.22
|
|
|
|
|
|
|
|
|
|
|
|
|
|
|
|
|
|
|
|
|
|
|
|
|
|
|
|
The weighted average fair value per share of employee stock
options granted during the fiscal years 2008, 2009 and 2010 was
$0.11, $0.11 and $0.75, respectively.
The fair value of options on their date of grant was determined
using the Black-Scholes option-pricing model, using the
following weighted average assumptions:
| |
|
|
|
|
|
|
|
|
|
|
|
|
|
|
|
Years Ended
|
|
|
|
|
January 2,
|
|
|
January 1,
|
|
|
December 31,
|
|
|
|
|
2009
|
|
|
2010
|
|
|
2010
|
|
|
|
|
Risk-free interest rate
|
|
|
2.82
|
%
|
|
|
2.80
|
%
|
|
|
2.26
|
%
|
|
Dividend yield
|
|
|
—
|
|
|
|
—
|
|
|
|
—
|
|
|
Expected life of options (years)
|
|
|
4.0
|
|
|
|
6.1
|
|
|
|
6.1
|
|
|
Volatility
|
|
|
58.0
|
%
|
|
|
70.0
|
%
|
|
|
61.4
|
%
|
The Company elected to treat awards with graded vesting as a
single award when estimating fair value. Compensation cost is
recognized on a straight-line basis over the employee’s
requisite service period, which in the Company’s
circumstances is the stated vesting period of the award,
provided that total compensation cost recognized at least equals
the pro-rata value of the awards that have vested.
The risk-free interest rate assumption was based on the United
States Treasury’s rates for zero-coupon bonds with
maturities similar to those of the expected term of the award
being valued. The assumed dividend yield was based on the
Company’s expectation of not paying dividends in the
foreseeable future. The weighted average expected life of
options was calculated using the simplified method as prescribed
by guidance provided by the Securities and Exchange Commission.
This
F-18
SiGe
SEMICONDUCTOR, INC.
NOTES TO
CONSOLIDATED FINANCIAL
STATEMENTS — (Continued)
(in thousands of U.S. dollars
and shares, except per share amounts.)
decision was based on the lack of relevant historical data due
to the Company’s limited historical experience. In
addition, due to the Company’s limited historical data, the
estimated volatility incorporates the historical volatility of
comparable companies whose share prices are publicly available.
The Company made the following modification during the past
three years.
|
|
|
| |
(i)
|
In May 2009 the Company extended the term of its options from
5 years to 10 years. The term modification affected
16,683 outstanding options. Compensation costs in the amount of
$303 have been included in the statement of operations for the
2009 fiscal year as a result of this modification. The
incremental fair value of these options was $432 or $0.03 per
option representing the difference between the fair value of the
options under the original terms at the date of modification and
the fair value of the options under the new terms. The following
assumptions were used for calculating both the fair value of the
options under the original terms at the date of modification and
the fair value of the modified award: expected dividend
yield — 0%; risk-free interest rate between 1.00% and
2.48%; expected lives of between 1.64 and 5.87 years and
estimated volatility of 70%.
|
The following table summarizes information about stock options
outstanding at December 31, 2010:
| |
|
|
|
|
|
|
|
|
|
|
|
|
|
|
|
|
|
|
|
|
|
|
|
|
|
|
|
|
|
|
|
Options
|
|
|
Options
|
|
|
|
|
Outstanding
|
|
|
Exercisable
|
|
|
|
|
|
|
|
|
|
|
Weighted
|
|
|
|
|
|
|
|
|
Weighted
|
|
|
|
|
|
|
|
|
|
|
Weighted
|
|
|
Average
|
|
|
Aggregate
|
|
|
|
|
|
Average
|
|
|
Aggregate
|
|
|
|
|
Number
|
|
|
Average
|
|
|
Exercise
|
|
|
Intrinsic
|
|
|
Number
|
|
|
Exercise
|
|
|
Intrinsic
|
|
|
Exercise Prices
|
|
of Options
|
|
|
Remaining Life
|
|
|
Price
|
|
|
Value
|
|
|
of Options
|
|
|
Price
|
|
|
Value
|
|
|
|
|
$0.21
|
|
|
18,282
|
|
|
|
7.1
|
|
|
$
|
0.21
|
|
|
$
|
25,779
|
|
|
|
15,003
|
|
|
$
|
0.21
|
|
|
$
|
21,154
|
|
|
1.04
|
|
|
742
|
|
|
|
9.4
|
|
|
|
1.04
|
|
|
|
430
|
|
|
|
88
|
|
|
|
1.04
|
|
|
|
51
|
|
|
1.75
|
|
|
839
|
|
|
|
9.8
|
|
|
|
1.75
|
|
|
|
—
|
|
|
|
41
|
|
|
|
1.75
|
|
|
|
—
|
|
|
|
|
|
|
|
|
|
|
|
|
|
|
|
|
|
|
|
|
|
|
|
|
|
|
|
|
|
|
|
|
|
|
|
19,863
|
|
|
|
7.3
|
|
|
$
|
0.31
|
|
|
$
|
26,209
|
|
|
|
15,132
|
|
|
$
|
0.22
|
|
|
$
|
21,205
|
|
|
|
|
|
|
|
|
|
|
|
|
|
|
|
|
|
|
|
|
|
|
|
|
|
|
|
|
|
|
|
The Company recognized stock-based compensation in the statement
of operations as follows:
| |
|
|
|
|
|
|
|
|
|
|
|
|
|
|
|
Years Ended
|
|
|
|
|
January 2,
|
|
|
January 1,
|
|
|
December 31,
|
|
|
|
|
2009
|
|
|
2010
|
|
|
2010
|
|
|
|
|
Cost of revenue
|
|
$
|
17
|
|
|
$
|
37
|
|
|
$
|
23
|
|
|
Research and development
|
|
|
161
|
|
|
|
262
|
|
|
|
295
|
|
|
Selling, general and administrative
|
|
|
498
|
|
|
|
615
|
|
|
|
485
|
|
|
|
|
|
|
|
|
|
|
|
|
|
|
|
|
|
|
$
|
676
|
|
|
$
|
914
|
|
|
$
|
803
|
|
|
|
|
|
|
|
|
|
|
|
|
|
|
|
The total unrecognized compensation cost related to unvested
stock option grants as of January 1, 2010 and
December 31, 2010 was $985 and $1,751, respectively, and
the weighted average period over which these grants are expected
to vest is 0.9 years and 1.32 years, respectively.
On February 16, 2011 the Board of Directors approved the
grant of 255,000 options to purchase Standard Common Stock.
The Board of Directors also granted options to purchase an
additional 986,500 Standard Common Stock subject to a 3,000,000
increase in the number of shares of Standard Common Stock
reserved under the 2002 Plan which was approved by Stockholders
on March 15, 2011.
F-19
SiGe
SEMICONDUCTOR, INC.
NOTES TO
CONSOLIDATED FINANCIAL
STATEMENTS — (Continued)
(in thousands of U.S. dollars
and shares, except per share amounts.)
Standard Common Stock reserved for future issuance is as follows:
| |
|
|
|
|
|
|
|
|
|
|
|
January 1,
|
|
|
December 31,
|
|
|
|
|
2010
|
|
|
2010
|
|
|
|
|
Conversion of
Series A-1
Preferred Stock
|
|
|
14,285
|
|
|
|
16,752
|
|
|
Conversion of
Class A-1
Exchangeable Shares
|
|
|
5,069
|
|
|
|
2,602
|
|
|
Conversion of Common Exchangeable Shares
|
|
|
15,945
|
|
|
|
14,167
|
|
|
Stock options outstanding
|
|
|
18,139
|
|
|
|
19,863
|
|
|
Authorized for future stock option grants
|
|
|
2,324
|
|
|
|
541
|
|
|
|
|
|
|
|
|
|
|
|
|
Total
|
|
|
55,762
|
|
|
|
53,925
|
|
|
|
|
|
|
|
|
|
|
|
|
|
|
7.
|
Guarantees and
Commitments
|
The Company has entered into agreements that contain features
which meet the definition of a guarantee (a contract that
contingently requires the Company to make payments (either in
cash, financial instruments, other assets, common shares of the
Company or through the provision of services) to a third party
based on changes in an underlying economic characteristic (such
as interest rates or market value) that is related to an asset,
liability or an equity security of the other party). The Company
has the following guarantees that are subject to disclosure:
|
|
|
| |
(i)
|
As at December 31, 2010 the Company is contingently liable
under a letter of guarantee in the amount of CDN$150 for credit
facilities for Company credit cards.
|
|
|
|
| |
(ii)
|
In the normal course of business, the Company and its
subsidiaries enter into lease agreements for facilities or
equipment. It is common in such commercial lease transactions
for the Company or its subsidiaries as the lessee to agree to
indemnify the lessor and other related third parties for
liabilities that may arise from the use of the leased assets.
The maximum amount potentially payable under the foregoing
indemnities cannot be reasonably estimated. The Company has
liability insurance that relates to the indemnifications
described above.
|
Historically, the Company has not made any significant payments
related to the above-noted guarantees and indemnities and
accordingly, no liabilities have been accrued in the financial
statements.
The Company has entered into operating lease agreements for
office space in the U.S., Hong Kong, China and Canada that
expire between 2011 and 2013. The Company has also entered into
rental commitments for computer aided design tools that expire
between 2011 and 2013. The future rental commitments and minimum
lease payments excluding operating costs on office leases are
approximately as follows at December 31, 2010:
| |
|
|
|
|
|
2011
|
|
$
|
1,552
|
|
|
2012
|
|
|
703
|
|
|
2013
|
|
|
595
|
|
|
|
|
|
|
|
|
Total minimum payments
|
|
$
|
2,850
|
|
|
|
|
|
|
|
F-20
SiGe
SEMICONDUCTOR, INC.
NOTES TO
CONSOLIDATED FINANCIAL
STATEMENTS — (Continued)
(in thousands of U.S. dollars
and shares, except per share amounts.)
Total rent expense, including operating costs, associated with
these operating leases for the fiscal years 2008, 2009 and 2010
were $1,031, $895 and $946, respectively.
In January 2011, the Company renewed its Andover, MA lease
through June 2016. Future minimum annual payments under the
operating lease for the years 2011, 2012, 2013, 2014 and 2015
and thereafter are approximately $0, $167, $211, $217 and $335,
respectively.
In March 2010, the Company signed an agreement with the
Government of Ontario which provides for a conditional grant of
up to $6,983 (CDN$7,035) over a period of 5 years under the
government’s Next Generation of Jobs Fund. The grant is
intended to fund 15% of eligible costs (primarily research
and development labor, material and overhead) over the next
5 years to develop advanced semiconductor components. In
the event the Company does not meet certain hiring and spending
criteria over the next five years, a pro rata amount of monies
received may become repayable at the end of 5 years. The
Company accounts for the funding as a reduction of the related
research and development expense as the eligible spending is
incurred.
The Company has also secured other research and development
funding that may be repayable if certain criteria are not met
such as ownership of the intellectual property and continuation
or material change of the scheduled project.
If repayment of any funding is required the Company will account
for it in the period when repayment is probable by accruing a
liability.
For financial reporting purposes, “Income (loss) before
income taxes” included the following components:
| |
|
|
|
|
|
|
|
|
|
|
|
|
|
|
|
Year Ended
|
|
|
Year Ended
|
|
|
Year Ended
|
|
|
|
|
January 2,
|
|
|
January 1,
|
|
|
December 31,
|
|
|
|
|
2009
|
|
|
2010
|
|
|
2010
|
|
|
|
|
Domestic income (loss)
|
|
$
|
(10,538
|
)
|
|
$
|
1,634
|
|
|
$
|
(3,298
|
)
|
|
Foreign income (loss)
|
|
|
6,755
|
|
|
|
(5,990
|
)
|
|
|
7,827
|
|
|
|
|
|
|
|
|
|
|
|
|
|
|
|
|
Income (loss) before income tax
|
|
$
|
(3,783
|
)
|
|
$
|
(4,356
|
)
|
|
$
|
4,529
|
|
|
|
|
|
|
|
|
|
|
|
|
|
|
|
Significant components of income taxes are as follows:
| |
|
|
|
|
|
|
|
|
|
|
|
|
|
|
|
Year Ended
|
|
|
Year Ended
|
|
|
Year Ended
|
|
|
|
|
January 2,
|
|
|
January 1,
|
|
|
December 31,
|
|
|
|
|
2009
|
|
|
2010
|
|
|
2010
|
|
|
|
|
Current tax:
|
|
|
|
|
|
|
|
|
|
|
|
|
|
Domestic
|
|
$
|
—
|
|
|
$
|
—
|
|
|
$
|
—
|
|
|
Foreign
|
|
|
17
|
|
|
|
21
|
|
|
|
29
|
|
|
|
|
|
|
|
|
|
|
|
|
|
|
|
|
|
|
|
17
|
|
|
|
21
|
|
|
|
29
|
|
|
|
|
|
|
|
|
|
|
|
|
|
|
|
|
Deferred tax:
|
|
|
|
|
|
|
|
|
|
|
|
|
|
Domestic
|
|
|
—
|
|
|
|
—
|
|
|
|
—
|
|
|
Foreign
|
|
|
—
|
|
|
|
—
|
|
|
|
(2,544
|
)
|
|
|
|
|
|
|
|
|
|
|
|
|
|
|
|
|
|
|
—
|
|
|
|
—
|
|
|
|
(2,544
|
)
|
|
|
|
|
|
|
|
|
|
|
|
|
|
|
|
Total
|
|
$
|
17
|
|
|
$
|
21
|
|
|
$
|
(2,515
|
)
|
|
|
|
|
|
|
|
|
|
|
|
|
|
|
F-21
SiGe
SEMICONDUCTOR, INC.
NOTES TO
CONSOLIDATED FINANCIAL
STATEMENTS — (Continued)
(in thousands of U.S. dollars
and shares, except per share amounts.)
Income tax recovery varies from the amount that would be
computed by applying the enacted income tax rates for the period
to loss before income taxes, as follows:
| |
|
|
|
|
|
|
|
|
|
|
|
|
|
|
|
Year Ended
|
|
|
Year Ended
|
|
|
Year Ended
|
|
|
|
|
January 2,
|
|
|
January 1,
|
|
|
December 31,
|
|
|
|
|
2009
|
|
|
2010
|
|
|
2010
|
|
|
|
|
Federal statutory rate
|
|
|
34
|
%
|
|
|
34
|
%
|
|
|
34
|
%
|
|
Provision at statutory rate
|
|
$
|
(1,286
|
)
|
|
$
|
(1,481
|
)
|
|
$
|
1,540
|
|
|
State income taxes (net of federal benefit)
|
|
|
(632
|
)
|
|
|
98
|
|
|
|
(198
|
)
|
|
Stock-based compensation
|
|
|
126
|
|
|
|
143
|
|
|
|
162
|
|
|
Change in valuation allowance
|
|
|
(4,396
|
)
|
|
|
3,800
|
|
|
|
(1,547
|
)
|
|
Adjustment to deferred tax asset for change in exchange rates
|
|
|
7,598
|
|
|
|
(3,952
|
)
|
|
|
(778
|
)
|
|
Difference between current and future tax rates
|
|
|
7
|
|
|
|
(39
|
)
|
|
|
604
|
|
|
Change in foreign enacted rates
|
|
|
420
|
|
|
|
2,366
|
|
|
|
302
|
|
|
Foreign tax rate differential
|
|
|
(480
|
)
|
|
|
281
|
|
|
|
(821
|
)
|
|
Research and development tax credits
|
|
|
(1,090
|
)
|
|
|
(1,409
|
)
|
|
|
(1,938
|
)
|
|
Other
|
|
|
(250
|
)
|
|
|
214
|
|
|
|
159
|
|
|
|
|
|
|
|
|
|
|
|
|
|
|
|
|
|
|
$
|
17
|
|
|
$
|
21
|
|
|
$
|
(2,515
|
)
|
|
|
|
|
|
|
|
|
|
|
|
|
|
|
The tax effects of the items that give rise to significant
portions of the deferred tax asset are as follows:
| |
|
|
|
|
|
|
|
|
|
|
|
January 1,
|
|
|
December 31,
|
|
|
|
|
2010
|
|
|
2010
|
|
|
|
|
Deferred tax asset:
|
|
|
|
|
|
|
|
|
|
Operating loss carryforwards
|
|
$
|
17,337
|
|
|
$
|
16,376
|
|
|
Research and development expense carryforwards
|
|
|
5,770
|
|
|
|
5,335
|
|
|
Ontario harmonization credit
|
|
|
1,338
|
|
|
|
1,242
|
|
|
Investment tax credit carryforwards
|
|
|
5,098
|
|
|
|
6,753
|
|
|
Property and equipment
|
|
|
9,741
|
|
|
|
10,429
|
|
|
Stock-based compensation
|
|
|
346
|
|
|
|
496
|
|
|
Other items
|
|
|
4
|
|
|
|
—
|
|
|
|
|
|
|
|
|
|
|
|
|
Total gross deferred tax asset
|
|
|
39,634
|
|
|
|
40,631
|
|
|
Valuation allowance
|
|
|
(39,634
|
)
|
|
|
(38,087
|
)
|
|
|
|
|
|
|
|
|
|
|
|
Net deferred taxes
|
|
$
|
—
|
|
|
$
|
2,544
|
|
|
|
|
|
|
|
|
|
|
|
F-22
SiGe
SEMICONDUCTOR, INC.
NOTES TO
CONSOLIDATED FINANCIAL
STATEMENTS — (Continued)
(in thousands of U.S. dollars
and shares, except per share amounts.)
The Company has operating loss carryforwards available to be
applied against income and which expire as follows:
| |
|
|
|
|
|
|
|
|
|
|
|
|
|
|
|
United
|
|
|
United
|
|
|
|
|
|
|
|
States
|
|
|
Kingdom
|
|
|
Total
|
|
|
|
|
2019
|
|
$
|
61
|
|
|
$
|
—
|
|
|
$
|
61
|
|
|
2020
|
|
|
543
|
|
|
|
—
|
|
|
|
543
|
|
|
2021
|
|
|
2,088
|
|
|
|
—
|
|
|
|
2,088
|
|
|
2022
|
|
|
2,534
|
|
|
|
—
|
|
|
|
2,534
|
|
|
2023
|
|
|
1,738
|
|
|
|
—
|
|
|
|
1,738
|
|
|
2024
|
|
|
5,110
|
|
|
|
—
|
|
|
|
5,110
|
|
|
2025
|
|
|
3,694
|
|
|
|
—
|
|
|
|
3,694
|
|
|
2026
|
|
|
2,260
|
|
|
|
—
|
|
|
|
2,260
|
|
|
2027
|
|
|
1,840
|
|
|
|
—
|
|
|
|
1,840
|
|
|
2028
|
|
|
65
|
|
|
|
—
|
|
|
|
65
|
|
|
2029
|
|
|
1,813
|
|
|
|
—
|
|
|
|
1,813
|
|
|
2030
|
|
|
1,982
|
|
|
|
—
|
|
|
|
1,982
|
|
|
Indefinite
|
|
|
—
|
|
|
|
25,499
|
|
|
|
25,499
|
|
|
|
|
|
|
|
|
|
|
|
|
|
|
|
|
|
|
|
23,728
|
|
|
$
|
25,499
|
|
|
|
49,227
|
|
|
|
|
|
|
|
|
|
|
|
|
|
|
|
In addition, the Company has research and development expense
carryforwards available to be applied against Canadian income
and investment tax credit carryforwards available to reduce
Canadian income taxes payable in the future which expire as
follows:
| |
|
|
|
|
|
|
|
|
|
|
|
Research and
|
|
|
Investment
|
|
|
|
|
Development
|
|
|
Tax Credits
|
|
|
|
|
2018
|
|
$
|
—
|
|
|
$
|
226
|
|
|
2020
|
|
|
—
|
|
|
|
402
|
|
|
2021
|
|
|
—
|
|
|
|
542
|
|
|
2022
|
|
|
—
|
|
|
|
117
|
|
|
2023
|
|
|
—
|
|
|
|
90
|
|
|
2024
|
|
|
—
|
|
|
|
249
|
|
|
2025
|
|
|
—
|
|
|
|
404
|
|
|
2026
|
|
|
—
|
|
|
|
425
|
|
|
2027
|
|
|
—
|
|
|
|
1,395
|
|
|
2028
|
|
|
—
|
|
|
|
1,783
|
|
|
2029
|
|
|
—
|
|
|
|
1,437
|
|
|
2030
|
|
|
—
|
|
|
|
1,355
|
|
|
Indefinitely
|
|
|
19,298
|
|
|
|
—
|
|
|
|
|
|
|
|
|
|
|
|
|
|
|
$
|
19,298
|
|
|
$
|
8,425
|
|
|
|
|
|
|
|
|
|
|
|
The Company recorded a full valuation allowance against its net
deferred tax assets at January 2, 2009 and January 1,
2010. In determining the need for a valuation allowance,
management reviewed all available evidence pursuant to the
requirements of ASC 740. The determination of recording or
releasing tax valuation allowances is made, in part, pursuant to
an
F-23
SiGe
SEMICONDUCTOR, INC.
NOTES TO
CONSOLIDATED FINANCIAL
STATEMENTS — (Continued)
(in thousands of U.S. dollars
and shares, except per share amounts.)
assessment performed by management regarding the likelihood that
the Company will generate sufficient future taxable income
against which benefits of the deferred tax assets may or may not
be realized. This assessment requires management to exercise
significant judgment and make estimates with respect to the
Company’s ability to generate revenue, gross profits,
operating income and taxable income in future periods. Amongst
other factors, management must make assumptions regarding
overall current and projected business and semiconductor
industry conditions, operating efficiencies, the Company’s
ability to timely develop, introduce and consistently
manufacture new products to customers’ specifications,
acceptance of new products, customer concentrations,
technological change and the competitive environment which may
impact the Company’s ability to generate taxable income
and, in turn, realize the value of the deferred tax assets.
Significant cumulative operating losses in 2009 and prior years
and significant economic uncertainties in the market made the
Company’s ability to project future taxable income highly
uncertain and volatile at January 1, 2010. Therefore the
Company concluded as of January 1, 2010 that it was not
more likely than not that its net deferred tax assets would be
realized.
As of the fourth quarter of 2010, the Company has recorded
cumulative earnings in the past three years in one foreign tax
jurisdiction where the Company operates. Additionally by the end
of fiscal 2010 visibility into the future was such that
management concluded the recent trend of profitability in this
tax jurisdiction would more likely than not continue. Based on
these facts management reassessed the need for a valuation
allowance at December 31, 2010 and concluded that a change
in circumstances had occurred. Management determined that, based
on the Company’s prospects and business outlook, it was
reasonable to conclude that it is more likely than not that a
portion of the Company’s deferred tax assets in this tax
jurisdiction will be realized. Accordingly, the Company released
a portion of the valuation allowance in the amount of $2,544
recorded against its deferred tax assets based on the weight of
positive evidence that existed at December 31, 2010.
Significant judgment is required to determine the timing and
extent of a valuation allowance release and the Company’s
ability to utilize deferred tax assets will continue to be
dependent on the ability to generate sufficient taxable income
in future periods.
Pursuant to Internal Revenue Code Sections 382 and 383, use
of the Company’s United States net operating loss
carryforwards may be limited if a cumulative change in ownership
of more than 50% occurs. The Company had one change of ownership
in December 2002 resulting in an annual net operating loss
limitation. The annual limitation from the change in ownership
in December 2002 will not cause a loss of net operating loss
carryforwards. Additional limitations on the use of these tax
attributes could occur in the event of possible disputes arising
in examinations from various tax authorities.
The FASB has established authoritative guidance to create a
single model to address accounting for uncertain tax positions.
This guidance clarifies the accounting for income taxes, by
prescribing a minimum recognition threshold a tax position is
required to meet before being recognized in the financial
statements. The guidance also provides guidance on
derecognition, measurement and classification of amounts
relating to uncertain tax positions, accounting for and
disclosure of interest and penalties, accounting for interim
periods, disclosures and transition relating to the adoption of
the new accounting standard. At January 1, 2010 and
December 31, 2010 the unrecognized tax benefit was $Nil.
The Company does not expect any significant increases or
decreases to its unrecognized tax benefits within the next
twelve months.
The Company is subject to audits for domestic and foreign income
tax from various tax authorities. The Company is generally no
longer subject to income tax examination by tax authorities for
the years prior to 2004.
F-24
SiGe
SEMICONDUCTOR, INC.
NOTES TO
CONSOLIDATED FINANCIAL
STATEMENTS — (Continued)
(in thousands of U.S. dollars
and shares, except per share amounts.)
|
|
|
9.
|
Fair Value
Measurements
|
Effective December 29, 2007, the Company determines the
fair market values of its financial instruments based on the
fair value hierarchy established in topic
ASC 820-10
which requires an entity to maximize the use of observable
inputs and minimize the use of unobservable inputs when
measuring fair value. The standard describes three levels of
inputs that may be used to measure fair value. These levels are:
|
|
|
| |
•
|
Level 1 — inputs are based upon unaudited quoted
prices for identical instruments traded in active markets.
|
| |
| |
•
|
Level 2 — inputs are based on quoted prices for
similar instruments in active markets, quoted prices for
identical or similar instruments in markets that are not active,
and model based valuation techniques for which all significant
assumptions are observable in the market or can be corroborated
by observable market data for substantially the full term of the
assets or liabilities.
|
| |
| |
•
|
Level 3 — inputs are generally unobservable and
typically reflect management’s estimates of assumptions
that market participants would use in pricing the asset or
liability. The fair values are therefore determined using model
based techniques that include option-pricing models, discounted
cash flow models and similar techniques.
|
Cash and cash equivalents are classified as Level 1. There
were no items classified in Level 2 or 3 for any periods
presented.
|
|
|
10.
|
Concentration of
Credit and Other Risks and Significant Customers
|
Financial instruments which potentially subject the Company to
concentrations of credit risk consist of cash and cash
equivalents and accounts receivable. The Company limits its
exposure to credit loss by placing its cash with what management
believes are high credit quality financial institutions. At
times, such deposits may be in excess of insured limits. The
Company has not experienced any losses on its deposits of cash
and cash equivalents.
The Company markets its products to original equipment
manufacturers and original design manufacturers throughout the
world. The Company makes periodic evaluations of the credit
worthiness of its customers and does not require collateral for
credit sales. The Company has not had any significant bad debt
expense since inception.
Customers representing greater than 10% of revenue for each of
the periods are as follows:
| |
|
|
|
|
|
|
|
|
|
|
|
|
|
|
|
Years Ended
|
|
|
|
|
|
|
|
January 2,
|
|
|
January 1,
|
|
|
December 31,
|
|
|
|
|
2009
|
|
|
2010
|
|
|
2010
|
|
|
|
|
Percentage of revenue:
|
|
|
|
|
|
|
|
|
|
|
|
|
|
Customer 1
|
|
|
11
|
%
|
|
|
27
|
%
|
|
|
26
|
%
|
|
Customer 2
|
|
|
12
|
%
|
|
|
18
|
%
|
|
|
27
|
%
|
|
Customer 3
|
|
|
27
|
%
|
|
|
15
|
%
|
|
|
10
|
%
|
|
Customer 4
|
|
|
22
|
%
|
|
|
15
|
%
|
|
|
*
|
|
|
Customer 5
|
|
|
13
|
%
|
|
|
14
|
%
|
|
|
15
|
%
|
|
|
|
|
*
|
|
Represents less than 10% of the
revenue for the respective period
|
F-25
SiGe
SEMICONDUCTOR, INC.
NOTES TO
CONSOLIDATED FINANCIAL
STATEMENTS — (Continued)
(in thousands of U.S. dollars
and shares, except per share amounts.)
Customers whose balance represents greater than 10% of accounts
receivable is as follows:
| |
|
|
|
|
|
|
|
|
|
|
|
January 1,
|
|
|
December 31,
|
|
|
|
|
2010
|
|
|
2010
|
|
|
|
|
Percentage of accounts receivable:
|
|
|
|
|
|
|
|
|
|
Customer 1
|
|
|
22
|
%
|
|
|
26
|
%
|
|
Customer 2
|
|
|
27
|
%
|
|
|
22
|
%
|
|
Customer 3
|
|
|
16
|
%
|
|
|
13
|
%
|
|
Customer 4
|
|
|
|
*
|
|
|
*
|
|
|
Customer 5
|
|
|
22
|
%
|
|
|
20
|
%
|
|
|
|
|
*
|
|
Represents less than 10% of the
revenue or accounts receivable for the respective period
|
Substantially all of the Company’s revenue is derived from
foreign countries, primarily Asia.
The semiconductor industry is characterized by rapid
technological change, competitive pricing pressures and cyclical
market patterns. The Company’s financial results are
affected by a wide variety of factors, including general
economic conditions worldwide, economic conditions specific to
the semiconductor industry, the timely development of new or
enhanced products, the timely implementation of new
manufacturing technologies, the ability to safeguard patents and
intellectual property in a rapidly evolving market and reliance
on assembly and test subcontractors, independent distributors,
and third party foundry wafer suppliers. In particular the
Company is dependent on IBM Microelectronics and WIN
Semiconductor for wafers to meet its volume shipments.
On August 27, 2010 the Company amended its October 15,
2009 $7.5 million credit facility. The amended credit
facility of $12.0 million consists of a $10.0 million
demand facility and a $2.0 million term loan facility. The
demand facility is available at the lender’s
U.S. prime rate plus 0.50% and is subject to a borrowing
limit of up to specified percentages of certain accounts
receivable balances. The $2.0 million term loan facility is
repayable over a maximum of three years at either a variable
interest rate of the lender’s Canadian prime rate plus
2.10% or a fixed interest rate determined on the borrowing date.
The amended credit facility is secured by a general security
agreement covering all of the Company’s personal property
and is subject to a Debt to EBITDA requirement of no greater
than 3.0 to 1, calculated on a rolling four quarters basis. No
amounts were outstanding under the facility at January 1,
2010 and December 31, 2010.
The Company operates in one segment related to the design,
development and sale of radio frequency semiconductors for
wireless applications. The Company’s chief operating
decision-maker is its chief executive officer, who reviews
operating results on an aggregate basis and manages the
Company’s operations as a single operating segment.
The following table presents revenue and long-lived asset
information based on geographic region. Revenue is based on the
geographic location of the distributors or customers who
purchased
F-26
SiGe
SEMICONDUCTOR, INC.
NOTES TO
CONSOLIDATED FINANCIAL
STATEMENTS — (Continued)
(in thousands of U.S. dollars
and shares, except per share amounts.)
the Company’s products, which may differ from the
geographic location of the end customers. Long-lived assets
include property and equipment and are based on the physical
location of the assets.
| |
|
|
|
|
|
|
|
|
|
|
|
|
|
|
|
|
|
|
|
|
|
|
|
|
|
|
|
|
|
|
|
|
|
|
|
United
|
|
|
|
|
|
|
|
|
China/
|
|
|
|
|
|
|
|
|
Rest of
|
|
|
|
|
|
|
|
States
|
|
|
Canada
|
|
|
Malaysia
|
|
|
HK
|
|
|
Taiwan
|
|
|
Japan
|
|
|
World
|
|
|
Total
|
|
|
|
|
Net revenue:
|
|
|
|
|
|
|
|
|
|
|
|
|
|
|
|
|
|
|
|
|
|
|
|
|
|
|
|
|
|
|
|
|
|
2008
|
|
|
295
|
|
|
|
38
|
|
|
|
—
|
|
|
|
50,519
|
|
|
|
19,104
|
|
|
|
22,293
|
|
|
|
4,672
|
|
|
|
96,921
|
|
|
2009
|
|
|
102
|
|
|
|
—
|
|
|
|
11
|
|
|
|
41,922
|
|
|
|
22,867
|
|
|
|
12,973
|
|
|
|
4,727
|
|
|
|
82,602
|
|
|
2010
|
|
|
249
|
|
|
|
38
|
|
|
|
31
|
|
|
|
44,517
|
|
|
|
42,054
|
|
|
|
11,340
|
|
|
|
5,089
|
|
|
|
103,318
|
|
|
Long-lived assets:
|
|
|
|
|
|
|
|
|
|
|
|
|
|
|
|
|
|
|
|
|
|
|
|
|
|
|
|
|
|
|
|
|
|
January 1, 2010
|
|
|
335
|
|
|
|
1,173
|
|
|
|
1,062
|
|
|
|
513
|
|
|
|
—
|
|
|
|
—
|
|
|
|
82
|
|
|
|
3,165
|
|
|
December 31, 2010
|
|
|
400
|
|
|
|
980
|
|
|
|
1,833
|
|
|
|
328
|
|
|
|
—
|
|
|
|
—
|
|
|
|
110
|
|
|
|
3,651
|
|
The Company has evaluated subsequent events to the date the
financial statements are available to be issued at
March 18, 2011.
F-27
SiGe
SEMICONDUCTOR, INC.
Schedule II
Valuation and
Qualifying Accounts
| |
|
|
|
|
|
|
|
|
|
|
|
|
|
|
|
|
|
|
|
Balance at
|
|
|
|
|
|
|
|
|
Balance at
|
|
|
|
|
beginning of
|
|
|
Provision/
|
|
|
|
|
|
end of
|
|
|
|
|
period
|
|
|
(recoveries)(1)
|
|
|
Deductions
|
|
|
period
|
|
|
|
|
Inventory reserve
|
|
|
|
|
|
|
|
|
|
|
|
|
|
|
|
|
|
Year ended January 2, 2009
|
|
$
|
3,181
|
|
|
$
|
(288
|
)
|
|
$
|
—
|
|
|
$
|
2,893
|
|
|
Year ended January 1, 2010
|
|
|
2,893
|
|
|
|
(384
|
)
|
|
|
(230
|
)
|
|
|
2,279
|
|
|
Year ended December 31, 2010
|
|
|
2,279
|
|
|
|
210
|
|
|
|
(30
|
)
|
|
|
2,459
|
|
|
|
| Note (1): |
Amounts charged or credited to cost of revenue in the
Consolidated Statement of Operations.
|
F-28
Shares
Common
Stock
Prospectus
,
2011
|
|
| Barclays
Capital |
Deutsche Bank Securities |
|
|
|
|
| RBC
Capital Markets |
Needham & Company, LLC |
Canaccord Genuity |
Raymond James |
PART II
INFORMATION NOT
REQUIRED IN PROSPECTUS
|
|
|
Item 13.
|
Other Expenses
of Issuance and Distribution
|
The following table sets forth all expenses, other than the
underwriting discounts and commissions, payable by the
registrant in connection with the sale of the common stock being
registered. All the amounts shown are estimates except the
Securities and Exchange Commission registration fee, the
Financial Industry Regulatory Authority, or FINRA, filing fee
and the NASDAQ Global Market initial listing fee.
| |
|
|
|
|
|
|
|
Total
|
|
|
|
|
Securities and Exchange Commission registration fee
|
|
$
|
10,250
|
|
|
FINRA filing fee
|
|
$
|
14,875
|
|
|
NASDAQ Global Market initial listing fee
|
|
$
|
*
|
|
|
Blue sky qualification fees and expenses
|
|
$
|
*
|
|
|
Printing and engraving expenses
|
|
$
|
*
|
|
|
Legal fees and expenses
|
|
$
|
*
|
|
|
Accounting fees and expenses
|
|
$
|
*
|
|
|
Transfer agent and registrar fees
|
|
$
|
*
|
|
|
Miscellaneous
|
|
$
|
*
|
|
|
|
|
|
|
|
|
Total
|
|
$
|
|
|
|
|
|
|
|
|
|
|
|
|
*
|
|
To be provided by amendment.
|
|
|
|
Item 14.
|
Indemnification
of Directors and Officers
|
Section 145 of the Delaware General Corporation Law permits
a corporation to include in its charter documents, and in
agreements between the corporation and its directors and
officers, provisions expanding the scope of indemnification
beyond that specifically provided by the current law.
The Registrant’s amended and restated certificate of
incorporation provides for the indemnification of directors to
the fullest extent permissible under Delaware law.
The Registrant’s amended and restated by-laws, which will
become effective upon the completion of this offering, provide
for the indemnification of officers, directors and third parties
acting on the Registrant’s behalf if such persons act in
good faith and in a manner reasonably believed to be in and not
opposed to the Registrant’s best interest, and, with
respect to any criminal action or proceeding, such indemnified
party had no reason to believe his or her conduct was unlawful.
The Registrant is entering into indemnification agreements with
each of its directors, in addition to the indemnification
provisions provided for in its charter documents, and the
Registrant intends to enter into indemnification agreements with
any new directors in the future.
The underwriting agreement (to be filed as Exhibit 1.1
hereto) will provide for indemnification by the underwriters of
the Registrant and its executive officers and directors, and
indemnification of the underwriters by the Registrant, for
certain liabilities, including liabilities arising under the
Securities Act of 1933.
The Registrant intends to purchase and maintain insurance on
behalf of any person who is or was a director or officer against
any loss arising from any claim asserted against him or her and
II-1
incurred by him or her in that capacity, subject to certain
exclusions and limits of the amount of coverage.
|
|
|
Item 15.
|
Recent Sales
of Unregistered Securities
|
In the three years preceding the filing of this registration
statement, we have issued the following securities that were not
registered under the Securities Act.
Grants and
Exercises of Stock Options
Since March 18, 2008, we have granted stock options to
purchase an aggregate of 6,632,000 shares of our common stock,
with 3,809,500 of such stock options having an exercise price of
$0.21 per share, 742,000 of such stock options having an
exercise price of $1.04 per share and 2,080,500 of such stock
options having an exercise price of $1.75 per share, to
employees, directors and consultants pursuant to our 2002 Stock
Plan. Since March 18, 2008, we have issued and sold an
aggregate of 534,385 shares of our common stock upon
exercise of stock options granted pursuant to our 2002 Stock
Plan for aggregate consideration of $67,510. The issuances of
common stock upon exercise of the options were exempt either
pursuant to Rule 701, as a transaction pursuant to a
compensatory benefit plan, or pursuant to Section 4(2) of
the Securities Act, as a transaction by an issuer not involving
a public offering. The shares of common stock issued upon
exercise of options are deemed restricted securities for the
purposes of the Securities Act.
Issuances of
Capital Stock
On April 1, 2010, we issued an aggregate of
1,712,516 shares of
Series A-1
Preferred Stock to two stockholders in exchange for an equal
number of
Class A-1
Exchangeable Shares of our subsidiary SiGe Semiconductor Inc.
held by those stockholders. On December 10, 2010, we issued
754,491 shares of
Series A-1
Preferred Stock and 1,777,761 shares of Common Stock to a
stockholder in exchange for an equal number of
Class A-1
Exchangeable Shares and Common Exchangeable Shares,
respectively, of our subsidiary SiGe Semiconductor Inc. held by
that stockholder. The issuances of
Series A-1
Preferred Stock were exempt pursuant to Section 4(2) of the
Securities Act (and/or Regulation D promulgated thereunder)
as a transaction by an issuer not involving a public offering.
The shares of
Series A-1
Preferred Stock are deemed restricted securities for the
purposes of the Securities Act.
|
|
|
Item 16.
|
Exhibits and
Financial Statement Schedules
|
(a) Exhibits.
The exhibits to the registration statement are listed in the
Exhibit Index to this registration statement and are
incorporated herein by reference.
(b) Financial
Statement Schedule.
The financial statement schedule can be found in the
consolidated financial statements section of this registration
statement under the heading “Schedule II —
Valuation and Qualifying Accounts” and is incorporated
herein by reference.
The Registrant hereby undertakes that:
Insofar as indemnification for liabilities arising under the
Securities Act of 1933, as amended, may be permitted to
directors, officers and controlling persons of the Registrant
pursuant to the foregoing
II-2
provisions, or otherwise, the Registrant has been advised that
in the opinion of the Securities and Exchange Commission such
indemnification is against public policy as expressed in the
Securities Act and is, therefore, unenforceable. In the event
that a claim for indemnification against such liabilities (other
than the payment by the Registrant of expenses incurred or paid
by a director, officer or controlling person of the Registrant
in the successful defense of any action, suit or proceeding) is
asserted by such director, officer or controlling person in
connection with the securities being registered, the Registrant
will, unless in the opinion of its counsel the matter has been
settled by controlling precedent, submit to a court of
appropriate jurisdiction the question whether such
indemnification by it is against public policy as expressed in
the Securities Act of 1933 and will be governed by the final
adjudication of such issue.
The Registrant hereby undertakes that:
(a) The Registrant will provide to the underwriters at the
closing as specified in the underwriting agreement, certificates
in such denominations and registered in such names as required
by the underwriters to permit prompt delivery to each purchaser.
(b) For purposes of determining any liability under the
Securities Act, the information omitted from the form of
prospectus filed as part of this registration statement in
reliance upon Rule 430A and contained in a form of
prospectus filed by the Registrant pursuant to
Rule 424(b)(1) or (4) or 497(h) under the Securities
Act shall be deemed to be part of this registration statement as
of the time it was declared effective.
(c) For the purpose of determining any liability under the
Securities Act each post-effective amendment that contains a
form of prospectus shall be deemed to be a new registration
statement relating to the securities offered therein, and the
offering of such securities at that time shall be deemed to be
the initial bona fide offering thereof.
II-3
SIGNATURES
Pursuant to the requirements of the Securities Act of 1933, as
amended, the Registrant has duly caused this Amendment No. 3 to
Registration Statement on
Form S-1
to be signed on its behalf by the undersigned, thereunto duly
authorized, in the Town of Andover, Commonwealth of
Massachusetts, on the 18 day of March, 2011.
SIGE SEMICONDUCTOR, INC.
Sohail A. Khan
President and Chief Executive Officer
Pursuant to the requirements of the Securities Act of 1933, as
amended, this Amendment No. 3 to Registration Statement has been
signed by the following persons in the capacities indicated
below on the 18 day of March, 2011.
| |
|
|
|
|
|
Signature
|
|
Title
|
|
|
|
|
|
|
|
/s/ Sohail
A. Khan
Sohail
A. Khan
|
|
President, Chief Executive Officer
(Principal Executive Officer) and Director
|
|
|
|
|
|
/s/ William
H. Burke
William
H. Burke
|
|
Chief Financial Officer, Treasurer and Secretary
(Principal Financial and Accounting Officer)
|
|
|
|
|
|
*
Theodore Shlapak
|
|
Chairman of the Board of Directors
|
|
|
|
|
|
*
Bill Byun
|
|
Director
|
|
|
|
|
|
*
Patrick DiPietro
|
|
Director
|
|
|
|
|
*
|
|
Pursuant to power of attorney
|
|
|
|
| |
By:
|
/s/ Sohail
A. Khan
Sohail
A. Khan
Attorney-in-fact
|
The person whose individual signature appears below hereby
authorizes and appoints Sohail A. Khan and William H. Burke, and
each of them, with full power of substitution and resubstitution
and full power to act without the other, as his true and lawful
attorney in fact and agent to act in his name, place and stead
and to execute in the name and on behalf of such person,
individually and in each capacity stated below, and to file any
and all amendments to this Registration Statement, including any
and all post effective amendments and amendments thereto, and
any registration statement relating to the same offering as this
Registration Statement that is to be effective upon filing
pursuant to Rule 462(b) under the Securities Act of 1933,
as amended, and to file the same, with all exhibits thereto, and
other documents in connection therewith, with the Securities and
Exchange Commission, granting unto said attorneys in fact and
agents, and each of them, full power and authority to do and
II-4
perform each and every act and thing, ratifying and confirming
all that said attorneys in fact and agents or any of them or
their or his substitute or substitutes may lawfully do or cause
to be done by virtue thereof.
Pursuant to the requirements of the Securities Act of 1933, as
amended, this Registration Statement has been signed by the
following person in the capacity indicated below on the day of
18 March, 2011.
| |
|
|
|
|
|
Signature
|
|
Title
|
|
|
|
|
|
|
|
/s/ Matthew
S. Engel
Matthew
S. Engel
|
|
Director
|
II-5
EXHIBIT INDEX
| |
|
|
|
|
|
Exhibit No.
|
|
Description
|
|
|
|
|
1
|
.1*
|
|
Form of Underwriting Agreement
|
|
|
3
|
.1*
|
|
Form of Second Amended and Restated Certificate of Incorporation
of the Registrant
|
|
|
3
|
.2*
|
|
Form of Third Amended and Restated Certificate of Incorporation
of the Registrant
|
|
|
3
|
.3*
|
|
Form of Amended and Restated By-laws of the Registrant
|
|
|
4
|
.1*
|
|
Specimen Common Stock Certificate
|
|
|
5
|
.1*
|
|
Opinion of Goodwin Procter LLP
|
|
|
10
|
.1*
|
|
2011 Employee Stock Purchase Plan
|
|
|
10
|
.2*
|
|
2011 Stock Option and Incentive Plan and forms of award
agreements
|
|
|
10
|
.3
|
|
2002 Stock Plan
|
|
|
10
|
.4**
|
|
Forms of Award Agreements under 2002 Stock Plan
|
|
|
10
|
.5*
|
|
Employment Agreement with Sohail A. Khan, as amended
|
|
|
10
|
.6*
|
|
Employment Offer Letter with William H. Burke, as amended
|
|
|
10
|
.7*
|
|
Employment Offer Letter with George W. Haberlin, as amended
|
|
|
10
|
.8*
|
|
Employment Offer Letter with Peter L. Gammel, as amended
|
|
|
10
|
.9*
|
|
Employment Offer Letter with Alistair P. Manley, as amended
|
|
|
10
|
.10*
|
|
Incentive Stock Option Agreement between Sohail A. Khan and
the Registrant, dated as of December 27, 2007, as amended
|
|
|
10
|
.11**
|
|
Amended and Restated Investor Rights Agreement
|
|
|
10
|
.12*
|
|
Form of Indemnification Agreement
|
|
|
10
|
.13**
|
|
Credit Facility Agreement, dated October 15, 2009, by and
among Royal Bank of Canada (as Bank), SiGe Semiconductor Inc., a
Canadian corporation (as Borrower), and the Registrant and SiGe
Semiconductor Canada, a Canadian general partnership (as
Guarantors)
|
|
|
10
|
.14
|
|
Office Lease, dated January 31, 2011, by and between
Transwestern Brickstone Square, L.L.C. and Registrant for
certain premises at 200 Brickstone Square, Andover,
Massachusetts
|
|
|
10
|
.15**
|
|
Net Office Lease, dated October 4, 2005, by and between Merkburn
Holdings Limited and SiGe Semiconductor Inc., a Canadian
corporation, for certain premises at 1050 Morrison Drive Ottawa,
Ontario K2H 8S9
|
|
|
10
|
.16#
|
|
Payment Agreement, dated as of July 28, 2010
|
|
|
10
|
.17**
|
|
Conditional Grant Agreement, dated August 17, 2009, by and
between Her Majesty the Queen in Right of the Province of
Ontario and SiGe Semiconductor Inc., a Canadian corporation
|
|
|
10
|
.18**
|
|
Lease, dated July 7, 2010, by and between Hong Kong Science
and Technology Parks Corporation and SiGe Semiconductor (Hong
Kong) Limited, for certain premises at No. 8 Science Park
West Avenue, Phase Two, Hong Kong Science Park, Pak Shek Kok,
Tai Po, New Territories, Hong Kong
|
|
|
10
|
.19**
|
|
Amendment, dated August 27, 2010, to Credit Facility
Agreement, dated October 15, 2009, by and among Royal Bank
of Canada (as Bank), SiGe Semiconductor Inc., a Canadian
corporation (as Borrower), and the Registrant and SiGe
Semiconductor Canada, a Canadian general partnership (as
Guarantors)
|
|
|
10
|
.20
|
|
Amendment and Waiver, dated March 15, 2011, to the Amended
and Restated Investor Rights Agreement
|
|
|
21
|
.1
|
|
List of Subsidiaries of the Registrant
|
|
|
23
|
.1
|
|
Consent of KPMG LLP, Independent Registered Public Accounting
Firm
|
|
|
23
|
.2*
|
|
Consent of Goodwin Procter LLP (included in Exhibit 5.1)
|
|
|
24
|
.1**
|
|
Power of Attorney (included on signature page)
|
|
|
|
|
* |
|
To be filed by amendment. |
|
|
|
|
# |
|
Confidential treatment has been requested for certain provisions
of this Exhibit. Such provisions have been omitted and filed
separately with the Securities and Exchange Commission. |