Attached files
| file | filename |
|---|---|
| 8-K - FORM 8-K - Cooper-Standard Holdings Inc. | d8k.htm |
| EX-99.1 - PRESS RELEASE - Cooper-Standard Holdings Inc. | dex991.htm |
 Cooper Standard
Fourth
Quarter
and
Full
Year
Earnings
Call
March 21, 2011
Exhibit 99.2 |
 cooperstandard
Introduction & Agenda
•
Introduction:
Glenn
Dong,
Treasurer
•
Executive
Overview:
Jim
McElya,
CEO
•
Business
Highlights:
Keith
Stephenson,
COO
•
Financial
Review
&
2011
Guidance:
Allen
Campbell,
CFO
•
Questions & Answers
2 |
 cooperstandard
Safe Harbor
3
In addition to historical information, certain statements contained herein are
forward-looking statements within the meaning of federal securities
laws, and Cooper Standard Automotive (Cooper Standard) intends that such
forward-looking statements be subject to the safe-harbor created thereby.
These forward-looking statements include statements concerning the
company’s plans, objectives, goals, strategies, future events, future
revenue or performance, capital expenditures, financing needs, plans or
intentions
relating
to
acquisitions,
business
trends,
the
impact
of
“fresh-start”
accounting,
the
impact
of
the
company’s
bankruptcy
on
its
future
performance
and
other
information
that
is
not
historical
information.
When
used
herein,
the
words
“estimates,”
“expects,”
“anticipates,”
“projects,”
“plans,”
“intends,”
“believes,”
“forecasts,”
or
future
or
conditional
verbs,
such
as
“will,”
“should,”
“could,”
or
“may,”
and
variations
of
such
words or similar expressions are intended to identify forward-looking
statements. All forward-looking statements, including, without
limitation, management’s examination of historical operating trends and data,
are based upon Cooper Standard’s current expectations and various
assumptions. Cooper Standard’s expectations, beliefs and projections
are expressed in good faith and Cooper Standard believes there is a
reasonable basis for them. However, no assurances can be made that these
expectations, beliefs and projections will be achieved. Forward-looking
statements are not guarantees of future performance and are subject to
significant risks and uncertainties that may cause actual results or achievements to be materially
different from the future results or achievements expressed or implied by the
forward-looking statements. |
 Safe
Harbor 4
This presentation includes forward-looking statements, reflecting current
analysis and expectations, based on what are believed to be reasonable
assumptions. Forward-looking statements may involve known and unknown
risks, uncertainties and other factors, which may cause the actual results to
differ materially from those projected, stated
or
implied,
depending
on
many
factors,
including,
without
limitation: the inability to compare the company’s
financial condition or results historically due to fresh start accounting; the
company’s emergence from bankruptcy will reduce or eliminate certain
tax benefits; the company’s emergence from bankruptcy may adversely effect its
operations going forward; the company’s dependence on the automotive industry;
the company’s dependence on certain major customers; the company's
ability to generate cash to service its indebtedness and dividend
obligations
of
preferred
shares;
availability
and
cost
of
raw
materials;
the uncertainty of the company’s ability to
meet significant increases in demand; competition in the industry; sovereign and
other risks related to the company conducting operations outside the United
States; the uncertainty of the company’s ability to achieve expected
cost reduction savings; the company’s exposure to product liability and warranty claims; labor
conditions;
escalating
pricing
pressures
from
our
customers;
the
company’s
ability
to
meet
customers’
needs for
new
and
improved
products
in
a
timely
manner;
potential
conflicts
of
interests
between
certain
shareholders
and
the company; the company’s legal rights to its intellectual property
portfolio; the company’s underfunded pension plans; the actual return
on pension assets, environmental and other regulations; the possibility that the company’s
acquisition
strategy
will
not
be
successful;
and
the
possibility
of impairment charges relating to goodwill and long-
lived assets. There may be other factors that may cause the company’s actual
results to differ materially from the forward-looking statement.
Accordingly, there can be no assurance that Cooper Standard will meet future results,
performance or achievements expressed or implied by such forward-looking
statements. This paragraph is included to provide a safe harbor for
forward-looking statements, which are not generally required to be publicly
revised as circumstances change and which Cooper Standard does not intend to
update. There may be other factors that may cause the company’s actual
results to differ materially from the forward- looking statements. Cooper
Standard undertakes no obligation to update or revise forward-looking statements to
reflect events or circumstances that arise after the date made or to reflect the
occurrence of unanticipated events. cooperstandard
|
 Jim
McElya Chairman & CEO
Executive Overview
4Q & Full Year 2010 |
 Executive Overview
•
Innovative, global solutions provider for broad and
diverse customer base
•
Advantageous business model, proven record of
profitable operating performance
•
Five lanes for revenue growth
–
Industry recovery
–
Emerging markets
–
Global platforms
–
Green technology trends
–
Opportunistic acquisitions
•
Strong balance sheet
6
Ready to Thrive in the New Competitive Landscape
and Drive Shareholder Value
cooperstandard |
 Executive Overview: Year and Quarter Review
•
2010:
–
Solid financial performance
–
Increased gross profit margin
–
Annual Gross business awards of $613 million*
–
Strong cash flow
–
Strong balance sheet
•
4
th
Quarter:
–
Strong adjusted EBITDA margin run-rate
–
43% of total 2010 launch
7
* Based on currently estimated production volumes for the future
periods pertaining to the
awards; includes new, replacement and conquest business.
cooperstandard |
 8
Executive Overview: Industry Conditions
•
Capacity and raw materials concerns
•
Suppliers adding back growth-related costs
•
Continued growth in emerging markets
•
Increased demand for new technology
•
Industry consolidation creating opportunities, as
global automotive production improves
cooperstandard |
 Five
Lanes for Revenue Growth •
Industry recovery
•
Emerging markets
•
Global
platforms
•
Green technology trends
•
Opportunistic acquisitions |
 2011
Priorities •
Continue expansion in Asia & South America
•
Aggressively pursue business on global platforms
•
Leverage global alliance with Nishikawa
•
Successfully launch new technologies
•
Manage raw material costs and supply
cooperstandard
10 |
  Business
Highlights 4Q & Full Year 2010
Keith Stephenson
Chief Operating Officer |
 cooperstandard
12
Business Highlights 4
th
Quarter 2010
•
Solid revenue growth in all regions
•
Recognized by customers for quality excellence
•
Q4 launched $183 million in annualized sales,
across multiple product lines
•
Launched new generation of pump technology to
support introduction of electric vehicles
•
Continued focus on operational excellence |
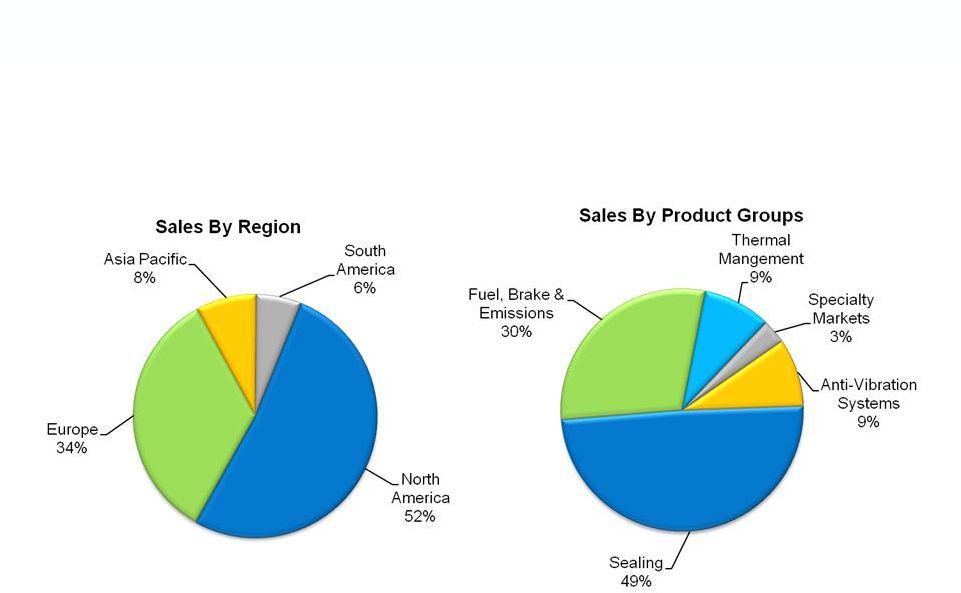 Sales
By Region & Product Groups Full Year 2010 = $2.4 Billion
Note: Inclusion of JV sales would increase Asia Pacific share to
15%
cooperstandard
13 |
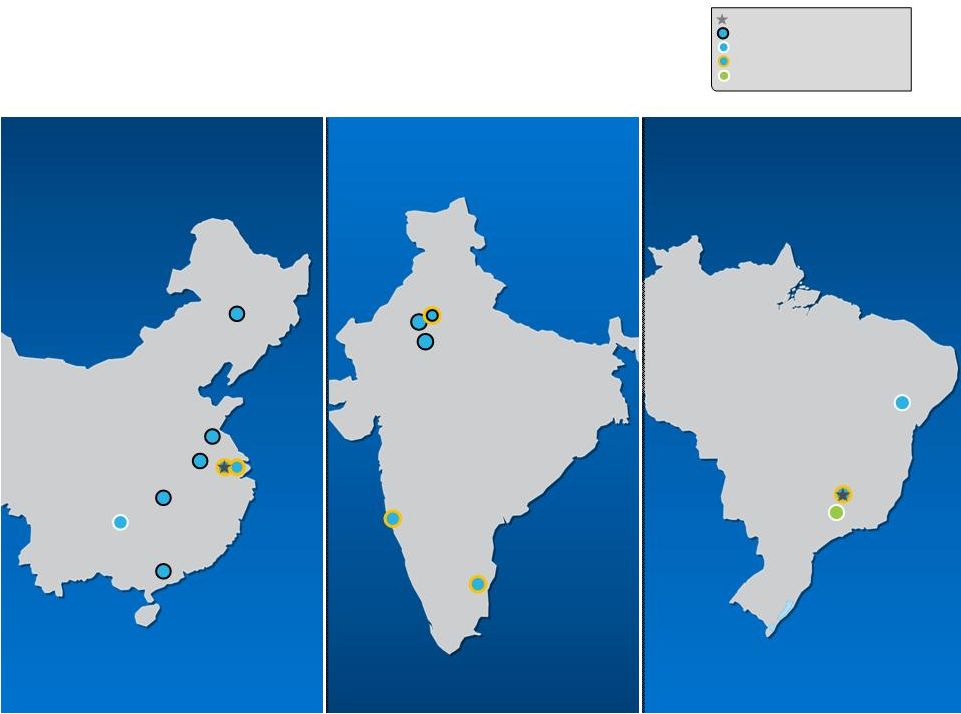 Headquarters
Joint Venture Operation
Manufacturing
Manufacturing / Technical Center
Sales / Manufacturing
Presence in Emerging Markets
Huayan
Kunshan
Panyu
Shanghai
Wuhu
Changchun
Chongqing
Jingzhou
Varginha
Camaçari
São Bernardo
Dharuhera
Manesar
Chennai
Pune
Sahibabad
Brazil
Brazil
China
China
India
India |
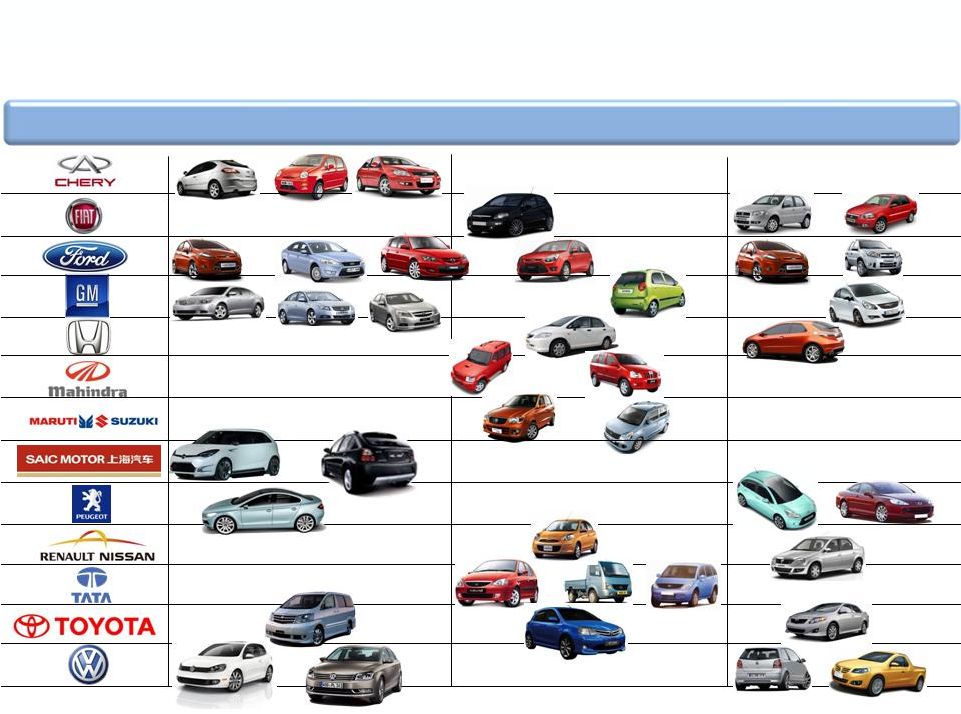 2011
Emerging Markets Vehicle Launches 15
QQ3
A3
M-11
Fiesta
Mondeo
Mazda 3
Golf
Palio
Siena
Fiesta
EcoSport
Corsa
Civic
C-3
C-4
Logan
Polo
Saveiro
Corolla
Indigo
March
Figo
Scorpio
Xylo
Wagon
R
Alto
City
Punto
Spark
Etios
LaCrosse
Lacetti
Epica
China
India
Brazil
Automaker
Ace
Indicruz
408
MG3
S100
Passat
MPV
cooperstandard |
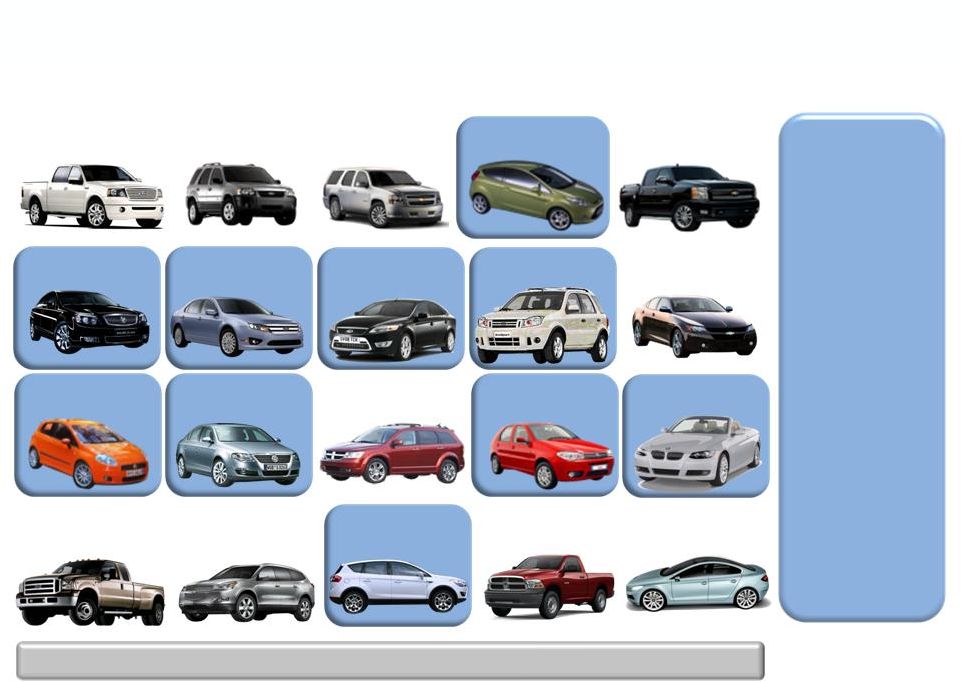 Cooper Standard’s Top 20 Platforms 4Q 2010
16
#5 GM
Silverado/Sierra
#2 Ford
Tribute/Escape
#20 Peugeot
308/408
#1 Ford
F-150
#7 Ford
Fusion / Edge
#9 Ford
Ecosport/Fiesta
#13 Chrysler
Journey
#8 Ford
Mondeo/Freelander/
V50/V70
#14 Fiat
Palio/Strada/Doblo
#3 GM
Tahoe/Yukon/
Escalade
#4 Ford
Fiesta/Fusion
#10 GM
Impala
#6 GM
Lacrosse/Insignia
#11 Fiat
Linea/Punto
#12 VW -Audi
Passat/Beduin
#19 Chrysler / Nissan
Ram / Titan
#15 BMW
3-Series
#18 Ford
Focus/Kuga/Axela
#17 GM
Chevy Traverse /
Acadia / Enclave
#16 Ford
F-Series Super Duty
Cooper
Standard
products are
consistently
on the top
selling
global
platforms
Broad customer mix across multiple vehicle segments
cooperstandard |
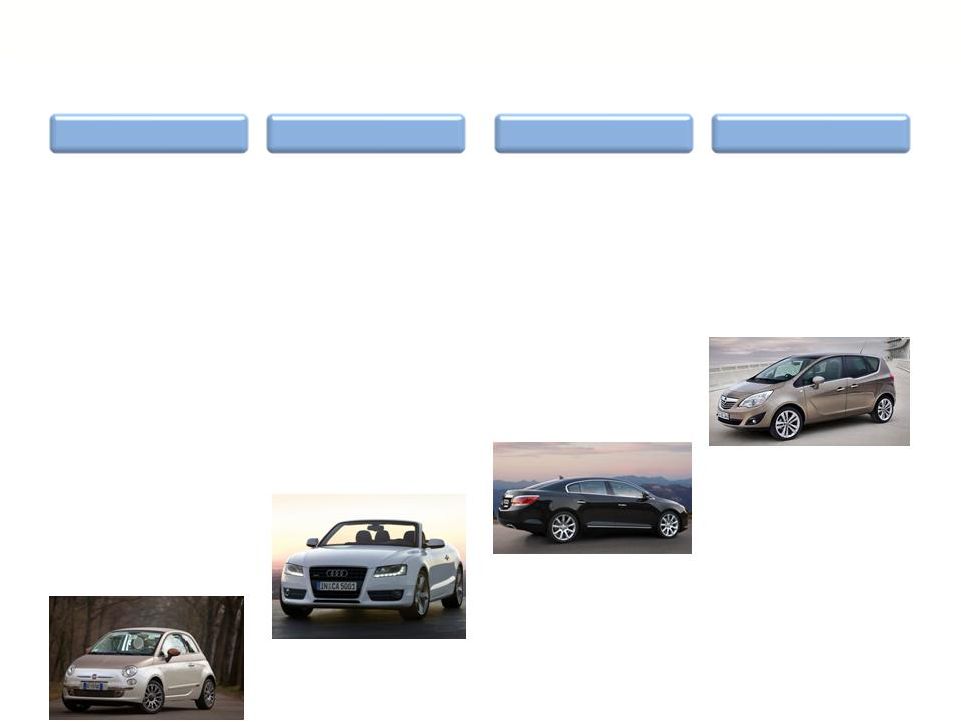 Vehicle Launches 4Q 2010
North America
Europe
Asia Pacific
South America
–
Chrysler 300
Thermal
Management
–
Fiat 500
Sealing, Thermal
Management
–
Ford Explorer
Sealing; Liftgate
Obstacle Detection
System; Fuel, Brake
& Emissions;
Thermal
Management
–
Ford Eco-Engine
Thermal
Management
–
Nissan Leaf
Thermal
Management
–
Audi A6
Sealing
–
Daimler
Mercedes SLK
Sealing
–
Ford Focus
Sealing
–
Volvo S60/C70
Fuel, Brake &
Emissions
–
GM
Celta/Prisma
Sealing
–
GM Meriva
Sealing
–
GM Alpheon
(LaCrosse)
Sealing, Fuel, Brake
& Emissions
–
Tata Indicruz
Sealing
–
Toyota Etios
Sealing
–
VW Passat
Sealing
Audi A6
GM Alpheon/LaCrosse
GM Meriva
Fiat 500
cooperstandard
17 |
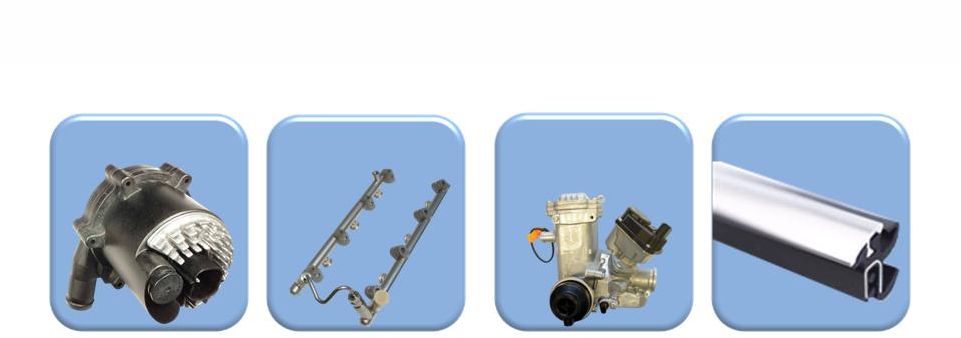 Advanced Products for Emerging Trends
Bright Trim Sealing
Direct Injection
Fuel Rails
Exhaust Gas
Recirculation (EGR)
Module
Coolant Pump
Thermal Management
Key customer benefits:
•
Increases fuel economy
•
Lighter weight
•
Increased efficiency
•
Optimizes coolant flow
Opportunity:
•
Increasing need for
cooling as engines
become smaller and
more complex
•
Increase content vs.
current auxiliary pump
Fuel, Brake & Emissions
Key customer benefits:
•
Increases fuel economy
through improved burn
•
Reduced emissions
Opportunity:
•
Increased global
adoption of direct
injection engines
•
Proprietary design &
engineering
•
Few competitors
Fuel, Brake & Emissions
Key customer benefits:
•
Reduce emissions
•
Improves fuel economy
•
Integrated solution,
reduced footprint
Opportunity:
•
Increasing need due to
regulation
•
Increasing adoption of
diesel
•
Few competitors offer
integrated solution
Sealing
Key customer benefits:
•
Functionally integrates
sealing and trim
•
Multiple innovative options
(stainless, aluminum, film)
•
Ease of assembly
Opportunity:
•
Consumer preference
•
Ability to integrate into
modules
cooperstandard
18 |
 Focus
on Operational Excellence •
Disciplined approach to restructuring and Lean
–
Target annual cost savings 4% of sales
•
Manufacturing design and process expertise
–
Won 2 Honda Brazil awards in 4Q
•
Disciplined model for acquisition integration
cooperstandard
19 |
 Financial Overview
4Q & Full Year 2010
Allen Campbell
Chief Financial Officer
Due to Cooper Standard’s adoption of fresh start reporting on May 31, 2010, in
some of its financial reports, the company’s
financial
information
for
periods
ended
on
or
prior
to
May
31,
2010
is
described
as
relating
to
Predecessor
periods, and financial information for periods ended after May 31, 2010 is
described as relating to Successor periods. For purposes of this financial
overview, the company is presenting financial information for Predecessor and
Successor periods on a combined basis so that results of operations for the three
and nine months ended September 30, 2010 can be more readily compared with
the corresponding periods in the prior year. The company believes that
presenting this financial information on a combined basis provides management and
investors with a more meaningful perspective on ongoing financial and
operational performance and trends. For a presentation of results of
operations and other financial information on an uncombined basis, please refer to
Cooper Standard’s Quarterly Report
on
Form
10-Q
for
the
quarter
ended
September
30,
2010,
which
was
filed
with
the
SEC
on
November
12,
2010. |
 4Q
and Full Year 2010 Performance $ Millions
Q4 2009
Q4 2010
Net Sales
$577.6
$603.7
Operating Profit (Loss)
$ 37.2
$ 25.7
Gross Profit
$ 91.1
$ 96.8
FY 2009
FY 2010
$1,945.3
$2,414.1
$ (344.1)
$ 142.2
$ 266.3
$ 409.6
Net Income (Loss)
$ 37.4
$ 14.8
$ (356.1)
$ 676.9
Adjusted EBITDA
$ 61.7
$ 176.5
$ 276.5
$ 70.8
% Margin
10.2%
9.1%
12.3%
11.5%
SGA
$ 53.3
$ 67.9
$ 199.6
$ 251.7
cooperstandard
21 |
 EBITDA and Adjusted EBITDA Reconciliation
22
$ USD Millions
2009
2010
Net Income (Loss)
$(356.1)
$ 676.9
Provision for income tax expense (benefit)
(55.7)
EBITDA
$(233.7)
$ 893.8
Restructuring
32.4
6.4
Adjusted EBITDA
$ 176.5
$ 276.5
45.0
12 Months Ended December 31st
Net Interest expense
64.3
69.5
Depreciation and amortization
113.8
102.4
Bond repurchase
(9.1)
Foreign exchange (gains)/losses
(4.0)
--
17.1
EDITDA and Adjusted EBITDA are Non-GAAP measures. Reference comments on slide
26 Reorganization / Fresh Start/ Impairment
(660.0)
Inventory write-up
--
8.1
EBITDA excl. Reorg & Impairment
233.8
147.2
380.9
Reorganization related fees
7.7
0.4
Other
0.9
(1.7)
Right sizing of German facilities
--
5.8
Stock based compensation
1.4
6.6
cooperstandard |
 Cash
Flow 4Q 2010 Cash Balance as of September 30
232.3
$
Cash generated
62.2
Cash Balance as of December 31
294.5
$
($ in Millions)
Q4 - 2010
Cash from Operations
37.9
$
Changes in operating assets & liabilities
52.4
Cash from Operations
90.3
$
Capital Expenditures
(30.9)
Cash from Operations less CAPEX
59.4
$
Proceeds from sale of fixed assets
2.5
Financing Activities
(1.6)
Foreign Exchange/Other
1.9
Net Cash Generated in Q4
62.2
$
cooperstandard
23 |
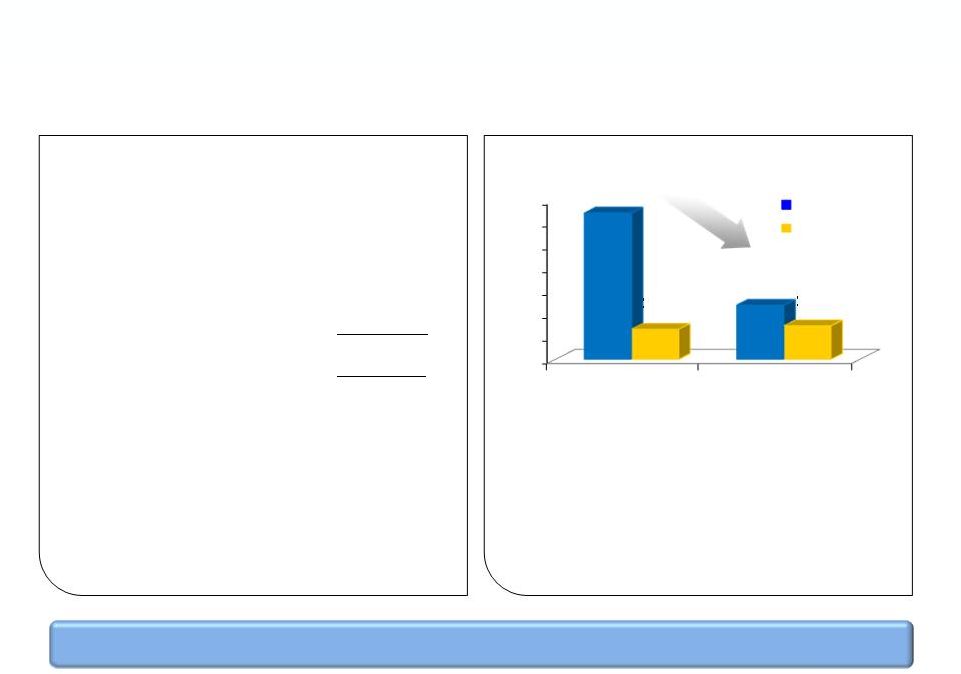 Liquidity as of December 31, 2010
Cash on Balance Sheet
$294.5M
ABL Revolver
125.0M
Letters of Credit
(33.2)M
Total Liquidity
$386.3 M
Flexible capital structure allows for future growth opportunities
•
27% increase in cash from the prior
quarter
•
ABL Revolver undrawn
•
Net leverage = $182 million
•
Net leverage ratio = 0.7x
•
No major debt maturity until 2018
cooperstandard
$1,400
$1,200
$1,000
$800
$600
$400
$200
$0
$1,291
Q1-10
Q4-10
Debt
Cash
$265
$477
$295
24 |
 2011
Guidance* •
Sales: $2.5 billion -
$2.6 billion
•
Capital expenditures: $90 million -
$100 million
•
Cash restructuring: $10 million -
$20 million
•
Cash taxes: $25 million -
$30 million
*
Guidance is based on IHS December North American production of 12.9
million, and Europe (including Russia) production of 18.6 million.
cooperstandard
25 |
 Non-GAAP Financial Measures
26
EBITDA and adjusted EBITDA are measures not recognized under Generally
Accepted Accounting Principles (GAAP) which exclude certain non-cash and
non- recurring items.
When analyzing the company’s operating performance, investors should use
EBITDA and adjusted EBITDA in addition to, and not as alternatives for, net
income (loss), operating income, or any other performance measure derived in
accordance with GAAP, or as an alternative to cash flow from operating
activities as a measure of the company’s performance. EBITDA and
adjusted EBITDA have limitations as analytical
tools
and
should
not
be
considered
in
isolation
or
as
substitutes for
analysis of the company’s results of operations as reported under GAAP. Other
companies may report EBITDA and adjusted EBITDA differently and therefore
Cooper Standard’s results may not be comparable to other similarly
titled measures of other companies.
cooperstandard |
 Questions & Answers |
 2011
Summary •
Continue expansion in Asia & South America
•
Aggressively pursue business on global platforms
•
Leverage global alliance with Nishikawa
•
Successfully launch new technologies
•
Manage raw material costs and supply
28
Ready to Thrive in the New Competitive Landscape
and Drive Shareholder Value
cooperstandard |
 Appendix |
 cooperstandard
30
Three Months Ended
December 31, 2010
Net income
14.8
$
Provision for income tax benefit
(0.3)
Interest expense, net of interest income
10.8
Depreciation and amortization
29.8
EBITDA
55.1
$
Restructuring
(1)
(0.7)
Stock-based compensation
(2)
2.8
Severance
(3)
5.8
Other
(1.3)
Adjusted EBITDA
61.7
$
(1)
Includes non-cash restructuring.
(2)
Non-cash stock amortization expense and non-cash stock option expense.
(3)
Severance costs associated with the right sizing of our German facilities.
4
th
Quarter 2010 Adjusted EBITDA |