Attached files
Table of Contents
UNITED STATES
SECURITIES AND EXCHANGE COMMISSION
Washington, D.C. 20549
FORM 10-K
(Mark One)
| x | ANNUAL REPORT PURSUANT TO SECTION 13 OR 15 (d) OF THE SECURITIES EXCHANGE ACT OF 1934 |
For the fiscal year ended: December 31, 2010
OR
| ¨ | TRANSITION REPORT PURSUANT TO SECTION 13 OR 15 (d) OF THE SECURITIES EXCHANGE ACT OF 1934 |
For the transition period from to
Commission file number 000-51288
CNL LIFESTYLE PROPERTIES, INC.
(Exact name of registrant as specified in its charter)
| Maryland | 20-0183627 | |
| (State of other jurisdiction of incorporation or organization) |
(I.R.S. Employer Identification No.) | |
| 450 South Orange Avenue Orlando, Florida |
32801 | |
| (Address of principal executive offices) | (Zip Code) |
Registrant’s telephone number, including area code: (407) 650-1000
Securities registered pursuant to Section 12(b) of the Act:
| Title of each class |
Name of exchange on which registered | |
| None |
Not applicable |
Securities registered pursuant to Section 12(g) of the Act:
Common Stock, $0.01 par value per share
(Title of class)
Indicate by check mark if the registrant is a well-known seasoned issuer, as defined in Rule 405 of the Securities Act. Yes ¨ No x
Indicate by check mark if the registrant is not required to file reports pursuant to Section 13 or Section 15(d) of the Act. Yes ¨ No x
Indicate by check mark whether the registrant (1) has filed all reports required to be filed by Section 13 or 15(d) of the Securities Exchange Act of 1934 during the preceding 12 months (or for such shorter period that the registrant was required to file such reports), and (2) has been subject to such filing requirements for the past 90 days. Yes x No ¨
Indicate by check mark whether the registrant has submitted electronically and posted on its corporate Web site, if any, every Interactive Data File required to be submitted and posted pursuant to Rule 405 of Regulation S-T (§232.405 of this chapter) during the preceding 12 months (or for such shorter period that the registrant was required to submit and post such files). Yes ¨ No ¨
Indicate by check mark if disclosure of delinquent filers pursuant to Item 405 of Regulation S-K (229.05 of this Chapter) is not contained herein, and will not be contained, to the best of registrant’s knowledge, in definitive proxy or information statements incorporated by reference in Part III of this Form 10-K or any amendment to this Form 10-K. ¨
Indicate by check mark whether the registrant is a large accelerated filer, an accelerated filer, a non-accelerated filer, or a smaller reporting company. See definitions of “large accelerated filer”, “accelerated filer” and “smaller reporting company” in Rule 12b-2 of the Exchange Act.
| Large accelerated filer ¨ |
Accelerated filer ¨ | |
| Non-accelerated filer x |
Smaller reporting company ¨ | |
| (Do not check if a smaller reporting company) |
||
Indicate by check mark whether the registrant is a shell company (as defined in Rule 12b-2 of the Act). Yes ¨ No x
While there is no established market for the registrant’s shares of common stock, the registrant has an ongoing primary offering of its shares of common stock pursuant to a registration statement on Form S-11. In each of its primary offerings, the registrant sold shares of its common stock for $10.00 per share, with discounts available for certain categories of purchasers. The number of shares held by non-affiliates as of June 30, 2010 (the last business day of the registrant’s most recently completed second fiscal quarter) was approximately 262,971,959.
As of March 10, 2011, there were 293,530,034 shares of the registrant’s common stock outstanding.
DOCUMENTS INCORPORATED BY REFERENCE
Registrant incorporates by reference portions of the CNL Lifestyle Properties, Inc. Definitive Proxy Statement for the 2011 Annual Meeting of Stockholders (Items 10, 11, 12, 13 and 14 of Part III) to be filed no later than April 30, 2011.
Table of Contents
Table of Contents
STATEMENT REGARDING FORWARD LOOKING INFORMATION
The following information contains forward-looking statements within the meaning of Section 27A of the Securities Act of 1933, as amended, and Section 21E of the Securities Exchange Act of 1934, as amended. These statements generally are characterized by the use of terms such as “may,” “will,” “should,” “plan,” “anticipate,” “estimate,” “intend,” “predict,” “believe” and “expect” or the negative of these terms or other comparable terminology. Although we believe that the expectations reflected in such forward-looking statements are based upon reasonable assumptions, our actual results could differ materially from those set forth in the forward-looking statements. Some factors that might cause such a difference include the following: continued or worsening economic environment, the lack of available debt for us and our tenants, including our inability to refinance existing debt, the general decline in value of real estate, conditions affecting the CNL brand name, increased direct competition, changes in government regulations or accounting rules, changes in local and national real estate conditions, our ability to obtain additional lines of credit or long-term financing on satisfactory terms, changes in interest rates, availability of proceeds from our offering of shares, availability of capital to expand and enhance our properties, our tenants’ inability to increase revenues or manage rising costs, our ability to identify suitable investments, our ability to close on identified investments, our ability to locate suitable tenants and operators for our properties and borrowers for our loans, tenant or borrower defaults under their respective leases or loans, tenant or borrower bankruptcies and inaccuracies of our accounting estimates. Given these uncertainties, we caution you not to place undue reliance on such statements. We undertake no obligation to publicly release the results of any revisions to these forward-looking statements that may be made to reflect future events or circumstances or to reflect the occurrence of unanticipated events.
| Item 1. | Business |
GENERAL
CNL Lifestyle Properties, Inc. is a Maryland corporation organized on August 11, 2003. We operate as a real estate investment trust, or REIT. The terms “us,” “we,” “our,” “our company” and “CNL Lifestyle Properties” include CNL Lifestyle Properties, Inc. and each of our subsidiaries. We have retained CNL Lifestyle Company, LLC, (the “Advisor”), as our Advisor to provide management, acquisition, disposition, advisory and administrative services. Our offices are located at 450 South Orange Avenue within the CNL Center at City Commons in Orlando, Florida 32801.
Our principal investment objectives include investing in a diversified portfolio of real estate with a goal to preserve, protect and enhance the long-term value of those assets. We primarily invest in lifestyle properties in the United States that we believe have the potential for long-term growth and income generation. Our investment thesis is supported by demographic trends which we believe affect consumer demand for the various lifestyle asset classes that are the focus of our investment strategy. We define lifestyle properties as those properties that reflect or are impacted by the social, consumption and entertainment values and choices of our society. We primarily lease our properties on a long-term, triple-net or gross basis (generally five to 20 years, plus multiple renewal options) to tenants or operators that we consider to be significant industry leaders. To a lesser extent, we also make and acquire loans (including mortgage, mezzanine and other loans), enter into joint ventures related to interests in real estate and engage third-party operators to manage certain properties on our behalf as permitted under applicable tax regulations.
Following our investment policies of acquiring carefully selected and well-located lifestyle and other income producing properties, we believe we have built a unique portfolio of assets with established long-term operating histories, and have created balanced diversification within the portfolio by region, operator and asset class. We will continue to focus on select acquisitions of income producing properties that we believe will enhance the portfolio and provide long-term value to our stockholders, while also concentrating on the management and oversight of our existing portfolio. We have also maintained a strong balance sheet and cash position with a low leverage ratio.
1
Table of Contents
While we have primarily acquired wholly owned properties subject to long-term triple-net leases, we also make investments in properties through joint ventures, and to a lesser extent, engaged third-party operators to manage certain properties on our behalf. The following represents our types of property investments by number of total properties as of March 10, 2011:
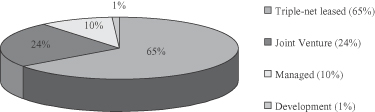
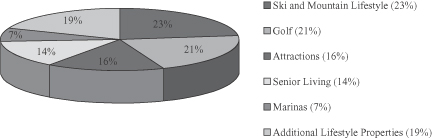
Asset classes and portfolio diversification. As of March 10, 2011, we had a portfolio of 150 lifestyle properties which when aggregated by initial purchase price was diversified as follows: approximately 23% in ski and mountain lifestyle, 21% in golf facilities, 14% in senior living, 16% in attractions, 7% in marinas and 19% in additional lifestyle properties. These assets consist of 22 ski and mountain lifestyle properties, 53 golf facilities, 29 senior living facilities, 21 attractions, 17 marinas and eight additional lifestyle properties. Thirty-seven of these 150 properties are owned through unconsolidated entities. Many of our properties feature characteristics that are common to more than one asset class, such as a ski resort with a golf facility. Our asset classifications are based on the primary property usage. The pie chart below shows our asset class diversification as of March 10, 2011, by initial purchase price.
2
Table of Contents
Our real estate investment portfolio is geographically diversified with properties in 32 states and two Canadian provinces. The map below shows our current property allocations across geographic regions as of March 10, 2011.

Our tenants and operators. We generally attempt to lease our properties to tenants and operators that we consider to be significant industry leaders. However, we do not believe the success of our properties is based solely on the performance or abilities of our tenant operators. In some cases, we consider the assets we have acquired to be unique, iconic or nonreplicable which by their nature have an intrinsic value. In addition, in the event a tenant is in default and vacates a property, under special provisions in the tax laws we are able to engage a third-party manager to operate the property on our behalf for a period of time until we re-lease it to a new tenant. During this period, the property remains open and we receive any net earnings from the property’s operations, although these amounts may be less than the rents that were contractually due under the prior leases. Any taxable income from these properties will be subject to income tax until we re-lease these properties to new tenants.
Our leases and ventures. As part of our net lease investment strategy, we either acquire properties directly or purchase interests in entities that own the properties. Once we acquire the properties, we either lease them back to the original seller or to a third-party operator. These leases are usually structured as triple-net leases which means our tenants are generally responsible for repairs, maintenance, property taxes, ground lease or permit expenses (where applicable), utilities and insurance for the properties that they lease. The weighted-average lease rate of our consolidated properties subject to long-term triple-net leases as of December 31, 2010 was approximately 8.8%. This rate is based on the weighted-average annualized straight-lined base rent due under our leases.
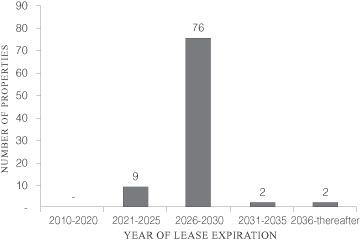
Our leases are generally long-term in nature (generally five to 20 years with multiple renewal options). We have no near-term lease expirations (other than at our one multi-family residential property, which generally
3
Table of Contents
enters into one-year leases with its tenants) with the first long-term lease expiring in December 2021, excluding available renewal periods. As of March 10, 2011, the average lease expiration of our portfolio (excluding our multi-family residential property and our unconsolidated properties) was approximately 17 years with the following breakdown:
We typically structure our leases to provide for the payment of a minimum annual base rent with periodic increases in base rent over the lease term. In addition, our leases provide for the payment of percentage rent normally based on a percentage of gross revenues generated at the property over certain thresholds. Within the provisions of our leases, we also generally require the payment of capital improvement reserve rent. Capital improvement reserves are paid by the tenant and are generally based on a percentage of gross revenue of the property and are set aside by us for capital improvements, replacements and other capital expenditures at the property. These amounts are and will remain our property during and after the term of the lease and help maintain the integrity of our assets.
To a lesser extent, when beneficial to our investment structure, certain properties may be leased to wholly-owned tenants that are taxable REIT subsidiaries or that are owned through taxable REIT subsidiaries (referred to as “TRS” entities). Under this structure, we engage third-party managers to conduct day-to-day operations. Under the TRS leasing structure, our results of operations will include the operating results of the underlying properties as opposed to rental income from operating leases that is recorded for properties leased to third-party tenants.
We have entered into joint ventures in which our partners subordinate their returns to our minimum return. This structure provides us with some protection against the risk of downturns in performance but may allow our partners to obtain a higher rate of return on their investment than we receive if the underlying performance of the properties exceeds certain thresholds. As of March 10, 2011, we had a total of 37 properties owned through three unconsolidated joint ventures.
Our managed properties. In certain circumstances, and subject to applicable tax regulations, we may engage third-party operators to manage properties on our behalf. For example, when beneficial to our investment structure, we may engage third-party operators to manage hotels and senior living properties under the TRS leasing structure. In addition, in the case of a tenant default and lease termination, we may engage a third-party manager to operate the property on our behalf for a period of time until we can re-lease the property. This allows us time to stabilize the property, if necessary, and enter into a new lease when market conditions are potentially more favorable. During this managed period, we recognize all the underlying property operating revenues and expenses in our consolidated financial statements and may be subject to more direct operating risk. As of March 10, 2011, we had 23 managed properties including four hotels, two golf courses, 16 attractions and one multi-family residential property.
4
Table of Contents
Our loans. As part of our overall investment and lending strategy, we have made and may continue to make or acquire loans (including mortgage, mezzanine or other loans) with respect to any of the asset classes in which we invest. We generally make loans to the owners of properties to enable them to acquire land, buildings, or both, or to develop property or as part of a larger acquisition. In exchange, the owner generally grants us a first lien or collateralized interest in a participating mortgage collateralized by the property or by interests in the entity that owns the property. Our loans generally require fixed interest payments. We expect that the interest rate and terms for long-term mortgage loans (generally, 10 to 20 years) will be similar to the rate of return on our long-term net leases. Mezzanine loans and other financings for which we have a secondary-lien or collateralized interest will generally have shorter terms (one to two years) and higher interest rates than our net leases and long-term mortgage loans. With respect to the loans that we make, we generally seek loans with collateral values resulting in a loan-to-value ratio of not more than 85%.
Our common stock offerings. As of December 31, 2010, we had raised approximately $3.0 billion (301.2 million shares) through our public offerings. During the period January 1, 2011 through March 10, 2011, we raised an additional $88.3 million (8.8 million shares). We have and will continue to use the net proceeds from our offerings to make select investments. We do not intend to commence another public offering of our shares following the completion of our current public offering on April 9, 2011. However, we intend to continue offering shares through our reinvestment plan. In making this decision, the board of directors considered a number of factors, including the Company’s size and diversification of our portfolio, our relatively low leverage and strong cash position, as well as the current stage of our lifecycle.
Seasonality. Many of the asset classes in which we invest are seasonal in nature and experience seasonal fluctuations in their business due to geographic location, climate and weather patterns. As a result, the businesses experience seasonal variations in revenues that may require our operators to supplement operating cash from their properties in order to be able to make scheduled rent payments to us. We have structured the leases for certain tenants such that rents are paid on a seasonal schedule with most, if not all, of the rent being paid during the tenant’s seasonally busy operating period.
As part of our diversification strategy, we have considered the varying and complimentary seasonality of our asset classes and portfolio mix. For example, the peak operating season of our ski and mountain lifestyle assets is staggered against the peak seasons in our attractions and golf portfolios to balance and mitigate the risks associated with seasonality. Generally seasonality does not significantly affect our recognition of rental income from operating leases due to straight-line revenue recognition in accordance with Generally Accepted Accounting Principles (“GAAP”). However, seasonality does impact the timing of when base rent payments are made by our tenants, which impacts our operating cash flows and the amount of rental revenue we recognize in connection with capital improvement reserve revenue and percentage rents paid by our tenants, which is recognized in the period in which it is earned and is generally based on a percentage of tenant revenues. In addition, seasonality directly impacts properties where we engage third-party operators to manage on our behalf and where we record property operating revenues and expenses rather than straight-line rents from operating leases. These properties will likely generate net operating losses during their non-peak months while generating most, if not all, of their operating income during their peak operating season. Our consolidated operating results and cash flows will fluctuate quarter to quarter depending on the number and types of properties being managed by third-party operators and the seasonal results of those properties.
Competition. As a REIT, we have historically experienced competition from other REITs (both traded and non-traded), real estate partnerships, mutual funds, institutional investors, specialty finance companies, opportunity funds, healthcare providers, and other investors, including, but not limited to, banks and insurance companies, many of which generally have had greater financial resources than we do for the purposes of leasing and financing properties within our targeted asset classes. These competitors often also have a lower cost of capital and are subject to less regulation. The level of competition impacts both our ability to raise capital, find real estate investments and locate suitable tenants. We may also face competition from other funds in which affiliates of our Advisor participate or advise.
5
Table of Contents
In general, we perceive there to be a lower level of competition for the types of assets that we have acquired and intend to acquire in comparison to assets in core real estate sectors based on the number of willing buyers and the volume of transactions in their respective markets. Accordingly, we believe that being focused in specialty or lifestyle asset classes allows us to take advantage of unique opportunities. Some of our key competitive advantages are as follows:
| • | We acquire assets in niche sectors which historically trade at higher cap rates than other core commercial real estate sectors such as Apartment, Industrial, Office and Retail. |
| • | Some of our targeted assets classes, such as golf and ski, have experienced a net reduction in new supply, which has better equalized supply and demand. |
| • | Certain of our lifestyle properties have inherently high barriers to entry. For example, the process of obtaining permits to create a new ski resort or marina is highly regulated and significantly more difficult than obtaining permits for the construction of new office or retail space. Additionally, general geographic constraints, such as the availability of suitable waterfront property or mountain terrain, are an inherent barrier to entry in several of our asset classes. There are also high costs associated with building a new ski resort or regional gated attractions that may be prohibitive to potential market participants. |
| • | Our leasing arrangements generally require the payment of capital improvement reserve rent which is paid by the tenants and set aside by us to be reinvested into the properties. This arrangement allows us to maintain the integrity of our properties and mitigates deferred maintenance issues. |
| • | Unlike our competitors in many other commercial real estate sectors that generally receive no income in the event a tenant defaults or vacates a property, applicable tax laws allow us to engage a third-party manager to operate a property on our behalf for a period of time until we can re-lease it to a new tenant. During that period, we receive any net earnings from the underlying business operations, which may be less than rents collected under the previous leasing arrangement. However, our ability to continue to operate the property under such an arrangement helps to off-set taxes, insurance and other operating costs that would otherwise have to be absorbed by a landlord and allows the property some time to stabilize, if necessary, before entering into a new lease. |
Significant tenants and borrowers. As of December 31, 2010 and 2009 and for the three years ended through December 31, 2010, we had the following tenants that individually accounted for 10% or more of our aggregate total revenues or assets.
| Tenant |
Number & Type of Leased |
Percentage of Total Revenues |
Percentage of Total Assets |
|||||||||||||||||||
| 2010 | 2009 | 2008 | 2010 | 2009 | ||||||||||||||||||
| PARC Management, LLC (“PARC”)(1) |
— (1) | 11.0 | %(1) | 18.3 | % | 21.0 | % | — | (1) | 14.3 | % | |||||||||||
| Boyne USA, Inc. (“Boyne”) |
7 Ski & Mountain | 12.6 | % | 15.3 | % | 19.4 | % | 8.8 | % | 9.2 | % | |||||||||||
| Lifestyle Properties | ||||||||||||||||||||||
| Evergreen Alliance Golf Limited, L.P. (“EAGLE”) |
43 Golf Facilities | 12.1 | % | 14.3 | % | 20.6 | % | 14.6 | % | 15.4 | % | |||||||||||
| Booth Creek Ski Holding, Inc.(2) (“Booth”) |
1 Ski & Mountain | 1.8 | % | 8.3 | % | 12.2 | % | 1.2 | % | 6.3 | % | |||||||||||
| Lifestyle Property | ||||||||||||||||||||||
FOOTNOTES:
| (1) | As of December 31, 2010, we were in the process of transitioning all of our properties previously leased to PARC to new third-party managers. This process was completed in February 2011 and PARC is no longer a tenant of the Company. |
6
Table of Contents
| (2) | On October 25, 2010, Vail Resorts Inc. acquired 100% of the equity interest in the companies that operate Northstar-at-Tahoe Resort and The Village at Northstar from Booth Creek Resort Properties LLC and became our tenant under the existing leases on the properties. |
The significance of any given tenant or operator, and the related concentration of risk generally decrease as additional properties and operators are added to the portfolio. As shown above, there were only two tenants that individually accounted for 10% or more of our total revenues or assets as of December 31, 2010.
Tax status. We currently operate and have elected to be taxed as a REIT for federal income tax purposes beginning with the taxable year ended December 31, 2004. As a REIT, we generally will not be subject to federal income tax at the corporate level to the extent we distribute annually at least 90% of our taxable income to our stockholders and meet other compliance requirements. If we fail to qualify as a REIT in any taxable year, we will be subject to federal income tax on our taxable income at regular corporate rates and will not be permitted to qualify for treatment as a REIT for federal income tax purposes for four years following the year in which our qualification is lost.
Recent tax legislation. On October 18, 2010, the IRS published final regulations that require us to report the cost basis and gain or loss to a stockholder upon the sale or liquidation of “covered shares.” For purposes of the final regulations, all shares acquired by non-tax exempt stockholders on or after January 1, 2011 will be considered “covered shares” and will be subject to the new reporting requirement. In addition, beginning on January 1, 2012, all shares acquired by non-tax exempt stockholders through our Distribution Reinvestment Plan (DRP) will also be considered “covered shares.”
Upon the sale or liquidation of “covered shares,” a broker must report both the cost basis of the shares and the gain or loss recognized on the sale of those shares to the stockholder and to the IRS on Form 1099-B. In addition, effective January 1, 2011, S-corporations will no longer be exempt from Form 1099-B reporting and shares purchased by an S-corporation on or after January 1, 2012 will be “covered shares” under the final regulations. If we take an organizational action such as a stock split, merger, acquisition or return of capital distribution that affects the cost basis of “covered shares,” we will report to each stockholder and to the IRS a description of any such action and the quantitative effect of that action on the cost basis on an information return.
We have elected the first in, first out (FIFO) method as the default for calculating the cost basis and gain or loss upon the sale or liquidation of “covered shares”. A non-tax exempt stockholder may elect a different method of computation until the settlement date of the sold or liquidated shares. The election must be made in writing. Stockholders should consult with their tax advisors to determine the appropriate method of accounting for their investment.
Recently enacted legislation will require, after December 31, 2012, withholding at a rate of 30% on dividends in respect of, and gross proceeds from the sale of, shares of our stock held by or through certain foreign financial institutions (including investment funds), unless such institution enters into an agreement with the Secretary of the Treasury to report, on an annual basis, information with respect to shares in the institution held by certain U.S. persons and by certain non-U.S. entities that are wholly or partially owned by U.S. persons and to withhold on certain payments. Accordingly, the entity through which shares of stock is held will affect the determination of whether such withholding is required. Similarly, dividends in respect of, and gross proceeds from the sale of, shares of our stock held by an investor that is a non-financial non-U.S. entity will be subject to withholding at a rate of 30%, unless such entity either (i) certifies to us that such entity does not have any “substantial United States owners” or (ii) provides certain information regarding the entity’s “substantial United States owners,” which we will in turn provide to the Secretary of the Treasury. We will not pay any additional amounts to any stockholders in respect of any amounts withheld. Foreign persons are encouraged to consult with their tax advisors regarding the possible implications of the legislation on their investment in shares of our stock.
On March 30, 2010, the President signed into law the Health Care and Education Reconciliation Act of 2010, which requires U.S. stockholders who meet certain requirements and are individuals, estates or certain
7
Table of Contents
trusts to pay an additional tax on, among other things, dividends on and capital gains from the sale or other disposition of stock for taxable years beginning after December 31, 2012. U.S. stockholders should consult their tax advisors regarding the effect, if any, of this legislation on their ownership and disposition of shares of our stock.
FINANCIAL INFORMATION ABOUT INDUSTRY SEGMENTS
Our current business consists of investing in, owning and leasing lifestyle properties primarily in the United States. We evaluate all of our lifestyle properties as a single industry segment and review performance on a property-by-property basis. Accordingly, we do not report segment information.
FINANCIAL INFORMATION ABOUT GEOGRAPHIC AREAS
We have one consolidated property located in British Columbia, Canada, Cypress Mountain, that generated total rental income of approximately $6.3 million for both of the years ended December 31, 2010 and 2009 and $6.7 million for the year ended December 31, 2008. We also own interests in two properties located in Canada through unconsolidated entities that generated a combined equity in earnings of approximately $0.1 million during the year ended December 31, 2010 and a combined equity in losses of approximately $0.3 million and $0.2 million during the years ended December 31, 2009 and 2008, respectively. The remainder of our rental income was generated from properties or investments located in the United States.
ADVISORY SERVICES
We have engaged CNL Lifestyle Company, LLC as our Advisor. Under the terms of the advisory agreement, our Advisor is responsible for our day-to-day operations, administers our bookkeeping and accounting functions, serves as our consultant in connection with policy decisions to be made by our board of directors, manages our properties, loans, and other permitted investments and renders other services as the board of directors deems appropriate. In exchange for these services, our Advisor is entitled to receive certain fees from us. First, for supervision and day-to-day management of the properties and the mortgage loans, our Advisor receives an asset management fee, which is payable monthly, in an amount equal to 0.08334% per month based on the total real estate asset value of a property as defined in the advisory agreement (exclusive of acquisition fees and acquisition expenses), the outstanding principal amounts of any loans made by us and the amount invested in any other permitted investments as of the end of the preceding month. Second, for the selection, purchase, financing, development, construction or renovation of real properties and services related to the incurrence of debt, our Advisor receives an acquisition fee equal to 3% of the gross proceeds from our common stock offerings and loan proceeds from debt, lines of credit and other permanent financing that we use to acquire properties or to make or acquire loans and other permitted investments.
In addition, we reimburse our Advisor for all of the costs it incurs in connection with the administrative services it provides to us. However, in accordance with the advisory agreement, our Advisor is required to reimburse us for the amount by which the total operating expenses (as described in the advisory agreement) incurred by us in any four consecutive fiscal quarters (the “Expense Year”) exceed the greater of 2% of average invested assets or 25% of net income (the “Expense Cap”). For the Expense Years ended December 31, 2010, 2009 and 2008, operating expenses did not exceed the Expense Cap.
The current advisory agreement continues until March 22, 2011, and was extended by unanimous consent of our board of directors through April 9, 2011, at which time we will engage CNL Lifestyle Advisor Corporation (the “New Advisor”) as our advisor and enter into an advisory agreement with substantially similar terms and services as those provided under our current advisory agreement. The current directors and officers of the Advisor will be elected and appointed as the directors and officers of the New Advisor and will have similar responsibilities and roles with the New Advisor as they currently hold with the Advisor except as otherwise noted in Item 9B. of this filing. In addition, the New Advisor will continue to engage and contract with other affiliates of our current advisor to cause those affiliates to provide services and personnel to perform duties on behalf of the Company.
8
Table of Contents
LEGAL AND REGULATORY CONSIDERATIONS
General. Our properties are subject to various laws, ordinances and regulations, including regulations relating to common areas. We believe that each of our properties as of December 31, 2010 has the necessary permits and approvals to operate its business.
Americans with Disabilities Act. Our U.S. properties must comply with Title III of the Americans with Disabilities Act of 1990, or the ADA, to the extent that such properties are “public accommodations” as defined by the ADA. The ADA may require removal of structural barriers to access by persons with disabilities in certain public areas of our properties where such removal is readily achievable. We believe that our properties are in substantial compliance with the ADA and that we will not be required to make substantial capital expenditures to address the requirements of the ADA. However, noncompliance with the ADA could result in imposition of fines or an award of damages to private litigants. The obligation to make readily achievable accommodations is an ongoing one, and we will continue to assess our properties and to make alterations as appropriate in this respect.
Environmental, Health, and Safety Matters. We are subject to many federal, state, and local environmental, health, and safety laws. The applicability of specific environmental, health, and, safety laws to each of our individual properties is dependent upon a number of property-specific factors, including: the current and former uses of the property; any impacts to the property from other properties; the type and amount of any emissions or discharges from or releases at the property; the building materials used at the property, including any asbestos-containing materials; and, among other factors, the type and amount of any hazardous substances or wastes used, stored, or generated at the property.
Under various laws relating to protection of the environment, current and former owners and operators of real property may be liable for any contamination resulting from the presence or release of hazardous or toxic substances at the property. Current and former owners and operators may also be held liable to the government or to third parties for property damage and for investigation and remediation costs related to contamination, regardless of whether the owners and operators were responsible for or even knew of the contamination, and the liability may be joint and several. The government may be entitled to a lien on a contaminated property. Certain environmental laws, as well as the common law, may subject us to liability for damages or injuries suffered by third parties as a result of environmental contamination or releases originating at our properties, including releases of asbestos, and the liabilities associated with our properties could exceed the values of the respective properties. Some of our properties were previously used for industrial purposes, and those properties may contain some degree of contamination. Environmental impacts or contamination at our properties may prevent us from selling or leasing the properties or using them as collateral. Environmental laws may regulate the use of our properties or the types of operations which can be conducted at our properties, and these regulations may necessitate corrective or other expenditures.
Some of our properties may contain asbestos-containing building materials. Asbestos-containing building materials are subject to management and maintenance requirements under environmental laws, and owners and operators may be subject to penalty for noncompliance. Environmental laws may allow suits by third parties for recovery from owners and operators for personal injury related to exposure to asbestos-containing building materials.
Prior to the purchase of our properties, we generally engaged independent environmental consultants to perform Phase I environmental assessments, which normally do not involve soil, groundwater or other invasive sampling. When Phase I environmental assessment results indicated the need to do so, we conducted Phase II assessments, which do involve invasive sampling. These assessments have not revealed any materially adverse environmental conditions which impact or have impacted our properties other than conditions which have been remediated or are currently undergoing remediation. There can be no assurance, however, that new environmental liabilities have not developed since the assessments were performed, that the assessment failed to reveal material adverse environmental conditions, liabilities, or compliance concerns, or that future developments, including changes in laws or regulations, will not impose environmental costs or liabilities upon
9
Table of Contents
us. If we become subject to material environmental liabilities, these liabilities could adversely effect us, our business and assets, the results of our operations, and our ability to meet our obligations.
Insurance. We maintain, or cause operators to maintain, insurance including, but not limited to, liability, fire, wind, earthquake, and business income coverage on all of our properties that are not being leased on a triple-net basis under various policies. We select policy specifications and insured limits which we believe to be appropriate given the relative risk of loss, the cost of the coverage and industry practice and, in the opinion of our company’s management, our properties that are not being leased on a triple-net basis are currently adequately insured. We do not carry insurance for generally uninsured losses such as loss from war or nuclear reaction. Certain of our properties are located in areas known to be seismically active. See “Risk Factors—Risks Related to Our Business and Operations—Potential losses may not be covered by insurance.”
EMPLOYEES
Reference is made to Item 10. “Directors, Executive Officers and Corporate Governance” in our Definitive Proxy Statement for a listing of our executive officers. We have no employees. Our executive officers are compensated through our advisor and/or its affiliates.
AVAILABLE INFORMATION
We make available free of charge on our Internet website, www.cnllifestylereit.com, our Annual Report on Form 10-K, Quarterly Reports on Form 10-Q, Current Reports on Form 8-K, and, if applicable, amendments to those reports filed or furnished pursuant to Section 13(a) or 15(d) of the Securities Exchange Act of 1934, as amended, as soon as reasonably practicable after we electronically file such material with, or furnish it to, the U.S. Securities and Exchange Commission (the “Commission”). The public may read and copy any materials that we file with the Commission at the Commission’s Public Reference Room at Room 1580, 100 F Street, N.E., Washington, D.C. 20549 and may obtain information on the Public Reference Room by calling the Commission at 1-800-SEC-0330. The Commission maintains an internet site that contains reports, proxy and information statements, and other information that we file electronically with the Commission (http://www.sec.gov).
10
Table of Contents
| Item 1A. | Risk Factors |
Real Estate and Other Investment Risks
The economic environment and general market conditions in recent years have affected certain of the lifestyle properties in which we invest. A continuation of such conditions could adversely affect our financial condition and results of operations. The recent economic and market conditions have affected the value and operating performance of certain of our properties which resulted in tenant defaults, losses on lease terminations, loan loss provisions and impairments charges. Continued or worsening global economic conditions including unemployment rates, the effects of unrest in the Middle East and rising oil prices, inflationary risks and rising costs, and a lack of consumer confidence with decreased consumer spending could result in additional losses to us and have a negative impact on our results of operations and our ability to pay distributions to our stockholders.
The economic environment has affected certain of our tenants’ ability to make rental payments to us in accordance with their lease agreement. Some of our tenants have experienced difficulties or have been unable to obtain working capital lines of credit or renew their existing lines of credit due to current state of economy and the capital markets which impacted their ability to pay the full amount of rent due under their leases. As a result, we restructured the leases for certain tenants such that the rents are paid on a seasonal schedule with most, if not all, of the rent being paid during the tenants’ seasonally busy period. In other cases, we restructured the lease terms to allow for rent deferrals or reductions for a period of time to provide temporary relief that then become payable in later periods of the lease term. In addition, we have refunded security deposits which must be replaced up to specified amounts and have provided lease allowances. The rent deferrals granted, the security deposits refunded and lease allowances paid directly reduced our cash flows from operating activities. Other restructures, such as the reductions in lease rates and the future amortization of lease allowances against rental income have reduced and will continue to reduce our net operating results and cash flows in current and future periods.
Our operating results will experience seasonal fluctuations on properties in which we have engaged third-party managers to operate the properties on our behalf. In certain circumstances, we have engaged third-party managers to operate the properties on our behalf as a result of tenant defaults or utilizing the TRS leasing structure. In these situations, we recognize the properties’ operating revenues and expenses in our consolidated financial statements and may be subject to more direct operating risk. In addition, certain of our managed properties are seasonal in nature due to geographic location, climate and weather patterns. These properties will likely generate net operating losses during their non-peak months while generating most, if not all, of their operating income during their peak operating season. Our consolidated operating results will fluctuate quarter to quarter depending on the number and types of properties being managed by third-party operators and the seasonal results of those properties.
We will be exposed to various operational risks, liabilities and claims with respect to the properties that we engage third-party managers to operate on our behalf which may adversely affect our operating results. With respect to the properties that are managed by third-party operators, we are exposed to various operational risk, liabilities and claims in addition to those generally applicable to ownership of real property. These risks include the operator’s inability to manage the properties and fulfill its obligations, increases in labor costs and services, cost of energy, insurance, operating supplies and litigation costs relating to accidents or injuries at the properties. Although we maintain reasonable levels of insurance, we cannot be certain the insurance will adequately cover all litigation costs relating to accidents or inquires. Any one or a combination of these factors, together with other market and conditions beyond our control, could result in operating deficiencies at our managed properties which could have a material effect on our operating results.
Because our revenues are highly dependent on lease payments from our properties and interest payments from loans that we make, defaults by our tenants or borrowers would reduce our cash available for the repayment of our outstanding debt and for distributions. Our ability to repay any outstanding debt and make distributions to stockholders will depend upon the ability of our tenants and borrowers to make payments to us,
11
Table of Contents
and their ability to make these payments will depend primarily on their ability to generate sufficient revenues in excess of operating expenses from businesses conducted on our properties. For example, the ability of our tenants to make their scheduled payments to us will depend upon their ability to generate sufficient operating income at the property they operate. A tenant’s failure or delay in making scheduled rent payments to us or a borrower’s failure to make debt service payments to us may result from the tenant or borrower realizing reduced revenues at the properties it operates.
Discretionary consumer spending may affect the profitability of certain properties we acquire. The financial performance of certain properties in which we have invested and may invest in the future depends in part on a number of factors relating to or affecting discretionary consumer spending for the types of services provided by businesses operated on these properties. Unfavorable local, regional, or national economic developments or uncertainties regarding future economic prospects have reduced consumer spending in the markets where we own properties and, when combined with the lack of available debt, have adversely affected certain of our tenants’ businesses. As a result, certain of our tenants have experienced declines in operating results, and a number of our tenants have modified the terms of certain of their leases with us. Any continuation of such events that leads to lower spending on lifestyle activities could impact our tenants’ ability to pay rent and thereby have a negative impact on our results of operations.
The inability to increase or maintain lease rates at our properties might affect the level of distributions to stockholders. Given the nature of certain properties we have acquired or may acquire, the relative stagnation of base lease rates in certain sectors might not allow for substantial increases in rental revenue to us that could allow us to maintain or increase levels of distributions to stockholders.
Seasonal revenue variations in certain asset classes will require the operators of those asset classes to manage cash flow properly over time so as to meet their non-seasonal scheduled rent payments to us. Certain of the properties in which we invest or may invest are generally seasonal in nature due to geographic location, climate and weather patterns. For example, revenue and profits at ski resorts and their related properties are substantially lower and historically result in losses during the summer months due to the closure of ski operations, while many attractions properties are closed during the winter months and produce the majority of their revenues and profits during summer months. As a result of the seasonal nature of certain business operations that may be conducted on properties we acquire, these businesses will experience seasonal variations in revenues that may require our operators to supplement revenue at their properties in order to be able to make scheduled rent payments to us or require us to, in certain cases, adjust their lease payments so that we collect more rent during their seasonally busy time.
Our real estate assets may be subject to impairment charges. We periodically evaluate the recoverability of the carrying value of our real estate assets for impairment indicators. Factors considered in evaluating impairment of our existing real estate assets held for investment include significant declines in property operating profits, recurring property operating losses and other significant adverse changes in general market conditions. Generally, a real estate asset held for investment is not considered impaired if the undiscounted, estimated future cash flows of the asset over its estimated holding period are in excess of the asset’s net book value at the balance sheet date. Investments in unconsolidated entities are not considered impaired if the estimated fair value of the investment exceeds the carrying value of the investment and the decline is considered to be other than temporary. Management makes assumptions and estimates when considering impairments and actual results could vary materially from these assumptions and estimates.
We do not have control over market and business conditions that may affect our success. The following external factors, as well as other factors beyond our control, may reduce the value of properties that we acquire, the ability of tenants to pay rent on a timely basis, or at all, the amount of the rent to be paid and the ability of borrowers to make loan payments on time, or at all:
| • | changes in general or local economic or market conditions; |
12
Table of Contents
| • | the pricing and availability of debt, operating lines of credit or working capital; |
| • | increased costs of energy, insurance or products; |
| • | increased costs and shortages of labor; |
| • | increased competition; |
| • | quality of management; |
| • | failure by a tenant to meet its obligations under a lease; |
| • | bankruptcy of a tenant or borrower; |
| • | the ability of an operator to fulfill its obligations; |
| • | limited alternative uses for properties; |
| • | changing consumer habits; |
| • | condemnation or uninsured losses; |
| • | changing demographics; and |
| • | changing government regulations. |
Further, the results of operations for a property in any one period may not be indicative of results in future periods, and the long-term performance of such property generally may not be comparable to, and cash flows may not be as predictable as, other properties owned by third parties in the same or similar industry. If tenants are unable to make lease payments or borrowers are unable to make loan payments as a result of any of these factors, cash available for distributions to our stockholders may be reduced.
Our exposure to typical real estate investment risks could reduce our income. Our properties, loans and other permitted investments will be subject to the risks typically associated with investments in real estate. Such risks include the possibility that our properties will generate rent and capital appreciation, if any, at rates lower than we anticipated or will yield returns lower than those available through other investments or that the value of our properties will decline. Further, there are other risks by virtue of the fact that our ability to vary our portfolio in response to changes in economic and other conditions will be limited because of the general illiquidity of real estate investments. Income from our properties may be adversely affected by many factors including, but not limited to, an increase in the local supply of properties similar to our properties, a decrease in the number of people interested in participating in activities related to the businesses conducted on the properties that we acquire, adverse weather conditions, changes in government regulation, international, national or local economic deterioration, increases in energy costs and other expenses affecting travel, factors which may affect travel patterns and reduce the number of travelers and tourists, increases in operating costs due to inflation and other factors that may not be offset by increased revenue, and changes in consumer tastes.
If one or more of our tenants file for bankruptcy protection, we may be precluded from collecting all sums due. If one or more of our tenants, or the guarantor of a tenant’s lease, commences, or has commenced against it, any proceeding under any provision of the U.S. federal bankruptcy code, as amended, or any other legal or equitable proceeding under any bankruptcy, insolvency, rehabilitation, receivership or debtor’s relief statute or law (“Bankruptcy Proceeding”), we may be unable to collect sums due under our lease(s) with that tenant. Any or all of the tenants, or a guarantor of a tenant’s lease obligations, could be subject to a Bankruptcy Proceeding. A Bankruptcy Proceeding may bar our efforts to collect pre-bankruptcy debts from those entities or their properties unless we are able to obtain an enabling order from the bankruptcy court. If a lease is rejected by a tenant in bankruptcy, we would only have a general unsecured claim against the tenant, and may not be entitled to any further payments under the lease. We believe that our security deposits in the form of letters of credit would be protected from bankruptcy in most jurisdictions. However, a tenant’s or lease guarantor’s Bankruptcy Proceeding could hinder or delay efforts to collect past due balances under relevant leases or guarantees and
13
Table of Contents
could ultimately preclude collection of these sums. Such an event could cause a decrease or cessation of rental payments which would reduce our cash flow and the amount available for distribution to our stockholders. In the event of a Bankruptcy Proceeding, we cannot assure you that the tenant or its trustee will assume our lease. If a given lease, or guaranty of a lease, is not assumed, our cash flow and the amounts available for distribution to our stockholders may be adversely affected.
Multiple property leases or loans with individual tenants or borrowers increase our risks in the event that such tenants or borrowers become financially impaired. The value of our properties will depend principally upon the value of the leases entered into for properties that we acquire. Defaults by a tenant or borrower may continue for some time before we determine that it is in our best interest to terminate the lease or foreclose on the property of the borrower. Tenants may lease more than one property, and borrowers may enter into more than one loan. As a result, a default by, or the financial failure of, a tenant or borrower could cause more than one property to become vacant or be in default or more than one lease or loan to become non-performing. Defaults or vacancies can reduce and have reduced our cash receipts and funds available for distribution and could decrease the resale value of affected properties until they can be re-leased.
It may be difficult for us to exit a joint venture after an impasse. In our joint ventures, there will be a potential risk of impasse in some business decisions because our approval and the approval of each co-venturer may be required for some decisions. In any joint venture, we may have the right to buy the other co-venturer’s interest or to sell our own interest on specified terms and conditions in the event of an impasse regarding a sale. In the event of an impasse, it is possible that neither party will have the funds necessary to complete a buy-out. In addition, we may experience difficulty in locating a third-party purchaser for our joint venture interest and in obtaining a favorable sale price for the interest. As a result, it is possible that we may not be able to exit the relationship if an impasse develops.
The current U.S. housing market may adversely affect our operators’ and tenants’ ability to increase or maintain occupancy levels at, and rental income from, our senior living facilities which may impact the amount of distributions and earnings we received from our unconsolidated venture that owns senior living facilities. Our tenants and operators in our senior living facilities may experience relatively flat or declining occupancy levels in the near-term due to falling home prices, declining incomes, stagnant home sales and other economic factors. Seniors may choose to postpone their plans to move into senior living facilities rather than sell their homes at a loss, or for a profit below their expectations. Moreover, tightening lending standards have made it more difficult for potential buyers to obtain mortgage financing, all of which have contributed to the declining home sales. Any future rise in interest rates may compound or prolong this problem. In addition, the senior living segment may continue to experience a decline in occupancy associated with private pay residents choosing to move out of the facilities to be cared for at home by relatives due to the weak economy. A material decline in occupancy levels and revenues may make it more difficult for them to meet scheduled rent payments to us, which could adversely affect our financial condition.
Events which adversely affect the ability of seniors to afford our daily resident fees could cause the occupancy rates, resident fee revenues and results of operations of our senior living facilities to decline. Costs to seniors associated with certain types of the senior living properties generally are not reimbursable under government reimbursement programs such as Medicaid and Medicare. Substantially all of the resident fee revenues generated by our facilities will be derived from private payment sources consisting of income or assets of residents or their family members. Only seniors with income or assets meeting or exceeding certain standards can typically afford to pay our daily resident and service fees and, in some cases, entrance fees. Economic downturns such as the one recently experienced in the United States, reductions or declining growth of government entitlement programs, such as social security benefits, or stock market volatility could adversely affect the ability of seniors to afford the fees for our senior living facilities. If our tenants or managers are unable to attract and retain seniors with sufficient income, assets or other resources required to pay the fees associated with assisted and independent living services, the occupancy rates, resident fee revenues and results of operations for these facilities could decline, which, in turn, could have a material adverse effect on our business.
14
Table of Contents
We may be unable to identify and complete acquisitions on favorable terms or at all. We continually evaluate the market of available properties and may acquire additional lifestyle properties when opportunities exist. Our ability to acquire properties on favorable terms may be subject to the following significant risks:
| • | we may be unable to acquire a desired property because of competition from other real estate investors with significant capital, including both publicly traded REITs and institutional investment funds; |
| • | even if we are able to acquire a desired property, competition from other potential acquirors may significantly increase the purchase price or result in other less favorable terms; |
| • | even if we enter into agreements for the acquisition of desired lifestyle properties, these agreements are typically subject to customary conditions to closing, including completion of due diligence investigations to our satisfaction; |
| • | we may be unable to finance acquisitions on favorable terms or at all; and |
| • | we may acquire properties subject to liabilities and without any recourse, or with only limited recourse, with respect to unknown liabilities such as liabilities for clean-up of undisclosed environmental contamination, claims by tenants, vendors or other persons dealing with the former owners of the properties and claims for indemnification by general partners, directors, officers and others indemnified by the former owners of the properties. |
If we cannot complete property acquisitions on favorable terms, our financial condition, results of operations, cash flow, cash available for distribution and ability to satisfy our debt service obligations could be materially adversely affected.
The real estate industry is capital intensive and we are subject to risks associated with ongoing needs for renovation and capital improvements to our properties as well as financing for such expenditures. In order for us to remain competitive, our properties will have an ongoing need for renovations and other capital improvements, including replacements, from time to time, of furniture, fixtures and equipment. These capital improvements may give rise to the following risks:
| • | construction cost overruns and delays; |
| • | a possible shortage of available cash to fund capital improvements and the related possibility that financing for these capital improvements may not be available to us on satisfactory terms; and |
| • | disruptions in the operation of the properties while capital improvements are underway. |
We will not control the management of our properties. In order to maintain our status as a REIT for federal income tax purposes, we may not operate certain types of properties we acquire or participate in the decisions affecting their daily operations. Our success, therefore, will depend on our ability to select qualified and creditworthy tenants and managers who can effectively manage and operate the properties. Our tenants will be responsible for maintenance and other day-to-day management of the properties and, because our revenues will largely be derived from rents, our financial condition will be dependent on the ability of third-party tenants and/or operators to operate the properties successfully. We will attempt to enter into leasing agreements with tenants having substantial prior experience in the operation of the type of property being rented, however, there can be no assurance that we will be able to make such arrangements. Additionally, if we elect to treat property we acquire as a result of a borrower’s default on a loan or a tenant’s default on a lease as “foreclosure property” for federal income tax purposes, we will be required to operate that property through an independent contractor over whom we will not have control. If our tenants or third-party operators are unable to operate the properties successfully or if we select unqualified managers, then such tenants and operators might not be able to pay our rent, or generate sufficient property-level operating income for us, which could adversely affect our financial condition.
Joint venture partners may have different interests than we have, which may negatively impact our control over our ventures. Investments in joint ventures involve the risk that our co-venturer may have economic or
15
Table of Contents
business interests or goals which, at a particular time, are inconsistent with our interests or goals, that the co-venturer may be in a position to take action contrary to our instructions, requests, policies or objectives, or that the co-venturer may experience financial difficulties and be unable to fund its share of required capital contributions. Among other things, actions by a co-venturer might subject assets owned by the joint venture to liabilities in excess of those contemplated by the terms of the joint venture agreement or to other adverse consequences. This risk is also present when we make investments in securities of other entities. If we do not have full control over a joint venture, the value of our investment will be affected to some extent by a third party that may have different goals and capabilities than ours. As a result, joint ownership of investments and investments in other entities may adversely affect our returns on investments and, therefore, cash available for distributions to our stockholders may be reduced.
Adverse weather conditions may damage certain properties we acquire and/or reduce our operators’ ability to make scheduled rent payments to us. Weather conditions may influence revenues at certain types of properties we acquire. These adverse weather conditions include heavy snowfall (or lack thereof), hurricanes, tropical storms, high winds, heat waves, frosts, drought (or reduced rainfall levels), excessive rain, avalanches, mudslides and floods. Adverse weather could reduce the number of people participating in activities at properties we acquire and have acquired. Certain properties may be susceptible to damage from weather conditions such as hurricanes, which may cause damage (including, but not limited to property damage and loss of revenue) that is not generally insurable at commercially reasonable rates. Further, the physical condition of properties we acquire must be satisfactory to attract visitation. In addition to severe or generally inclement weather, other factors, including, but not limited to plant disease and insect infestation, as well as the quality and quantity of water, could adversely affect the conditions at properties we own and acquire or develop. Most properties have some insurance coverage that will offset such losses and fund needed repairs.
Potential losses may not be covered by insurance. We maintain, or cause our operators to maintain, insurance including, but not limited to, liability, fire, wind, earthquake and business income coverage on all of our properties that are not being leased on a triple-net basis under various insurance policies. We select policy specifications and insured limits which we believe to be appropriate and adequate given the relative risk of loss, the cost of the coverage and industry practice. We do not carry insurance for generally uninsured losses such as loss from riots, terrorist threats, war or nuclear reaction. Most of our policies, like those covering losses due to floods, are insured subject to limitations involving large deductibles or co-payments and policy limits which may not be sufficient to cover losses. While we carry earthquake insurance on our properties that are not being leased on a triple-net basis, the amount of our earthquake insurance coverage may not be sufficient to fully cover losses from earthquakes. In addition, we may discontinue earthquake or other insurance on some or all of our properties in the future if the cost of premiums for any of these policies exceeds, in our judgment, the value of the coverage relative to the risk of loss.
Our operating results may be negatively affected by potential development and construction delays and resultant increased costs and risks. We may invest in properties upon which we will develop and construct improvements. We will be subject to risks relating to uncertainties associated with re-zoning for development and environmental concerns of governmental entities and/or community groups, and our ability to control construction costs or to build in conformity with plans, specifications and timetables. Our performance also may be affected or delayed by conditions beyond our control. Moreover, delays in completion of construction also could give tenants the right to terminate preconstruction leases for space at a newly developed project. Furthermore, we must rely upon projections of rental income, expenses and estimates of the fair market value of property upon completion of construction before agreeing to a property’s purchase price. If our projections are inaccurate, we may pay too much for a property and our return on our investment could suffer.
If we set aside insufficient reserves for capital expenditures, we may be required to defer necessary property improvements. If we do not have enough reserves for capital expenditures to supply needed funds for capital improvements throughout the life of the investment in a property, and there is insufficient cash available from our operations, we may be required to defer necessary improvements to the property that may cause the property to suffer from a greater risk of obsolescence, a decline in value and/or a greater risk of decreased cash flow as a
16
Table of Contents
result of attracting fewer potential tenants to the property and adversely affecting our tenants’ businesses. If we lack sufficient capital to make necessary capital improvements, then we may not be able to maintain projected rental rates for certain properties, and our results of operations and ability to pay distributions to our stockholders may be negatively impacted.
We may be required to defer property expansion during the foreclosure period after tenant’s default. In cases where a tenant has defaulted and we have foreclosed on the leases and engaged a third-party manager to operate the property for a period of time, we are prohibited by tax regulations from conducting any new construction during the foreclosure period to expand these properties. The inability to continue to expand certain of our properties may reduce the competitiveness of the properties and result in declining revenues and operating income. This may impact properties’ value and the level of distributions we can pay.
Our failure or the failure of the tenants and managers of our facilities to comply with licensing and certification requirements, the requirements of governmental programs, fraud and abuse regulations or new legislative developments may materially adversely affect the operations of our senior living properties. The operations of our senior living properties are subject to numerous federal, state and local laws and regulations that are subject to frequent and substantial changes resulting from legislation, adoption of rules and regulations, and administrative and judicial interpretations of existing laws. The ultimate timing or effect of any changes in these laws and regulations cannot be predicted. Failure to obtain licensure or loss or suspension of licensure or certification may prevent a facility from operating or result in a suspension of certain revenue sources until all licensure or certification issues have been resolved. Facilities may also be affected by changes in accreditation standards or procedures of accrediting agencies that are recognized by governments in the certification process. State laws may require compliance with extensive standards governing operations and agencies administering those laws regularly inspect such facilities and investigate complaints. Failure to comply with all regulatory requirements could result in the loss of the ability to provide or bill and receive payment for health care services at our senior living facilities. Additionally, transfers of operations of certain senior living facilities are subject to regulatory approvals not required for transfers of other types of commercial operations and real estate. We may have no direct control over the tenant’s or manager’s ability to meet regulatory requirements and failure to comply with these laws, regulations and requirements may materially adversely affect the operations of these properties.
Cost control and other health care reform measures may reduce reimbursement revenue available to certain of our senior living properties. The health care industry is facing various challenges, including increased government and private payor pressure on health care providers to control costs and the vertical and horizontal consolidation of health care providers. The pressure to control health care costs has intensified in recent years as a result of the national health care reform debate and has continued as Congress attempts to slow the rate of growth of federal health care expenditures as part of its effort to balance the federal budget. Similar debates are ongoing at the state level in many states. These trends are likely to lead to reduced or slower growth in reimbursement for services provided at some of our senior living properties and could therefore result in reduced profitability of such properties, adversely affecting our income or results from investments in such properties.
Each year, legislative proposals are introduced or proposed in Congress and in some state legislatures that would effect major changes in the health care system, nationally or at the state level. We cannot predict whether any proposals will be adopted or, if adopted, what effect, if any, these proposals would have on those of our senior living facilities offering health care services and, thus, our business. Health care, including the long-term care and assisted living sectors, remains a dynamic, evolving industry. On March 23, 2010, the Patient Protection and Affordable Care Act of 2010 was enacted and on March 30, 2010, the Health Care and Education Reconciliation Act was enacted, which in part modified the Patient Protection and Affordable Care Act. Together, the two Acts serve as the primary vehicle for comprehensive health care reform in the United States. The two Acts are intended to reduce the number of individuals in the United States without health insurance and effect significant other changes to the ways in which health care is organized, delivered and reimbursed. The legislation will become effective in a phased approach, beginning in 2010 and concluding in 2018. At this time,
17
Table of Contents
the effects of the legislation and its impact on our business are not yet known. Our business could be materially and adversely affected by the two Acts and further governmental initiatives undertaken pursuant to the two Acts.
We may incur significant costs complying with the Americans with Disabilities Act and similar laws. Under the Americans with Disabilities Act of 1990, or the ADA, all public accommodations must meet federal requirements related to access and use by disabled persons. We have not conducted an audit or investigation of all of our properties to determine our compliance with the ADA. If one or more of our properties does not comply with the ADA, then we would be required to incur additional costs to bring the property into compliance. Additional federal, state and local laws also may require modifications to our properties, or restrict our ability to renovate our properties. We cannot predict the ultimate cost of compliance with the ADA or other legislation. If we incur substantial costs to comply with the ADA and any other similar legislation, our financial condition, results of operations, cash flow, cash available for distribution and ability to satisfy our debt service obligations could be materially adversely affected.
Lending Related Risks
Our loans may be affected by unfavorable real estate market conditions. When we make loans, we are at risk of default on those loans caused by many conditions beyond our control, including local and other economic conditions affecting real estate values and interest rate levels. We do not know whether the values of the properties collateralizing mortgage loans will remain at the levels existing on the dates of origination of the loans. If the values of the underlying properties drop or in some instances fail to rise, our risk will increase and the value of our interests may decrease.
Foreclosures create additional ownership risks that could adversely impact our returns on mortgage investments. When we acquire property by foreclosure following defaults under our mortgage, bridge or mezzanine loans, we have the economic and liability risks as the owner of such property. This additional liability could adversely impact our returns on mortgage investments.
Our loans will be subject to interest rate fluctuations. If we invest in fixed-rate, long-term loans and interest rates rise, the loans will yield a return lower than then-current market rates. If interest rates decrease, we will be adversely affected to the extent that loans are prepaid, because we will not be able to make new loans at the previously higher interest rate.
Lack of principal amortization of loans increases the risk of borrower default at maturity and delays in liquidating defaulted loans could reduce our investment returns and our cash available for distributions. Certain of the loans that we have made do not require the amortization of principal during their term. As a result, a substantial amount of, or the entire principal balance of such loans, will be due in one balloon payment at their maturity. Failure to amortize the principal balance of loans may increase the risk of a default during the term, and at maturity of loans. In addition, certain of our loans have or may have a portion of the interest accrued and payable upon maturity. We may not receive any of that accrued interest if our borrower defaults. A default under loans could have a material adverse effect on our ability to pay distributions to stockholders. Further, if there are defaults under our loans, we may not be able to repossess and sell the underlying properties or other security quickly. The resulting time delay could reduce the value of our investment in the defaulted loans. An action to foreclose on a mortgaged property securing a loan is regulated by state statutes and rules and is subject to many of the delays and expenses of other lawsuits if the defendant raises defenses or counterclaims. In the event of default by a mortgagor, these restrictions, among other things, may impede our ability to foreclose on or sell the mortgaged property or to obtain proceeds sufficient to repay all amounts due on our loan. Any failure or delay by a borrower in making scheduled payments to us may adversely affect our ability to make distributions to stockholders.
We may make loans on a subordinated and unsecured basis and may not be able to collect outstanding principal and interest. Although our loans to third parties are usually collateralized by properties pledged by such borrowers, we have made loans that are unsecured and/or subordinated in right of payment to such third parties’
18
Table of Contents
existing and future indebtedness. In the event of a foreclosure, bankruptcy, liquidation, winding up, reorganization or other similar proceeding relating to such third party, and in certain other events, such third party’s assets may only be available to pay obligations on our unsecured loans after the third party’s other indebtedness has been paid. As a result, there may not be sufficient assets remaining to pay the principal or interest on the unsecured loans we may make.
Financing Related Risks
Anticipated borrowing creates risks. We have borrowed and will continue to borrow money to acquire assets, to preserve our status as a REIT or for other corporate purposes. We generally mortgage or put a lien on one or more of our assets in connection with any borrowing. We intend to maintain one or more revolving lines of credit of up to $150 million to provide financing for the acquisition of assets, although our board of directors could determine to borrow a greater amount. We may repay the line of credit using equity offering proceeds, including proceeds from our stock offering, proceeds from the sale of assets, working capital or long-term financing. We also have and intend to continue to obtain long-term financing. We may not borrow more than 300% of the value of our net assets without the approval of a majority of our Independent Directors and the borrowing must be disclosed and explained to our stockholders in our first quarterly report after such approval. Borrowing may be risky if the cash flow from our properties and other permitted investments is insufficient to meet our debt obligations. In addition, our lenders may seek to impose restrictions on future borrowings, distributions to our stockholders and operating policies, including with respect to capital expenditures and asset dispositions. If we mortgage assets or pledge equity as collateral and we cannot meet our debt obligations, then the lender could take the collateral, and we would lose the asset or equity and the income we were deriving from the asset.
Lenders may require us to enter into restrictive covenants relating to our operations, which could limit our ability to make distributions to our stockholders. When providing financing, a lender may impose restrictions on us that affect our operating policies, ability to incur additional debt and our ability to pay distributions to stockholders. Loan documents we enter into may also contain covenants that limit our ability to further mortgage a property or affect other operating policies. Such limitations would hamper our flexibility and may impair our ability to achieve our operating plans.
Continued uncertainty and volatility in the credit markets could affect our ability to obtain debt financing on reasonable terms, which could reduce the number of properties we may be able to acquire. The global and U.S. economy began to show some signs of improvement in late 2009 and throughout 2010. However, unemployment remains high and concerns continue to exist about inflation and the strength of the recovery. If mortgage debt continues to be limited and, when available, on unfavorable terms as a result of increased interest rates, increased credit spreads, decreased liquidity or other factors, our ability to acquire properties may be limited and we risk being unable to refinance our existing debt upon maturity.
There is no guarantee that borrowing arrangements or other arrangements for obtaining leverage will be available, or if available, will be available on terms and conditions acceptable to us. Unfavorable economic conditions have increased financing costs and limited access to the capital markets. In addition, any decline in market value of our assets may have adverse consequences in instances where we borrow money based on the fair value of those assets and may make refinancing more difficult.
Currently, the market for credit facilities is very challenging and many lenders are actively seeking to reduce their balances outstanding by lowering advance rates on financed assets and increasing borrowing costs, to the extent such facilities continue to be available. Our current line of credit is subject to various requirements and financial covenants. In the event we are unable to maintain or extend existing and/or secure new lines of credit or collateralized financing on favorable terms, our ability to make new investments and improvements in existing properties as well as our ability to make distributions may be significantly impacted.
19
Table of Contents
Defaults on our borrowings may adversely affect our financial condition and results of operations. Defaults on loans collateralized by a property we own may result in foreclosure actions and our loss of the property or properties securing the loan that is in default. Such legal actions are expensive. For tax purposes, a foreclosure would be treated as a sale of the property for a purchase price equal to the outstanding balance of the debt collateralized by the property. If the outstanding balance of the debt exceeds our tax basis in the property, we would recognize taxable income on the foreclosure and all or a portion of such taxable income may be subject to tax and/or required to be distributed to our stockholders in order for us to qualify as a REIT. In such case, we would not receive any cash proceeds to enable us to pay such tax or make such distributions. If any mortgages contain cross collateralization or cross default provisions, more than one property may be affected by a default. If any of our properties are foreclosed upon due to a default, our financial condition, results of operations and ability to pay distributions to stockholders may be adversely affected.
Financing arrangements involving balloon payment obligations may adversely affect our ability to make distributions. Some of our fixed-term financing arrangements may require us to make “balloon” payments at maturity. Our ability to make a balloon payment at maturity is uncertain and may depend upon our ability to obtain additional financing or sell a particular property. At the time the balloon payment is due, we may not be able to raise equity or refinance the balloon payment on terms as favorable as the original loan or sell the property at a price sufficient to make the balloon payment. These refinancing or property sales could negatively impact the rate of return to stockholders and the timing of disposition of our assets. In addition, payments of principal and interest may leave us with insufficient cash to pay the distributions that we are required to pay to maintain our qualification as a REIT.
Increases in interest rates could increase the amount of our debt payments and adversely affect our ability to make distributions to our stockholders. We may borrow money that bears interest at a variable rate and, from time to time, we may pay mortgage loans or refinance our properties in a rising interest rate environment. Accordingly, increases in interest rates could increase our interest costs, which could have a material adverse effect on our operating cash flow and our ability to make distributions to our stockholders.
We may borrow money to make distributions and distributions may not come from funds from operations which may have negative tax implications and a negative effect on the value of your shares under certain conditions. In the past, we have borrowed from affiliates and other persons to make distributions, and in the future we may continue to borrow money as we consider necessary or advisable to meet our distribution requirements. Our distributions have exceeded our funds from operations in the past and may do so in the future. In the event that we make distributions in excess of our earnings and profits, such distributions could constitute a return of capital for federal income tax and accounting purposes. Furthermore, in the event that we are unable to fund future distributions from our funds from operations, the value of your shares upon the possible listing of our stock, the sale of our assets or any other liquidity event may be negatively affected.
We may acquire various financial instruments for purposes of “hedging” or reducing our risks which may be costly and/or ineffective and will reduce our cash available for distribution to our stockholders. Use of derivative instruments for hedging purposes may present significant risks, including the risk of loss of the amounts invested. Defaults by the other party to a hedging transaction can result in the hedging transaction becoming worthless or a speculative hedge. Hedging activities also involve the risk of an imperfect correlation between the hedging instrument and the asset being hedged, which could result in losses both on the hedging transaction and on the asset being hedged. Use of hedging activities generally may not prevent significant losses and could increase our losses. Further, hedging transactions may reduce cash available for distribution to our stockholders.
Tax Related Risks
We will be subject to increased taxation if we fail to qualify as a REIT for federal income tax purposes. We believe that we have been organized and have operated, and intend to continue to be organized and to operate, in a manner that will enable us to meet the requirements for qualification and taxation as a REIT for federal income tax
20
Table of Contents
purposes, commencing with our taxable year ended December 31, 2004. A REIT is generally not subject to federal tax at the corporate level to the extent that it distributes annually at least 90% of its taxable income to its stockholders and meets other compliance requirements. We have not requested, and do not plan to request, a ruling from the IRS that we qualify as a REIT. Based upon representations made by our officers with respect to certain factual matters, and upon counsel’s assumption that we have operated and will continue to operate in the manner described in the representations and in our prospectus relating to our common stock offerings, our tax counsel, Arnold & Porter LLP, has rendered an opinion that we were organized and have operated in conformity with the requirements for qualification as a REIT and that our proposed method of operation will enable us to continue to meet the requirements for qualification as a REIT. Our continued qualification as a REIT will depend on our continuing ability to meet highly technical and complex requirements concerning, among other things, the ownership of our outstanding shares of common stock, the nature of our assets, the sources of our income, the amount of our distributions to our stockholders and the filing of TRS elections. No assurance can be given that we qualify or will continue to qualify as a REIT or that new legislation, Treasury Regulations, administrative interpretations or court decisions will not significantly change the tax laws with respect to our qualification as a REIT.
You should be aware that opinions of counsel are not binding on the IRS or on any court. The conclusions stated in the opinion of our tax counsel are conditioned on, and our continued qualification as a REIT will depend on, our company meeting various requirements.
If we fail to qualify as a REIT, we would be subject to additional federal income tax at regular corporate rates. If we fail to qualify as a REIT, we may be subject to additional federal income and alternative minimum taxes. Unless we are entitled to relief under specific statutory provisions, we also could not elect to be taxed as a REIT for four taxable years following the year during which we were disqualified. Therefore, if we fail to qualify as a REIT, the funds available for distribution to stockholders may be reduced substantially for each of the years involved.
Our leases may be recharacterized as financings which would eliminate depreciation deductions on our properties. We believe that we would be treated as the owner of properties where we would own the underlying land, except with respect to leases structured as “financing leases,” which would constitute financings for federal income tax purposes. If the lease of a property does not constitute a lease for federal income tax purposes and is recharacterized as a secured financing by the IRS, then we believe the lease should be treated as a financing arrangement and the income derived from such a financing arrangement should satisfy the 75% and the 95% gross income tests for REIT qualification as it would be considered to be interest on a loan collateralized by real property. Nevertheless, the recharacterization of a lease in this fashion may have adverse tax consequences for us. In particular, we would not be entitled to claim depreciation deductions with respect to the property (although we should be entitled to treat part of the payments we would receive under the arrangement as the repayment of principal). In such event, in some taxable years our taxable income, and the corresponding obligation to distribute 90% of such income, would be increased. With respect to leases structured as “financing leases,” we will report income received as interest income and will not take depreciation deductions related to the real property. Any increase in our distribution requirements may limit our ability to invest in additional properties and to make additional mortgage loans. No assurance can be provided that the IRS would recharacterize such transactions as financings that would qualify under the 95% and 75% gross income tests.
Excessive non-real estate asset values may jeopardize our REIT status. In order to qualify as a REIT, among other requirements, at least 75% of the value of our assets must consist of investments in real estate, investments in other REITs, cash and cash equivalents and government securities. Accordingly, the value of any other property that is not considered a real estate asset for federal income tax purposes must represent in the aggregate not more than 25% of our total assets. In addition, under federal income tax law, we may not own securities in, or make loans to, any one company (other than a REIT, a qualified REIT subsidiary or a taxable REIT subsidiary) which represent in excess of 10% of the voting securities or 10% of the value of all securities of that company or which have, in the aggregate, a value in excess of 5% of our total assets, and we may not own securities of one or more taxable REIT subsidiaries which have, in the aggregate, a value in excess of 25% of our total assets.
21
Table of Contents
The 25%, 10% and 5% REIT qualification tests are determined at the end of each calendar quarter. If we fail to meet any such test at the end of any calendar quarter, and such failure is not remedied within 30 days after the close of such quarter, we will cease to qualify as a REIT, unless certain requirements are satisfied.
Despite our REIT status, we remain subject to various taxes which would reduce operating cash flow if and to the extent certain liabilities are incurred. Even if we qualify as a REIT, we are subject to some federal, state and local taxes on our income and property that could reduce operating cash flow, including but not limited to: (i) tax on any undistributed real estate investment trust taxable income; (ii) “alternative minimum tax” on our items of tax preference; (iii) certain state income taxes (because not all states treat REITs the same as they are treated for federal income tax purposes); (iv) a tax equal to 100% of net gain from “prohibited transactions;” (v) tax on gains from the sale of certain “foreclosure property;” (vi) tax on gains of sale of certain “built-in gain” properties; and (vii) certain taxes and penalties if we fail to comply with one or more REIT qualification requirements, but nevertheless qualify to maintain our status as a REIT. Foreclosure property includes property with respect to which we acquire ownership by reason of a borrower’s default on a loan or possession by reason of a tenant’s default on a lease. We may elect to treat certain qualifying property as “foreclosure property,” in which case, the income from such property will be treated as qualifying income under the 75% and 95% gross income tests for three years following such acquisition. To qualify for such treatment, we must satisfy additional requirements, including that we operate the property through an independent contractor after a short grace period. We will be subject to tax on our net income from foreclosure property. Such net income generally means the excess of any gain from the sale or other disposition of foreclosure property and income derived from foreclosure property that otherwise does not qualify for the 75% gross income test, over the allowable deductions that relate to the production of such income. Any such tax incurred will reduce the amount of cash available for distribution.
We may be required to pay a penalty tax upon the sale of a property. The federal income tax provisions applicable to REITs provide that any gain realized by a REIT on the sale of property held as inventory or other property held primarily for sale to customers in the ordinary course of business is treated as income from a “prohibited transaction” that is subject to a 100% penalty tax. Under current law, unless a sale of real property qualifies for a safe harbor, the question of whether the sale of a property constitutes the sale of property held primarily for sale to customers is generally a question of the facts and circumstances regarding a particular transaction. The 2008 Housing and Economic Recovery Act changed the safe harbor rules such that a REIT, among other things, is required to hold the property for only two years rather than four years. We intend that we and our subsidiaries will hold the interests in our properties for investment with a view to long-term appreciation, to engage in the business of acquiring and owning properties, and to make occasional sales as are consistent with our investment objectives. We do not intend to engage in prohibited transactions. We cannot assure you, however, that we will make no more than seven sales within a year to satisfy the requirements of the safe harbors or that the IRS will not successfully assert that one or more of such sales are prohibited transactions.
The lease of qualified health care properties to a taxable REIT subsidiary is subject to special requirements. We intend to lease certain qualified health care properties we acquire from operators to a taxable REIT subsidiary (or a limited liability company of which the taxable REIT subsidiary is a member), which lessee will contract with such operators (or a related party) to manage and operate the health care operations at these properties. The rents from this taxable REIT subsidiary lessee structure will be treated as qualifying rents from real property if (1) they are paid pursuant to an arms-length lease of a qualified health care property with a taxable REIT subsidiary and (2) the operator qualifies as an eligible independent contractor. If any of these conditions are not satisfied, then the rents will not be qualifying rents for purposes of the 75% and 95% gross income tests for REIT qualification.
Company Related Risks
We may have difficulty funding distributions solely from cash flow from operations, which could reduce the funds we have available for investments and your overall return. There are many factors that can affect the
22
Table of Contents
availability and timing of distributions to stockholders. We expect to fund distributions principally from cash flows from operations; however, if our properties are not generating sufficient cash flow or our other operating expenses require it, we may fund our distributions from borrowings. If we fund distributions from borrowings, then we will have fewer funds available for the acquisition of properties and your overall return may be reduced. Further, to the extent distributions exceed earnings and profits calculated on a tax basis, a stockholder’s basis in our stock will be reduced and, to the extent distributions exceed a stockholder’s basis, the stockholder may recognize a capital gain in the future.
We may not be able to pay distributions at our current or an increasing rate. In the future, our ability to declare and pay distributions at our current or an increasing rate will be subject to evaluation by our board of directors of our current and expected future operating results, capital levels, financial condition, future growth plans, general business and economic conditions and other relevant considerations, and we cannot assure you that we will continue to pay distributions on any schedule or that we will not reduce the amount of or cease paying distributions in the future.
We rely on the senior management team of our Advisor, the loss of whom could significantly harm our business. Our continued success will depend to a significant extent on the efforts and abilities of the senior management team of our Advisor. These individuals are important to our business and strategy and to the extent that any of them departs and is not replaced with a qualified substitute; such person’s departure could harm our operations and financial condition.
The price of our shares is subjective and may not bear any relationship to what a stockholder could receive if their shares were resold.
We determined the offering price of our shares in our sole discretion based on:
| • | the price that we believed investors would pay for our shares; |
| • | estimated fees to be paid to third parties and to our Advisor and its affiliates; and |
| • | the expenses of this offering and funds we believed should be available for us to invest in properties, loans and other permitted investments. |
There is no public market for our shares on which to base market value and there can be no assurance that one will develop. However, eighteen months following the completion of our last offering, we will be required to provide an estimated value of our shares to our stockholders.
Although we have adopted a redemption plan, we have discretion not to redeem your shares, to suspend the plan and to cease redemptions. Our redemption plan includes restrictions that limit a stockholders’ ability to have their shares redeemed. Our stockholders must hold their shares for at least one year before presenting for our consideration all or any portion equal to at least 25% of such shares to us for redemption, except for redemption sought upon death, qualifying disability, bankruptcy or unforeseeable emergency of a stockholder. We limit the number of shares redeemed pursuant to the redemption plan as follows: (i) at no time during any 12-month period, may we redeem more than 5% of the weighted-average shares of our common stock at the beginning of such 12-month period and (ii) during each quarter, redemptions will be limited to an amount determined by our board and from the sale of shares under our dividend reinvestment plan during the prior quarter. The redemption plan has many limitations and you should not rely upon it as a method of selling shares promptly at a desired price. See Item 5. “Market for Registrant’s Common Equity, Related Stockholder Matters and Issuer Purchases of Equity Securities”—“Redemption of Shares” for additional information.
| Item 1B. | Unresolved Staff Comments |
None.
23
Table of Contents
| Item 2. | Properties |
As of December 31, 2010, through various wholly-owned limited partnerships and limited liability companies, we had invested in 122 real estate investment properties. The following tables set forth details about our property holdings by asset class beginning with wholly-owned properties followed by properties owned through joint venture arrangements (in thousands):
| Name and Location |
Description |
Operator | Mortgages and Other Notes Payable as of December 31, 2010 |
Initial Purchase Price |
Date Acquired |
|||||||||||
| Ski and Mountain Lifestyle | ||||||||||||||||
| Brighton Ski Resort— Brighton, Utah |
1,050 skiable acres, seven chairlifts; permit and fee interests | Boyne | $ | 15,304 | $ | 35,000 | 1/8/07 | |||||||||
| Crested Butte Mountain Resort— Mt. Crested Butte, Colorado |
1,167 skiable acres, 16 chairlifts; permit and leasehold interests | Triple Peaks | $ | 13,109 | $ | 41,000 | 12/5/08 | |||||||||
| Cypress Mountain— Vancouver, BC, Canada |
358 skiable acres, five chairlifts; permit and fee interests | Boyne | $ | 19,494 | $ | 27,500 | 5/30/06 | |||||||||
| Gatlinburg Sky Lift— Gatlinburg, Tennessee |
Scenic chairlift; leasehold interest | Boyne | $ | — | $ | 19,940 | 12/22/05 | |||||||||
| Jiminy Peak Mountain Resort— Hancock, Massachusetts | 800 skiable acres, eight chairlifts; fee interest | FO Ski Resorts, LLC |
$ | 9,664 | $ | 27,000 | 1/27/09 | |||||||||
| Loon Mountain Resort— Lincoln, New Hampshire |
275 skiable acres, ten chairlifts; leasehold, permit and fee interests | Boyne | $ | 12,529 | $ | 15,539 | 1/19/07 | |||||||||
| Mount Sunapee Mountain Resort— Newbury, New Hampshire | 230 skiable acres, ten chairlifts leasehold interest | Triple Peaks | $ | 6,075 | $ | 19,000 | 12/5/08 | |||||||||
| Mountain High Resort— Wrightwood, California | 290 skiable acres, 59 trails, 16 chairlifts; permit interest | Mountain High Resorts Associates, LLC |
$ | — | $ | 45,000 | 6/29/07 | |||||||||
| Northstar-at-Tahoe Resort— Lake Tahoe, California |
2,480 skiable acres, 16 chairlifts; permit and fee interests | Trimont Land Company |
$ | 40,720 | $ | 80,097 | 1/19/07 | |||||||||
| Okemo Mountain Resort— Ludlow, Vermont | 624 skiable acres, 19 chairlifts; leasehold interest | Triple Peaks | $ | 32,816 | $ | 72,000 | 12/5/08 | |||||||||
| Sierra-at-Tahoe Resort— South Lake Tahoe, California |
1,680 skiable acres, 12 chairlifts; permit and fee interests | Booth | $ | 18,704 | $ | 39,898 | 1/19/07 | |||||||||
| Sugarloaf Mountain Resort— Carrabassett Valley, Maine | 525 skiable acres, 15 chairlifts; fee and leasehold interests | Boyne | $ | — | (2) | $ | 26,000 | 8/7/07 | ||||||||
| Summit-at-Snoqualmie Resort— Snoqualmie Pass, Washington | 1,697 skiable acres, 26 chairlifts; permit and fee interests | Boyne | $ | 12,529 | $ | 34,466 | 1/19/07 | |||||||||
| Sunday River Resort— Newry, Maine |
668 skiable acres, 18 chairlifts; leasehold, permit and fee interests | Boyne | $ | — | (2) | $ | 50,500 | 8/7/07 | ||||||||
| The Village at Northstar— Lake Tahoe, California |
79,898 leasable square feet | Trimont Land Company |
$ | — | $ | 36,100 | 11/15/07 | |||||||||
| Total | $ | 180,944 | $ | 569,040 | ||||||||||||
24
Table of Contents
| Name and Location |
Description |
Operator | Mortgages and Other Notes Payable as of December 31, 2010 |
Initial Purchase Price |
Date Acquired |
|||||||||||||
| Golf | ||||||||||||||||||
| Ancala Country Club— Scottsdale, Arizona |
18-hole private course | EAGLE | $ | 6,702 | $ | 14,107 | 11/30/07 | |||||||||||
| Arrowhead Country Club— Glendale, Arizona |
18-hole private course | EAGLE | $ | 8,290 | $ | 17,357 | 11/30/07 | |||||||||||
| Arrowhead Golf Club— Littleton, Colorado |
18-hole public course | EAGLE | $ | 9,171 | $ | 15,783 | 11/30/07 | |||||||||||
| Bear Creek Golf Club— Dallas, Texas |
36-hole public course; leasehold interest | Billy Casper Golf | $ | 5,356 | $ | 11,100 | 9/8/06 | |||||||||||
| Canyon Springs Golf Club— San Antonio, Texas |
18-hole public course | EAGLE | $ | 7,389 | $ | 13,010 | 11/16/06 | |||||||||||
| Clear Creek Golf Club— Houston, Texas |
18-hole public course; concession-hold interest | EAGLE | $ | — | $ | 1,888 | 1/11/07 | |||||||||||
| Continental Golf Course— Scottsdale, Arizona |
18-hole public course | EAGLE | $ | 3,527 | $ | 6,419 | 11/30/07 | |||||||||||
| Cowboys Golf Club— Grapevine, Texas |
18-hole public course; leasehold interest | EAGLE | $ | 11,785 | $ | 25,000 | 12/26/06 | |||||||||||
| David L. Baker Golf Course— Fountain Valley, California |
18-hole public course; concession interest | EAGLE | $ | — | $ | 9,492 | 4/17/08 | |||||||||||
| Deer Creek Golf Club— Overland Park, Kansas |
18-hole public course | EAGLE | $ | 4,321 | $ | 8,934 | 11/30/07 | |||||||||||
| Desert Lakes Golf Club— Bullhead City, Arizona |
18-hole public course | EAGLE | $ | 1,146 | $ | 2,637 | 11/30/07 | |||||||||||
| Eagle Brook Country Club— Geneva, Illinois |
18-hole private course | EAGLE | $ | 8,113 | $ | 16,253 | 11/30/07 | |||||||||||
| Foothills Golf Club— Phoenix, Arizona |
18-hole public course | EAGLE | $ | 5,027 | $ | 9,881 | 11/30/07 | |||||||||||
| Forest Park Golf Course— St. Louis, Missouri |
27-hole public course; leasehold interest | EAGLE | $ | — | $ | 13,372 | 12/19/07 | |||||||||||
| Fox Meadow Country Club— Medina, Ohio |
18-hole private course | EAGLE | $ | 4,423 | $ | 9,400 | 12/22/06 | |||||||||||
| Golf Club at Fossil Creek— Fort Worth, Texas |
18-hole public course | EAGLE | $ | 4,410 | $ | 7,686 | 11/16/06 | |||||||||||
| Hunt Valley Golf Club— Phoenix, Maryland |
27-hole public course | EAGLE | $ | 12,346 | $ | 23,430 | 11/30/07 | |||||||||||
| Kokopelli Golf Club— Phoenix, Arizona |
18-hole public course | EAGLE | $ | 5,115 | $ | 9,416 | 11/30/07 | |||||||||||
| Lake Park Golf Club— Dallas-Fort Worth, Texas |
27-hole public course; concession-hold interest | EAGLE | $ | — | $ | 5,632 | 11/16/06 | |||||||||||
| Lakeridge Country Club— Lubbock, Texas | 18-hole private course | EAGLE | $ | 3,725 | $ | 7,900 | 12/22/06 | |||||||||||
25
Table of Contents
| Name and Location |
Description |
Operator | Mortgages and Other Notes Payable as of December 31, 2010 |
Initial Purchase Price |
Date Acquired |
|||||||||||||
| Golf (continued) | ||||||||||||||||||
| Las Vegas Golf Club— Las Vegas, Nevada |
18-hole public course | EAGLE | $ | — | $ | 10,951 | 4/17/08 | |||||||||||
| Legend at Arrowhead Golf Resort—Glendale, Arizona | 18-hole public course | EAGLE | $ | 5,556 | $ | 10,438 | 11/30/07 | |||||||||||
| London Bridge Golf Club— | 36-hole public course | EAGLE | $ | 6,173 | $ | 11,805 | 11/30/07 | |||||||||||
| Lake Havasu, Arizona | ||||||||||||||||||
| Majestic Oaks Golf Club— | 45-hole public course | EAGLE | $ | 6,349 | $ | 13,217 | 11/30/07 | |||||||||||
| Ham Lake, Minnesota | ||||||||||||||||||
| Mansfield National Golf Club— Dallas-Fort Worth, Texas |
18-hole public course; leasehold interest | EAGLE | $ | 4,082 | $ | 7,147 | 11/16/06 | |||||||||||
| Meadowbrook Golf & Country Club— | 18-hole private course | EAGLE | $ | 5,997 | $ | 11,530 | 11/30/07 | |||||||||||
| Tulsa, Oklahoma | ||||||||||||||||||
| Meadowlark Golf Course— Huntington Beach, California |
18-hole public course; leasehold interest | EAGLE | $ | — | $ | 16,945 | 4/17/08 | |||||||||||
| Mesa del Sol Golf Club— | 18-hole public course | EAGLE | $ | 3,222 | $ | 6,850 | 12/22/06 | |||||||||||
| Yuma, Arizona | ||||||||||||||||||
| Micke Grove Golf Course— | 18-hole public course; | EAGLE | $ | — | $ | 6,550 | 12/19/07 | |||||||||||
| Lodi, California | leasehold interest | |||||||||||||||||
| Mission Hills Country Club— | 18-hole private course | EAGLE | $ | 1,587 | $ | 4,779 | 11/30/07 | |||||||||||
| Northbrook, Illinios | ||||||||||||||||||
| Montgomery Country Club— | 18-hole private course | Traditional Golf | $ | — | $ | 6,300 | 9/11/08 | |||||||||||
| Laytonsville, Maryland | ||||||||||||||||||
| Painted Desert Golf Club— | 18-hole public course | EAGLE | $ | 4,762 | $ | 9,468 | 11/30/07 | |||||||||||
| Las Vegas, Nevada | ||||||||||||||||||
| Painted Hills Golf Club— | 18-hole public course | EAGLE | $ | 1,816 | $ | 3,850 | 12/22/06 | |||||||||||
| Kansas City, Kansas | ||||||||||||||||||
| Palmetto Hall Plantation Club— | 36-hole public course | Heritage Golf | $ | 3,658 | $ | 7,600 | 4/27/06 | |||||||||||
| Hilton Head, South Carolina | ||||||||||||||||||
| Plantation Golf Club— | 18-hole public course | EAGLE | $ | 2,565 | $ | 4,424 | 11/16/06 | |||||||||||
| Dallas-Fort Worth, Texas | ||||||||||||||||||
| Raven Golf Club at South Mountain— | 18-hole public course | I.R.I. Golf | $ | 6,135 | $ | 12,750 | 6/9/06 | |||||||||||
| Phoenix, Arizona | ||||||||||||||||||
| Royal Meadows Golf Course— | 18-hole public course | EAGLE | $ | 1,141 | $ | 2,400 | 12/22/06 | |||||||||||
| Kansas City, Missouri | ||||||||||||||||||
| Ruffled Feathers Golf Club— | 18-hole public course | EAGLE | $ | 7,319 | $ | 13,883 | 11/30/07 | |||||||||||
| Lemont, Illinois | ||||||||||||||||||
| Shandin Hills Golf Club— San Bernardino, California |
18-hole public course; leasehold interest | EAGLE | $ | — | $ | 5,249 | 3/7/08 | |||||||||||
| Signature Golf Course— |
18-hole private course | EAGLE | $ | 8,032 | $ | 17,100 | 12/22/06 | |||||||||||
| Solon, Ohio |
||||||||||||||||||
26
Table of Contents
| Name and Location |
Description |
Operator | Mortgages and Other Notes Payable as of December 31, 2010 |
Initial Purchase Price |
Date Acquired |
|||||||||||||
| Golf (continued) | ||||||||||||||||||
| Stonecreek Golf Club— |
18-hole public course | EAGLE | $ | 7,760 | $ | 14,095 | 11/30/07 | |||||||||||
| Phoenix, Arizona |
||||||||||||||||||
| Superstition Springs Golf Club— |
18-hole public course | EAGLE | $ | 5,644 | $ | 11,042 | 11/30/07 | |||||||||||
| Mesa, Arizona |
||||||||||||||||||
| Tallgrass Country Club— |
18-hole private course | EAGLE | $ | 2,469 | $ | 5,405 | 11/30/07 | |||||||||||
| Wichita, Kansas |
||||||||||||||||||
| Tamarack Golf Club— |
18-hole public course | EAGLE | $ | 3,968 | $ | 7,747 | 11/30/07 | |||||||||||
| Naperville, Illinois |
||||||||||||||||||
| Tatum Ranch Golf Club— |
18-hole private course | EAGLE | $ | 2,116 | $ | 6,379 | 11/30/07 | |||||||||||
| Cave Creek, Arizona |
||||||||||||||||||
| The Golf Club at Cinco Ranch— |
18-hole public course | EAGLE | $ | 4,322 | $ | 7,337 | 11/16/06 | |||||||||||
| Houston, Texas |
||||||||||||||||||
| The Links at Challedon Golf Club— |
18-hole public course | Traditional Golf | $ | — | $ | 3,650 | 9/11/08 | |||||||||||
| Mount Airy, Maryland |
||||||||||||||||||
| The Tradition Golf Club at Broad Bay— |
18-hole private course | Traditional Golf | $ | 5,661 | $ | 9,229 | 3/26/08 | |||||||||||
| Virginia Beach, Virginia |
||||||||||||||||||
| The Tradition Golf Club at Kiskiack— |
18-hole public course | Traditional Golf | $ | — | $ | 6,987 | 3/26/08 | |||||||||||
| Williamsburg, Virginia |
||||||||||||||||||
| The Tradition Golf Club at The Crossings— |
18-hole public course | Traditional Golf | $ | — | $ | 10,084 | 3/26/08 | |||||||||||
| Glen Allen, Virginia |
||||||||||||||||||
| Valencia Country Club— |
18-hole private course | Kemper Sports | $ | 18,206 | $ | 39,533 | 10/16/06 | |||||||||||
| Santa Clarita, California |
||||||||||||||||||
| Weston Hills Country Club— |
36-hole private course | Century Golf | $ | 16,280 | $ | 35,000 | 10/16/06 | |||||||||||
| Weston, Florida |
||||||||||||||||||
| Weymouth Country Club— |
18-hole private course | EAGLE | $ | 4,935 | $ | 10,500 | 12/22/06 | |||||||||||
| Medina, Ohio |
||||||||||||||||||
| Total | $ | 240,601 | $ | 578,921 | ||||||||||||||
| Attractions |
||||||||||||||||||
| Camelot Park— Bakersfield, California |
Miniature golf course, go-karts, batting cages and arcade; fee and leasehold interest | |
Amusement(1) Management Partners, LLC |
|
$ | — | $ | 948 | 10/6/06 | |||||||||
| Darien Lake— Buffalo, New York |
978-acre theme park and waterpark | |
Herschend Family(1) Entertainment Corp. |
|
$ | — | (2) | $ | 109,000 | 4/6/07 | ||||||||
| Elitch Gardens— Denver, Colorado |
62-acre theme park and waterpark | |
Herschend Family(1) Entertainment Corp. |
|
$ | — | $ | 109,000 | 4/6/07 | |||||||||
| Fiddlesticks Fun Center— Tempe, Arizona |
Miniature golf course, bumper boats, batting cages and go-karts | |
Amusement(1) Management Partners, LLC |
|
$ | — | $ | 5,016 | 10/6/06 | |||||||||
27
Table of Contents
| Name and Location |
Description |
Operator | Mortgages and Other Notes Payable as of December 31, 2010 |
Initial Purchase Price |
Date Acquired |
|||||||||||||
| Attractions (continued) |
||||||||||||||||||
| Frontier City— Oklahoma City, Oklahoma |
113-acre theme park | |
Premier Attractions(1) Management, LLC |
|
$ | — | (2) | $ | 17,750 | 4/6/07 | ||||||||
| Funtasticks Fun Center— Tucson, Arizona |
Miniature golf course, go-karts, batting cages, bumper boats and kiddie land with rides | |
Amusement(1) Management Partners, LLC |
|
$ | — | $ | 6,424 | 10/6/06 | |||||||||
| Grand Prix Tampa— Tampa, Florida |
Miniature golf course, go-kart and batting cages | Grand Prix Tampa | $ | — | $ | 3,254 | 10/6/06 | |||||||||||
| Hawaiian Falls-Garland— Garland, Texas |
11-acre waterpark; leasehold interest | HFE Horizon | $ | — | $ | 6,318 | 4/21/06 | |||||||||||
| Hawaiian Falls-The Colony— The Colony, Texas |
12-acre waterpark; leasehold interest | HFE Horizon | $ | — | $ | 5,807 | 4/21/06 | |||||||||||
| Magic Springs and Crystal Falls— Hot Springs, Arkansas |
70-acre theme park and waterpark | |
Amusement(1) Management Partners, LLC |
|
$ | — | $ | 20,000 | 4/16/07 | |||||||||
| Mountasia Family Fun Center— North Richland Hills, Texas |
Two miniature golf courses, go- karts, bumper boats, batting cages, paintball fields and arcade | |
Amusement(1) Management Partners, LLC |
|
$ | — | $ | 1,776 | 10/6/06 | |||||||||
| Myrtle Waves Water Park— Myrtle Beach, South Carolina |
20-acre waterpark; leasehold interest | PARC(5) | $ | — | $ | 9,100 | 7/11/08 | |||||||||||
| Pacific Park— Santa Monica, California |
2-acre theme park; leasehold interest | |
Santa Monica Amusements, LLC |
|
$ | — | $ | 34,000 | 12/29/10 | |||||||||
| Splashtown— Houston, Texas |
53-acre waterpark | |
Premier Attractions(1) Management, LLC |
|
$ | — | (2) | $ | 13,700 | 4/6/07 | ||||||||
| Waterworld— Concord, California |
23-acre waterpark; leasehold interest | |
Palace(1) Entertainment |
|
$ | — | (2) | $ | 10,800 | 4/6/07 | ||||||||
| Wet’nWild Hawaii— Honolulu, Hawaii |
29-acre waterpark; leasehold interest | Village Roadshow | $ | — | $ | 25,800 | 5/6/09 | |||||||||||
| White Water Bay— Oklahoma City, Oklahoma |
21-acre waterpark | |
Premier Attractions(1) Management, LLC |
|
$ | — | (2) | $ | 20,000 | 4/6/07 | ||||||||
| Wild Waves — Seattle, Washington |
67-acre theme park and waterpark; leasehold interest | |
NorPoint(1) Entertainment |
|
$ | — | $ | 31,750 | 4/6/07 | |||||||||
| Zuma Fun Center— Charlotte, North Carolina |
Miniature golf course, batting cages, bumper boats and go-karts |
|
Amusement (1) Management |
|
$ | — | $ | 7,378 | 10/6/06 | |||||||||
| Zuma Fun Center— Knoxville, Tennessee |
Miniature golf course, batting cages, bumper boats, rock climbing and go-karts | |
Amusement (1) Management |
|
$ | — | $ | 2,037 | 10/6/06 | |||||||||
28
Table of Contents
| Name and Location |
Description |
Operator | Mortgages and Other Notes Payable as of December 31, 2010 |
Initial Purchase Price |
Date Acquired |
|||||||||||||
| Attractions (continued) |
||||||||||||||||||
| Zuma Fun Center— North Houston, Texas |
Miniature golf course, batting cages, bumper boats and go-karts | |
Amusement(1) Management |
|
$ | — | $ | 916 | 10/6/06 | |||||||||
| Zuma Fun Center— South Houston, Texas |
Miniature golf course, batting cages, bumper boats and go-karts | |
Amusement(1) Management |
|
$ | — | $ | 4,883 | 10/6/06 | |||||||||
| Total |
$ | — | $ | 445,657 | ||||||||||||||
| Marinas |
||||||||||||||||||
| Anacapa Isle Marina— Oxnard, California |
438 wet slips; leasehold interest | |
Almar Management, Inc. |
|
$ | 2,709 | $ | 9,829 | 3/12/10 | |||||||||
| Ballena Isle Marina— Alameda, California |
504 wet slips; leasehold interest | |
Almar Management, Inc. |
|
$ | — | $ | 8,179 | 3/12/10 | |||||||||
| Beaver Creek Marina— Monticello, Kentucky |
275 wet slips; leasehold interest | |
Marinas International |
|
$ | — | $ | 10,525 | 12/22/06 | |||||||||
| Brady Mountain Resort & Marina— Royal (Hot Springs), Arkansas |
585 wet slips, 55 dry storage units; leasehold interest | |
Marinas International |
|
$ | — | $ | 14,140 | 4/10/08 | |||||||||
| Bohemia Vista Yacht Basin— Chesapeake City, Maryland |
239 wet slips; fee interest | |
Aqua Marine Partners, LLC |
|
$ | — | $ | 4,970 | 5/20/10 | |||||||||
| Burnside Marina— Somerset, Kentucky |
400 wet slips; leasehold interest | |
Marinas International |
|
$ | — | $ | 7,130 | 12/22/06 | |||||||||
| Cabrillo Isle Marina— San Diego, California |
463 slips; leasehold interest | |
Almar Management, Inc. |
|
$ | 6,479 | $ | 20,575 | 3/12/10 | |||||||||
| Crystal Point Marina— Point Pleasant, New Jersey |
200 wet slips | |
Marinas International |
|
$ | — | (2) | $ | 5,600 | 6/8/07 | ||||||||
| Eagle Cove Marina— Byrdstown, Tennessee |
106 wet slips; leasehold and fee interests | |
Marinas International |
|
$ | — | $ | 5,300 | 8/1/07 | |||||||||
| Great Lakes Marina— Muskegon, Michigan |
350 wet slips, 150 dry storage units | |
Marinas International |
|
$ | — | (2) | $ | 10,088 | 8/20/07 | ||||||||
| Hack’s Point Marina— Earleville, Maryland |
239 wet slips; fee interest | |
Aqua Marine Partners, LLC |
|
$ | — | $ | 2,030 | 5/20/10 | |||||||||
| Holly Creek Marina— Celina, Tennessee |
250 wet slips; leasehold and fee interests | |
Marinas International |
|
$ | — | $ | 6,790 | 8/1/07 | |||||||||
| Lakefront Marina— Port Clinton, Ohio |
470 wet slips; leasehold and fee interests | |
Marinas International |
|
$ | — | $ | 5,600 | 12/22/06 | |||||||||
| Manasquan River Club— Brick Township, New Jersey |
199 wet slips | |
Marinas International |
|
$ | — | (2) | $ | 8,900 | 6/8/07 | ||||||||
| Pier 121 Marina and Easthill Park— Lewisville, Texas |
1,007 wet slips, 250 dry storage units; leasehold interest | |
Marinas International |
|
$ | — | $ | 37,190 | 12/22/06 | |||||||||
29
Table of Contents
| Name and Location |
Description |
Operator | Mortgages and Other Notes Payable as of December 31, 2010 |
Initial Purchase Price |
Date Acquired |
|||||||||||
| Marinas (continued) |
||||||||||||||||
| Sandusky Harbor Marina— Sandusky, Ohio |
660 wet slips; leasehold and fee interests | Marinas International |
$ | — | $ | 8,953 | 12/22/06 | |||||||||
| Ventura Isle Marina— Ventura, California |
579 slips; leasehold interest | Almar Management, Inc. |
$ | 4,080 | $ | 16,417 | 3/12/10 | |||||||||
| Total |
$ | 13,268 | $ | 182,216 | ||||||||||||
| Additional Lifestyle Properties |
||||||||||||||||
| Dealership |
||||||||||||||||
| Route 66 Harley-Davidson— Tulsa, Oklahoma |
46,000 square-foot retail and service facility with restaurant | Route 66 Motorcycle, LLC |
$ | — | $ | 6,500 | 4/27/06 | |||||||||
| Total |
$ | — | $ | 6,500 | ||||||||||||
| Multi-family Residential |
||||||||||||||||
| Mizner Court at Broken Sound— Boca Raton, Florida |
450-unit apartment complex | Greystar | $ | 66,379 | (4) | $ | 104,413 | 12/31/07 | ||||||||
| Total |
$ | 66,379 | $ | 104,413 | ||||||||||||
| Hotels |
||||||||||||||||
| Coco Key Water Resort— Orlando, Florida |
399-room waterpark hotel (closed during renovation) | Sage Hospitality |
$ | 18,129 | $ | 18,527 | 5/28/08 | |||||||||
| Great Wolf Lodge—Sandusky— Sandusky, Ohio |
271-room waterpark resort | Great Wolf Resorts |
$ | 32,213 | $ | 43,400 | (3) | 8/6/09 | ||||||||
| Great Wolf Lodge—Wisconsin Dells— Wisconsin Dells, Wisconsin |
309-room waterpark resort | Great Wolf Resorts |
$ | 26,610 | $ | 46,900 | (3) | 8/6/09 | ||||||||
| The Omni Mount Washington Resort and Bretton Woods Ski Area— Bretton Woods, New Hampshire |
284-room hotel, 434 skiable acres and nine chairlifts | Omni Hotels Management Corporation |
$ | 25,000 | $ | 45,000 | 6/23/06 | |||||||||
| Total |
$ | 101,952 | $ | 153,827 | ||||||||||||
| Other |
||||||||||||||||
| Granby Development Lands Granby, Colorado |
1,553 acres with infrastructure and improvements such as roads, water, sewer, golf course in various stages of completion | N/A | $ | — | $ | 51,255 | 10/29/09 | |||||||||
| Total |
$ | — | $ | 51,255 | ||||||||||||
| Total Properties |
$ | 603,144 | $ | 2,091,829 | ||||||||||||
FOOTNOTES:
| (1) | These properties were previously leased to PARC and transitioned to the new operator listed above by February 2011. |
| (2) | These properties are pledged as collateral for an $85.0 million revolving line of credit as of December 31, 2010. |
30
Table of Contents
| (3) | We acquired an initial partnership interest in these properties on October 4, 2005. We acquired all remaining partnership interests on August 6, 2009, and the amounts stated as initial purchase price represent the estimated fair value of these properties at that time. |
| (4) | In connection with the debt restructure, the principal balance was reduced from approximately $85.4 million to $66.4 million. See Note 12, “Mortgages and Other Notes Payable” to the accompanying consolidated financial statements in Item 8 for additional information. |
| (5) | As of the date of this filing, this property has been transferred to PARC subject to 100% seller financing. |
As of December 31, 2010, we own interests in two unconsolidated entities that are in the business of owning and leasing real estate. We own an 80% interest in the Intrawest Retail Village Properties and 81.9% interest in the Dallas Market Center. As of December 31, 2010, we have invested, through unconsolidated entities, in the following properties which are divided by asset class (in thousands):
| Name and Location |
Description |
Mortgages and Other Notes Payable as of December 31, 2010 |
Initial Purchase Price |
Date Acquired |
||||||||||
| Destination Retail—Intrawest Venture |
||||||||||||||
| Village of Baytowne Wharf— Destin, Florida |
56,104 leasable square feet | $ | 9,900 | $ | 17,100 | 12/16/04 | ||||||||
| Village at Blue Mountain—Collingwood, ON, Canada | 39,723 leasable square feet | $ | 25,132 | (1) | $ | 10,781 | 12/3/04 | |||||||
| Village at Copper Mountain— Copper Mountain, Colorado |
97,928 leasable square feet | $ | 10,872 | $ | 23,300 | 12/16/04 | ||||||||
| Village at Mammoth Mountain—Mammoth Lakes, California | 57,924 leasable square feet | $ | 12,242 | $ | 22,300 | 12/16/04 | ||||||||
| Village of Snowshoe Mountain—Snowshoe, West Virginia | 39,846 leasable square feet | $ | 4,817 | $ | 8,400 | 12/16/04 | ||||||||
| Village at Stratton— Stratton, Vermont |
47,837 leasable square feet | $ | 2,829 | $ | 9,500 | 12/16/04 | ||||||||
| Whistler Creekside— Vancouver, BC, Canada |
70,802 leasable square feet | $ | — | (1) | $ | 19,500 | 12/3/04 | |||||||
| Total |
$ | 65,792 | $ | 110,881 | ||||||||||
| Merchandise Marts—DMC Venture |
||||||||||||||
| Dallas Market Center— International Floral and Gift Center—Dallas, Texas |
4.8 million leasable square feet; leasehold and fee interests | $ | 142,015 | $ | 260,659 | 2/14/05 | ||||||||
| Total |
$ | 142,015 | $ | 260,659 | ||||||||||
| Total Properties |
$ | 207,807 | $ | 371,540 | ||||||||||
FOOTNOTE:
| (1) | This amount encumbers both the Village at Blue Mountain and Whistler Creekside properties and was converted from Canadian dollars to U.S. dollars at an exchange rate of 0.9999 Canadian dollars for $1.0000 U.S. dollar on December 31, 2010. |
31
Table of Contents
In addition to the properties listed above, on January 10, 2011, we acquired a 60% ownership interest, through an unconsolidated entity, in the following senior living properties with an agreed upon value of $630.0 million. At closing, the venture obtained a $435.0 million loan to finance a portion of the acquisition. See Item 7. “Management’s Discussion and Analysis of Financial Condition and Results of Operations”—“Acquisitions and Investments in Unconsolidated Entities” for additional information (in thousands).
| Name and Location |
Description |
Operator |
|
Mortgages Payable |
|
|
Initial Purchase Price(1) |
|
|
Date Acquired |
| |||||
| Senior Living—Sunrise Venture |
||||||||||||||||
| Sunrise of Alta Loma Rancho Cucamonga, California |
59 residential units | Sunrise Senior Living Management, Inc. | $ | 7,065 | $ | 10,170 | 1/10/11 | |||||||||
| Sunrise of Baskin Ridge Baskin Ridge, New Jersey |
77 residential units | Sunrise Senior Living Management, Inc. | $ | 21,639 | $ | 31,150 | 1/10/11 | |||||||||
| Sunrise of Belmont Belmont, California |
78 residential units | Sunrise Senior Living Management, Inc. | $ | 21,639 | $ | 31,150 | 1/10/11 | |||||||||
| Sunrise of Chesterfield Chesterfield, Missouri |
74 residential units | Sunrise Senior Living Management, Inc. | $ | 28,759 | $ | 41,400 | 1/10/11 | |||||||||
| Sunrise of Claremont Claremont, California |
54 residential units | Sunrise Senior Living Management, Inc. | $ | 8,135 | $ | 11,710 | 1/10/11 | |||||||||
| Sunrise of Crystal Lake Crystal Lake, Illinois |
58 residential units | Sunrise Senior Living Management, Inc. | $ | 10,135 | $ | 14,590 | 1/10/11 | |||||||||
| Sunrise of Dix Hills Dix Hills, New York |
76 residential units | Sunrise Senior Living Management, Inc. | $ | 23,410 | $ | 33,700 | 1/10/11 | |||||||||
| Sunrise of East Meadow East Meadow, New York |
82 residential units | Sunrise Senior Living Management, Inc. | $ | 24,529 | $ | 35,310 | 1/10/11 | |||||||||
| Sunrise of East Setauket East Setauket, New York |
82 residential units | Sunrise Senior Living Management, Inc. | $ | 19,937 | $ | 28,700 | 1/10/11 | |||||||||
| Sunrise of Edgewater Edgewater, New Jersey |
70 residential units | Sunrise Senior Living Management, Inc. | $ | 18,089 | $ | 26,040 | 1/10/11 | |||||||||
| Sunrise of Flossmoor Flossmoor, Illinois |
62 residential units | Sunrise Senior Living Management, Inc. | $ | 8,544 | $ | 12,300 | 1/10/11 | |||||||||
| Sunrise of Gahanna Gahanna, Ohio |
50 residential units | Sunrise Senior Living Management, Inc. | $ | 6,370 | $ | 9,170 | 1/10/11 | |||||||||
| Sunrise of Gurnee Gurnee, Illinois |
59 residential units | Sunrise Senior Living Management, Inc. | $ | 15,178 | $ | 21,850 | 1/10/11 | |||||||||
| Sunrise of Holbrook Holbrook, New York |
79 residential units | Sunrise Senior Living Management, Inc. | $ | 21,187 | $ | 30,500 | 1/10/11 | |||||||||
| Sunrise of Huntington Commons Kennebunk, Maine |
180 residential units | Sunrise Senior Living Management, Inc. | $ | 20,347 | $ | 29,290 | 1/10/11 | |||||||||
| Sunrise of Lincroft Lincroft, New York |
60 residential units | Sunrise Senior Living Management, Inc. | $ | 13,435 | $ | 19,340 | 1/10/11 | |||||||||
| Sunrise of Marlboro Marlboro, New Jersey |
63 residential units | Sunrise Senior Living Management, Inc. | $ | 8,982 | $ | 12,930 | 1/10/11 | |||||||||
| Sunrise of Montgomery Village Montgomery Village, Maryland |
141 residential units | Sunrise Senior Living Management, Inc. | $ | 6,724 | $ | 9,680 | 1/10/11 | |||||||||
| Sunrise of Naperville North Naperville, Illinois |
77 residential units | Sunrise Senior Living Management, Inc. | $ | 21,222 | $ | 30,550 | 1/10/11 | |||||||||
32
Table of Contents
| Name and Location |
Description |
Operator |
Mortgages Payable |
Initial Purchase Price(1) |
Date Acquired |
|||||||||||
| Senior Living—Sunrise Venture (Continued) |
||||||||||||||||
| Sunrise of Plainview Plainview, New York |
51 residential units | Sunrise Senior Living Management, Inc. | $ | 15,213 | $ | 21,900 | 1/10/11 | |||||||||
| Sunrise of Roseville Roseville, Minnesota |
77 residential units | Sunrise Senior Living Management, Inc. | $ | 19,319 | $ | 27,810 | 1/10/11 | |||||||||
| Sunrise of Schaumburg Schaumburg, Illinois |
82 residential units | Sunrise Senior Living Management, Inc. | $ | 21,153 | $ | 30,450 | 1/10/11 | |||||||||
| Sunrise of Silver Spring Silver Spring, Maryland |
65 residential units | Sunrise Senior Living Management, Inc. | $ | 12,761 | $ | 18,370 | 1/10/11 | |||||||||
| Sunrise of Tustin Santa Ana, California |
48 residential units | Sunrise Senior Living Management, Inc. | $ | 10,344 | $ | 14,890 | 1/10/11 | |||||||||
| Sunrise of University Park Colorado Springs, Colorado |
53 residential units | Sunrise Senior Living Management, Inc. | $ | 8,739 | $ | 12,580 | 1/10/11 | |||||||||
| Sunrise of West Babylon West Babylon, New York |
79 residential units | Sunrise Senior Living Management, Inc. | $ | 24,035 | $ | 34,600 | 1/10/11 | |||||||||
| Sunrise of West Bloomfield West Bloomfield, Michigan |
52 residential units | Sunrise Senior Living Management, Inc. | $ | 6,738 | $ | 9,700 | 1/10/11 | |||||||||
| Sunrise of West Hills West Hills, California |
65 residential units | Sunrise Senior Living Management, Inc. | $ | 6,092 | $ | 8,770 | 1/10/11 | |||||||||
| Sunrise of Weston Weston, Massachusetts |
29 residential units | Sunrise Senior Living Management, Inc. | $ | 5,280 | $ | 7,600 | 1/10/11 | |||||||||
| Total | $ | 435,000 | $ | 626,200 | ||||||||||||
FOOTNOTE:
| (1) | Initial purchase price represents the fair value of the properties at the date of acquisition net of cash and other working capital. |
| Item 3. | Legal Proceedings |
We are subject, from time to time, to various legal proceedings and claims that arise in the ordinary course of business. While resolution of these matters cannot be predicted with certainty, we believe, based upon currently available information that the final outcome of such matters will not have a material adverse effect on our results of operations or financial condition.
33
Table of Contents
| Item 5. | Market for Registrant’s Common Equity, Related Stockholder Matters and Issuer Purchases of Equity Securities |
Market Information. There is no established public trading market for our shares. Although we may list our shares on a national securities exchange or over-the-counter market if market conditions are satisfactory, a public market for our shares may not develop even if the shares are listed. Prior to such time, if any, as the listing of our shares occurs, any stockholder who has held shares for not less than one year (other than our Advisor or its affiliates) may present all or any portion equal to at least 25% of such stockholder’s shares to us for redemption at any time pursuant to our existing redemption plan. See the section entitled “Redemption of Shares” below for additional information regarding our redemption plan.
As of December 31, 2010, the price per share of our common stock was $10.00. We determined the price per share based upon the price we believed investors would pay for the shares and upon the price at which our shares are currently selling. We did not take into account the value of the underlying assets in determining the price per share.
We are aware of sales of our common stock made between investors totaling 50,082 shares sold at an average price of $6.63 per share during 2010, 8,640 shares sold at an average price of $8.97 per share during 2009 and 21,793 shares sold at an average price of $9.21 per share during 2008.
As of December 31, 2010, we had cumulatively raised approximately $3.0 billion (301.2 million shares) in subscription proceeds including approximately $270.1 million (28.4 million shares) received through our dividend reinvestment plan pursuant to a registration statement on Form S-11 under the Securities Act of 1933. In addition, during the period January 1, 2011 through March 10, 2011, we raised an additional $88.3 million (8.8 million shares). As of March 10, 2011, we had approximately 91,908 common stockholders of record. The below is information about our completed and current offerings as of March 10, 2011:
| Offering |
Commenced | Closed | Maximum Offering |
Total Offering Proceeds (in thousands) |
||||||||||||
| 1st (File No. 333-108355) |
4/16/2004 | 3/31/2006 | $ | 2.0 billion | $ | 520,728 | ||||||||||
| 2nd (File No. 333-128662) |
4/4/2006 | 4/4/2008 | $ | 2.0 billion | 1,520,035 | |||||||||||
| 3rd (File No. 333-146457) |
4/9/2008 | Ongoing | $ | 2.0 billion | 1,043,083 | |||||||||||
| Total |
$ | 3,083,846 | ||||||||||||||
We do not intend to commence another public offering of our shares following the completion of our current public offering of shares on April 9, 2011. However, we intend to continue offering shares through our reinvestment plan. In making this decision, the board of directors considered a number of factors, including the Company’s size and diversification of our portfolio and our relatively low leverage and strong cash position, as well as the current stage of our lifecycle.
34
Table of Contents
We have used the proceeds from our offerings primarily in our investing activities, including the acquisition of properties, the making of loans, investments in unconsolidated entities and for other capital expenditures. In addition, we used the offering proceeds to reimburse and compensate our Advisor and its affiliates for acquisition fees and costs incurred on our behalf, to pay offering costs, selling commissions and marketing support fees to our Managing Dealer and to make redemptions in connection with our redemption plan. As of December 31, 2010, approximately $2.9 billion in total proceeds raised were used in the above mentioned activities and are allocated as follows (in thousands):
| Investing activities |
$ | 2,299,142 | ||
| Acquisition fees and costs to advisor |
151,387 | |||
| Fees to Managing Dealer |
265,768 | |||
| Redemptions |
160,215 | |||
| Total |
$ | 2,876,512 | ||
Distributions. We intend to continue to pay distributions to our stockholders on a quarterly basis. The amount of distributions declared to our stockholders will be determined by our board of directors and is dependent upon a number of factors, including:
| • | Sources of cash available for distribution such as current year and inception to date cumulative cash flows, Funds from Operations (“FFO”) and Modified Funds from Operations (“MFFO”), as well as, expected future long-term stabilized cash flows, FFO and MFFO; |
| • | The proportion of distributions paid in cash compared to that which is being reinvested through our reinvestment program |
| • | Limitations and restrictions contained in the terms of our current and future indebtedness concerning the payment of distributions; and |
| • | Other factors such as the avoidance of distribution volatility, our objective of continuing to qualify as a REIT, capital requirements, the general economic environment and other factors. |
We may use borrowings and proceeds from our dividend reinvestment plan to fund a portion of our distributions in order to avoid distribution volatility. See “Sources of Liquidity and Capital Resources” within Item 7. “Management’s Discussion and Analysis of Financial Condition and Results of Operations” for additional information related to our sources of cash for distributions.
For the years ended December 31, 2010 and 2009, approximately 0.3% and 4.4%, respectively, of the distributions paid to stockholders were considered taxable income and approximately 99.7% and 95.6%, respectively, were considered a return of capital to stockholders for federal income tax purposes. No amounts distributed to stockholders for the years ended December 31, 2010 and 2009, were required to be or have been treated by us as a return of capital for purposes of calculating the stockholders’ return on their invested capital as described in our advisory agreement. In determining the apportionment between taxable income and a return of capital, the amounts distributed to stockholders (other than any amounts designated as capital gains dividends) in excess of current or accumulated Earnings and Profits (“E&P”) are treated as a return of capital to the stockholders. E&P is a statutory calculation, which is derived from net income and determined in accordance with the Internal Revenue Code. It is not intended to be a measure of the REIT’s performance, nor do we consider it to be an absolute measure or indicator of our source or ability to pay distributions to stockholders.
35
Table of Contents
The following table represents total distributions declared including cash distributions, distributions reinvested and distributions per share for the years ended December 31, 2010 and 2009 (in thousands except per share data):
| Sources of Distributions Paid in Cash |
||||||||||||||||||||
| Periods |
Distributions Per Share |
Total Distributions Declared(1) |
Distributions Reinvested |
Cash Distributions |
Cash Flows From Operating Activities(2) |
|||||||||||||||
| 2010 Quarter |
||||||||||||||||||||
| First |
$ | 0.1563 | $ | 38,987 | $ | 17,463 | $ | 21,524 | $ | 25,134 | ||||||||||
| Second |
0.1563 | 40,092 | 17,913 | 22,179 | 28,948 | |||||||||||||||
| Third |
0.1563 | 41,593 | 18,465 | 23,128 | 43,372 | |||||||||||||||
| Fourth |
0.1563 | 43,267 | 19,243 | 24,024 | (17,678 | )(4) | ||||||||||||||
| Year |
$ | 0.6252 | $ | 163,939 | $ | 73,084 | $ | 90,855 | $ | 79,776 | ||||||||||
| 2009 Quarter |
||||||||||||||||||||
| First |
$ | 0.1538 | $ | 34,917 | $ | 16,304 | $ | 18,613 | $ | 21,644 | ||||||||||
| Second |
0.1913 | (3) | 44,285 | 20,237 | 24,048 | 3,902 | (4) | |||||||||||||
| Third |
0.1563 | 37,160 | 16,910 | 20,250 | 42,106 | |||||||||||||||
| Fourth |
0.1563 | 38,091 | 17,167 | 20,924 | (5,252 | )(4) | ||||||||||||||
| Year |
$ | 0.6577 | $ | 154,453 | $ | 70,618 | $ | 83,835 | $ | 62,400 | ||||||||||
FOOTNOTES:
| (1) | Distributions reinvested may be dilutive to stockholders to the extent that they are not covered by operating cash flows, FFO and MFFO and such shortfalls are instead covered by borrowings. |
| (2) | Cash flows from operating activities calculated in accordance with GAAP are not necessarily indicative of the amount of cash available to pay distributions. For example, GAAP requires that the payment of acquisition fees and costs be classified as a use of cash in operating activities in the statement of cash flows, which directly reduces the measure of cash flows from operations. However, acquisition fees and costs are paid for with proceeds from our offerings and debt financings as opposed to operating cash flows. The board of directors also uses other measures such as FFO and MFFO in order to evaluate the level of distributions. |
| (3) | Amount includes a special distribution in connection with the gain on sale of a property in late 2008. |
| (4) | The shortfall in cash flows from operating activities versus cash distributions paid was funded with cumulative cash flows from operations from prior periods and temporary borrowings under our revolving line of credit. |
36
Table of Contents
Redemption of Shares. We redeem shares pursuant to our redemption plan, which is designed to provide eligible stockholders with limited interim liquidity by enabling them to sell shares back to us prior to any listing of our shares. The following table presents information about redemptions for the years ended December 31, 2010 and 2009 (in thousands except per share data):
| 2010 Quarters |
First | Second | Third | Fourth | Full Year | |||||||||||||||
| Requests in queue |
1,324 | 1,387 | 2,263 | 3,043 | 1,324 | |||||||||||||||
| Redemptions requested |
1,981 | 1,746 | 1,583 | 1,372 | 6,682 | |||||||||||||||
| Shares redeemed: |
||||||||||||||||||||
| Prior period requests |
(1,200 | ) | (538 | ) | (540 | ) | (558 | ) | (2,836 | ) | ||||||||||
| Current period requests |
(594 | ) | (225 | ) | (226 | ) | (208 | ) | (1,253 | ) | ||||||||||
| Adjustments(1) |
(124 | ) | (107 | ) | (37 | ) | (54 | ) | (322 | ) | ||||||||||
| Pending redemption requests(2) |
1,387 | 2,263 | 3,043 | 3,595 | 3,595 | |||||||||||||||
| Average price paid per share |
$ | 9.73 | $ | 9.83 | $ | 9.79 | $ | 9.79 | $ | 9.77 | ||||||||||
| 2009 Quarters |
First | Second | Third | Fourth | Full Year | |||||||||||||||
| Requests in queue |
— | — | 1,297 | 1,301 | — | |||||||||||||||
| Redemptions requested |
2,268 | 3,409 | 1,762 | 1,872 | 9,311 | |||||||||||||||
| Shares redeemed: |
||||||||||||||||||||
| Prior period requests |
— | — | (1,297 | ) | (1,173 | ) | (2,470 | ) | ||||||||||||
| Current period requests |
(2,268 | ) | (2,112 | ) | (461 | ) | (598 | ) | (5,439 | ) | ||||||||||
| Adjustments(1) |
— | — | — | (78 | ) | (78 | ) | |||||||||||||
| Pending redemption requests(2) |
— | 1,297 | 1,301 | 1,324 | 1,324 | |||||||||||||||
| Average price paid per share |
$ | 9.55 | $ | 9.58 | $ | 9.70 | $ | 9.35 | $ | 9.55 | ||||||||||
FOOTNOTES:
| (1) | This amount represents redemption request cancellations and other adjustments. |
| (2) | Requests that are not fulfilled in whole during a particular quarter will be redeemed on a pro rata basis pursuant to the redemption plan. |
The redemption price per share is based on the amount of time that the redeeming stockholder has held the applicable shares, but in no event is the redemption price greater than the price of shares sold to the public in our offerings.
In the event there are insufficient funds to redeem all of the shares for which redemption requests have been submitted, redemptions will occur on a pro rata basis at the end of each quarter, with the actual redemption occurring at the beginning of the next quarter. Stockholders whose shares are not redeemed due to insufficient funds in that quarter will have their requests carried forward and be honored at such time as sufficient funds exist. In such case, the redemption request will be retained and such shares will be redeemed before any subsequently received redemption requests are honored, subject to certain priority groups for hardship cases. Redeemed shares are considered retired and will not be reissued.
In March 2010, we amended our redemption plan to provide clarity about the board of directors’ discretion in establishing the amount of redemptions that may be processed each quarter and to allow certain priority groups of stockholders with requests made pursuant to circumstances such as death, qualifying disability, bankruptcy or unforeseeable emergency to have their redemption requests processed ahead of the general stockholder population.
We are not obligated to redeem shares under our redemption plan. However, if we elect to redeem shares, the aggregate amount of funds that will be used to redeem shares pursuant to the redemption plan will be
37
Table of Contents
determined on a quarterly basis in the sole discretion of our board of directors and may be less than, but is not expected to exceed, the aggregate proceeds received through our dividend reinvestment plan. In addition, our board of directors determined that we will redeem shares pursuant to the redemption plan of no more than $7.5 million per calendar quarter beginning in the second quarter of 2010. Our board of directors will continue to evaluate and determine the amount of shares to be redeemed based on what it believes to be in the best interests of the company and our stockholders, as the redemption of shares dilutes the amount of cash available to make acquisitions. At no time during a 12-month period, however, may the number of shares we redeem pursuant to the redemption plan (if we determine to redeem shares) exceed 5% of the weighted-average shares of our common stock at the beginning of such 12-month period. To date we have not exceeded this limit, and we do not anticipate that we will reach the maximum number of shares redeemable under our Redemption Plan during the next twelve months.
Subject to certain restrictions discussed below, we may redeem shares, from time to time, at the following prices:
| • | 92.5 % of the original purchase price per share for stockholders who have owned their shares for at least one year; |
| • | 95.0% of the original purchase price per share for stockholders who have owned their shares for at least two years; |
| • | 97.5% of the original purchase price per share for stockholders who have owned their shares for at least three years; and |
| • | for stockholders who have owned their shares for at least four years, a price determined by our board of directors but in no event less than 100.0 % of the original purchase price per share. |
During the period of any public offering, the repurchase price will not exceed the current public offering price of the shares. If there is no current offering, the redemption price will not exceed the estimated fair market value of the shares as determined by the discretion of management. In addition, we have the right to waive the above holding periods and redemption prices in the event of the death, qualifying disability, bankruptcy or unforeseeable emergency of a stockholder as defined under the plan. Redemption of shares issued pursuant to our dividend reinvestment plan will be priced based upon the purchase price from which shares are being reinvested.
Any stockholder who has held shares for not less than one year (other than our Advisor) may present for our consideration, all or any portion equal to at least 25% of such shares to us for redemption at any time. At such time, we may, at our sole option, choose to redeem such shares presented for redemption for cash to the extent we have sufficient funds available. There is no assurance that there will be sufficient funds available for redemption or that we will exercise our discretion to redeem such shares and, accordingly, a stockholder’s shares may not be redeemed. Factors that we will consider in making our determinations to redeem shares include:
| • | whether such redemption impairs our capital or operations; |
| • | whether an emergency makes such redemption not reasonably practical; |
| • | whether any governmental or regulatory agency with jurisdiction over us demands such action for the protection of our stockholders; |
| • | whether such redemption would be unlawful; and |
| • | whether such redemption, when considered with all other redemptions, sales, assignments, transfers and exchanges of our shares, could prevent us from qualifying as a REIT for tax purposes. |
In the event there are insufficient funds to redeem all of the shares for which redemption requests have been submitted, and we have determined to redeem shares, we will redeem pending requests at the end of each quarter in the following order:
| (i) | pro rata as to redemptions sought upon a stockholder’s death; |
38
Table of Contents
| (ii) | pro rata as to redemptions sought by stockholders with a qualifying disability; |
| (iii) | pro rata as to redemptions sought by stockholders subject to bankruptcy; |
| (iv) | pro rata as to redemptions sought by stockholders in the event of an unforeseeable emergency; |
| (v) | pro rata as to stockholders subject to mandatory distribution requirements under an individual retirement arrangement (an “IRA”); |
| (vi) | pro rata as to redemptions that would result in a stockholder owning less than 100 shares; and |
| (vii) | pro rata as to all other redemption requests. |
With respect to a stockholder whose shares are not redeemed due to insufficient funds in that quarter, the redemption request will be retained by us unless it is withdrawn by the stockholder, and such shares will be redeemed in subsequent quarters as funds become available and before any subsequently received redemption requests are honored, subject to the priority for redemption requests listed in (i) through (vi) above. Until such time as the company redeems the shares, a stockholder may withdraw its redemption request as to any remaining shares not redeemed.
Our board of directors, in its sole discretion, may amend or suspend the redemption plan at any time it determines that such amendment or suspension is in our best interest. If our board of directors amends or suspends the redemption plan, we will provide stockholders with at least 30 days advance notice prior to effecting such amendment or suspension: (i) in our annual or quarterly reports or (ii) by means of a separate mailing accompanied by disclosure in a current or periodic report under the Securities Exchange Act of 1934. While we are engaged in an offering, we will also include this information in a prospectus supplement or post-effective amendment to the registration statement as required under federal securities laws. The redemption plan will terminate, and we no longer shall accept shares for redemption, if and when listing occurs.
Issuer Purchases of Equity Securities. The following table presents details regarding our repurchase of securities between October 1, 2010 and December 31, 2010 (in thousands except per share data).
| Period |
Total Number of Shares Purchased |
Average Price Paid Per Share |
Total Number of Shares Purchased as Part of Publicly Announced Plan |
Maximum Number of Shares That May Yet be Purchased Under the Plan |
||||||||||||
| October 1, 2010 through October 31, 2010 |
— | — | 6,361,248 | |||||||||||||
| November 1, 2010 through November 30, 2010 |
— | — | 6,361,248 | |||||||||||||
| December 1, 2010 through December 31, 2010 |
765,851 | $ | 9.79 | 765,851 | 7,704,391 | (1) | ||||||||||
| Total |
765,851 | 765,851 | ||||||||||||||
FOOTNOTE:
| (1) | This number represents the maximum number of shares which can be redeemed under the redemption plan without exceeding the five percent limitation in a rolling 12-month period described above and does not take into account the amount the board has determined to redeem or whether there are sufficient proceeds under the redemption plan. Under the redemption plan, we can, at our discretion, use up to $100,000 per calendar quarter of the proceeds from any public offering of our common stock for redemptions. |
39
Table of Contents
| Item 6. | Selected Financial Data |
SELECTED FINANCIAL DATA
The following selected financial data for CNL Lifestyle Properties, Inc. should be read in conjunction with “Item 7.—Management’s Discussion and Analysis of Financial Condition and Results of Operations” and “Item 8.—Financial Statements and Supplementary Data” (in thousands except per share data):
| Year Ended December 31, | ||||||||||||||||||||
| 2010 | 2009 | 2008 | 2007 | 2006 | ||||||||||||||||
| Operating Data: |
||||||||||||||||||||
| Revenues |
$ | 304,428 | $ | 253,271 | $ | 210,415 | $ | 139,422 | $ | 21,887 | ||||||||||
| Operating income (loss)(1) |
(60,271 | ) | 13,012 | 57,578 | 34,661 | 1,295 | ||||||||||||||
| Income (loss) from continuing operations(1) |
(81,889 | ) | (19,320 | ) | 34,240 | 35,356 | 19,250 | |||||||||||||
| Discontinued operations(2) |
— | — | 2,396 | 169 | 135 | |||||||||||||||
| Net income (loss)(1) |
(81,889 | ) | (19,320 | ) | 36,636 | 35,525 | 19,385 | |||||||||||||
| Net income (loss) per share (basic and diluted): |
||||||||||||||||||||
| From continuing operations |
(0.31 | ) | (0.08 | ) | 0.16 | 0.22 | 0.31 | |||||||||||||
| From discontinued operations |
— | — | 0.01 | — | — | |||||||||||||||
| Weighted average number of shares outstanding (basic and diluted) |
263,516 | 235,873 | 210,192 | 159,807 | 62,461 | |||||||||||||||
| Distributions declared(3)(4) |
163,939 | 154,453 | 128,358 | 94,067 | 33,726 | |||||||||||||||
| Distributions declared per share(4) |
0.63 | 0.66 | 0.62 | 0.60 | 0.56 | |||||||||||||||
| Cash provided by operating activities |
79,776 | 62,400 | 118,782 | 117,212 | 45,293 | |||||||||||||||
| Cash used in investing activities |
138,575 | 141,884 | 369,193 | 1,221,387 | 562,480 | |||||||||||||||
| Cash provided by financing activities |
75,603 | 53,459 | 424,641 | 842,894 | 721,293 | |||||||||||||||
| Year Ended December 31, | ||||||||||||||||||||
| 2010 | 2009 | 2008 | 2007 | 2006 | ||||||||||||||||
| Balance Sheet Data: |
||||||||||||||||||||
| Real estate investment properties, net |
$ | 2,025,522 | $ | 2,021,188 | $ | 1,862,502 | $ | 1,603,061 | $ | 464,892 | ||||||||||
| Investments in unconsolidated entities |
140,372 | 142,487 | 158,946 | 169,350 | 178,672 | |||||||||||||||
| Mortgages and other notes receivable, net |
116,427 | 145,640 | 182,073 | 116,086 | 106,356 | |||||||||||||||
| Cash |
200,517 | 183,575 | 209,501 | 35,078 | 296,163 | |||||||||||||||
| Total assets |
2,673,926 | 2,672,128 | 2,529,735 | 2,042,210 | 1,103,699 | |||||||||||||||
| Long-term debt obligations |
603,144 | 639,488 | 539,187 | 355,620 | 69,996 | |||||||||||||||
| Line of credit |
58,000 | 99,483 | 100,000 | — | 3,000 | |||||||||||||||
| Total liabilities |
742,886 | 822,912 | 707,363 | 424,896 | 104,505 | |||||||||||||||
| Rescindable common stock |
— | — | — | — | 21,688 | |||||||||||||||
| Stockholders’ equity |
1,931,040 | 1,849,216 | 1,822,372 | 1,617,314 | 977,506 | |||||||||||||||
| Other Data: |
||||||||||||||||||||
| Funds from operations (“FFO”)(1)(5) |
55,553 | 120,576 | 148,853 | 118,378 | 40,037 | |||||||||||||||
| FFO per share |
0.21 | 0.51 | 0.71 | 0.74 | 0.64 | |||||||||||||||
| Modified funds from operations (“MFFO”)(5) |
122,206 | 141,422 | 148,853 | 118,378 | 40,037 | |||||||||||||||
| MFFO per share |
0.46 | 0.60 | 0.71 | 0.74 | 0.64 | |||||||||||||||
| Properties owned directly at the end of period |
114 | 107 | 104 | 90 | 42 | |||||||||||||||
| Properties owned through unconsolidated entities at end of the period |
8 | 8 | 10 | 10 | 10 | |||||||||||||||
| Investments in mortgages and other notes receivable at the end of period |
10 | 10 | 11 | 9 | 7 | |||||||||||||||
40
Table of Contents
FOOTNOTES:
| (1) | Certain of our tenants continued to experience operating challenges and limited ability to obtain working capital from lenders or capital partners and defaulted on leases and loan obligations to us. For the year ended December 31, 2010, we recorded a loss on lease termination of approximately $55.5 million and recorded a loan loss provision of approximately $4.1 million in notes receivable that were deemed uncollectible in connection with the lease terminations. In addition, we recorded impairment provisions totaling approximately $26.9 million for the year ended December 31, 2010 for the two Great Wolf properties, one golf property and one attraction property. See Item 8, Note 4 “Real Estate Investment Properties, net” to the accompanying consolidated financial statements for additional information. |
For the years ended December 31, 2010 and 2009, acquisition fees and costs were approximately $14.1 million and $14.6 million, respectively. These fees were historically capitalized but are currently expensed as a result of new accounting standards effective January 1, 2009.
| (2) | On December 12, 2008, we sold our Talega Golf Course property. In accordance with GAAP, we have reclassified and included the results from the property sold in 2008 as discontinued operations in the consolidated statements of operations for all periods presented. |
| (3) | Cash distributions are declared by the board of directors and generally are based on various factors, including actual and future expected net cash from operations, FFO and MFFO, and our general financial condition, among others. Approximately 0.3%, 4.4%, 41.0%, 58.0% and 71.9% of the distributions received by stockholders were considered to be taxable income and approximately 99.7%, 95.6%, 59.0%, 42.0% and 28.1% were considered a return of capital for federal income tax purposes for the years ended December 31, 2010, 2009, 2008, 2007 and 2006, respectively. We have not treated such amounts as a return of capital for purposes of calculating the stockholders’ return on their invested capital, as described in our advisory agreement. |
| (4) | In 2009, amount includes a special distribution in connection with the gain on sale of a property in late 2008. |
| (5) | FFO is a non-GAAP financial measure that is widely recognized in the REIT industry as a supplemental measure of operating performance. FFO is defined by the National Association of Real Estate Investment Trusts (“NAREIT”) as net income (loss) computed in accordance with GAAP, excluding gains or losses from sales of property, plus depreciation and amortization on real estate assets, and after adjustments for unconsolidated partnerships and joint ventures. FFO was developed by NAREIT as a relative measure of performance of an equity REIT in order to recognize that income-producing real estate has historically not depreciated on the basis as determined under GAAP, which implies that the value of real estate assets diminishes predictably over time. We believe that FFO is a useful measure that should be considered along with, but not as an alternative to, net income (loss) when evaluating operating performance. |
In addition to FFO, we use MFFO, which further adjusts net income (loss) and FFO to exclude acquisition-related costs, impairments, contingent purchase price adjustments and other non-recurring charges in order to further evaluate our ongoing operating performance. Changes in the accounting and reporting rules under GAAP that have been put into effect since the establishment of NAREIT’s definition of FFO have increased the number of non-cash and non-operating items included in net income (loss) and FFO, which management consider to be more reflective of investing activities. For example, the accounting for acquisition costs and expenses have changed from a capitalize and depreciate model to expense as incurred. These costs are paid for with proceeds from our common stock offerings or debt proceeds rather than paid for with cash generated from operations. Similarly, recent accounting standards require us to estimate any future contingent purchase consideration at the time of acquisition and subsequently record changes to those estimates or eventual payments in the statement of operations even though the payment is funded by offering proceeds. Previously under GAAP, these amounts would be capitalized, which is consistent with how these incremental payments are added to the contractual lease basis used to calculate rent for the related property and generates future rental income. Impairments and other non-recurring non-cash write-offs are
41
Table of Contents
not indicative of ongoing results of operations. Therefore, we exclude these amounts in the computation of MFFO. By providing MFFO, we present information that we believe is more consistent with management’s long term view of our core operating activities and is more reflective of a stabilized asset base.
We believe that in order to facilitate a clear understanding of our operating performance between periods and as compared to other equity REITs, FFO and MFFO should be considered in conjunction with our net income (loss) and cash flows as reported in the accompanying consolidated financial statements and notes thereto. FFO and MFFO (i) do not represent cash generated from operating activities determined in accordance with GAAP (which, unlike FFO or MFFO, generally reflects all cash effects of transactions and other events that enter into the determination of net income (loss)), (ii) are not necessarily indicative of cash flow available to fund cash needs and (iii) should not be considered as alternatives to net income (loss) determined in accordance with GAAP as an indication of our operating performance, or to cash flow from operating activities determined in accordance with GAAP as a measure of either liquidity or our ability to make distributions. FFO or MFFO as presented may not be comparable to amounts calculated by other companies.
The following table presents a reconciliation of net income (loss) to FFO and MFFO for the years ended December 31, 2010, 2009, 2008, 2007 and 2006 (in thousands except per share data):
| Year Ended December 31, | ||||||||||||||||||||
| 2010 | 2009 | 2008 | 2007 | 2006 | ||||||||||||||||
| Net income (loss) |
$ | (81,889 | ) | $ | (19,320 | ) | $ | 36,636 | $ | 35,525 | $ | 19,385 | ||||||||
| Adjustments: |
||||||||||||||||||||
| Depreciation and amortization |
126,223 | 124,040 | 98,901 | 64,883 | 8,489 | |||||||||||||||
| Gain on sale of real estate investment properties |
— | — | (4,470 | ) | — | — | ||||||||||||||
| Net effect of FFO adjustment from unconsolidated entities(a) |
11,219 | 15,856 | 17,786 | 17,970 | 12,163 | |||||||||||||||
| Total funds from operations |
55,553 | 120,576 | 148,853 | 118,378 | 40,037 | |||||||||||||||
| Acquisition fees and expenses(b) |
14,149 | 14,616 | — | — | — | |||||||||||||||
| Impairments of real estate related investments |
26,880 | — | — | — | — | |||||||||||||||
| Impairments of lease assets |
21,347 | 569 | — | — | — | |||||||||||||||
| Impairments of notes receivable |
4,072 | — | — | — | — | |||||||||||||||
| Assumption of non-cash deferred charges in connection with lease terminations |
1,705 | 2,189 | — | — | — | |||||||||||||||
| Contingent purchase price adjustments |
(1,500 | ) | 3,472 | — | — | — | ||||||||||||||
| Modified funds from operations |
$ | 122,206 | $ | 141,422 | $ | 148,853 | $ | 118,378 | $ | 40,037 | ||||||||||
| Weighted average number of shares of common stock outstanding (basic and diluted) |
263,516 | 235,873 | 210,192 | 159,807 | 62,461 | |||||||||||||||
| FFO per share (basic and diluted) |
$ | 0.21 | $ | 0.51 | $ | 0.71 | $ | 0.74 | $ | 0.64 | ||||||||||
| MFFO per share (basic and diluted) |
$ | 0.46 | $ | 0.60 | $ | 0.71 | $ | 0.74 | $ | 0.64 | ||||||||||
FOOTNOTES:
| (a) | This amount represents our share of the FFO adjustments allowable under the NAREIT definition (primarily depreciation) multiplied by the percentage of income or loss recognized under the hypothetical liquidation at book value (“HLBV”) method. |
| (b) | Acquisition fees and costs that were directly identifiable with properties acquired were not required to be expensed under GAAP prior to January 1, 2009. Accordingly, no adjustments to funds from operations are necessary for periods prior to 2009. |
42
Table of Contents
| Item 7. | Management’s Discussion and Analysis of Financial Condition and Results of Operations |
INTRODUCTION
CNL Lifestyle Properties, Inc. was organized pursuant to the laws of the State of Maryland on August 11, 2003. We were formed primarily to acquire lifestyle properties in the United States that we lease on a long-term (generally five to 20 years, plus multiple renewal options), triple-net or gross basis to tenants or operators that we consider to be significant industry leaders and engage third-party operators to manage certain properties on our behalf as permitted under applicable tax regulations. We define lifestyle properties as those properties that reflect or are impacted by the social, consumption and entertainment values and choices of our society. We also make and acquire loans (including mortgage, mezzanine and other loans) generally collateralized by interests in real estate. We currently operate and have elected to be taxed as a REIT for federal income tax purposes beginning with the taxable year ended December 31, 2004. We have retained CNL Lifestyle Company, LLC, as our Advisor to provide management, acquisition, advisory and administrative services.
GENERAL
Our principal business objectives include investing in and owning a diversified portfolio of real estate with a goal to preserve, protect and enhance the long-term value of those assets. We have built a portfolio of properties that we consider to be well-diversified by region, asset type and operator. As of March 10, 2011 we had a portfolio of 150 lifestyle properties, which when aggregated by initial purchase price was diversified as follows: approximately 23% in ski and mountain lifestyle, 21% in golf facilities, 14% in senior living, 16% in attractions, 7% in marinas and 19% in additional lifestyle properties. These assets consist of 22 ski and mountain lifestyle properties, 53 golf facilities, 29 senior living, 21 attractions, 17 marinas and eight additional lifestyle properties. Thirty seven of these 150 properties are owned through unconsolidated entities. As of December 31, 2010, we had 122 properties, of which 89 consolidated properties were subject to long-term triple-net leases to single tenant operators (fully occupied) with a weighted-average lease rate of 8.8% and average lease expiration of 17 years. This rate is based on the weighted-average annualized straight-lined base rent due under our leases.
Economic and Market Trends
Although the U.S economy has shown signs of recovery, concerns continue to exist over the general economic conditions including unemployment rates, the effects of unrest in the Middle East and rising oil prices, inflationary risks, rising costs, and a lack of consumer confidence. In addition, the availability of debt continued to be limited and when available, we have seen an increase in the cost of borrowing over historical rates, which we expect to continue. Across our portfolio, we have seen indications of recovery. Entering the 2010/2011 season, our ski resorts saw strong sales of season passes, with multiple resorts pacing ahead of prior year revenues and units sold. We have also noticed a slight rise in early bookings for events at certain golf and resort properties.
Our research indicates that consumers are still spending time and money on the type of lifestyle and leisure activities supported by our properties. The trend in “staycations”, which is generally defined as a period of time in which an individual or family engages in nearby leisure activities or takes regional day trips from their home to area attractions as opposed to taking destination or fly-to vacations, that emerged in 2008 continued into 2010. Even in a down market, spending on leisure pursuits continues. While certain consumers reduce their spending, they continue to seek leisure and recreational outlets to create memories with family and friends. We believe that many of our properties managed through the recession because of their accessible drive-to locations and the types of activities and experiences offered at a range of affordable price points. This is evidenced by the generally sustained or only modest decreases in visitation levels, on average across our portfolio. See “Asset Classes and Industry Trends” below for additional information about recent trends impacting the industries in which we operate.
Our total assets were approximately 25% leveraged at December 31, 2010, with approximately 85% of our debt comprised of long-term, fixed-rate mortgage loans (including amounts which are effectively fixed through the use of interest rate swaps). We expect to see greater availability of debt financing in the next 12 months,
43
Table of Contents
however, at increasing borrowing rates. The limited availability of debt continued to create challenges for our tenants during 2010, especially those operators with seasonal business that have historically relied on working capital from lenders or capital partners during their off season.
We continue to monitor the economic environment, capital markets and the financial stability of our tenants in an effort to mitigate the impact of any negative trends. We cannot predict the extent to which these trends will continue, worsen or improve or the timing and nature of any changes to the macroeconomic environment, including the impact it may have on our future results of operations and cash flows. In response to the economic and market pressures, we have focused on liquidity, maintained a strong balance sheet with significant cash balances and low leverage, proactively monitored tenant performance, restructured tenant leases and terminated tenant relationships when necessary and strengthened relationships with key constituents including tenants and lenders. Going forward, we will focus on asset management in order to drive income and capitalize on the economic recovery.
We have, and intend to maintain, a low leverage ratio. Our conservative lease structures generally require security deposits and include cross-default provisions when multiple properties are leased to a single tenant. Our leases also provide inflationary protection through scheduled increases in base rent over the term as well as additional rents due based on a percentage of gross revenues at the properties.
Asset Class and Industry Trends
Although we primarily lease our properties to tenant operators that bear the primary variability in property performance and net operating results, certain economic and industry trends that impact our tenants’ operations can ultimately impact our operating performance. For example, positive growth in visitation and per capita spending may result in our receipt of additional percentage rent and declines may impact our tenants’ ability to pay rent to us.
Ski and Mountain Lifestyle. According to the National Ski Area Association (NSAA) and the Kottke National End of Season Survey 2009/10, the U.S. ski industry recorded an exceptional snow year with 59.8 million ski and snowboard visits for the 2009/10 ski season, representing the second best season ever and only 1.2% below the all time record of 60.5 million visits in 2007/08. On average, our ski resorts finished the winter season for 2009/2010 with skier visits totaling 5.5 million, or 2.5% below the previous year. Entering the 2010/2011 ski season, our resorts saw strong sales of season passes, with multiple resorts pacing ahead of prior year revenues and units sold. As of the date of this filing, and although the 2010/11 season is not completed, we have seen revenue per visit trends improve over the 2009/10 season, largely attributed to favorable snow conditions and an improvement in the U.S. economy with visitors increasing discretionary spending on retail items and food and beverage, in addition to “core” revenue areas including lift tickets, ski and snowboard rentals, and ski school. The trend experienced during the past two ski seasons that saw regional destination and day ski resorts prosper to a greater extent than fly-to destination resorts continues to affect the U.S. ski industry in general, as well as our ski and Mountain lifestyle portfolio. As our portfolio continues to be heavily weighted toward regional and day ski resorts located near large drive-to markets, we are well positioned to continue benefitting from this trend.
Golf. According to Golf Datatech, one of the industry’s leading providers of information, reported total rounds played in the U.S. for the twelve month period ended December 2010 was down by 2.3% from the same period in 2009. The National Golf Foundation (“NFG”) continues to expect the net supply of facilities (openings less closures) to decline until the supply and demand reach equilibrium. Our golf facilities experienced a decrease in total rounds played by 3.4% compared to the same period in 2009. Although, we have seen slight improvements in private clubs, we believe unfavorable weather patterns and high unemployment contributed to the decline in rounds played.
Attractions. Our properties include regional gated amusement parks and water parks that generally draw most of their visitation from local markets. Regional and local attractions have historically been somewhat resistant to recession, with inclement weather being a more significant factor impacting attendance. Our portfolio on average experienced an increase in revenue and per capita spending of 3.4% and 10.5%, respectively, over prior year. According to the most recent IBIS World Industry Report for “Amusement & Themeparks in the US” released in November 2010, revenues at domestic parks are expected to grow by an average annual rate of
44
Table of Contents
3.1% through 2015. Based on these trends and industry research we believe that the attraction properties in our portfolio have the potential for long term growth and revenue generation.
Marinas. According to the September 2010 IBIS World Industry Report on “Marinas in the US”, the industry is highly fragmented, with 93% of companies employing fewer than 20 people. Therefore, the industry has a large number of small, locally operated and owned establishments. High barriers to entry limit the supply of competing properties and demand is projected to rise as the number of boat sales increase. Common industry drivers are boat ownerships, slip rental, and occupancy. Marina operators are affected by government regulations, rising fuel prices, and general economic conditions. During 2010, we added six properties to our portfolio for a total of 17 marinas which are located primarily in the West, Southeast, Great Lakes and Mid Atlantic regions. According to IBIS World, the industry is relatively mature and revenue is forecasted to grow by approximately 0.9% per year through 2015. The report also indicates that the economic recession has had a relatively limited impact on the industry, as revenues were projected to fall approximately 0.3% in 2010 over 2009 to $3.88 billion.
Effects of Recent Trends on Our Portfolio
Lease Terminations. As noted above, although visitation at our properties has generally been sustained or slightly changed, some of our tenants continued to experience operating challenges and limited ability to obtain working capital from lenders or capital partners. While PARC Management (“PARC”) was current on its contractual scheduled rent payments to us through September 30, 2010 and reported improved property-level performance over the prior year, its management continued to experience working capital issues and defaulted on its leases and loan obligations to us in October 2010. As a result, we terminated our leases with PARC and transitioned the properties to new third-party operators effective on or before February 2011. In connection with this transition, we recorded a loss on lease terminations for the year ended December 31, 2010 totaling approximately $53.7 million, which includes the write-offs and expenses of approximately $5.5 million in intangible lease assets, approximately $14.6 million in lease incentives, approximately $18.4 million in deferred rents and approximately $15.2 million in lease termination payments. In addition, we recorded a loan loss provision of approximately $4.1 million related to the notes receivable and accrued interest, which were deemed uncollectible. For the year ended December 31, 2010, we also terminated our lease on an additional lifestyle property and recorded loss on lease termination of approximately $1.8 million. Going forward, the rental income that was previously recorded under the operating leases will be replaced by the operating revenues and expenses of the properties in our consolidated statements of operations until new leases are entered into. Our operating results will experience seasonal fluctuations on these attraction properties resulting in losses during the winter months due to closure of the properties and income during their profitable summer months.
We continue to have concentrations of credit risk with our EAGLE and Boyne tenants, which, individually accounted for 10% or more of our total revenue for the years ended December 31, 2010, 2009 and 2008, and we continuously monitor the property performance and health of these operators. The failure of any of these tenants to pay contractual lease payments could significantly impact our results of operations and cash flows from operations.
We continue to closely monitor the performance of all tenants, their financial strength and their ability to pay rent under the leases for our properties. Our asset managers review operating results and rent coverage compared to budget for each of our properties on a monthly basis, monitor the local and regional economy, competitor activity, and other environmental, regulatory or operating conditions for each property, make periodic site visits and engage in regular discussions with our tenants.
Impairments. We have been monitoring the performance of our two Great Wolf Lodge properties, which have had ongoing challenges due to the general economic conditions, local market conditions and competition over the past several years. During 2010, management determined that the property level performance was not recovering as originally anticipated and that it was no longer in our best interest to fund debt service on the non-recourse loans encumbering the properties at the current level without a modification of the existing terms. If we are unable to restructure the loans with more favorable terms, we may decide to deed the properties back to the lender in lieu of foreclosure to satisfy the non-recourse loans. As of the date of this filing, we continue our negotiation to modify the loan in an attempt to obtain more favorable terms. Due to these changes in circumstances, we evaluated the carrying values of the properties for impairment, and based on a probability weighted analysis of the estimated undiscounted cash flows under the potential scenarios and holding periods, we
45
Table of Contents
determined that the carrying value of the assets may not be recoverable. As a result, at September 30, 2010, we reduced the carrying values of the properties to the estimated fair value of approximately $58.9 million by recording an impairment provision in the amount of $24.2 million.
Also, during the year ended December 31, 2010, we determined that the carrying values of one golf property and one attractions property were not fully recoverable and recorded an impairment provision of approximately $2.7 million for the related assets.
We continue to believe that our properties have long-term value, and we will continue to manage our portfolio through these temporary and cyclical market conditions with a long-term view. Our portfolio contains unique, iconic or nonreplicable properties with long-established operating histories. The following information shows the average operating history of each of our operating asset classes based on the date the properties in our portfolio were first opened. Further, it demonstrates the longevity of these assets through a number of economic down-cycles during their operating history.
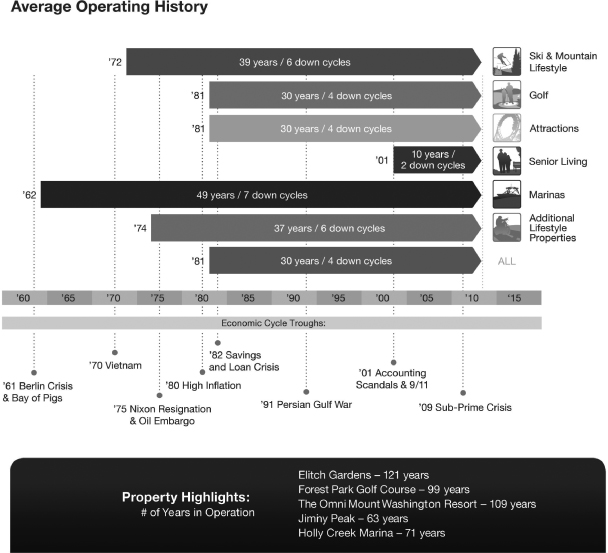
SOURCE: Economic Cycles as defined by the National Bureau of Economic Research. Average years of operation by property and asset class compiled from Schedule III as included in this filing on form 10-K.
46
Table of Contents
LIQUIDITY AND CAPITAL RESOURCES
General
During the year ended December 31, 2010, we focused on maintaining our liquidity and the preservation of capital. Our principal demand for funds during the short and long-term will be for property acquisitions and enhancements, payment of operating expenses, debt service and distributions to stockholders. Generally, our cash needs for items other than property acquisitions and enhancements are generated from operations and our existing investments. The sources of our operating cash flows are primarily driven by the rental income, net security deposits received from leased properties, property operating income for managed properties, interest payments on the loans we make, interest earned on our cash balances and distributions from our unconsolidated entities. A reduction in cash flows from any of these sources could result in the need to borrow more to maintain the same level of distributions or in a decrease in the level of distributions. In addition, we have a revolving line of credit of $85.0 million, of which $58.0 million was drawn as of December 31, 2010.
Going forward, we intend to make select property acquisitions within the parameters of our conservative investment policies with our cash on hand, the proceeds from our distribution reinvestment plan, our line of credit and other long-term debt financing. If sufficient funds are not raised, or if affordable debt is unavailable, it could limit our ability to make significant acquisitions.
We intend to continue to pay distributions to our stockholders on a quarterly basis. Operating cash flows are expected to continue to be generated from properties, loans and other permitted investments to cover a significant portion of such distributions and any temporary shortfalls are expected to be funded with cash borrowed under our line of credit. In the event that our properties do not perform as expected or our lenders place additional limitations on our ability to pay distributions, we may not be able to continue to pay distributions to stockholders or may need to reduce the distribution rate or borrow to continue paying distributions, all of which may negatively impact a stockholder’s investment in the long-term.
We believe that our current liquidity needs for operating expenses, debt service and cash distributions to stockholders will be adequately covered by cash generated from our investments and other sources of available cash. We believe that we will be able to refinance the majority of our debt as it comes due and will be exploring additional borrowing opportunities. The acquisition of additional real estate investments will be dependent upon the amount and pace of capital raised through our public offerings and our ability to obtain additional long-term debt financing.
Sources of Liquidity and Capital Resources
Common Stock Offering
Our main source of capital is from our common stock offerings. As of December 31, 2010, we had received approximately $3.0 billion (301.2 million shares) in total offering proceeds from all three offerings. During the period from January 1, 2011 through March 10, 2011, we received additional subscription proceeds of approximately $88.3 million (8.8 million shares).
The amount of capital raised through our public offerings for the years ended December 31, 2010, 2009 and 2008 was approximately $406.4 million, $293.3 million and $387.0 million, respectively, which represents an increase of 38.6% from 2010 compared to 2009 and a decrease of 24.2% from 2009 compared to 2008. We believe the increase was, in part, due to a slight improvement in the U.S economy. The decrease from 2009 as compared to 2008 resulted from impact of the economic downturn and increased competition in the unlisted REIT industry.
We do not intend to commence another public offering of our shares following the termination of our current public offering on April 9, 2011. However, we intend to continue offering shares through our
47
Table of Contents
reinvestment plan. In making this decision, the board of directors considered a number of factors, including the Company’s size and diversification of our portfolio and our relatively low leverage and strong cash position, as well as the current stage of our lifecycle.
Borrowings
We have borrowed and intend to continue to borrow money to acquire properties and to pay certain related fees and to cover periodic shortfalls between distributions paid and cash flows from operating activities. See “Distributions” below for additional information. In general, we have pledged our assets in connection with such borrowings. We have also borrowed, and may continue to borrow, money to pay distributions to stockholders in order to avoid distribution volatility. As discussed above, the availability of debt has been significantly restricted in the last two years due to the global economic downturn. The aggregate amount of long-term financing is not expected to exceed 50% of our total assets on an annual basis. As of December 31, 2010, our leverage ratio was 25% using our total indebtedness over our total assets.
As of December 31, 2010 and 2009, we had the following indebtedness (in thousands):
| December 31, 2010 |
December 31, 2009 |
|||||||
| Mortgages payable |
||||||||
| Fixed rate debt |
$ | 412,478 | $ | 416,527 | ||||
| Variable rate debt(1) |
138,666 | 145,861 | ||||||
| Sellers financing |
||||||||
| Fixed rate debt |
52,000 | 77,100 | ||||||
| Total mortgages and other notes payable |
603,144 | 639,488 | ||||||
| Line of credit |
58,000 | 99,483 | ||||||
| Total indebtedness |
$ | 661,144 | $ | 738,971 | ||||
FOOTNOTE:
| (1) | Amount includes variable rate debt of approximately $95.5 million and $103.0 million as of December 31, 2010 and 2009, respectively that has been swapped to fixed rates. |
On December 6, 2010, we restructured the mortgage loan collateralized by our multi-family residential property with an original principal balance of approximately $85.4 million to $66.4 million, under a troubled debt restructure. In connection with the restructure, Tranche B and C notes with a principal balance of $22.1 million were satisfied with a repayment of $6.0 million and the remaining balance was forgiven. The Tranche A was modified to an interest rate of LIBOR + 1.25% and the maturity was extended to January 2, 2016. At the same time, we terminated two interest rate swaps that were designated as cash flow hedges totaling $74.0 million with fixed interest rates of 5.805% to 6.0% and entered into a new interest rate swap of $57.3 million with a blended fixed rate of 3.12% for the term of the loan. The fair value of this instrument has been recorded as an asset of approximately $0.5 million as of December 31, 2010. Through the December 6, 2010 date of termination, we recorded the changes in the fair value of these interest rate swaps of approximately $9.0 million included in other comprehensive loss of which approximately $2.4 million relating to the ineffectiveness change in fair value and reduction in hedge liabilities resulting from the termination were reclassified and included in statements of operations as interest expense. In addition, we began amortizing the remaining approximately $6.6 million in other comprehensive loss over the remaining period of the loan since the originally forecasted payments are still probable of occurring. The troubled debt restructure resulted in a gain on extinguishment of debt of approximately $14.4 million or a gain in earnings of approximately $0.05 per share and is included in the accompanying consolidated statements of operations for the year ended December 31, 2010. Our management evaluated the residential property’s operating performance and based on the estimated current and projected operating cash flows, the property is not deemed impaired.
48
Table of Contents
In connection with the lease termination and settlement agreement with PARC as discussed above, the Company repaid the unsecured seller financing with the $10.0 million collateral provided in March 2010 and approximately $6.0 million in cash resulting in a gain in extinguishment of debt of approximately $0.9 million.
On November 1, 2010, in order to induce the special servicer of the loan pool to enter into discussions regarding a loan restructure, we elected not to make the scheduled loan payment, thereby defaulting under the non-recourse loan which had an outstanding principal balance of approximately $62.0 million as of that date. As a result, the loan may be accelerated at the option of the lender. As of the date of this filing, we continue our negotiation to modify the loan in an attempt to obtain more favorable terms; however, there can be no assurances that we will be successful in obtaining a modification of the loan terms. If we are successful in obtaining a modification of the loan, we may consider continuing to hold the properties long term. However, if we are unsuccessful in negotiating more favorable terms, we may decide that it is in our best interest to deed the properties back to the lender in lieu of foreclosure to satisfy the non-recourse loan.
See Note 12 “Mortgages and Other Notes Payable” and Note 13 “Line of Credit” to the accompanying consolidated financial statements in Item 8. for additional information including interest rates, maturity dates and other loan terms.
As of December 31, 2010, three of our loans require us to meet certain customary financial covenants and ratios, with which we were in compliance. Our other long-term borrowings are not subject to any significant financial covenants.
See also “Off Balance Sheet and Other Arrangements—Borrowings of Our Unconsolidated Entities” for a description of the borrowings of our unconsolidated entities.
Operating Cash Flows
Our net cash flows provided by operating activities was approximately $79.8 million for the year ended December 31, 2010 which consisted primarily of rental income from operating leases, property operating revenues, interest income on mortgages and other notes receivable, distributions from our unconsolidated entities and interest earned on cash balances offset by payments made for operating expenses including property operating expenses and asset management fees to our Advisor. Net cash flows provided by operating activities was approximately $62.4 million for the year ended December 31, 2009. The increase in operating cash flows of approximately $17.4 million or 27.9% as compared to the prior year is principally attributable to:
| • | A reduction in rent deferrals during 2010 as compared to 2009; |
| • | An increase in interest income received from mortgages and other notes receivable resulting from additional issuances of loans during 2010; |
| • | An increase in distributions received from our unconsolidated entities. In 2009, we contributed cash to the DMC Partnership to exercise our option to purchase the land under the DMC property, which increased our ownership in the partnership, offset, in part, by; |
| • | The incurrence of off-season carrying costs associated with the transition of the properties previously leased to PARC; |
| • | An increase in interest expenses on our borrowings due to our higher level of indebtedness; and |
| • | An increase in our operating expenses as a result of the increase in our total assets under management. |
Distributions from Unconsolidated Entities
As of December 31, 2010, we had investments in eight properties through unconsolidated entities. We are entitled to receive quarterly cash distributions from our unconsolidated entities to the extent there is cash
49
Table of Contents
available to distribute. For the years ended December 31, 2010 and 2009, we were declared operating distributions of approximately $12.8 million and $11.2 million, respectively, from the operation of these entities. These distributions are generally received within 45 days after each quarter end. We received cash distributions from our unconsolidated entities of approximately $12.7 million and $10.8 million for the years ended December 31, 2010 and 2009, respectively.
The following table summarizes the change in distributions declared to us from our unconsolidated entities (in thousands):
| For the year ended December 31, | ||||||||||||||||
| Period |
2010 | 2009 | $ Change | % Change | ||||||||||||
| DMC Partnership |
$ | 11,263 | $ | 10,427 | $ | 836 | 8.0 | % | ||||||||
| Intrawest Venture |
1,579 | 809 | 770 | 95.2 | % | |||||||||||
| Total |
$ | 12,842 | $ | 11,236 | $ | 1,606 | ||||||||||
The Retail Villages owned by the Intrawest Venture were impacted by the recession resulting in reduced cash distributions declared to us in 2009. During the year ended December 31, 2010, operating results at these properties began to improve, which resulted in greater distributions to us as compared to the same period in 2009. Distributions from the DMC Partnership increased as a result of additional capital we invested in the venture in August 2009 and the distribution preferences we have ahead of our partner in this investment.
Uses of Liquidity and Capital Resources
Acquisitions and Investments in Unconsolidated Entities
Since our inception we have used proceeds from our common stock offerings to acquire new properties, make additional capital improvements at existing properties, make and acquire loans and make investments in unconsolidated entities. During the year ended December 31, 2010, we acquired the following properties (in thousands).
| Property/Description |
Location | Date of Acquisition |
Purchase Price |
|||||||||
| Anacapa Isle Marina— One marina (leasehold interest) |
California | 3/12/2010 | $ | 9,829 | ||||||||
| Ballena Isle Marina— One marina (leasehold and fee interests) |
California | 3/12/2010 | 8,179 | |||||||||
| Cabrillo Isle Marina— One marina (leasehold interest) |
California | 3/12/2010 | 20,575 | |||||||||
| Ventura Isle Marina— One marina (leasehold interest) |
California | 3/12/2010 | 16,417 | |||||||||
| Bohemia Vista Yacht Basin— One marina (fee interest) |
Maryland | 5/20/2010 | 4,970 | |||||||||
| Hack's Point Marina— One marina (fee interest) |
Maryland | 5/20/2010 | 2,030 | |||||||||
| Pacific Park— One attraction (leasehold interest) |
California | 12/29/2010 | 34,000 | |||||||||
| Total | $ | 96,000 | ||||||||||
The properties above are subject to long-term triple-net leases with renewal options. In connection with the transactions, we paid approximately $81.0 million in cash, net of approximately $1.0 million deposit made in
50
Table of Contents
2009, excluding transaction costs, and assumed three existing loans collateralized by three properties, Anacapa Isle Marina, Cabrillo Isle Marina and Ventura Isle Marina, with an aggregate outstanding principal balance of approximately $14.0 million, which were recorded at their estimated fair values of approximately $13.6 million.
On January 10, 2011, we acquired an ownership interest in 29 senior living facilities (the “Communities”). We entered into agreements with US Assisted Living Facilities III, Inc., an affiliate of an institutional investor (“Seller”), and Sunrise Senior Living Investments, Inc. (“Sunrise”) to acquire the Communities through a new joint venture formed by us and Sunrise (the “Sunrise Venture”), valued at approximately $630.0 million. We acquired sixty percent (60%) of the membership interests in the Sunrise Venture for an equity contribution of approximately $134.3 million, including certain transactional and closing costs. Sunrise contributed cash and its interest in the previous joint venture with Seller (the “Old Venture”) for a forty percent (40%) membership interest in the Sunrise Venture. The Sunrise Venture obtained $435.0 million in loan proceeds from new debt financing, a portion of which was used to refinance the existing indebtedness encumbering the Communities.
Mortgages and Other Notes Receivable, net
We use cash raised through our public offerings to make or acquire real estate related loans. As of December 31, 2010 and 2009, we had loans outstanding with carrying values of approximately $116.4 million and $145.6 million, respectively. During 2010, we collected $38.6 million in repayment of loans and made additional loans totaling approximately $14.9 million. As of December 31, 2010 and 2009, mortgages and other notes receivable consisted of the following (in thousands):
| December 31, | ||||||||
| 2010 | 2009 | |||||||
| Principal |
$ | 116,503 | $ | 140,228 | ||||
| Accrued interest |
2,347 | 2,628 | ||||||
| Acquisition fees, net |
1,750 | 2,956 | ||||||
| Loan origination fees, net |
(101 | ) | (172 | ) | ||||
| Loan loss provision |
(4,072 | ) | — | |||||
| Total carrying amount |
$ | 116,427 | $ | 145,640 | ||||
See Note 8, “Mortgages and Other Notes Receivable, net” to the accompanying consolidated financial statements in Item 8. for additional information including interest rates, maturity dates and other loan terms.
The following is a schedule of future maturities for all mortgages and other notes receivable (in thousands):
| 2011 |
$ | 93 | ||
| 2012 |
86,310 | |||
| 2013 |
4,112 | |||
| 2014 |
122 | |||
| 2015 |
134 | |||
| Thereafter |
20,673 | |||
| Total |
$ | 111,444 | (1) | |
FOOTNOTE:
| (1) | Amount is presented net of loan loss provision and a parcel of land with a fair value of $1.0 million to be deeded to us to satisfy a portion of the loan. |
51
Table of Contents
Distributions
We intend to pay distributions to our stockholders on a quarterly basis. The amount of distributions declared to our stockholders will be determined by our board of directors and is dependent upon a number of factors. See Item 5. “Market for Registrant’s Common Equity, Related Stockholder Matters and Issuer Purchases of Equity Securities”—“Distributions” for additional information.
Approximately 99.7% and 95.6% of the distributions for the years ended 2010 and 2009, respectively, constitute a return of capital for federal income tax purposes. Due to seasonality of rent collections, rent deferrals and other factors, the characterization of distributions declared for the year ended December 31, 2010 may not be indicative of the characterization of distributions that may be expected for the year ending December 31, 2011. No amounts distributed to stockholders are required to be or have been treated as a return of capital for purposes of calculating the stockholders’ return on their invested capital as described in our advisory agreement.
Common Stock Redemptions
The following details our redemptions for the year ended December 31, 2010 (in thousands except per share data).
| 2010 Quarters |
First | Second | Third | Fourth | Year to Date | |||||||||||||||
| Requests in queue |
1,324 | 1,387 | 2,263 | 3,043 | 1,324 | |||||||||||||||
| Redemptions requested |
1,981 | 1,746 | 1,583 | 1,372 | 6,682 | |||||||||||||||
| Shares redeemed: |
||||||||||||||||||||
| Prior period requests |
(1,200 | ) | (538 | ) | (540 | ) | (558 | ) | (2,836 | ) | ||||||||||
| Current period requests |
(594 | ) | (225 | ) | (226 | ) | (208 | ) | (1,253 | ) | ||||||||||
| Adjustments(1) |
(124 | ) | (107 | ) | (37 | ) | (54 | ) | (322 | ) | ||||||||||
| Pending redemption requests(2) |
1,387 | 2,263 | 3,043 | 3,595 | 3,595 | |||||||||||||||
| Average price paid per share |
$ | 9.73 | $ | 9.83 | $ | 9.79 | $ | 9.79 | $ | 9.77 | ||||||||||
| 2009 Quarters |
First | Second | Third | Fourth | Year to Date | |||||||||||||||
| Requests in queue |
— | — | 1,297 | 1,301 | — | |||||||||||||||
| Redemptions requested |
2,268 | 3,409 | 1,762 | 1,872 | 9,311 | |||||||||||||||
| Shares redeemed: |
||||||||||||||||||||
| Prior period requests |
— | — | (1,297 | ) | (1,173 | ) | (2,470 | ) | ||||||||||||
| Current period requests |
(2,268 | ) | (2,112 | ) | (461 | ) | (598 | ) | (5,439 | ) | ||||||||||
| Adjustments(1) |
— | — | — | (78 | ) | (78 | ) | |||||||||||||
| Pending redemption requests(2) |
— | 1,297 | 1,301 | 1,324 | 1,324 | |||||||||||||||
| Average price paid per share |
$ | 9.55 | $ | 9.58 | $ | 9.70 | $ | 9.35 | $ | 9.55 | ||||||||||
FOOTNOTES:
| (1) | This amount represents redemption request cancellations and other adjustments. |
| (2) | Requests that are not fulfilled in whole during a particular quarter will be redeemed on a pro rata basis pursuant to the redemption plan. |
The redemption price per share is based on the amount of time that the redeeming stockholder has held the applicable shares, but in no event is the redemption price greater than the price of shares sold to the public in our offerings.
In the event there are insufficient funds to redeem all of the shares for which redemption requests have been submitted, redemptions will occur on a pro rata basis at the end of each quarter, with the actual redemption
52
Table of Contents
occurring at the beginning of the next quarter. Stockholders whose shares are not redeemed due to insufficient funds in that quarter will have their requests carried forward and be honored at such time as sufficient funds exist. In such case, the redemption request will be retained and such shares will be redeemed before any subsequently received redemption requests are honored subject to certain priority groups for hardship cases. Redeemed shares are considered retired and will not be reissued.
In March 2010, we amended our redemption plan to provide clarity about the board of directors’ discretion in establishing the amount of redemptions that may be processed each quarter and to allow certain priority groups of stockholders with requests made pursuant to circumstances such as death, qualifying disability, bankruptcy or unforeseeable emergency to have their redemption requests processed ahead of the general stockholder population. In addition, our board of directors determined that we will redeem shares pursuant to the redemption plan of no more than $7.5 million per calendar quarter beginning in the second quarter of 2010. Our board of directors will continue to evaluate and determine the amount of shares to be redeemed based on what it believes to be in the best interests of the company and our stockholders, as the redemption of shares dilutes the amount of cash available to make acquisitions.
Stock Issuance Costs and Other Related Party Arrangements
Certain of our directors and officers hold similar positions with our Advisor and CNL Securities Corp. (the “Managing Dealer”), which is the managing dealer for our public offerings. Our chairman of the board indirectly owns a controlling interest in CNL Financial Group, LLC, the parent company of our Advisor and indirect parent of the Managing Dealer. These entities receive fees and compensation in connection with our stock offerings and the acquisition, management and sale of our assets. Amounts incurred relating to these transactions were approximately $72.4 million, $56.3 million and $69.0 million for the years ended December 31, 2010, 2009 and 2008, respectively. Of these amounts, approximately $5.6 million and $4.2 million is included in the due to affiliates line item in the accompanying consolidated balance sheets as of December 31, 2010 and 2009, respectively. Our Advisor and its affiliates are entitled to reimbursement of certain expenses and amounts incurred on our behalf in connection with our organization, offering, acquisitions, and operating activities. Reimbursable expenses for the years ended December 31, 2010, 2009 and 2008 were approximately $13.2 million, $13.3 million and $11.6 million, respectively.
Pursuant to the advisory agreement, we will not reimburse our Advisor for any amount by which total operating expenses paid or incurred by us exceed the greater of 2.0% of average invested assets or 25.0% of net income (the “Expense Cap”) in any expense year. For the expense years ended December 31, 2010, 2009 and 2008, operating expenses did not exceed the Expense Cap.
We also maintain accounts at a bank in which our chairman and vice-chairman serve as directors. We had deposits at that bank of approximately $5.3 million and $26.1 million as of December 31, 2010 and 2009, respectively.
CRITICAL ACCOUNTING POLICIES AND ESTIMATES
Consolidation. Our consolidated financial statements include the accounts of the Company and our wholly owned subsidiaries. All inter-company transactions, balances and profits have been eliminated in consolidation. In addition, we evaluate our investments in partnerships and joint ventures for consolidation based on whether we have a controlling interest, including those in which we have been determined to be a primary beneficiary of a variable interest entity (“VIE”) or meets certain criteria of a sole general partner or managing member in accordance with the Consolidation guidance of the Financial Accounting Standards Board (“FASB”) Accounting Standards Codification (“ASC”).
Effective January 1, 2010, we adopted the amended accounting guidance on consolidations as follows: (i) replaced the quantitative-based risks and rewards calculation for determining when a reporting entity has a
53
Table of Contents
controlling financial interest in a variable interest entity (“VIE”) with a qualitative approach focused on identifying which reporting entity has the power to direct the activities of a VIE that most significantly impact the entity’s economic performance and the obligation to absorb losses of the entity or the right to receive benefits from the entity and (ii) requires additional disclosures about a reporting entity’s involvement in VIEs. This consolidation guidance for VIEs also: (i) requires ongoing consideration, rather than only when specific events occur, of whether an entity is a primary beneficiary of a VIE; (ii) eliminates substantive removal rights consideration in determining whether an entity is VIE; and (iii) eliminates the exception for troubled debt restructurings as an event triggering reconsideration of an entity’s status as a VIE. The adoption of this guidance did not have a material impact on our financial position or results of operations.
The application of these accounting principles requires management to make significant estimates and judgments about our rights and our venture partners’ rights, obligations and economic interests in the related venture entities. For example, under this pronouncement, there are judgments and estimates involved in determining if an entity in which we have made an investment is a VIE and if so, if we are the primary beneficiary. This includes determining the expected future losses of the entity, which involves assumptions of various possibilities of the results of future operations of the entity, assigning a probability to each possibility and using a discount rate to determine the net present value of those future losses. A change in the judgments, assumptions and estimates outlined above could result in consolidating an entity that should not be consolidated or accounting for an investment on the equity method that should in fact be consolidated, the effects of which could be material to our the financial statements.
Investments in unconsolidated entities. The equity method of accounting is applied with respect to investments in entities for which we have determined that consolidation is not appropriate and we have significant influence. We record equity in earnings of the entities under the HLBV method of accounting. Under this method, we recognize income in each period equal to the change in our share of assumed proceeds from the liquidation of the underlying unconsolidated entities at depreciated book value. Under this method, in any given period, we could be recording more or less income than actual cash distributions received and more or less than what we may receive in the event of an actual liquidation.
Leases. Our leases are accounted for as operating leases. Lease accounting principles require management to estimate the economic life of the leased property, the residual value of the leased property and the present value of minimum lease payments to be received from the tenant in order to determine the proper lease classification. Changes in our estimates or assumptions regarding collectability of lease payments, the residual value or economic lives of the leased property could result in a change in lease classification and our accounting for leases.
Revenue recognition. For properties subject to operating leases, rental revenue is recorded on a straight-line basis over the terms of the leases. Additional percentage rent that is due contingent upon tenant performance thresholds, such as gross revenues, is deferred until the underlying performance thresholds have been achieved. Property operating revenues from managed properties, which are not subject to leasing arrangements, are derived from room rentals, food and beverage sales, ski and spa operations, golf operations, membership dues, ticket sales, concessions, waterpark and themepark operations and other service revenues. Such revenues, excluding membership dues, are recognized when rooms are occupied, when services have been performed, and when products are delivered. Membership dues are recognized ratably over the term of the membership period. For mortgages and other notes receivable, interest income is recognized on an accrual basis when earned, except for loans placed on non-accrual status, for which interest income is recognized when received. Any deferred portion of contractual interest is recognized on a straight-line basis over the term of the corresponding note. Loan origination fees charged and acquisition fees incurred in connection with the making of loans are recognized as interest income, and a reduction in interest income, respectively over the term of the notes.
Impairments. We test the recoverability of our directly-owned real estate whenever events or changes in circumstances indicate that the carrying value of those assets may be impaired. Factors that could trigger an
54
Table of Contents
impairment analysis include, among others: (i) significant underperformance relative to historical or projected future operating results; (ii) significant changes in the manner of use or estimated holding period of our real estate assets or the strategy of our overall business; (iii) a significant increase in competition; (iv) a significant adverse change in legal factors or an adverse action or assessment by a regulator, which could affect the value of our real estate assets; or (v) significant negative industry or economic trends. When such factors are present, we assess potential impairment by comparing estimated future undiscounted operating cash flows expected to be generated over the life of the asset and from its eventual disposition, to the carrying amount of the asset. In the event that the carrying amount exceeds the estimated future undiscounted operating cash flows, we would recognize an impairment provision to adjust the carrying amount of the asset to the estimated fair value. Fair values are generally determined based on incorporating market participant assumptions, discounted cash flow models and our estimates reflecting the facts and circumstances of each acquisition.
For investments in unconsolidated entities, management monitors on a continuous basis whether there are any indicators, including the underlying investment property operating performance and general market conditions, that the value of the investments in unconsolidated entities may be impaired. An investment’s value is impaired only if management’s estimate of the fair value of the investment is less than the carrying value of the investment and such difference is deemed to be other-than-temporary. To the extent an impairment has occurred, the loss would be measured as the excess of the carrying amount of the investment over the estimated fair value of the investment.
The estimated fair values of our unconsolidated entities are based upon a discounted cash flow model that includes all estimated cash inflows and outflows over the expected holding period. The discounted cash flow model contains significant judgments and assumptions including discount and capitalization rates and forecasted operating performance of the underlying properties. The capitalization rates and discount rates utilized in these models are based upon rates that we believe to be within a reasonable range of current market rates for the underlying properties.
Mortgages and other notes receivable. Mortgages and other notes receivable are recorded at the stated principal amounts net of deferred loan origination costs or fees. A loan is considered to be impaired when, based on current information and events, it is probable that we will be unable to collect all amounts due according to the contractual terms of the note. An allowance for loan loss is calculated by comparing the carrying value of the note to the estimated fair value of the underlying collateral. Increases and decreases in the allowance due to changes in the measurement of the impaired loans are included in the provision for loan loss not to exceed the original carrying amount of the loan. Interest income on performing loans is accrued as earned. Interest income on impaired loans is recognized as collected. The estimated fair market value of the underlying loan collateral is determined by management using appraisals and internally developed valuation methods. These models are based on a variety of assumptions. Changes in these assumptions could positively or negatively impact the valuation of our impaired loans.
Derivative instruments and hedging activities. We utilize derivative instruments to partially offset the effect of fluctuating interest rates on the cash flows associated with our variable-rate debt. We follow established risk management policies and procedures in our use of derivatives and do not enter into or hold derivatives for trading or speculative purposes. We record all derivative instruments on the balance sheet at fair value. On the date we enter into a derivative contract, the derivative is designated as a hedge of the exposure to variable cash flows of a forecasted transaction. The effective portion of the derivative’s gain or loss is initially reported as a component of other comprehensive income (loss) and subsequently recognized in the statement of operations in the periods in which earnings are impacted by the variability of the cash flows of the hedged item. Any ineffective portion of the gain or loss is reflected in interest expense in the statement of operations. Determining fair value and testing effectiveness of these financial instruments requires management to make certain estimates and judgments. Changes in assumptions could have a positive or negative impact on the estimated fair values and measured effectiveness of such instruments could in turn impact our results of operations.
55
Table of Contents
Accounting for property acquisitions. For each acquisition, we record the fair value of the land, buildings, equipment, intangible assets, including in-place lease origination costs and above or below market lease values, and any assumed liabilities on contingent purchase consideration. Fair value is defined as the exchange price that would be received for an asset or paid to transfer a liability in the principal or most advantageous market for the asset or liability in an orderly transaction between market participants on the measurement date. Fair values are determined based on incorporating market participant assumptions, discounted cash flow models and our estimates reflecting the facts and circumstances of each acquisition.
Mortgages and other notes payable. Mortgages and other notes payable are recorded at the stated principal amount and are generally collateralized by our lifestyle properties with monthly interest only and/or principal payments. A loan that is accounted for as a troubled debt restructure is recorded at the future cash payments, principal and interest, specified by the new terms. We have and may undergo a troubled debt restructuring if management determines that the underlying collateralized properties are not performing to meet debt service. In order to qualify as a troubled debt restructuring, the following must apply: (i) the underlying collateralized property value decreased as a result of the economic environment, (ii) transfer of asset (cash) to partially satisfy the loan has occurred and (iii) new loan terms decrease the interest rate and extend the maturity date. The difference between the future cash payments specified by the new terms and the carrying value immediately preceding the restructure is recorded as gain on extinguishment of debt. For the year ended December 31, 2010, we restructured one of our loans with a principal outstanding balance of approximately $85.4 million, repaid $6.0 million in cash and recorded a gain on extinguishment of debt of approximately $14.4 million resulting in a new outstanding balance of approximately $66.4 million, as of December 31, 2010.
Fair value of non-financial assets and liabilities. Effective January 1, 2009, we adopted a new fair value pronouncement for non-financial assets and liabilities such as real estate, intangibles, investments in unconsolidated entities and other long-lived assets, including the incorporation of market participant assumptions. Fair value is defined as the exchange price that would be received for an asset or paid to transfer a liability in the principal or most advantageous market for the asset or liability in an orderly transaction between market participants on the measurement dated. We generally determine fair value based on incorporating market participant assumptions, discounted cash flow models and our management’s estimates reflecting the facts and circumstances of each non-financial asset or liability. Consequently, the adoption of this guidance did not have a material impact.
Acquisition fees and costs. Effective January 1, 2009, we began expensing acquisition fees and costs in accordance with a new accounting pronouncement. Prior to this date, acquisition fees and costs were capitalized and allocated to the cost basis of the assets acquired in connection with a business combination. The adoption of this pronouncement had, and will continue to have, a significant impact on our operating results due to the highly acquisitive nature of our business. This pronouncement also causes a decrease in cash flows from operating activities, as acquisition fees and costs historically have been included in cash flows from investing activities, but are treated as cash flows from operating activities under this new pronouncement. The characterization of these acquisition fees and costs to operating activities in accordance with GAAP does not change the nature and source of how the amounts are funded and paid with proceeds from our public offerings. Upon the adoption of this pronouncement, we expensed approximately $5.9 million in acquisition fees and costs for acquisitions that were being pursued in 2008 but which did not close as of December 31, 2008. Additionally, we expensed approximately $14.1 million and $8.7 million in new acquisition fees and costs incurred during the years ended December 31, 2010 and 2009, respectively. We will continue to capitalize acquisition fees and costs incurred in connection with the making of loans, simple asset purchases and other investments not subject to this pronouncement.
IMPACT OF RECENT ACCOUNTING PRONOUNCEMENTS
See Item 8. “Financial Statements and Supplementary Data” for additional information about the impact of recent accounting pronouncements.
56
Table of Contents
RESULTS OF OPERATIONS
General Trends and Effects of Seasonality
As of December 31, 2010 and 2009, we owned 122 and 115 properties directly and indirectly, of which 90 and 99 were 100% leased under long-term triple-net leases and eight were owned through unconsolidated joint ventures for both periods, respectively. Fifteen and six were operated by third-party managers under management contracts, excluding the nine properties that were previously leased to PARC that were subsequently transitioned to new third-party managers as of March 10, 2011. In addition, we had one property held for development as of December 31, 2010 and 2009, respectively.
Certain of our properties are operated seasonally due to geographic location, climate and weather patterns. Generally, the effect of seasonality will not significantly affect our recognition of base rental income from operating leases due to straight-line revenue recognition in accordance with GAAP. However, seasonality does impact the timing of when base rent payment is made by our tenants which impacts our operating cash flows, the amount of rental revenue we recognize in connection with capital improvement reserve revenue and other percentage rents paid by our tenants, which is recognized in the period in which it is earned and is generally based on a percentage of tenant revenues. In addition, seasonality directly impacts properties where we engage third-party operators to manage on our behalf resulting from lease terminations and began recording the property’s operating revenues and expenses. These properties will likely generate net operating losses during their non-peak months while generating most, if not all, of their net operating income during their peak season. Our consolidated operating results will fluctuate quarter to quarter depending on the number and types of properties being managed by third-party operators and seasonal results of properties instead of base rental income from operating leases.
57
Table of Contents
The following table summarizes our operations for the years ended December 31, (in thousands except per share data):
| Year Ended December 31, | % Change 2010 vs 2009 |
% Change 2009 vs 2008 |
||||||||||||||||||
| 2010 | 2009 | 2008 | ||||||||||||||||||
| Revenues: |
||||||||||||||||||||
| Rental income from operating leases |
$ | 202,029 | $ | 205,247 | $ | 203,031 | (1.6 | )% | 1.1 | % | ||||||||||
| Property operating revenues |
86,567 | 35,246 | — | 145.6 | % | n/a | ||||||||||||||
| Interest income on mortgages and other notes receivable |
15,832 | 12,778 | 7,384 | 23.9 | % | 73.0 | % | |||||||||||||
| Total revenues |
304,428 | 253,271 | 210,415 | 20.2 | % | 20.4 | % | |||||||||||||
| Expenses: |
||||||||||||||||||||
| Property operating expenses |
79,365 | 34,665 | — | 128.9 | % | n/a | ||||||||||||||
| Asset management fees to advisor |
26,808 | 25,075 | 21,937 | 6.9 | % | 14.3 | % | |||||||||||||
| General and administrative |
14,242 | 13,935 | 14,003 | 2.2 | % | (0.5 | )% | |||||||||||||
| Ground lease and permit fees |
12,589 | 11,561 | 9,477 | 8.9 | % | 22.0 | % | |||||||||||||
| Acquisition fees and costs |
14,149 | 14,616 | — | (3.2 | )% | n/a | ||||||||||||||
| Other operating expenses |
2,528 | 9,548 | 8,943 | (73.5 | )% | 6.8 | % | |||||||||||||
| Bad debt expense |
2,315 | 2,313 | 328 | 0.1 | % | 605.2 | % | |||||||||||||
| Loan loss provision |
4,072 | — | — | n/a | n/a | |||||||||||||||
| Loss on lease terminations |
55,528 | 4,506 | — | 1132.3 | % | n/a | ||||||||||||||
| Impairment provision |
26,880 | — | — | n/a | n/a | |||||||||||||||
| Depreciation and amortization |
126,223 | 124,040 | 98,149 | 1.8 | % | 26.4 | % | |||||||||||||
| Total expenses |
364,699 | 240,259 | 152,837 | 51.8 | % | 57.2 | % | |||||||||||||
| Operating income (loss) |
(60,271 | ) | 13,012 | 57,578 | (563.2 | )% | (77.4 | )% | ||||||||||||
| Other income (expense): |
||||||||||||||||||||
| Interest and other income |
2,759 | 2,676 | 5,718 | 3.1 | % | (53.2 | )% | |||||||||||||
| Interest expense and loan cost amortization |
(50,616 | ) | (40,638 | ) | (32,076 | ) | (24.6 | )% | (26.7 | )% | ||||||||||
| Gain on extinguishment of debt |
15,261 | — | — | n/a | n/a | |||||||||||||||
| Equity in earnings of unconsolidated entities |
10,978 | 5,630 | 3,020 | 95.0 | % | 86.4 | % | |||||||||||||
| Total other expense |
(21,618 | ) | (32,332 | ) | (23,338 | ) | 33.1 | % | 38.5 | % | ||||||||||
| Income (loss) from continuing operations |
(81,889 | ) | (19,320 | ) | 34,240 | (323.9 | )% | (156.4 | )% | |||||||||||
| Discontinued operations |
— | — | 2,396 | n/a | n/a | |||||||||||||||
| Net income (loss) |
$ | (81,889 | ) | $ | (19,320 | ) | $ | 36,636 | (323.9 | )% | (152.7 | )% | ||||||||
| Earnings (loss) per share of common stock (basic and diluted) |
||||||||||||||||||||
| Continuing operations |
$ | (0.31 | ) | $ | (0.08 | ) | $ | 0.16 | (287.5 | )% | (150.0 | )% | ||||||||
| Discontinued operations |
$ | — | $ | — | $ | 0.01 | n/a | n/a | ||||||||||||
| $ | (0.31 | ) | $ | (0.08 | ) | $ | 0.17 | (287.5 | )% | (147.1 | )% | |||||||||
| Weighted average number of shares of common stock outstanding (basic and diluted) |
263,516 | 235,873 | 210,192 | |||||||||||||||||
58
Table of Contents
Year ended December 31, 2010 vs. Year ended December 31, 2009
Rental income from operating leases. Overall, we experienced a decrease of 1.6% in rental income for the year ended December 31, 2010 as compared to 2009. The decrease in rental income is attributable to the lease terminations offset, in part, by recently acquired properties and capital expansion projects that have increased the lease basis and base rents for certain of our properties.
The following information summarizes trends in rental income from operating leases in relation to the timing and number of our property acquisitions (in thousands):
| Properties Subject to Operating Leases |
Number of Properties |
Total Rental Income (in thousands) for the Year Ended December 31, |
Percentage of Total 2010 Rental Income |
Percentage of Total 2009 Rental Income |
Percentage of Total Increase (Decrease) in Rental Income |
|||||||||||||||||||
| 2010 | 2009 | |||||||||||||||||||||||
| Acquired prior to 2009(1) |
81 | $ | 150,170 | $ | 150,539 | 74.3 | % | 73.3 | % | (11.5 | )% | |||||||||||||
| Acquired in 2009(1) |
2 | 7,210 | 5,230 | 3.6 | % | 2.5 | % | 61.5 | % | |||||||||||||||
| Acquired in 2010(1) |
7 | 6,997 | — | 3.5 | % | 0.0 | % | 217.4 | % | |||||||||||||||
| Terminated leases(2) |
21 | 37,652 | 49,478 | 18.6 | % | 24.2 | % | (367.4 | )% | |||||||||||||||
| Total |
111 | $ | 202,029 | $ | 205,247 | 100.0 | % | 100.0 | % | 100.0 | % | |||||||||||||
FOOTNOTES:
| (1) | The numbers only include our consolidated properties operated under long-term triple-net leases and our multi-family residential property. |
| (2) | This represents rental income on properties prior to the lease terminations. |
As of December 31, 2010 and 2009, the weighted-average lease rate for our portfolio of leased properties was 8.8% and 8.9%, respectively. These rates are based on annualized straight-lined base rent due under our leases and the weighted-average contractual lease basis of our real estate investment properties subject to operating leases. The decrease is primarily a result of reduced rents on certain properties and 18 lease terminations in 2010. Additionally, the weighted-average lease rate of our portfolio will fluctuate based on our asset mix, timing of property acquisitions, lease terminations and reductions in rent granted to tenants.
Property operating revenues. Property operating revenues from managed properties, which are not subject to leasing arrangements, are derived from room rentals, food and beverage sales, ski and spa operations, golf operations, membership dues, ticket sales, concessions, waterpark and themepark operations and other service revenues. Property operating revenues totaled $86.6 million and $35.2 million for the years ended December 31, 2010 and 2009, respectively, and are not directly comparable. For the year ended December 31, 2010, we recorded the operating results of three properties for a full year that operated for only a partial year in 2009 as well as eight properties for one month during 2010 which were leased in 2009. In addition, we began recording the operations of two properties that were previously unconsolidated and owned by the Wolf Partnership that we began consolidating effective August 6, 2009 upon our acquisition of our former partner’s interest in that partnership.
Interest income on mortgages and other notes receivable. For the years ended December 31, 2010 and 2009, we earned interest income of approximately $15.8 million and $12.8 million, respectively, on our performing loans with an aggregate principal balance of approximately $111.4 million and $140.2 million as of December 31, 2010 and 2009, respectively. The increase is attributable to loans made by us subsequent to December 31, 2009, offset, in part, by the three loans that were deemed uncollectible in connection with PARC’s lease terminations for which no interest income was recorded during fourth quarter of 2010.
59
Table of Contents
Property operating expenses. Property operating expenses from managed properties are derived from the operations as discussed above. For the years ended December 31, 2010 and 2009, property operating expenses were approximately $79.4 million and $34.7 million, respectively, and are not directly comparable. See “Property operating revenues” above for further information.
Asset management fees to advisor. Monthly asset management fees of 0.08334% of invested assets are paid to the Advisor for the acquisition of real estate assets and making loans. For the years ended December 31, 2010 and 2009, asset management fees to our advisor were approximately $26.8 million and $25.1 million, respectively. The increase in such fees is due to the acquisition of additional real estate properties and loans made.
General and administrative. General and administrative expenses totaled approximately $14.2 million and $13.9 million for the years ended December 31, 2010 and 2009, respectively. The increase is primarily due to an increase in legal and professional services, offset, in part, by a reduction in accounting, legal and administrative personnel charges.
Ground leases and permit fees. Ground lease payments, concession holds and land permit fees are generally based on a percentage of gross revenue of the underlying property over certain thresholds and are paid by the tenants in accordance with the terms of our triple-net leases with those tenants. These expenses have corresponding equivalent revenues included in rental income above. For the years ended December 31, 2010 and 2009, ground lease, concession holds and land permit fees were approximately $12.6 million and $11.6 million, respectively. The increase is attributable to the growth of our property portfolio offset against the reduction in gross revenue of certain underlying properties reducing ground lease and permit fees.
Acquisition fees and costs. Effective January 1, 2009, we began expensing acquisition fees and costs as a result of a newly issued accounting standard. Upon adoption of the new standard on January 1, 2009, we were required to initially expense approximately $5.9 million in acquisition fees and costs that were incurred prior to December 31, 2008 and capitalized on our balance sheet. Acquisition fees and costs incurred for the years ended December 31, 2010 and 2009 were approximately $14.1 million and $14.6 million, of which approximately $8.7 million for the year ended December 31, 2009, was unrelated to the initial adoption of the new standard.
Other operating expenses. Other operating expenses totaled approximately $2.5 million and $9.5 million for the years ended December 31, 2010 and 2009, respectively. The decrease is partially due to a reduction in the additional purchase price consideration expense recorded in 2009 relating to the acquisition of Wet’n’Wild Hawaii. During 2010, the operating income of the property did not exceed certain performance threshold resulting in a reduction in the estimated contingent purchase consideration to be paid of $1.5 million from the $3.5 million recorded for the year ended December 31, 2009. In addition, the decrease is a result of lower repairs and maintenance incurred. Capital expenditures are made from the capital improvement reserve accounts for replacements, refurbishments, repairs and maintenance at our properties. Certain expenditures, which do not substantially enhance the property value or increase the estimated useful lives, cannot be capitalized and are expensed.
Bad debt expense. Bad debt expense was approximately $2.3 million for both years ended December 31, 2010 and 2009 resulting from the write-off of past due rents receivable that were deemed uncollectible from tenants whose leases have been terminated.
Loan loss provision. Loan loss provision was approximately $4.1 million for the year ended December 31, 2010 as a result of the notes receivable from PARC that were deemed uncollectible. See “General”—“Economic and Market Trends” above for additional information.
Loss on lease terminations. Loss on lease terminations were approximately $55.5 million and $4.5 million for the years ended December 31, 2010 and 2009, respectively. The increase is due to the recording of lease
60
Table of Contents
terminations relating to eighteen properties that were previously leased to PARC during 2010, as discussed above, compared to the three properties for which leases were terminated in 2009.
Impairment provision. We recorded an impairment provision totaling approximately $26.9 million for the year ended December 31, 2010 on the two Great Wolf properties, one golf property and one attraction property. See “General”—“Asset Class and Industry Trends” above for additional information. Prior to January 1, 2010, we had not recorded any impairment provisions.
Depreciation and amortization. Depreciation and amortization expenses were approximately $126.2 million and $124.0 million for the years ended December 31, 2010 and 2009, respectively. The increase is primarily due to the acquisition of real estate properties in 2009 of which partial depreciation and amortization were recognized as compared to a full year in 2010 coupled with acquisition of additional real estate properties in 2010.
Interest and other income. Interest and other income totaling approximately $2.8 million and $2.7 million for the years ended December 31, 2010 and 2009, respectively, and was consistent.
Interest expense and loan cost amortization. Interest expense and loan cost amortization were approximately $50.6 million and $40.6 million for the years ended December 31, 2010 and 2009, respectively. The increase is attributable to the increase in our borrowings. In addition, in March 2010, we wrote off the remaining unamortized loan costs from our previous line of credit as a result of obtaining a new line of credit.
Gain on extinguishment of debt. Gain on extinguishment of debt was approximately $15.3 million for the year ended December 31, 2010 resulting from the restructuring of one of our debts with a principal balance of approximately $85.4 million and the repayment of seller financing to PARC at a discount resulting in approximately $0.9 million gain. We had no debt restructures in 2009. See “Borrowings” above for additional information.
Equity in earnings of unconsolidated entities. The following table summarizes equity in earnings from our unconsolidated entities (in thousands):
| For the Year Ended December 31, | ||||||||||||||||
| 2010 | 2009 | $ Change | % Change | |||||||||||||
| Wolf Partnership |
$ | — | $ | (2,657 | ) | $ | 2,657 | 100.0 | % | |||||||
| DMC Partnership |
10,775 | 9,931 | 844 | 8.5 | % | |||||||||||
| Intrawest Venture |
203 | (1,644 | ) | 1,847 | 112.3 | % | ||||||||||
| Total |
$ | 10,978 | $ | 5,630 | $ | 5,348 | ||||||||||
Equity in earnings is recognized using the HLBV method of accounting due to the preferences we receive upon liquidation, which means we recognize income in each period equal to the change in our share of assumed proceeds from the liquidation of the underlying unconsolidated entities at depreciated book value. Because our equity in earnings is calculated in this manner, we have historically recognized more income than the underlying unconsolidated entities have generated and our partners have historically been allocated losses to offset the amount of earnings that we have recorded over and above the net income generated from the entities. This will continue until our partner’s capital has been reduced to zero, at which point no further losses can be allocated to our partners.
Equity in earnings of unconsolidated entities increased by approximately $5.3 million for the year ended December 31, 2010, as compared to 2009, primarily due to our acquisition of the remaining interest in the
61
Table of Contents
Wolf Partnership in August 2009 which resulted in the consolidation of these properties’ operations and no longer reporting its operating results within equity in earnings. In addition, during 2009, we increased our ownership interest in the DMC Partnership which resulted in an increase in our allocation of income due to our distribution preferences and how such preferences impact income allocations under HLBV method of accounting. Operating results for the Intrawest Venture showed improvement as a result of increased rents resulting from an increase in consumer spending at the properties.
We received cash distributions from our unconsolidated entities of approximately $12.7 million and $10.8 million for the years ended December 31, 2010 and 2009, respectively.
Net income (loss) and earnings (loss) per share of common stock. The increase in net loss and loss per share for the year ended December 31, 2010 as compared to 2009 was attributable to (i) the recording of an impairment provisions on two Great Wolf properties, one golf property and one attraction property, (ii) losses recorded on the lease terminations and loan impairments relating to our attractions properties leased to PARC, (iii) an increase in interest expense from additional borrowings and depreciation expense in the current year as a result of acquisitions of properties, offset, in part, by (iv) an increase in net operating income from properties that are being operated by third-party management companies that were leased in the prior year and (v) gain on extinguishment of debt from the restructuring of one of our debts and the repayment of seller financing.
Year ended December 31, 2009 vs. Year ended December 31, 2008
Rental income from operating leases. Overall, we experienced a 1.1% increase in rental income for the years ended December 31, 2009 as compared to the same period in 2008. The increase was attributable to properties newly acquired during 2008 and 2009, offset, in part, by lease restructures and the termination of leases for three properties.
The following information summarizes trends in rental income from operating leases in relation to the timing and number of our property acquisitions:
| Properties Subject to Operating Leases |
Number of Properties |
Total Rental Income (in thousands) for the Year Ended December 31, |
Percentage of Total 2009 Rental Income |
Percentage of Total 2008 Rental Income |
Percentage of Total Increase (Decrease) in Rental Income |
|||||||||||||||||||
| 2009 | 2008 | |||||||||||||||||||||||
| Acquired prior to 2008(1) |
85 | $ | 165,097 | $ | 177,398 | 80.4 | % | 87.4 | % | (555.1 | )% | |||||||||||||
| Acquired in 2008(1) |
15 | 31,348 | 12,677 | 15.3 | % | 6.2 | % | 842.5 | % | |||||||||||||||
| Acquired in 2009(1) |
2 | 5,231 | — | 2.5 | % | — | 236.1 | % | ||||||||||||||||
| Terminated leases(2) |
3 | 3,571 | 12,956 | 1.8 | % | 6.4 | % | (423.5 | )% | |||||||||||||||
| Total |
105 | $ | 205,247 | $ | 203,031 | 100.0 | % | 100.0 | % | 100.0 | % | |||||||||||||
FOOTNOTES:
| (1) | The numbers only include our consolidated properties operated under long-term triple-net leases and our multi-family residential property. |
| (2) | This represents rental income on two golf properties and one additional lifestyle property prior to the lease termination at which point we began recording the properties’ operating revenues and expenses in place of rental income. |
As of December 31, 2009 and 2008, the weighted-average lease rate for our portfolio of leased properties was 8.9% and 9.0%, respectively. These rates are based on annualized straight-lined base rent due under our leases and the weighted-average contractual lease basis of our real estate investment properties subject to operating leases. The decrease was primarily a result of reduced rents on certain properties and three lease
62
Table of Contents
terminations. Additionally, the weighted-average lease rate of our portfolio will fluctuate based on our asset mix, timing of property acquisitions, lease terminations and reductions in rent granted to tenants.
Property operating revenues. Property operating revenues totaled approximately $35.2 million for the year ended December 31, 2009 and are not directly comparable. For the year ended December 31, 2009, we recorded the operating results of three properties that are operated by third-party management companies as a result of lease terminations and were previously accounted for as operating leases. In addition, we began recording the operations of two properties that were previously unconsolidated and owned by the Wolf Partnership that we began consolidating effective August 6, 2009 upon our acquisition of our former partner’s interest in that partnership. Prior to January 1, 2009, there were no lease terminations.
Interest income on mortgages and other notes receivable. For the year ended December 31, 2009, we earned interest income of approximately $12.8 million on our performing loans with an aggregate principal balance of approximately $140.2 million. Comparatively, for the year ended December 31, 2008, we recorded interest income of approximately $7.4 million on our performing loans with an aggregate principal balance of approximately $129.7 million. The increase was attributable to partial interest income recognized on loans made by us during the year ended December 31, 2008 as compared to full year during 2009 coupled with new loans made by us during the year ended December 31, 2009.
Property operating expenses. For the year ended December 31, 2009, property operating expenses were approximately $34.7 million and are not directly comparable. See “Property operating revenues” above for further information.
Asset management fees to advisor. Monthly asset management fees of 0.08334% of invested assets are paid to the advisor for the acquisition of real estate assets and making loans. For the years ended December 31, 2009 and 2008, asset management fees to our advisor were approximately $25.1 million and $21.9 million, respectively. The increase in such fees is due to the acquisition of additional real estate properties and loans made.
General and administrative. General and administrative expenses totaled approximately $13.9 million and $14.0 million for the years ended December 31, 2009 and 2008, respectively. The slight decrease was primarily due to cost control efforts in 2009.
Ground leases and permit fees. For the years ended December 31, 2009 and 2008, ground lease, concession holds and land permit fees were approximately $11.6 million and $9.5 million, respectively. The increase was attributable to the growth of our property portfolio and gross revenues at certain properties. As of December 31, 2009, 37 of our properties are subject to ground leases, concession holds or land permit fees, as compared to 36 properties in 2008.
Acquisition fees and costs. Effective January 1, 2009, we began expensing acquisition fees and costs as a result of a newly issued accounting standard. Upon adoption of the new standard on January 1, 2009, we were required to initially expense approximately $5.9 million in acquisition fees and costs that were incurred prior to December 31, 2008 and capitalized on our balance sheet. Acquisition fees and costs incurred for the year ended December 31, 2009 were approximately $14.6 million, of which approximately $8.7 million for the year ended December 31, 2009 was unrelated to the initial adoption of the new standard.
Other operating expenses. Other operating expenses totaled approximately $9.5 million and $8.9 million for the years ended December 31, 2009 and 2008, respectively. The increase was primarily a result of expensing approximately $3.5 million due to a change in estimate of contingent purchase consideration payable in connection with the acquisition of Wet’n’Wild Hawaii in 2009, offset by a decrease in repairs and maintenance expenses incurred. Capital expenditures are made from the capital improvement reserve accounts for replacements, refurbishments, repairs and maintenance at our properties. Certain expenditures, which do not substantially enhance the property value or increase the estimated useful lives, cannot be capitalized and are expensed.
63
Table of Contents
Bad debt expense. Bad debt expense was approximately $2.3 million and $0.3 million for the years ended December 31, 2009 and 2008, respectively. The increase was primarily due to the write-off of past due rents receivable that were deemed uncollectible from a tenant whose lease was terminated.
Loss on lease terminations. Loss on lease terminations was approximately $4.5 million for the year ended December 31, 2009 and was attributable to the termination of leases for three properties which are now operated by third parties under management contracts. Prior to January 1, 2009, there were no lease terminations.
Depreciation and amortization. Depreciation and amortization expenses were approximately $124.0 million and $98.1 million for the years ended December 31, 2009 and 2008, respectively. The increase was primarily due to the acquisition of real estate properties in 2008 of which partial depreciation and amortization were recognized as compared to a full year in 2009 coupled with acquisition of additional real estate properties in 2009.
Interest and other income. Interest and other income totaled approximately $2.7 million and $5.7 million for the years ended December 31, 2009 and 2008, respectively. The decrease primarily resulted from a general reduction in rates paid by depository institutions on short-term deposits during 2009 as compared to 2008. We continue to monitor depository institutions that hold our cash and cash equivalents. During 2009, we received an average yield of 0.8% as compared to an average yield of 2.4% during 2008. Our average uninvested offering proceeds, based on month-end money market balances, was approximately $166.2 million during 2009 as compared to approximately $222.8 million during 2008.
Interest expense and loan cost amortization. Interest expense and loan cost amortization were approximately $40.6 million and $32.1 million for the years ended December 31, 2009 and 2008, respectively. The increase was attributable to the increase in our borrowings as a result of acquisitions and renovation of our properties and an increase in interest expense on our line of credit of which partial expense was recognized in 2008 compared to a full year in 2009. As of December 31, 2009, we had loan obligations totaling $739.0 million as compared to total loan obligations of $639.2 million at December 31, 2008.
Equity in earnings of unconsolidated entities. The following table summarizes equity in earnings (losses) from our unconsolidated entities (in thousands):
| For the Year Ended December 31, | ||||||||||||||||
| 2009 | 2008 | $ Change | % Change | |||||||||||||
| Wolf Partnership |
$ | (2,657 | ) | $ | (5,773 | ) | $ | 3,116 | 54.0 | % | ||||||
| DMC Partnership |
9,931 | 9,480 | 451 | 4.8 | % | |||||||||||
| Intrawest Venture |
(1,644 | ) | (687 | ) | (957 | ) | (139.3 | )% | ||||||||
| Total |
$ | 5,630 | $ | 3,020 | $ | 2,610 | ||||||||||
Equity in earnings increased by approximately $2.6 million for the year ended December 31, 2009, as compared to 2008, primarily due to a decrease in the loss we were allocated from the Wolf Partnership of approximately $3.1 million, mainly as a result of negotiated reduction in management and license fees of $1.8 million and because on August 6, 2009, we acquired all the remaining interest in the Wolf Partnership and began consolidating the properties operations. As a result, we recorded equity in losses from the Wolf Partnership through August 5, 2009 compared to a full year in 2008. In addition, the increase in equity in earnings was due to the allocation from the DMC Partnership of approximately $0.5 million, resulting from a reduction in ground rent after the partnership acquired a majority of the underlying land.
The Intrawest Venture was significantly impacted by a reduction in retail spending at its resort village retail locations, which is a direct result of the recent recession. While visitation at many of these locations did not decline, spending by consumers during their visits declined. We believe that operations at these properties will return to historical levels when the broader economy improves. Additionally, during the first quarter of 2009, the Intrawest Venture determined that it made certain accounting errors in 2008 which totaled approximately
64
Table of Contents
$0.4 million. We concluded that these errors were not material to our financial statements for the year ended December 31, 2009 or 2008. As such, we recorded the cumulative effect of these adjustments during the three months ended March 31, 2009, which resulted in a reduction in equity in earnings of unconsolidated entities of $0.4 million.
We received cash distributions from our unconsolidated entities of approximately $10.8 million and $14.9 million for the years ended December 31, 2009 and 2008, respectively.
Discontinued operations. For the year ended December 31, 2008, results of discontinued operations were approximately $2.4 million relating to the sale of the Talega Golf Course property, which was sold in December 2008.
Net income (loss) and earnings (loss) per share of common stock. The decrease in net income (loss) and earnings (loss) per share for the year ended December 31, 2009 as compared to the prior year was primarily due to (i) the reduction in rental income from certain of our properties, including those for which the leases were terminated and have been restructured offset by additional rent from properties acquired in 2008 and 2009, (ii) the adoption of a new pronouncement which requires the expensing of all acquisition fees and costs as operating costs, (iii) additional interest expense on our borrowings, and (iv) a reduction in the rates paid by depository institutions on short-term deposits offset by an increase in equity in earnings from unconsolidated entities. Our earnings and earnings per share may fluctuate while we continue to raise capital and make significant acquisitions.
OTHER
Funds from Operations and Modified Funds From Operations
FFO is a non-GAAP financial measure that is widely recognized in the REIT industry as a supplemental measure of operating performance. FFO is defined by the National Association of Real Estate Investment Trusts (“NAREIT”) as net income (loss) computed in accordance with GAAP, excluding gains or losses from sales of property, plus depreciation and amortization on real estate assets, and after adjustments for unconsolidated partnerships and joint ventures. FFO was developed by NAREIT as a relative measure of performance of an equity REIT in order to recognize that income-producing real estate has historically not depreciated on the basis as determined under GAAP, which implies that the value of real estate assets diminishes predictably over time. We believe that FFO is a useful measure that should be considered along with, but not as an alternative to, net income (loss) when evaluating operating performance.
In addition to FFO, we use MFFO, which further adjusts net income (loss) and FFO to exclude acquisition-related costs, impairments, contingent purchase price adjustments and other non-recurring charges in order to further evaluate our ongoing operating performance. Changes in the accounting and reporting rules under GAAP that have been put into effect since the establishment of NAREIT’s definition of FFO have increased the number of non-cash and non-operating items included in net income (loss) and FFO, which management consider to be more reflective of investing activities. For example, the accounting for acquisition costs and expenses have changed from a capitalize and depreciate model to expense as incurred. These costs are paid for with proceeds from our common stock offerings or debt proceeds rather than paid for with cash generated from operations. Similarly, recent accounting standards require us to estimate any future contingent purchase consideration at the time of acquisition and subsequently record changes to those estimates or eventual payments in the statement of operations even though the payment is funded by offering proceeds. Previously under GAAP, these amounts would be capitalized, which is consistent with how these incremental payments are added to the contractual lease basis used to calculate rent for the related property and generates future rental income. Impairments and other non-recurring non-cash write-offs are not indicative of ongoing results of operations. Therefore, we exclude these amounts in the computation of MFFO. By providing MFFO, we present information that we believe is more consistent with management’s long term view of our core operating activities and is more reflective of a stabilized asset base.
65
Table of Contents
We believe that in order to facilitate a clear understanding of our operating performance between periods and as compared to other equity REITs, FFO and MFFO should be considered in conjunction with our net income (loss) and cash flows as reported in the accompanying consolidated financial statements and notes thereto. FFO and MFFO (i) do not represent cash generated from operating activities determined in accordance with GAAP (which, unlike FFO or MFFO, generally reflects all cash effects of transactions and other events that enter into the determination of net income (loss)), (ii) are not necessarily indicative of cash flow available to fund cash needs and (iii) should not be considered as alternatives to net income (loss) determined in accordance with GAAP as an indication of our operating performance, or to cash flow from operating activities determined in accordance with GAAP as a measure of either liquidity or our ability to make distributions. FFO or MFFO as presented may not be comparable to amounts calculated by other companies.
The following table presents a reconciliation of net income (loss) to FFO and MFFO for the years ended December 31, 2010, 2009, and 2008 (in thousands except per share data):
| Year Ended December 31, | ||||||||||||
| 2010 | 2009 | 2008 | ||||||||||
| Net income (loss) |
$ | (81,889 | ) | $ | (19,320 | ) | $ | 36,636 | ||||
| Adjustments: |
||||||||||||
| Depreciation and amortization |
126,223 | 124,040 | 98,901 | |||||||||
| Gain on sale of real estate investment properties |
— | — | (4,470 | ) | ||||||||
| Net effect of FFO adjustment from unconsolidated entities(1) |
11,219 | 15,856 | 17,786 | |||||||||
| Total funds from operations |
55,553 | 120,576 | 148,853 | |||||||||
| Acquisition fees and expenses(2) |
14,149 | 14,616 | — | |||||||||
| Impairments of real estate assets |
26,880 | — | — | |||||||||
| Impairments of lease related investments |
21,347 | 569 | — | |||||||||
| Impairments of notes receivable |
4,072 | — | — | |||||||||
| Assumption of non-cash deferred charges in connection with lease terminations |
1,705 | 2,189 | — | |||||||||
| Contingent purchase price adjustments |
(1,500 | ) | 3,472 | — | ||||||||
| Modified funds from operations |
$ | 122,206 | $ | 141,422 | $ | 148,853 | ||||||
| Weighted average number of shares of common stock outstanding (basic and diluted) |
263,516 | 235,873 | 210,192 | |||||||||
| FFO per share (basic and diluted) |
$ | 0.21 | $ | 0.51 | $ | 0.71 | ||||||
| MFFO per share (basic and diluted) |
$ | 0.46 | $ | 0.60 | $ | 0.71 | ||||||
FOOTNOTES:
| (1) | This amount represents our share of the FFO adjustments allowable under the NAREIT definition (primarily depreciation) multiplied by the percentage of income or loss recognized under the HLBV method. |
| (2) | Acquisition fees and costs that were directly identifiable with properties acquired were not required to be expensed under GAAP prior to January 1, 2009. Accordingly, no adjustments to funds from operations are necessary for periods prior to 2009. |
Total FFO decreased from approximately $120.6 million for the year ended December 31, 2009 to approximately $55.6 million for the year ended December 31, 2010. FFO per share decreased from $0.51 per share for the year ended December 31, 2009 to $0.21 per share for the year ended December 31, 2010. The decrease in FFO and FFO per share are attributable principally to: (i) the recording of real estate impairments relating to the two Great Wolf properties, one golf property and one attraction property, (ii) the write-off of lease assets resulting from lease terminations which includes deferred rent and (iii) an increase in interest expense from additional borrowings, offset, in part, by an increase in net operating income from properties that are being
66
Table of Contents
operated by third-party management companies that were being leased in the prior year, a reduction in acquisition fees and costs and the restructuring of one of our mortgage debt resulting in a gain in extinguishment of debt.
MFFO decreased from approximately $141.4 million for the year ended December 31, 2009 to approximately $122.2 million for the year ended December 31, 2010. MFFO per share decreased from $0.60 per share for the year ended December 31, 2009 to $0.46 per share for the year ended December 31, 2010. The decrease in MFFO and MFFO per share are attributable principally to (i) the write-off of deferred rent and the incurrence of off-season carrying costs associated with the transition of the properties previously leased to PARC and (ii) an increase in interest expense from additional borrowings.
Total FFO decreased from approximately $148.9 million for the year ended December 31, 2008 to approximately $120.6 million for the year ended December 31, 2009. FFO per share decreased from $0.71 per share for the year ended December 31, 2008 to $0.51 per share for the year ended December 31, 2009. The decrease in FFO and FFO per share were attributable principally to (i) the reduction in rental income from certain of our properties, including those for which the leases were terminated and have been restructured, offset by, additional rent from properties acquired in 2008 and 2009, (ii) an increase in bad debt expense and the write-off of in-place lease intangibles related to terminated and restructured leases, (iii) the adoption of a new accounting pronouncement and expensing of acquisition fees and costs and (iv) additional interest expense paid on our borrowings.
MFFO decreased from approximately $148.9 million for the year ended December 31, 2008 to approximately $141.4 million for the year ended December 31, 2009. MFFO per share decreased from $0.71 per share for the year ended December 31, 2008 to $0.60 per share for the year ended December 31, 2009. The decrease in MFFO and MFFO per share was attributable to (i) the reduction in rental income from certain of our properties, including those for which the leases were terminated and have been restructured offset by additional rent from properties acquired in 2008 and 2009, (ii) an increase in bad debt expense and (iii) additional interest expense paid on our borrowings.
OFF BALANCE SHEET AND OTHER ARRANGEMENTS
We have investments in unconsolidated entities that own and lease commercial real estate: the DMC Partnership, in which we own an 81.9% interest, and the Intrawest Venture, in which we own an 80.0% interest. Our equity in earnings from unconsolidated entities for the years ended December 31, 2010, 2009 and 2008 contributed approximately $11.0 million, $5.6 million and $3.0 million, respectively, to our results of operations. The partnership agreements governing the allocation of cash flows from the entities provide for the annual payment of a preferred return on our invested capital and thereafter in accordance with specified residual sharing percentages. See also Item 8. “Financial Statements and Supplementary Data” for additional information about our unconsolidated entities.
As discussed above, we acquired an ownership interest in 29 senior living facilities through a new unconsolidated joint venture formed by us and Sunrise valued at approximately $630.0 million. We acquired sixty percent (60%) of the membership interests in the Sunrise Venture for an equity contribution of approximately $134.3 million, including certain transactional and closing costs. The Sunrise Venture obtained $435.0 million in mortgage financing, which is collateralized by the properties. The non-recourse loan has a three-year term and a fixed-interest rate of 6.76% requiring monthly interest-only payments with all principal due upon maturity. Under the terms of our venture agreement with Sunrise, we receive a preferred return on our invested capital for the first six years and share control over major decisions with Sunrise. Sunrise holds the option to buy out our interest in the venture in years three through six at a price which would provide us with a thirteen to fourteen percent internal rate of return.
67
Table of Contents
Borrowings of Our Unconsolidated Entities
The aggregate principal debt of our unconsolidated entities was approximately $207.8 million and $211.4 million as of December 31, 2010 and 2009, respectively. In connection with the loans encumbering properties owned by our unconsolidated entities, if we engage in certain prohibited activities, we could become liable for the obligations of the unconsolidated entities which own the properties for certain enumerated recourse liabilities related to those entities and their properties. In the case of the borrowing for the resort village properties located in Canada, our obligations are such that we could become liable for the entire loan if we triggered a default due to bankruptcy or other similar events.
COMMITMENTS, CONTINGENCIES AND CONTRACTUAL OBLIGATIONS
The following tables present our contractual obligations and contingent commitments and the related payments due by period as of December 31, 2010:
Contractual Obligations
| Payments Due by Period (in thousands) | ||||||||||||||||||||
| Less than 1 year |
Years 1-3(3) | Years 3-5 | More than 5 years |
Total | ||||||||||||||||
| Mortgages and other notes payable |
$ | 146,229 | $ | 201,852 | $ | 159,178 | $ | 292,454 | $ | 799,713 | ||||||||||
| Obligations under capital leases |
2,473 | 2,294 | 277 | — | 5,044 | |||||||||||||||
| Obligations under operating leases(2) |
14,376 | 28,752 | 28,752 | 253,911 | 325,791 | |||||||||||||||
| Total |
$ | 163,078 | $ | 232,898 | $ | 188,207 | $ | 546,365 | $ | 1,130,548 | ||||||||||
FOOTNOTES:
| (1) | This line item includes all third-party and seller financing obtained in connection with the acquisition of properties, and the $58.0 million drawn on our syndicated revolving line of credit. Future interest payments on our variable rate debt and line of credit were estimated based on a 30-day LIBOR forward rate curve. |
| (2) | This line item represents obligations under ground leases, concession holds and land permits which are paid by our third-party tenants on our behalf. Ground lease payments, concession holds and land permit fees are generally based on a percentage of gross revenue of the related property exceeding a certain threshold. The future obligations have been estimated based on current revenue levels projected over the term of the leases or permits. |
| (3) | Includes mortgage loans of approximately $62.0 million that may be accelerated at the option of the lender. |
Contingent Commitments
| Payments Due by Period (in thousands) | ||||||||||||||||||||
| Less than 1 year |
Years 1-3 | Years 3-5 | More than 5 years |
Total | ||||||||||||||||
| Contingent purchase consideration(1) |
$ | 625 | $ | — | $ | — | $ | — | $ | 625 | ||||||||||
| Capital improvements(2) |
30,291 | 4,305 | 2,137 | — | 36,733 | |||||||||||||||
| Loan commitments(3) |
2,193 | — | — | — | 2,193 | |||||||||||||||
| Total |
$ | 33,109 | $ | 4,305 | $ | 2,137 | $ | — | $ | 39,551 | ||||||||||
FOOTNOTES:
| (1) | In connection with the acquisition of Wet’n’Wild Hawaii in 2009, we agreed to pay additional purchase consideration of up to $14.7 million upon the property achieving certain financial performance goals over |
68
Table of Contents
| the next three years, of which approximately $12.4 million was paid during the year ended December 31, 2010. The additional purchase price consideration is not to provide compensation for services but is based on the property achieving certain financial performance goals. In accordance with relevant accounting standards, we recorded the fair value of this contingent liability in our consolidated balance sheets as of December 31, 2010. |
In connection with our acquisition on March 12, 2010 of four marinas, we agreed to pay additional purchase consideration up to a maximum of $10.0 million, contingent upon the properties achieving certain performance thresholds. However, we have determined, based on our estimates and the likelihood of the properties achieving such thresholds, that the fair value of the liability was zero as of December 31, 2010.
| (2) | We have committed to fund ongoing equipment replacements and other capital improvement projects on our existing properties through capital reserves set aside by us for this purpose and additional capital investment in the properties that will increase the lease basis and generate additional rental income. |
| (3) | In connection with certain loans we have made, we are committed to fund, in aggregate, approximately $10.1 million in construction loans of which approximately $7.9 million was drawn as of December 31, 2010. |
EVENTS OCCURRING SUBSEQUENT TO DECEMBER 31, 2010
Our board of directors declared distributions of $0.0521 per share to stockholders of record at the close of business on January 1, 2011, February 1, 2011 and March 1, 2011. These distributions are to be paid by March 31, 2011.
In January 2011, we obtained a loan for $18.0 million that is collateralized by one of our ski and lifestyle properties. The loan bears interest at 30-day LIBOR and requires monthly payments of principal and interest and with the remaining principal and accrued interest due at maturity on December 31, 2015. On January 13, 2011, we entered into an interest swap thereby fixing the rate at 6.68%.
On January 10, 2011, we acquired an ownership interest, through an unconsolidated entity, in 29 senior living properties with an agreed upon value of $630.0 million. See “Acquisitions and Investments in Unconsolidated Entities” above for additional information.
The current advisory agreement continues until March 22, 2011, and was extended by unanimous consent of our board of directors through April 9, 2011, at which time we will engage CNL Lifestyle Advisor Corporation (the “New Advisor”) as our advisor and enter into an advisory agreement with substantially similar terms and services as those provided under our current advisory agreement.
69
Table of Contents
| Item 7A. | Quantitative and Qualitative Disclosures About Market Risk |
We are exposed to interest rate changes primarily as a result of long-term debt used to acquire properties, make loans and other permitted investments. Our interest rate risk management objectives are to limit the impact of interest rate changes on earnings and cash flows and to lower our overall borrowing costs. To achieve our objectives, we expect to borrow and lend primarily at fixed rates or variable rates with the lowest margins available, and in some cases, with the ability to convert variable rates to fixed rates. With regard to variable rate financing, we will assess interest rate cash flow risk by continually identifying and monitoring changes in interest rate exposures that may adversely impact expected future cash flows and by evaluating hedging opportunities.
The following is a schedule of our fixed and variable debt maturities for each of the next five years, and thereafter (in thousands):
| Expected Maturities | ||||||||||||||||||||||||||||||||
| 2011 | 2012 | 2013 | 2014 | 2015 | Thereafter | Total | Fair Value |
|||||||||||||||||||||||||
| Fixed rate debt |
$ | 63,350 | $ | 11,930 | $ | 71,946 | $ | 96,206 | $ | 8,680 | $ | 215,765 | $ | 467,877 | $ | 438,955 | (1) | |||||||||||||||
| Weighted average interest rates of maturities |
8.91 | % | 6.19 | % | 6.10 | % | 6.12 | % | 6.26 | % | 6.27 | % | 6.57 | % | ||||||||||||||||||
| Variable rate debt |
45,773 | 2,672 | 60,729 | 19,891 | (4) | 2,154 | 65,447 | 196,666 | 186,974 | (6) | ||||||||||||||||||||||
| Average interest rate |
|
Prime or 2 |
%(2)(3) |
|
|
(3) |
|
|
(3) |
|
CDOR |
|
|
LIBOR + |
|
|
LIBOR + |
|
||||||||||||||
| Total debt |
$ | 109,123 | $ | 14,602 | $ | 132,675 | $ | 116,097 | $ | 10,834 | $ | 281,212 | $ | 664,543 | $ | 625,929 | ||||||||||||||||
FOOTNOTES:
| (1) | The fair value of our fixed-rate debt was determined using discounted cash flows based on market interest rates as of December 31, 2010. We determined market rates through discussions with our existing lenders pricing our loans with similar terms and current rates and spreads. |
| (2) | The 30-day LIBOR rate was approximately 0.26% and 0.23%, respectively as of December 31, 2010 and 2009. The 30-day CDOR rate was approximately 1.20% and 0.40% as of December 31, 2010 and 2009, respectively. |
| (3) | The average interest rate from year 2011 through 2013 consists of (i) 30-day LIBOR + 3.25% on the $10.0 million loan collateralized by our Jimmy Peak Mountain Resort property and (ii) 30-day CDOR + 3.75% on the $20.0 million loan collateralized by our Cypress Ski Resort property. |
| (4) | On November 30, 2009, we obtained a $20.0 million loan (denominated in Canadian dollars) collateralized by our Cypress Ski Resort property. The loan matures on December 1, 2014 and bears interested at CDOR plus 3.75% that has been fixed with an interest rate swap to 6.43% for the term of the loan. The loan requires monthly payments of principal and interest based on a 20-year amortization schedule. The balance as of December 31, 2010 has been converted from Canadian dollars to U.S. dollar at an exchange rate of 0.9999 Canadian dollars for $1.0000 U.S. dollar on December 31, 2010. The fair value of this instrument has been recorded as a liability of approximately $0.3 million. |
| (5) | On December 6, 2010, we restructured one of our mortgage debts, collateralized by our residential property, with an original principal balance of approximately $85.4 million to $66.4 million. In connection with the restructure, Tranche B and C notes with a principal balance of $22.1 million were satisfied with a repayment of $6.0 million and the remaining balance was forgiven. The Tranche A note was modified to an interest rate of LIBOR + 1.25% and the maturity was extended to January 2, 2016. At the same time, we terminated two interest rate swaps that were designated as cash flow hedges totaled $74.0 |
70
Table of Contents
| million with fixed interest rates of 5.805% to 6.0% and entered into a new interest rate swap of $57.3 million with a blended fixed rate of 3.12% for the term of the loan. The fair value of this instrument has been recorded as an asset of approximately $0.5 million as of December 31, 2010. |
On September 29, 2009, we obtained a $10.0 million loan collateralized by the Jiminy Peak Mountain Resort property. The loan requires monthly payments of interest and principal with the remaining principal and accrued interest payable upon maturity on September 1, 2019. For the entire term, the loan bears interest at a 30-day LIBOR plus 3.25%. However, we entered into an interest rate swap and thereby fixing the rate to 6.89%. The fair value of this instrument has been recorded as a liability of approximately $0.5 million.
| (6) | The estimated fair value of our variable rate debt was determined using discounted cash flows based on market interest rates as of December 31, 2010. We determined market rates through discussions with our existing lenders pricing our loans with similar terms and current rates and spreads. |
Management estimates that a hypothetical one-percentage point increase in LIBOR would have resulted in additional interest costs of approximately $1.2 million and $1.4 million for the years ended December 31, 2010 and 2009, respectively. This sensitivity analysis contains certain simplifying assumptions, and although it gives an indication of our exposure to changes in interest rates, it is not intended to predict future results and our actual results will likely vary.
Our fixed rate mortgage and other notes receivable, which totaled $116.4 million at December 31, 2010, are subject to market risk to the extent that the stated interest rates vary from current market rates for borrowings under similar terms. The estimated fair value of the mortgage notes receivable was approximately $110.8 million and $137.6 million at December 31, 2010 and 2009, respectively.
We are exposed to foreign currency exchange rate fluctuations as a result of our direct ownership of one property in Canada which is leased to a third-party tenant. The lease payments we receive under the triple-net lease and debt service payments are denominated in Canadian dollars. Management does not believe this to be a significant risk or that currency fluctuations would result in a significant impact to our overall results of operations.
We are also indirectly exposed to foreign currency risk related to our investment in unconsolidated Canadian entities and interest rate risk from debt at our unconsolidated entities. However, we believe our risk of foreign exchange loss and exposure to credit and interest rate risks are mitigated as a result of our right to receive a preferred return on our investments in our unconsolidated entities. Our preferred returns as stated in the governing venture agreements are denominated in U.S. dollars.
71
Table of Contents
| Item 8. | Financial Statements and Supplementary Data |
CNL LIFESTYLE PROPERTIES, INC.
AND SUBSIDIARIES
CONTENTS
| Pages | ||||
| Report of Independent Registered Certified Public Accounting Firm |
73 | |||
| Financial Statements |
||||
| 74 | ||||
| 75 | ||||
| 76-77 | ||||
| 78-79 | ||||
| 80-110 | ||||
| 134 | ||||
| 135-144 | ||||
| 145-146 | ||||
72
Table of Contents
Report of Independent Registered Certified Public Accounting Firm
To the Board of Directors and Stockholders of
CNL Lifestyle Properties, Inc.:
In our opinion, the consolidated financial statements listed in the accompanying index present fairly, in all material respects, the financial position of CNL Lifestyle Properties, Inc. and its subsidiaries at December 31, 2010 and 2009, and the results of their operations and their cash flows for the years ended December 31, 2010, 2009 and 2008 in conformity with accounting principles generally accepted in the United States of America. In addition, in our opinion, the financial statement schedules listed in the index appearing under Item 15(a) 2 present fairly, in all material respects, the information set forth therein when read in conjunction with the related consolidated financial statements. These financial statements and financial statement schedules are the responsibility of the Company’s management. Our responsibility is to express an opinion on these financial statements and financial statement schedules based on our audits. We conducted our audits of these statements in accordance with the standards of the Public Company Accounting Oversight Board (United States). Those standards require that we plan and perform the audit to obtain reasonable assurance about whether the financial statements are free of material misstatement. An audit includes examining, on a test basis, evidence supporting the amounts and disclosures in the financial statements, assessing the accounting principles used and significant estimates made by management, and evaluating the overall financial statement presentation. We believe that our audits provide a reasonable basis for our opinion.
/s/ PricewaterhouseCoopers LLP
Orlando, Florida
March 18, 2011
73
Table of Contents
CNL LIFESTYLE PROPERTIES, INC.
AND SUBSIDIARIES
(in thousands except per share data)
| December 31, | ||||||||
| 2010 | 2009 | |||||||
| ASSETS | ||||||||
| Real estate investment properties, net (including $216,574 related to consolidated variable interest entitites) |
$ | 2,025,522 | $ | 2,021,188 | ||||
| Cash |
200,517 | 183,575 | ||||||
| Investments in unconsolidated entities |
140,372 | 142,487 | ||||||
| Mortgages and other notes receivable, net |
116,427 | 145,640 | ||||||
| Deferred rent and lease incentives |
80,948 | 91,850 | ||||||
| Other assets |
49,719 | 24,656 | ||||||
| Intangibles, net |
25,929 | 32,032 | ||||||
| Restricted cash |
19,912 | 19,438 | ||||||
| Accounts and other receivables, net |
14,580 | 11,262 | ||||||
| Total Assets |
$ | 2,673,926 | $ | 2,672,128 | ||||
| LIABILITIES AND STOCKHOLDERS’ EQUITY | ||||||||
| Mortgages and other notes payable (including $86,408 non-recourse debt of consolidated variable interest entities) |
$ | 603,144 | $ | 639,488 | ||||
| Line of credit |
58,000 | 99,483 | ||||||
| Other liabilities |
35,555 | 43,931 | ||||||
| Accounts payable and accrued expenses |
24,433 | 19,591 | ||||||
| Security deposits |
16,140 | 16,180 | ||||||
| Due to affiliates |
5,614 | 4,239 | ||||||
| Total Liabilities |
742,886 | 822,912 | ||||||
| Commitments and contingencies |
||||||||
| Stockholders’ equity: |
||||||||
| Preferred stock, $.01 par value per share |
||||||||
| 200 million shares authorized and unissued |
— | — | ||||||
| Excess shares, $.01 par value per share |
||||||||
| 120 million shares authorized and unissued |
— | — | ||||||
| Common stock, $.01 par value per share |
||||||||
| One billion shares authorized; 301,299 and 260,233 shares issued and 284,687 and 247,710 shares outstanding as of December 31, 2010 and 2009, respectively |
2,847 | 2,477 | ||||||
| Capital in excess of par value |
2,523,405 | 2,195,251 | ||||||
| Accumulated earnings (deficit) |
(3,763 | ) | 78,126 | |||||
| Accumulated distributions |
(585,812 | ) | (421,873 | ) | ||||
| Accumulated other comprehensive loss |
(5,637 | ) | (4,765 | ) | ||||
| 1,931,040 | 1,849,216 | |||||||
| Total Liabilities and Stockholders' Equity |
$ | 2,673,926 | $ | 2,672,128 | ||||
See accompanying notes to consolidated financial statements.
74
Table of Contents
CNL LIFESTYLE PROPERTIES, INC.
AND SUBSIDIARIES
CONSOLIDATED STATEMENTS OF OPERATIONS
(in thousands except per share data)
| Year Ended December 31, | ||||||||||||
| 2010 | 2009 | 2008 | ||||||||||
| Revenues: |
||||||||||||
| Rental income from operating leases |
$ | 202,029 | $ | 205,247 | $ | 203,031 | ||||||
| Property operating revenues |
86,567 | 35,246 | — | |||||||||
| Interest income on mortgages and other notes receivable |
15,832 | 12,778 | 7,384 | |||||||||
| Total revenues |
304,428 | 253,271 | 210,415 | |||||||||
| Expenses: |
||||||||||||
| Property operating expenses |
79,365 | 34,665 | — | |||||||||
| Asset management fees to advisor |
26,808 | 25,075 | 21,937 | |||||||||
| General and administrative |
14,242 | 13,935 | 14,003 | |||||||||
| Ground lease and permit fees |
12,589 | 11,561 | 9,477 | |||||||||
| Acquisition fees and costs |
14,149 | 14,616 | — | |||||||||
| Other operating expenses |
2,528 | 9,548 | 8,943 | |||||||||
| Bad debt expense |
2,315 | 2,313 | 328 | |||||||||
| Loan loss provision |
4,072 | — | — | |||||||||
| Loss on lease terminations |
55,528 | 4,506 | — | |||||||||
| Impairment provision |
26,880 | — | — | |||||||||
| Depreciation and amortization |
126,223 | 124,040 | 98,149 | |||||||||
| Total expenses |
364,699 | 240,259 | 152,837 | |||||||||
| Operating income (loss) |
(60,271 | ) | 13,012 | 57,578 | ||||||||
| Other income (expense): |
||||||||||||
| Interest and other income |
2,759 | 2,676 | 5,718 | |||||||||
| Interest expense and loan cost amortization |
(50,616 | ) | (40,638 | ) | (32,076 | ) | ||||||
| Gain on extinguishment of debt |
15,261 | — | — | |||||||||
| Equity in earnings of unconsolidated entities |
10,978 | 5,630 | 3,020 | |||||||||
| Total other expense |
(21,618 | ) | (32,332 | ) | (23,338 | ) | ||||||
| Income (loss) from continuing operations |
(81,889 | ) | (19,320 | ) | 34,240 | |||||||
| Discontinued operations |
— | — | 2,396 | |||||||||
| Net income (loss) |
$ | (81,889 | ) | $ | (19,320 | ) | $ | 36,636 | ||||
| Earnings (loss) per share of common stock (basic and diluted) |
||||||||||||
| Continuing operations |
$ | (0.31 | ) | $ | (0.08 | ) | $ | 0.16 | ||||
| Discontinued operations |
$ | — | $ | — | $ | 0.01 | ||||||
| $ | (0.31 | ) | $ | (0.08 | ) | $ | 0.17 | |||||
| Weighted average number of shares of common stock outstanding (basic and diluted) |
263,516 | 235,873 | 210,192 | |||||||||
See accompanying notes to consolidated financial statements.
75
Table of Contents
CNL LIFESTYLE PROPERTIES, INC.
AND SUBSIDIARIES
CONSOLIDATED STATEMENTS OF STOCKHOLDERS’ EQUITY
Years ended December 31, 2010, 2009 and 2008
(in thousands except per share data)
| Common Stock | Capital in Excess of Par Value |
Accumulated Earnings |
Accumulated Distributions |
Accumulated Comprehensive Income (Loss) |
Total Stockholders’ Equity |
Comprehensive Income |
||||||||||||||||||||||||||
| Number of Shares |
Par Value |
|||||||||||||||||||||||||||||||
| Balance at December 31, 2007 |
191,827 | $ | 1,918 | $ | 1,690,018 | $ | 60,810 | $ | (139,062 | ) | $ | 3,630 | $ | 1,617,314 | ||||||||||||||||||
| Subscriptions received for common stock through public offering and reinvestment plan |
37,778 | 378 | 386,617 | — | — | — | 386,995 | |||||||||||||||||||||||||
| Redemption of common stock |
(3,568 | ) | (36 | ) | (33,939 | ) | — | — | — | (33,975 | ) | |||||||||||||||||||||
| Stock issuance and offering costs |
— | — | (37,549 | ) | — | — | — | (37,549 | ) | |||||||||||||||||||||||
| Net income |
— | — | — | 36,636 | — | — | 36,636 | $ | 36,636 | |||||||||||||||||||||||
| Distributions, declared and paid ($0.6150 per share) |
— | — | — | — | (128,358 | ) | — | (128,358 | ) | |||||||||||||||||||||||
| Foreign currency translation adjustment |
— | — | — | — | — | (9,992 | ) | (9,992 | ) | (9,992 | ) | |||||||||||||||||||||
| Current period adjustment to recognize changes in fair value of cash flow hedges |
— | — | — | — | — | (8,699 | ) | (8,699 | ) | (8,699 | ) | |||||||||||||||||||||
| Total comprehensive income |
— | — | — | — | — | — | — | $ | 17,945 | |||||||||||||||||||||||
| Balance at December 31, 2008 |
226,037 | $ | 2,260 | $ | 2,005,147 | $ | 97,446 | $(267,420) | $ | (15,061 | ) | $ | 1,822,372 | |||||||||||||||||||
| Subscriptions received for common stock through public offering and reinvestment plan |
29,660 | 297 | 293,006 | — | — | — | 293,303 | |||||||||||||||||||||||||
| Redemption of common stock |
(7,987 | ) | (80 | ) | (76,161 | ) | — | — | — | (76,241 | ) | |||||||||||||||||||||
| Stock issuance and offering costs |
— | — | (26,741 | ) | — | — | — | (26,741 | ) | |||||||||||||||||||||||
| Net income |
— | — | — | (19,320 | ) | — | — | (19,320 | ) | $ | (19,320 | ) | ||||||||||||||||||||
| Distributions, declared and paid ($0.6577 per share) |
— | — | — | — | (154,453) | — | (154,453) | |||||||||||||||||||||||||
| Foreign currency translation adjustment |
— | — | — | — | — | 6,583 | 6,583 | 6,583 | ||||||||||||||||||||||||
| Current period adjustment to recognize changes in fair value of cash flow hedges |
— | — | — | — | — | 3,713 | 3,713 | 3,713 | ||||||||||||||||||||||||
| Total comprehensive income |
— | — | — | — | — | — | — | $ | (9,024 | ) | ||||||||||||||||||||||
| Balance at December 31, 2009 |
247,710 | $ | 2,477 | $ | 2,195,251 | $ | 78,126 | $ | (421,873 | ) | $ | (4,765 | ) | $ | 1,849,216 | |||||||||||||||||
See accompanying notes to consolidated financial statements.
76
Table of Contents
CNL LIFESTYLE PROPERTIES, INC.
AND SUBSIDIARIES
CONSOLIDATED STATEMENTS OF STOCKHOLDERS’ EQUITY—CONTINUED
Years ended December 31, 2010, 2009 and 2008
(in thousands except per share data)
| Common Stock | Capital in Excess of Par Value |
Accumulated Earnings |
Accumulated Distributions |
Accumulated Comprehensive Income (Loss) |
Total Stockholders’ Equity |
Comprehensive Loss |
||||||||||||||||||||||||||
| Number of Shares |
Par Value |
|||||||||||||||||||||||||||||||
| Balance at December 31, 2009 |
247,710 | $ | 2,477 | $ | 2,195,251 | $ | 78,126 | $ | (421,873 | ) | $ | (4,765 | ) | $ | 1,849,216 | |||||||||||||||||
| Subscriptions received for common stock through public offering and reinvestment plan |
41,066 | 411 | 406,019 | — | — | — | 406,430 | |||||||||||||||||||||||||
| Redemption of common stock |
(4,089 | ) | (41 | ) | (40,355 | ) | — | — | — | (40,396 | ) | |||||||||||||||||||||
| Stock issuance and offering costs |
— | — | (37,510 | ) | — | — | — | (37,510 | ) | |||||||||||||||||||||||
| Net loss |
— | — | — | (81,889 | ) | — | — | (81,889 | ) | $ | (81,889 | ) | ||||||||||||||||||||
| Distributions, declared and paid ($0.6252 per share) |
— | — | — | — | (163,939 | ) | — | (163,939 | ) | |||||||||||||||||||||||
| Foreign currency translation adjustment |
— | — | — | — | — | 1,061 | 1,061 | 1,061 | ||||||||||||||||||||||||
| Amortization of loss on termination of cash flow hedges |
— | — | — | — | — | 331 | 331 | 331 | ||||||||||||||||||||||||
| Current period adjustment to recognize changes in fair value of cash flow hedges, net of reclassifications (Note 14) |
— | — | — | — | — | (2,264 | ) | (2,264 | ) | (2,264 | ) | |||||||||||||||||||||
| Total comprehensive loss |
— | — | — | — | — | — | — | $ | (82,761 | ) | ||||||||||||||||||||||
| Balance at December 31, 2010 |
284,687 | $ | 2,847 | $ | 2,523,405 | $ | (3,763 | ) | $ | (585,812 | ) | $ | (5,637 | ) | $ | 1,931,040 | ||||||||||||||||
See accompanying notes to consolidated financial statements.
77
Table of Contents
CNL LIFESTYLE PROPERTIES, INC.
AND SUBSIDIARIES
CONSOLIDATED STATEMENTS OF CASH FLOWS
(in thousands)
| Year Ended December 31, | ||||||||||||
| 2010 | 2009 | 2008 | ||||||||||
| Operating activities: |
||||||||||||
| Net income (loss) |
$ | (81,889 | ) | $ | (19,320 | ) | $ | 36,636 | ||||
| Adjustments to reconcile net income to net cash provided by operating activities |
||||||||||||
| Depreciation and amortization |
134,190 | 129,136 | 100,853 | |||||||||
| Accretion of note origination costs |
(72 | ) | (161 | ) | (248 | ) | ||||||
| Write off of note origination costs |
— | — | 604 | |||||||||
| Loan origination fees received |
— | — | 340 | |||||||||
| Gain on sale of property |
— | — | (4,470 | ) | ||||||||
| (Gain)/loss on disposal of fixed assets |
(265 | ) | (376 | ) | 29 | |||||||
| Gain on extinguishment of debt |
(15,261 | ) | — | — | ||||||||
| Reclassification of hedge loss from extinguishment of debt |
2,006 | — | — | |||||||||
| Deferred interest received on mortgages and other notes receivable |
2,814 | — | — | |||||||||
| Loss on lease termination |
55,528 | 4,506 | — | |||||||||
| Impairment provision |
26,880 | — | — | |||||||||
| Loan loss provision |
4,072 | — | — | |||||||||
| Swap breakage payment |
(9,256 | ) | — | — | ||||||||
| Bad debt |
2,315 | 2,313 | 328 | |||||||||
| Write-off of intangible assets |
— | — | 1,085 | |||||||||
| Equity in earnings net of distributions from unconsolidated entities |
1,712 | 5,156 | 11,863 | |||||||||
| Changes in assets and liabilities: |
||||||||||||
| Other assets |
(25,923 | ) | (8,937 | ) | 1,024 | |||||||
| Deferred rent |
(24,530 | ) | (47,489 | ) | (17,005 | ) | ||||||
| Accounts and other receivables |
2,829 | 152 | (5,636 | ) | ||||||||
| Accounts payable, accrued expenses and other liabilities |
(2,142 | ) | 17,811 | 1,315 | ||||||||
| Security deposits from tenants |
5,926 | (21,399 | ) | (8,406 | ) | |||||||
| Due to affiliates |
842 | 1,008 | 470 | |||||||||
| Net cash provided by operating activities |
79,776 | 62,400 | 118,782 | |||||||||
| Investing activities: |
||||||||||||
| Acquisition of properties |
(81,390 | ) | (42,000 | ) | (167,529 | ) | ||||||
| Capital expenditures |
(59,140 | ) | (62,320 | ) | (116,205 | ) | ||||||
| Deposits on real estate investments |
(11,220 | ) | (1,022 | ) | — | |||||||
| Acquisition of remaining partnership interest in Wolf Partnership entity, net of $3,752 cash received |
— | (2,382 | ) | — | ||||||||
| Contributions to unconsolidated entities |
— | (16,229 | ) | (1,394 | ) | |||||||
| Payment of contingent purchase consideration |
(12,433 | ) | — | — | ||||||||
| Issuance of mortgage loans receivable |
(14,897 | ) | (28,881 | ) | (68,584 | ) | ||||||
| Payment of additional carrying costs for mortgage loans receivable |
— | (7,599 | ) | (3,656 | ) | |||||||
| Principal payments received on mortgage loans receivable |
38,614 | 18,388 | — | |||||||||
| Acquisition fees on mortgage notes receivable |
(461 | ) | (867 | ) | (19,105 | ) | ||||||
| Return of short term investments |
8,000 | — | — | |||||||||
| Proceeds from sale of property |
— | — | 12,000 | |||||||||
| Proceeds from disposal of assets |
590 | 560 | 69 | |||||||||
| Changes in restricted cash |
(6,238 | ) | 468 | (4,789 | ) | |||||||
| Net cash used in investing activities |
(138,575 | ) | (141,884 | ) | (369,193 | ) | ||||||
See accompanying notes to consolidated financial statements.
78
Table of Contents
CNL LIFESTYLE PROPERTIES, INC.
AND SUBSIDIARIES
CONSOLIDATED STATEMENTS OF CASH FLOWS—CONTINUED
(in thousands)
| Year Ended December 31, | ||||||||||||
| 2010 | 2009 | 2008 | ||||||||||
| Financing activities: |
||||||||||||
| Offering proceeds |
$ | 333,346 | $ | 222,685 | $ | 326,198 | ||||||
| Redemptions of common stock |
(40,396 | ) | (76,958 | ) | (33,730 | ) | ||||||
| Distributions to stockholders, net of reinvestments |
(90,855 | ) | (83,835 | ) | (67,561 | ) | ||||||
| Stock issuance costs |
(36,574 | ) | (26,940 | ) | (37,910 | ) | ||||||
| Borrowings under line of credit, net of payments |
(41,483 | ) | (517 | ) | 100,000 | |||||||
| Proceeds from mortgage loans and other notes payables |
12,202 | 37,855 | 159,403 | |||||||||
| Principal payments on mortgage loans |
(50,450 | ) | (10,856 | ) | (19,378 | ) | ||||||
| Principal payments on capital leases |
(4,284 | ) | (4,852 | ) | (42 | ) | ||||||
| Payment of loan costs |
(5,903 | ) | (3,123 | ) | (2,339 | ) | ||||||
| Net cash provided by financing activities |
75,603 | 53,459 | 424,641 | |||||||||
| Effect of exchange rate fluctuation on cash |
$ | 138 | $ | 99 | $ | 193 | ||||||
| Net increase (decrease) in cash |
16,942 | (25,926 | ) | 174,423 | ||||||||
| Cash at beginning of period |
183,575 | 209,501 | 35,078 | |||||||||
| Cash at end of period |
$ | 200,517 | $ | 183,575 | $ | 209,501 | ||||||
| Supplemental disclosure of cash flow information: |
||||||||||||
| Cash paid during the period for interest |
$ | 46,693 | $ | 36,726 | $ | 28,088 | ||||||
| Supplemental disclosure of non-cash investing activities: |
||||||||||||
| Amounts incurred but not paid (included in due to affiliates): |
||||||||||||
| Acquisition fees and costs |
$ | — | $ | — | $ | 664 | ||||||
| Offering and stock issuance costs |
$ | 457 | $ | 256 | $ | 657 | ||||||
| Allocation of acquisition fees to real estate investments |
$ | — | $ | — | $ | 8,783 | ||||||
| Allocation of acquisition fees to mortgages and other notes receivable |
$ | — | $ | — | $ | 2,720 | ||||||
| Assumption of capital leases |
$ | 2,044 | $ | 7,102 | $ | 2,115 | ||||||
| Capital expansion projects incurred but not paid |
$ | 1,994 | $ | 1,760 | $ | 13,545 | ||||||
| Discharge of note receivable in connection with foreclosure |
$ | — | $ | 51,255 | $ | 16,800 | ||||||
| Changes in estimated contingent purchase price |
$ | 1,500 | $ | 10,800 | $ | — | ||||||
| During the year ended December 31, 2009, the Company acquired the remaining 30.3% interest in the Wolf Partnership for approximately $6.0 million and accounted for this acquisition using the purchase method of accounting. The Wolf Partnership was previously an unconsolidated entity of which the Company had a 69.7% ownership interest. The fair value of the net assets acquired at August 6, 2009 were as follows: |
| |||||||||||
| Real estate and intangibles |
$ | 90,300 | ||||||||||
| Other assets |
7,621 | |||||||||||
| Liabilities |
(64,803 | ) | ||||||||||
| Net assets |
$ | 33,118 | ||||||||||
| Supplemental disclosure of non-cash financing activities: |
||||||||||||
| Seller financing obtained in connection with acquisitions |
$ | 13,983 | $ | 14,400 | $ | 43,542 | ||||||
| Seller financing provided upon sale of discontinued operations |
$ | — | $ | — | $ | 10,000 | ||||||
| Forgiveness from debt restructure |
$ | 15,261 | $ | — | $ | — | ||||||
See accompanying notes to consolidated financial statements.
79
Table of Contents
CNL LIFESTYLE PROPERTIES, INC.
AND SUBSIDIARIES
NOTES TO CONSOLIDATED FINANCIAL STATEMENTS
1. Organization and Nature of Business:
CNL Lifestyle Properties, Inc. (the “Company”), was organized in Maryland on August 11, 2003. The Company operates and has elected to be taxed as a real estate investment trust (a “REIT”) for federal income tax purposes beginning with its taxable year ended December 31, 2004. Various wholly owned subsidiaries have been and will be formed by the Company for the purpose of acquiring and owning direct or indirect interests in real estate. The Company generally invests in lifestyle properties in the United States that are primarily leased on a long-term (generally five to 20-years, plus multiple renewal options), triple-net or gross basis to tenants or operators that the Company considers to be significant industry leaders. To a lesser extent, the Company also leases properties to taxable REIT subsidiary (“TRS”) tenants and engages independent third-party managers to operate those properties.
As of December 31, 2010, the Company owned 122 lifestyle properties directly and indirectly within the following asset classes: Ski and Mountain Lifestyle, Golf, Attractions, Marinas and Additional Lifestyle Properties. Eight of these 122 properties are owned through unconsolidated entities and three are located in Canada. Although these are the asset classes in which the Company has invested and are most likely to invest in the future, it may acquire or invest in any type of property that it believes has the potential to generate long-term revenue. The Company may also make or acquire loans (mortgage, mezzanine and other loans) or other permitted investments.
2. Significant Accounting Policies:
Principles of Consolidation and Basis of Presentation—The accompanying consolidated financial statements include the accounts of the Company and its wholly owned subsidiaries. All significant inter-company balances and transactions have been eliminated in consolidation. In addition, the Company evaluates its investments in partnerships and joint ventures for consolidation based on whether the Company has a controlling interest, including where the Company has been determined to be a primary beneficiary of a variable interest entity (“VIE”) or meets certain criteria of a sole general partner or managing member in accordance with the Consolidation guidance of the Financial Accounting Standards Board (“FASB”) Accounting Standards Codification (“ASC”).
Real Estate—Upon acquisition of real estate properties, the Company estimates the fair value of acquired tangible assets (consisting of land, buildings, improvements and equipment) and identifiable intangibles (consisting of above and below-market leases, in-place leases and trade names), and any assumed debt or other liabilities such as contingent purchase consideration at the date of acquisition, based on evaluation of information and estimates available at that date. Based on these estimates, the Company allocates the estimated fair value to the applicable assets and liabilities. Fair value is determined based on an exit price approach, which contemplates the price that would be received to sell an asset or paid to transfer a liability in an orderly transaction between market participants at the measurement date.
Real estate assets are stated at cost less accumulated depreciation, which is computed using the straight-line method of accounting over the estimated useful lives of the related assets. Buildings and improvements are depreciated over the lesser of 39 years or the remaining life of the ground lease including renewal options and leasehold and permit interests and equipment are depreciated over their estimated useful lives. On an ongoing basis, management assesses whether there are any indicators, including property operating performance and general market conditions, that the value of the real estate properties (including any related amortizable intangible assets or liabilities) may be impaired. A property value is considered impaired only if management’s estimate of current and projected operating cash flows (undiscounted and unleveraged) of the property over its
80
Table of Contents
CNL LIFESTYLE PROPERTIES, INC.
AND SUBSIDIARIES
NOTES TO CONSOLIDATED FINANCIAL STATEMENTS
2. Significant Accounting Policies (Continued):
remaining useful life is less than the net carrying value of the property. Such cash flow projections consider factors such as expected future operating income, trends and prospects, as well as the effects of demand, competition and other factors. To the extent impairment has occurred, the carrying value of the property would be adjusted to an amount to reflect the estimated fair value of the property.
Expenditures for maintenance and repairs are charged to operations as incurred. Significant renovations and replacements, which improve and extend the life of the asset, are capitalized.
Impairment of Real Estate Assets—Real estate assets are reviewed on an ongoing basis to determine whether there are any indicators, including property operating performance and general market conditions, that the value of the real estate properties (including any related amortizable intangible assets or liabilities) may be impaired. A property value is considered impaired if management’s estimate of current and projected operating cash flows (undiscounted and unleveraged) of the property over its remaining useful life is less than the net carrying value of the property. Such cash flow projections consider factors such as expected future operating income, trends, and prospects, as well as the effects of demand, competition and other factors. To the extent impairment has occurred, the carrying value of the property is adjusted to an amount to reflect the estimated fair value of the property.
Intangible Assets—Amortization of intangible assets is computed using the straight-line method of accounting over the respective lease term or estimated useful life. The capitalized above-market or below-market intangible is amortized to rental income over the estimated remaining term of the respective leases. If a lease were to be terminated prior to its scheduled expiration, all unamortized costs relating to that lease would be written off. Intangible assets with indefinite lives are not amortized and, like all intangibles are evaluated for impairment on an annual basis or upon a triggering event.
Acquisition Fees and Costs—Effective January 1, 2009, the Company began expensing acquisition fees and costs in accordance with a new accounting pronouncement. Prior to the adoption of this pronouncement, acquisition fees and costs were generally capitalized and allocated to the cost basis of the assets acquired in connection with a property acquisition or business combination. The adoption of this pronouncement had, and will continue to have a significant impact on the Company’s operating results due to the highly acquisitive nature of its business, and also causes a decrease in cash flows from operating activities, as acquisition fees and costs historically have been included in cash flows from investing activities, but are treated as cash flows from operating activities under the new guidance. The characterization of these acquisition fees and costs to operating activities in accordance with generally accepted accounting principles (“GAAP”) does not change the nature and source of how the amounts are funded and paid with proceeds from the Company’s public offerings. Upon adoption of this new pronouncement, the Company expensed approximately $5.9 million in acquisition fees and costs for acquisitions that were being pursued in 2008 but which did not close as of December 31, 2008. Additionally, the Company expensed approximately $14.1 million and $8.7 million in new acquisition fees and costs incurred during the years ended December 31, 2010 and 2009, respectively. The Company will continue to capitalize acquisition fees and costs incurred in connection with the making of loans, simple asset purchases and other investments.
Investment in Unconsolidated Entities—The Company accounts for its investments in unconsolidated joint ventures under the equity method of accounting as the Company exercises significant influence, but does not control these entities. These investments are recorded initially at cost and subsequently adjusted for cash contributions and distributions. Based on the respective venture structures and preferences the Company receives
81
Table of Contents
CNL LIFESTYLE PROPERTIES, INC.
AND SUBSIDIARIES
NOTES TO CONSOLIDATED FINANCIAL STATEMENTS
2. Significant Accounting Policies (Continued):
on distributions and liquidation, the Company records its equity in earnings of the entities under the hypothetical liquidation at book value (“HLBV”) method of accounting. Under this method, the Company recognizes income or loss in each period as if the net book value of the assets in the venture were hypothetically liquidated at the end of each reporting period. Under this method, in any given period, the Company could be recording more or less income than actual cash distributions received and more or less than what the Company may receive in the event of an actual liquidation.
Management monitors on a continuous basis whether there are any indicators, including the underlying investment property operating performance and general market conditions, that the value of the Company’s investments in unconsolidated entities may be impaired. An investment’s value is impaired only if management’s estimate of the fair value of the investment is less than the carrying value of the investment and such difference is deemed to be other-than-temporary. To the extent an impairment has occurred, the loss would be measured as the excess of the carrying amount of the investment over the estimated fair value of the investment. The Company’s estimated fair values of its unconsolidated entities are based upon a discounted cash flow model that includes all estimated cash inflows and outflows over the expected holding period. Capitalization rates and discount rates utilized in these models are based upon rates that the Company believes to be within a reasonable range of current market rates for the underlying properties.
Mortgages and Other Notes Receivable—Mortgages and other notes receivable are recorded at the stated principal amounts net of deferred loan origination costs or fees. A loan is considered to be impaired when, based on current information and events, it is probable that the Company will be unable to collect all amounts due according to the contractual terms of the note. An allowance for loan loss is calculated by comparing the carrying value of the note to the estimated fair value of the underlying collateral. Increases and decreases in the allowance due to changes in the measurement of the impaired loans are included in the provision for loan loss not to exceed the original carrying amount of the loan. Interest income on performing loans is accrued as earned. Interest income on impaired loans is recognized as collected.
Loan origination and other fees received by the Company in connection with making the loans are recorded as a reduction of the note receivable and amortized into interest income, using the effective interest method, over the term of the loan. The Company records acquisition fees incurred in connection with making the loans as part of the mortgages and other notes receivable balance and amortizes the amounts as a reduction of interest income over the term of the notes.
Cash—Cash consists of demand deposits at commercial banks. The Company also invests in money market funds during the year. As of December 31, 2010, the cash deposits exceeded federally insured amounts. However, the Company has not experienced any losses on such accounts. Management continues to monitor third-party depository institutions that hold the Company’s cash, primarily with the goal of safety of principal and secondarily on maximizing yield on those funds. To that end, the Company has diversified its cash and cash equivalents between several banking institutions in an attempt to minimize exposure to any one of these entities. Management has attempted to select institutions that it believes are strong based on an evaluation of their financial stability and exposure to poor performing assets.
Restricted Cash—Certain amounts of cash are restricted to fund capital expenditures for the Company’s real estate investment properties or represent certain tenant security deposits. The Company’s restricted cash balances as of December 31, 2010 and 2009 were approximately $19.9 million and $19.4 million, respectively.
82
Table of Contents
CNL LIFESTYLE PROPERTIES, INC.
AND SUBSIDIARIES
NOTES TO CONSOLIDATED FINANCIAL STATEMENTS
2. Significant Accounting Policies (Continued):
Derivative Instruments and Hedging Activities—The Company utilizes derivative instruments to partially offset the effect of fluctuating interest rates on the cash flows associated with its variable-rate debt. The Company follows established risk management policies and procedures in its use of derivatives and does not enter into or hold derivatives for trading or speculative purposes. The Company records all derivative instruments on the balance sheet at fair value. On the date the Company enters into a derivative contract, the derivative is designated as a hedge of the exposure to variable cash flows of a forecasted transaction. The effective portion of the derivative’s gain or loss is initially reported as a component of other comprehensive income (loss) and subsequently recognized in the statement of operations in the periods in which earnings are impacted by the variability of the cash flows of the hedged item. Any ineffective portion of the gain or loss is reflected in interest expense in the statement of operations. As of December 31, 2010 and 2009, the fair value of the hedged net liabilities totaled approximately $0.3 million and $5.0 million, respectively, and has been included in other assets and other liabilities in the accompanying consolidated balance sheets. As of December 31, 2010, the Company’s hedges qualified as highly effective and, accordingly, all of the change in value is reflected in other comprehensive income (loss).
Fair Value of Financial Instruments—The estimated fair value of cash, accounts receivable, accounts payable and accrued expenses approximates carrying value as of December 31, 2010 and 2009, because of the liquid nature of the assets and relatively short maturities of the obligations. The Company estimates that the fair value of its mortgages and other notes receivable at December 31, 2010 and 2009 was approximately $110.8 million and $137.6 million, respectively, based on current economic conditions and prevailing market rates. The Company estimates that at December 31, 2010 and 2009, the fair value of its fixed rate debt was approximately $439.0 million and $465.0 million, respectively, and the fair value of its variable rate debt was approximately $187.0 million and $235.6 million, respectively, based upon the current rates and spreads it would pay to obtain similar borrowings.
Fair Value of Non-Financial Assets and Liabilities—Effective January 1, 2009, the Company adopted new guidance, which affects how fair value is determined for non-financial assets such as real estate, intangibles, investments in unconsolidated entities and other long-lived assets, including the incorporation of market participant assumptions in determining the fair value. The adoption of this guidance did not have a material impact on the Company’s financial position or results of operations.
Deferred Financing Costs—Financing costs paid in connection with obtaining long-term debt are deferred and amortized over the life of the debt using the effective interest method. Amortization expense was approximately $3.6 million, $2.8 million and $1.7 million for the years ended December 31, 2010, 2009 and 2008, respectively.
Foreign Currency Translation—The accounting records for the Company’s one consolidated foreign location, in Vancouver, British Columbia, are maintained in the local currency and revenues and expenses are translated using the average exchange rates during the period. Assets and liabilities are translated to U.S. dollars using the exchange rate in effect at the balance sheet date. The resulting translation adjustments are reflected in stockholders’ equity as a cumulative foreign currency translation adjustment, a component of accumulated other comprehensive income (loss). Gains and losses from foreign currency transactions are included in the accompanying consolidated statements of operations.
Revenue Recognition—For properties subject to operating leases, rental revenue is recorded on a straight-line basis over the terms of the leases. Additional percentage rent that is due contingent upon tenant performance
83
Table of Contents
CNL LIFESTYLE PROPERTIES, INC.
AND SUBSIDIARIES
NOTES TO CONSOLIDATED FINANCIAL STATEMENTS
| 2. | Significant Accounting Policies (Continued): |
thresholds, such as gross revenues, is deferred until the underlying performance thresholds have been achieved. Property operating revenues from managed properties, which are not subject to leasing arrangements, are derived from room rentals, food and beverage sales, ski and spa operations, golf operations, membership dues, ticket sales, concessions, waterpark and themepark operations and other service revenues. Such revenues, excluding membership dues, are recognized when rooms are occupied, when services have been performed, and when products are delivered. Membership dues are recognized ratably over the term of the membership period. For mortgages and other notes receivable, interest income is recognized on an accrual basis when earned, except for loans placed on non-accrual status, for which interest income is recognized when received. Any deferred portion of contractual interest is recognized on a straight-line basis over the term of the corresponding note. Loan origination fees charged and acquisition fees incurred in connection with the making of loans are recognized as interest income, and a reduction in interest income, respectively over the term of the notes.
Capital Improvement Reserve Income—The Company’s leases require the tenants to pay certain contractual amounts that are set aside by the Company for replacements of fixed assets and other improvements to the properties. These amounts are and will remain the property of the Company during and after the term of the lease. The amounts are recorded as capital improvement reserve income at the time that they are earned and are included in rental income from operating leases in the accompanying consolidated statements of operations.
Mortgages and other notes payable—Mortgages and other notes payable are recorded at the stated principal amount and are generally collateralized by the Company’s lifestyle properties with monthly interest only and/or principal payments. A loan that is accounted for as a troubled debt restructure is recorded at the future cash payments, principal and interest, specified by the new terms. The Company may undergo a troubled debt restructuring if management determines that the underlying collateralized properties are not performing to meet debt service. In order to qualify as a troubled debt restructure the following must apply: (i) the underlying collateralized property value decreased as a result of the economic environment, (ii) transfer of asset (cash) to partially satisfy the loan has occurred and (iii) new loan terms decrease the interest rate and extend the maturity date. The difference between the future cash payments specified by the new terms and the carrying value immediately preceding the restructure is recorded as gain on extinguishment of debt. For the year ended December 31, 2010, the Company restructured one of its debts with a principal outstanding balance of approximately $85.4 million, repaid $6.0 million in cash and recorded a gain on extinguishment of debt of approximately $14.4 million resulting in a new outstanding balance of approximately $66.4 million, as of December 31, 2010.
Income Taxes—The Company believes it has qualified as a REIT under Sections 856 through 860 of the Internal Revenue Code of 1986, as amended and related regulations beginning with the year ended December 31, 2004. As a REIT, the Company generally is not subject to federal corporate income taxes provided it distributes at least 90% of its REIT taxable income and meets certain other requirements for qualifying as a REIT. Subject to compliance with applicable tax law, certain properties may be operated using an eligible third-party manager. In those cases, taxable income from those operations may be subject to federal income tax. Management believes that the Company was organized and operated in a manner that enables the Company to continue to qualify for treatment as a REIT for federal income tax purposes for the years ended December 31, 2010, 2009 and 2008.
Under the provisions of the Internal Revenue Code and applicable state laws, each TRS entity of the Company is subject to taxation of income on the profits and losses from its tenant operations. The Company accounts for federal and state income taxes with respect to its TRS entities using the asset and liability method.
84
Table of Contents
CNL LIFESTYLE PROPERTIES, INC.
AND SUBSIDIARIES
NOTES TO CONSOLIDATED FINANCIAL STATEMENTS
| 2. | Significant Accounting Policies (Continued): |
Deferred tax assets and liabilities are recognized for the future tax consequences attributable to differences between the consolidated financial statement carrying amounts of existing assets and liabilities and respective tax bases and operating losses and tax-credit carry forwards.
Deferred tax assets and liabilities are measured using enacted tax rates expected to apply to taxable income in the years in which those temporary differences are expected to be recovered or settled. The effect on deferred tax assets and liabilities of a change in tax rates is recognized in income in the period that includes the enactment date. Valuation allowances are established when necessary to reduce deferred tax assets to the amount expected to be realized.
Assets Held For Sale and Discontinued Operations—The Company classifies assets as held for sale when management has obtained a firm commitment from a buyer, the sale has been approved by the board of directors, and consummation of the sale is considered probable and expected within one year. The related operations of assets held for sale are reported as discontinued if such operations and cash flows can be clearly distinguished both operationally and financially from the ongoing operations, such operations and cash flows will be eliminated from ongoing operations once the disposal occurs, and if the Company will not have any significant continuing involvement subsequent to the sale.
Earnings Per Share—Earnings per share is calculated based upon the weighted-average number of shares of common stock outstanding during the period. For the years ended December 31, 2010, 2009 and 2008, the weighted-average numbers of shares of common stock outstanding, basic and diluted, were approximately 263,516, 235,873, and 210,192 respectively.
Use of Estimates—Management has made a number of estimates and assumptions related to the reporting of assets and liabilities and the disclosure of contingent assets and liabilities to prepare these consolidated financial statements in conformity with generally accepted accounting principles. For example, significant estimates and assumptions are made in connection with the allocation of purchase price and the analysis of real estate, equity method investments and loan impairment. Actual results could differ from those estimates.
Reclassifications—Certain prior period amounts in the audited consolidated financial statements have been reclassified to conform to the current period presentation.
Segment Information—Operating segments are components of an enterprise for which separate financial information is available and is evaluated regularly by the chief operating decision maker in deciding how to allocate resources and in assessing performance. The Company’s chief operating decision maker currently evaluates the Company’s operations from a number of different operational perspectives including but not limited to a property-by-property basis and by tenant and operator. The Company derives all significant revenues from a single reportable operating segment of business, lifestyle real estate. Accordingly, the Company does not report more than one segment; nevertheless, management periodically evaluates whether the Company continues to have one single reportable segment of business.
Recent Accounting Pronouncements—In December 2010, the FASB issued ASU 2010-29, Business Combinations (Topic 805), or ASU 2010-29. ASU 2010-29 amends ASC Topic 805 to require the disclosure of pro forma revenue and earnings for all business combinations that occurred during the current year to be presented as of the beginning of the comparable prior annual reporting period. The amendments in ASU 2010-29 also expand the supplemental pro forma disclosures to include a description of the nature and amount of material,
85
Table of Contents
CNL LIFESTYLE PROPERTIES, INC.
AND SUBSIDIARIES
NOTES TO CONSOLIDATED FINANCIAL STATEMENTS
| 2. | Significant Accounting Policies (Continued): |
nonrecurring pro forma adjustments directly attributable to the business combination included in the reported pro forma revenue and earnings. ASU 2010-29 is effective for business combinations for which the acquisition date is on or after the beginning of the first annual reporting period beginning on or after December 15, 2010.
3. Acquisitions:
During the year ended December 31, 2010, the Company acquired the following properties (in thousands):
| Property/Description |
Location | Date of Acquisition |
Purchase Price |
|||||||||
| Anacapa Isle Marina— |
California | 3/12/2010 | $ | 9,829 | ||||||||
| One marina (leasehold interest) |
||||||||||||
| Ballena Isle Marina— |
California | 3/12/2010 | 8,179 | |||||||||
| One marina (leasehold and fee interests) |
||||||||||||
| Cabrillo Isle Marina— |
California | 3/12/2010 | 20,575 | |||||||||
| One marina (leasehold interest) |
||||||||||||
| Ventura Isle Marina— |
California | 3/12/2010 | 16,417 | |||||||||
| One marina (leasehold interest) |
||||||||||||
| Bohemia Vista Yacht Basin— |
Maryland | 5/20/2010 | 4,970 | |||||||||
| One marina (fee interest) |
||||||||||||
| Hack’s Point Marina— |
Maryland | 5/20/2010 | 2,030 | |||||||||
| One marina (fee interest) |
||||||||||||
| Pacific Park— |
California | 12/29/2010 | 34,000 | |||||||||
| One attraction (leasehold interest) |
||||||||||||
| Total | $ | 96,000 | ||||||||||
The properties above are subject to long-term triple-net leases with renewal options. In connection with the transactions, the Company paid approximately $81.0 million in cash, net of approximately $1.0 million deposit made in 2009, excluding transaction costs, and assumed three existing loans collateralized by three properties, Anacapa Isle Marina, Cabrillo Isle Marina and Ventura Isle Marina, with an aggregate outstanding principal balance of approximately $14.0 million, which were recorded at their estimated fair values of approximately $13.6 million.
The following summarizes the allocation of the purchase price for the above properties, which approximates the fair values of the assets acquired and liabilities assumed (in thousands):
| Total
Purchase Price Allocation |
||||
| Land and land improvements |
$ | 6,091 | ||
| Leasehold interests and improvements |
70,097 | |||
| Buildings |
10,103 | |||
| Equipment |
8,550 | |||
| Intangibles |
765 | |||
| Below market loan premium |
394 | |||
| Mortgage notes payable |
(14,000 | ) | ||
| Total |
$ | 82,000 | ||
86
Table of Contents
CNL LIFESTYLE PROPERTIES, INC.
AND SUBSIDIARIES
NOTES TO CONSOLIDATED FINANCIAL STATEMENTS
3. Acquisitions (Continued):
The revenue and net operating results attributable to the properties included in the Company’s consolidated statements of operations for the years ended December 31, 2010 and 2009 were approximately $7.0 million and $0.5 million, respectively.
The following presents unaudited pro forma results of operations of the Company as if the properties above were acquired as of January 1, 2009 and owned during the entire years ended December 31, 2010 and 2009 (in thousands, except per share data):
| Year
Ended December 31, |
||||||||
| 2010 | 2009 | |||||||
| Revenues |
$ | 310,513 | $ | 265,603 | ||||
| Expenses |
(368,690 | ) | (248,996 | ) | ||||
| Other expense |
(21,789 | ) | (33,224 | ) | ||||
| Net loss |
$ | (79,966 | ) | $ | (16,617 | ) | ||
| Loss per share of common stock (basic and diluted) |
$ | (0.30 | ) | $ | (0.07 | ) | ||
| Weighted average number of shares of common stock outstanding (basic and diluted) |
263,516 | 235,873 | ||||||
In connection with the Company’s acquisition on March 12, 2010 of four marinas, the Company agreed to pay additional purchase consideration up to a maximum of $10.0 million, contingent upon the properties achieving certain performance thresholds. However, the Company determined, based on its estimates and the likelihood of the properties achieving such thresholds, that the fair value of the liability was zero as of the acquisition date and December 31, 2010.
4. Real Estate Investment Properties, net:
As of December 31, 2010 and 2009, real estate investment properties consisted of the following (in thousands):
| 2010 | 2009 | |||||||
| Land and land improvements |
$ | 1,011,838 | $ | 999,355 | ||||
| Leasehold interests and improvements |
306,694 | 235,914 | ||||||
| Buildings |
626,882 | 617,100 | ||||||
| Equipment |
491,278 | 435,578 | ||||||
| Construction in progress |
— | 20,021 | ||||||
| Less: accumulated depreciation and amortization |
(411,170 | ) | (286,780 | ) | ||||
| Total |
$ | 2,025,522 | $ | 2,021,188 | ||||
For the years ended December 31, 2010, 2009 and 2008, the Company had depreciation expense of approximately $124.8 million, $122.6 million and $96.7 million, respectively.
The Company has been monitoring the performance of its two Great Wolf Lodge properties, which have had ongoing challenges due to the general economic conditions, local market conditions and competition over the past several years. During 2010, management determined that the property level performance was not recovering
87
Table of Contents
CNL LIFESTYLE PROPERTIES, INC.
AND SUBSIDIARIES
NOTES TO CONSOLIDATED FINANCIAL STATEMENTS
| 4. | Real Estate Investment Properties, net (Continued): |
as originally anticipated and that it was no longer in the Company’s best interest to fund debt service on the non-recourse loans encumbering the properties at the current level without a modification of the existing terms. If the Company is unable to restructure the loans with more favorable terms, it may decide to deed the properties back to the lender in lieu of foreclosure to satisfy the non-recourse loans. Due to these changes in circumstances, the Company evaluated the carrying values of the properties for impairment, and based on a probability weighted analysis of the estimated undiscounted cash flows under the potential scenarios and holding periods, the Company determined that the carrying value of the assets may not be recoverable. As a result, at September 30, 2010, the Company reduced the carrying values of the properties to the estimated fair value of approximately $58.9 million by recording an impairment provision in the amount of $24.2 million. Also, during the year ended December 31, 2010, the Company determined that the carrying values of one golf property and one attraction property were not fully recoverable and recorded an impairment provision of approximately $2.7 million for the related assets.
5. Intangible Assets, net:
The gross carrying amount and accumulated amortization of the Company’s intangible assets as of December 31, 2010 and 2009 are as follows (in thousands):
| Intangible Assets |
Gross Carrying Amount |
Accumulated Amortization |
2010 Net Book Value |
|||||||||
| In place leases |
$ | 17,293 | $ | 3,249 | $ | 14,044 | ||||||
| Trade name |
10,798 | 1,032 | 9,766 | |||||||||
| Trade name |
1,531 | — | 1,531 | |||||||||
| Below market lease |
629 | 41 | 588 | |||||||||
| Total |
$ | 30,251 | $ | 4,322 | $ | 25,929 | ||||||
| Intangible Assets |
Gross Carrying Amount |
Accumulated Amortization |
2009 Net Book Value |
|||||||||
| In place leases |
$ | 23,093 | $ | 3,132 | $ | 19,961 | ||||||
| Trade name |
10,798 | 776 | 10,022 | |||||||||
| Trade name |
1,429 | — | 1,429 | |||||||||
| Below market lease |
629 | 9 | 620 | |||||||||
| Total |
$ | 35,949 | $ | 3,917 | $ | 32,032 | ||||||
88
Table of Contents
CNL LIFESTYLE PROPERTIES, INC.
AND SUBSIDIARIES
NOTES TO CONSOLIDATED FINANCIAL STATEMENTS
| 5. | Intangible Assets, net (Continued): |
Amortization expense was approximately $1.4 million, $1.5 million and $1.4 million for the years ended December 31, 2010, 2009 and 2008, respectively. The Company wrote off approximately $5.5 million and $0.6 million of in-place lease intangibles related to lease terminations for the year ended December 31, 2010 and 2009, respectively. The estimated future amortization expense for the Company’s intangible assets with finite lives, as of December 31, 2010 is as follows (in thousands):
| 2011 |
$ | 1,149 | ||
| 2012 |
1,149 | |||
| 2013 |
1,149 | |||
| 2014 |
1,149 | |||
| 2015 |
1,149 | |||
| Thereafter |
18,653 | |||
| Total |
$ | 24,398 | ||
6. Operating Leases:
In October 2010, PARC defaulted on its lease and loan obligations to the Company. As a result, on November 19, 2010, the Company entered into a lease termination and settlement agreement with PARC and transitioned nine family entertainment center properties to a new third-party tenant or management company with the remaining nine attraction properties transitioned to new third-party management companies during first the quarter of 2011. In connection with the termination, the Company recorded a loss on lease termination totaling approximately $53.7 million, which includes the write-offs and expenses of approximately $5.5 million in intangible lease assets, approximately $14.6 million in lease incentives, approximately $18.4 million in deferred rents and approximately $15.2 million in lease termination payments. In addition, the Company recorded a loan loss provision of approximately $4.1 million related to the notes receivable and accrued interest, which were deemed uncollectible. For the year ended December 31, 2010, the Company also terminated its lease on an additional lifestyle property and recorded loss on lease termination of approximately $1.8 million. Going forward, the rental income that was previously recorded under the operating leases will be replaced by the operating revenues and expenses of the properties in the Company’s consolidated statements of operations until new leases are entered into.
On October 25, 2010, Vail Resorts Inc. acquired 100% of the equity interest in the companies that operate Northstar-at-Tahoe Resort and the Village at Northstar from Booth Creek Resort Properties LLC and became the Company’s tenant under the existing leases on the properties.
As of December 31, 2010, the Company leased 89 properties under long-term, triple-net leases to third-parties. The following is a schedule of future minimum lease payments to be received under the non-cancellable operating leases with third-parties at December 31, 2010 excluding properties that were previously leased to PARC (in thousands):
| 2010 |
$ | 112,258 | ||
| 2012 |
115,628 | |||
| 2013 |
119,286 | |||
| 2014 |
123,053 | |||
| 2015 |
126,079 | |||
| Thereafter |
1,657,329 | |||
| Total |
$ | 2,253,633 | ||
89
Table of Contents
CNL LIFESTYLE PROPERTIES, INC.
AND SUBSIDIARIES
NOTES TO CONSOLIDATED FINANCIAL STATEMENTS
6. Operating Leases (Continued):
Under the triple-net leases, the tenants are responsible for paying the Company percentage rent and capital improvement reserve rent. Capital improvement reserves are generally based on a percentage of gross revenue of the property and are set aside by the Company for capital improvements including replacements, from time to time, of furniture, fixtures and equipment. Percentage rent is generally based on a percentage of gross revenue after it exceeds a certain threshold. Total percentage rent recorded was approximately $1.0 million for both of the years ended December 31, 2010 and 2009 and $3.7 million, for the year ended December 31, 2008. Capital improvement reserves are generally based on a percentage of gross revenue at the property and totaled approximately $24.5 million, $24.6 million and $25.5 million, for the years ended December 31, 2010, 2009 and 2008, respectively. In addition, tenants are generally responsible for repairs, maintenance, property taxes, utilities, insurance and expenses of ground leases, concession holds or land permits. For the years ended December 31, 2010, 2009 and 2008, the tenants paid approximately $24.2 million, $21.5 million and $19.3 million, respectively, for property taxes related to properties that the Company owns.
7. Variable Interest and Unconsolidated Entities:
Consolidated VIEs
The Company adopted the new guidance for consolidation and VIEs, where it performed an analysis and determined that it has five wholly owned subsidiaries designed as single property entities to own and lease its respective properties to single tenant operators that are VIEs due to potential future buy-out options held by the respective tenants, which are not currently exercisable. Two other properties in which service providers have a significant variable interest were also determined to be VIEs. The Company determined that it is the primary beneficiary and holds a controlling financial interest in these entities due to the Company’s power to direct the activities that most significantly impact the economic performance of the entities, as well as its obligation to absorb the most significant losses and its right to receive significant benefits from these entities. As such, the transactions and accounts of these VIEs are included in the accompanying consolidated financial statements. The adoption of the new guidance and the identification of these entities as VIEs did not have an impact on the Company’s financial statements, as the subsidiaries have historically been consolidated and continue to be consolidated under the new guidance.
The aggregate carrying amount and major classifications of the consolidated assets that can be used to settle obligations of the VIEs and liabilities of the consolidated VIEs that are non-recourse to the Company as of December 31, 2010 are as follows (in thousands):
| Assets |
||||
| Real estate investment properties, net |
$ | 216,574 | ||
| Other assets |
$ | 23,553 | ||
| Liabilities |
||||
| Mortgages and other notes payable |
$ | 86,408 | ||
| Other liabilities |
$ | 13,168 | ||
The Company’s maximum exposure to loss as a result of its involvement with these VIEs is limited to its net investment in these entities which totaled approximately $140.6 million as of December 31, 2010. The Company’s exposure is limited because of the non-recourse nature of the borrowings of the VIEs.
90
Table of Contents
CNL LIFESTYLE PROPERTIES, INC.
AND SUBSIDIARIES
NOTES TO CONSOLIDATED FINANCIAL STATEMENTS
7. Variable Interest and Unconsolidated Entities (Continued):
Unconsolidated Entities
The Company has investments in two unconsolidated joint ventures that are accounted for under the equity method of accounting. The adoption of the new consolidation guidance did not impact the Company’s financial statements or reporting of these entities. The Company has determined that the DMC Partnership is not a VIE, and that the Intrawest Venture is a VIE. While several significant decisions are shared between the Company and its joint venture partners, the Company does not direct the activities that most significantly impact the venture’s performance. The Company’s maximum exposure to loss as a result of its involvement with the Intrawest Venture is primarily limited to the carrying amount of its net investment in the venture, which totaled approximately $30.2 million as of December 31, 2010.
The Company uses the HLBV method of accounting to allocate income and losses between venture partners for its unconsolidated entities. The HLBV method allocates income and loss between venture partners to most appropriately match the distribution of cash from unconsolidated entities whose annual operating cash flows and, in some cases, liquidating cash flows are distributed to the Company and its partners based on preferences and complex waterfall calculations as outlined in the respective partnership agreements. Under the HLBV method of accounting, the Company recognizes income in each period equal to the change in its share of assumed proceeds from the liquidation of the underlying unconsolidated entities at depreciated book value. For the years ended December 31, 2010, 2009 and 2008, the Company recognized equity in earnings from the entities of approximately $11.0 million, $5.6 million and $3.0 million, respectively.
The following tables present financial information for the unconsolidated entities for the years ended December 31, 2010, 2009 and 2008 (in thousands):
Summarized Operating Data
| Year Ended December 31, 2010 | ||||||||||||
| DMC Partnership |
Intrawest Venture |
Total | ||||||||||
| Revenue |
$ | 27,476 | $ | 15,396 | $ | 42,872 | ||||||
| Property operating expenses |
(549 | ) | (7,033 | ) | (7,582 | ) | ||||||
| Depreciation & amortization expenses |
(8,654 | ) | (3,997 | ) | (12,651 | ) | ||||||
| Interest expense |
(8,702 | ) | (5,526 | ) | (14,228 | ) | ||||||
| Interest and other income |
37 | 64 | 101 | |||||||||
| Net income (loss) |
$ | 9,608 | $ | (1,096 | ) | $ | 8,512 | |||||
| Loss allocable to other venture partners(1) |
$ | (1,655 | ) | $ | (1,533 | ) | $ | (3,188 | ) | |||
| Income allocable to the Company(1) |
$ | 11,263 | $ | 437 | $ | 11,700 | ||||||
| Amortization of capitalized costs |
(488 | ) | (234 | ) | (722 | ) | ||||||
| Equity in earnings of unconsolidated entities |
$ | 10,775 | $ | 203 | $ | 10,978 | ||||||
| Distributions declared to the Company |
$ | 11,263 | $ | 1,579 | $ | 12,842 | ||||||
| Distributions received by the Company |
$ | 11,112 | $ | 1,579 | $ | 12,691 | ||||||
91
Table of Contents
CNL LIFESTYLE PROPERTIES, INC.
AND SUBSIDIARIES
NOTES TO CONSOLIDATED FINANCIAL STATEMENTS
7. Variable Interest and Unconsolidated Entities (Continued):
Summarized Operating Data
| Year Ended December 31, 2009 | ||||||||||||||||
| Wolf Partnership(2) |
DMC Partnership |
Intrawest Venture |
Total | |||||||||||||
| Revenue |
$ | 19,750 | $ | 29,131 | $ | 14,362 | $ | 63,243 | ||||||||
| Property operating expenses |
(15,954 | ) | (697 | ) | (7,681 | ) | (24,332 | ) | ||||||||
| Depreciation & amortization expenses |
(4,413 | ) | (8,659 | ) | (3,863 | ) | (16,935 | ) | ||||||||
| Interest expense |
(2,357 | ) | (8,894 | ) | (5,592 | ) | (16,843 | ) | ||||||||
| Interest and other income (expense) |
(4 | ) | 24 | 42 | 62 | |||||||||||
| Net income (loss) |
$ | (2,978 | ) | $ | 10,905 | $ | (2,732 | ) | $ | 5,195 | ||||||
| Income (loss) allocable to other venture partners(1) |
$ | (528 | ) | $ | 478 | $ | (1,322 | ) | $ | (1,372 | ) | |||||
| Income (loss) allocable to the Company(1) |
$ | (2,450 | ) | $ | 10,427 | $ | (1,410 | ) | $ | 6,567 | ||||||
| Amortization of capitalized costs |
(207 | ) | (496 | ) | (234 | ) | (937 | ) | ||||||||
| Equity in earnings (loss) of unconsolidated entities |
$ | (2,657 | ) | $ | 9,931 | $ | (1,644 | ) | $ | 5,630 | ||||||
| Distributions declared to the Company |
$ | — | $ | 10,427 | $ | 809 | $ | 11,236 | ||||||||
| Distributions received by the Company |
$ | — | $ | 9,832 | $ | 954 | $ | 10,786 | ||||||||
Summarized Operating Data
| Year Ended December 31, 2008 | ||||||||||||||||
| Wolf Partnership |
DMC Partnership |
Intrawest Venture |
Total | |||||||||||||
| Revenue |
$ | 31,510 | $ | 29,189 | $ | 15,963 | $ | 76,662 | ||||||||
| Property operating expenses |
(28,158 | ) | (755 | ) | (7,934 | ) | (36,847 | ) | ||||||||
| Depreciation & amortization expenses |
(7,335 | ) | (8,549 | ) | (4,771 | ) | (20,655 | ) | ||||||||
| Interest expense |
(3,998 | ) | (9,100 | ) | (5,663 | ) | (18,761 | ) | ||||||||
| Interest and other income |
21 | 25 | 167 | 213 | ||||||||||||
| Net income (loss) |
$ | (7,960 | ) | $ | 10,810 | $ | (2,238 | ) | $ | 612 | ||||||
| Income (loss) allocable to other venture partners(1) |
$ | (2,414 | ) | $ | 834 | $ | (1,785 | ) | $ | (3,365 | ) | |||||
| Income (loss) allocable to the Company(1) |
$ | (5,546 | ) | $ | 9,976 | $ | (453 | ) | $ | 3,977 | ||||||
| Amortization of capitalized costs |
(227 | ) | (496 | ) | (234 | ) | (957 | ) | ||||||||
| Equity in earnings (loss) of unconsolidated entities |
$ | (5,773 | ) | $ | 9,480 | $ | (687 | ) | $ | 3,020 | ||||||
| Distributions declared to the Company |
$ | — | $ | 10,251 | $ | 2,876 | $ | 13,127 | ||||||||
| Distributions received by the Company |
$ | — | $ | 10,405 | $ | 4,478 | $ | 14,883 | ||||||||
FOOTNOTES:
| (1) | Income is allocated between the Company and its partnership using the HLBV method of accounting. |
| (2) | As a result of the Company’s purchase of Great Wolf’s 30.3% interest in the Wolf Partnership, the results of operations for the partnership are only presented through August 5, 2009. The results of operations for the properties from August 6, 2009 through December 31, 2009 were consolidated in the Company’s consolidated statements of operations. |
92
Table of Contents
CNL LIFESTYLE PROPERTIES, INC.
AND SUBSIDIARIES
NOTES TO CONSOLIDATED FINANCIAL STATEMENTS
7. Variable Interest and Unconsolidated Entities (Continued):
Summarized Balance Sheet Data
| As of December 31, 2010 | ||||||||||||
| DMC Partnership(1) |
Intrawest Venture(1) |
Total(1) | ||||||||||
| Real estate assets, net |
$ | 246,397 | $ | 94,991 | $ | 341,388 | ||||||
| Intangible assets, net |
6,321 | 1,325 | 7,646 | |||||||||
| Other assets |
7,051 | 12,541 | 19,592 | |||||||||
| Mortgages and other notes payable |
142,015 | 76,893 | 218,908 | |||||||||
| Other liabilities |
4,544 | 13,062 | 17,606 | |||||||||
| Partners’ capital |
113,210 | 18,902 | 132,112 | |||||||||
| Company’s share of partners’ capital |
81.9 | % | 80.0 | % | ||||||||
Summarized Balance Sheet Data
| As of December 31, 2009 | ||||||||||||
| DMC Partnership(1) |
Intrawest Venture(1) |
Total(1) | ||||||||||
| Real estate assets, net |
$ | 251,791 | $ | 97,082 | $ | 348,873 | ||||||
| Intangible assets, net |
6,571 | 1,506 | 8,077 | |||||||||
| Other assets |
6,673 | 11,463 | 18,136 | |||||||||
| Mortgages and other notes payable |
145,293 | 77,165 | 222,458 | |||||||||
| Other liabilities |
4,808 | 13,036 | 17,844 | |||||||||
| Partners’ capital |
114,934 | 19,850 | 134,784 | |||||||||
| Company’s share of partners’ capital |
81.9 | % | 80.0 | % | ||||||||
FOOTNOTE:
| (1) | As of December 31, 2010 and 2009, the Company’s share of partners’ capital was approximately $131.3 million and $132.4 million, respectively, and the total difference between the carrying amount of investment and the Company’s share of partners’ capital was approximately $9.1 million and $10.1 million, respectively. |
The Company’s maximum exposure to loss is primarily limited to the carrying amount of its investment in each of the unconsolidated entities. The unconsolidated entities have debt obligations totaling approximately $207.8 million as of December 31, 2010. If the Company engages in certain prohibited activities there are circumstances which could trigger an obligation on the part of the Company with respect to a portion of this debt.
93
Table of Contents
CNL LIFESTYLE PROPERTIES, INC.
AND SUBSIDIARIES
NOTES TO CONSOLIDATED FINANCIAL STATEMENTS
8. Mortgages and Other Notes Receivable, net:
As of December 31, 2010 and 2009, mortgages and other notes receivable consisted of the following (in thousands):
| Loan Principal Amount as of December 31, |
||||||||||||||||||||||||
| Borrower and Description of Collateral Property |
Date of Loan Agreement (s) |
Maturity Date |
Interest Rate |
Accrued Interest |
2010 | 2009 | ||||||||||||||||||
| PARC Management LLC (equipment)(1) |
11/13/2008 | 11/12/2011 | 8.00% -8.50% | — | 584 | (1) | 584 | |||||||||||||||||
| Big Sky Resort (one ski resort) |
9/23/2008 | 9/1/2012 | 12.00% | 680 | 68,000 | 68,000 | ||||||||||||||||||
| Booth Creek Resort Properties LLC (one ski property and one parcel of land)(2) |
1/18/2007 | 1/15/2012 | variable | — | — | 12,327 | ||||||||||||||||||
| CMR Properties, LLC and CM Resort, LLC (one ski property and one construction loan)(2) |
6/15/2010 | 9/30/2017 | 9.00% - 11.00% | 63 | 13,787 | — | ||||||||||||||||||
| Marinas International, Inc. |
12/22/2006 | 12/22/2021 | 9.00% - 10.25% | 307 | 7,449 | 39,151 | ||||||||||||||||||
| (one marina and one construction loan)(3) |
3/30/2010 | |||||||||||||||||||||||
| Boyne USA, Inc. (four ski resorts) |
8/10/2009 | 9/1/2012 | 6.30% - 15.00% | 1,224 | 18,208 | 18,680 | ||||||||||||||||||
| PARC Magic Springs LLC (one parcel of land and membership interests)(1) |
5/8/2009 | 8/1/2012 | 10.00% - 11.00% | 13 | (1) | 1,475 | (1) | 1,486 | ||||||||||||||||
| PARC Investors, LLC and PARC Operations, LLC |
2/10/2010 | 9/1/2010 | 9.00% | — | 3,000 | (1) | — | |||||||||||||||||
| (membership interest)(1) |
||||||||||||||||||||||||
| Evergreen Alliance Golf Limited, L.P.(4) |
11/12/2010 | 11/1/2013 | 11.00% | 60 | 4,000 | — | ||||||||||||||||||
| Total |
$ | 2,347 | 116,503 | 140,228 | ||||||||||||||||||||
| Accrued interest |
2,347 | 2,628 | ||||||||||||||||||||||
| Acquisition fees, net |
1,750 | 2,956 | ||||||||||||||||||||||
| Loan origination fees, net |
(101 | ) | (172 | ) | ||||||||||||||||||||
| Loan loss provision |
(4,072 | )(1) | — | |||||||||||||||||||||
| Total carrying amount |
$ | 116,427 | $ | 145,640 | ||||||||||||||||||||
FOOTNOTES:
| (1) | In connection with the lease termination and settlement agreement with PARC as discussed above, the Company deemed these mortgages and notes receivable uncollectible and recorded a loan loss provision of approximately $4.1 million including accrued interest for these loans. |
| (2) | During 2010, Booth Creek Resort Properties, LLC (“Booth Creek”), an existing borrower, sold its property (Cranmore Mountain Resort) that is collateralized by a loan from the Company to an affiliate of Jiminy Peak Mountain Resort, LLC, an existing tenant. In addition, Booth Creek sold its 100% equity interest in the company that operates two of our ski and lifestyle properties to Vail Resorts, Inc. In connection with the transactions, Booth Creek repaid a loan with an outstanding balance of approximately $3.9 million, including accrued and deferred interest. An affiliate of Jiminy Peak Mountain Resort LLC assumed one loan that had an outstanding principal balance of approximately $8.8 million. The loan was amended with the following terms: annual interest rate of 6.0% with periodic increases to 11.0% over the life of the loan until maturity on September 30, 2017 with monthly interest-only payments. Simultaneously, the Company committed to provide a $7.0 million construction loan to fund a significant expansion of the property with the following terms: annual interest rate of 9.0% with periodic increases to 11.0% over the life of the loan until maturity on September 30, 2017 with monthly interest-only payments. The Company obtained a call option, and the new borrower retained a put option to allow or cause the Company, to purchase the Cranmore Mountain Resort, if certain criteria are met in years 2015 through 2017. The Company’s obligation to the put option would be limited to the outstanding loan balance. As of December 31, 2010, approximately $5.0 million was drawn on the construction loan for improvements at the resort. |
94
Table of Contents
CNL LIFESTYLE PROPERTIES, INC.
AND SUBSIDIARIES
NOTES TO CONSOLIDATED FINANCIAL STATEMENTS
8. Mortgages and Other Notes Receivable, net (Continued):
| (3) | On December 10, 2010, Marinas International, Inc., an existing borrower, repaid its three outstanding loans of approximately $36.8 million including accrued interest. On March 30, 2010, it entered into a new construction loan for approximately $3.1 million which is collateralized by one marina property. Approximately $2.9 million was drawn as of December 31, 2010. The loan bears an annual interest rate of 9.0% with monthly interest-only payments until January 1, 2011, at which time, monthly payments of principal and interest in the amount of $25,216 with unpaid principal and interest due at maturity on December 22, 2021. In addition, Marinas International is required to pay an exit fee at maturity equal to the aggregate of monthly interest payments that would have been payable if the annual interest rate had been 10.25% instead of 9.0%. |
| (4) | On November 12, 2010, EAGLE Golf borrowed $4.0 million which is collateralized by substantially all of EAGLE Golf’s accounts receivable, inventory and tangible personal property. The loan bears an annual interest rate of 11.0% with monthly interest only payments. The principal together with all accrued and unpaid interest are due at maturity on November 1, 2013. |
The following is a schedule of future maturities for all mortgages and other notes receivable (in thousands):
| 2011 |
$ | 93 | ||
| 2012 |
86,310 | |||
| 2013 |
4,112 | |||
| 2014 |
122 | |||
| 2015 |
134 | |||
| Thereafter |
20,673 | |||
| Total |
$ | 111,444 | (1) | |
FOOTNOTE:
| (1) | Amount is presented net of loan loss provision and a parcel of land with a fair value of $1.0 million to be deeded to the Company to satisfy a portion of the loan. |
The Company has two outstanding loans to unrelated VIEs totaling approximately $13.8 million, which represents the Company’s maximum exposure to loss related to these investments. The Company determined it is not the primary beneficiary of the VIEs because it does not have the ability to direct the activities that most significantly impact the economic performance of the entities.
9. Discontinued Operations:
On December 12, 2008, the Company sold its Talega Golf Course property to Won & Jay, Inc. (“W&J”) for $22.0 million, resulting in a gain of approximately $4.5 million. At the same time, the Company paid approximately $2.4 million in loan prepayment fees and paid off the portion of the mortgage loan collateralized by this property of approximately $8.8 million. In connection with the sale, the Company received cash in the amount of $12.0 million and a promissory note from W&J in the amount of $10.0 million, which was subsequently repaid, and terminated its lease on the property with Heritage Golf.
95
Table of Contents
CNL LIFESTYLE PROPERTIES, INC.
AND SUBSIDIARIES
NOTES TO CONSOLIDATED FINANCIAL STATEMENTS
9. Discontinued Operations: (Continued)
The results of discontinued operations are summarized below (in thousands):
| Year ended December 31, 2008 |
||||
| Revenues |
$ | 1,626 | ||
| Expenses |
(595 | ) | ||
| Depreciation and amortization |
(752 | ) | ||
| Income from discontinued operations |
279 | |||
| Gain on sale of assets |
4,470 | |||
| Loss on extinguishment of debt |
(2,353 | ) | ||
| Total |
$ | 2,396 | ||
| 10. | Public Offerings and Stockholders’ Equity: |
As of December 31, 2010, the Company had cumulatively raised approximately $3.0 billion (301.2 million shares) in subscription proceeds including approximately $270.1 million (28.4 million shares) received through the Company’s dividend reinvestment plan pursuant to a registration statement on Form S-11 under the Securities Act of 1933. The following information provides detail about the Company’s completed and current offerings as of December 31, 2010:
| Offering |
Commenced | Closed | Maximum Offering |
Total Offering Proceeds (in thousands) |
||||||||||||
| 1st (File No. 333-108355) |
4/16/2004 | 3/31/2006 | $ | 2.0 billion | $ | 520,728 | ||||||||||
| 2nd (File No. 333-128662) |
4/4/2006 | 4/4/2008 | $ | 2.0 billion | 1,520,035 | |||||||||||
| 3rd (File No. 333-146457) |
4/9/2008 | Ongoing | $ | 2.0 billion | 954,770 | |||||||||||
| Total |
$ | 2,995,533 | ||||||||||||||
The Company’s board of directors determined that the Company does not intend to commence another public offering of its shares following the completion of its current public offering on April 9, 2011. However, the Company intends to continue offering shares through its reinvestment plan. In making this decision, the board of directors considered a number of factors, including the Company’s size and diversification of its portfolio and its relatively low leverage and strong cash position, as well as the current stage of the Company’s lifecycle.
In connection with the 3rd Offering, CNL Securities Corp., the Managing Dealer of the Company’s public offerings, will receive selling commissions of up to 7.0% of gross offering proceeds on all shares sold, a marketing support fee of 3.0% of gross proceeds, and reimbursement of actual expenses incurred up to 0.10% of gross offering proceeds in connection with due diligence of the offerings. A substantial portion of the selling commissions and marketing support fees are reallocated to third-party participating broker dealers. In addition, the Advisor will receive acquisition fees of 3.0% of gross offering proceeds of the offering for services in the selection, purchase, development or construction of real property or equity investments and 3.0% of loan proceeds for services in connection with the incurrence of debt. Shares owned by the advisor, the directors, or any of their affiliates are subject to certain voting restrictions. Neither the advisor, nor the directors, nor any of their affiliates may vote or consent on matters submitted to the stockholders regarding the removal of the advisor, directors, or any of their affiliates or any transactions between the Company and any of them.
96
Table of Contents
CNL LIFESTYLE PROPERTIES, INC.
AND SUBSIDIARIES
NOTES TO CONSOLIDATED FINANCIAL STATEMENTS
10. Public Offerings and Stockholders’ Equity (Continued):
The Company has and will continue to incur costs in connection with the offering and issuance of shares, including filing fees, legal, accounting, printing, selling commissions, marketing support fees, due diligence expense reimbursements and escrow fees, which are deducted from the gross proceeds of the offering. As of December 31, 2010 and 2009, the total cumulative offering and stock issuance costs incurred were approximately $310.9 million and $273.4 million, respectively.
In accordance with the Company’s amended and restated articles of incorporation, the total amount of selling commissions, marketing support fees, due diligence expense reimbursement, and organizational and offering expenses to be paid by the Company may not exceed 13.0% of the aggregate offering proceeds. As of December 31, 2010 and 2009, there were no offering costs in excess of the 13.0% limitation that had been billed to the Company.
11. Other Assets:
As of December 31, 2010, other assets primarily consisted of deposits of approximately $11.5 million, assets, working capital and collateral received in connection with lease terminations of approximately $17.8 million, costs in connection with obtaining loans of approximately $8.4 million, a security deposit on a ground lease relating to one of our attraction properties of approximately $5.0 million and the change in fair value of one of the Company’s interest rate swaps of approximately $0.5 million. As of December 31, 2009, other assets primarily consisted of a certificate of deposit of approximately $8.2 million, collateralizing one of the Company’s letters of credit and costs in connection with obtaining loans of approximately $7.3 million.
97
Table of Contents
CNL LIFESTYLE PROPERTIES, INC.
AND SUBSIDIARIES
NOTES TO CONSOLIDATED FINANCIAL STATEMENTS
12. Mortgages and Other Notes Payable:
As of December 31, 2010 and 2009, the Company had the following indebtedness (in thousands):
| Collateral & Approximate Carrying Value of Collateral at December 31, 2010 |
Interest Rate(1) |
Maturity Date |
Balance as of December 31, |
|||||||||||||
| 2010 | 2009 | |||||||||||||||
| Variable rate debt: |
||||||||||||||||
| Mortgage debt |
1 multi-family residential property, $95.6 million |
30-day LIBOR + 1.25% | 1/2/2016 | $ | 66,379 | (2) | $ | 85,413 | ||||||||
| Mortgage debt |
1 hotel property, $70.8 million |
30-day LIBOR + 2.00% | 7/13/2011 | 25,000 | 25,000 | |||||||||||
| Mortgage debt |
1 hotel property, $46.1 million |
30-day LIBOR + 2.75% and 5.00% floor | 7/6/2011 | 18,129 | 6,427 | |||||||||||
| Mortgage debt |
1 ski and mountain lifestyle property, $24.7 million |
30-day LIBOR + 3.25% | 9/1/2019 | 9,664 | (2) | 9,957 | ||||||||||
| Mortgage debt |
1 ski and mountain lifestyle property, $41.2 million |
CDOR + 3.75% | 11/30/2014 | 19,494 | (2) | 19,064 | ||||||||||
| Total variable rate debt |
$ | 138,666 | $ | 145,861 | ||||||||||||
| Fixed rate debt: |
||||||||||||||||
| Mortgage debt |
1 golf property, $8.5 million |
7.28% | 3/1/2016 | $ | 5,660 | $ | 5,770 | |||||||||
| Mortgage debt |
23 golf properties, $239.4 million | 6.09% | 2/5/2016 | 123,460 | 135,375 | |||||||||||
| Mortgage debt |
8 golf properties, $72.7 million |
6.58% | 7/1/2017 | 39,079 | 39,903 | |||||||||||
| Mortgage debt |
5 ski and mountain lifestyle properties, $215.6 million | 6.11% | 4/5/2014 | 99,786 | 103,245 | |||||||||||
| Mortgage debt |
5 golf properties, $34.7 million |
6.35% | 3/1/2017 | 22,768 | 23,276 | |||||||||||
98
Table of Contents
CNL LIFESTYLE PROPERTIES, INC.
AND SUBSIDIARIES
NOTES TO CONSOLIDATED FINANCIAL STATEMENTS
12. Mortgages and Other Notes Payable (Continued):
| Collateral & Approximate Carrying Value of Collateral at December 31, 2010 |
Interest Rate(1) |
Maturity Date |
Balance as of December 31, |
|||||||||||||
| 2010 | 2009 | |||||||||||||||
| Fixed rate debt: (continued) |
||||||||||||||||
| Mortgage debt |
2 golf properties, $67.1 million | 6.33% | 12/1/2016 | 34,484 | 35,273 | |||||||||||
| Mortgage debt |
3 golf properties, $25.9 million | 6.18% | 12/1/2016 | 15,149 | 15,502 | |||||||||||
| Mortgage debt |
2 hotel properties, $58.0 million | 6.08% | 3/1/2013 | 58,823 | (3) | 58,183 | ||||||||||
| Mortgage debt |
3 marina properties, $44.1 million | 6.29% - 6.50% | |
9/1/2016 - 12/1/2016 |
|
13,269 | — | |||||||||
| Seller financing |
$10.0 million pledged account | 8.75% | 4/1/2019 | — | 18,600 | |||||||||||
| Seller financing |
3 ski and mountain lifestyle properties, $125.9 million | 9.00% - 9.50% | 12/31/2011 | 52,000 | 52,000 | |||||||||||
| Seller financing |
$8.0 million certificate of deposit | 5.77% | 6/19/2010 | — | 6,500 | |||||||||||
| Total fixed rate debt |
$ | 464,478 | $ | 493,627 | ||||||||||||
| Total debt |
$ | 603,144 | $ | 639,488 | ||||||||||||
| Discount |
3,399 | 4,304 | ||||||||||||||
| Total |
$ | 606,543 | $ | 643,792 | ||||||||||||
FOOTNOTES:
| (1) | The 30-day LIBOR rate was approximately 0.26% and 0.23%, respectively as of December 31, 2010 and 2009. The 30-day CDOR rate was approximately 1.20% and 0.40% as of December 31, 2010 and 2009, respectively. |
| (2) | The Company has entered into interest rate swaps for these variable rate debts. See Note 14, “Derivative instruments and Hedging Activities” for additional information. |
| (3) | On November 1, 2010, in order to induce the special servicer of the loan pool to enter into discussions regarding a loan restructure, the Company elected not to make the scheduled loan payment, thereby defaulting under the non-recourse loan which had an outstanding principal balance of approximately $62.0 million as of that date. As a result, the loan may be accelerated at the option of the lender. As of the date of this filing, the Company continues its negotiation to modify the loan in an attempt to obtain more favorable terms; however, there can be no assurances that the Company will be successful in obtaining a modification of the loan terms. If the Company is successful in obtaining a modification of the loan, it may consider continuing to hold the properties long term. However, if the Company is unsuccessful in negotiating more favorable terms, it may decide that it is in its best interest to deed the properties back to the lender in lieu of foreclosure to satisfy the non-recourse loan. |
99
Table of Contents
CNL LIFESTYLE PROPERTIES, INC.
AND SUBSIDIARIES
NOTES TO CONSOLIDATED FINANCIAL STATEMENTS
12. Mortgages and Other Notes Payable (Continued):
On December 6, 2010, the Company restructured the mortgage loan collateralized by its multi-family residential property with an original principal balance of approximately $85.4 million to $66.4 million under a troubled debt restructure. In connection with the restructure, Tranche B and C notes with a principal balance of $22.1 million were satisfied with a repayment of $6.0 million and the remaining balance was forgiven. The Tranche A was modified to an interest rate of LIBOR + 1.25% and the maturity was extended to January 2, 2016. The troubled debt restructure resulted in a gain on extinguishment of debt of approximately $14.4 million or a gain in earnings of approximately $0.05 per share and is included in the accompanying consolidated statements of operations for the year ended December 31, 2010. The management evaluated the residential property’s operating performance and based on the estimated current and projected operating cash flows, the property is not deemed impaired.
On August 18, 2010, the Company repaid $9.0 million and added one additional property as collateral under one of its mortgage loans with an original principal balance of $140.0 million in exchange for an extension of the maturity date from February 5, 2013 to February 5, 2016. As of December 31, 2010, the outstanding balance of this mortgage loan was approximately $123.5 million.
In connection with the lease termination and settlement agreement with PARC as discussed above, the Company repaid the unsecured seller financing with the $10.0 million collateral provided in March 2010 and approximately $6.0 million in cash resulting in a gain in extinguishment of debt of approximately $0.9 million.
On March 12, 2010, in connection with the acquisition of four marina properties, the Company assumed three existing loans that are collateralized by three of the properties with an aggregate outstanding principal balance of approximately $14.0 million, which were recorded at their estimated fair values totaling approximately $13.6 million. The loans bear interest at fixed rates between 6.29% and 6.50%, require monthly payments of principal and interest and mature between September 1, 2016 and December 1, 2016.
The following is a schedule of future principal payments and maturities for all mortgages and other notes payable (in thousands):
| 2011 |
$ | 109,123 | ||
| 2012 |
14,602 | |||
| 2013 |
74,675 | |||
| 2014 |
116,096 | |||
| 2015 |
10,834 | |||
| Thereafter |
281,213 | |||
| Total |
$ | 606,543 | ||
As of December 31, 2010, three of the Company’s loans require the Company to meet certain customary financial covenants and ratios, with which the Company is in compliance. The Company’s other long-term borrowings are not subject to any significant financial covenants.
13. Line of Credit:
On March 30, 2010, the Company obtained a syndicated revolving line of credit (the “2013 Revolver”) with $85.0 million in total borrowing capacity, of which $58.0 million was drawn as of December 31, 2010. The 2013 Revolver bears interest at LIBOR plus 4.75%, is collateralized by a pool of the Company’s properties, matures
100
Table of Contents
CNL LIFESTYLE PROPERTIES, INC.
AND SUBSIDIARIES
NOTES TO CONSOLIDATED FINANCIAL STATEMENTS
13. Line of Credit (Continued):
on March 30, 2013 and requires the Company to maintain customary financial covenants, including minimum debt service, fixed charge and interest coverage ratios and maximum leverage ratio. As of December 31, 2010, the Company was in compliance with these covenants. In connection with obtaining the 2013 Revolver, the Company recorded approximately $2.9 million in loan costs, repaid its previous line of credit with an outstanding balance of approximately $96.6 million and wrote off approximately $0.4 million in remaining unamortized loan costs from its previous line of credit.
14. Derivative Instruments and Hedging Activities:
The Company utilizes derivative instruments to partially offset the effect of fluctuating interest rates on the cash flows associated with its variable-rate debt. The Company follows established risk management policies and procedures in its use of derivatives and does not enter into or hold derivatives for trading or speculative purposes. The Company records all derivative instruments on its balance sheet at fair value. On the date the Company enters into a derivative contract, the derivative is designated as a hedge of the exposure to variable cash flows of a forecasted transaction. The effective portion of the derivative’s gain or loss is initially reported as a component of other comprehensive income (loss) and subsequently recognized in the statement of operations in the periods in which earnings are impacted by the variability of the cash flows of the hedged item. Any ineffective portion of the gain or loss is reflected in interest expense in the statement of operations.
The Company has three interest rate swaps that were designated as cash flow hedges of interest payments from their inception. The following table summarizes the terms and fair values of the Company’s derivative financial instruments as of December 31, 2010 and 2009, which are included in other assets and other liabilities in the accompanying consolidated balance sheets (in thousands).
| Notional Amount |
Strike | Trade Date |
Maturity Date |
Fair Value as of December 31, | ||||||||||||||||||
| 2010 | 2009 | |||||||||||||||||||||
| $ | — | (1) | 4.285%(1) | 1/2/2008 | 1/2/2015 | $ | — | $ | 3,802 | |||||||||||||
| — | (1) | 4.305%(1) | 1/2/2008 | 1/2/2015 | — | 1,123 | ||||||||||||||||
| 57,300 | 3.120%(1) | 12/6/2010 | 1/2/2016 | (510 | ) | — | ||||||||||||||||
| 9,664 | 6.890% | 9/28/2009 | 9/1/2019 | 495 | 46 | |||||||||||||||||
| 19,494 | (2) | 6.430%(2) | 12/1/2009 | 12/1/2014 | 341 | 15 | ||||||||||||||||
| $ | 86,458 | |||||||||||||||||||||
FOOTNOTES:
| (1) | In connection with the restructuring of one of the Company’s mortgage loans as discussed in Note 12, the Company terminated two interest rate swaps that were designated as cash flow hedges totaling $74.0 million with fixed interest rates of 5.805% to 6.0% and entered into a new interest rate swap of $57.3 million with a blended fixed rate of 3.12% for the term of the loan. The fair value of this instrument has been recorded as an asset of approximately $0.5 million as of December 31, 2010. Through the December 6, 2010 date of termination, the Company recorded the changes in the fair value of these interest rate swaps of approximately $9.0 million included in other comprehensive loss of which approximately $2.4 million relating to the ineffectiveness change in fair value and reduction in hedge liabilities resulting from the termination were reclassified and included in statements of operations as interest expense. In addition, the Company began amortizing the remaining approximately $6.6 million in other comprehensive loss over the |
101
Table of Contents
CNL LIFESTYLE PROPERTIES, INC.
AND SUBSIDIARIES
NOTES TO CONSOLIDATED FINANCIAL STATEMENTS
14. Derivative Instruments and Hedging Activities (Continued):
| remaining period of the loan since the originally forecasted payments are still probable of occurring. The strike rate above does not include the credit spread on the notional amount. The credit spread as of December 31, 2010 is 1.25% totaling a blended fixed rate of 3.12% for the term of the loan. |
| (2) | On November 30, 2009, the Company obtained a $20.0 million loan (denominated in Canadian dollars). The loan bears interest at CDOR plus 3.75% that has been fixed with an interest rate swap to 6.43% for the term of the loan. The notional amount has been converted from Canadian dollars to U.S. dollars at an exchange rate of 0.9999 Canadian dollars for $1.0000 U.S. dollar on December 31, 2010. |
As of December 31, 2010, the Company’s hedges qualified as highly effective and, accordingly, all of the change in value is reflected in other comprehensive loss. Determining fair value and testing effectiveness of these financial instruments requires management to make certain estimates and judgments. Changes in assumptions could have a positive or negative impact on the estimated fair values and measured effectiveness of such instruments could, in turn, impact the Company’s results of operations.
15. Fair Value Measurements:
The Company’s derivative instruments are valued primarily based on inputs other than quoted prices that are observable for the assets or liabilities (such as interest rates, volatilities, and credit risks), and are classified as Level 2 in the fair value hierarchy. The valuation of derivative instruments also includes a credit value adjustment which is a Level 3 input. However, the impact of the assumption is not significant to its overall valuation calculation and therefore the Company considers its derivative instruments to be classified as Level 2. The fair value of such instruments was a net liability of approximately $0.3 million and $5.0 million as of December 31, 2010 and 2009, respectively, and is included in other assets and other liabilities in the accompanying consolidated balance sheets.
In connection with certain property acquisitions, the Company has agreed to pay additional purchase consideration contingent upon the respective property achieving certain financial performance goals over a specified period. Upon the closing of the acquisition, the Company estimates the fair value of any expected additional purchase consideration to be paid, which is classified as Level 3 in the fair value hierarchy. Such amounts are recorded and included in other liabilities in the accompanying consolidated balances sheets and totaled approximately $0.6 million and $14.4 million as of December 31, 2010 and 2009, respectively. During the year ended December 31, 2010, the Company paid approximately $12.4 million in additional purchase consideration, thereby satisfying a portion of the estimated liability. Changes in estimates or the periodic accretion of the estimated payments are recognized as a period cost in the accompanying consolidated statements of operations.
The following tables show the fair value of the Company’s financial assets and liabilities carried at fair value (in thousands):
| Fair Value Measurements as of December 31, 2010 | ||||||||||||||||
| Balance
at December 31, 2010 |
Level 1 | Level 2 | Level 3 | |||||||||||||
| Assets: |
||||||||||||||||
| Derivative instruments |
$ | 510 | $ | — | $ | 510 | $ | — | ||||||||
| Liabilities: |
||||||||||||||||
| Derivative instruments |
$ | 836 | $ | — | $ | 836 | $ | — | ||||||||
| Contingent purchase consideration |
$ | 625 | $ | — | $ | — | $ | 625 | ||||||||
102
Table of Contents
CNL LIFESTYLE PROPERTIES, INC.
AND SUBSIDIARIES
NOTES TO CONSOLIDATED FINANCIAL STATEMENTS
15. Fair Value Measurements (Continued):
| Fair Value Measurements as of December 31, 2010 | ||||||||||||||||
| Balance
at December 31, 2009 |
Level 1 | Level 2 | Level 3 | |||||||||||||
| Liabilities: |
||||||||||||||||
| Derivative instruments |
$ | 4,986 | $ | — | $ | 4,986 | $ | — | ||||||||
| Contingent purchase consideration |
$ | 14,402 | $ | — | $ | — | $ | 14,402 | ||||||||
The following information details the changes in the fair value measurements using significant unobservable inputs (Level 3) for the year ended December 31, 2010 (in thousands):
| Liabilities | ||||
| Beginning balance |
$ | 14,402 | ||
| Payment of additional purchase consideration |
(12,433 | ) | ||
| Accretion of discounts |
156 | |||
| Adjustment to estimates(1) |
(1,500 | ) | ||
| Ending balance |
$ | 625 | ||
FOOTNOTE:
| (1) | In connection with the acquisition of Wet’n’Wild Hawaii in 2009, the Company agreed to pay additional purchase consideration of up to $14.7 million upon the property achieving certain financial performance goals over the next three years. During 2010, the operating income of the property did not exceed certain performance thresholds. As such, the additional purchase price consideration was reduced. |
16. Income Taxes:
As of December 31, 2010 and 2009, the Company recorded net current and long-term deferred tax assets related to depreciation differences, deferred income, and net operating losses at its TRS subsidiaries. Because there are no historical earnings and no certainty that such deferred tax assets will be available to offset future tax liabilities, the Company has established a full valuation allowance as of December 31, 2010 and 2009. The components of the deferred taxes recognized in the accompanying consolidated balance sheets at December 31, 2010 and 2009 are as follows (in thousands):
| Year Ended December 31, |
||||||||
| 2010 | 2009 | |||||||
| Net operating losses |
$ | 69,018 | $ | 52,075 | ||||
| Book/tax differences in deferred income |
299 | (2,647 | ) | |||||
| Book/tax differences in acquired assets |
(35,357 | ) | (28,222 | ) | ||||
| Total deferred tax asset |
33,960 | 21,206 | ||||||
| Valuation allowance |
(33,960 | ) | (21,206 | ) | ||||
| $ | — | $ | — | |||||
103
Table of Contents
CNL LIFESTYLE PROPERTIES, INC.
AND SUBSIDIARIES
NOTES TO CONSOLIDATED FINANCIAL STATEMENTS
16. Income Taxes (Continued):
The Company’s TRS subsidiaries had net operating loss carry-forwards for federal and state purposes of approximately $166.5 million and $126.8 million as of December 31, 2010 and 2009, respectively, to offset future taxable income. The estimated net operating loss carry-forwards will expire as follows:
| Expiration year |
Net Operating Loss |
|||
| 2025 |
$ | 1,600 | ||
| 2026 |
5,600 | |||
| 2027 |
26,700 | |||
| 2028 |
44,900 | |||
| 2029 |
48,000 | |||
| 2030 |
39,700 | |||
The Company analyzed its material tax positions and determined that it has not taken any uncertain tax positions.
17. Related Party Arrangements:
On March 14, 2008, the Company entered into a services agreement with CNL Capital Markets Corp. (“CCM”), an affiliate of the Company’s advisor and of the managing dealer of the Company’s securities offerings, pursuant to which CCM will serve as the Company’s agent in connection with certain services related to the Company’s offerings and securities. Effective on March 14, 2008, CCM, acting as the Company’s agent, entered into a transfer agency and services agreement with Boston Financial Data Services, Inc. (“Boston Financial”), an affiliate of State Street Bank and Trust Company, pursuant to which Boston Financial has been engaged to act as the transfer agent (the “Transfer Agent”) for the Company’s common stock.
Certain directors and officers of the Company hold similar positions with both its Advisor, CNL Lifestyle Company, LLC (the “Advisor”) which is both a stockholder of the Company as well as its Advisor, and CNL Securities Corp., (the “Managing Dealer”), for the Company’s public offerings. The Company’s chairman of the board indirectly owns a controlling interest in CNL Financial Group, Inc., the parent company of the Advisor and Managing Dealer. The Advisor and Managing Dealer receive fees and compensation in connection with the Company’s stock offerings and the acquisition, management and sale of the Company’s assets.
For the years ended December 31, 2010, 2009 and 2008, the Company incurred the following fees (in thousands):
| Year Ended December 31, | ||||||||||||
| 2010 | 2009 | 2008 | ||||||||||
| Selling commissions |
$ | 23,141 | $ | 15,484 | $ | 21,899 | ||||||
| Marketing support fee & due diligence expense reimbursements |
9,931 | 6,654 | 9,392 | |||||||||
| Total |
$ | 33,072 | $ | 22,138 | $ | 31,291 | ||||||
The Managing Dealer is entitled to selling commissions of up to 7.0% of gross offering proceeds and marketing support fees of 3.0% of gross offering proceeds, in connection with the Company’s offerings, as well as actual expenses of up to 0.10% of proceeds in connection with due diligence. A substantial portion of the selling commissions and marketing support fees and all of the due diligence expenses are reallowed to third-party participating broker dealers.
104
Table of Contents
CNL LIFESTYLE PROPERTIES, INC.
AND SUBSIDIARIES
NOTES TO CONSOLIDATED FINANCIAL STATEMENTS
17. Related Party Arrangements (Continued):
For the years ended December 31, 2010, 2009 and 2008, the Advisor earned fees and incurred reimbursable expenses as follows (in thousands):
| Year Ended December 31, | ||||||||||||
| 2010 | 2009 | 2008 | ||||||||||
| Acquisition fees:(1) |
||||||||||||
| Acquisition fees from offering proceeds |
$ | 10,990 | $ | 6,512 | $ | 10,239 | ||||||
| Acquisition fees from debt proceeds |
1,535 | 2,614 | 5,506 | |||||||||
| Total |
12,525 | 9,126 | 15,745 | |||||||||
| Asset management fees:(2) |
26,808 | 25,075 | 21,937 | |||||||||
| Reimbursable expenses:(3) |
||||||||||||
| Offering costs |
3,706 | 3,618 | 5,587 | |||||||||
| Acquisition costs |
226 | 114 | 1,732 | |||||||||
| Operating expenses |
9,254 | 9,616 | 4,235 | |||||||||
| Total |
13,186 | 13,348 | 11,554 | |||||||||
| Total fees earned and reimbursable expenses |
$ | 52,519 | $ | 47,549 | $ | 49,236 | ||||||
FOOTNOTES:
| (1) | Acquisition fees are paid for services in connection with the selection, purchase, development or construction of real property, generally equal to 3.0% of gross offering proceeds, and 3.0% of loan proceeds for services in connection with the incurrence of debt. |
| (2) | Asset management fees are equal to 0.08334% per month of the Company’s “real estate asset value,” as defined in the Company’s prospectus, and the outstanding principal amount of any mortgage loan as of the end of the preceding month. |
| (3) | The Advisor and its affiliates are entitled to reimbursement of certain expenses incurred on behalf of the Company in connection with the Company’s organization, offering, acquisitions, and operating activities. Pursuant to the advisory agreement, the Company will not reimburse the Advisor any amount by which total operating expenses paid or incurred by the Company exceed the greater of 2% of average invested assets or 25% of net income (the “Expense Cap”) in any expense year, as defined in the advisory agreement. For the expense years ended December 31, 2010, 2009 and 2008, operating expenses did not exceed the Expense Cap. |
105
Table of Contents
CNL LIFESTYLE PROPERTIES, INC.
AND SUBSIDIARIES
NOTES TO CONSOLIDATED FINANCIAL STATEMENTS
17. Related Party Arrangements (Continued):
Amounts due to the Advisor and its affiliates for fees and expenses described above are as follows (in thousands):
| Year Ended December 31, |
||||||||
| 2010 | 2009 | |||||||
| Due to the Advisor and its affiliates: |
||||||||
| Offering expenses |
$ | 457 | $ | 256 | ||||
| Asset management fees |
2,291 | 2,212 | ||||||
| Operating expenses |
1,211 | 1,305 | ||||||
| Acquisition fees and expenses |
1,113 | 119 | ||||||
| Total |
$ | 5,072 | $ | 3,892 | ||||
| Due to Managing Dealer: |
||||||||
| Selling commissions |
$ | 380 | $ | 243 | ||||
| Marketing support fees and due diligence expense reimbursements |
162 | 104 | ||||||
| Total |
$ | 542 | $ | 347 | ||||
| Total due to affiliates |
$ | 5,614 | $ | 4,239 | ||||
The Company also maintains accounts at a bank in which the Company’s chairman and vice-chairman serve as directors. The Company had deposits at that bank of approximately $5.3 million and $26.1 million as of December 31, 2010 and 2009, respectively.
18. Redemption of Shares:
In March 2010, the Company amended its redemption plan to clarify the board of directors’ discretion in establishing the amount of redemptions to be processed each quarter and to allow certain priority groups of stockholders with requests made pursuant to circumstances such as death, qualifying disability, bankruptcy or unforeseeable emergency to have their redemption requests processed ahead of the general stockholder population. The board of directors has determined to limit redemptions to no more than $7.5 million per quarter at this time.
The following details the Company’s redemptions for the year ended December 31, 2010 and 2009 (in thousands except per share data).
| 2010 Quarters |
First | Second | Third | Fourth | Full Year | |||||||||||||||
| Requests in queue |
1,324 | 1,387 | 2,263 | 3,043 | 1,324 | |||||||||||||||
| Redemptions requested |
1,981 | 1,746 | 1,583 | 1,372 | 6,682 | |||||||||||||||
| Shares redeemed: |
||||||||||||||||||||
| Prior period requests |
(1,200 | ) | (538 | ) | (540 | ) | (558 | ) | (2,836 | ) | ||||||||||
| Current period requests |
(594 | ) | (225 | ) | (226 | ) | (208 | ) | (1,253 | ) | ||||||||||
| Adjustments(1) |
(124 | ) | (107 | ) | (37 | ) | (54 | ) | (322 | ) | ||||||||||
| Pending redemption requests(2) |
1,387 | 2,263 | 3,043 | 3,595 | 3,595 | |||||||||||||||
| Average price paid per share |
$ | 9.73 | $ | 9.83 | $ | 9.79 | $ | 9.79 | $ | 9.77 | ||||||||||
106
Table of Contents
CNL LIFESTYLE PROPERTIES, INC.
AND SUBSIDIARIES
NOTES TO CONSOLIDATED FINANCIAL STATEMENTS
18. Redemption of Shares (Continued):
| 2009 Quarters |
First | Second | Third | Fourth | Full Year |
|||||||||||||||
| Requests in queue |
— | — | 1,297 | 1,301 | — | |||||||||||||||
| Redemptions requested |
2,268 | 3,409 | 1,762 | 1,872 | 9,311 | |||||||||||||||
| Shares redeemed: |
||||||||||||||||||||
| Prior period requests |
— | — | (1,297 | ) | (1,173 | ) | (2,470 | ) | ||||||||||||
| Current period requests |
(2,268 | ) | (2,112 | ) | (461 | ) | (598 | ) | (5,439 | ) | ||||||||||
| Adjustments(1) |
— | — | — | (78 | ) | (78 | ) | |||||||||||||
| Pending redemption requests(2) |
— | 1,297 | 1,301 | 1,324 | 1,324 | |||||||||||||||
| Average price paid per share |
$ | 9.55 | $ | 9.58 | $ | 9.70 | $ | 9.35 | $ | 9.55 | ||||||||||
FOOTNOTES:
| (1) | This amount represents redemption request cancellations and other adjustments. |
| (2) | Requests that are not fulfilled in whole during a particular quarter will be redeemed on a pro rata basis pursuant to the redemption plan. |
19. Distributions:
In order to qualify as a REIT for federal income tax purposes, the Company must, among other things, make distributions each taxable year equal to at least 90% of its REIT taxable income. The Company intends to make regular distributions, and the board of directors currently intends to declare distributions on a monthly basis using the first day of the month as the record date. For the years ended December 31, 2010, 2009 and 2008, the Company declared and paid distributions of approximately $163.9 million ($0.6252 per share), $154.5 million ($0.6577 per share) and $128.4 million ($0.6150 per share), respectively.
For the years ended December 31, 2010, 2009 and 2008, approximately 0.3%, 4.4% and 41.0% of the distributions paid to the stockholders were considered taxable income and approximately 99.7%, 95.6% and 59.0% were considered a return of capital for federal income tax purposes, respectively. No amounts distributed to stockholders are required to be or have been treated as a return of capital for purposes of calculating the stockholders’ return on their invested capital as described in the advisory agreement.
20. Concentrations of Risk:
As of December 31, 2010 and 2009 and for the three years ended through December 31, 2010, the Company had the following tenants that individually accounted for 10% or more of its aggregate total revenues or assets.
| Tenant |
Number & Type of |
Percentage of Total Revenues |
Percentage of
Total Assets |
|||||||||||||||||||
| 2010 | 2009 | 2008 | 2010 | 2009 | ||||||||||||||||||
| PARC Management, LLC (“PARC”)(1) |
—(1) | 11.0 | %(1) | 18.3 | % | 21.0 | % | — | (1) | 14.3 | % | |||||||||||
| Boyne USA, Inc. (“Boyne”) |
7 Ski & Mountain Lifestyle Properties | 12.6 | % | 15.3 | % | 19.4 | % | 8.8 | % | 9.2 | % | |||||||||||
| Evergreen Alliance Golf Limited, L.P. |
43 Golf Facilities | 12.1 | % | 14.3 | % | 20.6 | % | 14.6 | % | 15.4 | % | |||||||||||
| Booth Creek Ski Holding, Inc.(2) (“Booth”) |
1 Ski & Mountain Lifestyle Property | 1.8 | % | 8.3 | % | 12.2 | % | 1.2 | % | 6.3 | % | |||||||||||
107
Table of Contents
CNL LIFESTYLE PROPERTIES, INC.
AND SUBSIDIARIES
NOTES TO CONSOLIDATED FINANCIAL STATEMENTS
20. Concentrations of Risk (Continued):
FOOTNOTES:
| (1) | As of December 31, 2010, the Company was in the process of transitioning all of its properties previously leased to PARC to new third-party managers. This process was completed in February 2011 and PARC is no longer a tenant of the Company. |
| (2) | On October 25, 2010, Vail Resorts Inc. acquired 100% of the equity interest in the companies that operate two of our ski and mountain lifestyle properties from Booth Creek Resort Properties LLC and became our tenant under the existing leases on the properties. |
Additionally, the Company has made loans to Boyne and PARC that together generated interest income totaling approximately $11.4 million or 3.7%, $9.0 million or 3.6% and $2.3 million or 1.1% of total revenues for the years ended December 31, 2010, 2009 and 2008, respectively. In connection with the lease termination and settlement agreement with PARC, the Company deemed the loans to be uncollectible and recorded a loan loss provision for the year ended December 31, 2010.
Failure of any of these tenants to pay contractual lease or interest payments could significantly impact the Company’s results of operations and cash flows from operations which, in turn would impact its ability to pay debt service and make distributions to stockholders.
The Company’s real estate investment portfolio is geographically diversified with properties in 32 states and Canada. The Company owns ski and mountain lifestyle properties in eight states and Canada with a majority of those properties located in the northeast, California and Canada. The Company’s golf properties are located in 15 states with a majority of those facilities located in “Sun Belt” states. The Company’s attractions properties are located in 13 states with a majority located in the Southern and Western United States.
As of December 31, 2010, the Company’s investments in real estate when aggregated by initial purchase price were concentrated in the following asset classes: approximately 27% in ski and mountain lifestyle, 24% in golf facilities, 19% in attractions, 8% in marinas and 22% in additional lifestyle properties. Adverse events or conditions affecting those asset classes and related industries, such as severe weather conditions or economic downturn, could significantly impact the Company’s ability to generate rental income or cash flows which, in turn would significantly impact its ability to pay debt service and make distributions to stockholders.
21. Commitments and Contingencies:
The Company has commitments under ground leases, concession holds and land permit fees. Ground lease payments, concession holds and land permit fees are generally based on a percentage of gross revenue of the underlying property over certain thresholds, and are paid by the third-party tenants in accordance with the terms of the triple-net leases with those tenants. These fees and expenses were approximately $12.6 million, $11.6 million and $9.5 million for the years ended December 31, 2010, 2009 and 2008, respectively, and have been reflected as ground lease, concession hold and permit fees with a corresponding increase in rental income from operating leases in the accompanying consolidated statements of operations.
In connection with the acquisition of Wet’n’Wild Hawaii in 2009, the Company agreed to pay additional purchase consideration of up to $14.7 million upon the property achieving certain financial performance goals over the next three years of which approximately $12.4 million was paid during 2010 satisfying a portion of the
108
Table of Contents
CNL LIFESTYLE PROPERTIES, INC.
AND SUBSIDIARIES
NOTES TO CONSOLIDATED FINANCIAL STATEMENTS
21. Commitments and Contingencies (Continued)
estimated liability. During 2010, the operating income of the property did not exceed certain performance thresholds. As such, the additional purchase price consideration was reduced. As of December 31, 2010 and 2009, the fair value of the additional purchase consideration was approximately $0.6 million and $14.4 million, respectively, included in other liabilities in accompanying consolidated balance sheets. This additional purchase consideration, if paid, will be added to the contractual lease basis used to calculate rent and will result in additional rent being generated from this property.
The following is a schedule of future obligations under ground leases, concession holds and land permits (in thousands):
| 2011 |
$ | 14,376 | ||
| 2012 |
14,376 | |||
| 2013 |
14,376 | |||
| 2014 |
14,376 | |||
| 2015 |
14,376 | |||
| Thereafter |
253,911 | |||
| Total |
$ | 325,791 | ||
From time to time the Company may be exposed to litigation arising from operations of its business in the ordinary course of business. Management is not aware of any litigation that it believes will have a material adverse impact on the Company’s financial condition or results of operations.
22. Selected Quarterly Financial Data (Unaudited):
The following table presents selected unaudited quarterly financial data for the year ended December 31, 2010 and 2009 (in thousands except per share data):
| 2010 Quarters |
First | Second | Third | Fourth | Year | |||||||||||||||
| Total revenues |
$ | 83,666 | $ | 71,465 | $ | 80,254 | $ | 69,043 | $ | 304,428 | ||||||||||
| Operating income (loss) |
15,213 | 5,116 | (60,786 | ) | (19,814 | ) | (60,271 | ) | ||||||||||||
| Equity in earnings of unconsolidated entities |
3,177 | 2,525 | 2,811 | 2,465 | 10,978 | |||||||||||||||
| Net income (loss) |
6,789 | (4,532 | ) | (69,790 | )(1) | (14,356 | )(1) | (81,889 | ) | |||||||||||
| Weighted average number of shares outstanding (basic and diluted) |
250,327 | 257,727 | 267,353 | 278,299 | 263,516 | |||||||||||||||
| Earnings (loss) per share of common stock (basic and diluted) |
$ | 0.03 | $ | (0.02 | ) | $ | (0.26 | ) | $ | (0.05 | ) | $ | (0.31 | ) | ||||||
| 2009 Quarters |
First | Second | Third | Fourth | Year | |||||||||||||||
| Total revenues |
$ | 61,003 | $ | 57,757 | $ | 64,589 | $ | 69,922 | $ | 253,271 | ||||||||||
| Operating income (loss) |
6,762 | 770 | 7,046 | (1,566 | ) | 13,012 | ||||||||||||||
| Equity in earnings of unconsolidated entities |
6 | 118 | 3,332 | 2,174 | 5,630 | |||||||||||||||
| Net loss |
(2,044 | ) | (6,775 | ) | (93 | ) | (10,408 | ) | (19,320 | ) | ||||||||||
| Weighted average number of shares outstanding (basic and diluted) |
227,611 | 232,599 | 238,505 | 244,562 | 235,873 | |||||||||||||||
| Loss per share of common stock (basic and diluted) |
$ | (0.01 | ) | $ | (0.03 | ) | $ | (0.00 | ) | $ | (0.04 | ) | $ | (0.08 | ) | |||||
109
Table of Contents
CNL LIFESTYLE PROPERTIES, INC.
AND SUBSIDIARIES
NOTES TO CONSOLIDATED FINANCIAL STATEMENTS
22. Selected Quarterly Financial Data (Unaudited) (Continued):
FOOTNOTE:
| (1) | The increases in net loss during the last six months of 2010 was partially attributable to the lease termination with PARC and the impairment provision on four of the Company’s properties as discussed above. |
23. Subsequent Events:
The Company’s board of directors declared distributions of $0.0521 per share to stockholders of record at the close of business on January 1, 2011, February 1, 2011 and March 1, 2011. These distributions are to be paid by March 31, 2011.
In January 2011, the Company obtained a loan for $18.0 million that is collateralized by one of its ski and mountain lifestyle properties. The loan bears interest at 30-day LIBOR and requires monthly payments of principal and interest with the remaining principal and accrued interest due at maturity on December 31, 2015. On January 13, 2011, the Company entered into an interest swap thereby fixing the rate at 6.68%.
On January 10, 2011, the Company acquired an ownership interest in 29 senior living properties with an agreed upon value of $630.0 million from US Assisted Living Facilities III, Inc., (“Seller”), and Sunrise Senior Living Investments, Inc. (“Sunrise”) through a newly formed joint venture with Sunrise (the “Sunrise Venture”). The Company acquired 60% of the membership interests in the Sunrise Venture for an equity contribution of approximately $134.3 million, including transaction fees. Sunrise contributed cash and its interest in the previous joint venture with the Seller (“Old Venture”) for a 40% membership interest in the Sunrise Venture. The Sunrise Venture obtained $435.0 million in loan proceeds from new debt financing, a portion of which was used to refinance the existing indebtedness encumbering the properties, and acquired all of Seller’s interests in the Old Venture. Under the terms of the Company’s venture agreement with Sunrise, the Company receives a preferred return on its invested capital for the first six years and share control over major decisions with Sunrise. Sunrise holds the option to buy out the Company’s interest in the venture in years three through six at a price which would provide the Company with a 13% to 14% internal rate of return depending on the exercise date.
The current advisory agreement continues until March 22, 2011, and was extended by unanimous consent of the Company’s board of directors through April 9, 2011, at which time the Company will engage CNL Lifestyle Advisor Corporation (the “New Advisor”) as its advisor and enter into an advisory agreement with substantially similar terms and services as those provided under its current advisory agreement.
110
Table of Contents
| Item 9. | Changes in and Disagreements With Accountants on Accounting and Financial Disclosure |
None.
| Item 9A. | Controls and Procedures |
Evaluation of Disclosure Controls and Procedures
Pursuant to Rule 13a-15(b) under the Securities Exchange Act of 1934, as amended (the “Exchange Act”), under the supervision and with the participation of our management, including our principal executive officer and principal financial and accounting officers, we conducted an evaluation of the effectiveness of our disclosure controls and procedures (as defined under Rule 13a-15(e) under the Exchange Act) as of the end of the period covered by this report. Based upon that evaluation, our management, including our principal executive officer and principal financial and accounting officers, concluded that our disclosure controls and procedures are effective as of the end of the period covered by this report.
Management’s Report on Internal Control Over Financial Reporting
Management is responsible for establishing and maintaining adequate internal control over financial reporting (as defined in Rule 13a-15(f) under the Securities Exchange Act of 1934, as amended). The Company’s internal control over financial reporting is designed to provide reasonable assurance to the Company’s management and board of directors regarding the preparation and fair presentation of published financial statements.
Because of its inherent limitations, internal control over financial reporting may not prevent or detect misstatements. Also, projections of any evaluation of effectiveness to future periods are subject to the risk that controls may become inadequate because of changes in conditions, or that the degree of compliance with the policies or procedures may deteriorate.
Based on management’s assessment, the Company maintained, in all material respects, effective internal control over financial reporting as of December 31, 2010 using the criteria set forth by the Committee of Sponsoring Organizations of the Treadway Commission (COSO) in “Internal Control Integrated Framework”. The scope of management’s assessment of the effectiveness of internal control over financial reporting as of December 31, 2010 did not include the internal control over financial reporting for the Coco Key Water Resort, the eight family entertainment center (“FEC”) properties, or eight attractions properties. The Company terminated the leases on the Coco Key Water Resort and entered into a lease termination and settlement agreement with PARC for the FEC and attractions properties during the fourth quarter of 2010 and transitioned the properties to new third-party management companies at various dates between November 2010 and February 2011. In the period between the lease termination dates and the date of management’s report, it was not possible to conduct a complete assessment of internal control over financial reporting for the operations of these properties. The revenues attributable to the properties that were transitioned, between the date of the lease terminations and the date of this report, were less than one percent of total revenues of the Company for the year ended December 31, 2010.
This annual report does not include an attestation report of the Company’s independent registered certified public accounting firm regarding internal control over financial reporting. Management’s report was not subject to attestation by the Company’s independent registered certified public accounting firm pursuant to temporary rules of the Securities and Exchange Commission that permits the Company to provide only management’s report in this annual report.
Changes in Internal Control over Financial Reporting
During the most recent fiscal quarter, there was no change in our internal controls over financial reporting (as defined under Rule 13a-15(f) under the Exchange Act) that has materially affected, or is reasonably likely to materially affect, our internal controls over financial reporting.
111
Table of Contents
| Item 9B. | Other Information |
Departures and Appointments of Officers
On March 16, 2011, Tammie A. Quinlan gave notice of her intent to resign as Chief Financial Officer of the Company effective April 9, 2011. Ms. Quinlan will continue to serve in her role as Chief Financial Officer until completion of the Company’s common stock offering on April 9, 2011, at which time the duties and responsibilities of the Company’s principal financial officer will be assumed by Joseph T. Johnson, Senior Vice President and Chief Accounting Officer of the Company. Ms. Quinlan may be engaged by the Company’s advisor from time to time pursuant to a consultancy arrangement for a period of up to one year.
Most recently, Mr. Johnson has served as Senior Vice President and Chief Accounting Officer of the Company and over the past 10 years has been employed by the Company, it’s Advisor and affiliates in various accounting and financial reporting roles.
As a result of this appointment, there was no change in the compensation arrangements between the Company and Mr. Johnson, who is an officer of and is compensated by our Advisor. There are no family relationships between Mr. Johnson and any director or other executive officer of the Company.
112
Table of Contents
| Item 10. | Directors, Executive Officers and Corporate Governance |
The information required by this Item is incorporated by reference to our Definitive Proxy Statement to be filed with the Commission no later than April 30, 2011.
| Item 11. | Executive Compensation |
The information required by this Item is incorporated by reference to our Definitive Proxy Statement to be filed with the Commission no later than April 30, 2011.
| Item 12. | Security Ownership of Certain Beneficial Owners and Management and Related Stockholder Matters |
The information required by this Item is incorporated by reference to our Definitive Proxy Statement to be filed with the Commission no later than April 30, 2011.
| Item 13. | Certain Relationships and Related Transactions and Director Independence |
The information required by this Item is incorporated by reference to our Definitive Proxy Statement to be filed with the Commission no later than April 30, 2011.
| Item 14. | Principal Accountant Fees and Services |
The information required by this Item is incorporated by reference to our Definitive Proxy Statement to be filed with the Commission no later than April 30, 2011.
113
Table of Contents
| Item 15. | Exhibits and Financial Statement Schedules |
| (a) | Financial Statements |
| 1. | The Company is required to file the following separate audited financial statements of its unconsolidated subsidiaries which are filed as part of this report: |
CNL Dallas Market Center, LP and Subsidiaries
Report of Independent Registered Certified Public Accounting Firm
Consolidated Balance Sheets at December 31, 2010 and 2009
Consolidated Statement of Operations for the years ended December 31, 2010, 2009 and 2008
Consolidated Statement of Changes in Partners’ Capital for the years ended December 31, 2010, 2009 and 2008
Consolidated Statement of Cash Flows for the years ended December 31, 2010, 2009 and 2008
Notes to Consolidated Financial Statements for the years ended December 31, 2010, 2009 and 2008
| 2. | Financial Statement Schedules |
Schedule II—Valuation and Qualifying Accounts as of December 31, 2010
Schedule III—Real Estate and Accumulated Depreciation as of December 31, 2010
Schedule IV—Mortgage Loans and Real Estate at December 31, 2010
| (b) | Exhibits |
Exhibits
| 2.3 | Amended and Restated Partnership Interest Purchase Agreement between CNL Lifestyle Properties, Inc. and Dallas Market Center Company, Ltd. as of January 14, 2005 (Previously filed as Exhibit 2.4 to Post-Effective Amendment No. One to the Registration Statement on Form S-11 (File No. 333-108355) filed March 3, 2005, and incorporated herein by reference.) | |
| 3.1 | Amended and Restated Articles of Incorporation (Previously filed as Exhibit 3.3 to the Registration Statement on Form S-11 (File No. 333-108355) filed March 16, 2004, and incorporated herein by reference.) | |
| 3.2 | Bylaws (Previously filed as Exhibit 3.4 to the Registration Statement on Form S-11 (File No. 333-108355) filed March 16, 2004, and incorporated herein by reference.) | |
| 3.3 | Articles of Amendment to the Amended and Restated Articles of Incorporation (Previously filed as Exhibit 3.5 to the Registration Statement on Form S-11 (File No. 333-108355) filed April 9, 2004, and incorporated herein by reference.) | |
| 3.4 | Amendment No. One to the Bylaws (Previously filed as Exhibit 3.1 to the Report on Form 8-K filed on May 9, 2005 (File No. 000-51288) and incorporated herein by reference.) | |
| 3.5 | Amendment No. Two to the Bylaws (Previously filed as Exhibit 3.1 to the Report on Form 8-K filed on September 23, 2005 (File No. 000-51288) and incorporated herein by reference.) | |
| 3.6 | Articles of Amendment to the Amended and Restated Articles of Incorporation dated March 26, 2008 (Previously filed as Exhibit 3.1 to the Report on Form 8-K filed on
March 26, 2008 (File No. 000-51288) and incorporated herein by reference.) | |
114
Table of Contents
| 3.7 | Amendment No. Three to the Bylaws (Previously filed as Exhibit 3.1 to the Report on Form 8-K filed on December 5, 2007 and incorporated herein by reference.) | |
| 4.1 | Amended and Restated Redemption Plan (Previously filed as Exhibit 4.1 to the Report on Form 10-K filed on March 25, 2010.) | |
| 4.2 | Amended and Restated Reinvestment Plan (Previously filed as Appendix A to Pre-Effective Amendment No. One to the Registration Statement on Form S-11 (File No. 333-146457) filed March 28, 2008 and incorporated herein by reference.) | |
| 10.1 | Advisory Agreement between CNL Lifestyle Properties, Inc. and CNL Lifestyle Company, LLC dated March 22, 2010 (Previously filed as Exhibit 10.1 to the Report on Form 10-K filed on March 25, 2010.) | |
| 10.1.1 | Advisory Agreement between CNL Lifestyle Properties, Inc. and CNL Lifestyle Advisor Corporation approved March 16, 2011 to be effective April 10, 2011 (Filed herewith.) | |
| 10.2 | Indemnification Agreement between CNL Lifestyle Properties, Inc. and James M. Seneff, Jr. dated March 2, 2004. Each of the following directors and/or officers has signed a substantially similar agreement: Robert A. Bourne, Bruce Douglas, Dennis N. Folken, Robert J. Woody dated March 2, 2004, Thomas J. Hutchison III, R. Byron Carlock, Jr., Tammie A. Quinlan and Charles A. Muller dated April 19, 2004, Amy Sinelli dated June 14, 2005, Joseph Johnson dated January 1, 2006, Daniel Crowe dated March 22, 2006, Baxter Underwood dated September 9, 2008 and Kay S. Redlich and Holly Greer dated as of December 31, 2009 (Previously filed as Exhibit 10.4 to the Quarterly Report on Form 10-Q for the period ended June 30, 2004, filed August 4, 2004 and incorporated herein by reference.) | |
| 10.3 | Loan Agreement dated as of August 2, 2004 between WTC-Trade Mart, L.P., as Borrower and Bank of America, N.A., as Lender (Previously filed as Exhibit 10.16 to Post-Effective Amendment No. Three to the Registration Statement on Form S-11 (File No. 333-108355) filed on June 15, 2005 and incorporated herein by reference.) | |
| 10.4 | Loan Agreement dated as of August 8, 2003 by and between IFDC Property Company, Ltd., as Borrower and Bank of America, N.A., as Lender (Previously filed as Exhibit 10.19 to Post-Effective Amendment No. Three to the Registration Statement on Form S-11 (File No. 333-108355) filed on June 15, 2005 and incorporated herein by reference.) | |
| 10.5 | Sub-Permit and Lease Agreement dated as of May 26, 2006 by and between R&H US Canadian Cypress Limited in its capacity as the trustee of the Cypress Jersey Trust as Landlord and Cypress Bowl Recreations Limited Partnership as Tenant (Previously filed as Exhibit 10.1 to the Report on 8-K filed June 5, 2006 (File No. 000-51288) and incorporated herein by reference.) | |
| 10.6 | Personal Property Sublease Agreement dated as of May 18, 2006 by and between CNL Personal Property TRS ULC as Lessor and Cypress Bowl Recreations Limited Partnership as Lessee (Previously filed as Exhibit 10.2 to the Report on 8-K filed June 5, 2006 (File No. 000-51288) and incorporated herein by reference.) | |
| 10.7 | The Second Amended and Restated Loan Agreement dated February 9, 2007 between CNL Income Palmetto, LLC, et al., Borrowers, and Sun Life Assurance Company of Canada, Lender (Previously filed as Exhibit 10.60 to Post-Effective Amendment No. Five to the Registration Statement on Form S-11 (File No. 333-128662) filed March 8, 2007 and incorporated herein by reference.) | |
| 10.8 | Deed of Trust, Security Agreement and Financing Statement dated February 9, 2007 executed by CNL Income Canyon Springs, LLC, Grantor, in favor of Sun Life Assurance Company of Canada, Beneficiary (Previously filed as Exhibit 10.61 to Post-Effective Amendment No. Five to the Registration Statement on Form S-11 (File No. 333-128662) filed March 8, 2007 and incorporated herein by reference.) | |
115
Table of Contents
| 10.9 | Loan Agreement dated March 23, 2007 by and among CNL Income Northstar, LLC, et al, Borrower, and CNL Income SKI II, LLC et al, Pledgor and The Prudential Insurance Company of America, Lender (Previously filed as Exhibit 10.63 to Post-Effective Amendment No. Six to the Registration Statement on Form S-11 (File No. 333-128662) filed April 16, 2007 and incorporated herein by reference.) | |
| 10.10 | Sublease Agreement dated as of April 5, 2007 by and between CNL Income Enchanted Village, LLC, Landlord, and PARC Enchanted Parks, LLC, Tenant (Previously filed as Exhibit 10.64 to Post-Effective Amendment No. Six to the Registration Statement on Form S-11 (File No. 333-128662) filed April 16, 2007 and incorporated herein by reference.) | |
| 10.11 | Collateral Loan Agreement dated as of January 25, 2008 between CNL Income EAGL Southwest Golf, LC, et al., Borrower, and The Prudential Insurance Company of America, Lender (Previously filed as Exhibit 10.1 to Report on Form 8-K filed January 31, 2008 and incorporated herein by reference.) | |
| 10.12 | Deed of Trust and Security Agreement dated January 25, 2008 by CNL Income EAGL Southwest Golf, LLC, Borrower, to The Prudential Insurance Company of America, Lender (Ancala Country Club, Scottsdale, Arizona) (Previously filed as Exhibit 10.2 to Report on Form 8-K filed January 31, 2008 and incorporated herein by reference.) | |
| 10.13 | Ancala Country Club, Scottsdale, Arizona, Amended and Restated Lease Agreement dated as of March 31, 2009 between CNL Income EAGL Southwest Golf, LLC and Evergreen Alliance Golf Limited, L.P. (Previously filed as Exhibit 10.23 to Post-Effective Amendment No. Five to the Registration Statement on Form S-11 (File No. 333-146457) filed April 9, 2009 and incorporated herein by reference.) | |
| 10.14 | Omnibus Lease Resolution Agreement dated as of October 30, 2008 among Evergreen Alliance Golf Limited, L.P. et al. and CNL Income Partners, LP et al. (Previously filed as Exhibit 10.1 to the Quarterly Report on Form 10-Q for the period ended September 30, 2008, filed November 14, 2008 and incorporated by reference herein). | |
| 10.15 | First Amendment to Omnibus Lease Resolution Agreement dated as of December 30, 2008 among Evergreen Alliance Golf Limited, L.P. et al. and CNL Income Partners, LP et al. (Previously filed as Exhibit 10.20 to Post-Effective Amendment No. Five to the Registration Statement on Form S-11 (File No. 333-146457) filed April 9, 2009 and incorporated herein by reference.) | |
| 10.16 | Second Amendment to Omnibus Lease Resolution Agreement dated as of February 5, 2009 among Evergreen Alliance Golf Limited, L.P. et al. and CNL Income Partners, LP et al. (Previously filed as Exhibit 10.21 to Post-Effective Amendment No. Five to the Registration Statement on Form S-11 (File No. 333-146457) filed April 9, 2009 and incorporated herein by reference.) | |
| 10.17 | Third Amendment to Omnibus Lease Resolution Agreement dated as of March 27, 2009 among Evergreen Alliance Golf Limited, L.P. et al. and CNL Income Partners, LP et al. (Previously filed as Exhibit 10.21 to Post-Effective Amendment No. Five to the Registration Statement on Form S-11 (File No. 333-146457) filed April 9, 2009 and incorporated herein by reference.) | |
| 10.18 | Amended and Restated Lease Agreement dated as of March 31, 2009 between CNL Income EAGL Southwest Golf, LLC, Landlord, and Evergreen Alliance Golf Limited, L.P., Tenant (Previously filed as Exhibit 10.23 to Post-Effective Amendment No. Five to the Registration Statement on Form S-11 (File No. 333-146457) filed April 9, 2009 and incorporated herein by reference.) | |
| 10.19 | Schedule of Omitted Agreements (Filed herewith.) | |
| 21.1 | Subsidiaries of the Registrant (Filed herewith.) | |
| 31.1 | Certification of Chief Executive Officer of CNL Lifestyle Properties, Inc., Pursuant to Rule 13a-14(a), as Adopted Pursuant to Section 302 of the Sarbanes-Oxley Act of 2002. (Filed herewith.) | |
116
Table of Contents
| 31.2 | Certification of Chief Financial Officer of CNL Lifestyle Properties, Inc., Pursuant to Rule 13a-14(a), as Adopted Pursuant to Section 302 of the Sarbanes-Oxley Act of 2002. (Filed herewith.) | |
| 32.1 | Certification of the Chief Executive Officer of CNL Lifestyle Properties, Inc., Pursuant to 18 U.S.C. Section 1350, as Adopted Pursuant to Section 906 of the Sarbanes-Oxley Act of 2002. (Filed herewith.) | |
| 32.2 | Certification of the Chief Financial Officer of CNL Lifestyle Properties, Inc., Pursuant to 18 U.S.C. Section 1350, as Adopted Pursuant to Section 906 of the Sarbanes-Oxley Act of 2002. (Filed herewith.) | |
| 99.1 | Securities Purchase Agreement dated as of January 10, 2007 among Six Flags Theme Parks, Inc., et al. and PARC 7F-Operations Corporation (Previously filed as Exhibit 99 to Post-Effective Amendment No. Five to the Registration Statement on Form S-11 (File No. 333-128662) filed March 8, 2007 and incorporated herein by reference.) | |
117
Table of Contents
CNL Dallas Market
Center, L.P. and Subsidiaries
Consolidated Financial Statements
December 31, 2010 and 2009
118
Table of Contents
CNL Dallas Market Center, L.P. and Subsidiaries
Index
December 31, 2010 and 2009
| Page(s) | ||||
| Report of Independent Registered Certified Public Accounting Firm |
120 | |||
| 121 | ||||
| 122 | ||||
| 123 | ||||
| 124 | ||||
| 125-131 | ||||
119
Table of Contents
Report of Independent Registered Certified Public Accounting Firm
To the Partners of
CNL Dallas Market Center, L.P.
In our opinion, the accompanying consolidated balance sheets and the related consolidated statements of operations, of changes in partners’ capital and of cash flows present fairly, in all material respects, the financial position of CNL Dallas Market Center, L.P. and its subsidiaries at December 31, 2010 and 2009, and the results of their operations and their cash flows for the years ended December 31, 2010, 2009 and 2008, in conformity with accounting principles generally accepted in the United States of America. These financial statements are the responsibility of the Partnership’s management. Our responsibility is to express an opinion on these financial statements based on our audits. We conducted our audits of these statements in accordance with the standards of the Public Company Accounting Oversight Board (United States). Those standards require that we plan and perform the audit to obtain reasonable assurance about whether the financial statements are free of material misstatement. An audit includes examining, on a test basis, evidence supporting the amounts and disclosures in the financial statements, assessing the accounting principles used and significant estimates made by management, and evaluating the overall financial statement presentation. We believe that our audits provide a reasonable basis for our opinion.
/s/ PricewaterhouseCoopers LLP
Orlando, Florida
March 18, 2011
120
Table of Contents
CNL Dallas Market Center, L.P. and Subsidiaries
December 31, 2010 and 2009
| 2010 | 2009 | |||||||
| Assets |
||||||||
| Property and equipment, net |
$ | 246,397,307 | $ | 251,791,220 | ||||
| In-place lease costs, net |
5,768,881 | 6,007,695 | ||||||
| Cash |
3,209,523 | 2,478,492 | ||||||
| Restricted cash |
2,149,629 | 2,158,434 | ||||||
| Accrued rent |
1,691,241 | 1,762,714 | ||||||
| Favorable ground leases, net |
552,145 | 562,984 | ||||||
| Rent receivable |
— | 273,835 | ||||||
| Total assets |
$ | 259,768,726 | $ | 265,035,374 | ||||
| Liabilities and Partners’ Capital |
||||||||
| Mortgage loans payable |
$ | 142,014,568 | $ | 145,292,994 | ||||
| Distributions payable |
3,059,523 | 3,467,333 | ||||||
| Accounts payable and accrued expenses |
1,484,871 | 1,299,577 | ||||||
| Due to affiliates |
— | 41,057 | ||||||
| Total liabilities |
146,558,962 | 150,100,961 | ||||||
| Partners’ capital |
113,209,764 | 114,934,413 | ||||||
| Total liabilities and partners’ capital |
$ | 259,768,726 | $ | 265,035,374 | ||||
The accompanying notes are an integral part of these consolidated financial statements.
121
Table of Contents
CNL Dallas Market Center, L.P. and Subsidiaries
Consolidated Statements of Operations
Years Ended December 31, 2010, 2009 and 2008
| 2010 | 2009 | 2008 | ||||||||||
| Revenues |
||||||||||||
| Rental income from operating leases |
$ | 27,476,493 | $ | 26,943,054 | $26,616,046 | |||||||
| Percentage rent |
— | 2,188,157 | 2,572,917 | |||||||||
| Total revenues |
27,476,493 | 29,131,211 | 29,188,963 | |||||||||
| Cost and expenses |
||||||||||||
| Depreciation |
8,415,246 | 8,420,093 | 8,310,167 | |||||||||
| Ground rent expense |
277,115 | 421,174 | 505,006 | |||||||||
| General, administrative and operating |
271,772 | 275,368 | 249,748 | |||||||||
| Amortization of lease costs |
238,814 | 238,814 | 238,814 | |||||||||
| Total cost and expenses |
9,202,947 | 9,355,449 | 9,303,735 | |||||||||
| Operating income |
18,273,546 | 19,775,762 | 19,885,228 | |||||||||
| Interest and other income |
36,855 | 23,732 | 25,224 | |||||||||
| Interest expense |
(8,702,529 | ) | (8,894,533 | ) | (9,100,137 | ) | ||||||
| Net income |
$ | 9,607,872 | $ | 10,904,961 | $10,810,315 | |||||||
The accompanying notes are an integral part of these consolidated financial statements.
122
Table of Contents
CNL Dallas Market Center, L.P. and Subsidiaries
Consolidated Statements of Changes in Partners’ Capital
Years Ended December 31, 2010, 2009 and 2008
| General Partner |
CNL LP | Crow | Total | |||||||||||||
| Balance, December 31, 2007 |
$ | 1,087,213 | $ | 88,599,322 | $ | 17,567,900 | $ | 107,254,435 | ||||||||
| Net income |
99,758 | 9,876,003 | 834,554 | 10,810,315 | ||||||||||||
| Distributions |
(128,134 | ) | (10,122,583 | ) | (2,562,680 | ) | (12,813,397 | ) | ||||||||
| Balance, December 31, 2008 |
$ | 1,058,837 | $ | 88,352,742 | $ | 15,839,774 | $ | 105,251,353 | ||||||||
| Additional partner contributions |
142,892 | 11,555,683 | — | 11,698,575 | ||||||||||||
| Net income |
104,265 | 10,322,270 | 478,426 | 10,904,961 | ||||||||||||
| Distributions |
(130,332 | ) | (10,296,204 | ) | (2,493,940 | ) | (12,920,476 | ) | ||||||||
| Balance, December 31, 2009 |
$ | 1,175,662 | $ | 99,934,491 | $ | 13,824,260 | $ | 114,934,413 | ||||||||
| Additional partner contributions |
— | — | — | — | ||||||||||||
| Net income (loss) |
112,626 | 11,149,978 | (1,654,732 | ) | 9,607,872 | |||||||||||
| Distributions |
(140,784 | ) | (11,121,819 | ) | (69,918 | ) | (11,332,521 | ) | ||||||||
| Balance, December 31, 2010 |
$ | 1,147,504 | $ | 99,962,650 | $ | 12,099,610 | $ | 113,209,764 | ||||||||
The accompanying notes are an integral part of these consolidated financial statements.
123
Table of Contents
CNL Dallas Market Center, L.P. and Subsidiaries
Consolidated Statements of Cash Flows
Years Ended December 31, 2010 and 2009 and 2008
| 2010 | 2009 | 2008 | ||||||||||
| Cash flows from operating activities |
||||||||||||
| Net income |
$ | 9,607,872 | $ | 10,904,961 | $ | 10,810,315 | ||||||
| Adjustments to reconcile net income to net cash provided by operating activities |
||||||||||||
| Depreciation |
8,415,246 | 8,420,093 | 8,310,167 | |||||||||
| Amortization of lease costs |
238,814 | 238,814 | 238,814 | |||||||||
| Amortization of favorable ground lease |
10,839 | 59,824 | 84,318 | |||||||||
| Loss (gain) on sale of asset |
236 | (5,500 | ) | (862 | ) | |||||||
| Changes in assets and liabilities: |
||||||||||||
| Rent receivable |
273,835 | (273,835 | ) | — | ||||||||
| Prepaid expenses and other assets |
— | — | 40,511 | |||||||||
| Due to/from affiliates |
(41,057 | ) | 41,057 | — | ||||||||
| Accrued rent |
71,473 | 7,811 | 6,580 | |||||||||
| Accounts payable and accrued expenses |
185,294 | 58,653 | (1,064,156 | ) | ||||||||
| Unearned percentage rent |
— | (1,513,532 | ) | 270,539 | ||||||||
| Net cash provided by operating activities |
18,762,552 | 17,938,346 | 18,696,226 | |||||||||
| Cash flows from investing activities |
||||||||||||
| Acquisition of property and equipment, net |
(3,022,369 | ) | (14,108,337 | ) | (2,873,427 | ) | ||||||
| Proceeds from disposal of fixed assets |
800 | 5,500 | 11,042 | |||||||||
| (Increase) decrease in restricted cash |
8,805 | (665,050 | ) | (137,601 | ) | |||||||
| Net cash used in investing activities |
(3,012,764 | ) | (14,767,887 | ) | (2,999,986 | ) | ||||||
| Cash flows from financing activities |
||||||||||||
| Principal payment on mortgage loans |
(3,278,426 | ) | (3,087,399 | ) | (2,882,843 | ) | ||||||
| Capital contributions from partners |
— | 11,698,575 | — | |||||||||
| Distributions to partners |
(11,740,331 | ) | (12,258,671 | ) | (13,005,788 | ) | ||||||
| Net cash used in financing activities |
(15,018,757 | ) | (3,647,495 | ) | (15,888,631 | ) | ||||||
| Net increase (decrease) in cash |
731,031 | (477,036 | ) | (192,391 | ) | |||||||
| Cash |
||||||||||||
| Beginning of period |
2,478,492 | 2,955,528 | 3,147,919 | |||||||||
| End of period |
$ | 3,209,523 | $ | 2,478,492 | $ | 2,955,528 | ||||||
| Supplemental disclosure of cash flow information |
||||||||||||
| Cash paid during the year for interest, net of capitalized interest |
$ | 8,719,288 | $ | 8,910,313 | $ | 9,114,872 | ||||||
| Supplemental disclosure of noncash investing activities |
||||||||||||
| Accrual of capital expenditures |
$ | — | $ | — | $ | 20,432 | ||||||
| Termination of ground lease |
$ | — | $ | 3,447,015 | $ | — | ||||||
| Supplemental disclosure of noncash financing activities |
||||||||||||
| Distributions declared but not paid to partners |
$ | 3,059,523 | $ | 3,467,333 | $ | 2,805,528 | ||||||
The accompanying notes are an integral part of these consolidated financial statements.
124
Table of Contents
CNL Dallas Market Center, L.P. and Subsidiaries
Notes to Consolidated Financial Statements
Years Ended December 31, 2010, 2009 and 2008
1. Organization
CNL Dallas Market Center, L.P. (the “Partnership”) is a Delaware limited partnership whose partners are CNL Dallas Market Center GP, LLC (the “General Partner”), CNL DMC, LP (the “CNL LP”) and Dallas Market Center Company, Ltd. (“Crow”). Crow and CNL LP are collectively referred to as the “Limited Partners”. The General Partner and the CNL LP are wholly owned subsidiaries of CNL Lifestyle Properties, Inc. and are referred to as the “CNL Partners”. Certain major decisions as defined in the partnership agreement (the “Agreement”) require the approval of the General Partner and Limited Partners.
The Partnership was formed on February 14, 2005 for purposes of owning certain real property located in Dallas, Texas. In a series of formation transactions (referred to as the “Formation Transactions”), Crow transferred its interests in two subsidiary partnerships to the Partnership. The first subsidiary partnership owned the World Trade Center, Dallas Trade Mart and Market Hall buildings as well as leases for the underlying land; limited use rights to the Apparel Mart (which resides on the Dallas Market Center Campus) (collectively referred to as the “World Trade Center” property); and related parking facilities on the property, which had an agreed upon value of approximately $219.9 million. Later, on May 25, 2005, Crow transferred its interest in the second subsidiary partnership, which owned the International Floral and Gift Center (referred to as the “IFGC” property), with an agreed upon value of approximately $30.8 million. With the contributions of the World Trade Center and IFGC, the Partnership assumed approximately $142.3 million and $16.3 million, respectively, in existing debt. In connection with these transfers, the CNL Partners made a series of capital contributions in exchange for their ownership interests, which were immediately distributed to Crow. Additionally, all of the partners paid their share of closing costs in order to complete the transaction.
During 2005 and 2006, the Partners made pro-rata capital contributions of $21.3 million to develop a lighting center expansion at the Dallas Market Center. As of December 31, 2006, the Partnership completed its funding to the Trade Mart Expansion and the expansion was leased to an affiliate of Crow as of December 31, 2007.
On August 3, 2009, the Partnership exercised its option to purchase the land under the World Trade Center property, which was previously leased to the Partnership, for approximately $11.6 million. The General Partner and the CNL LP contributed cash to the Partnership to fund the entire land purchase thereby increasing its ownership in the Partnership. As of December 31, 2009, the General Partner and Limited Partners hold the following percentage interest:
| Partner |
Percentage Interest |
|||
| General Partner |
1.00 | % | ||
| CNL LP |
80.87 | % | ||
| Crow |
18.13 | % | ||
The World Trade Center consists of 15 floors including the fashion center, showrooms and wholesalers offering gifts and home textiles. The Dallas Trade Mart has five floors encompassing gifts, housewares and lighting. Market Hall is a consumer and tradeshow exhibition hall. The IFGC has two floors and houses permanent showrooms for floral products, holiday decorative products and related accessories. The IFGC serves as the headquarters for the American Floral Industry Association and is home to two annual floral shows, the Holiday and Home Expos. Both properties are leased to an affiliate of Crow under long-term triple-net leases.
Net cash flow, as defined in the Agreement, is to be distributed quarterly to the Partners in accordance with the following order of priority: (i) first, to the General Partner and CNL LP to pay the CNL first tier preferred
125
Table of Contents
CNL Dallas Market Center, L.P. and Subsidiaries
Notes to Consolidated Financial Statements
Years Ended December 31, 2010, 2009 and 2008
distribution, as defined in the Agreement; (ii) second, to Crow to pay the Crow first tier preferred distribution, as defined in the Agreement; (iii) third to the Partners pro-rata in proportion to their partnership interests until the sum of the aggregate distributions paid equals the second tier preferred distribution, as defined in the agreement; (iv) fourth, 60% to the General Partner and CNL LP and 40% to Crow until the sum of the aggregate distributions paid equals the third tier preferred distribution, as defined in the agreement and; (v) thereafter 50% to the General Partner and CNL LP and 50% to Crow. As of December 31, 2010 and 2009, the Partnership has net cash flow distributions payable totaling approximately $3.1 million and $3.5 million, respectively.
Net income or loss is allocated between the Partners based on the hypothetical liquidation at book value method (“HLBV”). Under the HLBV method, net income or loss is allocated between the Partners based on the difference between each Partner’s claim on the net assets of the Partnership at the end and beginning of the period. Each Partner’s share of the net assets of the Partnership is calculated as the amount that the Partner would receive if the Partnership were to liquidate all of its assets at net book value and distribute the resulting cash to creditors and partners in accordance with their respective priorities.
Capital proceeds, including capital proceeds distributed to the partners in winding up the Partnership, are allocated in the same manner as net cash flow with the exception that the first tier preferred distribution for CNL LP and Crow are set at a different rate per the Agreement.
2. Summary of Significant Accounting Policies
A summary of significant accounting principles and practices used in the preparation of the consolidated financial statements follows:
Basis of Financial Statement Presentation
The Partnership prepares its consolidated financial statements in conformity with accounting principles generally accepted in the United States of America. These principles require management to make estimates and assumptions that affect the reported amounts of assets and liabilities at the date of consolidated financial statements and report amounts of revenue and expenses during the reporting period. Actual results could differ from those estimates.
Principles of Consolidation
The accompanying consolidated financial statements of the Partnership include the accounts of CNL Dallas Market Center, LP and its wholly owned subsidiaries (“Subsidiaries”). All significant inter-Partnership balances and transactions have been eliminated in consolidation.
Effective January 1, 2010, the Partnership adopted the amended accounting guidance on consolidations as follows: (i) replaced the quantitative-based risks and rewards calculation for determining when a reporting entity has a controlling financial interest in a variable interest entity (“VIE”) with a qualitative approach focused on identifying which reporting entity has the power to direct the activities of a VIE that most significantly impact the entity’s economic performance and the obligation to absorb losses of the entity or the right to receive benefits from the entity and (ii) requires additional disclosures about a reporting entity’s involvement in VIEs. This consolidation guidance for VIEs also: (i) requires ongoing consideration, rather than only when specific events occur, of whether an entity is a primary beneficiary of a VIE, (ii) eliminates substantive removal rights consideration in determining whether an entity is VIE, and (iii) eliminates the exception for troubled debt restructurings as an event triggering reconsideration of an entity’s status as a VIE. The adoption of this guidance did not have a material impact on the Partnership’s financial position or results of operations.
126
Table of Contents
CNL Dallas Market Center, L.P. and Subsidiaries
Notes to Consolidated Financial Statements
Years Ended December 31, 2010, 2009 and 2008
Property and Equipment, net
Property and equipment is stated at cost and includes land, buildings and tenant improvements. Buildings and improvements and furniture, fixtures and equipment are depreciated on the straight-line method over the assets’ estimated useful lives ranging from 39 to 5 years. Tenant improvements are depreciated on the straight-line method over the shorter of the lease term or the estimated useful life.
Intangible Assets
Intangible lease assets are comprised of in place lease costs and favorable ground leases and are amortized over the remaining non-cancelable terms of the respective leases including automatic renewal terms. The remaining lives of the ground leases range from 50 to 60 years and the life of the master leases to Crow are 30 years including automatic renewal periods.
Lease Accounting
The Partnership’s leases are accounted for as operating leases. This determination requires management to estimate the economic life of the leased property, the residual value of the leased property and the present value of minimum lease payments to be received from the tenant. Rental income is recognized on a straight-line basis over the lease term. Contingent rent is recognized as revenue when underlying tenant revenues exceed required thresholds.
Cash and Cash Equivalents
The Partnership considers all highly liquid investments with an original maturity of three months or less to be cash equivalents. Cash and cash equivalents consist of demand deposits at commercial banks. Cash accounts maintained on behalf of the Partnership in demand deposits at commercial banks may exceed federally insured levels; however, the Partnership has not experienced any losses in such accounts. The Partners believe the Partnership is not exposed to any significant credit risk on cash and cash equivalents.
Restricted Cash
The leases require that certain amounts of cash are restricted to fund capital expenditures at the Partnership’s properties and have been included in the accompanying consolidated balance sheets. The reserve accounts are held at CNL Bank, which is an affiliate of the General Partner and CNL LP. As of December 31, 2010 and 2009, approximately $2.1 million and $2.2 million was held in these reserve accounts, respectively.
Revenue Recognition
The Partnership records rental revenue on the straight-line basis over the terms of the leases. Percentage rent that is due contingent upon tenant performance levels such as gross revenues is not recognized until the underlying performance thresholds have been reached.
Income Taxes
The Partnership is not subject to federal income taxes. As a result, the earnings or losses for federal income tax purposes are included in the tax returns of the individual partners. Net income or loss for financial statement purposes may differ significantly from taxable income reportable to partners as a result of differences between
127
Table of Contents
CNL Dallas Market Center, L.P. and Subsidiaries
Notes to Consolidated Financial Statements
Years Ended December 31, 2010, 2009 and 2008
the tax basis and financial reporting basis of assets and liabilities and the taxable loss allocation requirements under the Agreement. The partnership analyzed its material tax positions and determined that it has not taken any uncertain tax positions.
Fair Value of Financial Instruments
The estimated fair value of cash and accounts payable and accrued expenses approximates carrying value because of the liquid nature of the assets and short maturities of the obligations. The Partnership believes the fair value of its long-term debt was approximately $140.0 million and $142.5 million as of December 31, 2010 and 2009, respectively, based on the rates it believes it could obtain for similar borrowings.
Fair Value of Non-Financial Assets and Liabilities
Effective January 1, 2009, the Partnership adopted a new pronouncement which affects how fair value is determined for non-financial assets such as goodwill, intangibles and other long-lived assets, including the incorporation of market participant assumptions in determining the fair value. The adoption of this pronouncement did not have a material impact on the Partnership’s financial position or results of operations.
Impairment of Long-Lived Assets
The Partnership assesses impairment by comparing the carrying value of long-lived assets to future estimated undiscounted operating cash flows expected to be generated over the life of the assets and from its eventual disposition. In the event the carrying amount exceeds the estimated future undiscounted cash flows, the Partnership would recognize an impairment loss to adjust the carrying amount of the asset to the estimated fair value. For the years ended December 31, 2010, 2009 and 2008 the Partnership recorded no impairments.
3. Property and equipment
Property and equipment, net consists of the following:
| December 31, 2010 |
December 31, 2009 |
|||||||
| Building and improvements |
$ | 264,501,111 | $ | 263,448,035 | ||||
| Leasehold improvements |
1,682,069 | 1,651,334 | ||||||
| Land and land improvements |
15,630,694 | 15,630,694 | ||||||
| Equipment |
12,417,410 | 10,481,442 | ||||||
| 294,231,284 | 291,211,505 | |||||||
| Less: Accumulated depreciation |
(47,833,977 | ) | (39,420,285 | ) | ||||
| $ | 246,397,307 | $ | 251,791,220 | |||||
4. In Place Lease Costs and Favorable Ground Leases
In place lease costs, net and favorable ground leases, net consist of the following:
| In Place Lease Cost December 31, |
Favorable Ground Leases December 31, |
|||||||||||||||
| 2010 | 2009 | 2010 | 2009 | |||||||||||||
| Balance |
$ | 7,164,428 | $ | 7,164,428 | $ | 615,828 | $ | 615,828 | ||||||||
| Accumulated amortization |
(1,395,547 | ) | (1,156,733 | ) | (63,683 | ) | (52,844 | ) | ||||||||
| $ | 5,768,881 | $ | 6,007,695 | $ | 552,145 | $ | 562,984 | |||||||||
128
Table of Contents
CNL Dallas Market Center, L.P. and Subsidiaries
Notes to Consolidated Financial Statements
Years Ended December 31, 2010, 2009 and 2008
The anticipated amortization of intangible assets over each of the next five years and beyond is as follows:
| In Place Lease Costs |
Favorable Ground Leases |
|||||||
| 2011 |
$ | 238,814 | $ | 10,839 | ||||
| 2012 |
238,814 | 10,839 | ||||||
| 2013 |
238,814 | 10,839 | ||||||
| 2014 |
238,814 | 10,839 | ||||||
| 2015 |
238,814 | 10,839 | ||||||
| Thereafter |
4,574,811 | 497,950 | ||||||
| $ | 5,768,881 | $ | 552,145 | |||||
Amortization of the in place lease costs is recorded in amortization of lease costs expense in the accompanying consolidated statements of operations. The Partnership recorded total amortization expense of $238,814 for each year ended December 31, 2010, 2009 and 2008.
Amortization of the favorable ground lease asset is recorded as an increase in ground lease expense in the accompanying consolidated statements of operations. The Partnership recorded total amortization expense of $10,839 for the year ended December 31, 2010, $59,824 for the year ended December 31, 2009 and $84,318 for the year ended December 31, 2008.
5. Mortgage Loans Payable
In connection with the acquisition of the World Trade Center on February 14, 2005, the Partnership became obligated for approximately $142.3 million in existing debt collateralized by the World Trade Center property. On May 25, 2005, in connection with the acquisition of the IFGC, the Partnership became obligated for approximately $16.3 million in existing debt collateralized by the IFGC property. Mortgage loans payable consist of the following:
| Property |
Monthly Payment (Principal and Interest) |
Interest Rate |
Maturity Date | Balance as of December 31, | ||||||||||||||||
| 2010 | 2009 | |||||||||||||||||||
| World Trade Center |
$ | 889,145 | 6.037 | % | September 2014 | $ | 128,465,080 | $ | 131,181,175 | |||||||||||
| IFGC |
110,663 | 5.450 | % | September 2012 | 13,549,488 | 14,111,819 | ||||||||||||||
| $ | 142,014,568 | $ | 145,292,994 | |||||||||||||||||
Future scheduled principal payments of the mortgage loans are as follows:
| 2011 |
$ | 3,481,290 | ||
| 2012 |
16,002,163 | |||
| 2013 |
3,260,660 | |||
| 2014 |
119,270,455 | |||
| $ | 142,014,568 | |||
129
Table of Contents
CNL Dallas Market Center, L.P. and Subsidiaries
Notes to Consolidated Financial Statements
Years Ended December 31, 2010, 2009 and 2008
6. Master Leases
On February 14, 2005, the Partnership entered into a triple-net lease agreement with Dallas Market Center Operating, L.P. a subsidiary of the existing management company, Market Center Management Company, Ltd. (“MCMC”). MCMC is an affiliate of Crow Holdings. On May 25, 2005, the Partnership entered into a lease agreement with IFDC Operating, L.P., also a subsidiary of MCMC. The leases have an initial term of five-years with five automatic five-year renewal periods. Both leases call for the payment of monthly base rental payments and percentage rent to the extent that the annual percentage rent calculation exceeds annual base rent. Percentage rent is calculated as a set percentage of total gross sublease rental revenues as defined in the lease agreements. The amount of annual base rent automatically escalates in accordance with the provisions of the lease agreements. The leases require the tenant to pay property taxes on behalf of the Partnership. For the years ended December 31, 2010, 2009 and 2008, the tenant paid property taxes of approximately $1.9 million, $2.8 million and $3.3 million, respectively, on behalf of the Partnership.
On August 3, 2009, the Partnership renewed its first renewal term to commence on February 11, 2010 for a five year period.
Base rental income under the leases amounted to approximately $27.5 million, $26.9 million and $26.6 million for the years ended December 31, 2010, 2009 and 2008, respectively, including the effect of straight-lining rent in accordance with GAAP. The land purchase in 2009 and the construction on the Trade Mart Expansion in 2006 resulted in an increase in base rent of the Trade Mart Property.
Future minimum rental receipts under non-cancelable operating leases having remaining terms in excess of one year of December 31, 2010 are as follows:
| World Trade Center |
IFDC | Total | ||||||||||
| 2011 |
$ | 24,221,807 | $ | 3,326,156 | $ | 27,547,963 | ||||||
| 2012 |
24,221,807 | 3,326,156 | 27,547,963 | |||||||||
| 2013 |
24,221,807 | 3,326,156 | 27,547,963 | |||||||||
| 2014 |
24,221,807 | 3,326,156 | 27,547,963 | |||||||||
| 2015 |
24,221,807 | 3,326,156 | 27,547,963 | |||||||||
| Thereafter |
462,951,750 | 63,573,145 | 526,524,895 | |||||||||
| $ | 584,060,785 | $ | 80,203,925 | $ | 664,264,710 | |||||||
130
Table of Contents
CNL Dallas Market Center, L.P. and Subsidiaries
Notes to Consolidated Financial Statements
Years Ended December 31, 2010, 2009 and 2008
7. Ground Leases
As of December 31, 2010, the Partnership makes monthly lease payments under three ground leases, two of which have annual rent increases and all of the ground leases are with affiliates of Crow. For the years ended December 31, 2010, 2009 and 2008, the Partnership incurred a total of $277,115, $421,174 and $505,006, respectively, for rent expenses under the ground leases which includes the effect of GAAP straight-lining adjustments of $96,735, $99,269 and $101,754, respectively and the amortization of above market leases of $10,839, $59,824 and $84,318 for the years ended December 31, 2010, 2009 and 2008. Each of the ground leases expire between the years 2062 and 2066. Upon termination of the ground leases, all buildings and improvements become the property of the lessors under the ground leases. The non-cancelable future minimum lease payments under the ground leases are as follows:
| 2011 |
$ | 172,337 | ||
| 2012 |
174,974 | |||
| 2013 |
177,664 | |||
| 2014 |
180,407 | |||
| 2015 |
183,205 | |||
| Thereafter |
14,284,093 | |||
| $ | 15,172,680 | |||
Accrued rental expense of $608,225 and $511,490 is included in accounts payable and accrued expenses in the accompanying consolidated balance sheets as of December 31, 2010 and 2009, respectively.
8. Commitments and Contingencies
From time to time the Partnership may be exposed to litigation arising from operations of its business in the ordinary course of business. Management is not aware of any such litigation that it believes will have a material adverse impact on the Partnership’s financial condition or results of operations.
9. Subsequent Events
The accompanying audited consolidated financial statements were authorized for issue on March 18, 2011. Subsequent events are evaluated through that date.
131
Table of Contents
Pursuant to the requirements of Section 13 or 15(d) of the Securities Exchange Act of 1934, the registrant has duly caused this report to be signed on its behalf by the undersigned, thereunto duly authorized, on the 18th day of March 2011.
| CNL LIFESTYLE PROPERTIES, INC. | ||
| By: | /s/ R. BYRON CARLOCK, JR. | |
| R. BYRON CARLOCK, JR. | ||
| President and Chief Executive Officer | ||
| (Principal Executive Officer) | ||
| By: | /s/ TAMMIE A. QUINLAN | |
| TAMMIE A. QUINLAN | ||
| Executive Vice President and Chief Financial Officer | ||
| (Principal Financial Officer) | ||
| By: | /s/ JOSEPH T. JOHNSON | |
| JOSEPH T. JOHNSON | ||
| Senior Vice President and Chief Accounting Officer | ||
| (Principal Accounting Officer) | ||
132
Table of Contents
Pursuant to the requirements of the Securities Exchange Act of 1934, this report has been signed below by the following persons on behalf of the Registrant and in the capacities and on the dates indicated.
| Signature |
Title |
Date | ||
| /s/ JAMES M. SENEFF, JR. James M. Seneff, Jr. |
Chairman of the Board | March 18, 2011 | ||
| /s/ ROBERT A. BOURNE Robert A. Bourne |
Vice Chairman of the Board and Treasurer |
March 18, 2011 | ||
| /s/ ROBERT J. WOODY Robert J. Woody |
Independent Director | March 18, 2011 | ||
| /s/ BRUCE DOUGLAS Bruce Douglas |
Independent Director | March 18, 2011 | ||
| /S/ DENNIS N. FOLKEN Dennis N. Folken |
Independent Director | March 18, 2011 | ||
| /s/ R. BYRON CARLOCK, JR. R. Byron Carlock, Jr. |
President and Chief Executive Officer (Principal Executive Officer) | March 18, 2011 | ||
| /s/ TAMMIE A. QUINLAN Tammie A. Quinlan |
Executive Vice President and Chief Financial Officer (Principal Financial Officer) |
March 18, 2011 | ||
133
Table of Contents
CNL LIFESTYLE PROPERTIES, INC. AND SUBSIDIARIES
SCHEDULE II—Valuation and Qualifying Accounts
Years ended December 31, 2010, 2009 and 2008 (in thousands)
| Year |
Description |
Balance at Beginning of Year |
Charged to Costs and Expenses |
Charged to Other Accounts |
Deemed Uncollectible |
Collected/ Recovered |
Balance at End of Year |
|||||||||||||||||||||
| 2008 |
Deferred tax asset | $ | 5,277 | $ | — | $ | (152 | ) | $ | — | $ | — | $ | 5,125 | ||||||||||||||
| valuation allowance | ||||||||||||||||||||||||||||
| $ | 5,277 | $ | — | $ | (152 | ) | $ | — | $ | — | $ | 5,125 | ||||||||||||||||
| 2009 |
Deferred tax asset | $ | 5,125 | $ | — | $ | 16,081 | $ | — | $ | — | $ | 21,206 | |||||||||||||||
| valuation allowance | ||||||||||||||||||||||||||||
| $ | 5,125 | $ | — | $ | 16,081 | $ | — | $ | — | $ | 21,206 | |||||||||||||||||
| 2010 |
Deferred tax asset | $ | 21,206 | $ | — | $ | 12,754 | $ | — | $ | — | $ | 33,960 | |||||||||||||||
| valuation allowance | ||||||||||||||||||||||||||||
|
|
Allowance for loan losses |
|
$ | — | $ | 4,072 | $ | — | $ | — | $ | — | $ | 4,072 | ||||||||||||||
| $ | 21,206 | $ | 4,072 | $ | — | $ | — | $ | — | $ | 38,032 | |||||||||||||||||
134
Table of Contents
CNL LIFESTYLE PROPERTIES, INC. AND SUBSIDIARIES
SCHEDULE III—REAL ESTATE AND ACCUMULATED DEPRECIATION
As of December 31, 2010 (in thousands)
| Property/Location |
Encumbe- rances |
Initial Costs | Costs Capitalized Subsequent to Acquisition |
Gross Amounts at which Carried at Close of Period(3) |
Accumu- lated Depre- ciation |
Date of Construc- tion |
Date Acquired |
Life
on which depre- ciation in latest income state- ments is computed |
||||||||||||||||||||||||||||||||||||||||||||||||
| Land & Land Improve- ments |
Lease- hold Interests and Improve- ments |
Buildings | Improve- ments |
Carrying Costs |
Land & Land Improve- ments |
Lease- hold Interests and Improve- ments |
Buildings | Total | ||||||||||||||||||||||||||||||||||||||||||||||||
| Gatlinburg Sky Lift |
$ | — | $ | 19,154 | $ | 175 | $ | — | $ | — | $ | — | $ | 19,154 | $ | 175 | $ | 19,329 | $ | (2,034 | ) | In 1953 | 12/22/2005 | (2 | ) | |||||||||||||||||||||||||||||||
| Gatlinburg, Tennessee |
||||||||||||||||||||||||||||||||||||||||||||||||||||||||
| Hawaiian Falls Waterparks |
(1 | ) | $ | 3,123 | $ | 3,663 | $ | 758 | $ | 2,110 | $ | — | $ | 4,973 | $ | 3,810 | $ | 871 | $ | 9,654 | $ | (2,024 | ) | In 2004 | 4/21/2006 | (2 | ) | |||||||||||||||||||||||||||||
| Garland and The Colony, Texas |
||||||||||||||||||||||||||||||||||||||||||||||||||||||||
| Route 66 Harley-Davidson |
(1 | ) | $ | 998 | $ | — | $ | 5,509 | $ | 9 | $ | — | $ | 1,003 | $ | — | $ | 5,513 | $ | 6,516 | $ | (666 | ) | In 2002 | 4/27/2006 | (2 | ) | |||||||||||||||||||||||||||||
| Tulsa, Oklahoma |
||||||||||||||||||||||||||||||||||||||||||||||||||||||||
| Palmetto Hall Plantation Club |
(1 | ) | $ | 5,744 | $ | — | $ | 1,465 | $ | 57 | $ | — | $ | 5,777 | $ | — | $ | 1,489 | $ | 7,266 | $ | (1,592 | ) | In 1990 | 4/27/2006 | (2 | ) | |||||||||||||||||||||||||||||
| Hilton Head, South Carolina |
||||||||||||||||||||||||||||||||||||||||||||||||||||||||
| Cypress Mountain |
$ | 161 | $ | 19,001 | $ | 735 | $ | 14,075 | $ | — | $ | 1,313 | $ | 18,641 | $ | 14,018 | $ | 33,972 | $ | (4,571 | ) | In 1975 | 5/30/2006 | (2 | ) | |||||||||||||||||||||||||||||||
| Vancouver, British Columbia |
||||||||||||||||||||||||||||||||||||||||||||||||||||||||
| Raven Golf Club at South Mountain |
(1 | ) | $ | 11,599 | $ | — | $ | 1,382 | $ | 91 | $ | — | $ | 11,640 | $ | — | $ | 1,432 | $ | 13,072 | $ | (2,777 | ) | In 1995 | 6/9/2006 | (2 | ) | |||||||||||||||||||||||||||||
| Phoenix, Arizona |
||||||||||||||||||||||||||||||||||||||||||||||||||||||||
| The Omni Mount Washington Resort and Bretton Woods Ski Area |
(1 | ) | $ | 10,778 | $ | 10 | $ | 28,052 | $ | 27,050 | $ | — | $ | 11,563 | $ | 10 | $ | 54,317 | $ | 65,890 | $ | (8,502 | ) | In 1902 | 6/23/2006 | (2 | ) | |||||||||||||||||||||||||||||
| Bretton Woods, New Hampshire |
||||||||||||||||||||||||||||||||||||||||||||||||||||||||
| Bear Creek Golf Club |
(1 | ) | $ | 6,697 | $ | 2,613 | $ | 1,312 | $ | 525 | $ | — | $ | 7,022 | $ | 2,614 | $ | 1,511 | $ | 11,147 | $ | (2,286 | ) | In 1979 | 9/8/2006 | (2 | ) | |||||||||||||||||||||||||||||
| Dallas, Texas |
||||||||||||||||||||||||||||||||||||||||||||||||||||||||
| Funtasticks Fun Center |
(1 | ) | $ | 4,217 | $ | — | $ | 1,950 | $ | 22 | $ | — | $ | 4,217 | $ | — | $ | 1,972 | $ | 6,189 | $ | (614 | ) | In 1993 | 10/6/2006 | (2 | ) | |||||||||||||||||||||||||||||
| Tucson, Arizona |
||||||||||||||||||||||||||||||||||||||||||||||||||||||||
| Fiddlesticks Fun Center |
(1 | ) | $ | 4,466 | $ | — | $ | 648 | $ | 11 | $ | — | $ | 4,477 | $ | — | $ | 648 | $ | 5,125 | $ | (287 | ) | In 1991 | 10/6/2006 | (2 | ) | |||||||||||||||||||||||||||||
| Tempe, Arizona |
||||||||||||||||||||||||||||||||||||||||||||||||||||||||
| Grand Prix Tampa |
(1 | ) | $ | 2,738 | $ | — | $ | 487 | $ | — | $ | — | $ | 2,738 | $ | — | $ | 487 | $ | 3,225 | $ | (207 | ) | In 1979 | 10/6/2006 | (2 | ) | |||||||||||||||||||||||||||||
| Tampa, Florida |
||||||||||||||||||||||||||||||||||||||||||||||||||||||||
| Zuma Fun Center |
(1 | ) | $ | 3,720 | $ | — | $ | 1,192 | $ | 36 | $ | — | $ | 3,756 | $ | — | $ | 1,192 | $ | 4,948 | $ | (330 | ) | In 1990 | 10/6/2006 | (2 | ) | |||||||||||||||||||||||||||||
| South Houston, Texas |
||||||||||||||||||||||||||||||||||||||||||||||||||||||||
135
Table of Contents
CNL LIFESTYLE PROPERTIES, INC. AND SUBSIDIARIES
SCHEDULE III—REAL ESTATE AND ACCUMULATED DEPRECIATION—CONTINUED
As of December 31, 2010 (in thousands)
| Property/Location |
Encumbe- rances |
Initial Costs | Costs Capitalized Subsequent to Acquisition |
Gross Amounts at which Carried at Close of Period(3) |
Accumu- lated Depre- ciation |
Date of Construc- tion |
Date Acquired |
Life
on which depre- ciation in latest income state- ments is computed |
||||||||||||||||||||||||||||||||||||||||||||||||
| Land & Land Improve- ments |
Lease- hold Interests and Improve- ments |
Buildings | Improve- ments |
Carrying Costs |
Land & Land Improve- ments |
Lease- hold Interests and Improve- ments |
Buildings | Total | ||||||||||||||||||||||||||||||||||||||||||||||||
| Mountasia Family Fun Center |
(1 | ) | $ | 1,152 | $ | — | $ | 635 | $ | 22 | $ | — | $ | 1,174 | $ | — | $ | 635 | $ | 1,809 | $ | (195 | ) | In 1994 | 10/6/2006 | (2 | ) | |||||||||||||||||||||||||||||
| North Richland Hills, Texas |
||||||||||||||||||||||||||||||||||||||||||||||||||||||||
| Zuma Fun Center |
(1 | ) | $ | 757 | $ | — | $ | 182 | $ | — | $ | — | $ | 757 | $ | — | $ | 182 | $ | 939 | $ | (54 | ) | In 1990 | 10/6/2006 | (2 | ) | |||||||||||||||||||||||||||||
| North Houston, Texas |
||||||||||||||||||||||||||||||||||||||||||||||||||||||||
| Zuma Fun Center |
(1 | ) | $ | 1,231 | $ | — | $ | 751 | $ | — | $ | — | $ | 1,231 | $ | — | $ | 751 | $ | 1,982 | $ | (208 | ) | In 1993 | 10/6/2006 | (2 | ) | |||||||||||||||||||||||||||||
| Knoxville, Tennessee |
||||||||||||||||||||||||||||||||||||||||||||||||||||||||
| Zuma Fun Center |
(1 | ) | $ | 5,583 | $ | — | $ | 1,608 | $ | — | $ | — | $ | 5,583 | $ | — | $ | 1,608 | $ | 7,191 | $ | (603 | ) | In 1991 | 10/6/2006 | (2 | ) | |||||||||||||||||||||||||||||
| Charlotte, North Carolina |
||||||||||||||||||||||||||||||||||||||||||||||||||||||||
| Camelot Park |
(1 | ) | $ | 179 | $ | — | $ | 70 | $ | — | $ | — | $ | 179 | $ | — | $ | 70 | $ | 249 | $ | (249 | ) | In 1994 | 10/6/2006 | (2 | ) | |||||||||||||||||||||||||||||
| Bakersfield, California |
||||||||||||||||||||||||||||||||||||||||||||||||||||||||
| Weston Hills Country Club |
(1 | ) | $ | 20,332 | $ | — | $ | 14,374 | $ | 1,342 | $ | — | $ | 20,950 | $ | — | $ | 15,098 | $ | 36,048 | $ | (5,658 | ) | In 1990 | 10/16/2006 | (2 | ) | |||||||||||||||||||||||||||||
| Weston, Florida |
||||||||||||||||||||||||||||||||||||||||||||||||||||||||
| Valencia Country Club |
(1 | ) | $ | 31,565 | $ | — | $ | 8,646 | $ | 699 | $ | — | $ | 32,099 | $ | — | $ | 8,811 | $ | 40,910 | $ | (5,866 | ) | In 2000 | 10/16/2006 | (2 | ) | |||||||||||||||||||||||||||||
| Santa Clarita, California |
||||||||||||||||||||||||||||||||||||||||||||||||||||||||
| Canyon Springs Golf Club |
(1 | ) | $ | 11,463 | $ | — | $ | 1,314 | $ | 65 | $ | — | $ | 11,526 | $ | — | $ | 1,316 | $ | 12,842 | $ | (903 | ) | In 1997 | 11/16/2006 | (2 | ) | |||||||||||||||||||||||||||||
| San Antonio, Texas |
||||||||||||||||||||||||||||||||||||||||||||||||||||||||
| The Golf Club at Cinco Ranch |
(1 | ) | $ | 6,662 | $ | — | $ | 454 | $ | 226 | $ | — | $ | 6,887 | $ | — | $ | 455 | $ | 7,342 | $ | (330 | ) | In 1993 | 11/16/2006 | (2 | ) | |||||||||||||||||||||||||||||
| Houston, Texas |
||||||||||||||||||||||||||||||||||||||||||||||||||||||||
| Golf Club at Fossil Creek |
(1 | ) | $ | 4,905 | $ | — | $ | 1,040 | $ | 17 | $ | — | $ | 4,931 | $ | — | $ | 1,031 | $ | 5,962 | $ | (873 | ) | In 1987 | 11/16/2006 | (2 | ) | |||||||||||||||||||||||||||||
| Fort Worth, Texas |
||||||||||||||||||||||||||||||||||||||||||||||||||||||||
| Lake Park Golf Club |
$ | 2,089 | $ | 1,821 | $ | 1,352 | $ | 150 | $ | — | $ | 2,238 | $ | 1,822 | $ | 1,352 | $ | 5,412 | $ | (1,298 | ) | In 1957 | 11/16/2006 | (2 | ) | |||||||||||||||||||||||||||||||
| Dallas-Fort Worth, Texas |
||||||||||||||||||||||||||||||||||||||||||||||||||||||||
| Mansfield National Golf Club |
(1 | ) | $ | 5,216 | $ | 605 | $ | 1,176 | $ | 25 | $ | — | $ | 5,241 | $ | 605 | $ | 1,176 | $ | 7,022 | $ | (1,622 | ) | In 2000 | 11/16/2006 | (2 | ) | |||||||||||||||||||||||||||||
| Dallas-Fort Worth, Texas |
||||||||||||||||||||||||||||||||||||||||||||||||||||||||
| Plantation Golf Club |
(1 | ) | $ | 4,123 | $ | — | $ | 130 | $ | 18 | $ | — | $ | 4,141 | $ | — | $ | 130 | $ | 4,271 | $ | (59 | ) | In 1998 | 11/16/2006 | (2 | ) | |||||||||||||||||||||||||||||
| Dallas-Fort Worth, Texas |
||||||||||||||||||||||||||||||||||||||||||||||||||||||||
| Fox Meadow Country Club |
(1 | ) | $ | 5,235 | $ | — | $ | 4,144 | $ | 292 | $ | — | $ | 5,437 | $ | — | $ | 4,234 | $ | 9,671 | $ | (1,605 | ) | In 1995 | 12/22/2006 | (2 | ) | |||||||||||||||||||||||||||||
| Medina, Ohio |
||||||||||||||||||||||||||||||||||||||||||||||||||||||||
| Lakeridge Country Club |
(1 | ) | $ | 5,260 | $ | — | $ | 2,461 | $ | 170 | $ | — | $ | 5,378 | $ | — | $ | 2,513 | $ | 7,891 | $ | (939 | ) | In 1978 | 12/22/2006 | (2 | ) | |||||||||||||||||||||||||||||
| Lubbock, Texas |
||||||||||||||||||||||||||||||||||||||||||||||||||||||||
136
Table of Contents
CNL LIFESTYLE PROPERTIES, INC. AND SUBSIDIARIES
SCHEDULE III—REAL ESTATE AND ACCUMULATED DEPRECIATION—CONTINUED
As of December 31, 2010 (in thousands)
| Property/Location |
Encumbe- rances |
Initial Costs | Costs Capitalized Subsequent to Acquisition |
Gross Amounts at which Carried at Close of Period(3) |
Accumu- lated Depre- ciation |
Date of Construc- tion |
Date Acquired |
Life
on which depre- ciation in latest income state- ments is computed |
||||||||||||||||||||||||||||||||||||||||||||||||
| Land & Land Improve- ments |
Lease- hold Interests and Improve- ments |
Buildings | Improve- ments |
Carrying Costs |
Land & Land Improve- ments |
Lease- hold Interests and Improve- ments |
Buildings | Total | ||||||||||||||||||||||||||||||||||||||||||||||||
| Mesa del Sol Golf Club |
(1 | ) | $ | 5,802 | $ | — | $ | 981 | $ | 324 | $ | — | $ | 6,109 | $ | — | $ | 998 | $ | 7,107 | $ | (1,568 | ) | In 1970 | 12/22/2006 | (2 | ) | |||||||||||||||||||||||||||||
| Yuma, Arizona |
||||||||||||||||||||||||||||||||||||||||||||||||||||||||
| Painted Hills Golf Club |
(1 | ) | $ | 2,326 | $ | — | $ | 1,337 | $ | 103 | $ | — | $ | 2,387 | $ | — | $ | 1,379 | $ | 3,766 | $ | (596 | ) | In 1965 | 12/22/2006 | (2 | ) | |||||||||||||||||||||||||||||
| Kansas City, Kansas |
||||||||||||||||||||||||||||||||||||||||||||||||||||||||
| Royal Meadows Golf Course |
(1 | ) | $ | 1,971 | $ | — | $ | 374 | $ | 274 | $ | — | $ | 2,042 | $ | — | $ | 577 | $ | 2,619 | $ | (386 | ) | In 1960’s | 12/22/2006 | (2 | ) | |||||||||||||||||||||||||||||
| Kansas City, Missouri |
||||||||||||||||||||||||||||||||||||||||||||||||||||||||
| Signature Golf Course |
(1 | ) | $ | 8,513 | $ | — | $ | 8,403 | $ | 427 | $ | — | $ | 8,771 | $ | — | $ | 8,572 | $ | 17,343 | $ | (2,520 | ) | In 2002 | 12/22/2006 | (2 | ) | |||||||||||||||||||||||||||||
| Solon, Ohio |
||||||||||||||||||||||||||||||||||||||||||||||||||||||||
| Weymouth Country Club |
(1 | ) | $ | 5,571 | $ | — | $ | 4,860 | $ | 324 | $ | — | $ | 5,787 | $ | — | $ | 4,968 | $ | 10,755 | $ | (1,730 | ) | In 1969 | 12/22/2006 | (2 | ) | |||||||||||||||||||||||||||||
| Medina, Ohio |
||||||||||||||||||||||||||||||||||||||||||||||||||||||||
| Burnside Marina |
(1 | ) | $ | 350 | $ | 2,593 | $ | 415 | $ | 28 | $ | — | $ | 350 | $ | 2,621 | $ | 415 | $ | 3,386 | $ | (390 | ) | In 1950’s | 12/22/2006 | (2 | ) | |||||||||||||||||||||||||||||
| Somerset, Kentucky |
||||||||||||||||||||||||||||||||||||||||||||||||||||||||
| Pier 121 Marina and Easthill Park |
(1 | ) | $ | 1,172 | $ | 25,222 | $ | 4,576 | $ | 580 | $ | — | $ | 1,752 | $ | 25,222 | $ | 4,576 | $ | 31,550 | $ | (3,382 | ) | In 1960’s | 12/22/2006 | (2 | ) | |||||||||||||||||||||||||||||
| Lewisville, Texas |
||||||||||||||||||||||||||||||||||||||||||||||||||||||||
| Beaver Creek Marina |
(1 | ) | $ | 442 | $ | 5,778 | $ | 381 | $ | 20 | $ | — | $ | 442 | $ | 5,798 | $ | 381 | $ | 6,621 | $ | (1,571 | ) | In 1950’s | 12/22/2006 | (2 | ) | |||||||||||||||||||||||||||||
| Monticello, Kentucky |
||||||||||||||||||||||||||||||||||||||||||||||||||||||||
| Lake Front Marina |
(1 | ) | $ | 3,589 | $ | — | $ | 1,115 | $ | 218 | $ | — | $ | 3,753 | $ | — | $ | 1,169 | $ | 4,922 | $ | (411 | ) | In 1979 | 12/22/2006 | (2 | ) | |||||||||||||||||||||||||||||
| Port Clinton, Ohio |
||||||||||||||||||||||||||||||||||||||||||||||||||||||||
| Sandusky Harbor Marina |
(1 | ) | $ | 4,458 | $ | — | $ | 3,428 | $ | 29 | $ | — | $ | 4,479 | $ | — | $ | 3,436 | $ | 7,915 | $ | (844 | ) | In 1930’s | 12/22/2006 | (2 | ) | |||||||||||||||||||||||||||||
| Sandusky, Ohio |
||||||||||||||||||||||||||||||||||||||||||||||||||||||||
| Cowboys Golf Club |
(1 | ) | $ | 9,638 | $ | 2,534 | $ | 2,457 | $ | 608 | $ | — | $ | 9,615 | $ | 2,699 | $ | 2,923 | $ | 15,237 | $ | (3,203 | ) | In 2000 | 12/26/2006 | (2 | ) | |||||||||||||||||||||||||||||
| Grapevinem Texas |
||||||||||||||||||||||||||||||||||||||||||||||||||||||||
| Brighton Ski Resort |
(1 | ) | $ | 11,809 | $ | 2,123 | $ | 11,233 | $ | 2,806 | $ | — | $ | 12,669 | $ | 2,123 | $ | 13,179 | $ | 27,971 | $ | (4,255 | ) | In 1949 | 1/8/2007 | (2 | ) | |||||||||||||||||||||||||||||
| Brighton, Utah |
||||||||||||||||||||||||||||||||||||||||||||||||||||||||
| Clear Creek Golf Club |
$ | 423 | $ | 1,116 | $ | 155 | $ | 12 | $ | — | $ | 423 | $ | 1,116 | $ | 167 | $ | 1,706 | $ | (285 | ) | In 1987 | 1/11/2007 | (2 | ) | |||||||||||||||||||||||||||||||
| Houston, Texas |
||||||||||||||||||||||||||||||||||||||||||||||||||||||||
| Northstar-at-Tahoe Resort |
(1 | ) | $ | 60,790 | $ | — | $ | 8,534 | $ | 12,874 | $ | — | $ | 67,126 | $ | — | $ | 15,072 | $ | 82,198 | $ | (10,335 | ) | In 1972 | 1/19/2007 | (2 | ) | |||||||||||||||||||||||||||||
| Lake Tahoe, California |
||||||||||||||||||||||||||||||||||||||||||||||||||||||||
137
Table of Contents
CNL LIFESTYLE PROPERTIES, INC. AND SUBSIDIARIES
SCHEDULE III—REAL ESTATE AND ACCUMULATED DEPRECIATION—CONTINUED
As of December 31, 2010 (in thousands)
| Property/Location |
Encumbe- rances |
Initial Costs | Costs Capitalized Subsequent to Acquisition |
Gross Amounts at which Carried at Close of Period(3) |
Accumu- lated Depre- ciation |
Date of Construc- tion |
Date Acquired |
Life
on which depre- ciation in latest income state- ments is computed |
||||||||||||||||||||||||||||||||||||||||||||||||
| Land & Land Improve- ments |
Lease- hold Interests and Improve- ments |
Buildings | Improve- ments |
Carrying Costs |
Land & Land Improve- ments |
Lease- hold Interests and Improve- ments |
Buildings | Total | ||||||||||||||||||||||||||||||||||||||||||||||||
| Sierra-at-Tahoe Resort |
(1 | ) | $ | 19,875 | $ | 800 | $ | 8,574 | $ | 578 | $ | — | $ | 19,960 | $ | 800 | $ | 9,067 | $ | 29,827 | $ | (6,130 | ) | In 1968 | 1/19/2007 | (2 | ) | |||||||||||||||||||||||||||||
| South Lake Tahoe, California |
||||||||||||||||||||||||||||||||||||||||||||||||||||||||
| Loon Mountain Resort |
(1 | ) | $ | 9,226 | $ | 346 | $ | 4,673 | $ | 5,063 | $ | — | $ | 13,383 | $ | 347 | $ | 5,578 | $ | 19,308 | $ | (3,243 | ) | In 1966 | 1/19/2007 | (2 | ) | |||||||||||||||||||||||||||||
| Lincoln, New Hampshire |
||||||||||||||||||||||||||||||||||||||||||||||||||||||||
| Summit-at-Snowqualmie Resort |
(1 | ) | $ | 20,122 | $ | 792 | $ | 8,802 | $ | 1,885 | $ | — | $ | 21,681 | $ | 792 | $ | 9,128 | $ | 31,601 | $ | (5,395 | ) | In 1945 | 1/19/2007 | (2 | ) | |||||||||||||||||||||||||||||
| Snoqualmie Pass, Washington |
||||||||||||||||||||||||||||||||||||||||||||||||||||||||
| White Water Bay |
(1 | ) | $ | 10,720 | $ | — | $ | 5,461 | $ | 586 | $ | — | $ | 10,729 | $ | — | $ | 6,038 | $ | 16,767 | $ | (1,755 | ) | In 1981 | 4/6/2007 | (2 | ) | |||||||||||||||||||||||||||||
| Oklahoma City, Oklahoma |
||||||||||||||||||||||||||||||||||||||||||||||||||||||||
| Splashtown |
(1 | ) | $ | 10,817 | $ | — | $ | 1,609 | $ | 581 | $ | — | $ | 11,023 | $ | — | $ | 1,984 | $ | 13,007 | $ | (606 | ) | In 1981 | 4/6/2007 | (2 | ) | |||||||||||||||||||||||||||||
| Houston, Texas |
||||||||||||||||||||||||||||||||||||||||||||||||||||||||
| Waterworld |
(1 | ) | $ | 1,733 | $ | 7,841 | $ | 728 | $ | 342 | $ | — | $ | 1,937 | $ | 7,841 | $ | 866 | $ | 10,644 | $ | (2,018 | ) | In 1995 | 4/6/2007 | (2 | ) | |||||||||||||||||||||||||||||
| Concord, California |
||||||||||||||||||||||||||||||||||||||||||||||||||||||||
| Elitch Gardens |
(1 | ) | $ | 93,796 | $ | — | $ | 7,480 | $ | 601 | $ | — | $ | 94,154 | $ | — | $ | 7,723 | $ | 101,877 | $ | (4,025 | ) | In 1890 | 4/6/2007 | (2 | ) | |||||||||||||||||||||||||||||
| Denver, Colorado |
||||||||||||||||||||||||||||||||||||||||||||||||||||||||
| Darien Lake |
(1 | ) | $ | 60,993 | $ | — | $ | 21,967 | $ | 963 | $ | — | $ | 61,693 | $ | — | $ | 22,230 | $ | 83,923 | $ | (15,335 | ) | In 1955 | 4/6/2007 | (2 | ) | |||||||||||||||||||||||||||||
| Buffalo, New York |
||||||||||||||||||||||||||||||||||||||||||||||||||||||||
| Frontier City |
(1 | ) | $ | 7,265 | $ | — | $ | 7,518 | $ | 644 | $ | — | $ | 7,414 | $ | — | $ | 8,013 | $ | 15,427 | $ | (1,915 | ) | In 1958 | 4/6/2007 | (2 | ) | |||||||||||||||||||||||||||||
| Oklahoma City, Oklahoma |
||||||||||||||||||||||||||||||||||||||||||||||||||||||||
| Wild Waves & Enchanted Village |
(1 | ) | $ | 19,200 | $ | — | $ | 2,837 | $ | 601 | $ | — | $ | 19,554 | $ | — | $ | 3,084 | $ | 22,638 | $ | (5,084 | ) | In 1977 | 4/6/2007 | (2 | ) | |||||||||||||||||||||||||||||
| Seattle, Washington |
||||||||||||||||||||||||||||||||||||||||||||||||||||||||
| Magic Springs & Crystal Falls |
(1 | ) | $ | 4,237 | $ | 8 | $ | 10,409 | $ | 3,412 | $ | — | $ | 7,498 | $ | — | $ | 10,568 | $ | 18,066 | $ | (1,762 | ) | In 1977 | 4/16/2007 | (2 | ) | |||||||||||||||||||||||||||||
| Hot Springs, Arkansas |
||||||||||||||||||||||||||||||||||||||||||||||||||||||||
| Manasquan River Club |
(1 | ) | $ | 8,031 | $ | — | $ | 439 | $ | 22 | $ | — | $ | 8,041 | $ | 12 | $ | 439 | $ | 8,492 | $ | (388 | ) | In 1970’s | 6/8/2007 | (2 | ) | |||||||||||||||||||||||||||||
| Brick Township, New Jersey |
||||||||||||||||||||||||||||||||||||||||||||||||||||||||
| Crystal Point Marina |
(1 | ) | $ | 5,159 | $ | — | $ | 46 | $ | 138 | $ | — | $ | 5,297 | $ | — | $ | 46 | $ | 5,343 | $ | (57 | ) | In 1976 | 6/8/2007 | (2 | ) | |||||||||||||||||||||||||||||
| Point Pleasant, New Jersey |
||||||||||||||||||||||||||||||||||||||||||||||||||||||||
138
Table of Contents
CNL LIFESTYLE PROPERTIES, INC. AND SUBSIDIARIES
SCHEDULE III—REAL ESTATE AND ACCUMULATED DEPRECIATION—CONTINUED
As of December 31, 2010 (in thousands)
| Property/Location |
Encumbe- rances |
Initial Costs | Costs Capitalized Subsequent to Acquisition |
Gross Amounts at which Carried at Close of Period(3) |
Accumu- lated Depre- ciation |
Date of Construc- tion |
Date Acquired |
Life
on which depre- ciation in latest income state- ments is computed |
||||||||||||||||||||||||||||||||||||||||||||||||
| Land & Land Improve- ments |
Lease- hold Interests and Improve- ments |
Buildings | Improve- ments |
Carrying Costs |
Land & Land Improve- ments |
Lease- hold Interests and Improve- ments |
Buildings | Total | ||||||||||||||||||||||||||||||||||||||||||||||||
| Mountain High Resort |
(1 | ) | $ | 14,272 | $ | 14,022 | $ | 7,571 | $ | 732 | $ | — | $ | 14,547 | $ | 14,061 | $ | 7,989 | $ | 36,597 | $ | (5,371 | ) | In 1930’s | 6/29/2007 | (2 | ) | |||||||||||||||||||||||||||||
| Wrightwood, California |
||||||||||||||||||||||||||||||||||||||||||||||||||||||||
| Holly Creek Marina |
(1 | ) | $ | 372 | $ | 5,257 | $ | 465 | $ | 31 | $ | — | $ | 373 | $ | 5,286 | $ | 466 | $ | 6,125 | $ | (501 | ) | In 1940’s | 8/1/2007 | (2 | ) | |||||||||||||||||||||||||||||
| Celina, Tennessee |
||||||||||||||||||||||||||||||||||||||||||||||||||||||||
| Eagle Cove Marina |
(1 | ) | $ | 1,114 | $ | 1,718 | $ | 1,692 | $ | 95 | $ | — | $ | 1,113 | $ | 1,815 | $ | 1,691 | $ | 4,619 | $ | (404 | ) | In 1940’s | 8/1/2007 | (2 | ) | |||||||||||||||||||||||||||||
| Byrdstown, Tennessee |
||||||||||||||||||||||||||||||||||||||||||||||||||||||||
| Sugarloaf Mountain Resort |
$ | 15,408 | $ | — | $ | 5,658 | $ | 1,863 | $ | — | $ | 13,999 | $ | 2,000 | $ | 6,930 | $ | 22,929 | $ | (2,921 | ) | In 1962 | 8/7/2007 | (2 | ) | |||||||||||||||||||||||||||||||
| Carrabassett Valley, Maine |
||||||||||||||||||||||||||||||||||||||||||||||||||||||||
| Sunday River Resort |
$ | 32,698 | $ | — | $ | 12,256 | $ | 4,016 | $ | — | $ | 36,058 | $ | — | $ | 12,912 | $ | 48,970 | $ | (5,294 | ) | In 1959 | 8/7/2007 | (2 | ) | |||||||||||||||||||||||||||||||
| Newry, Maine |
||||||||||||||||||||||||||||||||||||||||||||||||||||||||
| Great Lakes Marina |
(1 | ) | $ | 6,633 | $ | — | $ | 3,079 | $ | 89 | $ | — | $ | 6,642 | $ | — | $ | 3,159 | $ | 9,801 | $ | (414 | ) | In 1981 | 8/20/2007 | (2 | ) | |||||||||||||||||||||||||||||
| Muskegon, Michigan |
||||||||||||||||||||||||||||||||||||||||||||||||||||||||
| The Village at Northstar |
$ | 2,354 | $ | — | $ | 33,932 | $ | 4,130 | $ | — | $ | 2,724 | $ | — | $ | 37,692 | $ | 40,416 | $ | (4,822 | ) | In 2005 | 11/15/2007 | (2 | ) | |||||||||||||||||||||||||||||||
| Lake Tahoe, California |
||||||||||||||||||||||||||||||||||||||||||||||||||||||||
| Arrowhead Country Club |
(1 | ) | $ | 6,358 | $ | — | $ | 9,501 | $ | 1,727 | $ | — | $ | 7,305 | $ | — | $ | 10,281 | $ | 17,586 | $ | (1,742 | ) | In 1980’s | 11/30/2007 | (2 | ) | |||||||||||||||||||||||||||||
| Glendale, Arizona |
||||||||||||||||||||||||||||||||||||||||||||||||||||||||
| Ancala Country Club |
(1 | ) | $ | 6,878 | $ | — | $ | 5,953 | $ | 1,304 | $ | — | $ | 7,677 | $ | — | $ | 6,458 | $ | 14,135 | $ | (1,592 | ) | In 1996 | 11/30/2007 | (2 | ) | |||||||||||||||||||||||||||||
| Scottsdale, Arizona |
||||||||||||||||||||||||||||||||||||||||||||||||||||||||
| Tallgrass Country Club |
(1 | ) | $ | 2,273 | $ | — | $ | 2,586 | $ | 541 | $ | — | $ | 2,582 | $ | — | $ | 2,818 | $ | 5,400 | $ | (404 | ) | In 1982 | 11/30/2007 | (2 | ) | |||||||||||||||||||||||||||||
| Witchita, Kansas |
||||||||||||||||||||||||||||||||||||||||||||||||||||||||
| Deer Creek Golf Club |
(1 | ) | $ | 4,914 | $ | — | $ | 3,353 | $ | 1,256 | $ | — | $ | 5,894 | $ | — | $ | 3,629 | $ | 9,523 | $ | (1,132 | ) | In 1989 | 11/30/2007 | (2 | ) | |||||||||||||||||||||||||||||
| Overland Park, Kansas |
||||||||||||||||||||||||||||||||||||||||||||||||||||||||
| Arrowhead Golf Club |
(1 | ) | $ | 11,798 | $ | — | $ | 2,885 | $ | 1,226 | $ | — | $ | 12,771 | $ | — | $ | 3,138 | $ | 15,909 | $ | (1,554 | ) | In 1974 | 11/30/2007 | (2 | ) | |||||||||||||||||||||||||||||
| Littleton, Colorad |
||||||||||||||||||||||||||||||||||||||||||||||||||||||||
| Hunt Valley Golf Club |
(1 | ) | $ | 16,115 | $ | — | $ | 5,627 | $ | 1,827 | $ | — | $ | 17,481 | $ | — | $ | 6,088 | $ | 23,569 | $ | (1,891 | ) | In 1970 | 11/30/2007 | (2 | ) | |||||||||||||||||||||||||||||
| Phoenix, Maryland |
||||||||||||||||||||||||||||||||||||||||||||||||||||||||
| Meadowbrook Golf & Country Club |
(1 | ) | $ | 8,311 | $ | — | $ | 1,935 | $ | 1,223 | $ | — | $ | 9,343 | $ | — | $ | 2,126 | $ | 11,469 | $ | (1,097 | ) | In 1957 | 11/30/2007 | (2 | ) | |||||||||||||||||||||||||||||
| Tulsa, Oklahoma |
||||||||||||||||||||||||||||||||||||||||||||||||||||||||
139
Table of Contents
CNL LIFESTYLE PROPERTIES, INC. AND SUBSIDIARIES
SCHEDULE III—REAL ESTATE AND ACCUMULATED DEPRECIATION—CONTINUED
As of December 31, 2010 (in thousands)
| Property/Location |
Encumbe- rances |
Initial Costs | Costs Capitalized Subsequent to Acquisition |
Gross Amounts at which Carried at Close of Period(3) |
Accumu- lated Depre- ciation |
Date of Construc- tion |
Date Acquired |
Life
on which depre- ciation in latest income state- ments is computed |
||||||||||||||||||||||||||||||||||||||||||||||||
| Land & Land Improve- ments |
Lease- hold Interests and Improve- ments |
Buildings | Improve- ments |
Carrying Costs |
Land & Land Improve- ments |
Lease- hold Interests and Improve- ments |
Buildings | Total | ||||||||||||||||||||||||||||||||||||||||||||||||
| Stonecreek Golf Club |
(1 | ) | $ | 9,903 | $ | — | $ | 2,915 | $ | 1,159 | $ | — | $ | 10,814 | $ | — | $ | 3,163 | $ | 13,977 | $ | (1,064 | ) | In 1990 | 11/30/2007 | (2 | ) | |||||||||||||||||||||||||||||
| Phoenix, Arizona |
||||||||||||||||||||||||||||||||||||||||||||||||||||||||
| Painted Desert Golf Club |
(1 | ) | $ | 7,851 | $ | — | $ | 965 | $ | 778 | $ | — | $ | 8,551 | $ | — | $ | 1,043 | $ | 9,594 | $ | (1,384 | ) | In 1987 | 11/30/2007 | (2 | ) | |||||||||||||||||||||||||||||
| Las Vegas, Nevada |
||||||||||||||||||||||||||||||||||||||||||||||||||||||||
| Mission Hills Country Club |
(1 | ) | $ | 1,565 | $ | — | $ | 2,772 | $ | 678 | $ | — | $ | 1,935 | $ | — | $ | 3,080 | $ | 5,015 | $ | (351 | ) | In 1975 | 11/30/2007 | (2 | ) | |||||||||||||||||||||||||||||
| Northbrook, Illinios |
||||||||||||||||||||||||||||||||||||||||||||||||||||||||
| Eagle Brook Country Club |
(1 | ) | $ | 8,385 | $ | — | $ | 6,621 | $ | 1,298 | $ | — | $ | 9,117 | $ | — | $ | 7,187 | $ | 16,304 | $ | (1,596 | ) | In 1992 | 11/30/2007 | (2 | ) | |||||||||||||||||||||||||||||
| Geneva, Illinios |
||||||||||||||||||||||||||||||||||||||||||||||||||||||||
| Majestic Oaks Golf Club |
(1 | ) | $ | 11,371 | $ | — | $ | 694 | $ | 1,032 | $ | — | $ | 12,343 | $ | — | $ | 754 | $ | 13,097 | $ | (1,818 | ) | In 1972 | 11/30/2007 | (2 | ) | |||||||||||||||||||||||||||||
| Ham Lake, Minnesota |
||||||||||||||||||||||||||||||||||||||||||||||||||||||||
| Ruffled Feathers Golf Club |
(1 | ) | $ | 8,109 | $ | — | $ | 4,747 | $ | 1,066 | $ | — | $ | 8,788 | $ | — | $ | 5,134 | $ | 13,922 | $ | (1,415 | ) | In 1992 | 11/30/2007 | (2 | ) | |||||||||||||||||||||||||||||
| Lemont, Illinios |
||||||||||||||||||||||||||||||||||||||||||||||||||||||||
| Tamarack Golf Club |
(1 | ) | $ | 5,544 | $ | — | $ | 1,589 | $ | 771 | $ | — | $ | 6,029 | $ | — | $ | 1,875 | $ | 7,904 | $ | (923 | ) | In 1988 | 11/30/2007 | (2 | ) | |||||||||||||||||||||||||||||
| Naperville, Illinios |
||||||||||||||||||||||||||||||||||||||||||||||||||||||||
| Continental Golf Course |
(1 | ) | $ | 5,276 | $ | — | $ | 789 | $ | 541 | $ | — | $ | 5,746 | $ | — | $ | 860 | $ | 6,606 | $ | (423 | ) | In 1979 | 11/30/2007 | (2 | ) | |||||||||||||||||||||||||||||
| Scottsdale, Arizona |
||||||||||||||||||||||||||||||||||||||||||||||||||||||||
| Desert Lakes Golf Club |
(1 | ) | $ | 153 | $ | — | $ | 125 | $ | — | $ | — | $ | 268 | $ | — | $ | 10 | $ | 278 | $ | (278 | ) | In 1989 | 11/30/2007 | (2 | ) | |||||||||||||||||||||||||||||
| Bullhead City, Arizona |
||||||||||||||||||||||||||||||||||||||||||||||||||||||||
| Tatum Ranch Golf Club |
(1 | ) | $ | 2,674 | $ | — | $ | 3,013 | $ | 700 | $ | — | $ | 3,130 | $ | — | $ | 3,257 | $ | 6,387 | $ | (642 | ) | In 1987 | 11/30/2007 | (2 | ) | |||||||||||||||||||||||||||||
| Cave Creek, Arizona |
||||||||||||||||||||||||||||||||||||||||||||||||||||||||
| Kokopelli Golf Club |
(1 | ) | $ | 7,319 | $ | — | $ | 1,310 | $ | 1,043 | $ | — | $ | 8,256 | $ | — | $ | 1,416 | $ | 9,672 | $ | (984 | ) | In 1992 | 11/30/2007 | (2 | ) | |||||||||||||||||||||||||||||
| Phoenix, Arizona |
||||||||||||||||||||||||||||||||||||||||||||||||||||||||
| Superstition Springs Golf Club |
(1 | ) | $ | 7,947 | $ | — | $ | 2,129 | $ | 827 | $ | — | $ | 8,592 | $ | — | $ | 2,311 | $ | 10,903 | $ | (947 | ) | In 1986 | 11/30/2007 | (2 | ) | |||||||||||||||||||||||||||||
| Mesa, Arizona |
||||||||||||||||||||||||||||||||||||||||||||||||||||||||
| Foothills Golf Club |
(1 | ) | $ | 5,493 | $ | — | $ | 3,515 | $ | 812 | $ | — | $ | 6,021 | $ | — | $ | 3,799 | $ | 9,820 | $ | (1,035 | ) | In 1987 | 11/30/2007 | (2 | ) | |||||||||||||||||||||||||||||
| Phoenix, Arizona |
||||||||||||||||||||||||||||||||||||||||||||||||||||||||
| Legend at Arrowhead Golf Resort |
(1 | ) | $ | 8,067 | $ | — | $ | 1,621 | $ | 839 | $ | — | $ | 8,773 | $ | — | $ | 1,754 | $ | 10,527 | $ | (978 | ) | In 2001 | 11/30/2007 | (2 | ) | |||||||||||||||||||||||||||||
| Glendale, Arizona |
||||||||||||||||||||||||||||||||||||||||||||||||||||||||
140
Table of Contents
CNL LIFESTYLE PROPERTIES, INC. AND SUBSIDIARIES
SCHEDULE III—REAL ESTATE AND ACCUMULATED DEPRECIATION—CONTINUED
As of December 31, 2010 (in thousands)
| Property/Location |
Encumbe- rances |
Initial Costs | Costs Capitalized Subsequent to Acquisition |
Gross Amounts at which Carried at Close of Period(3) |
Accumu- lated Depre- ciation |
Date of Construc- tion |
Date Acquired |
Life
on which depre- ciation in latest income state- ments is computed |
||||||||||||||||||||||||||||||||||||||||||||||||
| Land & Land Improve- ments |
Lease- hold Interests and Improve- ments |
Buildings | Improve- ments |
Carrying Costs |
Land & Land Improve- ments |
Lease- hold Interests and Improve- ments |
Buildings | Total | ||||||||||||||||||||||||||||||||||||||||||||||||
| London Bridge Golf Club |
(1 | ) | $ | 9,250 | $ | — | $ | 1,554 | $ | 940 | $ | — | $ | 10,064 | $ | — | $ | 1,680 | $ | 11,744 | $ | (1,682 | ) | In 1960’s | 11/30/2007 | (2 | ) | |||||||||||||||||||||||||||||
| Lake Havasu, Arizona |
||||||||||||||||||||||||||||||||||||||||||||||||||||||||
| Forest Park Golf Course |
$ | 7,699 | $ | 2,723 | $ | 2,753 | $ | 1,146 | $ | — | $ | 8,374 | $ | 2,971 | $ | 2,976 | $ | 14,321 | $ | (2,645 | ) | In 1900’s | 12/19/2007 | (2 | ) | |||||||||||||||||||||||||||||||
| St. Louis, Missouri |
||||||||||||||||||||||||||||||||||||||||||||||||||||||||
| Micke Grove Golf Course |
$ | 3,258 | $ | 2,608 | $ | 766 | $ | 562 | $ | — | $ | 3,545 | $ | 2,821 | $ | 828 | $ | 7,194 | $ | (1,195 | ) | In 1990 | 12/19/2007 | (2 | ) | |||||||||||||||||||||||||||||||
| Lodi, California |
||||||||||||||||||||||||||||||||||||||||||||||||||||||||
| Mizner Court at Broken Sound |
(1 | ) | $ | 37,224 | $ | — | $ | 65,364 | $ | 171 | $ | — | $ | 37,279 | $ | — | $ | 65,480 | $ | 102,759 | $ | (7,602 | ) | In 1987 | 12/31/2007 | (2 | ) | |||||||||||||||||||||||||||||
| Boca Raton, Floria |
||||||||||||||||||||||||||||||||||||||||||||||||||||||||
| Shandin Hills Golf Club |
$ | 3,070 | $ | 1,165 | $ | 1,112 | $ | 83 | $ | — | $ | — | $ | 4,314 | $ | 1,116 | $ | 5,430 | $ | (799 | ) | In 1980 | 3/7/2008 | (2 | ) | |||||||||||||||||||||||||||||||
| San Bernadino, California |
||||||||||||||||||||||||||||||||||||||||||||||||||||||||
| The Tradition Golf Club at Kiskiack |
$ | 5,836 | $ | — | $ | 1,097 | $ | 88 | $ | — | $ | 5,913 | $ | — | $ | 1,108 | $ | 7,021 | $ | (799 | ) | In 1996 | 3/26/2008 | (2 | ) | |||||||||||||||||||||||||||||||
| Williamsburg, Virginia |
||||||||||||||||||||||||||||||||||||||||||||||||||||||||
| The Tradition Golf Club at The Crossings |
$ | 8,616 | $ | — | $ | 1,376 | $ | 121 | $ | — | $ | 8,723 | $ | — | $ | 1,390 | $ | 10,113 | $ | (1,061 | ) | In 1979 | 3/26/2008 | (2 | ) | |||||||||||||||||||||||||||||||
| Glen Allen, Virginia |
||||||||||||||||||||||||||||||||||||||||||||||||||||||||
| The Tradition Golf Club at Broad Bay |
(1 | ) | $ | 6,837 | $ | — | $ | 2,187 | $ | 159 | $ | — | $ | 6,937 | $ | — | $ | 2,246 | $ | 9,183 | $ | (1,035 | ) | In 1986 | 3/26/2008 | (2 | ) | |||||||||||||||||||||||||||||
| Virginia Beach, Virginia |
||||||||||||||||||||||||||||||||||||||||||||||||||||||||
| Brady Mountain Resort & Marina |
$ | 738 | $ | 6,757 | $ | 1,619 | $ | 3,062 | $ | — | $ | 3,384 | $ | 7,044 | $ | 1,748 | $ | 12,176 | $ | (1,133 | ) | In 1950’s | 4/10/2008 | (2 | ) | |||||||||||||||||||||||||||||||
| Royal, Arkansas |
||||||||||||||||||||||||||||||||||||||||||||||||||||||||
| David L. Baker Golf Course |
$ | 4,642 | $ | 3,577 | $ | 1,433 | $ | 149 | $ | — | $ | 2 | $ | 8,343 | $ | 1,456 | $ | 9,801 | $ | (1,568 | ) | In 1987 | 4/17/2008 | (2 | ) | |||||||||||||||||||||||||||||||
| Fountain Valley, California |
||||||||||||||||||||||||||||||||||||||||||||||||||||||||
| Las Vegas Golf Club |
$ | 7,481 | $ | 2,059 | $ | 1,622 | $ | 97 | $ | — | $ | — | $ | 9,630 | $ | 1,629 | $ | 11,259 | $ | (1,632 | ) | In 1938 | 4/17/2008 | (2 | ) | |||||||||||||||||||||||||||||||
| Las Vegas, NV |
||||||||||||||||||||||||||||||||||||||||||||||||||||||||
| Meadowlark Golf Course |
$ | 8,544 | $ | 6,999 | $ | 1,687 | $ | 125 | $ | — | $ | 18 | $ | 15,643 | $ | 1,694 | $ | 17,355 | $ | (2,755 | ) | In 1922 | 4/17/2008 | (2 | ) | |||||||||||||||||||||||||||||||
| Huntington Beach, California |
||||||||||||||||||||||||||||||||||||||||||||||||||||||||
| Coco Key Water Resort |
$ | 9,830 | $ | — | $ | 5,440 | $ | 24,188 | $ | — | $ | 15,578 | $ | — | $ | 23,880 | $ | 39,458 | $ | (1,241 | ) | 1970’s | 5/28/2008 | (2 | ) | |||||||||||||||||||||||||||||||
| Orlando, Florida |
||||||||||||||||||||||||||||||||||||||||||||||||||||||||
141
Table of Contents
CNL LIFESTYLE PROPERTIES, INC. AND SUBSIDIARIES
SCHEDULE III—REAL ESTATE AND ACCUMULATED DEPRECIATION—CONTINUED
As of December 31, 2010 (in thousands)
| Property/Location |
Encumbe- rances |
Initial Costs | Costs Capitalized Subsequent to Acquisition |
Gross Amounts at which Carried at Close of Period(3) |
Accumu- lated Depre- ciation |
Date of Construc- tion |
Date Acquired |
Life
on which depre- ciation in latest income state- ments is computed |
||||||||||||||||||||||||||||||||||||||||||||||||
| Land & Land Improve- ments |
Lease- hold Interests and Improve- ments |
Buildings | Improve- ments |
Carrying Costs |
Land & Land Improve- ments |
Lease- hold Interests and Improve- ments |
Buildings | Total | ||||||||||||||||||||||||||||||||||||||||||||||||
| Myrtle Waves Water Park |
(1 | ) | $ | — | $ | 2,430 | $ | 4,926 | $ | 424 | $ | — | $ | — | $ | 2,829 | $ | 4,951 | $ | 7,780 | $ | (846 | ) | In 1985 | 7/11/2008 | (2 | ) | |||||||||||||||||||||||||||||
| Myrtle Beach, South Carolina |
||||||||||||||||||||||||||||||||||||||||||||||||||||||||
| Montgomery Country Club |
$ | 5,013 | $ | — | $ | 1,405 | $ | 406 | $ | — | $ | 5,404 | $ | — | $ | 1,420 | $ | 6,824 | $ | (648 | ) | In 1963 | 9/11/2008 | (2 | ) | |||||||||||||||||||||||||||||||
| Laytonsville, MD |
||||||||||||||||||||||||||||||||||||||||||||||||||||||||
| The Links at Challedon Golf Club |
$ | 2,940 | $ | — | $ | 718 | $ | 153 | $ | — | $ | 3,071 | $ | — | $ | 740 | $ | 3,811 | $ | (404 | ) | In 1995 | 9/11/2008 | (2 | ) | |||||||||||||||||||||||||||||||
| Mt. Airy, MD |
||||||||||||||||||||||||||||||||||||||||||||||||||||||||
| Mount Sunapee Mountain Resort |
(1 | ) | $ | — | $ | 6,727 | $ | 5,253 | $ | 62 | $ | — | $ | — | $ | 6,762 | $ | 5,280 | $ | 12,042 | $ | (1,169 | ) | In 1960 | 12/5/2008 | (2 | ) | |||||||||||||||||||||||||||||
| Newbury, New Hampshire |
||||||||||||||||||||||||||||||||||||||||||||||||||||||||
| Okemo Mountain Resort |
(1 | ) | $ | 17,566 | $ | 25,086 | $ | 16,684 | $ | 438 | $ | — | $ | 17,667 | $ | 25,144 | $ | 16,963 | $ | 59,774 | $ | (3,704 | ) | In 1963 | 12/5/2008 | (2 | ) | |||||||||||||||||||||||||||||
| Ludlow, Vermont |
||||||||||||||||||||||||||||||||||||||||||||||||||||||||
| Crested Butte Mountain Resort |
(1 | ) | $ | 1,305 | $ | 18,843 | $ | 11,188 | $ | 3,913 | $ | — | $ | 3,873 | $ | 19,218 | $ | 12,158 | $ | 35,249 | $ | (2,895 | ) | In 1960’s | 12/5/2008 | (2 | ) | |||||||||||||||||||||||||||||
| Mt. Crested Butte, Colorado |
||||||||||||||||||||||||||||||||||||||||||||||||||||||||
| Jiminy Peak Mountain Resort |
(1 | ) | $ | 7,802 | $ | — | $ | 8,164 | $ | 340 | $ | — | $ | 8,030 | $ | — | $ | 8,276 | $ | 16,306 | $ | (1,145 | ) | In 1948 | 1/27/2009 | (2 | ) | |||||||||||||||||||||||||||||
| Hancock, Massachusetts |
||||||||||||||||||||||||||||||||||||||||||||||||||||||||
| Wet'n'Wild Hawaii |
$ | — | $ | 13,399 | $ | 3,458 | $ | 62 | $ | — | $ | — | $ | 13,425 | $ | 3,494 | $ | 16,919 | $ | (780 | ) | In 1998 | 5/6/2009 | (2 | ) | |||||||||||||||||||||||||||||||
| Honolulu, Hawaii |
||||||||||||||||||||||||||||||||||||||||||||||||||||||||
| Great Wolf Lodge- Wisconsin Dells |
(1 | ) | $ | 3,433 | $ | — | $ | 17,632 | $ | — | $ | — | $ | 1,906 | $ | — | $ | 19,159 | $ | 21,065 | $ | (5,883 | ) | In 1997 | 8/6/2009 | (2 | ) | |||||||||||||||||||||||||||||
| Wisconsin Dells, Wisconsin |
||||||||||||||||||||||||||||||||||||||||||||||||||||||||
| Great Wolf Lodge- Sandusky |
(1 | ) | $ | 2,772 | $ | — | $ | 30,061 | $ | — | $ | — | $ | 2,236 | $ | 26 | $ | 30,571 | $ | 32,833 | $ | (6,171 | ) | In 2001 | 8/6/2009 | (2 | ) | |||||||||||||||||||||||||||||
| Sandusky, Ohio |
||||||||||||||||||||||||||||||||||||||||||||||||||||||||
| Orvis Development Lands |
$ | 51,255 | $ | — | $ | — | $ | 793 | $ | — | $ | 52,048 | $ | — | $ | — | $ | 52,048 | $ | — | N/A | 10/29/2009 | (2 | ) | ||||||||||||||||||||||||||||||||
| Granby, Colorado |
||||||||||||||||||||||||||||||||||||||||||||||||||||||||
| Anacapa Isle Marina |
(1 | ) | $ | — | $ | 7,155 | $ | 2,250 | $ | — | $ | — | $ | — | $ | 7,155 | $ | 2,250 | $ | 9,405 | $ | (410 | ) | In 1973 | 3/12/2010 | (2 | ) | |||||||||||||||||||||||||||||
| Oxnard, California |
||||||||||||||||||||||||||||||||||||||||||||||||||||||||
| Ballena Isle Marina |
23 | $ | 4,793 | $ | 2,906 | $ | — | $ | — | $ | 38 | $ | 4,720 | $ | 2,964 | $ | 7,722 | $ | (207 | ) | In 1972 | 3/12/2010 | (2 | ) | ||||||||||||||||||||||||||||||||
| Alameda, California |
||||||||||||||||||||||||||||||||||||||||||||||||||||||||
142
Table of Contents
CNL LIFESTYLE PROPERTIES, INC. AND SUBSIDIARIES
SCHEDULE III—REAL ESTATE AND ACCUMULATED DEPRECIATION—CONTINUED
As of December 31, 2010 (in thousands)
| Property/Location |
Encumbe- rances |
Initial Costs | Costs Capitalized Subsequent to Acquisition |
Gross Amounts at which Carried at Close of Period(3) |
Accumu- lated Depre- ciation |
Date of Construc- tion |
Date Acquired |
Life
on which depre- ciation in latest income state- ments is computed |
||||||||||||||||||||||||||||||||||||||||||||||||
| Land & Land Improve- ments |
Lease- hold Interests and Improve- ments |
Buildings | Improve- ments |
Carrying Costs |
Land & Land Improve- ments |
Lease- hold Interests and Improve- ments |
Buildings | Total | ||||||||||||||||||||||||||||||||||||||||||||||||
| Cabrillo Isle Marina |
(1 | ) | $ | — | $ | 17,984 | $ | 1,569 | $ | — | $ | — | $ | — | $ | 17,984 | $ | 1,569 | $ | 19,553 | $ | (816 | ) | In 1977 | 3/12/2010 | (2 | ) | |||||||||||||||||||||||||||||
| San Diego, California |
||||||||||||||||||||||||||||||||||||||||||||||||||||||||
| Ventura Isle Marina |
$ | — | $ | 14,426 | $ | 1,505 | $ | — | $ | — | $ | — | $ | 14,426 | $ | 1,505 | $ | 15,931 | $ | (792 | ) | In 1975 | 3/12/2010 | (2 | ) | |||||||||||||||||||||||||||||||
| Ventura California |
||||||||||||||||||||||||||||||||||||||||||||||||||||||||
| Bohemia Vista Yacht Basin |
$ | 4,307 | $ | 362 | $ | 136 | $ | — | $ | — | $ | 4,669 | $ | — | $ | 136 | $ | 4,805 | $ | (36 | ) | In 1967 | 5/20/2010 | (2 | ) | |||||||||||||||||||||||||||||||
| Chesapeake City, MD |
||||||||||||||||||||||||||||||||||||||||||||||||||||||||
| Hacks Point Marina |
$ | 1,759 | $ | 148 | $ | 56 | $ | — | $ | — | $ | 1,907 | $ | — | $ | 56 | $ | 1,963 | $ | (15 | ) | In 1970’s | 5/20/2010 | (2 | ) | |||||||||||||||||||||||||||||||
| Earleville, Maryland |
||||||||||||||||||||||||||||||||||||||||||||||||||||||||
| Pacific Park |
$ | — | $ | 25,050 | $ | 1,576 | $ | — | $ | — | $ | — | $ | 25,050 | $ | 1,576 | $ | 26,626 | $ | (39 | ) | In 1996 | 12/29/2010 | (2 | ) | |||||||||||||||||||||||||||||||
| Santa Monica, California |
||||||||||||||||||||||||||||||||||||||||||||||||||||||||
| $ | 978,376 | $ | 279,308 | $ | 537,589 | $ | 150,141 | $ | — | $ | 1,011,838 | $ | 306,694 | $ | 626,882 | $ | 1,945,414 | $ | (219,625 | ) | ||||||||||||||||||||||||||||||||||||
143
Table of Contents
CNL LIFESTYLE PROPERTIES, INC. AND SUBSIDIARIES
SCHEDULE III—REAL ESTATE AND ACCUMULATED DEPRECIATION—CONTINUED
As of December 31, 2010 (in thousands)
Transactions in real estate and accumulated depreciation as of December 31, 2009 are as follows:
| Balance at December 31, 2004 |
$ | — | Balance at December 31, 2004 | $ | — | |||||
| 2005 Acquisitions |
19,837 | 2005 Depreciation |
11 | |||||||
| Balance at December 31, 2005 |
19,837 | Balance at December 31, 2005 | 11 | |||||||
| 2006 Acquisitions |
392,300 | 2006 Depreciation |
3,541 | |||||||
| Balance at December 31, 2006 |
412,137 | Balance at December 31, 2006 | 3,552 | |||||||
| 2007 Acquisitions |
984,259 | 2007 Depreciation |
29,675 | |||||||
| Balance at December 31, 2007 |
1,396,396 | Balance at December 31, 2007 | 33,227 | |||||||
| 2008 Acquisitions |
279,823 | 2008 Depreciation |
51,182 | |||||||
| 2008 Dispositions |
(18,515 | ) | 2008 Accumulated depreciation on dispositions |
(1,486 | ) | |||||
| Balance at December 31, 2008 |
$ | 1,657,704 | Balance at December 31, 2008 | $ | 82,923 | |||||
| 2009 Acquisitions |
214,686 | 2009 Depreciation |
61,042 | |||||||
| Balance at December 31, 2009 |
$ | 1,872,390 | Balance at December 31, 2009 | $ | 143,965 | |||||
| 2010 Acquisitions |
99,904 | 2010 Depreciation |
75,660 | |||||||
| 2010 Impairment provision |
|
(26,880 |
) |
Balance at December 31, 2010 |
$ | 219,625 | ||||
| Balance at December 31, 2010 |
$ | 1,945,414 | ||||||||
FOOTNOTES:
| (1) | The property is encumbered at December 31, 2010. |
| (2) | Buildings and improvements are depreciated over 39 years. Leasehold improvements and equipment are depreciation over their estimated useful lives. |
| (3) | The aggregate cost for federal income tax purposes is $1.9 billion. |
144
Table of Contents
CNL LIFESTYLE PROPERTIES, INC. AND SUBSIDIARIES
SCHEDULE IV—MORTGAGE LOANS ON REAL ESTATE
December 31, 2010 (in thousands)
| Borrower and Description of Collateral Property |
Final Maturity Date |
Interest Rate |
Periodic Payment Term |
Prior Liens |
Face Amount of Mortgages |
Carrying Amount of Mortgages |
Principal Amount of Loans Subject to Delinquent Principal or Interest |
|||||||||||||||||||||
| PARC Management LLC (equipment)(1) |
11/12/2011 | |
8.00% - 8.50% |
|
|
Monthly interest only payments |
|
n/a | $ | 584 | $ | — | (1) | $ | — | |||||||||||||
| Big Sky Resort (one ski resort) |
9/1/2012 | 12.00% | |
Monthly interest only payments |
|
n/a | 68,000 | 68,000 | — | |||||||||||||||||||
| Booth Creek Resort Properties LLC (one ski property and one parcel of land)(2) |
1/15/2012 | variable | |
Monthly interest only payments |
|
n/a | — | — | — | |||||||||||||||||||
| CMR Properties, LLC and CM Resort, LLC (one ski property and one construction loan)(2) |
9/30/2017 | |
9.00% - 11.00% |
|
|
Monthly interest only payments |
|
n/a | 13,787 | 13,787 | — | |||||||||||||||||
| Marinas International, Inc. (one marina and one construction loan)(3) |
12/22/2021 | |
9.00% - 10.25% |
|
|
Monthly interest only payments |
|
n/a | 7,449 | 7,449 | — | |||||||||||||||||
| Boyne USA, Inc. (four ski resorts) |
9/1/2012 | |
6.30% - 15.00% |
|
|
Monthly interest only payments |
|
n/a | 18,208 | 18,208 | — | |||||||||||||||||
| PARC Magic Springs LLC (one parcel of land and membership interests)(1) |
8/1/2012 | |
10.00% - 11.00% |
|
|
Monthly interest only payments |
|
n/a | 1,475 | — | (1) | — | ||||||||||||||||
| PARC Investors, LLC and PARC Operations, LLC (membership interest)(1) |
9/1/2010 | 9.00% | |
Monthly interest only payments |
|
n/a | 3,000 | — | (1) | — | ||||||||||||||||||
| Evergreen Alliance Golf Limited, L.P.(4) |
11/1/2013 | 11.00% | |
Monthly interest only payments |
|
n/a | 4,000 | 4,000 | — | |||||||||||||||||||
| Total |
$ | 116,503 | $ | 111,444 | $ | — | ||||||||||||||||||||||
FOOTNOTES:
| (1) | In connection with the lease termination and settlement agreement with PARC as discussed above, the Company deemed these mortgages and notes receivable uncollectible and recorded a loan loss provision of approximately $4.1 million including accrued interest for these loans. |
| (2) | During 2010, Booth Creek Resort Properties, LLC (“Booth Creek”), an existing borrower, sold its property (Cranmore Mountain Resort) that is collateralized by a loan from the Company to an affiliate of Jiminy Peak Mountain Resort, LLC, an existing tenant. In addition, Booth Creek sold its 100% equity interest in the company that operates two of our ski and lifestyle properties to Vail Resorts, Inc. In connection with the transactions, Booth Creek repaid a loan with an outstanding balance of approximately $3.9 million, including accrued and deferred interest. An affiliate of Jiminy Peak Mountain Resort LLC assumed one loan that had an outstanding principal balance of approximately $8.8 million. The loan was amended with the following terms: annual interest rate of 6.0% with periodic increases to 11.0% over the life of the loan until maturity on September 30, 2017 with monthly interest-only payments. Simultaneously, the Company committed to provide a $7.0 million construction loan to fund a significant expansion of the property with the following terms: annual interest rate of 9.0% with periodic increases to 11.0% over the life of the loan until maturity on September 30, 2017 with monthly interest-only payments. The Company obtained a call option, and the new borrower retained a put option to allow or cause the Company, to purchase the Cranmore Mountain Resort, if certain criteria are met in years 2015 through 2017. The Company’s obligation to the put option would be limited to the outstanding loan balance. As of December 31, 2010, approximately $5.0 million was drawn on the construction loan for improvements at the resort. |
| (3) | On December 10, 2010, Marinas International, Inc., an existing borrower, repaid its three outstanding loans of approximately $36.8 million including accrued interest. On March 30, 2010, it entered into a new construction loan for approximately $3.1 |
145
Table of Contents
| million which is collateralized by one marina property. Approximately $2.9 million was drawn as of December 31, 2010. The loan bears an annual interest rate of 9.0% with monthly interest-only payments until January 1, 2011, at which time, monthly payments of principal and interest in the amount of $25,216 with unpaid principal and interest due at maturity on December 22, 2021. In addition, Marinas International is required to pay an exit fee at maturity equal to the aggregate of monthly interest payments that would have been payable if the annual interest rate had been 10.25% instead of 9.0%. |
| (4) | On November 12, 2010, EAGLE Golf borrowed $4.0 million which is collateralized by substantially all of EAGLE Golf’s accounts receivable, inventory and tangible personal property. The loan bears an annual interest rate of 11.0% with monthly interest only payments. The principal together with all accrued and unpaid interest are due at maturity on November 1, 2013. |
| (5) | The aggregate cost for federal income tax purposes is $116.4 million. |
| 2010 | 2009 | |||||||
| Balance at beginning of period |
$ | 145,640 | $ | 182,073 | ||||
| New mortgage loans |
14,889 | 36,480 | ||||||
| Collection of principal |
(38,614 | ) | (18,388 | ) | ||||
| Loan loss provision |
(4,072 | ) | — | |||||
| Foreclosed and converted to real estate |
— | (51,255 | ) | |||||
| Accrued and deferred interest |
(281 | ) | (2,544 | ) | ||||
| Acquisition fees allocated, net |
(1,206 | ) | (887 | ) | ||||
| Loan origination fees, net |
71 | 161 | ||||||
| $ | 116,427 | $ | 145,640 | |||||
146