UNITED STATES
SECURITIES AND EXCHANGE COMMISSION
Washington, D.C. 20549
Form 10-K
| |
|
|
| þ |
|
ANNUAL REPORT PURSUANT TO SECTION 13 OR 15(d) OF THE SECURITIES EXCHANGE ACT OF 1934 |
For the fiscal year ended December 31, 2010
OR
| |
|
|
| o |
|
TRANSITION REPORT PURSUANT TO SECTION 13 OR 15(d) OF THE SECURITIES EXCHANGE ACT OF 1934 |
For the transition period from to
COMMISSION FILE NO.: 001-34815
OXFORD RESOURCE PARTNERS, LP
(Exact name of registrant as specified in its charter)
| |
|
|
|
| Delaware
|
|
77-0695453 |
| (STATE OR OTHER JURISDICTION OF
|
|
(IRS EMPLOYER |
| INCORPORATION OR ORGANIZATION)
|
|
IDENTIFICATION NO.) |
41 South High Street, Suite 3450, Columbus, Ohio 43215
(Address Of Principal Executive Offices And Zip Code)
(614) 643-0314
(Registrant’s telephone number, including area code)
Securities registered pursuant to Section 12(b) of the Act: Common Units representing limited partner interests
| |
|
|
|
| Title of Each Class
|
|
Name of Each Exchange On Which Registered |
|
|
|
|
| Common Units Representing Limited Partner Interests
|
|
New York Stock Exchange |
Securities registered pursuant to Section 12(g) of the Act: None
Indicate by check mark if the registrant is a well-known seasoned issuer, as defined in Rule
405 of the Securities Act. o Yes þ No
Indicate by check mark if the registrant is not required to file reports pursuant to Section
13 or Section 15(d) of the Act. o Yes þ No
Indicate by check mark whether the registrant (1) has filed all reports required to be filed
by Section 13 or 15(d) of the Securities Exchange Act of 1934 during the preceding 12 months (or
for such shorter period that the registrant was required to file such reports), and (2) has been
subject to such filing requirements for the past 90 days. þ Yes o No
Indicate by check mark whether the registrant has submitted electronically and posted on its
corporate Web site, if any, every Interactive Data File required to be submitted and posted
pursuant to Rule 405 of Regulation S-T (§ 232.405 of this chapter) during the preceding 12 months
(or for such shorter period that the registrant was required to submit and post such files).
o Yes o No
Indicate by check mark if disclosure of delinquent filers pursuant to Item 405 of Regulation
S-K is not contained herein, and will not be contained, to the best of registrant’s knowledge, in
definitive proxy or information statements incorporated by reference in Part III of this Form 10-K
or any amendment to this Form 10-K. þ
Indicate by check mark whether the registrant is a large accelerated filer, an accelerated
filer, a non-accelerated filer, or a smaller reporting company. See the definitions of “large
accelerated filer,” “accelerated filer,” and “smaller reporting company” in Rule 12b-2 of the
Exchange Act. (Check one)
| |
|
|
|
|
|
|
|
| Large Accelerated Filer o
|
|
Accelerated Filer o
|
|
Non-Accelerated Filer þ
|
|
Smaller Reporting Company o |
Indicate by check mark whether the registrant is a shell company (as defined in Rule 12b-2 of
the Exchange Act). o Yes þ No
As of June 30, 2010, the last business day of the registrant’s second fiscal quarter of 2010,
the registrant’s common units were not listed on any exchange or over-the-counter market. The
registrant’s common units began trading on the New York Stock Exchange on July 14, 2010. The
aggregate market value of the common units held by non-affiliates of the registrant (treating all
executive officers and directors of the registrant, for this purpose, as if they may be affiliates
of the registrant) was approximately $251,653,000 as of December 31, 2010, based on the reported
closing price of the common units as reported on the New York Stock Exchange on such date.
As of March 14, 2011, 10,341,416 common units and 10,280,380 subordinated units were
outstanding. The common units trade on the New York Stock Exchange under the ticker symbol “OXF.”
DOCUMENTS INCORPORATED BY REFERENCE: None
CAUTIONARY STATEMENT ABOUT FORWARD-LOOKING STATEMENTS
This Annual Report on Form 10-K contains certain “forward-looking statements.” Statements
included in this Annual Report on Form 10-K that are not historical facts, that address activities,
events or developments that we expect or anticipate will or may occur in the future, including
things such as plans for growth of the business, future capital expenditures, competitive
strengths, goals, references to future goals or intentions or other such references, are
forward-looking statements. These statements can be identified by the use of forward-looking
terminology, including “may,” “believe,” “expect,” “anticipate,” “estimate,” “continue” or similar
words. These statements are made by us based on our past experience and our perception of
historical trends, current conditions and expected future developments as well as other
considerations we believe are appropriate under the circumstances. Whether actual results and
developments in the future will conform to our expectations is subject to numerous risks and
uncertainties, many of which are beyond our control. Therefore, actual outcomes and results could
materially differ from what is expressed, implied or forecasted in these statements. Any
differences could be caused by a number of factors, including but not limited to:
| |
• |
|
our production levels, margins earned and level of operating costs; |
| |
• |
|
weakness in global economic conditions or in our customers’ industries; |
| |
• |
|
changes in governmental regulation of the mining industry or the electric power
industry and the increased costs of complying with those changes; |
| |
• |
|
decreases in demand for electricity and changes in coal consumption patterns of U.S.
electric power generators; |
| |
• |
|
our dependence on a limited number of customers; |
| |
• |
|
our inability to enter into new long-term coal sales contracts at attractive prices
and the renewal and other risks associated with our existing long-term coal sales
contracts, including risks related to adjustments to price, volume or other terms of
those contracts; |
| |
• |
|
difficulties in collecting our receivables because of credit or financial problems
of major customers, and customer bankruptcies, cancellations or breaches of existing
contracts, or other failures to perform; |
| |
• |
|
our ability to acquire additional coal reserves; |
| |
• |
|
our ability to respond to increased competition within the coal industry; |
| |
• |
|
fluctuations in coal demand, prices and availability due to labor and transportation
costs and disruptions, equipment availability, governmental regulations, including
those pertaining to carbon dioxide emissions, and other factors; |
| |
• |
|
significant costs imposed on our mining operations by extensive and frequently
changing environmental laws and regulations, and greater than expected environmental
regulation, costs and liabilities; |
| |
• |
|
legislation, and regulatory and related judicial decisions and interpretations,
including issues pertaining to climate change and miner health and safety; |
| |
• |
|
a variety of operational, geologic, permitting, labor and weather-related factors,
including those pertaining to both our mining operations and our underground coal
reserves that we do not operate; |
| |
• |
|
limitations in the cash distributions we receive from our majority-owned subsidiary,
Harrison Resources, LLC, and the ability of Harrison Resources to acquire additional
reserves on economical terms from CONSOL Energy Inc. in the future; |
ii
| |
• |
|
the potential for inaccuracies in our estimates of our coal reserves, which could
result in lower than expected revenues or higher than expected costs; |
| |
• |
|
the accuracy of the assumptions underlying our reclamation and mine closure
obligations; |
| |
• |
|
liquidity constraints, including those resulting from the cost or unavailability of
financing due to current capital markets conditions; |
| |
• |
|
risks associated with major mine-related accidents; |
| |
• |
|
results of litigation, including claims not yet asserted; |
| |
• |
|
our ability to attract and retain key management personnel; |
| |
• |
|
greater than expected shortage of skilled labor; |
| |
• |
|
our ability to maintain satisfactory relations with our employees; and |
| |
• |
|
failure to obtain, maintain or renew our security arrangements, such as surety bonds
or letters of credit, in a timely manner and on acceptable terms. |
When considering forward-looking statements, you should keep in mind the risk factors and
other cautionary statements set forth in this Annual Report on Form 10-K as well as other written
and oral statements made or incorporated by reference from time to time by us in other reports and
filings with the Securities and Exchange Commission, or the SEC. All forward-looking statements
included in this Annual Report on Form 10-K and all subsequent written or oral forward-looking
statements attributable to us or persons acting on our behalf are expressly qualified in their
entirety by these cautionary statements. The forward-looking statements speak only as of the date
made, other than as required by law, and we undertake no obligation to publicly update or revise
any forward-looking statements, whether as a result of new information, future events or otherwise.
iii
Glossary of Selected Mining Terms
base-load power plants: The electrical generation facilities used to meet some or all of a
given region’s continuous energy demand and produce energy at a constant rate.
base-load scrubbed power plants: Base-load power plants that are scrubbed power plants.
Btu: British thermal unit, or Btu, is the amount of heat required to raise the temperature of
one pound of water one degree Fahrenheit.
dozer: A large, powerful tractor having a vertical blade at the front end for moving earth,
rocks, etc.
highwall: The unexcavated face of exposed overburden and coal in a surface mine or in a face
or bank on the uphill side of a contour mine excavation.
industrial boilers: Closed vessels that use a fuel source to heat water or generate steam for
industrial heating and humidification applications.
limestone: A rock predominantly composed of the mineral calcite (calcium carbonate (CaCO2)).
metallurgical coal: The various grades of coal suitable for carbonization to make coke for
steel manufacture. Its quality depends on four important criteria: volatility, which affects coke
yield; the level of impurities including sulfur and ash, which affects coke quality; composition,
which affects coke strength; and basic characteristics, which affect coke oven safety.
Metallurgical coal typically has a particularly high Btu but low ash and sulfur content.
probable coal reserves: Coal reserves for which quantity and grade and/or quality are computed
from information similar to that used for proven coal reserves, but the sites for inspection,
sampling and measurement are farther apart or are otherwise less adequately spaced. The degree of
assurance, although lower than that for proven coal reserves, is high enough to assume continuity
between points of observation.
proven coal reserves: Coal reserves for which (i) quantity is computed from dimensions
revealed in outcrops, trenches, workings or drill holes; (ii) grade and/or quality are computed
from the results of detailed sampling; and (iii) the sites for inspection, sampling and measurement
are spaced so closely and the geologic character is so well defined that size, shape, depth and
mineral content of coal reserves are well-established.
proven and probable coal reserves: Coal reserves which are a combination of proven coal
reserves and probable coal reserves.
reclamation: The restoration of mined land to original contour, use or condition.
reserve: That part of a mineral deposit that could be economically and legally extracted or
produced at the time of the reserve determination.
scrubbed power plant: A power plant that uses scrubbers to clean the gases that pass through
its smokestacks.
iv
scrubbers: Air pollution control devices that can be used to remove some particulates and
chemical compounds from industrial exhaust streams.
selective catalytic reduction, or SCR, device: A means of converting nitrogen oxides, also
referred to as NOx, with the aid of a catalyst into diatomic nitrogen (N2) and water (H2O).
spoil-piles: Earth and rock removed from a coal deposit and temporarily stored during
excavation.
steam coal: Coal used by power plants and industrial steam boilers to produce electricity,
steam or both.
strip ratio: In open pit mining, strip ratio refers to the number of tons of overburden or
waste that must be removed to extract one ton of coal.
tipple: A structure where coal is cleaned and loaded in railroad cars or trucks.
total maximum daily load: A calculation of the maximum amount of a pollutant that a body of
water can receive per day and still safely meet water quality standards.
v
PART I
Overview
We are a low cost producer of high value steam coal, and we are the largest producer of
surface mined coal in Ohio. We focus on acquiring steam coal reserves that we can efficiently mine
with our modern, large scale equipment. Our reserves and operations are strategically located in
Northern Appalachia and the Illinois Basin to serve our primary market area of Illinois, Indiana,
Kentucky, Ohio, Pennsylvania and West Virginia. We market our coal primarily to large utilities
with coal-fired, base-load scrubbed power plants under long-term coal sales contracts.
We currently have 21 active surface mines, two of which became active mines in 2011, that are
managed as eight mining complexes. Our operations also include two river terminals, strategically
located in eastern Ohio and western Kentucky. During 2010, we produced 7.5 million tons of coal.
During 2010, we sold 8.1 million tons of coal, including 0.7 million tons of purchased coal. As a
result, our coal inventory on hand increased by approximately 0.1 million tons. As is customary in
the coal industry, we have entered into long-term coal sales contracts with many of our customers.
We define long-term coal sales contracts as coal sales contracts having initial terms of one year
or more.
As of December 31, 2010, we owned and/or controlled 93.5 million tons of proven and probable
coal reserves, of which 68.1 million tons were associated with our surface mining operations and
the remaining 25.4 million tons consisted of underground coal reserves that we have subleased to a
third party in exchange for an overriding royalty. Historically, we have been successful at
replacing the reserves depleted by our annual production and growing our reserve base by acquiring
reserves with low operational, geologic and regulatory risks and that were located near our mining
operations or that otherwise had the potential to serve our primary market area. In 2010, we
acquired 8.7 million tons of proven and probable coal reserves, an amount equal to 109% of our 2010
production.
The following table summarizes our mining complexes, our coal production for the year ended
December 31, 2010 and our coal reserves as of December 31, 2010:
| |
|
|
|
|
|
|
|
|
|
|
|
|
|
|
|
|
|
|
|
|
|
|
|
|
|
|
| |
|
|
|
|
|
As of December 31, 2010 |
| |
|
Production for |
|
|
Total |
|
|
|
|
|
|
|
|
|
|
Average |
|
|
Average |
|
|
|
| |
|
the Year Ended |
|
|
Proven & |
|
|
|
|
|
|
|
|
|
|
Heat |
|
|
Sulfur |
|
|
Primary |
| |
|
December 31, |
|
|
Probable |
|
|
Proven |
|
|
Probable |
|
|
Value |
|
|
Content |
|
|
Transportation |
| Mining Complexes |
|
2010 |
|
|
Reserves(1) |
|
|
Reserves(1) |
|
|
Reserves(1) |
|
|
(BTU/lb.) |
|
|
(%) |
|
|
Methods |
| |
|
(in million tons) |
|
|
|
|
|
|
|
|
|
|
|
Surface Mining Operations: |
|
|
|
|
|
|
|
|
|
|
|
|
|
|
|
|
|
|
|
|
|
|
|
|
|
|
Northern Appalachia
- (principally Ohio) |
|
|
|
|
|
|
|
|
|
|
|
|
|
|
|
|
|
|
|
|
|
|
|
|
|
|
Cadiz (2) |
|
|
1.4 |
|
|
|
10.9 |
|
|
|
10.9 |
|
|
|
— |
|
|
|
11,500 |
|
|
|
3.4 |
|
|
Barge, Rail |
Tuscarawas County (2) |
|
|
0.9 |
|
|
|
7.6 |
|
|
|
7.6 |
|
|
|
— |
|
|
|
11,670 |
|
|
|
3.9 |
|
|
Truck |
Plainfield |
|
|
0.3 |
|
|
|
6.4 |
|
|
|
6.4 |
|
|
|
— |
|
|
|
11,460 |
|
|
|
4.4 |
|
|
Truck |
Belmont County |
|
|
1.1 |
|
|
|
6.2 |
|
|
|
5.9 |
|
|
|
0.3 |
|
|
|
11,620 |
|
|
|
3.8 |
|
|
Barge |
New Lexington |
|
|
0.6 |
|
|
|
5.7 |
|
|
|
5.4 |
|
|
|
0.3 |
|
|
|
11,550 |
|
|
|
3.9 |
|
|
Rail |
Harrison(3) |
|
|
1.0 |
|
|
|
5.1 |
|
|
|
4.9 |
|
|
|
0.2 |
|
|
|
12,000 |
|
|
|
1.8 |
|
|
Barge, Rail, Truck |
Noble County |
|
|
0.5 |
|
|
|
2.7 |
|
|
|
2.7 |
|
|
|
— |
|
|
|
11,200 |
|
|
|
4.7 |
|
|
Barge, Truck |
Illinois Basin (Kentucky) |
|
|
|
|
|
|
|
|
|
|
|
|
|
|
— |
|
|
|
|
|
|
|
|
|
|
|
Muhlenberg County |
|
|
1.7 |
|
|
|
23.5 |
|
|
|
22.8 |
|
|
|
0.7 |
|
|
|
11,309 |
|
|
|
3.6 |
|
|
Barge, Truck |
|
|
|
|
|
|
|
|
|
|
|
|
|
|
|
|
|
|
|
|
|
|
|
Total Surface Mining
Operations |
|
|
7.5 |
|
|
|
68.1 |
|
|
|
66.6 |
|
|
|
1.5 |
|
|
|
|
|
|
|
|
|
|
|
|
|
|
|
|
|
|
|
|
|
|
|
|
|
|
|
|
|
|
|
|
|
|
|
|
|
|
|
|
|
|
|
|
|
|
|
|
|
|
|
|
|
|
|
|
|
|
|
|
|
Underground Coal Reserves: |
|
|
|
|
|
|
|
|
|
|
|
|
|
|
|
|
|
|
|
|
|
|
|
|
|
|
Northern Appalachia (Ohio) |
|
|
|
|
|
|
|
|
|
|
|
|
|
|
|
|
|
|
|
|
|
|
|
|
|
|
Tusky(4) |
|
|
|
|
|
|
25.4 |
|
|
|
20.0 |
|
|
|
5.4 |
|
|
|
12,910 |
|
|
|
2.1 |
|
|
|
|
|
|
|
|
|
|
|
|
|
|
|
|
|
|
|
|
|
|
|
|
|
|
|
Total Underground Coal
Reserves |
|
|
|
|
|
|
25.4 |
|
|
|
20.0 |
|
|
|
5.4 |
|
|
|
|
|
|
|
|
|
|
|
|
|
|
|
|
|
|
|
|
|
|
|
|
|
|
|
|
|
|
|
|
|
|
|
|
|
|
|
|
|
|
|
|
|
|
|
|
|
|
|
|
|
|
|
|
|
|
|
|
|
|
Total |
|
|
|
|
|
|
93.5 |
|
|
|
86.6 |
|
|
|
6.9 |
|
|
|
|
|
|
|
|
|
|
|
|
|
|
|
|
|
|
|
|
|
|
|
|
|
|
|
|
|
|
|
|
|
|
|
| |
|
|
| (1) |
|
Reported as recoverable coal reserves, which is the portion of the coal that could
be economically produced at the time of the reserve determination, taking into account mining
recovery and preparation plant yield. |
| |
| (2) |
|
One additional mine became active within each of these complexes in 2011. |
1
| |
|
|
| (3) |
|
The Harrison mining complex is owned by Harrison Resources, our joint venture with
CONSOL Energy. We own 51.0% of Harrison Resources and CONSOL Energy owns the remaining 49.0%
through one of its subsidiaries. Because the results of operations of Harrison Resources are
included in our consolidated financial statements for the year ended December 31, 2010 as
required by U.S. generally accepted accounting principles, or GAAP, coal production and proven
and probable coal reserves attributable to the Harrison mining complex are presented on a
gross basis assuming we owned 100.0% of Harrison Resources. Please read “— Mining Operations
— Northern Appalachia — Harrison Mining Complex.” |
| |
| (4) |
|
Please read “— Mining Operations — Underground Coal Reserves” for more information
about our underground coal reserves at the Tusky mining complex, which we have subleased to a
third party in exchange for an overriding royalty. |
We are a Delaware limited partnership that is listed on the New York Stock Exchange, or
NYSE, under the ticker symbol “OXF.” On July 19, 2010, we closed our initial public offering of
common units. After deducting underwriting discounts and commissions of approximately $10.5 million
paid to the underwriters, our offering expenses of approximately $6.1 million and a structuring fee
of approximately $0.8 million, the net proceeds from our initial public offering were approximately
$144.5 million.
We were formed in August 2007 by American Infrastructure MLP Fund, L.P., or AIM, and C&T Coal,
Inc., or C&T Coal. AIM is a private investment firm specializing in natural resources,
infrastructure and real property. AIM, along with certain of the funds that AIM advises,
indirectly owns all of the ownership interests in AIM Oxford Holdings, LLC, or AIM Oxford, the
entity it used to form us in 2007. Brian D. Barlow, Matthew P. Carbone and George E. McCown serve
on the board of directors of our general partner and are principals of AIM and have ownership
interests in AIM. C&T Coal is owned by our founders, Charles C. Ungurean, the President and Chief
Executive Officer of our general partner and a member of the board of directors of our general
partner, and Thomas T. Ungurean, the Senior Vice President, Equipment, Procurement and Maintenance
of our general partner. Each of our two founders has over 38 years of experience in the coal
mining industry. In connection with our formation, our founders contributed all of their interests
in Oxford Mining Company to us and agreed that they would not compete with us in the coal mining
business in Illinois, Kentucky, Ohio, Pennsylvania, West Virginia and Virginia. This non-compete
agreement is in effect until August 24, 2014.
Our founders formed Oxford Mining Company in 1985 to provide contract mining services to a
mining division of a major oil company. In 1989, our founders transitioned Oxford Mining Company
from a contract miner into a producer of its own coal reserves. In January 2007, Oxford Mining
Company entered into a joint venture, Harrison Resources, with a subsidiary of CONSOL Energy to
mine surface coal reserves purchased from CONSOL Energy. In September 2009, we completed the
acquisition of Phoenix Coal’s active surface mining operations. The Phoenix Coal acquisition
provided us with an entry into the Illinois Basin in western Kentucky and included one mining
complex comprised of four mines as well as the Island river terminal on the Green River in western
Kentucky.
Industry Overview
Coal is ranked by heat content, with bituminous, sub-bituminous and lignite coal representing
the highest to lowest heat ranking, respectively. Coal is also categorized as either steam coal or
metallurgical coal. Steam coal is used by utilities and independent power producers to generate
electricity and metallurgical coal is used by steel companies to produce metallurgical coke for use
in blast furnaces. The U.S. Department of Energy’s Energy Information Administration, or the EIA,
forecasts that coal-fired electric power generation will increase by 13.0% through 2015 and by
27.0% through 2035, with steam coal remaining the dominant fuel source in the future.
Coal Quality Characteristics
Coal quality is primarily differentiated by its heat and sulfur content. Heat content is
measured in Btu per pound (Btu/lb). In general, coal with low moisture and ash content has high
heat content. Coal with higher heat content commands higher prices because less coal is needed to
generate a given quantity of electric power.
Sulfur content is measured in pounds of sulfur dioxide emitted per million Btu of fuel
combusted. When coal is burned, sulfur dioxide and other air emissions are released. Compliance
coal is a term generally used in the United States to describe coal or a blend of coals that, when
burned, emits less than 1.2 lbs of sulfur dioxide per million Btu and
complies with the requirements of the Clean Air Act Amendments of 1990, or the CAAA, without
the use of scrubbers. The primary reserves of compliance coal are found in both the Powder River
Basin, or PRB, and Central Appalachia.
2
High sulfur coal can be burned in electric utility plants equipped with sulfur-reduction
technology, such as scrubbers, which can reduce sulfur dioxide emissions by more than 90%. Plants
without scrubbers can burn high sulfur coal by blending it with lower sulfur coal, or by purchasing
emission allowances on the open market.
Coal ash and chlorine content also can influence the marketability of a particular coal. Ash
is the inorganic residue remaining after the combustion of coal. Ash content is also an important
characteristic of coal because electric generating plants must handle and dispose of ash following
combustion. The chlorine content of coal is important to generating station operators since high
levels can adversely impact boiler performance directly by both high and low temperature corrosion
and indirectly by reacting with other coal impurities to cause ash fouling. As with sulfur, coal
of various ash contents can be blended to meet the specific combustion and environmental needs of
customers.
Coal Mining Methods
Coal is mined using two primary methods, surface mining and underground mining. Surface
mining is generally used when coal is found relatively close to the surface, when multiple seams in
close vertical proximity are being mined or when conditions otherwise warrant. Surface mining
generally involves removing the overburden (earth and rock covering the coal) with heavy earth
moving equipment and explosives, loading out the coal, replacing the overburden and topsoil after
the coal has been excavated and reestablishing vegetation and plant life. Surface mining methods
generally encompass highwall and auger mining methods. After a final highwall is established by
other surface mining methods, a highwall miner or auger is used to recover additional reserves from
the coal seam in place without additional overburden removal. A highwall miner is similar to a
continuous miner used in underground mining connected to a conveyor system to remove coal as the
highwall miner advances into the coal seam underground from the open highwall face. Underground
mining is generally used when the coal seam is too deep to permit surface mining.
Transportation
The U.S. coal industry is dependent on the availability of a consistent and responsive
transportation network connecting the various supply regions to the domestic and international
markets. Railroads and barges comprise the foundation of the domestic coal distribution system,
collectively handling about three-quarters of all coal shipments. Truck and conveyor systems
typically move coal over shorter distances.
Although the purchaser typically bears the freight costs, transportation costs are still
important to coal mining companies because the purchaser may choose a supplier largely based on the
total delivered cost of coal, which includes the cost of transportation. Coal used for domestic
consumption may be sold free-on-board at the mine, or FOB mine, which means the purchaser normally
bears the transportation costs. Transportation can be a large component of a purchaser’s total
cost.
While coal can sometimes be moved by one transportation method to market, it is common for two
or more modes to be used to ship coal (i.e., inter-modal movements). The method of transportation
and the delivery distance greatly impact the total cost of coal delivered to the customer.
Overview of U.S. Market
The majority of coal consumed in the United States is used to generate electricity, with the
balance used by a variety of industrial users to heat and power foundries, cement plants, paper
mills, chemical plants and other manufacturing and processing facilities. In 2009, coal-fired
power plants produced approximately 45.0% of all electric power generation and steam coal accounted
for 92.0% of total coal consumption.
Short-Term Outlook
The EIA forecasts that domestic coal consumption will increase by 14.4% through 2015 and
coal-fired electric power generation will increase by 13.0% through 2015. According to the EIA,
coal production in Northern Appalachia and the Illinois Basin is expected to grow by 29.2% and
33.1%, respectively, through 2015. We believe that this projected increase will be driven by a
combination of the continued decline in coal production in Central Appalachia and the new
scrubber installations at coal-fired power plants in our primary market area of Illinois,
Indiana, Kentucky, Ohio, Pennsylvania and West Virginia. Additional increases in demand are also
projected in connection with new coal-to-liquids plants and carbon capture and sequestration, or
CCS, technology.
3
U.S. exports will also continue to increase, supported by recovering global economies and
continued rapid growth in electric power generation and steel production.
Increasingly stringent air quality legislation will continue to impact the demand for coal. A
series of more stringent requirements have been proposed or enacted by federal or state regulatory
authorities in recent years. Considerable uncertainty is associated with these air quality
regulations, some of which have been the subject of legal challenges in courts, and the actual
timing of implementation remains uncertain.
Mining Operations
We currently have 21 active surface mines, two of which became active mines in 2011, that are
managed as eight mining complexes. We define a mining complex as a group of mines that are located
in close proximity to each other or that routinely sell coal to the same customer. Our
transportation facilities include two river terminals and two rail loading facilities. Our mining
facilities include two wash plants, six blending facilities and eleven crushing facilities.
Our surface mining operations use area, contour, auger and highwall mining methods. Our area
mining operations use truck/shovel and truck/loader equipment fleets along with large dozers. Our
contour mining operations use truck/loader equipment fleets and large dozers. For our auger mining
operations, we own and operate seven augers and move them among our mining complexes as necessary.
For our highwall mining operations, we own and operate two Superior highwall miners and also move
them among our mining complexes as necessary.
In Northern Appalachia we operate large electric and hydraulic shovels matched with a fleet of
240-ton haul trucks and 200-ton haul trucks. We also deploy a fleet of over 75 large Caterpillar
D-11 and similar class dozers. We employ preventive maintenance and rebuild programs to ensure
that our equipment is well-maintained. The rebuild programs are performed by third-party
contractors. We assess the equipment utilized in our mining operations on an ongoing basis and
replace it with new, more efficient units on an as-needed basis.
Our transportation facilities include our Bellaire river terminal located on the Ohio River in
eastern Ohio, our Cadiz rail loadout facility located on the Ohio Central Railroad near Cadiz,
Ohio, our New Lexington rail facility located on the Ohio Central Railroad in Perry County, Ohio
and our Island river terminal and transloading facility located on the Green River in western
Kentucky. Our Bellaire river terminal, located on the Ohio River in Bellaire, Ohio, has an annual
throughput capacity of over 4 million tons with a sustainable barge loading rate of 2,000 tons per
hour. The barge harbor for this terminal can simultaneously hold up to 25 loaded barges and 20
empty barges. We control our Bellaire river terminal through a long-term lease agreement with a
third party. In May 2010, we signed a new five-year lease, effective January 1, 2010, with three
subsequent five-year renewal terms at our option for a total of up to 20 years. We own our Island
river terminal and transloading facility that is located on the Green River in western Kentucky.
Our Island river terminal has an annual throughput capacity of approximately 3 million tons with a
sustainable barge loading rate of 1,300 tons per hour.
Depending on coal quality and customer requirements, in most cases our coal is crushed and
shipped directly from our mines to our customers. However, blending different types or grades of
coal may be required from time to time to meet the coal quality and specifications of our
customers. Coal of various sulfur and ash contents can be mixed or “blended” to meet the specific
combustion and environmental needs of customers. Blending is typically done at our six blending
facilities:
| |
• |
|
our Barb Tipple blending and coal crushing facility that is adjacent to one of our
customer’s power plants near Coshocton, Ohio; |
| |
• |
|
our Strasburg wash plant near Strasburg, Ohio; |
| |
• |
|
our Bellaire river terminal on the Ohio River; |
| |
• |
|
our Island river terminal and transloading facility on the Green River in western
Kentucky; |
| |
• |
|
our Stonecreek coal crushing facility located in Tuscarawas County, Ohio; and |
| |
• |
|
our Schoate wash plant located in Muhlenberg County, Kentucky. |
4
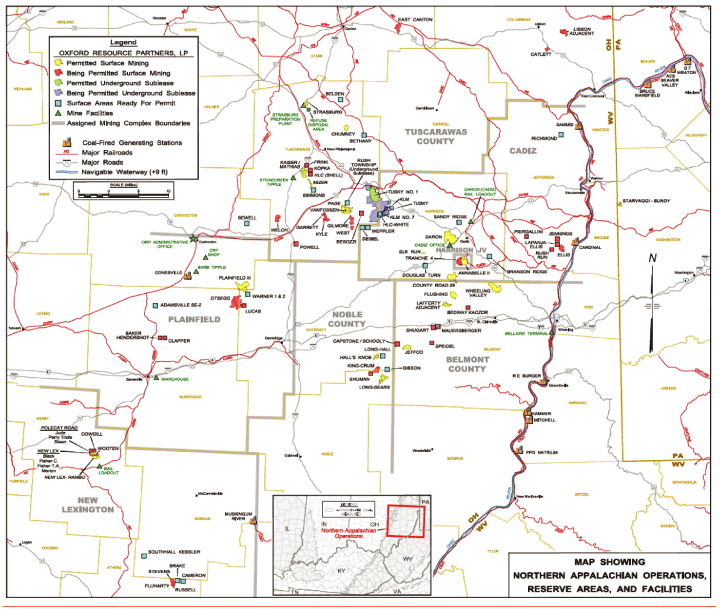
The following map shows the locations of our Northern Appalachia mining operations and coal
reserves and related transportation infrastructure.
5
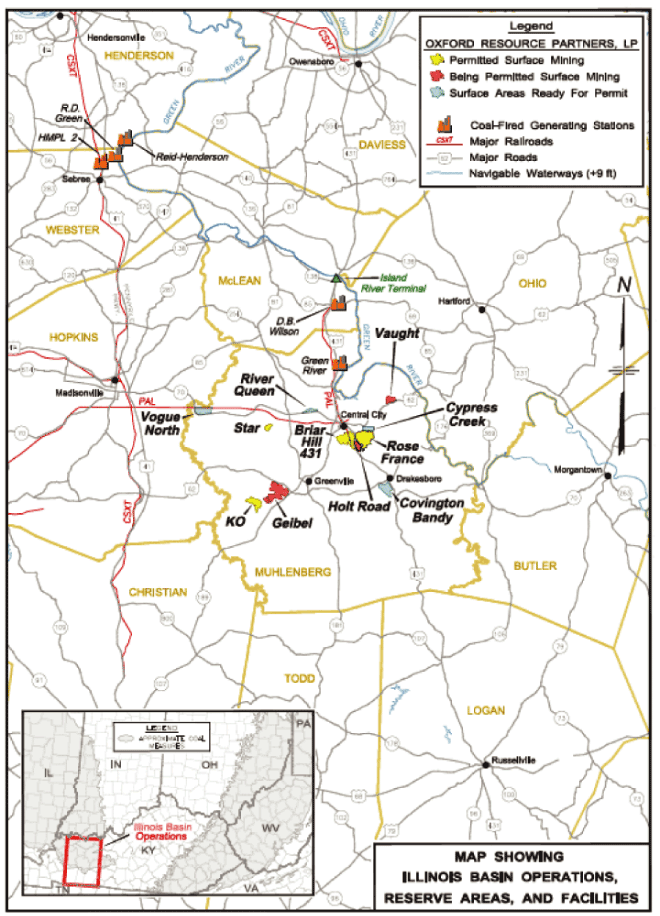
The following map shows the locations of our Illinois Basin mining operations and coal
reserves and related transportation infrastructure.
6
Northern Appalachia
We operate seven surface mining complexes in Northern Appalachia, substantially all of which
are located in eastern Ohio. For the year ended December 31, 2010, our mining complexes in
Northern Appalachia produced an aggregate of 5.8 million tons of steam coal. The following table
provides summary information regarding our mining complexes in Northern Appalachia as of December
31, 2010 and for the years indicated:
| |
|
|
|
|
|
|
|
|
|
|
|
|
|
|
|
|
|
|
|
|
|
|
| |
|
|
|
|
|
|
|
|
|
|
|
Tons Produced for the |
|
| |
|
Transportation Facilities |
|
|
|
Number |
|
|
Years Ended |
|
| |
|
Utilized |
|
Transportation |
|
of Active |
|
|
December 31, |
|
| Mining Complex |
|
River Terminal |
|
Rail Loadout |
|
Method(1) |
|
Mines |
|
|
2010 |
|
|
2009 |
|
|
2008 |
|
| |
|
|
|
|
|
|
|
|
|
|
|
(in millions) |
|
Cadiz (2) |
|
Bellaire |
|
Cadiz |
|
Barge, Rail |
|
|
3 |
|
|
|
1.4 |
|
|
|
1.1 |
|
|
|
1.4 |
|
Tuscarawas County (2) |
|
— |
|
— |
|
Truck |
|
|
5 |
|
|
|
0.9 |
|
|
|
0.9 |
|
|
|
1.0 |
|
Plainfield |
|
— |
|
— |
|
Truck |
|
|
1 |
|
|
|
0.3 |
|
|
|
0.5 |
|
|
|
0.5 |
|
Belmont County |
|
Bellaire |
|
— |
|
Barge |
|
|
4 |
|
|
|
1.1 |
|
|
|
1.3 |
|
|
|
0.9 |
|
New Lexington |
|
— |
|
New Lexington |
|
Rail |
|
|
1 |
|
|
|
0.6 |
|
|
|
0.6 |
|
|
|
0.7 |
|
Harrison(3) |
|
Bellaire |
|
Cadiz |
|
Barge, Rail, Truck |
|
|
1 |
|
|
|
1.0 |
|
|
|
0.7 |
|
|
|
0.4 |
|
Noble County |
|
Bellaire |
|
— |
|
Barge, Truck |
|
|
2 |
|
|
|
0.5 |
|
|
|
0.3 |
|
|
|
0.2 |
|
|
|
|
|
|
|
|
|
|
|
|
|
|
|
|
|
|
|
|
Total |
|
|
|
|
|
|
|
|
17 |
|
|
|
5.8 |
|
|
|
5.4 |
|
|
|
5.1 |
|
|
|
|
|
|
|
|
|
|
|
|
|
|
|
|
|
|
|
|
| |
|
|
| (1) |
|
Barge means transported by truck to our Bellaire river terminal and then
transported to the customer by barge. Rail means transported by truck to a rail facility and
then transported to the customer by rail. Truck means transported to the customer by truck. |
| |
| (2) |
|
We added two new mines since December 31, 2010 which are not reflected in the table above, one at our Cadiz Complex and another at our Tuscarawas Complex. |
| |
| (3) |
|
The Harrison mining complex is owned by Harrison Resources, our joint venture with
CONSOL Energy. We own 51.0% of Harrison Resources and CONSOL Energy owns the remaining 49.0%
of Harrison Resources indirectly through one of its subsidiaries. Because the results of
operations of Harrison Resources are included in our consolidated financial statements for
each December 31 year end as required by GAAP, coal production attributable to the Harrison
mining complex is presented on a gross basis assuming we owned 100.0% of Harrison Resources.
Please read “— Harrison Mining Complex.” |
Cadiz Mining Complex. The Cadiz mining complex is located principally in Harrison
County, Ohio and includes reserves located in Jefferson County, Ohio and Washington County,
Pennsylvania. It consists of the Daron, Elk Run and County Road 29 mines. We began our mining
operations at this mining complex in 2000. Operations at the Cadiz mining complex target the
Pittsburgh #8, Redstone #8A and Meigs Creek #9 coal seams. As of December 31, 2010, the Cadiz
mining complex included 10.9 million tons of proven and probable coal reserves. The infrastructure
at this mining complex includes a coal crusher, a truck scale and the Cadiz rail loadout. Coal
produced from the Cadiz mining complex is trucked either to our Bellaire river terminal on the Ohio
River and then transported by barge to the customer, or trucked to our Cadiz rail loadout facility
on the Ohio Central Railroad and then transported by rail to the customer. This mining complex
uses area and auger methods of surface mining. This mining complex produced 1.4 million tons of
coal for the year ended December 31, 2010.
Tuscarawas County Mining Complex. The Tuscarawas County mining complex is located in
Tuscarawas, Columbiana and Stark Counties, Ohio, and consists of the Stonecreek, Stillwater,
Chumney, Lisbon and Strasburg mines. We began our mining operations at this mining complex in
2003. Operations at this mining complex target the Brookville #4, Lower Kittanning #5, Middle
Kittanning #6, Upper Freeport #7 and Mahoning #7A coal seams. As of December 31, 2010, the
Tuscarawas County mining complex included 7.6 million tons of proven and probable coal reserves.
The infrastructure at this mining complex includes three coal crushers with truck scales and the
Strasburg wash plant. Coal produced from the Tuscarawas County mining complex is trucked directly
to our customers, our Barb Tipple blending and coal crushing facility or our Strasburg wash plant.
Coal trucked to our Barb Tipple blending and coal crushing facility or our Strasburg wash plant is
then transported by truck to the customer after processing is completed. This mining complex uses
the area, contour, auger and highwall miner methods of surface mining. This mining complex
produced 0.9 million tons of coal for the year ended December 31, 2010.
7
Plainfield Mining Complex. The Plainfield mining complex is located in Muskingum, Guernsey
and Coshocton Counties, Ohio, and consists of the Plainfield mine. We began our mining operations
at this mining complex in 1990. Operations at the Plainfield mining complex target the Middle
Kittanning #6 coal seam. As of December 31, 2010, the
Plainfield mining complex included 6.4 million tons of proven and probable coal reserves. The
infrastructure at this mining complex includes our Barb Tipple blending and coal crushing facility.
The majority of the coal produced from the Plainfield mining complex is trucked to our Barb Tipple
facility for crushing and blending or directly to the customer. Coal trucked to our Barb Tipple
facility is transported by truck to the customer after processing is completed. Some of the coal
production from this mining complex is trucked to our Strasburg wash plant and then transported by
truck to the customer. This mining complex uses contour, auger and highwall miner methods of
surface mining. This mining complex produced 0.3 million tons of coal for the year ended December
31, 2010.
Belmont County Mining Complex. The Belmont County mining complex is located in Belmont
County, Ohio, and consists of the Lafferty, Flushing, Jeffco and Wheeling Valley mines. We began
our mining operations at this mining complex in 1999. Operations at the Belmont County mining
complex target the Pittsburgh #8 and Meigs Creek #9 coal seams. As of December 31, 2010, the
Belmont County mining complex included 6.2 million tons of proven and probable coal reserves. Coal
produced from the Belmont County mining complex is primarily transported by truck to our Bellaire
river terminal on the Ohio River. Coal produced from this mining complex is crushed and blended at
the Bellaire river terminal before it is loaded onto barges for shipment to our customers on the
Ohio River. This mining complex uses area, contour, auger and highwall miner methods of surface
mining. This mining complex produced 1.1 million tons of coal for the year ended December 31,
2010.
New Lexington Mining Complex. The New Lexington mining complex is located in Perry, Athens
and Morgan Counties, Ohio, and consists of the New Lexington mine. We began our mining operations
at this mining complex in 1993. Operations at the New Lexington mining complex target the Lower
Kittanning #5, Middle Kittanning #6 and Pittsburgh #8 coal seams. As of December 31, 2010, the New
Lexington mining complex included 5.7 million tons of proven and probable coal reserves. The
infrastructure at this mining complex includes a coal crusher, a truck scale and the New Lexington
rail loadout. Coal produced from the New Lexington mining complex is delivered via-off highway
trucks to our New Lexington rail loadout facility on the Ohio Central Railroad where it is then
transported by rail to the customer. This mining complex uses the area method of surface mining.
This mining complex produced 0.6 million tons of coal for the year ended December 31, 2010.
Harrison Mining Complex. The Harrison mining complex is located in Harrison County, Ohio, and
consists of the Harrison mine. Mining operations at this mining complex began in 2007. The
Harrison mining complex is owned by Harrison Resources. We own 51.0% of Harrison Resources and
CONSOL Energy owns the remaining 49.0% of Harrison Resources indirectly through one of its
subsidiaries. We entered into this joint venture in 2007 to mine coal reserves purchased from
CONSOL Energy. We manage all of the operations of, and perform all of the contract mining and
marketing services for, Harrison Resources. Because the results of operations of Harrison
Resources are included in our consolidated financial statements for the year ended December 31,
2010 as required by GAAP, coal production and proven and probable coal reserves attributable to the
Harrison mining complex are presented on a gross basis assuming we owned 100.0% of Harrison
Resources.
Since its formation in 2007, Harrison Resources has acquired 6.9 million tons of proven and
probable coal reserves from CONSOL Energy. We believe that CONSOL Energy controls additional
reserves in Harrison County, Ohio that could be acquired by Harrison Resources in the future.
However, CONSOL Energy has no obligation to sell those reserves to Harrison Resources, and we have
no assurance that Harrison Resources will be able to acquire those reserves from CONSOL Energy on
acceptable terms.
Operations at the Harrison mining complex target the Pittsburgh #8, Redstone #8A and Meigs
Creek #9 coal seams. As of December 31, 2010, the Harrison mining complex included 5.1 million
tons of proven and probable coal reserves. The infrastructure at this mining complex includes a
coal crusher and a truck scale. Coal produced from the Harrison mining complex is trucked to our
Bellaire river terminal, our Cadiz rail loadout facility or directly to the customer. Coal trucked
to our Bellaire river terminal is transported to the customer by barge and coal trucked to our
Cadiz rail loadout facility is transported to the customer by rail. This mining complex uses the
area method of surface mining. This mining complex produced 1.0 million tons of coal for the year
ended December 31, 2010.
Noble County Mining Complex. The Noble County mining complex is located in Noble and Guernsey
Counties, Ohio, and consists of the Long-Sears and Hall’s Knob mines. We began our mining
operations at this mining complex in 2006. Operations at the Noble County mining complex target
the Pittsburgh #8 and Meigs Creek #9 coal seams. As of December 31, 2010, the Noble County mining
complex included 2.7 million tons of proven and probable coal reserves. Coal produced from the
Noble County mining complex is trucked to our Bellaire river terminal on the Ohio River or to our
Barb Tipple facility. Coal trucked to our Bellaire river terminal is then transported by
barge to the customer. Coal trucked to our Barb Tipple blending and coal crushing facility is
transported by truck to the customer after processing is completed. This mining complex uses the
area, contour and auger methods of surface mining. This mining complex produced 0.5 million tons
of coal for the year ended December 31, 2010.
8
Illinois Basin
We operate one surface mining complex in the Illinois Basin, which is located in western
Kentucky. For the year ended December 31, 2010, this mining complex produced an aggregate of 1.7
million tons of steam coal. The following table provides summary information regarding our mining
complex in the Illinois Basin as of December 31, 2010 and for the year then ended:
| |
|
|
|
|
|
|
|
|
|
|
|
|
|
|
|
|
| |
|
|
|
|
|
|
|
|
|
|
|
|
|
Tons Produced for |
|
| |
|
Transportation |
|
|
|
|
|
|
|
|
the Year Ended |
|
| |
|
Facilities Utilized |
|
|
|
|
|
|
|
|
December 31, |
|
| |
|
River |
|
Rail |
|
|
Transportation |
|
Number of |
|
|
2010 |
|
| Mining Complex |
|
Terminal |
|
Loadout |
|
|
Method(1) |
|
Active Mines |
|
|
(in millions) |
|
Muhlenberg County |
|
Island |
|
|
— |
|
|
Barge, Truck |
|
|
4 |
|
|
|
1.7 |
|
| |
|
|
| (1) |
|
Barge means transported by truck to our Island river terminal and then
transported to the customer by barge. Truck means transported to the customer by truck. |
Muhlenberg County Mining Complex. The Muhlenberg County mining complex is located in
Muhlenberg and McClean Counties, in western Kentucky, and consists of the Schoate, Highway 431, KO
and Rose France mines. We began our mining operations at this mining complex in October 2009.
Operations at the Muhlenberg County mining complex target the #5, #6, #9, #10, #11, #12 and #13
coal seams of the Illinois Basin. As of December 31, 2010, the Muhlenberg County mining complex
included 23.5 million tons of proven and probable coal reserves. The infrastructure at this mining
complex includes the Schoate wash plant, the KO coal crusher, the Rose France coal crusher and our
Island river terminal. Coal produced from this mining complex is usually crushed at the mine site
and then trucked to our Island river terminal on the Green River or directly to the customer. Coal
trucked to our Island river terminal is then transported to the customer by barge. Some of the
production from this mining complex is washed at our Schoate wash plant prior to being transported
by truck directly to the customer, or by truck to our Island river terminal and then transported by
barge to the customer. This mining complex uses the area method of surface mining. This mining
complex produced 1.7 million tons of steam coal during the year ended December 31, 2010.
Underground Coal Reserves
We began our underground mining operation at the Tusky mining complex in late 2003 after
leasing our underground coal reserves from a third party in exchange for a royalty based on tonnage
sold. In June 2005, we sold the Tusky mining complex, and we subleased our underground coal
reserves associated with that complex to the purchaser in exchange for an overriding royalty. Our
overriding royalty is equal to a percentage of the sales price received by our sublessee for the
coal produced from our underground coal reserves. In addition, our sublessee is obligated to pay
the royalty we owe to our lessor. We have almost 15 years remaining on the lease for our
underground coal reserves, and our sublessee has almost 15 years remaining on its sublease from us.
Reclamation
We are committed to minimizing our environmental impact during the mining process. However,
there is always some degree of impact. To minimize the long-term environmental impact of our
mining activities, we plan and monitor each phase of our mining projects as well as our post-mining
reclamation efforts. As of December 31, 2010, we had approximately $34.9 million in surety bonds
and $14,000 in cash bonds outstanding to secure the performance of our reclamation obligations.
Additionally, as of December 31, 2010, our surety bonds were supported by approximately $6.7
million in letters of credit. In addition to providing surety bonds, we have also made a
significant investment to complete the required reclamation activities in a timely and professional
manner to cause our surety bonds to be released. We perform reclamation activities on a continuous
basis as our mining activities progress.
9
Over 84% of our active surface mining permits are associated with coal reserves that were
mined by other coal producers prior to the implementation of the Surface Mining Control &
Reclamation Act of 1977, or SMCRA. We are
able to economically mine these reserves due to increased coal pricing and improved mining
technologies compared to the pre-SMCRA period. Reclamation standards prior to SMCRA were
considerably lower than today’s standards. These pre-SMCRA mining areas have unreclaimed highwalls
and often have water quality or vegetation deficiencies. Our mining activities not only recover
coal that was left behind by previous operators, but also significantly reduce the environmental
and safety hazards created by their pre-SMCRA mining activities. Although we have reclamation
obligations with respect to these pre-SMCRA mining areas, these obligations are typically no
greater than the reclamation obligations for newly mined reserves.
Surface or groundwater that comes in contact with materials resulting from mining activities
can become acidic and contain elevated levels of dissolved metals, a condition referred to as Acid
Mine Drainage, or AMD. We have seven mining permits that are identified on Ohio’s Inventory of
Long-Term AMD sites. Only one of these sites, associated with the Strasburg wash plant, requires
continuous AMD treatment, for which we have estimated the present value of the projected annual
treatment cost at approximately $85,000 per year. While we anticipate that AMD treatment will not
be required once reclamation is completed, it is possible that AMD treatment will be required for
some time and current AMD treatment costs could escalate due to changes in flow or water quality.
Two sites on the AMD Inventory List have been recommended by Ohio for removal from the AMD
Inventory List and the remaining sites are being monitored to assess long-term AMD treatment
issues. Moreover, we anticipate that one of these sites being recommended for removal from the AMD
Inventory List will receive final surety bond release in 2011.
Limestone
At our Daron and Strasburg mines, we remove limestone in order to mine the underlying coal.
We sell this limestone to a third party that crushes and processes the limestone before it is sold
to local governmental authorities, construction companies and individuals. The third party pays us
for this limestone based on a percentage of the revenue it receives from sales of this limestone.
Our revenues for the year ended December 31, 2010 include $1.5 million in limestone sales.
During 2010, we produced 0.4 million tons of limestone. Based on estimates from our internal
engineers, our Cadiz mining complex has 7.4 million tons of proven and probable limestone reserves
as of December 31, 2010. All of these limestone reserves were assigned reserves, which are
limestone reserves that can be recovered without a significant capital expenditure for mine
development.
Other Operations
During 2010, we generated $2.2 million of revenue from a variety of services we performed in
connection with our surface mining operations. This revenue included the following:
| |
• |
|
service fees we earned for operating a transloader for a third party that offloads
coal from railcars on the Ohio Central Railroad at one of our customer’s power plants; |
| |
• |
|
service fees we earned for providing earth-moving services for Tunnel Hill Partners,
LP, an entity owned by our sponsors that owns a landfill; and |
| |
• |
|
service fees we earned for hauling and disposing of ash at a third party landfill
for two municipal utilities. |
For more information regarding our relationships and our sponsors’ relationships with Tunnel
Hill Partners, LP, please read “Certain Relationships and Related Transactions, and Director
Independence.”
Customers
General
We market the majority of the coal we produce to base-load power plants in our six-state
market area under long-term coal sales contracts. Our primary customers are major electric
utilities, municipalities and cooperatives and industrial customers. For the year ended December
31, 2010, we derived 76.3% of our revenues from coal sales to electric utilities (including sales
through brokers), 15.7% from coal sales to municipalities and cooperatives, 5.8% from coal sales to
industrial customers and the remaining 2.2% from a mixture of sales of non-coal material such as
limestone, royalty payments on our underground coal reserves and fees for services we performed for
third parties.
10
Long-Term Coal Sales Contracts
For the past three years over 90.0% of our coal sales were made under long-term coal sales
contracts and we intend to continue to enter into long-term coal sales contracts for substantially
all of our annual coal production. We believe our long-term coal sales contracts reduce our
exposure to fluctuations in the spot price for coal and provide us with a reliable and stable
revenue base. Our long-term coal sales contracts also allow us to partially mitigate our exposure
to rising costs to the extent those contracts have full or partial cost pass through or cost
adjustment provisions.
During 2010, we executed over $275 million in long-term coal sales contracts primarily having
an effect on sales beginning in 2012. These contracts, the majority of which were related to our
Illinois Basin operations, were executed at prices significantly higher than current levels. For
2011, 2012, 2013 and 2014, we currently have long-term coal sales contracts that represent 100%,
78%, 52% and 47%, respectively, of our 2011 estimated coal sales of 9.1 million tons. Two of our
long-term coal sales contracts with the same customer contain provisions that provide for price
re-openers. These price re-openers provide for market-based adjustments to the initial contract
price every three years. These long-term coal sales contracts will terminate in 2013 if we cannot
agree upon a market-based price with the customer prior to the termination date. In addition, we
have one long-term coal sales contract with another customer that will terminate in 2014 if we
cannot agree upon a market-based price with the customer prior to the termination date. The coal
tonnage which is involved for these two customers through 2014 is 1.0 million tons annually for
2013 and 2014 and 0.4 million tons annually for 2014, respectively.
The current term of our long-term coal sales contract with American Electric Power Service
Corporation, or AEP, runs through 2012 but it can be extended for two additional three-year terms
if AEP gives us six months advance notice of its election to extend the contract. For each
extension term, we will negotiate with AEP to agree upon a market-based price based on similar term
contracts. In addition, the contract contains substantial cost pass through and cost adjustment
provisions. If AEP elects to extend this contract, we will be committed to deliver an additional
2.0 million tons in 2013 and 2014, and our 2013 and 2014 coal sales under long-term coal sales
contracts, as a percentage of 2011 estimated coal sales, would increase to 74% and 69%,
respectively. We are currently in negotiations with AEP to extend our contract with them. The
mutual goal of the parties is to amend the contract to fix the term to run through 2018, establish
future pricing that is acceptable to both parties and adjust the amounts of fixed and optional coal
tonnage covered by the contract. While the outcome of these negotiations is not certain at this
time, we believe that we will be able to achieve an extension that is on amended terms which are
beneficial to us and that furthers our long-term coal sales contract strategy.
The terms of our coal sales contracts result from competitive bidding and negotiations with
customers. As a result, the terms of these contracts vary by customer. However, most of our
long-term coal sales contracts have full or partial cost pass through provisions or cost adjustment
provisions. For 2011, 2012, 2013 and 2014, 81%, 96%, 100% and 91% of the coal, respectively, that
we have committed to deliver under our current long-term coal sales contracts are subject to full
or partial cost pass through provisions. Cost pass through provisions increase or decrease our coal
sales price for all or a specified percentage of changes in the costs for such items as fuel,
explosives and/or labor. Cost adjustment provisions adjust the initial contract price over the
term of the contract either by a specific percentage or a percentage determined by reference to
various cost-related indices.
A long-term coal sales contract may contain option provisions that give the customer the right
to elect to purchase additional tons of coal each month during the contract term at a fixed price
provided for in the contract. For example, upon 30 days advance notice, AEP may elect to purchase,
at the contract price in effect at the time for all other tons, an additional 25,000 tons of coal
each month under its long-term coal sales contract with us and, in addition, upon 90 days notice,
it may elect to purchase, at the contract price in effect at the time for all other tons, an
additional 200,000 tons of coal per half year. Our long-term coal sales contracts that provide for
these option tons typically require the customer to provide us with from one to three months
advance notice of an election to take these option tons. Because the price of these option tons is
fixed at the contract price in effect at the time for all other tons under the terms of the
contract, if our contract price is below market, we could be obligated to deliver additional coal
to those customers at a price that is below the market price for coal on the date the option is
exercised. For 2011, 2012, 2013 and 2014, we have outstanding option tons of 0.7 million, 0.9
million, 0.9 million and 1.2 million, respectively. If the customer does elect to receive these
option tons, we believe we will have the operating flexibility to meet these requirements through
increased production at our mining complexes.
11
Quality and volumes for the coal are stipulated in our coal sales contracts, and in some
instances our customers have the option to vary annual or monthly volumes. Most of our coal sales
contracts contain provisions requiring us to
deliver coal within certain ranges for specific coal characteristics such as heat content,
sulfur, ash, hardness and ash fusion temperature. Some of our coal sales contracts specify
approved locations from which coal must be sourced. Failure to meet these specifications can
result in economic penalties, suspension or cancellation of shipments or ultimately termination of
the contracts. Some of our contracts set out mechanisms for temporary reductions or delays in coal
volumes in the event of a force majeure, including events such as strikes, adverse mining
conditions, mine closures, or transportation disruptions that affect us as well as unanticipated
customer plant outages that may affect the customer’s ability to receive coal deliveries.
Customer Concentration
We derived 92.0% of our total revenues from coal sales to our ten largest customers for the
year ended December 31, 2010, with our top five customers accounting for 73.9% of our total
revenues. In addition, for the year ended December 31, 2010, we derived 30%, 12%, 11% and 11% of
our revenues from AEP, Duke Energy, East Kentucky Power Cooperative and First Energy, respectively.
Transportation
Our coal is delivered to our customers by barge, truck or rail. Over 57% of the coal we
shipped during 2010 was transported to our customers by barge, which is generally cheaper than
transporting coal by truck or rail. We operate river terminals on the Ohio River in eastern Ohio
and the Green River in western Kentucky, which have annual throughput capacities of approximately 4
million tons and 3 million tons, respectively. We also use third-party trucking to transport coal
to our customers. In addition, certain of our mines are located near rail lines. On April 1,
2006, we entered into a long-term transportation contract for rail services, which has been amended
and extended through March 31, 2011. Our customers typically pay the transportation costs from
river terminals, where barges are loaded, to their location. We typically pay for the cost of
transporting the coal by rail and/or truck to river terminals, rail loading facilities or directly
to our customer’s site(s). However, our sales contracts typically have these transportation costs
built into the price, as well as provisions for fuel cost adjustments. For the year ended December
31, 2010, 58%, 40% and 2% of our coal sales tonnage was shipped by barge, truck and rail,
respectively.
We believe that we have good relationships with rail carriers and truck companies due, in
part, to our modern coal-loading facilities and the working relationships and experience of our
general partner’s transportation and distribution employees.
Suppliers
For the year ended December 31, 2010, expenses we incurred to obtain goods and services in
support of our mining operations were $130 million, excluding capital expenditures. Principal
supplies and services used in our business include diesel fuel, oil, explosives, maintenance and
repair parts and services, and tires and lubricants. For the year ended December 31, 2010, we
managed our risk from rising fuel prices through both the use of fixed priced forward contracts
that provide for physical delivery and the use of escalation and fuel pass through clauses in
agreements with key customers. These fixed priced forward contracts have terms ranging from six
months to one year and generally do not have collateral requirements.
We use third-party suppliers for a significant portion of our equipment rebuilds and repairs
and for blasting services. We use bidding processes to promote competition between suppliers and
we seek to develop relationships with those suppliers whose focus is on lowering our costs. We
seek suppliers that identify and concentrate on implementing continuous improvement opportunities
within their area of expertise.
Competition
The coal industry is highly competitive. There are numerous large and small producers in all
coal producing regions of the United States, and we compete with many of these producers. Our main
competitors include Alliance Resource Partners, L.P., Alpha Natural Resources, Inc., Armstrong Coal
Company, Buckingham Coal Co., Inc., The Cline Group, CONSOL Energy, Massey Energy Company, Murray
Energy Corporation, Patriot Coal Corp., Peabody Energy, Inc. and Rhino Resource Partners LP.
12
The most important factors on which we compete are coal price, coal quality and
characteristics, transportation costs and reliability of supply. Demand for coal and the prices
that we will be able to obtain for our coal are closely linked to coal consumption patterns of the
domestic electric generation industry and international consumers. These coal consumption patterns
are influenced by factors beyond our control, including demand for electricity, which is
significantly dependent upon economic activity and summer and winter temperatures in the United
States, government regulation, technological developments and the location, quality, price and
availability of competing sources of fuel such as natural gas, oil and nuclear sources, and
alternative energy sources such as hydroelectric power and wind.
Our Safety and Environmental Programs and Procedures
We operate some of the industry’s safest mines. Over the last 5 years, our Mine Safety and
Health Administration, or MSHA, reportable incident rate was, on average, 1.9 compared to the
national surface mine average of 2.2, or 9.9% lower than the national surface coal mine incident
rate. Our safety record can be attributed to our extensive safety program, which includes, among
other things, (i) employing two full-time safety professionals, (ii) implementing policies and
procedures to protect employees and visitors at our mines, (iii) utilizing experienced third-party
blasting professionals to conduct our blasting activities, (iv) requiring a certified surface mine
foreman to be in charge of the activities at each mine and (v) ensuring that each employee
undergoes the required safety, hazard and task training.
In addition, we remain committed to maintaining a system that seeks to control and reduce the
environmental impacts of our mining operations. These controls include, among other things, (i)
installing sumps or double walled tanks to contain any spillage of fuel or lubricants at our mines
and facilities, (ii) evacuating used oil from equipment and placing it in storage tanks before
removing it for proper disposal, (iii) employing four full-time environmental compliance
professionals and (iv) utilizing experienced in-house personnel and contractors to conduct
extensive pre-mining sampling and studies to comply with environmental laws and regulations.
Mining and Environmental Regulation
Federal, state and local authorities regulate the coal mining industry with respect to
environmental, health and safety matters such as employee health and safety, permitting and
licensing requirements, air and water pollution, plant and wildlife protection, and the reclamation
and restoration of mining properties after mining has been completed. The current laws and
regulations have had, and will continue to have, a significant effect on production costs and may
impact our competitive advantages. Future laws, regulations or orders, as well as future
interpretation and enforcement of current laws, regulations or orders, may substantially increase
operating costs, result in delays and disrupt operations, the extent and scope of which cannot be
predicted with any degree of certainty. Future laws, regulations or orders may also cause coal to
become a less attractive source of energy, thereby reducing its market share as fuel used to
generate electricity, which may adversely affect our mining operations or the cost structure or
demand for coal.
We endeavor to conduct our mining operations at all times in compliance with all applicable
federal, state and local laws and regulations. However, due in part to the complexity and extent
of the various regulatory requirements and the nature of coal mining operations, violations can and
do occur from time to time.
Mining Permits and Approvals
Numerous federal, state or local governmental permits or approvals are required to conduct
coal mining and reclamation operations. The application process can require us to prepare and
present data to governmental authorities pertaining to the effect or impact that any proposed
production or processing of coal may have upon human health or the environment. The permitting
requirements imposed by governmental authorities are costly and have become subject to more
enhanced scrutiny, strict review and judicial challenge, which may delay commencement or
continuation of mining operations.
In order to obtain federal and state mining permits and approvals, mine operators or
applicants must submit a reclamation plan for restoring the mined land to its prior productive or
other approved use. Typically, we submit the necessary permit applications 12 to 30 months before
we plan to mine a new area. Some required mining permits have become increasingly difficult to
obtain in a timely manner or at all, and in some instances we have had to abandon coal in certain
areas of the application in order to obtain permit approvals. The application review process has
become increasingly longer and has more often been subject to legal challenge by environmentalists
and other advocacy groups, although we are not aware of any such challenges to any of our pending
permit applications.
13
Violations of federal, state and local laws or regulations or any permit or approval issued
thereunder can result in substantial fines and penalties, including revocation or suspension of
mining permits. In certain circumstances, criminal sanctions can be imposed for knowing and
willful failure to comply with these laws, regulations, permits or approvals.
Surface Mining Control and Reclamation Act
SMCRA establishes mining, reclamation and environmental protection standards for all aspects
of surface coal mining, including the surface effects of underground coal mining. Mining operators
must obtain SMCRA permits and permit renewals from the Office of Surface Mining, or the OSM, or
from the applicable state agency if the state has obtained primacy. A state may achieve primacy if
it develops a regulatory program that is no less stringent than the federal program and is approved
by OSM. Our mines are located in Ohio, Pennsylvania, West Virginia and Kentucky, each of which
have primacy to administer the SMCRA program.
SMCRA permit provisions include a complex set of requirements, which include, among other
things, coal exploration, mine plan development, topsoil or a topsoil removal alternative, storage
and replacement, selective handling of overburden materials, mine pit backfilling and grading,
disposal of excess spoil, protection of the hydrologic balance, surface runoff and drainage
control, establishment of suitable post-mining land uses and re-vegetation. The process of
preparing a mining permit application begins by collecting baseline data to adequately characterize
the pre-mining environmental conditions of the permit area. This work is typically conducted by
third-party consultants with specialized expertise and often includes surveys or assessments of the
following: cultural and historical resources, geology, soils, vegetation, aquatic organisms,
wildlife, potential for threatened, endangered or other special status species, surface and
groundwater hydrology, climatology, riverine and riparian habitat and wetlands. The geologic data
and information derived from the other surveys or assessments are used to develop the mining and
reclamation plans presented in the permit application. The mining and reclamation plans address
the provisions and performance standards of the state’s equivalent SMCRA regulatory program, and
are also used to support applications for other permits or authorizations required to conduct coal
mining activities. Also included in the permit application is information used for documenting
surface and mineral ownership, variance requests, public road use, bonding information, mining
methods, mining phases, other agreements that may relate to coal, other minerals, oil and gas
rights, water rights, permitted areas, and ownership and control information required to determine
compliance with OSM’s Applicant Violator System, or AVS, including the mining and compliance
history of officers, directors and principal owners of the entity.
Once a permit application is prepared and submitted to the regulatory agency, it goes through
a completeness and technical review. In addition, before a SMCRA permit is issued, a mine operator
must submit a bond or otherwise secure the performance of all reclamation obligations. After the
application is submitted, public notice or advertisement of the proposed permit action is required,
which is followed by a public comment period. It is not uncommon for this process to take from 12
to 30 months for a SMCRA mine permit application. This variability in time frame for permitting is
a function of the discretion vested in the various regulatory authorities’ handling of comments and
objections relating to the project received from the governmental agencies involved and the general
public. The public also has the right to comment on and otherwise engage in the administrative
process including at the public hearing and through judicial challenges to an issued permit.
Federal laws and regulations also provide that a mining permit or modification can be delayed,
refused or revoked if owners of specific percentages of ownership interests or controllers (i.e.,
officers and directors or other entities) of the applicant have, or are affiliated with another
entity that has, outstanding violations of SMCRA or state or tribal programs authorized by SMCRA.
This condition is often referred to as being “permit blocked” under the AVS. Thus, non-compliance
with SMCRA can provide a basis for denying the issuance of new mining permits or modifications of
existing mining permits. We are not permit-blocked and know of no existing circumstances which
could reasonably provide such a basis for denial.
We have subleased our underground coal reserves at the Tusky mining complex to a third party
in exchange for an overriding royalty. Under our sublease, our sublessee is contractually
obligated to comply with all federal, state and local laws and regulations, including the
reclamation and restoration of the mined areas by grading, shaping and reseeding the soil as
required under SMCRA. Regulatory authorities may attempt to assign the SMCRA liabilities of our
sublessee to us if it is not financially capable of fulfilling those obligations and it is
determined that we “own” or “control” the sublessee’s mining operation. To our knowledge, no such
claims have been asserted against us to date. If such claims are ever asserted against us, we will
contest them vigorously on the basis that, among other things, receiving an overriding royalty
under a sublease does not alone meet the legal or regulatory test of “ownership” or “control”
so as to subject us to the SMCRA liabilities of our sublessee.
14
We maintain coal refuse areas and slurry impoundments at our Tuscarawas County and Muhlenberg
County mining complexes. Such areas and impoundments are subject to extensive regulation under
SMCRA and other federal and state laws and regulations. One of those impoundments overlies a mined
out area, which can pose a heightened risk of structural failure and of damages arising out of such
failure. When a slurry impoundment experiences a structural failure, it could release large
volumes of coal slurry into the surrounding environment, which in turn can result in extensive
damage to the environment and natural resources, such as bodies of water. A failure may also
result in civil penalties or criminal fines, personal injuries and property damages, and damage to
wildlife or natural resources.
In 1983, the OSM adopted the “stream buffer zone rule,” or SBZ Rule, which prohibited mining
disturbances within 100 feet of streams if there would be a negative effect on water quality. In
December 2008, the OSM finalized a revised SBZ Rule, which purported to clarify certain aspects of
the 1983 SBZ Rule. Several organizations challenged the 2008 revision to the SBZ Rule in two
related actions filed in the U.S. District Court for the District of Columbia. In June 2009, the
Interior Department and the U.S. Army entered into a memorandum of understanding on how to protect
waterways from degradation if the revised SBZ Rule were vacated due to the litigation. In August
2009, the District Court concluded that the revised SBZ Rule could not be vacated without following
the Administrative Procedure Act and other related requirements. On November 30, 2009, the OSM
published an advanced notice of proposed rulemaking to further revise the SBZ Rule. In a March
2010 settlement with litigation parties, OSM agreed to use its best efforts to adopt a final rule
by June 29, 2012. On April 30, 2010, the OSM published a Notice of Intent to prepare an
Environmental Impact Statement for a new rule — to be called the Stream Protection Rule — that
will evaluate alternatives for revising surface mining rules to better protect streams. The
requirements of the revised SBZ Rule, when adopted, will likely be stricter than the prior SBZ Rule
to further protect streams from the impacts of surface mining, and may adversely affect our
business and operations. In addition, Congress has considered legislation to further restrict the
placement of mining material in streams. Such legislation could also have an adverse impact on our
business.
In addition to the bond requirement for an active or proposed permit, the Abandoned Mine Land
Fund, which was created by SMCRA, imposes a fee on all coal produced. The proceeds of the fee are
used to restore mines closed or abandoned prior to SMCRA’s adoption in 1977. The current fee is
$0.315 per ton of coal produced from surface mines. In 2010, we recorded $2.2 million of expense
in our cost of coal sales related to this fee.
Surety Bonds
State laws require a mine operator to secure the performance of its reclamation obligations
required under SMCRA through the use of surety bonds or other approved forms of performance
security to cover the costs the state would incur if the mine operator were unable to fulfill its
obligations. The cost of surety bonds have fluctuated in recent years, and the market terms of
these bonds have generally become more unfavorable to mine operators. These changes in the terms
of the bonds have been accompanied at times by a decrease in the number of companies willing to
issue surety bonds. Some mine operators have therefore used letters of credit to secure the
performance of reclamation obligations. We use letters of credit to secure the performance of a
portion of our reclamation obligations.
As of December 31, 2010, we had approximately $34.9 million in surety bonds outstanding to
secure the performance of our reclamation obligations, which were supported by approximately $6.7
million in letters of credit. There are no letters of credit outstanding in support of surety
bonds issued for the benefit of government agencies.
15
Mine Safety and Health
Coal mining operations are subject to stringent health and safety standards, including
pursuant to the Coal Mine Health and Safety Act of 1969 and the Federal Mine Safety and Health Act
of 1977, or the Mine Act. In addition to federal regulatory programs, all of the states in which
we operate have programs for mine safety and health regulation and enforcement. Collectively,
federal and state safety and health regulation in the coal mining industry is among the most
comprehensive systems for protection of employee health and safety affecting any segment of U.S.
industry. The Mine Act requires mandatory inspections of surface and underground coal mines and
requires the issuance of citations or orders for the violation of a mandatory health and safety
standard. A civil penalty must be assessed for each citation or order issued. Serious violations
of mandatory health and safety standards may result in the issuance of an order requiring the
immediate withdrawal of miners from the mine or shutting down a mine or any section of a mine or
any piece of mine equipment. The Mine Act also imposes criminal liability for corporate operators who knowingly
or willfully violate a mandatory health and safety standard or order and provides that civil and
criminal penalties may be assessed against individual agents, officers and directors who knowingly
or willfully violate a mandatory health and safety standard or order. In addition, criminal
liability may be imposed against any person for knowingly falsifying records required to be kept
under the Mine Act and standards.
In 2006, in response to underground mine accidents, Congress enacted the Mine Improvement and
New Emergency Response Act, or MINER Act. The MINER Act imposed additional burdens on coal
operators, including (i) emergency response plans that address post-accident communications,
tracking of miners, breathable air, lifelines, training and communication with local emergency
response personnel, (ii) requirements for mine rescue teams, (iii) prompt notification of federal
authorities of incidents that pose a reasonable risk of death and (iv) increased penalties for
violations of certain federal laws and regulations. Various states have also increased regulation
in many of these areas. In the wake of several underground mine accidents, enforcement scrutiny
has also increased, including more inspection hours at mine sites, an increased number of
inspections and increased issuance of the number and the severity of enforcement actions.
Additional federal and state legislation related to mine safety and health is under consideration.
We believe that our compliance with these and other reasonably likely mine health and safety laws
and regulations could increase our mining costs.
In 2010, in response to additional underground mine accidents, Congress expanded mine safety
disclosure requirements pursuant to Section 1503 of the Dodd-Frank Wall Street Reform and Consumer
Act. On December 15, 2010, the SEC issued proposed rules to implement Section 1503 by outlining
the way in which mining companies must disclose to investors certain information about mine safety
and health standards. In 2010, for each coal mine we operated: the total number of violations of
mandatory health or safety standards that could significantly and substantially, or S&S, contribute
to the cause and effect of a coal or other mine safety or health hazard under Section 104 of the
Mine Act for which we received a citation from MSHA was thirty (30) as shown in the following Table
OXF-MSHA-1; the total number of orders issued under Section 104(b) of the Mine Act was zero; the
total number of citations and orders for unwarrantable failure to comply with mandatory health or
safety standards under Section 104(d) of the Mine Act was zero; the total number of flagrant
violations under Section 110(b)(2) of the Mine Act was zero; the total number of imminent danger
orders issued under Section 107(a) of the Mine Act was zero; and the total dollar value of the
proposed assessments from MSHA under the Mine Act was $19,882. In addition, no coal mine of which
we were the operator received written notice from MSHA of a pattern of violations, or the potential
to have such a pattern, of mandatory health or safety standards that are of such nature as could
have significantly and substantially contributed to the cause and effect of coal or other mine
health or safety hazards under Section 104(e) of the Mine Act. The pending legal actions before
the Federal Mine Safety and Health Review Commission are shown in the following Table OXF-MSHA-2.
16
Table: OXF-MSHA-1
| |
|
|
|
|
|
|
|
|
|
|
|
|
|
|
|
|
|
|
|
|
|
|
|
|
|
|
|
|
|
|
|
|
| |
|
|
|
|
|
|
|
|
|
|
|
|
|
|
|
|
|
|
|
|
|
(F) |
|
|
|
|
|
|
(H) |
|
| |
|
(A) |
|
|
(B) |
|
|
(C) |
|
|
(D) |
|
|
(E) |
|
|
Proposed |
|
|
|
|
|
|
Pending |
|
| |
|
Section |
|
|
Section |
|
|
Section |
|
|
Section |
|
|
Section |
|
|
Assess- |
|
|
(G) |
|
|
Legal |
|
| Mining Complex |
|
104 |
|
|
104(b) |
|
|
104(d) |
|
|
110(b)(2) |
|
|
107(a) |
|
|
ments |
|
|
Fatalities |
|
|
Action |
|
Cadiz |
|
|
3 |
|
|
|
— |
|
|
|
— |
|
|
|
— |
|
|
|
— |
|
|
$ |
1,720 |
|
|
|
— |
|
|
|
2 |
|
Tuscarawas County |
|
|
1 |
|
|
|
— |
|
|
|
— |
|
|
|
— |
|
|
|
— |
|
|
$ |
2,682 |
|
|
|
— |
|
|
|
— |
|
Belmont County |
|
|
2 |
|
|
|
— |
|
|
|
— |
|
|
|
— |
|
|
|
— |
|
|
$ |
1,287 |
|
|
|
— |
|
|
|
— |
|
Plainfield |
|
|
1 |
|
|
|
— |
|
|
|
— |
|
|
|
— |
|
|
|
— |
|
|
$ |
1,542 |
|
|
|
— |
|
|
|
1 |
|
New Lexington |
|
|
1 |
|
|
|
— |
|
|
|
— |
|
|
|
— |
|
|
|
— |
|
|
$ |
1,268 |
|
|
|
— |
|
|
|
1 |
|
Harrison |
|
|
1 |
|
|
|
— |
|
|
|
— |
|
|
|
— |
|
|
|
— |
|
|
$ |
625 |
|
|
|
— |
|
|
|
— |
|
Noble County |
|
|
1 |
|
|
|
— |
|
|
|
— |
|
|
|
— |
|
|
|
— |
|
|
$ |
734 |
|
|
|
— |
|
|
|
— |
|
Muhlenberg County |
|
|
20 |
|
|
|
— |
|
|
|
— |
|
|
|
— |
|
|
|
— |
|
|
$ |
10,024 |
|
|
|
— |
|
|
|
— |
|
Totals |
|
|
30 |
|
|
|
— |
|
|
|
— |
|
|
|
— |
|
|
|
— |
|
|
$ |
19,882 |
|
|
|
— |
|
|
|
4 |
|
| |
|
|
| (A) |
|
The total number of violations of mandatory health or safety standards that could
significantly and substantially contribute to the cause and effect of a coal or other mine
safety or health hazard under section 104 of the Mine Act (30 U.S.C. 814) for which the
operator received a citation from MSHA. |
| |
| (B) |
|
The total number of orders issued under section 104(b) of the Mine Act (30 U.S.C. 814(b)). |
| |
| (C) |
|
The total number of citations and orders for unwarrantable failure of the mine operator to
comply with mandatory health or safety standards under section 104(d) of the Mine Act (30
U.S.C. 814(d)). |
| |
| (D) |
|
The total number of flagrant violations under section 110(b)(2) of the Mine Act (30 U.S.C.
820(b)(2)). |
| |
| (E) |
|
The total number of imminent danger orders issued under section 107(a) of the Mine Act (30
U.S.C. 817(a)). |
| |
| (F) |
|
The total dollar value of proposed assessments from MSHA under the Mine Act (30 U.S.C. 801 et
seq.). Includes proposed assessments for non-S&S citations and proposed assessments received
in 2010 for citations issued in 2009. |
| |
| (G) |
|
The total number of mining-related fatalities. |
| |
| (H) |
|
Any pending legal action before the Federal Mine Safety and Health Review Commission
involving such coal or other mine. See Table OXF-MSHA-2, below for information regarding
pending legal actions. |
17
Table: OXF-MSHA-2
| |
|
|
|
|
|
|
|
|
|
|
|
|
| Docket Number |
|
|
|
|
|
|
|
Proposed |
|
|
|
| MSHA Mine Name |
|
|
|
|
|
|
|
Civil |
|
|
|
| Oxford Mine Complex/Name |
|
Citation |
|
|
Date |
|
Penalty |
|
|
|
| MSHA ID Number |
|
No. |
|
|
Issued |
|
Assessment |
|
|
Status |
LAKE 2008-383
Oxford Mining #3
New Lexington/New Lexington
33-04336
|
|
|
7138351 |
|
|
1/9/2008
|
|
$ |
1,400 |
|
|
Petition for civil
penalty assessment
for a miner not
wearing a hard hat
outside of the
operating cab of
his equipment. The
Petition was served
on June 6, 2008 and
timely answered on
July 3, 2008. The
Commission recently
issued a Notice of
Hearing for April
26, 2011. Oxford’s
prehearing report
is due April 12. |
|
|
|
|
|
|
|
|
|
|
|
|
|
LAKE 2009-381-M
Oxford Mining #2
Plainfield/Adamsville*
33-04213
*Adamsville mine — reclaimed
|
|
7141549
7141550
|
|
11/3/2008
11/10/2008
|
|
$
$ |
460
460 |
|
|
Petition for civil
penalty assessment
for two citations
regarding brake
lights on mobile
equipment. The
proposed civil
penalty assessment
became a final
order on January
16, 2009, but the
notice of contest
was mailed to an
incorrect address.
A Motion to Reopen
the Penalty
Assessment was
filed on March 19,
2009 and unopposed
by the Secretary of
Labor. The
Commission has
approved the
Motion, and the
matter has been
assigned to
Administrative Law
Judge (ALJ) Barbour
pending issuance of
a Petition for
Penalty Assessment. |
|
|
|
|
|
|
|
|
|
|
|
|
|
LAKE 2010 -576
Snyder Mine
Cadiz/County Road 29
33-04414
|
|
|
8017301 |
|
|
8/31/2009
|
|
$ |
946 |
|
|
Petition for civil
penalty assessment
for a rock truck
operator failing to
maintain control of
the vehicle and
crashing into the
highwall; the
driver sustained a
broken leg. The
Petition was served
on May 5, 2010 and
timely answered on
June 7, 2010. The
case has been
assigned to ALJ
Harner. The
parties conducted a
status conference
with the ALJ and
have engaged in
settlement
discussions to no
avail. The parties
have requested that
the ALJ set the
matter for a
hearing. |
|
|
|
|
|
|
|
|
|
|
|
|
|
LAKE 2010-577
Snyder Mine
Cadiz/County Road 29
33-04414
|
|
|
8024308 |
|
|
2/3/2010
|
|
$ |
207 |
|
|
Petition for civil
penalty assessment
for a dump truck
that did not give
an audible sound
when reverse was
engaged when
tested. The
Petition was served
on May 6, 2010 and
timely answered on
June 7, 2010. The
case has been
assigned to ALJ
Harner. The
parties conducted a
status conference
with the ALJ and
have engaged in
settlement
discussions to no
avail. The parties
have requested that
the ALJ set the
matter for a
hearing. |
Black Lung
Under the Black Lung Benefits Revenue Act of 1977 and the Black Lung Benefits Reform Act of
1977, as amended in 1981, each coal mine operator must pay federal black lung benefits to claimants
who are current and former employees and also make payments to a trust fund for the payment of
benefits and medical expenses to claimants who last worked in the coal industry prior to January 1,
1970. The trust fund is funded by an excise tax on production of up to $1.10 per ton for
deep-mined coal and up to $0.55 per ton for surface-mined coal, neither amount to exceed 4.4% of
the gross sales price. The excise tax does not apply to coal shipped outside the United States.
During 2010, we recorded $3.9 million of expense in our cost of coal sales related to this excise
tax. The Patient Protection and Affordable Health Choices Act, or PPAHCA, which was enacted on
March 23, 2010, made two potentially significant changes to the federal Black Lung program. First,
the PPAHCA provides an automatic survivor benefit paid upon the death of a miner with an awarded
black lung claim, without requiring proof that the death was due to pneumoconiosis. Second, the
PPAHCA establishes a rebuttable presumption with regard to pneumoconiosis among miners with 15 or
more years of coal mine employment that are totally disabled by a respiratory condition. These
changes could have a material impact on our costs expended in association with the federal black
lung program. In addition, we are liable under various state laws for black lung claims.
Clean Air Act
The Clean Air Act and similar state laws affect coal mining operations both directly and
indirectly. Direct impacts on coal mining and processing operations include Clean Air Act
permitting requirements and control requirements for particulate matter, which includes fugitive
dust from roadways, parking lots, and equipment such as conveyors and storage piles.
18
On June 16, 2010, several environmental groups petitioned the U.S. Environmental Protection
Agency, or the EPA, to list coal mines as a source of air pollution and establish emissions
standards under the Clean Air Act for several pollutants, including particulate matter, nitrogen
oxide gases, volatile organic compounds and methane. Petitioners further
requested that the EPA regulate other emissions from mining operations, including dust and
clouds of nitrogen oxides associated with blasting operations. If the petitioners are successful,
emissions of these or other materials associated with our mining operations could become subject to
further regulation pursuant to existing laws such as the Clean Air Act. In that event, we may be
required to install additional emissions control equipment or take other steps to lower emissions
associated with our operations, thereby adversely affecting our results of operations.
The Clean Air Act indirectly affects coal mining operations by extensively regulating air
emissions from coal-fired power plants, which are the largest end users of our coal. Coal contains
certain impurities, including sulfur, mercury, chlorine and other constituents, many of which are
emitted into the air when coal is burned, including emissions of particulate matter, sulfur dioxide
(also referred to as SO2), nitrogen oxides (also referred to as NOx), carbon monoxide, ozone,
mercury and other compounds emitted by coal-fired power plants. As a result of the regulation of
these emissions, coal-fired power plants, which are the largest end users of our coal, have
expended considerable resources, and may be required to expend additional resources, to install
emission control equipment or take other steps to lower emissions or otherwise achieve compliance.
More stringent regulation by the EPA, states or Congress, pursuant to an international treaty or
due to a judicial decision, could make it more costly to operate coal-fired power plants. As a
result, coal could become a less attractive and less competitive fuel and future demand could
decrease. Although we are unable to predict the magnitude of any impact with any reasonable degree
of certainty, reduced demand could reduce the price of coal that we mine and sell, thereby reducing
our revenues, and thus could have a material adverse effect on our business and the results of our
operations.
In addition to the greenhouse gas regulations discussed below, air emission control programs
that affect our operations, directly or indirectly, include, but are not limited to, the following:
| |
• |
|
Acid Rain. The EPA’s Acid Rain Program, in Title IV of the Clean Air Act, regulates
SO2 emissions by coal-fired power plants with a generating capacity greater than 25
megawatts. Affected facilities purchase or are otherwise allocated allowances for SO2
emissions. Affected facilities have reduced SO2 emissions by switching to lower sulfur
fuels, installing pollution control devices, reducing electricity generating levels or
purchasing or trading allowances. |
| |
• |
|
SO2. Pursuant to the Clean Air Act, the EPA sets standards, known as National
Ambient Air Quality Standards, or NAAQS, for certain pollutants. On June 3, 2010, the
EPA issued a stricter NAAQS for SO2 emissions that established a 1-hour standard at a
level of 75 parts per billion or ppb to protect against short-term exposure and
minimize health-based risks. The EPA indicated that it would abolish the previous
annual standard for SO2. Under the new rule, monitors must be set up by 2013 in the
areas of the highest concentrations of SO2. Non-attainment decisions will be made by
June 2012, state implementation plans will be due by the winter of 2014 and attainment
of the standards must be achieved by the summer of 2018. |
| |
• |
|
Particulate Matter. Areas that are not in compliance, known as non-attainment
areas, with these standards must take steps to reduce emissions levels. Although our
operations are not currently located in non-attainment areas, if any of the areas in
which we operate become designated as non-attainment areas for particulate matter, our
mining operations may be directly affected by any related NAAQS. |
| |
• |
|
Ozone. The EPA’s ozone NAAQS imposes stringent limits on NOx emissions, which are
classified as an ozone precursor. In July 2009, the U.S. Court of Appeals for the
District of Columbia vacated part of a rule implementing the ozone NAAQS and remanded
certain other aspects of the rule to the EPA for further consideration. The EPA has
proposed a stricter NAAQS for ozone, which it expects to finalize in July 2011. Related
non-attainment decisions will be made by July 2013, state implementation plans will be
due by the end of 2016 and attainment of the standards must be achieved by 2018 or
later, depending on the severity of non-attainment. |
| |
• |
|
NOx SIP Call. The NOx SIP Call program was established by the EPA to reduce the
transport of nitrogen oxide and ozone on prevailing winds from the Midwest and South to
states in the Northeast that alleged they could not meet federal air quality standards
because of NOx emissions. As a result of this program, many power plants have been or
will be required to install additional emission control measures, such as selective
catalytic reduction, or SCR, devices. |
19
| |
• |
|
Clean Air Interstate Rule or CAIR. The EPA’s CAIR calls for power plants in 28
eastern states and the District of Columbia to reduce emission levels of SO2 and NOx
pursuant to a cap and trade program similar to the system now in effect for acid rain.
In July 2008, the U.S. Court of Appeals for the District of Columbia
Circuit vacated the EPA’s CAIR in its entirety and directed the EPA to commence new
rule-making. After a petition for rehearing, the court ruled in December 2008 that to
completely vacate CAIR would sacrifice public health and environmental benefits and that
CAIR should remain in effect while the EPA modifies the rule. The EPA proposed a
replacement rule known as the Clean Air Transport Rule in July 2010 that would set state
level caps on SO2 and NOx emissions for power plants for 31 eastern states and the
District of Columbia. The final rule is expected in July 2011. Under either CAIR or the
Clean Air Transport Rule, some coal-fired power plants may be required to install
additional pollution control equipment and burn less high sulfur coal. |
| |
• |
|
Mercury. In February 2008, the U.S. Court of Appeals for the District of Columbia
Circuit vacated the EPA’s Clean Air Mercury Rule, or CAMR, which had established a cap
and trade program to reduce mercury emissions from power plants. The EPA is under a
court deadline to issue a final rule by November 2011, and will likely impose stricter
limitations on mercury emissions from power plants than the vacated CAMR. In the
meantime, case-by-case MACT determinations for mercury may be required for new and
reconstructed coal-fired power plants. Mercury emissions from coal-fired power plants
may also be subject to state regulation, and related federal legislation has been
proposed. In addition, in February 2011, the EPA established new MACT for several
classes of boilers and process heaters, including large coal-fired boilers and process
heaters, which would require significant reductions in the emission of particulate
matter, carbon monoxide, hydrogen chloride, dioxins and mercury. The Obama
Administration has also indicated a desire to negotiate an international treaty to
reduce mercury pollution. |
| |
• |
|
Regional Haze. The EPA’s regional haze program seeks to protect and improve
visibility at and around national parks, national wilderness areas and international
parks. The program may restrict emissions on new coal-fired power plants whose
operation may impair visibility at and near such federally protected areas. The
program may also require certain existing coal-fired power plants to install additional
control measures designed to limit certain haze-causing emissions. On January 19,
2011, several environmental groups notified the EPA that they intend to sue under the
citizen suit provision of the Clean Air Act for failure to enforce the regional haze
rule. |
| |
• |
|
New Source Review, or NSR. A number of pending regulatory changes and court actions
by the EPA and various environmental groups may affect the scope of the EPA’s NSR
program, which, among other emission sources, requires new coal-fired power plants to
install emission control equipment and may require existing coal-fired power plants to
install additional emission control equipment. The changes to the NSR program may
impact demand for coal nationally, but we are unable to predict the magnitude of any
such impact with any reasonable degree of certainty. |
Climate Change
Combustion of fossil fuels, such as the coal we produce, results in the emission of carbon
dioxide and other greenhouse gases which have been subject to public and regulatory concern with
respect to climate change or global warming. Current and future regulation of greenhouse gases may
occur on various international, federal, state and local levels, including pursuant to future
legislative action, EPA enforcement under the existing Clean Air Act, regional and state laws and
initiatives and court orders. The Kyoto Protocol, which expires in 2012, established a set of
emission targets for greenhouse gases for ratifying countries. Although it has not ratified the
Kyoto Protocol, the United States is participating in international renewal discussions. Any
replacement treaty or other international arrangement related to greenhouse gas emissions will have
a potentially significant impact on the demand for coal if adopted by the United States.
Congress has actively considered proposals in the past several years to reduce greenhouse gas
emissions, mandate electricity suppliers to use renewable energy sources to generate a certain
percentage of power, promote the use of clean energy and require energy efficiency measures.
Although no bills to reduce such emissions have yet to pass both houses of Congress, bills to
reduce such emissions remain pending and others are likely to be introduced. Enactment of
comprehensive climate change legislation could impact the demand for coal. Any reduction in the
amount of coal consumed by North American electric power generators could reduce the price of coal
that we mine and sell, thereby reducing our revenues and have a material adverse effect on our
business and the results of our operations.
20
The EPA has also begun regulating greenhouse gas emissions under the Clean Air Act after
authorizion by its December 2009 endangerment finding made in response to the 2007 U.S. Supreme
Court Massachusetts v. EPA ruling In May 2010, the EPA issued a “tailoring rule” that determines
which stationary sources of greenhouse emissions need to
obtain a construction or operating permit, and install best available control technology for
greenhouse gas emissions, under the Clean Air Act when such facilities are built or significantly
modified. Prior to this rule, permits would have been required for stationary sources with
emissions that exceed either 100 or 250 tons per year (depending on the type of source). The
tailoring rule increases this threshold for greenhouse gas emissions to 75,000 tons per year on
January 1, 2011 with the intent to tailor the requirement to initially apply only to large
stationary sources such as coal-fired power plants and large industrial plants. The rule will
further modify the threshold after July 1, 2011. In addition, the tailoring rule requires the EPA
to undertake another rulemaking by no later than July 1, 2012 to, among other things, consider
expanding permitting requirements to sources with greenhouse gas emissions greater than 50,000 tons
per year. Moreover, in October 2009, the EPA issued a final rule requiring certain emitters of
greenhouse gases, including coal-fired power plants, to monitor and report their annual greenhouse
gas emissions to the EPA beginning in 2011 for emissions occurring in 2010. Future federal
legislative action or judicial decisions to pending or future court challenges may change any of
the foregoing final or proposed EPA findings and regulations. If carbon dioxide emissions from
electric utilities were to become subject to additional emission limits or permitting requirements,
our customers demand for coal could decrease.
In some areas, carbon dioxide emissions are subject to state and regional regulation. For
example, the Regional Greenhouse Gas Initiative, or RGGI, calls for a significant reduction of
carbon dioxide emissions from power plants in the participating northeastern states by 2018. The
RGGI program calls for signatory states to stabilize carbon dioxide emissions to current levels
from 2009 to 2015, followed by a 2.5% reduction each year from 2015 through 2018. Since its
inception, several additional northeastern states and Canadian provinces have joined as
participants or observers. RGGI has been holding quarterly carbon dioxide allowance auctions for
its initial three-year compliance period from January 1, 2009 to December 31, 2011 to allow
utilities to buy allowances to cover their carbon dioxide emissions. Other current and proposed
greenhouse gas regulation include the Midwestern Greenhouse Gas Reduction Accord, the Western
Regional Climate Action Initiative and recently enacted legislation and permit requirements in
California and other states.
Also, the U.S. Supreme Court recently granted certiorari to review a decision by the U.S.
Court of Appeals for the Second Circuit. The Second Circuit had held that state governments and
advocacy groups could seek injunctive relief using certain common law nuisance and trespass
theories on the basis that emissions of carbon dioxide from specific sources of emissions may have
created a public nuisance. The U.S. Court of Appeals for the Fifth Circuit recently dismissed on
procedural grounds a class action in which the plaintiffs had claimed that various oil and energy
companies had contributed to climate change.
In addition to direct regulation of greenhouse gases, over 30 states have adopted mandatory
“renewable portfolio standards,” which require electric utilities to obtain a certain percentage of
their electric generation portfolio from renewable resources. These standards generally range from
10% to 30% over time periods that extend from the present until between 2020 and 2030. Several
other states have renewable portfolio standard goals that are not yet legal requirements. Other
states may adopt similar requirements, and federal legislation is a possibility in this area. To
the extent these requirements affect our current and prospective customers, they may reduce the
demand for coal-fired power, and may affect long-term demand for our coal.
These and other current or future climate change rules, court orders or other legally
enforceable mechanisms may require additional controls on coal-fired power plants and industrial
boilers and may cause some users of coal to switch from coal to lower carbon dioxide emitting fuels
or shut down coal-fired power plants. Reasonably likely future regulation may include a carbon
dioxide cap and trade program, a carbon tax or other regulatory regimes. The cost of future
compliance may also depend on the likelihood that cost effective carbon capture and storage
technology can be developed by the necessary date. The permitting of new coal-fired power plants
has also recently been contested by regulators and environmental organizations based on concerns
relating to greenhouse gas emissions. Increased efforts to control greenhouse gas emissions could
result in reduced demand for coal. If mandatory restrictions on carbon dioxide emissions are
imposed, the ability to capture and store large volumes of carbon dioxide emissions from coal-fired
power plants may be a key mitigation technology to achieve emissions reductions while meeting
projected energy demands.
Clean Water Act
The Clean Water Act, or CWA, and corresponding state and local laws and regulations affect
coal mining operations by restricting the discharge of pollutants, including the discharge of
dredged or fill materials, into waters of the United States. The CWA and associated state and
federal regulations are complex and frequently subject to amendments, legal challenges and changes
in implementation. Recent state and federal court decisions, regulatory actions and proposed
legislation have created uncertainty over CWA jurisdiction and permitting requirements that
could increase the cost and time we expend on CWA compliance.
21
CWA and similar state requirements that may directly or indirectly affect our operations
include, but are not limited to, the following:
| |
• |
|
Wastewater Discharge. Section 402 of the CWA regulates the discharge of
“pollutants” into navigable waters of the United States. The National Pollutant
Discharge Elimination System, or NPDES, requires a permit for any such discharge and
entails regular monitoring, reporting and compliance with performance standards that
govern discharges. Failures to comply with the CWA or the NPDES permits can lead to
the imposition of penalties, compliance costs and delays in coal production. |
| |
|
|
The CWA and corresponding state laws also protect waters that states have designated for
special protections including those designated as: impaired (i.e., as not meeting
present water quality standards) through total maximum daily load regulations; and “high
quality/exceptional use” streams through anti-degradation regulations which restrict or
prohibit discharges that result in degradation. Other requirements necessitate the
treatment of discharges from coal mining properties for non-traditional pollutants, such
as chlorides, selenium and dissolved solids; and “protecting” streams, wetlands, other
regulated water sources and associated riparian lands from surface mining and the surface
impacts of underground mining. Individually and collectively, these requirements may
cause us to incur significant additional costs that could adversely affect our operating
results, financial condition and cash flows. |
| |
• |
|
Dredge and Fill Permits. Many mining activities, including the development of
settling ponds and other impoundments, require a permit issued under authority of
Section 404 of the CWA (Section 404 permit(s)) from the Army Corps of Engineers, or
Corps, prior to conducting such mining activities where they involve discharges of
“fill” into navigable waters of the United States. The Corps is empowered to issue a
“nationwide” permit, or NWP, for categories of similar filling activities that are
determined to have minimal environmental adverse effects in order to save the cost and
time of issuing individual permits under Section 404 of the CWA. Using this authority,
the Corps issued NWP 21, which authorizes the disposal of dredge-and-fill material from
mining activities into the waters of the United States. Individual Section 404 permits
are required for activities determined to have more significant impacts to waters of
the United States. |
| |
|
|
Since 2003, environmental groups have pursued litigation primarily in West Virginia and
Kentucky challenging the validity of NWP 21 and various individual Section 404 permits
authorizing valley fills associated with surface coal mining operations (primarily
mountain-top removal operations). This litigation has resulted in delays in obtaining
these permits and has increased permitting costs. The most recent major decision in this
line of litigation is the opinion of the U.S. Court of Appeals for the Fourth Circuit in
Ohio Valley Environmental Council v. Aracoma Coal Company, 556 F.3d 177 (2009) (Aracoma),
issued on February 13, 2009. In Aracoma, the Fourth Circuit rejected the substantive
challenges to the Section 404 permits involved in the case primarily by deferring to the
expertise of the Corps in review of the permit applications. On August 19, 2010, the
U.S. Supreme Court dismissed the then pending certiorari. |
| |
|
|
After the Fourth Circuit’s Aracoma decision, however, the EPA undertook several
initiatives to address the issuance of Section 404 permits for coal mining activities in
the Eastern U.S. First, the EPA began to comment on Section 404 permit applications
pending before the Corps raising many of the same issues that had been decided in favor
of the coal industry in Aracoma. Many of the EPA’s comment letters were submitted long
after the end of the EPA’s comment period based on what the EPA contended was “new”
information on the impacts of valley fills on stream water quality immediately downstream
of valley fills. These letters have created regulatory uncertainty regarding the
issuance of Section 404 permits for coal mining operations and have substantially
expanded the time required for issuance of these permits. |
| |
|
|
In June 2009, the Corps, the EPA and the Department of the Interior announced an
interagency action plan for an “enhanced review” of any project that requires both a
SMCRA permit and a CWA permit designed to reduce the harmful environmental consequences
of mountain-top mining in the Appalachian region. As part of this interagency memorandum
of understanding, the Corps proposed to suspend and modify NWP 21 in the Appalachian
region of Kentucky, Ohio, Pennsylvania, Tennessee, Virginia and West Virginia to prohibit
its use to authorize discharges of fill material into waters of the United States for
mountain-top mining. |
| |
|
|
On June 17, 2010, the Corps announced the suspension of the NWP 21 permitting process in
these six states until the Corps takes further action on NWP 21, or until NWP 21 expires
on March 18, 2012. While the suspension is in effect, proposed surface coal mining
projects in these states that involve discharges of dredged or fill material into waters
of the United States will have to obtain individual permits from the Corps pursuant to
the CWA. Projects currently permitted under NWP 21 are not affected by the suspension,
and NWP 21 remains available for proposed surface coal mining projects in other states. |
22
| |
|
|
The EPA is also taking a more active role in its review of NPDES permit applications for
coal mining operations in Appalachia, and announced in September 2009 that it was
delaying the issuance of 74 Section 404 permits in central Appalachia. The EPA’s review
has a strong focus in West Virginia, where the EPA plans to review all applications for
NPDES permits even though the State of West Virginia is authorized to issue NPDES
permits. These initiatives have extended the time required to obtain permits for coal
mining and we anticipate further delays in obtaining permits and that the costs
associated with obtaining and complying with those permits will increase substantially.
Additionally, while it is unknown precisely what other future changes will be implemented
as a result of the interagency action plan, any future changes could further restrict our
ability to obtain other new permits or to maintain existing permits. Moreover, on April
1, 2010, the EPA issued interim final guidance substantially revising the environmental
review of CWA permits by state and federal agencies. |
| |
|
|
The EPA’s enhanced scrutiny initiatives have been challenged in federal courts by the
National Mining Association, or NMA, and the State of West Virginia, and the Kentucky
Coal Association/Commonwealth of Kentucky. On January 14, 2011, the U.S. District Court
for the District of Columbia denied the EPA’s motion to dismiss the NMA’s complaint and
the NMA’s motion for a preliminary injunction of the EPA’s enhanced scrutiny initiatives.
The court ruling held that the EPA’s actions “are legislative rules that were adopted in
violation of notice and comment requirements.” Although the NMA’s motion for a
preliminary injunction was denied, the opinion contains holdings suggesting that the
court may rule in favor of the NMA on the merits of the case. The West Virginia and
Kentucky cases have been joined with the NMA’s case in the D.C. District Court of
Appeals. Unless the challenge to the EPA’s enhanced scrutiny of permit applications is
successful, we anticipate that we may not be able to obtain some Section 404 permits, it
will continue to take longer to obtain most Section 404 permits, and the costs of
obtaining Section 404 permits and compliance with Section 404 permit conditions will
increase significantly. |
Resource Conservation and Recovery Act
The Resource Conservation and Recovery Act, or RCRA, regulates the management of hazardous
wastes from the point of generation through treatment of disposal. RCRA does not apply to most of
the wastes generated at coal mines, overburden and coal cleaning wastes, because they are not
considered hazardous wastes as EPA applies that term. Only a small portion of the total amount of
wastes generated at a mine are regulated as hazardous wastes.
Although RCRA has the potential to apply to wastes from the combustion of coal, the EPA
determined that coal combustion wastes do not warrant regulation as hazardous wastes under RCRA in
May 2000. Most state solid waste laws also regulate coal combustion wastes as non-hazardous
wastes. The EPA is currently considering what type of waste regulations under RCRA are warranted
for certain wastes generated from coal combustion, such as coal ash, when used as mine-fill. In
June 2009, the EPA released proposals to regulate coal ash as either a non-hazardous waste under
Subtitle D of RCRA or as a special waste under Subtitle C of RCRA. If re-classified as hazardous
waste, regulations may impose restrictions on ash disposal, provide specifications for storage
facilities, require groundwater testing and impose restrictions on storage locations, which could
increase our customers’ operating costs and potentially reduce their ability to purchase coal. In
addition, contamination caused by the past disposal of coal combustion byproducts, including coal
ash, can lead to material liability to our customers under RCRA or other federal or state laws and
potentially reduce the demand for coal. The EPA issued a proposed rule for the safe disposal and
management of coal ash from coal-fired power plants in May 2010 and received more than 400,000
comments.
Comprehensive Environmental Response, Compensation and Liability Act
The Comprehensive Environmental Response, Compensation and Liability Act, CERCLA or Superfund,
and similar state laws affect coal mining operations by, among other things, imposing cleanup
requirements for threatened or actual releases of hazardous substances. Under CERCLA and similar
state laws, joint and several liability may be imposed
on waste generators, site owners, lessees and others regardless of fault or the legality of
the original disposal activity. Although the EPA excludes most wastes generated by coal mining and
processing operations from the hazardous waste laws, such wastes can, in certain circumstances,
constitute hazardous substances for the purposes of CERCLA. In addition, the disposal, release or
spilling of some products used by coal companies in operations, such as chemicals, could trigger
the liability provisions of CERCLA or similar state laws. Thus, we may be subject to liability
under CERCLA and similar state laws for coal mines that we currently own, lease or operate or that
we or our predecessors have previously owned, leased or operated, and sites to which we or our
predecessors sent waste materials. This includes the Tusky mining complex where we have subleased
our underground coal reserves to a third party in exchange for an overriding royalty. We may be
liable under CERCLA or similar state laws for the cleanup of hazardous substance contamination and
natural resource damages at sites where we own surface rights.
23
Endangered Species Act
The Endangered Species Act, or ESA, and counterpart state legislation protect species
threatened with possible extinction. The U.S. Fish and Wildlife Service, or USFWS, works closely
with the OSM and state regulatory agencies to ensure that species subject to the ESA are protected
from mining-related impacts. A number of species indigenous to the areas in which we operate,
specifically the Indiana bat, are protected under the ESA, and compliance with ESA requirements
could have the effect of prohibiting or delaying us from obtaining mining permits. These
requirements may also include restrictions on timber harvesting, road building and other mining or
agricultural activities in areas containing the affected species or their habitats. Should more
stringent protective measures be applied, this could result in increased operating costs,
heightened difficulty in obtaining future mining permits, or the need to implement additional
mitigation measures.
Use of Explosives
We use third party contractors for blasting services and our surface mining operations are
subject to numerous regulations relating to blasting activities. Pursuant to these regulations, we
incur costs to design and implement blast schedules and to conduct pre-blast surveys and blast
monitoring. In addition, the storage of explosives is subject to regulatory requirements. We
presently do not engage in blasting activities. All of our blasting activities are conducted by
independent contractors that use certified blasters.
Other Environmental Laws and Matters
We are required to comply with numerous other federal, state and local environmental laws and
regulations in addition to those previously discussed, including the Safe Drinking Water Act, the
Toxic Substance Control Act and the Emergency Planning and Community Right-to-Know Act.
Employees
To carry out our operations, our general partner employed approximately 836 full-time
employees as of December 31, 2010. None of these employees are subject to collective bargaining
agreements or are members of any unions. We believe that we have good relations with these
employees, and we continually seek their input with respect to our operations. Since our
inception, we have had no history of work stoppages or union organizing campaigns.
Available Information
We file annual and quarterly financial reports and current-event reports, as well as interim
updates of a material nature to investors, with the SEC. You may read and copy any of these
materials at the SEC’s Public Reference Room at 100 F. Street, NE, Washington, DC 20549.
Information on the operation of the Public Reference Room is available by calling the SEC at
1-800-SEC-0330. Alternatively, the SEC maintains an Internet site that contains reports, proxy and
information statements, and other information regarding issuers that file electronically with the
SEC. The address of that site is http://www.sec.gov.
We make our SEC filings available to the public, free of charge and as soon as practicable
after they are filed with the SEC, through our Internet website located at
http://www.OxfordResources.com. Our annual reports are filed on Form 10-K, our quarterly reports
are filed on Form 10-Q, and current-event reports are filed on Form 8-K; we also file amendments to
reports filed or furnished pursuant to the Securities Exchange Act of 1934, or the Exchange Act.
References to our website addressed in this Annual Report on Form 10-K are provided as a
convenience and do not constitute, and should not be viewed as, an incorporation by reference of
the information contained on, or available through, the website. Therefore, such information
should not be considered part of this Annual Report on Form 10-K.
24
Risks Related to Our Business
We may not have sufficient cash to enable us to pay the minimum quarterly distribution on our
common units following the establishment of cash reserves by our general partner and the payment of
costs and expenses, including reimbursement of expenses to our general partner.
In order to pay the minimum quarterly distribution of $0.4375 per unit per quarter, or $1.75
per unit per year, we will require available cash of approximately $9.2 million per quarter, or
$36.8 million per year, based on the number of general partner units, common units and subordinated
units outstanding at December 31, 2010. We may not have sufficient cash each quarter to pay the
minimum quarterly distribution. The amount of cash we can distribute on our common and
subordinated units principally depends upon the amount of cash we generate from our operations,
which will fluctuate from quarter to quarter based on, among other things:
| |
• |
|
the level of our production and coal sales and the amount of revenue we generate; |
| |
• |
|
the level of our operating costs, including reimbursement of expenses to our general
partner; |
| |
• |
|
changes in governmental regulation of the mining industry or the electric power
industry and the increased costs of complying with those changes; |
| |
• |
|
our ability to obtain, renew and maintain permits on a timely basis; |
| |
• |
|
prevailing economic and market conditions; and |
| |
• |
|
difficulties in collecting our receivables because of credit or financial problems
of major customers. |
In addition, the actual amount of cash we will have available for distribution will depend on
other factors, such as:
| |
• |
|
the level of capital expenditures we make; |
| |
• |
|
the restrictions contained in our credit agreement and our debt service
requirements; |
| |
• |
|
the cost of acquisitions; |
| |
• |
|
fluctuations in our working capital needs; |
| |
• |
|
our ability to borrow funds and access capital markets; and |
| |
• |
|
the amount of cash reserves established by our general partner. |
Because of these and other factors, we may not have sufficient available cash to pay a
specific level of cash distributions to our unitholders. Furthermore, the amount of cash we have
available for distribution depends primarily upon our cash flow, including cash flow from financial
reserves and working capital borrowings, and is not solely a function of profitability, which will
be affected by non-cash items. As a result, we may make cash distributions during periods when we
record net losses and may be unable to make cash distributions during periods when we record net
income.
Decreases in demand for electricity and changes in coal consumption patterns of U.S. electric power
generators could adversely affect our business.
Our business is closely linked to domestic demand for electricity and any changes in coal
consumption by U.S. electric power generators would likely impact our business over the long term.
In 2010 we sold approximately 76.3% of our coal to domestic electric power generators, and we have
long-term contracts in place with these electric power generators for a significant portion of our
future production. The amount of coal consumed by electric power generation is affected by, among
other things:
| |
• |
|
general economic conditions, particularly those affecting industrial electric power
demand, such as the recent downturn in the U.S. economy and financial markets; |
| |
| |
• |
|
indirect competition from alternative fuel sources for power generation, such as
natural gas, fuel oil, nuclear, hydroelectric, wind and solar power, and the location,
availability, quality and price of those alternative fuel sources; |
25
| |
• |
|
environmental and other governmental regulations, including those impacting
coal-fired power plants; and |
| |
• |
|
energy conservation efforts and related governmental policies. |
According to the EIA, total electricity consumption in the United States fell by approximately
3.8% during 2009 compared with 2008, primarily because of the effect of the economic downturn on
industrial electricity demand, and U.S. electric generation from coal fell by approximately 11.0%
in 2009 compared with 2008. Further decreases in the demand for electricity, such as decreases
that could be caused by a worsening of current economic conditions, a prolonged economic recession
or other similar events could have a material adverse effect on the demand for coal and on our
business over the long term.
Changes in the coal industry that affect our customers, such as those caused by decreased
electricity demand and increased competition, could also adversely affect our business. Indirect
competition from gas-fired plants that are cheaper to construct and easier to permit has the most
potential to displace a significant amount of coal-fired generation in the near term, particularly
older, less efficient coal-powered generators. In addition, uncertainty caused by federal and
state regulations could cause coal customers to be uncertain of their coal requirements in future
years, which could adversely affect our ability to sell coal to our customers under long-term coal
sales contracts.
Our long-term coal sales contracts subject us to renewal risks.
We sell most of the coal we produce under long-term coal sales contracts, which we define as
contracts with initial terms of one year or more. As a result, our results of operations are
dependent upon the prices we receive for the coal we sell under these contracts. To the extent we
are not successful in renewing, extending or renegotiating our long-term contracts on favorable
terms, we may have to accept lower prices for the coal we sell or sell reduced quantities of coal
in order to secure new sales contracts for our coal.
In addition, we may be adversely affected by extensions of our long-term coal sales contract
with AEP if market prices for coal under long-term contracts are low at the time of such extensions
or if increases in costs during the term of such extensions are greater than the offsets from our
cost pass through and cost adjustment provisions. The current term of our contract with AEP runs
through 2012, but it can be extended for two additional three-year terms. For each extension term,
the initial contract price will be based upon a market-based price for similar term contracts and
will be negotiated at the time of such extension, subject to cost pass through and cost adjustment
provisions. The contract also contains option provisions that give AEP the right to purchase
additional tons of coal during each extension term at a fixed price. If AEP elects to extend this
contract during a period when market prices for coal under similar term contracts are low, then we
may be materially and adversely affected if the contract price we are able to negotiate with AEP is
lower than our marginal cost of production. Alternatively, we may be materially and adversely
affected if our marginal cost of production increases by more than the offsets from our cost pass
through and cost adjustment provisions.
Prices and quantities under our long-term coal sales contracts are generally based on
expectations of future coal prices at the time the contract is entered into, renewed, extended or
re-opened. The expectation of future prices for coal depends upon factors beyond our control,
including the following:
| |
• |
|
domestic and foreign supply and demand for coal; |
| |
• |
|
domestic demand for electricity, which tends to follow changes in general economic
activity; |
| |
• |
|
domestic and foreign economic conditions; |
| |
• |
|
the price, quantity and quality of other coal available to our customers; |
| |
• |
|
competition for production of electricity from non-coal sources, including the price
and availability of alternative fuels and other sources, such as natural gas, fuel oil,
nuclear, hydroelectric, wind and solar power, and the effects of technological
developments related to these non-coal energy sources; |
| |
| |
• |
|
domestic air emission standards for coal-fired power plants, and the ability of
coal-fired power plants to meet these standards by installing scrubbers, purchasing
emissions allowances or other means; and |
| |
• |
|
legislative and judicial developments, regulatory changes, or changes in energy
policy and energy conservation measures that would adversely affect the coal industry. |
26
For more information regarding our long-term coal sales contracts, please read “Item 1.
Business — Customers — Long-Term Coal Sales Contracts.”
Our inability to acquire additional coal reserves that are economically recoverable may have a
material adverse effect on our future profitability.
Our profitability depends substantially on our ability to mine, in a cost-effective manner,
coal reserves that possess the quality characteristics our customers desire. Because our reserves
decline as we mine our coal, our future profitability depends upon our ability to acquire
additional coal reserves that are economically recoverable to replace the reserves we produce. If
we fail to acquire or develop sufficient additional reserves to replace the reserves depleted by
our production, our existing reserves will eventually be depleted.
Competition within the coal industry may materially and adversely affect our ability to sell coal
at an acceptable price.
We compete for domestic sales with numerous other coal producers in Northern Appalachia and
the Illinois Basin and in other coal producing regions of the United States, primarily Central
Appalachia and the PRB. The most important factors on which we compete are delivered price (i.e.,
the cost of coal delivered to the customer, including transportation costs, which are generally
paid by our customers either directly or indirectly), coal quality characteristics (primarily heat,
sulfur, ash and moisture content) and reliability of supply. Our competitors may have, among other
things, greater liquidity, greater access to credit and other financial resources, newer or more
efficient equipment, lower cost structures (like our competitors in the PRB), partnerships with
transportation companies or more effective risk management policies and procedures. Our failure to
compete successfully could have a material adverse effect on our business, financial condition or
results of operations.
We depend on a limited number of customers for a significant portion of our revenues, and the loss
of, or significant reduction in, purchases by any of them could adversely affect our results of
operations and our ability to make cash distributions to our unitholders.
We derived 73.9% of our revenues from coal sales to our five largest customers for the year
ended December 31, 2010 and, as of March 1, 2011, we had long-term coal sales contracts in place
with these same customers for 78.8% of our 2011 estimated coal sales. We expect to continue to
derive a substantial amount of our total revenues from a small number of customers in the future.
However, we may be unsuccessful in renewing long-term coal sales contracts with our largest
customers, and those customers may discontinue or reduce purchasing coal from us. If any of our
largest customers significantly reduces the quantities of coal it purchases from us and if we are
unable to sell such excess coal to our other customers on terms substantially similar to the terms
under our current long-term coal sales contracts, our business, our results of operations and our
ability to make distributions to our unitholders could be adversely affected.
New regulatory requirements limiting greenhouse gas emissions could adversely affect coal-fired
power generation and reduce the demand for coal as a fuel source, which could cause the price and
quantity of the coal we sell to decline materially.
One major by-product of burning coal is carbon dioxide, which is a greenhouse gas and a source
of concern with respect to global warming, also known as climate change. Climate change continues
to attract government, public and scientific attention, especially on ways to reduce greenhouse gas
emissions, including from coal-fired power plants. Various international, federal, regional and
state regulatory initiatives to limit emissions of greenhouse gases include possible future
U.S. treaty commitments, new federal or state legislation that may establish a cap-and-trade, and
regulation under existing environmental laws by the EPA. Future regulation of greenhouse gas
emissions may require additional controls on, or the closure of, coal-fired power plants and
industrial boilers and may restrict the construction of new coal-fired power plants.
27
The permitting of new coal-fired power plants has recently been contested by state regulators
and environmental advocacy organizations due to concerns related to greenhouse gas emissions. In
addition, a federal appeals courts has allowed a lawsuit pursuing federal common law claims to
proceed against certain utilities on the basis that they may have created a public nuisance due to
their emissions of carbon dioxide, although the U.S. Supreme Court has granted certiorari to review
this decision. A second federal appeals court dismissed such a case on procedural grounds. Future
regulation, litigation and permitting related to greenhouse gas emissions may cause some users of
coal to switch from coal to a lower-carbon fuel, or otherwise reduce the use of and demand for
fossil fuels, particularly coal, which could have a material adverse effect on our business,
financial condition or results of operations. For a more detailed discussion of potential climate
change impact, please read “Item 1. Business — Mining and Environmental Regulation — Climate
Change.”
Existing and future regulatory requirements relating to sulfur dioxide and other air emissions
could affect our customers and could reduce the demand for the high-sulfur coal we produce and
cause coal prices and sales of our high-sulfur coal to decline materially.
Coal-fired power plants are subject to extensive environmental regulation, particularly with
respect to air emissions. For example, the Clean Air Act, and similar state and local laws and
related regulations, place annual limits on emissions of sulfur dioxide, particulate matter,
nitrogen oxides, mercury and other compounds, including emissions by electric power generators,
which are the largest end-users of our coal. The ability of coal-fired power plants to burn the
high-sulfur coal we produce may be limited without the use of costly pollution control devices such
as scrubbers, the purchase of emission allowances or the blending of our high-sulfur coal with
low-sulfur coal.
Projected demand growth for high-sulfur coal in our primary market area is largely dependent
on planned installations of scrubbers at new and existing coal-fired power plants that use or plan
to use high-sulfur coal as a fuel. The timing and amount of these scrubber installations may be
affected by, among other things, anticipated changes in air quality regulations and the price and
availability of sulfur dioxide emissions allowances. To the extent that these scrubber
installations do not occur or are substantially delayed and sufficient sulfur dioxide allowances
are unavailable or are prohibitively expensive, demand for our high-sulfur coal could materially
decrease, which could have a material adverse effect on our business, financial condition or
results of operations. For a more detailed discussion of the regulation of air emissions, please
read “Item 1. Business — Mining and Environmental Regulation — Clean Air Act.”
Our coal mining operations are subject to operating risks, which could result in materially
increased operating expenses and decreased production levels and could have a material adverse
effect on our business, financial condition or results of operations.
Our coal mining operations are subject to a number of operating risks beyond our control.
Because we maintain very limited produced coal inventory, various conditions or events could
disrupt operations, adversely affect production and shipments and materially increase the cost of
mining and delay or halt production at particular mines for varying lengths of time, which could
have a material adverse effect on our business, financial condition or results of operations.
These conditions and events include, among others:
| |
• |
|
poor mining conditions resulting from geologic, hydrologic or other conditions,
which may cause instability of highwalls or spoil-piles or cause damage to nearby
infrastructure; |
| |
• |
|
adverse weather and natural disasters, such as heavy rains or flooding; |
| |
• |
|
the unavailability of qualified labor and contractors; |
| |
• |
|
the unavailability or increased prices of equipment or other critical supplies such
as tires and explosives, fuel, lubricants and other consumables; |
| |
• |
|
fluctuations in transportation costs and transportation delays or interruptions,
including those caused by river flooding and lock closures for repairs; |
| |
• |
|
delays, challenges to, and difficulties in acquiring, maintaining or renewing
permits or mineral and surface rights; |
| |
• |
|
future health, safety and environmental laws and regulations or changes in the
interpretation or enforcement of existing laws and regulations; |
| |
| |
• |
|
mine accidents or other unforeseen casualty events, including those involving
injuries or fatalities; |
| |
• |
|
increased or unexpected reclamation costs; and |
| |
• |
|
the inability to monitor our operations due to failures of information technology
systems. |
28
If any of the foregoing changes, conditions or events occurs and is not excusable as a force
majeure event, any resulting failure on our part to deliver coal to the purchaser under a long-term
sales contracts could result in economic penalties, suspension or cancellation of shipments or
ultimately termination of the agreement, any of which could have a material adverse effect on our
business, financial condition or results of operations.
We maintain insurance coverage for some but not all potential risks we face. We generally do
not carry business interruption insurance and we may elect not to carry other types of insurance in
the future. In addition, it is not possible to insure fully against safety, pollution and
environmental risks. The occurrence of a significant accident or other event that is not fully
covered by insurance could have a material adverse effect on our business, financial condition or
results of operations.
In the future, we may not receive cash distributions from Harrison Resources, and Harrison
Resources may not be able to acquire additional reserves on economical terms from CONSOL Energy.
In January 2007, we entered into a joint venture, Harrison Resources, with CONSOL Energy.
Pursuant to its operating agreement, all members of Harrison Resources must approve cash
distributions, other than tax distributions, to its members. The members of Harrison Resources
have consistently approved cash distributions from Harrison Resources on a quarterly basis,
including an aggregate of $5.9 million in distributions to us during 2010. In the future, however,
there can be no assurance that we will receive regular cash distributions from Harrison Resources.
CONSOL Energy controls the vast majority of the additional reserves in Harrison County, Ohio
that could be acquired by Harrison Resources in the future. However, CONSOL Energy has no
obligation to sell those reserves to Harrison Resources, and we cannot assure you that Harrison
Resources could acquire those reserves from CONSOL Energy on acceptable terms. As a result, the
growth of, and therefore our ability to receive future distributions from, Harrison Resources may
be limited, which could have a material adverse effect on our ability to make cash distributions to
our unitholders.
A significant portion of our cash available for distribution to our unitholders is derived from
royalty payments we receive on our underground coal reserves, which we do not operate.
In June 2005, we sold our underground mining operations at the Tusky mining complex to an
independent coal producer and subleased our underground coal reserves to this producer in exchange
for an overriding royalty equal to a percentage of the sales price received for the coal produced
and sold. For the year ended December 31, 2010, we received royalty income on our underground coal
reserves of approximately $2.8 million or approximately 5.4% of our adjusted EBITDA. The royalty
payments we receive could be adversely affected by any of the following:
| |
• |
|
a substantial and extended decline in the sales price for coal produced from our
underground coal reserves; |
| |
• |
|
any decisions by our sublessee to reduce or discontinue production or sales of coal
produced from our underground coal reserves; |
| |
• |
|
any failure by our sublessee to properly manage its operations; |
| |
• |
|
our sublessee’s operational risks relating to our underground coal reserves, which
expose our sublessee to operating conditions and events beyond its control, including
the inability to acquire necessary permits, changes or variations in geologic
conditions, changes in governmental regulation of the coal industry or the electric
power industry, mining and processing equipment failures and unexpected maintenance
problems, interruptions due to transportation delays, adverse weather and natural
disasters, labor-related interruptions and fires and explosions; and |
| |
• |
|
a material decline in the creditworthiness of our sublessee, including as a result
of the current economic downturn. |
If the royalty payments we receive from our sublessee are reduced, our ability to make cash
distributions to our unitholders could be adversely affected.
29
Increases in the cost of diesel fuel and explosives, or the inability to obtain a sufficient
quantity of those supplies, could increase our operating expenses, disrupt or delay our production
and have a material adverse effect on our profitability.
We use considerable quantities of diesel fuel in our mining operations. Even though we hedge
a portion of our diesel fuel needs, if the price of diesel fuel increases significantly, our
operating expenses will increase, which could have a material adverse effect on our profitability.
A significant amount of explosives are used in our mining operations. We use third party
contractors to provide blasting services, and they generally pass through to us the cost of
explosives, which is subject to fluctuations. Additionally, a limited number of suppliers exist
for explosives, and any of these suppliers may divert their products to other buyers. Shortages in
raw materials used in the manufacturing of explosives or the cancellation of supply contracts under
which these raw materials are obtained, could increase the prices and limit the ability of our
contractors to obtain these supplies.
Extensive environmental laws and regulations impose significant costs on our mining operations, and
future laws and regulations could materially increase those costs or limit our ability to produce
and sell coal.
The coal mining industry is subject to increasingly strict federal, state and local
environmental and mining safety laws and regulations. The enforcement of laws and regulations
governing the coal mining industry has substantially increased, due in part to recent accidents at
certain underground mines. Violations can result in administrative, civil and criminal penalties
and a range of other possible sanctions. In April 2010, a fatal mining accident in West Virginia
received national attention and led Congress to further increase mine safety disclosure
requirements. Additional state and national responses increasing mine safety regulation, reporting
requirements, inspection and enforcement, particularly with regard to underground mining
operations, are possible. New legislation or administrative regulations or new judicial
interpretations or administrative enforcement of existing laws and regulations, including proposals
related to the protection of the environment that would further regulate and tax the coal industry,
may also require us to change operations significantly or incur increased costs and be subject to
more adverse consequences for non-compliance. Such changes could have a material adverse effect on
our business, financial condition or results of operations.
We may be unable to obtain, maintain or renew permits necessary for our operations, which would
materially reduce our production, cash flows and profitability.
As is typical in the coal industry, our coal production is dependent on our ability to obtain
various federal and state permits and approvals to mine our coal reserves within the timeline
specified in our surface mining plan. The permitting rules, and the interpretations of these
rules, are complex, change frequently, and are often subject to discretionary interpretations by
regulators, which may increase the costs or possibly preclude the continuance of ongoing mining
operations or the development of future mining operations. In addition, the public, including
non-governmental organizations, anti-mining groups and individuals, has certain statutory rights to
comment upon and otherwise impact the permitting process, including through court intervention.
The slowing pace at which necessary permits are issued or renewed for new and existing mines has
materially impacted coal production. Permitting by the Corps, the EPA and the Department of the
Interior has become subject to enhanced review and stricter enforcement, especially under the CWA,
to reduce the harmful environmental consequences of mountain-top mining, especially in Central
Appalachia.
Based on our current surface mining plan, we have proven and probable coal reserves with
active permits that will allow us to mine for approximately three years. Typically, we submit the
necessary permit applications 12 to 30 months before we plan to mine a new area. Some of our
required mining permits are becoming increasingly difficult to obtain in a timely manner, or at
all, and in some instances we have had to abandon or substantially delay the mining of coal in
certain areas covered by the application in order to obtain required permits and approvals. We
expect that mining permits will be further delayed in the future if the EPA continues its enhanced
review of CWA applications. If the required permits are not issued or renewed in a timely fashion
or at all, or if permits issued or renewed are conditioned in a manner that restricts our ability
to efficiently and economically conduct our mining activities, we could suffer a material reduction
in our production and operations, and there could be a material adverse
effect on our ability to make cash distributions to our unitholders. Please read “Item 1.
Business — Mining and Environmental Regulation.”
30
If the assumptions underlying our reclamation and mine closure obligations are materially
inaccurate, our costs could be significantly greater than anticipated.
SMCRA and counterpart state laws and regulations establish reclamation and closure standards
for surface mining. As of December 31, 2010, we had accrued a reserve of approximately
$13.0 million for future reclamation and mine closure obligations. The estimate of ultimate
reclamation obligations is reviewed periodically by our management and engineers. Our estimated
reclamation and mine closure obligations could change significantly if actual results change from
our assumptions, which could have a material adverse effect on our financial condition or results
of operations. Please read Note 2 to our consolidated financial statements included elsewhere in
this Annual Report on Form 10-K under the heading “Asset Retirement Obligations” for more
information regarding our reclamation and mine closure obligations.
Debt we incur in the future may limit our flexibility to obtain financing and to pursue other
business opportunities.
Our future level of debt could have important consequences to us, including the following:
| |
• |
|
our ability to obtain additional financing, if necessary, for working capital,
capital expenditures, acquisitions or other purposes may be impaired or such financing
may not be available on favorable terms; |
| |
• |
|
our funds available for operations, future business opportunities and distributions
to unitholders will be reduced by that portion of our cash flow required to make
interest payments on our debt; |
| |
• |
|
we may be more vulnerable to competitive pressures or a downturn in our business or
the economy generally; and |
| |
• |
|
our flexibility in responding to changing business and economic conditions may be
limited. |
Our ability to service our debt will depend upon, among other things, our future financial and
operating performance, which will be affected by prevailing economic conditions and financial,
business, regulatory and other factors, some of which are beyond our control. If our operating
results are not sufficient to service our future indebtedness, we will be forced to take actions
such as reducing distributions, reducing or delaying our business activities, acquisitions,
investments or capital expenditures, selling assets or seeking additional equity capital. We may
not be able to effect any of these actions on satisfactory terms or at all.
Restrictions in our credit facility could adversely affect our business, financial condition,
results of operations, ability to make distributions to unitholders and value of our common units.
Our credit facility limits our ability to, among other things:
| |
• |
|
make distributions on or redeem or repurchase units; |
| |
• |
|
make certain investments and acquisitions; |
| |
• |
|
incur certain liens or permit them to exist; |
| |
• |
|
enter into certain types of transactions with affiliates; |
| |
• |
|
merge or consolidate with another company; and |
| |
• |
|
transfer or otherwise dispose of assets. |
Our credit facility also contains covenants requiring us to maintain certain financial ratios.
The provisions of our credit facility may affect our ability to obtain future financing and
pursue attractive business opportunities and our flexibility in planning for, and reacting to,
changes in business conditions. In addition, a failure to comply with the provisions of our credit
facility could result in a default or an event of default that could enable our lenders to declare
the outstanding principal of that debt, together with accrued and unpaid interest, to be
immediately due and payable. If the payment of our debt is accelerated, our assets may be
insufficient to repay such debt in full, and our unitholders could experience a partial or total
loss of their investment.
31
Our operations may impact the environment or cause environmental contamination, which could result
in material liabilities to us.
Our operations use hazardous materials, generate limited quantities of hazardous wastes and
may affect runoff or drainage water. In the event of environmental contamination or a release of
hazardous materials, we could become subject to claims for toxic torts, natural resource damages
and other damages and for the investigation and clean up of soil, surface water, groundwater, and
other media, as well as abandoned and closed mines located on property we operate. Such claims may
arise out of conditions at sites that we currently own or operate, as well as at sites that we
previously owned or operated, or may acquire. Our liability for such claims may be joint and
several, so that we may be held responsible for more than our share of the contamination or other
damages, or even for the entire share. These and other impacts that our operations may have on the
environment, as well as exposures to hazardous substances or wastes associated with our operations,
could result in costs and liabilities that could have a material adverse effect on us. Please read
“Item 1. Business — Mining and Environmental Regulation.”
We maintain coal refuse areas and slurry impoundments at our Tuscarawas County and Muhlenberg
County mining complexes. Such areas and impoundments are subject to extensive regulation. One of
those impoundments overlies a mined out area, which can pose a heightened risk of structural
failure and of damages arising out of such failure. When a slurry impoundment experiences a
structural failure, it could release large volumes of coal slurry into the surrounding environment,
which in turn can result in extensive damage to the environment and natural resources, such as
bodies of water. A failure may also result in civil or criminal fines, penalties, personal
injuries and property damages, and damage to wildlife or natural resources.
Our ability to operate our business effectively could be impaired if we fail to attract and retain
key management personnel.
Our ability to operate our business and implement our strategies depends on the continued
contributions of Charles C. Ungurean and other executive officers and key employees of our general
partner. In particular, we depend significantly on Mr. Ungurean’s long-standing relationships
within our industry. The loss of any of our senior executives, and Mr. Ungurean in particular,
could have a material adverse effect on our business. In addition, we believe that our future
success will depend on our continued ability to attract and retain highly skilled management
personnel with coal industry experience and competition for these persons in the coal industry is
intense. We may not be able to continue to employ key personnel or attract and retain qualified
personnel in the future, and our failure to retain or attract key personnel could have a material
adverse effect on our ability to effectively operate our business.
A shortage of skilled labor in the mining industry could reduce labor productivity and increase
costs, which could have a material adverse effect on our business and results of operations.
Efficient coal mining using modern techniques and equipment requires skilled laborers in
multiple disciplines such as equipment operators, mechanics and engineers, among others. We have
from time to time encountered shortages for these types of skilled labor. If we experience
shortages of skilled labor in the future, our labor and overall productivity or costs could be
materially and adversely affected. If coal prices decrease in the future or our labor prices
increase, or if we experience materially increased health and benefit costs with respect to our
general partner’s employees, our results of operations could be materially and adversely affected.
Our work force could become unionized in the future, which could adversely affect the stability of
our production and materially reduce our profitability.
All of our mines are operated by non-union employees of our general partner. Our employees
have the right at any time under the National Labor Relations Act to form or affiliate with a
union. If our employees choose to form or affiliate with a union and the terms of a union
collective bargaining agreement are significantly different from our
current compensation and job assignment arrangements with our employees, these arrangements
could adversely affect the stability of our production and materially reduce our profitability.
32
Inaccuracies in our estimates of our coal reserves could result in lower than expected revenues or
higher than expected costs.
Our future performance depends on, among other things, the accuracy of the estimates of our
proven and probable coal reserves. There are numerous factors and assumptions inherent in
estimating the quantities and qualities of, and costs to mine, coal reserves, any one of which may
vary considerably from actual results. These factors and assumptions include:
| |
• |
|
geologic and mining conditions, which may not be fully identified by available
exploration data or may differ from our experiences in areas where we currently mine; |
| |
• |
|
the percentage of coal ultimately recoverable; |
| |
• |
|
the assumed effects of regulation, including the issuance of required permits, and
taxes, including severance and excise taxes and royalties, and other payments to
governmental agencies; |
| |
• |
|
assumptions concerning the timing for the development of reserves; and |
| |
• |
|
assumptions concerning equipment and productivity, future coal prices, operating
costs, including for critical supplies such as fuel, tires and explosives, capital
expenditures and development and reclamation costs. |
As a result, estimates of the quantities and qualities of economically recoverable coal
attributable to any particular group of properties, classifications of reserves based on risk of
recovery, estimated cost of production, and estimates of future net cash flows expected from these
properties as prepared by different engineers and accounting personnel, or by the same engineers
and accounting personnel at different times, may vary materially due to changes in the above
factors and assumptions. Actual production recovered from identified reserve areas and properties,
and revenues and expenditures associated with our mining operations, may vary materially from
estimates. Any inaccuracy in the estimates related to our reserves could have a material adverse
effect on our ability to make cash distributions.
Our ability to collect payments from our customers could be impaired if their creditworthiness
deteriorates.
Our ability to receive payment for the coal we sell depends on the continued creditworthiness
of our customers. The current economic volatility and tight credit markets increase the risk that
we may not be able to collect payments from our customers. A continuation or worsening of current
economic conditions or other prolonged global or U.S. recessions could also impact the
creditworthiness of our customers.
If the creditworthiness of a customer declines, this would increase the risk that we may not
be able to collect payment for all of the coal we sell to that customer. If we determine that a
customer is not creditworthy, we may not be required to deliver coal under the customer’s coal
sales contract. If we are able to withhold shipments, we may decide to sell the customer’s coal on
the spot market, which may be at prices lower than the contract price, or we may be unable to sell
the coal at all. Furthermore, the bankruptcy of any of our customers could have a material adverse
effect on our financial position. In addition, competition with other coal suppliers could force
us to extend credit to customers and on terms that could increase the risk of payment default.
In addition, we sell some of our coal to coal brokers who may resell our coal to end users,
including utilities. These coal brokers may have only limited assets, making them less
creditworthy than the end users. Under some of these arrangements, we have contractual privity
only with the brokers and may not be able to pursue claims against the end users in connection with
these sales if we do not receive payment from the broker. In 2010, approximately 24% of our sales
were through coal brokers. We expect our sales through coal brokers to increase to approximately
31% of our sales in 2011.
Failure to obtain, maintain or renew our security arrangements, such as surety bonds or letters of
credit, in a timely manner and on acceptable terms could have an adverse effect on our ability to
make cash distributions to our unitholders.
Federal and state laws require us to secure the performance of certain long-term obligations,
such as mine closure or reclamation costs. The amount of these security arrangements is
substantial, with total amounts of surety bonds at March 14, 2011 of approximately $35.5 million,
which were supported by letters of credit of $6.7 million. Certain business transactions, such as
coal leases and other obligations, may also require bonding. Our bonding requirements could
increase in the future. We may have difficulty procuring or maintaining our surety bonds. Our
bond issuers may demand higher fees, additional collateral, including putting up letters of credit
or posting cash collateral, or other terms less favorable to us upon those renewals. Our ability
to obtain or renew our surety bonds could be impacted by a variety of other factors including lack
of availability, unfavorable market terms, the exercise by third-party surety bond issuers of their
right to refuse to renew the surety bonds and restrictions on availability of collateral for
current and future third-party surety bond issuers under the terms of any credit arrangements then
in place. Due to current economic conditions and the volatility of the financial markets, surety
bond providers may be less willing to provide us with surety bonds or maintain existing surety
bonds and we may have greater difficulty satisfying the liquidity requirements under our existing
surety bond contracts. If we do not maintain sufficient borrowing capacity or have other resources
to satisfy our surety and bonding requirements, our operations and our ability to make cash
distributions to our unitholders could be adversely affected.
33
The amount of estimated reserve replacement
expenditures that our general partner is required to deduct from
operating surplus each quarter is based on our current estimates and could increase in the future,
resulting in a decrease in available cash from operating surplus that could be distributed to our
unitholders.
For 2011, we expect to incur between $5.5 million and $6.0 million in reserve replacement
expenditures. Our partnership agreement requires our general partner to deduct from operating
surplus each quarter estimated reserve replacement expenditures as opposed to actual reserve
replacement expenditures in order to reduce disparities in operating surplus caused by fluctuating
reserve replacement costs. This amount is based on our current estimates of the amounts of
expenditures we will be required to make in future years to maintain our depleting reserve base,
which we believe to be reasonable. In the future our estimated reserve replacement expenditures
may be more than our actual reserve replacement expenditures, which will reduce the amount of
available cash from operating surplus that we would otherwise have available for distribution to
unitholders. The amount of estimated reserve replacement expenditures deducted from operating
surplus is subject to review and change by the board of directors of our general partner at least
once a year, subject to approval by the conflicts committee of the board of directors of our
general partner, or the Conflicts Committee.
Our management team does not have experience managing our business as a stand-alone publicly traded
partnership, and if they are unable to manage our business as a publicly traded partnership our
business may be affected.
Our management team does not have experience managing our business as a publicly traded
partnership. If we are unable to manage and operate our partnership as a publicly traded
partnership, our business and results of operations will be adversely affected.
We will be required by Section 404 of the Sarbanes-Oxley Act to evaluate the effectiveness of our
internal controls. If we are unable to establish and maintain effective internal controls, our
financial condition and operating results could be adversely affected.
We are in the process of evaluating our internal controls systems to allow management to
report on, and our independent auditors to audit, our internal controls over financial reporting.
We are also in the process of performing the system and process evaluation and testing (and any
necessary remediation) required to comply with the management report and auditor attestation
requirements of Section 404 of the Sarbanes-Oxley Act of 2002. We will be required to comply with
Section 404 for the year ending December 31, 2011. However, we cannot be certain as to the timing
of completion of our evaluation, testing and remediation actions or the impact of the same on our
operations. Furthermore, upon completion of this process, we may identify control deficiencies of
varying degrees of severity under applicable SEC and Public Company Accounting Oversight Board
rules and regulations that remain unremediated. We will be required to report, among other things,
control deficiencies that constitute a “material
weakness” or changes in internal controls that, or that are reasonably likely to, materially
affect internal controls over financial reporting. A “material weakness” is a deficiency or
combination of deficiencies in internal controls over financial reports that results in more than a
remote likelihood that a material misstatement of the annual or interim consolidated financial
statements will not be prevented or detected.
If we fail to implement the requirements of Section 404 in a timely manner, we might be
subject to sanctions or investigation by regulatory authorities such as the SEC. In addition,
failure to comply with Section 404 or the report by us of a material weakness may cause investors
to lose confidence in our consolidated financial statements, and as a result our unit price may be
adversely affected. If we fail to remedy any material weakness, our consolidated financial
statements may be inaccurate, we may face restricted access to the capital markets and our unit
price may be adversely affected.
34
Terrorist attacks and threats, escalation of military activity in response to these attacks or acts
of war could have a material adverse effect on our business, financial condition or results of
operations.
Terrorist attacks and threats, escalation of military activity or acts of war may have
significant effects on general economic conditions, fluctuations in consumer confidence and
spending and market liquidity, each of which could materially and adversely affect our business.
Future terrorist attacks, rumors or threats of war, actual conflicts involving the United States or
its allies, or military or trade disruptions affecting our customers may significantly affect our
operations and those of our customers. Strategic targets, such as energy-related assets and
transportation assets, may be at greater risk of future terrorist attacks than other targets in the
United States. Disruption or significant increases in energy prices could result in
government-imposed price controls. It is possible that any of these occurrences, or a combination
of them, could have a material adverse effect on our business, financial condition and results of
operations.
Risks Inherent in an Investment in Us
Our partnership agreement limits our general partner’s fiduciary duties to our unitholders and
restricts the remedies available to our unitholders for actions taken by our general partner that
might otherwise constitute breaches of fiduciary duties.
Fiduciary duties owed to our unitholders by our general partner are prescribed by law and the
partnership agreement. The Delaware Revised Uniform Limited Partnership Act, or the Delaware Act,
provides that Delaware limited partnerships may, in their partnership agreements, restrict the
fiduciary duties owed by the general partner to limited partners and the partnership. Our
partnership agreement contains provisions that reduce the standards to which our general partner
would otherwise be held by state fiduciary duty law. For example, our partnership agreement:
| |
• |
|
limits the liability and reduces the fiduciary duties of our general partner, while
also restricting the remedies available to our unitholders for actions that, without
these limitations, might constitute breaches of fiduciary duty. As a result of
purchasing common units, our unitholders consent to some actions and conflicts of
interest that might otherwise constitute a breach of fiduciary or other duties under
applicable state law; |
| |
• |
|
permits our general partner to make a number of decisions in its individual
capacity, as opposed to in its capacity as our general partner. This entitles our
general partner to consider only the interests and factors that it desires, and it has
no duty or obligation to give any consideration to any interest of, or factors
affecting, us, our affiliates or any limited partner. Examples include the exercise of
its limited call right, its voting rights with respect to the units it owns, its
registration rights and its determination whether or not to consent to any merger or
consolidation of the partnership; |
| |
• |
|
provides that our general partner shall not have any liability to us or our
unitholders for decisions made in its capacity as general partner so long as it acted
in good faith, meaning our general partner honestly believed that the decision was in
the best interests of the partnership; |
| |
• |
|
generally provides that affiliated transactions and resolutions of conflicts of
interest not approved by the Conflicts Committee and not involving a vote of our
unitholders must be on terms no less favorable to us than those generally being
provided to or available from unrelated third parties or be “fair and reasonable”
to us and that, in determining whether a transaction or resolution is “fair and
reasonable,” our general partner may consider the totality of the relationships between
the parties involved, including other transactions that may be particularly advantageous
or beneficial to us; and |
| |
• |
|
provides that our general partner and its officers and directors will not be liable
for monetary damages to us or our limited partners for any acts or omissions unless
there has been a final and non-appealable judgment entered by a court of competent
jurisdiction determining that our general partner or those other persons acted in bad
faith or engaged in fraud or willful misconduct. |
By purchasing a common unit, a common unitholder will become bound by the provisions of the
partnership agreement, including the provisions described above.
35
Our general partner and its affiliates have conflicts of interest with us, and their limited
fiduciary duties to our unitholders may permit them to favor their own interests to the detriment
of our unitholders.
C&T Coal owns an 18.2% limited partner interest in us, AIM Oxford owns a 35.7% limited partner
interest in us, and C&T Coal and AIM Oxford own substantially all of and control our general
partner and its 2.0% general partner interest in us. Although our general partner has certain
fiduciary duties to manage us in a manner beneficial to us and our unitholders, the executive
officers and directors of our general partner have a fiduciary duty to manage our general partner
in a manner beneficial to its owners. Furthermore, since certain executive officers and directors
of our general partner are executive officers or directors of affiliates of our general partner,
conflicts of interest may arise between C&T Coal and AIM Oxford and their affiliates, including our
general partner, on the one hand, and us and our unitholders, on the other hand. As a result of
these conflicts, our general partner may favor its own interests and the interests of its
affiliates over the interests of our unitholders. Please read “— Our partnership agreement limits
our general partner’s fiduciary duties to our unitholders and restricts the remedies available to
our unitholders for actions taken by our general partner that might otherwise constitute breaches
of fiduciary duty.” The risk to our unitholders due to such conflicts may arise because of the
following factors, among others:
| |
• |
|
our general partner is allowed to take into account the interests of parties other
than us, such as C&T Coal and AIM Oxford, in resolving conflicts of interest, which has
the effect of limiting its fiduciary duty to our unitholders; |
| |
• |
|
neither our partnership agreement nor any other agreement requires owners of our
general partner to pursue a business strategy that favors us. Executive officers and
directors of our general partner’s owners have a fiduciary duty to make these decisions
in the best interest of their owners, which may be contrary to our interests; |
| |
• |
|
our general partner determines the amount and timing of asset purchases and sales,
capital expenditures, borrowings and issuances of additional partnership securities and
reserves, each of which can affect the amount of cash that is available for
distribution to our unitholders; |
| |
• |
|
our general partner determines our estimated reserve replacement expenditures, which
reduce operating surplus, and that determination can affect the amount of cash that is
distributed to our unitholders and the ability of the subordinated units to convert to
common units; |
| |
• |
|
in some instances, our general partner may cause us to borrow funds in order to
permit the payment of cash distributions, even if the purpose or effect of the
borrowing is to make a distribution on the subordinated units, to make incentive
distributions or to accelerate the expiration of the subordination periods; |
| |
• |
|
our general partner determines which costs incurred by it and its affiliates are
reimbursable by us; |
| |
• |
|
our partnership agreement does not restrict our general partner from causing us to
pay it or its affiliates for any services rendered on terms that are fair and
reasonable to us or entering into additional contractual arrangements with any of these
entities on our behalf; |
| |
• |
|
our general partner intends to limit its liability regarding our contractual and
other obligations; |
| |
• |
|
our general partner may exercise its limited right to call and purchase common units
if it and its affiliates own more than 80.0% of the common units; |
| |
| |
• |
|
our general partner controls the enforcement of obligations owed to us by it and its
affiliates; and |
| |
• |
|
our general partner decides whether to retain separate counsel, accountants or
others to perform services for us. |
In addition, AIM currently holds substantial interests in other companies in the energy and
natural resource sectors. Our partnership agreement provides that our general partner will be
restricted from engaging in any business activities other than acting as our general partner and
those activities incidental to its ownership interest in us. However, AIM and AIM Oxford are not
prohibited from engaging in other businesses or activities, including those that might be in direct
competition with us. As a result, they could potentially compete with us for acquisition
opportunities and for new business or extensions of the existing services provided by us.
Pursuant to the terms of our partnership agreement, the doctrine of corporate opportunity, or
any analogous doctrine, does not apply to our general partner or any of its affiliates, including
its executive officers, directors and owners. Any such person or entity that becomes aware of a
potential transaction, agreement, arrangement or other matter that may be an opportunity for us
will not have any duty to communicate or offer such opportunity to us. Any such person or entity
will not be liable to us or to any limited partner for breach of any fiduciary duty or other duty
by reason of the fact that such person or entity pursues or acquires such opportunity for itself,
directs such opportunity to another person or entity or does not communicate such opportunity or
information to us. This may create actual and potential conflicts of interest between us and
affiliates of our general partner and result in less than favorable treatment of us and our
unitholders.
36
Our unitholders have limited voting rights and are not entitled to elect our general partner or its
directors or initially to remove our general partner without its consent.
Unlike the holders of common stock in a corporation, our unitholders have only limited voting
rights on matters affecting our business and, therefore, limited ability to influence management’s
decisions regarding our business. Our unitholders have no right to elect our general partner or
its board of directors on an annual or other continuing basis. The board of directors of our
general partner is chosen entirely by its members and not by our unitholders. Furthermore, if our
unitholders are dissatisfied with the performance of our general partner, they have limited ability
to remove our general partner.
Our unitholders are unable to remove our general partner without its consent because
affiliates of our general partner own sufficient units to be able to prevent removal of our general
partner. The vote of the holders of at least 80.0% of all outstanding common units and
subordinated units voting together as a single class is required to remove our general partner.
Affiliates of our general partner own 55.4% of our common units and subordinated units. Also, if
our general partner is removed without cause during the subordination period and units held by our
general partner and its affiliates are not voted in favor of that removal, all remaining
subordinated units will automatically be converted into common units and any existing arrearages on
the common units will be extinguished. A removal of our general partner under these circumstances
would adversely affect the common units by prematurely eliminating their distribution and
liquidation preference over the subordinated units, which would otherwise have continued until we
had met certain distribution and performance tests.
Cause is narrowly defined in our partnership agreement to mean that a court of competent
jurisdiction has entered a final, non-appealable judgment finding our general partner liable for
actual fraud or willful misconduct in its capacity as our general partner. Cause does not include
most cases of charges of poor management of the business, so the removal of our general partner
during the subordination period because of our unitholders’ dissatisfaction with our general
partner’s performance in managing our partnership will most likely result in the termination of the
subordination period.
The control of our general partner may be transferred to a third party without unitholder consent.
Our general partner may transfer its general partner interest in us to a third party in a
merger or in a sale of all or substantially all of its assets without the consent of our
unitholders. Furthermore, there is no restriction in our partnership agreement on the ability of
the members of our general partner to transfer their respective membership interests in our general
partner to a third party. The new members of our general partner would then be in a position to
replace the board of directors and executive officers of our general partner with their own
choices and to control the decisions and actions of the board of directors and executive officers
of our general partner.
The incentive distribution rights of our general partner may be transferred to a third party
without unitholder consent.
Our general partner may transfer its incentive distribution rights to a third party at any
time without the consent of our unitholders. If our general partner transfers its incentive
distribution rights to a third party but retains its general partner interest, our general partner
may not have the same incentive to grow our partnership and increase quarterly distributions to
unitholders over time as it would if it had retained ownership of its incentive distribution
rights.
Our general partner has a limited call right that may require our unitholders to sell their common
units at an undesirable time or price.
C&T Coal and AIM Oxford own an aggregate of 55.1% of our common units and subordinated units.
If at any time our general partner and its affiliates own more than 80.0% of the common units, our
general partner will have the right, but not the obligation, which it may assign to any of its
affiliates or to us, to acquire all, but not less than all, of the common units held by
unaffiliated persons at a price not less than the then-current market price. As a result, our
unitholders may be required to sell their common units at an undesirable time or price and may not
receive any return on their investment. Our unitholders may also incur a tax liability upon a sale
of their common units. Our general partner is not obligated to obtain a fairness opinion regarding
the value of the common units to be repurchased by it upon exercise of the limited call right.
There is no restriction in our partnership agreement that prevents our general partner from issuing
additional common units and exercising its limited call right. If our general partner exercised
its limited call right, the effect would be to take us private and, if the common units were
subsequently deregistered, we would no longer be subject to the reporting requirements of the
Exchange Act.
37
We may issue additional units without unitholder approval, which would dilute unitholder interests.
At any time, we may issue an unlimited number of limited partner interests of any type without
the approval of our unitholders. Further, our partnership agreement does not prohibit the issuance
of equity securities that may effectively rank senior to our common units. The issuance by us of
additional common units or other equity securities of equal or senior rank will have the following
effects:
| |
• |
|
our unitholders’ proportionate ownership interest in us will decrease; |
| |
• |
|
the amount of cash available for distribution on each unit may decrease; |
| |
• |
|
because a lower percentage of total outstanding units will be subordinated units,
the risk that a shortfall in the payment of the minimum quarterly distribution will be
borne by our common unitholders will increase; |
| |
• |
|
the relative voting strength of each previously outstanding unit may be diminished;
and |
| |
• |
|
the market price of the common units may decline. |
Our general partner may, without unitholder approval, elect to cause us to issue common units and
general partner units to it in connection with a resetting of the target distribution levels
related to its incentive distribution rights. This could result in lower distributions to holders
of our common units.
Our general partner has the right, at any time when there are no subordinated units
outstanding and it has received distributions on its incentive distribution rights at the highest
level to which it is entitled (48.0%) for each of the prior four consecutive fiscal quarters, to
reset the initial target distribution levels at higher levels based on our distributions at the
time of the exercise of the reset election. Following a reset election by our general partner, the
minimum quarterly distribution will be adjusted to equal the reset minimum quarterly distribution
and the target distribution levels will be reset to correspondingly higher levels based on
percentage increases above the reset minimum quarterly distribution.
If our general partner elects to reset the target distribution levels, it will be entitled to
receive a number of common units and general partner units. The number of common units to be
issued to our general partner will be equal to that number of common units that would have entitled
their holder to an average aggregate quarterly cash distribution in the prior two quarters equal to
the average of the distributions to our general partner on the incentive distribution rights in the
prior two quarters. Our general partner will be issued the number of general partner units
necessary to maintain our general partner’s interest in us that existed immediately prior to the
reset election. We anticipate that our general partner would exercise this reset right in order to
facilitate acquisitions or internal growth projects that would not be sufficiently accretive to
cash distributions per common unit without such conversion. It is possible, however, that our
general partner could exercise this reset election at a time when it is experiencing, or expects to
experience, declines in the cash distributions it receives related to its incentive distribution
rights and may, therefore, desire to be issued common units rather than retain the right to receive
distributions on its incentive distribution rights based on the initial target distribution levels.
As a result, a reset election may cause our common unitholders to experience a reduction in the
amount of cash distributions that our common unitholders would have otherwise received had we not
issued new common units and general partner units to our general partner in connection with
resetting the target distribution levels.
Cost reimbursements due to our general partner and its affiliates reduce cash available for
distribution to our unitholders.
Prior to making any distribution on the common units, we will reimburse our general partner
and its affiliates for all expenses they incur on our behalf, which will be determined by our
general partner in its sole discretion in accordance with the terms of our partnership agreement.
In determining the costs and expenses allocable to us, our general partner is subject to its
fiduciary duty, as modified by our partnership agreement, to the limited partners, which requires
it to act in good faith. These expenses include all costs incurred by our general partner and its
affiliates in managing and operating us. We are managed and operated by executive officers and
directors of our general partner. The reimbursement of expenses and payment of fees, if any, to
our general partner and its affiliates will reduce the amount of cash available for distribution to
our unitholders.
38
Our unitholders who fail to furnish certain information requested by our general partner or who our
general partner, upon receipt of such information, determines are not eligible citizens are not
entitled to receive distributions or allocations of income or loss on their common units and their
common units will be subject to redemption.
Our general partner may require each limited partner to furnish information about his
nationality, citizenship or related status. If a limited partner fails to furnish information
about his nationality, citizenship or other related status within 30 days after a request for the
information or our general partner determines after receipt of the information that the limited
partner is not an eligible citizen, the limited partner may be treated as a non-citizen assignee.
A non-citizen assignee does not have the right to direct the voting of his units and may not
receive distributions in kind upon our liquidation. Furthermore, we have the right to redeem all
of the common units and subordinated units of any holder that is not an eligible citizen or fails
to furnish the requested information. The redemption price will be paid in cash or by delivery of
a promissory note, as determined by our general partner.
Our unitholders may have liability to repay distributions.
Under certain circumstances, our unitholders may have to repay amounts wrongfully returned or
distributed to them. Under Section 17-607 of the Delaware Act, we may not make a distribution to
our unitholders if the distribution would cause our liabilities to exceed the fair value of our
assets. Delaware law provides that, for a period of three years from the date of the impermissible
distribution, limited partners who received the distribution and who knew at the time of the
distribution that it violated Delaware law will be liable to the limited partnership for the
distribution amount. Purchasers of units who become limited partners are liable for the
obligations of the transferring limited partner to make contributions to the partnership that are
known to the purchaser of units at the time it became a limited partner and for unknown obligations
if the liabilities could be determined from the partnership agreement. Liabilities to partners on
account of their partnership interests and liabilities that are non-recourse to the partnership are
not counted for purposes of determining whether a distribution is permitted.
Tax Risks
Our tax treatment depends on our status as a partnership for federal income tax purposes. If the
Internal Revenue Service, or the IRS, were to treat us as a corporation for federal income tax
purposes, which would subject us to entity-level taxation, then our cash available for distribution
to our unitholders would be substantially reduced.
The anticipated after-tax economic benefit of an investment in the common units depends
largely on our being treated as a partnership for federal income tax purposes. We have not
requested, and do not plan to request, a ruling from the IRS on this or any other tax matter
affecting us.
Despite the fact that we are a limited partnership under Delaware law, it is possible in
certain circumstances for a partnership such as ours to be treated as a corporation for federal
income tax purposes. A change in our business or a change in current law could cause us to be
treated as a corporation for federal income tax purposes or otherwise subject us to taxation as an
entity.
If we were treated as a corporation for federal income tax purposes, we would pay federal
income tax on our taxable income at the corporate tax rate, which is currently a maximum of 35.0%,
and would likely pay state and local income tax at varying rates. Distributions would generally be
taxed again as corporate dividends (to the extent of our current and accumulated earnings and
profits), and no income, gains, losses, deductions, or credits would flow through to you. Because
a tax would be imposed upon us as a corporation, our cash available for distribution to you would
be substantially reduced. Therefore, if we were treated as a corporation for federal income tax
purposes there would be material reduction in the anticipated cash flow and after-tax return to our
unitholders, likely causing a substantial reduction in the value of our common units.
Our partnership agreement provides that, if a law is enacted or existing law is modified or
interpreted in a manner that subjects us to taxation as a corporation or otherwise subjects us to
entity-level taxation for federal, state or local income tax purposes, the minimum quarterly
distribution amount and the target distribution amounts may be adjusted to reflect the impact of
that law on us.
39
If we were subjected to a material amount of additional entity-level taxation by individual states,
it would reduce our cash available for distribution to our unitholders.
Changes in current state law may subject us to additional entity-level taxation by individual
states. Because of widespread state budget deficits and other reasons, several states are
evaluating ways to subject partnerships to entity-level taxation through the imposition of state
income, franchise and other forms of taxation. Imposition of any such taxes may substantially
reduce the cash available for distribution to you.
Our partnership agreement provides that, if a law is enacted or existing law is modified or
interpreted in a manner that subjects us to taxation as a corporation or otherwise subjects us to
entity-level taxation for federal, state or local income tax purposes, the minimum quarterly
distribution amount and the target distribution amounts may be adjusted to reflect the impact of
that law on us.
The tax treatment of publicly traded partnerships or an investment in our common units could be
subject to potential legislative, judicial or administrative changes and differing interpretations,
possibly on a retroactive basis.
The present U.S. federal income tax treatment of publicly traded partnerships, including us,
or an investment in our common units may be modified by administrative, legislative or judicial
interpretation at any time. Recently, members of the U.S. Congress considered substantive changes
to the existing U.S. federal income tax laws that would have affected the tax treatment of certain
publicly traded partnerships. Any modification to the U.S. federal income tax laws or
interpretations thereof may or may not be applied retroactively. Although we are unable to predict
whether any of these changes or any other proposals will ultimately be enacted, any changes could
negatively impact the value of an investment in our common units.
Certain federal income tax preferences currently available with respect to coal exploration and
development may be eliminated in future legislation.
Among the changes contained in President Obama’s Budget Proposal for Fiscal Year 2012, or the
Budget Proposal, is the elimination of certain key U.S. federal income tax preferences relating to
coal exploration and development. The Budget Proposal would: (i) eliminate current deductions, the
60-month amortization period and the 10-year amortization period for exploration and development
costs relating to coal and other hard mineral fossil fuels, (ii) repeal the percentage depletion
allowance with respect to coal properties, (iii) repeal capital gains treatment of coal and lignite
royalties and (iv) exclude from the definition of domestic production gross receipts all gross
receipts derived from the sale, exchange, or other disposition of coal, other hard mineral fossil
fuels or primary products thereof. The passage of any legislation as a result of the Budget
Proposal or any other similar changes in U.S. federal income tax laws could eliminate certain tax
deductions that are currently available with respect to coal exploration and development, and any
such change could increase the taxable income allocable to our unitholders and negatively impact
the value of an investment in our common units.
Our unitholders’ share of our income is taxable to them for U.S. federal income tax purposes even
if they do not receive any cash distributions from us.
Because a unitholder is treated as a partner to whom we allocate taxable income which could be
different in amount than the cash we distribute, a unitholder’s allocable share of our taxable
income is taxable to it, which may require the payment of federal income taxes and, in some cases,
state and local income taxes on its share of our taxable income even if it receives no cash
distributions from us. Our unitholders may not receive cash distributions from us equal to their
share of our taxable income or even equal to the actual tax liability that results from that
income.
If the IRS contests the federal income tax positions we take, the market for our common units may
be adversely impacted and the cost of any IRS contest will reduce our cash available for
distribution to our unitholders.
We have not requested a ruling from the IRS with respect to our treatment as a partnership for
federal income tax purposes or any other matter affecting us. The IRS may adopt positions that
differ from the positions we take, and the IRS’s positions may ultimately be sustained. It may be
necessary to resort to administrative or court proceedings to sustain some or all of the positions
we take and such positions may not ultimately be sustained. A court may not agree with some or all
of the positions we take. Any contest with the IRS, and the outcome of any IRS contest, may have a
materially adverse impact on the market for our common units and the price at which they trade. In
addition, our costs of any contest with the IRS will be borne indirectly by our unitholders and our
general partner because the costs will reduce our cash available for distribution.
40
Tax gain or loss on the disposition of our common units could be more or less than expected.
If you sell your common units, you will recognize a gain or loss for federal income tax
purposes equal to the difference between the amount realized and your tax basis in those common
units. Because distributions in excess of your allocable share of our net taxable income decrease
your tax basis in your common units, the amount, if any, of such prior excess distributions with
respect to the common units you sell will, in effect, become taxable income to you if you sell such
common units at a price greater than your tax basis in those common units, even if the price you
receive is less than your original cost. Furthermore, a substantial portion of the amount realized
on any sale of your common units, whether or not representing gain, may be taxed as ordinary income
due to potential recapture items, including depreciation recapture. In addition, because the
amount realized includes a unitholder’s share of our nonrecourse liabilities, if you sell your
common units, you may incur a tax liability in excess of the amount of cash you receive from the
sale.
Tax-exempt entities and non-U.S. persons face unique tax issues from owning our common units that
may result in adverse tax consequences to them.
Investment in common units by tax-exempt entities, such as employee benefit plans and
individual retirement accounts (known as IRAs), and non-U.S. persons raises issues unique to them.
For example, virtually all of our income allocated to organizations that are exempt from federal
income tax, including IRAs and other retirement plans, will be unrelated business taxable income
and will be taxable to them. Distributions to non-U.S. persons will be reduced by withholding
taxes at the highest applicable effective tax rate, and non-U.S. persons will be required to file
U.S. federal
income tax returns and pay tax on their share of our taxable income. If you are a tax-exempt
entity or a non-U.S. person, you should consult a tax advisor before investing in our common units.
We treat each purchaser of common units as having the same tax benefits without regard to the
actual common units purchased. The IRS may challenge this treatment, which could adversely affect
the value of the common units.
Because we cannot match transferors and transferees of common units and because of other
reasons, we have adopted depreciation and amortization positions that may not conform to all
aspects of existing Treasury Regulations. A successful IRS challenge to those positions could
adversely affect the amount of tax benefits available to you. It also could affect the timing of
these tax benefits or the amount of gain from your sale of common units and could have a negative
impact on the value of our common units or result in audit adjustments to your tax returns.
We prorate our items of income, gain, loss and deduction for U.S. federal income tax purposes
between transferors and transferees of our units each month based upon the ownership of our units
on the first day of each month, instead of on the basis of the date a particular unit is
transferred. The IRS may challenge this treatment, which could change the allocation of items of
income, gain, loss and deduction among our unitholders.
We prorate our items of income, gain, loss and deduction for U.S. federal income tax purposes
between transferors and transferees of our units each month based upon the ownership of our units
on the first day of each month, instead of on the basis of the date a particular unit is
transferred. The use of this proration method may not be permitted under existing Treasury
Regulations. If the IRS were to challenge this method or new Treasury regulations were issued, we
may be required to change the allocation of items of income, gain, loss and deduction among our
unitholders.
A unitholder whose common units are loaned to a “short seller” to effect a short sale of common
units may be considered as having disposed of those common units. If so, he would no longer be
treated for federal income tax purposes as a partner with respect to those common units during the
period of the loan and may recognize gain or loss from the disposition.
Because a unitholder whose common units are loaned to a “short seller” to effect a short sale
of common units may be considered as having disposed of the loaned common units, he may no longer
be treated for federal income tax purposes as a partner with respect to those common units during
the period of the loan to the short seller and the unitholder may recognize gain or loss from such
disposition. Moreover, during the period of the loan to the short seller, any of our income, gain,
loss or deduction with respect to those common units may not be reportable by the unitholder and
any cash distributions received by the unitholder as to those common units could be fully taxable
as ordinary income. Our unitholders desiring to assure their status as partners and avoid the risk
of gain recognition from a loan to a short seller are urged to consult a tax advisor to discuss
whether it is advisable to modify any applicable brokerage account agreements to prohibit their
brokers from loaning their common units.
41
We have adopted certain valuation methodologies and monthly conventions for U.S. federal income tax
purposes that may result in a shift of income, gain, loss and deduction between our general partner
and our unitholders. The IRS may challenge this treatment, which could adversely affect the value
of the common units.
When we issue additional units or engage in certain other transactions, we will determine the
fair market value of our assets and allocate any unrealized gain or loss attributable to our assets
to the capital accounts of our unitholders and our general partner. Our methodology may be viewed
as understating the value of our assets. In that case, there may be a shift of income, gain, loss
and deduction between certain unitholders and our general partner, which may be unfavorable to such
unitholders. Moreover, under our valuation methods, subsequent purchasers of common units may have
a greater portion of their Internal Revenue Code Section 743(b) adjustment allocated to our
tangible assets and a lesser portion allocated to our intangible assets. The IRS may challenge our
valuation methods, or our allocation of the Section 743(b) adjustment attributable to our tangible
and intangible assets, and allocations of taxable income, gain, loss and deduction between our
general partner and certain of our unitholders.
A successful IRS challenge to these methods or allocations could adversely affect the amount
of taxable income or loss being allocated to our unitholders. It also could affect the amount of
taxable gain from our unitholders’
sale of common units and could have a negative impact on the value of the common units or
result in audit adjustments to our unitholders’ tax returns without the benefit of additional
deductions.
The sale or exchange of 50% or more of our capital and profits interests during any twelve-month
period will result in the termination of our partnership for federal income tax purposes.
We will be considered to have technically terminated our partnership for federal income tax
purposes if there is a sale or exchange of 50% or more of the total interests in our capital and
profits within a twelve-month period. For purposes of determining whether the 50% threshold has
been met, multiple sales of the same interest will be counted only once. Our technical termination
would, among other things, result in the closing of our taxable year for all unitholders, which
would result in us filing two tax returns (and our unitholders could receive two Schedules K-1 if
relief was not available, as described below) for one fiscal year and could result in a deferral of
depreciation deductions allowable in computing our taxable income. In the case of a unitholder
reporting on a taxable year other than a fiscal year ending December 31, the closing of our taxable
year may also result in more than twelve months of our taxable income or loss being includable in
his taxable income for the year of termination. Our termination currently would not affect our
classification as a partnership for federal income tax purposes, but instead we would be treated as
a new partnership for tax purposes. If treated as a new partnership, we must make new tax
elections and could be subject to penalties if we are unable to determine that a termination
occurred. The IRS has recently announced a publicly traded partnership technical termination
relief program whereby, if a publicly traded partnership that technically terminated requests
publicly traded partnership technical termination relief and such relief is granted by the IRS,
among other things, the partnership will only have to provide one Schedule K-1 to unitholders for
the year notwithstanding two partnership tax years.
As a result of investing in our common units, you may become subject to state and local taxes and
return filing requirements in jurisdictions where we operate or own or acquire properties.
In addition to federal income taxes, our unitholders will likely be subject to other taxes,
including state and local taxes, unincorporated business taxes and estate, inheritance or
intangible taxes that are imposed by the various jurisdictions in which we conduct business or
control property now or in the future, even if they do not live in any of those jurisdictions. Our
unitholders will likely be required to file state and local income tax returns and pay state and
local income taxes in some or all of these various jurisdictions. Further, our unitholders may be
subject to penalties for failure to comply with those requirements. We conduct business in
Indiana, Kentucky, Ohio, Pennsylvania and West Virginia. Each of these states currently imposes a
personal income tax on individuals. As we make acquisitions or expand our business, we may control
assets or conduct business in additional states that impose a personal income tax. It is your
responsibility to file all U.S. federal, state and local tax returns. Our counsel has not rendered
an opinion on the state or local tax consequences of an investment in our common units.
|
|
|
| ITEM 1B. |
|
UNRESOLVED STAFF COMMENTS |
None.
42
Mining Operations
See “Item 1. Business — Mining Operations” for specific information about our mining
operations.
Coal Reserves
The estimates of our proven and probable reserves associated with our surface mining
operations in Northern Appalachia are derived from our internal estimates, which estimates were
audited by John T. Boyd Company, an independent mining and geological consulting firm. The
estimates of our proven and probable reserves associated with our surface mining operations in the
Illinois Basin and our proven and probable underground coal reserves are derived from reserve
reports prepared by John T. Boyd Company. These estimates are based on geologic data, economic
data such as cost of production and projected sale prices and assumptions concerning permitability
and advances in mining technology. Our coal reserves are reported as “recoverable coal reserves,”
which is the portion of the coal that could be economically and legally extracted or produced at
the time of the reserve determination, taking into account mining
recovery and preparation plant yield. These estimates are periodically updated to reflect
past coal production, new drilling information and other geologic or mining data. Acquisitions or
dispositions of coal properties will also change these estimates. Changes in mining methods may
increase or decrease the recovery basis for a coal seam, as will changes in preparation plant
processes. We maintain reserve information in secure computerized databases, as well as in hard
copy. The ability to update or modify the estimates of our coal reserves is restricted to our
engineering group and the modifications are documented.
As of December 31, 2010, all of our proven and probable coal reserves were “assigned”
reserves, which are coal reserves that can be mined without a significant capital expenditure for
mine development.
As of December 31, 2010, we owned 19% of our coal reserves and leased 81% of our coal reserves
from various third-party landowners. The majority of our leases have terms denominated in years
and we believe that the term of years will allow the recoverable coal reserves to be fully
extracted in accordance with our projected mining plan. Some of our leases have an initial term
denominated in years but also provide for the term of the lease to continue until exhaustion of the
“mineable and merchantable” coal in the lease area so long as we comply with the terms of the
lease.
It generally takes us from 12 to 30 months to obtain a SMCRA permit. Permits are issued for
an initial five year term and must be renewed if mining is to continue after the end of the term.
We submit and obtain new mining permits on a continuing basis to replace existing permits as they
are depleted. Based on our current surface mining plan, we have proven and probable coal reserves
with active permits that will allow us to mine for approximately the next three years. Given the
current permitting environment, we intend to continually address the timing of our permitting
process in such a way as to as much as possible avoid any material delays in obtaining or renewing
permits on our remaining coal reserves associated with our mining operations.
43
The following table provides information as of December 31, 2010 on the location of our
operations and the amount and ownership of our coal reserves:
| |
|
|
|
|
|
|
|
|
|
|
|
|
| |
|
Total Tons of Proven and |
|
| |
|
Probable Coal Reserves(1) |
|
| Mining Complex |
|
Total |
|
|
Owned |
|
|
Leased |
|
| |
|
(in million tons) |
|
Surface Mining Operations: |
|
|
|
|
|
|
|
|
|
|
|
|
Northern Appalachia (principally Ohio) |
|
|
|
|
|
|
|
|
|
|
|
|
Cadiz |
|
|
10.9 |
|
|
|
6.5 |
|
|
|
4.4 |
|
Tuscarawas County |
|
|
7.6 |
|
|
|
0.1 |
|
|
|
7.5 |
|
Plainfield |
|
|
6.4 |
|
|
|
0.8 |
|
|
|
5.6 |
|
Belmont County |
|
|
6.2 |
|
|
|
1.6 |
|
|
|
4.6 |
|
New Lexington |
|
|
5.7 |
|
|
|
3.7 |
|
|
|
2.0 |
|
Harrison(2) |
|
|
5.1 |
|
|
|
5.1 |
|
|
|
— |
|
Noble County |
|
|
2.7 |
|
|
|
— |
|
|
|
2.7 |
|
|
|
|
|
|
|
|
|
|
|
Total Northern Appalachia |
|
|
44.6 |
|
|
|
17.8 |
|
|
|
26.8 |
|
|
|
|
|
|
|
|
|
|
|
|
|
|
|
|
|
|
|
|
|
|
|
|
Illinois Basin (Kentucky) |
|
|
|
|
|
|
|
|
|
|
|
|
Muhlenberg County |
|
|
23.5 |
|
|
|
— |
|
|
|
23.5 |
|
|
|
|
|
|
|
|
|
|
|
Total Illinois Basin |
|
|
23.5 |
|
|
|
— |
|
|
|
23.5 |
|
|
|
|
|
|
|
|
|
|
|
|
|
|
|
|
|
|
|
|
|
|
|
|
Total Surface Mining Operations |
|
|
68.1 |
|
|
|
17.8 |
|
|
|
50.3 |
|
|
|
|
|
|
|
|
|
|
|
| |
Underground Coal Reserves: |
|
|
|
|
|
|
|
|
|
|
|
|
Tusky |
|
|
25.4 |
|
|
|
— |
|
|
|
25.4 |
|
|
|
|
|
|
|
|
|
|
|
Total Underground Coal Reserves |
|
|
25.4 |
|
|
|
— |
|
|
|
25.4 |
|
|
|
|
|
|
|
|
|
|
|
Total |
|
|
93.5 |
|
|
|
17.8 |
|
|
|
75.7 |
|
|
|
|
|
|
|
|
|
|
|
|
|
|
|
|
|
|
|
|
|
|
|
|
Percentage of Total |
|
|
100.0 |
% |
|
|
19.0 |
% |
|
|
81.0 |
% |
|
|
|
|
|
|
|
|
|
|
| |
|
|
| (1) |
|
Reported as recoverable coal reserves. All proven and probable coal reserves
are “assigned” coal reserves, which are coal reserves that can be mined without a significant
capital expenditure for mine development. |
| |
| (2) |
|
The Harrison mining complex is owned by Harrison Resources. We own 51.0% of
Harrison Resources and CONSOL Energy Inc. owns the remaining 49.0% of Harrison Resources
through one of its subsidiaries. Because the results of operations of Harrison Resources are
included in our consolidated financial statements for the year ended December 31, 2010 as
required by GAAP, proven and probable coal reserves attributable to the Harrison mining
complex are presented on a gross basis assuming we owned 100.0% of Harrison Resources. |
44
The following table provides information on particular characteristics of our coal
reserves as of December 31, 2010:
| |
|
|
|
|
|
|
|
|
|
|
|
|
|
|
|
|
|
|
|
|
|
|
|
|
|
|
|
|
|
|
|
|
| |
|
As Received Basis(1) |
|
|
|
|
| |
|
|
|
|
|
|
|
|
|
|
|
|
|
# of |
|
|
Proven and Probable Coal Reserves |
|
| |
|
|
|
|
|
|
|
|
|
|
|
|
|
SO2/mm |
|
|
Sulfur Content(1) |
|
| Mining Complex |
|
% Ash |
|
|
% Sulfur |
|
|
Btu/lb. |
|
|
Btu |
|
|
Total |
|
|
<2% |
|
|
2-4% |
|
|
>4% |
|
| |
|
|
|
|
|
|
|
|
|
|
|
|
|
|
|
|
|
(tons in millions) |
|
Surface Mining Operations: |
|
|
|
|
|
|
|
|
|
|
|
|
|
|
|
|
|
|
|
|
|
|
|
|
|
|
|
|
|
|
|
|
Northern Appalachia (principally Ohio) |
|
|
|
|
|
|
|
|
|
|
|
|
|
|
|
|
|
|
|
|
|
|
|
|
|
|
|
|
|
|
|
|
Cadiz |
|
|
11.9 |
|
|
|
3.4 |
|
|
|
11,500 |
|
|
|
6.0 |
|
|
|
10.9 |
|
|
|
0.9 |
|
|
|
5.0 |
|
|
|
5.0 |
|
Tuscarawas County |
|
|
10.6 |
|
|
|
3.9 |
|
|
|
11,670 |
|
|
|
6.6 |
|
|
|
7.6 |
|
|
|
1.2 |
|
|
|
2.9 |
|
|
|
3.5 |
|
Plainfield |
|
|
10.5 |
|
|
|
4.4 |
|
|
|
11,460 |
|
|
|
7.7 |
|
|
|
6.4 |
|
|
|
— |
|
|
|
0.8 |
|
|
|
5.6 |
|
Belmont County |
|
|
12.9 |
|
|
|
3.8 |
|
|
|
11,620 |
|
|
|
6.6 |
|
|
|
6.2 |
|
|
|
— |
|
|
|
3.7 |
|
|
|
2.5 |
|
New Lexington |
|
|
11.6 |
|
|
|
3.9 |
|
|
|
11,550 |
|
|
|
6.8 |
|
|
|
5.7 |
|
|
|
— |
|
|
|
2.9 |
|
|
|
2.8 |
|
Harrison(2) |
|
|
12.1 |
|
|
|
1.8 |
|
|
|
12,000 |
|
|
|
3.1 |
|
|
|
5.1 |
|
|
|
3.6 |
|
|
|
1.5 |
|
|
|
— |
|
Noble County |
|
|
12.1 |
|
|
|
4.7 |
|
|
|
11,200 |
|
|
|
8.3 |
|
|
|
2.7 |
|
|
|
— |
|
|
|
0.4 |
|
|
|
2.3 |
|
Illinois Basin (Kentucky) |
|
|
|
|
|
|
|
|
|
|
|
|
|
|
|
|
|
|
|
|
|
|
|
|
|
|
|
|
|
|
|
|
Muhlenberg County |
|
|
10.9 |
|
|
|
3.6 |
|
|
|
11,309 |
|
|
|
6.4 |
|
|
|
23.5 |
|
|
|
— |
|
|
|
22.8 |
|
|
|
0.7 |
|
Underground Coal Reserves: |
|
|
|
|
|
|
|
|
|
|
|
|
|
|
|
|
|
|
|
|
|
|
|
|
|
|
|
|
|
|
|
|
Tusky |
|
|
5.4 |
|
|
|
2.1 |
|
|
|
12,910 |
|
|
|
3.3 |
|
|
|
25.4 |
|
|
|
3.8 |
|
|
|
21.6 |
|
|
|
— |
|
| |
|
|
| (1) |
|
As received represents an analysis of a sample as received at a laboratory
operated by a third party. |
| |
| (2) |
|
The Harrison mining complex is owned by Harrison Resources. We own 51.0% of
Harrison Resources and CONSOL Energy Inc. owns the remaining 49.0% of Harrison Resources
through one of its subsidiaries. Because the results of operations of Harrison Resources are
included in our consolidated financial statements for the year ended December 31, 2010 as
required by GAAP, proven and probable coal reserves attributable to the Harrison mining
complex are presented on a gross basis assuming we owned 100.0% of Harrison Resources. |
Office Facilities
We lease and own office space in Columbus, Ohio and Coshocton, Ohio, respectively, that is
used by our general partner’s executive and administrative employees. Our Columbus, Ohio office
space lease expires in 2015.
|
|
|
| ITEM 3. |
|
LEGAL PROCEEDINGS |
Although we are, from time to time, involved in litigation and claims arising out of our
operations in the normal course of business, we do not believe that we are a party to any
litigation that could have a material adverse impact on our financial condition or results of
operations. We are not aware of any significant legal or governmental proceedings against us, or
contemplated to be brought against us. We maintain such insurance policies with insurers in
amounts and with coverage and deductibles as our general partner believes are reasonable and
prudent. However, we cannot assure you that this insurance will be adequate to protect us from all
material expenses related to potential future claims for personal and property damage or that these
levels of insurance will be available in the future at economical prices.
45
PART II
|
|
|
| ITEM 5. |
|
MARKET FOR REGISTRANT’S COMMON EQUITY, RELATED UNITHOLDER MATTERS AND ISSUER PURCHASES OF
EQUITY SECURITIES |
Our common units are listed on the NYSE under the symbol “OXF” and began trading on July 14,
2010 on a “when-issued” basis. Prior to July 14, 2010, our common units were not listed on any
exchange or traded in any public market. On March 14, 2011, the closing market price for the
common units was $25.90 per unit. As of March 14, 2011, there were 10,341,416 common units
outstanding. There were approximately 49 record holders of common units on December 31, 2010.
This number does not include unitholders whose units are held in trust by other entities. The
actual number of unitholders is greater than the number of holders of record.
The following table sets forth, for each period indicated, the high and low sales prices per
common unit, as reported on the NYSE, and the cash distributions declared and paid per common unit
for each quarter since our initial public offering:
| |
|
|
|
|
|
|
|
|
|
|
|
|
| |
|
High |
|
|
Low |
|
|
|
|
| Period |
|
Price |
|
|
Price |
|
|
Distributions Declared Per Unit |
|
Quarter ended September 30, 2010 |
|
$ |
19.80 |
|
|
$ |
16.44 |
|
|
$ |
0.3519 |
|
Quarter ended December 31, 2010 |
|
$ |
24.93 |
|
|
$ |
19.36 |
|
|
$ |
0.4375 |
|
We have also issued 10,280,380 subordinated units and 420,853 general partner units, for which
there is no established public trading market. All of the subordinated units and general partner
units are held by affiliates of our general partner. The affiliates of our general partner receive
quarterly distributions on the subordinated units only after sufficient distributions have been
paid to the common units.
Cash Distribution Policy
Our partnership agreement requires that we distribute all of our available cash quarterly.
Under our partnership agreement, available cash is generally defined to mean, for each quarter,
cash generated from our business in excess of the amount of cash reserves established by our
general partner to provide for the conduct of our business, to comply with applicable law, any of
our debt instruments or other agreements or to provide for future distributions to our unitholders
for any one or more of the next four quarters. Our available cash may also include, if our general
partner so determines, all or any portion of the cash on hand on the date of determination of
available cash for the quarter resulting from working capital borrowings made subsequent to the end
of such quarter. Working capital borrowings are generally borrowings that are made under a credit
facility, commercial paper facility or similar financing arrangement that are used solely to pay
distributions to unitholders.
Our partnership agreement provides that, during a period of time referred to as the
“subordination period,” the common units will have the right to receive distributions of available
cash from operating surplus each quarter in an amount equal to $0.4375 per common unit, which
amount is defined in our partnership agreement as the minimum quarterly distribution, plus any
arrearages in the payment of the minimum quarterly distribution on the common units from prior
quarters, before any distributions of available cash from operating surplus may be made on the
subordinated units. Furthermore, no arrearages will be paid on the subordinated units. The
practical effect of the subordinated units is to increase the likelihood that during the
subordination period there will be available cash to be distributed on the common units.
The subordination period will end on the first business day after we have earned and paid from
operating surplus generated in the applicable period at least (i) $1.75 (the minimum quarterly
distribution on an annualized basis) on each outstanding common and subordinated unit and the
corresponding distribution on our general partner units for each of three consecutive,
non-overlapping four quarter periods ending on or after September 30, 2013 or (ii) $0.65625 per
quarter (150.0% of the minimum quarterly distribution, which is $2.625 on an annualized basis) on
each outstanding common and subordinated unit and the corresponding distributions on our general
partner units for any four quarter period ending on or after September 30, 2011, in each case
provided there are no arrearages on our common units at that time. In addition, the subordination
period will end upon the removal of our general partner other than for cause if the units held by
our general partner and its affiliates are not voted in favor of such removal. When the
subordination period ends, each outstanding subordinated unit will convert into one common unit and
any existing
arrearages in payment of the minimum quarterly distribution on the common units will be
extinguished. All of our subordinated units are held by AIM Oxford and C&T Coal.
46
Our general partner is entitled to 2.0% of all quarterly distributions that we make prior to
our liquidation. This general partner interest is represented by 420,853 general partner units.
Our general partner also currently holds incentive distribution rights that entitle it to receive
increasing percentages, up to a maximum of 50.0%, of the cash we distribute from operating surplus
in excess of $0.5031 per unit per quarter. The maximum distribution of 50.0% includes
distributions paid to our general partner on its 2.0% general partner interest and assumes that our
general partner maintains its general partner interest at 2.0%. The maximum distribution of 50.0%
does not include any distributions that our general partner may receive on common units or
subordinated units that it owns. We did not pay our general partner any amounts with respect to
its incentive distribution rights in connection with distributions for 2010.
There is no guarantee that we will distribute quarterly cash distributions to our unitholders.
Our cash distribution policy is subject to restrictions on cash distributions under our credit
facility. Specifically, our credit facility contains financial tests and covenants that we must
satisfy before quarterly cash distributions can be paid. In addition, our ability to pay quarterly
cash distributions will be restricted if an event of default has occurred under our credit
facility. See “Item 7. Management’s Discussion and Analysis of Financial Condition and Results of
Operation — Liquidity and Capital Resources — Credit Facility.”
Our ability to pay quarterly cash distributions is also potentially restricted by the
operating agreement of Harrison Resources, our joint venture with CONSOL Energy. Pursuant to the
operating agreement, all members of Harrison Resources must approve cash distributions, other than
tax distributions, to its members. The members of Harrison Resources have consistently approved
cash distributions from Harrison Resources on a quarterly basis, including an aggregate of $5.9
million in distributions to us during 2010. In the future, however, there can be no assurance that
we will receive regular cash distributions from Harrison Resources.
Unregistered Sales of Equity Securities
From our formation in August 2007 until July 19, 2010, we issued 91,996 Class A common units
to our employees upon the vesting of phantom units granted under our long-term incentive plan.
These unit amounts do not reflect the unit split that was effected in connection with our initial
public offering. These transactions were exempt from registration under Section 4(2) of the
Securities Act of 1933 or Rule 701 pursuant to compensatory benefit plans and contracts related to
compensation.
Our general partner has the right to contribute a proportionate amount of capital to us to
maintain its 2.0% interest if we issue additional units. Pursuant to the exercise of this right,
on March 22 and 31, 2010, we received contributions of approximately $22,346 and $2,379,
respectively, from our general partner as consideration for the issuance to our general partner of
approximately 1,282 and 137 general partner units, respectively. These unit amounts do not reflect
the unit split that was effected in connection with our initial public offering. These
transactions were exempt from registration under Section 4(2) of the Securities Act of 1933.
On July 19, 2010, in connection with the closing of our initial public offering, our general
partner contributed 175,000 of our common units to us in exchange for 175,000 general partner units
in order to maintain its 2.0% general partnership interest in us. This transaction was exempt from
registration pursuant to Section 4(2) of the Securities Act of 1933, as amended.
On October 29, 2010, December 31, 2010 and January 31, 2011, we received contributions of
approximately $2,043, $20,194 and $5,349, respectively, from our general partner as consideration
for the issuance to our general partner of approximately 106, 920 and 220 general partner units,
respectively. These transactions were exempt from registration pursuant to Section 4(2) of the
Securities Act of 1933, as amended. Issuer Purchases of Equity Securities
No purchases of our common units were made by us or on our behalf during 2010.
Securities Authorized for Issuance Under Equity Compensation Plan
Please read the information in this Annual Report on Form 10-K under “Item 12. Security
Ownership of Certain Beneficial Owners and Management and Related Unitholder Matters,” which is
incorporated by reference into this Item 5.
47
|
|
|
| ITEM 6. |
|
SELECTED FINANCIAL AND OPERATING DATA |
The following table presents our selected financial and operating data, as well as that of our
accounting predecessor and wholly owned subsidiary, Oxford Mining Company, as of the dates and for
the periods indicated. The following table should be read in conjunction with “Item 7.
Management’s Discussion and Analysis of Financial Condition and Results of Operations.”
SELECTED FINANCIAL AND OPERATING DATA
| |
|
|
|
|
|
|
|
|
|
|
|
|
|
|
|
|
|
|
|
|
|
|
|
|
| |
|
Oxford Resource Partners, LP |
|
|
Oxford Mining Company |
|
| |
|
(Successor) |
|
|
(Predecessor) |
|
| |
|
|
|
|
|
|
|
|
|
|
|
|
|
Period from |
|
|
|
|
| |
|
|
|
|
|
|
|
|
|
|
|
|
|
August 24, |
|
|
January 1, |
|
|
Year |
|
| |
|
|
|
|
|
|
|
|
|
|
|
|
|
2007 to |
|
|
2007 to |
|
|
Ended |
|
| |
|
Years Ended December 31, |
|
|
December 31, |
|
|
August 23, |
|
|
December 31, |
|
| |
|
2010 |
|
|
2009 |
|
|
2008 |
|
|
2007 |
|
|
2007 |
|
|
2006 |
|
| |
|
(in thousands, except per ton amounts) |
|
Statement of Operations Data: |
|
|
|
|
|
|
|
|
|
|
|
|
|
|
|
|
|
|
|
|
|
|
|
|
Revenues: |
|
|
|
|
|
|
|
|
|
|
|
|
|
|
|
|
|
|
|
|
|
|
|
|
Coal sales |
|
$ |
311,567 |
|
|
$ |
254,171 |
|
|
$ |
193,699 |
|
|
$ |
61,324 |
|
|
$ |
96,799 |
|
|
$ |
141,440 |
|
Transportation revenue |
|
|
38,490 |
|
|
|
32,490 |
|
|
|
31,839 |
|
|
|
10,204 |
|
|
|
18,083 |
|
|
|
27,771 |
|
Royalty and non-coal revenue |
|
|
6,521 |
|
|
|
7,183 |
|
|
|
4,951 |
|
|
|
1,407 |
|
|
|
3,267 |
|
|
|
6,643 |
|
|
|
|
|
|
|
|
|
|
|
|
|
|
|
|
|
|
|
|
| |
Total revenues |
|
|
356,578 |
|
|
|
293,844 |
|
|
|
230,489 |
|
|
|
72,935 |
|
|
|
118,149 |
|
|
|
175,854 |
|
Costs and expenses: |
|
|
|
|
|
|
|
|
|
|
|
|
|
|
|
|
|
|
|
|
|
|
|
|
Cost of coal sales (excluding DD&A,
shown separately) |
|
|
229,468 |
|
|
|
170,698 |
|
|
|
151,421 |
|
|
|
40,721 |
|
|
|
70,415 |
|
|
|
106,657 |
|
Cost of purchased coal |
|
|
22,024 |
|
|
|
19,487 |
|
|
|
12,925 |
|
|
|
9,468 |
|
|
|
17,494 |
|
|
|
22,159 |
|
Cost of transportation |
|
|
38,490 |
|
|
|
32,490 |
|
|
|
31,839 |
|
|
|
10,204 |
|
|
|
18,083 |
|
|
|
27,771 |
|
Depreciation, depletion and amortization |
|
|
42,329 |
|
|
|
25,902 |
|
|
|
16,660 |
|
|
|
4,926 |
|
|
|
9,025 |
|
|
|
12,396 |
|
Selling, general and administrative expenses |
|
|
14,757 |
|
|
|
13,242 |
|
|
|
9,577 |
|
|
|
2,114 |
|
|
|
3,643 |
|
|
|
2,097 |
|
Contract termination and amendment
expenses, net |
|
|
652 |
|
|
|
— |
|
|
|
— |
|
|
|
— |
|
|
|
— |
|
|
|
— |
|
|
|
|
|
|
|
|
|
|
|
|
|
|
|
|
|
|
|
|
| |
Total costs and expenses |
|
|
347,720 |
|
|
|
261,819 |
|
|
|
222,422 |
|
|
|
67,433 |
|
|
|
118,660 |
|
|
|
171,080 |
|
|
|
|
|
|
|
|
|
|
|
|
|
|
|
|
|
|
|
|
| |
Income (loss) from operations |
|
|
8,858 |
|
|
|
32,025 |
|
|
|
8,067 |
|
|
|
5,502 |
|
|
|
(511 |
) |
|
|
4,774 |
|
Interest income |
|
|
12 |
|
|
|
35 |
|
|
|
62 |
|
|
|
55 |
|
|
|
26 |
|
|
|
30 |
|
Interest expense |
|
|
(9,511 |
) |
|
|
(6,484 |
) |
|
|
(7,720 |
) |
|
|
(3,498 |
) |
|
|
(2,386 |
) |
|
|
(3,672 |
) |
Gain on purchase of business(1) |
|
|
— |
|
|
|
3,823 |
|
|
|
— |
|
|
|
— |
|
|
|
— |
|
|
|
— |
|
|
|
|
|
|
|
|
|
|
|
|
|
|
|
|
|
|
|
|
| |
Net income (loss) |
|
|
(641 |
) |
|
|
29,399 |
|
|
|
409 |
|
|
|
2,059 |
|
|
|
(2,871 |
) |
|
|
1,132 |
|
Less: Net income attributable to
noncontrolling interest |
|
|
(6,710 |
) |
|
|
(5,895 |
) |
|
|
(2,891 |
) |
|
|
(537 |
) |
|
|
(682 |
) |
|
|
— |
|
|
|
|
|
|
|
|
|
|
|
|
|
|
|
|
|
|
|
|
| |
Net income (loss) attributable to Oxford
Resource Partners, LP unitholders |
|
$ |
(7,351 |
) |
|
$ |
23,504 |
|
|
$ |
(2,482 |
) |
|
$ |
1,522 |
|
|
$ |
(3,553 |
) |
|
$ |
1,132 |
|
|
|
|
|
|
|
|
|
|
|
|
|
|
|
|
|
|
|
|
Net income (loss) allocated to general partner |
|
$ |
(147 |
) |
|
$ |
467 |
|
|
$ |
(50 |
) |
|
$ |
30 |
|
|
|
n/a |
|
|
|
n/a |
|
|
|
|
|
|
|
|
|
|
|
|
|
|
|
|
|
|
|
|
Net income (loss) allocated to limited partner |
|
$ |
(7,204 |
) |
|
$ |
23,037 |
|
|
$ |
(2,432 |
) |
|
$ |
1,492 |
|
|
|
n/a |
|
|
|
n/a |
|
|
|
|
|
|
|
|
|
|
|
|
|
|
|
|
|
|
|
|
|
|
|
|
|
|
|
|
|
|
|
|
|
|
|
|
|
|
|
|
|
|
|
|
|
Net income (loss) per limited partner unit: |
|
|
|
|
|
|
|
|
|
|
|
|
|
|
|
|
|
|
|
|
|
|
|
|
Basic |
|
$ |
(0.45 |
) |
|
$ |
2.09 |
|
|
$ |
(0.24 |
) |
|
$ |
0.17 |
|
|
|
n/a |
|
|
|
n/a |
|
|
|
|
|
|
|
|
|
|
|
|
|
|
|
|
|
|
|
|
Diluted |
|
$ |
(0.45 |
) |
|
$ |
2.08 |
|
|
$ |
(0.24 |
) |
|
$ |
0.17 |
|
|
|
n/a |
|
|
|
n/a |
|
|
|
|
|
|
|
|
|
|
|
|
|
|
|
|
|
|
|
|
|
|
|
|
|
|
|
|
|
|
|
|
|
|
|
|
|
|
|
|
|
|
|
|
|
Weighted average number of limited partner
units outstanding: |
|
|
|
|
|
|
|
|
|
|
|
|
|
|
|
|
|
|
|
|
|
|
|
|
Basic |
|
|
15,887,977 |
|
|
|
11,033,840 |
|
|
|
10,104,324 |
|
|
|
8,922,801 |
|
|
|
n/a |
|
|
|
n/a |
|
|
|
|
|
|
|
|
|
|
|
|
|
|
|
|
|
|
|
|
Diluted |
|
|
15,887,977 |
|
|
|
11,083,170 |
|
|
|
10,104,324 |
|
|
|
8,926,360 |
|
|
|
n/a |
|
|
|
n/a |
|
|
|
|
|
|
|
|
|
|
|
|
|
|
|
|
|
|
|
|
Distributions paid per limited partner unit (2) |
|
$ |
0.58 |
|
|
$ |
1.20 |
|
|
$ |
1.26 |
|
|
$ |
— |
|
|
|
n/a |
|
|
|
n/a |
|
|
|
|
|
|
|
|
|
|
|
|
|
|
|
|
|
|
|
|
48
SELECTED FINANCIAL AND OPERATING DATA — (continued)
| |
|
|
|
|
|
|
|
|
|
|
|
|
|
|
|
|
|
|
|
|
|
|
|
|
| |
|
Oxford Resource Partners, LP |
|
|
Oxford Mining Company |
|
| |
|
(Successor) |
|
|
(Predecessor) |
|
| |
|
|
|
|
|
|
|
|
|
|
|
|
|
Period from |
|
|
|
|
| |
|
|
|
|
|
|
|
|
|
|
|
|
|
August 24, |
|
|
January 1, |
|
|
Year |
|
| |
|
|
|
|
|
|
|
|
|
|
|
|
|
2007 to |
|
|
2007 to |
|
|
Ended |
|
| |
|
Years Ended December 31, |
|
|
December 31, |
|
|
August 23, |
|
|
December 31, |
|
| |
|
2010 |
|
|
2009 |
|
|
2008 |
|
|
2007 |
|
|
2007 |
|
|
2006 |
|
| |
|
(in thousands, except per ton amounts) |
|
Statement of Cash Flows Data: |
|
|
|
|
|
|
|
|
|
|
|
|
|
|
|
|
|
|
|
|
|
|
|
|
Net cash provided by (used in): |
|
|
|
|
|
|
|
|
|
|
|
|
|
|
|
|
|
|
|
|
|
|
|
|
Operating activities |
|
$ |
37,997 |
|
|
$ |
38,637 |
|
|
$ |
33,992 |
|
|
$ |
(8,519 |
) |
|
$ |
17,634 |
|
|
$ |
16,236 |
|
Investing activities |
|
|
(82,623 |
) |
|
|
(49,171 |
) |
|
|
(23,942 |
) |
|
|
(98,745 |
) |
|
|
(16,619 |
) |
|
|
(13,547 |
) |
Financing activities |
|
|
42,149 |
|
|
|
(1,279 |
) |
|
|
4,494 |
|
|
|
106,724 |
|
|
|
(234 |
) |
|
|
(2,548 |
) |
|
|
|
|
|
|
|
|
|
|
|
|
|
|
|
|
|
|
|
|
|
|
|
|
|
Other Financial Data: |
|
|
|
|
|
|
|
|
|
|
|
|
|
|
|
|
|
|
|
|
|
|
|
|
Adjusted EBITDA (3) |
|
$ |
51,617 |
|
|
$ |
56,967 |
|
|
$ |
24,686 |
|
|
|
8,120 |
|
|
|
10,691 |
|
|
|
16,998 |
|
Distributable cash flow (4) (5) |
|
|
8,526 |
|
|
|
n/a |
|
|
|
n/a |
|
|
|
n/a |
|
|
|
n/a |
|
|
|
n/a |
|
Reserve replacement expenditures (6) |
|
|
3,353 |
|
|
|
3,057 |
|
|
|
2,526 |
|
|
|
163 |
|
|
|
1,297 |
|
|
|
3,881 |
|
Other maintenance capital expenditures (6) |
|
|
25,028 |
|
|
|
25,657 |
|
|
|
25,321 |
|
|
|
7,420 |
|
|
|
11,305 |
|
|
|
9,665 |
|
|
|
|
|
|
|
|
|
|
|
|
|
|
|
|
|
|
|
|
|
|
|
|
|
|
Balance Sheet Data (at period end): |
|
|
|
|
|
|
|
|
|
|
|
|
|
|
|
|
|
|
|
|
|
|
|
|
Cash and cash equivalents |
|
$ |
889 |
|
|
$ |
3,366 |
|
|
$ |
15,179 |
|
|
$ |
635 |
|
|
$ |
1,175 |
|
|
$ |
392 |
|
Trade accounts receivable |
|
|
28,108 |
|
|
|
24,403 |
|
|
|
21,528 |
|
|
|
17,547 |
|
|
|
18,396 |
|
|
|
16,826 |
|
Inventory |
|
|
12,640 |
|
|
|
8,801 |
|
|
|
5,134 |
|
|
|
4,655 |
|
|
|
4,824 |
|
|
|
3,977 |
|
Property, plant and equipment, net |
|
|
198,694 |
|
|
|
149,461 |
|
|
|
112,446 |
|
|
|
106,408 |
|
|
|
54,510 |
|
|
|
48,001 |
|
Total assets |
|
|
261,071 |
|
|
|
203,363 |
|
|
|
171,297 |
|
|
|
146,774 |
|
|
|
90,893 |
|
|
|
80,533 |
|
Total debt (current and long-term) |
|
|
102,986 |
|
|
|
95,711 |
|
|
|
83,977 |
|
|
|
75,529 |
|
|
|
43,165 |
|
|
|
43,697 |
|
|
|
|
|
|
|
|
|
|
|
|
|
|
|
|
|
|
|
|
|
|
|
|
|
|
Operating Data: |
|
|
|
|
|
|
|
|
|
|
|
|
|
|
|
|
|
|
|
|
|
|
|
|
Tons of coal produced (clean) |
|
|
7,470 |
|
|
|
5,846 |
|
|
|
5,089 |
|
|
|
1,634 |
|
|
|
2,693 |
|
|
|
3,913 |
|
Tons of coal purchased |
|
|
734 |
|
|
|
530 |
|
|
|
434 |
|
|
|
305 |
|
|
|
641 |
|
|
|
962 |
|
Tons of coal sold |
|
|
8,151 |
|
|
|
6,311 |
|
|
|
5,528 |
|
|
|
1,938 |
|
|
|
3,333 |
|
|
|
4,872 |
|
Tons sold under long-term contracts (7) |
|
|
95.9 |
% |
|
|
97.8 |
% |
|
|
93.8 |
% |
|
|
98.9 |
% |
|
|
96.6 |
% |
|
|
99.5 |
% |
Average sales price per ton (8) |
|
$ |
38.22 |
|
|
$ |
40.27 |
|
|
$ |
35.04 |
|
|
$ |
31.64 |
|
|
$ |
29.04 |
|
|
$ |
29.03 |
|
Cost of purchased coal sales per ton (9) |
|
$ |
30.00 |
|
|
$ |
36.79 |
|
|
$ |
29.81 |
|
|
$ |
31.08 |
|
|
$ |
27.29 |
|
|
$ |
23.03 |
|
Cost of coal sales per ton produced (10) |
|
$ |
30.94 |
|
|
$ |
29.52 |
|
|
$ |
29.81 |
|
|
$ |
24.93 |
|
|
$ |
26.16 |
|
|
$ |
27.27 |
|
Number of operating days — NAPP operations |
|
|
275.5 |
|
|
|
274.5 |
|
|
|
280.0 |
|
|
|
97.5 |
|
|
|
181.5 |
|
|
|
277.0 |
|
Number of operating days — ILB operations |
|
|
273.0 |
|
|
|
60.5 |
|
|
|
n/a |
|
|
|
n/a |
|
|
|
n/a |
|
|
|
n/a |
|
| |
|
|
| (1) |
|
On September 30, 2009, we acquired all of the active Illinois Basin surfacing
mining operations of Phoenix Coal. The purchase price of this acquisition was less than the
fair value of the net assets and liabilities we acquired. We recorded this difference as a
gain of $3.8 million for the year ended December 31, 2009. |
| |
| (2) |
|
Excludes amounts distributed as part of the initial public offering. |
| |
| (3) |
|
Adjusted EBITDA is not defined in GAAP. Adjusted EBITDA is presented because it is
helpful to management, industry analysts, investors, lenders and rating agencies in assessing
the financial performance and operating results of our fundamental business activities. For a
definition of adjusted EBITDA and a reconciliation of adjusted EBITDA to our net income (loss)
attributable to unitholders, please see
“Non-GAAP Financial Measures” in this Item 6. |
| |
| (4) |
|
Distributable cash flow is not defined in GAAP. Distributable cash flow is
presented because it is helpful to management, industry analysts, investors, lenders and
rating agencies in assessing our financial performance. For a definition of distributable
cash flow and a reconciliation of distributable cash flow to its most directly comparable
financial measures calculated and presented in accordance with GAAP, please see “Non-GAAP
Financial Measures” in this Item 6. |
| |
| (5) |
|
Represents our distributable cash flow for the second half of 2010 during which we
were a publicly traded partnership. We do not calculate distributable cash flow with respect
to periods prior thereto. |
| |
| (6) |
|
Maintenance capital expenditures are cash expenditures made to maintain or replace,
including over the long term, our operating capacity, asset base or operating income. Our
partnership agreement divides maintenance capital expenditures into two categories — reserve
replacement expenditures and other maintenance capital expenditures. Examples of reserve
replacement expenditures include cash expenditures for the purchase of fee interests in coal
reserves and cash expenditures for advance royalties with respect to the acquisition of
leasehold interests in coal reserves. Examples of other maintenance capital expenditures
include capital expenditures associated with the repair, refurbishment and replacement of
equipment and with mine development. Historically, we have not made a distinction between
maintenance capital expenditures and other capital expenditures. For purposes of this
presentation, however, we have evaluated our historical capital expenditures to estimate which
of them would have been classified as reserve replacement expenditures and which of them would
have been classified as other maintenance capital expenditures in accordance with our
partnership agreement at the time they were made. The amounts shown reflect our estimates
based on that evaluation. In 2010, we modified the definitions and calculations of reserve
replacement expenditures and other maintenance capital expenditures on a prospective basis resulting from
the amendment to our partnership agreement. Reserve replacement expenditures for 2010 are
estimated, while prior years are actual. Other maintenance capital expenditures for 2010
include asset retirement obligations and mine development costs, while prior years do not. |
49
| |
|
|
| (7) |
|
Represents the percentage of the tons of coal we sold that were delivered under long-term coal sales contracts. |
| |
| (8) |
|
Represents our coal sales divided by total tons of coal sold. |
| |
| (9) |
|
Represents the cost of purchased coal divided by the tons of coal purchased. |
| |
| (10) |
|
Represents our cost of coal sales (excluding depreciation, depletion and
amortization, or DD&A) divided by the tons of coal we produce. |
NON-GAAP FINANCIAL MEASURES
Adjusted EBITDA
Adjusted EBITDA for a period represents net income (loss) attributable to our unitholders for
that period before interest, taxes, DD&A, gain on purchase of business, contract termination and
amendment expenses, net, amortization of below-market coal sales contracts, non-cash equity-based
compensation expense, non-cash gain or loss on asset disposals and the non-cash change in future
asset retirement obligations (“ARO”). The non-cash change in future ARO is the portion of our
non-cash change in our future ARO that is included in reclamation expense in our financial
statements, and that portion represents the change over the applicable period in the value of our
ARO. Although adjusted EBITDA is not a measure of performance calculated in accordance with GAAP,
our management believes that it is useful in evaluating our financial performance and our
compliance with certain credit facility financial covenants. Because not all companies calculate
adjusted EBITDA identically, our calculation may not be comparable to the similarly titled measure
of other companies. Please read “— Reconciliation to GAAP Measures” below for a reconciliation of
net income (loss) attributable to our unitholders to adjusted EBITDA for each of the periods
indicated.
Adjusted EBITDA is used as a supplemental financial measure by management and by external
users of our financial statements, such as investors and lenders, to assess:
| |
• |
|
our financial performance without regard to financing methods, capital structure or
income taxes; |
| |
• |
|
our ability to generate cash sufficient to pay interest on our indebtedness and to
make distributions to our unitholders and our general partner; |
| |
• |
|
our compliance with certain credit facility financial covenants; and |
| |
| |
• |
|
our ability to fund capital expenditure projects from operating cash flow. |
Distributable Cash Flow
Distributable cash flow for a period represents adjusted EBITDA for that period, less cash
interest expense (net of interest income), estimated reserve replacement expenditures and other
maintenance capital expenditures. Cash interest expense represents the portion of our interest
expense accrued for the period that was paid in cash during the period or that we will pay in cash
in future periods. Estimated reserve replacement expenditures represent an estimate of the average
periodic (quarterly or annual, as applicable) reserve replacement expenditures that we will incur
over the long term as applied to the applicable period. We use estimated reserve replacement
expenditures to calculate distributable cash flow instead of actual reserve replacement
expenditures, consistent with our partnership agreement which requires that we deduct estimated
reserve replacement expenditures when calculating operating surplus. Other maintenance capital
expenditures include, among other things, actual expenditures for plant, equipment and mine
development and our estimate of the periodic expenditures that we will incur over the long term
relating to our ARO. Distributable cash flow should not be considered as an alternative to net
income (loss) attributable to our unitholders, income from operations, cash flows from operating
activities or any other measure of performance presented in accordance with GAAP. Although
distributable cash flow is not a measure of performance calculated in accordance with GAAP, our
management believes distributable cash flow is a useful measure to investors because this
measurement is used by many analysts and others in the industry as a performance measurement tool
to evaluate our operating and financial performance and to compare it with the performance of other
publicly traded limited partnerships. We also compare distributable cash flow to the cash
distributions we expect to pay our unitholders. Using this measure, management can quickly compute
the coverage ratio of distributable cash flow to planned cash distributions. Please read “—
Reconciliation to GAAP Measures” below for a reconciliation of net income (loss) attributable to
our unitholders to distributable cash flow for each of the periods indicated.
50
Reconciliation to GAAP Measures
The following table presents a reconciliation of net income (loss) attributable to unitholders
to adjusted EBITDA and distributable cash flow for each of the periods indicated:
| |
|
|
|
|
|
|
|
|
|
|
|
|
|
|
|
|
|
|
|
|
|
|
|
|
|
|
|
|
| |
|
Oxford Resource Partners, LP |
|
|
Oxford Mining |
|
| |
|
(Successor) |
|
|
(Predecessor) |
|
| |
|
|
|
|
|
|
|
|
|
|
|
|
|
|
|
|
|
Period |
|
|
Period |
|
|
|
|
| |
|
|
|
|
|
|
|
|
|
|
|
|
|
|
|
|
|
from |
|
|
from |
|
|
|
|
| |
|
|
|
|
|
Year |
|
|
Year |
|
|
Year |
|
|
August 24, |
|
|
January 1, |
|
|
Year |
|
| |
|
Second |
|
|
Ended |
|
|
Ended |
|
|
Ended |
|
|
2007 to |
|
|
2007 to |
|
|
Ended |
|
| |
|
Half of |
|
|
December 31, |
|
|
December 31, |
|
|
December 31, |
|
|
December 31, |
|
|
August 23, |
|
|
December 31, |
|
| |
|
2010 |
|
|
2010 |
|
|
2009 |
|
|
2008 |
|
|
2007 |
|
|
2007 |
|
|
2006 |
|
| |
|
(in thousands) |
|
Net income (loss) attributable to
Oxford
Resource Partners, LP unitholders |
|
$ |
(4,957 |
) |
|
$ |
(7,351 |
) |
|
$ |
23,504 |
|
|
$ |
(2,482 |
) |
|
$ |
1,522 |
|
|
$ |
(3,553 |
) |
|
$ |
1,132 |
|
PLUS: |
|
|
|
|
|
|
|
|
|
|
|
|
|
|
|
|
|
|
|
|
|
|
|
|
|
|
|
|
Interest expense,
net of interest income |
|
|
5,634 |
|
|
|
9,499 |
|
|
|
6,449 |
|
|
|
7,658 |
|
|
|
3,443 |
|
|
|
2,360 |
|
|
|
3,642 |
|
Depreciation, depletion and
amortization |
|
|
23,997 |
|
|
|
42,329 |
|
|
|
25,902 |
|
|
|
16,660 |
|
|
|
4,926 |
|
|
|
9,025 |
|
|
|
12,396 |
|
Contract termination and
amendment expenses, net |
|
|
652 |
|
|
|
652 |
|
|
|
— |
|
|
|
— |
|
|
|
— |
|
|
|
— |
|
|
|
— |
|
Non-cash equity compensation expense |
|
|
486 |
|
|
|
942 |
|
|
|
472 |
|
|
|
468 |
|
|
|
25 |
|
|
|
— |
|
|
|
— |
|
Non-cash (gain) loss on asset
disposals |
|
|
776 |
|
|
|
1,228 |
|
|
|
1,177 |
|
|
|
(1,407 |
) |
|
|
(8 |
) |
|
|
(25 |
) |
|
|
8 |
|
Change in fair value of future asset
retirement obligations |
|
|
3,198 |
|
|
|
5,742 |
|
|
|
4,991 |
|
|
|
4,560 |
|
|
|
167 |
|
|
|
2,884 |
|
|
|
(180 |
) |
LESS: |
|
|
|
|
|
|
|
|
|
|
|
|
|
|
|
|
|
|
|
|
|
|
|
|
|
|
|
|
Gain on purchase of business |
|
|
— |
|
|
|
— |
|
|
|
3,823 |
|
|
|
— |
|
|
|
— |
|
|
|
— |
|
|
|
— |
|
Amortization of below-market coal
sales contracts |
|
|
399 |
|
|
|
1,424 |
|
|
|
1,705 |
|
|
|
771 |
|
|
|
1,955 |
|
|
|
— |
|
|
|
— |
|
|
|
|
|
|
|
|
|
|
|
|
|
|
|
|
|
|
|
|
|
|
|
Adjusted EBITDA(1) |
|
|
29,387 |
|
|
$ |
51,617 |
|
|
$ |
56,967 |
|
|
$ |
24,686 |
|
|
$ |
8,120 |
|
|
$ |
10,691 |
|
|
$ |
16,998 |
|
|
|
|
|
|
|
|
|
|
|
|
|
|
|
|
|
|
|
|
|
|
|
LESS: |
|
|
|
|
|
|
|
|
|
|
|
|
|
|
|
|
|
|
|
|
|
|
|
|
|
|
|
|
Cash interest expense, net of
interest income |
|
|
3,531 |
|
|
|
|
|
|
|
|
|
|
|
|
|
|
|
|
|
|
|
|
|
|
|
|
|
Estimated reserve replacement
expenditures |
|
|
2,635 |
|
|
|
|
|
|
|
|
|
|
|
|
|
|
|
|
|
|
|
|
|
|
|
|
|
Other maintenance capital
expenditures |
|
|
14,695 |
|
|
|
|
|
|
|
|
|
|
|
|
|
|
|
|
|
|
|
|
|
|
|
|
|
|
|
|
|
|
|
|
|
|
|
|
|
|
|
|
|
|
|
|
|
|
|
|
|
|
|
|
|
|
|
|
|
|
|
|
|
|
|
|
|
|
|
|
|
|
|
|
|
|
|
|
|
|
|
|
|
|
Distributable cash flow(1) |
|
$ |
8,526 |
|
|
|
|
|
|
|
|
|
|
|
|
|
|
|
|
|
|
|
|
|
|
|
|
|
|
|
|
|
|
|
|
|
|
|
|
|
|
|
|
|
|
|
|
|
|
|
|
|
|
|
|
|
| |
|
|
| (1) |
|
The calculation of adjusted EBITDA and distributable cash flow as presented in our quarterly filing for the period ended September 30, 2010
was modified, and such changes are reflected herein, to conform to the current definition of these non-GAAP financial measures. We do not calculate distributable cash flow with respect to periods beginning prior to the second half of 2010 during which we were a publicly traded partnership. |
51
|
|
|
| ITEM 7. |
|
MANAGEMENT’S DISCUSSION AND ANALYSIS OF FINANCIAL CONDITION AND RESULTS OF OPERATIONS |
The following discussion and analysis of our financial condition and results of operations
should be read in conjunction with the consolidated financial statements and notes thereto included
elsewhere in this Annual Report on Form 10-K. This discussion contains forward-looking statements
that reflect management’s current views with respect to future events and financial performance.
Our actual results may differ materially from those anticipated in these forward-looking statements
or as a result of certain factors such as those set forth under “Cautionary Statement About
Forward-Looking Statements.”
Overview
We are a low cost producer of high value steam coal, and we are the largest producer of
surface mined coal in Ohio. We focus on acquiring steam coal reserves that we can efficiently mine
with our modern, large scale equipment. Our reserves and operations are strategically located in
Northern Appalachia and the Illinois Basin to serve our primary market area of Illinois, Indiana,
Kentucky, Ohio, Pennsylvania and West Virginia.
We operate in a single business segment and have three operating subsidiaries, Oxford Mining
Company, LLC, Oxford Mining Company — Kentucky, LLC and Harrison Resources, LLC. All of our
operating subsidiaries participate in the business of utilizing surface mining techniques to mine
domestic coal and prepare it for sale to our customers.
We currently have 21 active surface mines, two of which became active mines in 2011, that are
managed as eight mining complexes. Our operations also include two river terminals, strategically
located in eastern Ohio and western Kentucky. During 2010, we produced 7.5 million tons of coal
and sold 8.1 million tons of coal, including 0.7 million tons of purchased coal. As a result, our
coal inventory on hand increased by approximately 0.1 million tons. We purchase coal in the open
market and under contracts to satisfy a portion of our sales commitments. During 2010, we produced
1.7 million tons of coal from the Illinois Basin reserves we acquired from Phoenix Coal on
September 30, 2009. As is customary in the coal industry, we have entered into long-term coal
sales contracts with many of our customers. We define long-term coal sales contracts as coal sales
contracts having initial terms of one year or more.
On July 19, 2010, we closed our initial public offering of common units. After deducting
underwriting discounts and commissions of approximately $10.5 million paid to the underwriters, our
offering expenses of approximately $6.1 million and a structuring fee of approximately $0.8
million, the net proceeds from our initial public offering were approximately $144.5 million. We
used all of the net proceeds from our initial public offering for the uses described in the
prospectus for our initial public offering.
In connection with our initial public offering, we paid off the amounts outstanding under a
$115 million credit facility evidenced by a credit agreement with a syndicate of lenders, for which
FirstLight Funding I, Ltd. acted as Administrative Agent (our “$115 million credit facility” or our
“prior $115 million credit facility”), and entered into a new $175 million credit facility
evidenced by a credit agreement with Citicorp USA, Inc., as Administrative Agent, Citibank, N.A.,
as Swing Line Bank, Barclays Bank PLC and The Huntington National Bank, as Co-Syndication Agents,
Fifth Third Bank and Comerica Bank, as Co-Documentation Agents, and the lenders party thereto (our
“$175 million credit facility” or our “new $175 million credit facility”). Our $175 million credit
facility provides for a $60 million term loan and a $115 million revolving credit facility. As of
December 31, 2010, we had $90 million of borrowings outstanding under our $175 million credit
facility, consisting of term loan borrowings of $57 million and revolving credit facility
borrowings of $33 million.
Evaluating Our Results of Operations
We evaluate our results of operations based on several key measures:
| |
• |
|
our coal production, sales volume and average sales price, which drive our coal
sales; |
| |
• |
|
our cost of coal sales; |
| |
• |
|
our cost of purchased coal; |
| |
• |
|
our adjusted EBITDA, a non-GAAP financial measure; and |
| |
| |
• |
|
our distributable cash flow, a non-GAAP financial measure. |
52
Coal Production, Sales Volume and Sales Prices
We evaluate our operations based on the volume of coal we produce, the volume of coal we sell
and the prices we receive for our coal. These coal volumes are measured in clean tons, net of
refuse. Because we sell substantially all of our coal under long-term coal sales contracts, our
coal production, sales volume and sales prices are largely dependent upon the terms of those
contracts. The volume of coal we sell is also a function of the productive capacity of our mining
complexes, the amount of coal we purchase and changes in inventory levels. Please read “— Cost of
Purchased Coal” for more information regarding our purchased coal.
Our long-term coal sales contracts typically provide for a fixed price, or a schedule of
prices that are either fixed or contain market-based adjustments, over the contract term. In
addition, most of our long-term coal sales contracts have full or partial cost pass through or cost
adjustment provisions. Cost pass through provisions increase or decrease our coal sales price for
all or a specified percentage of changes in the costs for items such as fuel, explosives and labor.
Cost adjustment provisions adjust the initial contract price over the term of the contract either
by a specific percentage or a percentage determined by reference to various cost-related indices,
including cost-related indices for fuel, explosives, labor, equipment and cost-of-living generally.
We evaluate the price we receive for our coal on an average sales price per ton basis. Our
average sales price per ton represents our coal sales revenue divided by total tons of coal sold.
The following table provides operational data with respect to our coal production and purchases,
coal sales volume and average sales price per ton for the periods indicated:
| |
|
|
|
|
|
|
|
|
|
|
|
|
|
|
|
|
|
|
|
|
| |
|
|
|
|
|
|
|
|
|
|
|
|
|
% Change |
|
| |
|
|
|
|
|
|
|
|
|
|
|
|
|
2010 |
|
|
2009 |
|
| |
|
Years Ended December 31, |
|
|
vs. |
|
|
vs. |
|
| |
|
2010 |
|
|
2009 |
|
|
2008 |
|
|
2009 |
|
|
2008 |
|
| |
|
(tons in thousands) |
|
|
|
|
|
|
|
|
|
|
|
|
|
|
|
|
|
|
|
|
|
|
|
|
|
|
|
|
|
|
Tons of coal produced (clean) |
|
|
7,470 |
|
|
|
5,846 |
|
|
|
5,089 |
|
|
|
27.8 |
% |
|
|
14.9 |
% |
(Increase) decrease in inventory |
|
|
(53 |
) |
|
|
(65 |
) |
|
|
5 |
|
|
|
n/a |
|
|
|
n/a |
|
Tons of coal purchased |
|
|
734 |
|
|
|
530 |
|
|
|
434 |
|
|
|
38.5 |
% |
|
|
22.1 |
% |
Tons of coal sold |
|
|
8,151 |
|
|
|
6,311 |
|
|
|
5,528 |
|
|
|
29.2 |
% |
|
|
14.2 |
% |
Tons sold under long-term
contracts(1) |
|
|
95.9 |
% |
|
|
97.8 |
% |
|
|
93.8 |
% |
|
|
-1.9 |
% |
|
|
4.3 |
% |
Average sales price per ton |
|
$ |
38.22 |
|
|
$ |
40.27 |
|
|
$ |
35.04 |
|
|
|
-5.1 |
% |
|
|
14.9 |
% |
| |
|
|
| (1) |
|
Represents the percentage of the tons of coal we sold that were delivered under
long-term coal sales contracts. |
Cost of Coal Sales
We evaluate our cost of coal sales, which excludes the costs of purchased coal and
transportation, DD&A and any indirect costs such as selling, general and administrative expenses,
or SG&A expenses, on a cost per ton sold basis. Our cost of coal sales per ton sold represents our
cost of coal sales divided by the tons of coal we sold. Our cost of coal sales includes costs for
labor, fuel, oil, explosives, royalties, operating leases, repairs and maintenance and all other
costs that are directly related to our mining operations. Our cost of coal sales does not take
into account the effects of any of the cost pass through or cost adjustment provisions in our
long-term coal sales contracts, as those provisions result in an adjustment to our coal sales
price. The following table provides summary information for the periods indicated relating to our
cost of coal sales per ton and tons sold:
| |
|
|
|
|
|
|
|
|
|
|
|
|
|
|
|
|
|
|
|
|
| |
|
|
|
|
|
|
|
|
|
|
|
|
|
% Change |
|
| |
|
|
|
|
|
|
|
|
|
|
|
|
|
2010 |
|
|
2009 |
|
| |
|
Years Ended December 31, |
|
|
vs. |
|
|
vs. |
|
| |
|
2010 |
|
|
2009 |
|
|
2008 |
|
|
2009 |
|
|
2008 |
|
| |
|
(tons in thousands) |
|
|
|
|
|
|
|
|
|
|
|
|
|
|
|
|
|
|
|
|
|
|
|
|
|
|
|
|
|
|
Cost of coal sales per ton |
|
$ |
30.94 |
|
|
$ |
29.52 |
|
|
$ |
29.73 |
|
|
|
4.8 |
% |
|
|
-1.0 |
% |
Tons of coal produced
(clean) |
|
|
7,470 |
|
|
|
5,846 |
|
|
|
5,089 |
|
|
|
27.8 |
% |
|
|
14.9 |
% |
53
Cost of Purchased Coal
We purchase coal from third parties to fulfill a small portion of our obligations under our
long-term coal sales contracts and, in certain cases, to meet customer specifications. In
connection with our acquisition of Illinois Basin assets from Phoenix Coal, we assumed a long-term
coal purchase contract that had favorable pricing terms relative to our production costs. Under
this contract we are obligated to purchase 0.4 million tons of coal each year until the coal
reserves covered by this contract are depleted. Based on an estimate of the proven and probable
coal reserves in place at December 31, 2010, we expect this contract to continue beyond five years.
We evaluate our cost of purchased coal on a per ton basis. For 2010, we sold 734,000 tons of
purchased coal. The following table provides summary information for the periods indicated for our
cost of purchased coal per ton and tons purchased:
| |
|
|
|
|
|
|
|
|
|
|
|
|
|
|
|
|
|
|
|
|
| |
|
|
|
|
|
|
|
|
|
|
|
|
|
% Change |
|
| |
|
|
|
|
|
|
|
|
|
|
|
|
|
2010 |
|
|
2009 |
|
| |
|
Years Ended December 31, |
|
|
vs. |
|
|
vs. |
|
| |
|
2010 |
|
|
2009 |
|
|
2008 |
|
|
2009 |
|
|
2008 |
|
| |
|
(tons in thousands) |
|
|
|
|
|
|
|
|
|
| |
Cost of purchased
coal per ton |
|
$ |
30.00 |
|
|
$ |
36.79 |
|
|
$ |
29.81 |
|
|
|
-18.5 |
% |
|
|
23.4 |
% |
Tons of coal purchased |
|
|
734 |
|
|
|
530 |
|
|
|
434 |
|
|
|
38.5 |
% |
|
|
22.1 |
% |
Adjusted EBITDA
For a definition of adjusted EBITDA and a reconciliation of our net income (loss) attributable to
unitholders to adjusted EBITDA, please see “Non-GAAP Financial Measures” in Item 6. Please also
read “— Summary” for a reconciliation of net income (loss) attributable to our unitholders to
adjusted EBITDA for the period indicated.
Distributable Cash Flow
For a definition of distributable cash flow and a reconciliation of our net income (loss)
attributable to unitholders to distributable cash flow, please see “Non-GAAP Financial Measures” in
Item 6. Please also read “— Summary” for a reconciliation of net income (loss) attributable to our
unitholders to distributable cash flow for the period indicated.
Factors That Impact Our Business
For the past three years over 90.0% of our coal sales were made under long-term coal sales
contracts and we intend to continue to enter into long-term coal sales contracts for substantially
all of our annual coal production. We believe our long-term coal sales contracts reduce our
exposure to fluctuations in the spot price for coal and provide us with a reliable and stable
revenue base. Our long-term coal sales contracts also allow us to partially mitigate our exposure
to rising costs to the extent those contracts have full or partial cost pass through or cost
adjustment provisions.
During 2010, we executed over $275 million in long-term coal sales contracts primarily having
an effect on sales beginning in 2012. These contracts, the majority of which were related to our
Illinois Basin operations, were executed at prices significantly higher than current levels. For
2011, 2012, 2013 and 2014, we currently have long-term coal sales contracts that represent 100%,
78%, 52% and 47%, respectively, of our 2011 estimated coal sales of 9.1 million tons. Two of our
long-term coal sales contracts with the same customer contain provisions that provide for price
re-openers. These price re-openers provide for market-based adjustments to the initial contract
price every three years. These long-term coal sales contracts will terminate in 2013 if we cannot
agree upon a market-based price with the applicable customer prior to the termination date. In
addition, we have one long-term coal sales contract that will terminate in 2014 if we cannot agree
upon a market-based price with the customer prior to the termination date. The coal tonnage which
is involved for these two customers through 2014 is 1.0 million tons annually for 2013 and 2014 and
0.4 million tons annually for 2014, respectively.
54
The current term of our long-term coal sales contract with AEP runs through 2012 but it can be
extended for two additional three-year terms if AEP gives us six months advance notice of its
election to extend the contract. For each extension term, we will negotiate with AEP to agree upon
a market-based price based on similar term contracts.
In addition, the contract contains substantial cost pass through and/or cost adjustment
provisions. If AEP elects to extend this contract, we will be committed to deliver an additional
2.0 million tons in 2013 and 2014, and our 2013 and 2014 coal sales under long-term coal sales
contracts, as a percentage of 2011 estimated coal sales, would increase to 74% and 69%,
respectively. We are currently in negotiations with AEP to extend our contract with them. The
mutual goal of the parties is to amend the contract to fix the term to run through 2018, establish
future pricing that is acceptable to both parties, and adjust the amounts of fixed and optional
coal tonnage covered by the contract. While the outcome of these negotiations is not certain at
this time, we believe that we will be able to achieve an extension that is on amended terms which
are beneficial to us and that furthers our long-term coal sales contract strategy.
The terms of our coal sales contracts result from competitive bidding and negotiations with
customers. As a result, the terms of these contracts vary by customer. However, most of our
long-term coal sales contracts have full or partial cost pass through provisions and/or cost
adjustment provisions. For 2011, 2012, 2013 and 2014, 81%, 96%, 100% and 91% of the coal,
respectively, that we have committed to deliver under our current long-term coal sales contracts
are subject to full or partial cost pass through provisions and/or cost adjustment provisions. Cost
pass through provisions increase or decrease our coal sales price for all or a specified percentage
of changes in the costs for such items as fuel, explosives and/or labor. Cost adjustment
provisions adjust the initial contract price over the term of the contract either by a specific
percentage or a percentage determined by reference to various cost-related indices.
A long-term coal sales contract may contain option provisions that give the customer the right
to elect to purchase additional tons of coal each month during the contract term at a fixed price
provided for in the contract. For example, upon 30 days advance notice, AEP may elect to purchase,
at the contract price in effect at the time for all other tons, an additional 25,000 tons of coal
each month under its long-term coal sales contract with us and, in addition, upon 90 days notice,
it may elect to purchase, at the contract price in effect at the time for all other tons, an
additional 200,000 tons of coal per half year. Our long-term coal sales contracts that provide for
these option tons typically require the customer to provide us with from one to three months
advance notice of an election to take these option tons. Because the price of these option tons is
fixed at the contract price in effect at the time for all other tons under the terms of the
contract, if our contract price is below market, we could be obligated to deliver additional coal
to those customers at a price that is below the market price for coal on the date the option is
exercised. For 2011, 2012, 2013 and 2014, we have outstanding option tons of 0.7 million, 0.9
million, 0.9 million and 1.2 million, respectively. If our customer does elect to receive these
option tons, we believe we will have the operating flexibility to meet these requirements through
increased production at our mining complexes.
We believe the other key factors that influence our business are: (i) demand for coal, (ii)
demand for electricity, (iii) economic conditions, (iv) the quantity and quality of coal available
from competitors, (v) competition for production of electricity from non-coal sources, (vi)
domestic air emission standards and the ability of coal-fired power plants to meet these standards,
(vii) legislative, regulatory and judicial developments, including delays, challenges to, and
difficulties in acquiring, maintaining or renewing necessary permits or mineral or surface rights,
(viii) market price fluctuations for sulfur dioxide emission allowances and (ix) our ability to
meet governmental financial security requirements associated with mining and reclamation
activities.
Results of Operations
Factors Affecting the Comparability of Our Results of Operations
The comparability of our results of operations is impacted by (i) the acquisition of Illinois
Basin assets from Phoenix Coal on September 30, 2009, (ii) an amendment to a long-term coal sales
contract with a major customer in December 2008 and (iii) the transactions relating to the closing
of our initial public offering and our $175 million credit facility in July 2010.
55
We acquired all of the active Illinois Basin surface mining operations of Phoenix Coal on
September 30, 2009. The financial results from this acquisition are included in our consolidated
financial statements for 2010. However, only three months of financial results from this
acquisition are included in our consolidated financial statements for 2009 and none of the
financial results from this acquisition are included in our consolidated financial statements for
2008.
In December 2008, we agreed with one of our major customers to amend a long-term coal sales
contract. As part of this amendment, we agreed to give this customer two additional three-year
term extension options with market-based price adjustments for each extension. In exchange, we received a substantial temporary
increase in the price per ton of coal for 2009 along with certain cost adjustment provisions for
the remaining term of the contract, which expires at the end of 2012 unless extended at the
customer’s election. This price increase contributed $13.3 million to revenue and adjusted EBITDA
for 2009.
In connection with the closing of our initial public offering and our $175 million credit
facility, we executed the following transactions, each of which had an impact on our results of
operations for 2010:
| |
• |
|
we terminated our $115 million credit facility (See Note 10 to our consolidated
financial statements included elsewhere in this Annual Report on Form 10-K under the
heading “Long-Term Debt”); |
| |
• |
|
we terminated our advisory services agreement with affiliates of AIM Oxford (See
Note 19 to our consolidated financial statements included elsewhere in this Annual
Report on Form 10-K under the heading “Related Party Transactions”); and |
| |
• |
|
we purchased $54.2 million of previously leased and additional major mining
equipment. |
56
Summary
The following table presents certain of our historical consolidated financial data for the
years indicated and contains both GAAP and non-GAAP financial measures:
| |
|
|
|
|
|
|
|
|
|
|
|
|
| |
|
Years Ended December 31, |
|
| |
|
2010 |
|
|
2009 |
|
|
2008 |
|
| |
|
(in thousands) |
|
| |
Statement of Operations Data: |
|
|
|
|
|
|
|
|
|
|
|
|
Revenues: |
|
|
|
|
|
|
|
|
|
|
|
|
Coal sales |
|
$ |
311,567 |
|
|
$ |
254,171 |
|
|
$ |
193,699 |
|
Transportation revenue |
|
|
38,490 |
|
|
|
32,490 |
|
|
|
31,839 |
|
Royalty and non-coal revenue |
|
|
6,521 |
|
|
|
7,183 |
|
|
|
4,951 |
|
|
|
|
|
|
|
|
|
|
|
Total revenues |
|
|
356,578 |
|
|
|
293,844 |
|
|
|
230,489 |
|
|
|
|
|
|
|
|
|
|
|
|
|
|
Costs and expenses: |
|
|
|
|
|
|
|
|
|
|
|
|
Cost of coal sales (excluding DD&A, shown
separately) |
|
|
229,468 |
|
|
|
170,698 |
|
|
|
151,421 |
|
Cost of purchased coal |
|
|
22,024 |
|
|
|
19,487 |
|
|
|
12,925 |
|
Cost of transportation |
|
|
38,490 |
|
|
|
32,490 |
|
|
|
31,839 |
|
Depreciation, depletion and amortization |
|
|
42,329 |
|
|
|
25,902 |
|
|
|
16,660 |
|
Selling, general and administrative expenses |
|
|
14,757 |
|
|
|
13,242 |
|
|
|
9,577 |
|
Contract termination and amendment expenses, net |
|
|
652 |
|
|
|
— |
|
|
|
— |
|
|
|
|
|
|
|
|
|
|
|
Total costs and expenses |
|
|
347,720 |
|
|
|
261,819 |
|
|
|
222,422 |
|
|
|
|
|
|
|
|
|
|
|
|
|
|
Income from operations |
|
|
8,858 |
|
|
|
32,025 |
|
|
|
8,067 |
|
Interest income |
|
|
12 |
|
|
|
35 |
|
|
|
62 |
|
Interest expense |
|
|
(9,511 |
) |
|
|
(6,484 |
) |
|
|
(7,720 |
) |
Gain on purchase of business (1) |
|
|
— |
|
|
|
3,823 |
|
|
|
— |
|
|
|
|
|
|
|
|
|
|
|
|
|
|
|
|
|
|
|
|
|
|
|
|
Net income (loss) |
|
|
(641 |
) |
|
|
29,399 |
|
|
|
409 |
|
Less: Net income (loss) attributable to noncontrolling interest |
|
|
(6,710 |
) |
|
|
(5,895 |
) |
|
|
(2,891 |
) |
|
|
|
|
|
|
|
|
|
|
|
|
|
|
|
|
|
|
|
|
|
|
|
Net income (loss) attributable to Oxford Resource
Partners, LP unitholders |
|
$ |
(7,351 |
) |
|
$ |
23,504 |
|
|
$ |
(2,482 |
) |
|
|
|
|
|
|
|
|
|
|
|
|
|
|
|
|
|
|
|
|
|
|
|
Other Financial Data: |
|
|
|
|
|
|
|
|
|
|
|
|
Adjusted EBITDA(2) |
|
$ |
51,617 |
|
|
$ |
56,967 |
|
|
$ |
24,686 |
|
|
|
|
|
|
|
|
|
|
|
| |
|
|
| (1) |
|
On September 30, 2009, we acquired all of the active Illinois Basin surface
mining operations of Phoenix Coal. The purchase price of this acquisition was less than the
fair value of the net assets and liabilities we acquired. We recorded this difference as a
gain of $3.8 million for the year ended December 31, 2009. |
| |
| (2) |
|
For our definition of adjusted EBITDA, which is a non-GAAP financial measure, and
for a reconciliation of this measure to our net income (loss) attributable to unitholders, please
see “Item 6: Selected Financial and Operating Data — Non-GAAP Financial Measures.” |
57
The following table presents a reconciliation of net income (loss) attributable to unitholders
to adjusted EBITDA for the years indicated:
Reconciliation of net income (loss) attributable to Oxford Resource
Partners, LP unitholders to adjusted EBITDA
| |
|
|
|
|
|
|
|
|
|
|
|
|
| |
|
Years Ended December 31, |
|
| |
|
2010 |
|
|
2009 |
|
|
2008 |
|
| |
|
(in thousands) |
|
Net Income (loss) attributable to Oxford
Resource Partners, LP unitholders |
|
$ |
(7,351 |
) |
|
$ |
23,504 |
|
|
$ |
(2,482 |
) |
|
|
|
|
|
|
|
|
|
|
|
|
|
PLUS: |
|
|
|
|
|
|
|
|
|
|
|
|
Interest expense, net of interest income |
|
|
9,499 |
|
|
|
6,449 |
|
|
|
7,658 |
|
Depreciation, depletion and amortization |
|
|
42,329 |
|
|
|
25,902 |
|
|
|
16,660 |
|
Contract termination and amendment expenses, net |
|
|
652 |
|
|
|
— |
|
|
|
— |
|
Non-cash equity-based compensation expense |
|
|
942 |
|
|
|
472 |
|
|
|
468 |
|
Non-cash (gain) loss on asset disposals |
|
|
1,228 |
|
|
|
1,177 |
|
|
|
(1,407 |
) |
Change in fair value of future asset retirement
obligations |
|
|
5,742 |
|
|
|
4,991 |
|
|
|
4,560 |
|
|
|
|
|
|
|
|
|
|
|
|
|
|
LESS: |
|
|
|
|
|
|
|
|
|
|
|
|
Gain on purchase of business |
|
|
— |
|
|
|
3,823 |
|
|
|
— |
|
Amortization of below-market coal
sales contracts |
|
|
1,424 |
|
|
|
1,705 |
|
|
|
771 |
|
|
|
|
|
|
|
|
|
|
|
|
|
|
|
|
|
|
|
|
|
|
|
|
Adjusted EBITDA (1) |
|
$ |
51,617 |
|
|
$ |
56,967 |
|
|
$ |
24,686 |
|
|
|
|
|
|
|
|
|
|
|
| |
|
|
| (1) |
|
For our definition of adjusted EBITDA, which is a non-GAAP financial measure, and
for a reconciliation of this measure to our net income (loss) attributable to unitholders, please
see “Item 6: Selected Financial and Operating Data — Non-GAAP Financial Measures.” |
58
The following table presents a reconciliation of net income (loss) attributable to unitholders to
adjusted EBITDA and distributable cash flow for the period indicated:
Reconciliation of net income (loss) attributable to Oxford Resource Partners, LP
unitholders to adjusted EBITDA and distributable cash flow
| |
|
|
|
|
| |
|
Second Half of |
|
| |
|
2010 |
|
| |
|
(in thousands) |
|
Net Income (loss) attributable to Oxford
Resource Partners, LP unitholders |
|
$ |
(4,957 |
) |
|
|
|
|
|
PLUS: |
|
|
|
|
Interest expense, net of interest income |
|
|
5,634 |
|
Depreciation, depletion and amortization |
|
|
23,997 |
|
Contract termination and amendment expenses, net |
|
|
652 |
|
Non-cash equity-based compensation expense |
|
|
486 |
|
Non-cash loss on asset disposals |
|
|
776 |
|
Change in fair value of future asset retirement obligations |
|
|
3,198 |
|
|
|
|
|
|
LESS: |
|
|
|
|
Amortization of below-market sales contracts |
|
|
(399 |
) |
|
|
|
|
|
|
|
|
|
Adjusted EBITDA (1) |
|
$ |
29,387 |
|
|
|
|
|
|
LESS: |
|
|
|
|
Cash interest expense, net of interest income |
|
|
(3,531 |
) |
Estimated reserve replacement expenditures |
|
|
(2,635 |
) |
Other maintenance capital expenditures |
|
|
(14,695 |
) |
|
|
|
|
|
|
|
|
|
Distributable cash flow (1) |
|
$ |
8,526 |
|
|
|
|
|
| |
|
|
| (1) |
|
The calculation of adjusted EBITDA and distributable cash flow as presented in our quarterly
filing for the period ended September 30, 2010 was modified, and such changes are reflected
herein, to conform to the current definition of these non-GAAP financial measures. We do not
calculate distributable cash flow with respect to periods beginning prior to the second half of
2010 during which we were a publicly traded partnership. |
Year Ended December 31, 2010 Compared to Year Ended December 31, 2009
Overview. For the year ended December 31, 2010, coal production increased 27.8% to 7.5 million
tons from 5.8 million tons in 2009. Our tons sold increased 29.2% to 8.1 million tons in 2010 from
6.3 million tons in 2009. During 2010, 96% of tons sold were under long-term coal sales contracts.
Total revenue for the year ended December 31, 2010 was $356.6 million compared to $293.8 million
for 2009. The full year 2010 net loss was $7.4 million, or $0.45 per diluted limited partner unit,
compared to the full year 2009 net income of $23.5 million, or $2.08 per diluted limited partner
unit. Net income in 2009 was positively impacted by a temporary price increase and a gain on
purchase of business of $13.3 million and $3.8 million, respectively. The 2010 net loss included
higher depreciation, depletion and amortization (DD&A) of $16.4 million, primarily due to the full
year impact of DD&A from our 2009 acquisition of Phoenix Coal’s active Illinois Basin surface
mining assets in western Kentucky and the partial year impact of DD&A from our purchase of
previously leased and additional major mining equipment using the proceeds from our initial public
offering and borrowings under our $175 million credit facility.
Additional factors affecting comparability for each year and their impact on our net income
(loss) are as follows:
Year Ended December 31, 2010
| |
• |
|
$13.3 million reduction in net income resulting from the expiration of a temporary
price increase with a major customer. |
| |
• |
|
$16.4 million increase in DD&A with $7.9 million of this amount resulting from the
full-year impact of the increase in DD&A associated with the Illinois Basin assets
acquired from Phoenix Coal and the remainder from the purchase of previously leased and
additional major mining equipment using proceeds from our initial public offering and
borrowings under our credit facility. |
59
Year Ended December 31, 2009
| |
• |
|
$13.3 million increase in net income resulting from a temporary price increase with
a major customer. |
| |
• |
|
$3.8 million increase in net income resulting from the gain on purchase of business
that resulted from the acquisition of Illinois Basin assets from Phoenix Coal. |
Coal Production. Our tons of coal produced increased 27.8% to 7.5 million tons in
2010 from 5.8 million tons in 2009. This increase was primarily due to a full year of coal
production of 1.7 million tons in 2010 as compared to 0.4 million tons in 2009 from our Muhlenberg
County complex in the Illinois Basin that we acquired on September 30, 2009, as well as a 6.8%
increase in production from our Northern Appalachia mining complexes. While overall coal
production increased, production was adversely affected by delays in receiving the Rose France
permit at our Muhlenberg County complex, adverse geological conditions at our Plainfield mine and
overall higher strip ratios.
Sales Volume. Our sales volume increased 29.2% to 8.1 million tons in 2010 from 6.3 million
tons in 2009. This increase was primarily attributable to the full year’s coal sales of 1.6
million tons from our Muhlenberg County complex in the Illinois Basin that we acquired on September
30, 2009.
Average Sales Price Per Ton. Our average sales price per ton decreased 5.1% to $38.22 in 2010
from $40.27 in 2009. The $2.05 per ton decrease was primarily attributable to the full-year impact
of the lower-priced coal sales contracts assumed in connection with our acquisition of Illinois
Basin assets on September 30, 2009 and the absence of the temporary price increase realized in
2009.
Coal Sales Revenue. Our coal sales revenue for 2010 increased by $57.4 million, or 22.6%,
compared to 2009. This increase was primarily attributable to a full year of coal sales of $74.3
million in 2010 as compared to $21.0 million in 2009 from our Muhlenberg County complex in the
Illinois Basin and higher coal sales volumes delivered to our major utility customers served by our
Northern Appalachia operations. Reducing the impact of the year-over-year increase was the
inclusion in 2009 of $13.3 million of revenue relating to the temporary price increase previously
discussed.
Royalty and Non-Coal Revenue. Our royalty and non-coal revenue includes our royalty revenue
from subleasing our underground coal reserves to a third party, revenue from the sale of limestone
that we recover in connection with our coal mining operations and various fees we receive for
performing related services for others. Our royalty and non-coal revenue decreased to $6.5 million
in 2010 from $7.2 million in 2009. This decrease was primarily attributable to a $1.7 million
temporary royalty reduction from our underground coal reserves that are subleased, as mining
occurred during a portion of 2010 on a small piece of property surrounded by our reserves that was
not subject to our royalty. In late September 2010, royalty-generating mining activity resumed on
our underground coal reserves. This decrease was partially offset by an increase of $1.0 million
in non-coal revenue.
Cost of Coal Sales (Excluding DD&A). Cost of coal sales (excluding DD&A) increased 34.4% to
$229.5 million in 2010 from $170.7 million in 2009. This increase was primarily attributable to
the increase of 27.8% in our tons produced, principally from our Muhlenberg County complex in the
Illinois Basin. Our average cost of coal sales per ton increased by 4.8% to $30.94 in 2010
compared to $29.52 in 2009. This increase resulted in part from higher operating costs due to the
delay of the Rose France mine permit, adverse geologic conditions at our Plainfield mine and higher
strip ratios, as well as higher repair and maintenance expenses.
Cost of Purchased Coal. Cost of purchased coal increased to $22.0 million in 2010 from $19.5
million in 2009. This increase was primarily attributable to higher volumes purchased under a
long-term coal purchase contract assumed in our acquisition of Illinois Basin assets. Our average
cost of purchased coal per ton decreased by 18.5% to $30.00 in 2010 due to a significant portion of
our purchases in 2010 being supplied under the long-term coal purchase contract compared to a high
percentage of higher-priced spot market purchases in 2009.
Depreciation, Depletion and Amortization (DD&A). DD&A expense in 2010 was $42.3 million
compared to $25.9 million in 2009, an increase of $16.4 million. Approximately $7.9 million of
this increase related to higher DD&A expense associated with the assets we acquired our acquisition
of Illinois Basin assets, and the remaining increase of $8.5 million related primarily to higher
depreciation on equipment placed in service in late 2009 and the depreciation on the previously
leased and additional major mining equipment that we purchased, all of which purchases were made
with proceeds from our initial public offering and borrowings under our $175 million credit
facility.
60
Selling, General and Administrative Expenses (SG&A). SG&A expenses for 2010 were $14.8
million compared to $13.2 million for 2009, an increase of $1.6 million. This increase was
primarily due to an increase of $1.0 million in public company expenses and $0.6 million of
additional administrative expenses for supporting our Muhlenberg County complex in the Illinois
Basin.
Contract Termination and Amendment Expenses, Net. Contract termination and amendment
expenses, net for 2010 were $0.7 million compared to zero for 2009. These expenses result from the
$2.5 million expense related to the termination of an advisory services agreement with certain
affiliates of AIM Oxford in connection with our initial public offering, partially offset by a $1.8
million reduction in a specific reserve for a below-market coal supply contract assumed in our
acquisition of Illinois Basin assets that was amended to reset the price to a market rate starting
in 2010.
Transportation Revenue and Expenses. Our transportation expenses represent the cost to
transport our coal by truck or rail from our mines to our river terminals, our rail loading
facilities and our customers. Our long-term coal sales contracts have these transportation costs
built into the price of our coal. Our transportation revenue reflects the portion of our total
revenues that is attributable to reimbursements for transportation expenses. Our transportation
revenue fluctuates based on a number of factors, including the volume of coal we transport by truck
or rail under those contracts and the related transportation costs. Our transportation revenue and
expenses for 2010 increased 18.5% compared to 2009 due to higher coal sales revenue.
Interest Expense. Interest expense for 2010 was $9.5 million compared to $6.5 million for
2009, an increase of $3.0 million. This increase was primarily due to an amendment to our prior
$115 million credit facility in September 2009 in connection with our acquisition of Illinois Basin
assets that resulted in higher borrowings outstanding and higher effective interest rates during
the first half of 2010. In addition, the non-cash mark-to-market adjustment for the interest rate
swap agreement increased interest expense by $1.8 million for 2010 compared to 2009.
Net Income Attributable to Noncontrolling Interest. In 2007, we entered into a joint venture,
Harrison Resources, with CONSOL Energy to mine surface coal reserves purchased from CONSOL Energy.
We own 51% of Harrison Resources and CONSOL Energy owns the remaining 49% indirectly through one of
its subsidiaries. We manage all of the operations of, and perform all of the contract mining and
marketing services for, Harrison Resources. Net income attributable to noncontrolling interest
relates to the 49% of Harrison Resources that we do not own. For 2010, the net income attributable
to noncontrolling interest was $6.7 million compared to $5.9 million for 2009. Net income
attributable to noncontrolling interest for 2009 included a non-recurring $0.9 million payment
received from a customer that terminated a long-term coal sales contract.
Adjusted EBITDA. Adjusted EBITDA for 2010 was $51.6 million versus $57.0 million for 2009.
Adjusted EBITDA for 2009 was positively impacted by the aforementioned $13.3 million temporary
price increase and a $3.8 million gain on the purchase of a business that resulted from the
acquisition of the Illinois Basin assets from Phoenix Coal.
Distributable Cash Flow. Our distributable cash flow for the last half of 2010 during which we
were a publicly traded partnership was $8.5 million. We do not calculate distributable cash flow
for periods prior to becoming a publicly traded partnership, so there was no comparable amount for
2009.
Year Ended December 31, 2009 Compared to Year Ended December 31, 2008
Overview. For the year ended December 31, 2009, coal production increased 14.9% to 5.8
million tons from 5.1 million tons in 2008. Our tons sold increased 14.2% to 6.3 million tons in
2009 from 5.5 million tons in 2008. During 2009, 98% of tons sold were under long-term coal sales
contracts. Total revenue for the year ended December 31, 2009 was $293.8 million compared to
$230.5 million for 2008. The full year 2009 net income was $23.5 million, or $2.08 per diluted
limited partner unit, compared to the full year 2008 net loss of $2.5 million, or $0.24 per diluted
limited partner unit. Our financial performance in 2009 reflected one quarter’s contribution from
the Illinois Basin assets that we acquired on September 30, 2009. Additionally, our 2009 results
related to our Northern Appalachia operations included a temporary price increase which positively
impacted our net income and adjusted EBITDA for 2009 by $13.3 million. Excluding the temporary
price increase, our results for 2009 would have included net income attributable to our unitholders
of $10.2 million and adjusted EBITDA of $43.7 million.
61
Coal Production. Our tons of coal produced increased 14.9% to 5.8 million tons in
2009 from 5.1 million tons in 2008. This increase was primarily the result of increased coal
production in the fourth quarter of 2009 of
0.4 million tons due to our acquisition of Illinois Basin assets and higher production at
certain of our Northern Appalachia mining complexes.
Sales Volume. Our sales volume increased 14.2% to 6.3 million tons in 2009 from 5.5 million
tons in 2008. The increase in the sales volume in 2009 was primarily attributable to the 0.6
million tons we sold during the fourth quarter of 2009 as a result of our acquisition of Illinois
Basin assets.
Average Sales Price Per Ton. Our average sales price per ton increased 14.9% to $40.27 in
2009 from $35.04 in 2008. This increase was primarily attributable to the amendment of a long-term
coal sales contract with a major customer in December 2008. As part of this amendment, we received
a temporary increase in the price per ton in 2009 which resulted in additional revenue of $13.3
million and increased our average sales price per ton by $2.10. Our financial results for 2009 also
included $2.1 million of contract buyout fees from a customer that had a $0.33 per ton favorable
impact on our average sales price for 2009.
Coal Sales Revenue. Our coal sales revenue for 2009 increased by $60.5 million, or 31.2%,
over 2008. The majority of the increase, or $33.5 million, was attributable to the 14.9%
improvement in our average sales price per ton for 2009 compared to 2008, of which $13.3 million
related to the temporary price increase in 2009 from a major customer. Approximately $21.0 million
of this increase was attributable to the increase in our tons sold resulting from of our
acquisition of Illinois Basin assets.
Royalty and Non-Coal Revenue. Our royalty and non-coal revenue increased to $7.2 million in
2009 from $5.0 million in 2008. This increase was primarily attributable to increases in our
royalty revenue from our underground coal reserves that we sublease of $3.2 million partially
offset by decreases in other revenue of $1.0 million.
Cost of Coal Sales (Excluding DD&A). Cost of coal sales (excluding DD&A) increased 12.7% in
2009 to $170.7 million from $151.4 million in 2008. This increase was primarily attributable to the
increase in our tons sold, partially offset by lower operating costs per ton. During 2009, our cost
of coal sales per ton decreased 1.0% primarily as a result of lower fuel, oil and explosives prices
partially offset by higher operating lease expenses and higher contract labor costs.
Cost of Purchased Coal. Cost of purchased coal increased 50.8% in 2009 to $19.5 million from
$12.9 million in 2008. This increase was primarily attributable to a $6.98 per ton increase in the
average cost of purchased coal per ton and a 0.1 million ton increase in the volume of purchased
coal during 2009 as compared to 2008. Our average cost of purchased coal per ton increased by 23.4%
to $36.79 per ton in 2009 from $29.81 per ton in 2008. This increase was due to higher quality coal
being purchased at higher prices in 2009 as opposed to 2008.
Depreciation, Depletion and Amortization. DD&A expense for 2009 was $25.9 million compared to
$16.7 million for 2008, an increase of $9.2 million. Depreciation expense attributable to equipment
upgrades that occurred during 2009 accounted for $6.6 million of this increase and the Illinois
Basin assets we acquired in 2009 accounted for $1.6 million of this increase. Depletion and
amortization increased during 2009 by approximately $1.0 million as a result of the 14.9% increase
in coal production.
Selling, General and Administrative Expenses. SG&A expenses for 2009 were $13.2 million
compared to $9.6 million for 2008, an increase of $3.6 million. The increase in SG&A expenses was
primarily due to increased headcount and expenses in our accounting and administrative departments
in anticipation of becoming a publicly traded partnership, as well as one-time costs of $1.6
million associated with our acquisition of Illinois Basin assets and $1.0 million of legal fees
incurred in renegotiating our prior $115 million credit facility.
Transportation Revenue and Expenses. The 2.0% increase in transportation revenue in 2009
compared to 2008 was a function of the increase in tons of coal sold partially offset by lower
trucking rates.
Interest Expense. Interest expense for 2009 was $6.5 million compared to $7.7 million for
2008, a decrease of $1.2 million, or 16.0%. The decrease in interest expense was primarily
attributable to lower effective weighted average interest rates in 2009 under our prior $115
million credit facility compared to 2008 and a gain of $1.7 million on our interest rate swap in
2009. These decreases were partially offset by an increase of $1.3 million in interest expense due
to the write-off of deferred financing costs associated with our prior $115 million credit facility
which was amended to accommodate our acquisition of Illinois Basin assets.
62
Gain on Purchase of Business. On September 30, 2009, we acquired all of the active Illinois
Basin surface mining operations of Phoenix Coal. The purchase price of this acquisition was less
than the fair value of the net assets and liabilities we acquired. We recorded this difference as a
one-time gain of $3.8 million for 2009.
Net Income Attributable to Noncontrolling Interest. For the year ended December 31, 2009, net
income attributable to the noncontrolling interest was $5.9 million compared to $2.9 million for
2008. This increase of $3.0 million was primarily attributable to increases in both tons sold and
average sales price realized by Harrison Resources in 2009 compared to 2008.
Adjusted EBITDA. Adjusted EBITDA for 2009 was $57.0 million compared to $24.7 million for
2008. Adjusted EBITDA for 2009 was positively impacted by the aforementioned $13.3 million
temporary price increase and a $3.8 million gain on purchase of business that resulted from the
acquisition of the Illinois Basin assets from Phoenix Coal.
Liquidity and Capital Resources
Liquidity
Our business is capital intensive and requires substantial capital expenditures for
purchasing, upgrading and maintaining equipment used in mining our reserves, as well as complying
with applicable environmental laws and regulations. Our principal liquidity requirements are to
finance current operations, fund capital expenditures, including acquisitions from time to time,
service our debt and pay cash distributions to our unitholders. Our primary sources of liquidity
to meet these needs have been cash generated by our operations, credit facility borrowings and
contributions from our partners.
The principal indicators of our liquidity are our cash on hand and availability under our $175
million credit facility, which is described under “— Credit Facility” below. Going forward, we
expect our sources of liquidity to include:
| |
• |
|
cash generated from operations; |
| |
• |
|
borrowing capacity under our $175 million credit facility; |
| |
• |
|
issuances of additional partnership units; and |
We believe that cash generated from these sources will be sufficient to meet our liquidity
needs over the next 12 months, including operating expenditures, debt service obligations,
contingencies and anticipated capital expenditures, and to fund our quarterly distributions to
unitholders.
Please read “— Capital Expenditures” for a further discussion on the impact of capital
expenditures on liquidity.
63
Cash Flows
The following table reflects cash flows for the years indicated:
| |
|
|
|
|
|
|
|
|
|
|
|
|
| |
|
Years Ended December 31, |
|
| |
|
2010 |
|
|
2009 |
|
|
2008 |
|
| |
|
(in thousands) |
|
|
|
|
|
|
|
|
|
|
|
|
|
|
Net cash provided by (used in): |
|
|
|
|
|
|
|
|
|
|
|
|
Operating activities |
|
$ |
40,268 |
|
|
$ |
38,637 |
|
|
$ |
33,992 |
|
Investing activities |
|
|
(84,894 |
) |
|
|
(49,171 |
) |
|
|
(23,942 |
) |
Financing activities |
|
|
42,149 |
|
|
|
(1,279 |
) |
|
|
4,494 |
|
Year Ended December 31, 2010 Compared to Year Ended December 31, 2009. Net cash provided by
operating activities was $40.3 million for 2010 compared to $38.6 million for 2009.
Net cash used in investing activities was $84.9 million for 2010 compared to $49.2 million for
2009. This $35.7 million increase was primarily attributable to the $52.5 million of newly
purchased property and equipment in 2010 partially offset by $18.3 million used in connection
with our acquisition of Illinois Basin assets in 2009.
Net cash provided by financing activities was $42.1 million for 2010 compared to net cash used
in financing activities of $1.3 million for 2009. This $43.4 million increase was primarily
attributable to net proceeds from our initial public offering of $144.4 million partially offset by
an increase of $73.2 million in distributions to partners and non-controlling interest, a net
reduction in borrowings of $12.5 million, a decrease of $11.5 million in contributions from
partners and debt issuance costs of $3.8 million.
Year Ended December 31, 2009 Compared to Year Ended December 31, 2008. Net cash provided by
operating activities was $38.6 million for 2009 compared to $34.0 million for 2008. This $4.6
million increase was primarily due to the combined effects of the $26.0 million increase in net
income (loss) attributable to our unitholders and higher non-cash adjustments of $10.5 million,
partially offset by a decrease in the cash provided by changes in assets and liabilities of $31.7
million. One of the major contributors to this decrease in cash provided by changes in assets and
liabilities was a $13.3 million advance payment by one of our major customers in December 2008 for
committed deliveries of coal in 2009, of which $11.2 million was offset against outstanding
receivables in 2009.
Net cash used in investing activities was $49.2 million for 2009 compared to $23.9 million for
2008. This $25.3 million increase was attributable to the $18.3 million we spent in connection
with our acquisition of Illinois Basin assets, $3.1 million primarily relating to increases in the
purchases of coal properties and mine development costs and a decrease of $3.9 million of proceeds
from the sale of property and equipment during 2009 as compared to 2008.
Net cash used in financing activities was $1.3 million for 2009 compared to net cash provided
by financing activities of $4.5 million for 2008. This $5.8 million decrease was primarily
attributable to $3.7 million of cash distributions to the noncontrolling interest in Harrison
Resources and $1.8 million of debt issuance costs during 2009 compared to 2008.
Credit Facility
In connection with our initial public offering, we paid off the amounts outstanding under our
$115 million credit facility and we entered into our $175 million credit facility. Our $175
million credit facility provides for a $60 million term loan and a $115 million revolving credit
facility. As of December 31, 2010, we had borrowings of $90 million outstanding under our $175
million credit facility, consisting of a $57 million term loan and borrowings of $33 million on the
revolving credit facility. We also use our $175 million credit facility to collateralize letters
of credit related to surety bonds securing our reclamation obligations. As of December 31, 2010, we
had letters of credit outstanding in support of these surety bonds of $6.7 million.
64
The term loan and revolver will mature in 2014 and 2013, respectively, and borrowings bear
interest at a variable rate per annum equal to, at our option, LIBOR or the Base Rate, as the case
may be, plus the Applicable
Margin (LIBOR, Base Rate and Applicable Margin are each defined in the credit agreement that
evidences our $175 million credit facility). We used a portion of the borrowings under our $175
million credit facility and a portion of our initial public offering proceeds to purchase all of
the equipment we had under operating leases, which reduced operating lease expenses beginning in
the third quarter of 2010.
Borrowings under our $175 million credit facility are secured by a first-priority lien on and
security interest in substantially all of our assets. Our $175 million credit facility contains
customary covenants, including restrictions on our ability to incur additional indebtedness, make
certain investments, make distributions to our unitholders, make ordinary course dispositions of
assets over predetermined levels or enter into equipment leases, as well as enter into a merger or
sale of all or substantially all of our property or assets, including the sale or transfer of
interests in our subsidiaries. Our $175 million credit facility also requires compliance with
certain financial covenant ratios, including limiting our leverage ratio (the ratio of consolidated
indebtedness to adjusted EBITDA) to no greater than 2.75 : 1.0 and limiting our interest coverage
ratio (the ratio of adjusted EBITDA to consolidated interest expense) to no less than 4.0 : 1.0.
In addition, we are not permitted under our $175 million credit facility to fund capital
expenditures in any fiscal year in excess of certain predetermined amounts.
The events that constitute an event of default under our $175 million credit facility include,
among other things, failure to pay principal and interest when due, breach of representations and
warranties, failure to comply with covenants, voluntary bankruptcy or liquidation and a change of
control.
Contractual Obligations
We have contractual obligations that are required to be settled in cash. The amounts of our
contractual obligations as of December 31, 2010 were as follows:
| |
|
|
|
|
|
|
|
|
|
|
|
|
|
|
|
|
|
|
|
|
| |
|
Payment Due by Period |
|
| |
|
|
|
|
|
|
|
|
|
|
|
|
|
|
|
|
|
More |
|
| |
|
|
|
|
|
1 Year |
|
|
1 - 3 |
|
|
3 - 5 |
|
|
than |
|
| |
|
Total |
|
|
or Less |
|
|
Years |
|
|
Years |
|
|
5 Years |
|
| |
|
(in thousands) |
|
|
|
|
|
|
|
|
|
|
|
|
|
|
|
|
|
|
|
|
|
|
Long-term debt obligations |
|
$ |
90,000 |
|
|
$ |
6,000 |
|
|
$ |
84,000 |
|
|
$ |
— |
|
|
$ |
— |
|
Future interest obligations — long-term debt (1) |
|
|
13,491 |
|
|
$ |
4,836 |
|
|
$ |
8,655 |
|
|
|
— |
|
|
|
— |
|
Other long-term debt (2) |
|
|
12,986 |
|
|
|
1,249 |
|
|
|
11,732 |
|
|
|
5 |
|
|
|
— |
|
Future interest obligations — other long-term debt |
|
|
1,453 |
|
|
|
719 |
|
|
|
734 |
|
|
|
— |
|
|
|
— |
|
Fixed-price diesel fuel purchase contracts |
|
|
26,457 |
|
|
|
26,457 |
|
|
|
— |
|
|
|
— |
|
|
|
— |
|
Operating lease obligations |
|
|
2,199 |
|
|
|
537 |
|
|
|
1,581 |
|
|
|
78 |
|
|
|
3 |
|
Long-term coal purchase contract (3) |
|
|
61,848 |
|
|
|
12,847 |
|
|
|
29,401 |
|
|
|
19,600 |
|
|
|
— |
|
|
|
|
|
|
|
|
|
|
|
|
|
|
|
|
|
Total |
|
$ |
208,434 |
|
|
$ |
52,645 |
|
|
$ |
136,103 |
|
|
$ |
19,683 |
|
|
$ |
3 |
|
|
|
|
|
|
|
|
|
|
|
|
|
|
|
|
|
| |
|
|
| (1) |
|
Interest on variable rate long-tem debt was calculated using rates estimated by us
at December 31, 2010 for the remaining term of outstanding borrowings. |
| |
| (2) |
|
Represents various notes payable with interest rates ranging from 4.6% to 6.75%. |
| |
| (3) |
|
We assumed a long-term coal purchase contract as a result of our acquisition of
Illinois Basin assets. Please read Note 10 to our consolidated financial statements included
elsewhere in this Annual Report on Form 10-K under the heading “Long-Term Debt.” |
Capital Expenditures
Our mining operations require investments to expand, upgrade or enhance existing operations
and to comply with environmental laws and regulations. Our capital requirements primarily consist
of maintenance capital expenditures and expansion capital expenditures. Maintenance capital
expenditures are those capital expenditures required to maintain or replace, including over the
long term, our operating capacity, asset base or operating income. Expansion capital expenditures
are those capital expenditures made to increase our long-term operating capacity, asset base or
operating income. Our partnership agreement divides maintenance capital expenditures into two
categories —
reserve replacement expenditures and other maintenance capital expenditures. Examples of
reserve replacement expenditures include cash expenditures for the purchase of fee interests in
coal reserves and cash expenditures for advance royalties with respect to the acquisition of
leasehold interests in coal reserves. Examples of other maintenance capital expenditures include
capital expenditures associated with the repair, refurbishment and replacement of equipment, the
development of new mines and reclamation upon mine closures. Examples of expansion capital
expenditures include the acquisition (by lease or otherwise) of reserves, equipment or a new mine
or the expansion of an existing mine, to the extent such expenditures are incurred to increase our
long-term operating capacity, asset base or operating income.
65
For
2011, we expect to incur between $37.0 million and
$40.0 million in reserve replacement expenditures
and other maintenance capital expenditures. However, at December 31, 2010, we did not have any
material commitments for capital expenditures. We expect to fund maintenance capital expenditures
primarily from cash generated by our operations. To the extent we incur expansion capital
expenditures, we expect to fund those expenditures with the proceeds of borrowings under our $175
million credit facility, issuance of debt and equity securities and/or other external sources of
financing.
Off-Balance Sheet Arrangements
In the normal course of business, we are a party to certain off-balance sheet arrangements.
These arrangements include guarantees and financial instruments with off-balance sheet risk, such
as bank letters of credit, surety bonds, performance bonds and road bonds. No liabilities related
to these arrangements are reflected in our consolidated balance sheet, and we do not expect any
material adverse effects on our financial condition, results of operations or cash flows to result
from these off-balance sheet arrangements.
Federal and state laws require us to secure certain long-term obligations such as mine closure
and reclamation costs and other obligations. We typically secure these obligations by using surety
bonds, an off-balance sheet instrument. The use of surety bonds is less expensive for us than the
alternative of posting a 100% cash bond and we typically use bank letters of credit to secure our
surety bond obligations. To the extent that surety bonds become unavailable, we would seek to
secure our reclamation obligations with bank letters of credit, cash deposits or other suitable
forms of collateral. We also post performance bonds to secure our performance of various
contractual obligations and road bonds to secure our obligations to repair local roads.
As of December 31, 2010, we had approximately $34.9 million in surety bonds outstanding to
secure the performance of our reclamation obligations, which were supported by approximately $6.7
million in bank letters of credit. Our management believes these bonds and bank letters of credit
will expire without any claims or payments thereon and thus any subrogation or other rights with
respect thereto will not have a material adverse effect on our financial position, liquidity or
operations.
Seasonality
Our business has historically experienced only limited variability in its results due to the
effect of seasons. Demand for coal-fired power can increase due to unusually hot or cold weather as
power consumers use more air conditioning or heating. Conversely, mild weather can result in softer
demand for our coal. Adverse weather conditions, such as heavy and/or extended periods of rain,
snow or floods, can impact our ability to mine and ship our coal, and our customers’ ability to
take delivery of coal.
Critical Accounting Policies and Estimates
“Management’s Discussion and Analysis of Financial Condition and Results of Operations”
discusses our consolidated financial statements, which have been prepared in accordance with GAAP.
The preparation of these consolidated financial statements requires management to make estimates
and assumptions that affect the reported amounts of assets and liabilities, the disclosure of
contingent assets and liabilities at the date of the consolidated financial statements and the
reported amounts of revenues and expenses during the reporting period.
Our management regularly reviews our accounting policies to make certain they are current and
also to provide readers of our consolidated financial statements with useful and reliable
information about our operating results and financial condition. These include, but are not limited
to, matters related to accounts receivable, inventories, pension benefits and income taxes.
Implementation of these accounting policies includes estimates and judgments by
management based on historical experience and other factors believed to be reasonable. This
may include judgments about the carrying value of assets and liabilities based on considerations
that are not readily apparent from other sources. Actual results may differ from these estimates
under different assumptions or conditions.
66
Our management believes the following critical accounting policies are most important to the
portrayal of our financial condition and results of operations and require more significant
judgments and estimates in the preparation of our consolidated financial statements.
Use of Estimates
In order to prepare financial statements in conformity with GAAP, we are required to make
estimates and assumptions that affect the reported amounts of assets and liabilities and the
disclosures of contingent assets and liabilities (if any) at the date of the financial statements
and the reported amounts of revenues and expenses during the reporting period. The most significant
areas requiring the use of management estimates and assumptions relate to amortization calculations
using the units-of-production method, asset retirement obligations, useful lives for depreciation
of fixed assets and estimates of fair values of assets and liabilities. The estimates and
assumptions that we use are based upon our evaluation of the relevant facts and circumstances as of
the date of the financial statements. Actual results could ultimately differ from those estimates.
Allowance for Doubtful Accounts
We establish an allowance for losses on trade receivables when it is probable that all or part
of the outstanding balance will not be collected. Our management regularly reviews the probability
that a receivable will be collected and establishes or adjusts the allowance as necessary.
Inventory
Inventory consists of coal that has been completely uncovered or, that has been removed from
the pit and stockpiled for crushing, washing or shipment to customers. Inventory also consists of
supplies, spare parts and fuel. Inventory is valued at the lower of average cost or market. The
cost of coal inventory includes certain operating expenses including overhead and stripping costs
incurred prior to the production phase, which commences when saleable coal beyond a de minimus
amount is produced.
Property, Plant and Equipment
Property, plant and equipment are recorded at cost. Expenditures that extend the useful lives
of existing plant and equipment are capitalized. Maintenance and repairs that do not extend the
useful life or increase productivity are charged to operating expense as incurred. Plant and
equipment are depreciated principally on the straight-line method over the estimated useful lives
of the assets based on the following schedule:
| |
|
|
|
|
Buildings and tipple |
|
25-39 years |
Machinery and equipment |
|
7-12 years |
Vehicles |
|
5-7 years |
Furniture and fixtures |
|
3-7 years |
Railroad siding |
|
7 years |
We acquire our coal reserves through purchases or leases. We deplete our coal reserves using
the units-of-production method on the basis of tonnage mined in relation to total estimated
recoverable tonnage with residual surface values classified as land and not depleted. At December
31, 2010 and 2009, all of our reserves were attributed to mine complexes engaged in mining
operations or leased to third parties. We believe that the carrying value of these reserves will be
recovered.
Exploration expenditures are charged to operating expense as incurred and include costs
related to locating coal deposits and the drilling and evaluation costs incurred to assess the
economic viability of such deposits. Costs incurred in areas outside the boundary of known coal
deposits and areas with insufficient drilling spacing to qualify as proven and probable reserves
are also expensed as exploration costs.
Once management determines there is sufficient evidence that the expenditure will result in a
future economic benefit to us, the costs are capitalized as mine development costs. Capitalization
of mine development costs continues until more than a de minimis amount of saleable coal is
extracted from the mine. Amortization of these mine development costs is then initiated using the
units-of-production method based upon the total estimated recoverable tonnage.
67
Advance Royalties
A substantial portion of our reserves are leased. Advance royalties are advance payments made
to lessors under terms of mineral lease agreements that are recoupable through an offset or credit
against royalties payable on future production. Amortization of leased coal interests is computed
using the units-of-production method over estimated recoverable tonnage.
Financial Instruments and Derivative Financial Instruments
Our financial instruments include cash and cash equivalents, accounts receivable, accounts
payable, fixed rate debt, variable rate debt, interest rate swap agreements and an interest rate
cap agreement. We do not hold or purchase financial instruments or derivative financial instruments
for trading purposes.
We used interest rate swap agreements to partially reduce risks related to floating rate
financing agreements that are subject to changes in the market rate of interest. Terms of the
interest rate swap agreements required us to receive a variable interest rate and pay a fixed
interest rate. Our interest rate swap agreements and their variable rate financings were based upon
LIBOR. We had an interest rate cap agreement that set an upper limit on LIBOR that we would have to
pay under the terms of our existing credit facility. This agreement expired on December 31, 2010.
We did not elect hedge accounting for any of these agreements and, therefore, changes in market
value on these derivatives are included in interest expense on the consolidated statements of
operations.
We measure our derivatives (interest rate swap agreements or interest rate cap agreement) at
fair value on a recurring basis using significant observable inputs, which are Level 2 inputs as
defined in the fair value hierarchy. See Note 12 to our consolidated financial statements included
elsewhere in this Annual Report on Form 10-K under the heading “Fair Value of Financial
Instruments.”
Our other financial instruments include fixed price forward contracts for diesel fuel. Our
risk management policy requires us to purchase up to 75% of our unhedged diesel fuel gallons on
fixed price forward contracts. These contracts meet the normal purchases and sales exclusion and
therefore are not accounted for as derivatives. We take physical delivery of all the fuel under
these forward contracts and such contracts usually have a term of one year or less.
Long-Lived Assets
We follow authoritative guidance that requires projected future cash flows from use and
disposition of assets to be compared with the carrying amounts of those assets when impairment
indicators are present. When the sum of projected cash flows is less than the carrying amount,
impairment losses are indicated. If the fair value of the assets is less than the carrying amount
of the assets, an impairment loss is recognized. In determining such impairment losses, discounted
cash flows or asset appraisals are utilized to determine the fair value of the assets being
evaluated. Also, in certain situations, expected mine lives are shortened because of changes to
planned operations. When that occurs and it is determined that the mine’s underlying costs are not
recoverable in the future, reclamation and mine closure obligations are accelerated by accelerating
the depletion rate. To the extent it is determined that an asset’s carrying value will not be
recoverable during a shorter mine life, the asset is written down to its recoverable value. There
were no indicators of impairment present during the years ended December 31, 2010, 2009 and 2008.
Accordingly, no impairment losses were recognized during any of these years.
Identifiable Intangible Assets and Liabilities
Identifiable intangible assets are recorded in other assets in the accompanying consolidated
balance sheets. We capitalize costs incurred in connection with the establishment of credit
facilities and amortize such costs to interest expense over the term of the credit facility using
the effective interest method.
We also have recorded intangible assets and liabilities at fair value associated with certain
customer relationships and below-market coal sales contracts, respectively. These balances arose
from the purchase accounting for our acquisitions of Oxford Mining Company and Phoenix Coal. These
intangible assets are being amortized over their expected useful lives. See the “Coal Sales
Contracts” section of Note 2 and Note 7 to our consolidated financial
statements included elsewhere in this Annual Report on Form 10-K for further details under the
headings “Summary of Significant Accounting Policies” and “Intangible Assets and Liabilities,”
respectively.
68
Asset Retirement Obligations
Our asset retirement obligations, or AROs, arise from SMCRA and similar state statutes, which
require that mine property be restored in accordance with specified standards and an approved
reclamation plan. Our AROs are recorded initially at fair value. It has been our practice, and we
anticipate that it will continue to be our practice, to perform a substantial portion of the
reclamation work using internal resources. Hence, the estimated costs used in determining the
carrying amount of our AROs may exceed the amounts that are eventually paid for reclamation costs
if the reclamation work is performed using internal resources.
To determine the fair value of our AROs, we calculate on a mine-by-mine basis the present
value of estimated reclamation cash flows. This process requires us to estimate the current
disturbed acreage subject to reclamation, estimate future reclamation costs and make assumptions
regarding the mine’s productivity. These cash flows are discounted at a credit-adjusted, risk-free
interest rate based on U.S. Treasury bonds with a maturity similar to the expected lives of our
mines.
When the liability is initially established, the offset is capitalized to the producing mine
asset. Over time, the ARO liability is accreted to its present value, and the capitalized cost is
depleted using the units-of-production method for the related mine. The liability is also increased
as additional land is disturbed during the mining process. The timeline between digging the mining
pit and extracting the coal is relatively short; therefore, a portion of the liability created for
active mining is expensed within a month or so of establishment because the related coal has been
extracted. If the assumptions used to estimate the ARO do not materialize as expected or regulatory
changes occur, reclamation costs or obligations to perform reclamation and mine closure activities
could be materially different than currently estimated. We review our entire reclamation liability
at least annually and make necessary adjustments for permit changes as granted by state
authorities, additional costs resulting from revisions to cost estimates and the quantity of
acreage disturbed during the current year. At December 31, 2010, we had recorded ARO liabilities of
$13.0 million, including amounts reported as current liabilities. On an aggregate undiscounted
basis, we estimate the cost of final mine closure to be approximately $15.4 million.
Income Taxes
As a partnership, we are not a taxable entity for federal or state income tax purposes; the
tax effect of our activities passes through to our unitholders. Therefore, no provision or
liability for federal or state income taxes is included in our financial statements. Net income for
financial statement purposes may differ significantly from taxable income reportable to our
unitholders as a result of timing or permanent differences between financial reporting under US
GAAP and the regulations promulgated by the Internal Revenue Service.
Authoritative accounting guidance on accounting for uncertainty in income taxes establishes
the criterion that an individual tax position is required to meet for some or all of the benefits
of that position to be recognized in our financial statements. On initial application, the
uncertain tax position guidance has been applied to all tax positions for which the statute of
limitations remains open and no liability was recognized. Only tax positions that meet the
more-likely-than-not recognition threshold at the adoption date are recognized or will continue to
be recognized.
Revenue Recognition
Revenue from coal sales is recognized and recorded when shipment or delivery to the customer
has occurred, prices are fixed or determinable and the title or risk of loss has passed in
accordance with the terms of the sales contract. Under the typical terms of these contracts, risk
of loss transfers to the customers at the mine or dock, when the coal is loaded on the rail, barge,
or truck.
On September 29, 2008, we executed and received a prepayment from one of our customers of
$13.3 million toward its future coal deliveries in 2009. This amount was classified as deferred
revenue and recognized as revenue as we delivered the coal in accordance with the terms of the
arrangement. As of December 31, 2009, $2.1 million of the prepayment remained on our balance sheet
as deferred revenue and was fully recognized in 2010.
69
Freight and handling costs paid to third party carriers and invoiced to customers are recorded
as cost of transportation and transportation revenue, respectively.
Royalty and non-coal revenue consists of coal royalty income, service fees for providing
landfill earth moving and transportation services, commissions that we receive from a third party
who sells limestone that we recover during our coal mining process, service fees for operating a
coal unloading facility and fees that we receive for trucking ash for municipal utility customers.
Revenues are recognized when earned or when services are performed. Royalty revenue relates to the
overriding royalty we receive on our underground coal reserves that we sublease to a third party
mining company. Prior to June 2008, we did not receive any royalties because we were purchasing the
output of this mine and no royalty was due on purchases by us. Starting in June 2008, our sublessee
began selling the coal production for its own account which entitled us to start receiving royalty
revenue. For the years ended December 31, 2010, 2009 and 2008, we received royalties of $2.8
million, $4.5 million and $1.3 million, respectively.
Below-Market Coal Sales Contracts
Our below-market coal sales contracts were acquired through our acquisition of Illinois Basin
assets in 2009 and were coal sales contracts for which the prevailing market price for coal
specified in the contract was in excess of the contract price. The fair value was based on
discounted cash flows resulting from the difference between the below-market contract price and the
prevailing market price at the date of acquisition. The difference between the below-market
contracts cash flows and the cash flows at the prevailing market price are amortized into coal
sales on the basis of tons shipped over the terms of the respective contracts.
Equity-Based Compensation
We account for equity-based awards in accordance with applicable guidance, which establishes
standards of accounting for transactions in which an entity exchanges its equity instruments for
goods or services. Equity-based compensation expense is recorded based upon the fair value of the
award at grant date. Such costs are recognized as expense on a straight-line basis over the
corresponding vesting period. Prior to our initial public offering (see the Initial Public Offering
section in Note 1 to our consolidated financial statements included elsewhere in this Annual Report
on Form 10-K under the heading “Organization and Presentation”), the fair value of our LTIP units
was determined based on the sale price of our limited partner units in arm’s-length transactions.
Subsequent to our initial public offering, the unit price fair value is determined based on the
closing sales price of our units on the New York Stock Exchange on the grant date. See Note 13 to
our consolidated financial statements included elsewhere in this Annual Report on Form 10-K under
the heading “Long-Term Incentive Plan.”
Earnings Per Unit
For purposes of our earnings per unit calculation, we have applied the two class method. The
classes of units are our limited partner and general partner units. All outstanding units share pro
rata in income allocations and distributions and our general partner has sole voting rights. Prior
to our initial public offering (see the Initial Public Offering section in Note 1 to our
consolidated financial statements included elsewhere in this Annual Report on Form 10-K under the
heading “Organization and Presentation”), limited partner units were separated into Class A and
Class B units to prepare for a potential transaction such as an initial public offering. In
connection with and since our initial public offering, our limited partner units were converted to
and are maintained as common units and subordinated units.
Limited Partner Units: Basic earnings per unit are computed by dividing net income
attributable to limited partners by the weighted average units outstanding during the reporting
period. Diluted earnings per unit are computed similar to basic earnings per unit except that the
weighted average units outstanding and net income attributable to limited partners are increased to
include phantom units that have not yet vested and that will convert to LTIP units upon vesting.
In years of a loss, the phantom units are antidilutive and therefore not included in the earnings
per unit calculation.
General Partner Units: Basic earnings per unit are computed by dividing net income
attributable to our general partner by the weighted average units outstanding during the reporting
period. Diluted earnings per unit for our general partner are computed similar to basic earnings
per unit except that the net income attributable to the general partner units is adjusted for the
dilutive impact of the phantom units. In years of a loss, the phantom units are antidilutive and
therefore not included in the earnings per unit calculation.
70
New Accounting Standards Issued
In August 2009, the Financial Accounting Standards Board, or FASB, issued ASU 2009-05,
Measuring Liabilities at Fair Value. The amendment provides clarification that in circumstances in
which a quoted price in an active market for the identical liability is not available, a reporting
entity is required to measure fair value using one or more of the alternative valuation methods
outlined in the guidance. It also clarifies that restrictions preventing the transfer of a
liability should not be considered as a separate input or adjustment in the measurement of its fair
value. This amendment was effective as of the beginning of interim and annual reporting periods
that begin after August 27, 2009. The adoption of this guidance did not impact our consolidated
financial statements.
In June 2009, the FASB amended guidance for the consolidation of a variable interest entity (a
“VIE”). This guidance updated the determination of whether an enterprise is the primary
beneficiary of a VIE, and is, therefore, required to consolidate an entity, by requiring a
qualitative analysis rather than a quantitative analysis. This standard also requires continuous
reassessments of whether an enterprise is the primary beneficiary of a VIE. Previously,
reconsideration was required only when specific events had occurred. This guidance also requires
enhanced disclosure about an enterprise’s involvement with a VIE. The provisions of these updates
are effective as of the beginning of interim and annual reporting periods that begin after November
15, 2009. The adoption of this guidance did not impact our consolidated financial statements.
In January 2010, the FASB issued ASU 2010-06, Fair Value Measurements and Disclosures —
Improving Disclosures about Fair Value Measurements. This guidance requires reporting entities to
make new disclosures about recurring or non-recurring fair value measurements including significant
transfers into and out of Level 1 and Level 2 fair value measurements and information on purchases,
sales, issuances, and settlements on a gross basis in the reconciliation of Level 3 fair value
measurements. We adopted this guidance effective January 1, 2010 for Level 1 and Level 2
reconciliation disclosures and effective December 31, 2010 for Level 3 reconciliation disclosures.
The adoption of this guidance did not have a material effect on our consolidated financial
statements.
In December 2010, the FASB issued ASU 2010-29, Business Combinations — Disclosure of
Supplementary Pro Forma Information for Business Combinations. This guidance requires a public
entity to disclose the revenue and earnings of the combined entity in its consolidated financial
statements as though the business combination(s) that occurred during the current year had occurred
as of the beginning of the comparable prior annual reporting period only. This guidance also
expands the supplemental pro forma disclosures to include a description of the nature and amount of
material, non-recurring pro forma adjustments directly attributable to the business combination(s)
included in the reported pro forma revenue and earnings. These amendments are effective
prospectively for business combinations for which the acquisition date is on or after the beginning
of the first annual reporting period beginning on or after December 31, 2010. Early adoption of
the guidance is permissible. We do not believe this guidance will have a material impact on our
consolidated financial statements.
|
|
|
| ITEM 7A. |
|
QUANTITATIVE AND QUALITATIVE DISCLOSURES ABOUT MARKET RISK |
Market risk includes risks that arise from changes in interest rates, foreign currency
exchange rates, commodity prices, equity prices and other market changes that affect
market-sensitive instruments. We believe our principal market risks are commodity price risks and
interest rate risks.
Commodity Price Risks
We sell most of the coal we produce under long-term coal sales contracts. Historically, we
have principally managed the commodity price risks from our coal sales by entering into long-term
coal sales contracts of varying terms and durations, rather than through the use of derivative
instruments.
We believe that the price risks associated with our diesel fuel purchases is significant.
Taking into account full or partial diesel fuel cost pass through provisions in our long-term coal
sales contracts and our fixed price forward contracts for delivery of diesel fuel, we estimate that
a hypothetical increase of $0.30 per gallon for diesel fuel would have increased net income
attributable to our unitholders by $0.4 million for 2010. This hypothetical increase in income
results from the fuel escalation clauses contained within our long-term coal sales contracts and
fixed price physical fuel purchase contracts.
71
Interest Rate Risk
We are exposed to interest rate risks as borrowings under our $175 million credit facility are
at variable rates. We manage our interest rate risks from time to time through interest rate swap
and/or interest rate cap agreements.
On August 2, 2010, we entered into an interest rate swap agreement that had an original
notional principal amount of $50 million and a maturity of January 31, 2013. The notional principal
amount declines over the term of the interest rate swap agreement at a rate of $1.5 million each
quarter that corresponds to our required principal payments on the term loan under our $175 million
credit facility. Under the interest rate swap agreement, we pay interest monthly at a fixed rate of
1.39% per annum and receive interest monthly at a variable rate equal to LIBOR (with a 1% floor)
based on the notional principal amount. The interest rate swap agreement was effective August 9,
2010. The derivative liability is recorded in other liabilities and increased by $0.1 million in
2010.
On September 11, 2009, we entered into an interest rate cap agreement to hedge our exposure to
rising LIBOR interest rates during 2010. This agreement had an effective date of January 4, 2010
and a notional amount of $50.0 million and provided for a LIBOR interest rate cap of 2% using the
three month LIBOR. This interest rate cap agreement expired on December 31, 2010.
The variable interest rate on our debt under the $175 million credit facility, at December 31,
2010, was 5.25%, calculated at the 30-day LIBOR rate, subject to a floor of 1.0%, plus the
applicable margin of 4.25%. Based on our current 2011 borrowings, a hypothetical 100 basis point
increase in short term interest rates would result, over the subsequent twelve-month period, in a
reduction of approximately $0.1 million in income or cash flows. The current 30 day LIBOR is
approximately 74 basis points below the 1% LIBOR floor. As a result the $0.1 million hypothetical
reduction noted above represents the current 30 day LIBOR interest rate as adjusted for the impact
of the hypothetical 100 basis point increase less the 1% LIBOR floor, or an increase of 26 basis
points from our current interest rate. This estimate is based upon the current level of variable
debt and assumes no changes in the composition of that debt.
|
|
|
| ITEM 8. |
|
FINANCIAL STATEMENTS AND SUPPLEMENTARY DATA |
Our consolidated balance sheets as of December 31, 2010 and 2009 and the related consolidated
statements of operations, partners’ equity and cash flows for the years ended December 31, 2010,
2009 and 2008, together with the report of the independent registered public accounting firm
thereon, appear on pages F-1 through F-31 hereof and are incorporated herein by reference.
|
|
|
| ITEM 9. |
|
CHANGES IN AND DISAGREEMENTS WITH ACCOUNTANT ON ACCOUNTING AND FINANCIAL DISCLOSURE |
None.
|
|
|
| ITEM 9A. |
|
CONTROLS AND PROCEDURES |
Conclusion Regarding the Effectiveness of Disclosure Controls and Procedures
We carried out an evaluation, under the supervision and with the participation of management,
including our Chief Executive Officer and Chief Financial Officer, of the effectiveness of the
design and operation of our disclosure controls and procedures as of the end of the period covered
by this Report on Form 10-K pursuant to Securities Exchange Act of 1934 Rule 13a-15. Based upon
that evaluation, our Chief Executive Officer and Chief Financial Officer concluded that, as of
December 31, 2010, our disclosure controls and procedures were effective to provide reasonable
assurance that material information required to be disclosed by us in reports that we file or
submit under the Securities Exchange Act of 1934 is appropriately recorded, processed, summarized
and reported within the time periods specified in the SEC’s rules and forms and that information
required to be disclosed by us in the reports we file or submit under the Securities Exchange Act
of 1934 is accumulated and communicated to our management, including our Chief Executive Officer
and Chief Financial Officer, as appropriate, to allow timely decisions regarding required
disclosure.
72
Management’s Annual Report on Internal Control Over Financial Reporting and Attestation Report of
the Registered Public Accounting Firm
This Annual Report on Form 10-K does not include management’s assessment regarding internal
control over financial reporting or an attestation report of our independent registered public
accounting firm due to a transition period established by rules of the SEC for newly public
companies.
Changes in Internal Control Over Financial Reporting
There has been no change in our internal control over financial reporting during the quarter
ended December 31, 2010 that has materially affected, or is reasonably likely to materially affect,
our internal control over financial reporting.
|
|
|
| ITEM 9B. |
|
OTHER INFORMATION |
None.
73
PART III
|
|
|
| ITEM 10. |
|
DIRECTORS, EXECUTIVE OFFICERS AND CORPORATE GOVERNANCE |
Partnership Management
We are managed and operated by the directors and executive officers of our general partner,
Oxford Resources GP, LLC. Our general partner is not elected by our unitholders and will not be
subject to re-election in the future. Our general partner has a board of directors, and our
unitholders are not entitled to elect the directors or directly or indirectly participate in our
management or operations. Our general partner owes certain fiduciary duties to our unitholders as
well as a fiduciary duty to its owners. Our general partner is liable, as general partner, for all
of our debts (to the extent not paid from our assets), except for indebtedness or other obligations
that are made specifically nonrecourse to it. Whenever possible, we intend to incur indebtedness
that is nonrecourse to our general partner.
Our general partner’s board of directors has seven directors, three of whom are independent as
defined under the independence standards established by the NYSE and the Exchange Act. Our general
partner’s board of directors has affirmatively determined that Messrs. Tywoniuk, Lilly and Messey
are independent as described in the rules of the NYSE and the Exchange Act. The NYSE does not
require a listed publicly traded partnership, such as ours, to have a majority of independent
directors on the board of directors of our general partner or to establish a compensation committee
or a nominating committee.
Directors and Executive Officers
Directors are appointed for a term of one year and hold office until their successors have
been elected or qualified or until the earlier of their death, resignation, removal or
disqualification. Officers serve at the discretion of the board. The following table shows
information for the directors and executive officers of our general partner.
| |
|
|
|
|
|
|
| Name |
|
Age |
|
Position |
George E. McCown
|
|
|
75 |
|
|
Chairman of the Board |
Charles C. Ungurean
|
|
|
61 |
|
|
Director, President and Chief Executive Officer |
Jeffrey M. Gutman
|
|
|
45 |
|
|
Senior Vice President, Chief Financial Officer and Treasurer |
Gregory J. Honish
|
|
|
54 |
|
|
Senior Vice President, Operations |
Thomas T. Ungurean
|
|
|
59 |
|
|
Senior Vice President, Equipment, Procurement and Maintenance |
Daniel M. Maher
|
|
|
65 |
|
|
Senior Vice President, Chief Legal Officer and Secretary |
Michael B. Gardner
|
|
|
55 |
|
|
General Counsel and Assistant Secretary |
Denise M. Maksimoski
|
|
|
36 |
|
|
Senior Director of Accounting |
Brian D. Barlow
|
|
|
40 |
|
|
Director |
Matthew P. Carbone
|
|
|
44 |
|
|
Director |
Gerald A. Tywoniuk
|
|
|
49 |
|
|
Director |
Peter B. Lilly
|
|
|
62 |
|
|
Director |
Robert J. Messey
|
|
|
65 |
|
|
Director |
George E. McCown was elected Chairman of the board of directors of our general partner in
August 2007. Mr. McCown has been a Managing Director of AIM since he co-founded AIM in July 2006.
Additionally, Mr. McCown has been a Managing Director of McCown De Leeuw & Co., or MDC, a private
equity firm based in Foster City, California that specializes in buying and building
industry-leading middle-market companies in partnership with management, since he co-founded MDC in
1983. Mr. McCown is Chairman of the board of directors of the general partner of Tunnel Hill
Partners, LP, an affiliate of AIM and C&T Coal. Mr. McCown received an MBA from Harvard University
and a B.S. in mechanical engineering from Stanford University, where he served as a trustee from
1980 to 1985 and chaired the Finance Committee and Investment Policy Subcommittee of Stanford’s
board of trustees.
Mr. McCown’s over 40 years of experience in buying and building companies, as well as his
in-depth knowledge of the coal industry generally and our partnership in particular, provide him
with the necessary skills to be a member of the board of directors of our general partner.
74
Charles C. Ungurean was elected President and Chief Executive Officer and a member of the
board of directors of our general partner in August 2007. In 1985, Mr. Ungurean co-founded our
predecessor and wholly owned subsidiary, Oxford Mining Company. He served as President and
Treasurer of our predecessor from 1985 to August
2007. He has served as the President and Chief Executive Officer of our general partner since
its formation in August 2007. Mr. Ungurean currently serves on the board of directors of the
National Mining Association. In addition, Mr. Ungurean served as Chairman of the Ohio Coal
Association from July 2002 to July 2004. Mr. Ungurean is the brother of Thomas T. Ungurean, the
Senior Vice President, Equipment, Procurement and Maintenance of our general partner. Mr. Ungurean
received a B.A. in general studies from Ohio University and is a Certified Surface Mine Foreman in
Ohio.
Mr. Ungurean’s 38 years of experience in the coal industry, over 25 of which have been spent
running our operations or the operations of our predecessor and wholly owned subsidiary, Oxford
Mining Company, provide him with the necessary skills to be a member of the board of directors of
our general partner.
Jeffrey M. Gutman has served as Senior Vice President, Chief Financial Officer and Treasurer
of our general partner since April 2008. Prior to joining us, from 1991 to March 2008, Mr. Gutman
served in a number of positions with The Williams Companies, Inc., an integrated natural gas
company based in Tulsa, Oklahoma. His positions at the Williams Companies included Director of
Capital Services from February 1998 to April 2000, Director of Structured Finance from April 2000
to December 2002, Chief Financial Officer of Gulf Liquids, a wholly-owned subsidiary of the
Williams Companies, from December 2002 to December 2005, Director of Planning & Market Analysis
from April 2005 to February 2008, and Commercial Development from December 2005 until joining our
general partner in April 2008. Prior to joining the Williams Companies, Mr. Gutman was with
Deloitte & Touche, LLP in their Tulsa office. Mr. Gutman is a certified public accountant in
Oklahoma and holds a B.S. in Business Administration in Accounting from Oklahoma State University.
Gregory J. Honish has served as Senior Vice President, Operations of our general partner since
March 2009. Mr. Honish has served in other capacities with us and our predecessor since January
1999, including Vice President, Mining and Business Development from September 2007 to March 2009
and Senior Mining Engineer from January 1999 to September 2007. Mr. Honish has held a balanced
spectrum of engineering, operations and management positions in the coal mining industry during his
30-year professional career at mines in Northern Appalachia, Central Appalachia, the Illinois Basin
and the PRB. He is a Licensed Professional Engineer in Ohio and West Virginia and a Certified
Surface Mine Foreman in Ohio and Wyoming. Mr. Honish holds a B.S. in Mining Engineering from the
University of Wisconsin.
Thomas T. Ungurean has served as Senior Vice President, Equipment, Procurement and Maintenance
of our general partner since March 2010, prior to which he was Vice President of Equipment from
August 2007 to February 2010. In 1985, Mr. Ungurean co-founded our predecessor and wholly owned
subsidiary, Oxford Mining Company. Since then he has served in various capacities with our
predecessor, including Vice President and Secretary from September 2000 to August 2007. Mr.
Ungurean is a Certified Surface Mine Foreman in Ohio. Mr. Ungurean is the brother of Charles C.
Ungurean, the President and Chief Executive Officer and a member of the board of directors of our
general partner.
Daniel M. Maher was elected Senior Vice President and Chief Legal Officer of our general
partner on August 1, 2010 and Secretary of our general partner on December 9, 2010. Mr. Maher had
been a partner in the Columbus, Ohio office of the international law firm of Squire, Sanders &
Dempsey L.L.P. from March of 1988 to December 31, 2010 and prior thereto he had been an associate
and then partner with the predecessor firm to Squire Sanders since June of 1972. He is a licensed
attorney in Ohio with more than 38 years of experience in representing various clients in
corporate, financial, merger and acquisition, contractual, real property, litigation and other
legal matters. He received a J.D. from the University of Virginia and a B.S. from the United
States Merchant Marine Academy. While Mr. Maher was elected and has served full-time as an officer
of our general partner since August 1, 2010, he did not commence employment with our general
partner until January 1, 2011. For that period in 2010 during which he served as an officer, we
made aggregate payments of $225,000 to Squire Sanders under an engagement letter between Squire
Sanders and our general partner relating to such services.
Michael B. Gardner has served as General Counsel of our general partner since September 2007
and as Assistant Secretary of our general partner since December 9, 2010. Mr. Gardner served as
our Secretary from September 2007 until December 8, 2010. Prior to joining us, from June 2004
until May 2007, Mr. Gardner served as Associate General Counsel of Murray Energy Corporation, the
largest privately-owned coal mining company in the United States. While at Murray Energy, Mr.
Gardner served as an officer of several Murray Energy subsidiaries, including Vice President of
UMCO Energy, Inc. and Secretary of UMCO Energy, Inc., Maple Creek Mining, Inc., Maple Creek
Processing, Inc., The Ohio Valley Coal Company, The Ohio Valley Transloading Company, Ohio Valley
Resources, Inc., and Sunburst Resources, Inc., and represented these entities in a variety of
corporate, financial, real property, labor, litigation, environmental, health, safety, governmental
affairs and public relations matters. Mr. Gardner is a licensed attorney in Ohio with more than 30
years of experience in the coal industry and in environmental regulatory compliance management.
Mr. Gardner serves on the Board of Directors of the Ohio Coal Association and Kentucky Coal
Association and serves as a trustee on the Energy and Mineral Law Foundation Governing Member
Organization for the Ohio Coal Association. He is also a member of the American Corporate Counsel
Association, Northeast Ohio Chapter, and the Cleveland Metropolitan Bar Association. Mr. Gardner
received a J.D. from Case Western Reserve University, an MBA from Ashland University and a B.S. in
Environmental Biology (Botany Emphasis), cum laude, from Ohio University.
75
Denise M. Maksimoski has served as Senior Director of Accounting of our general partner since
December 2009, prior to which she was Director, Financial Reporting and General Accounting from
August 2008 to December 2009. Prior to joining us, from 1997 to 2008 Ms. Maksimoski was with
Deloitte & Touche, LLP in Washington, D.C. and Columbus, Ohio in various positions including most
recently as an Audit Senior Manager from August 2005 to August 2008 and as an Audit Manager from
August 2003 to August 2005. While at Deloitte, Ms. Maksimoski gained extensive SEC reporting
experience through leading large audit teams on public clients primarily in the energy and
financial services industries. Ms. Maksimoski is a certified public accountant in the states of
Ohio, Maryland and Virginia and in the District of Columbia. She received a B.A. degree in
Accounting and Actuarial Studies from Thiel College.
Brian D. Barlow was elected as a member of the board of directors of our general partner in
August 2007. Mr. Barlow has been a Principal with AIM since January 2007. Prior to joining AIM,
he was a Senior Securities Analyst for Scion Capital, a private investment partnership located in
Cupertino, California, from August 2004 to August 2006 and was self-employed from August 2006 to
January 2007. Mr. Barlow has 18 years of investing experience in both the public and private
equity markets; and while at Scion, he focused on public and private investments in the energy and
natural resources sectors. He received an MBA from Columbia Business School and a B.A. from the
University of Washington.
Mr. Barlow’s 18 years of investing experience, as well as his in-depth knowledge of the coal
industry generally and our partnership in particular, provide him with the necessary skills to be a
member of the board of directors of our general partner and a member and the chairman of the
Compensation Committee.
Matthew P. Carbone was elected as a member of the board of directors of our general partner in
August 2007. Mr. Carbone has been a Managing Director of AIM since he co-founded AIM in July 2006.
Prior to co-founding AIM, from January 2005 until July 2006, Mr. Carbone was a Managing Director
of MDC.
Mr. Carbone has spent nearly 20 years in private equity and investment banking. Prior to MDC,
he led Wit Capital Group’s West Coast operations and worked in the investment banking divisions of
Morgan Stanley, First Boston Corporation and Smith Barney. Mr. Carbone is a member of the board of
directors of the general partner of Tunnel Hill Partners, an affiliate of AIM and C&T Coal. Mr.
Carbone is also a member of the board of directors of the general partner of American Midstream
Partners, LP. He received an MBA from Harvard Business School and a B.A. in Neuroscience from
Amherst College.
Mr. Carbone’s nearly 20 years of experience in corporate finance, as well as his in-depth
knowledge of the coal industry generally and our partnership in particular, provide him with the
necessary skills to be a member of the board of directors of our general partner.
Gerald A. Tywoniuk was elected as a member of the board of directors of our general partner in
January 2009. In May 2010, he was appointed interim Senior Vice President, Finance of CIBER, Inc.,
a global information technology services company. Mr. Tywoniuk continues to act on a part-time
consulting basis as the Plan Representative for the plan of liquidation of Pacific Energy Resources
Ltd., which was an oil and gas acquisition, exploitation and development company and is now
completing its plan of liquidation. Mr. Tywoniuk joined Pacific Energy Resources Ltd. in June 2008
as Senior Vice President, Finance and he was appointed Chief Financial Officer in August 2008. He
was also appointed acting Chief Executive Officer in September 2009. He held these positions as an
employee until May 2010. Mr. Tywoniuk joined Pacific Energy Resources Ltd. in June 2008 to help
the management team work through the company’s financially distressed situation. The board of the
company elected to file for Chapter 11 protection in March 2009. In December 2009, the company
completed the sale of its assets, and is now working through the remaining steps of liquidation.
76
Prior to joining Pacific Energy Resources Ltd., Mr. Tywoniuk acted as an independent
consultant in accounting and finance from March 2007 to June 2008. From December 2002 through
November 2006, Mr. Tywoniuk was Senior Vice President and Chief Financial Officer of Pacific Energy
Partners, LP. From November 2006 to March 2007, Mr. Tywoniuk assisted with the integration of
Pacific Energy Partners, LP after it was acquired by Plains All American Pipeline, L.P. Mr.
Tywoniuk holds a Bachelor of Commerce degree from The University of Alberta, Canada, and is a
Canadian chartered accountant.
Mr. Tywoniuk has 29 years of experience in accounting and finance, including 12 years as the
Chief Financial Officer of three public companies and 4 years as Vice President/Controller of a
fourth public company. Mr. Tywoniuk’s extensive accounting, financial and executive management
experience, as well as his in-depth knowledge of the mining industry generally and our partnership
in particular, and his prior experience with publicly traded partnerships, provide him with the
necessary skills to be a member of the board of directors of our general partner, a member of the
Compensation Committee and a member and the chairman of the Audit Committee. With respect to the
Audit Committee, he also qualifies as an “audit committee financial expert.”
Peter B. Lilly was elected as a member of the board of directors of our general partner in
June 2010. Prior to joining the board of directors of our general partner, since February 2009 he
has been a part-time consultant relating to the coal industry international market and has also
focused on investments in commercial real estate through his company, Harm Group, LLC. Before
that, Mr. Lilly was an executive officer with CONSOL Energy Inc., the largest producer of high-Btu
bituminous coal in the United States. Mr. Lilly joined CONSOL Energy in October 2002 as Chief
Operating Officer and served as President — Coal Group from February 2007 until his retirement in
January 2009. Prior to joining CONSOL Energy, Mr. Lilly served as President and Chief Executive
Officer of Triton Coal Company LLC and Vulcan Coal Holdings LLC from 1998 to 2002. Between 1991
and 1998, Mr. Lilly was with Peabody Holding Company, Inc., where he served as President and Chief
Operating Officer from 1995 to 1998, Executive Vice President from 1994 to 1995 and President of
Eastern Associated Coal Corporation from 1991 to 1994. He is a former board member of the National
Coal Association, the American Mining Congress and the World Coal Institute and a former chairman
of the Safety Committee of the National Mining Association. Mr. Lilly is currently a member of
Harm Group, LLC, which serves as a consultant to financial analysts on issues related to the coal
industry.
Mr. Lilly received a B.S. in General Engineering and Applied Science from the U.S. Military
Academy at West Point in 1970 and served in the U.S. Army until 1975. He obtained an MBA from
Harvard Business School in 1977.
Mr. Lilly’s 30 plus years of experience in the coal industry, much of it in significant
executive management positions, provide him with the necessary skills to serve as a member of the
board of directors of our general partner, a member of the Audit Committee and a member of the
Compensation Committee.
Robert J. Messey was elected as a member of the board of directors of our general partner in
October 2010. He has been an independent management consultant since April 2008. Before that, Mr.
Messey served as senior vice president and chief financial officer of Arch Coal (NYSE:ACI), one of
the largest U.S. coal producers, from December 2000 until April 2008. Prior to Arch Coal, he served
from 1993 as chief financial officer of Sverdrup, a large privately held engineering, architecture,
construction and technology services firm, until its acquisition in 1999 by Jacobs Engineering
Group, Inc. (NYSE:JEC), one of the largest global firms providing engineering, architecture,
construction and technology services. After such acquisition, Mr. Messey served as vice president
of financial services with Jacobs until November 2000. He attended Washington University in St.
Louis, Missouri, where he received a Bachelor of Science degree in business administration. He is a
Certified Public Accountant. Mr. Messey was with the public accounting firm of Ernst & Young from
1968 to 1992, and during that period served as an SEC Audit Partner from 1981 to 1992. He
currently serves as a director and audit committee chairperson on the board of Stereotaxis
(NASDAQ:STXS), and additionally serves on the compensation committee of Stereotaxis’ board. As
well, Mr. Messey currently serves on the advisory board of Mississippi Lime Company, a non-public
trust, and is chairperson of the audit committee and serves on the compensation committee of that
advisory board.
Mr. Messey has over 40 years of experience in accounting and finance, including 8 years as the
Chief Financial Officer of a public company, 6 years as the Chief Financial Officer of a large
privately held company and 11 years as an SEC audit partner. His extensive accounting, financial
and executive management experience, as well as his in-depth knowledge of the mining industry
generally, provide him with the necessary skills to be a member of the board of directors of our
general partner, a member of the Audit Committee and a member of the Compensation Committee. With
respect to the Audit Committee, he also qualifies as an “audit committee financial expert.”
77
Corporate Governance
The board of directors of our general partner has adopted corporate governance guidelines to
assist it in the exercise of its responsibilities to provide effective governance over our affairs
for the benefit of our unitholders. In addition, we have adopted a code of business conduct and
ethics, which sets forth legal and ethical standards of conduct for all our officers, directors and
employees. The corporate governance guidelines, the code of business conduct and ethics and the
charters of our audit and compensation committees are available on our website at
www.OxfordResources.com and in print without charge to any unitholder who requests any of them. A
unitholder may make such a request in writing by mailing such request to Brian A. Meilton at
Investor Relations, Oxford Resource Partners, LP, 41 South High Street, Suite 3450, Columbus, Ohio
43215, or by emailing such request to Mr. Meilton at bmeilton@OxfordResources.com. Amendments to,
or waivers from, the code of business conduct and ethics will also be available on our website and
reported as may be required under SEC rules; however, any technical, administrative or other
non-substantive amendments to the code of business conduct and ethics may not be posted. Please
note that the preceding Internet address is for information purposes only and is not intended to be
a hyperlink. Accordingly, no information found or provided at that Internet address or at our
website in general is intended or deemed to be incorporated by reference herein.
Conflicts Committee
Our partnership agreement provides for the Conflicts Committee, as circumstances warrant, to
review conflicts of interest between us and our general partner or between us and affiliates of our
general partner. The Conflicts Committee, consisting solely of independent directors, determines
if the resolution of a conflict of interest that has been presented to it by our general partner is
fair and reasonable to us. The members of the Conflicts Committee may not be executive officers or
employees of our general partner or directors, executive officers or employees of its affiliates.
In addition, the members of the Conflicts Committee must meet the independence and experience
standards established by the NYSE and the Exchange Act.
Audit Committee
The board of directors of our general partner has established an audit committee, or Audit
Committee, that complies with the NYSE requirements and Section 3(a)(58)(A) of the Exchange Act.
Our general partner is generally required to have at least three independent directors serving on
its board at all times. Gerald A. Tywoniuk, Peter B. Lilly and Robert J. Messey are our
independent directors and serve as the members of the Audit Committee. The board has determined
that Mr. Tywoniuk, who serves as the chairman of the Audit Committee, and also Mr. Messey, each
have such accounting or related financial management expertise sufficient to qualify him as an
audit committee financial expert in accordance with Item 401 of Regulation S-K.
The Audit Committee meets on a regularly-scheduled basis with our independent accountants at
least four times each year and is available to meet at their request. The Audit Committee has the
authority and responsibility to review our external financial reporting, to review our procedures
for internal auditing and the adequacy of our internal accounting controls, to consider the
qualifications and independence of our independent accountants, to engage and resolve disputes with
our independent accountants, including the letter of engagement and statement of fees relating to
the scope of the annual audit work and special audit work that may be recommended or required by
the independent accountants, and to engage the services of any other advisors and accountants as
the Audit Committee deems advisable. The Audit Committee reviews and discusses the audited
financial statements with management, discusses with our independent auditors matters required to
be discussed by SAS 114 (Communications with Audit Committees), and makes recommendations to the
board of directors of our general partner regarding the inclusion of our audited financial
statements in this Annual Report on Form 10-K.
The Audit Committee is authorized to recommend periodically to the board of directors any
changes or modifications to its charter that the Audit Committee believes may be required or
desirable.
Compensation Committee
The board of directors of our general partner has established a Compensation Committee. The
Compensation Committee establishes standards and makes recommendations concerning the compensation
of our officers and directors. In addition, the Compensation Committee determines and establishes
the standards for any awards to our officers and other employees, including the performance
standards or other restrictions pertaining to the vesting of any
such awards, under our long-term incentive plan. Brian D. Barlow, Peter B. Lilly, Robert J.
Messey and Gerald A. Tywoniuk serve as the members of the Compensation Committee. Mr. Barlow
serves as the chairman of the Compensation Committee.
78
Meeting of Non-Management Directors and Communications with Directors
At each quarterly meeting of our general partner’s board of directors, all of our independent
directors meet in an executive session without management participation or participation by
non-independent directors. Mr. Tywoniuk, the chairman of the Audit Committee, presides over these
executive sessions.
Our general partner’s board of directors welcomes questions or comments about us and our
operations. Unitholders or interested parties may contact the board of directors, including any
individual director, by contacting the Secretary of our general partner at
dmaher@OxfordResources.com or at the following address and fax number; Name of the Director(s),
c/o Secretary, Oxford Resource Partners, LP, 41 South High Street, Suite 3450, Columbus, Ohio
43215, 614-754-7100.
Section 16(a) Beneficial Ownership Reporting Compliance
Section 16(a) of the Exchange Act requires our general partner’s board of directors and
executive officers, and persons who own more than 10 percent of a registered class of our equity
securities, to file with the SEC and any exchange or other system on which such securities are
traded or quoted initial reports of ownership and reports of changes in ownership of our common
units and other equity securities. Officers, directors and greater than 10 percent unitholders are
required by the SEC’s regulations to furnish to us and any exchange or other system on which such
securities are traded or quoted with copies of all Section 16(a) forms they filed with the SEC. To
our knowledge, based solely on a review of the copies of such reports furnished to us and written
representations that no other reports were required, we believe that all reporting obligations of
our general partner’s officers, directors and greater than 10 percent unitholders under Section
16(a) were satisfied during the year ended December 31, 2010.
|
|
|
| ITEM 11. |
|
EXECUTIVE COMPENSATION |
Compensation Discussion and Analysis
The following is a discussion of the compensation policies and decisions of the board of
directors of our general partner, or the Board, and the Compensation Committee for the fiscal year
ended December 31, 2010 with respect to the following individuals, who are executive officers of
our general partner and referred to as the “named executive officers”:
| |
• |
|
Charles C. Ungurean, President and Chief Executive Officer; |
| |
• |
|
Jeffrey M. Gutman, Senior Vice President, Chief Financial Officer and Treasurer; |
| |
• |
|
Thomas T. Ungurean, Senior Vice President, Equipment, Procurement and Maintenance; |
| |
• |
|
Gregory J. Honish, Senior Vice President, Operations; and |
| |
• |
|
Michael B. Gardner, General Counsel and Assistant Secretary. |
Our compensation program is designed to recruit and retain as executive officers individuals
with the highest capacity to develop, grow and manage our business, and to align their compensation
with our short-term and long-term goals. To do this, our compensation program for executive
officers is made up of the following components: (i) base salary, designed to compensate our
executive officers for work performed during the fiscal year; (ii) short-term incentive programs,
designed to reward our executive officers for our yearly performance and for their individual
performances during the fiscal year; and (iii) equity-based awards granted under the Oxford
Resource Partners, LP Amended and Restated Long-Term Incentive Plan, or our LTIP, which are meant
to align our executive officers’ interests with those of our unitholders and our long-term
performance.
79
Role of the Board, the Compensation Committee and Management
Our general partner, under the direction of the Board, is responsible for the management of
our operations and employs all of the employees that operate our business. Historically, from our
formation in August 2007 through compensation decisions made in early 2010, decisions with respect
to the compensation of executive officers were made by the Board, based primarily on negotiations
between our management group and the members of the Board who were not employees of our general
partner, or the Non-employee Directors. In connection with our initial public offering in 2010, we
revised certain policies and practices with respect to executive compensation. In particular, the
Board appointed the Compensation Committee to help the Board administer certain aspects of the
compensation policies and programs for our executive officers and certain other employees and to
make recommendations to the Board relating to the compensation of the directors and executive
officers of our general partner. The Compensation Committee and the Board are charged with, among
other things, the responsibility of:
| |
• |
|
reviewing executive officer compensation policies and practices to ensure adherence
to our compensation philosophies and that the total compensation paid to our executive
officers is fair, reasonable and competitive; |
| |
• |
|
reviewing base salary levels for our executive officers and determining any
adjustments thereto; |
| |
• |
|
assessing the individual performance of our Chief Executive Officer, or CEO, and our
other named executive officers and their contributions to our company-wide performance,
and determining the annual bonuses to be provided to our executive officers for a given
year after taking into account target bonus levels set forth in executive officers’
employment agreements or otherwise established at the outset of the year; and |
| |
• |
|
determining the types, amounts and vesting terms of awards to be provided to our
executive officers under our LTIP. |
The compensation programs for our executive officers consist of base salaries, annual
incentive bonuses and awards under our LTIP, in the form of equity-based phantom units, as well as
other customary employment benefits. In making compensation determinations, the Compensation
Committee and the Board consider the recommendations of our CEO with respect to the other executive
officers. The total compensation of our executive officers and the components and relative
emphasis among components of their annual compensation are reviewed on at least an annual basis by
the Compensation Committee with any proposed changes recommended to the Board for final approval.
Compensation Objectives and Methodology
The principal objective of our executive compensation program is to attract and retain
individuals of demonstrated competence, experience and leadership who share our business
aspirations, values, ethics and culture. A further objective is to provide incentives to and
reward our executive officers and other key employees for positive contributions to our business
and operations, and to align their interests with our unitholders’ interests.
In setting our compensation programs, we consider the following objectives:
| |
• |
|
to create unitholder value through sustainable earnings and cash available for
distribution; |
| |
• |
|
to provide a significant percentage of total compensation that is “at-risk” or
variable; |
| |
• |
|
to encourage significant equity holdings to align the interests of executive
officers and other key employees with those of unitholders; |
| |
• |
|
to provide competitive, performance-based compensation programs that allow us to
attract and retain superior talent; and |
| |
• |
|
to develop a strong linkage between business performance, safety, environmental
stewardship and cooperation on the one hand and executive compensation on the other
hand. |
80
Taking account of the foregoing objectives, we structured total 2010 compensation for our
executives to provide a guaranteed amount of cash compensation in the form of competitive base
salaries, while also providing a meaningful amount of annual cash compensation, dependent on our
performance and individual performance of the executives, in the form of discretionary annual
bonuses. We also sought to provide a portion of total compensation in
the form of equity-based awards under our LTIP, in order to align the interests of executives
and other key employees with those of our unitholders and for retention purposes. Prior to and
during 2010, we did not make regular annual grants of awards under our LTIP. Instead, such awards
had typically been made in connection with our formation, upon commencement of employment for
executives who joined us after our formation, and in discrete circumstances to reward service or
performance. In January 2011 but relating to performance in 2010, we made, and in the future we
expect to regularly make, equity-based awards as a part of our annual compensation decision-making
process.
Compensation decisions for individual executive officers were the result of the subjective
analysis of a number of factors, including the individual executive officer’s experience, skills or
tenure with us and changes to the individual executive officer’s position and responsibilities. In
measuring the contributions of executive officers and our performance, a variety of financial
measures were considered, including non-GAAP financial measures used by management to assess our
financial performance. Historically and in 2010, the Board has used and did use the amount of cash
distributions made to our equityholders as the primary measure of our operating performance. For a
discussion of cash distributions and related matters, please read “Item 5. Market for Registrant’s
Common Equity, Related Unitholder Matters and Issuer Purchases of Equity Securities — Cash
Distribution Policy.” In addition, an evaluation of the individual performance of each of the
executive officers was taken into consideration.
In making individual compensation decisions, the Board historically has not relied and in 2010
did not rely on pre-determined performance goals or targets. Instead, determinations regarding
compensation were the result of the exercise of judgment based on all reasonably available
information and, to that extent, were discretionary. Each executive officer’s current and prior
compensation was considered in setting compensation for 2010. The amount of each executive
officer’s current compensation was considered as a base against which determinations were made as
to whether increases were appropriate to retain the executive officer in light of competition or in
order to provide continuing performance incentives. The Board retained and exercised its
discretion to adjust the components of compensation to achieve our goal of recruiting, promoting
and retaining as executive officers individuals with the skills necessary to execute our business
strategy and develop, grow and manage our business.
Prior to 2010, we did not review executive compensation against a specific group of comparable
companies. Rather, the Board had historically relied upon the judgment and industry experience of
the Non-employee Directors in making decisions with respect to total compensation and with respect
to the allocation of total compensation among our three main components of compensation. For the
2010 performance period, the Compensation Committee made compensation recommendations to the Board
based upon trends occurring within our industry, including from a peer group of companies that our
Compensation Committee identified, which includes the following coal companies and similar-sized
publicly traded partnerships: Alliance Resource Partners, L.P., National Coal Corp., Westmoreland
Coal Co., James River Coal Co., International Coal Group, Inc., Patriot Coal Corporation, Rhino
Resource Partners LP, Vanguard Natural Resources, LLC, Global Partners LP, Legacy Reserves LP,
Copano Energy LLC, Suburban Propane Partners LP and Crosstex Energy Inc. Although the Board and
our Compensation Committee reviewed compensation data relating to our peer group of companies, they
do not and did not benchmark compensation at any particular level relative to our peer group.
81
Elements of the Compensation Programs
Overall, our executive officer compensation programs are designed to be consistent with the
philosophy and objectives set forth above. The principal elements of our executive officer
compensation programs are summarized in the table below, followed by a more detailed discussion of
each compensation element.
| |
|
|
|
|
| Element |
|
Characteristics |
|
Purpose |
|
|
|
|
|
Base Salaries
|
|
Fixed annual cash
compensation in the
form of base
salaries. Our
executive officers
are eligible for
periodic increases
in base salaries.
Increases may be
based on
performance or such
other factors as
the Board or the
Compensation
Committee may
determine.
|
|
Keep our fixed
annual compensation
competitive with
the defined market
for skills and
experience
necessary to
execute our
business strategy. |
|
|
|
|
|
Annual Incentive Bonuses
|
|
Performance-related
annual cash
incentives earned
based on our
objectives and
individual
performance of the
executive officers.
Trends for our
peer group are
taken into account
in setting annual
cash incentive
awards for our
executive officers.
|
|
Align annual
compensation with
our financial
performance and
reward our
executive officers
for individual
performance during
the year and for
contributing to our
financial success.
Amounts provided as
incentive bonuses
are also designed
to provide
competitive total
direct
compensation;
potential for
awards above or
below target
amounts are
intended to
motivate our
executive officers
to achieve greater
levels of
performance. |
|
|
|
|
|
Equity-Based Awards
(phantom-units)
|
|
Performance-related,
equity-based
awards granted at
the discretion of
the Board. Awards
are based on our
performance and on
competitive
practices at peer
companies. Grants
typically vest
ratably over four
years and will be
settled upon
vesting with either
a net cash payment
or an issuance of
common units, at
the discretion of
the Board.
|
|
Align interests of
our executive
officers with
unitholders and
motivate and reward
our executive
officers to
increase unitholder
value over the long
term. Ratable
vesting in four
annual installments
is designed to
facilitate
retention of our
executive officers. |
|
|
|
|
|
Retirement Plan
|
|
Qualified 401(k)
retirement plan
benefits are
available for our
executive officers
and all other
regular full-time
employees.
|
|
Provide our
executive officers
and other employees
with the
opportunity to save
for their future
retirement. |
|
|
|
|
|
Health and Welfare Benefits
|
|
Health and welfare
benefits (medical,
dental, vision,
disability
insurance and life
insurance) are
available for our
executive officers
and all other
regular full-time
employees.
|
|
Provide benefits to
meet the health and
wellness needs of
our executive
officers and other
employees and their
families. |
82
Base Salaries
Design. Base salaries for our executive officers are determined annually by an assessment of
our overall financial and operating performance, each executive officer’s performance evaluation
and changes in executive officer responsibilities. While many aspects of performance can be
measured in financial terms, senior management is also evaluated in areas of performance that are
more subjective. These areas include the development and execution of strategic plans, the
exercise of leadership in the development of management and other employees, innovation and
improvement in our business activities and each executive officer’s involvement in industry
groups and in the communities that we serve. We seek to compensate executive officers for their
performance throughout the year with annual base salaries that are fair and competitive within our
marketplace. We believe that executive officer base salaries should be competitive with salaries
for executive officers in similar positions and with similar responsibilities in our marketplace
and adjusted for financial and operating performance and each executive officer’s performance
evaluation, length of service with us and previous work experience. Individual salaries have
historically been established by the Board based on the general industry knowledge and experience
of the Non-employee Directors, in alignment with these considerations and with reference to
industry survey data, to ensure the attraction, development and retention of superior talent. For
base salary changes in 2010 and going forward, base salary determinations focused and will continue
to focus on the above considerations and also were made and will be made based upon relevant market
data, including data from our peer group.
Base salaries are reviewed annually to ensure continuing consistency with market levels and
our level of financial performance during the prior year. Future adjustments to base salaries and
salary ranges will reflect average movement in the competitive market as well as individual
performance. Prior to our initial public offering, annual base salary adjustments, if any, for the
CEO were determined by the Non-employee Directors. Since our initial public offering, annual base
salary adjustments for the CEO have been and will be approved by the Non-employee Directors based
upon recommendations from the Compensation Committee. Prior to our initial public offering, annual
base salary adjustments, if any, for the other executive officers were determined by the Board
taking into account input from the CEO. Since our initial public offering, annual base salary
adjustments for the other executive officers have been and will be approved by the Board based upon
recommendations from the Compensation Committee, which recommendations may take into account input
from the CEO.
Actions Taken With Respect to Base Salaries in 2010. Effective July 19, 2010, base salary
increases were provided to each of the executive officers as provided in the table below. These
base salary increases were provided as “merit” increases based on the Board’s subjective assessment
of each executive officer’s performance since his last salary increase, considering a variety of
factors, none of which was individually material to such assessment, to reflect increased levels of
responsibility following our initial public offering, and to ensure that the base salaries for the
executive officers remained competitive with other companies in our industry. The Board considered
the salary levels of comparable executive officers in our peer group, and used those salary levels
as a check against their conclusions regarding salaries for our executive officers but did not
benchmark compensation at any particular level relative to our peer group.
| |
|
|
|
|
|
|
|
|
|
|
|
|
| |
|
Base Salary at Start |
|
|
Base Salary Increase |
|
|
2010 Base Salary |
|
| Name |
|
of 2010 |
|
|
in 2010 |
|
|
Following Increase(1) |
|
Charles C. Ungurean |
|
$ |
375,000 |
|
|
$ |
125,000 |
|
|
$ |
500,000 |
|
Jeffrey M. Gutman |
|
|
260,000 |
|
|
|
10,000 |
|
|
|
270,000 |
|
Thomas T. Ungurean |
|
|
225,000 |
|
|
|
50,000 |
|
|
|
275,000 |
|
Gregory J. Honish |
|
|
150,000 |
|
|
|
35,000 |
|
|
|
185,000 |
|
Michael B. Gardner |
|
|
145,000 |
|
|
|
20,000 |
|
|
|
165,000 |
|
| (1) |
|
There have been no changes in base salaries at the start of 2011 and to date, except that the
base salary of Gregory J. Honish has been increased by $25,000 to $210,000 effective January
1, 2011. This increase was approved by the Board based upon the recommendation of the
Compensation Committee, which had determined that the increase was warranted to remain
competitive for comparable positions with other companies in our industry and to reward
performance. |
Annual Incentive Bonuses
Design. As one way of accomplishing compensation objectives, our executive officers are
rewarded for their contribution to our financial and operational success through the award of
discretionary annual cash incentive bonuses. Prior to our initial public offering, annual
incentive awards, if any, for the CEO were determined by the Non-employee Directors. Since our
initial public offering, annual incentive awards, if any, for the CEO have been and will be
approved by the Non-employee Directors based upon recommendations from the Compensation Committee.
Prior to our initial public offering, annual incentive awards, if any, for the other executive
officers were determined by the
Board taking into account input from the CEO. Since our initial public offering, annual
incentive awards for the other executive officers have been and will be approved by the Board based
upon recommendations from the Compensation Committee, which recommendations may take into account
input from the CEO.
83
For our executive officers, target bonus amounts are set forth in their employment agreements,
which are discussed in more detail under “— Employment and Severance Arrangements” below. The
employment agreements for the executive officers provide for their eligibility to receive annual
incentive bonuses in an amount up to 50% (66.6% in the case of Charles C. Ungurean and Thomas T.
Ungurean) of their annual base salaries, or such other greater percentage as may be approved by the
Non-employee Directors (in the case of Charles C. Ungurean) or the Board (in the case of our other
executive officers), in any such case based on the recommendations of the Compensation Committee.
Notwithstanding such target bonus amounts, the Compensation Committee, Non-employee Directors and
Board have broad discretion to maintain, reduce or increase the award amounts when making their
final bonus recommendations and determinations.
The annual incentive bonus award for each executive officer is contingent on the executive
officer’s continued employment with our general partner at the time of the award. Further, bonuses
(similar to other elements of the compensation provided to executive officers) are not based on a
prescribed formula but rather are determined on a discretionary basis and generally are based on a
subjective evaluation referencing individual, company-wide and industry performance criteria. The
Board and the Compensation Committee believe that this approach to assessing performance results in
a more comprehensive evaluation for compensation decisions. The Board and the Compensation
Committee recognize the following factors in making recommendations and determinations of
discretionary annual incentive bonuses (without assigning any particular weighting to any factor):
| |
• |
|
financial performance for a given fiscal year, including the level of achievement of our
cash distribution target for the year as discussed below; |
| |
• |
|
distribution performance for a given fiscal year compared to the peer group; |
| |
• |
|
unitholder total return for a given fiscal year compared to the peer group; |
| |
• |
|
competitive compensation data for executive officers in the peer group; |
| |
• |
|
a subjective performance evaluation based on company-wide financial and individual
qualitative performance, as determined in the Board’s discretion; and |
| |
• |
|
the scope, level of expertise and experience required for the executive officer’s
position. |
These factors are considered to be the most appropriate measures upon which to base the annual
incentive cash bonus decisions because the Compensation Committee and our Board believe that they
help to align individual compensation with competency and contribution and that they most directly
correlate to increases in long-term value for our unitholders.
The Board and the Compensation Committee retain broad discretion with respect to the amount of
each executive officer’s annual bonus award, in order to provide total cash compensation for the
year that is competitive and consistent with total cash compensation provided by other companies in
our industry, as determined based on the industry knowledge and experience of the Non-employee
Directors and review of the compensation levels of our peer group, and to address the Board’s (and
in the case of the CEO the Non-employee Directors’) assessment of each executive officer’s
individual performance and contributions to our overall success. Based on these considerations, the
Board (and in the case of the CEO the Non-employee Directors) determined to award the incentive
bonus amounts set forth in the table below to our executive officers for performance in 2010.
These bonus awards in all cases represented 45% of the applicable executive’s base salary, and as
compared to the target bonus amounts set forth in their employment agreements these awards
represented approximately 68%-90% of the applicable target bonus amounts. These final amounts were
ultimately determined based on an assessment of what was fair and competitive total cash
compensation for each executive officer in light of our cash distribution performance for 2010, the
individual executive officer’s level of responsibility within our organization and the view of the
Compensation Committee and the Board (and in the case of the CEO the Non-employee Directors) of
each executive officer’s contributions to our success for 2010.
84
| |
|
|
|
|
| Name |
|
2010 Bonus |
|
Charles C. Ungurean |
|
$ |
225,000 |
|
Jeffrey M. Gutman |
|
|
121,500 |
|
Thomas T. Ungurean |
|
|
123,750 |
|
Gregory J. Honish |
|
|
83,250 |
|
Michael B. Gardner |
|
|
74,250 |
|
Equity-Based Awards
Design. Our LTIP was originally adopted in 2007 in connection with our formation and amended
and restated in July of 2010 in connection with our initial public offering. In adopting our LTIP,
the Board recognized that it needed a source of equity to attract new members to and retain members
of the management team, as well as to provide an equity incentive to other key employees. We
believe our LTIP promotes a long-term focus on results and aligns executive and unitholder
interests.
Our LTIP is designed to encourage responsible and profitable growth while taking into account
non-routine factors that may be integral to our success. Long-term incentive compensation in the
form of equity-based grants are used to incentivize performance that leads to enhanced unitholder
value, encourage retention and closely align the executive officers’ and key employees’ interests
with unitholders’ interests. Equity-based grants provide a vital link between the long-term
results achieved for our unitholders and the rewards provided to executive officers and other key
employees.
Phantom Units. The only awards made under our LTIP since its adoption have been phantom
units. A phantom unit is a notional unit granted under our LTIP that entitles the holder to
receive an amount of cash equal to the fair market value of one common unit upon vesting of the
phantom unit, unless the Board elects to pay such vested phantom unit with a common unit in lieu of
cash. Historically, including in 2010, we have always issued common units in lieu of cash.
Unvested phantom units are forfeited at the time the holder terminates employment, except for a
termination due to death or disability, which results in vesting acceleration. In general, phantom
units awarded to executive officers under our LTIP vest as to 25% of the award on the initial
vesting date established at the time of the award and on each of the first three anniversaries of
that initial vesting date. Mr. Gutman’s LTIP awards will vest in full upon a change of control of
us or our general partner.
Equity-Based Award Policies. Prior to 2010, equity-based awards were granted by the Board and
were limited to the grants at our formation in 2007 (or for executives who joined us after our
formation, upon or in connection with their commencement of employment) and grants that were made
in certain limited circumstances to reward individual service and performance. In early 2010, the
Board delegated a portion of its duties and responsibilities under our LTIP to the Compensation
Committee with the exception that equity-based awards will be awarded more regularly as part of the
ongoing total annual compensation package for executive officers, rather than only in such discrete
circumstances. Annual equity compensation grants, if any, for the CEO are approved by the
Non-employee Directors based upon recommendations from the Compensation Committee. Annual equity
compensation grants for the other executive officers are approved by the Board based upon
recommendations from the Compensation Committee, which recommendations may take into account input
from the CEO.
Equity-Based Awards for 2010. In January 2010, Jeffrey M. Gutman received an award of 27,285
phantom units in recognition of his performance in connection with a restructuring of certain of
our indebtedness and the completion of the acquisition of Illinois Basin assets from Phoenix Coal
in September 2009. In making this award, the Board also took into account its determination that
the initial equity-based awards granted to Mr. Gutman in connection with his commencement of
employment in 2008 were, in the Board’s view based on its general industry knowledge and
experience, below the level of equity participation granted to similarly situated executives at
many other companies in our industry.
85
As part of its determination to make regular equity-based awards to our named executive
officers as part of their annual compensation package, the Board approved awards of phantom units
which were granted to the named executive officers on January 1, 2011 in the amounts set forth in
the table below. These awards, although granted in 2011, were intended as a part of the named
executive officers’ 2010 compensation and were granted to reward the
named executive officers for performance in 2010. The Board determined the amount of the
awards such that the phantom unit awards represent a total of 10% of each named executive officers’
total compensation for 2010 (inclusive of base salaries, target bonuses and phantom unit awards).
In addition, the Board determined at that time to award further phantom units to Gregory J. Honish
after determining that the initial equity-based awards granted to him in 2007 were below the level
of equity participation appropriate for his position with and contributions to us, based on an
assessment of Mr. Honish’s scope of responsibility within our organization and an understanding of
the equity participation of comparable executives at other companies in our peer group.
| |
|
|
|
|
|
|
|
|
| |
|
Value of |
|
|
Number of |
|
| Name |
|
Phantom Units (1) |
|
|
Phantom Units |
|
Charles C. Ungurean |
|
$ |
92,227 |
|
|
|
3,786 |
|
Jeffrey M. Gutman |
|
|
45,017 |
|
|
|
1,848 |
|
Thomas T. Ungurean |
|
|
50,742 |
|
|
|
2,083 |
|
Gregory J. Honish (2) |
|
|
80,851 |
|
|
|
3,319 |
|
Michael B. Gardner |
|
|
27,502 |
|
|
|
1,129 |
|
| |
|
|
| (1) |
|
The number of phantom units was determined based on the closing trading price of
our common units on December 31, 2010 so that the number of phantom units corresponding to the
number of our common units having a value equal to the indicated dollar amount were granted. |
| |
| (2) |
|
The portion of the units related to 2010 performance was 1,266 units valued at
$30,840, with the remainder of the units consisting of 2,053 units valued at $50,011 being to
adjust his level of equity participation as described above. |
In connection with the closing of our initial public offering, Mr. Gutman was issued 5.979201
Class B Units, representing a 0.44% equity interest, in our general partner pursuant to his
employment agreement. The issuance of such equity interest was made to Mr. Gutman in satisfaction
of our general partner’s prior commitment to provide such an equity interest upon the consummation
of such an offering.
Deferred Compensation
Tax-deferred retirement plans are a common way that companies assist employees in preparing
for retirement. Through 2009, we maintained a defined contribution money purchase pension plan to
which we made contributions for the benefit of the participants, including named executive
officers. Effective beginning in 2010, we provide our eligible executive officers and other
employees with an opportunity to participate in our 401(k) savings plan. The plan allows executive
officers and other employees to contribute compensation for retirement up to IRS imposed limits
(for 2010, $16,500 for participants age 49 and under and $22,000 for participants age 50 and over),
either on a tax deferred or after-tax basis. The 401(k) plan permits us to make annual
discretionary contributions to the plan as a percentage of the eligible compensation of
participants in the plan. Annual contributions of 3% or more of such eligible compensation will
maintain “safe harbor” tax-qualified status for the plan and, while such contributions are
discretionary, we intend generally to make annual contributions at that level or higher, subject to
applicable IRS limits. For each of 2010 and 2011, we committed to make an employer discretionary
contribution of 4% of such eligible compensation. Decisions regarding this element of compensation
do not impact any other element of compensation.
Perquisites and Other Benefits
Although perquisites are not a significant factor in our compensation programs, we provide
certain limited perquisite and personal benefits to certain of the named executive officers,
including the use primarily for business purposes (with personal usage being limited to usage for
commuting purposes) of company-owned automobiles for Charles C. Ungurean and Thomas T. Ungurean.
We provide these benefits to assist the executive officers in performing their services for us and
they are not factored into the Board’s determinations with respect to other elements of total
compensation. In addition, under our company-wide policy in effect through 2009, we maintained for
all salaried employees including the executive officers a vacation program that provided additional
annual payments to each of such employees in the amount of his or her base salary over a period
equal to the vacation time allotted to him or her. This payment was in addition to continuing the
payment of base salaries for all salaried employees including the executive officers during periods
when they were on vacation. Effective in 2010, the vacation policy was changed
so that no such additional payments are made but base salaries will continue to be paid to the
salaried employees including the executive officers while they are on vacation. The additional
vacation-related payments made to the named executive officers in 2010 are included in bonus
amounts and set forth in a footnote to the Summary Compensation Table below.
86
Recoupment Policy
We currently do not have a formal compensation recoupment policy applicable to annual
incentive bonuses, equity awards or other compensation. The Compensation Committee has reviewed
and is anticipating legislative and regulatory developments with respect to such a policy and
intends to adopt such a policy consistent with applicable legal and regulatory requirements and
securities exchange listing standards as well as economic and market conditions.
Employment and Severance Arrangements
The Board and the Compensation Committee consider the maintenance of a sound management team
to be essential to protecting and enhancing our best interests. To that end, we recognize that the
uncertainty that may exist among management with respect to their “at-will” employment with our
general partner may result in the departure or distraction of management personnel to our
detriment. Accordingly, our general partner has employment agreements with our executive officers.
These employment agreements have two year terms, provide for the base salary and target bonus
amounts for each executive officer and contain severance arrangements that we believe are
appropriate to encourage the continued attention and dedication of members of our management. The
employment agreements with our executive officers are described more fully below under “—
Potential Payment Upon Termination or Change in Control — Employment Agreements with Named
Executive Officers.”
Compensation Committee Report
We have reviewed and discussed with management certain compensation discussion and analysis
provisions to be included in this Annual Report on Form 10-K for the year ended December 31, 2010
to be filed pursuant to Section 13(a) of the Securities and Exchange Act of 1934, or this Annual
Report on Form 10-K. Based on that review and discussion, we recommend to the Board that the
compensation discussion and analysis provisions be included in this Annual Report on Form 10-K.
Compensation Committee
Brian D. Barlow, Chairman
Peter B. Lilly
Robert J. Messey
Gerald A. Tywoniuk
Risk Assessment in Compensation Programs
Management of our general partner, with the support of our human resources, finance and legal
departments, has assisted the Compensation Committee and the Board in analyzing the potential risks
arising from our compensation policies and practices, and management, the Compensation Committee
and the Board have all determined that there are no such risks that are reasonably likely to have a
material adverse effect on us.
87
Summary Compensation Table
The following table sets forth certain information with respect to the compensation paid to
the named executive officers for the periods indicated.
| |
|
|
|
|
|
|
|
|
|
|
|
|
|
|
|
|
|
|
|
|
|
|
|
|
| |
|
|
|
|
|
|
|
|
|
|
|
|
|
Unit |
|
|
All Other |
|
|
|
|
| |
|
|
|
|
|
Salary |
|
|
Bonus |
|
|
Awards |
|
|
Compensation |
|
|
|
|
| Name and Principal Position |
|
Year |
|
|
($)(1) |
|
|
($)(2) |
|
|
($)(3) |
|
|
($)(4) |
|
|
Total ($) |
|
Charles C. Ungurean |
|
|
2010 |
|
|
|
432,212 |
|
|
|
253,846 |
|
|
|
|
|
|
|
13,691 |
|
|
|
699,749 |
|
President and Chief Executive Officer |
|
|
2009 |
|
|
|
375,002 |
|
|
|
248,077 |
|
|
|
|
|
|
|
18,888 |
|
|
|
641,967 |
|
Jeffrey M. Gutman
Senior Vice President, Chief Financial |
|
|
2010 |
|
|
|
265,423 |
|
|
|
141,500 |
|
|
|
295,883 |
|
|
|
14,820 |
|
|
|
717,626 |
|
Officer and Treasurer |
|
|
2009 |
|
|
|
261,385 |
|
|
|
125,481 |
|
|
|
|
|
|
|
15,370 |
|
|
|
402,236 |
|
Thomas T. Ungurean
|
|
|
| |
|
|
|
|
|
|
|
|
|
|
|
|
|
|
|
|
|
|
|
|
Senior Vice President, Equipment,
|
|
|
2010 |
|
|
|
247,981 |
|
|
|
141,057 |
|
|
|
|
|
|
|
11,322 |
|
|
|
400,360 |
|
Procurement and Maintenance |
|
|
2009 |
|
|
|
233,333 |
|
|
|
190,385 |
|
|
|
|
|
|
|
16,572 |
|
|
|
440,290 |
|
Gregory J. Honish |
|
|
2010 |
|
|
|
166,193 |
|
|
|
91,580 |
|
|
|
|
|
|
|
7,149 |
|
|
|
264,922 |
|
Senior Vice President, Operations |
|
|
2009 |
|
|
|
142,116 |
|
|
|
70,096 |
|
|
|
|
|
|
|
12,771 |
|
|
|
224,983 |
|
Michael B. Gardner |
|
|
2010 |
|
|
|
154,404 |
|
|
|
76,988 |
|
|
|
|
|
|
|
6,802 |
|
|
|
238,194 |
|
General Counsel and Assistant Secretary |
|
|
2009 |
|
|
|
152,083 |
|
|
|
75,567 |
|
|
|
|
|
|
|
13,560 |
|
|
|
241,210 |
|
| |
|
|
| (1) |
|
Amounts shown in this column for 2010 represent salaries paid to the named executive
officers in 2010 and include pro-rated amounts based on the increases in salaries that
occurred in 2010. |
| |
| (2) |
|
The bonus amounts for the named executive officers for 2010 include and reflect
bonuses paid in early 2011 that relate to services performed in 2010, which bonus amounts for
each of the named executive officers were as follows: Charles C. Ungurean — $225,000; Jeffrey
M. Gutman — $121,500; Thomas T. Ungurean — $123,750; Gregory J. Honish — $83,250; and Michael
B. Gardner — $74,250. The bonus amounts also include vacation payments in 2010, as follows:
Charles C. Ungurean — $28,846; Jeffrey M. Gutman — $20,000; Thomas T. Ungurean — $17,307;
Gregory J. Honish — $8,330; and Michael B. Gardner — $2,738. |
| |
| (3) |
|
Amount shown for Jeffrey M. Gutman reflects the grant date fair value of phantom
units awarded under the LTIP to Mr. Gutman in January 2010 of $261,117, as well as an estimate
of the grant date fair value of the Class B units in our general partner granted to Mr. Gutman
in connection with the consummation of our initial public offering, of $34,766, each as
described in more detail under the heading “Compensation Discussion and Analysis — Equity
Based Awards” above, and each as determined in accordance with FASB ASC Topic 718. |
| |
| (4) |
|
Amounts shown in this column for 2010 include contributions being made to our 401(k)
savings plan for each of the named executive officers with respect to services performed in
2010, payments made in 2010 with respect to life insurance benefits provided to each of the
named executive officers, a holiday-related allowance paid in 2010 to each of the named
executive officers, the taxable portion of automobile allowances paid to Jeffrey M. Gutman and
Gregory J. Honish, and the dues paid for Charles C. Ungurean and Jeffrey M. Gutman for a
dining and athletic club facility located in the same building as our executive offices. For
each of Charles C. Ungurean and Thomas T. Ungurean, who are provided company-owned automobiles
primarily for business use (with personal use being limited to usage for commuting purposes),
the amounts shown for 2010 also include the cost to us of providing an automobile to them for
their use for the estimated personal usage portion thereof for commuting purposes (11% of the
total cost in the case of Charles C. Ungurean and 5% of the total cost in the case of Thomas
T. Ungurean) in the amount of $1,977 and $1,239, respectively. |
88
Grants of Plan-Based Awards for 2010
The following table provides information regarding grants of plan-based awards to named
executive officers for the year ended December 31, 2010.
| |
|
|
|
|
|
|
|
|
|
|
|
|
| |
|
|
|
|
|
All Other Unit |
|
|
Grant Date Fair |
|
| |
|
|
|
|
|
Awards: Number |
|
|
Value of Unit |
|
| Name |
|
Grant Date |
|
|
of Units (#) |
|
|
Awards ($) |
|
Jeffrey M. Gutman |
|
|
1/1/10 |
|
|
|
27,285 |
(1) |
|
|
261,117 |
(2) |
Senior Vice President, Chief Financial Officer and Treasurer |
|
|
7/19/10 |
|
|
|
5.979201 |
(3) |
|
|
34,766 |
(4) |
| |
|
|
| (1) |
|
Amount shown is the number of phantom units granted to Jeffrey M. Gutman on January
1, 2010, as adjusted for a unit split that occurred in connection with our initial public
offering. |
| |
| (2) |
|
Amount shown is based on the grant date fair market value of our common units of
$17.43 ($9.57 after adjustment for a unit split that occurred in connection with our initial
public offering). |
| |
| (3) |
|
Amount shown is the number of Class B units of our general partner granted to
Jeffrey M. Gutman in connection with our initial public offering. The units represent a 0.44%
profits interest in our general partner. |
| |
| (4) |
|
Amount shown is an estimate of the grant date fair market value of the Class B
units, as determined in accordance with FASB ASC Topic 718. |
Outstanding Equity-Based Awards at December 31, 2010
The following table provides information regarding outstanding equity-based awards held by the
named executive officers as of December 31, 2010. All such equity-based awards consist of phantom
units granted under our LTIP, other than the Class B units in our general partner held by Jeffrey
M. Gutman. Neither Charles C. Ungurean nor Thomas T. Ungurean held any outstanding equity-based
awards at December 31, 2010. None of the named executive officers hold outstanding option awards.
| |
|
|
|
|
|
|
|
|
|
|
|
|
| |
|
Unit Awards |
|
| |
|
Number of |
|
|
|
|
|
|
|
| |
|
Phantom |
|
|
Number of |
|
|
Market Value |
|
| |
|
Units That |
|
|
Class B Units |
|
|
of Units That |
|
| |
|
Have Not |
|
|
That Have |
|
|
Have Not |
|
| |
|
Vested |
|
|
Not Vested |
|
|
Vested |
|
| Name |
|
(#)(1) |
|
|
(#)(2) |
|
|
($)(3) |
|
Jeffrey M. Gutman |
|
|
33,981 |
|
|
|
|
|
|
|
827,777 |
|
Senior Vice President, Chief Financial Officer and Treasurer |
|
|
|
|
|
|
5.979201 |
|
|
|
45,890 |
|
Gregory J. Honish
Senior Vice President, Operations |
|
|
4,669 |
|
|
|
|
|
|
|
113,737 |
|
Michael B. Gardner
General Counsel and Assistant Secretary |
|
|
2,917 |
|
|
|
|
|
|
|
71,058 |
|
| |
|
|
| (1) |
|
As to Mr. Gutman’s unvested units, 6,821 units, 6,822 units and 6,821 units vest on
January 1, 2011 and the next two anniversaries thereof, respectively, and the remaining 13,517
units will vest on March 31, 2011. Messrs. Honish’s and Gardner’s unvested units, which were
granted in 2007, will vest on December 1, 2011. |
| |
| (2) |
|
Amount shown is the number of Class B units of our general partner granted to Mr.
Gutman in connection with our initial public offering. These units vest 25% on the first
anniversary of the July 19, 2010 grant date and an additional 25% on each of the next three
subsequent anniversaries of that grant date. |
| |
| (3) |
|
For phantom units, based on the closing price of our common units of $24.36 on
December 31, 2010; for Class B units, reflects an estimate of the fair market value of the
Class B units of our general partner as of December 31, 2010, as determined in accordance with
FASB ASC Topic 718. |
In addition to these outstanding equity-based awards at December 31, 2010, there were
additional equity-based awards on January 1, 2011 as described above under “Equity-Based Awards —
Equity-Based Awards for 2010.”
89
Units Vested in 2010
The following table shows the phantom unit awards that vested during 2010. Charles C.
Ungurean and Thomas T. Ungurean did not hold or vest in any phantom unit awards in 2010 and none of
the named executive officers held or exercised any stock options in 2010.
| |
|
|
|
|
|
|
|
|
| |
|
Number of |
|
|
|
|
| |
|
Units |
|
|
Value |
|
| |
|
Acquired on |
|
|
Realized on |
|
| Name |
|
Vesting (#) |
|
|
Vesting ($) |
|
Jeffrey M. Gutman
Senior Vice President, Chief Financial Officer and Treasurer(1) |
|
|
20,342 |
|
|
|
194,711 |
|
Gregory J. Honish
Senior Vice President, Operations(2) |
|
|
4,669 |
|
|
|
102,531 |
|
Michael B. Gardner
General Counsel and Assistant Secretary(2) |
|
|
2,917 |
|
|
|
64,057 |
|
| |
|
|
| (1) |
|
Of these units, 6,822 units vested on January 1, 2010 and 13,520 units vested on
March 31, 2010, and the value realized amount reflects a unit value of $9.57 per unit, the
fair market value on each such vesting date (all after adjustment for a unit split that
occurred in connection with our initial public offering). |
| |
| (2) |
|
Units vested on December 1, 2010, and the value realized amounts reflect a unit
value of $21.96 per unit, the closing price on such vesting date. |
Pension Benefits
The named executive officers do not participate in any defined benefit pension plans and
received no pension benefits during the year ended December 31, 2010.
Nonqualified Deferred Compensation
The named executive officers do not participate in any nonqualified deferred compensation
plans and received no nonqualified deferred compensation during the year ended December 31, 2010.
Potential Payment Upon Termination or Change in Control
Employment Agreements with Named Executive Officers
Our general partner has entered into employment agreements with each of Messrs. Charles C.
Ungurean, Gutman, Thomas T. Ungurean, Honish and Gardner, which became effective upon the closing
of our initial public offering, and which replaced and superseded our named executive officers’
existing employment agreements that were entered into prior to 2009. Each of these new employment
agreements has an initial term of two years. These employment agreements are each automatically
extended for successive one-year periods unless and until either party elects to terminate the
agreement by giving at least 90 days written notice prior to the commencement of the next
succeeding one-year period. These agreements establish customary employment terms including base
salaries, bonuses and other incentive compensation and other benefits. For information regarding
the base salaries and other compensation to be provided under the new employment agreements, please
refer to the discussion above under “Compensation Discussion and Analysis — Employment and
Severance Arrangements.”
90
These employment agreements also provide for, among other things, the payment of severance
benefits and in some cases the continuation of certain benefits following certain terminations of
employment by our general partner or the termination of employment for “Good Reason” (as defined in
each of the employment agreements) by the executive officer. Under these agreements, if the
executive’s employment is terminated by the general partner without “Cause”
(as defined in the employment agreements) or the executive resigns for Good Reason, in each
case, during the term of the agreement the executive will have the right to a lump sum cash payment
by our general partner equal to one times (two times with respect to Charles C. Ungurean and Thomas
T. Ungurean) the executive’s annual base salary on the date of such termination, which will be
subject to reimbursement by us to our general partner. In addition, for Messrs. Charles C.
Ungurean and Thomas T. Ungurean, in the event of a termination due to death or disability (as such
term is defined in the employment agreements), or by our general partner without Cause, the
executive and his dependents will be entitled to continued participation in our general partner’s
employee benefit plans and insurance arrangements providing medical and dental benefits in which
they are enrolled at the time of such termination for the remainder of the employment term,
provided that the continuation is permitted at the time of termination under the terms of our
general partner’s employee benefit plans and insurance arrangements. Under the employment
agreements, if our general partner chooses to terminate a named executive officer’s employment
without cause or the executive resigns for good reason, in each case within 12 months after the
expiration of the agreement following notice by our general partner that it is not renewing the
term of the agreement, the named executive officer would be entitled to a lump sum payment equal to
six months of the named executive officer’s base salary. All of the foregoing severance benefits
are conditioned on the executive executing a release of claims in favor of our general partner and
its affiliates including us.
“Cause” is defined in each employment agreement as the executive having (i) engaged in gross
negligence, gross incompetence or willful misconduct in the performance of the duties required of
him under the employment agreement, (ii) refused without proper reason to perform the duties and
responsibilities required of him under the employment agreement, (iii) willfully engaged in conduct
that is materially injurious to our general partner or its affiliates including us (monetarily or
otherwise), (iv) committed an act of fraud, embezzlement or willful breach of fiduciary duty to our
general partner or an affiliate including us (including the unauthorized disclosure of confidential
or proprietary material information of our general partner or an affiliate including us or, in the
case of Mr. Gutman’s employment agreement only, including instead the unauthorized disclosure of
information that is, and is known or reasonably should have been known to the executive to be,
confidential or proprietary information of our general partner or an affiliate including us) or (v)
been convicted of (or pleaded no contest to) a crime involving fraud, dishonesty or moral turpitude
or any felony. “Good Reason” is defined in each employment agreement as a termination by the
executive in connection with or based upon (i) a material diminution in the executive’s
responsibilities, duties or authority, (ii) a material diminution in the executive’s base
compensation or (iii) a material breach by us of any material provision of the employment agreement
(and, in the case of Mr. Gutman’s employment agreement, a breach of obligations with respect to his
LTIP award granted on March 31, 2008).
Each employment agreement also contains certain confidentiality covenants prohibiting each
executive officer from, among other things, disclosing confidential information relating to our
general partner or any of its affiliates including us. The employment agreements also contain
non-competition and non-solicitation restrictions. For Messrs. Charles C. Ungurean and Thomas T.
Ungurean, those provisions apply during the term of their respective agreements and continue for a
period of two years following termination of employment for any reason. In addition, in connection
with the contribution of Oxford Mining Company to us in August 2007, Messrs. Charles C. Ungurean
and Thomas T. Ungurean agreed that they would not compete with us in the coal mining business in
Illinois, Kentucky, Ohio, Pennsylvania, West Virginia and Virginia until August 24, 2014. In the
cases of Messrs. Honish, Gardner and Gutman, those provisions apply during the term of their
respective employment with our general partner and continue for a period of 12 months following
termination of employment for any reason if such termination occurs during the term of the
employment agreement and not in connection with the expiration of the employment agreement.
91
The following table shows the value of the severance benefits and other benefits for the named
executive officers under the new employment agreements, assuming each named executive officer had
terminated employment on December 31, 2010.
| |
|
|
|
|
|
|
|
|
|
|
|
|
|
|
| |
|
|
|
Death or |
|
|
Termination |
|
|
Resignation for |
|
| |
|
|
|
Disability |
|
|
Without Cause |
|
|
Good Reason |
|
| Name |
|
Payment Type |
|
($) |
|
|
($) |
|
|
($) |
|
Charles C. Ungurean |
|
Cash severance |
|
|
|
|
|
$ |
1,000,000 |
|
|
$ |
1,000,000 |
|
|
|
Benefit Continuation |
|
$ |
25,854 |
|
|
|
25,854 |
|
|
|
|
|
|
|
Total |
|
|
25,854 |
|
|
|
1,025,854 |
|
|
|
1,000,000 |
|
Thomas T. Ungurean |
|
Cash severance |
|
|
|
|
|
|
550,000 |
|
|
|
550,000 |
|
|
|
Benefit Continuation |
|
|
22,055 |
|
|
|
22,055 |
|
|
|
|
|
|
|
Total |
|
|
22,055 |
|
|
|
572,055 |
|
|
|
550,000 |
|
Jeffrey M. Gutman |
|
Cash severance |
|
|
|
|
|
|
270,000 |
|
|
|
270,000 |
|
Gregory J. Honish |
|
Cash severance |
|
|
|
|
|
|
185,000 |
|
|
|
185,000 |
|
Michael B. Gardner |
|
Cash severance |
|
|
|
|
|
|
165,000 |
|
|
|
165,000 |
|
Our named executive officers other than Mr. Gutman are not entitled to any additional payments
or benefits upon the occurrence of a change in control with respect to us or our general partner.
Mr. Gutman’s employment agreement provides that, upon the occurrence of a change in control with
respect to us or our general partner, all of the awards granted to Mr. Gutman under our LTIP that
have not vested as of the date of the change in control will immediately vest. Assuming that a
change in control with respect to us or our general partner had occurred on December 31, 2010, Mr.
Gutman would have been entitled to accelerated vesting with respect to 33,981 phantom units that he
held as of such date, having an aggregate market value as of such date of $827,777, based on the
closing price of our common units of $24.36 on that date. In addition, in connection with the
closing of our initial public offering, Mr. Gutman received 5.979201 Class B units in our general
partner representing a profits participation interest in our general partner. The interest vests
over the four-year period following the closing of our initial public offering and is subject to
accelerated vesting upon a change in control with respect to us or our general partner. Assuming
that a change in control with respect to us or our general partner had occurred on December 31,
2010, Mr. Gutman would have been entitled to accelerated vesting with respect to all of such Class
B units that he held as of such date, having an estimated aggregate fair market value as of such
date of $45,890, determined in accordance with FASB ASC Topic 718.
Compensation of Directors
Our general partner’s non-employee directors are compensated for their service as directors
under our general partner’s Non-Employee Director Compensation Plan. Our non-employee directors
for purposes of the plan are directors that (i) are not an officer or employee of our general
partner or any of its subsidiaries or affiliates, (ii) are not affiliated with or related to any
party that receives compensation from our general partner or any of its subsidiaries and
affiliates, and (iii) have not entered into an arrangement with our general partner or any of its
subsidiaries and affiliates to receive compensation from any such entity other than in respect of
his services as a member of the board of directors. In addition, other members of the board of
directors that are not employees of our general partner can be approved by the board of directors
for participation in such plan, effective as of January 1 of the calendar year following such
approval.
Each non-employee director covered by the plan receives an annual compensation package
consisting of the following:
| |
• |
|
a $50,000 cash retainer; |
| |
• |
|
a $50,000 annual unit grant; and |
| |
• |
|
where applicable, a committee chair retainer of $10,000 for each committee chaired. |
In addition, each non-employee director receives per meeting fees of:
| |
• |
|
$1,000 for board meetings attended in person; |
| |
• |
|
where applicable, $500 for committee meetings attended in person; and |
| |
• |
|
$500 for telephonic board meetings and committee meetings greater than one hour in
length. |
92
In addition, in connection with the initial election of a non-employee director, the board of
directors of our general partner may determine that such non-employee directors will receive a
one-time grant of unrestricted common units. Furthermore, for 2011 and thereafter, each
non-employee director may elect to receive the cash components of their compensation under the
plan, as outlined above, in the form of unrestricted common units granted under our LTIP
representing an equivalent value at the date of issuance. Such elections must be made in advance
of the year in which the compensation is earned or at the directors’ initial appointment. The
annual compensation package is paid to each non-employee director based on his or her service for
the period beginning upon the date of his or her appointment to the board. If a non-employee
director’s service commences after the first day of a calendar year, such non-employee director
will receive a prorated annual compensation package for such year. The annual board membership
retainer and, if applicable, committee chair retainer are paid in quarterly installments. For
calendar year 2011 and thereafter, the annual unit grants is also paid in quarterly installments of
units having equivalent fair market value on the date of issuance to one fourth of the total annual
grant value described above. If board membership or committee chairmanship terminates during the
year, amounts due on subsequent quarterly payment dates would not be paid. Units awarded to
non-employee directors under the annual compensation package or upon first election to the board,
and any units issued upon a non-employee director’s election to receive units in lieu of cash
compensation, are granted under our LTIP and vest on the date of grant. Cash distributions will be
paid on these units from and after the time of their issuance. Each non-employee director is also
reimbursed for out-of-pocket expenses in connection with attending meetings of the board or its
committees. Each director will be indemnified by us for actions associated with being a director
of our general partner to the fullest extent permitted under Delaware law.
Director Compensation Table for 2010
The following table sets forth the compensation paid to our non-employee directors for the
year ended December 31, 2010, as described above. None of our non-employee directors held any
unvested units as of December 31, 2010.
| |
|
|
|
|
|
|
|
|
|
|
|
|
| |
|
Fees Earned or |
|
|
|
|
|
|
|
| Name |
|
Paid in Cash ($) |
|
|
Unit Awards ($)(1) |
|
|
Total ($) |
|
Gerald A. Tywoniuk |
|
$ |
53,000 |
|
|
$ |
50,003 |
|
|
$ |
103,003 |
|
Peter B. Lilly |
|
$ |
33,000 |
|
|
$ |
75,018 |
|
|
$ |
108,018 |
|
Robert J. Messey |
|
$ |
17,500 |
|
|
$ |
62,526 |
|
|
$ |
80,026 |
|
| |
|
|
| (1) |
|
The amount in this column represents the value of unit awards made to directors
under our LTIP in 2010. For Gerald A. Tywoniuk, 2,277 units were granted and vested on
December 1, 2010 and their market value is based on the closing price of $21.96 per unit on
such date; for Peter B. Lilly, 2,703 units were granted and vested on August 18, 2010 and
their value is based on the initial public offering price of $18.50 per unit on such date, and
the remaining 1,139 units were granted and vested on December 1, 2010 and their market value
is based on the closing price of $21.96 per unit on such date; and for Robert J. Messey, 2,472
units were granted and vested on October 8, 2010 and their market value is based on the
closing price of $20.23 per unit on such date, and the remaining 570 units were granted and
vested on December 1, 2010 and their market value is based on the closing price of $21.96 per
unit on such date. |
Compensation Committee Interlocks and Insider Participation
Brian D. Barlow, Peter B. Lilly, Gerald A. Tywoniuk and Robert J. Messey serve as the members
of the Compensation Committee. Mr. Barlow serves as the chairman of the Compensation Committee.
For a description of certain transactions between us and affiliates of Mr. Barlow, see “Item 13.
Certain Relationships and Related Transactions, and Director Independence.”
|
|
|
| ITEM 12. |
|
SECURITY OWNERSHIP OF CERTAIN BENEFICIAL OWNERS AND MANAGEMENT AND RELATED UNITHOLDER MATTERS |
The following table sets forth certain information regarding the beneficial ownership of units
as March 14, 2011 (the “Ownership Reference Date”) by:
| |
• |
|
each person who is known to us to beneficially own 5% or more of such units to be
outstanding; |
| |
• |
|
each of the directors and named executive officers of our general partner; and |
| |
• |
|
all of the directors and executive officers of our general partner as a group. |
93
All information with respect to beneficial ownership has been furnished by the respective
directors, officers or 5% or more unitholders as the case may be.
The equity interests of our general partner are comprised of class A units and class B units.
The class B units represent only profits interests in our general partner from the date of
issuance. The class A units of our general partner are owned 33.7% by C&T Coal and 66.3% by AIM
Oxford (both of which are reflected as 5% or more unitholders in the table below). C&T Coal is
owned by Charles C. Ungurean and Thomas T. Ungurean, each of whom is a member of our management
team, and AIM Oxford is owned by AIM Coal LLC and certain investment partnerships affiliated with
AIM. The class B units of our general partner are owned 50% by Jeffrey M. Gutman and 50% by Daniel
M. Maher, each of whom is a member of our management team.
The amounts and percentage of units beneficially owned are reported on the basis of
regulations of the SEC governing the determination of beneficial ownership of securities. Under
the rules of the SEC, a person is deemed to be a “beneficial owner” of a security if that person
has or shares “voting power,” which includes the power to vote or to direct the voting of such
security, or “investment power,” which includes the power to dispose of or to direct the
disposition of such security. In computing the number of common units beneficially owned by a
person and the percentage ownership of that person, common units subject to options or warrants
held by that person that are currently exercisable or exercisable within 60 days of the Ownership
Reference Date, if any, are deemed outstanding, but are not deemed outstanding for computing the
percentage ownership of any other person. Except as indicated by footnote, the persons named in
the table below have sole voting and investment power with respect to all units shown as
beneficially owned by them, subject to community property laws where applicable.
94
The percentage of units beneficially owned is based on a total of 10,341,416 common units and
10,280,380 subordinated units outstanding as of the Ownership Reference Date.
| |
|
|
|
|
|
|
|
|
|
|
|
|
|
|
|
|
|
|
|
|
| |
|
|
|
|
|
|
|
|
|
|
|
|
|
|
|
|
|
Percentage |
|
| |
|
|
|
|
|
|
|
|
|
|
|
|
|
|
|
|
|
of Total |
|
| |
|
|
|
|
|
Percentage of |
|
|
|
|
|
|
Percentage of |
|
|
Common and |
|
| |
|
|
|
|
|
Common Units |
|
|
Subordinated |
|
|
Subordinated |
|
|
Subordinated |
|
| |
|
Common Units to |
|
|
to be |
|
|
Units to be |
|
|
Units to be |
|
|
Units to be |
|
| |
|
be Beneficially |
|
|
Beneficially |
|
|
Beneficially |
|
|
Beneficially |
|
|
Beneficially |
|
| Name of Beneficial Owner |
|
Owned |
|
|
Owned |
|
|
Owned |
|
|
Owned |
|
|
Owned |
|
AIM Oxford Holdings, LLC(1)(2) |
|
|
709,143 |
|
|
|
6.9 |
% |
|
|
6,813,160 |
|
|
|
66.3 |
% |
|
|
36.5 |
% |
C&T Coal, Inc.(3) |
|
|
360,882 |
|
|
|
3.5 |
% |
|
|
3,467,220 |
|
|
|
33.7 |
% |
|
|
18.6 |
% |
Cushing MLP Opportunity Fund I,
LP(4) |
|
|
700,000 |
|
|
|
6.8 |
% |
|
|
— |
|
|
|
— |
|
|
|
3.4 |
% |
Swank Energy Income Advisors, LP (n/k/a
Cushing MLP Asset Management,
LP(4)(5) |
|
|
1,649,100 |
|
|
|
15.9 |
% |
|
|
— |
|
|
|
— |
|
|
|
8.0 |
% |
Swank Capital, L.L.C.(4)(6) |
|
|
1,649,100 |
|
|
|
15.9 |
% |
|
|
— |
|
|
|
— |
|
|
|
8.0 |
% |
Jerry V. Swank(4)(7) |
|
|
1,649,100 |
|
|
|
15.9 |
% |
|
|
— |
|
|
|
— |
|
|
|
8.0 |
% |
George E. McCown(1)(2)(8) |
|
|
709,143 |
|
|
|
6.9 |
% |
|
|
6,813,160 |
|
|
|
66.3 |
% |
|
|
36.5 |
% |
Brian D. Barlow(2) |
|
|
— |
|
|
|
— |
|
|
|
— |
|
|
|
— |
|
|
|
— |
|
Matthew P. Carbone(1)(2)(8) |
|
|
709,143 |
|
|
|
6.9 |
% |
|
|
6,813,160 |
|
|
|
66.3 |
% |
|
|
36.5 |
% |
Gerald A. Tywoniuk(3)(9)(10) |
|
|
5,850 |
|
|
|
* |
|
|
|
— |
|
|
|
— |
|
|
|
* |
|
Peter B. Lilly(3)(10) |
|
|
10,462 |
|
|
|
* |
|
|
|
— |
|
|
|
— |
|
|
|
* |
|
Robert J. Messey(3)(10) |
|
|
3,525 |
|
|
|
* |
|
|
|
|
|
|
|
|
|
|
|
* |
|
Charles C. Ungurean(3)(11)(12) |
|
|
360,882 |
|
|
|
3.5 |
% |
|
|
3,467,220 |
|
|
|
33.7 |
% |
|
|
18.6 |
% |
Thomas T. Ungurean(3)(11)(13) |
|
|
360,882 |
|
|
|
3.5 |
% |
|
|
3,467,220 |
|
|
|
33.7 |
% |
|
|
18.6 |
% |
Jeffrey M. Gutman(3)(14) |
|
|
26,903 |
|
|
|
* |
|
|
|
— |
|
|
|
— |
|
|
|
* |
|
Gregory J. Honish(3)(15) |
|
|
7,870 |
|
|
|
* |
|
|
|
— |
|
|
|
— |
|
|
|
* |
|
Michael B. Gardner(3)(16) |
|
|
7,510 |
|
|
|
* |
|
|
|
— |
|
|
|
— |
|
|
|
* |
|
All directors and executive officers as
a group (consisting of 13 persons) |
|
|
1,144,785 |
|
|
|
10.1 |
% |
|
|
10,280,380 |
|
|
|
100.0 |
% |
|
|
55.4 |
% |
| |
|
|
| An asterisk indicates that the person or entity owns less than one percent. |
| |
| (1) |
|
AIM Oxford Holdings, LLC is governed by its sole manager, AIM Coal Management, LLC,
a Delaware limited liability company. AIM Coal Management, LLC’s members consist of George E.
McCown and Matthew P. Carbone, both directors of our general partner, and Robert B. Hellman,
Jr. Messrs. McCown, Carbone and Hellman, in their capacities as members of AIM Coal
Management, LLC, share voting and investment power with respect to the common and subordinated
units owned by AIM Oxford Holdings, LLC. |
| |
| (2) |
|
The address for this person or entity is 950 Tower Lane, Suite 800, Foster City,
California 94404. |
| |
| (3) |
|
The address for this person or entity is 41 South High Street, Suite 3450, Columbus,
Ohio 43215. |
| |
| (4) |
|
The address for this person or entity is 8117 Preston Road, Suite 440, Dallas Texas
75225. |
| |
| (5) |
|
As investment advisor to Cushing MLP Opportunity Fund I, LP (the “Cushing Fund”) and
other holders of common units, Swank Energy Income Advisors, LP (n/k/a Cushing MLP Asset
Management, LP) (“Cushing Management”) shares voting and investment power over the common
units held by the Cushing Fund and certain other private funds and managed accounts
(collectively, the “Cushing Management Funds/Accounts”). |
| |
| (6) |
|
As general partner of Cushing Management, Swank Capital, L.L.C. shares voting and
investment power over the common units held by the Cushing Fund and the Cushing Management
Funds/Accounts. |
| |
| (7) |
|
As principal of Swank Capital, L.L.C., Jerry V. Swank shares voting and investment
power over the common units held by the Cushing Fund and the Cushing Management
Funds/Accounts. |
| |
| (8) |
|
Each of Messrs. McCown and Carbone disclaim beneficial ownership of the units,
except to the extent of any pecuniary interest therein. |
| |
| (9) |
|
A total of 5,367 of these common units are owned by a trust established by Mr.
Tywoniuk and his spouse and for which they both serve as trustees. Mr. Tywoniuk disclaims
beneficial ownership of the units held by such trust, except to the extent of any pecuniary
interest therein. |
95
| |
|
|
| (10) |
|
The common units shown for Messrs, Tywoniuk, Lilly and Messey include common units
which will vest and be issued to them on March 31, 2011. The number of such units which will
vest and be issued are estimated because the actual number to be issued to each of them will
be dependent upon the closing price for the units on March 31, 2011. Mr. Tywoniuk will have
units having a value of $12,500 at such closing price (estimated at 483 units) issued to him,
Mr. Lilly will have units having a value of $29,000 at such closing price (estimated at 1,120
units) issued to him and Mr. Messey will have units having a value of $12,500 at such closing
price (estimated at 483 units) issued to him. The estimated number of units for each of them
has been estimated based on the closing price on the Ownership Reference Date. |
| |
| (11) |
|
Charles C. Ungurean and Thomas T. Ungurean, as the shareholders of C&T Coal, Inc.,
share voting and investment power with respect to the common and subordinated units owned by
C&T Coal, Inc. Each of Charles C. Ungurean and Thomas T. Ungurean disclaim beneficial
ownership of the units, except to the extent of any pecuniary interest therein. |
| |
| (12) |
|
Does not include 3,786 common units that could be issuable upon the vesting of
phantom units, which phantom units will not vest within 60 days of the Ownership Reference
Date. |
| |
| (13) |
|
Does not include 2,083 common units that could be issuable upon the vesting of
phantom units, which phantom units will not vest within 60 days of the Ownership Reference
Date. |
| |
| (14) |
|
Does not include 15,491 common units that could be issuable upon the vesting of
phantom units, which phantom units will not vest within 60 days of the Ownership Reference
Date. |
| |
| (15) |
|
Does not include 7,988 common units that could be issuable upon the vesting of
phantom units, which phantom units will not vest within 60 days of the Ownership Reference
Date. |
| |
| (16) |
|
Does not include 4,046 common units that could be issuable upon the vesting of
phantom units, which phantom units will not vest within 60 days of the Ownership Reference
Date. |
Securities Authorized for Issuance under Equity Compensation Plans
The following table provides information concerning common units that may be issued under our
LTIP. Our LTIP allows for awards of options, phantom units, restricted units, unit awards, other
unit awards and unit appreciation rights. It currently permits the grant of awards covering an
aggregate of 2,056,075 units. Our LTIP is administered by the Compensation Committee.
The board of directors of our general partner in its discretion may terminate, suspend or
discontinue our LTIP at any time with respect to any award that has not yet been granted. The
board of directors of our general partner also has the right to alter or amend our LTIP or any part
of our LTIP from time to time, including increasing the number of units that may be granted subject
to unitholder approval as required by the exchange upon which the common units are listed at that
time. However, no change in any outstanding grant may be made that would materially impair the
rights of the participant without the consent of the participant.
The following table summarizes the number of securities remaining available for future
issuance under our LTIP as of December 31, 2010.
| |
|
|
|
|
|
|
|
|
|
|
|
|
| |
|
|
|
|
|
|
|
|
|
Number of Securities |
|
| |
|
|
|
|
|
|
|
|
|
Remaining Available |
|
| |
|
|
|
|
|
|
|
|
|
for Future Issuance |
|
| |
|
Number of Securities |
|
|
|
|
|
|
Under Equity |
|
| |
|
to be Issued Upon |
|
|
Weighted-Average |
|
|
Compensation Plans |
|
| |
|
Exercise of |
|
|
Exercise Price of |
|
|
(Excluding Securities |
|
| |
|
Outstanding Options, |
|
|
Outstanding Options, |
|
|
Reflected in |
|
| Plan Category |
|
Warrants and Rights |
|
|
Warrants and Rights |
|
|
Column(a)) |
|
| |
|
(a) |
|
|
(b) |
|
|
(c) |
|
Equity compensation
plans approved by
security
holders(1) |
|
|
— |
|
|
$ |
— |
|
|
|
1,879,275 |
(2) |
Equity compensation
plans not approved by
security holders |
|
|
— |
|
|
|
— |
|
|
|
— |
|
|
|
|
|
|
|
|
|
|
|
|
Total |
|
|
— |
|
|
$ |
— |
|
|
|
1,879,275 |
(2) |
|
|
|
|
|
|
|
|
|
|
|
| |
|
|
| (1) |
|
Our LTIP was approved by our partners (general and limited) prior to our initial
public offering. Our LTIP currently permits the grant of awards covering an aggregate of
2,056,705 units, inclusive of prior award grants, which grants did not and do not require
approval by our limited partners. |
| |
| (2) |
|
The number of remaining available units for award grants includes the units that
would be issuable upon vesting of a total of 124,480 outstanding phantom units. |
96
|
|
|
| ITEM 13. |
|
CERTAIN RELATIONSHIPS AND RELATED TRANSACTIONS, AND DIRECTOR INDEPENDENCE |
C&T Coal owns 360,882 common units and 3,467,220 subordinated units representing a combined
18.6% limited partner interest in us, and AIM Oxford owns 709,143 common units and 6,813,160
subordinated units representing a combined 36.5% limited partner interest in us. C&T Coal and AIM
Oxford control our general partner which owns a 2.0% general partner interest in us and all of our
incentive distribution rights. The equity interests of our general partner are comprised of class
A units and class B units. The class B units represent only profits interests in our general
partner from the date of issuance. The class A units of our general partner are owned 33.7% by C&T
Coal and 66.3% by AIM Oxford. C&T Coal is owned by Charles C. Ungurean and Thomas T. Ungurean,
each a member of our management team, and AIM Oxford is owned by AIM Coal LLC and certain
investment partnerships affiliated with AIM. The class B units of our general partner are owned
50% by Jeffrey M. Gutman and 50% by Daniel M. Maher, each of whom is a member of our management
team.
Distributions and Payments to Our General Partner and Its Affiliates
The following table summarizes the distributions and payments to be made by us to our general
partner and its affiliates in connection with our ongoing operation and liquidation. These
distributions and payments were determined by and among affiliated entities and, consequently, are
not the result of arm’s-length negotiations.
| |
|
|
Pre-IPO Stage |
|
|
|
|
|
The consideration
received by our
general partner and
its affiliates
prior to or in
connection with our
initial public
offering
|
|
• 1,458,800 common units;
• 10,280,380 subordinated units;
• all of our incentive distribution rights;
• 2.0% general partner interest; and
• approximately $76.4 million in cash and accounts receivable. |
|
|
|
Post-IPO Stage |
|
|
|
|
|
Distributions of
available cash to
our general partner
and its affiliates
|
|
We will initially make cash distributions 98.0% to the unitholders, including
affiliates of our general partner, as the holders of an aggregate of 1,458,800
common units and all of the subordinated units and 2.0% to our general
partner. If distributions exceed the minimum quarterly distribution and the
first target distribution level, our general partner will be entitled to
increasing percentages of the distributions, up to 48.0% of the distributions
above the highest target distribution level. |
|
|
|
|
|
Assuming we have sufficient available cash to pay the full minimum quarterly
distribution on all of our outstanding units for four quarters, our general
partner and its affiliates would receive an annual distribution of
approximately $0.7 million on the 2.0% general partner interest and
approximately $20.5 million on their common units and subordinated units. |
|
|
|
Payments to our
general partner and
its affiliates
|
|
Our general partner will not receive a management fee or other compensation
for its management of us. Our general partner and its affiliates will be
reimbursed for expenses incurred on our behalf. Our partnership agreement
provides that our general partner will determine the amount of these expenses. |
|
|
|
Withdrawal or
removal of our
general partner
|
|
If our general partner withdraws or is removed, its general partner interest
and its incentive distribution rights will either be sold to the new general
partner for cash or converted into common units, in each case for an amount
equal to the fair market value of those interests. |
|
|
|
Liquidation Stage |
|
|
|
|
|
Liquidation
|
|
Upon our liquidation, the partners, including our general partner, will be
entitled to receive liquidating distributions according to their particular
capital account balances. |
97
Ownership Interests of Certain Executive Officers and Directors of Our General Partner
C&T Coal, AIM Oxford, Jeffrey M. Gutman and Daniel M. Maher collectively own 100.0% of our
general partner. Charles C. Ungurean, the President and Chief Executive Officer of our general
partner, and Thomas T. Ungurean, the Senior Vice President, Equipment, Procurement and Maintenance
of our general partner, own all of the equity interests in C&T Coal. Brian D. Barlow, Matthew P.
Carbone and George E. McCown serve on the board of directors of our general partner and are
principals of AIM and have ownership interests in AIM. Jeffrey M. Gutman is the Senior Vice
President, Chief Financial Officer and Treasurer of our general partner and Daniel M. Maher is the
Senior Vice President, Chief Legal Officer and Secretary of our general partner.
In addition to the 2.0% general partner interest in us, our general partner owns the incentive
distribution rights, which entitle the holder to increasing percentages, up to a maximum of 48.0%,
of the cash we distribute in excess of $0.6563 per quarter.
Advisory Services Agreement
Upon our formation in August 2007, Oxford Mining Company, LLC entered into an advisory
services agreement with American Infrastructure MLP Management, L.L.C. and American Infrastructure
MLP PE Management, L.L.C., which are affiliates of AIM, AIM Oxford and certain members of the board
of directors of our general partner. Our advisors performed financial and advisory services for us
under this agreement, which was terminated in connection with our initial public offering in
exchange for a one-time, non-recurring payment to our advisors of $2.5 million. Our advisors
received annual compensation in the amount of $250,000 plus a fee determined by a formula, taking
into account the increase in our gross revenue over the prior year. During the year ended December
31, 2010, excluding and in addition to the one-time, non-recurring payment of $2.5 million, we paid
our advisors approximately $210,000 for these services.
Administrative and Operational Services Agreement
On August 24, 2007, we entered into an administrative and operational services agreement with
Oxford Mining Company, LLC and our general partner. Under the terms of the agreement, our general
partner provides services to us and is reimbursed for all related costs incurred on our behalf.
The services that our general partner provides include, among other things, general administrative
and management services, human resources, information technology, finance and accounting, corporate
development, real property, marketing, engineering, operations (including mining operations),
geologic services, risk management and insurance services. During 2010, we paid our general
partner approximately $68.2 million for services, primarily related to payroll, performed under the
administrative and operational services agreement. Any party may terminate the administrative and
operational services agreement by providing at least 30 days’ written notice to the other parties
of its intention to terminate the administrative and operational services agreement.
Investors’ Rights Agreement
We entered into an investors’ rights agreement on August 24, 2007 with our general partner,
C&T Coal, AIM Oxford, Charles C. Ungurean and Thomas C. Ungurean. Pursuant to such agreement and
subject to certain restrictions, C&T Coal was granted certain demand and “piggyback” registration
rights. Pursuant to the terms of the agreement, C&T Coal has the right to require us to file a
registration statement for the public sale of all of the common and subordinated units it owns at
any time after our initial public offering. In addition and subject to certain restrictions, if we
sell any common units in a registered underwritten offering, C&T Coal will have the right to
include its common units in that offering; provided, however, that the managing underwriter or
underwriters of any such offering will have the right to limit the number of common units to be
included in such sale. We will pay all expenses relating to any demand or piggyback registration,
except for fees and disbursements of any counsel retained by C&T Coal and any underwriter or
brokers’ commission or discounts.
98
In addition, the investors’ rights agreement gives C&T Coal the right to designate a number of
directors to the board of directors of our general partner proportionate to its percentage share of
the total outstanding membership interests in our general partner. AIM Oxford has the right to
designate the remaining members of the board of directors of our general partner. However, the
number of directors C&T Coal has the right to appoint will be reduced if necessary such that the
number of directors appointed by C&T Coal and the number of independent directors (as defined in
our partnership agreement) are less than fifty percent of the members of the board, provided that
the number of directors C&T Coal has the right to appoint is not less than one. C&T Coal’s right
to designate members of the board of directors of our general partner will terminate upon C&T Coal,
Charles C. Ungurean and Thomas T. Ungurean ceasing to own in the aggregate at least 5% of our
common units and subordinated units.
Furthermore, the investors’ rights agreement gives C&T Coal, Charles C. Ungurean and Thomas T.
Ungurean tag-along rights to sell their limited partner interests in us in any case where AIM
Oxford requires C&T Coal, Charles C. Ungurean and Thomas T. Ungurean, pursuant to the investors’
rights agreement, to sell their interest in our general partner in connection with the sale by AIM
Oxford of all of its interests in us and our general partner to a non-affiliated third party. All
of the other rights provided for in the investors’ rights agreement related to dispositions of
interests in us by AIM Oxford or C&T Coal, Charles C. Ungurean and Thomas T. Ungurean terminated
upon the closing of our initial public offering.
Tunnel Hill Partners, LP
The vast majority of the ownership interest in Tunnel Hill Partners, LP is directly or
indirectly owned by T&C Holdco, LLC and AIM Tunnel Hill Holdings II, LLC. T&C Holdco is
wholly-owned by Charles C. Ungurean and Thomas T. Ungurean. AIM Tunnel Hill Holdings II, LLC is
indirectly owned by AIM.
We are a party to an environmental services agreement with Tunnell Hill Reclamation LLC, a
wholly owned subsidiary of Tunnel Hill Partners, LP, pursuant to which we provide certain landfill
operational services. Receipts for these services for 2010 were approximately $1.4 million.
In addition, pursuant to a mining agreement, Tunnell Hill Reclamation LLC has granted us
access to certain properties for the purpose of conducting mining operations. As consideration for
such access, we have authorized the construction by Tunnell Hill Reclamation LLC of future
landfills or other waste disposal facilities on such properties.
Chartering of Aircraft Transportation
From time to time for business purposes we charter the use of an airplane from Zanesville
Aviation located in Zanesville, Ohio. In each of these cases we are invoiced for and pay the
normal amounts that Zanesville Aviation charges any chartering person. T&C Holdco owns an airplane
that it leases to Zanesville Aviation and that Zanesville Aviation uses in providing chartering
services to its customers including us. Under its lease with Zanesville Aviation, T&C Holdco
receives compensation from Zanesville Aviation for the use of T&C Holdco’s airplane. The airplane
owned by T&C Holdco was chartered to us on a number of occasions in 2010, and we paid Zanesville
Aviation an aggregate of approximately $175,000 for those charters.
Procedures for Review, Approval and Ratification of Related Person Transactions
The board of directors of our general partner has adopted a code of business conduct and
ethics that provides that the board of directors of our general partner or its authorized committee
will periodically review all related person transactions that are required to be disclosed under
SEC rules and, when appropriate, initially authorize or ratify all such transactions. In the event
that the board of directors of our general partner or its authorized committee considers
ratification of a related person transaction and determines not to so ratify, the code of business
conduct and ethics provides that our management will make all reasonable efforts to cancel or annul
the transaction.
The code of business conduct and ethics provides that, in determining whether or not to
recommend the initial approval or ratification of a related person transaction, the board of
directors of our general partner or its authorized committee should consider all of the relevant
facts and circumstances available, including (if applicable) but not limited to: (i) whether there
is an appropriate business justification for the transaction; (ii) the benefits that accrue to us
as a result of the transaction; (iii) the terms available to unrelated third parties entering into
similar transactions; (iv) the impact of the transaction on a director’s independence (in the event
the related person is a director, an immediate family member of a director or an entity in which a
director or an immediately family member of a director is a partner, shareholder, member or
executive officer); (v) the availability of other sources for comparable products or services; (vi)
whether it is a single transaction or a series of ongoing, related transactions; and (vii) whether
entering into the transaction would be consistent with the code of business conduct and ethics.
99
The code of business conduct and ethics described above was adopted in connection with the
closing of our initial public offering, and as a result the transactions described above were not
reviewed under such policy.
Further information required for this item is provided in “Item 1. Business — Overview,”
“Item 10. Directors, Executive Officers and Corporate Governance” and Note 19, Related Party
Transactions, included in the notes to the audited consolidated financial statements included in
“Item 8 — Financial Statements and Supplementary Data.”
|
|
|
| ITEM 14. |
|
PRINCIPAL ACCOUNTANT FEES AND SERVICES |
The following table sets forth fees and out-of-pocket expenses billed by Grant Thornton LLP
for the audit of our annual financial statements and other services rendered for the fiscal years
ended December 31, 2010 and 2009:
| |
|
|
|
|
|
|
|
|
| Name |
|
2010 |
|
|
2009 |
|
Audit fees(1) (5) |
|
$ |
332,000 |
|
|
$ |
639,000 |
|
Audit-related fees(2) |
|
|
— |
|
|
|
— |
|
Tax fees(3) (5) |
|
|
134,000 |
|
|
|
145,000 |
|
All other fees(4) |
|
|
— |
|
|
|
— |
|
|
|
|
|
|
|
|
|
|
|
|
|
|
|
|
|
Total |
|
$ |
466,000 |
|
|
$ |
784,000 |
|
|
|
|
|
|
|
|
| |
|
|
| (1) |
|
Includes fees and expenses for audits of annual financial statements of our
subsidiaries (as well as an audit of our financial statements at December 31, 2009 in
connection with our initial public offering), reviews of the related quarterly financial
statements, and services that are normally provided by the independent accountants in
connection with statutory and regulatory filings or engagements, including reviews of
documents filed with the SEC. |
| |
| (2) |
|
Includes fees and expense related to consultations concerning financial accounting
and reporting standards and services related to the implementation of our internal controls
over financial reporting. |
| |
| (3) |
|
Includes fees and expenses related to professional services for tax compliance, tax
advice and tax planning. |
| |
| (4) |
|
Consists of fees and expenses for services other than services reported above. |
| |
| (5) |
|
Includes fees and expenses associated with our initial public offering. |
Pursuant to the charter of the Audit Committee, the Audit Committee is responsible for the
oversight of our accounting, reporting and financial practices. The Audit Committee is responsible
for the appointment, compensation, retention and oversight of the work of our external auditors;
the pre-approval of all audit and non-audit services to be provided, consistent with all applicable
laws, to us by our external auditors; and the establishment of the fees and other compensation to
be paid to our external auditors. The Audit Committee also oversees and directs our internal
auditing program and reviews our internal controls.
The Audit Committee has adopted a policy for the pre-approval of audit and permitted non-audit
services provided by our principal independent accountants. The policy requires that all services
provided by Grant Thornton LLP, including audit services, audit-related services, tax services and
other services, must be pre-approved by the Audit Committee.
100
The Audit Committee reviews the external auditors’ proposed scope and approach as well as the
performance of the external auditors. It also has direct responsibility for resolution of and sole
authority to resolve any disagreements between our management and our external auditors regarding
financial reporting, regularly reviews with the external auditors any problems or difficulties the
auditors encounter in the course of their audit work, and, at least annually, uses its reasonable
efforts to obtain and review a report from the external auditors addressing the following (among
other items):
| |
• |
|
the external auditors’ internal quality-control procedures; |
| |
| |
• |
|
any material issues raised by the most recent internal quality-control review, or peer
review, of the external auditors; |
| |
| |
• |
|
the independence of the external auditors; |
| |
| |
• |
|
the aggregate fees billed by the external auditors for each of the previous two fiscal
years; and |
| |
| |
• |
|
the rotation of the external auditors’ lead partner. |
PART IV
|
|
|
| ITEM 15. |
|
EXHIBITS AND FINANCIAL STATEMENT SCHEDULES |
| (a)1. |
|
Financial Statements. See “Index to Financial Statements” on page F-1. |
| |
| (a)2. |
|
Financial Statement Schedules. Other schedules are omitted because they are not required or
applicable, or the required information is included in our consolidated financial statements
or related notes. |
| |
| (a)3. |
|
Exhibits. See “Index to Exhibits.” |
101
SIGNATURES
Pursuant to the requirements of Section 13 or 15(d) of the Securities Exchange Act of 1934,
the registrant has duly caused this report to be signed on its behalf by the undersigned, thereunto
duly authorized.
Date: March
18, 2011
| |
|
|
|
|
|
|
| |
|
OXFORD RESOURCE PARTNERS, LP |
|
|
|
|
|
|
|
|
|
|
|
By:
|
|
OXFORD RESOURCES GP, LLC, its general partner |
|
|
|
|
|
|
|
|
|
|
|
By:
|
|
/s/ CHARLES C. UNGUREAN |
|
|
|
|
|
|
Charles C. Ungurean
|
|
|
|
|
|
|
President and Chief Executive Officer |
|
|
|
|
|
|
(Principal Executive Officer) |
|
|
|
|
|
|
|
|
|
|
|
By:
|
|
/s/ JEFFREY M. GUTMAN |
|
|
|
|
|
|
Jeffrey M. Gutman
|
|
|
|
|
|
|
Senior Vice President, Chief Financial Officer and Treasurer |
|
|
|
|
|
|
(Principal Financial Officer) |
|
|
Pursuant to the requirements of the Securities Exchange Act of 1934, this report has been
signed below by the following persons in their indicated capacities, which are with the general
partner of the registrant, on the dates indicated.
| |
|
|
|
|
| Signature |
|
Title |
|
Date |
|
|
|
|
|
/s/ GEORGE E. MCCOWN
George E. McCown
|
|
Chairman of the Board
|
|
March 18, 2011 |
|
|
|
|
|
/s/ CHARLES C. UNGUREAN
Charles C. Ungurean
|
|
Director, President and Chief
Executive
Officer
(principal executive officer)
|
|
March 18, 2011 |
|
|
|
|
|
/s/ JEFFREY M. GUTMAN
Jeffrey M. Gutman
|
|
Senior Vice President, Chief
Financial
Officer and Treasurer
(principal financial officer)
|
|
March 18, 2011 |
|
|
|
|
|
/s/ DENISE M. MAKSIMOSKI
Denise M. Maksimoski
|
|
Senior Director of Accounting
(principal
accounting officer)
|
|
March 18, 2011 |
|
|
|
|
|
/s/ BRIAN D. BARLOW
Brian D. Barlow
|
|
Director
|
|
March 18, 2011 |
|
|
|
|
|
/s/ MATTHEW P. CARBONE
Matthew P. Carbone
|
|
Director
|
|
March 18, 2011 |
|
|
|
|
|
/s/ GERALD A. TYWONIUK
Gerald A. Tywoniuk
|
|
Director
|
|
March 18, 2011 |
|
|
|
|
|
/s/ PETER B. LILLY
Peter B. Lilly
|
|
Director
|
|
March 18, 2011 |
|
|
|
|
|
/s/ ROBERT J. MESSEY
Robert J. Messey
|
|
Director
|
|
March 18, 2011 |
102
INDEX TO EXHIBITS
| |
|
|
|
|
| Exhibit |
|
|
| Number |
|
Description |
| |
|
|
|
|
| |
3.1 |
|
|
Certificate of Limited Partnership of Oxford Resource Partners, LP
(incorporated by reference to Exhibit 3.1 to the Registration
Statement on Form S-1 (Commission File No. 333-165662) filed on
March 24, 2010) |
| |
|
|
|
|
| |
3.2 |
|
|
Third Amended and Restated Agreement of Limited Partnership of
Oxford Resource Partners, LP dated July 19, 2010 (incorporated by
reference to Exhibit 3.1 to the Current Report on Form 8-K
(Commission File No. 001-34815) filed on July 19, 2010) |
| |
|
|
|
|
| |
3.3 |
|
|
Certificate of Formation of Oxford Resources GP, LLC (incorporated
by reference to Exhibit 3.3 to Amendment No. 1 to the Registration
Statement on Form S-1 (Commission File No. 333-165662) filed on
April 21, 2010) |
| |
|
|
|
|
| |
3.4 |
|
|
Third Amended and Restated Limited Liability Company Agreement of
Oxford Resources GP, LLC dated January 1, 2011 (incorporated by
reference to Exhibit 3.2 to the Current Report on Form 8-K
(Commission File No. 001-34815) filed on January 4, 2011) |
| |
|
|
|
|
| |
10.1A |
|
|
Credit Agreement dated as of July 6, 2010 (incorporated by
reference to Exhibit 10.1 to the Current Report on Form 8-K
(Commission File No. 001-34815) filed on July 19, 2010) |
| |
|
|
|
|
| |
10.1B |
|
|
First Amendment to Credit Agreement and Limited Waiver dated as of
July 15, 2010 (incorporated by reference to Exhibit 10.2 to the
Current Report on Form 8-K (Commission File No. 001-34815) filed on
July 19, 2010) |
| |
|
|
|
|
| |
10.2 |
|
|
Investors’ Rights Agreement, dated August 24, 2007, by and among
Oxford Resource Partners, LP, Oxford Resources GP, LLC, AIM Oxford
Holdings, LLC, C&T Coal, Inc., Charles C. Ungurean and Thomas T.
Ungurean (incorporated by reference to Amendment No. 3 to the
Registration Statement on Form S-1 (Commission File No. 333-165662)
filed on June 9, 2010) |
| |
|
|
|
|
| |
10.3 |
# |
|
Employment Agreement between Oxford Resources GP, LLC and Michael
B. Gardner (incorporated by reference to Exhibit 10.3 to the
Quarterly Report on Form 10-Q (Commission File No. 001-34815) for
the quarter ended June 30, 2010 filed on August 10, 2010) |
| |
|
|
|
|
| |
10.4 |
# |
|
Employment Agreement between Oxford Resources GP, LLC and Jeffrey
M. Gutman (incorporated by reference to Exhibit 10.4 to the
Quarterly Report on Form 10-Q (Commission File No. 001-34815) for
the quarter ended June 30, 2010 filed on August 10, 2010) |
| |
|
|
|
|
| |
10.5 |
# |
|
Employment Agreement between Oxford Resources GP, LLC and Gregory
J. Honish (incorporated by reference to Exhibit 10.5 to the
Quarterly Report on Form 10-Q (Commission File No. 001-34815) for
the quarter ended June 30, 2010 filed on August 10, 2010) |
| |
|
|
|
|
| |
10.6 |
# |
|
Employment Agreement between Oxford Resources GP, LLC and Charles
C. Ungurean (incorporated by reference to Exhibit 10.6 to the
Quarterly Report on Form 10-Q (Commission File No. 001-34815) for
the quarter ended June 30, 2010 filed on August 10, 2010) |
| |
|
|
|
|
| |
10.7 |
# |
|
Employment Agreement between Oxford Resources GP, LLC and Thomas T.
Ungurean (incorporated by reference to Exhibit 10.7 to the
Quarterly Report on Form 10-Q (Commission File No. 001-34815) for
the quarter ended June 30, 2010 filed on August 10, 2010) |
103
| |
|
|
|
|
| Exhibit |
|
|
| Number |
|
Description |
| |
|
|
|
|
| |
10.8 |
# |
|
Employee Unitholder Agreement among Oxford Resource Partners, LP,
Oxford Resources GP, LLC and Michael B. Gardner (incorporated by
reference to Amendment No. 1 to the Registration Statement on Form
S-1 (Commission File No. 333-165662) filed on April 21, 2010) |
| |
|
|
|
|
| |
10.9 |
# |
|
Employee Unitholder Agreement among Oxford Resource Partners, LP,
Oxford Resources GP, LLC and Jeffrey M. Gutman (incorporated by
reference to Amendment No. 1 to the Registration Statement on Form
S-1 (Commission File No. 333-165662) filed on April 21, 2010) |
| |
|
|
|
|
| |
10.10 |
# |
|
Employee Unitholder Agreement among Oxford Resource Partners, LP,
Oxford Resources GP, LLC and Gregory J. Honish (incorporated by
reference to Amendment No. 1 to the Registration Statement on Form
S-1 (Commission File No. 333-165662) filed on April 21, 2010) |
| |
|
|
|
|
| |
10.11 |
# |
|
Employee Unitholder Agreement among Oxford Resource Partners, LP,
Oxford Resources GP, LLC and Denise M. Maksimoski (incorporated by
reference to Amendment No. 1 to the Registration Statement on Form
S-1 (Commission File No. 333-165662) filed on April 21, 2010) |
| |
|
|
|
|
| |
10.12 |
# |
|
Oxford Resource Partners, LP Amended and Restated Long-Term
Incentive Plan dated July 19, 2010 (incorporated by reference to
Exhibit 10.3 to the Current Report on Form 8-K (Commission File No.
001-34815) filed on July 19, 2010) |
| |
|
|
|
|
| |
10.13A |
# |
|
Form of Long-Term Incentive Plan Grant Agreement (incorporated by
reference to Amendment No. 3 to the Registration Statement on Form
S-1 (Commission File No. 333-165662) filed on June 9, 2010) |
| |
|
|
|
|
| |
10.13B |
# |
|
Form of Long-Term Incentive Plan Grant Agreement between Oxford
Resources GP, LLC and Jeffrey M. Gutman (incorporated by reference
to Amendment No. 3 to the Registration Statement on Form S-1
(Commission File No. 333-165662) filed on June 9, 2010) |
| |
|
|
|
|
| |
10.14 |
# |
|
Non-Employee Director Compensation Plan (incorporated by reference
to Exhibit 10.14 to the Quarterly Report on Form 10-Q (Commission
File No. 001-34815) for the quarter ended June 30, 2010 filed on
August 10, 2010) |
| |
|
|
|
|
| |
10.15A |
# |
|
Form of Non-Employee Director Compensation Plan Grant Agreement
(incorporated by reference to Amendment No. 3 to the Registration
Statement on Form S-1 (Commission File No. 333-165662) filed on
June 9, 2010) |
| |
|
|
|
|
| |
10.15B |
# |
|
Director Unitholder Agreement, dated December 1, 2009, by and among
Oxford Resource Partners, LP, Oxford Resources GP, LLC and Gerald
A. Tywoniuk (incorporated by reference to Amendment No. 1 to the
Registration Statement on Form S-1 (Commission File No. 333-165662)
filed on April 21, 2010) |
| |
|
|
|
|
| |
10.16 |
|
|
Acquisition Agreement, dated August 14, 2009, by and among Oxford
Mining Company, LLC, Phoenix Coal Inc., Phoenix Coal Corporation
and Phoenix Newco, LLC (incorporated by reference to Amendment No.
1 to the Registration Statement on Form S-1 (Commission File No.
333-165662) filed on April 21, 2010) |
| |
|
|
|
|
| |
10.17A |
|
|
Coal Purchase and Sale Agreement No. 10-62-04-900, dated May 21,
2004, by and between Oxford Mining Company, Inc. and American
Electric Power Service Corporation, agent for Columbus Southern
Power Company (incorporated by reference to Amendment No. 4 to the
Registration Statement on Form S-1 (Commission File No. 333-165662)
filed on June 25, 2010) |
| |
|
|
|
|
| |
10.17B |
|
|
Amendment No. 2004-1 to Coal Purchase and Sale Agreement, dated
October 25, 2004 (incorporated by reference to Amendment No. 1 to
the Registration Statement on Form S-1 (Commission File No.
333-165662) filed on April 21, 2010) |
104
| |
|
|
|
|
| Exhibit |
|
|
| Number |
|
Description |
| |
|
|
|
|
| |
10.17C |
|
|
Amendment No. 2005-1 to Coal Purchase and Sale Agreement, dated
April 8, 2005 (incorporated by reference to Amendment No. 4 to the
Registration Statement on Form S-1 (Commission File No. 333-165662)
filed on June 25, 2010) |
| |
|
|
|
|
| |
10.17D |
|
|
Amendment No. 2006-3 to Coal Purchase and Sale Agreement, dated
December 5, 2006 (incorporated by reference to Amendment No. 4 to
the Registration Statement on Form S-1 (Commission File No.
333-165662) filed on June 25, 2010) |
| |
|
|
|
|
| |
10.17F |
|
|
Amendment No. 2008-6 to Coal Purchase and Sale Agreement, dated
December 29, 2008 (incorporated by reference to Amendment No. 4 to
the Registration Statement on Form S-1 (Commission File No.
333-165662) filed on June 25, 2010) |
| |
|
|
|
|
| |
10.17G |
|
|
Amendment No. 2009-1 to Coal Purchase and Sale Agreement, dated May
21, 2009 (incorporated by reference to Amendment No. 4 to the
Registration Statement on Form S-1 (Commission File No. 333-165662)
filed on June 25, 2010) |
| |
|
|
|
|
| |
10.17H |
|
|
Amendment No. 2009-3 to Coal Purchase and Sale Agreement, dated
December 15, 2009 (incorporated by reference to Amendment No. 4 to
the Registration Statement on Form S-1 (Commission File No.
333-165662) filed on June 25, 2010) |
| |
|
|
|
|
| |
10.17I |
|
|
Amendment No. 2010-1 to Coal Purchase and Sale Agreement, dated
January 11, 2010 (incorporated by reference to Amendment No. 4 to
the Registration Statement on Form S-1 (Commission File No.
333-165662) filed on June 25, 2010) |
| |
|
|
|
|
| |
10.17J |
|
|
Amendment No. 2010-2 to Coal Purchase and Sale Agreement, dated
February 4, 2010 (incorporated by reference to Amendment No. 1 to
the Registration Statement on Form S-1 (Commission File No.
333-165662) filed on April 21, 2010) |
| |
|
|
|
|
| |
10.17K |
|
|
Amendment No. 2010-3 to Coal Purchase and Sale Agreement, dated
April 16, 2010 (incorporated by reference to Amendment No. 3 to the
Registration Statement on Form S-1 (Commission File No. 333-165662)
filed on June 9, 2010) |
| |
|
|
|
|
| |
10.18 |
|
|
Non-Compete Agreement by and among Oxford Resource Partners, LP,
C&T Coal, Inc., Charles C. Ungurean, Thomas T. Ungurean and Oxford
Resources GP, LLC (incorporated by reference to Amendment No. 3 to
the Registration Statement on Form S-1 (Commission File No.
333-165662) filed on June 9, 2010) |
| |
|
|
|
|
| |
10.19 |
|
|
Administrative and Operational Services Agreement, dated August 24,
2007, by and among Oxford Resource Partners, LP, Oxford Mining
Company, LLC and Oxford Resources GP, LLC (incorporated by
reference to Amendment No. 1 to the Registration Statement on Form
S-1 (Commission File No. 333-165662) filed on April 21, 2010) |
| |
|
|
|
|
| |
10.20 |
# |
|
Engagement letter agreement dated August 1, 2010 between Oxford
Resources GP, LLC and Squire, Sanders & Dempsey L.L.P. relating to
representation services provided principally by and under the
direction of Daniel M. Maher (incorporated by reference to Exhibit
10.20 to the Quarterly Report on Form 10-Q (Commission File No.
001-34815) for the quarter ended September 30, 2010 filed on
November 9, 2010) |
| |
|
|
|
|
| |
10.21 |
# |
|
Employment Agreement between Oxford Resources GP, LLC and Daniel M.
Maher dated August 1, 2010 (incorporated by reference to Exhibit
10.21 to the Quarterly Report on Form 10-Q (Commission File No.
001-34815) for the quarter ended September 30, 2010 filed on
November 9, 2010) |
| |
|
|
|
|
| |
10.22 |
* |
|
First Amendment to Employment Agreement between Oxford Resources
GP, LLC and Daniel M. Maher dated December 31, 2010 |
105
| |
|
|
|
|
| Exhibit |
|
|
| Number |
|
Description |
| |
|
|
|
|
| |
21.1* |
|
|
List of Subsidiaries of Oxford Resource Partners, LP |
| |
|
|
|
|
| |
23.1* |
|
|
Consent of Grant Thornton LLP |
| |
|
|
|
|
| |
23.2* |
|
|
Consent of John T. Boyd Company |
| |
|
|
|
|
| |
31.1* |
|
|
Certification of Charles C. Ungurean, President and Chief Executive
Officer of Oxford Resources GP, LLC, the general partner of Oxford
Resource Partners, LP, for the December 31, 2010 Annual Report on
Form 10-K, pursuant to Section 302 of the Sarbanes-Oxley Act of
2002 |
| |
|
|
|
|
| |
31.2* |
|
|
Certification of Jeffrey M. Gutman, Senior Vice President, Chief
Financial Officer and Treasurer of Oxford Resources GP, LLC, the
general partner of Oxford Resource Partners, LP, for the December
31, 2010 Annual Report on Form 10-K, pursuant to Section 302 of the
Sarbanes-Oxley Act of 2002 |
| |
|
|
|
|
| |
32.1* |
|
|
Certification of Charles C. Ungurean, President and Chief Executive
Officer of Oxford Resources GP, LLC, the general partner of Oxford
Resource Partners, LP, for the December 31, 2010 Annual Report on
Form 10-K, pursuant to Section 906 of the Sarbanes-Oxley Act of
2002 |
| |
|
|
|
|
| |
32.2* |
|
|
Certification of Jeffrey M. Gutman, Senior Vice President, Chief
Financial Officer and Treasurer of Oxford Resources GP, LLC, the
general partner of Oxford Resource Partners, LP, for the December
31, 2010 Annual Report on Form 10-K, pursuant to Section 906 of the
Sarbanes-Oxley Act of 2002 |
| |
|
|
| * |
|
Filed herewith (or furnished in the case of Exhibits 32.1 and 32.2). |
| |
| # |
|
Compensatory plan or arrangement. |
106
INDEX TO CONSOLIDATED FINANCIAL STATEMENTS
Oxford Resource Partners, LP and Subsidiaries
| |
|
|
|
|
|
|
|
|
F-2 |
|
|
|
|
|
|
|
|
|
F-3 |
|
|
|
|
|
|
|
|
|
F-4 |
|
|
|
|
|
|
|
|
|
F-5 |
|
|
|
|
|
|
|
|
|
F-6 |
|
|
|
|
|
|
|
|
F-7 to F-31 |
F-1
REPORT OF INDEPENDENT REGISTERED PUBLIC ACCOUNTING FIRM
Board of Directors and Unitholders
Oxford Resource Partners, LP
We have audited the accompanying balance sheets of Oxford Resource Partners, LP (a Delaware limited
partnership) and subsidiaries (the “Partnership”) as of December 31, 2010 and 2009, and the related
consolidated statements of operations, partners’ capital and cash flows for each of the three years
in the period ended December 31, 2010. These financial statements are the responsibility of the
Partnership’s management. Our responsibility is to express an opinion on these financial statements
based on our audits.
We conducted our audits in accordance with the standards of the Public Company Accounting Oversight
Board (United States). Those standards require that we plan and perform the audit to obtain
reasonable assurance about whether the financial statements are free of material misstatement. The
Partnership is not required to have, nor were we engaged to perform an audit of its internal
control over financial reporting. Our audit included consideration of internal control over
financial reporting as a basis for designing audit procedures that are appropriate in the
circumstances, but not for the purpose of expressing an opinion on the effectiveness of the
Partnership’s internal control over financial reporting. Accordingly, we express no such opinion. An
audit also includes examining, on a test basis, evidence supporting the amounts and disclosures in
the financial statements, assessing the accounting principles used and significant estimates made
by management, as well as evaluating the overall financial statement presentation. We believe that
our audits provide a reasonable basis for our opinion.
In our opinion, the financial statements referred to above present fairly, in all material
respects, the financial position of Oxford Resource Partners, LP and subsidiaries as of December
31, 2010 and 2009, and the results of its operations and its cash flows for each of the three years
in the period ended December 31, 2010, in conformity with accounting principles generally accepted
in the United States of America.
As discussed in Note 16, the Partnership changed its method of accounting and reporting for
noncontrolling interest in subsidiaries in the 2009 consolidated financial statements due to the
adoption of Statement of Financial Accounting Standards No. 160, Noncontrolling Interests in
Consolidated Financial Statements, codified in FASB ASC 810 — Consolidation.
/s/ GRANT THORNTON LLP
Cleveland, Ohio
March 18, 2011
F-2
OXFORD RESOURCE PARTNERS, LP AND SUBSIDIARIES
CONSOLIDATED BALANCE SHEETS
(in thousands, except for unit information)
| |
|
|
|
|
|
|
|
|
| |
|
As of December 31, |
|
| |
|
2010 |
|
|
2009 |
|
|
|
|
|
|
|
|
|
|
ASSETS |
|
|
|
|
|
|
|
|
Cash and cash equivalents |
|
$ |
889 |
|
|
$ |
3,366 |
|
Trade accounts receivable |
|
|
28,108 |
|
|
|
24,403 |
|
Inventory |
|
|
12,640 |
|
|
|
8,801 |
|
Advance royalties — current portion |
|
|
924 |
|
|
|
1,674 |
|
Prepaid expenses and other current assets |
|
|
1,023 |
|
|
|
1,424 |
|
|
|
|
|
|
|
|
|
|
|
|
|
|
|
|
|
Total current assets |
|
|
43,584 |
|
|
|
39,668 |
|
|
|
|
|
|
|
|
|
|
Property, plant and equipment, net |
|
|
198,694 |
|
|
|
149,461 |
|
Advance royalties |
|
|
7,693 |
|
|
|
7,438 |
|
Other long-term assets |
|
|
11,100 |
|
|
|
6,796 |
|
|
|
|
|
|
|
|
|
|
|
|
|
|
|
|
|
Total assets |
|
$ |
261,071 |
|
|
$ |
203,363 |
|
|
|
|
|
|
|
|
|
|
|
|
|
|
|
|
|
LIABILITIES |
|
|
|
|
|
|
|
|
Current portion of long-term debt |
|
$ |
7,249 |
|
|
$ |
4,113 |
|
Accounts payable |
|
|
26,074 |
|
|
|
21,655 |
|
Asset retirement obligations — current portion |
|
|
6,450 |
|
|
|
7,377 |
|
Deferred revenue |
|
|
780 |
|
|
|
2,090 |
|
Accrued taxes other than income taxes |
|
|
1,643 |
|
|
|
1,464 |
|
Accrued payroll and related expenses |
|
|
2,625 |
|
|
|
2,045 |
|
Other current liabilities |
|
|
2,952 |
|
|
|
5,714 |
|
|
|
|
|
|
|
|
|
|
|
|
|
|
|
|
|
Total current liabilities |
|
|
47,773 |
|
|
|
44,458 |
|
|
|
|
|
|
|
|
|
|
Long-term debt, less current portion |
|
|
95,737 |
|
|
|
91,598 |
|
Asset retirement obligations |
|
|
6,537 |
|
|
|
5,966 |
|
Other long-term liabilities |
|
|
2,261 |
|
|
|
4,229 |
|
|
|
|
|
|
|
|
|
|
|
|
|
|
|
|
|
Total liabilities |
|
|
152,308 |
|
|
|
146,251 |
|
Commitments and Contingencies (Note 17) |
|
|
— |
|
|
|
— |
|
|
|
|
|
|
|
|
|
|
PARTNERS’ CAPITAL |
|
|
|
|
|
|
|
|
|
|
|
|
|
|
|
|
|
Limited partners (20,610,983 and 11,964,547 units outstanding
as of December 31, 2010 and 2009, respectively) |
|
|
105,684 |
|
|
|
53,960 |
|
General partner (420,633 and 242,023 units outstanding
as of December 31, 2010 and 2009, respectively) |
|
|
(63 |
) |
|
|
1,085 |
|
|
|
|
|
|
|
|
|
|
|
|
|
|
|
|
|
Total Partners’ capital |
|
|
105,621 |
|
|
|
55,045 |
|
Noncontrolling interest |
|
|
3,142 |
|
|
|
2,067 |
|
|
|
|
|
|
|
|
|
|
|
|
|
|
|
|
|
Total partners’ capital |
|
|
108,763 |
|
|
|
57,112 |
|
|
|
|
|
|
|
|
|
|
|
|
|
|
|
|
|
Total liabilities and partners’ capital |
|
$ |
261,071 |
|
|
$ |
203,363 |
|
|
|
|
|
|
|
|
See accompanying notes to consolidated financial statements.
F-3
OXFORD RESOURCE PARTNERS, LP AND SUBSIDIARIES
CONSOLIDATED STATEMENTS OF OPERATIONS
(in thousands, except for unit and per unit information)
| |
|
|
|
|
|
|
|
|
|
|
|
|
| |
|
For the Years Ended December 31, |
|
| |
|
2010 |
|
|
2009 |
|
|
2008 |
|
Revenue |
|
|
|
|
|
|
|
|
|
|
|
|
Coal sales |
|
$ |
311,567 |
|
|
$ |
254,171 |
|
|
$ |
193,699 |
|
Transportation revenue |
|
|
38,490 |
|
|
|
32,490 |
|
|
|
31,839 |
|
Royalty and non-coal revenue |
|
|
6,521 |
|
|
|
7,183 |
|
|
|
4,951 |
|
|
|
|
|
|
|
|
|
|
|
Total revenue |
|
|
356,578 |
|
|
|
293,844 |
|
|
|
230,489 |
|
|
|
|
|
|
|
|
|
|
|
|
|
|
Costs and expenses |
|
|
|
|
|
|
|
|
|
|
|
|
Cost of coal sales (excluding depreciation,
depletion and amortization, shown separately) |
|
|
229,468 |
|
|
|
170,698 |
|
|
|
151,421 |
|
Cost of purchased coal |
|
|
22,024 |
|
|
|
19,487 |
|
|
|
12,925 |
|
Cost of transportation |
|
|
38,490 |
|
|
|
32,490 |
|
|
|
31,839 |
|
Depreciation, depletion and amortization |
|
|
42,329 |
|
|
|
25,902 |
|
|
|
16,660 |
|
Selling, general and administrative expenses |
|
|
14,757 |
|
|
|
13,242 |
|
|
|
9,577 |
|
Contract terminations |
|
|
652 |
|
|
|
— |
|
|
|
— |
|
|
|
|
|
|
|
|
|
|
|
Total costs and expenses |
|
|
347,720 |
|
|
|
261,819 |
|
|
|
222,422 |
|
|
|
|
|
|
|
|
|
|
|
|
|
|
Income from operations |
|
|
8,858 |
|
|
|
32,025 |
|
|
|
8,067 |
|
Interest income |
|
|
12 |
|
|
|
35 |
|
|
|
62 |
|
Interest expense |
|
|
(9,511 |
) |
|
|
(6,484 |
) |
|
|
(7,720 |
) |
Gain on purchase of business |
|
|
— |
|
|
|
3,823 |
|
|
|
— |
|
|
|
|
|
|
|
|
|
|
|
|
|
|
|
|
|
|
|
|
|
|
|
|
Net income (loss) |
|
|
(641 |
) |
|
|
29,399 |
|
|
|
409 |
|
Less: net income attributable to noncontrolling interest |
|
|
(6,710 |
) |
|
|
(5,895 |
) |
|
|
(2,891 |
) |
|
|
|
|
|
|
|
|
|
|
|
|
|
|
|
|
|
|
|
|
|
|
|
Net income (loss) attributable to Oxford Resource
Partners, LP unitholders |
|
$ |
(7,351 |
) |
|
$ |
23,504 |
|
|
$ |
(2,482 |
) |
|
|
|
|
|
|
|
|
|
|
|
|
|
|
|
|
|
|
|
|
|
|
|
Net income (loss) allocated to general partner |
|
$ |
(147 |
) |
|
$ |
467 |
|
|
$ |
(50 |
) |
|
|
|
|
|
|
|
|
|
|
Net income (loss) allocated to limited partners |
|
$ |
(7,204 |
) |
|
$ |
23,037 |
|
|
$ |
(2,432 |
) |
|
|
|
|
|
|
|
|
|
|
|
|
|
|
|
|
|
|
|
|
|
|
|
Net income (loss) per limited partner unit: |
|
|
|
|
|
|
|
|
|
|
|
|
Basic |
|
$ |
(0.45 |
) |
|
$ |
2.09 |
|
|
$ |
(0.24 |
) |
|
|
|
|
|
|
|
|
|
|
Diluted |
|
$ |
(0.45 |
) |
|
$ |
2.08 |
|
|
$ |
(0.24 |
) |
|
|
|
|
|
|
|
|
|
|
|
|
|
|
|
|
|
|
|
|
|
|
|
Weighted average number of limited partner units outstanding: |
|
|
|
|
|
|
|
|
|
|
|
|
Basic |
|
|
15,887,977 |
|
|
|
11,033,840 |
|
|
|
10,104,324 |
|
|
|
|
|
|
|
|
|
|
|
Diluted |
|
|
15,887,977 |
|
|
|
11,083,170 |
|
|
|
10,104,324 |
|
|
|
|
|
|
|
|
|
|
|
Distributions paid per limited partner unit* |
|
$ |
0.58 |
|
|
$ |
1.20 |
|
|
$ |
1.26 |
|
|
|
|
|
|
|
|
|
|
|
|
|
|
| * |
|
Excludes amounts distributed as part of the initial public offering. |
See accompanying notes to consolidated financial statements.
F-4
OXFORD RESOURCE PARTNERS, LP AND SUBSIDIARIES
CONSOLIDATED STATEMENTS OF CASH FLOWS
(in thousands)
| |
|
|
|
|
|
|
|
|
|
|
|
|
| |
|
For the Years Ended December 31, |
|
| |
|
2010 |
|
|
2009 |
|
|
2008 |
|
CASH FLOWS FROM OPERATING ACTIVITIES: |
|
|
|
|
|
|
|
|
|
|
|
|
Net income (loss) attributable to unitholders |
|
$ |
(7,351 |
) |
|
$ |
23,504 |
|
|
$ |
(2,482 |
) |
Adjustments to reconcile net income (loss) to net cash
provided by (used in) operating activities |
|
|
|
|
|
|
|
|
|
|
|
|
Depreciation, depletion and amortization |
|
|
42,329 |
|
|
|
25,902 |
|
|
|
16,660 |
|
Interest rate swap adjustment to market |
|
|
142 |
|
|
|
(1,681 |
) |
|
|
574 |
|
Loan fee amortization |
|
|
1,239 |
|
|
|
530 |
|
|
|
398 |
|
Loss on debt extinguishment |
|
|
1,302 |
|
|
|
1,252 |
|
|
|
— |
|
Non-cash compensation expense |
|
|
942 |
|
|
|
472 |
|
|
|
468 |
|
Advanced royalty recoupment |
|
|
1,609 |
|
|
|
1,390 |
|
|
|
1,020 |
|
Loss (gain) on disposal of property and equipment |
|
|
3,499 |
|
|
|
1,177 |
|
|
|
(1,407 |
) |
(Gain) on acquisition |
|
|
— |
|
|
|
(3,823 |
) |
|
|
— |
|
Noncontrolling interest in subsidiary earnings |
|
|
6,710 |
|
|
|
5,895 |
|
|
|
2,891 |
|
(Increase) decrease in assets: |
|
|
|
|
|
|
|
|
|
|
|
|
Accounts receivable |
|
|
(3,705 |
) |
|
|
(2,875 |
) |
|
|
(3,906 |
) |
Inventory |
|
|
(3,542 |
) |
|
|
(2,062 |
) |
|
|
(479 |
) |
Other assets |
|
|
455 |
|
|
|
(996 |
) |
|
|
(494 |
) |
Increase (decrease) in liabilities: |
|
|
|
|
|
|
|
|
|
|
|
|
Accounts payable and other liabilities |
|
|
956 |
|
|
|
3,055 |
|
|
|
6,761 |
|
Asset retirement obligations |
|
|
(1,583 |
) |
|
|
737 |
|
|
|
1,509 |
|
Provision for below-market contracts and deferred revenue |
|
|
(2,734 |
) |
|
|
(13,840 |
) |
|
|
12,479 |
|
|
|
|
|
|
|
|
|
|
|
Net cash provided by operating activities |
|
|
40,268 |
|
|
|
38,637 |
|
|
|
33,992 |
|
|
|
|
|
|
|
|
|
|
|
|
|
|
CASH FLOWS FROM INVESTING ACTIVITIES: |
|
|
|
|
|
|
|
|
|
|
|
|
Phoenix Coal acquisition |
|
|
— |
|
|
|
(18,275 |
) |
|
|
— |
|
Purchase of property and equipment |
|
|
(78,199 |
) |
|
|
(25,657 |
) |
|
|
(25,321 |
) |
Purchase of mineral rights and land |
|
|
(3,120 |
) |
|
|
(2,705 |
) |
|
|
(197 |
) |
Mine development costs |
|
|
(3,029 |
) |
|
|
(1,989 |
) |
|
|
(1,476 |
) |
Royalty advances |
|
|
(1,169 |
) |
|
|
(629 |
) |
|
|
(853 |
) |
Proceeds from sale of property and equipment |
|
|
36 |
|
|
|
88 |
|
|
|
3,972 |
|
Insurance proceeds |
|
|
2,271 |
|
|
|
— |
|
|
|
— |
|
Change in restricted cash |
|
|
(1,684 |
) |
|
|
(4 |
) |
|
|
(67 |
) |
|
|
|
|
|
|
|
|
|
|
Net cash used in investing activities |
|
|
(84,894 |
) |
|
|
(49,171 |
) |
|
|
(23,942 |
) |
|
|
|
|
|
|
|
|
|
|
|
|
|
CASH FLOWS FROM FINANCING ACTIVITIES: |
|
|
|
|
|
|
|
|
|
|
|
|
Initial public offering proceeds |
|
|
150,544 |
|
|
|
— |
|
|
|
— |
|
Offering expenses |
|
|
(6,097 |
) |
|
|
— |
|
|
|
— |
|
Proceeds from borrowings |
|
|
60,040 |
|
|
|
6,650 |
|
|
|
14,800 |
|
Payments on borrowings |
|
|
(92,552 |
) |
|
|
(2,646 |
) |
|
|
(5,853 |
) |
Advances on line of credit |
|
|
39,000 |
|
|
|
7,500 |
|
|
|
16,850 |
|
Payments on line of credit |
|
|
(10,500 |
) |
|
|
(3,000 |
) |
|
|
(17,350 |
) |
Credit facility issuance costs |
|
|
(5,603 |
) |
|
|
(1,811 |
) |
|
|
— |
|
Capital contributions from partners |
|
|
47 |
|
|
|
11,560 |
|
|
|
11,000 |
|
Distributions to noncontrolling interest |
|
|
(5,635 |
) |
|
|
(6,125 |
) |
|
|
(2,450 |
) |
Distributions to partners |
|
|
(87,095 |
) |
|
|
(13,407 |
) |
|
|
(12,503 |
) |
|
|
|
|
|
|
|
|
|
|
Net cash provided by (used in) financing activities |
|
|
42,149 |
|
|
|
(1,279 |
) |
|
|
4,494 |
|
Net increase/(decrease) in cash |
|
|
(2,477 |
) |
|
|
(11,813 |
) |
|
|
14,544 |
|
CASH AND CASH EQUIVALENTS, beginning of period |
|
|
3,366 |
|
|
|
15,179 |
|
|
|
635 |
|
|
|
|
|
|
|
|
|
|
|
CASH AND CASH EQUIVALENTS, end of period |
|
$ |
889 |
|
|
$ |
3,366 |
|
|
$ |
15,179 |
|
|
|
|
|
|
|
|
|
|
|
See accompanying notes to consolidated financial statements.
F-5
OXFORD RESOURCE PARTNERS, LP AND SUBSIDIARIES
CONSOLIDATED STATEMENTS OF PARTNERS’ CAPITAL
(in thousands, except for unit data)
| |
|
|
|
|
|
|
|
|
|
|
|
|
|
|
|
|
|
|
|
|
|
|
|
|
|
|
|
|
|
|
|
|
| |
|
Limited Partner |
|
|
General |
|
|
General |
|
|
|
|
|
|
Total |
|
| |
|
Common |
|
|
Subordinated |
|
|
Partner |
|
|
Partners’ |
|
|
Noncontrolling |
|
|
Partners’ |
|
| |
|
Units |
|
|
Capital |
|
|
Units |
|
|
Capital |
|
|
Units |
|
|
Capital |
|
|
interest |
|
|
Capital |
|
Balance at December 31, 2007 |
|
|
|
|
|
|
|
|
|
|
8,922,801 |
|
|
$ |
35,932 |
|
|
|
182,097 |
|
|
$ |
733 |
|
|
$ |
1,856 |
|
|
$ |
38,521 |
|
|
|
|
|
|
|
|
|
|
|
|
|
|
|
|
|
|
|
|
|
|
|
|
|
|
|
|
|
|
|
|
|
|
Net income (loss) |
|
|
|
|
|
|
|
|
|
|
|
|
|
|
(2,432 |
) |
|
|
|
|
|
|
(50 |
) |
|
|
2,891 |
|
|
|
409 |
|
Partners’ contributions |
|
|
|
|
|
|
|
|
|
|
1,752,693 |
|
|
|
10,780 |
|
|
|
35,770 |
|
|
|
220 |
|
|
|
|
|
|
|
11,000 |
|
Partners’ distributions |
|
|
|
|
|
|
|
|
|
|
|
|
|
|
(12,253 |
) |
|
|
|
|
|
|
(250 |
) |
|
|
(2,450 |
) |
|
|
(14,953 |
) |
Equity-based compensation |
|
|
|
|
|
|
|
|
|
|
|
|
|
|
468 |
|
|
|
|
|
|
|
|
|
|
|
|
|
|
|
468 |
|
Issuance of units to LTIP
participants |
|
|
|
|
|
|
|
|
|
|
49,131 |
|
|
|
(124 |
) |
|
|
|
|
|
|
|
|
|
|
|
|
|
|
(124 |
) |
|
|
|
|
|
|
|
|
|
|
|
|
|
|
|
|
|
|
|
|
|
|
|
|
|
Balance at December 31, 2008 |
|
|
|
|
|
|
|
|
|
|
10,724,625 |
|
|
$ |
32,371 |
|
|
|
217,867 |
|
|
$ |
653 |
|
|
$ |
2,297 |
|
|
$ |
35,321 |
|
|
|
|
|
|
|
|
|
|
|
|
|
|
|
|
|
|
|
|
|
|
|
|
|
|
|
|
|
|
|
|
|
|
|
|
|
|
|
|
|
|
|
|
|
|
|
|
|
|
|
|
|
|
|
|
|
|
|
Net income |
|
|
|
|
|
|
|
|
|
|
|
|
|
|
23,037 |
|
|
|
|
|
|
|
467 |
|
|
|
5,895 |
|
|
|
29,399 |
|
Partners’ contributions |
|
|
|
|
|
|
|
|
|
|
1,183,689 |
|
|
|
11,329 |
|
|
|
24,156 |
|
|
|
231 |
|
|
|
|
|
|
|
11,560 |
|
Partners’ distributions |
|
|
|
|
|
|
|
|
|
|
|
|
|
|
(13,141 |
) |
|
|
|
|
|
|
(266 |
) |
|
|
(6,125 |
) |
|
|
(19,532 |
) |
Equity-based compensation |
|
|
|
|
|
|
|
|
|
|
|
|
|
|
472 |
|
|
|
|
|
|
|
|
|
|
|
|
|
|
|
472 |
|
Issuance of units to LTIP
participants |
|
|
|
|
|
|
|
|
|
|
56,233 |
|
|
|
(108 |
) |
|
|
|
|
|
|
|
|
|
|
|
|
|
|
(108 |
) |
|
|
|
|
|
|
|
|
|
|
|
|
|
|
|
|
|
|
|
|
|
|
|
|
|
Balance at December 31, 2009 |
|
|
|
|
|
|
|
|
|
|
11,964,547 |
|
|
$ |
53,960 |
|
|
|
242,023 |
|
|
$ |
1,085 |
|
|
$ |
2,067 |
|
|
$ |
57,112 |
|
|
|
|
|
|
|
|
|
|
|
|
|
|
|
|
|
|
|
|
|
|
|
|
|
|
|
|
|
|
|
|
|
|
|
|
|
|
|
|
|
|
|
|
|
|
|
|
|
|
|
|
|
|
|
|
|
|
|
Net income (loss) |
|
|
|
|
|
|
(1,546 |
) |
|
|
|
|
|
|
(5,658 |
) |
|
|
|
|
|
|
(147 |
) |
|
|
6,710 |
|
|
|
(641 |
) |
Initial public offering |
|
|
10,280,368 |
|
|
|
157,181 |
|
|
|
(1,705,368 |
) |
|
|
(7,331 |
) |
|
|
175,000 |
|
|
|
694 |
|
|
|
|
|
|
|
150,544 |
|
Offering costs |
|
|
|
|
|
|
(6,097 |
) |
|
|
|
|
|
|
|
|
|
|
|
|
|
|
|
|
|
|
|
|
|
|
(6,097 |
) |
Partners’ contributions |
|
|
|
|
|
|
|
|
|
|
|
|
|
|
|
|
|
|
3,610 |
|
|
|
47 |
|
|
|
|
|
|
|
47 |
|
Partners’ distributions |
|
|
|
|
|
|
(3,626 |
) |
|
|
|
|
|
|
(81,727 |
) |
|
|
|
|
|
|
(1,742 |
) |
|
|
(5,635 |
) |
|
|
(92,730 |
) |
Equity-based compensation |
|
|
|
|
|
|
|
|
|
|
|
|
|
|
942 |
|
|
|
|
|
|
|
|
|
|
|
|
|
|
|
942 |
|
Issuance of units to LTIP
participants |
|
|
50,235 |
|
|
|
(320 |
) |
|
|
21,201 |
|
|
|
(94 |
) |
|
|
|
|
|
|
|
|
|
|
|
|
|
|
(414 |
) |
|
|
|
|
|
|
|
|
|
|
|
|
|
|
|
|
|
|
|
|
|
|
|
|
|
Balance at December 31, 2010 |
|
|
10,330,603 |
|
|
$ |
145,592 |
|
|
|
10,280,380 |
|
|
$ |
(39,908 |
) |
|
|
420,633 |
|
|
$ |
(63 |
) |
|
$ |
3,142 |
|
|
$ |
108,763 |
|
|
|
|
|
|
|
|
|
|
|
|
|
|
|
|
|
|
|
|
|
|
|
|
|
|
See accompanying notes to consolidated financial statements.
F-6
OXFORD RESOURCE PARTNERS, LP AND SUBSIDIARIES
NOTES TO CONSOLIDATED FINANCIAL STATEMENTS
NOTE 1: ORGANIZATION AND PRESENTATION
Significant Relationships Referenced in Notes to Consolidated Financial Statements
| |
• |
|
“We,” “us,” “our,” or the “Partnership” means the business and operations of Oxford
Resource Partners, LP, the parent entity, as well as its consolidated subsidiaries. |
| |
• |
|
“ORLP” means Oxford Resource Partners, LP, individually as the parent entity, and
not on a consolidated basis. |
| |
• |
|
Our “GP” means Oxford Resources GP, LLC, the general partner of Oxford Resource
Partners, LP. |
| |
• |
|
“Oxford” means our predecessor, Oxford Mining Company. |
Organization
We are a low cost producer of high value steam coal. We focus on acquiring steam coal reserves
that we can efficiently mine with our modern, large scale equipment. Our reserves and operations
are strategically located in Northern Appalachia and the Illinois Basin to serve our primary market
area of Illinois, Indiana, Kentucky, Ohio, Pennsylvania and West Virginia. These coal reserves are
mined by our subsidiaries, Oxford Mining Company, LLC (“Oxford Mining”), Oxford Mining Company -
Kentucky, LLC and Harrison Resources, LLC (“Harrison Resources”).
We are managed by our GP and all executives, officers and employees who provide services to us
are employees of our GP. Charles Ungurean, the President and Chief Executive Officer of our GP and
a member of our GP’s board of directors, and Thomas Ungurean, the Senior Vice President, Equipment,
Procurement and Maintenance of our GP, are the co-owners of one of our limited partners, C&T Coal,
Inc. (“C&T Coal”).
We were formed in August 2007 to acquire all of the ownership interests in Oxford from C&T
Coal. Immediately following the acquisition, C&T Coal and AIM Oxford Holdings, LLC (“AIM Oxford”)
held a 34.3% and 63.7% limited partner interest in ORLP, respectively, and our GP owned a 2%
general partner interest. Also at that time, the members of our GP were AIM Oxford with a 65%
ownership interest and C&T Coal with a 35% ownership interest. After taking into account their
indirect ownership of ORLP through our GP, AIM Oxford held a 65% total interest in ORLP and C&T
Coal held a 35% total interest in ORLP.
Subsequent to our formation, AIM Oxford and C&T Coal made several capital contributions for
various purposes including purchasing property, plant and equipment and acquiring the surface
mining operations of Phoenix Coal Corporation (“Phoenix Coal”). See Note 3. The capital
contributions were not all in direct proportion to AIM Oxford’s and C&T Coal’s initial limited
partner interests in us. As a result of the disproportionate capital contributions, AIM Oxford’s
and C&T Coal’s ownership of the Partnership, as of December 31, 2009, was 64.39% and 32.77%,
respectively, with 1.98% and 0.86% interests being owned by our GP and participants in the
Partnership’s Long-Term Incentive Plan (“LTIP”), respectively. AIM Oxford and C&T Coal then owned
66.27% and 33.73%, respectively, in the GP.
On July 19, 2010, we completed the closing of our initial public offering as discussed further
in the Initial Public Offering section of this Note 1. Immediately prior to the offering, all of
the limited partner and general partner interests in us were split as discussed further in the Unit
Split section of this Note 1. As a result of these transactions, AIM Oxford’s and C&T Coal’s
ownership of the Partnership, as of December 31, 2010, was 36.82% and 18.74%, respectively, with
our GP’s ownership being 2.00%. The remaining 42.44% was held by the general public and our LTIP
participants. AIM Oxford and C&T Coal owned 65.98% and 33.58%, respectively, of our GP as of
December 31, 2010, with the remaining 0.44% interest therein being owned by Jeffrey M. Gutman, our
Senior Vice President, Chief Financial Officer and Treasurer.
Basis of Presentation and Principles of Consolidation
The accompanying consolidated financial statements include the accounts and operations of the
Partnership and its consolidated subsidiaries and are prepared in conformity with accounting
principles generally accepted in the United States of America (“US GAAP”).
F-7
OXFORD RESOURCE PARTNERS, LP AND SUBSIDIARIES
NOTES TO CONSOLIDATED FINANCIAL STATEMENTS — (Continued)
We own a 51% interest in Harrison Resources and are therefore deemed to have control. As a
result, we consolidate all of Harrison Resources’ accounts with all material intercompany
transactions and balances being eliminated in our consolidated financial statements. The 49%
portion of Harrison Resources that we do not own is reflected as “Noncontrolling interest” in the
consolidated balance sheet and statements of operations. See Note 16.
Initial Public Offering
On July 6, 2010, we commenced the initial public offering of our common units pursuant to our
Registration Statement on Form S-1, Commission File No. 333-165662 (the “Registration Statement”),
which was declared effective by the U.S. Securities and Exchange Commission (the “SEC”) on July 12,
2010. Upon closing of our initial public offering on July 19, 2010, we issued 8,750,000 common
units that were registered at a price per unit of $18.50. The aggregate offering amount of the
securities sold pursuant to the Registration Statement was $161.9 million. In our initial public
offering, we granted the underwriters a 30 day option to purchase up to 1,312,500 additional common
units. This option was not exercised.
After deducting underwriting discounts and commissions of approximately $10.5 million paid to
the underwriters, our offering expenses of approximately $6.1 million and a structuring fee of
approximately $0.8 million, the net proceeds from our initial public offering were approximately
$144.5 million. We used all of the net proceeds from our initial public offering for the uses
described in our final prospectus dated July 15, 2010 and filed with the SEC.
Concurrent with our initial public offering, we entered into our $175 million credit facility
and paid off the amounts outstanding under our $115 million credit facility. See Note 10.
Unit Split
Immediately prior to the closing of our initial public offering on July 19, 2010, we executed
a unit split whereby the unitholders at that time received approximately 1.82097973 units in
exchange for each unit they held on that date. The units and per unit amounts referenced in the
accompanying consolidated financial statements and these notes thereto have been retroactively
restated to reflect this unit split.
NOTE 2: SUMMARY OF SIGNIFICANT ACCOUNTING POLICIES
Use of Estimates
In order to prepare financial statements in conformity with US GAAP, we are required to make
estimates and assumptions that affect the reported amounts of assets and liabilities and the
disclosures of contingent assets and liabilities (if any) at the date of the financial statements
and the reported amounts of revenue and expenses during the reporting period. The most significant
areas requiring the use of management estimates and assumptions relate to amortization calculations
using the units-of-production method, asset retirement obligations, useful lives for depreciation
of fixed assets and estimates of fair values of assets and liabilities. The estimates and
assumptions that we use are based upon our evaluation of the relevant facts and circumstances as of
the date of the financial statements. Actual results could ultimately differ from those estimates.
Cash and Cash Equivalents
Cash and cash equivalents consist of all unrestricted cash balances and highly liquid
investments that have an original maturity of three months or less. Financial instruments and
related items, which potentially subject us to concentrations of credit risk, consist primarily of
cash, cash equivalents and trade receivables. We place our cash and temporary cash investments
with high credit quality institutions. At times, such investments may be in excess of the FDIC
insurance limit. We have not experienced any losses in such accounts and believe we are not
exposed to any significant credit risk relating to our cash and cash equivalents.
F-8
OXFORD RESOURCE PARTNERS, LP AND SUBSIDIARIES
NOTES TO CONSOLIDATED FINANCIAL STATEMENTS — (Continued)
Restricted Cash
We had restricted cash and cash equivalents related to Harrison Resources of $3,561,000 and
$1,877,000 at December 31, 2010 and 2009, respectively, which are included in the balance sheet
caption “Other long-term assets” based on their anticipated release from restriction. Harrison
Resources’ cash, which is deemed to be restricted due to the limitations of its use for Harrison
Resources’ operations, primarily relates to funds set aside for future reclamation obligations.
See Note 16.
Allowance for Doubtful Accounts
We establish an allowance for losses on trade receivables when it is probable that all or part
of the outstanding balance will not be collected. Our management regularly reviews the probability
that a receivable will be collected and establishes or adjusts the allowance as necessary. There
was no allowance for doubtful accounts at December 31, 2010 and 2009.
Inventory
Inventory consists of coal that has been completely uncovered or that has been removed from
the pit and stockpiled for crushing, washing, or shipment to customers. Inventory also consists of
supplies, spare parts and fuel. Inventory is valued at the lower of average cost or market. The
cost of coal inventory includes certain operating expenses including overhead and stripping costs
incurred prior to the production phase, which commences when saleable coal, beyond a de minimis
amount, is produced.
Property, Plant and Equipment
Property, plant and equipment are recorded at cost. Expenditures that extend the useful lives
of existing plant and equipment are capitalized. Maintenance and repairs that do not extend the
useful life or increase productivity are charged to operating expense as incurred. Plant and
equipment are depreciated principally on the straight-line method over the estimated useful lives
of the assets based on the following schedule:
| |
|
|
|
|
|
Buildings and tipple |
|
25-39 years |
|
Machinery and equipment |
|
7-12 years |
|
Vehicles |
|
5-7 years |
|
Furniture and fixtures |
|
3-7 years |
|
Railroad siding |
|
7 years |
|
We acquire our coal reserves through purchases or leases. We deplete our coal reserves using
the units-of-production method on the basis of tonnage mined in relation to total estimated
recoverable tonnage with residual surface values classified as land and not depleted. At December
31, 2010 and 2009, all of our reserves were attributed to mine complexes engaged in mining
operations or leased to third parties. We believe that the carrying value of these reserves will
be recovered.
Exploration expenditures are charged to operating expense as incurred and include costs
related to locating coal deposits and the drilling and evaluation costs incurred to assess the
economic viability of such deposits. Costs incurred in areas outside the boundary of known coal
deposits and areas with insufficient drilling spacing to qualify as proven and probable reserves
are also expensed as exploration costs.
Once management determines there is sufficient evidence that the expenditure will result in a
future economic benefit to the Partnership, the costs are capitalized as mine development costs.
Capitalization of mine development costs continues until more than a de minimis amount of saleable
coal is extracted from the mine. Amortization of these mine development costs is then initiated
using the units-of-production method based upon the total estimated recoverable tonnage.
Advance Royalties
A substantial portion of our reserves are leased. Advance royalties are advance payments made
to lessors under terms of mineral lease agreements that are recoupable through an offset or credit
against royalties payable on future production. Amortization of leased coal interests is computed
using the units-of-production method over estimated recoverable tonnage.
F-9
OXFORD RESOURCE PARTNERS, LP AND SUBSIDIARIES
NOTES TO CONSOLIDATED FINANCIAL STATEMENTS — (Continued)
Financial Instruments and Derivative Financial Instruments
Our financial instruments include cash and cash equivalents, accounts receivable, accounts
payable, fixed rate debt, variable rate debt, interest rate swap agreements and an interest rate
cap agreement. We do not hold or purchase financial instruments or derivative financial
instruments for trading purposes.
We used interest rate swap agreements to partially reduce risks related to floating rate
financing agreements that are subject to changes in the market rate of interest. Terms of the
interest rate swap agreements required us to receive a variable interest rate and pay a fixed
interest rate. Our interest rate swap agreements and their variable rate financings were based
upon the London Interbank Offered Rate (“LIBOR”). We had an interest rate cap agreement that set
an upper limit on LIBOR that we would have to pay under the terms of our credit facility. This
agreement expired on December 31, 2010. We did not elect hedge accounting for any of these
agreements and, therefore, changes in market value on these derivatives are included in interest
expense on the consolidated statements of operations.
We measure our derivatives (interest rate swap agreements or interest rate cap agreement) at
fair value on a recurring basis using significant observable inputs, which are Level 2 inputs as
defined in the fair value hierarchy. See Note 12.
Our other financial instruments include fixed price forward contracts for diesel fuel. Our
risk management policy requires us to purchase up to 75% of our unhedged diesel fuel gallons on
fixed price forward contracts. These contracts meet the normal purchases and sales exclusion and
therefore are not accounted for as derivatives. We take physical delivery of all the fuel under
these forward contracts and such contracts usually have a term of one year or less.
Long-Lived Assets
We follow authoritative guidance that requires projected future cash flows from use and
disposition of assets to be compared with the carrying amounts of those assets when impairment
indicators are present. When the sum of projected cash flows is less than the carrying amount,
impairment losses are indicated. If the fair value of the assets is less than the carrying amount
of the assets, an impairment loss is recognized. In determining such impairment losses, discounted
cash flows or asset appraisals are utilized to determine the fair value of the assets being
evaluated. Also, in certain situations, expected mine lives are shortened because of changes to
planned operations. When that occurs and it is determined that the mine’s underlying costs are not
recoverable in the future, reclamation and mine closure obligations are accelerated by accelerating
the depletion rate. To the extent it is determined that an asset’s carrying value will not be
recoverable during a shorter mine life, the asset is written down to its recoverable value. There
were no indicators of impairment present during the years ended December 31, 2010, 2009 and 2008.
Accordingly, no impairment losses were recognized during any of these years.
Identifiable Intangible Assets and Liabilities
Identifiable intangible assets are recorded in other assets in the accompanying consolidated
balance sheets. We capitalize costs incurred in connection with the establishment of credit
facilities and amortize such costs to interest expense over the term of the credit facility using
the effective interest method.
We also have recorded intangible assets and liabilities at fair value associated with certain
customer relationships and below-market coal sales contracts, respectively. These balances arose
from the purchase accounting for our acquisitions of Phoenix Coal and Oxford. These intangible
assets are being amortized over their expected useful lives. See the Coal Sales Contracts section
of this Note 2 and Note 7 for further details.
Asset Retirement Obligations
Our asset retirement obligations, or AROs, arise from the Surface Mining Control and
Reclamation Act of 1977 (SMCRA) and similar state statutes, which require that mine property be
restored in accordance with specified standards and an approved reclamation plan. Our AROs are
recorded initially at fair value. It has been our practice, and we anticipate that it will
continue to be our practice, to perform a substantial portion of the reclamation work using
internal resources. Hence, the estimated costs used in determining the carrying amount of our AROs
may exceed the amounts that are eventually paid for reclamation costs if the reclamation work is
performed using internal resources.
F-10
OXFORD RESOURCE PARTNERS, LP AND SUBSIDIARIES
NOTES TO CONSOLIDATED FINANCIAL STATEMENTS — (Continued)
To determine the fair value of our AROs, we calculate on a mine-by-mine basis the present
value of estimated reclamation cash flows. This process requires us to estimate the current
disturbed acreage subject to reclamation, estimate future reclamation costs and make assumptions
regarding the mine’s productivity. These cash flows are discounted at a credit-adjusted, risk-free
interest rate based on U.S. Treasury bonds with a maturity similar to the expected lives of our
mines.
When the liability is initially established, the offset is capitalized to the producing mine
asset. Over time, the ARO liability is accreted to its present value, and the capitalized cost is
depleted using the units-of-production method for the related mine. The liability is also
increased as additional land is disturbed during the mining process. The timeline between digging
the mining pit and extracting the coal is relatively short; therefore, a portion of the liability
created for active mining is recognized within a month or so of establishment because the related
coal has been extracted. If the assumptions used to estimate the ARO liability do not materialize
as expected or regulatory changes occur, reclamation costs or obligations to perform reclamation
and mine closure activities could be materially different than currently estimated. We review our
entire reclamation liability at least annually and make necessary adjustments for permit changes as
granted by state authorities, additional costs resulting from revisions to cost estimates and the
quantity of acreage disturbed during the current year. At December 31, 2010, we had recorded ARO
liability of $13.0 million, including amounts reported as current liabilities. On an aggregate
undiscounted basis, we estimate the cost of final mine closure to be approximately $15.4 million.
Income Taxes
As a partnership, we are not a taxable entity for federal or state income tax purposes; the
tax effect of our activities passes through to our unitholders. Therefore, no provision or
liability for federal or state income taxes is included in our financial statements. Net income
for financial statement purposes may differ significantly from taxable income reportable to our
unitholders as a result of timing or permanent differences between financial reporting under US
GAAP and the regulations promulgated by the Internal Revenue Service.
Authoritative accounting guidance on accounting for uncertainty in income taxes establishes
the criterion that an individual tax position is required to meet for some or all of the benefits
of that position to be recognized in our financial statements. On initial application, the
uncertain tax position guidance has been applied to all tax positions for which the statute of
limitations remains open and no liability was recognized. Only tax positions that meet the
more-likely-than-not recognition threshold at the adoption date are recognized or will continue to
be recognized.
Revenue Recognition
Revenue from coal sales is recognized and recorded when shipment or delivery to the customer
has occurred, prices are fixed or determinable and the title or risk of loss has passed in
accordance with the terms of the sales contract. Under the typical terms of these contracts, risk
of loss transfers to the customer at the mine or dock, when the coal is loaded on the rail, barge,
or truck.
On September 29, 2008, we executed and received a prepayment from one of our customers of
$13,250,000 toward its future coal deliveries in 2009. This amount was classified as deferred
revenue and recognized as revenue as
we delivered the coal in accordance with the terms of the arrangement. As of December 31,
2009, $2,090,000 of the prepayment remained on our balance sheet as deferred revenue and was fully
recognized in 2010.
Freight and handling costs paid to third party carriers and invoiced to customers are recorded
as cost of transportation and transportation revenue, respectively.
Royalty and non-coal revenue consists of coal royalty income, service fees for providing
landfill earth moving and transportation services, commissions that we receive from a third party
who sells limestone that we recover during our coal mining process, service fees for operating a
coal unloading facility and fees that we receive for trucking ash for municipal utility customers.
Revenues are recognized when earned or when services are performed. Royalty revenue relates to the
overriding royalty we receive on our underground coal reserves that we sublease to a third party
mining company. Prior to June 2008, we did not receive any royalties because we were purchasing
the output of this mine and no royalty was due on purchases by us. Starting in June 2008, our
sublessee began selling the coal production for its own account which entitled us to start
receiving royalty revenue. For the years ended 2010, 2009 and 2008, we received royalties of
$2,790,000, $4,513,000 and $1,289,000, respectively.
F-11
OXFORD RESOURCE PARTNERS, LP AND SUBSIDIARIES
NOTES TO CONSOLIDATED FINANCIAL STATEMENTS — (Continued)
Below-Market Coal Sales Contracts
Our below-market coal sales contracts were acquired through the Phoenix Coal acquisition in
2009 and were coal sales contracts for which the prevailing market price for coal specified in the
contract was in excess of the contract price. The fair value was based on discounted cash flows
resulting from the difference between the below-market contract price and the prevailing market
price at the date of acquisition. The difference between the below-market contracts cash flows and
the cash flows at the prevailing market price are amortized into coal sales on the basis of tons
shipped over the terms of the respective contracts.
Equity-Based Compensation
We account for unit-based awards in accordance with applicable guidance, which establishes
standards of accounting for transactions in which an entity exchanges its equity instruments for
goods or services. Equity-based compensation expense is recorded based upon the fair value of the
award at grant date. Such costs are recognized as expense on a straight-line basis over the
corresponding vesting period. Prior to our initial public offering (see the Initial Public
Offering section in Note 1), the fair value of our LTIP units was determined based on the sale
price of our limited partner units in arm’s-length transactions. Subsequent to our initial public
offering, the fair value of our LTIP units is determined based on the closing sales price of our
units on the New York Stock Exchange on the grant date. See Note 13.
Earnings Per Unit
For purposes of our earnings per unit calculation, we have applied the two class method. The
classes of units are our limited partner and general partner units. All outstanding units share
pro rata in income allocations and distributions and our general partner has sole voting rights.
Prior to our initial public offering (see the Initial Public Offering section in Note 1), limited
partner units were separated into Class A and Class B units to prepare for a potential transaction
such as an initial public offering. In connection with and since our initial public offering, our
limited partner units were converted to and are maintained as common units and subordinated units.
Limited Partner Units: Basic earnings per unit are computed by dividing net income
attributable to limited partners by the weighted average units outstanding during the reporting
period. Diluted earnings per unit are computed similar to basic earnings per unit except that the
weighted average units outstanding and net income attributable to limited partners are increased to
include phantom units that have not yet vested and that will convert to LTIP units upon vesting.
In years of a loss, the phantom units are antidilutive and therefore not included in the earnings
per unit calculation.
General Partner Units: Basic earnings per unit are computed by dividing net income
attributable to our GP by the weighted average units outstanding during the reporting period.
Diluted earnings per unit for our GP are computed similar to basic earnings per unit except that
the net income attributable to the general partner units is adjusted for the dilutive impact of the
phantom units. In years of a loss, the phantom units are antidilutive and therefore not included
in the earnings per unit calculation.
F-12
OXFORD RESOURCE PARTNERS, LP AND SUBSIDIARIES
NOTES TO CONSOLIDATED FINANCIAL STATEMENTS — (Continued)
The computation of basic and diluted earnings per unit under the two class method for
limited partner units and general partner units is presented below:
| |
|
|
|
|
|
|
|
|
|
|
|
|
| |
|
Years Ended December 31, |
|
| |
|
2010 |
|
|
2009 |
|
|
2008 |
|
| |
|
(in thousands, except for unit and per unit information) |
|
|
|
|
|
|
|
|
|
|
|
|
|
|
Limited partner units |
|
|
|
|
|
|
|
|
|
|
|
|
Average units outstanding: |
|
|
|
|
|
|
|
|
|
|
|
|
Basic |
|
|
15,887,977 |
|
|
|
11,033,840 |
|
|
|
10,104,324 |
|
Effect of equity-based awards |
|
|
n/a |
|
|
|
49,330 |
|
|
|
n/a |
|
|
|
|
|
|
|
|
|
|
|
|
|
|
|
|
|
|
|
|
Diluted |
|
|
15,887,977 |
|
|
|
11,083,170 |
|
|
|
10,104,324 |
|
|
|
|
|
|
|
|
|
|
|
|
|
|
|
|
|
|
|
|
|
|
|
|
Net income attributable to limited partners |
|
|
|
|
|
|
|
|
|
|
|
|
Basic |
|
$ |
(7,204 |
) |
|
$ |
23,037 |
|
|
$ |
(2,432 |
) |
Diluted |
|
|
(7,204 |
) |
|
|
23,038 |
|
|
|
(2,432 |
) |
|
|
|
|
|
|
|
|
|
|
|
|
|
Earnings per limited partner unit |
|
|
|
|
|
|
|
|
|
|
|
|
Basic |
|
$ |
(0.45 |
) |
|
$ |
2.09 |
|
|
$ |
(0.24 |
) |
Diluted |
|
|
(0.45 |
) |
|
|
2.08 |
|
|
|
(0.24 |
) |
|
|
|
|
|
|
|
|
|
|
|
|
|
General partner units |
|
|
|
|
|
|
|
|
|
|
|
|
Average units outstanding: |
|
|
|
|
|
|
|
|
|
|
|
|
Basic and diluted |
|
|
323,647 |
|
|
|
223,956 |
|
|
|
206,210 |
|
|
|
|
|
|
|
|
|
|
|
|
|
|
Net income attributable to general partner |
|
|
|
|
|
|
|
|
|
|
|
|
Basic |
|
$ |
(147 |
) |
|
$ |
467 |
|
|
$ |
(50 |
) |
Diluted |
|
|
(147 |
) |
|
|
466 |
|
|
|
(50 |
) |
|
|
|
|
|
|
|
|
|
|
|
|
|
Earnings per general partner unit |
|
|
|
|
|
|
|
|
|
|
|
|
Basic |
|
$ |
(0.45 |
) |
|
$ |
2.09 |
|
|
$ |
(0.24 |
) |
Diluted |
|
|
(0.45 |
) |
|
|
2.08 |
|
|
|
(0.24 |
) |
|
|
|
|
|
|
|
|
|
|
|
|
|
Anti-dilutive shares (1) |
|
|
108,486 |
|
|
|
— |
|
|
|
36,588 |
|
|
|
|
| (1) |
|
Anti-dilutive units are not used in calculating diluted average units. |
Reclassification
Certain cash flow amounts have been reclassified for 2009 to conform to current year
presentation. These reclassifications relate to credit facility issuance costs and the non-cash
portion of our AROs.
New Accounting Standards Issued
In August 2009, the Financial Accounting Standards Board, or FASB, issued ASU 2009-05,
Measuring Liabilities at Fair Value. The amendment provides clarification that in circumstances in
which a quoted price in an active market for the identical liability is not available, a reporting
entity is required to measure fair value using one or more of the alternative valuation methods
outlined in the guidance. It also clarifies that restrictions preventing the transfer of a
liability should not be considered as a separate input or adjustment in the measurement of its fair
value. This amendment was effective as of the beginning of interim and annual reporting periods
that begin after August 27, 2009. The adoption of this guidance did not impact our consolidated
financial statements.
In June 2009, the FASB amended guidance for the consolidation of a variable interest entity (a
“VIE”). This guidance updated the determination of whether an enterprise is the primary
beneficiary of a VIE, and is, therefore, required to consolidate an entity, by requiring a
qualitative analysis rather than a quantitative analysis. This standard also requires continuous
reassessments of whether an enterprise is the primary beneficiary of a VIE. Previously,
reconsideration was required only when specific events had occurred. This guidance also requires
enhanced disclosure about an enterprise’s involvement with a VIE. The provisions of these updates
are effective as of the beginning of interim and annual reporting periods that begin after November
15, 2009. The adoption of this guidance did not impact our consolidated financial statements.
F-13
OXFORD RESOURCE PARTNERS, LP AND SUBSIDIARIES
NOTES TO CONSOLIDATED FINANCIAL STATEMENTS — (Continued)
In January 2010, the FASB issued ASU 2010-06, Fair Value Measurements and Disclosures —
Improving Disclosures about Fair Value Measurements. This guidance requires reporting entities to
make new disclosures about
recurring or non-recurring fair value measurements including significant transfers into and
out of Level 1 and Level 2 fair value measurements and information on purchases, sales, issuances,
and settlements on a gross basis in the reconciliation of Level 3 fair value measurements. We
adopted this guidance effective January 1, 2010 for Level 1 and Level 2 reconciliation disclosures
and effective December 31, 2010 for Level 3 reconciliation disclosures. The adoption of this
guidance did not have a material effect on our consolidated financial statements.
In December 2010, the FASB issued ASU 2010-29, Business Combinations — Disclosure of
Supplementary Pro Forma Information for Business Combinations. This guidance requires a public
entity to disclose the revenue and earnings of the combined entity in its consolidated financial
statements as though the business combination(s) that occurred during the current year had occurred
as of the beginning of the comparable prior annual reporting period only. This guidance also
expands the supplemental pro forma disclosures to include a description of the nature and amount of
material, non-recurring pro forma adjustments directly attributable to the business combination(s)
included in the reported pro forma revenue and earnings. These amendments are effective
prospectively for business combinations for which the acquisition date is on or after the beginning
of the first annual reporting period beginning on or after December 31, 2010. Early adoption of
the guidance is permissible. We do not believe this guidance will have a material impact on our
consolidated financial statements.
NOTE 3: ACQUISITION
On September 30, 2009, we acquired 100% of the active western Kentucky surface mining coal
operations of Phoenix Coal. This acquisition provided us an entry into the Illinois Basin and
consisted of four active surface coal mines and coal reserves of 20 million tons, as well as
mineral rights, working capital and various coal sales and purchase contracts. The application of
purchase accounting requires that the total purchase price be allocated to the fair value of assets
acquired and liabilities assumed based upon the fair values of the assets and the liabilities as of
the acquisition date. The following table summarizes the fair values of the assets acquired and
the liabilities assumed as of the acquisition date:
| |
|
|
|
|
|
Net working capital |
|
$ |
1,594,000 |
|
Mineral rights and land |
|
|
10,264,000 |
|
Property, plant and equipment, net |
|
|
20,519,000 |
|
Other assets |
|
|
404,000 |
|
Coal sales contracts |
|
|
(6,600,000 |
) |
Other liabilities |
|
|
(4,083,000 |
) |
|
|
|
|
|
|
|
|
|
Net assets acquired |
|
$ |
22,098,000 |
|
|
|
|
|
The purchase price of $18,275,000 was less than the fair value of the net assets acquired
of $22,098,000, and as a result we recorded a gain of $3,823,000 included in other operating income
in the consolidated statement of operations for the year ended December 31, 2009. Phoenix Coal’s
surface coal mining operations had previously operated at a loss and its management and board of
directors elected to exit the surface mining business to focus on maximizing the value of its
underground reserves.
F-14
OXFORD RESOURCE PARTNERS, LP AND SUBSIDIARIES
NOTES TO CONSOLIDATED FINANCIAL STATEMENTS — (Continued)
In connection with the closing of our Phoenix Coal acquisition, we entered into an escrow
agreement with Phoenix Coal. The purpose of the escrow agreement is to provide a source of funding
for any indemnification claims we make against Phoenix Coal for breaches of warranties and/or
covenants as the seller under the terms of the acquisition agreement. To date, there have been no
indemnification claims against the escrow fund. The escrow was funded with $3,300,000. The escrow
agreement provides for the release to Phoenix Coal of portions of the escrow fund including
earnings thereon at periodic intervals, with one-third of the escrow fund amount being released to
Phoenix Coal at each of March 31, 2010, September 30, 2010, and March 31, 2011. All amounts are
offset for any indemnification claims. Pursuant to such release provisions, the escrow agent
released $1,100,000 on each of the first two release dates as scheduled for an aggregate amount of
$2,200,000 which represents two-thirds of the escrow fund amount.
As part of the acquisition agreement, we agreed to make additional payments of up to
$1,000,000 in two installments to Phoenix Coal if Phoenix Coal secured specific surface and mineral
rights by certain dates, the last of which expired on June 30, 2010. During the fourth quarter of
2009, we paid $500,000 to Phoenix Coal for obtaining
such surface rights pertaining to certain coal leases. The remaining $500,000 contingent
payment was paid to Phoenix Coal in January 2010 for obtaining such mineral rights. At the
acquisition closing date, we concluded that the fair value of the contingent liability was
$1,000,000 and recorded that amount in our financial statements as the payment was deemed probable.
We also assumed a contract with a third party to pay a contingent fee if the third party was
able to arrange to lease or purchase, on our behalf, a specified amount of coal reserves by July
31, 2010. The contract called for a payment of $1,000,000; however, we concluded that the fair
value of the contingent liability was $625,000 using a probability weighted average of the likely
outcomes. That amount was recorded as a liability with a corresponding asset in the consolidated
balance sheet under the caption of “Property, plant and equipment, net” at December 31, 2009. This
liability was settled in 2010 with an advance royalty payment of $500,000, and the $125,000
difference was recorded as a reduction to Property, plant and equipment, net.
For the fourth quarter of 2009, our surface coal mine operations in the Illinois Basin that we
acquired from Phoenix Coal reported total revenue of approximately $22.5 million and a net loss
from operations of approximately $1.9 million. As a result of recording a gain of $3.8 million
relating to the acquisition, the net income of these operations for the quarter was approximately
$1.9 million, excluding general and administrative overhead expenses which are not allocated among
our subsidiaries. In 2010, the Illinois Basin operations were included in our results of
operations for the full year.
The following unaudited pro forma financial information reflects the consolidated results of
operations as if the Phoenix Coal acquisition had occurred at the beginning of 2009. The pro forma
information includes adjustments primarily for depreciation, depletion and amortization based upon
fair values of property, plant and equipment and mineral rights, leased equipment, and interest
expense for acquisition debt and additional capital contributions. The pro forma financial
information is not necessarily indicative of results that actually would have occurred if we had
assumed operation of these assets on the date indicated nor are they indicative of future results.
| |
|
|
|
|
|
|
|
|
| |
|
Pro Forma Results for the |
|
| |
|
Years Ended December 31, |
|
| |
|
2009 |
|
|
2008 |
|
| |
|
(unaudited) |
|
|
|
|
|
|
|
|
|
|
Revenue |
|
$ |
356,894,000 |
|
|
$ |
313,118,000 |
|
Net income (loss) attributable to
Oxford Resource Partners, LP unitholders |
|
|
6,479,000 |
|
|
|
(21,711,000 |
) |
F-15
OXFORD RESOURCE PARTNERS, LP AND SUBSIDIARIES
NOTES TO CONSOLIDATED FINANCIAL STATEMENTS — (Continued)
NOTE 4: INVENTORY
Inventory
consisted of the following as of December 31:
| |
|
|
|
|
|
|
|
|
| |
|
2010 |
|
|
2009 |
|
|
|
|
|
|
|
|
|
|
Coal |
|
$ |
6,451,000 |
|
|
$ |
4,759,000 |
|
Fuel |
|
|
1,836,000 |
|
|
|
1,264,000 |
|
Supplies and spare parts |
|
|
4,353,000 |
|
|
|
2,778,000 |
|
|
|
|
|
|
|
|
|
|
|
|
|
|
|
|
|
Total |
|
$ |
12,640,000 |
|
|
$ |
8,801,000 |
|
|
|
|
|
|
|
|
NOTE 5: PROPERTY, PLANT AND EQUIPMENT, NET
Property, plant and equipment, net of accumulated depreciation, depletion and amortization,
consisted of the following as of December 31:
| |
|
|
|
|
|
|
|
|
| |
|
2010 |
|
|
2009 |
|
|
|
|
|
|
|
|
|
|
Property, plant and equipment, gross |
|
|
|
|
|
|
|
|
Land |
|
$ |
3,374,000 |
|
|
$ |
3,374,000 |
|
Coal reserves |
|
|
54,250,000 |
|
|
|
39,905,000 |
|
Mine development costs |
|
|
12,237,000 |
|
|
|
8,606,000 |
|
|
|
|
|
|
|
|
|
|
|
|
|
|
|
|
|
Total property |
|
|
69,861,000 |
|
|
|
51,885,000 |
|
|
|
|
|
|
|
|
|
|
|
|
|
|
|
|
|
Buildings and tipple |
|
|
2,084,000 |
|
|
|
2,025,000 |
|
Machinery and equipment |
|
|
199,924,000 |
|
|
|
133,667,000 |
|
Vehicles |
|
|
4,267,000 |
|
|
|
3,913,000 |
|
Furniture and fixtures |
|
|
1,477,000 |
|
|
|
690,000 |
|
Railroad sidings |
|
|
160,000 |
|
|
|
160,000 |
|
|
|
|
|
|
|
|
|
|
|
|
|
|
|
|
|
Total property, plant and equipment, gross |
|
|
277,773,000 |
|
|
|
192,340,000 |
|
Less: accumulated depreciation, depletion and amortization |
|
|
79,079,000 |
|
|
|
42,879,000 |
|
|
|
|
|
|
|
|
|
|
|
|
|
|
|
|
|
Total property, plant and equipment, net |
|
$ |
198,694,000 |
|
|
$ |
149,461,000 |
|
|
|
|
|
|
|
|
The amounts of depreciation expense related to owned and leased fixed assets, depletion
expense related to owned and leased coal reserves, and amortization expense related to mine
development costs for the respective years are set forth below:
| |
|
|
|
|
|
|
|
|
|
|
|
|
| |
|
For the Years Ended December 31, |
|
| |
|
2010 |
|
|
2009 |
|
|
2008 |
|
|
|
|
|
|
|
|
|
|
Expense Type: |
|
|
|
|
|
|
|
|
|
|
|
|
Depreciation |
|
$ |
32,747,000 |
|
|
$ |
19,632,000 |
|
|
$ |
11,455,000 |
|
Depletion |
|
|
5,945,000 |
|
|
|
4,672,000 |
|
|
|
3,226,000 |
|
Amortization — mine development |
|
|
3,298,000 |
|
|
|
1,200,000 |
|
|
|
1,533,000 |
|
F-16
OXFORD RESOURCE PARTNERS, LP AND SUBSIDIARIES
NOTES TO CONSOLIDATED FINANCIAL STATEMENTS — (Continued)
NOTE 6: OPERATING LEASES
We lease certain operating facilities under non-cancelable lease agreements that expire on
various dates through 2018. Generally the lease agreements are for a periods which range from five
to ten years. As of December 31, 2010, aggregate lease payments that are required under operating
leases that have initial or remaining non-cancelable lease terms in excess of one year are set
forth below:
| |
|
|
|
|
|
For the years ending December 31, 2011 |
|
$ |
537,000 |
|
2012 |
|
|
543,000 |
|
2013 |
|
|
526,000 |
|
2014 |
|
|
513,000 |
|
2015 |
|
|
62,000 |
|
Thereafter |
|
|
37,000 |
|
For the years ended December 31, 2010, 2009 and 2008, we incurred lease expenses of
approximately $4,681,000, $5,428,000, and $2,267,000, respectively. On July 19, 2010, we
terminated all of our equipment leases and purchased the equipment that was under lease with
proceeds from our initial public offering and borrowings from our $175 million credit facility.
We also entered into various coal reserve lease agreements under which future royalty payments
are due based on production. Such payments are capitalized as advance royalties at the time of
payment, and amortized into royalty expense based on the stated recoupment rate.
NOTE 7: INTANGIBLE ASSETS AND LIABILITIES
| |
|
|
|
|
|
|
|
|
|
|
|
|
|
|
|
|
| |
|
December 31, 2010 |
|
| |
|
Estimated |
|
|
|
|
|
|
|
|
|
|
|
| |
|
Remaining |
|
|
|
|
|
|
Accumulated |
|
|
Net Carrying |
|
| |
|
Life (years) |
|
|
Cost |
|
|
Amortization |
|
|
Value |
|
Intangible assets |
|
|
|
|
|
|
|
|
|
|
|
|
|
|
|
|
Customer relationships |
|
|
17 |
|
|
$ |
3,315,000 |
|
|
$ |
1,358,000 |
|
|
$ |
1,957,000 |
|
Deferred financing costs |
|
|
2 |
|
|
|
5,603,000 |
|
|
|
854,000 |
|
|
|
4,749,000 |
|
|
|
|
|
|
|
|
|
|
|
|
|
|
|
Total intangible assets |
|
|
|
|
|
$ |
8,918,000 |
|
|
$ |
2,212,000 |
|
|
$ |
6,706,000 |
|
|
|
|
|
|
|
|
|
|
|
|
|
|
|
|
|
|
|
|
|
|
|
|
Intangible liabilities |
|
|
|
|
|
|
|
|
|
|
|
|
|
|
|
|
Below-market coal sales contracts |
|
|
2 |
|
|
$ |
6,600,000 |
|
|
$ |
4,978,000 |
|
|
$ |
1,622,000 |
|
|
|
|
|
|
|
|
|
|
|
|
|
|
|
| |
|
|
|
|
|
|
|
|
|
|
|
|
|
|
|
|
| |
|
December 31, 2009 |
|
| |
|
Estimated |
|
|
|
|
|
|
|
|
|
|
|
| |
|
Remaining |
|
|
|
|
|
|
Accumulated |
|
|
Net Carrying |
|
| |
|
Life (years) |
|
|
Cost |
|
|
Amortization |
|
|
Value |
|
Intangible assets |
|
|
|
|
|
|
|
|
|
|
|
|
|
|
|
|
Customer relationships |
|
|
18 |
|
|
$ |
3,315,000 |
|
|
$ |
1,019,000 |
|
|
$ |
2,296,000 |
|
Deferred financing costs |
|
|
3 |
|
|
|
1,811,000 |
|
|
|
174,000 |
|
|
|
1,637,000 |
|
|
|
|
|
|
|
|
|
|
|
|
|
|
|
Total intangible assets |
|
|
|
|
|
$ |
5,126,000 |
|
|
$ |
1,193,000 |
|
|
$ |
3,933,000 |
|
|
|
|
|
|
|
|
|
|
|
|
|
|
|
|
|
|
|
|
|
|
|
|
Intangible liabilities |
|
|
|
|
|
|
|
|
|
|
|
|
|
|
|
|
Below-market coal sales contracts |
|
|
3 |
|
|
$ |
6,600,000 |
|
|
$ |
1,705,000 |
|
|
$ |
4,895,000 |
|
|
|
|
|
|
|
|
|
|
|
|
|
|
|
Customer relationships represent intangible assets that were recorded at fair value when
we acquired Oxford on August 24, 2007. The net carrying value of our customer relationships is
reflected in our consolidated balance sheets under the caption “Other long-term assets.” We
amortize these assets over the expected life of the respective customer relationships. The amount
included in depreciation, depletion and amortization related to customer relationships was
$339,000, $398,000 and $446,000 for the years ended December 31, 2010, 2009 and 2008, respectively.
F-17
OXFORD RESOURCE PARTNERS, LP AND SUBSIDIARIES
NOTES TO CONSOLIDATED FINANCIAL STATEMENTS — (Continued)
We capitalized costs incurred in connection with the establishment of credit facilities.
Concurrent with our initial public offering, we paid off the amounts outstanding under our $115
million credit facility and entered into a $175 million credit facility. See Note 10. We
capitalized the cost of the $175 million credit facility of $5,603,000 and wrote off, to interest
expense, the unamortized costs of $1,302,000 from the $115 million credit facility. On September
30, 2009, we amended and restated the credit agreement for our $115 million credit facility. The
amended and restated credit agreement for our $115 million credit facility was determined to be
substantially different from our prior credit agreement, and therefore we wrote off, to interest
expense, the remaining unamortized capitalized costs of $1,252,000 from our prior credit agreement
in 2009. The net carrying value of the deferred financing costs is reflected in our consolidated
balance sheets under the caption “Other long-term assets.”
We incurred costs of $1,811,000 associated with the $115 million credit facility which we
capitalized. These costs are amortized to interest expense over the life of the $115 million
credit facility using the interest method. Amortization of deferred financing costs included in
interest expense was $1,189,000, $530,000 and $398,000 for the years ended December 31, 2010, 2009
and 2008, respectively.
Our below-market coal sales contracts, acquired through the Phoenix Coal acquisition in 2009
and in connection with our acquisition of Oxford in 2007, were coal sales contracts for which the
prevailing market price for coal specified in the contract was in excess of the contract price.
The difference between the below-market contracts cash flows and the cash flows at the prevailing
market price are amortized into coal sales on the basis of tons shipped over the terms of the
respective contracts. Amortization of these below-market contracts included in revenue was
$1,424,000, $1,705,000 and $1,955,000 for the years ended December 31, 2010, 2009 and 2008,
respectively. An additional $1,849,000 was recorded in contract terminations in 2010, when one of
these contracts was amended to market rate. The current portion of the net carrying value of our
below-market coal sales contracts is reflected in our consolidated balance sheets under the caption
“Other current liabilities.” The non-current portion of the net carrying value of our below-market
coal sales contracts is reflected in our consolidated balance sheets under the caption “Other
long-term liabilities.”
Expected amortization of identifiable intangible assets and deferred loan costs for each of
the next five years will be approximately:
| |
|
|
|
|
|
For the years ending December 31, 2011 |
|
$ |
1,980,000 |
|
2012 |
|
|
1,950,000 |
|
2013 |
|
|
1,347,000 |
|
2014 |
|
|
468,000 |
|
2015 |
|
|
961,000 |
|
We evaluate our intangible assets for impairment when indicators of impairment exist. For the
years ended December 31, 2010, 2009 and 2008, there were no indicators of impairment present.
Accordingly, no impairment losses were recognized during any of these years.
Based on expected shipments related to the below-market contracts, we expect to record annual
amortization income of:
| |
|
|
|
|
|
For the years ending December 31, 2011 |
|
$ |
1,111,000 |
|
2012 |
|
|
511,000 |
|
F-18
OXFORD RESOURCE PARTNERS, LP AND SUBSIDIARIES
NOTES TO CONSOLIDATED FINANCIAL STATEMENTS — (Continued)
NOTE 8: OTHER CURRENT LIABILITIES
Other
current liabilities consisted of the following as of December 31:
| |
|
|
|
|
|
|
|
|
| |
|
2010 |
|
|
2009 |
|
|
|
|
|
|
|
|
|
|
Below-market coal sales contracts(1) |
|
$ |
1,111,000 |
|
|
$ |
2,345,000 |
|
Accrued interest and interest rate swap(2) |
|
|
828,000 |
|
|
|
860,000 |
|
Contingent liabilities(1) |
|
|
— |
|
|
|
1,125,000 |
|
Other |
|
|
1,013,000 |
|
|
|
1,384,000 |
|
|
|
|
|
|
|
|
Total |
|
$ |
2,952,000 |
|
|
$ |
5,714,000 |
|
|
|
|
|
|
|
|
|
|
|
| (1) |
|
Below-market coal sales contracts and contingent liabilities assumed with the Phoenix Coal acquisition. See Note 3 and Note 7. |
| |
| (2) |
|
The interest rate swap is discussed in Note 11. |
NOTE 9: ASSET RETIREMENT OBLIGATIONS
Our asset retirement obligations arise from the SMCRA and similar state statutes, which
require that mine property be restored in accordance with specified standards and an approved
reclamation plan. The required reclamation activities to be performed are outlined in our mining
permits. These activities include reclaiming the pit and support acreage at surface mines.
We review our asset retirement obligations at least annually and make necessary adjustments
for permit changes as granted by state authorities and for revisions of estimates of the amount and
timing of costs. When the liability is initially recorded for a new mine site, the offset is
recorded to the producing mine asset. Over time, the ARO liability is accreted to its present
value and the capitalized cost for the related mine is depleted using the units-of-production
method. The liability is also increased as additional land is disturbed during the mining process.
The timeline between digging the mining pit and extracting the coal is relatively short;
therefore, a portion of the liability created for active mining is recognized within a month or so
of establishment because the related coal has been extracted.
At December 31, 2010, we had recorded asset retirement obligation liabilities of $13.0
million, including amounts reported as current liabilities. While the precise amount of these
future costs cannot be determined with absolute certainty, we estimate that, as of December 31,
2010, the aggregate undiscounted cost of final mine closure is approximately $15.4 million.
The following table presents the activity affecting the asset retirement obligations for the
respective years:
| |
|
|
|
|
|
|
|
|
| |
|
Years Ended December 31, |
|
| |
|
2010 |
|
|
2009 |
|
|
|
|
|
|
|
|
|
|
Beginning balance |
|
$ |
13,343,000 |
|
|
$ |
9,292,000 |
|
Accretion expense |
|
|
836,000 |
|
|
|
650,000 |
|
Payments |
|
|
(3,430,000 |
) |
|
|
(3,358,000 |
) |
Revisions in estimated cash flows |
|
|
2,238,000 |
|
|
|
3,802,000 |
|
Additions due to acquisition |
|
|
— |
|
|
|
2,957,000 |
|
|
|
|
|
|
|
|
|
|
|
|
|
|
|
|
|
Total asset retirement obligations |
|
|
12,987,000 |
|
|
|
13,343,000 |
|
Less current portion |
|
|
(6,450,000 |
) |
|
|
(7,377,000 |
) |
|
|
|
|
|
|
|
|
|
|
|
|
|
|
|
|
Noncurrent liability |
|
$ |
6,537,000 |
|
|
$ |
5,966,000 |
|
|
|
|
|
|
|
|
F-19
OXFORD RESOURCE PARTNERS, LP AND SUBSIDIARIES
NOTES TO CONSOLIDATED FINANCIAL STATEMENTS — (Continued)
NOTE 10: LONG-TERM DEBT
Our long-term debt as of December 31, 2010 and 2009 consisted of long-term debt under our $175
million credit facility with a syndicate of lenders for which Citicorp USA, Inc. is acting as
administrative agent (our “$175 million credit facility”) and long-term debt under our $115 million
credit facility with a syndicate of lenders for which FirstLight Funding I, Ltd. acted as
administrative agent (our “$115 million credit facility”), respectively, as well as other note
payable debt, as follows:
| |
|
|
|
|
|
|
|
|
| |
|
2010 |
|
|
2009 |
|
|
|
|
|
|
|
|
|
|
$175 million credit facility: |
|
|
|
|
|
|
|
|
Term loan |
|
$ |
57,000,000 |
|
|
|
— |
|
Revolving credit line loans |
|
|
33,000,000 |
|
|
|
— |
|
|
|
|
|
|
|
|
|
|
|
|
|
|
|
|
|
Total $175 million credit facility loans |
|
|
90,000,000 |
|
|
|
— |
|
|
|
|
|
|
|
|
|
|
$115 million credit facility: |
|
|
|
|
|
|
|
|
Term loans |
|
|
— |
|
|
|
64,925,000 |
|
Acquisition loans |
|
|
— |
|
|
|
21,304,000 |
|
Revolving loans |
|
|
— |
|
|
|
4,500,000 |
|
|
|
|
|
|
|
|
|
|
|
|
|
|
|
|
|
Total $115 million credit facility loans |
|
|
— |
|
|
|
90,729,000 |
|
|
|
|
|
|
|
|
|
|
|
|
|
|
|
|
|
Note payable — Peabody #1 |
|
|
— |
|
|
|
228,000 |
|
Note payable — Peabody #2 |
|
|
947,000 |
|
|
|
1,843,000 |
|
Note payable — CONSOL #1 |
|
|
— |
|
|
|
1,570,000 |
|
Note payable — CONSOL #2 |
|
|
267,000 |
|
|
|
1,317,000 |
|
Note payable — CONSOL #3 |
|
|
11,720,000 |
|
|
|
— |
|
Note payable — Other |
|
|
52,000 |
|
|
|
24,000 |
|
|
|
|
|
|
|
|
|
|
|
|
|
|
|
|
|
Long-term debt |
|
|
102,986,000 |
|
|
|
95,711,000 |
|
Less current portion |
|
|
(7,249,000 |
) |
|
|
(4,113,000 |
) |
|
|
|
|
|
|
|
|
|
|
|
|
|
|
|
|
Total long-term debt |
|
$ |
95,737,000 |
|
|
$ |
91,598,000 |
|
|
|
|
|
|
|
|
$175 Million Credit Facility
In connection with our initial public offering in July of 2010, we paid off the amounts
outstanding under our $115 million credit facility and entered into our $175 million credit
facility with Citicorp USA, Inc., as Administrative Agent, Citibank, N.A., as Swing Line Bank,
Barclays Bank PLC and The Huntington National Bank, as Co-Syndication Agents, Fifth Third Bank and
Comerica Bank, as Co-Documentation Agents, and the lenders party thereto. Our $175 million credit
facility became effective on July 19, 2010, the closing date of our initial public offering, and
provides for a $60 million term loan and a $115 million revolving credit line. We are required to
make quarterly principal payments of $1.5 million on the term loan commencing on September 30, 2010
and continuing until the maturity date in 2014 when the remaining balance is to be paid. The $60
million term loan and $115 million revolving credit line will mature in 2014 and 2013,
respectively, and borrowings will bear interest at a variable rate per annum equal to, at our
option, the London Interbank Offered Rate (“LIBOR”) or the Base Rate, as the case may be, plus the
Applicable Margin (LIBOR, Base Rate and Applicable Margin are each defined in the credit agreement
evidencing our $175 million credit facility).
Borrowings under our $175 million credit facility are secured by a first-priority lien on and
security interest in substantially all of our assets. Our $175 million credit facility contains
customary covenants, including restrictions on our ability to incur additional indebtedness, make
certain investments, make distributions to our unitholders, make ordinary course dispositions of
assets over predetermined levels or enter into equipment leases, as well as enter into a merger or
sale of all or substantially all of our property or assets, including the sale or transfer of
interests in our subsidiaries. Our $175 million credit facility also requires compliance with
certain financial covenant ratios, including limiting our leverage ratio (the ratio of consolidated
indebtedness to adjusted EBITDA) to no greater than 2.75 : 1.0 and limiting our interest coverage
ratio (the ratio of adjusted EBITDA to consolidated interest expense) to no less than 4.0 : 1.0.
In addition, we are not permitted under our $175 million credit facility to fund capital
expenditures in any fiscal year in excess of certain predetermined amounts.
F-20
OXFORD RESOURCE PARTNERS, LP AND SUBSIDIARIES
NOTES TO CONSOLIDATED FINANCIAL STATEMENTS — (Continued)
The events that constitute an event of default under our $175 million credit facility include,
among other things, failure to pay principal and interest when due, breach of representations and
warranties, failure to comply with covenants, voluntary bankruptcy or liquidation and a change of
control.
We were in compliance with all covenants under the terms of the credit agreement for our $175
million credit facility as of December 31, 2010.
$115 Million Credit Facility
Our $115 million credit facility was maintained with a syndicate of lenders with FirstLight
Funding I, Ltd. (“FirstLight”) acting as the administrative agent pursuant to a credit agreement
with FirstLight and such lenders. The credit agreement for our $115 million credit facility
provided for borrowings of up to $115,000,000 in the form of term loans of up to $70,000,000,
acquisition loans of up to $25,000,000 and revolving loans under a revolving credit facility of up
to $20,000,000.
Total Borrowings
At December 31, 2010 (under our $175 million credit facility) and 2009 (under our $115 million
credit facility), we had $90,000,000 and $90,729,000, respectively, of borrowings outstanding, and
$6,723,000 and $8,245,000, respectively, of letters of credit outstanding. At December 31, 2010
(under our $175 million credit facility) and 2009 (under our $115 million credit facility), we had
available unused capacity for borrowings of approximately $39,000,000 and $7,255,000, respectively.
Subsequent to December 31, 2010, we borrowed an additional $11,000,000 under our $175 million
credit facility. The variable interest rate on our debt under our $175 million credit facility, at
December 31, 2010, was 5.25%, calculated at the 30 day LIBOR rate, subject to a floor of 1.0%, plus
the applicable margin of 4.25%. The variable interest rate on our debt under our $115 million
credit facility, at December 31, 2009, was 5.5%, calculated at the 30 day LIBOR rate, subject to a
floor of 1.0%, plus the applicable margin of 4.5%. At both December 31, 2010 and 2009, the 30 day
LIBOR rate was less than 1%.
Term Loan
We had an initial term loan of $60,000,000 outstanding under our $175 million credit facility.
As of December 31, 2010, we had $57,000,000 outstanding. We are obligated to make quarterly
principal payments of $1,500,000 on the term loan until repayment of the then outstanding balance
at maturity. During 2010, we made principal repayments of $3,000,000. The term loan has a current
stated interest rate of the Base Rate plus 3.25% per annum, or, at our election, LIBOR plus 4.25%
per annum. The term loan matures in July 2014. Additional borrowings are not permitted under the
terms of the term loan.
Revolving Credit Line
We have a revolving credit line for revolving loans in the amount of $115,000,000 under our
$175 million credit facility (our “existing revolving credit line”), and we had a revolving credit
line for revolving loans in the amount of $20,000,000 under our $115 million credit facility. As
of December 31, 2010 (under our $175 million credit facility) and 2009 (under our $115 million
credit facility), we had $33,000,000 and $4,500,000, respectively, outstanding under the facility’s
revolving credit line and $6,723,000 and $8,245,000, respectively, of outstanding letters of
credit. Our existing revolving credit line has a current stated interest rate of the Base Rate
plus 3.25% per annum on advances or, at our election, LIBOR plus 4.25% per annum on advances.
Under our existing revolving credit line, letters of credit can be issued in an aggregate amount
not to exceed $20,000,000, which results in a dollar for dollar reduction in the available
capacity. Our existing revolving credit line matures on July 18, 2013 and, until that time, only
interest payments are required. For our outstanding letters of credit issued under our existing
revolving credit line, we pay issuing fees of 0.25% per annum on the stated amount of the letters
of credit when we issue a letter of credit and an applicable margin depending on our leverage ratio
ranging from 3.75% to 4.50% per annum. Additionally, we pay a commitment fee depending on our
leverage ratio of 0.50% to 0.75% per annum that is due quarterly for any unused capacity under the
our existing revolving credit line.
F-21
OXFORD RESOURCE PARTNERS, LP AND SUBSIDIARIES
NOTES TO CONSOLIDATED FINANCIAL STATEMENTS — (Continued)
Other Notes Payable
Peabody #1 — In July 2007, we acquired coal reserves from Peabody Energy Corporation through
one of its subsidiaries in exchange for a note payable that was due in three annual payments of
$250,000 at no stated interest rate. The obligation was secured by real property and mineral
rights and matured in June 2010. The difference between the face amount and the imputed amount was
recorded as a discount using an imputed interest rate of 9.25% and was amortized into interest
expense using the effective interest method. This note was paid in full during 2010.
Peabody #2 — In December 2009, we acquired coal reserves from Peabody Energy Corporation
through one of its subsidiaries in exchange for a down payment of $1,000,000 and a note payable
that is due in two annual payments of $1,000,000 at no stated interest rate. The obligation was
secured by real property and mineral rights and matures in December 2011. The difference between
the face amount and the imputed amount was recorded as a discount using an imputed interest rate of
5.5% and is being amortized into interest expense using the effective interest method.
CONSOL #1 — In August 2007, Harrison Resources acquired coal reserves from CONSOL Energy,
through one of its subsidiaries, in exchange for a note payable that matured in August 2010. The
note was payable in three equal installments of $1,773,000 at no stated interest rate. The
difference between the face amount and the imputed amount was recorded as a discount using an
imputed interest rate of 8.25% and was amortized into interest expense using the effective interest
method. This note was paid in full during 2010.
CONSOL #2 — In March 2009, we acquired coal reserve leases from CONSOL Energy, through one of
its subsidiaries, in exchange for a down payment of $1,500,000 and a note payable that matures in
March 2012 in an original face amount of $1,500,000. The note is payable in monthly installments
based on units-of-production with a minimum of $500,000 due annually at no stated interest rate.
The difference between the face amount and the imputed amount was recorded as a discount using an
imputed interest rate of 4.6% and is being amortized using the effective interest method.
CONSOL #3 — In August 2010, Harrison Resources acquired coal reserves from CONSOL Energy,
through one of its subsidiaries, in exchange for a down payment of $850,000 and a note payable in
an original face amount of $13,458,000 that matures three years from the date Harrison Resources is
issued a permit to mine such reserves (which is currently expected to occur in late 2011 or early
2012). The note is payable in three annual installments of $5,383,000, $5,383,000 and $2,692,000
commencing with the issuance of such permit to mine such reserves. The note has no stated interest
rate; therefore, the difference between the face amount of $13,458,000 and the imputed amount of
$11,720,000 reflected on the balance sheet was recorded as a discount using an imputed interest
rate of 5.5% and is being amortized into interest expense using the effective interest method.
Additionally, a royalty stream is due on certain excess coal tonnage produced from the reserves
above specified levels contained in the acquisition agreement.
Other Note Payable — We acquired coal reserves from an individual with payments due of $5,000
per year for ten years at no stated interest rate. The obligation matures in April 2015. The
difference between the face amount and the imputed amount was recorded as a discount using an
imputed interest rate of 6.75% and is being amortized into interest expense using the effective
interest method.
F-22
OXFORD RESOURCE PARTNERS, LP AND SUBSIDIARIES
NOTES TO CONSOLIDATED FINANCIAL STATEMENTS — (Continued)
Debt Maturity Table
The total debt of the Partnership matures as follows:
| |
|
|
|
|
|
During the years ending December 31, 2011 |
|
$ |
7,249,000 |
|
2012 |
|
|
10,216,000 |
|
2013 |
|
|
43,964,000 |
|
2014 |
|
|
41,552,000 |
|
2015 |
|
|
5,000 |
|
Thereafter |
|
|
— |
|
|
|
|
|
|
|
|
|
|
|
|
$ |
102,986,000 |
|
|
|
|
|
NOTE 11: INTEREST RATE CAP AND SWAP AGREEMENTS
On August 2, 2010, we entered into an interest rate swap agreement that had an original
notional principal amount of $50 million and a maturity of January 31, 2013. The notional
principal amount declines over the term of the interest rate swap agreement at a rate of $1.5
million each quarter which corresponds to our required principal payments on the term loan under
our $175 million credit facility. Under the interest rate swap agreement, we pay interest monthly
at a fixed rate of 1.39% per annum and receive interest monthly at a variable rate equal to LIBOR
(with a 1% floor) based on the notional principal amount. The interest rate swap agreement was
effective August 9, 2010. The fair value of the derivative liability of $108,000 is recorded in
other liabilities and increased by $108,000 in 2010. The balance of the amortizing interest rate
swap agreement was $47.0 million at December 31, 2010.
On September 11, 2009, we entered into an interest rate cap agreement to hedge our exposure to
rising LIBOR interest rates during 2010. This agreement, which had an effective date of January 4,
2010 and a notional amount of $50,000,000, provided for a LIBOR interest rate cap of 2% using
three-month LIBOR. LIBOR was 0.251% as of December 31, 2009. We paid a fixed fee of $85,000 for
this agreement which had quarterly settlement dates and matured on December 31, 2010. At December
31, 2009, the value of the interest rate cap was $34,000 and was recorded in other assets and the
mark-to-market decrease in value of $51,000 was recorded to interest expense in the consolidated
statements of operations for the year ended December 31, 2009. This interest rate cap agreement
expired on December 31, 2010.
We entered into an interest rate swap agreement on August 24, 2007 that had an original
notional principal amount of $67,500,000 and matured in August 2009. Under the swap agreement, we
paid interest at a fixed rate of 4.83% and received interest at a variable rate equal to LIBOR
(1.43% as of December 31, 2008), based on the notional amount. The change in the fair value and
settlement of the swap agreement decreased interest expense by $1,681,000 for the year ended
December 31, 2009 and increased interest expense by $574,000 for the year ended December 31, 2008,
respectively.
NOTE 12: FAIR VALUE OF FINANCIAL INSTRUMENTS
Effective January 1, 2008, we adopted the provision for fair value of financial
assets and financial liabilities. We utilized fair value measurement guidance that, among other
things, defines fair value, requires enhanced disclosures about assets and liabilities carried at
fair value and establishes a hierarchal disclosure framework based upon the quality of inputs used
to measure fair value. We elected to defer the application of the guidance to nonfinancial assets
and liabilities until our fiscal year 2009 and that application did not have a material impact on
our consolidated financial statements as of December 31, 2009. As a result of the adoption, we
have elected not to measure any additional financial assets or liabilities at fair value, other
than those which were previously recorded at fair value prior to the adoption.
F-23
OXFORD RESOURCE PARTNERS, LP AND SUBSIDIARIES
NOTES TO CONSOLIDATED FINANCIAL STATEMENTS — (Continued)
The financial instruments measured at fair value on a recurring basis are summarized below:
| |
|
|
|
|
|
|
|
|
|
|
|
|
| |
|
Fair Value Measurements at December 31, 2010 |
|
| |
|
Quoted Prices in |
|
|
|
|
|
|
Significant |
|
| |
|
Active Markets for |
|
|
Significant Other |
|
|
Unobservable |
|
| |
|
Identical Liabilities |
|
|
Observable Inputs |
|
|
Inputs |
|
| Description |
|
(Level 1) |
|
|
(Level 2) |
|
|
(Level 3) |
|
|
|
|
|
|
|
|
|
|
|
|
|
|
Interest rate swap agreement |
|
$ |
— |
|
|
$ |
(108,000 |
) |
|
$ |
— |
|
| |
|
|
|
|
|
|
|
|
|
|
|
|
| |
|
Fair Value Measurements at December 31, 2009 |
|
| |
|
Quoted Prices in |
|
|
|
|
|
|
Significant |
|
| |
|
Active Markets for |
|
|
Significant Other |
|
|
Unobservable |
|
| |
|
Identical Liabilities |
|
|
Observable Inputs |
|
|
Inputs |
|
| Description |
|
(Level 1) |
|
|
(Level 2) |
|
|
(Level 3) |
|
|
|
|
|
|
|
|
|
|
|
|
|
|
Interest rate cap agreement |
|
$ |
— |
|
|
$ |
34,000 |
|
|
$ |
— |
|
The following methods and assumptions were used to estimate the fair values of financial
instruments for which the fair value option was not elected:
Cash and cash equivalents, trade accounts receivable and accounts payable: The carrying
amount reported in the balance sheets for cash and cash equivalents, trade accounts receivable and
accounts payable approximates its fair value due to the short maturity of these instruments.
Fixed rate debt: The fair values of long-term debt are estimated using discounted cash flow
analyses, based on current market rates for instruments with similar cash flows.
Variable rate debt: The fair value of variable rate debt is estimated using discounted cash
flow analyses, based on our best estimates of market rate for instruments with similar cash flows.
The carrying amounts and fair values of financial instruments for which the fair value option
was not elected are as follows:
| |
|
|
|
|
|
|
|
|
|
|
|
|
|
|
|
|
| |
|
December 31, 2010 |
|
|
December 31, 2009 |
|
| |
|
Carrying |
|
|
|
|
|
|
Carrying |
|
|
|
|
| |
|
Amount |
|
|
Fair Value |
|
|
Amount |
|
|
Fair Value |
|
|
|
|
|
|
|
|
|
|
|
|
|
|
|
|
|
|
Fixed rate debt |
|
$ |
12,986,000 |
|
|
$ |
12,926,000 |
|
|
$ |
4,982,000 |
|
|
$ |
4,952,000 |
|
Variable rate debt |
|
$ |
90,000,000 |
|
|
$ |
90,000,000 |
|
|
$ |
90,729,000 |
|
|
$ |
90,729,000 |
|
NOTE 13: LONG-TERM INCENTIVE PLAN
In November 2007, we implemented a Long-Term Incentive Plan, or LTIP, whereby equity awards
may be granted to executives, officers, employees, directors, or consultants, as recommended by the
Compensation Committee and approved by our Board of Directors, in the form of partnership units,
and may include distribution equivalent rights. Under this program, we have granted phantom units
that have no rights until they are converted upon vesting. At our option, we can issue cash or
partnership units upon vesting, although we do not intend to settle these awards in cash. To date,
we have always issued units and those units have the right to an allocation of income and to
distributions but are not obligated to participate in any capital calls. See the Equity-Based
Compensation section of Note 2 for a further description of how we value our LTIP units.
These units are subject to such conditions and restrictions as our Compensation Committee may
determine, including continued employment or service or achievement of pre-established performance
goals and objectives. Generally, these units vest in equal annual increments over four years with
accelerated vesting of the first increment in certain cases. The total number of units authorized
to distribute under the LTIP was 2,056,075 at December 31, 2010. Unless amended by our Board of
Directors or Compensation Committee at the discretion of our Board of Directors, our LTIP will
expire in November 2017.
F-24
OXFORD RESOURCE PARTNERS, LP AND SUBSIDIARIES
NOTES TO CONSOLIDATED FINANCIAL STATEMENTS — (Continued)
Surrendered units were used to satisfy the individual tax obligations
of those LTIP participants electing a net issuance whereby we pay the
employee’s tax liability and the employee surrenders a
sufficient number of units equal to the amount of tax liability
assumed by us. On January 1, 2011, we granted an aggregate of 46,187 units. After
consideration of these grants as well as grants vesting in early January 2011, 1,714,812 units remain available for issuance in the future
assuming that all grants issued and currently outstanding are settled
with common units, without reduction for tax withholding, and no
future forfeitures occur.
We recognize compensation expense over the vesting period of the units, which is generally
four years for each award. For the years ended December 31, 2010, 2009 and 2008, our gross LTIP
expense was approximately $942,000, $472,000 and $468,000, respectively, which is included in
selling, general and administrative expenses (SG&A) in our consolidated statements of operations.
As of December 31, 2010 and 2009, approximately $726,000 and $840,000, respectively, of cost
remained unamortized which we expect to recognize over a remaining weighted average period of 2
years.
The following table summarizes additional information concerning our unvested LTIP units:
| |
|
|
|
|
|
|
|
|
| |
|
|
|
|
|
Weighted |
|
| |
|
|
|
|
|
Average |
|
| |
|
|
|
|
|
Grant Date |
|
| |
|
Units |
|
|
Fair Value |
|
|
|
|
|
|
|
|
|
|
Unvested balance at December 31, 2008 |
|
|
195,506 |
|
|
$ |
6.15 |
|
Granted |
|
|
20,299 |
|
|
|
9.57 |
|
Issued |
|
|
(56,233 |
) |
|
|
6.45 |
|
Surrendered |
|
|
(15,639 |
) |
|
|
6.52 |
|
|
|
|
|
|
|
|
|
|
|
|
|
|
|
|
|
|
Unvested balance at December 31, 2009 |
|
|
143,933 |
|
|
|
6.48 |
|
Granted |
|
|
77,402 |
|
|
|
10.75 |
|
Issued |
|
|
(71,436 |
) |
|
|
8.55 |
|
Surrendered |
|
|
(25,419 |
) |
|
|
7.17 |
|
|
|
|
|
|
|
|
|
|
|
|
|
|
|
|
|
|
Unvested balance at December 31, 2010 |
|
|
124,480 |
|
|
|
7.80 |
|
|
|
|
|
|
|
|
|
The value of LTIP units vested during the years ended December 31, 2010, 2009 and 2008
was $786,000, $465,000 and $401,000, respectively.
NOTE 14: WORKERS’ COMPENSATION AND BLACK LUNG
We have no liabilities under state statutes and the Federal Coal Mine Health and Safety Act of
1969, as amended, to pay black lung benefits to eligible employees, former employees and their
dependents. Under the Black Lung Benefits Revenue Act of 1977 and the Black Lung Benefits Reform
Act of 1977, as amended in 1981, each coal mine operator must pay federal black lung benefits to
claimants who are current and former employees and also make payments to a trust fund for the
payment of benefits and medical expenses to claimants who last worked in the coal industry prior to
January 1, 1970. The trust fund is funded by an excise tax on production of up to $1.10 per ton
for deep-mined coal and up to $0.55 per ton for surface-mined coal, neither amount to exceed 4.4%
of the gross sales price. The excise tax does not apply to coal shipped outside the United States.
For the years ended December 31, 2010, 2009 and 2008, we recorded $3.9 million, $3.1 million and
$2.7 million, respectively, in our cost of coal sales related to this excise tax.
With regard to workers’ compensation, we provide benefits to our employees and are insured
through state sponsored programs or an insurance carrier where there is no state sponsored program.
F-25
OXFORD RESOURCE PARTNERS, LP AND SUBSIDIARIES
NOTES TO CONSOLIDATED FINANCIAL STATEMENTS — (Continued)
NOTE 15: RETIREMENT PLAN
We had a money purchase pension plan in which substantially all full-time employees with more
than six months of service participated. Contributions were made annually at 4% of qualified wages
and an additional 4% was contributed on wages over the FICA limit up to the maximum allowed under
the Internal Revenue Code. We incurred expense of $1,522,000 and $1,083,000 for the years ended
December 31, 2009 and 2008, respectively.
Effective January 1, 2010, the money purchase pension plan was replaced with a 401(k)
plan. For 2010, we committed to make a contribution at 4% of qualified wages. We incurred expense
for such contribution of $1,992,000 for the year ended December 31, 2010.
NOTE 16: NONCONTROLLING INTEREST
We have adopted accounting guidance that establishes accounting and reporting standards for
(1) noncontrolling interests in partially owned consolidated subsidiaries and (2) the loss of
control of subsidiaries. This guidance requires noncontrolling interests (minority interests) to
be reported as a separate component of equity. The amount of net income or loss attributable to
the noncontrolling interests will be included in consolidated net income or loss on the face of the
income statement. In addition, this guidance requires that a parent recognize a gain or loss in
net income when a subsidiary is deconsolidated. Such gain or loss will be measured using the fair
value of the noncontrolling equity investment on the deconsolidation date.
Harrison Resources, a limited liability company, was formed in March 2006 by Oxford to acquire
coal properties, develop mine sites and mine coal for sale to customers. Effective January 30,
2007, 49% of Harrison Resources was sold to CONSOL Energy and its ownership interest is held by one
of its subsidiaries. Harrison Resources’ revenues which are included in the consolidated
statements of operations were $46,361,000, $37,190,000, and $20,605,000 for the years ended
December 31, 2010, 2009 and 2008, respectively. Oxford has a contract mining and reclamation
services agreement with Harrison Resources to operate the mines for an agreed-upon per ton price
and markets all the coal under a broker agreement with Harrison Resources.
Harrison Resources’ cash, which is deemed to be restricted for Harrison Resources’ operations,
primarily relates to funds set aside for future reclamation obligations in the amounts of
$3,561,000 and $1,877,000 at December 31, 2010 and 2009, respectively, and is included in the
balance sheet caption “Other long-term assets” (see Note 2). Harrison Resources’ total net assets
as of December 31, 2010 and 2009 were $6,411,000 and $4,218,000, respectively.
The noncontrolling interest represents the 49% of Harrison Resources owned by CONSOL
Energy, through one of its subsidiaries, and consisted of the following:
| |
|
|
|
|
|
|
|
|
| |
|
Years Ended December 31, |
|
| |
|
2010 |
|
|
2009 |
|
|
|
|
|
|
|
|
|
|
Beginning balance |
|
$ |
2,067,000 |
|
|
$ |
2,297,000 |
|
Net income |
|
|
6,710,000 |
|
|
|
5,895,000 |
|
Distributions to owners |
|
|
(5,635,000 |
) |
|
|
(6,125,000 |
) |
|
|
|
|
|
|
|
|
|
|
|
|
|
|
|
|
Ending balance |
|
$ |
3,142,000 |
|
|
$ |
2,067,000 |
|
|
|
|
|
|
|
|
NOTE 17: COMMITMENTS AND CONTINGENCIES
Coal Sales Contracts
We are committed under long-term contracts to sell coal that meets certain quality
requirements at specified prices. Most of these prices are subject to cost pass through or cost
adjustment provisions that mitigate some risk from rising costs. Quantities sold under some of
these contracts may vary from year to year within certain limits at the option of the customer or
us. The remaining life of our long-term contracts ranges from one to eight years.
F-26
OXFORD RESOURCE PARTNERS, LP AND SUBSIDIARIES
NOTES TO CONSOLIDATED FINANCIAL STATEMENTS — (Continued)
Purchase Commitments
We use independent contractors to mine some of our coal at a few of our mines. We also
purchase coal from third parties in order to meet quality or delivery requirements under our
customer agreements. We assumed one long-term purchase agreement as a result of the Phoenix Coal
acquisition. Under this agreement, we are committed to purchase a certain volume of coal until the
coal reserves covered by the contract are depleted. Based on the proven and probable coal reserves
in place at December 31, 2010, we expect this contract to continue for five to seven years.
Additionally, we bought coal on the spot market, and the cost of that coal is dependent upon the
market price and quality. Supply disruptions could impair our ability to fill customer orders or
require us to purchase coal from other sources at a higher cost to us in order to satisfy these
orders.
Transportation
We depend upon barge, rail, and truck transportation systems to deliver our coal to our
customers. Disruption of these transportation services due to weather-related problems, mechanical
difficulties, strikes, lockouts, bottlenecks, and other events could temporarily impair our ability
to supply coal to our customers, resulting in decreased shipments. We entered into a long-term
transportation contract on April 1, 2006 for rail services, and that agreement has been amended and
extended through March 31, 2011.
Defined Contribution Pension Plan
At December 31, 2010, we had an obligation to pay our GP for the purpose of funding our GP’s
commitments to the 401(k) plan in the amount of $1,895,000. This amount is expected to be paid by
September 2011.
Security for Reclamation and Other Obligations
As of December 31, 2010, we had $34,886,000 in surety bonds and $14,000 in cash bonds
outstanding to secure certain reclamation obligations. Additionally, as of December 31, 2010, we
had letters of credit outstanding in support of these surety bonds of $6,723,000. Further, as of
December 31, 2010, we had certain outstanding road bonds of $615,000 and performance bonds of
$7,450,000. Our management believes these bonds and letters of credit will expire without any
claims or payments thereon and thus any subrogation or other rights with respect thereto will not
have a material adverse effect on our financial position, liquidity or operations.
Legal
We are involved, from time to time, in various legal proceedings arising in the ordinary
course of business. While the ultimate results of these proceedings cannot be predicted with
certainty, our management believes these claims will not have a material adverse effect on our
financial position, liquidity or operations.
Guarantees
Our GP and the Partnership guarantee certain obligations of our subsidiaries. Our management
believes that these guarantees will expire without any liability to the guarantors, and therefore
any indemnification or subrogation commitments with respect thereto will not have a material
adverse effect on our financial position, liquidity or operations.
F-27
OXFORD RESOURCE PARTNERS, LP AND SUBSIDIARIES
NOTES TO CONSOLIDATED FINANCIAL STATEMENTS — (Continued)
NOTE 18: CONCENTRATION OF CREDIT RISK AND MAJOR CUSTOMERS
We have a credit policy that establishes procedures to determine creditworthiness and credit
limits for trade customers. Generally, credit is extended based on an evaluation of the customer’s
financial condition. Collateral is not generally required, unless credit cannot be established.
We market our coal principally to electric utilities, municipalities and electric cooperatives
and industrial customers in Illinois, Indiana, Kentucky, Ohio, Pennsylvania and West Virginia. As
of December 31, 2010 and 2009, accounts receivable from electric utilities totaled $21.1 million
and $18.2 million, respectively, or 75.1% and 74.8% of total trade receivables, respectively. A
small portion of these sales are executed through coal brokers. Four and three customers,
respectively, individually accounted for greater than 10% of coal sales for each of the years ended
December 31, 2010 and 2009, respectively, which, in the aggregate, represented approximately 64.2%
and 64.1%, respectively, of our total coal sales for each of such years. Three and four customers,
respectively, in the aggregate, represented approximately 61.2% and 69.4% of the outstanding
accounts receivable at December 31, 2010 and 2009, respectively. Two customers individually
accounted for greater than 10% of coal sales which, in the aggregate, represented approximately
55.5% of our total coal sales for the year ended December 31, 2008.
F-28
OXFORD RESOURCE PARTNERS, LP AND SUBSIDIARIES
NOTES TO CONSOLIDATED FINANCIAL STATEMENTS — (Continued)
NOTE 19: RELATED PARTY TRANSACTIONS
In connection with our formation in August 2007, the Partnership and Oxford Mining entered
into an administrative and operational services agreement (“Services Agreement”) with our GP. The
Services Agreement is terminable by either party upon thirty days’ written notice. Under the terms
of the Services Agreement, our GP provides services through its employees to us and is reimbursed
for all related costs incurred on our behalf. Our GP provides us with services such as general
administrative and management, human resources, information technology, finance and accounting,
corporate development, real property, marketing, engineering, operations (including mining
operations), geological, risk management and insurance services. Pursuant to the Services
Agreement, the primary reimbursements to our GP were for costs related to payroll, and for such
reimbursable costs the amounts of $2,618,000 and $2,504,000 were included in our accounts payable
at December 31, 2010 and 2009, respectively.
Also in connection with our formation in August 2007, Oxford Mining entered into an advisory
services agreement (“Advisory Agreement”) with certain affiliates of AIM Oxford. The Advisory
Agreement had a term of ten years running until August 2017, subject to earlier termination at any
time by the AIM Oxford affiliates. Under the terms of the Advisory Agreement, the AIM Oxford
affiliates had duties as financial and management advisors to Oxford Mining, including providing
services in obtaining equity, debt, lease and acquisition financing, as well as providing other
financial, advisory and consulting services for the operation and growth of Oxford Mining. These
services consisted of advisory services of a type customarily provided by sponsors of U.S. private
equity firms to companies in which they have substantial investments. Such services were rendered
at the reasonable request of Oxford Mining. The basic annual fees under the Advisory Agreement
were $250,000 for 2008 and for 2009 and each year thereafter increased based on the percentage
increase in gross revenues. Further fees were payable for additional significant services
requested. Pursuant to the Advisory Agreement, advisory fees were paid to AIM Oxford affiliates of
$210,000, $1,307,000 and $225,000 for the years ended December 31, 2010, 2009 and 2008,
respectively. The advisory fees paid for 2009 included a transaction fee of $1,000,000 paid to the
AIM Oxford affiliates for additional significant services in connection with our $115 million
credit facility and this fee is included in deferred financing costs in 2009. The Advisory
Agreement was terminated on July 19, 2010 with a termination payment of $2,500,000 being made in
connection with the closing of our initial public offering on the same date.
Contract services were provided to Tunnell Hill Reclamation, LLC, a company that is indirectly
owned by Charles C. Ungurean, our President and Chief Executive Officer (“Mr. C. Ungurean”), Thomas
T. Ungurean, our Senior Vice President, Equipment, Procurement and Maintenance (“Mr. T. Ungurean”),
and affiliates of AIM Oxford, in the amount of $1,410,000, $695,000, and $1,050,000 for the years
ended December 31, 2010, 2009 and 2008, respectively. Accounts receivable were $329,000 and
$70,000 from Tunnell Hill Reclamation, LLC at December 31, 2010 and 2009, respectively. We have
concluded that Tunnell Hill Reclamation, LLC does not represent a variable interest entity.
From time to time for business purposes we charter the use of an airplane from Zanesville
Aviation located in Zanesville, Ohio. In each of these cases we are invoiced for and pay the
normal amounts that Zanesville Aviation charges any chartering person. T&C Holdco LLC, a company
that is owned by Mr. C. Ungurean and Mr. T. Ungurean, owns an airplane that it leases to Zanesville
Aviation and that Zanesville Aviation uses in providing chartering services to its customers
including us. Under its lease with Zanesville Aviation, T&C Holdco LLC receives compensation from
Zanesville Aviation for the use of T&C Holdco LLC’s airplane. The airplane owned by T&C Holdco LLC
was chartered to us on a number of occasions in 2010, and we paid Zanesville Aviation an aggregate
of approximately $175,000 for those charters.
We had accounts receivable from employees and owners in the amount of $0 and $28,000 at
December 31, 2010 and 2009, respectively.
F-29
OXFORD RESOURCE PARTNERS, LP AND SUBSIDIARIES
NOTES TO CONSOLIDATED FINANCIAL STATEMENTS — (Continued)
NOTE 20: SUPPLEMENTAL CASH FLOW INFORMATION
Supplemental cash flow information:
| |
|
|
|
|
|
|
|
|
|
|
|
|
| |
|
For the Years Ended December 31, |
|
| |
|
2010 |
|
|
2009 |
|
|
2008 |
|
|
|
|
|
|
|
|
|
|
|
|
|
|
Cash paid for: |
|
|
|
|
|
|
|
|
|
|
|
|
Interest |
|
$ |
7,208,000 |
|
|
$ |
6,005,000 |
|
|
$ |
6,395,000 |
|
Non-cash activity |
|
|
|
|
|
|
|
|
|
|
|
|
Market value of common units vested in LTIP |
|
|
1,715,000 |
|
|
|
363,000 |
|
|
|
302,000 |
|
Accounts payable for purchase of coal reserves
as of December 31 |
|
|
— |
|
|
|
62,000 |
|
|
|
87,000 |
|
Accounts payable for purchase of royalty
advances as of December 31 |
|
|
— |
|
|
|
55,000 |
|
|
|
5,000 |
|
Accounts payable for purchase of property and
equipment as of December 31 |
|
|
3,151,000 |
|
|
|
2,049,000 |
|
|
|
3,161,000 |
|
Purchase of coal reserves with debt |
|
|
11,287,000 |
|
|
|
3,230,000 |
|
|
|
— |
|
NOTE 21: SEGMENT INFORMATION
We operate in one business segment. We operate surface coal mines in Northern Appalachia and
the Illinois Basin and sell high value steam coal to utilities, industrial customers or other
coal-related organizations primarily in the eastern United States. Our operating and executive
management reviews and bases its decisions upon consolidated reports. All three of our operating
subsidiaries participate primarily in the business of utilizing surface mining techniques to mine
domestic coal and prepare it for sale to their customers. The operating companies share customers
and a particular customer may receive coal from any one of the operating companies.
F-30
OXFORD RESOURCE PARTNERS, LP AND SUBSIDIARIES
NOTES TO CONSOLIDATED FINANCIAL STATEMENTS — (Continued)
NOTE 22: SUPPLEMENTAL QUARTERLY FINANCIAL INFORMATION
— (Unaudited)
A summary of our unaudited consolidated quarterly operating results in 2010 and 2009 is as
follows (in thousands, except unit and per unit data):
| |
|
|
|
|
|
|
|
|
|
|
|
|
|
|
|
|
|
|
|
| |
|
2010 |
|
|
|
|
| |
|
March 31 |
|
|
June 30 |
|
|
September 30 |
|
|
December 31 |
|
|
Total |
|
|
|
|
|
|
|
|
|
|
|
|
|
|
|
|
|
|
|
|
|
|
Total Revenues |
|
$ |
88,060 |
|
|
$ |
90,148 |
|
|
$ |
89,079 |
|
|
$ |
89,291 |
|
|
$ |
356,578 |
|
Income from operations |
|
|
3,173 |
|
|
|
1,606 |
|
|
|
1,595 |
|
|
|
2,484 |
|
|
|
8,858 |
|
Net loss attributable to Oxford Resource
Partners, LP unitholders |
|
|
(287 |
) |
|
|
(2,107 |
) |
|
|
(3,400 |
) |
|
|
(1,557 |
) |
|
|
(7,351 |
) |
Net loss attributable to general partners |
|
|
(6 |
) |
|
|
(42 |
) |
|
|
(68 |
) |
|
|
(31 |
) |
|
|
(147 |
) |
Net loss attributable to limited partners |
|
|
(281 |
) |
|
|
(2,065 |
) |
|
|
(3,332 |
) |
|
|
(1,526 |
) |
|
|
(7,204 |
) |
|
|
|
|
|
|
|
|
|
|
|
|
|
|
|
|
|
|
|
|
|
Loss per limited partner unit: |
|
|
|
|
|
|
|
|
|
|
|
|
|
|
|
|
|
|
|
|
Basic (1) |
|
$ |
(0.02 |
) |
|
$ |
(0.18 |
) |
|
$ |
(0.20 |
)(2) |
|
$ |
(0.05 |
) |
|
$ |
(0.45 |
) |
Diluted (1) |
|
$ |
(0.02 |
) |
|
$ |
(0.18 |
) |
|
$ |
(0.20 |
)(2) |
|
$ |
(0.05 |
) |
|
$ |
(0.45 |
) |
|
|
|
|
|
|
|
|
|
|
|
|
|
|
|
|
|
|
|
|
|
Distributions paid per limited partner unit (1) |
|
$ |
0.23 |
|
|
$ |
— |
|
|
$ |
— |
|
|
$ |
0.35 |
|
|
$ |
0.58 |
|
|
|
|
| (1) |
|
All per unit amounts have been retro actively restated to reflect the unit split that occurred on July 19, 2010 in
conjunction with our initial public offering. |
| |
| (2) |
|
Amount restated to correct year-to-date rounding difference. |
| |
|
|
|
|
|
|
|
|
|
|
|
|
|
|
|
|
|
|
|
| |
|
2009 |
|
|
|
|
| |
|
March 31 |
|
|
June 30 |
|
|
September 30 |
|
|
December 31 |
|
|
Total |
|
|
|
|
|
|
|
|
|
|
|
|
|
|
|
|
|
|
|
|
|
|
Total Revenues |
|
$ |
78,439 |
|
|
$ |
61,290 |
|
|
$ |
65,783 |
|
|
$ |
88,332 |
|
|
$ |
293,844 |
|
Income from operations |
|
|
11,660 |
|
|
|
8,132 |
|
|
|
7,728 |
|
|
|
4,505 |
|
|
|
32,025 |
|
Net income attributable to Oxford Resource
Partners, LP unitholders |
|
|
9,383 |
|
|
|
5,448 |
|
|
|
7,797 |
|
|
|
876 |
|
|
|
23,504 |
|
Net income attributable to general partners |
|
|
187 |
|
|
|
108 |
|
|
|
155 |
|
|
|
17 |
|
|
|
467 |
|
Net income attributable to limited partners |
|
|
9,196 |
|
|
|
5,340 |
|
|
|
7,642 |
|
|
|
859 |
|
|
|
23,037 |
|
|
|
|
|
|
|
|
|
|
|
|
|
|
|
|
|
|
|
|
|
|
Income per limited partner unit: |
|
|
|
|
|
|
|
|
|
|
|
|
|
|
|
|
|
|
|
|
Basic (1) |
|
$ |
0.85 |
|
|
$ |
0.50 |
|
|
$ |
0.72 |
(2) |
|
$ |
0.02 |
|
|
$ |
2.09 |
|
Diluted (1) |
|
$ |
0.85 |
|
|
$ |
0.50 |
|
|
$ |
0.71 |
|
|
$ |
0.02 |
|
|
$ |
2.08 |
|
|
|
|
|
|
|
|
|
|
|
|
|
|
|
|
|
|
|
|
|
|
Distributions paid per limited partner unit (1) |
|
$ |
0.23 |
|
|
$ |
0.23 |
|
|
$ |
0.51 |
|
|
$ |
0.23 |
|
|
$ |
1.20 |
|
|
|
|
| (1) |
|
All per unit amounts have been retro actively restated to reflect the unit split that occurred on July 19, 2010 in conjunction with our
initial public offering. |
| |
| (2) |
|
Amount restated to correct year-to-date rounding difference. |
NOTE 23: SUBSEQUENT EVENTS
The following represents material events that have occurred subsequent to December 31, 2010.
We made a quarterly distribution to our unitholders of $9,206,000 or $0.4375 per unit in
February 2011.
We granted LTIP awards in January 2011 in the amount of $1,125,000. Of those units, 25% of
one such grant (the “early vesting grant”) vested in January with a remaining unvested value of
$300,000. The early vesting grant vests ratably in annual increments over the next three years,
and the remaining grants vest ratably in annual increments over the next four years.
F-31