Attached files
Use these links to rapidly review the document
TABLE OF CONTENTS
GLOBAL GEOPHYSICAL SERVICES, INC. INDEX TO CONSOLIDATED FINANCIAL STATEMENTS
UNITED STATES
SECURITIES AND EXCHANGE COMMISSION
Washington, D.C. 20549
Form 10-K
| (Mark One) | ||
ý |
ANNUAL REPORT PURSUANT TO SECTION 13 OR 15(d) OF THE SECURITIES EXCHANGE ACT OF 1934 |
|
For the fiscal year ended December 31, 2010 |
||
or |
||
o |
TRANSITION REPORT PURSUANT TO SECTION 13 OR 15(d) OF THE SECURITIES EXCHANGE ACT OF 1934 |
|
For the transition period from to |
||
Commission file number: 001-34709
GLOBAL GEOPHYSICAL SERVICES, INC.
(Exact name of registrant as specified in its charter)
| Delaware (State or other jurisdiction of incorporation or organization) |
05-0574281 (I.R.S. Employer Identification No.) |
|
13927 South Gessner Road Missouri City, Texas (Address of principal executive offices) |
77489 (Zip Code) |
(Telephone Number) (713) 972-9200
Securities registered pursuant to Section 12(b) of the Act:
| Common Stock, $0.01 par value (Title of Each Class) |
The New York Stock Exchange (Name of Each Exchange on Which Registered) |
Securities registered pursuant to Section 12(g) of the Act: None
Indicate by check mark if the registrant is a well-known seasoned issuer, as defined in Rule 405 of the Securities Act. Yes o No ý
Indicate by check mark if the registrant is not required to file reports pursuant to Section 13 or Section 15(d) of the Exchange Act. Yes o No ý
Indicate by check mark whether the registrant (1) has filed all reports required to be filed by Section 13 or 15(d) of the Securities Exchange Act of 1934 during the preceding 12 months (or for such shorter period that the registrant was required to file such reports), and (2) has been subject to such filing requirements for the past 90 days. Yes ý No o
Indicate by check mark whether the registrant has submitted electronically and posted on its corporate Web site, if any, every Interactive Data File required to be submitted and posted pursuant to Rule 405 of Regulation S-T (§232.405 of this chapter) during the preceding 12 months (or for such shorter period that the registrant was required to submit and post such files). Yes o No o
Indicate by check mark if disclosure of delinquent filers pursuant to Item 405 of Regulation S-K (§229.405 of this chapter) is not contained herein, and will not be contained, to the best of registrant's knowledge, in definitive proxy or information statements incorporated by reference in Part III of this Form 10-K or any amendment to this Form 10-K. o
Indicate by check mark whether the registrant is a large accelerated filer, an accelerated filer, a non-accelerated filer, or a smaller reporting company. See the definitions of "large accelerated filer," "accelerated filer" and "smaller reporting company" in Rule 12b-2 of the Exchange Act.
| Large Accelerated filer o | Accelerated filer o | Non-accelerated filer ý (Do not check if a smaller reporting company) |
Smaller reporting company o |
Indicate by check mark whether the registrant is a shell company (as defined in Rule 12b-2 of the Exchange Act). Yes o No ý
The aggregate market value of the stock held by non-affiliates of the registrant, as of June 30, 2010, computed by reference to the closing sale price of the registrant's common stock on the NYSE on such date, was $122,087,419.
For purposes of this disclosure, shares of common stock held by persons who hold more than 10% of the outstanding shares of common stock and shares held by executive officers and directors of the registrant have been excluded because such persons may be deemed to be affiliates. This determination of executive officer or affiliate status is not necessarily a conclusive determination for other purposes.
36,479,635 shares of common stock were outstanding as of March 10, 2011.
DOCUMENTS INCORPORATED BY REFERENCE
(1) Portions of the registrant's definitive Proxy Statement relating to its 2011 Annual Meeting of Shareholders are incorporated by reference into Part III of this Annual Report on Form 10-K where indicated. Such Proxy Statement will be filed with the U.S. Securities and Exchange Commission within 120 days after the end of the fiscal year to which this report relates.
GLOBAL GEOPHYSICAL SERVICES, INC.
FORM 10-K
FOR THE FISCAL YEAR ENDED DECEMBER 31, 2010
TABLE OF CONTENTS
1
The Business section and other parts of this Annual Report on Form 10-K ("Form 10-K") contain forward-looking statements that involve risks and uncertainties. Many of the forward-looking statements are located in "Management's Discussion and Analysis of Financial Condition and Results of Operations." Forward-looking statements provide current expectations of future events based on certain assumptions and include any statement that does not directly relate to any historical or current fact. Forward-looking statements can also be identified by words such as "anticipates," "believes," "estimates," "expects," "intends," "plans," "predicts," "projects," "forecasts," "may," "should," and "probably" and similar terms. Forward-looking statements are not guarantees of future performance and our actual results may differ significantly from the results discussed in the forward-looking statements. Factors that might cause such differences include, but are not limited to, those discussed in the subsection entitled "Risk Factors" under Part I, Item 1A of this Form 10-K, which are incorporated herein by reference. We assume no obligation to revise or update any forward-looking statements for any reason, except as required by law.
References in this Form 10-K to "GGS," "Global Geophysical," the "Company," "we," "us" or "our" refer to Global Geophysical Services, Inc. and its subsidiaries included in the consolidated financial statements, except as otherwise indicated or the context otherwise requires. Our fiscal year ends on December 31, and references herein to "fiscal 2010," "this year" and "fiscal year 2010" refer to our fiscal year ended December 31, 2010.
(a) General Development of Business
Our company, Global Geophysical Services, Inc. and its subsidiaries, provide an integrated suite of seismic data solutions to the global oil and gas industry, including our high resolution RG-3D Reservoir Grade™ ("RG3D") seismic solutions. Our seismic data solutions consist primarily of seismic data acquisition, microseismic monitoring, processing and interpretation services. Through these services, we deliver data that enables the creation of high resolution images of the earth's subsurface and reveal complex structural and stratigraphic details. These images are used primarily by oil and gas companies to identify geologic structures favorable to the accumulation of hydrocarbons, to reduce risk associated with oil and gas exploration, to optimize well completion techniques and to monitor changes in hydrocarbon reservoirs. We integrate seismic survey design, data acquisition, processing and interpretation to deliver enhanced services to our clients. In addition, we own and market a growing seismic data library and license this data to clients on a non-exclusive basis.
Our seismic solutions are used by many of the world's largest and most technically advanced oil and gas exploration and production companies, including national oil companies ("NOCs"), major integrated oil companies ("IOCs"), and large independent oil and gas companies. We provide seismic data acquisition on a worldwide basis for land, transition zone and shallow marine areas, including challenging environments such as marshes, forests, jungles, arctic climates, mountains and deserts. We also have significant operational experience in most of the major U.S. shale plays, including the Haynesville, Barnett, Bakken, Fayetteville, Eagle Ford and Woodford, where we believe our high resolution RG3D seismic solutions are particularly well-suited.
We currently own approximately 162,000 recording channels. Our recording channels and systems are interoperable which provides operational scalability and efficiency. This operational scalability and efficiency enables us to execute on large and technologically complex projects.
Our company is a Delaware corporation founded in 2003.
2
Our Strengths
We believe that the following strengths provide us with significant competitive advantages:
Our high resolution RG3D seismic solutions
As a result of our extensive experience designing and implementing seismic data acquisition programs in a variety of environments, and our use of the latest technologies available in the industry, we provide our clients with high resolution seismic data. We have a common technology platform and configured its design in order to perform high channel count seismic data acquisition projects which increase the resolution, or "trace density," and other advanced attributes of the data. We believe our high resolution RG3D seismic solutions can help our clients more effectively identify and develop oil and gas reserves.
International footprint with extensive experience operating in challenging environments
We operate globally in many challenging environments including marshes, forests, jungles, arctic climates, mountains and deserts. Our recent experience includes projects in Mexico, Colombia, Argentina, Chile, Peru, Georgia, Uganda, Algeria, Iraq, Oman and India. In addition, our operations management team has experience operating in over 60 countries. To further extend our footprint and complement our skills, we selectively engage in strategic alliances with foreign partners that enhance our relationships with regional clients, offer commercial and regulatory guidance and provide access to local facilities, equipment and personnel.
Operational efficiency and flexibility
We manage our crews and projects with a focus on efficiency so that our projects may be completed in less time and at a lower cost, thereby improving our margins. The equipment we employ is an important factor in our success, as our common platform allows us to easily and efficiently allocate components and people to meet specific project objectives while also maximizing utilization. Our operational flexibility also allows us to quickly reallocate our equipment and crews across our global operations in response to our business or client needs. This can be particularly important to our clients who face lease expiration deadlines. In addition, our integrated product offering provides us with flexibility to be responsive to our clients' specific needs. For example, on a recent project in Algeria, we successfully deployed our advanced processing services directly in the field thereby reducing the time required to deliver processed seismic data to our client.
Blue chip client base
Members of our management have long-standing relationships with blue chip clients including many NOCs and IOCs. Our large inventory of common technology platform equipment and global operating ability allows us to leverage these relationships throughout the world. Although the terms of our master service agreements with our clients do not guarantee future business, we believe that our status as an approved service provider with numerous industry participants and our past performance with these clients enhances our ability to win new business. Historically our NOC and IOC clients have represented a significant percentage of our revenues.
Strong operations management team with extensive industry experience and relationships
Our operations management team averages more than 25 years of industry experience in a variety of roles and senior positions at other seismic companies as well as E&P companies. We believe that the knowledge base, experience and relationships that our management team has built over the years extends our operating capabilities, improves the quality of our services, facilitates access to clients and underlies our strong reputation in the industry.
3
Multi-client library
We have grown our Multi-client library to over 3,700 square miles as of December 31, 2010 with another 3,500 under commitment which we expect to record during 2011. Our library includes data available to license in the Bakken, Eagle Ford, Niobrara, Haynesville, and Marcellus shale plays. Although the current focus of data licenses to these surveys are the unconventional resources previously noted, we believe the data will be of value as other prospective zones are identified within the same sedimentary column.
Our Strategies
We intend to continue to use our competitive strengths to advance our corporate strategy. The following are key elements of our strategy:
Continue to advance our high resolution RG3D seismic solutions
We intend to continue providing our clients with high resolution seismic technology and processing in order to help our clients make more informed decisions regarding their exploration and development programs. We are committed to providing our clients the most advanced technologies in the market. We have made recent investments in the design and development of advanced seismic technology such as land nodal recording systems through our acquisition of RD Seismic, tethered seafloor nodal systems built on RD Seismic nodal technology. Our land nodal recording systems are intended to operate autonomously and record continuously. Our tethered seafloor nodal systems, if successfully developed, are intended to operate in deep water with the goal of providing higher quality and more cost effective data than that provided by alternative methods. In addition, we have invested in multi-component recording equipment which provides additional information compared to standard, single component recording channels. To complement our investment in equipment technology, we will continue to develop and expand our processing and interpretation capabilities, which we believe benefits both our Proprietary Services and Multi-client Services segments.
Enhance and expand client relationships
We intend to continue enhancing our relationships with our existing clients by seeking to perform services for them in new geographic regions, as well as by continuing to provide the latest technologies and an integrated suite of services. For example, we were awarded a high resolution seismic project in Algeria after successfully completing a project for the same IOC in Oman. Additionally, we intend to build relationships with new clients by continuing to provide high quality service, operational flexibility and higher-end integrated service offerings throughout the world.
Expand our Multi-client seismic data library
We intend to continue investing in seismic data surveys for our Multi-client seismic data library. Our focus is on oil and gas basins that our clients believe have the highest potential for development.
Expand our marine services operations
We plan to increase our use of ocean bottom cable and other seafloor recording technologies to extend the application of our high resolution RG3D seismic solutions further into the deep water environment. We are currently investing in the design and development of equipment, including seafloor nodal technology, that, if successful, will combine seismic sensors and data recording technology in a manner that does not require electrical cabling or an external power source.
4
Attract and retain talented, experienced employees
Our senior management and employees have an established track record of successfully executing seismic data projects. As we have done since our inception, we intend to continue hiring industry experts with a broad experience base and extensive client relationships. We believe this valuable mix of skills and relationships will continue to improve our service offerings and facilitate our continued growth.
Industry Overview
Seismic data is acquired by introducing acoustic energy into the earth through controlled seismic energy sources. Seismic energy sources can consist of truck mounted vibration equipment in accessible terrain, explosives such as dynamite in more difficult terrain, or boat mounted air guns in shallow water and marine areas. In environments requiring the use of explosives, shot holes are drilled to the necessary depth and an explosive charge is placed securely in the hole. Vibroseis is a method used to propagate energy signals into the earth over an extended period of time as opposed to the near instantaneous energy provided by impulsive sources such as dynamite. The sound waves created by vibration equipment or dynamite are reflected back to the surface and collected by seismic sensors referred to as "geophones", which measure ground displacement, or "hydrophones", which measure pressure waves in marine environments. One or more strategically positioned seismic sensors are connected to a recording channel which transmits the data to a central recording location. Generally speaking, the higher the number of recording channels employed in a given survey, the richer the data set that is produced. A typical project, which in our industry is referred to as a "shoot" or a "seismic shoot", involves the use of thousands, and sometimes tens of thousands, of channels recording simultaneously over the survey area. Seismic data is used to pinpoint and determine the locations of subsurface features favorable for the collection of hydrocarbons, as well as define the make-up of the sedimentary rock layers and their corresponding fluids.
A seismic survey is acquired with a surface geometry—a grid of seismic energy sources and receivers extending over very large areas. The size of this grid varies with and depends on the size, depth and geophysical characteristics of the target to be imaged. The lines must be accurately positioned, so the location of each source and receiver point is obtained using either GPS, inertial, or conventional optical survey methods depending upon the vegetation and environment in the prospect area. Seismic receivers and cables are deployed on the surface of the area being surveyed at regular intervals and patterns to measure, digitize and transmit reflected seismic energy to a set of specialized recording instruments located at a central location. The transportation of cables, geophones and field recording equipment can be by truck, boat or helicopter depending upon the terrain and environment within the area to be imaged.
Two-dimensional ("2D") seismic data is recorded using straight lines of receivers crossing the earth's surface, and, once processed, allows geophysicists to only see a profile of the earth. Commercial development of three-dimensional ("3D") imaging technology began in the early 1980s and was a significant milestone for the industry. 2D seismic data surveys are generally used only to identify gross structural features; 3D seismic data surveys, which provide information continuously through the subsurface volume within the bounds of a survey, have proven effective in providing detailed views of subsurface structures. The increased use of 3D seismic data by the oil and gas industry in the 1980s helped drive significant increases in drilling success rates as better data quality allowed operators to optimize well locations and results. While prior to 1980 all seismic data acquired was 2D, today the vast majority of seismic data acquired is 3D, of which high density 3D is a growing component.
More recently the industry has seen the development of four-dimensional ("4D") imaging technology. Also known as time lapse seismic, 4D seismic data incorporates numerous 3D seismic surveys over the same reservoir at specified intervals of time. 4D seismic data is a production tool that
5
can help determine changes in flow, pressure and saturation. By scanning a reservoir over a given period of time, the flow of the hydrocarbons within can be traced and better understood. This is beneficial because, as hydrocarbons are depleted from a field, the pressure and composition of the fluids may change. Additionally, 4D seismic data can help geologists understand how a reservoir reacts to gas injection or water flooding and can help locate untapped pockets of oil or gas within the reservoir.
Multi-component recording equipment outlines both compressional and shear waves given off by a seismic source. The additional data collected through multi-component recording equipment helps to provide geologists and geophysicists a greater understanding of the properties of subsurface structures.
Microseismic monitoring consists of data acquisition, processing & analysis and interpretation services associated with the passive seismic energy emitted during the hydraulic fracturing stimulation of oil and natural gas wells. Monitoring and mapping microseismic events better enables our customers to evaluate the effectiveness of their planned hydraulic fracture treatments and associated fracture generation. Continued and coordinated monitoring and mapping efforts can provide an understanding of the interdependency of stimulation effects between wells and aid field development, reservoir management and production optimization.
Seismic data processing operations use complex mathematical algorithms to transform seismic data acquired in the field into 2D profiles, or 3D volumes of the earth's subsurface or 4D time-lapse seismic data. These images are then interpreted by geophysicists and geologists for use by oil and gas companies in evaluating prospective areas, designing horizontal drilling programs, selecting drilling sites and managing producing reservoirs.
Seismic data acquisition can be further delineated by the environment of operation as set forth below:
Land seismic data acquisition
For land applications, geophones are buried, or partially buried, to ensure good coupling with the surface and to reduce wind noise. Burying geophones in the ground is a manual process and may involve anywhere from a few to more than 100 people depending on the size of the seismic crew and the terrain involved. Cables that connect the geophones to the recording system may also be deployed manually, or in some cases, automatically from a vehicle depending on the terrain. The acoustic source for land seismic data acquisition is typically a fleet of large hydraulic vibrator trucks, but may also be explosives detonated in holes drilled for such purposes.
On a typical land seismic survey, the seismic recording crew is supported by a surveying crew and a drilling crew. The surveying crew lays out the receiver locations to be recorded and, in a survey using an explosive source, identifies the sites which the drilling crew creates for the explosive charges that produce the necessary acoustical impulse. In other surveys a mechanical vibrating unit, such as a vibrator truck, is used as the seismic energy source. The seismic crew lays out the geophones and recording instruments, directs shooting operations and records the acoustical signal reflected from subsurface strata. A fully staffed seismic land crew typically consists of at least one party manager, one instrument operator, head linesman and crew laborers. The number of individuals on each crew is dependent upon the size and nature of the seismic survey.
Transition zone seismic data acquisition
In the transition zone area where land and water come together, elements of both land data acquisition and shallow marine data acquisition are employed. Transition zone seismic data acquisition is similar to ocean bottom cable applications in that both hydrophones and geophones are lowered to the ocean floor. However, due to the shallow water depth, only small vessels and manual labor can be
6
used to deploy and retrieve the cables. Additionally, the source vessels and source arrays must be configured to run in shallower water. In transition zone areas consisting of swamps and marshes, explosives must be used as an acoustic source in addition to air guns. Our equipment allows us to record a seamless line from land, through the transition zone, and into the shallow marine environment.
Marine seismic data acquisition
In deep water environments, large ships typically tow streamer arrays that contain the sensors used to acquire seismic data. In shallow water, the ocean bottom cable method, where cables with attached geophones and hydrophones are placed directly on the bottom, is more common due to superior data quality and the ability of the smaller ships to get into shallower water. In both cases, high-pressure air gun arrays serve as the seismic energy source. We are capable of performing shallow marine surveys in water depths up to approximately 250 feet. We do not participate in towed streamer seismic data acquisition.
We believe the following industry trends should benefit our business and provide the basis for our long-term growth:
Demand for new energy resources combined with increasing difficulty of locating and producing new oil reserves
According to the International Energy Agency, worldwide oil demand is expected to grow by approximately 24% from 2008 to 2030. To meet growing world demand and to offset steep decline rates from existing proved oil resources, significant quantities of new oil reserves must be discovered. Accordingly, exploration and production companies are increasingly required to access reservoirs that are typically smaller, deeper or have other complex characteristics. In addition, existing fields which have previously been shot with older technologies are being re-shot with newer, high resolution seismic technology in connection with efforts to increase their production, identify previously bypassed reserves, and locate new prospective drilling locations.
Increased industry focus on unconventional plays, including natural gas shales in North America and internationally
Technical advances in horizontal drilling and new well completion techniques have greatly enhanced the ability of oil and gas companies to produce natural gas from unconventional resource plays such as natural gas shales. As a result, domestic shale gas resources have become a significant contributor to recent increases in U.S. natural gas production and reserves. In particular, seismic data is useful in designing horizontal drilling programs to avoid unfavorable geologic drilling textures that may increase drilling costs. Using the experience derived from the development of domestic shales, exploration and production companies have also begun to focus on shale gas resources on a global scale. Because many of these resources are located in areas that have not experienced significant historical oil and gas production, large amounts of new seismic data will be required as companies delineate the extent of shales and evaluate drilling inventories and leasing opportunities. High resolution 3D seismic data, such as that obtained through our RG3D seismic solutions, is also commonly used to formulate and implement completion techniques in shale gas reservoirs.
7
Significant advances in seismic data technologies
We believe that recent advances in seismic data equipment, technologies and processing capabilities, such as those that enable our high resolution RG3D seismic solutions, have improved not only the efficiency of seismic data acquisition but also the usefulness of the data provided. We believe that demand for our services will increase as clients become familiar with the benefits of more advanced seismic technologies, including higher density 3D and multi-component seismic data which uses multiple geophones or accelerometers to record all components of reflected acoustic energy. While seismic data historically has been used solely as an exploration tool, higher resolution seismic images are now used in applications such as designing horizontal drilling programs, formulating well completion techniques and for 4D reservoir monitoring.
Many large NOCs and IOCs have maintained consistent levels of exploration and production capital expenditures
Despite the industry downturn beginning in late 2008, many large and well capitalized oil and gas companies have maintained consistent levels of capital spending. Because large oil and gas development projects can take several years before a field is productive, many large companies take a longer term view of commodity prices in setting capital budgets.
(b) Financial Information about Segments
Our company is comprised of two business segments: Proprietary Services and Multi-client Services. The contribution of each business segment to net sales and operating income (loss), as well as, the identifiable assets attributable to each business segment, are set forth in Note 13 of the Notes to Consolidated Financial Statements.
(c) Narrative Description of Business
Description of Business Segments
Proprietary Services
We provide our clients seismic data acquisition, microseismic monitoring, data processing, and interpretation services. For our seismic data acquisition services, our clients typically request a bid for a seismic survey based on their survey design specifications. In some cases, we are shown a prospect area and asked to propose and bid on a survey of our own design. In other cases, we may be able to propose modifications in the process or scope of a proposed project in ways intended to create value, in which case we are able to propose and bid on an alternative survey design. Once the scope of the work is defined, either we or the client will undertake to obtain the required land access consents and permits. Once the required consents and permits are obtained, we survey the prospect area to determine where the energy sources and receivers would be best located. Our crews then place the geophones and energy sources into position, activate the energy sources, collect the data generated and deliver the data sets to the client. In some cases, data interpretation and processing is included in the total package bid, and in others it is bid separately. Where possible, we seek to combine our seismic data acquisition with processing and interpretation services. Throughout the entire process, we coordinate with our client in an effort to add value at each stage of seismic data acquisition, processing and interpretation. We believe that this integrated offering of seismic data services allows us to sell multiple or bundled services that offer our clients greater value and helps us to capture the highest available margins. During fiscal years 2010, 2009 and 2008 revenues from our Proprietary Services accounted for 47%, 92% and 93% of total revenues respectively. The percentage decrease in 2010 revenues from our Proprietary Services is primarily the result of a percentage increase in 2010 revenues for our Multi-client Services.
8
Multi-client Services
We also offer seismic data acquisition services in a Multi-client structure, which allows our clients to share the costs of seismic data acquisition. Our Multi-client Services projects differ from our Proprietary Services projects in that we set the specifications of the program (with some input from our clients), generally handle all aspects of the acquisition, from permitting to processing, and maintain ownership of the seismic data and associated rights after the project is completed, including any revenue stream.
We include the seismic data sets that we have acquired through our Multi-client shoots in our seismic data library. The seismic data sets are then licensed to clients on a non-exclusive basis. Our seismic data licenses are typically transferable only under limited circumstances and only upon payment to us of a specified transfer fee. Substantially all costs directly incurred in acquiring, processing and otherwise completing seismic surveys are capitalized into the Multi-client surveys.
In addition to acquiring seismic data sets through our Multi-client seismic shoots, in certain cases we will grant a non-exclusive license to a specific seismic data set to a client in exchange for ownership of complementary proprietary seismic data held by that client.
We believe that offering seismic data acquisition services in a Multi-client structure and licensing the data from our library is not only an effective business strategy in times of high capital spending, but also during times of industry-wide reductions in capital expenditures. The efficiencies we create by acquiring Multi-client seismic surveys allow oil and gas exploration companies to acquire seismic data at a lower cost and with less risk. We avoid significant speculative risk by targeting pre-commitments of approximately 80% of our estimated investment in a portfolio. During fiscal years 2010, 2009 and 2008 revenues from our Multi-client Services accounted for 53%, 8% and 7% of total revenues respectively.
Description of Segment Status
In October 2010, we purchased the assets of RD Seismic, LLC which included the High Definition Recorder ("HDR"), a small footprint, lightweight, autonomous nodal land seismic data recorder that we believe represents a new benchmark for data quality and operational efficiency. We expect to put the first 10,000 channels into service in the first half of 2011. Additionally, we plan to increase our use of ocean bottom cable and nodal seafloor recording technologies under development to extend the application of our high resolution RG3D seismic solutions further into the deep water environment.
For the year ended December 31, 2010 we invested approximately $3.0 million in the purchase of technology, design, and development of equipment, including land and seafloor nodal technology. We believe that such investments in land nodal and deeper water marine technologies will benefit both our Proprietary Services and Multi-client Services segments.
Sources and Availability of Equipment
We currently purchase a majority of our recording equipment from Sercel, Inc. Pursuant to a volume purchasing agreement, Sercel has agreed to provide us with most-favored client pricing on our recording equipment purchases. In addition, Sercel is our preferred supplier of conventional land or transition zone data acquisition equipment. The parent company of Sercel is one of our competitors. If competitive pressures were to become such that Sercel would no longer sell to us, we would have to source equipment from an increasingly competitive marketplace. If the HDR technology, which we own, is not successful, there are currently only three other manufacturers from whom we could purchase replacement equipment. Accordingly, it is uncertain if equipment that we use would be available. In addition, we obtain our seismic vibrator equipment from INOVA Geophysical, a 51% - 49% joint venture between BGP, a competitor and wholly owned subsidiary of China National Petroleum Company, and ION Geophysical Corporation.
9
Patents and Trademarks
We own or have licenses under patents and registered trademarks which are used in connection with our activity in all business segments. Some of the patents or licenses cover significant processes used to provide our services. The trademarks are important to the overall marketing and branding of our business. All of our trademarks are registered.
Seasonal Variation in Business
In North America, we generally have our highest utilization rates in the cooler months when the weather is more favorable for seismic data acquisition. Our operations can also be impacted by the Atlantic hurricane season from the months of June through November.
In addition, our operations in the Asia-Pacific region are impacted by the monsoon season, which moves across the region between September and early March. Accordingly, the results of any one quarter are not necessarily indicative of annual results or continuing trends.
Customer Base
For fiscal year 2010, a NOC represented 16% of our total sales. No other customers represent more than 10% of our sales. In 2010, we had 36 customers that each represented more than $1 million in revenue. Three customers each represented more than 10% of our Proprietary Services segment revenue at 34%, 20%, and 13%, respectively. Only one customer represented more than 10% of Multi-client Services segment revenue at 17%. By the nature of our business, it is common for our top customers to change from year to year.
Backlog
Our backlog represents contracts for services that have been entered into but which have not yet been completed. At December 31, 2010, we had a backlog of work to be completed on contracts of approximately $265 million. Of this amount, approximately $115 million is international and $150 million is domestic. At December 31, 2009, we had a backlog of work to be completed on contracts of approximately $153 million. The increase in backlog is primarily the result of an increased demand for Proprietary Services internationally and in increase in demand for Multi-client Services in the United States. Due to the timing of our contracts and the long-term nature of some of our projects, portions of our backlog may not be completed in the fiscal year 2011. Most projects we perform can be completed in a short period of time, typically several months. Larger projects may take a year or more to be completed. Generally, mobilization starts shortly after the signing of the contract. Additionally, contracts for services are occasionally modified by mutual consent of the parties and in many instances may be cancelled by the customer on short notice without penalty. As a result, along with projects extending beyond fiscal year 2011, our backlog as of any particular date may not be indicative of our actual operating results for any succeeding fiscal period.
Government Contracts
Not applicable.
Service Contracts
Our seismic data acquisition contracts generally provide for payment for mobilization, data acquisition and demobilization. Mobilization payments are intended to cover, or partially offset, the costs of moving equipment and personnel to a new job location. Demobilization payments are intended to cover, or partially offset, the costs of returning equipment and personnel from the job location.
Seismic data acquisition is generally paid for on a turnkey or term rate (also referred to as "day-rate") basis or on a combination of both methods. A turnkey contract provides for a fixed fee to
10
be paid per square mile of data acquired. Term rate contracts provide for payments based on agreed rates per units of time, which are typically expressed in number of days. Our contracts generally contain provisions that require our clients to pay a standby rate for periods during which a project is delayed. However, these provisions may not cover all instances of delay, or may be limited in duration.
Our contracts generally permit our clients to terminate a contract upon payment of an early termination fee plus the demobilization fee for an early termination that occurs after we mobilize to the job. Our contracts generally provide for a lesser fee if a client elects to terminate before we have mobilized.
Our international agreements generally require arbitration for contract dispute resolution. We endeavor to have these international arbitrations conducted in London under English law and in English. We have been generally successful in obtaining such provisions, except in contracts for services in Latin America which tend to require arbitration in the local country and in Spanish.
Most of our contracts provide for payment in U.S. dollars. Often we elect to receive a portion of a contract payment in the local currency for use in paying local payroll and other local expenses
Competitive Conditions
Seismic data services for the oil and gas industry have historically been highly competitive. Success in marketing seismic services is based on several factors, including price, crew experience, equipment availability, technological expertise, reputation for quality and dependability.
We consider our principal competitors to be Bureau of Geophysical Prospecting Limited ("BGP"—a subsidiary of Chinese National Petroleum Corporation), Compagnie Générale de Géophysique-Veritas ("CGGVeritas"), Dawson Geophysical Company, Geophysical Pursuit Inc., Geokinetics Inc., Petroleum Geo-Services ASA ("PGS"), Seismic Exchange Inc., Seitel Inc., TGC Industries Inc., and WesternGeco (a business segment of Schlumberger).
Environmental Disclosures and Regulation
Our operations are subject to a variety of federal, state and local laws and regulations governing various aspects of our operations. Our use of explosives is regulated in the United States by the Bureau of Alcohol, Tobacco and Firearms, which has issued us a license to use explosives. We are also subject to certain environmental laws regarding removal and clean-up of materials that may harm the environment. In countries outside the United States, we are subject to similar requirements, and also rely on customer requirements and industry guidelines either in addition to or in lieu of applicable legal requirements. We believe we conduct our operations in substantial compliance with applicable laws and regulations governing our business.
We developed our Health, Safety, Environment and Quality ("HSEQ") Management System in accordance with the guidelines of the International Association of Oil and Gas Producers ("OGP"), as set forth in OGP Report Number 210, "Guidelines for the Development and Application of Health, Safety and Environmental Management Systems". Our HSEQ Management System describes how we manage health and safety risk, process risk, environmental matters relating to our business, including the impact our operations may have on the communities in which we operate and our relationships with customers, contractors and suppliers. We have designed our HSEQ Management System to complement our clients' HSEQ management systems so that we may achieve a seamless structure for managing projects.
Employees
Our senior management and employees have an established track record of successfully executing seismic data projects. As we have done since our inception, we intend to continue hiring industry experts with a broad experience base and extensive client relationships. We believe this valuable mix of
11
skills and relationships will continue to improve our service offerings and facilitate our continued growth. As of December 31, 2010, we had 1,667 employees serving in various capacities.
(d) Financial Information about Domestic and Foreign Operations
Sales within the United States accounted for approximately 57% of our total sales in 2010. Operations outside the United States are generally characterized by the same conditions discussed in the description of the business above and may also be affected by additional factors including changing currency values, different rates of inflation, economic growth and political and economic uncertainties and disruptions. Our sales by geography for the three years ended December 31 were as follows:
| |
2010 | 2009 | 2008 | |||||||
|---|---|---|---|---|---|---|---|---|---|---|
United States |
57 | % | 58 | % | 41 | % | ||||
Latin America(1) |
30 | % | 13 | % | 28 | % | ||||
Europe, Africa, Middle East (EAME)(2) |
3 | % | 13 | % | 20 | % | ||||
Asia Pacific(3) |
10 | % | 16 | % | 11 | % | ||||
The following countries represent 10% or greater of our revenues:
- (1)
- Colombia
for 2010 and 2009.
- (2)
- Algeria
for 2008.
- (3)
- India for 2010, 2009 and 2008.
Revenues and assets within the United States and internationally for the fiscal years ended December 31 were as follows:
| |
Revenues | Assets | |||||||||||||||||
|---|---|---|---|---|---|---|---|---|---|---|---|---|---|---|---|---|---|---|---|
| |
2010 | 2009 | 2008 | 2010 | 2009 | 2008 | |||||||||||||
| |
(in millions) |
||||||||||||||||||
United States |
145.7 | 180.1 | 152.7 | 303.1 | 209.8 | 189.7 | |||||||||||||
International |
109.0 | 132.7 | 223.6 | 110.2 | 106.8 | 139.9 | |||||||||||||
(e) Available Information
We file with the Securities and Exchange Commission ("SEC") our annual report on Form 10-K, quarterly reports on Form 10-Q, current reports on Form 8-K and all amendments to those reports, proxy statements and registration statements. You may read and copy any material we file with the SEC at the SEC's Public Reference Room at 100 F Street, NE., Washington, DC 20549. You may also obtain information on the operation of the Public Reference Room by calling the SEC at 1-800-SEC-0330. In addition, the SEC maintains an internet site at http://www.sec.gov that contains reports, proxy and information statements, and other information regarding issuers, including us, that file electronically.
All of our reports and materials filed with the SEC, are available free of charge through our website, http://www.globalgeophysical.com/, as soon as reasonably practical, after we have electronically filed such material with the SEC. Information about our Board Members, Board's Standing Committee Charters, and Code of Business Conduct and Ethics are also available, free of charge, through our website. We reserve the right to satisfy the disclosure requirement under Item 5.05 of Form 8-K regarding an amendment to, or a waiver from, a provision of our Code of Business Conduct and Ethics that applies to the principal executive officer, principal financial officer, principal accounting officer or controller or persons performing similar functions and that relates to any element of the code of ethics definition enumerated in Item 406(b) of Regulations S-K (17 CFR 228.406(b)), by posting such amendment or waiver on our website within four business days following the date of the amendment or waiver. The contents of our website are not, however, a part of this Form 10-K.
12
The following discussion of risk factors contains "forward-looking statements," as discussed immediately preceding Item 1A. of this Form 10-K. These risk factors may be important to understanding any statement in this Form 10-K or elsewhere. The risk factors should also be read in conjunction with Management's Discussion and Analysis, and the consolidated financial statements and related notes incorporated by reference in this Form 10-K. Because of the following risk factors, as well as other factors affecting our financial condition and operating results, past financial performance should not be considered to be a reliable indicator of future performance, and investors should not use historical trends to anticipate results or trends in future periods.
Risks Related to Our Business
Our results of operations could be materially adversely affected by economic conditions.
Prices for oil and natural gas have been volatile. During the most recent period of depressed commodity prices, many oil and gas exploration and production companies significantly reduced their levels of capital spending, including amounts dedicated to the purchase of seismic data services. Historically, demand for our services has depended significantly on the level of exploration spending by oil and gas companies. A return of depressed commodity prices, or a decline in existing commodity prices or other economic factors, could materially adversely affect demand for the services we provide, and therefore affect our business, financial condition, results of operations and cash flows.
Industry spending on our services is subject to rapid and material change.
Our clients' willingness to explore, develop and produce depends largely upon prevailing industry conditions that are influenced by numerous factors over which our management has no control, such as:
- •
- demand for oil and natural gas, especially in the United States, China and India;
- •
- the ability of oil and gas exploration and production companies to generate funds or otherwise obtain external capital for
exploration, development, construction and production operations;
- •
- the sale and expiration dates of leases in the United States and overseas;
- •
- domestic and foreign tax policies;
- •
- the cost of exploring for, developing, producing and delivering oil and natural gas;
- •
- the expected rates of declining current production;
- •
- the availability and discovery rates of new oil and gas reserves;
- •
- technical advances affecting energy exploration, production, transportation and consumption;
- •
- weather conditions, including hurricanes and monsoons that can affect oil and gas operations over a wide area as well as
less severe inclement weather that can preclude or delay seismic data acquisition;
- •
- political instability in oil and gas producing countries;
- •
- government and other organizational policies, including those of the Organization of the Petroleum Exporting Countries,
regarding the exploration, production and development of oil and gas reserves;
- •
- the ability of oil and gas producers to raise equity capital and debt financing; and
- •
- merger and divestiture activity among oil and gas producers.
13
In addition, increases in oil and natural gas prices may not have a positive effect on our financial condition or results of operations. Although demand for our services may decrease when depressed economic conditions are present, including lower oil and natural gas prices, the reverse is not necessarily true due to the factors listed in this Form 10-K as well as other factors beyond our control.
Our revenues are subject to fluctuations that are beyond our control, which could adversely affect our results of operations in any financial period.
Our operating results may vary in material respects from quarter to quarter and may continue to do so in the future. Factors that cause variations include the timing of the receipt and commencement of contracts for seismic data acquisition, processing or interpretation and clients' budgetary cycles, both of which are beyond our control. Furthermore, in any given period, we could have idle crews which result in a significant portion of our revenues, cash flows and earnings coming from a relatively small number of crews. Additionally, due to location, service line or particular project, some of our individual crews may achieve results that are a significant percentage of our consolidated operating results. Should one or more of these crews experience significant changes in timing, our financial results could be subject to significant variations from period to period. Combined with our high fixed costs, these revenue fluctuations could have a material adverse effect on our results of operations in any fiscal period.
Our working capital needs are difficult to forecast and may vary significantly, which could require us to seek additional financing that we may not be able to obtain on satisfactory terms, or at all.
Our working capital needs are difficult to predict with certainty. This difficulty is due primarily to working capital requirements related to our seismic data services where our revenues vary in material respects as a result of, among other things, the timing of our projects, our clients' budgetary cycles and our receipt of payment. We may therefore be subject to significant and rapid increases in our working capital needs that could require us to seek additional financing sources. Restrictions in our debt agreements may impair our ability to obtain other sources of financing, and access to additional sources of financing may not be available on terms acceptable to us, or at all.
We face intense competition in our business that could result in downward pricing pressure and the loss of market share.
Competition among seismic contractors historically has been, and likely will continue to be, intense. Competitive factors have in recent years included price, crew experience, equipment availability, technological expertise and reputation for quality and dependability. We also face increasing competition from nationally owned companies in various international jurisdictions that operate under less significant financial constraints than those we experience. Many of our competitors have greater financial and other resources, more clients, greater market recognition and more established relationships and alliances in the industry than we do. They and other competitors may be better positioned to withstand and adjust more quickly to volatile market conditions, such as fluctuations in oil and natural gas prices and production levels, as well as changes in government regulations. Additionally, the seismic data acquisition business is extremely price competitive and has a history of protracted periods of months or years where seismic contractors under financial duress bid jobs at unattractive pricing levels and therefore adversely affect industry pricing. Competition from these and other competitors could result in downward pricing pressure, which could adversely affect our EBITDA margins, and the loss of market share.
We have had losses in the past and there is no assurance of our profitability for the future.
Following the precipitous decline in oil and natural gas prices beginning in 2008, we recorded a net loss for the year ending December 31, 2008 of $8.0 million. Although we showed a net profit of
14
$0.4 million in 2009, we experienced a net loss in 2010 of $39.7 million. We cannot assure you that we will be profitable in future periods.
We have supply arrangements with a limited number of key suppliers, the loss of any one of which could have a material adverse effect on our financial condition and results of operations. Additionally, our supply agreement with Sercel, Inc., under which we purchase the majority of our recording equipment on "most favored client" terms, expires in 2013.
Historically, we have purchased substantially all of our seismic data acquisition equipment from two key suppliers, Sercel, Inc. ("Sercel") and ION Geophysical Corporation ("ION"). If either of our key suppliers discontinues operations or otherwise refuses to honor its supply arrangements with us, we may be required to enter into agreements with alternative suppliers on terms less favorable to us, which could result in increased product costs and longer delivery lead times.
Under its supply agreement with us, Sercel is obligated to sell to us recording equipment at prices and on terms at least as favorable as those made available to its other customers who purchase similar volumes of like equipment. This agreement expires in 2013. If Sercel declined to extend this agreement beyond 2013, or otherwise did not offer to sell such equipment to us on "most favored client" terms, the cost to us of additional or replacement recording equipment could increase significantly. The loss of any of our key suppliers, or our failure to renew or extend our existing supply agreement with Sercel, could have a material adverse effect on our financial condition and results of operations.
In addition, ongoing patent litigation between Sercel and ION could impact our ability to obtain and use seismic equipment and parts in the future. We are currently assessing the impact of the Sercel—ION litigation on our business, but it is difficult to assess its full impact until a final resolution of the litigation is achieved.
Key suppliers or their affiliates may compete with us.
A number of seismic equipment manufacturers are affiliated with or are otherwise controlled by our competitors. We currently purchase a majority of our recording equipment from Sercel, a subsidiary of one of our competitors, CGGVeritas. In addition, we purchase seismic vibrator equipment manufactured by a joint venture between ION and BGP, which is a competitor of ours. There are a limited number of companies which manufacture this equipment in addition to Sercel and ION. If either of Sercel or ION choose to no longer sell this equipment to us, or to no longer sell such equipment to us on commercially reasonable terms, whether as a result of competitive pressures or otherwise, we may be required to use less suitable replacement equipment which could impair our ability to execute our business solutions for customers.
We are dependent upon a small number of significant clients. Additionally, from time to time a significant portion of our revenues are generated by a single project.
We derive a significant amount of our revenues from a small number of oil and gas exploration and development companies. During the year ended December 31, 2010, we had one client which accounted for more than 10% of our revenues. While our revenues are derived from a concentrated client base, our significant clients may vary between years. If we lose one or more major clients in the future, or if one or more clients encounter financial difficulties, our business, financial condition and results of operations could be materially and adversely affected.
Additionally, from time to time, a significant portion of our revenues are generated by a single project. Our dependence from time to time on a single project for a significant percentage of our revenues may result in significant variability of our earnings from period to period as these projects are completed.
15
We cannot assure you that NOC and IOC clients will continue to generate the majority, or even a significant percentage, of our revenue. Smaller or less well capitalized oil and gas exploration and production companies may be forced to reduce their budgets for seismic data acquisition services in periods of depressed or declining commodity prices. Our dependence on customers other than NOCs and IOCs for the majority of our revenue could expose us to greater earnings volatility.
Historically, our NOC and IOC clients have represented a significant percentage of our revenues. Smaller or less well capitalized oil and gas exploration and production companies may be required to sharply reduce their expenditures for seismic data acquisition services in periods of depressed or declining commodity prices. Our dependence on customers other than NOCs and IOCs for the majority of our revenue could expose us to greater earnings volatility.
Revenues derived from our projects may not be sufficient to cover our costs of completing those projects. As a result, our results of operations may be adversely affected.
Our revenues are determined, in part, by the price we receive for our services, the productivity of our crew and the accuracy of our cost estimates. Our crew's productivity is partly a function of external factors, such as seasonal variations in the length of days, weather, including the onset of monsoons, difficult terrain and marine environments, and third party delays, over which we have no control. In addition, cost estimates for our projects may be inadequate due to unknown factors associated with the work to be performed and market conditions, resulting in cost over-runs. If our crew encounters operational difficulties or delays, or if we have not correctly priced our services, our results of operation may vary, and in some cases, may be adversely affected. We have in the past experienced cost over-runs that caused the cost from a particular project to exceed the revenues from that project and cannot assure you that this will not happen again.
Many of our projects are performed on a turnkey basis where a defined amount and scope of work is provided by us for a fixed price and extra work, which is subject to client approval, is billed separately. The revenue, cost and gross profit realized on a turnkey contract can vary from our estimated amount because of changes in job conditions, variations in labor and equipment productivity from the original estimates, and the performance of subcontractors. Turnkey contracts may also cause us to bear substantially all of the risks of business interruption caused by weather delays and other hazards. These variations, delays and risks inherent in billing clients at a fixed price may result in us experiencing reduced profitability or losses on projects.
From time to time we experience disputes with our clients relating to the amounts we invoice for our services, particularly with respect to billings relating to standby time. The exercise of remedies against clients in connection with our collection efforts could negatively affect our ability to secure future business from those clients.
Our contracts for seismic data acquisition services typically include provisions that require payment to us at a reduced rate for a limited amount of time if we are unable to record seismic data as a result of weather conditions or certain other factors outside our control, including delays caused by our clients. From time to time we experience disputes with our clients relating to the amounts we invoice for our services. For example, as of December 31, 2010, we had disputes with certain customers which relate to charges for our services. The exercise of our contractual remedies against these or other clients in connection with our collection efforts could negatively affect our relationship with these clients, and could result in the loss of future business which in turn could negatively affect our earnings in future periods.
16
Technological change in our business creates risks of technological obsolescence and requirements for future capital expenditures. If we are unable to continue investing in, or otherwise acquire, the latest technology, we may not be able to compete effectively.
The development of seismic data acquisition, processing and interpretation equipment has been characterized by rapid technological advancements in recent years and we expect this trend to continue. Manufacturers of seismic equipment may develop new systems that have competitive advantages relative to systems now in use that either renders the equipment we currently use obsolete or require us to make substantial capital expenditures to maintain our competitive position. Additionally, a number of seismic equipment manufacturers are affiliated with or are otherwise controlled by our competitors. If any such equipment manufacturer developed new equipment or systems and, for competitive reasons or otherwise, declined to sell such equipment or systems to us, we could be placed at a competitive disadvantage. In order to remain competitive, we must continue to invest additional capital to maintain, upgrade and expand our seismic data acquisition capabilities. In addition to our continuing investment in seismic data acquisition equipment from third party suppliers, we are also currently investing in the design and development of our own land and sea floor nodal technology. However, we may not be successful in developing and deploying this technology in a manner that is technologically or commercially viable. See "Management's Discussion and Analysis of Financial Condition and Results of Operations—Liquidity and Capital Resources—Capital Expenditures."
Seismic data acquisition equipment is expensive and our ability to operate and expand our business operations is dependent upon the availability of internally generated cash flow and financing alternatives. Such financing may consist of bank or commercial debt, equity or debt securities or any combination thereof. There can be no assurance that we will be successful in obtaining sufficient capital to upgrade and expand our current operations through cash from operations or additional financing or other transactions if and when required on terms acceptable to us.
If we do not effectively manage our transitions into new products and services, our revenues may suffer.
Products and services for the seismic industry are characterized by rapid technological advances in hardware performance, software functionality and features, frequent introduction of new products and services, and improvement in price characteristics relative to product and service performance. Among the risks associated with the introduction of new products and services are delays in development or manufacturing, variations in costs, delays in customer purchases or reductions in price of existing products in anticipation of new introductions, write-offs or write-downs of the carrying costs of assets associated with prior generation products, difficulty in predicting customer demand for new product and service offerings and effectively managing inventory levels so that they are in line with anticipated demand, risks associated with customer qualification, evaluation of new products, and the risk that new products may have quality or other defects or may not be supported adequately by application software. The introduction of new products and services by our competitors also may result in delays in customer purchases and difficulty in predicting customer demand. If we do not make an effective transition from existing products and services to future offerings, our revenues and margins may decline.
Furthermore, sales of our new products and services may replace sales, or result in discounting, of some of our current offerings, offsetting the benefit of a successful new product introduction. In addition, it may be difficult to ensure performance of new products and services in accordance with our revenue, margin, and cost estimates and to achieve operational efficiencies embedded in our estimates. Given the competitive nature of the seismic industry, if any of these risks materialize, the future demand for our products and services, and our future results of operations, may suffer.
17
We are exposed to risks related to complex, highly technical products.
Our customers often require demanding specifications for product performance and reliability. Because many of our products are complex and often use unique advanced components, processes, technologies, and techniques, undetected errors and design and manufacturing flaws may occur. Even though we attempt to assure that our systems perform reliably in the field, the many technical variables related to their operations can cause a combination of factors that may, and from time to time have, caused performance and service issues with certain of our products. Product defects result in higher product service, warranty, and replacement costs and may affect our customer relationships and industry reputation, all of which may adversely impact our results of operations. Despite our testing and quality assurance programs, undetected errors may not be discovered until the product is purchased and used by a customer in a variety of field conditions. If our customers deploy our new products and they do not work correctly, our relationship with our customers may be materially and adversely affected.
Our backlog estimates are based on certain assumptions and are subject to unexpected adjustments and cancellations and thus may not be timely converted to revenues in any particular fiscal period, if at all, or be indicative of our actual operating results for any future period.
Our backlog estimates represent those seismic data acquisition projects for which a client has executed a contract and has a scheduled start date for the project as well as unrecognized pre-committed funding from our Multi-client Services segment. Backlog estimates are based on a number of assumptions and estimates including assumptions related to foreign exchange rates and proportionate performance of contracts and our valuation of assets, such as seismic data, to be received by us as payment under certain agreements. The realization of our backlog estimates is further affected by our performance under term rate contracts, as the early or late completion of a project under term rate contracts will generally result in decreased or increased, as the case may be, revenues derived from these projects. Contracts for services are also occasionally modified by mutual consent. Because of potential changes in the scope or schedule of our clients' projects, we cannot predict with certainty when or if our backlog will be realized. Even where a project proceeds as scheduled, it is possible that the client may default and fail to pay amounts owed to us. In addition, the contracts in our backlog are cancelable by the client. Material delays, payment defaults or cancellations could reduce the amount of backlog currently reported, and consequently, could inhibit the conversion of that backlog into revenues.
We have invested, and expect to continue to invest, significant amounts of money in acquiring and processing seismic data for Multi-client surveys and for our seismic data library without knowing precisely how much of this seismic data we will be able to sell or when and at what price we will be able to sell such data.
Multi-client surveys and the resulting seismic data library are an increasingly important part of our business and our future investments. We invest significant amounts of money in acquiring and processing seismic data that we own. By making such investments, we are exposed to the following risks:
- •
- We may not fully recover our costs of acquiring, processing and interpreting seismic data through future sales. The
amounts of these data sales are uncertain and depend on a variety of factors, many of which are beyond our control.
- •
- The timing of these sales is unpredictable and can vary greatly from period to period. The costs of each survey are capitalized and then amortized over the expected useful life of the data. This amortization will affect our earnings and when combined with the sporadic nature of sales, will result in increased earnings volatility.
18
- •
- Regulatory changes that affect companies' ability to drill, either generally or in a specific location where we have
acquired seismic data, could materially adversely affect the value of the seismic data contained in our library. Technology changes could also make existing data sets obsolete. Additionally, each of
our individual surveys has a limited book life based on its location and oil and gas companies' interest in prospecting for reserves in such location, so a particular survey may be subject to a
significant decline in value beyond our initial estimates.
- •
- The value of our Multi-client data could be significantly adversely affected if any material adverse change occurs in the
general prospects for oil and gas exploration, development and production activities.
- •
- The cost estimates upon which we base our pre-commitments of funding could be wrong, which could result in
losses that have a material adverse effect on our financial condition and results or operations.
- •
- Pre-commitments of funding are subject to the creditworthiness of our clients. In the event that a client
refuses or is unable to pay its commitment, we could lose a material amount of money.
- •
- If our clients significantly increase their preference toward licensing seismic data from Multi-client data libraries, we may not have the appropriate existing data library assets to be able to obtain permits and access rights to geographic areas of interest from which to record such data, or make appropriate levels of investment in the creation of new data library assets to support our business strategy.
Any reduction in the market value of such data will require us to write down its recorded value, which could have a significant material adverse effect on our results of operations.
Our operations are subject to delays related to obtaining land access rights from third parties which could affect our results of operations.
Our seismic data acquisition operations could be adversely affected by our inability to timely obtain access to both public and private land included within a seismic survey. We cannot begin surveys on property without obtaining permits from certain governmental entities as well as the permission of the parties who have rights to the land being surveyed. In recent years, it has become more difficult, costly and time-consuming to obtain access rights as drilling activities have expanded into more populated areas. Additionally, while land owners generally are cooperative in granting access rights, some have become more resistant to seismic and drilling activities occurring on their property and stall or refuse to grant these rights for various reasons. In our Multi-client Services segment, we acquire data sets pertaining to large areas of land. Consequently, if we do not obtain land access rights from a specific land owner, we may not be able to provide a complete survey for that area. The failure to redact or remove the seismic information relating to mineral interests held by non-consenting third parties could result in claims against us for seismic trespass. In addition, governmental entities do not always grant permits within the time periods expected. Delays associated with obtaining such permits and significant omissions from a survey as a result of the failure to obtain consents could have a material adverse effect on our financial condition and results of operations.
We operate under hazardous conditions that subject us and our employees to risk of damage to property or personal injury and limitations on our insurance coverage may expose us to potentially significant liability costs.
Our activities are often conducted in dangerous environments and under hazardous conditions, including the detonation of dynamite. Operating in such environments and under such conditions carries with it inherent risks, such as damage to or loss of human life or equipment, as well as the risk of downtime or reduced productivity resulting from equipment failures caused by such adverse
19
operating environment. These risks could cause us to experience equipment losses, injuries to our personnel and interruptions in our business. We cannot assure you that our insurance will be sufficient or adequate to cover all losses or liabilities or that insurance will continue to be available to us or available to us on acceptable terms. A successful claim for which we are not fully insured, or which exceeds the policy limits of our applicable insurance could have a material adverse effect on our financial condition. Moreover, we do not carry business interruption insurance with respect to our operations.
Our agreements with our clients may not adequately protect us from unforeseen events or address all issues that could arise with our clients. The occurrence of unforeseen events not adequately addressed in the contracts could result in increased liability, costs and expenses associated with any given project.
With many of our clients we enter into master service agreements which allocate certain operational risks. Despite the inclusion of risk allocation provisions in our agreements, our operations may be affected by a number of events that are unforeseen or not within our control. We cannot assure you that our agreements will adequately protect us from each possible event. If an event occurs which we have not contemplated or otherwise addressed in our agreement, we, and not our client, will likely bear the increased cost or liability. To the extent our agreements do not adequately address these and other issues, or we are not able to successfully resolve resulting disputes, we may incur increased liability, costs and expenses.
Weather may adversely affect our ability to conduct business.
Our seismic data acquisition operations could be adversely affected by inclement weather conditions. Delays associated with weather conditions could have a material adverse effect on our financial condition and results of operations. For example, weather delays focused on a particular project or region could lengthen the time to complete the project, resulting in decreased margins to us. Our operations in or near the Gulf of Mexico may be subject to stoppages for hurricanes. In addition, our operations in the Arabian Sea and the Bay of Bengal are subject to stoppages for monsoons. Accordingly, the results of any one quarter are not necessarily indicative of annual results or continuing trends.
We may be held liable for the actions of our subcontractors.
We often work as the general contractor on seismic data acquisition surveys and consequently engage a number of subcontractors to perform services and provide products. There can be no assurance we will not be held liable for the actions of these subcontractors. In addition, subcontractors may cause damage or injury to our personnel and property that is not fully covered by insurance.
Current or future distressed financial conditions of clients could have an adverse effect on us in the event these clients are unable to pay us for our services.
Some of our clients are experiencing, or may experience in the future, severe financial problems that have had or may have a significant effect on their creditworthiness. We generally do not require that our clients make advance payments or otherwise collateralize their payment obligations. We cannot provide assurance that one or more of our financially distressed clients will not default on their payment obligations to us or that such a default or defaults will not have a material adverse effect on our business, financial position, results of operations or cash flows. Furthermore, the bankruptcy of one or more of our clients, or other similar proceeding or liquidity constraint, will reduce the amounts we can expect to recover, if any, with respect to amounts owed to us by such party. In addition, such events might force those clients to reduce or curtail their future use of our products and services, which could have a material adverse effect on our results of operations and financial condition.
20
The high fixed costs of our operations could result in operating losses.
We are subject to high fixed costs which primarily consist of depreciation, maintenance expenses associated with our seismic data acquisition, processing and interpretation equipment and certain crew costs. Because substantially all of our equipment is new or nearly new, we believe that our depreciation expense relative to our revenues is higher than that of many of our competitors. Extended periods of significant downtime or low productivity caused by reduced demand, weather interruptions, equipment failures, permit delays or other causes could reduce our profitability and have a material adverse effect on our financial condition and results of operations because we will not be able to reduce our fixed costs as fast as revenues decline.
Our results of operations could be adversely affected by goodwill or long-lived asset impairments.
We periodically review our portfolio of equipment for impairment. A prolonged downturn could affect the carrying value of our goodwill and require us to recognize a loss. If we expect significant sustained decreases in oil and natural gas prices in the future, we may be required to write down the value of our equipment if the future cash flows anticipated to be generated from the related equipment falls below net book value. A decline in oil and natural gas prices, if sustained, can result in future impairments. In addition, changes in industry conditions, such as changes in applicable laws and regulations, could affect the usefulness of our Multi-client seismic data library to oil and gas companies, thereby requiring us to write down the value of our seismic data library. If we are forced to write down the value of our assets, these non-cash asset impairments could negatively affect our results of operations in the period in which they are recorded. See discussions of "Impairment of Long-lived Assets" included in "Critical Accounting Policies and Estimates" and "Goodwill" included in Note 2 "Summary of Significant Accounting Policies."
We are subject to compliance with stringent environmental laws and regulations that may expose us to significant costs and liabilities.
Our operations are subject to stringent federal, provincial, state and local environmental laws and regulations in the United States and foreign jurisdictions relating to environmental protection. In our business, we use explosives and certain other regulated hazardous materials that are subject to such regulation. These laws and regulations may impose numerous obligations that are applicable to our operations including:
- •
- the acquisition of permits before commencing regulated activities;
- •
- the limitation or prohibition of seismic activities in environmentally sensitive or protected areas such as wetlands or
wilderness areas;
- •
- restrictions pertaining to the management and operation of our vehicles and equipment; and
- •
- licensing requirements for our personnel handling explosives and other regulated hazardous materials.
Numerous governmental authorities, such as the U.S. Environmental Protection Agency ("EPA"), the Bureau of Alcohol, Tobacco, Firearms and Explosives ("BATFE"), the Bureau of Land Management ("BLM") and analogous state agencies in the United States and governmental bodies with control over environmental matters in foreign jurisdictions, have the power to enforce compliance with these laws and regulations and any licenses and permits issued under them, oftentimes requiring difficult and costly actions. In addition, failure to comply with these laws, regulations and permits may result in the assessment of administrative, civil and criminal penalties, the imposition of obligations to investigate and/or remediate contaminations, and the issuance of injunctions limiting or preventing some or all of our operations.
21
We invest extensive financial and management resources to comply with these laws and related licensing and permitting requirements, and we believe that the regulatory environment for the oil and natural gas industry and related service providers is likely to become more burdensome and time consuming than it ever has been before. Over the last year, permitting authorities have begun requiring us to comply with standards that have never before applied to seismic companies. As further discussed below, some proposed regulations would inhibit the use of hydraulic fracturing in connection with the drilling of wells, which is a crucial part in recovering economic amounts of hydrocarbons from shale plays, which represent a significant opportunity for us. If oil and natural gas companies face regulation that makes drilling for resources uneconomic, the demand for our services may be adversely affected. In addition, the ongoing revision of such environmental laws and regulations, sometimes as a direct result of particular economic, political, or social events, makes it difficult for seismic data acquisition companies to predict future costs or the impact of such laws and regulations on future projects. As a result, we could incur capital and operating expenses, as well as compliance costs, beyond those anticipated which could adversely affect our future operations.
There is inherent risk of incurring significant environmental costs and liabilities in our operations due to our controlled storage, use and disposal of explosives. In the event of an accident, we could be held liable for any damages that result or we could be penalized with fines, and any liability could exceed the limits of or fall outside our insurance coverage.
Current and future legislation relating to climate change and hydraulic fracturing may negatively impact the exploration and production of oil and gas, and implicitly the demand for our products and services.
Our company along with other seismic data acquisition companies may be affected by new environmental legislation intended to limit or reduce increased emissions of gases, such as carbon dioxide and methane from the burning of fossil fuels (oil, gas and coal), which may be a contributing factor to climate change. The European Union has already established greenhouse gas ("GHGs") regulations, and many other countries, including the United States, are in the process of enacting similar regulations. This could cause us to incur additional direct and indirect compliance costs in relation to any new climate change laws and regulations. Moreover, passage of climate change legislation or other regulatory initiatives that target emissions of GHGs may impair exploration and production of hydrocarbons and thus adversely affect future demand for our products and services. Reductions in our revenues or increases in our expenses as a result of climate control legislative initiatives could have negative impact on our business, financial position, results of operations and prospects. Although various climate change legislative measures have been under consideration by the U.S. Congress, it is not possible at this time to predict whether or when Congress may act on climate change legislation.
22
In addition, the "Fracturing Responsibility and Awareness of Chemicals Act" (the "FRAC Act") was introduced to both houses of the 111th U.S. Congress on June 9, 2009, aiming to amend the "Safe Drinking Water Act" (the "SDWA") by repealing an exemption from regulation for hydraulic fracturing. If enacted, the FRAC Act would amend the definition of "underground injection" in the SDWA to encompass hydraulic fracturing activities. Such a provision could require hydraulic fracturing operations to meet permitting and financial assurance requirements, adhere to certain construction specifications, fulfill monitoring, reporting, and recordkeeping obligations, and meet plugging and abandonment requirements. The FRAC Act also proposes to require the reporting and public disclosure by the energy industry of the chemicals mixed with the water and sand it pumps underground in the hydraulic fracturing process (also known as "fracking"), information that has largely been protected as trade secrets. This reporting would make it easier for third parties opposing the hydraulic fracturing process to initiate legal proceedings based on allegations that specific chemicals used in the fracturing process could adversely affect groundwater. The adoption of any future federal or state laws or implementing regulations imposing reporting obligations on, or otherwise limiting, the hydraulic fracturing process could make it more difficult to complete natural gas wells. Shale gas cannot be economically produced without extensive fracturing. While proposed legislation is pending in Congress, the EPA has also reviewed its existing authority under the SDWA and asserted its intent to regulate hydraulic fracturing operations involving diesel additives. In the event this legislation is enacted, demand for seismic acquisition services may be adversely affected.
Historically our operational expenses incurred in connection with international seismic data projects have been higher, as a percentage of revenues, than the operational expenses incurred in connection with seismic data projects undertaken in the United States. The profitability of our future international operations will depend significantly on our ability to control these expenses.
The expense of mobilizing personnel and equipment to various foreign locations, as well as the cost of obtaining and complying with local regulatory requirements historically have been significantly higher than the expenses incurred in connection with seismic data projects undertaken in the United States. If we are unable to reduce the expenses incurred in connection with an international seismic data project, or to obtain better pricing for such services, our results of operations could be materially and adversely affected.
Operating internationally subjects us to significant risks and regulation inherent in operating in foreign countries.
We conduct operations on a global scale. As of December 31, 2010, approximately 38% of our property, plant and equipment and approximately 36% of our employees were located outside of the U.S. and, for the year ended December 31, 2010, approximately 43% of our revenues were attributable to operations in foreign countries.
Our international operations are subject to a number of risks inherent to any business operating in foreign countries, and especially those with emerging markets. As we continue to increase our presence in such countries, our operations will encounter the following risks, among others:
- •
- government instability, which can cause investment in capital projects by our potential clients to be withdrawn or
delayed, reducing or eliminating the viability of some markets for our services;
- •
- potential expropriation, seizure, nationalization or detention of assets;
- •
- difficulty in repatriating foreign currency received in excess of local currency requirements;
- •
- import/export quotas;
- •
- civil uprisings, riots and war, which can make it unsafe to continue operations, adversely affect both budgets and schedules and expose us to losses;
23
- •
- availability of suitable personnel and equipment, which can be affected by government policy, or changes in policy, which
limit the importation of qualified crewmembers or specialized equipment in areas where local resources are insufficient;
- •
- decrees, laws, regulations, interpretation and court decisions under legal systems, which are not always fully developed
and which may be retroactively applied and cause us to incur unanticipated and/or unrecoverable costs as well as delays which may result in real or opportunity costs; and
- •
- terrorist attacks, including kidnappings of our personnel.
We cannot predict the nature and the likelihood of any such events. However, if any of these or other similar events should occur, it could have a material adverse effect on our financial condition and results of operation.
Certain of the seismic equipment that we use in certain foreign countries may require prior U.S. government approval in the form of an export license and may otherwise be subject to tariffs and import/export restrictions. The delay in obtaining required governmental approvals could affect our ability to timely commence a project, and the failure to comply with all such controls could result in fines and other penalties.
We are subject to taxation in many foreign jurisdictions and the final determination of our tax liabilities involves the interpretation of the statutes and requirements of taxing authorities worldwide. Our tax returns are subject to routine examination by taxing authorities, and these examinations may result in assessments of additional taxes, penalties and/or interest.
Our overall success as a global business depends, in part, upon our ability to succeed in differing economic, social and political conditions. We may not continue to succeed in developing and implementing policies and strategies that are effective in each location where we do business, which could negatively affect our profitability.
As a company subject to compliance with the Foreign Corrupt Practices Act (the "FCPA"), our business may suffer because our efforts to comply with U.S. laws could restrict our ability to do business in foreign markets relative to our competitors who are not subject to U.S. law. Additionally, our business plan involves establishing joint ventures with partners in certain foreign markets. Any determination that we or our foreign agents or joint venture partners have violated the FCPA may adversely affect our business and operations.
We and our local partners operate in many parts of the world that have experienced governmental corruption to some degree and, in certain circumstances, strict compliance with anti-bribery laws may conflict with local customs and practices. We may be subject to competitive disadvantages to the extent that our competitors are able to secure business, licenses or other preferential treatment by making payments to government officials and others in positions of influence or using other methods that U.S. law and regulations prohibit us from using.
As a U.S. corporation, we are subject to the regulations imposed by the FCPA, which generally prohibits U.S. companies and their intermediaries from making improper payments to foreign officials for the purpose of obtaining or keeping business. In particular, we may be held liable for actions taken by our strategic or local partners even though our partners are not subject to the FCPA. Any such violations could result in substantial civil and/or criminal penalties and might adversely affect our business, results of operations or financial condition. In addition, our ability to continue to work in the countries discussed above could be adversely affected if we were found to have violated certain U.S. laws, including the FCPA.
24
Our results of operations can be significantly affected by currency fluctuations.
A portion of our revenues is derived in the local currencies of the foreign jurisdictions in which we operate. Accordingly, we are subject to risks relating to fluctuations in currency exchange rates. In the future, and especially as we expand our sales in international markets, our clients may increasingly make payments in non-U.S. currencies. Fluctuations in foreign currency exchange rates could affect our sales, cost of sales and operating margins. In addition, currency devaluation can result in a loss to us if we hold deposits of that currency. Hedging foreign currencies can be difficult, especially if the currency is not actively traded. We cannot predict the effect of future exchange rate fluctuations on our operating results.
A terrorist attack or armed conflict could harm our business.
Some seismic surveys are located in unstable political jurisdictions, including North Africa and the Middle East. Terrorist activities, anti-terrorist efforts and other armed conflicts involving the United States or other countries may adversely affect our ability to work in these markets which could prevent us from meeting our financial and other obligations. These activities could have a direct negative effect on our business in those areas, including loss of life, equipment and data. Costs for insurance and security may increase as a result of these threats, and some insurance coverage may become more difficult to obtain, if available at all.
Our success depends on key members of our management, the loss of any of whom could disrupt our business operations.
The loss of the services of Richard A. Degner, our Chairman, President and Chief Executive Officer, or other key personnel could disrupt our operations which in turn could materially and adversely affect our results of operations.
We may be unable to attract and retain skilled and technically knowledgeable employees, which could adversely affect our business.
Our success depends upon attracting and retaining highly skilled professionals and other technical personnel. A number of our employees are highly skilled scientists and highly trained technicians, and our failure to continue to attract and retain such individuals could adversely affect our ability to compete in the seismic services industry. We may confront significant and potentially adverse competition for these skilled and technically knowledgeable personnel, particularly during periods of increased demand for seismic services. Additionally, at times there may be a shortage of skilled and technical personnel available in the market, potentially compounding the difficulty of attracting and retaining these employees. As a result, our business, results of operations and financial condition may be materially adversely affected.
Our industry has periodically experienced shortages in the availability of equipment. Any difficulty we experience replacing or adding equipment could adversely affect our business.
If the demand for seismic services increases, we may not be able to acquire equipment to replace our existing equipment or add additional equipment. From time to time, the high demand for seismic services has decreased the availability of geophysical equipment, resulting in extended delivery dates on orders of new equipment. If that happens again, any delay in obtaining equipment could delay our implementation of additional or larger crews and restrict the productivity of our existing crews. Our required equipment may not continue to be available to us at costs which allow us to be profitable. A delay in obtaining equipment essential to our operations could have a material adverse effect on our financial condition and results of operations.
25
If we do not manage our recent growth and expansion effectively, our results of operations could be adversely affected.
We have experienced substantial growth to date. This growth has presented a challenge to our systems, processes, resources, personnel, management and other infrastructure and support mechanisms. The following factors could present difficulties to us:
- •
- lack of sufficient executive level and skilled crew personnel;
- •
- increased administrative burden; and
- •
- increased logistical problems common to large, expansive operations.
If we do not manage these growth challenges effectively, our profitability and results of operations could be adversely affected, our management resources may be diverted and our future growth impeded.
We may grow through acquisitions and our failure to properly plan and manage those acquisitions may adversely affect our performance.
We plan to expand not only through organic growth, but through the strategic acquisition of companies and assets. We must plan and manage any acquisitions effectively to achieve revenue growth and maintain profitability in our evolving market. If we fail to manage acquisitions effectively, our results of operations could be adversely affected. Our growth has placed, and is expected to continue to place, significant demands on our personnel, management and other resources. We must continue to improve our operational, financial, management, legal compliance and information systems to keep pace with the growth of our business.
Any future acquisitions could present a number of risks, including but not limited to:
- •
- incorrect assumptions regarding the future results of acquired operations or assets or expected cost reductions or other
synergies expected to be realized as a result of acquiring operations or assets;
- •
- failure to integrate the operations or management of any acquired operations or assets successfully and timely;
- •
- diversion of management's attention from existing operations or other priorities; and
- •
- our inability to secure sufficient financing, on terms we find acceptable, that may be required for any such acquisition or investment.
Our business plan anticipates, and is based upon our ability to successfully complete acquisitions of other businesses or assets. Our failure to do so, or to successfully integrate our acquisitions in a timely and cost effective manner, could have an adverse effect on our business, financial condition or results of operations.
If we fail to maintain proper and effective internal controls, our ability to produce accurate and timely consolidated financial statements could be impaired, which could harm our operating results, our ability to operate our business and investor views of us.
Ensuring that we have adequate internal financial and accounting controls and procedures in place so that we can produce accurate consolidated financial statements on a timely basis is a costly and time-consuming effort that needs to be re-evaluated frequently. Our internal control over financial reporting is a process designed to provide reasonable assurance regarding the reliability of financial reporting and the preparation of consolidated financial statements in accordance with generally accepted accounting principles. We are in the process of documenting, reviewing and improving our
26
internal controls and procedures for compliance with Section 404 of the Sarbanes-Oxley Act of 2002 (the "Sarbanes-Oxley Act"), which requires annual management assessment of the effectiveness of our internal control over financial reporting and a report by our independent auditors addressing this assessment. Both we and our independent auditors will be testing our internal controls in connection with the audit of our consolidated financial statements for the year ending December 31, 2011 and, as part of the testing, identifying areas for further attention and improvement. If we fail to maintain proper and effective internal controls, our ability to produce accurate and timely consolidated financial statements could be impaired, which could harm our operating results, harm our ability to operate our business and reduce the trading price of our stock.
Risks Related to our Indebtedness
Our substantial debt could adversely affect our financial health and prevent us from fulfilling our obligations.
We have a significant amount of debt and may incur substantial additional debt (including secured debt) in the future. The terms of our existing debt agreements limit, but do not prohibit, us from doing so. As of December 31, 2010, we had approximately $209 million of total long-term indebtedness (comprised primarily of our $200 million 101/2% senior notes and under our Revolving Credit Facility), and $35 million available for future borrowings under our Revolving Credit Facility, as described in our "Management's Discussion and Analysis—Liquidity and Capital Resources" section of this Form 10-K. We cannot assure you that we will be able to generate sufficient cash to service our debt or sufficient earnings to cover fixed charges in future years. Increases in outstanding debt above this level will intensify the related risks.
Our substantial debt could have important consequences. In particular, it could:
- •
- increase our vulnerability to general adverse economic and industry conditions;
- •
- require us to dedicate a substantial portion of our cash flow from operations to payments on our indebtedness, thereby
reducing the availability of our cash flow to fund capital expenditures and other general corporate purposes;
- •
- limit our flexibility in planning for, or reacting to, changes in our businesses and the industries in which we operate;
- •
- place us at a competitive disadvantage compared to our competitors that have less debt; and
- •
- limit, along with the financial and other restrictive covenants of our indebtedness, among other things, our ability to borrow additional funds.
Our debt agreements contain restrictive covenants that may limit our ability to respond to changes in market conditions or pursue business opportunities.
The terms of the indenture governing our new notes and our Revolving Credit Facility contain restrictive covenants that limit our ability to, among other things:
- •
- incur or guarantee additional debt;
- •
- pay dividends;
- •
- repay subordinated debt prior to its maturity;
- •
- grant additional liens on our assets;
- •
- enter into transactions with our affiliates;
- •
- repurchase stock;
27
- •
- make certain investments or acquisitions of substantially all or a portion of another entity's business assets; and
- •
- merge with another entity or dispose of our assets.
For example, our Revolving Credit Facility limits the amount of our capital expenditures, including amounts we may spend on our Multi-client library. These capital expenditure limitations may limit our ability to add to our Multi-client library.
In addition, our Revolving Credit Facility requires us, to maintain certain financial ratios and tests. The requirement that we comply with these provisions may materially adversely affect our ability to react to changes in market conditions, take advantage of business opportunities we believe to be desirable, obtain future financing, fund needed capital expenditures or withstand a continuing or future downturn in our business.
If our lenders foreclose on their security interests in our assets, they will have the right to sell those assets in order to satisfy our obligations to them.
Our obligations under our Revolving Credit Facility are, secured by a lien on substantially all of our assets including the equity interests in our material subsidiaries. In the event of foreclosure, liquidation, bankruptcy or other insolvency proceeding relating to us or our subsidiaries that have guaranteed our debt, holders of this secured indebtedness will have prior claims with respect to substantially all of our assets. There can be no assurance that we would receive any proceeds from a foreclosure sale of our assets that constitute collateral following the satisfaction of the secured lenders' priority claims.
If we are unable to comply with the restrictions and covenants in our existing debt agreements and other current and future debt agreements, there could be a default under the terms of such agreements, which could result in an acceleration of repayment.
If we are unable to comply with the restrictions and covenants in our existing debt agreements or in future debt agreements, there could be a default under the terms of these agreements. Our ability to comply with these restrictions and covenants, including meeting financial ratios and tests, may be affected by events beyond our control. As a result, we cannot assure you that we will be able to comply with these restrictions and covenants or meet such financial ratios and tests. In the event of a default under these agreements, lenders could terminate their commitments to lend or accelerate the loans and declare all amounts borrowed due and payable. Borrowings under other debt instruments that contain cross-acceleration or cross-default provisions may also be accelerated and become due and payable. If any of these events occur, our assets might not be sufficient to repay in full all of our outstanding indebtedness and we may be unable to find alternative financing. Even if we could obtain alternative financing, it might not be on terms that are favorable or acceptable to us. Additionally, we may not be able to amend our debt agreements or obtain needed waivers on satisfactory terms.
To service our indebtedness, we require a significant amount of cash, and our ability to generate cash will depend on many factors beyond our control.
Our ability to make payments on and to refinance our indebtedness, and to fund planned capital expenditures depends in part on our ability to generate cash in the future. This ability is, to a certain extent, subject to general economic, financial, competitive, legislative, regulatory and other factors that are beyond our control.
We cannot assure that we will generate sufficient cash flow from operations, that we will realize operating improvements on schedule or that future borrowings will be available to us in an amount sufficient to enable us to service and repay our indebtedness or to fund our other liquidity needs. If we
28
are unable to satisfy our debt obligations, we may have to undertake alternative financing plans, such as refinancing or restructuring our indebtedness, selling assets, reducing or delaying capital investments or seeking to raise additional capital. We cannot assure that any refinancing or debt restructuring would be possible or, if possible, would be completed on favorable or acceptable terms, that any assets could be sold or that, if sold, the timing of the sales and the amount of proceeds realized from those sales would be favorable to us or that additional financing could be obtained on acceptable terms. Disruptions in the capital and credit markets, such as those experienced during 2008 and 2009, could adversely affect our ability to meet our liquidity needs or to refinance our indebtedness, including our ability to borrow under our Revolving Credit Facility. Banks that are party to our Revolving Credit Facility may not be able to meet their funding commitments to us if they experience shortages of capital and liquidity or if they experience excessive volumes of borrowing requests from us and other borrowers within a short period of time.
Increases in interest rates would adversely affect our results of operations.
Our Revolving Credit Facility is subject to floating interest rates which vary in line with movements in short-term interest rates. As a result, our interest expenses may increase significantly if short-term interest rates increase.
Item 1B. Unresolved Staff Comments
None.
We own a building complex in the greater metropolitan Houston, Texas area that we use as our corporate headquarters. Our headquarters consists of office and warehouse space totaling approximately 92,000 square feet.
In addition, at the end of 2010, we were registered to do business and, in certain locations, leased administrative offices, sales offices, data processing centers, research centers, warehouses or equipment repairing centers in the United States in cities such as Dallas (Texas), Missouri City (Texas), Stafford (Texas) and Denver (Colorado), as well as throughout the world in countries such as Algeria, Argentina, Belize, Brazil, Brunei, Canada, Cayman Islands, Chile, Colombia, Cook Islands, Ecuador, Georgia, India, Iraq, Isle of Man, Kurdistan, Libya, Mexico, Nigeria, Oman, Peru, Russia, Saudi Arabia, Trinidad and Tobago, Tunisia, and Venezuela.
We believe that our existing facilities are well maintained, suitable for their intended use, and adequate to meet our current and future operating requirements, but we may also seek to expand our facilities from time to time.
We are subject to periodic lawsuits, arbitrations, investigations, disputes and claims, including environmental claims and employee related matters, arising in the ordinary conduct of our business. Although we cannot predict with certainty the ultimate resolution of lawsuits, investigations and claims asserted against us, we do not believe that any currently pending legal proceedings to which we are a party will have a material adverse effect on our business, results of operations, cash flows or financial condition.
We sometimes experience disagreements or disputes with our customers relating to our charges. As of December 31, 2010, we had disputes with certain customers which relate to our charges for our services. If the amount we ultimately recover with respect to any of these disputes is less than the revenue previously recorded, the difference will be recorded as an expense. None of these are expected to have a material adverse effect on our earnings.
29
Item 5. Market for Registrant's Common Equity, Related Stockholder Matters and Issuer Purchases of Equity Securities
As of March 10, 2011, there were 36,479,635 shares of common stock of Global Geophysical Services, Inc. outstanding and 384 stockholders of record. Our common stock is listed on the NYSE, where it is traded under the symbol "GGS".
The following table sets forth the high and low closing prices for the common stock of Global Geophysical Services, Inc. since our common stock began trading on April 22, 2010, as reported by the NYSE for the period shown. The following quotations reflect inter-dealer prices, without retail mark-up, mark-down or commission and may not represent actual transactions.
Quarter Ended
|
High | Low | |||||
|---|---|---|---|---|---|---|---|
June 30, 2010 |
$ | 12.00 | $ | 6.97 | |||
September 30, 2010 |
$ | 8.09 | $ | 5.91 | |||
December 31, 2010 |
$ | 10.40 | $ | 6.98 | |||
We have never paid cash dividends on our common stock, and the Board of Directors intends to retain all of our earnings, if any, to finance the development and expansion of our business. There can be no assurance that our operations will prove profitable to the extent necessary to pay cash dividends. Moreover, even if such profits are achieved, the future dividend policy will depend upon our earnings, capital requirements, financial condition, debt covenants and other factors considered relevant by our Board of Directors.
Securities Authorized for Issuance under Equity Compensation Plans
The following table summarizes certain information regarding securities authorized for issuance under our equity compensation plans as of December 31, 2010. In July 2006, our Board of Directors and Stockholders adopted the Global Geophysical Services, Inc. 2006 Incentive Compensation Plan. See information regarding material features of the plan in Note 12, "Stock-Based Compensation" to the Consolidated Financial Statements included herein.
Plan Category
|
Number of Securities to be Issued Upon Exercise of Outstanding Options |
Weighted-Average Exercise Price of Outstanding Options |
Number of Securities Remaining Available for Future Issuance Under Equity Compensation Plans (Excluding Securities Reflected in Column (a)) |
|||||||
|---|---|---|---|---|---|---|---|---|---|---|
| |
(a) |
(b) |
(c) |
|||||||
Equity compensation plans approved by security holders |
2,884,100 | $ | 22.93 | 5,393,163 | ||||||
Equity compensation plans not approved by security holders |
— | — | — | |||||||
Total |
2,884,100 | $ | 22.93 | 5,393,163 | ||||||
Stock Performance Graph
The following graph compares the cumulative eight-month total return provided stockholders on Global Geophysical Services, Inc.'s common stock relative to the cumulative total returns of the S&P 500 Index and a peer group made up of companies in the PHLX Oil Service Sector Index. The PHLX Oil Service Sector Index consists of far larger companies that perform a variety of services as compared to land-based acquisition and processing of seismic data performed by us.
30
The following graph and related information shall not be deemed "soliciting material" or to be "filed" with the SEC, nor shall such information be incorporated by reference into any future filing under the Securities Act of 1933 or the Securities Exchange Act of 1934, except to the extent that Global Geophysical Services, Inc. specifically incorporates it by reference into such filing.
Comparison of Eight Month Cumulative Total Return*
Among Global Geophysical Services, Inc., the S&P 500 Index and the PHLX Oil Service Sector Index
Comparison of Total
Returns
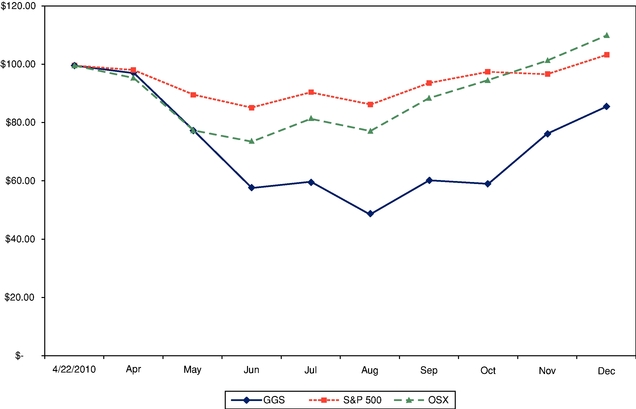
- *
- Assumes $100 was invested on April 22, 2010 in stock or index, including reinvestment of dividends. The stock price performance included in this graph is not necessarily indicative of future stock price performance
31
Sales of Unregistered Securities and Stock Repurchases*
During the year ended December 31, 2010, we made the following purchases of our common stock, which is registered pursuant to Section 12(b) of the Exchange Act of 1934.
| |
Total Number of Shares Purchased |
Price Paid Per Share |
Total Number of Shares Purchased as Part of Publicly Announced Plans or Programs |
Maximum Number of Shares that May Yet Be Purchased |
|||||||||
|---|---|---|---|---|---|---|---|---|---|---|---|---|---|
May 27, 2010 |
83,333 | $ | 15.00 | 0 | 46,794 | ||||||||
October 15, 2010 |
10,900 | $ | 6.16 | 0 | 0 | ||||||||
Total |
94,233 | N/A | 0 | 46,794 | |||||||||
- *
- The purchases of shares indicated above were related to separation agreements with certain employees.
32
Item 6. Selected Financial Data
SELECTED FINANCIAL INFORMATION
The following table presents our summary historical financial data for the periods indicated. The data for the years ended December 31, 2010, 2009, 2008, 2007 and 2006 have been derived from our audited financial statements. The financial data for the years ended December 31, 2010, 2009 and 2008 are included elsewhere in this filing. For further information that will help you better understand the summary data, you should read this financial data in conjunction with "Management's Discussion and Analysis of Financial Condition and Results of Operations" and the consolidated financial statements and related notes and other financial information included elsewhere in this Form 10-K. These historical results are not necessarily indicative of results to be expected for any future periods.
| |
Year Ended December 31, | |||||||||||||||||
|---|---|---|---|---|---|---|---|---|---|---|---|---|---|---|---|---|---|---|
| |
2010 | 2009 | 2008 | 2007 | 2006 | |||||||||||||
| |
(in thousands) |
|||||||||||||||||
Statement of Operations Data: |
||||||||||||||||||
Revenues(1) |
$ | 254,705 | $ | 312,796 | $ | 376,256 | $ | 225,742 | $ | 83,577 | ||||||||
Operating expenses |
225,327 | 262,168 | 319,451 | 188,702 | 66,717 | |||||||||||||
Gross profit |
29,378 | 50,628 | 56,805 | 37,040 | 16,860 | |||||||||||||
Selling, general and administrative expenses |
40,387 | 32,300 | 30,190 | 18,684 | 9,147 | |||||||||||||
Income (loss) from operations |
(11,009 | ) | 18,328 | 26,615 | 18,356 | 7,713 | ||||||||||||
Interest expense, net |
(21,269 | ) | (18,613 | ) | (22,384 | ) | (10,745 | ) | (3,752 | ) | ||||||||
Other income (expense), net(2) |
(6,676 | ) | 1,023 | (6,250 | ) | (233 | ) | (125 | ) | |||||||||
Income (loss) before income taxes |
(38,954 | ) | 738 | (2,019 | ) | 7,378 | 3,836 | |||||||||||
Income tax expense |
600 | 293 | 6,027 | 4,941 | 1,934 | |||||||||||||
Income (loss) after Taxes |
(39,554 | ) | 445 | (8,046 | ) | 2,437 | 1,902 | |||||||||||
Net Income, attributable to noncontrolling interests |
162 | — | — | — | — | |||||||||||||
Net Income (Loss), attributable to common shareholders |
$ | (39,716 | ) | $ | 445 | $ | (8,046 | ) | $ | 2,437 | $ | 1,902 | ||||||
Earnings per share: |
||||||||||||||||||
Basic |
$ | (1.44 | ) | $ | 0.05 | $ | (0.98 | ) | $ | 0.29 | $ | 0.22 | ||||||
Diluted(3) |
(1.44 | ) | 0.02 | (0.98 | ) | 0.09 | 0.08 | |||||||||||
Weighted average shares outstanding |
||||||||||||||||||
Basic |
27,517 | 8,188 | 8,174 | 8,369 | 8,772 | |||||||||||||
Diluted(3) |
27,517 | 28,788 | 8,174 | 28,612 | 24,197 | |||||||||||||
Ratio of earnings to fixed charges(4) |
— | 1.03 | — | 1.43 | 1.67 | |||||||||||||
Cash Flows Data: |
||||||||||||||||||
Cash flows provided by (used in) operating activities |
$ | 115,842 | $ | 80,396 | $ | 41,113 | $ | 12,956 | (2 | ) | ||||||||
Cash flows used in investing activities |
(212,732 | ) | (53,280 | ) | (84,699 | ) | (83,554 | ) | (73,494 | ) | ||||||||
Cash flows provided by (used in) financing activities |
108,101 | (40,534 | ) | 57,110 | 51,011 | 104,819 | ||||||||||||
Balance Sheet Data: |
||||||||||||||||||
Cash and cash equivalents(5) |
$ | 28,237 | $ | 17,027 | $ | 30,444 | $ | 16,920 | $ | 36,507 | ||||||||
Total assets |
413,267 | 316,620 | 329,652 | 253,444 | 172,648 | |||||||||||||
Total debt, including capital leases(6) |
218,344 | 171,953 | 213,990 | 130,366 | 63,979 | |||||||||||||
Total liabilities |
311,410 | 252,691 | 267,042 | 183,399 | 97,034 | |||||||||||||
Total stockholders' equity |
101,857 | 63,928 | 62,610 | 70,045 | 75,613 | |||||||||||||
- (1)
- Includes $134.9 million, $24.5 million and $25.0 million in recognized revenues generated from Multi-client services in the years ended December 31, 2010, 2009 and 2008, respectively.
33
- (2)
- Includes
unrealized gain (loss) on derivative instruments, foreign exchange gain (loss), loss on extinguishment of debt, other income (expense) and gains
and losses on sales of assets.
- (3)
- For
the years 2010 and 2008, diluted and basic are the same due to the net loss for those years.
- (4)
- The
ratio of earnings to fixed charges was computed by dividing the sum of our earnings before income taxes and fixed charges by fixed charges. Fixed
charges consist of all interest and one third of the total of rent, marketing data services, maintenance and equipment rental expenses (considered representative of the interest factor). For the year
ended December 31, 2010 there was a coverage deficiency of $39 million.
- (5)
- Cash
and cash equivalents do not include restricted cash investments of approximately $2.4, $5.3 million, $7.6 million, $2.4 million
and $0 at December 31, 2010, 2009, 2008, 2007 and 2006, respectively.
- (6)
- Excludes unamortized original issue discount of approximately $5.6 million, $2.1 million, $2.4 million, $0 and $0 at December 31, 2010, 2009, 2008, 2007, 2006.
Item 7. Management's Discussion and Analysis of Financial Condition and Results of Operation
The following discussion and analysis of our financial condition and results of operations should be read in conjunction with the "Selected Financial Information" section of this annual report and our consolidated financial statements and the related notes and other financial information included elsewhere in this annual report. In addition to historical financial information, the following discussion and analysis contains forward-looking statements that involve risks, uncertainties, and assumptions. Our actual results and timing of selected events may differ materially from those anticipated in these forward-looking statements as a result of many factors, including those discussed under "Risk Factors" and elsewhere in this annual report, which are incorporated herein by reference.
Overview
We provide an integrated suite of seismic data solutions to the global oil and gas industry, including our high resolution RG-3D Reservoir Grade™ ("RG3D") seismic solutions. Our seismic data solutions consist primarily of seismic data acquisition, microseismic monitoring, data processing and interpretation services. Through these services, we deliver data that enable the creation of high resolution images of the earth's subsurface and reveal complex structural and stratigraphic details. These images are used primarily by oil and gas companies to identify geologic structures favorable to the accumulation of hydrocarbons, to reduce risk associated with oil and gas exploration, to optimize well completion techniques and to monitor changes in hydrocarbon reservoirs. We integrate seismic survey design, data acquisition, processing and interpretation to deliver enhanced services to our clients. In addition, we own and market a growing seismic data library and license this data to clients on a non-exclusive basis.
We provide seismic data acquisition for land, transition zone and shallow marine areas, including challenging environments such as marshes, forests, jungles, arctic climates, mountains and deserts worldwide. Our management team has significant operational experience in most of the major U.S. shale plays, including the Haynesville, Barnett, Bakken, Fayetteville, Eagle Ford and Woodford, where we believe our high resolution RG3D seismic solutions are particularly well-suited.
Our seismic solutions are used by many of the world's largest and most technically advanced oil and gas exploration and production companies, including national oil companies ("NOCs") such as Oil and Natural Gas Corporation Limited ("ONGC") and Ecopetrol S.A. ("Ecopetrol"), major integrated oil and gas companies ("IOCs") such as BP p.l.c. ("BP"), ConocoPhillips Company ("ConocoPhillips") and Exxon Mobil Corporation ("ExxonMobil"), and independent oil and gas exploration and production companies such as Anadarko Petroleum Corporation ("Anadarko"), Apache Corporation, and Chesapeake Energy Corporation ("Chesapeake").
34
We currently own approximately 162,000 recording channels. Our recording channels and systems are interoperable providing operational scalability and efficiency, enabling us to execute on large and technologically complex projects.
We primarily generate revenues by providing Proprietary Services and Multi-client Services to our clients. Our Proprietary Services generate revenues by conducting geophysical surveys for our clients on a contractual basis where our clients generally acquire all rights to the seismic data obtained through such survey. We also generate revenues by providing microseismic monitoring, data processing and interpretation services. Our Multi-client Services generate revenues by selling licenses, on a non-exclusive basis, to data we own as a part of our seismic data library.
Key Accomplishments
We have grown at a rapid pace since commercial operations began in May 2005, finishing 2010 with $254.7 million in revenues. During this period, we continued to expand not only our operational capabilities but also our service offerings to include land, transition zone and shallow marine seismic data acquisition, processing and interpretation services and Multi-client Services. Other recent highlights include:
- •
- Cash flow from Operations was $115.8 million in 2010 compared to $80.4 million in 2009.
- •
- Increasing our backlog to approximately $265 million as of December 31, 2010 compared to $153 million
as of December 31, 2009.
- •
- Increasing our Seismic Data Library to approximately 3,700 square miles as of December 31, 2010 compared with
approximately 900 square miles as of the end of year 2009.
- •
- Launching our Brazilian operations during 2010 with a program for Petra Energia S.A for an onshore seismic data acquisition project in the São Francisco Basin of Minas Gerais, Brazil.
How We Generate Our Revenues
We generate revenues by providing Proprietary Services and Multi-client Services to our clients. Proprietary Services revenues represented 47% and 92% of our revenues for the years ended December 31, 2010 and December 31, 2009, respectively. Multi-client Services revenues represented 53% and 8% of our revenues for the years ended December 31, 2010 and December 31, 2009, respectively.
Proprietary Services. We generate revenues by conducting geophysical surveys for our clients on a contractual basis where our clients generally acquire all rights to the seismic data obtained through such survey. We also generate revenues by providing microseismic monitoring, data processing and interpretation services.
Most of our Proprietary Services, microseismic monitoring, data processing and interpretation services business is obtained through competitive bidding. We generally require approximately 30 days of preparation and diligence in order to prepare and submit a bid in response to a request for proposal. In certain circumstances, various factors, such as the difficulty of the terrain involved or remoteness of the survey area, may require considerably more time to prepare and submit a bid. Our clients usually ask us to quote a "turnkey" rate for each completed unit of recorded data, or they may ask for a "term rate" bid. When we perform work on a turnkey basis a defined amount and scope of work is provided by us for a fixed price and extra work, which is subject to client approval, is billed separately, whereas when we perform work on a term rate basis, one of our seismic crews is hired for a fixed fee per day. Current market conditions drive our portfolio of outstanding contracts in terms of pricing (turnkey, term rate or a combination of the two). We also enter into contracts that combine different pricing elements, such as a term rate contract with bonus incentives for early completion or
35
achievement of certain performance metrics to maximize the economic incentives for both us and our client.
We have entered into master service agreements with many of our clients. These agreements specify payment terms, establish standards of performance and allocate certain operational risks through indemnity and related provisions and are supplemented on a project-by-project basis with pricing terms and other project-specific terms. Revenues from our Proprietary Services segment are recognized when they are realizable and earned as services are performed based on the proportionate performance method. We defer unearned revenues until earned, and recognize losses in full when they occur.
Our contracts typically provide that we remain responsible for the majority of costs and expenses associated with a particular project. We seek to manage the risk of delays through the inclusion of "standby rate" provisions. These provisions are included in most of our contracts and require payment to us of a reduced rate for a limited amount of time if we are unable to record seismic data as a result of weather conditions or certain other factors outside our control. The pricing for any Proprietary Services, microseismic monitoring, data processing and interpretation services project is primarily determined by the data quality requirement, resolution, program parameters, complexity and conditions including the timing, location and terrain and equipment required to complete the project.
Multi-client Services. We generate Multi-client revenues by granting a license to seismic data. This allows our clients to have access to seismic data at a cost that is generally less than acquiring data on a proprietary basis. We believe that revenues from our Multi-client Services will continue to grow as a percentage of our U.S. revenues. Our Multi-client Services differ from our Proprietary Services projects in that we set the specifications of the program, generally handle all aspects of the seismic data acquisition and maintain ownership of the seismic data and its corresponding revenue stream. The seismic data sets that we have acquired through our Multi-client Services are included in our seismic data library.
Revenues under our arrangements are generated as pre-funding commitments ("pre-commitments"), late sales and/or data swaps, or a combination thereof, from the licensing of Multi-client data. The terms of the license typically set pricing on a per square mile basis, specify a defined survey area, and include limitations on transferability of the underlying data. We retain ownership of the seismic data acquired and licensed in Multi-client Services which remains available for late sales. Generally, we target pre-commitments of approximately 80% of our expected investment in the program. We may receive additional cash amounts as certain project milestones are reached. The cash inflows from these payments generally correspond to the timing of our cash expenses on a project.
We believe that offering seismic data acquisition projects in a Multi-client structure and licensing the data from our library is not only an effective business strategy in times of high capital spending, but also during times of industry-wide reductions in capital expenditures. The efficiencies we create by acquiring Multi-client seismic surveys allow oil and gas exploration companies to acquire seismic data at a lower cost. The Multi-client library also offers clients the opportunity to acquire data over a larger area than would otherwise be readily available to them. By acquiring data that relates to areas beyond the scope of their current holdings, our clients are better able to understand the attributes of the subsurface formations contained in their current holdings. This additional data also may assist our clients in assessing whether to acquire adjacent as yet not leased properties. Additionally, by purchasing a final product, our clients avoid the risk of incurring cost over-runs or liability as a result of the occupational health and safety hazards inherent in the process of seismic data acquisition.
36
The following table summarizes data for our Multi-client Services:
| |
Year Ended December 31, | |||||||||
|---|---|---|---|---|---|---|---|---|---|---|
| |
2010 | 2009 | 2008 | |||||||
Multi-client Services revenue |
$ | 134.9 | $ | 24.5 | $ | 25.0 | ||||
Cash investment |
170.8 |
34.4 |
25.2 |
|||||||
Capitalized depreciation(1) |
20.4 | 3.7 | 3.0 | |||||||
Non-cash data exchange |
10.0 | 8.9 | — | |||||||
Total Investment in Multi-client library |
$ | 201.2 | $ | 47.0 | $ | 28.2 | ||||
| |
December 31, | |||||||||
|---|---|---|---|---|---|---|---|---|---|---|
| |
2010 | 2009 | 2008 | |||||||
Cumulative total investment in Multi-client Services |
$ | 276.4 | $ | 75.2 | $ | 28.2 | ||||
Less: accumulated amortization of Multi-client library assets |
130.5 | 37.8 | 19.1 | |||||||
Multi-client net book value (at period end) |
$ | 145.9 | $ | 37.4 | $ | 9.1 | ||||
- (1)
- Represents capitalized cost of the equipment owned and leased by us and utilized in connection with a Multi-client seismic shoot.
How We Evaluate Our Operations
We evaluate our land, transition zone and shallow marine projects on a project basis and as a whole using similar performance metrics. In addition, our management utilizes a variety of financial and productivity metrics to analyze and monitor our performance. These metrics include, but are not limited to, the following:
- •
- safety performance rates;
- •
- selling, general and administrative expenses ("SG&A") as a percentage of revenues;
- •
- our EBIT in absolute terms and as a percentage of revenues; and
- •
- the level of pre-commitment funding for our Multi-client projects.
The information generated using the foregoing metrics is an important part of our operational analysis. We apply these metrics to monitor operations separately for each of our projects and analyze trends to determine the relative performance of each. We seek to have strong centralized financial analysis and controls to allocate our crews, combined with local decision-making and flexibility in the delivery of services to maximize client satisfaction.
Recent Trends Affecting Our Business
The seismic data services industry historically has been cyclical. Volatility in oil and gas prices can produce significant changes in the demand for seismic services and the prices seismic contractors can negotiate for their services. Oil and gas exploration, development, exploitation and production spending levels traditionally have been heavily influenced by expected future prices of oil and natural gas. Prior to mid-2008, the oil and gas industry saw significant increases in activity resulting from high commodity prices for oil and natural gas. We benefited from this increased spending.
However, during the period from mid-2008 through mid-2009, oil and natural gas prices declined significantly, which resulted in significant curtailments in capital expenditures by independent oil and gas companies, including spending for seismic data acquisition services. Accordingly, we experienced a decline in the revenues of our business.
37
More recently, in connection with increases in crude price levels, there have been planned increases in capital expenditures by oil and gas companies throughout the world. We expect the increases in capital expenditure spending to result in increased demand for seismic services.
Within the North American market, we have continued to observe a trend toward seismic data programs being focused on unconventional resource plays (shales). We believe that a continuation of that trend will result in seismic services contracts being structured on a Multi-client basis. We have not yet observed a similar trend in overseas markets where we currently expect proprietary services will continue to constitute the majority of the services we provide.
Financial Operations Overview
Revenues. A portion of our revenues are generated from either large projects or multiple projects from a limited number of clients. As a result, a small number of clients typically represent a significant amount of our revenues in any particular period. For the year ended December 31, 2010, we had one client which represented more than 10% of our revenues. Because we work on different projects for various clients on a regular basis, it is not uncommon for our top clients to change from year to year.
The table below presents for the years ended December 31, 2010, 2009 and 2008, our revenue concentration in our clients, representing 10% or more of our revenues.
| |
Year Ended December 31, |
|||||||||
|---|---|---|---|---|---|---|---|---|---|---|
% of Total Revenues
|
2010 | 2009 | 2008 | |||||||
Largest client |
16 | % | 37 | % | 13 | % | ||||
Second largest client(1) |
9 | % | 16 | % | 11 | % | ||||
Third largest client(1) |
9 | % | 11 | % | 9 | % | ||||
Top three clients |
34 | % | 64 | % | 33 | % | ||||
- (1)
- Less than 10% presented for comparison purposes in this table.
Revenues generated from our international operations are primarily attributable to providing Proprietary Services. Since December 31, 2007, the percentage of revenues that we derive from international operations has increased from 30% for the year ended December 31, 2007 to 43% for the year ended December 31, 2010. We believe the international seismic data services market continues to provide significant growth opportunities.
Operating Expenses. Our operating expenses are primarily a function of our seismic data recording crew count, make-up and utilization levels on a project-by-project basis. Our productivity depends largely on the equipment utilized, seismic survey design, operating efficiency and external factors such as weather and third party delays. Our seismic data acquisition services are performed outdoors and are therefore subject to seasonality. Shorter winter days, competing uses of land and adverse weather negatively affects our ability to provide services in certain regions. In order to minimize the effect of seasonality on our assets, we have diversified our operations in a manner such that our equipment is mobile between regions and countries and our common-platform equipment also works to improve crew productivity by allowing us to move equipment and people between crews as needed with minimal compatibility issues. Certain costs, such as equipment rentals and leases, depreciation, certain labor, some repair and maintenance, and interest payments, are fixed and are incurred regardless of utilization, and account for a significant percentage of our costs and expenses. Accordingly, downtime or low productivity resulting from weather interruptions, reduced demand, equipment failures or other causes can result in significant operating losses, which affects our profitability.
38
SG&A. SG&A expenses increased as a result of becoming a public company along with the addition of personnel and expenses to facilitate the company's growth, such as that the SG&A expenses at the end of 2010, 2009 and 2008 were $40.4 million, $32.3 million and $30.2 million, respectively. Increased costs attributable to becoming a public company include the cost of increased accounting support services, filing annual and quarterly reports with the SEC, investor relations, directors' expenses, directors' and officers' insurance and registrar and transfer agent fees, which we expect to continue to incur on an ongoing basis. As we made our initial public offering of securities in the second quarter of 2010, our consolidated financial statements for the year ended 2010 reflect the effect of a portion of these increased expenses and affect the comparability of our consolidated financial statements for prior periods.
Taxes. Our effective tax rate has varied widely in prior periods, and has trended significantly higher than the U.S. federal statutory tax rate of 35% for a number of reasons, including state income tax liabilities, the disallowance of certain contractor per-diem payments and other expenses for tax purposes, and valuation allowances provided for losses incurred in certain foreign jurisdictions. In addition, as a result of our operations in various foreign jurisdictions, we are subject to a number of different tax regimes that have significantly affected our effective tax rates in some cases. For example, in some countries we are subject to a withholding tax on our revenues regardless of our profits.
We expect that our overall effective tax rate in future periods will generally trend modestly higher than the U.S. federal statutory rate. However, we cannot assure you that our effective tax rate will decline. We could experience significantly higher effective rates in different periods as a result of the factors described above.
As of December 31, 2010, we had approximately $91.5 million in U.S. net operating loss ("NOL") carry forwards and foreign NOL carry forwards of $57.2 million. The U.S. NOLs have a carry forward period of 20 years and expire in 2028 through 2030 if not utilized. The foreign NOLs have carry forward periods of up to 10 years, with the earliest expiration in 2012.
Gross Profit Margin. Our gross profit margins for the years ended December 31, 2010, 2009 and 2008 were 12%, 16% and 15%, respectively. The gross profit margin decrease in 2010 is primarily attributable to lower revenue base against the two previous years. The margins from our international operations has been adversely affected by the initial costs associated with the development and expansion of our international operations, such as the establishment of branch offices, marketing alliances and the mobilization of equipment and personnel to overseas locations. In addition, equipment failures and additional regulatory requirements have contributed to lower margins for our international operations. Although the profitability of our international operations will continue to be adversely affected by factors not present in our domestic operations, we believe the profitability of our international operations will increase as we complete the expenditures necessary to establish our international operations.
Backlog. Our backlog consists of contracted seismic data acquisition and Multi-client unrecognized pre-commitments. Our estimated backlog as of December 31, 2010 was approximately $265 million as compared to approximately $153 million as of December 31, 2009. Backlog estimates are based on a number of assumptions and estimates including assumptions related to foreign exchange rates and proportionate performance of contracts and our valuation of assets, such as seismic data, to be received by us as payment under certain agreements. The realization of our backlog estimates are further affected by our performance under term rate contracts, as the early or late completion of a project under term rate contracts will generally result in decreased or increased, as the case may be, revenues derived from these projects. Contracts for services are occasionally modified by mutual consent and may be cancelable by the client under the circumstances described in "Business—Narrative Description of Business—Service Contracts." Consequently, backlog as of any particular date may not be indicative of actual operating results for any future period. See "Risk Factors—Our backlog
39
estimates are based on certain assumptions and are subject to unexpected adjustments and cancellations and thus may not be timely converted to revenues in any particular fiscal period, if at all, or be indicative of our actual operating results for any future period."
Critical Accounting Policies and Estimates
Our discussion and analysis of our financial condition and results of operations is based upon our consolidated financial statements, which have been prepared in accordance with accounting principles generally accepted in the United States. The preparation of the consolidated financial statements requires management to make estimates and judgments that affect the reported amounts of assets, liabilities, revenues and expenses, and related disclosure of contingent assets and liabilities, such as backlog. We continually evaluate our judgments and estimates in determining our financial condition and operating results. Estimates are based upon information available as of the date of the consolidated financial statements and, accordingly, actual results could differ from these estimates, sometimes materially. Critical accounting policies and estimates are defined as those that are both most important to the portrayal of our financial condition and operating results and require management's most subjective judgments. The most critical accounting policies and estimates are described below.
Revenue Recognition
Proprietary Services. Our Proprietary Services are provided under cancelable service contracts, which vary in terms and conditions. We recognize revenue in accordance with the terms of the contract. These contracts are "turnkey" or "term" agreements or a combination of the two. Under turnkey agreements, we recognize revenue based upon quantifiable measures of progress, such as square miles or linear kilometers of data acquired. Under term agreements, period revenue is recognized on a day-rate basis. Under certain contracts where the client pays separately for the mobilization of equipment to the project site, we recognize these mobilization fees as revenue during the performance of the seismic acquisition, using the same quantifiable measures of progress as for the acquisition work. We also receive reimbursements for certain other out-of-pocket expenses under the terms of our service contracts. We record amounts billed to clients in revenues as the gross amount including out-of-pocket expenses that are reimbursed by the client. In some instances, customers are billed in advance of services performed which we recognize as deferred revenues.
Multi-client Services. Revenues are recorded under our arrangements from the licensing of our Multi-client data as pre-commitments, late sales and/or data swap transactions. Once a contract is signed, it will be classified as a pre-commitment, or a late sale and the entire contract will follow revenue recognition as transcribed below.
Revenues from the creation of our multi-client projects are recognized when (i) we have an arrangement with the customer that is validated by a signed contract, (ii) the sales price is fixed and determinable, (iii) collection is reasonably assured, and (iv) delivery, as defined in the below paragraph, has occurred. When the above criteria has been satisfied, we recognize revenue using the proportionate performance method based upon quantifiable measures of progress such as square mile or linear kilometer of data acquired.
Revenues associated from a data swap transaction are recognized as a pre-commitment or late sale when (i) we have an arrangement with the customer that is validated by a signed contract, (ii) the value is determined according to GGS policy, and (iii) the asset exchanged for has been received. Delivery is defined as "data is made available to the customer to view".
If the data is subject to any incremental processing, we hold back a portion of the revenue to be recognized upon the delivery of the processed data to the customer. This hold back is calculated as a percentage of the data processing cost remaining to complete over the entire cost of the project.
40
Pre-Commitment Revenues. Pre-Commitments represent one classification of Multi-client revenue. Pre-commitment revenues are contractual obligations whereby a client commits funds in advance of our acquisition of seismic data. In return for these pre-commitments, our clients typically have some input with respect to project specifications and receive preferential pricing. We record pre-commitment payments as deferred revenue when they are received and record them as revenue on the basis of proportionate performance.
Late Sale Revenues. Late Sales represent another classification of Multi-Client revenues. For any contract, if all or any portion of the data has been acquired by the company and it can be made available to view by the customer, it will be classified as a late sale. For late sale contracts any portion associated with data which has not been acquired will be deferred and recognized as revenue on the basis of proportionate performance.
We establish amortization rates based on the estimated future revenues (both from pre-commitments and late sales) on an individual survey basis. The underlying estimates that form the basis for the sales forecast depend on historical and recent revenue trends, oil and gas prospectively in particular regions, general economic conditions affecting our customer base, expected changes in technology and other factors. The estimation of future cash flows and fair value is highly subjective and inherently imprecise. Estimates can change materially from period to period based on many factors, including those described in the preceding paragraph. Accordingly, if conditions change in the future, an impairment loss may be recorded relative to the seismic data library, which could be material to any particular reporting period. However, under no circumstance will an individual survey carry a net book value greater than a four-year straight-line amortized value. This is accomplished by comparing the cumulative amortization recorded for each survey to the cumulative straight-line amortization. If the cumulative straight-line amortization is higher for any specific survey, additional amortization expense is recorded, resulting in accumulated amortization being equal to the cumulative straight-line amortization for such survey. Amortization expense of the Multi-client seismic data was $92.7 million, $18.7 million and $19.1 million for the years ended December 31, 2010, 2009 and 2008, respectively.
Allowance for Doubtful Accounts. We estimate our allowance for doubtful accounts receivable (billed and unbilled) based on our past experience of historical write-offs, our current client base and our review of past due accounts. However, the inherent volatility of the energy industry's business cycle can cause swift and unpredictable changes in the financial stability of our clients.
Impairment of Long-lived Assets. In accordance with current guidance for accounting for impairment or disposal of long-lived assets, we evaluate the recoverability of property and equipment and our Multi-client data library if facts and circumstances indicate that any of those assets might be impaired. If an evaluation is required, the estimated future undiscounted cash flows associated with the asset are compared to the asset's carrying amount to determine if an impairment of such property and Multi-client data library is necessary. The effect of any impairment would be to expense the difference between the fair value of such property and its carrying value.
For the Multi-client data library, the impairment evaluation is based first on a comparison of the undiscounted future cash flows over each component's remaining estimated useful life with the carrying value of each library component. If the undiscounted cash flows are equal to or greater than the carrying value of such component, no impairment is recorded. If undiscounted cash flows are less than the carrying value of any component, the forecast of future cash flows related to such component is discounted to fair value and compared with such component's carrying amount. The difference between the library component's carrying amount and the discounted future value of the expected revenue stream is recorded as an impairment charge. There were no impairment charges recognized in the statements of operations during the years ended December 31, 2010, 2009 and 2008.
41
Depreciable Lives of Property, Plant and Equipment. Our property, plant and equipment are capitalized at historical cost and depreciated over the useful life of the asset. Our estimation of the useful life of a particular asset is based on circumstances that exist in the seismic industry and information available to our management at the time of the purchase of the asset. The technology of the equipment used to gather data in the seismic industry has historically evolved such that obsolescence does not occur quickly. As circumstances change and new information becomes available these estimates could change. We amortize these capitalized items using the straight-line method. Capital assets are depreciated over one to ten years depending on the classification of the asset.
Tax Accounting. The Company follows the current guidance in accounting for income taxes. Under the asset and liability method required by this guidance, deferred tax assets and liabilities are recognized for the future tax consequences attributable to differences between the financial statement carrying amounts of existing assets and liabilities and their respective tax bases. Deferred tax assets and liabilities are measured using enacted tax rates expected to apply to taxable income in the years in which those temporary differences are expected to be recovered or settled. The effect on deferred tax assets and liabilities of a change in tax rates is recognized in income in the period that includes the enactment date. A deferred tax asset will be reduced by a valuation allowance when, based on the Company's estimates, it is more likely than not that a portion of those assets will not be realized in a future period.
The Company follows guidance regarding the accounting for uncertainty in income taxes. This guidance clarifies the accounting for income taxes by prescribing the minimum recognition threshold an income tax position is required to meet before recognizing in the consolidated financial statements and applies to all income tax positions. Each income tax position is assessed using a two step process. A determination is first made as to whether it is more likely than not that the income tax position will be sustained, based upon technical merits, upon examination by the taxing authorities. If the income tax position is expected to meet the more likely than not criteria, the benefit recorded in the consolidated financial statements equals the largest amount that is greater than 50% likely to be realized upon its ultimate settlement. Our methodology for recording income taxes requires judgment regarding assumptions and the use of estimates, including determining our annual effective tax rate and the valuation of deferred tax assets, which can create variance between actual results and estimates. The process involves making forecasts of current and future years' taxable income and unforeseen events may significantly affect these estimates. Those factors, among others, could have a material effect on our provision or benefit for income taxes.
Stock-Based Compensation. We account for stock-based compensation in accordance with current guidance, which requires us to measure the cost of employee services received in exchange for an award of equity instruments based on the grant date fair value of the award. In so doing, we use the Black-Scholes-Merton option-pricing model, which requires various assumptions as to interest rates, volatility, dividend yields and expected lives of stock-based awards.
Revenues
The following table sets forth our consolidated revenues for the periods indicated:
| |
Year Ended December 31, | |||||||||||||||||||
|---|---|---|---|---|---|---|---|---|---|---|---|---|---|---|---|---|---|---|---|---|
| |
2010 | 2009 | 2008 | |||||||||||||||||
| |
(in millions, except percentages) |
|||||||||||||||||||
Proprietary Services |
$ | 119.8 | 47 | % | $ | 288.3 | 92 | % | $ | 351.3 | 93 | % | ||||||||
Multi-client Services |
134.9 | 53 | 24.5 | 8 | 25.0 | 7 | ||||||||||||||
Total |
$ | 254.7 | 100 | % | $ | 312.8 | 100 | % | $ | 376.3 | 100 | % | ||||||||
42
Revenues by Region
The following table sets forth our consolidated revenues by region for the periods indicated:
| |
Year Ended December 31, | |||||||||||||||||||
|---|---|---|---|---|---|---|---|---|---|---|---|---|---|---|---|---|---|---|---|---|
| |
2010 | 2009 | 2008 | |||||||||||||||||
| |
(in millions, except percentages) |
|||||||||||||||||||
U.S. |
$ | 145.7 | 57 | % | $ | 180.1 | 58 | % | $ | 152.8 | 41 | % | ||||||||
Latin America |
76.7 | 30 | 41.8 | 13 | 104.6 | 28 | ||||||||||||||
EAME(1) |
7.5 | 3 | 40.0 | 13 | 77.5 | 20 | ||||||||||||||
Asia Pacific |
24.8 | 10 | 50.9 | 16 | 41.4 | 11 | ||||||||||||||
Total |
$ | 254.7 | 100 | % | $ | 312.8 | 100 | % | $ | 376.3 | 100 | % | ||||||||
- (1)
- Europe, Africa, Middle East.
Year Ended December 31, 2010 Compared to Year Ended December 31, 2009
Revenues.
| |
Year Ended December 31, | |||||||||||||
|---|---|---|---|---|---|---|---|---|---|---|---|---|---|---|
| |
2010 | 2009 | ||||||||||||
| |
(in millions, except percentages) |
|||||||||||||
Proprietary Services |
$ | 119.8 | 47 | % | $ | 288.3 | 92 | % | ||||||
Multi-client Services |
134.9 | 53 | 24.5 | 8 | ||||||||||
Total |
$ | 254.7 | 100 | % | $ | 312.8 | 100 | % | ||||||
We recorded revenues of $254.7 million for the year ended December 31, 2010 compared to $312.8 million for the year ended December 31, 2009, a decrease of $58.1 million, or 19%. The majority of this decrease is attributable to a reduction in demand for our seismic data services caused by generally lower exploration and production spending by our clients.
We recorded revenues from Proprietary Services of $119.8 million for the year ended December 31, 2010 compared to $288.3 million for the year ended December 31, 2009, a decrease of $168.5 million, or 58%. Of this amount, the decrease related to the U.S. Proprietary operations was $144.8 million. This is primarily a result of a shift from Proprietary to Multi-client demand in the North America unconventional resource plays. In Latin America, we had $76.7 million in revenues for the year ended December 31, 2010 compared to $41.8 million for the year ended December 31, 2009, an increase of $34.9 million, largely driven by an increase in the number of our crews active in Argentina and Colombia in 2010. In EAME, during the years ended December 31, 2010 and 2009 we recorded revenues of $7.5million and $40.0 million, respectively, a decrease of $32.5 million also driven by a decrease of our crew activity primarily in Algeria during 2010. In the Asia Pacific market, revenues decreased to $24.8 million for the year ended December 31, 2010 from $50.9 million for the year ended December 31, 2009, a decrease of $26.1 million. The decrease was the result of reduced crew activity during 2010 as we completed a job in India during the first quarter of 2010.
We recorded revenues from Multi-client Services of $134.9 million for the year ended December 31, 2010 compared to $24.5 million for the year ended December 31, 2009, an increase of $110.4 million, or 451%. The $134.9 million in Multi-client revenues included $16.4 million of late sales revenue, $109.1 million of pre-commitment revenue, and $9.4 million in data swap transactions. As of December 31, 2009, we had completed a large portion of the acquisition activities of the Multi-client surveys then underway. Total pre-commitments that had not been recognized as revenue were $137.4 million and $92.8 million as of December 31, 2010 and 2009, respectively.
43
Operating Expenses. Operating expenses, excluding depreciation and amortization, decreased by $106.5 million, or 58%, to $77.2 million for the year ended December 31, 2010 from $183.7 million for the year ended December 31, 2009. Substantially all of the decrease in the year ended December 31, 2010 in dollar terms was the result of shift to U.S. Multi-client work, where the acquisition costs are recorded on the balance sheet and amortized when sales are recorded. In the year ended December 31, 2010 the Company capitalized Multi-client cash investments of $170.8 million compared to $34.4 million for the same period in 2009, an increase of $136.4 million.
SG&A. SG&A, excluding depreciation and amortization, increased by $8.2 million, or 27%, to $38.9 million for the year ended December 31, 2010, from $30.7 million for the year ended December 31, 2009. Overall compensation and employee benefits increased by $7.3 million during 2010 compared to 2009, mainly attributable to our increased effort in our Multi-client sales and marketing staff, coupled with certain added costs related to being a public company. Bad debt expense decreased by $1.0 million, to $3.1 million for the year ended December 31, 2010 from $4.1million during the same period of 2009.
Depreciation and Amortization Expense. Gross depreciation charges were $56.3 million for the period ending December 31, 2010 compared to $60.6 million for the same period of 2009. Of these amounts $20.4 million and $3.7 million were capitalized in connection with our Multi-client projects for 2010 and 2009, respectively. As a result of the amounts capitalized for Multi-client, the net depreciation expense reflected in operating expenses are $35.9 million and $56.9 million for 2010 and 2009, respectively.
Gross depreciation charges decreased by $4.3 million, to $56.3 million during 2010 as some of our older equipment is becoming fully depreciated and capital investments in recent quarters has been less than our historical average.
Multi-client amortization expense was $92.7 million for the year ended December 31, 2010, compared to Multi-client amortization of $18.7 million for the same period of 2009. Multi-client amortization increased by $74.0 million, or 396%, as a result of the increase in Multi-client Services revenues. Multi-client amortization included a charge for $4.6 million for additional amortization expense against our data library attributable to the weather related delays experienced in the first three quarters during 2010.
Interest Expense, Net. Interest expense, net, increased by $2.7 million, or 15%, to $21.3 million for the year ended December 31, 2010, from $18.6 million for the year ended December 31, 2009. This increase in interest expense is due in large part to borrowing costs from the issuance of $200 million, 101/2% senior notes.
Other Income (Expense), Net. Other income, net, decreased by $7.7 million to ($6.7) million for the year ended December 31, 2010 from an expense of $1.0 million for the year ended December 31, 2009. The main item driving the decrease was a $6.0 million expense attributable to the extinguishment of debt from the previous credit facility during 2010. The carrying value of the interest rate hedge held as a requirement under our previous credit facility decreased by $0.5 million, or 63% to $0.3 million at the end of December 31, 2010.
Income Tax. For the year ended December 31, 2010 we had an income tax expense of $0.6 million compared to an expense of $0.3 million for the year ended December 31, 2009.
44
Year Ended December 31, 2009 Compared to Year Ended December 31, 2008
Revenues.
| |
Year Ended December 31, | |||||||||||||
|---|---|---|---|---|---|---|---|---|---|---|---|---|---|---|
| |
2009 | 2008 | ||||||||||||
| |
(in millions, except percentages) |
|||||||||||||
Proprietary Services |
$ | 288.3 | 92 | % | $ | 351.3 | 93 | % | ||||||
Multi-client Services |
24.5 | 8 | 25.0 | 7 | ||||||||||
Total |
$ | 312.8 | 100 | % | $ | 376.3 | 100 | % | ||||||
We recorded revenues of $312.8 million for the year ended December 31, 2009 compared to $376.3 million for the year ended December 31, 2008, a decrease of $63.5 million, or 16.9%. The majority of this decrease is attributable to a reduction in demand for our Proprietary Services caused by generally lower exploration and production spending by our clients.
We recorded revenues from Proprietary Services of $288.3 million for the year ended December 31, 2009 compared to $351.3 million for the year ended December 31, 2008, a decrease of $63.0 million, or 17.9%. Revenues in the U.S. market increased to $180.1 million for the year ended December 31, 2009 from $152.8 million for the year ended December 31, 2008, an increase of $27.3 million driven by several large projects for major IOCs in 2009. In Latin America, we had $41.8 million in revenues for the year ended December 31, 2009 compared to $104.6 million for the year ended December 31, 2008, a decrease of $62.8 million, largely driven by a reduction in the number of crews active in 2009. In EAME during the years ended December 31, 2009 and 2008 we recorded revenues of $40.0 million and $77.5 million, respectively, a decrease of $37.5 million also driven by a reduction of our crew activity in the first three quarters of 2009. In the Asia Pacific market, revenues increased to $50.9 million for the year ended December 31, 2009 from $41.4 million for the year ended December 31, 2008, an increase of $9.5 million. The increase was the result of increased crew activity within the region during the fourth quarter of 2009.
We recorded revenues from Multi-client Services of $24.5 million for the year ended December 31, 2009 compared to $25.0 million for the year ended December 31, 2008, a decrease of $0.5 million, or 2.0%. As of December 31, 2008, we had completed a large portion of the acquisition activities of the Multi-client surveys then underway. Total pre-commitments that had not been recognized as revenue were $9.7 million and $92.8 million on December 31, 2008 and 2009, respectively.
For the year ended December 31, 2009, $13.4 million of our Multi-client revenues were from the recognition of pre-commitments and $11.1 million were from late sales. In 2008, all of our Multi-client Services revenues were generated through the recognition of pre-commitments and none were from late sales.
Operating Expenses. Operating expenses, excluding depreciation and amortization, decreased by $63.8 million, or 25.9%, to $182.9 million for the year ended December 31, 2009 from $246.7 million for the year ended December 31, 2008. Operating expenses, excluding depreciation and amortization, are closely tied to crew activity. Substantially all of the decrease in the year ended December 31, 2009 in dollar terms was the result of reduced crew operating activity during the period, as described in "Revenues" above. In addition, several large, high productivity projects underway during this period increased overall operating efficiency compared to the year ended December 31, 2008. Operating expenses, excluding depreciation and amortization, as a percentage of revenue, declined to 58.5% in 2009 from 65.6% in 2008, an improvement of 7.1%.
SG&A. SG&A expenses, excluding depreciation and amortization, increased by $2.5 million, or 8.6%, to $31.5 million for the year ended December 31, 2009, from $29.0 million for the year ended
45
December 31, 2008. This increase is primarily from bad debt expense which increased by $4.1 million for the year ended December 31, 2009. This increase in bad debt expense was partially offset by cost reductions, mostly in corporate staff headcount, made in response to a decrease in demand for our services during this period. SG&A, excluding depreciation and amortization, net of bad debt expense, declined by $1.1 million in the year ended December 31, 2009, and represented 8.8% of revenues in 2009 compared to 7.6% of revenues in 2008.
Depreciation and Amortization Expense. Gross depreciation charges were $60.6 million for the period ending December 31, 2009 compared to $54.8 million for the same period of 2008. Of these amounts $3.7 million and $3.0 million were capitalized in connection with our Multi-client projects for 2009 and 2008, respectively. As a result of the amounts capitalized for Multi-client, the net depreciation expense reflected in operating expenses are $56.9 million and $51.8 million for 2009 and 2008, respectively.
Gross depreciation charges decreased by $5.8 million, to $54.8 million during 2009 as some of our older equipment is becoming fully depreciated and capital investments in recent quarters has been less than our historical average. Multi-Client amortization expense was $18.6 million for the year ended December 31, 2009, compared to Multi-client amortization of $19.1 million for the same period of 2008, resulting in a decrease in amortization of $0.5 million.
Interest Expense, Net. Interest expense, net, decreased by $3.8 million, or 17.0%, to $18.6 million for the year ended December 31, 2009, from $22.4 million for the year ended December 31, 2008. This reduction in interest expense is due in large part to the $3.6 million of capitalized debt issuance costs written off and prepayment penalties incurred with the refinancing of our secured credit facilities in January 2008 and the lower interest rates resulting from lower LIBOR in 2009 as compared to 2008.
Other Income (Expense), Net. Other income, net, increased by $7.2 million to $1.0 million for the year ended December 31, 2009, from an expense of $6.2 million for the year ended December 31, 2008. The main item driving the increase was a $5.2 million foreign exchange loss in 2008, compared to a $0.2 million gain in 2009. The increase also includes an unrealized gain of $0.8 million on the carrying value of the interest rate hedge held as a requirement under our Existing Credit Facilities in 2009 compared to an unrealized $1.2 million loss in 2008.
Income Tax Expense. For the year ended December 31, 2009 we had an income tax expense of $0.3 million compared to $6.0 million for the year ended December 31, 2008.
46
Results of Operations
Consolidated Results of Operations
The following table sets forth our consolidated results of operations for the periods indicated:
| |
Year Ended December 31, | ||||||||||
|---|---|---|---|---|---|---|---|---|---|---|---|
| |
2010 | 2009 | 2008 | ||||||||
| |
(in millions) |
||||||||||
Statement of Operations Information: |
|||||||||||
Revenues |
$ | 254.7 | $ | 312.8 | $ | 376.3 | |||||
Expenses |
|||||||||||
Operating expenses |
225.3 | 262.2 | 319.5 | ||||||||
Selling, general and administrative expenses |
40.4 | 32.3 | 30.2 | ||||||||
Interest expense, net |
(21.3 |
) |
(18.6 |
) |
(22.4 |
) |
|||||
Other income (expense), net(1) |
(6.7 | ) | 1.0 | (6.2 | ) | ||||||
Income tax expense (benefit) |
0.6 | 0.3 | 6.0 | ||||||||
- (1)
- Includes unrealized gain (loss) on derivative instruments, foreign exchange gain (loss), loss on extinguishment of debt, and other income (expense) and gains and losses on assets.
Liquidity and Capital Resources
Our primary sources of liquidity are cash generated from revenues by the Proprietary Services and Multi-client Services we provide to our clients, prepayments from clients, debt and equity offerings, our revolving credit facility, and equipment financings such as capital leases.
As of December 31, 2010, we had available liquidity as follows:
(Amounts in millions)
|
December 31, 2010 |
|||
|---|---|---|---|---|
Available cash |
$ | 28.2 | ||
Undrawn borrowing capacity under Revolving Credit Facility |
35.0 | |||
Net available liquidity |
$ | 63.2 | ||
Our primary uses of capital include the acquisition of seismic data recording equipment, seismic vehicles and vessels, other equipment needed to outfit new crews and to enhance the capabilities of and maintain existing crews' energy sources, and investments in Multi-client data for our library. We also use capital to fund the working capital required to launch new crews and operate existing crews. Our cash position, consistent with our revenues, depends to a large extent on the level of demand for our services. Historically, we have supplemented cash from operations with borrowings under our Revolving Credit Facility periodically from time to time as the need arises.
We are also required to post letters of credit or performance bonds in connection with a number of our international seismic data acquisition contracts as security for the performance of our obligations under those contracts. As of December 31, 2010, we had no outstanding letters of credit issued under our Revolving Credit Facility. Other letters of credit totaling $2.4 million were secured with the cash identified as "Restricted cash investments" on our balance sheet as of December 31, 2010.
For purposes of local payroll and other operating expenses we typically maintain cash balances with local banks in many of the foreign jurisdictions in which we operate. In some jurisdictions, our ability to transfer such cash balances to our U.S. based banks can require a period of weeks, or even months, due to local banking and other regulatory requirements. We do not consider the cash balances maintained in such accounts to be material.
47
The following table summarizes the net cash provided by (used in) operating, investing and financing activities for the years ended December 31, 2010 and 2009:
| |
Year Ended December 31, |
||||||
|---|---|---|---|---|---|---|---|
(Amounts in millions)
|
2010 | 2009 | |||||
Operating activities |
115.8 | 80.4 | |||||
Investing activities |
(212.7 | ) | (53.3 | ) | |||
Financing activities |
108.1 | (40.5 | ) | ||||
For the year ended December 31, 2010:
Operating Activities. We rely primarily on cash flows from operations to fund working capital for current and future operations. Net cash provided by operating activities totaled $115.8 million, $80.4 million and $41.1 million for the years ended December 31, 2010, 2009 and 2008, respectively. This resulted in an increase in operating cash flows of $35.4 million for the year ended December 31, 2010 compared to the year ended December 31, 2009. The net (loss) income, attributable to common shareholders resulted in a use of cash of $40.2 million, as well as capitalized depreciation used $16.6 million of cash from operations. Our deferred revenue balance resulted in a use of cash during 2010 of $30.3 million as the pre-billings from our Multi-client projects from 2009 were booked into revenue during 2010. This was offset primarily from the depreciation and amortization change of $69.5 million and the loss on extinguishment of debt of $6.0 million during 2010, a combination of an increase to cash flow from operations of $75.5 million during 2010. The change in accounts receivable increased by $13.3 million year over year, primarily from better collections, as our Days Sales Outstanding ("DSO") improved by nine days over 2009. Accounts payable and accrued expenses were $3.7 million in 2010 as compared to ($1.8) million in 2009, resulting in an increase to cash flows from operations of $5.5 million. Also contributing to the increase in cash flow from operations during 2010 was a combination of income and other taxes receivable of $11.1 million and income and taxes payable of $10.6 million, a difference of $21.7 million as compared to 2009.
Investing Activities. Cash used in investing activities totaled $212.7 million, $53.3 million and $84.7 million for the years ended December 31, 2010, 2009 and 2008, respectively. The $159.5 million increase in cash used in investing activities in 2010 as compared to 2009 is primarily the result of an increase in capital equipment purchases of $18.8 million, and a $136.4 million in increase in investment in Multi-client library in 2010 compared to 2009. There was also an increase of $6.7 million from our purchase of new business during 2010.
Investing activities in the years ended December 31, 2010, 2009, and 2008 consisted primarily of the acquisition of new seismic data recording equipment, seismic energy sources, vehicles and vessels, and other equipment needed to outfit new and existing crews. Investments in our Multi-client seismic data library, totaled $170.8 million and $34.4 million for the years ended December 31, 2010 and 2009, respectively. In addition, we financed $5.4 million, $3.1 million and $11.1 million of equipment through capital leases and accounts payable in the years ended December 31, 2010, 2009, and 2008, respectively. These are included on our statements of cash flows and the notes to our consolidated financial statements under the heading "Note 16—Supplemental Cash Flow Information." Investing activities in 2011 are expected to consist primarily of investments in our Multi-client seismic data library and
48
equipment purchases. The following table sets forth our investment in our Multi-client library for the period indicated:
| |
Year Ended December 31, |
||||||
|---|---|---|---|---|---|---|---|
(Amounts in millions)
|
2010 | 2009 | |||||
Cash investment in Multi-client library assets |
170.8 | 34.4 | |||||
Capitalized depreciation(1) |
20.4 | 3.7 | |||||
Non-cash data exchange |
10.0 | 8.9 | |||||
| |
At December 31, | ||||||
|---|---|---|---|---|---|---|---|
| |
2010 | 2009 | |||||
Total capitalized investment at cost (cumulative, at period end) |
$ | 276.4 | $ | 75.2 | |||
Less: Accumulated amortization of Multi-client library assets |
130.5 | 37.8 | |||||
Multi-client net book value (at period end) |
$ | 145.9 | $ | 37.4 | |||
- (1)
- Represents capitalized cost of the equipment, owned or leased, and utilized in connection with Multi-client seismic acquisition.
Financing Activities. Financing activities increased by $148.6 million in cash in the year ended December 31, 2010. In the years ended December 31, 2009 and 2008, financing activities used $40.5 million and generated $57.1 million in cash, respectively. Financing activities in 2010 consisted of our initial public offering and the sale of our $200 million 101/2% senior notes due 2017 (see below).
Please see our consolidated financial statements presented elsewhere in this annual report for more information on our operating, investing, and financing cash flows.
Capital Resources. In connection with the closing of our initial public offering and the sale of our $200 million 101/2% senior notes due 2017 on April 27, 2010 (described below), we repaid all outstanding borrowings under a $150.0 million First Lien Credit Agreement, dated January 16, 2008, with Credit Suisse, as administrative agent and collateral agent, and a $50.0 million second lien term loan agreement, dated January 16, 2008, with Credit Suisse, as administrative agent and collateral agent, and a construction loan agreement, dated February 13, 2008, and subsequently amended on August 28, 2009, with Citibank, N.A. (total available borrowing capacity of $5.4 million) which provided financing of the construction of our Missouri City headquarters facility. These repayments resulted in the termination of each of these borrowing arrangements. The prepayment of our construction loan resulted in the incurrence of $0.2 million in prepayment penalties. In addition, we repaid all outstanding capital lease commitments.
On April 22, 2010, we entered into a Purchase Agreement with Barclays Capital Inc., Credit Suisse Securities (USA) LLC and Banc of America Securities LLC, as representatives of the initial purchasers (the "Initial Purchasers"), relating to the offer and sale by us of $200 million aggregate principal amount, 101/2% senior notes due May 1, 2017 (the "Notes"). We received net proceeds from the offering of approximately $188.1 million after deducting the Initial Purchasers' discounts, offering expenses and original issue discount. The issuance of the Notes occurred on April 27, 2010. The Notes were offered and sold to the Initial Purchasers and resold only to qualified institutional buyers in compliance with the exemption from registration provided by Rule 144A under the Securities Act of 1933, as amended (the "Securities Act"), and in offshore transactions in reliance on Regulation S under the Securities Act.
On April 27, 2010, we completed an initial public offering of our shares on the New York Stock Exchange. The net proceeds from this offering were approximately $76.4 million after deducting
49
underwriting discounts, fees and offering expenses. As described in our final prospectus dated April 22, 2010 (the "Prospectus") contained in our Registration Statement on Form S-1 (File No. 333-162540), we used the net proceeds of the offering to pay down indebtedness and the remaining proceeds were used for anticipated capital expenditures and general working capital purposes. We did not receive any of the proceeds from the sale of the Common Stock sold by the selling stockholders.
On April 30, 2010, we completed the closing of a new revolving credit facility under the terms of a Credit Agreement (the "Revolving Credit Facility") with Bank of America, N.A., as administrative agent for each lender party to the Revolving Credit Facility. Our Revolving Credit Facility provides for borrowings of up to $50.0 million. The loans under our Revolving Credit Facility bear interest at a rate equal to LIBOR plus the Applicable Rate or the Base Rate plus the Applicable Rate. The Base Rate is defined as the higher of (x) the prime rate and (y) the Federal Funds rate plus 0.50%. The Applicable Rate is defined as a percentage determined in accordance with a pricing grid based upon our leverage ratio, that will decline from LIBOR plus 4.00% or the prime rate plus 3.00% to a minimum rate equal to LIBOR plus 3.50% or the prime rate plus 2.50%. We are able to prepay borrowings under our Revolving Credit Facility at any time without penalty or premium, subject to reimbursement of the lenders' breakage and redeployment costs in the case of prepayment of LIBOR borrowings. We also will pay a commitment fee of 0.75% per annum on the actual daily unused portions of the Revolving Credit Facility.
Capital Expenditures. Capital expenditures for the years ended December 31, 2010, 2009 and 2008 were $246.5 million, $71.2 million and $89.1 million, respectively. The $246.5 million capital expenditures in 2010 consisted of $45.3 million for equipment upgrades for existing crews, and $201.2 million invested in our Multi-client library, comprised of a cash investment of $170.8 million, $20.4 million in capitalized depreciation, and $10.0 million in non cash data exchange. In 2009, we invested $47.0 million in our Multi-client library, comprised of $34.4 million in cash investment, $3.7 million in capitalized depreciation and $8.9 million of non-cash data exchange.
We expect to spend approximately $30 to $40 million on capital expenditures, (excluding capital expenditures related to our Multi-client Services) for property, plant and equipment in 2011, of which approximately $10 to $15 million is expected to be allocated to the expansion of our facilities and equipment. The remaining 2011 capital expenditures budget is expected to be allocated to the development and purchase of additional equipment, including the development of land and seafloor nodal technologies. We expect that our capital budget for 2011 will increase to include expenditures with respect to our Multi-client Services, subject to the demands of our clients to expand current Multi-client projects and opportunities to initiate and develop new Multi-client projects.
We continuously reevaluate our capital budget based on market conditions and other factors and may defer or accelerate capital expenditures depending on market conditions or our ability to obtain capital on attractive terms. Depending on the market demand for seismic services or other growth opportunities that may arise, we may require additional debt or equity financing.
We believe that our current working capital, projected cash flow from operations, and available amounts under our credit facilities will be sufficient to meet our capital requirements for our existing operations for the next 12 months. Although we expect to continue generating positive cash flow from our operations, events beyond our control may affect our financial condition or results of operations. These events include, but are not limited to, a significant drop in prices for oil and natural gas and a corresponding drop in demand for our services.
Off Balance Sheet Arrangements
We had no off-balance sheet arrangements for the year ended December 31, 2010.
50
Contractual Obligations
The following table summarizes the payments due in specific periods related to our contractual obligations as of December 31, 2010:
| |
Payments Due by Period | ||||||||||||||||
|---|---|---|---|---|---|---|---|---|---|---|---|---|---|---|---|---|---|
| |
Total | Within 1 Year | 1 - 3 Years | 3 - 5 Years | After 5 Years | ||||||||||||
| |
(in millions) |
||||||||||||||||
Long-term debt obligations |
$ | 218.3 | 3.3 | 15.0 | 0.0 | 200.0 | |||||||||||
Operating lease obligations |
2.7 | 1.8 | 0.7 | 0.2 | 0.0 | ||||||||||||
Purchase obligations(1) |
0.7 | 0.7 | 0.0 | 0.0 | 0.0 | ||||||||||||
Total |
$ | 221.7 | 5.8 | 15.7 | 0.2 | 200.0 | |||||||||||
- (1)
- Represents an option to purchase from a former employee 46,794 shares of common stock at $15 per share.
Item 7A. Quantitative and Qualitative Disclosures About Market Risks
In the normal course of operations, we are exposed to market risks primarily from credit risk, changes in interest rates and foreign currency exchange rate risks.
Credit Risk
Financial instruments, which potentially subject us to concentration of credit risk, consist primarily of unsecured trade receivables. In the normal course of business, we provide credit terms to our customers. Accordingly, we perform ongoing credit evaluations of our customers and maintain allowances for possible losses which, when realized, have been within the range of our expectations. We believe that our unreserved trade receivables at December 31, 2010, are collectible and our allowance for doubtful accounts is adequate.
We generally provide services to a relatively small group of key customers that account for a significant percentage of our accounts receivable at any given time. Our key customers vary over time. We extend credit to various companies in the oil and natural gas industry, including our key customers, for the acquisition of seismic data, which results in a concentration of credit risk. This concentration of credit risk may be affected by changes in the economic or other conditions of our key customers and may accordingly impact our overall credit risk.
We have cash in bank and restricted cash which, at times, may exceed federally insured limits. We have not experienced any losses in such accounts.
Interest Rate Risk
Fluctuations in the general level of interest rates on our current and future fixed and variable debt obligations expose us to market risk. We are vulnerable to significant fluctuations in interest rates affecting our adjustable rate debt, and any future refinancing of our fixed rate debt and our future debt. At December 31, 2010, we were exposed to interest rate fluctuations on our credit facilities carrying variable interest rates.
Foreign Currency Exchange Rate Risk
We currently conduct business in many foreign countries. As a company that derives a substantial amount of our revenue from sales internationally, we are subject to risks relating to fluctuations in currency exchange rates. Fluctuations in the exchange rate of the U.S. dollar against such other currencies have had in the past and can be expected in future periods to have a significant effect upon our results of operations.
51
While we attempt to reduce the risks associated with such exchange rate fluctuations, we cannot provide assurance that we will be effective in doing so or that fluctuations in the value of the currencies in which we operate will not materially affect our results of operations in the future.
Inflation Risk
We do not believe that inflation has had a significant impact on our business, financial condition, or results of operations during the most recent three years.
Item 8. Financial Statements and Supplementary Data
Our Annual Consolidated Financial Statements, Notes to Consolidated Financial Statements and the reports of UHY LLP ("UHY"), our independent registered public accounting firm, with respect thereto, referred to in the Table of Contents to Consolidated Financial Statements, appear beginning on page F-1 of this document and are incorporated herein by reference.
Item 9. Changes in and Disagreements with Accountants on Accounting and Financial Disclosure
None.
Item 9A. Controls and Procedures
Disclosure controls and procedures
In order to ensure that the information we must disclose in our filings with the Securities and Exchange Commission is recorded, processed, summarized and reported on a timely basis, our management, with the participation of its Chief Executive Officer and Chief Financial Officer, evaluated the effectiveness of the design and operation of its disclosure controls and procedures (as such term is defined in Rules 13a-15(e) and 15d-15(e) under the Securities Exchange Act of 1934, as amended (the "Exchange Act"). Based on their evaluation as of the end of the period covered by this Form 10-K, our Chief Executive Officer and Chief Financial Officer have concluded that our disclosure controls and procedures are effective. It should be noted that any system of controls, no matter how well designed and operated, can provide only reasonable, not absolute, assurance that the control system's objectives will be met. Further, the design of any control system is based in part upon certain judgments, including the costs and benefits of controls and the likelihood of future events. Because of these and other inherent limitations of control systems, no evaluation of controls can provide absolute assurance that all control issues, if any, within the Company have been detected.
Changes in internal control over financial reporting
There have been no changes in our internal control over financial reporting that occurred during the period ended December 31, 2010, that have materially affected, or are reasonably likely to materially affect, such internal control over financial reporting. The Company's internal controls exist within a dynamic environment and we continually strive to improve our internal controls and procedures to enhance the quality of our financial reporting.
None.
52
Item 10. Directors, Executive Officers and Corporate Governance
The information required by this Item is set forth under the heading "Directors, Executive Officers and Corporate Governance" in our 2011 Proxy Statement to be filed with the Securities and Exchange Commission ("SEC") in connection with the solicitation of proxies for our 2011 Annual Meeting of Shareholders ("2011 Proxy Statement") and is incorporated herein by reference. Such 2011 Proxy Statement will be filed with the SEC within 120 days after the end of the fiscal year to which this report relates.
Item 11. Executive Compensation
The information required by this Item is set forth under the headings "Executive Compensation" and "Compensation Discussion and Analysis" in our 2011 Proxy Statement and is incorporated herein by reference.
Item 12. Security Ownership of Certain Beneficial Owners and Management and Related Stockholder Matters
The information required by this Item is set forth under the headings "Security Ownership of Certain Beneficial Owners and Management" and "Equity Compensation Plan Information" in our 2011 Proxy Statement and is incorporated herein by reference.
Item 13. Certain Relationships and Related Transactions and Director Independence
The information required by this Item is set forth under the heading "Review, Approval or Ratification of Transactions with Related Persons" in our 2011 Proxy Statement and is incorporated herein by reference.
Item 14. Principal Accountant Fees and Services
The information required by this Item is set forth under the heading "Fees Paid to Auditors" in our 2011 Proxy Statement and is incorporated herein by reference.
Item 15. Exhibits and Financial Statement Schedules
(a) List of documents filed as part of this Report
- (1)
- Consolidated
Financial Statements: See Index to Consolidated Financial Statements on page F-1
- (2)
- Financial Statement Schedules
All financial statement schedules have been omitted, since the required information is not applicable or is not present in amounts sufficient to require submission of the schedule, or because the information required is included in the consolidated financial statements and notes thereto.
(b) Exhibits required by Item 601 of Regulation S-K
The information required by this Item is set forth on the Exhibit Index that follows the signature page of this Report.
53
Pursuant to the requirements of Section 13 or 15(d) of the Securities Exchange Act of 1934, the Registrant has duly caused this report to be signed on its behalf by the undersigned, thereunto duly authorized.
| GLOBAL GEOPHYSICAL SERVICES, INC. | ||||
Date: March 18, 2011 |
By: |
/s/ RICHARD A. DEGNER Richard A. Degner President and Chief Executive Officer |
||
Date: March 18, 2011 |
By: |
/s/ P. MATHEW VERGHESE P. Mathew Verghese Senior Vice President and Chief Financial Officer |
||
Pursuant to the requirements of the Securities Exchange Act of 1934, this report has been signed below by the following persons on behalf of the Registrant and in the capacities and on the dates indicated:
Signature
|
Title
|
Date
|
||
|---|---|---|---|---|
| /s/ RICHARD A. DEGNER Richard A. Degner |
President and Director (Chief Executive Officer and Principal Executive Officer) | March 18, 2011 | ||
/s/ P. MATHEW VERGHESE P. Mathew Verghese |
Senior Vice President (Chief Financial Officer, Principal Financial Officer and Principal Accounting Officer) |
March 18, 2011 |
||
/s/ THOMAS J. FLEURE Thomas J. Fleure |
Senior Vice President, Geophysical Technology and Director |
March 18, 2011 |
||
/s/ DAMIR S. SKERL Damir S. Skerl |
Director |
March 18, 2011 |
||
/s/ MICHAEL C. FORREST Michael C. Forrest |
Director |
March 18, 2011 |
||
/s/ GEORGE E. MATELICH George E. Matelich |
Director |
March 18, 2011 |
||
/s/ STANLEY DE JONGH OSBORNE Stanley de Jongh Osborne |
Director |
March 18, 2011 |
||
/s/ KARL F. KURZ Karl F. Kurz |
Director |
March 18, 2011 |
54
| |
|
Incorporated by Reference | |||||
|---|---|---|---|---|---|---|---|
EXHIBIT NO. |
DESCRIPTION | Form File Date |
Exhibit No. SEC File No. |
||||
| 2.1 | † | Asset Purchase Agreement, dated as of June 5, 2008, by and among Global Geophysical Services, Inc., Weinman GeoScience, Inc., WGI Sub, LLC, Barry L. Weinman and Jane L. Weinman | S-1 10/16/09 |
2.1 333-163540 |
|||
| 2.2 | † | Amendment No. 1 to Asset Purchase Agreement, dated as of May 5, 2009, by and among Global Geophysical Services, Inc., Weinman GeoScience, Inc., WGI Sub, LLC, Barry L. Weinman and Jane L. Weinman | S-1 10/16/09 |
2.2 333-163540 |
|||
| 2.3 | † | Amendment No. 2 to Asset Purchase Agreement, dated as of June 15, 2009, by and among Global Geophysical Services, Inc., Weinman GeoScience, Inc., WGI Sub, LLC, Barry L. Weinman and Jane L. Weinman | S-1 10/16/09 |
2.3 333-163540 |
|||
| 3.1 | † | Third Amended and Restated Certificate of Incorporation dated April 26, 2010 | 8-K 4/27/10 |
3.1 | |||
| 3.2 | † | Amended and Restated Bylaws dated April 27, 2010 | 8-K 4/27/10 |
3.2 | |||
| 4.1 | † | Form of Specimen Certificate of Global Geophysical Services, Inc. | S-1 10/16/09 |
4.1 333-163540 |
|||
| 4.2 | † | Warrant Agreement, dated as of March 29, 2007, by and among Global Geophysical Services, Inc., Kelso Investment Associates VII, L.P. and KEP VI, LLC | S-1 10/16/09 |
4.2 333-163540 |
|||
| 4.3 | † | Plan of Recapitalization of Global Geophysical Services, Inc., dated December 18, 2009 | S-1 10/16/09 |
4.3 333-163540 |
|||
| 4.4 | † | Indenture dated as of April 27, 2010, among the Company, The Bank of New York Mellon Trust Company, N.A., as trustee, and the Guarantors | 8-K 4/27/10 |
4.1 | |||
| 4.5 | † | Registration Rights Agreement dated as of April 27, 2010, among the Company, the Guarantors and Barclays Capital Inc., Credit Suisse Securities (USA) LLC and Banc of America Securities LLC, as representatives of the initial purchasers | 8-K 4/27/10 |
4.2 | |||
| 4.6 | †† | First Supplemental Indenture, dated as of September 10, 2010, among Global MicroSeismic, Inc. (the "Guaranteeing Subsidiary"); Global Geophysical Services, Inc.; the other Guarantors (as defined in the Indenture) and The Bank of New York Mellon Trust Company, N.A., as trustee | |||||
| 4.7 | †† | Second Supplemental Indenture, dated as of November 10, 2010, among Paisano Lease Co., Inc. and Global Eurasia, LLC (the "Guaranteeing Subsidiaries"); Global Geophysical Services, Inc.; the other Guarantors, and The Bank of New York Mellon Trust Company, N.A., as trustee | |||||
55
| |
|
Incorporated by Reference | |||||
|---|---|---|---|---|---|---|---|
EXHIBIT NO. |
DESCRIPTION | Form File Date |
Exhibit No. SEC File No. |
||||
| 4.8 | †† | Third Supplemental Indenture, dated as of December 9, 2010, among Autoseis Development Company (the "Guaranteeing Subsidiary") a wholly-owned subsidiary of AutoSeis, Inc., a wholly-owned subsidiary of Global Geophysical Services, Inc. respectively; Global Geophysical Services, Inc.; the other Guarantors, and The Bank of New York Mellon Trust Company, N.A., as trustee | |||||
| 10.1 | † | Multiple Advance Term Promissory Note, dated as of February 13, 2008, by and between Citibank, N.A. GGS International Holdings, Inc. and Global Geophysical Services, Inc. | S-1 10/16/09 |
10.1 333-163540 |
|||
| 10.2 | † | Deed of Trust , dated as of February 13, 2008, by and between Citibank, N.A., GGS International Holdings, Inc. and Global Geophysical Services, Inc. | S-1 10/16/09 |
10.2 333-163540 |
|||
| 10.3 | † | Construction Loan Agreement dated as of February 13, 2008, by and between Citibank, N.A., GGS International Holdings, Inc. and Global Geophysical Services, Inc. | S-1 10/16/09 |
10.3 333-163540 |
|||
| 10.4 | †* | Amended and Restated Cooperation Agreement dated May 1, 2007, by and between Sercel, Inc. and Global Geophysical Services, Inc. | S-1 10/16/09 |
10.4 333-163540 |
|||
| 10.5 | † | First Lien Credit Agreement, dated as of January 16 , 2008, by and between Global Geophysical Services, Inc. and Credit Suisse, Credit Suisse Securities (USA) LLC, Jefferies Finance LLC, Whitney National Bank and Allied Irish Banks PLC | S-1 10/16/09 |
10.5 333-163540 |
|||
| 10.6 | † | Second Lien Credit Agreement, dated as of January 16 , 2008, by and between Global Geophysical Services, Inc. and Credit Suisse, certain Lenders, Credit Suisse Securities (USA) LLC and Jefferies Finance LLC | S-1 10/16/09 |
10.6 333-163540 |
|||
| 10.7 | † | First Lien Collateral Agreement, dated as of January 16, 2008, by and among Global Geophysical Services, Inc., certain subsidiaries of Global Geophysical Services, Inc. and Credit Suisse | S-1 10/16/09 |
10.7 333-163540 |
|||
| 10.8 | † | Second Lien Collateral Agreement, dated as of January 16, 2008, by and among Global Geophysical Services, Inc., certain subsidiaries of Global Geophysical Services, Inc. and Credit Suisse | S-1 10/16/09 |
10.8 333-163540 |
|||
| 10.9 | † | First Lien Preferred Fleet Mortgage, dated as January 16 , 2008, among Global Geophysical Services, Inc. and Credit Suisse, Cayman Islands Branch | S-1 10/16/09 |
10.9 333-163540 |
|||
| 10.10 | † | Second Lien Preferred Fleet Mortgage, dated January 16, 2008, among Global Geophysical Services, Inc. and Credit Suisse, Cayman Islands Branch | S-1 10/16/09 |
10.10 333-163540 |
|||
| 10.11 | † | Transition Agreement, dated July 2, 2008 by and between Global Geophysical Services, Inc. and Craig A. Lindberg | S-1 10/16/09 |
10.11 333-163540 |
|||
| 10.12 | † | Employment Agreement, dated as of June 5, 2008, by and between Global Geophysical Services, Inc. and Barry L. Weinman | S-1 10/16/09 |
10.12 333-163540 |
|||
56
| |
|
Incorporated by Reference | |||||
|---|---|---|---|---|---|---|---|
EXHIBIT NO. |
DESCRIPTION | Form File Date |
Exhibit No. SEC File No. |
||||
| 10.13 | † | Employment Agreement dated as of June 5, 2008, by and between Global Geophysical Services, Inc. and Jane L. Weinman | S-1 10/16/09 |
10.13 333-163540 |
|||
| 10.14 | † | Stockholders Agreement dated as of November 30, 2006 among Global Geophysical Services, Inc., Kelso Investment Associates VI, L.P., KEP VI, LLC, and those other parties identified therein | S-1 10/16/09 |
10.14 333-163540 |
|||
| 10.15 | † | Subordinated Promissory Note issued by Global Geophysical Services, Inc. to WGI Sub, LLC as of December 10, 2008 in the amount of $6.6 million | S-1 10/16/09 |
10.15 333-163540 |
|||
| 10.16 | † | Subordinated Promissory Note issued by Global Geophysical Services, Inc. to Weinman GeoScience, Inc., as of December 10, 2008 in the amount of $5.4 million | S-1 10/16/09 |
10.16 333-163540 |
|||
| 10.17 | † | Letter Agreement amending Subordinated Promissory Note dated as of December 10, 2008, by and among Global Geophysical Services, Inc., and WGI Sub, LLC, as of May 5, 2009 | S-1 10/16/09 |
10.17 333-163540 |
|||
| 10.18 | † | Letter Agreement amending Subordinated Promissory Note dated as of December 10, 2008, by and among Global Geophysical Services, Inc., and Weinman GeoScience, Inc., as of May 5, 2009 | S-1 10/16/09 |
10.18 333-163540 |
|||
| 10.19 | † | Letter Agreement amending Subordinated Promissory Note dated as of December 10, 2008, as amended by Letter Agreement dated May 5, 2009, by and among Global Geophysical Services, Inc., and WGI Sub, LLC, as of June 15, 2009 | S-1 10/16/09 |
10.19 333-163540 |
|||
| 10.20 | † | Letter Agreement amending Subordinated Promissory Note dated as of December 10, 2008, as amended by Letter Agreement dated May 5, 2009, by and among Global Geophysical Services, Inc., and Weinman GeoScience, Inc., as of June 15, 2009 | S-1 10/16/09 |
10.20 333-163540 |
|||
| 10.21 | † | Amendment No. 1 and Waiver dated as of October 30, 2009, under the First Lien Credit Agreement among Global Geophysical Services, Inc., the Lenders party thereto and Credit Suisse, as Administrative Agent and Collateral Agent | S-1 10/16/09 |
10.21 333-163540 |
|||
| 10.22 | † | Amendment No. 1 and Waiver dated as of October 30, 2009, under the Second Lien Credit Agreement among Global Geophysical Services, Inc., the Lenders party thereto and Credit Suisse, as Administrative Agent and Collateral Agent | S-1 10/16/09 |
10.22 333-163540 |
|||
| 10.23 | † | Employment Agreement dated effective December 24, 2009 between Global Geophysical Services, Inc. and Mathew Verghese | S-1 10/16/09 |
10.23 333-163540 |
|||
| 10.24 | † | Employment Agreement dated effective December 24, 2009 between Global Geophysical Services, Inc. and Alvin L. Thomas II | S-1 10/16/09 |
10.24 333-163540 |
|||
| 10.25 | † | Form of Indemnification Agreement between Global Geophysical Services, Inc. and its directors. | S-1 10/16/09 |
10.25 333-163540 |
|||
| 10.26 | † | Form of Lock-up Agreement applicable to selling stockholders of Global Geophysical, Inc. | S-1 10/16/09 |
10.26 333-163540 |
|||
57
| |
|
Incorporated by Reference | |||||
|---|---|---|---|---|---|---|---|
EXHIBIT NO. |
DESCRIPTION | Form File Date |
Exhibit No. SEC File No. |
||||
| 10.27 | † | Form of Lock-up Agreement applicable to officers, directors and stockholders of Global Geophysical, Inc. other than selling stockholders | S-1 10/16/09 |
10.27 333-163540 |
|||
| 10.28 | † | Letter Agreement dated December 1, 2006, between Kelso & Company, L.P. and Global Geophysical, Inc. | S-1 10/16/09 |
10.28 333-163540 |
|||
| 10.29 | † | Form of Incentive Stock Option Agreement | S-1 10/16/09 |
10.29 333-163540 |
|||
| 10.30 | † | Form of Grant of Restricted Stock | S-1 10/16/09 |
10.30 333-163540 |
|||
| 10.31 | † | Stock Repurchase Agreement dated December 29, 2009, between Richard Degner, Tom Fleure, Heidi Brown, John Degner and Global Geophysical Services, Inc. | S-1 10/16/09 |
10.31 333-163540 |
|||
| 10.32 | †* | First Amendment amending Amended and Restated Cooperation Agreement dated May 1, 2007, between Global Geophysical Services, Inc. and Sercel, Inc., as of January 13, 2010, | S-1 10/16/09 |
10.32 333-163540 |
|||
| 10.33 | † | First Amendment amending Stockholders Agreement between Global Geophysical Services, Inc. and certain stockholders dated November 30, 2006, as of January 13, 2010 | S-1 10/16/09 |
10.33 333-163540 |
|||
| 10.34 | †† | Global Geophysical Services, Inc. Amended and Restated 2006 Incentive Compensation Plan, effective as of February 5, 2010 | |||||
| 10.35 | †* | Second Amendment amending the First Amendment to the Amended and Restated Cooperation Agreement dated January 13, 2010, between Global Geophysical Services, Inc. and Sercel, Inc., as of March 5, 2010 | S-1 10/16/09 |
10.35 333-163540 |
|||
| 10.36 | † | Note Purchase Agreement dated as of April 22, 2010, among the Company, the Guarantors and Barclays Capital Inc., Credit Suisse Securities (USA) LLC and Banc of America Securities LLC, as representatives of the initial purchasers | 8-K 8/27/10 |
10.1 | |||
| 10.37 | † | Credit Agreement dated as of April 30, 2010 by and among Global Geophysical Services, Inc. and Bank of America, N.A., as Administrative Agent, Swing Line Lender and L/C Issuer, and each lender from time to time party thereto | 8-K 5/3/10 |
10.1 | |||
| 10.38 | †† | Security Agreement dated as of April 30, 2010 by and among Global Geophysical Services, Inc. and other Debtors parties in favor of Bank of America, N.A., as Administrative Agent | |||||
| 10.39 | †† | Supplemental No.1 dated as of September 8, 2010 to the Security Agreement dated as of April 30, 2010, among Global Geophysical Services, Inc., Global Microseismic, Inc., and Bank of America, N.A., as administrative agent | |||||
58
| |
|
Incorporated by Reference | |||||
|---|---|---|---|---|---|---|---|
EXHIBIT NO. |
DESCRIPTION | Form File Date |
Exhibit No. SEC File No. |
||||
| 10.40 | †† | Supplemental No.2 dated as of November 12, 2010 to the Security Agreement dated as of April 30, 2010, among Global Geophysical Services, Inc., Paisano Lease Co. Inc., Global Eurasia, LLC, and Bank of America, N.A., as administrative agent | |||||
| 10.41 | †† | Supplemental No.3 dated as of December 7, 2010 to the Security Agreement dated as of April 30, 2010, among Global Geophysical Services, Inc., Autoseis Development Company, and Bank of America, N.A. ,as administrative agent | |||||
| 10.42 | †† | Assignment of Insurance among Global Geophysical Services, Inc. and Bank of America, N.A. dated April 30, 2010 | |||||
| 10.43 | †† | Deed of Trust, Security Agreement, Assignment of Rents and Leases and Fixture Filing (Texas) by and from Global Geophysical Services, Inc. to Aaron Roffwarg for the benefit of Bank of America, N.A., as Administrative Agent, dated April 30, 2010 | |||||
| 10.44 | †† | First Preferred Fleet Mortgage by Global Geophysical Services, Inc. to Bank of America, N.A. dated April 30, 2010 | |||||
| 10.45 | †† | Guaranty to Bank of America, N.A. dated April 30, 2010 | |||||
| 10.46 | †† | Note payable to Citibank, N.A. dated April 30, 2010 | |||||
| 10.47 | † | Employment Agreement dated as of October 15, 2010 between Global Geophysical Services, Inc. and Christopher P. Graham | 8-K 10/21/10 |
10.1 | |||
| 12.1 | †† | Statement Regarding Computation of Ratio of Earnings to Fixed Charges | |||||
| 14.1 | †† | Global Geophysical Services, Inc. Code of Business Conduct and Ethics dated November 9, 2010 | |||||
| 21.1 | †† | List of Subsidiaries of Global Geophysical Services, Inc. | |||||
| 23.1 | †† | Consent of UHY LP | |||||
| 31.1 | †† | Certification of Chief Executive Officer pursuant to Rules 13a-14(a) and 15d-14(a) of the Securities Exchange Act of 1934, as amended. | |||||
| 31.2 | †† | Certification of Chief Executive Officer pursuant to Rules 13a-14(a) and 15d-14(a) of the Securities Exchange Act of 1934, as amended. | |||||
| 32.1 | †† | Certification of Chief Financial Officer pursuant to 18 U.S.C. Section 1350, as adopted pursuant to Section 906 of the Sarbanes-Oxley Act of 2002. | |||||
| 32.2 | †† | Certification of Chief Financial Officer pursuant to 18 U.S.C. Section 1350, as adopted pursuant to Section 906 of the Sarbanes-Oxley Act of 2002. | |||||
- †
- Previously
filed.
- ††
- Filed
herewith.
- *
- Confidential
portions have been filed separately with the Commission.
- **
- To be filed by amendment.
59
GLOBAL GEOPHYSICAL SERVICES, INC.
INDEX TO CONSOLIDATED FINANCIAL STATEMENTS
F-1
Report of Independent Registered Public Accounting Firm
To
the Board of Directors of and Stockholders
Global Geophysical Services, Inc. and Subsidiaries
Houston, Texas
We have audited the accompanying consolidated balance sheets of Global Geophysical Services, Inc. and Subsidiaries (the "Company") as of December 31, 2010 and 2009, and the related consolidated statements of operations, stockholders' equity and cash flows for each of the years in the three-year period ended December 31, 2010. These consolidated financial statements are the responsibility of the Company's management. Our responsibility is to express an opinion on these consolidated financial statements based on our audits.
We conducted our audits in accordance with the standards of the Public Company Accounting Oversight Board (United States). Those standards require that we plan and perform the audits to obtain reasonable assurance about whether the consolidated financial statements are free of material misstatement. An audit includes examining, on a test basis, evidence supporting the amounts and disclosures in the consolidated financial statements. An audit also includes assessing the accounting principles used and significant estimates made by management, as well as evaluating the overall consolidated financial statement presentation. We believe that our audits provide a reasonable basis for our opinion. The Company is not required to have nor were we engaged to perform an audit of the Company's internal control over financial reporting. Our audits included consideration of internal control over financial reporting as a basis for designing audit procedures that are appropriate in the circumstances, but not for the purpose of expressing an opinion on the effectiveness of the Company's internal control over financial reporting. Accordingly, we express no such opinion.
In our opinion, the consolidated financial statements referred to above present fairly, in all material respects, the consolidated financial position of Global Geophysical Services, Inc. and Subsidiaries as of December 31, 2010 and 2009, and the consolidated results of their operations and cash flows for each of the years in the three-year period ended December 31, 2010, in conformity with accounting principles generally accepted in the United States of America.
/s/ UHY LLP
Houston,
Texas
March 18, 2011
F-2
GLOBAL GEOPHYSICAL SERVICES, INC. AND SUBSIDIARIES
CONSOLIDATED BALANCE SHEETS
| |
December 31, | ||||||||
|---|---|---|---|---|---|---|---|---|---|
| |
2010 | 2009 | |||||||
ASSETS |
|||||||||
CURRENT ASSETS |
|||||||||
Cash and cash equivalents |
$ | 28,237,302 | $ | 17,026,865 | |||||
Restricted cash investments |
2,443,857 | 5,346,066 | |||||||
Accounts receivable, net |
69,509,391 | 73,568,184 | |||||||
Income and other taxes receivable |
6,954,864 | 10,159,498 | |||||||
Prepaid expenses and other current assets |
4,842,496 | 10,626,831 | |||||||
TOTAL CURRENT ASSETS |
111,987,910 | 116,727,444 | |||||||
MULTI-CLIENT LIBRARY, net |
145,896,355 |
37,395,521 |
|||||||
PROPERTY AND EQUIPMENT, net |
126,963,953 |
140,217,953 |
|||||||
GOODWILL AND OTHER INTANGIBLES, net |
20,251,775 |
15,974,103 |
|||||||
DEFERRED TAX ASSET |
2,031,048 |
— |
|||||||
OTHER |
6,135,459 |
6,304,570 |
|||||||
TOTAL ASSETS |
$ | 413,266,500 | $ | 316,619,591 | |||||
See accompanying notes to consolidated financial statements.
F-3
GLOBAL GEOPHYSICAL SERVICES, INC. AND SUBSIDIARIES
CONSOLIDATED BALANCE SHEETS (Continued)
| |
December 31, | ||||||||
|---|---|---|---|---|---|---|---|---|---|
| |
2010 | 2009 | |||||||
LIABILITIES AND STOCKHOLDERS' EQUITY |
|||||||||
CURRENT LIABILITIES |
|||||||||
Accounts payable and accrued expenses |
$ | 44,058,306 | $ | 34,272,606 | |||||
Current portion of long-term debt |
3,344,261 | 1,983,282 | |||||||
Current portion of capital lease obligations |
— | 1,767,353 | |||||||
Income and other taxes payable |
5,601,356 | 875,255 | |||||||
Deferred revenue |
47,496,895 | 43,545,291 | |||||||
Liability on derivative instruments |
— | 331,163 | |||||||
TOTAL CURRENT LIABILITIES |
100,500,818 | 82,774,950 | |||||||
DEFERRED INCOME TAXES |
— |
3,826,131 |
|||||||
LONG-TERM DEBT, net of current portion and unamortized discount |
209,418,242 |
165,794,658 |
|||||||
CAPITAL LEASE OBLIGATIONS, net of current portion |
— |
295,665 |
|||||||
NONCONTROLLING INTERESTS |
1,490,745 |
— |
|||||||
TOTAL LIABILITIES |
311,409,805 | 252,691,404 | |||||||
COMMITMENTS AND CONTINGENCIES (NOTE 15) |
|||||||||
STOCKHOLDERS' EQUITY |
|||||||||
Common Stock, $.01 par value, authorized 100,000,000 and 0 shares, 45,586,215 and 0 issued and 36,142,985 and 0 outstanding at December 31, 2010 and 2009, respectively |
455,862 | — | |||||||
Preferred Stock, $.01 par value, authorized 5,000,000 and 0 shares, 0 and 0 issued and outstanding at December 31, 2010 and 2009, respectively |
— | — | |||||||
Series A Convertible Preferred Stock, $.01 par value, authorized 0 and 50,000,000 shares, 0 and 28,358,394 issued and 0 and 20,617,751 outstanding at December 31, 2010 and 2009, respectively |
— | 283,584 | |||||||
Class A Common stock, $.01 par value, authorized 0 and 30,000,000 shares, 0 and 4,000,000 issued and 0 and 3,709,100 outstanding at December 31, 2010 and 2009, respectively |
— | 40,000 | |||||||
Class B Common stock, $.01 par value, authorized 0 and 120,000,000 shares, 0 and 5,736,107 issued and 0 and 4,471,021 outstanding at December 31, 2010 and 2009, respectively |
— | 57,361 | |||||||
Additional paid-in capital |
239,248,935 | 160,362,017 | |||||||
Accumulated deficit |
(42,145,755 | ) | (2,429,862 | ) | |||||
|
197,559,042 | 158,313,100 | |||||||
Less: treasury stock, at cost, 9,443,230 and 9,296,629 shares at December 31, 2010 and 2009, respectively |
95,702,347 | 94,384,913 | |||||||
TOTAL STOCKHOLDERS' EQUITY |
101,856,695 | 63,928,187 | |||||||
TOTAL LIABILITIES AND STOCKHOLDERS' EQUITY |
$ | 413,266,500 | $ | 316,619,591 | |||||
See accompanying notes to consolidated financial statements.
F-4
GLOBAL GEOPHYSICAL SERVICES, INC. AND SUBSIDIARIES
CONSOLIDATED STATEMENTS OF OPERATIONS
| |
Year Ended December 31, | |||||||||||
|---|---|---|---|---|---|---|---|---|---|---|---|---|
| |
2010 | 2009 | 2008 | |||||||||
REVENUES |
$ | 254,704,813 | $ | 312,796,377 | $ | 376,256,261 | ||||||
OPERATING EXPENSES |
225,327,226 |
262,168,382 |
319,451,408 |
|||||||||
GROSS PROFIT |
29,377,587 | 50,627,995 | 56,804,853 | |||||||||
SELLING, GENERAL, AND ADMINISTRATIVE EXPENSES |
40,386,854 |
32,299,663 |
30,190,204 |
|||||||||
INCOME (LOSS) FROM OPERATIONS |
(11,009,267 | ) | 18,328,332 | 26,614,649 | ||||||||
OTHER INCOME (EXPENSE) |
||||||||||||
Interest expense, net |
(21,268,611 | ) | (18,613,301 | ) | (22,383,705 | ) | ||||||
Unrealized gain (loss) on derivative instruments |
331,163 | 822,094 | (1,153,257 | ) | ||||||||
Foreign exchange gain (loss) |
(947,289 | ) | 236,770 | (5,210,431 | ) | |||||||
Loss on extinguishment of debt |
(6,035,841 | ) | — | — | ||||||||
Other income (expense) |
(24,584 | ) | (35,839 | ) | 113,901 | |||||||
TOTAL OTHER EXPENSE |
(27,945,162 | ) | (17,590,276 | ) | (28,633,492 | ) | ||||||
INCOME (LOSS) BEFORE INCOME TAXES |
(38,954,429 | ) | 738,056 | (2,018,843 | ) | |||||||
INCOME TAX EXPENSE (BENEFIT) |
||||||||||||
Current |
6,457,124 | (336,439 | ) | 7,453,873 | ||||||||
Deferred |
(5,857,179 | ) | 629,136 | (1,426,627 | ) | |||||||
TOTAL INCOME TAX EXPENSE |
599,945 | 292,697 | 6,027,246 | |||||||||
INCOME (LOSS) AFTER INCOME TAXES |
(39,554,374 | ) | 445,359 | (8,046,089 | ) | |||||||
NET INCOME, attributable to noncontrolling interests |
161,519 |
— |
— |
|||||||||
NET INCOME (LOSS), attributable to common shareholders |
$ | (39,715,893 | ) | $ | 445,359 | $ | (8,046,089 | ) | ||||
INCOME (LOSS) PER COMMON SHARE |
||||||||||||
Basic |
$ | (1.44 | ) | $ | .05 | $ | (.98 | ) | ||||
Diluted |
$ | (1.44 | ) | $ | .02 | $ | (.98 | ) | ||||
WEIGHTED AVERAGE SHARES OUTSTANDING |
||||||||||||
Basic |
27,517,050 | 8,187,506 | 8,173,554 | |||||||||
Diluted |
27,517,050 | 28,787,643 | 8,173,554 | |||||||||
See accompanying notes to consolidated financial statements.
F-5
GLOBAL GEOPHYSICAL SERVICES, INC. AND SUBSIDIARIES
CONSOLIDATED STATEMENTS OF STOCKHOLDERS' EQUITY
DECEMBER 31, 2010, 2009 AND 2008
| |
|
Common Stock | |
|
|
|
|
||||||||||||||||||
|---|---|---|---|---|---|---|---|---|---|---|---|---|---|---|---|---|---|---|---|---|---|---|---|---|---|
| |
Preferred Stock |
Common Stock | Additional Paid-in Capital |
Treasury Stock |
Accumulated Deficit |
Total Stockholders' Equity |
|||||||||||||||||||
| |
Class A | Class B | |||||||||||||||||||||||
Balances at December 31, 2007 |
$ | 277,010 | $ | 40,000 | $ | 54,193 | $ | — | $ | 152,095,935 | $ | (87,592,915 | ) | $ | 5,170,868 | $ | 70,045,091 | ||||||||
Issuance of common stock |
— | — | 1,278 | — | — | — | — | 1,278 | |||||||||||||||||
Issuance of preferred stock |
— | — | — | — | — | — | — | — | |||||||||||||||||
Compensation expense associated with stock grants |
— | — | — | — | 1,229,420 | — | — | 1,229,420 | |||||||||||||||||
Purchase of treasury stock |
— | — | — | — | — | (619,710 | ) | — | (619,710 | ) | |||||||||||||||
Net loss attributable to common shareholders |
— | — | — | — | — | — | (8,046,089 | ) | (8,046,089 | ) | |||||||||||||||
Balances at December 31, 2008 |
277,010 | 40,000 | 55,471 | — | 153,325,355 | (88,212,625 | ) | (2,875,221 | ) | 62,609,990 | |||||||||||||||
Issuance of common stock |
— | — | 1,890 | — | — | — | — | 1,890 | |||||||||||||||||
Issuance of preferred stock |
6,574 | — | — | — | 5,515,200 | — | — | 5,521,774 | |||||||||||||||||
Compensation expense associated with stock grants |
— | — | — | — | 1,521,462 | — | — | 1,521,462 | |||||||||||||||||
Purchase of treasury stock |
— | — | — | — | — | (6,172,288 | ) | — | (6,172,288 | ) | |||||||||||||||
Net income attributable to common shareholders |
— | — | — | — | — | — | 445,359 | 445,359 | |||||||||||||||||
Balances at December 31, 2009 |
283,584 | 40,000 | 57,361 | — | 160,362,017 | (94,384,913 | ) | (2,429,862 | ) | 63,928,187 | |||||||||||||||
Issuance of common stock, net of costs of issuance of $7,573,652 |
— | — | 1,021 | 73,896 | 76,356,347 | — | — | 76,431,264 | |||||||||||||||||
Conversion to common stock |
(283,584 | ) | (40,000 | ) | (58,382 | ) | 381,966 | — | — | — | — | ||||||||||||||
Compensation expense associated with stock grants |
— | — | — | — | 3,129,291 | — | — | 3,129,291 | |||||||||||||||||
Charitable contribution expense associated with stock grant |
— | — | — | — | 103,190 | — | — | 103,190 | |||||||||||||||||
Put option liability |
— | — | — | — | (701,910 | ) | — | — | (701,910 | ) | |||||||||||||||
Purchase of treasury stock |
— | — | — | — | — | (1,317,434 | ) | — | (1,317,434 | ) | |||||||||||||||
Net loss attributable to common shareholders |
— | — | — | — | — | — | (39,715,893 | ) | (39,715,893 | ) | |||||||||||||||
Balances at December 31, 2010 |
$ | — | $ | — | $ | — | $ | 455,862 | $ | 239,248,935 | $ | (95,702,347 | ) | $ | (42,145,755 | ) | $ | 101,856,695 | |||||||
See accompanying notes to consolidated financial statements.
F-6
GLOBAL GEOPHYSICAL SERVICES, INC. AND SUBSIDIARIES
CONSOLIDATED STATEMENTS OF CASH FLOWS
| |
Year Ended December 31, | |||||||||||
|---|---|---|---|---|---|---|---|---|---|---|---|---|
| |
2010 | 2009 | 2008 | |||||||||
CASH FLOWS FROM OPERATING ACTIVITIES |
||||||||||||
Net (loss) income, attributable to common shareholders |
$ | (39,715,893 | ) | $ | 445,359 | $ | (8,046,089 | ) | ||||
Adjustments to reconcile net (loss) income to net cash provided by operating activities: |
||||||||||||
Depreciation and amortization expense |
149,562,465 | 80,089,658 | 73,914,146 | |||||||||
Capitalized depreciation for Multi-client library |
(20,369,366 | ) | (3,729,362 | ) | (3,037,442 | ) | ||||||
Amortization of debt issuance costs |
1,040,817 | 917,792 | 3,805,508 | |||||||||
Loss on extinguishment of debt |
6,035,841 | — | — | |||||||||
Noncontrolling interest |
161,519 | — | — | |||||||||
Stock-based compensation |
3,129,291 | 1,521,462 | 1,229,420 | |||||||||
Non-cash charitable contribution |
103,190 | — | — | |||||||||
Non-cash revenue from Multi-client data exchange |
(9,381,991 | ) | (8,880,000 | ) | — | |||||||
Deferred tax (benefit) expense |
(5,857,179 | ) | 629,136 | (1,426,627 | ) | |||||||
Unrealized gain on derivative instrument |
(331,163 | ) | (822,094 | ) | 1,153,257 | |||||||
Loss on disposal of property and equipment |
2,628,811 | — | (818,668 | ) | ||||||||
Effects of changes in operating assets and liabilities: |
||||||||||||
Accounts receivable, net |
4,058,793 | (9,213,863 | ) | (22,306,396 | ) | |||||||
Prepaid expenses and other current assets |
8,334,335 | 2,963,953 | 3,031,716 | |||||||||
Other assets |
1,527,315 | (1,552,545 | ) | (548,721 | ) | |||||||
Accounts payable and accrued expenses |
3,729,397 | (1,767,333 | ) | (10,331,182 | ) | |||||||
Deferred revenue |
3,254,894 | 33,545,953 | 3,056,315 | |||||||||
Income and other taxes receivable |
3,204,634 | (7,854,943 | ) | (2,304,555 | ) | |||||||
Income and other taxes payable |
4,726,101 | (5,897,455 | ) | 3,741,914 | ||||||||
NET CASH PROVIDED BY OPERATING ACTIVITIES |
115,841,811 | 80,395,718 | 41,112,596 | |||||||||
CASH FLOWS FROM INVESTING ACTIVITIES |
||||||||||||
Purchase of property and equipment |
(39,987,473 | ) | (21,143,151 | ) | (49,843,664 | ) | ||||||
Investment in Multi-client library |
(170,755,194 | ) | (34,352,781 | ) | (25,169,740 | ) | ||||||
Change in restricted cash investments |
2,902,209 | 2,216,272 | (5,165,338 | ) | ||||||||
Purchase of business |
(6,718,067 | ) | — | (10,375,000 | ) | |||||||
Noncontrolling interests |
1,329,226 | — | — | |||||||||
Proceeds from the sale of property and equipment |
497,411 | — | — | |||||||||
Proceeds from insurance claim |
— | — | 5,855,000 | |||||||||
NET CASH USED IN INVESTING ACTIVITIES |
(212,731,888 | ) | (53,279,660 | ) | (84,698,742 | ) | ||||||
CASH FLOWS FROM FINANCING ACTIVITIES |
||||||||||||
Proceeds from long-term debt, net of discount |
196,449,261 | 7,596,074 | 188,340,731 | |||||||||
Principal payments on long-term debt |
(170,477,253 | ) | (11,069,662 | ) | (121,423,726 | ) | ||||||
Net (payments) proceeds on revolving credit facility |
15,000,000 | (25,832,055 | ) | 1,632,055 | ||||||||
Debt issuance costs |
(5,922,307 | ) | — | (5,223,122 | ) | |||||||
Principal payments on capital lease obligations |
(2,063,018 | ) | (5,057,468 | ) | (5,597,366 | ) | ||||||
Purchase of treasury stock |
(1,317,434 | ) | (6,172,288 | ) | (619,710 | ) | ||||||
Issuances of stock, net |
76,431,265 | 1,890 | 1,278 | |||||||||
NET CASH PROVIDED BY (USED IN) FINANCING ACTIVITIES |
108,100,514 | (40,533,509 | ) | 57,110,140 | ||||||||
NET INCREASE (DECREASE) IN CASH AND CASH EQUIVALENTS |
11,210,437 | (13,417,451 | ) | 13,523,994 | ||||||||
CASH AND CASH EQUIVALENTS, beginning of period |
17,026,865 |
30,444,316 |
16,920,322 |
|||||||||
CASH AND CASH EQUIVALENTS, end of period |
$ | 28,237,302 | $ | 17,026,865 | $ | 30,444,316 | ||||||
See accompanying notes to consolidated financial statements.
F-7
NOTE 1—ORGANIZATION AND NATURE OF OPERATIONS
Global Geophysical Services, Inc., a Delaware corporation, and its subsidiaries (collectively referred to as the "Company") are headquartered in Houston, Texas. The Company provides an integrated suite of seismic data solutions to the global oil and gas industry, including the Company's high resolution RG-3D Reservoir Grade™ ("RG3D") seismic service. The Company's seismic data solutions consist primarily of seismic data acquisition, processing and interpretation services. Through these services, the Company delivers data that enables the creation of high quality images of the Earth's subsurface that reveal complex structural and stratigraphic details. These images are used primarily by oil and gas companies to reduce risk associated with oil and gas exploration, to optimize well completion techniques and to monitor changes in hydrocarbon reservoirs. The Company integrates seismic survey design, data acquisition, processing and interpretation to deliver an enhanced product to clients. In addition, the Company owns and markets a growing seismic data library and licenses this data to clients on a non-exclusive basis.
NOTE 2—SUMMARY OF SIGNIFICANT ACCOUNTING POLICIES
Revenue Recognition:
Proprietary services
The Company's seismic services are provided under cancelable service contracts, which vary in terms and conditions. The Company recognizes revenue in accordance with the terms of the contract. These contracts are either "turnkey" or "term" agreements or a combination of the two. Under turnkey agreements or the turnkey portions thereof, the Company recognizes revenue based upon quantifiable measures of progress, such as square miles or linear kilometers of data acquired. Under term agreements or the term portions thereof, period revenue is recognized on a day-rate basis. Under certain contracts where the client pays separately for the mobilization of equipment, the Company recognizes such mobilization fees as revenue during the performance of the seismic acquisition, using the same quantifiable measures of progress as for the acquisition work. The Company also receives reimbursements for certain other out-of-pocket expenses under the terms of its service contracts. The Company records amounts billed to clients in revenue at the gross amount including out-of-pocket expenses that are reimbursed by the client. In some instances, customers are billed in advance of services performed and the Company recognizes the liability as deferred revenue.
Multi-client Services
The Company generates Multi-client revenues by granting a license to seismic data. This allows clients to have access to seismic data at a cost that is generally less than acquiring data on a proprietary basis. The Company's Multi-client projects differ from seismic data services projects in that the Company sets the specifications of the program, generally handles all aspects of the seismic data acquisition and maintains ownership of the seismic data and its corresponding revenue stream.
Revenues are recorded under arrangements from the licensing of Multi-client data as pre-commitments, late sales and / or data swap transactions. Once a contract is signed, it will be classified as a pre-commitment, or a late sale and the entire contract will follow revenue recognition as transcribed below.
Revenues from the creation of Multi-client projects are recognized when (i) the Company has an arrangement with the customer that is validated by a signed contract, (ii) the sales price is fixed and determinable, (iii) collection is reasonably assured, and (iv) delivery, 'as defined below' has occurred. When the above criteria has been satisfied, the Company recognizes revenue using the proportionate
F-8
NOTE 2—SUMMARY OF SIGNIFICANT ACCOUNTING POLICIES (Continued)
performance method based upon quantifiable measures of progress such as square mile or linear kilometer of data acquired.
Revenues associated from a data swap transaction are recognized as a pre-commitment or late sale when (i) the Company has an arrangement with the customer that is validated by a signed contract, (ii) the value is determined according to Company policy, and (iii) the asset exchanged for has been received. Delivery is defined as 'data is made available to the customer to view'.
If the data is subject to any incremental processing, the Company holds back a portion of the revenue to be recognized upon the delivery of the processed data to the customer. This hold back is calculated as a percentage of the data processing cost remaining to complete over the entire cost of the project.
Pre-Commitment Revenues
Pre-Commitments represent one classification of Multi-client revenue. Pre-commitment revenues are contractual obligations whereby a client commits funds in advance of the Company's acquisition of seismic data. In return for these pre-commitments, clients typically have some input with respect to project specifications and receive preferential pricing. The Company records pre-commitment payments as deferred revenue when they are received and records them as revenue on the basis of proportionate performance.
Late Sale Revenues
Late Sales represent another classification of Multi-client revenues. For any contract, if all or any portion of the data has been acquired by the Company and it can be made available to view by the customer, it will be classified as a late sale. For late sale contracts any portion associated with data which has not been acquired will be deferred and recognized as revenue on the basis of proportionate performance.
Multi-client Library
All costs directly incurred in acquiring, processing and otherwise completing a seismic survey are capitalized into the Multi-client library. The Company establishes amortization rates based on the estimated future revenues (both from pre-commitments and late sales) on an individual survey basis. The underlying estimates that form the basis for the sales forecast depend on historical and recent revenue trends, oil and gas prospectivity in particular regions, general economic conditions affecting the customer base, expected changes in technology and other factors. The estimation of future cash flows and fair value is highly subjective and inherently imprecise. Estimates can change materially from period to period based on many factors. Accordingly, if conditions change in the future, an impairment loss may be recorded relative to the seismic data library, which could be material to any particular reporting period. However, under no circumstance will an individual survey carry a net book value greater than a four-year straight-line amortized value. This is accomplished by comparing the cumulative amortization recorded for each survey to the cumulative straight-line amortization. If the cumulative straight-line amortization is higher for any specific survey, additional amortization expense is recorded, resulting in accumulated amortization being equal to the cumulative straight-line amortization for such survey. Amortization expense of the Multi-client seismic data was $92,702,426, $18,629,279 and $19,144,525 for the years ended December 31, 2010, 2009 and 2008, respectively.
F-9
NOTE 2—SUMMARY OF SIGNIFICANT ACCOUNTING POLICIES (Continued)
Non-Monetary Transactions
The Company participates in certain non-cash data exchange transactions, in which the Company takes ownership of a customer's seismic data in exchange for a non-exclusive license to selected seismic data from the Multi-client library. In these non-cash data exchange transactions, the Company records a data library asset for the data received and recognizes revenue on the transaction in accordance with its revenue recognition policy. These transactions are valued at the fair value of the data received or delivered, whichever is more readily determinable. For the years ended December 31, 2010, 2009, and 2008, the Company has recognized $9,381,991, $8,880,000, and $0 respectively, as revenue related to non-cash data transactions.
Mobilization Costs: Transportation and other expenses incurred prior to the commencement of geophysical operations are deferred and amortized over the term of the related contract. See Note 3.
Financial Instruments: Financial instruments consist of cash and cash equivalents, accounts receivable and payables, and debt. The carrying value of cash and cash equivalents and accounts receivable and payables approximate fair value due to their short-term nature. The Company believes the fair value and the carrying value of all other debt would not be materially different due to the instruments' interest rates approximating market rates for similar borrowings at December 31, 2010 and 2009.
Cash and Cash Equivalents: The Company considers all highly liquid investments purchased with an original maturity of three months or less to be cash equivalents.
Accounts Receivable: Trade accounts receivables are recorded in accordance with terms and amounts specified in the related contracts on an ongoing basis. Amounts recorded as unbilled represent work done for customers but not billed at period end in accordance with contract provisions and generally are expected to be billed within a relatively short period of time. Management of the Company continually monitors accounts receivable for collectability issues. The Company evaluates the collectability of accounts receivable on a specific account basis using a combination of factors, including the age of the outstanding balances, evaluation of the customer's financial condition, and discussions with relevant Company personnel and with the customers directly. The allowance for doubtful accounts was $3,484,612 and $1,697,830 at December 31, 2010 and 2009, respectively.
The Company sometimes experiences disagreements or disputes with customers relating to the Company's charges. As of December 31, 2010, the Company had disputes with certain customers which relate to charges for the Company's services. Included in accounts receivable at December 31, 2010 are net receivables of approximately $4,800,000 related to such disputes. If the amount ultimately recovered with respect to any of these disputes is less than the revenue previously recorded, the difference will be recorded as an expense. None of these are expected to have a materially adverse effect on the Company's earnings. Bad debt expense for the years ended December 31, 2010 and 2009 was $3,090,972 and $4,096,646, respectively.
Property and Equipment: Property and equipment are stated at cost. Depreciation is computed on the straight-line basis over the estimated useful lives of the various classes of assets as follows:
| Boats | 10 years | |
| Computers and software | 3 years | |
| Furniture and fixtures | 1 - 2 years | |
| Machinery and equipment | 3 - 7 years |
F-10
NOTE 2—SUMMARY OF SIGNIFICANT ACCOUNTING POLICIES (Continued)
Management's estimation of useful life is based on circumstances that exist in the seismic industry and information available at the time of the asset purchase. As circumstances change and new information becomes available these estimates could change.
Disposals are removed at cost less accumulated depreciation with any resulting gain or loss reflected in income (loss) from operations within the statements of operations during the reporting period. During the years ended December 31, 2010, 2009 and 2008, the Company disposed of property and equipment, incurring a loss of $2,628,811, $0 and $818,668, respectively, which is included in operating expenses. Substantially all of the Company's assets are pledged as collateral to secure debt.
Goodwill: Goodwill represents the excess of costs over the fair value of net assets of acquired businesses. Goodwill acquired in a business combination is not amortized, but instead tested for impairment at least annually or when indicators of impairment are present. Under this goodwill impairment test, if the fair value of a reporting unit does not exceed its carrying value, the excess of fair value of the reporting unit over the fair value of its net assets is considered to be the implied fair value of goodwill. If the carrying value of goodwill exceeds its implied fair value, the difference is recognized as a loss on impairment of goodwill. Goodwill was evaluated for impairment at December 31, 2010 and was not deemed to be impaired.
Asset Impairment: In accordance with the guidance for accounting for impairment or disposal of long-lived assets, the Company evaluates the recoverability of property and equipment and its Multi-client data library if facts and circumstances indicate that any of those assets might be impaired. If an evaluation is required, the estimated future undiscounted cash flows associated with the asset are compared to the asset's carrying amount to determine if an impairment of such property and Multi-client data library is necessary. The effect of any impairment would be to expense the difference between the fair value of such property and its carrying value. There were no impairment charges in the statements of operations during the years ended December 31, 2010, 2009 and 2008, respectively.
For the Multi-client data library, the impairment evaluation is based first on a comparison of the undiscounted future cash flows over each component's remaining estimated useful life with the carrying value of each library component. If the undiscounted cash flows are equal to or greater than the carrying value of such component, no impairment is recorded. If undiscounted cash flows are less than the carrying value of any component, the forecast of future cash flows related to such component is discounted to fair value and compared with such component's carrying amount. The difference between the library components's carrying amount and the discounted future value of the expected revenue stream is recorded as an impairment charge. There were no impairment charges recognized in the statements of operations during the years ended December 31, 2010, 2009 and 2008.
Deferred Revenue: Deferred revenue consists primarily of amounts contractually billable or client payments made in advance of work done and deferred fees related to the mobilization period. These amounts are amortized over the term of the related contract. As of December 31, 2010 and 2009, the deferred revenue balance was $47,496,895 and $43,545,291, respectively.
Treasury Stock: The Company utilizes the cost method for accounting for its treasury stock acquisitions and dispositions.
Stock Warrants: At December 31, 2010, the Company had outstanding warrants which entitle the holders to purchase an aggregate of 390,000 shares of Common Stock of the Company at an exercise price of $4.25 per share.
F-11
NOTE 2—SUMMARY OF SIGNIFICANT ACCOUNTING POLICIES (Continued)
Debt Issuance Costs: The costs related to the issuance of debt are capitalized and amortized to interest expense using the effective interest method over the maturity period of the related debt. Accumulated amortization was $396,248 and $1,159,580 at December 31, 2010 and 2009, respectively.
In 2010 the Company recognized a loss on the extinguishment of debt in the amount of $6,035,841, which consisted of $4,005,707 and $2,030,134 for the debt issuance costs and the unamortized portion of the original issue discount, respectively, related to the Company's Prior Facilities upon refinancing with the Notes offering in April 2010. See Note 9.
Concentrations of Credit Risk: The Company maintains its cash in bank deposits with a financial institution. These deposits, at times, exceed federally insured limits. In July 2010, the Federal Insurance Corporation permanently increased its insurance from $100,000 to $250,000 per depositor and in November 2010 temporarily extended coverage, through December 2012, to an unlimited amount for non-interest bearing accounts. The Company monitors the financial condition of the financial institution and has not experienced any losses on such accounts. The Company is not party to any financial instruments which would have off-balance sheet credit or interest rate risk.
Advertising: Advertising costs are expensed as incurred and were approximately $596,000, $355,000 and $347,500 for the years ended December 2010, 2009 and 2008, respectively.
Income Taxes: The Company follows current guidance in accounting for income taxes. Under the asset and liability method required by this guidance, deferred tax assets and liabilities are recognized for the future tax consequences attributable to differences between the financial statement carrying amounts of existing assets and liabilities and their respective tax bases. Deferred tax assets and liabilities are measured using enacted tax rates expected to apply to taxable income in the years in which those temporary differences are expected to be recovered or settled. The effect on deferred tax assets and liabilities of a change in tax rates is recognized in income in the period that includes the enactment date. A deferred tax asset will be reduced by a valuation allowance when, based on the Company's estimates, it is more likely than not that a portion of those assets will not be realized in a future period.
The Company follows current guidance regarding the accounting for uncertainty in income taxes. This guidance clarifies the accounting for income taxes by prescribing the minimum recognition threshold that an income tax position is required to meet before recognizing in the consolidated financial statements and applies to all income tax positions. Each income tax position is assessed using a two-step process. A determination is first made as to whether it is more likely than not that the income tax position will be sustained, based upon technical merits, upon examination by the taxing authorities. If the income tax position is expected to meet the more likely than not criteria, the benefit recorded in the consolidated financial statements equals the largest amount that is greater than 50% likely to be realized upon its ultimate settlement. Accordingly, the Company continues to recognize income tax related penalties and interest in the provision for income taxes.
Earnings Per Share: The Company accounts for earnings per share in accordance with current guidance for earnings per share. Basic earnings per share amounts are calculated by dividing net income (loss) by the weighted average number of common shares outstanding during each period. Diluted earnings per share is calculated by dividing net income (loss) by the weighted average number of common shares outstanding for the periods, including the dilutive effect of restricted stock, options and warrants granted. Dilutive restricted stock, options, and warrants that are issued during a period or that expire or are canceled during a period are reflected in the computations for the time they were outstanding during the periods being reported. Restricted stock, options and warrants, where the exercise price exceeds the average stock price for the period, are considered anti-dilutive and therefore are not included in the calculation of dilutive shares.
F-12
NOTE 2—SUMMARY OF SIGNIFICANT ACCOUNTING POLICIES (Continued)
Foreign Operations: The Company's future revenues, in part, depend on operating results from its operations in foreign countries. The success of the Company's operations is subject to various contingencies beyond management's control. These contingencies include general and regional economic conditions, prices for crude oil and natural gas, competition and changes in regulation.
The Company enters into transactions that are not denominated in U.S. dollars. The transactions are translated to U.S. dollars and the exchange gains and losses are reported in other expense within the consolidated statements of operations.
Use of Estimates: The preparation of consolidated financial statements in conformity with accounting principles generally accepted in the United States of America requires management to make estimates and assumptions that affect the amounts reported of assets and liabilities and disclosure of contingent assets and liabilities at the date of the consolidated financial statements and the reported amounts of revenues and expenses during the reporting period. Actual results could differ from those estimates.
Reclassifications: Certain amounts in the 2009 and 2008 consolidated financial statements have been reclassified to conform to the classifications in the 2010 consolidated financial statements.
NOTE 3—SELECTED BALANCE SHEET ACCOUNTS
Restricted cash:
| |
December 31, | ||||||
|---|---|---|---|---|---|---|---|
| |
2010 | 2009 | |||||
Pledged for letters of credit |
$ | 2,443,857 | $ | 4,462,500 | |||
Bank guarantee to a foreign government for export of equipment |
— | 883,566 | |||||
|
$ | 2,443,857 | $ | 5,346,066 | |||
Prepaid expenses and other current assets:
| |
December 31, | ||||||
|---|---|---|---|---|---|---|---|
| |
2010 | 2009 | |||||
Mobilization costs, net |
$ | 1,368,858 | $ | 9,410,108 | |||
Prepaid expenses and other current assets |
923,638 | 1,216,723 | |||||
Note receivable, current portion |
2,550,000 | — | |||||
|
$ | 4,842,496 | $ | 10,626,831 | |||
Accounts receivable:
| |
December 31, | ||||||
|---|---|---|---|---|---|---|---|
| |
2010 | 2009 | |||||
Accounts receivable, trade |
$ | 47,775,478 | $ | 57,731,675 | |||
Unbilled |
25,218,525 | 17,534,339 | |||||
Allowance for doubtful accounts |
(3,484,612 | ) | (1,697,830 | ) | |||
|
$ | 69,509,391 | $ | 73,568,184 | |||
F-13
NOTE 3—SELECTED BALANCE SHEET ACCOUNTS (Continued)
Other:
| |
December 31, | ||||||
|---|---|---|---|---|---|---|---|
| |
2010 | 2009 | |||||
Debt issuance costs, net |
$ | 5,526,060 | $ | 4,167,856 | |||
Other |
609,399 | 2,136,714 | |||||
|
$ | 6,135,459 | $ | 6,304,570 | |||
NOTE 4—MULTI-CLIENT LIBRARY
Multi-client library consisted of the following:
| |
December 31, | ||||||
|---|---|---|---|---|---|---|---|
| |
2010 | 2009 | |||||
Multi-client library, at cost |
$ | 276,372,586 | $ | 75,169,326 | |||
Less: accumulated amortization |
130,476,231 | 37,773,805 | |||||
Multi-client library, net |
$ | 145,896,355 | $ | 37,395,521 | |||
NOTE 5—PROPERTY AND EQUIPMENT
Property and equipment consisted of the following:
| |
December 31, | ||||||
|---|---|---|---|---|---|---|---|
| |
2010 | 2009 | |||||
Furniture and fixtures |
$ | 138,976 | $ | 138,976 | |||
Boats |
7,174,287 | 6,424,288 | |||||
Machinery and equipment |
300,785,427 | 270,210,793 | |||||
Computers and software |
10,134,094 | 9,177,907 | |||||
Land |
2,035,153 | 2,035,153 | |||||
Buildings |
11,721,548 | 11,721,548 | |||||
|
331,989,485 | 299,708,665 | |||||
Less: accumulated depreciation |
214,156,447 | 160,759,486 | |||||
|
117,833,038 | 138,949,179 | |||||
Construction in process |
9,130,915 | 1,268,774 | |||||
Net property and equipment |
$ | 126,963,953 | $ | 140,217,953 | |||
The following table represents an analysis of depreciation expense:
| |
Year Ended December 31, | |||||||||
|---|---|---|---|---|---|---|---|---|---|---|
| |
2010 | 2009 | 2008 | |||||||
Gross depreciation expense |
$ | 56,265,394 | $ | 60,583,280 | $ | 54,774,621 | ||||
Less: Capitalized depreciation for Multi-client library |
20,369,366 | 3,729,362 | 3,037,442 | |||||||
Net depreciation expense |
$ | 35,896,028 | $ | 56,853,918 | $ | 51,737,179 | ||||
F-14
NOTE 6—GOODWILL AND OTHER INTANGIBLES
In June 2008, the Company acquired substantially all of the assets of WeinmanGeoscience, Inc. ("Weinman") for the aggregate purchase price of approximately $22.0 million, including $10.0 million paid in cash and $12.0 million assumed as debt through the issuance of two promissory notes for $6.6 million and $5.4 million, respectively, due December 2010. Additional consideration of $10.0 million of cash or equity would be paid in 2010 if certain earn-out provisions are met. As a result of the acquisition, the Company recorded goodwill of $13,445,576 and other intangibles of $5,504,000.
In June 2009, the Company recorded a purchase accounting adjustment of approximately $2.5 million to reflect an amendment of the terms of the earn-out provision of the acquisition agreement and the conversion of $8.0 million of the principal amount of the promissory notes due to Weinman into 657,354 shares of Series A Convertible Preferred Stock. Consequently, the Company reduced notes payable by $8.0 million to reflect the conversion of debt to equity, increased stockholders' equity to reflect the issuance of 657,354 shares at a value of $8.40 per share, and reduced goodwill by the implied change of the earn-out provision of the acquisition agreement of $2,478,226.
In addition, during 2008 the Company acquired substantially all of the assets of HMS Enterprises ("HMS"), a small seismic cable repair company, for a purchase price of $1,500,000, of which $375,000 was paid in cash and the balance of $1,125,000 is to be paid in shares of the Company in the event of an initial public offering. Such amount is included in Other Long-term Liability in the consolidated balance sheet at December 31, 2008. The Company and the seller entered into an agreement under which the Company is no longer obliged to issue shares of the Company. Accordingly, the reduction in the Other Long-term Liability has been offset against associated goodwill.
During 2010, the Company purchased substantially all of the assets of certain businesses for an aggregate purchase price of $8,218,067, of which $6,718,067 was paid in cash and $1,500,000 assumed debt through the issuance of a promissory note, due November 2011.
The changes in the carrying amount of goodwill for the years ended December 31, 2010 and 2009 were as follows:
Beginning balance January 1, 2009 |
$ | 14,945,576 | ||
Purchase price adjustment in connection with converting debt to equity and amending the earn-out provision |
(2,478,226 |
) |
||
HMS settlement |
(1,125,000 |
) |
||
Ending balance, December 31, 2009 |
11,342,350 | |||
Acquisitions during 2010 |
1,038,614 |
|||
Ending balance, December 31, 2010 |
$ | 12,380,964 | ||
F-15
NOTE 6—GOODWILL AND OTHER INTANGIBLES (Continued)
Goodwill and other intangibles included the following:
| |
December 31, | ||||||
|---|---|---|---|---|---|---|---|
| |
2010 | 2009 | |||||
Customer list |
$ | 3,934,000 | $ | 3,934,000 | |||
Trademark |
1,191,000 | 924,000 | |||||
Patents |
450,853 | 450,852 | |||||
Non-compete agreements |
865,539 | 200,000 | |||||
Intellectual property |
2,901,163 | — | |||||
|
9,342,555 | 5,508,852 | |||||
Less: accumulated amortization |
1,471,744 | 877,099 | |||||
|
7,870,811 | 4,631,753 | |||||
Goodwill |
12,380,964 | 11,342,350 | |||||
Total goodwill and other intangibles |
$ | 20,251,775 | $ | 15,974,103 | |||
Intangible assets subject to amortization are amortized over their estimated useful lives which are between two and fifteen years. Amortization expense for the years ended December 31, 2010, 2009 and 2008 was $594,645, $877,099 and $0, respectively. Amortization expense is projected to be $1,691,434, $1,691,434, $1,635,972, $502,533, $502,533 and $1,846,905 for the twelve months ended December 31, 2011 through 2015 and thereafter, respectively.
NOTE 7—INCOME TAXES
The components of income tax expense were as follows:
| |
Year Ended December 31, | ||||||||||
|---|---|---|---|---|---|---|---|---|---|---|---|
| |
2010 | 2009 | 2008 | ||||||||
Current |
|||||||||||
Federal |
$ | 89,710 | $ | 472,467 | $ | (598,141 | ) | ||||
State |
206,442 | 271,525 | 56,804 | ||||||||
Foreign |
6,160,972 | (1,080,431 | ) | 7,995,210 | |||||||
|
6,457,124 | (336,439 | ) | 7,453,873 | |||||||
Deferred |
|||||||||||
Federal |
(9,698,242 | ) | 1,752,032 | (1,890,405 | ) | ||||||
State |
1,507,755 | (11,380 | ) | — | |||||||
Foreign |
2,333,308 | (1,111,516 | ) | 463,778 | |||||||
|
(5,857,179 | ) | 629,136 | (1,426,627 | ) | ||||||
Income tax expense |
$ | 599,945 | $ | 292,697 | $ | 6,027,246 | |||||
F-16
NOTE 7—INCOME TAXES (Continued)
The provision for income taxes differs from the amount of income tax determined by applying the U.S. statutory rate to the income (loss) before income taxes as follows:
| |
Year Ended December 31, | |||||||||
|---|---|---|---|---|---|---|---|---|---|---|
| |
2010 | 2009 | 2008 | |||||||
Income tax at statutory rate |
$ | (13,634,050 | ) | $ | 258,320 | $ | (706,595 | ) | ||
US state income taxes (benefit) |
777,402 | 210,346 | (64,603 | ) | ||||||
Non-US effective rate different than statutory |
5,159,930 | 173,443 | (532,975 | ) | ||||||
Effect of non-deductible expenses |
2,275,071 | 1,900,921 | 4,190,099 | |||||||
Net operating loss |
— | 162,372 | (2,299,462 | ) | ||||||
Tax credits |
— | (4,203,967 | ) | — | ||||||
Change in valuation allowance |
3,667,409 | 1,791,262 | 5,347,915 | |||||||
Liabilities for uncertain tax matters |
1,900,000 | — | — | |||||||
Other |
454,183 | — | 92,867 | |||||||
Income tax expense |
$ | 599,945 | $ | 292,697 | $ | 6,027,246 | ||||
In 2010, the Company's effective tax rate differed from the statutory rate primarily due to taxes paid in Non-U.S. jurisdictions, current year increases to the valuation allowance, increases to uncertain tax positions and non-deductible expenses. In 2009, the Company's effective tax rate differed from the statutory rate, primarily due to increases to the valuation allowance, non-deductible expenses and foreign tax credits. In 2008, the Company's effective tax rate differed from the statutory rate, primarily due to increases to the valuation allowance, non-deductible expenses and Non-U.S. permanent provision to return adjustments and non-deductible U.S transfer pricing adjustments.
F-17
NOTE 7—INCOME TAXES (Continued)
Deferred income taxes reflect the net tax effects of temporary differences between the carrying amounts of assets and liabilities for financial reporting purposes and the amounts reported for income tax purposes at the enacted tax rates in effect when the differences reverse. The components of deferred tax assets and liabilities are as follows:
| |
December 31, | ||||||||
|---|---|---|---|---|---|---|---|---|---|
| |
2010 | 2009 | |||||||
Deferred tax assets: |
|||||||||
Net operating loss carryforwards |
$ | 46,796,417 | $ | 25,240,546 | |||||
Alternative Minimum Tax |
— | 387,456 | |||||||
Foreign tax credits |
6,460,888 | 4,705,756 | |||||||
Multi-client library |
— | 4,758,164 | |||||||
Other |
— | 488,848 | |||||||
Total gross deferred tax asset |
53,257,305 | 35,580,770 | |||||||
Less: valuation allowance |
13,987,699 | 7,920,327 | |||||||
Total gross deferred tax asset |
39,269,606 | 27,660,443 | |||||||
Deferred tax liability: |
|||||||||
Property and equipment |
(13,381,619 | ) | (31,486,574 | ) | |||||
Multi-client library |
(22,869,477 | ) | — | ||||||
Other |
(987,462 | ) | — | ||||||
Total gross deferred tax liability |
(37,238,558 | ) | (31,486,574 | ) | |||||
Deferred tax asset (liability), net |
$ | 2,031,048 | $ | (3,826,131 | ) | ||||
As of December 31, 2010, the Company has approximately $91,548,000 in U.S. net operating loss carryforwards and $57,181,000 in non-U.S. net operating loss carryforwards. Such tax loss carryforwards expire in 2028-2030 in the U.S. and will not expire before 2012 in the non-U.S. jurisdictions. At December 31, 2010, the Company also has approximately $6,461,000 in foreign tax credit carryforwards, which expire in 2016-2020.
A valuation allowance is established when it is more likely than not that all or a portion of the deferred tax assets will not be realized. The valuation allowance is then adjusted when the realization of deferred tax assets becomes more likely than not. Adjustments are also made to recognize the expiration of carry forward items with corresponding adjustments to the deferred taxes. Based on the net operating losses incurred by the Company in different taxing jurisdictions and the "net operating loss" adjustments discussed above, the Company recorded valuation allowances primarily related to foreign net operating loss carry forwards. The allowance increased by $6,067,372, $1,791,452 and $5,912,473 in 2010, 2009, and 2008, respectively.
The Company has unremitted earnings in certain foreign subsidiaries and management intends to permanently reinvest those earnings. During 2009, the Company remitted earnings from its Chilean subsidiary to the U.S. Withholding tax paid in connection with this remittance has been recognized in the financial statements for the year ended December 31, 2009. Consistent with management's intention to permanently reinvest earnings from its non-U.S. operations, U.S. Federal and State Income taxes have not been recognized on such earnings, as the Company does not intend to repatriate such earnings. At such time the Company determines that such earnings will be remitted, appropriate US Federal and State taxes, as applicable, will be recorded in the consolidated financial statements.
F-18
NOTE 7—INCOME TAXES (Continued)
Unrecognized Tax Benefits (Liabilities for Uncertain Tax Matters):
The following table shows the change in the Company's unrecognized tax benefits:
| |
Year Ended December 31, |
|||||||
|---|---|---|---|---|---|---|---|---|
| |
2010 | 2009 | ||||||
Balance at January 1, |
||||||||
Additions based on tax positions taken in current year |
$ | — | $ | — | ||||
Additions based on tax positions of prior years |
1,523,000 | — | ||||||
Reductions due to settlements with taxing authorities |
— | — | ||||||
Reductions due to lapse of statutes of limitation |
— | — | ||||||
Balance at December 31, |
$ | 1,523,000 | $ | — | ||||
As of December 31, 2010, $1,523,000 of unrecognized tax benefits would affect the Company's income tax expense and effective income tax rate if recognized in future periods. It is reasonably possible that the total amount of unrecognized tax benefits could change in the next 12 months.
The Company recognizes accrued interest related to unrecognized tax benefits and penalties as income tax expense. During 2010, the Company recognized $377,000 in interest and penalties related to the unrecognized tax benefits noted above. The Company had $377,000 accrued for the payment of interest and penalties as of December 31, 2010.
The Company and its subsidiaries file income tax returns in the United States and various foreign jurisdictions. The Company is no longer subject to examinations by income tax authorities in most jurisdictions for years prior to 2006.
NOTE 8—INITIAL PUBLIC OFFERING
On April 21, 2010, the Company entered into an underwriting agreement (the "Underwriting Agreement") with Credit Suisse Securities (USA) LLC and Barclays Capital Inc., as representatives of the several underwriters named therein (collectively, the "Underwriters"), providing for the offer and sale in a firm commitment offering of 7,500,000 shares of the Company's common stock, par value $0.01 (the "Common Stock"), of which 500,000 shares were sold by selling stockholders, at a public offering price of $12.00 per share. Pursuant to the Underwriting Agreement, the Company and the selling stockholders granted the Underwriters a 30-day option to purchase up to an additional 625,000 shares and 500,000 shares of Common Stock, respectively, to cover over-allotments, which subsequently expired without being exercised.
The transactions contemplated by the Underwriting Agreement were consummated on April 27, 2010. The Company's net proceeds from this offering were approximately $76.4 million after deducting underwriting discounts, fees and offering expenses. As described in the Company's final prospectus dated April 22, 2010 (the "Prospectus") contained in its Registration Statement on Form S-1 (File No. 333-162540), the Company used the net proceeds of the offering to pay down indebtedness and will use the remaining proceeds for anticipated capital expenditures and general working capital purposes. The Company did not receive any of the proceeds from the sale of the Common Stock sold by the selling stockholders.
Upon completion of the initial public offering, all existing shares of the Company's outstanding Class A and Class B common stock and the Company's Series A convertible preferred stock were converted into one class of common stock (the "Stock Conversions"). Under the terms of its amended
F-19
NOTE 8—INITIAL PUBLIC OFFERING (Continued)
certificate of incorporation the Company is authorized to issue 105,000,000 shares of capital stock which consists of 100,000,000 shares of common stock, par value $0.01 per share, and 5,000,000 shares of preferred stock, par value $0.01 per share.
NOTE 9—LONG-TERM DEBT
Senior Notes: On April 22, 2010, the Company entered into a Purchase Agreement (the "Purchase Agreement") with Barclays Capital Inc., Credit Suisse Securities (USA) LLC and Banc of America Securities LLC, as representatives of the initial purchasers (the "Initial Purchasers"), relating to the offer and sale by the Company of $200 million aggregate principal amount of its 101/2% senior notes due 2017 (the "Notes"). The Company's net proceeds from the offering were approximately $188.1 million after deducting the Initial Purchasers' discounts, offering expenses and original issue discount. The issuance of the Notes occurred on April 27, 2010. The Notes were offered and sold to the Initial Purchasers and resold only to qualified institutional buyers in compliance with the exemption from registration provided by Rule 144A under the Securities Act of 1933, as amended (the "Securities Act"), and in offshore transactions in reliance on Regulation S under the Securities Act.
The Notes are a general unsecured, senior obligation of the Company. The Notes are unconditionally guaranteed as to principal, premium, if any, and interest by the Company's domestic subsidiaries (the "Guarantors") on a senior unsecured basis.
The Company used the proceeds from the offering and sale of the Notes to repay outstanding indebtedness and plans to use the remaining proceeds for anticipated capital expenditures and for general working capital purposes.
On April 27, 2010, in connection with the offering of the Notes, the Company entered into (i) an Indenture with The Bank of New York Mellon Trust Company, N.A., (the "Trustee"), and (ii) a Registration Rights Agreement with the Initial Purchasers. The following is a brief summary of the material terms and conditions of the Indenture and the Registration Rights Agreement.
The Company and the Guarantors entered into an Indenture with the Trustee, pursuant to which the Company issued the Notes at a price equal to 97.009% of their face value.
Interest—The Notes will bear interest from April 27, 2010 at a rate of 101/2% per annum. The Company will pay interest on the Notes semi-annually, in arrears, on May 1 and November 1 of each year, beginning November 1, 2010.
Principal and Maturity—The Notes were issued with a $200 million aggregate principal amount and will mature on May 1, 2017.
Optional Redemption by the Company—At any time prior to May 1, 2013, the Company may redeem up to 35% of the aggregate principal amount of the Notes with the net cash proceeds of certain equity offerings at a redemption price of 110.500% of the aggregate principal amount of the Notes redeemed if at least 65% of the aggregate principal amount of the Notes remains outstanding immediately after such redemption and the redemption occurs within 90 days of the closing date of such equity offering. On or after May 1, 2014, the Company may redeem the Notes at the following percentages of the original principal amount: (i) 105.250% from May 1, 2014 to April 30, 2015; (ii) 102.625% from May 1, 2015 to April 30, 2016; and (iii) 100% from May 1, 2016 and thereafter.
Repurchase Obligations by the Company—If there is a change of control of the Company (as defined in the Indenture), each holder of the Notes may require the Company to purchase their Notes
F-20
NOTE 9—LONG-TERM DEBT (Continued)
at a price equal to 101% of the principal amount thereof, plus accrued and unpaid interest, if any, to the date of repurchase.
Events of Default—The Indenture also contains events of default including, but not limited to, the following: (i) nonpayment; (ii) defaults in certain other indebtedness of the Company or the Guarantors; and (iii) the failure of the Company or the Guarantors to comply with their respective covenants in the event of a mandatory redemption, optional redemption, option to repurchase, or a merger, consolidation or sale of assets. Upon an event of default, the holders of the Notes or the Trustee may declare the Notes due and immediately payable. As of December 31, 2010, the Company is in compliance with all respective covenants.
Bank of America Revolving Credit Facility: On April 30, 2010, the Company entered into a new revolving credit facility under the terms of a Credit Agreement (the "Revolving Credit Facility") with Bank of America, N.A., as Administrative Agent, Swing Line Lender and L/C Issuer, and each lender from time to time party thereto. The Revolving Credit Facility provides for borrowings of up to $50.0 million. The loans under the Revolving Credit Facility bear interest at a rate equal to LIBOR plus the Applicable Rate or the Base Rate plus the Applicable Rate. The Base Rate is defined as the higher of (x) the prime rate and (y) the Federal Funds rate plus 0.50%. The Applicable Rate is defined as a percentage determined in accordance with a pricing grid based upon the Company's leverage ratio, that will decline from LIBOR plus 4.00% or the prime rate plus 3.00% to a minimum rate equal to LIBOR plus 3.50% or the prime rate plus 2.50%. The Company is able to prepay borrowings under the Revolving Credit Facility at any time without penalty or premium, subject to reimbursement of the lenders' breakage and redeployment costs in the case of prepayment of LIBOR borrowings. The Company also will pay a commitment fee of 0.75% per annum on the actual daily unused portions of the Revolving Credit Facility.
The Company's Revolving Credit Facility is secured by a first priority lien on substantially all of the Company's assets, the assets of the Company's non-foreign subsidiaries, the stock of the Company's non-foreign subsidiaries and 66% of the stock of certain of the Company's foreign subsidiaries. In addition, the Company's non-foreign subsidiaries will guarantee the Company's obligations under the Revolving Credit Facility.
The terms of the Revolving Credit Facility will limit the Company's ability and the ability of certain of the Company's subsidiaries to, among other things: incur or guarantee additional indebtedness; grant additional liens on the Company's assets; make certain investments or certain acquisitions of substantially all or a portion of another entity's business or assets; merge with another entity or dispose of the Company's assets; pay dividends; enter into transactions with affiliates; engage in other lines of business and repurchase stock.
Additionally, the Revolving Credit Facility requires that the Company maintain certain ratios of total senior secured debt to consolidated EBITDA (as defined therein), and of consolidated EBITDA to consolidated interest. The Revolving Credit Facility includes customary provisions with respect to events of default. Upon the occurrence and continuation of an event of default under the Revolving Credit Facility, the lenders will be able to, among other things, terminate their revolving loan commitments, accelerate the repayment of the loans outstanding and declare the same to be immediately due and payable. As of December 31, 2010, the Company is in compliance with all respective covenants.
F-21
NOTE 9—LONG-TERM DEBT (Continued)
In connection with the closing of the Company's initial public offering and the sale of $200 million of the Company's 101/2% senior notes due 2017 on April 27, 2010, the Company repaid all outstanding borrowings under the First Lien Credit Agreement, the Second Lien Credit Agreement, and the Construction Loan Agreement. These repayments resulted in the termination of each of these borrowing arrangements. The prepayment of the Construction Loan Agreement resulted in the incurrence of $160,000 in prepayment penalties.
Promissory Notes: On November 18, 2010, the Company issued a promissory note for $1.5 million in association with the purchase of the assets of a certain business at an annual interest rate of twelve percent (12%). The balance as December 31, 2010 amounted to $913,000 and is payable in monthly installments of $83,000 through November 2011. In October 2010, the Company issued three promissory notes to two financial institutions in Colombia for $2,431,261 at annual interest rates ranging from 7.6% to 7.9%. The promissory notes were paid in full in January 2011.
Long-term debt consisted of the following:
| |
December 31, | ||||||
|---|---|---|---|---|---|---|---|
| |
2010 | 2009 | |||||
Senior notes |
$ | 200,000,000 | $ | — | |||
Revolving credit facility |
15,000,000 | — | |||||
Promissory notes |
3,344,261 | — | |||||
First lien term loan |
— | 113,900,000 | |||||
Second lien term loan |
— | 50,000,000 | |||||
Notes payable—insurance |
— | 627,816 | |||||
Mortgage |
— | 5,362,437 | |||||
|
218,344,261 | 169,890,253 | |||||
Less: unamortized discount |
5,581,758 | 2,112,313 | |||||
|
212,762,503 | 167,777,940 | |||||
Less: current portion |
3,344,261 | 1,983,282 | |||||
Total notes payable and line of credit, net of current portion |
$ | 209,418,242 | $ | 165,794,658 | |||
Future maturities of notes payable and line of credit for each of the next five years and thereafter are as follows:
Year Ending December 31,
|
|
||||
|---|---|---|---|---|---|
2011 |
$ | 3,344,261 | |||
2012 |
— | ||||
2013 |
15,000,000 | ||||
2014 |
— | ||||
2015 |
— | ||||
Thereafter |
200,000,000 | ||||
|
$ | 218,344,261 | |||
Interest Rate Swap: On March 7, 2007, the Company entered into a $70.0 million notional value interest rate collar to protect its interest from unanticipated fluctuations in cash flows caused by volatility in the interest rate on its floating-rate debt. The two year swap arrangement effectively caps the 3-month LIBOR rate at 5.75% and sets the floor at 4.55%. The interest rate swap was terminated on March 31, 2010.
F-22
NOTE 10—FAIR VALUES OF FINANCIAL INSTRUMENTS
Effective January 1, 2009, the Company adopted guidance as it relates to financial assets and financial liabilities, which defines fair value, establishes a framework for measuring fair value under generally accepted accounting principles and expands disclosures about fair value measurements. The provisions of this standard apply to other accounting pronouncements that require or permit fair value measurements.
This guidance defines fair value as the price that would be received to sell an asset or paid to transfer a liability in an orderly transaction between market participants at the measurement date. Hierarchical levels, as defined in this guidance and directly related to the amount of subjectivity associated with the inputs to fair valuations of these assets and liabilities are as follows:
Level 1—Unadjusted quoted prices in active markets that are accessible at the measurement date for identical, unrestricted assets or liabilities.
Level 2—Inputs other than quoted prices included within Level 1 that are observable for the asset or liability, either directly or indirectly, including quoted prices for similar assets or liabilities in active markets; quoted prices for identical or similar assets or liabilities in markets that are not active; inputs other than quoted prices that are observable for the asset or liability (e.g., interest rates); and inputs that are derived principally from or corroborated by observable market data by correlation or other means.
Level 3—Inputs that are both significant to the fair value measurement and unobservable.
The reported fair values for financial instruments that use Level 2 and Level 3 inputs to determine fair value are based on a variety of factors and assumptions. Accordingly, certain fair values may not represent actual values of the financial instruments that could have been realized as of December 31, 2010 or that will be realized in the future and do not include expenses that could be incurred in an actual sale or settlement.
In the normal course of operations, the Company is exposed to market risks arising from adverse changes in interest rates. Market risk is defined for these purposes as the potential for change in the fair value of debt instruments resulting from an adverse movement in interest rates.
The carrying amounts of cash and cash equivalents, accounts receivable, accounts payable and short-term debt approximate their fair value due to the short maturity of those instruments or variable rates of interest. Accordingly, they have been excluded from the table below. The fair value of the Notes is determined by multiplying the principal amount by the market price. The following table sets forth the fair value of the Company's financial assets and liabilities as of December 31, 2010 and 2009:
| |
December 31, | ||||||||||||
|---|---|---|---|---|---|---|---|---|---|---|---|---|---|
| |
2010 | 2009 | |||||||||||
| |
Carrying Amount |
Fair Value |
Carrying Amount |
Fair Value |
|||||||||
Long-term debt |
$ | 194,418,242 | $ | 198,250,000 | $ | — | $ | — | |||||
The Company is not a party to any hedge arrangements, commodity swap agreement or other derivative financial instruments.
The Company utilizes foreign subsidiaries and branches to conduct operations outside of the United States. These operations expose the Company to market risks from changes in foreign exchange rates.
F-23
NOTE 11—EARNINGS PER SHARE
The Company follows current guidance for share-based payments which are considered as participating securities. Upon adoption, all share-based payment awards that contained non-forfeitable rights to dividends, whether paid or unpaid, were designated as participating securities and included in the computation of earnings per share ("EPS"). The prior period EPS data presented has been adjusted retrospectively.
The following table sets forth the computation of basic and diluted earnings per share:
| |
Year Ended December 31, | ||||||||||
|---|---|---|---|---|---|---|---|---|---|---|---|
| |
2010 | 2009 | 2008 | ||||||||
Net income (loss), attributable to common shareholders |
$ | (39,715,893 | ) | $ | 445,359 | $ | (8,046,089 | ) | |||
Weighted average shares outstanding: |
|||||||||||
Basic |
27,517,050 | 8,187,506 | 8,173,554 | ||||||||
Diluted |
— |
20,600,137 |
— |
||||||||
Total |
27,517,050 | 28,787,643 | 8,173,554 | ||||||||
Basic (loss) income per share |
$ | (1.44 | ) | $ | .05 | $ | (.98 | ) | |||
Diluted (loss) income per share |
$ | (1.44 | ) | $ | .02 | $ | (.98 | ) | |||
For the years ended December 31, 2010, 2009 and 2008, 2,884,100, 2,642,200, and 2,802,300 out-of-the-money stock options have been excluded from diluted earnings per share because they are considered anti-dilutive, respectively.
For the years ended December 31, 2010, 2009 and 2008, 390,000, 0 and 0 stock warrants have been excluded from diluted earnings per share because they are considered anti-dilutive, respectively.
NOTE 12—STOCK BASED COMPENSATION
The Company follows the current guidance for share-based payments which requires all stock-based payments, including stock options, to be recognized as an operating expense over the vesting period, based on their grant date fair values.
In July 2006, the Company's board of directors and stockholders adopted the Global Geophysical Services, Inc. 2006 Incentive Compensation Plan (the "2006 Incentive Plan"). The 2006 Incentive Plan provides for a variety of incentive awards, including nonstatutory stock options, incentive stock options within the meaning of Section 422 of the Internal Revenue Code, or (the "Code"), stock appreciation rights, restricted stock awards, restricted stock unit awards, performance-based awards, and other stock-based awards. A total of 9,203,058 shares of common stock are reserved for issuance under the 2006 Incentive Plan. As of December 31, 2010, a total of 4,765,400 options have been granted and 1,881,300 have been forfeited.
Incentive Stock Options: The Company estimates the fair value of each stock option on the date of grant using the Black-Scholes-Merton valuation model. The volatility is based on expected volatility over the expected life of eighty-four months. As the Company has not historically declared dividends, the dividend yield used in the calculation is zero. Actual value realized, if any, is dependent on the future performance of the Company's common stock and overall stock market conditions. There is no
F-24
NOTE 12—STOCK BASED COMPENSATION (Continued)
assurance the value realized by an optionee will be at or near the value estimated by the Black-Scholes-Merton model. The following assumptions were used:
| |
Year Ended December 31, | |||||||||
|---|---|---|---|---|---|---|---|---|---|---|
| |
2010 | 2009 | 2008 | |||||||
Risk-free interest rates |
2.62 | % | 2.82 | % | 3.17 | % | ||||
Expected lives (in years) |
7.00 | 7.00 | 7.00 | |||||||
Expected dividend yield |
0.00 | % | 0.00 | % | 0.00 | % | ||||
Expected volatility |
60.93 | % | 57.63 | % | 51.14 | % | ||||
The computation of expected volatility during the year ended December 31, 2010 was based on the historical volatility. Historical volatility was calculated from historical data for the time approximately equal to the expected term of the option award starting from the grant date. The risk-free interest rate assumption is based upon the U.S. Treasury yield curve in effect at the time of grant for the period corresponding with the expected life of the option
A summary of the activity of the Company's stock option plans for the years ended December 31, 2010, 2009 and 2008 is presented below:
| |
Weighted Average Exercise Price |
Number of Optioned Shares |
Weighted Average Remaining Contractual Term in Years |
Weighted Average Optioned Grant Date Fair Value |
||||||||||
|---|---|---|---|---|---|---|---|---|---|---|---|---|---|---|
Balance as of December 31, 2007 |
$ | 22.86 | 2,432,600 | 10 | $ | 3.24 | ||||||||
Expired |
— | — | — | — | ||||||||||
Granted |
24.31 | 811,600 | 10 | 6.80 | ||||||||||
Exercised |
— | — | — | — | ||||||||||
Forfeited |
22.62 | (441,900 | ) | — | 4.11 | |||||||||
Balance as of December 31, 2008 |
23.32 | 2,802,300 | — | 4.48 | ||||||||||
Expired |
— | — | — | — | ||||||||||
Granted |
22.56 | 727,500 | 10 | 7.18 | ||||||||||
Exercised |
— | — | — | — | ||||||||||
Forfeited |
23.79 | (887,600 | ) | — | 5.22 | |||||||||
Balance as of December 31, 2009 |
22.95 | 2,642,200 | 10 | 4.97 | ||||||||||
Expired |
— | — | — | — | ||||||||||
Granted |
22.71 | 562,900 | 10 | 11.38 | ||||||||||
Exercised |
— | — | — | — | ||||||||||
Forfeited |
22.69 | (321,000 | ) | — | 6.57 | |||||||||
Balance as of December 31, 2010 |
$ | 22.93 | 2,884,100 | 10 | $ | 6.04 | ||||||||
Exercisable as of December 31, 2010 |
$ | 23.05 | 1,392,450 | — | $ | — | ||||||||
Outstanding options at December 31, 2010 expire during the period June 2017 to December 2020 and have exercise prices ranging from $12.50 to $30.00.
Compensation expense associated with stock options of $1,647,795, $745,560 and $539,683 for the years ended December 31, 2010, 2009 and 2008, respectively, is included in selling, general and administrative expenses in the statements of operations. At December 31, 2010, the Company had approximately 1,392,000 of nonvested stock option awards. The total cost of nonvested stock option
F-25
NOTE 12—STOCK BASED COMPENSATION (Continued)
awards which the Company had not yet recognized was approximately $4,100,000 at December 31, 2010. Such amounts are expected to be recognized over a period of 4 years, beginning January 1, 2011.
Stock Warrants: At December 31, 2010, the Company has outstanding warrants which entitle the holders to purchase an aggregate of 390,000 shares of common stock of the Company at an exercise price of $4.25 per share.
Restricted Stock: To encourage retention and performance, the Company granted certain employees and consultants restricted shares of common stock with a fair value per share determined in accordance with conventional valuation techniques, including but not limited to, arm's length transactions, net book value or multiples of comparable company earnings before interest, taxes, depreciation and amortization, as applicable.
| |
Number of Nonvested Restricted Share Awards |
Weighted Average Grant Date Fair Value |
|||||||
|---|---|---|---|---|---|---|---|---|---|
Balance at December 31, 2007 |
451,319 | $ | 3.16 | ||||||
Granted |
127,767 | 6.73 | |||||||
Vested |
(211,741 | ) | 1.86 | ||||||
Forfeited |
(81,036 | ) | 3.77 | ||||||
Balance at December 31, 2008 |
286,309 | 4.36 | |||||||
Granted |
189,000 | 8.89 | |||||||
Vested |
(163,476 | ) | 3.42 | ||||||
Forfeited |
(30,544 | ) | 5.05 | ||||||
Balance at December 31, 2009 |
281,289 | 7.88 | |||||||
Granted |
488,714 | 9.75 | |||||||
Vested |
(116,260 | ) | 6.09 | ||||||
Forfeited |
(58,690 | ) | 6.51 | ||||||
Nonvested Restricted Shares Outstanding December 31, 2010 |
595,053 | $ | 9.90 | ||||||
Compensation / charitable contribution expense associated with restricted stock of $1,584,686, $775,902 and $689,737 for the years ended December 31, 2010, 2009 and 2008, respectively, is included in selling, general and administrative expenses in the statements of operations. The total cost of nonvested stock awards which the Company had not yet recognized at December 31, 2010 was approximately $3,333,000. This amount is expected to be recognized over the next three years.
F-26
NOTE 13—SEGMENT INFORMATION
The Company has two reportable segments: Proprietary Services and Multi-client Services.
The following table sets forth significant information concerning the Company's reportable segments as of and for the years ended December 31, 2010, 2009 and 2008. Proprietary services accounted for 47%, 92%, and 93% of total revenue for the years ended December 31, 2010, 2009 and 2008, respectively, and Multi-client services accounted for 53%, 8%, and 7% of total revenue for the years ended December 31, 2010, 2009 and 2008, respectively.
| |
As of and for the Year Ended December 31, 2010 | ||||||||||||
|---|---|---|---|---|---|---|---|---|---|---|---|---|---|
| |
Proprietary Services | Multi-Client Services | Corporate | Total | |||||||||
Revenue |
$ | 119,836,992 | $ | 134,867,821 | $ | — | $ | 254,704,813 | |||||
Segment income (loss) |
$ | (31,184,950 | ) | $ | 24,877,514 | $ | (33,408,457 | ) | $ | (39,715,893 | ) | ||
Segment assets |
$ | 43,288,468 | $ | 181,364,638 | $ | 188,613,394 | $ | 413,266,500 | |||||
| |
As of and for the Year Ended December 31, 2009 | ||||||||||||
|---|---|---|---|---|---|---|---|---|---|---|---|---|---|
| |
Proprietary Services | Multi-Client Services | Corporate | Total | |||||||||
Revenue |
$ | 288,301,809 | $ | 24,494,568 | $ | — | $ | 312,796,377 | |||||
Segment income (loss) |
$ | 3,000,160 | $ | 1,626,467 | $ | (4,181,268 | ) | $ | 445,359 | ||||
Segment assets |
$ | 74,029,647 | $ | 57,720,387 | $ | 184,869,557 | $ | 316,619,591 | |||||
| |
As of and for the Year Ended December 31, 2008 | ||||||||||||
|---|---|---|---|---|---|---|---|---|---|---|---|---|---|
| |
Proprietary Services | Multi-Client Services | Corporate | Total | |||||||||
Revenue |
$ | 351,271,592 | $ | 24,984,669 | $ | — | $ | 376,256,261 | |||||
Segment income (loss) |
$ | 14,962,212 | $ | 4,191,769 | $ | (27,200,070 | ) | $ | (8,046,089 | ) | |||
Segment assets |
$ | 77,439,325 | $ | 11,872,992 | $ | 240,339,810 | $ | 329,652,127 | |||||
NOTE 14—EMPLOYEE BENEFIT PLANS
The Company provides a 401(k) plan as part of its employee benefits package in order to retain quality personnel. During 2010, 2009 and 2008, the Company made matching contributions equal to 100% of the first 3% and 50% of the next 2% of eligible compensation contributed by participating personnel. The Company's matching contributions for the years ended December 31, 2010, 2009 and 2008 were approximately $643,000, $581,000 and $444,000, respectively.
NOTE 15—COMMITMENTS AND CONTINGENCIES
Leases: The Company leases certain office space under non-cancelable operating lease agreements, which expire at various dates and require various minimum annual rentals. Future minimum rental payments under these leases (including new leases entered into in 2010) which have
F-27
NOTE 15—COMMITMENTS AND CONTINGENCIES (Continued)
initial or remaining terms in excess of one year as of December 31, 2010, for each of the years remaining and in the aggregate are:
Year Ended December 31,
|
Operating Leases |
|||
|---|---|---|---|---|
2011 |
$ | 1,779,700 | ||
2012 |
418,000 | |||
2013 |
238,400 | |||
2014 |
168,200 | |||
2015 |
57,300 | |||
Total future minimum lease payments |
$ | 2,661,600 | ||
Rental expense for short-term and long-term operating leases for the years ended December 31, 2010, 2009 and 2008 was approximately $23,631,000, $46,199,000 and $38,148,000, respectively.
Letter of Credit Facility: In February 2007, the Company entered into a $10.0 million revolving line of credit which is secured by restricted cash. The terms of the letter of credit facility as currently written only allow for letters of credit to be drawn on the available credit; however, the cash balance in excess of the total outstanding letters of credit may be withdrawn at any time. As of December 31, 2010 and 2009, the letters of credit outstanding were $2,432,700 and $4,462,500, respectively.
The Company is involved in litigation in the normal course of business. Management does not expect the eventual outcome to have a material impact on the financial condition of the Company.
NOTE 16—SUPPLEMENTAL CASH FLOW INFORMATION
The following is supplemental cash flow information:
| |
Year Ended December 31, | |||||||||
|---|---|---|---|---|---|---|---|---|---|---|
| |
2010 | 2009 | 2008 | |||||||
Interest paid |
$ | 16,737,957 | $ | 17,710,955 | $ | 18,841,933 | ||||
Income taxes paid |
$ | 4,519,475 | $ | 3,979,155 | $ | 5,782,629 | ||||
F-28
NOTE 16—SUPPLEMENTAL CASH FLOW INFORMATION (Continued)
The following is supplemental disclosure of non-cash investing and financing activities:
| |
Year Ended December 31, | |||||||||
|---|---|---|---|---|---|---|---|---|---|---|
| |
2010 | 2009 | 2008 | |||||||
Property and equipment additions financed through capital leases |
$ | — | $ | 325,941 | $ | 5,972,585 | ||||
Property and equipment additions financed through accounts payable and accrued expenses |
$ | 5,354,393 | $ | 2,814,534 | $ | 5,121,479 | ||||
Option payable recorded against additional paid in capital |
$ | 701,910 | $ | — | $ | — | ||||
Property and equipment sale financed through note receivable |
$ | 2,550,000 | $ | — | $ | — | ||||
Non-cash multi-client asset recorded as deferred revenue |
$ | 696,709 | $ | — | $ | — | ||||
Increase / decrease of Other Long-term Liability and Goodwill |
$ | — | $ | 1,125,000 | $ | 1,125,000 | ||||
Note payable converted to preferred stock |
$ | — | $ | 8,000,000 | $ | — | ||||
Original issue discount on notes payable |
$ | 5,982,000 | $ | — | $ | 2,700,000 | ||||
Note payable related to purchase of business |
$ | 1,500,000 | $ | — | $ | 12,000,000 | ||||
NOTE 17—CUSTOMER CONCENTRATIONS
The Company's sales are to clients whose activities relate to oil and gas exploration and production. In general, the Company does not require collateral from its customers. Therefore, the collection of receivables may be affected by the economy surrounding the oil and gas industry. For the years ended December 31, 2010, 2009 and 2008, customers representing more than 10% of the Company's revenue and accounts receivable at the balance sheet dates are listed in the table below (figures in $ millions):
| |
Year Ended December 31, | |||||||||||||||||||
|---|---|---|---|---|---|---|---|---|---|---|---|---|---|---|---|---|---|---|---|---|
| |
2010 | 2009 | 2008 | |||||||||||||||||
| |
Revenue | % of Total | Revenue | % of Total | Revenue | % of Total | ||||||||||||||
Customer 1 |
$ | 41.0 | 16 | % | $ | 115.4 | 37 | % | $ | 48.6 | 13 | % | ||||||||
Customer 2 |
— | — | 50.0 | 16 | % | 41.0 | 11 | % | ||||||||||||
Customer 3 |
— | — | 34.8 | 11 | % | — | — | |||||||||||||
Total |
$ | 41.0 | 16 | % | $ | 200.2 | 64 | % | $ | 89.6 | 24 | % | ||||||||
| |
As of December 31, | |||||||||||||||||||
|---|---|---|---|---|---|---|---|---|---|---|---|---|---|---|---|---|---|---|---|---|
| |
2010 | 2009 | 2008 | |||||||||||||||||
| |
Accounts Receivable |
% of Total | Accounts Receivable |
% of Total | Accounts Receivable |
% of Total | ||||||||||||||
Customer 1 |
$ | — | — | % | $ | 11.1 | 15 | % | $ | 4.6 | 7 | % | ||||||||
Customer 2 |
— | — | 15.1 | 21 | % | 8.4 | 13 | % | ||||||||||||
Customer 3 |
— | — | % | 6.1 | 8 | % | — | — | ||||||||||||
Total |
$ | 2.7 | 4 | % | $ | 32.3 | 44 | % | $ | 14.8 | 23 | % | ||||||||
F-29
NOTE 17—CUSTOMER CONCENTRATIONS (Continued)
For the years ended December 31, 2010, 2009 and 2008, revenues from all geographic areas outside of the United States were $109.0 million, $132.7 million and $223.5 million, representing 43%, 42% and 59% of total revenues, respectively.
For the year ended December 31, 2010, purchases from the Company's largest vendor were approximately $19.3 million, representing 5% of total purchases. Accounts payable for this vendor were approximately $0.4 million, representing approximately 9% of total accounts payable as of December 31, 2010. For the year ended December 31, 2009, purchases from the Company's largest vendor were approximately $16.8 million, representing 6% of total purchases. Accounts payable for this vendor were approximately $2.8 million, representing approximately 27% of total accounts payable as of December 31, 2009. For the year ended December 31, 2008, purchases from the Company's largest vendor were approximately $28.6 million, representing 11% of total purchases. Accounts payable for this vendor were approximately $0.2 million, representing approximately 5% of total accounts payable as of December 31, 2008.
NOTE 18—QUARTERLY FINANCIAL DATA (Unaudited)
| |
Quarter Ended | ||||||||||||||
|---|---|---|---|---|---|---|---|---|---|---|---|---|---|---|---|
| |
December 31, | September 30, | June 30, | March 31, | |||||||||||
2010 |
|||||||||||||||
Revenue |
$ | 93,463,911 | $ | 60,469,517 | $ | 40,110,189 | $ | 60,661,196 | |||||||
Income (loss) from operations |
$ | 10,077,450 | $ | (3,754,181 | ) | $ | (10,884,066 | ) | $ | (6,448,470 | ) | ||||
Other income (expense) |
$ | (6,369,952 | ) | $ | (5,770,624 | ) | $ | (11,414,270 | ) | $ | (4,390,316 | ) | |||
Net income (loss) attributable to common shareholders |
$ | (1,768,575 | ) | $ | (18,645,402 | ) | $ | (12,064,398 | ) | $ | (7,237,518 | ) | |||
Net income (loss) per common share: |
|||||||||||||||
Basic |
$ | (.05 | ) | $ | (.52 | ) | $ | (.41 | ) | $ | (.88 | ) | |||
Diluted |
$ | (.05 | ) | $ | (.52 | ) | $ | (.41 | ) | $ | (.88 | ) | |||
| |
Quarter Ended | ||||||||||||||
|---|---|---|---|---|---|---|---|---|---|---|---|---|---|---|---|
| |
December 31, | September 30, | June 30, | March 31, | |||||||||||
2009 |
|||||||||||||||
Revenue |
$ | 98,559,273 | $ | 89,709,234 | $ | 57,692,319 | $ | 66,835,551 | |||||||
Income (loss) from operations |
$ | 8,135,369 | $ | 9,625,652 | $ | (4,597,683 | ) | $ | 5,164,994 | ||||||
Other income (expense) |
$ | (5,969,676 | ) | $ | (3,865,203 | ) | $ | (2,984,384 | ) | $ | (4,771,013 | ) | |||
Net income (loss) attributable to common shareholders |
$ | (1,205,709 | ) | $ | 6,367,574 | $ | (4,517,086 | ) | $ | (199,420 | ) | ||||
Net income (loss) per common share: |
|||||||||||||||
Basic |
$ | (.15 | ) | $ | .78 | $ | (.55 | ) | $ | (.02 | ) | ||||
Diluted |
$ | (.15 | ) | $ | .78 | $ | (.55 | ) | $ | (.02 | ) | ||||
NOTE 19—GUARANTEES OF REGISTERED SECURITIES
On August 3, 2010, the Company filed a registration statement on Form S-4 with the Securities and Exchange Commission. Under this registration statement, the Company exchanged $200 million of its publicly registered 10.50% senior notes due 2017 for a like amount of its privately placed 10.50% senior notes due 2017. The debt securities sold are fully and unconditionally guaranteed, on a joint and several basis, by the guarantor subsidiaries which will correspond to all subsidiaries located in the United States. The non-guarantor subsidiaries consist of all subsidiaries outside of the United States.
F-30
NOTE 19—GUARANTEES OF REGISTERED SECURITIES (Continued)
Separate condensed consolidating financial statement information for the guarantor subsidiaries and non-guarantor subsidiaries as of December 31, 2010 and 2009 and for the years ended December 31, 2010, 2009 and 2008 is as follows:
| |
As of December 31, 2010 | |||||||||||||||
|---|---|---|---|---|---|---|---|---|---|---|---|---|---|---|---|---|
| |
Guarantors | Non-guarantors | Eliminations | Consolidated | ||||||||||||
BALANCE SHEET |
||||||||||||||||
ASSETS |
||||||||||||||||
Current assets |
$ | 116,600,714 | $ | 26,123,142 | $ | (30,735,946 | ) | $ | 111,987,910 | |||||||
Multi-client library, net |
145,896,355 | — | — | 145,896,355 | ||||||||||||
Property and equipment, net |
125,342,454 | 1,621,499 | — | 126,963,953 | ||||||||||||
Investment in subsidiaries |
1,099 | — | (1,099 | ) | — | |||||||||||
Intercompany accounts |
17,325,928 | (17,325,928 | ) | — | — | |||||||||||
Other non-current assets |
28,403,426 | 14,856 | — | 28,418,282 | ||||||||||||
TOTAL ASSETS |
$ | 433,569,976 | $ | 10,433,569 | $ | (30,737,045 | ) | $ | 413,266,500 | |||||||
LIABILITIES AND STOCKHOLDERS' EQUITY |
||||||||||||||||
Current liabilities |
$ | 98,383,785 | $ | 32,852,979 | $ | (30,735,946 | ) | $ | 100,500,818 | |||||||
Long-term debt and capital lease obligations, net of current portion |
209,418,242 | — | — | 209,418,242 | ||||||||||||
Deferred income tax and other non-current liabilities |
1,490,745 | — | — | 1,490,745 | ||||||||||||
TOTAL LIABILITIES |
309,292,772 | 32,852,979 | (30,735,946 | ) | 311,409,805 | |||||||||||
Stockholders' equity |
124,277,204 |
(22,419,410 |
) |
(1,099 |
) |
101,856,695 |
||||||||||
TOTAL LIABILITIES AND STOCKHOLDERS' EQUITY |
$ | 433,569,976 | $ | 10,433,569 | $ | (30,737,045 | ) | $ | 413,266,500 | |||||||
| |
As of December 31, 2009 | |||||||||||||||
|---|---|---|---|---|---|---|---|---|---|---|---|---|---|---|---|---|
| |
Guarantors | Non-guarantors | Eliminations | Consolidated | ||||||||||||
BALANCE SHEET |
||||||||||||||||
ASSETS |
||||||||||||||||
Current assets |
$ | 82,022,731 | $ | 56,456,406 | $ | (21,751,693 | ) | $ | 116,727,444 | |||||||
Multi-client library, net |
37,395,521 | — | — | 37,395,521 | ||||||||||||
Property and equipment, net |
138,394,183 | 1,823,770 | — | 140,217,953 | ||||||||||||
Investment in subsidiaries |
1,099 | — | (1,099 | ) | — | |||||||||||
Intercompany accounts |
37,679,846 | (37,679,846 | ) | — | — | |||||||||||
Other non-current assets |
22,211,327 | 67,346 | — | 22,278,673 | ||||||||||||
TOTAL ASSETS |
$ | 317,704,707 | $ | 20,667,676 | $ | (21,752,792 | ) | $ | 316,619,591 | |||||||
LIABILITIES AND STOCKHOLDERS' EQUITY |
||||||||||||||||
Current liabilities |
$ | 79,948,550 | $ | 24,578,093 | $ | (21,751,693 | ) | $ | 82,774,950 | |||||||
Long-term debt and capital lease obligations, net of current portion |
166,090,323 | — | — | 166,090,323 | ||||||||||||
Deferred income tax and other non-current liabilities |
3,826,131 | — | — | 3,826,131 | ||||||||||||
TOTAL LIABILITIES |
249,865,004 | 24,578,093 | (21,751,693 | ) | 252,691,404 | |||||||||||
Stockholders' equity |
67,839,703 |
(3,910,417 |
) |
(1,099 |
) |
63,928,187 |
||||||||||
TOTAL LIABILITIES AND STOCKHOLDERS' EQUITY |
$ | 317,704,707 | $ | 20,667,676 | $ | (21,752,792 | ) | $ | 316,619,591 | |||||||
F-31
NOTE 19—GUARANTEES OF REGISTERED SECURITIES (Continued)
| |
Year Ended December 31, 2010 | |||||||||||||||
|---|---|---|---|---|---|---|---|---|---|---|---|---|---|---|---|---|
| |
Guarantors | Non-guarantors | Eliminations | Consolidated | ||||||||||||
STATEMENTS OF OPERATIONS |
||||||||||||||||
Revenues |
$ | 238,176,165 | $ | 30,342,412 | $ | (13,813,764 | ) | $ | 254,704,813 | |||||||
Expenses: |
||||||||||||||||
Operating expenses |
200,229,998 | 37,749,281 | (12,652,053 | ) | 225,327,226 | |||||||||||
Selling, general and administrative expenses |
33,489,066 | 8,059,499 | (1,161,711 | ) | 40,386,854 | |||||||||||
Total expenses |
233,719,064 | 45,808,780 | (13,813,764 | ) | 265,714,080 | |||||||||||
Income (loss) from operations |
4,457,101 | (15,466,368 | ) | — | (11,009,267 | ) | ||||||||||
Interest income (expense), net |
(21,268,661 | ) | 50 | — | (21,268,611 | ) | ||||||||||
Other expenses, net |
(6,612,996 | ) | (63,555 | ) | — | (6,676,551 | ) | |||||||||
Loss before income taxes |
(23,424,556 | ) | (15,529,873 | ) | — | (38,954,429 | ) | |||||||||
Income tax expense (benefit) |
(2,379,175 | ) | 2,979,120 | — | 599,945 | |||||||||||
Loss after income taxes |
(21,045,381 | ) | (18,508,993 | ) | — | (39,554,374 | ) | |||||||||
Net income, attributable to noncontrolling interests |
161,519 | — | — | 161,519 | ||||||||||||
Net loss, attributable to common shareholders |
$ | (21,206,900 | ) | $ | (18,508,993 | ) | $ | — | $ | (39,715,893 | ) | |||||
| |
Year Ended December 31, 2009 | |||||||||||||||
|---|---|---|---|---|---|---|---|---|---|---|---|---|---|---|---|---|
| |
Guarantors | Non-guarantors | Eliminations | Consolidated | ||||||||||||
STATEMENTS OF OPERATIONS |
||||||||||||||||
Revenues |
$ | 239,037,761 | $ | 102,215,631 | $ | (28,457,015 | ) | $ | 312,796,377 | |||||||
Expenses: |
||||||||||||||||
Operating expenses |
196,059,102 | 93,626,805 | (27,517,525 | ) | 262,168,382 | |||||||||||
Selling, general and administrative expenses |
19,977,143 | 13,262,010 | (939,490 | ) | 32,299,663 | |||||||||||
Total expenses |
216,036,245 | 106,888,815 | (28,457,015 | ) | 294,468,045 | |||||||||||
Income (loss) from operations |
23,001,516 | (4,673,184 | ) | — | 18,328,332 | |||||||||||
Interest expense, net |
(18,613,301 | ) | — | — | (18,613,301 | ) | ||||||||||
Other expenses, net |
1,007,383 | 15,642 | — | 1,023,025 | ||||||||||||
Income (loss) before income taxes |
5,395,598 | (4,657,542 | ) | — | 738,056 | |||||||||||
Income tax expense (benefit) |
(2,792,826 | ) | 3,085,523 | — | 292,697 | |||||||||||
Net income (loss), attributable to common shareholders |
$ | 8,188,424 | $ | (7,743,065 | ) | $ | — | $ | 445,359 | |||||||
F-32
NOTE 19—GUARANTEES OF REGISTERED SECURITIES (Continued)