Attached files
Table of Contents
UNITED STATES
SECURITIES AND EXCHANGE COMMISSION
Washington, D.C. 20549
FORM 10-K
| x | ANNUAL REPORT PURSUANT TO SECTION 13 OR 15(d) OF THE SECURITIES EXCHANGE ACT OF 1934 |
FOR THE FISCAL YEAR ENDED JANUARY 2, 2011
OR
| ¨ | TRANSITION REPORT PURSUANT TO SECTION 13 OR 15(d) OF THE SECURITIES EXCHANGE ACT OF 1934 |
For the transition period from to
Commission file number 000-31149
California Pizza Kitchen, Inc.
(Exact name of registrant as specified in its charter)
| Delaware | 95-4040623 | |
| (State or other jurisdiction of incorporation or organization) |
(I.R.S. Employer Identification Number) |
6053 West Century Boulevard, 11th Floor
Los Angeles, California 90045-6438
(Address of principal executive offices, including zip code)
(310) 342-5000
(Registrant’s telephone number, including area code)
Securities registered pursuant to section 12(b) of the Act:
None
Securities registered pursuant to Section 12(g) of the Act:
Common Stock, $0.01 par value (title of class)
Indicate by check mark if the registrant is a well-known seasoned issuer, as defined in Rule 405 of the Securities Act. YES ¨ NO x
Indicate by check mark if the registrant is not required to file reports pursuant to Section 13 or Section 15(d) of the Act. YES ¨ NO x
Indicate by check mark whether the registrant (1) has filed all reports required to be filed by Section 13 or 15(d) of the Securities Exchange Act of 1934 during the preceding 12 months (or for such shorter period that the registrant was required to file such reports), and (2) has been subject to such filing requirements for the past 90 days. YES x NO ¨
Indicate by check mark whether the registrant has submitted electronically and posted on its corporate Web site, if any, every Interactive Data File required to be submitted and posted pursuant to Rule 405 of Regulation S-T (§232.405 of this chapter) during the preceding 12 months (or for such shorter period that the registrant was required to submit and post such files).* YES ¨ NO ¨
*The registrant has not yet been phased into the interactive data requirements.
Indicate by check mark if disclosure of delinquent filers pursuant to Item 405 of Regulation S-K (§229.405 of this chapter) is not contained herein, and will not be contained, to the best of registrant’s knowledge, in definitive proxy or information statements incorporated by reference in Part III of this Form 10-K or any amendment to this Form 10-K. x
Indicate by check mark whether the registrant is a large accelerated filer, an accelerated filer, a non-accelerated filer, or a smaller reporting company. See the definitions of “large accelerated filer,” “accelerated filer” and “smaller reporting company” in Rule 12b-2 of the Exchange Act.
| Large accelerated filer ¨ | Accelerated filer x | |
| Non-accelerated filer ¨ (Do not check if a smaller reporting company) | Smaller reporting company ¨ |
Indicate by check mark whether the registrant is a shell company (as defined in Rule 12b-2 of the Act). YES ¨ NO x
The aggregate market value of voting stock held by non-affiliates of the registrant as of July 2, 2010, the last trading day of the second fiscal quarter, was approximately $202.3 million based upon the last sales price reported for such date on the NASDAQ Global Select Market. For purposes of this disclosure, shares of Common Stock held by persons who hold more than 5% of the outstanding shares of Common Stock and shares held by officers and directors of the registrant have been excluded, in that such persons may be deemed to be affiliates. This determination is not necessarily conclusive.
As of March 13, 2011, 24,580,501 shares of the registrant’s Common Stock, $0.01 par value, were outstanding.
Table of Contents
CALIFORNIA PIZZA KITCHEN, INC. AND SUBSIDIARIES
2010 ANNUAL REPORT ON FORM 10-K
INDEX
| Page No. | ||||||
| Part I | ||||||
| Item 1. |
3 | |||||
| Item 1A. |
12 | |||||
| Item 1B. |
18 | |||||
| Item 2. |
18 | |||||
| Item 3. |
19 | |||||
| Item 4. |
20 | |||||
| Part II | ||||||
| Item 5. |
21 | |||||
| Item 6. |
24 | |||||
| Item 7. |
Management’s Discussion and Analysis of Financial Condition and Results of Operations |
26 | ||||
| Item 7A. |
37 | |||||
| Item 8. |
37 | |||||
| Item 9. |
Changes in and Disagreements With Accountants on Accounting and Financial Disclosure |
37 | ||||
| Item 9A. |
37 | |||||
| Item 9B. |
40 | |||||
| Part III | ||||||
| Item 10. |
40 | |||||
| Item 11. |
40 | |||||
| Item 12. |
Security Ownership of Certain Beneficial Owners and Management and Related Stockholder Matters |
40 | ||||
| Item 13. |
Certain Relationships and Related Transactions, and Director Independence |
40 | ||||
| Item 14. |
40 | |||||
| Part IV | ||||||
| Item 15. |
41 | |||||
Table of Contents
FORWARD-LOOKING STATEMENTS
This report contains forward-looking statements that involve risks and uncertainties. These statements relate to our future plans, objectives, expectations and intentions. These statements may be identified by the use of words such as “expects,” “anticipates,” “intends,” “plans” and similar expressions. Our actual results could differ materially from those discussed in these statements. Factors that could contribute to these differences include those discussed under “Item 1A. Risk Factors” and elsewhere in this report. The cautionary statements made in this report should be read as being applicable to all forward-looking statements wherever they appear in this report.
ASSUMPTIONS USED IN THIS REPORT
Throughout this report, our fiscal years ended December 31, 2006, December 30, 2007, December 28, 2008, January 3, 2010 and January 2, 2011 are referred to as fiscal years 2006, 2007, 2008, 2009 and 2010, respectively. Our fiscal year consists of 52 or 53 weeks and ends on the Sunday closest to December 31 in each year. Our fiscal years typically consist of 52 weeks except for 2009, which was a 53-week year. All prior year final quarters consisted of 13 weeks except for 2009, which included a final quarter of 14 weeks.
PART I
Overview and Strategy
California Pizza Kitchen, Inc. (referred to herein as the “Company” or in the first person notations “we,” “our” and “us”) is a leading casual dining restaurant chain with a particular focus on the premium pizza segment. As of January 2, 2011, we owned, licensed or franchised 266 locations in 32 states and 11 foreign countries, of which 208 were company-owned and 58 operated under franchise or license arrangements. During our 25 years of operating history, we have developed a recognized consumer brand and demonstrated the appeal of our concept in a wide variety of geographic areas.
We opened our first casual dining restaurant in 1985 in Beverly Hills, California and grew steadily to 25 restaurants by early 1992. Our concept, with its signature line of innovative, premium pizzas, open-flame ovens in exhibition-style kitchens and excellent guest service, attracted PepsiCo, which bought a controlling interest in our Company in May 1992.
During the approximate five-year period when PepsiCo was our controlling stockholder, we opened 60 restaurants, 17 of which were subsequently closed. We experimented with different locations and different restaurant sizes, ranging from 3,600 square feet to more than 11,000 square feet. Our rapid expansion strained our infrastructure, resulted in a variety of management and operational changes, diverted our attention from the execution of our concept and led to disappointing operating results and financial performance, including a decline in comparable restaurant sales in 1996.
At the end of 1996, PepsiCo concluded that it would sell or otherwise divest all of its restaurant businesses, including California Pizza Kitchen. In September 1997, we consummated a series of transactions to effect a merger and leveraged recapitalization through which an investor group led by Bruckmann, Rosser, Sherrill & Co., L.P. acquired PepsiCo’s interest in our Company.
In 1998, we instituted an accelerated growth plan, focusing largely on further penetrating our existing markets. Between January 1998 and December 2003, we opened 71 company-owned, full service restaurants and three CPK/ASAP restaurants.
3
Table of Contents
Following rapid expansion, the Board of Directors asked Richard Rosenfield and Larry Flax, co-founders and co-Chairmen of the Board, to reassume the responsibilities of co-Chief Executive Officers (“co-CEOs”). In connection with this management change, we reviewed our restaurant portfolio, as well as our operations and growth strategy, and decided to slow down our new restaurant opening schedule, emphasizing quality and profitability beginning in fiscal 2004.
Our objective is to extend our leadership position in the restaurant and premium pizza market by selling innovative, high quality pizzas in addition to creative salads, distinctive pastas and related products and by providing exceptional customer service, thereby building a high degree of customer loyalty, brand awareness and superior returns for our stockholders. To reach these objectives, we plan to increase our market share by expanding our restaurant base in new and existing markets, leveraging our partnerships in non-traditional and retail channels and offering innovative menu items. We also offer the opportunity for guests to enjoy our products off of our premises by taking advantage of our online ordering, take-out call center and delivery options and our newly launched catering program. Our restaurants, which feature an exhibition-style kitchen centered around an open flame oven, provide a distinctive, casual dining experience that is family friendly and has broad consumer appeal.
Menu
Our menu development is led by our co-founders and co-CEOs, Richard Rosenfield and Larry Flax, who lead our menu development team to continually create menu selections that are innovative and capture distinctive tastes. Our diverse menu focuses on imaginative toppings and showcases tastes and flavors that customers readily identify, but do not typically associate with pizza, pastas or salads. Recognizing the wide appeal of our restaurants, we apply equal focus to creating flavorful offerings that utilize tastes and menu items that are familiar to guests and then adding our distinctive attention to flavor and quality.
From the opening of our first restaurant in Beverly Hills in 1985, we have applied our innovative approach to creating and defining a new category of pizza—the premium pizza. For example, our signature creation, the Original BBQ Chicken Pizza, utilizes barbecue sauce instead of tomato sauce and adds toppings of barbeque chicken breast, smoked Gouda and mozzarella cheeses, sliced red onion and fresh cilantro. Our Thai Chicken Pizza, another early original creation, is created with a base of spicy peanut-ginger and sesame sauce, and topped with marinated chicken breast, mozzarella cheese, roasted peanuts, green onions, bean sprouts, julienne carrots and fresh cilantro. Other examples of our wide variety of distinctive flavors include the Jamaican Jerk Chicken Pizza, Buffalo Chicken Pizza, Greek Pizza, California Club Pizza, Pear & Gorgonzola Pizza, Chipotle Chicken Pizza, Meat Cravers Pizza and the recently introduced Roasted Artichoke & Spinach Pizza.
Our menu is also designed to satisfy customers who seek traditional, American-style tomato sauce-based pizza or authentic, Italian-style Neapolitan pizza. For the traditionalist, we offer a variety of items such as the Mushroom Pepperoni Sausage Pizza, the Italian Tomato & Basil Pizza and The Works Pizza which combines sweet Italian sausage, pepperoni, sautéed mushrooms, mozzarella cheese, green peppers, black olives and our tomato sauce. Our Thin Crust pizzas include our Margherita Pizza made with imported Italian tomatoes, fresh mozzarella cheese, fresh basil and parmesan cheese, and our Sicilian Pizza made with spicy marinara sauce, spicy Capicola ham, julienne salami and fontina, mozzarella and parmesan cheeses.
In addition to our innovative pizza menu, another competitive strength is the popularity of our salad menu. From the success of our Original BBQ Chicken pizza we were inspired to create such signature salads as The Original BBQ Chicken Chopped Salad, which contains chopped lettuce, black beans, sweet corn, jicama, cilantro, basil, crispy corn tortilla chips, and Monterey Jack cheese tossed together in our homemade ranch dressing, and topped with chopped barbecue chicken breast, fresh diced Roma tomatoes and fresh green onions. We also were innovative in updating the Waldorf Chicken Salad with our rendition of this New York City favorite. Our recipe includes fresh field greens, grilled chicken breast, seedless grapes, Granny Smith apples, candied walnuts, celery and Gorgonzola cheese, topped with our homemade Dijon balsamic vinaigrette. We also offer such innovative salads as the Thai Crunch Salad, Miso Shrimp Salad and Moroccan Chicken Salad. Among our traditional salad offerings are our Original Chopped Salad, CPK Cobb Salad, and our Classic Caesar Salad.
4
Table of Contents
Our pasta menu has longstanding original favorites such as our Chicken Tequila Fettuccine, Kung Pao Spaghetti, Garlic Cream Fettuccine and traditional items with our own recipes such as our Tomato Basil Spaghetti, Spaghetti Bolognese and Baby Clam Linguini with Imported Italian Tomatoes.
We have broadened our menu beyond pizza, pastas, and salads, to include specialty entrees, sandwiches, soups, appetizers and desserts, and we strive to bring the same level of creativity and innovation to our entire menu and offer items that appeal to a variety of tastes.
In January 2010, we introduced our Small Cravings Menu to offer our guests the innovative flavors we are known for, but in smaller portions, inviting guests to explore the many tastes our restaurants offer. These items range in price from $4.29 to $5.99 and examples include the Spicy Chicken Tinga Quesadilla, Korean BBQ Steak Tacos, White Corn Guacamole & Chips, and the Wedge Salad. We also offer a full range of appetizers including our Spinach Artichoke Dip, Avocado Club Egg Rolls, Chicken or Shrimp Lettuce Wraps and Tortilla Spring Rolls.
Our specialty entrées include the Baja Fish Tacos, Steak Tacos, Wild Caught Mahi Mahi, Pan-Sautéed Salmon, Chicken Milanese and Chicken Piccata. A variety of cravable desserts round out the menu including our sumptuous Butter Cake, Red Velvet Cake, Chocolate Soufflé Cake, Key Lime Pie, Apple Crisp and Tiramisu.
All of our menu items are prepared to order in our restaurants. This reinforces our customers’ confidence in the freshness and quality of our preparations and allows us to customize any dish to accommodate specific dietary or taste preferences. We are proud that our entire menu is trans-fat free. We have also added such healthy options as multi-grain pasta and honey wheat with whole grain pizza crust.
We have improved and expanded our wine list to offer a wider variety of premium wines in a reasonable price range. Most of our wines are offered by the glass or by the half glass. We also serve a variety of bottled and tap beers. We serve mixed drinks primarily to complement our menu offerings in all restaurants in which we have liquor licenses.
Our soup menu is entirely vegetarian with such features as our Dakota Smashed Pea and Barley Soup, Sedona Tortilla Soup and Tuscan White Bean Minestrone. Our sandwiches are offered on focaccia bread and include our Cranberry Walnut Chicken Salad, Chicken Club and Turkey Stack as well as our longstanding favorites such as the Grilled Chicken Caesar.
We regularly review the sales mix of our menu items and replace lower selling items in each category with new menu items twice a year. Because of our ability to quickly adapt our menu, we believe that we are able to meet our customers’ changing tastes and expectations. Our entrées generally range in price from $6.49 to $17.99 and our average dine-in guest check is approximately $15.00, including alcoholic beverages.
Operations
Restaurant Management. We currently have 32 regional directors who report to four regional vice presidents of operations. These regional vice presidents report to our Chief Operating Officer and Chief Financial Officer (“COO and CFO”), Susan M. Collyns. Each regional director oversees five to nine restaurants and supervises the general manager for each restaurant within his or her area of control. The typical full service restaurant management team consists of a general manager, who oversees the entire operation of the restaurant, a kitchen manager and one to three other managers. Additionally, depending upon the size and sales volume of a restaurant, we may also employ another kitchen manager and/or another manager in the dining area. Most of our full service restaurants employ approximately 60 to 80 hourly employees, many of whom work part-time. The general manager of each restaurant is responsible for the day-to-day operation of that restaurant, including hiring,
5
Table of Contents
training and development of personnel, as well as operating results. The kitchen manager is responsible for product quality, food costs and kitchen labor costs. Our full service restaurants are generally open Sunday through Thursday from 11:00 a.m. until 10:00 p.m., and on Friday and Saturday from 11:00 a.m. until 11:00 p.m.
Training. We strive to maintain quality and consistency in each of our restaurants through the careful training, development and supervision of personnel and the establishment of, and adherence to, high standards relating to service, food and beverage preparation, maintenance of facilities, quality and safety. We provide all new employees with complete orientation and training for their positions to ensure they are able to meet our high standards. Each location has certified trainers who provide classroom and on-the-job instruction. Employees are certified for their positions by passing a series of tests and evaluations. Our management training program lasts for 10 weeks and is completed in one of our more than 100 certified training restaurants. Management training includes service, kitchen and overall management responsibilities, with intense focus on food preparation, which is the essence of the California Pizza Kitchen experience. An extensive series of interactive modules and on-line quizzes are used in conjunction with on-the-job training. After spending the first eight weeks in their certified training restaurant, new managers spend the last two weeks of training in their home restaurant, working side-by-side with the general manager. We place a high priority on our continuing management development programs in order to ensure that qualified managers are available for our future growth. In addition, we have detailed written operating procedures, standards and controls, finance modules, food and service quality assurance systems and safety programs. We regularly hold conference calls, workshops, rollout meetings, tutorials and updates for general managers and regional directors during which they receive financial information and additional training on food preparation, hospitality and other relevant topics. This same information is then communicated to all levels of management through the regional vice presidents and regional directors, ensuring that identical messages are communicated to each manager in our company.
When we open a new restaurant, we provide varying levels of training to each employee as necessary to ensure the smooth and efficient operation of a California Pizza Kitchen restaurant from the first day it opens to the public. Approximately two weeks prior to opening a new restaurant, our dedicated training/opening team travels to the location to begin intensive training of all new employees for that restaurant. Our training team remains on site during the first two weeks of operation. We believe this additional investment in our new restaurants is important since it helps us provide our customers with a quality dining experience from day one. We also make on-site training teams available when our franchisees open new restaurants. After a restaurant has been opened and is operating smoothly, the general manager supervises the training of all new employees. Each region also has one regional training manager who periodically oversees the training processes in each location to ensure our industry-leading training standards are achieved for maximum consistency and brand strength.
Recruiting and Retention. We seek to hire experienced managers and staff. We offer our employees competitive wages and benefits, including a 401(k) plan and deferred compensation plan, both with a discretionary match for our salaried employees, medical insurance for all of our employees, including eligible part-time workers, and discounts on dining.
We attempt to motivate and retain our employees by providing them with structured career development programs for increased responsibilities and advancement opportunities, as well as performance-based bonuses tied to sales, profitability and qualitative measures. Our most successful general managers are eligible for promotion to senior general manager status and are entitled to receive more lucrative compensation packages based on various performance criteria. We believe we also enjoy the recruiting advantage of offering our general managers restaurants that are easier to manage because they are generally smaller than those of our competitors and have hours that typically do not extend late into the night.
Customer Satisfaction. Customer satisfaction is critically important to us. To that end, we solicit and analyze our customers’ opinions through web-based surveying of guests every month, which is a vital tool in our quality control efforts from both a food quality and customer service perspective. We also use targeted mystery shopper reports to continually evaluate and refine our operational execution.
6
Table of Contents
Marketing
Our communication strategy focuses on marketing the California Pizza Kitchen brand through many creative and non-traditional avenues. As one of the pioneers of premium pizza, we continue to benefit from national media attention featuring our co-founders and co-CEOs, Richard Rosenfield and Larry Flax. New restaurant openings, high-profile fundraisers and media events currently serve as the focal point of our public relations and media outreach efforts.
In 2010, we had sponsorship agreements with the Los Angeles Dodgers, Los Angeles Angels of Anaheim and Los Angeles Kings to promote California Pizza Kitchen at Dodger Stadium, Angel Stadium and STAPLES Center, respectively, and were the exclusive pizza provider at these venues. We expect to continue the arrangements in 2011.
During 2010, our public relations efforts led to coverage on a national level in numerous outlets including People Magazine, Sunset Magazine, Health Magazine, Wall Street Journal, The View, The Dr. Phil Show, AOL.com and The Rachael Ray Show. In addition, Company representatives were invited to demonstrate our creative menu items on local television programs in over 15 major markets, and the Company was written about in major daily newspapers from coast to coast.
We employ a variety of marketing techniques in connection with our new restaurant openings, including charitable fundraising events with invitations to media personalities and community leaders. In addition, we donate 100% of dine-in pizza sales from a designated day immediately following the opening to a local children’s charity. California Pizza Kitchen managers are also encouraged to host fundraising events in their restaurants with local charities which returns 20% of proceeds back to the charities as a donation.
Our involvement in the community does not end once we have opened a restaurant. In each of the markets in which we operate, we continuously engage in a variety of charitable and civic causes through ongoing in-kind donations. We donate 100% of the proceeds from the sale of California Pizza Kitchen’s three cookbooks to various children’s charities. These cookbooks are sold at our restaurants, through national bookstore chains and through on-line retailers.
In 2008, the CPK Foundation partnered with Starlight Children’s Foundation on a national level to host twenty CPKids Camps each year through 2011 in cities across the country for Starlight children and their families. These camps will give seriously ill children and their families recreational opportunities outside of the hospital environment. In 2010, Starlight Children’s Foundation planned and executed 21 CPKids Camps in cities including Los Angeles, New York, Dallas, Denver, Seattle, San Francisco and San Diego that included outdoor games, crafts, music and performers. Local CPK restaurants provide lunch for all participants and employees volunteer as “Camp Counselors.”
During 2010, a total of approximately $1.4 million was donated to over 2,000 local community and children’s charities across the U.S. directly from our restaurants and through the CPK Foundation.
We conduct consumer research to monitor our customer satisfaction, and we also engage, to a limited extent, in paid advertising on a national and individual location basis. Some of the mediums used include digital, billboards, kiosks and newspapers. In 2010, we continued our nationwide Thank You Card promotion, which awarded customers with complimentary meals, discounts and various other prizes, with the Grand Prize of $100,000 in cash. We also utilize a variety of social media platforms including Twitter, Facebook and YouTube. On-going marketing efforts include business-to-business programs, CPKids programs with local schools and children’s organizations, hotel concierges and new resident programs. We utilize a variety of printed materials, including take-out and catering menus, mall employee pizza passes, take-out bag stuffers, check presenter inserts, Be Our Guest cards and electronic gift cards.
In 2010, we spent an aggregate of 1.2% of restaurant sales on marketing efforts. We expect to continue investing approximately 1.0% of restaurant sales in marketing efforts in 2011.
7
Table of Contents
Company-owned Restaurant Expansion Strategy and Site Selection
We expect that full service restaurants will continue to represent the majority of our revenue growth in the near term, and our expansion strategy will focus primarily on further penetrating existing markets. As a result, we anticipate over the next several years that a majority of our new restaurants will be in existing markets. This clustering approach enables us to increase brand awareness and improve our operating and marketing efficiencies. For example, clustering enables us to reduce costs associated with regional supervision of restaurant operations and provides us with the opportunity to leverage marketing costs over a greater number of restaurants. We also believe this approach reduces the risks involved with opening new restaurants given that we better understand the competitive conditions, consumer tastes, demographics and discretionary spending patterns in our existing markets. In addition, our ability to hire qualified employees is enhanced in markets in which we are well known.
We believe that our site selection strategy is critical to our success, and we devote substantial effort to evaluating each potential site at the highest levels within our organization. We identify areas within our target markets that meet our demographic requirements, focusing on daytime and evening populations, shopping patterns, availability of personnel and household income levels. We only consider expanding to new markets that meet our strict demographic criteria. Our site selection criteria are flexible given that we operate restaurants in all types of regional shopping centers, lifestyle centers, entertainment centers, freestanding street locations in commercial and residential neighborhoods, office buildings and hotels. We have several long-standing relationships with major mall developers and owners and are therefore afforded the opportunity to negotiate multiple location deals.
We developed a “new” prototype full service restaurant in fiscal 2004 and have opened 95 new or remodeled restaurants under this format. Including these prototype locations, restaurants built beginning in 1998 and refreshened older locations, more than 90% of our restaurant base now has a warmer ambience environment that achieves higher value scores from guests compared to our original format.
Our company-owned locations include four CPK/ASAP restaurants that compete in the fast casual market. In 2009, the Company began to transition certain company-owned CPK/ASAP locations to logo branding consistent with full service restaurants. We intend to either close or transition the remaining company-owned CPK/ASAP locations into full service restaurants in the future. Our portfolio of restaurants also includes LA Food Show Grill & Bar (“LA Food Show”) with one location in Manhattan Beach, California and one location in Beverly Hills, California.
Unit Level Economics
Full service restaurants opened in fiscal 2010 are approximately 5,300 square feet with approximately 200 seats and are “inline” rather than “freestanding” restaurants. We are building fewer freestanding locations than in previous years but will continue to build freestanding locations if presented with unique opportunities. Consistent with reduced construction costs and our flexible design format, costs on average are approximately $2.5 million for inline restaurants before any landlord allowances. This excludes pre-opening costs, which averaged approximately $340,000 per restaurant.
Restaurant Franchise and Licensing Arrangements
As part of our strategy to expand and leverage the California Pizza Kitchen brand, we introduced and franchised the CPK/ASAP concept in 1996. Our franchised CPK/ASAP restaurants are designed specifically for the “grab and go” customer in non-traditional locations and are typically 600 to 1,000 square feet in size with a limited menu and common area seating. The HMSHost Corporation franchisee (“HMSHost”) operates 19 CPK/ASAP restaurants throughout the United States, including one full service location, primarily in airports and travel plazas. MGM Mirage operates one full service restaurant in The Mirage in Las Vegas, Nevada. In January 2010, CPK opened a quick-serve location at Stony Brook University in Stony Brook, New York. This location is
8
Table of Contents
the Company’s second location on a college campus and is operated by Compass LCS, LLC, a wholly-owned subsidiary of Compass Group USA, Inc., dba Lackmann Culinary Services. A third university operation was also added in August 2010 at the University of Southern California and is operated by USC Hospitality.
HMSHost has preferred rights to open new CPK/ASAP restaurants in airports and in travel plazas along toll-roads in North America. In 2010 HMSHost opened four locations: one quick-service restaurant at each of the international airports in Honolulu and Maui, Hawaii, a CPK airport kiosk in Fresno, California and a travel plaza in King of Prussia, Pennsylvania. Any location proposed by HMSHost is subject to approval at our sole discretion. Once we have agreed to HMSHost’s development of a CPK/ASAP restaurant in an airport or travel plaza location, our right to license or operate a restaurant ourselves at that location is limited. In fiscal 2006, we agreed to extend our relationship with HMSHost until 2012. Upon approval of additional locations, HMSHost pays an initial franchise fee of $20,000, generally, for each CPK/ASAP restaurant at a new location, $10,000 for each additional CPK/ASAP restaurant at an existing location, and continuing royalties at rates of 5.0% to 5.5% of gross sales. The HMSHost franchise agreement typically terminates at the same time as the HMSHost concessionaire agreement to operate at an airport or mall terminates.
As of January 2, 2011, we have eight international franchisees. One international franchisee operates six full service restaurants with three in Hong Kong, China and one each in Indonesia, Singapore and Malaysia. We have one international franchisee that operates seven full service restaurants in the Philippines, and another franchisee that operates nine full service restaurants in Mexico. Our fourth and fifth international franchisees operate one full service restaurant in Japan and Guam, respectively. The sixth international franchisee operates four full service restaurants in South Korea and a seventh international franchisee operates three full service restaurants in Dubai, United Arab Emirates. Our final franchisee operates one full service restaurant in India.
Our territorial development agreements with our international franchisees grant them the right to operate restaurants in an identified territory subject to meeting development obligations and excluding certain types of locations. Our basic franchise agreement with these franchisees generally requires payment of an initial fee of between $50,000 and $75,000 for a full service restaurant, as well as continuing royalties at a rate of 5.0% of gross revenue. Most of our franchise agreements contain a 10- or 20-year term.
Agreement with Nestlé
We are party to a trademark license agreement with Nestlé USA, Inc. (“Nestlé”), which assumed the obligations under the license agreement from Kraft Pizza Company in March 2010. Pursuant to the agreement, we have licensed certain of our trademarks and proprietary recipes to Nestlé for its use in manufacturing and distributing a line of California Pizza Kitchen premium frozen pizzas in the United States and Canada. Our frozen products are currently sold in 50 states and the District of Columbia at approximately 20,000 points of distribution through select grocers and warehouse stores.
Our frozen products include the Crispy Thin Crust pizza line which is available in seven flavors: BBQ Chicken, Four Cheese, Garlic Chicken, Margherita, Sicilian, Signature Pepperoni and White. Original Restaurant Style Crust selections include BBQ Recipe Chicken, Five Cheese & Tomato and Hawaiian. Choices for the Small pizza, formerly known as “For One”, include BBQ Chicken, Four Cheese, Margherita, Pesto Chicken, Sicilian and Hawaiian.
We collect royalties based on a tiered schedule. The royalties are calculated as a percentage of wholesale sales of our premium frozen products. We received $6.1 million in royalties in fiscal 2010, a decrease of 20.9% from fiscal 2009. Nestlé is also obligated to spend a percentage of net sales on advertising and promotion of California Pizza Kitchen’s licensed products and possesses the first right of refusal on manufacturing and distributing new frozen product lines.
9
Table of Contents
Management Information Systems
All of our restaurants use computerized information technology systems that are designed to improve operating efficiencies, provide field and corporate management timely access to financial and marketing data, reduce restaurant and corporate administrative time and expense, ensure compliance with federal and local legislation and facilitate an enjoyable guest experience by allowing our guests to customize menu items, food preparation and payment options as desired. Our restaurant systems include a point-of-sale system, a labor scheduling and management application and an inventory usage analysis system. Our systems provide integrated online customer ordering via the Company website and text or mobile-web enabled devices. The data captured by our restaurant-level systems include restaurant sales, cash and credit card receipts, quantities of each menu item sold, customer counts, daily labor expense and inventory movement. This information drives in-store reporting and analysis systems designed to help our management teams run their restaurants efficiently and profitably. Each week, every restaurant prepares a flash profit and loss statement that is compared to other relevant measures such as budget and prior year. Additionally, the information is transmitted to the corporate office on a daily basis for use by our corporate information systems.
We have an extensive sales performance reporting system used by all levels of management. This suite of reports and alerts give operators the ability to effectively view store level metrics about category sales, guest count, check average and guest satisfaction. Our “meal break” reporting technologies allow our operators to track staff meals and breaks on a shift-by-shift basis to better ensure compliance. Our corporate information systems provide management with operating reports that show restaurant performance comparisons against items such as budget, prior year results and other company restaurants. Multiple reporting time frames are available, including current week, current accounting period and year-to-date. These systems allow us to closely monitor restaurant sales, cost of sales, labor expense and other restaurant trends on a daily, weekly and monthly basis.
We believe these systems enable both restaurant and corporate management to adequately manage the operation and financial performance of our restaurants. To maximize system uptime and to ensure continued operations in the event of disasters, we operate redundant data centers in two different states, either of which is capable of satisfying all of our information technology requirements on its own. Our store data communication network also has redundancy built in. In the event a store’s primary private network circuit fails, the store’s network will automatically switch over to a second private network connection, independent of the original connection. These levels of redundancy have proven that we can rely on our systems for mission critical applications. Additionally, we believe the systems are scalable and flexible enough to accommodate or integrate with any technologies necessary to support new initiatives. We are also certified as being in compliance with the Payment Card Industry Data Security Standard requirements for Level 1 merchants.
Purchasing
Our procurement department procures all of our food ingredients, beverages, products and supplies. We seek to obtain the highest quality ingredients, products and supplies from reliable sources at competitive prices. We continually research and evaluate various food ingredients, products and supplies for consistency and food safety and compare them to our detailed specifications. Specific, qualified manufacturers and growers are then inspected and approved for use. This process is repeated at least once a year. To maximize our purchasing efficiencies and obtain the lowest possible prices for our ingredients, products and supplies, while maintaining the highest quality, our centralized purchasing staff generally negotiates prices based on one of two formats: fixed-price contracts, generally with terms of one month to one year, or monthly commodity pricing formulas. In order to provide the freshest ingredients and products, and to maximize operating efficiencies between purchase and usage, each restaurant’s kitchen manager determines its daily usage requirements for food ingredients, products and supplies. The kitchen manager orders accordingly from approved local vendors and our national master distributor. The kitchen manager also inspects all deliveries daily to ensure that the items received meet our quality specifications and negotiated prices. We have competitively priced, high quality alternative manufacturers, vendors, growers and distributors available should the need arise.
10
Table of Contents
Employees
As of January 2, 2011, we have approximately 14,000 employees, including approximately 190 employees located at our corporate headquarters. Our employees are not covered by any collective bargaining agreement. We consider our employee relations to be strong. We comply with US immigration laws, including the Immigration Reform and Control Act of 1986. In accordance with this law, we require every employee to complete Form I-9 when hired and within three business days of the date of hire, provide valid documentation which we strictly review to confirm lawful employment authorization in the United States. No employee may continue in employment without lawful employment authorization.
Competition
The restaurant industry is intensely competitive. We compete on the basis of the taste, quality and price of food offered, customer service, ambiance, location and overall dining experience. We believe that our concept, attractive price-value relationship and quality of food and service enable us to differentiate ourselves from our competitors. Although we believe we compete favorably with respect to each of these factors, many of our direct and indirect competitors are well-established national, regional or local chains, and some have substantially greater financial, marketing and other resources. We also compete with many other restaurant and retail establishments for site locations and restaurant-level employees. The packaged food industry is also intensely competitive.
Trademarks
Our registered trademarks and service marks include, among others, the word marks “California Pizza Kitchen” and “LA Food Show,” as well as the California Pizza Kitchen and California Pizza Kitchen ASAP logos. We have registered our marks with the United States Patent and Trademark Office. We have registered our most significant trademarks and service marks in many foreign countries. We have also registered our ownership of the Internet domain names “www.cpk.com” and “www.californiapizzakitchen.com.” We believe that our trademarks, service marks and other proprietary rights have significant value and are important to our brand-building efforts and the marketing of our restaurant concepts. We have vigorously protected our proprietary rights in the past and expect to continue to do so. We cannot predict, however, whether steps taken by us to protect our proprietary rights will be adequate to prevent misappropriation of these rights or the use by others of restaurant features based upon, or otherwise similar to, our concept. It may be difficult for us to prevent others from copying elements of our concept and any litigation to enforce our rights will likely be costly.
Government Regulation
Our restaurants are subject to licensing and regulation by state and local health, sanitation, safety, fire and other authorities, including licensing and regulation requirements for the sale of alcoholic beverages and food. To date, we have not experienced an inability to obtain or maintain any necessary licenses, permits or approvals, including restaurant, alcoholic beverage and retail licenses. The development and construction of additional restaurants will also be subject to compliance with applicable zoning, land use and environmental regulations. We are also subject to federal and state laws that regulate the offer and sale of franchises and substantive aspects of a licensor-licensee relationship. Various federal and state labor laws govern our relationship with our employees and affect operating costs. These laws include minimum wage requirements, overtime, unemployment tax rates, workers’ compensation rates, employment eligibility requirements and sales taxes.
We are subject to federal and state laws that require multi-unit restaurant operators to make certain nutritional information available to guests or prohibit the sale of certain types of ingredients in restaurants. We are also subject to federal and state environmental regulations, but these rules have not had a material effect on our operations. Various laws concerning the handling, storage and disposal of hazardous materials, such as cleaning solvents, and the operation of restaurants in environmentally sensitive locations may impact aspects of our operations. During fiscal 2010, there were no material capital expenditures for environmental control devices and no such expenditures are anticipated.
11
Table of Contents
Our facilities must comply with the applicable requirements of the Americans with Disabilities Act of 1990 (“ADA”) and related state statutes. The ADA prohibits discrimination on the basis of disability with respect to public accommodations and employment. Under the ADA and related state laws, when constructing new restaurants or undertaking significant remodeling of existing restaurants, we must make the restaurants readily accessible to disabled persons. We must also make reasonable accommodations for the employment of disabled persons.
We have a significant number of hourly restaurant employees that receive tip income. We have elected to voluntarily participate in a Tip Rate Alternative Commitment (“TRAC”) agreement with the Internal Revenue Service. By complying with the educational and other requirements of the TRAC agreement, we reduce the likelihood of potential employer-only FICA assessments for unreported or underreported tips. However, we rely on our staff members to accurately disclose the full amount of their tip income and base our reporting on the disclosures provided to us by such tipped employees.
Availability of Reports
Our Internet address is www.cpk.com. At this Internet website we make available, free of charge, our Code of Ethics, proxy statement, annual report on Form 10-K, quarterly reports on Form 10-Q, current reports on Form 8-K and amendments to those reports filed or furnished pursuant to Section 13(a) or 15(d) of the Securities Exchange Act as soon as reasonably practicable after we electronically file such materials with, or furnish them to, the Securities and Exchange Commission (“SEC”).
Changes in economic conditions and financial markets could affect consumer spending which may harm our business and operating results.
The effects of the downturn in economic activity experienced beginning in 2008 by the U.S. and global economies may continue into 2011. The Company is sensitive to changes in general economic conditions, both nationally and locally, such as levels of unemployment, disposable consumer income, consumer debt, interest rates, energy costs, inflation and changes in commodity prices as they may each affect consumer spending habits which could in turn adversely affect demand for the Company’s products.
Consumers have generally reduced their discretionary spending and continue to trade down to lower priced products in many cases when deciding how much to spend on consumer goods and dining out. The Company could continue to experience reduced customer traffic or limitations on the prices it can charge for its products, either of which could reduce the Company’s sales and profit margins and have a material adverse effect on the Company’s financial position, results of operations or cash flows. Also, economic factors such as those listed above and increased transportation costs, labor, insurance and healthcare costs and changes in laws and regulations may increase the Company’s cost of sales, operating, general and administrative expenses and otherwise adversely affect the financial position, results of operations or cash flows of the Company.
Changes in consumer preferences or negative publicity could adversely impact our results.
Our restaurants feature innovative pizzas, pastas, salads and appetizers in an upscale, family-friendly, casual environment. Our continued success depends, in part, upon the popularity of these foods and this style of informal dining. Shifts in consumer preferences away from this cuisine or dining style could materially adversely affect our future profitability. Guest satisfaction is important to us, and we believe that our success depends on the value and quality of items that we offer our guests. Any incident that erodes consumer trust in or affinity for our brands could significantly reduce their values. Like other restaurant chains, we can also be materially adversely affected by negative publicity, whether accurate or not, concerning food quality, illness, injury, publication of government or industry findings concerning food products served by us or other health concerns or operating issues stemming from one or more restaurants. These types of publicity could reduce our guest traffic which could adversely affect our operating results.
12
Table of Contents
New information or attitudes regarding diet and health could result in changes in regulations and consumer eating habits that could adversely affect our revenues.
Regulations and consumer eating habits may continue to change as a result of new information and attitudes regarding diet and health. These changes may include regulations that impact the ingredients and nutritional content of our menu items. The federal government as well as a number of states, counties and cities have enacted menu labeling laws requiring multi-unit restaurant operators to make certain nutritional information available to guests or have enacted legislation prohibiting the sales of certain types of ingredients in restaurants. The success of our restaurant operations depends, in part, upon our ability to effectively respond to changes in consumer health and disclosure regulations and to adapt our menu offerings to fit the dietary needs and eating habits of our guests without sacrificing flavor. If consumer health regulations or consumer eating habits change significantly, we may be required to modify or discontinue certain menu items. To the extent we are unable to respond with appropriate changes to our menu offerings, it could materially affect guest demand for our concepts and have an adverse impact on our revenues.
Our menu and marketing programs may not be successful.
We expect to undertake new menu and marketing initiatives to drive comparable sales and guest traffic while building long-term, sustainable value. Our profitability depends, in part, upon consumer reception of these initiatives as unsuccessful initiatives could result in incremental expenses incurred without the benefit of higher revenues. Furthermore, if our competitors were to introduce more effective menu and marketing programs than ours, it could adversely affect our guest traffic which could adversely affect our operating results.
Our operations are susceptible to changes in food and supply costs, which could adversely affect our margins.
Our profitability depends, in part, on our ability to anticipate and react to changes in food and supply costs. Our procurement department negotiates prices for all of our ingredients and supplies through either contracts (terms of one month up to one year) or commodity pricing formulas. Our national master distributor delivers goods one to three times per week at a set, flat fee per case to all of our restaurants. Our contract with our national master distributor is up for renewal in July 2011, and while the Company believes it will be able to negotiate a similarly priced contract with either its current sole master distributor or another distributor, there can be no guarantee that we will be able to do so. We currently expect prices for commodity products to increase in 2011 compared to 2010. Furthermore, various factors beyond our control, including adverse weather conditions and governmental regulations, could also cause our food and supply costs to increase beyond our expectations. We cannot predict whether we will be able to anticipate and react timely to changing food and supply costs by adjusting our purchasing practices. A failure to do so could adversely affect our operating results or cash flows.
Approximately 40 percent of our U.S. based restaurants are located in California. As a result, we are highly sensitive to negative economic conditions in that state.
Together with our franchisees, we currently operate a total of 85 restaurants in California (74 are company-owned and 11 are franchised locations). As a result, we are particularly susceptible to adverse trends and economic conditions in California, which has been more negatively impacted by the economic downturn than many other geographic regions. In addition, given our geographic concentration, negative publicity regarding any of our restaurants in California could have a material adverse effect on our business and operations, as could other regional occurrences such as local strikes, earthquakes or other natural disasters.
Changes in applicable laws or regulations, including those related to labor, could adversely affect our business, financial position and results of operations if we fail to comply or if the costs of complying with these laws or regulations prove material.
Our business is subject to extensive federal, state and local government regulation in the various jurisdictions in which our restaurants are located, including regulations relating to alcoholic beverage control,
13
Table of Contents
public health and safety and food safety. The failure to obtain and/or retain licenses, permits or other regulatory approvals could delay or prevent the opening and/or continued operation of a restaurant in a particular area. In addition, our failure to comply with applicable laws and regulations could subject us to fines or legal actions, and the costs of compliance with new regulations could be high, in each case potentially resulting in an adverse effect on our business, financial position or results of operations.
Various federal and state labor laws and regulations govern our operations and relationships with employees, including minimum wages, breaks, overtime, fringe benefits, safety, working conditions and citizenship requirements. Changes in, or any failure to comply with, these laws and regulations could subject us to fines or legal actions. Even though we operate our facilities in strict compliance with Bureau of Citizenship and Immigration Services requirements and the requirements of certain states, some of our employees may, without our knowledge, fail to meet federal citizenship or residency requirements. This could result in a disruption in our work force, sanctions against us and adverse publicity. Significant government-imposed increases in minimum wages, paid or unpaid leaves of absence and mandated health benefits, or increased tax reporting, assessment or payment requirements related to our employees who receive gratuities could be detrimental to the profitability of our restaurants.
A number of our employees are subject to various minimum wage requirements. The federal minimum wage increased as recently as fiscal 2009, and many states concurrently changed their minimum wage laws to entitle employees to the greater of the state or federal minimum wage. These changes in legislation resulted in minimum wage increases in 31 states and the District of Columbia. Similar increases may be implemented in other jurisdictions in which we operate or seek to operate. These minimum wage increases may increase the cost of labor and subsequently reduce our profitability.
The restaurant industry is typically impacted by changes to tax laws regarding tip credits. Changes to the tip credit continue to be proposed and implemented on both the federal and state levels. Future legislation that changes allowable tip credits may increase our effective tax rate and have an adverse effect on the Company’s financial position, operating results and cash flows.
Our federal, state and local tax returns may, from time to time, be selected for audit by taxing authorities, which may result in tax assessments or penalties that could have a material adverse impact on our results of operations and financial position.
We are subject to federal, state and local taxes in the U.S. and international taxes. Significant judgment is required in determining the provision for income taxes. Although we believe our tax estimates are reasonable, if the IRS or other taxing authority disagrees with the positions we have taken on our tax returns, we could face additional tax liability, including interest and penalties. If material, payment of such additional amounts upon final adjudication of any disputes could have a material adverse impact on our results of operations and financial position.
We are subject to complaints and litigation that could have an adverse effect on our business.
We are, from time to time, the subject of complaints or litigation from guests alleging food borne illnesses, injuries or other food quality, health or operational concerns. Adverse publicity resulting from these allegations may materially adversely affect our restaurants and brand, regardless of whether the allegations are valid or whether we are liable. We are also subject to complaints or allegations from current, former or prospective employees from time to time. The restaurant industry in California has seen a rise in purported class action lawsuits in recent years, as has the Company. A lawsuit or claim could result in an adverse decision against us that could have a material adverse effect on our business. Additionally, the costs and expense of defending ourselves against lawsuits or claims, regardless of merit, could have an adverse impact on our profitability and could cause variability in our results compared to expectations. Further, defending such claims may divert financial and management resources that would otherwise be used to benefit the future performance of our
14
Table of Contents
operations. We also are subject to some states’ “dram shop” statutes. These statutes generally provide a person injured by an intoxicated person with the right to recover damages from an establishment that wrongfully served alcoholic beverages to the intoxicated person. A settlement or judgment against us under a dram shop statute could have a material adverse effect on our operations.
Failure to maintain our credit facility could have a material adverse effect on our liquidity and financial condition.
The Company has a five-year $150.0 million revolving credit facility that expires in May 2013. The facility contains an uncommitted option to increase, subject to the satisfaction of certain conditions, the maximum borrowing capacity by up to an additional $50.0 million. The credit facility contains certain restrictive and financial covenants, including that the Company maintain a minimum consolidated fixed charge coverage ratio and a maximum lease adjusted leverage ratio. The availability and terms of additional financing are subject to a number of factors, some of which are beyond our control, including credit worthiness. See Note 8 of the Notes to Consolidated Financial Statements in Part IV, Item 15 of this report for additional information concerning our credit facility. Our failure to maintain these covenants or the inability to renew the credit facility at maturity could have a material adverse effect on our future results and financial condition.
Our future revenue and earnings per share growth depends in part upon the growth of our royalty, license and franchise revenues, which depends on contract partners we do not control.
Our revenue and earnings per share growth from ancillary sources including license and franchise agreements depend, in part, upon the performance of contract partners acting independently. Adverse events beyond our control, such as quality issues related to a food product or a failure to maintain quality standards at a franchised restaurant, could negatively impact our brand, business and results of operations. The growth of our international franchise business depends in part upon our ability to find and attract quality franchisees. There is also the risk that we may see an increase in restaurant offerings in the markets in which our international locations operate which could result in reduced guest traffic and have an adverse impact on our operating results. The growth of our domestic franchise business depends on the ability of our franchise partner to obtain concessionaire agreements to operate at an airport and on air travel volume, as most of our domestic franchise locations are located in airports. Any events or factors that disrupt business or leisure air travel, including the current recession and threats of terrorist activity, could adversely impact our growth. Increased competition in the frozen pizza category, including product offerings by our competitors at heavy discounts or by way of aggressive marketing, may result in our inability to sustain our market share. A decline in ancillary revenues could have a material adverse impact on our growth, profitability and results of operations.
Our success depends, in part, on our ability to achieve our planned growth strategy, which partly depends on factors outside our control, including the current economic environment.
We are pursuing a disciplined growth strategy that, to be successful, depends on our ability and the ability of our franchisees and licensees to open new restaurants and to operate these new restaurants on a profitable basis. Successful expansion depends on numerous factors, many of which are beyond our control, including: the hiring, training and retention of qualified operating personnel, especially managers; competition for restaurant sites; negotiation of favorable lease terms; timely development of new restaurants, including the availability of construction materials and labor; management of construction and development costs of new restaurants; securing required governmental approvals and permits; competition in our markets; and general economic conditions.
A challenge in meeting our growth objectives will be to secure an adequate supply of suitable new restaurant sites. There can be no assurance that we will be able to find and secure sufficient suitable locations for our planned expansion in any future period. Opening newly selected restaurant sites in a timely manner is, and may remain, a challenge. We have experienced, and may continue to experience, delays in opening some of our
15
Table of Contents
new restaurants due to delays by landlords and developers in delivery of real estate development projects in which our new sites are located. These delays occur both in the normal course of business and, more recently, due to the weak economic environment and tight credit markets and their negative impact on the commercial real estate market. Delays or failures in opening new restaurants on time could materially adversely affect our business, financial condition, operating results or cash flows.
A reduction in the number of restaurant openings or acceleration of the pace of restaurant openings may have an adverse impact on our results of operations or financial position.
Our opening costs continue to be significant, and the amount incurred in any one year or quarter depends on the number of restaurants expected to be opened during the respective period. Our decision to either decrease or increase the pace of restaurant openings may adversely affect on our results of operations for the period being measured.
Landlords or other tenants in the shopping centers and retail areas in which our restaurants are located may experience difficulty as a result of macroeconomic trends or cease to operate, which in turn could negatively affect our business.
In the current economic climate, landlords of properties in which we operate or plan to operate may become insolvent, may be unable to obtain financing or be otherwise unable to discharge their obligations to us under their financing arrangements or our lease agreements. If our landlords fail to satisfy their obligations to us or cannot operate their businesses in the ordinary course, such failures may result in us delaying openings or terminating leases in these locations which could lead us to incur additional costs particularly for the relocation and development of a restaurant whose lease was not renewed. In addition, other tenants at the properties in which we are located or have executed leases may delay their openings, fail to open or may cease operations. Decreases in total tenant occupancy in the properties in which we are located may affect guest traffic at our restaurants. All of these factors could have a material adverse impact on our results of operations.
Our inability to renew existing leases on favorable terms may adversely affect our financial condition, operating results or cash flows.
We lease over 95% of our restaurant facilities, and the majority of our leases include options to extend the lease terms, tenant improvement allowances, rent holidays, rent escalation clauses and/or contingent rent provisions. We utilize our portfolio optimization model to evaluate whether to renew leases as they come up for renewal. While we currently expect to exercise the renewal option of the majority of our expiring restaurant leases, there is a possibility that such leases may be renewed at substantially higher rent prices which could have a material adverse impact on our business, financial condition, operating results or cash flows.
Our success depends on qualified and available labor, which could slow our growth.
Our success depends, in part, upon our ability to attract, motivate and retain a sufficient number of qualified employees, including restaurant managers, kitchen staff and servers, necessary to keep pace with our expansion schedule. Qualified individuals of the requisite caliber and number needed to fill these positions are in short supply in some areas. Although we have not experienced any significant problems in recruiting or retaining employees, any future inability to recruit and retain sufficient individuals may delay the planned openings of new restaurants. Any such delays or any material increases in employee turnover rates in existing restaurants could have a material adverse effect on our business, financial condition, operating results or cash flows. Additionally, competition for qualified employees could require us to pay higher wages and/or grant awards of equity, to the extent available, to attract a sufficient number of employees, which could result in higher labor costs. Failure to pay higher wages and/or grant awards of equity may prevent us from retaining and attracting qualified employees.
16
Table of Contents
Our restaurant expansion strategy focuses primarily on further penetrating existing markets. This strategy can cause sales in some of our existing restaurants to decline.
In accordance with our expansion strategy, we intend to open new restaurants primarily in our existing markets. Since we typically draw customers from a relatively small radius around each of our restaurants, the sales performance and customer counts for restaurants near the area in which a new restaurant opens may decline due to cannibalization of the existing restaurant’s customer base.
Our expansion into new markets may present increased risks due to our unfamiliarity with those areas
Our expansion strategy, in part, may also entail opening restaurants in markets in which we have little or no operating experience. These new markets may have different competitive conditions, consumer tastes and discretionary spending patterns than our restaurants in our existing markets. In addition, our new restaurants will typically take several months to reach budgeted operating levels due to problems associated with new restaurants, including lack of market awareness, inability to hire sufficient staff and other factors. Restaurants opened in new markets may never reach expected sales and profit levels, thereby affecting our overall profitability. Although we have attempted to mitigate these factors by paying careful attention to training and staffing needs, there can be no assurance that we will be successful in operating new restaurants on a profitable basis.
Our business and growth depend on the contributions of our co-CEOs, COO/CFO and other senior executives.
The success of our business continues to depend on the contributions of our co-founders and co-CEOs, Richard Rosenfield and Larry Flax, our COO and CFO Susan Collyns and certain other senior executives of the Company. The loss of the services of the co-CEOs, COO/CFO or other senior executives could have a material adverse effect on our business and plans for future development.
Our ability to attract and retain qualified management personnel may be harmed if we are unable to offer competitive compensation, including cash and equity awards. Our 2004 Omnibus Incentive Compensation Plan does not contain sufficient authorized shares to permit future equity grants at similar levels as in the past. Our ability to offer equity awards in the future may be limited or nonexistent if our shareholders do not approve a new equity incentive plan. If we fail to retain and attract qualified management personnel, we risk failing to maintain consistent quality of service which may in turn adversely affect our business and results of operations.
Rising insurance costs could negatively impact profitability.
The rising cost of insurance (workers’ compensation insurance, general liability insurance, health insurance and directors’ and officers’ liability insurance) could have a negative impact on our profitability. We self-insure a substantial portion of our workers’ compensation and general liability costs and the occurrence of a greater frequency or amount of claims or increase in medical costs could have a negative impact on our profitability. Additionally, health insurance costs in general have risen significantly over the past few years. These increases could have a negative impact on our profitability if we are not able to offset the effect of such increases with plan modifications and cost control measures, or by continuing to improve our operating efficiencies.
Failure to meet market expectations for our financial performance will likely have a negative impact on the market price of our common stock.
If we fail to meet the market’s expectations for our financial performance, particularly with respect to comparable restaurant sales, revenues, operating margins and diluted earnings per share, a decline in the market price of California Pizza Kitchen, Inc. common stock will likely occur.
The market price of our common stock may also be affected by general stock market conditions, including the performance of broad-based stock market indices and exchanges. These conditions may result in stock market volatility, which in turn would likely impact the price of our common stock, as well as a sell-off in our common stock, both of which could be unrelated or disproportionate to changes in our operating performance.
17
Table of Contents
There may be future sales or other dilution of our equity which may adversely affect the market price of our common stock.
We are not restricted from issuing additional common stock or preferred stock, including any securities that are convertible into or exchangeable for, or that represent the right to receive, common stock or preferred stock or any substantially similar securities. Our Board of Directors is authorized to issue additional shares of common stock and additional classes or series of preferred stock without any action on the part of the stockholders. Our Board of Directors also has the discretion, without stockholder approval, to set the terms of any such classes or series of preferred stock that may be issued, including voting rights, rights and preferences with respect to dividends or upon the liquidation, or winding up of our business and other terms. If we issue preferred shares in the future that have a preference over our common stock with respect to the payment of dividends or upon liquidation, dissolution or winding up, or if we issue preferred shares with voting rights that dilute the voting power of our common stock, the rights of our common stockholders or the market price of our common stock could be adversely affected.
Item 1B. Unresolved Staff Comments.
None.
Our corporate headquarters are located in Los Angeles, California. We occupy this facility under a lease, which was renewed effective September 1, 2002 and extends until August 2012 with an option to extend for an additional five years thereafter. We lease substantially all of our restaurant facilities, although we own one location each in Atlanta, Georgia; Alpharetta, Georgia; Grapevine, Texas; Scottsdale, Arizona; and Schaumburg, Illinois. A majority of our leases are for 10-year terms and include options to extend the terms. The majority of our leases also include tenant improvement allowances, rent holidays, rent escalation clauses and/or contingent rent provisions.
Current Locations
As presented in the table on the next page, as of March 13, 2011, we own, license or franchise 266 locations in 32 states and 11 foreign countries, of which 207 are company-owned and 59 operate under franchise or license arrangements. We franchise or license our concept to other restaurant operators including: HMSHost, which operates 18 CPK/ASAP restaurants and one full service restaurant; MGM Mirage, which operates one full service restaurant in a Las Vegas hotel-casino; eight international franchisees which currently operate a total of 33 full service restaurants in China, Dubai, Guam, India, Indonesia, Japan, Malaysia, Mexico, Philippines, Singapore and South Korea. We also have California Pizza Kitchen locations on three college campuses and at three domestic sports and entertainment venues that operate seasonally.
| Company-Owned Restaurants (1) |
Franchised/ Licensed Full Service Restaurants |
Franchised ASAP Restaurants |
Campus, Sports & Entertainment Venues (Seasonal) |
Total Locations |
||||||||||||||||
| Domestic |
||||||||||||||||||||
| Alabama |
2 | — | — | — | 2 | |||||||||||||||
| Arizona |
7 | — | 1 | — | 8 | |||||||||||||||
| California |
74 | — | 7 | 4 | 85 | |||||||||||||||
| Colorado |
6 | — | — | — | 6 | |||||||||||||||
| Connecticut |
3 | — | — | — | 3 | |||||||||||||||
| Delaware |
1 | — | — | — | 1 | |||||||||||||||
| Florida |
14 | — | 2 | — | 16 | |||||||||||||||
| Georgia |
6 | — | — | — | 6 | |||||||||||||||
| Hawaii |
5 | — | 2 | — | 7 | |||||||||||||||
18
Table of Contents
| Company-Owned Restaurants (1) |
Franchised/ Licensed Full Service Restaurants |
Franchised ASAP Restaurants |
Campus, Sports & Entertainment Venues (Seasonal) |
Total Locations |
||||||||||||||||
| Illinois |
10 | — | — | — | 10 | |||||||||||||||
| Kansas |
1 | — | — | — | 1 | |||||||||||||||
| Kentucky |
1 | — | — | — | 1 | |||||||||||||||
| Louisiana |
1 | — | — | — | 1 | |||||||||||||||
| Maryland |
4 | — | — | — | 4 | |||||||||||||||
| Massachusetts |
6 | — | — | — | 6 | |||||||||||||||
| Michigan |
6 | — | — | — | 6 | |||||||||||||||
| Minnesota |
2 | — | 1 | — | 3 | |||||||||||||||
| Missouri |
5 | — | 1 | — | 6 | |||||||||||||||
| Nevada |
2 | 2 | — | — | 4 | |||||||||||||||
| New Jersey |
5 | — | — | — | 5 | |||||||||||||||
| New Mexico |
1 | — | — | — | 1 | |||||||||||||||
| New York |
7 | — | — | 2 | 9 | |||||||||||||||
| North Carolina |
3 | — | 2 | — | 5 | |||||||||||||||
| Ohio |
3 | — | — | — | 3 | |||||||||||||||
| Oregon |
2 | — | — | — | 2 | |||||||||||||||
| Pennsylvania |
4 | — | 1 | — | 5 | |||||||||||||||
| Tennessee |
1 | — | — | — | 1 | |||||||||||||||
| Texas |
11 | — | — | — | 11 | |||||||||||||||
| Utah |
3 | — | 1 | — | 4 | |||||||||||||||
| Virginia |
6 | — | — | — | 6 | |||||||||||||||
| Washington |
3 | — | — | — | 3 | |||||||||||||||
| Wisconsin |
1 | — | — | — | 1 | |||||||||||||||
| International |
||||||||||||||||||||
| Dubai, United Arab Emirates |
— | 3 | — | — | 3 | |||||||||||||||
| Guam |
— | 1 | — | — | 1 | |||||||||||||||
| Hong Kong, China |
— | 3 | — | — | 3 | |||||||||||||||
| Shanghai, China |
1 | — | — | — | 1 | |||||||||||||||
| India |
— | 2 | — | — | 2 | |||||||||||||||
| Indonesia |
— | 1 | — | — | 1 | |||||||||||||||
| Japan |
— | 1 | — | — | 1 | |||||||||||||||
| Malaysia |
— | 1 | — | — | 1 | |||||||||||||||
| Mexico |
— | 10 | — | — | 10 | |||||||||||||||
| Philippines |
— | 7 | — | — | 7 | |||||||||||||||
| Singapore |
— | 1 | — | — | 1 | |||||||||||||||
| South Korea |
— | 3 | — | — | 3 | |||||||||||||||
| Totals as of March 13, 2011 |
207 | 35 | 18 | 6 | 266 | |||||||||||||||
| (1) | All of our company-owned restaurants are full service, except for four ASAP restaurants. |
On April 27, 2007, three former hourly restaurant employees in the State of California filed a class-action lawsuit in the San Francisco Superior Court. The parties purport to represent other current and former hourly California restaurant employees. The lawsuit alleges violations of state wage-and-hour laws involving the purchase of items of apparel required to be worn by hourly employees and reimbursement for laundering of these items of apparel and seeks unspecified monetary damages. On August 11, 2010, the Court granted class certification in this matter. We deny any liability with respect to these allegations and intend to vigorously defend ourselves in this action. An estimate of the possible loss, if any, or the range of the loss cannot be made at time.
19
Table of Contents
On July 3, 2007, two former hourly restaurant employees in the State of California filed a class-action lawsuit in the Los Angeles Superior Court alleging violations of state wage-and-hour laws. On April 22, 2008 and on April 25, 2008, former hourly employees in the State of California filed two additional lawsuits in Los Angeles Superior Court alleging similar wage-and-hour violations, and on December 4, 2008, the Court coordinated the three cases. The parties purport to represent other current and former hourly California restaurant employees. The lawsuit alleges violations of state wage-and-hour laws involving allegations of work performed off the clock, improper reduction in hours, failure to provide meal and rest breaks and failure to reimburse employees for expenses incurred in the course of employment. The plaintiffs seek unspecified monetary damages. In December 2008, a proposed settlement was not approved by the Court. The Company has accrued a loss contingency based on the proposed settlement which is not considered to be material to our consolidated financial position. We deny any liability with respect to these allegations and intend to vigorously defend ourselves in this action.
On May 19, 2008, a class-action lawsuit was filed in the State of California in the San Diego Superior Court against the Company. The lawsuit was filed by a former restaurant manager on behalf of himself and other current and former restaurant managers employed in California. The lawsuit alleges violations of state wage-and-hour laws involving the exempt status of managers, alleges violations of meal and rest breaks and unpaid overtime and seeks unspecified monetary damages. On October 7, 2010, the Company entered into a proposed settlement of all claims in the action. This proposed settlement is subject to court approval. The proposed settlement does not involve any admission of wrongdoing or liability and, subject to court approval, will result in the dismissal of the lawsuit’s claims against the Company. Under the proposed settlement, class members can submit claims pursuant to a Court approved process whereby the Company would pay an amount not to exceed $4.0 million to settle claims asserted on behalf of the class. The Company has accrued a legal settlement reserve based on its best estimate of costs to be incurred relative to this case. The Company anticipates plaintiffs’ counsel will be filing a motion in the Superior Court in the near future requesting approval of the proposed settlement. The Company cannot provide any assurances that the Court will approve the proposed settlement.
Other than the class-action lawsuits mentioned above, in the ordinary course of our business we are subject to certain private lawsuits, administrative proceedings and other claims. Such claims typically involve claims from guests, employees and others related to operational issues common to the food service industry. A number of such claims may exist at any given time. We could be affected by adverse publicity resulting from such allegations, regardless of whether such allegations are valid or whether we are found to be liable. From time to time, we are also involved in lawsuits with respect to infringements of, or challenges to, our registered trademarks.
Item 4. (Removed and Reserved).
20
Table of Contents
PART II
| Item 5. | Market for Registrant’s Common Equity, Related Stockholder Matters and Issuer Purchases of Equity Securities. |
Our common stock is quoted on the NASDAQ Global Select Market (“NASDAQ”) under the symbol “CPKI.” The following table sets forth, for the two most recent fiscal years, the high and low sales prices as reported on NASDAQ:
| High | Low | |||||||
| Fiscal 2009: |
||||||||
| First Quarter |
$ | 14.68 | $ | 8.03 | ||||
| Second Quarter |
$ | 17.44 | $ | 12.34 | ||||
| Third Quarter |
$ | 17.13 | $ | 12.83 | ||||
| Fourth Quarter |
$ | 16.55 | $ | 12.29 | ||||
| Fiscal 2010: |
||||||||
| First Quarter |
$ | 18.32 | $ | 12.93 | ||||
| Second Quarter |
$ | 24.00 | $ | 14.17 | ||||
| Third Quarter |
$ | 20.00 | $ | 12.95 | ||||
| Fourth Quarter |
$ | 18.00 | $ | 15.77 | ||||
As of March 13, 2011, there were approximately 165 holders of record of our common stock. On March 13, 2011, the last sale price reported on NASDAQ for our common stock was $15.68 per share. No cash dividends have been paid on the common stock to date.
21
Table of Contents
Performance Graph
Set forth below is a graph comparing the total return on an indexed basis of a $100 investment in our common stock with (a) the NASDAQ Composite Index, (b) the S&P 600 Restaurants Index and (c) the Morningstar Restaurants Industry Group Index for the period commencing December 31, 2005 through December 31, 2010, the last trading day before our fiscal year ended January 2, 2011.
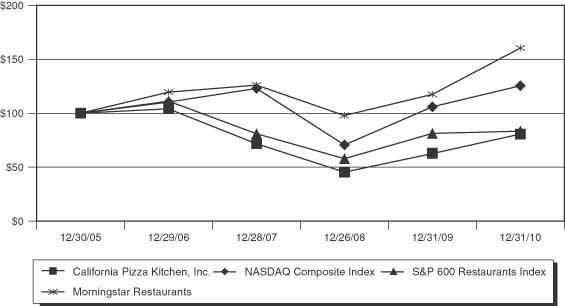
Dividend Policy
We currently retain all earnings for the operation and expansion of our business. Any payment of cash dividends in the future will be at the discretion of our Board of Directors and will depend upon our results of operations, earnings, capital requirements, contractual restrictions contained in our credit agreement and other factors deemed relevant by our Board. In May 2008, the Company entered into a new five-year revolving credit facility (the “Facility”) with a syndicate of banks. The Facility states that we may declare and pay cash dividends and distributions to our stockholders if we are not in default and if we maintain a maximum lease adjusted leverage ratio of less than 3.5 to 1, as defined in the agreement.
Equity Compensation Plan Information
Information about California Pizza Kitchen’s equity compensation plans at January 2, 2011 was as follows:
| Plan Category |
Number of securities to be issued upon exercise of outstanding options, warrants and rights |
Weighted-average exercise price of outstanding options, warrants and rights |
Number of securities remaining available for future issuance under equity compensation plans |
|||||||||
| Equity compensation plans approved by security holders (1) |
5,321,187 | $ | 15.89 | 125,968 | ||||||||
| Equity compensation plans not approved by security holders |
— | — | — | |||||||||
| Total |
5,321,187 | $ | 15.89 | 125,968 | ||||||||
| (1) | Consists of two California Pizza Kitchen compensation plans: 1998 Stock-Based Incentive Compensation Plan and 2004 Omnibus Incentive Compensation Plan. |
22
Table of Contents
Purchases of Equity Securities by the Issuer and Affiliated Purchasers
On July 9, 2008, the Board of Directors authorized a stock repurchase program (“July 2008 Program”) to acquire the Company’s common stock from time to time in the open market and through privately negotiated transactions. Under the July 2008 Program, up to $50.0 million of the Company’s common stock could be repurchased from time to time over a 24-month period. While the Company repurchased 1,044,134 shares in the open market for an aggregate price of $10.7 million during the third and fourth quarters of 2008, no shares were repurchased during 2009 or 2010. The July 2008 Program expired on July 8, 2010.
23
Table of Contents
Item 6. Selected Financial Data.
The following selected consolidated financial and operating data for each of the fiscal years presented below are derived from our audited consolidated financial statements. This selected consolidated financial and operating data should be read in conjunction with the consolidated financial statements and accompanying notes, “Item 7. Management’s Discussion and Analysis of Financial Condition and Results of Operations” and other financial information included elsewhere in this report.
CALIFORNIA PIZZA KITCHEN, INC. AND SUBSIDIARIES
SELECTED CONSOLIDATED FINANCIAL AND OPERATING DATA
(in thousands, except store data, per share data and operating data)
| Fiscal Year | ||||||||||||||||||||
| 2010 | 2009 | 2008 | 2007 | 2006 | ||||||||||||||||
| Statement of Operations Data: |
||||||||||||||||||||
| Revenues: |
||||||||||||||||||||
| Restaurant sales |
$ | 630,606 | $ | 652,185 | $ | 665,616 | $ | 624,324 | $ | 547,968 | ||||||||||
| Royalties from licensing agreement |
6,122 | 7,739 | 6,580 | 4,710 | 3,691 | |||||||||||||||
| Domestic franchise revenues |
3,100 | 2,684 | 2,757 | 2,460 | 2,138 | |||||||||||||||
| International franchise revenues |
2,403 | 2,078 | 2,121 | 1,390 | 804 | |||||||||||||||
| Total revenues |
642,231 | 664,686 | 677,074 | 632,884 | 554,601 | |||||||||||||||
| Costs and expenses: |
||||||||||||||||||||
| Food, beverage and paper supplies |
148,732 | 154,181 | 165,526 | 153,954 | 135,848 | |||||||||||||||
| Labor |
237,133 | 247,350 | 247,276 | 228,664 | 199,744 | |||||||||||||||
| Direct operating and occupancy |
142,420 | 141,973 | 140,367 | 124,476 | 108,558 | |||||||||||||||
| Cost of sales |
528,285 | 543,504 | 553,169 | 507,094 | 444,150 | |||||||||||||||
| General and administrative |
50,731 | 50,791 | 51,642 | 48,391 | 43,320 | |||||||||||||||
| Pre-opening costs |
3,269 | 1,843 | 4,478 | 7,167 | 6,964 | |||||||||||||||
| Operating income before depreciation and amortization, impairment, store closure and litigation, settlement and other costs (1) |
59,946 | 68,548 | 67,785 | 70,232 | 60,167 | |||||||||||||||
| Depreciation and amortization |
37,006 | 40,181 | 40,299 | 37,146 | 29,489 | |||||||||||||||
| Loss on impairment of property and equipment |
18,702 | 22,941 | 13,336 | — | — | |||||||||||||||
| Store closure costs |
1,708 | 539 | 1,033 | 9,269 | 707 | |||||||||||||||
| Litigation, settlement and other costs (2) |
8,759 | 1,609 | 736 | 2,300 | — | |||||||||||||||
| Total costs and expenses |
648,460 | 661,408 | 664,693 | 611,367 | 524,630 | |||||||||||||||
| Operating (loss)/income |
(6,229 | ) | 3,278 | 12,381 | 21,517 | 29,971 | ||||||||||||||
| Interest (expense) income, net |
(16 | ) | (788 | ) | (1,324 | ) | (73 | ) | 718 | |||||||||||
| (Loss)/income before income tax (benefit)/provision |
(6,245 | ) | 2,490 | 11,057 | 21,444 | 30,689 | ||||||||||||||
| Income tax (benefit)/provision |
(5,839 | ) | (2,091 | ) | 2,395 | 6,660 | 9,689 | |||||||||||||
| Net (loss)/income |
$ | (406 | ) | $ | 4,581 | $ | 8,662 | $ | 14,784 | $ | 21,000 | |||||||||
| Net (loss)/income per common share (3): |
||||||||||||||||||||
| Basic |
$ | (0.02 | ) | $ | 0.19 | $ | 0.34 | $ | 0.51 | $ | 0.72 | |||||||||
| Diluted |
$ | (0.02 | ) | $ | 0.19 | $ | 0.34 | $ | 0.50 | $ | 0.70 | |||||||||
| Shares used in calculating net (loss)/income per common share (3): |
||||||||||||||||||||
| Basic |
24,488 | 24,064 | 25,193 | 28,843 | 29,118 | |||||||||||||||
| Diluted |
24,488 | 24,143 | 25,211 | 29,609 | 29,818 | |||||||||||||||
24
Table of Contents
| Fiscal Year | ||||||||||||||||||||
| 2010 | 2009 | 2008 | 2007 | 2006 | ||||||||||||||||
| Selected Operating Data: |
||||||||||||||||||||
| Locations open at end of year |
266 | 253 | 252 | 231 | 205 | |||||||||||||||
| Company-owned restaurants open at end of year |
208 | 205 | 204 | 193 | 176 | |||||||||||||||
| Average weekly company-owned full service restaurant sales |
$ | 59,393 | $ | 61,029 | $ | 65,481 | $ | 67,461 | $ | 65,406 | ||||||||||
| 18-month comparable company-owned full service restaurant sales change |
-2.4 | % | -6.6 | % | -2.0 | % | 3.8 | % | 5.9 | % | ||||||||||
| As of the Fiscal Year Ended | ||||||||||||||||||||
| 2010 | 2009 | 2008 | 2007 | 2006 | ||||||||||||||||
| Selected Balance Sheet Data: |
||||||||||||||||||||
| Cash and cash equivalents |
$ | 21,230 | $ | 21,424 | $ | 14,392 | $ | 10,795 | $ | 8,187 | ||||||||||
| Total assets |
330,944 | 350,258 | 368,413 | 367,128 | 310,513 | |||||||||||||||
| Total debt, including current portion |
— | 22,300 | 74,000 | 21,000 | — | |||||||||||||||
| Stockholders’ equity |
194,411 | 189,250 | 174,532 | 218,137 | 208,343 | |||||||||||||||
| (1) | This is a non-GAAP measure and is not based on any standardized methodology prescribed by GAAP and is not necessarily comparable to similar measures presented by other companies. We believe this measure provides additional information to facilitate the comparison of our past and present financial results and provides an additional means for investors to evaluate business performance. However, use of this measure should not be construed as an indication that our future results will be unaffected by similarly excluded items. |
| (2) | For fiscal 2010, other costs represent expenses related to the review of strategic alternatives. No such expenses were incurred in each of 2009, 2008, 2007 and 2006. |
| (3) | See Note 2 and Note 13 to Consolidated Financial Statements for an explanation of the method used to calculate the net income per common share and shares used in computing net income per common share, basic and diluted. The Company effected a 3-for-2 stock split on June 19, 2007. All references to shares have been adjusted accordingly. |
25
Table of Contents
Item 7. Management’s Discussion and Analysis of Financial Condition and Results of Operations.
General
As of January 2, 2011, we owned, licensed or franchised 266 locations in 32 states and 11 foreign countries, of which 208 were company-owned and operated under the names “California Pizza Kitchen,” “California Pizza Kitchen ASAP” and “LA Food Show” and the remaining 58 operated under franchise or license arrangements. During our 25 years of operating history, we believe we have developed strong brand awareness and demonstrated the appeal of our concept in a wide variety of geographic areas. Our concept was, and still remains, to take our customers’ favorite food cravings and put them on a pizza—to figuratively “put the world on a pizza.”
Our Restaurants
We introduced our new prototype full service restaurant in fiscal 2004. The new prototype is approximately 5,300 square feet, has approximately 200 indoor and outdoor seats and has been designed to create a more comfortable experience to enhance our dinner business. Costs on average are less than $2.5 million for inline restaurants, our predominant structural environment. This excludes pre-opening costs, which average approximately $340,000 per restaurant.
During the months following the opening of a new restaurant, customer traffic generally settles into a more normalized pattern. Additionally, our new restaurants usually require a 90- to 120-day period after opening to reach their targeted restaurant-level operating margin due to cost of sales and labor inefficiencies commonly associated with new restaurants. As a result, a significant number of restaurant openings in any single fiscal quarter, accompanied with their associated pre-opening costs, could have a significant impact on our consolidated results of operations for that period. Therefore, our results of operations for any single fiscal quarter are not necessarily indicative of the results to be expected for any other fiscal quarter or for a full fiscal year.
Overview
Our revenues are comprised of restaurant sales, license fees, domestic franchise royalties and international franchise royalties. Our restaurant sales are comprised almost entirely of food and beverage sales; license fees are from our trademark license agreement with Nestlé; and domestic and international franchise royalties consist of monthly royalty income and initial franchise fees.
Cost of sales is comprised of food, beverage and paper supplies, labor and direct operating and occupancy expenses. The components of food, beverage and paper supplies are variable and increase with sales volume. Labor costs include direct hourly and management wages, stock-based compensation, bonuses and taxes and benefits for restaurant employees. Direct operating and occupancy costs include restaurant supplies, marketing costs, fixed rent, percentage rent, common area maintenance charges, utilities, real estate taxes, repairs and maintenance and other related restaurant costs. Direct operating and occupancy costs generally increase with sales volume but decline as a percentage of restaurant sales.
General and administrative costs include all corporate and administrative functions that support existing operations and provide infrastructure to facilitate our future growth. Components of this category include management, supervisory and staff salaries and related employee benefits, stock-based compensation, travel and relocation costs, information systems, training, corporate rent and legal, professional and consulting fees. Depreciation and amortization principally includes depreciation on capital expenditures for restaurants. Pre-opening costs, which are expensed as incurred, currently consist of rent from the date construction begins through the restaurant opening date, the costs of hiring and training the initial work force, travel, the cost of food used in training, marketing costs, the cost of the initial stocking of operating supplies and other direct costs related to the opening of a restaurant. Loss on impairment is determined as the amount, based on a restaurant’s future cash flow projections, future operating plans and other qualitative factors, by which the restaurant’s carrying value exceeds its fair value. Store closure costs may include lease termination costs, landlord fees,
26
Table of Contents
severance charges or other expenses related to the closure of a company-owned restaurant. Litigation, settlement and other costs include external legal costs related to defending or settling various employee-related lawsuits or claims, whether class-action or individual, regardless of merit, and the costs to explore strategic alternatives.
In calculating comparable company-owned full service restaurant sales, we include a restaurant in the comparable base once it has been open for 18 months. As of January 2, 2011, we had 195 company-owned restaurants that met this criterion.
Results of Operations
Operating results for fiscal years 2010, 2009 and 2008 are expressed as a percentage of revenues below, except for cost of sales, which is expressed as a percentage of restaurant sales:
| 2010 | 2009 | 2008 | ||||||||||
| Statement of Operations Data: |
||||||||||||
| Revenues: |
||||||||||||
| Restaurant sales |
98.2 | % | 98.1 | % | 98.3 | % | ||||||
| Royalties from licensing agreement |
0.9 | 1.2 | 1.0 | |||||||||
| Domestic franchise revenues |
0.5 | 0.4 | 0.4 | |||||||||
| International franchise revenues |
0.4 | 0.3 | 0.3 | |||||||||
| Total revenues |
100.0 | 100.0 | 100.0 | |||||||||
| Costs and expenses: |
||||||||||||
| Food, beverage and paper supplies |
23.6 | 23.6 | 24.9 | |||||||||
| Labor |
37.6 | 37.9 | 37.1 | |||||||||
| Direct operating and occupancy |
22.6 | 21.8 | 21.1 | |||||||||
| Cost of sales |
83.8 | 83.3 | 83.1 | |||||||||
| General and administrative |
7.9 | 7.6 | 7.6 | |||||||||
| Pre-opening costs |
0.5 | 0.3 | 0.7 | |||||||||
| Operating income before depreciation and amortization, impairment, store closure and litigation, settlement and other costs (1) |
9.3 | 10.3 | 10.0 | |||||||||
| Depreciation and amortization |
5.8 | 6.0 | 6.0 | |||||||||
| Loss on impairment of property and equipment |
2.9 | 3.5 | 2.0 | |||||||||
| Store closure costs |
0.3 | 0.1 | 0.2 | |||||||||
| Litigation, settlement and other costs (2) |
1.4 | 0.2 | 0.1 | |||||||||
| Total costs and expenses |
101.0 | 99.5 | 98.2 | |||||||||
| Operating (loss)/income |
(1.0 | ) | 0.5 | 1.8 | ||||||||
| Interest expense |
(0.0 | ) | (0.1 | ) | (0.2 | ) | ||||||
| (Loss)/income before income tax (benefit)/provision |
(1.0 | ) | 0.4 | 1.6 | ||||||||
| Income tax (benefit)/provision |
(0.9 | ) | (0.3 | ) | 0.3 | |||||||
| Net (loss)/income |
(0.1 | )% | 0.7 | % | 1.3 | % | ||||||
| (1) | This is a non-GAAP measure, is not based on any standardized methodology prescribed by GAAP and is not necessarily comparable to similar measures presented by other companies. We believe this measure provides additional information to facilitate the comparison of our past and present financial results and provides an additional means for investors to evaluate business performance. However, use of this measure should not be construed as an indication that our future results will be unaffected by similarly excluded items. |
| (2) | For fiscal year 2010, other costs represent expenses related to the review of strategic alternatives. No such expenses were incurred in fiscal years 2009 or 2008. |
27
Table of Contents
2010 (52 weeks) Compared to 2009 (53 weeks)
Total Revenues. Fiscal 2010 was a 52-week year compared to 53 weeks in 2009. Total revenues decreased by $22.5 million, or 3.4%, to $642.2 million in 2010 from $664.7 million in 2009 as the result of a $21.6 million decrease in restaurant sales and a $1.6 million decrease in royalties from our licensing agreement with Nestlé, partially offset by a $0.7 million increase in domestic and international franchise revenues. Excluding the additional week in the fourth quarter of 2009, total revenues decreased 1.2%. The decrease in restaurant sales was primarily attributable to the 2.4% decrease in full service comparable restaurant sales in 2010. Royalties from our licensing agreement with Nestlé decreased 20.9% as the result of heightened competition as well as transitional issues related to changes in our product offerings in 2010. Domestic and international franchise revenues increased 15.5% and 15.6%, respectively, as the result of stronger comparable sales as well as an increase in initial franchise fees earned in 2010 compared to 2009 as the result of more franchise openings in 2010. Restaurant sales included $5.6 million of supplemental gift card revenue with no comparable revenue in 2009 as we began recognizing supplemental gift card revenue in 2010 as discussed in Note 2 to our consolidated financial statements.
Food, beverage and paper supplies. Food, beverage and paper supplies decreased by $5.5 million, or 3.5%, to $148.7 million in 2010 from $154.2 million in 2009. Food, beverage and paper supplies as a percentage of restaurant sales were 23.6% in 2010 and 2009. Excluding supplemental gift card revenue, food, beverage and paper supplies were 23.8% of restaurant sales in 2010. Higher grocery and dairy pricing in the second half of 2010 was the primary cause for the increase in food, beverage and supplies as a percentage of restaurant sales and was partially offset by continued productivity improvements associated with our initiatives to reduce the variance between theoretical and actual food costs.
Labor. Labor decreased by $10.3 million, or 4.1%, to $237.1 million in 2010 from $247.4 million in 2009. As a percentage of restaurant sales, labor was 37.6% in 2010 compared to 37.9% in 2009. Excluding supplemental gift card revenue, labor was 37.9% of restaurant sales in 2010. We stabilized labor costs in 2010 primarily through effective hourly labor cost management.
Direct operating and occupancy. Direct operating and occupancy increased by $0.4 million, or 0.3%, to $142.4 million in 2010 from $142.0 million in 2009. Direct operating and occupancy as a percentage of restaurant sales were 22.6% in 2010 compared to 21.8% in 2009. Excluding supplemental gift card revenue, direct operating and occupancy costs were 22.8% of restaurant sales in 2010. The increase in direct operating and occupancy expenses as a percentage of restaurant sales primarily resulted from the full rollout of our take-out call center, higher utilities expenses and the deleveraging of rent expense and other fixed costs against lower sales in 2010 compared to 2009. Deleveraging occurs when sales decline and fixed costs have a relatively larger impact as a percentage of revenues.
General and administrative. General and administrative costs decreased by $0.1 million, or 0.1%, to $50.7 million in 2010 from $50.8 million in 2009. General and administrative costs as a percentage of total revenue increased to 7.9% in 2010 from 7.6% in 2009. To be consistent with current year presentation, $1.6 million of litigation and settlement costs were reclassified from 2009 general and administrative costs to litigation, settlement and other costs. Costs decreased as a result of lower personnel costs, including stock-based compensation and travel and entertainment expenses. The increase in general and administrative expenses as a percentage of total revenue was primarily the result of the deleveraging of general and administrative costs against lower sales.
Pre-opening costs. Pre-opening costs increased $1.4 million, or 77.4%, to $3.3 million in 2010 from $1.9 million in 2009. The increase was principally the result of the opening of nine full service restaurants, including one in China, and conversion of one CPK ASAP to a full service restaurant in 2010 compared to the opening of five full service restaurants in 2009.
28
Table of Contents
Depreciation and amortization. Depreciation and amortization decreased $3.2 million, or 7.9%, to $37.0 million in 2010 from $40.2 million in 2009. The decrease in depreciation expense was primarily due to a smaller depreciable asset base in 2010 resulting from the 13 and 10 stores previously impaired at the end of 2009 and in 2010, respectively, offset by depreciation incurred for the nine new stores opened in 2010 and full-year depreciation for the five stores opened in 2009.
Loss on impairment of property and equipment. We incurred a loss on impairment of property and equipment in 2010 of $18.7 million compared to $22.9 million in 2009. The decrease of $4.2 million in loss on impairment of property and equipment was primarily due to the impairment of 10 restaurants in 2010 compared to 13 restaurants in 2009.
Store closure costs. Store closure costs were $1.7 million in 2010 compared to $0.5 million in 2009. Store closure costs in 2010 related to termination fees and other costs associated with seven restaurants compared to two locations in 2009 that were each near the end of its lease term.
Litigation, settlement and other costs. We incurred $8.8 million in litigation, settlement and other costs in 2010 compared to $1.6 million in 2009. The increase was primarily due to the $5.3 million in settlement and associated costs related to a class-action lawsuit in the state of California, continuing litigation costs of other lawsuits and approximately $1.0 million related to accrued legal costs associated with the strategic alternatives process in 2010. See further description of current litigation in “Legal Proceedings” in Part I, Item 3.
Interest expense, net. Net interest expense decreased to $16,000 in 2010 from $788,000 in 2009. The decrease in net interest expense resulted from a lower weighted-average outstanding debt balance in 2010 compared to 2009. We maintained minimal levels of debt for the majority of 2010.
Income tax benefit. The effective income tax rate was a benefit of 93.5% for 2010 compared to 84.0% for 2009. We are currently in an income tax rate benefit position as a result of loss before taxes and significant FICA and business tax credits.
2009 (53 weeks) Compared to 2008 (52 weeks)
Total Revenues. Fiscal 2009 was a 53-week year compared to 52 weeks in 2008. The fourth quarter of 2009 included 14 weeks and all other quarters in 2009 were 13 weeks. Total revenues decreased by $12.4 million, or 1.8%, to $664.7 million in 2009 from $677.1 million in 2008 due to a $13.4 million decrease in restaurant sales and a $0.1 million decrease in domestic and international franchise revenues partially offset by a $1.1 million increase in Kraft royalties. Comparable restaurant sales declined 6.6%, which was driven by a 2.6% increase in pricing, 0.2% increase in mix and a 9.4% decrease in guest counts. We believe the reduced restaurant traffic was primarily due to macroeconomic factors impacting the casual dining industry as a whole. The slight decrease in domestic and international franchise revenues was the result of lower initial franchise fees in 2009 compared to 2008; our partners opened five locations in 2009 compared to ten locations in 2008. Royalties from our Kraft licensing agreement increased 17.6% to $7.7 million in 2009 from $6.6 million in 2008 due to higher sales of our frozen products.
Food, beverage and paper supplies. Food, beverage and paper supplies decreased by $11.3 million, or 6.9%, to $154.2 million in 2009 from $165.5 million in 2008. Food, beverage and paper supplies as a percentage of restaurant sales decreased to 23.6% in 2009 from 24.9% in the prior year. The decrease as a percentage of sales was primarily due to reduced pricing in dairy, produce and grocery as well as productivity improvements associated with our initiatives to reduce the variance between actual and theoretical food costs.
Labor. Labor increased $0.1 million to $247.4 million in 2009 from $247.3 million in 2008. As a percentage of restaurant sales, labor increased to 37.9% in 2009 from 37.1% in the prior year. The increase in labor as a percentage of restaurant sales was due to lower comparable sales and associated deleveraging of fixed
29
Table of Contents
costs, minimum wage increases across our hourly labor base in 25 states and increases in payroll taxes as tax rates reset to higher levels for calendar year 2010 which began in the last two weeks of fiscal 2009. Stock-based compensation included in labor totaled $0.5 million in 2009 compared to $0.7 million in 2008.
Direct operating and occupancy. Direct operating and occupancy increased by $1.6 million, or 1.1%, to $142.0 million in 2009 from $140.4 million in 2008. Direct operating and occupancy as a percentage of restaurant sales increased to 21.8% in 2009 from 21.1% in the prior year. The increase in direct operating and occupancy expenses was principally the result of increased rent expense due to the inclusion of the renewal option period in the lease term for certain locations offset by improved management of utility expenses and lower delivery charges.
General and administrative. General and administrative costs decreased to $50.8 million in 2009 from $51.6 million in 2008. To be consistent with current year presentation, $1.6 million of litigation and settlement costs were reclassified from 2009 general and administrative costs to litigation, settlement and other costs. General and administrative costs as a percentage of total revenue was relatively flat at 7.6% in both 2009 and 2008 due to the deleveraging of general and administrative costs against lower sales. Stock-based compensation included in general and administrative expenses totaled $6.4 million in 2009 compared to $6.1 million in 2008.
Pre-opening costs. Pre-opening costs decreased $2.6 million, or 58.8%, to $1.9 million in 2009 from $4.5 million in 2008. The decrease was chiefly attributable to the opening of five full service restaurants in 2009 compared to 13 full service restaurants opened in 2008. Pre-opening costs include $0.3 million and $1.1 million in 2009 and 2008, respectively, related to rent expense incurred during the restaurants’ construction periods.
Depreciation and amortization. Depreciation and amortization decreased $0.1 million, or 0.3%, to $40.2 million in 2009 from $40.3 million in 2008. The decrease in depreciation expense is primarily the result of lower depreciation due to the nine stores impaired at the end of 2008 offset by depreciation incurred for the five new stores opened in 2009.
Loss on impairment of property and equipment. We incurred a loss on impairment of property and equipment in 2009 of $22.9 million compared to $13.3 million in 2008. The increase of $9.6 million in loss on impairment of property and equipment represented the impairment of 13 full service restaurants in 2009 compared to three CPK/ASAPs and seven full service restaurants in 2008.
Store closure costs. Store closure costs decreased by $0.5 million, or 47.8%, to $0.5 million in 2009 from $1.0 million in 2008. In 2009, we closed two locations that were each near the end of its lease term compared to 2008 whereby store closure costs represented early termination costs.
Litigation, settlement and other costs. We incurred $1.6 million in litigation, settlement and other costs in 2009 compared to $0.7 million in 2008. The increase was primarily due to legal costs associated with a class-action lawsuit filed in the state of California in 2008 as well as continuing litigation costs of other lawsuits. See the Legal Proceedings section in Part I, Item 3 for additional information.
Interest expense, net. Net interest expense decreased to $0.8 million in 2009 from $1.3 million in 2008. Interest expense primarily relates to lower borrowings against our line of credit in 2009 compared to 2008. In addition, favorable interest rates reduced net interest expense.
Income tax provision. The effective income tax rate was -84.0% for 2009 compared to 21.7% for 2008. We are currently in an income tax rate benefit position as the result of significant FICA and state tax credits for 2009 due to lower earnings before taxes after the loss on impairment of property and equipment and store closure charges.
30
Table of Contents
Factors That May Influence Future Results of Operations
In 2011, we expect to focus our efforts on the restaurants we currently operate, and as such, plan to open three to four new company-owned locations. We expect capital expenditures in the range of $25 million to $30 million, excluding landlord contributions, which will be used primarily for building new locations, remodels, conversion of two CPK/ASAPs to full service locations and capitalized maintenance. We expect to finance these capital expenditures with cash flows from operations. We will also close approximately four underperforming restaurants by exercising termination clauses or not renewing leases. We also expect our international franchisees to open approximately 10 restaurants in 2011, which may change based on the ability of our franchise partners to execute their expansion plans.
We expect to experience higher commodity costs and increased labor wage rates during fiscal 2011. To offset some of these inflationary pressures, we have a series of cost reduction programs planned. These include menu price increases and a menu optimization program targeting margin and productivity improvements by eliminating items that have low sales volumes and require labor intensive preparation. We expect operating expenses will be reduced as a result of these initiatives.
Potential Fluctuations in Quarterly Results and Seasonality
Our quarterly operating results may fluctuate significantly as a result of a variety of factors, including the timing of new restaurant openings and related expenses, profitability of new restaurants, increases or decreases in comparable restaurant sales, general economic conditions, consumer confidence in the economy, changes in consumer preferences, competitive factors, changes in food costs, changes in labor costs, rising gas prices and war or prolonged civil disorder. In the past, we have experienced significant variability in pre-opening costs from quarter to quarter. These fluctuations are primarily a function of the timing of restaurant openings. We typically incur the most significant portion of pre-opening costs associated with a given restaurant in the month of opening. In addition, our experience to date has been that labor and direct operating and occupancy costs associated with a newly opened restaurant during the first three to four months of operation are often materially greater than what will be expected after that time, both in aggregate dollars and as a percentage of restaurant sales. Accordingly, the number and timing of new restaurant openings in any quarter has had, and is expected to continue to have, a significant impact on quarterly pre-opening costs, labor and direct operating and occupancy costs.
Our business also is subject to seasonal fluctuations and adverse weather. Our results of operations have historically been impacted by seasonality, which is directly impacted by tourism at our coastal California locations. The summer months (June through August) have traditionally been higher sales volume periods than other periods of the year. Holidays, severe winter weather, hurricanes, thunderstorms and similar conditions may impact restaurant sales volumes seasonally in some of the markets where we operate. Many of our restaurants are located in or near shopping centers and malls that typically experience seasonal fluctuations in sales. As a result of these and other factors, our financial results for any given quarter may not be indicative of the results that may be achieved for a full fiscal year.
Liquidity and Capital Resources
The following table presents a summary of our cash flows for the fiscal years 2010, 2009 and 2008 (in thousands):
| 2010 | 2009 | 2008 | ||||||||||
| Net cash provided by operating activities |
$ | 59,922 | $ | 81,535 | $ | 66,215 | ||||||
| Net cash used in investing activities |
(40,021 | ) | (25,748 | ) | (56,601 | ) | ||||||
| Net cash used in financing activities |
(20,095 | ) | (48,755 | ) | (6,017 | ) | ||||||
| Net (decrease)/increase in cash and cash equivalents |
$ | (194 | ) | $ | 7,032 | $ | 3,597 | |||||
31
Table of Contents
Operating activities. We fund our capital requirements principally through cash flow from operations and borrowings from our line of credit. Net cash provided by operating activities was $59.9 million in 2010 compared to $81.5 million in 2009 and $66.2 million in 2008. Net cash provided by operating activities exceeded net (loss)/income each of the years presented primarily because of the effects of depreciation and amortization, loss on impairment of property and equipment and non-cash compensation charges. Other than effects of changes in net (loss)/income and non-cash items, net cash provided by operating activities was lower in 2010 than in 2009 primarily as the result of an increased use of cash for accrued, gift card and other liabilities. These changes were offset by an increase in cash provided by other receivables and deferred rent credits and a decrease in cash used for prepaid expenses and other assets, deferred tax assets and accounts payable. Other than effects of changes in non-cash items, net cash provided by operating activities was higher in 2009 than in 2008 primarily due to an increase in cash provided by gift card liabilities and a decreased use of cash for accounts payable, other operating liabilities, deferred tax assets and intangible assets. These changes were offset by a decrease in cash provided by other receivables and deferred rent credits and an increased use of cash for prepaid expenses and other assets.
Investing activities. We use working capital and borrowings from our line of credit to fund the development and construction of new restaurants and remodel our existing restaurants. Net cash used in investing activities, which was related almost entirely to capital expenditures, was $40.0 million in 2010 compared to $25.7 million in 2009 and $56.6 million in 2008. Capital expenditures in 2010 resulted from $25.3 million incurred on new restaurants and $14.7 million incurred on capitalized maintenance, remodeling and other costs. Capital expenditures in 2009 resulted from $10.8 million incurred on new restaurants and $15.0 million incurred on capitalized maintenance, remodeling and other costs. We opened nine full service restaurants, including one in China, and converted one CPK ASAP to a full service restaurant in 2010 compared to opening five full service restaurants in 2009. In 2008, capital expenditures were attributable to $39.0 million and $17.6 million incurred in connection with the opening of new restaurants and capitalized maintenance, remodeling and other costs, respectively. We opened 12 full service restaurants and one LA Food Show restaurant in 2008.
Financing activities. Net cash used in financing activities was $20.1 million in 2010 compared to $48.8 million in 2009 and $6.0 million in 2008. In 2010, the Company had net repayments on the credit facility of $22.3 million compared to $51.7 million in 2009 and net borrowings on the credit facility in 2008 of $53.0 million. Net proceeds from the issuance of common stock were $2.1 million in 2010, $3.4 million in 2009 and $1.7 million in 2008. 2010 proceeds consisted entirely of employee stock option exercises while 2009 and 2008 proceeds were provided by $2.5 million and $0.7 million, respectively, in employee stock option exercises and $0.9 million and $1.0 million, respectively, in purchases under our employee stock purchase plan. While there were no stock repurchases in 2010 or 2009, we used $60.7 million in 2008 to buy back shares of our common stock under the August 2007 and July 2008 Program. The July 2008 Program, outlined in Note 11 to our consolidated financial statements, concluded on July 15, 2010.
On May 7, 2008, the Company replaced its $100.0 million credit facility by entering into a new five-year revolving credit facility (the “Facility”) with a syndicate of banks, featuring a maximum available borrowing capacity of $150.0 million. The Facility contains an uncommitted option to increase, subject to satisfaction of certain conditions, the maximum borrowing capacity by up to an additional $50.0 million. The Facility is guaranteed by one of the Company’s subsidiaries and stipulates certain events of default. The Facility also contains certain restrictive and financial covenants, including that the Company maintain a minimum consolidated fixed charge coverage ratio and a maximum lease adjusted leverage ratio. As of January 2, 2011, the Company was in compliance with all debt covenants.
Borrowings under the Facility bear interest at either LIBOR or the prime rate, at the Company’s option, plus a spread ranging from 100 to 150 basis points for LIBOR loans or zero to 25 basis points for prime rate loans. The Company also pays a commitment fee on the unused facility ranging from 20 to 30 basis points per annum. Both the interest rate spread and the commitment fee level depend on the lease adjusted leverage ratio as defined in the terms of the Facility. The Facility also includes a $15.0 million sublimit for standby letters of credit. As of January 2, 2011, the Company had no borrowings outstanding under the Facility. Availability under the Facility
32
Table of Contents
was reduced by outstanding letters of credit totaling $6.6 million as of January 2, 2011, which are used to support the Company’s self-insurance programs. Available borrowings under the Facility were $143.4 million as of January 2, 2011. The Facility matures in May 2013.
Future capital requirements. Our capital requirements, including costs related to opening additional restaurants, have been and will continue to be significant. Our future cash requirements and the adequacy of available funds will depend on many factors, including the pace of expansion, real estate markets, site locations and the nature of the arrangements negotiated with landlords. We believe that our current cash balances, together with anticipated cash flows from operations and funds anticipated to be available from our credit facility, will be sufficient to satisfy our working capital and capital expenditure requirements on a short-term and long-term basis. Changes in our operating plans, acceleration of our expansion plans, lower than anticipated sales, increased expenses, failure to maintain financial covenants under our credit facility, financial and non-financial covenant requirements or other events may cause us to seek additional financing sooner than anticipated. Additional financing may not be available on acceptable terms, or at all. Failure to obtain additional financing as needed could have a material adverse effect on our business and results of operations.
As of January 2, 2011, we had no financing transactions, arrangements or other relationships with any unconsolidated entities or related parties. Additionally, we had no financing arrangements involving synthetic leases or trading activities involving commodity contracts.
As of January 2, 2011, the Company had cash and cash equivalents of $21.2 million managed by third-party financial institutions. At any point in time the Company also has a range of approximately $5.0 million to $15.0 million in its operating accounts. These balances exceed the Federal Deposit Insurance Corporation (“FDIC”) insurance limits. While the Company monitors the cash balances in its operating accounts on a daily basis and adjusts the cash balances as appropriate, these cash balances could be impacted if the underlying financial institutions fail or are subject to other adverse conditions in the financial markets. To date, the Company has experienced no loss or lack of access to cash in its operating accounts. However, the Company can provide no assurances that access to its invested cash and cash equivalents will not be impacted by adverse conditions in the financial markets.
Off-Balance Sheet Arrangements
As part of our ongoing business, we do not participate in transactions that generate relationships with unconsolidated entities or financial partnerships, such as entities often referred to as structured finance or variable interest entities (“VIEs”), which would have been established for the purpose of facilitating off-balance sheet arrangements or other contractually narrow or limited purposes. As of January 2, 2011, we are not involved in any VIE transactions and do not otherwise have any off-balance sheet arrangements.
Contractual Commitments
As of January 2, 2011, we had no long-term borrowings or unconditional purchase obligations. The following table summarizes our contractual commitments as of January 2, 2011 (in thousands):
| Payments Due by Period | ||||||||||||||||||||
| Total | Less than 1 Year |
1-3 Years |
3-5 Years |
More than 5 Years |
||||||||||||||||
| Operating lease obligations (1) |
$ | 220,026 | $ | 40,781 | $ | 69,752 | $ | 52,812 | $ | 56,681 | ||||||||||
| FIN 48 liability (2) |
— | — | — | — | — | |||||||||||||||
| $ | 220,026 | $ | 40,781 | $ | 69,752 | $ | 52,812 | $ | 56,681 | |||||||||||
| (1) | Represents aggregate minimum lease payments. Most of the leases require contingent rent in addition to the minimum rent based on a percentage of sales and require expenses incidental to the use of the property. |
33
Table of Contents
| (2) | Due to the uncertainty with respect to the timing of future cash flows associated with unrecognized tax benefits at January 2, 2011, the Company is unable to make reasonably reliable estimates of the period of cash settlement with the respective taxing authority. Therefore, $319,000 of unrecognized tax benefits have been excluded from the contractual obligations table above. |
Critical Accounting Policies
Our significant accounting policies are disclosed in Note 1 to our consolidated financial statements. The following discussion addresses our most critical accounting policies, which are those that require the greatest amount of subjective or complex judgments by management. Such judgment may result in materially different amounts being reported under different conditions or using different assumptions.
Gift Card Revenue Recognition
The Company’s branded gift cards (the “Cards”) are sold primarily at the Company’s restaurants and other retailers and are redeemable at Company-owned locations. Cards are issued by a third-party vendor (“Issuer”) pursuant to a service agreement and the Issuer is the obligor for Cards. The Cards carry no dormancy, inactivity or service fees and have no expiration date. When Cards are sold, a gift card liability is recorded. Restaurant sales are recognized when Cards are redeemed. Discounts on Cards sold for less than face value are generally recorded as reductions to restaurant sales when the related Cards are redeemed.
In 2010, the Company determined that it had specific, historical data over a sufficient timeframe and determined the period after which the likelihood of a Card being redeemed was deemed to be remote was 24 months after it is sold. An analysis of the data also determined the percentage of Card balances unlikely to ever be redeemed which is commonly referred to as the breakage rate. As a result of the Issuer agreement, the Company is able to recognize supplemental gift card revenue based on Cards unlikely to ever be redeemed.
Beginning in 2010, the Company began recognizing supplemental gift card revenue over 24 months, utilizing the redemption method, beginning when a Card is sold. The amount recognized is based on the estimated breakage rate and in the same proportion that the data shows Cards are redeemed by guests. This was accounted for as a change in accounting estimate. During 2010, $5.6 million of supplemental gift card revenue was recorded, or $0.23 per share, on loss before income tax benefit, of which $3.3 million related to a cumulative catch up for Cards issued prior to 2010.
Due to the variability of timing, terms, volume of Card sales and redemptions, supplemental gift card revenue in the future may differ significantly from those recorded in fiscal 2010.
Stock-Based Compensation
We account for stock-based compensation, including stock option grants and restricted stock awards, based on fair value measurement guidance. We use the Black-Scholes valuation model, which requires the use of subjective assumptions, including 1) the expected term vested options will be held before exercise, 2) common stock price volatility over the expected term and 3) the number of options and restricted stock awards that will ultimately not vest (“forfeiture rate”). Changes in these assumptions can materially affect fair value and our estimates of stock-based compensation, ultimately affecting expense recognized in the consolidated statements of income.
Long-Lived Asset Impairments
We assess no less frequently than quarterly the impairment of long-lived assets when events or changes in circumstances indicate that the carrying value of the assets may not be recoverable. We assess recoverability of long-lived assets at the restaurant level based on historical and estimated future cash flows along with other
34
Table of Contents
factors. Management has determined that restaurants open at least one year that demonstrate operating results of less than a defined target over the previous 12-month period should be evaluated for possible impairment. Based on the restaurant’s future restaurant cash flow projections, future operating plans and other qualitative factors, we may recognize an impairment charge determined as the amount by which the asset carrying value exceeds fair value, which is based on discounted future cash flows.
Estimates of future cash flows are judgments based on our experience and knowledge of local operations. These estimates can be significantly impacted by changes in real estate market conditions, the economic environment, capital spending decisions and inflation.
Leases
All of our restaurant leases are currently classified as operating leases. The lease term includes renewal option periods only in instances in which the exercise of the renewal option can be reasonably assured and failure to exercise such option would result in an economic penalty. We recognize rent over the lease term, which includes the “rent holiday period”, defined as the period from date of possession through store opening, during which no cash rent payments are typically due under terms of the lease. Rent expense from the date of possession through the restaurant opening date is included in pre-opening expenses. Any delay in the store opening can affect the rent holiday period, subsequently affecting the amount of pre-opening expense and post-opening, occupancy costs.
Minimum base rent for our operating leases, which generally have escalating rentals over the term of the lease, is recorded on a straight-line basis over the initial lease term and those renewal periods that are reasonably assured. Many of our leases contain provisions that require additional rental payments based upon restaurant sales volume (“contingent rent”). Contingent rent is accrued each period as the liability is incurred, in addition to the straight-line rent expense noted above. Our total occupancy costs can vary due to fluctuations in contingent rents based on restaurant sales.
Management applies judgment in determining whether a lease term should include option periods. Differences in estimated lease terms could materially affect amounts of rent expense, amortization of deferred rent credits related to tenant improvement allowances and depreciation expense.
Property and Equipment
Property and equipment is recorded at cost net of accumulated depreciation. Property and equipment is depreciated over the assets’ estimated useful lives using the straight-line method. Leasehold improvements are amortized using the straight-line method over the shorter of the estimated useful life of the asset or the lease term including remodels when probable. The cost of repairs and maintenance is expensed when incurred, while expenditures for refurbishments and improvements that extend the useful life of an asset are capitalized. Management applies judgment in determining the useful life of property and equipment and in classifying expenditures as capital or expense items. Depreciation expense and direct operating costs could be materially different if management came to different conclusions.
Self-Insurance
We are self-insured for a significant portion of our employee workers’ compensation, general liability, automobile and health insurance obligations. We maintain stop-loss coverage with third-party insurers to limit our total exposure. The accrued liabilities associated with these programs are based on historical claims data and our estimate of the ultimate costs to be incurred to settle known claims and claims incurred but not reported as of the balance sheet date. The estimated liability is not discounted and is based on a number of assumptions and factors, including historical trends, actuarial assumptions and economic conditions. If actual claims, including the frequency or amount of claims, differ from our assumptions and estimates, changes in our liabilities would impact the expense recorded in our consolidated statements of income.
35
Table of Contents
Goodwill
Goodwill and intangible assets deemed to have indefinite lives are not amortized, but are subject to annual impairment testing. We test for recoverability of goodwill based on both a discounted cash flow analysis and multiple of earnings analysis comparing the fair value of the reporting unit to the carrying value. This analysis requires management to make assumptions about future revenues and expenses, rate of return, and market risk, among other factors. Changes in estimates of growth and market conditions may impact the fair value of the reporting unit and consequently the recorded value of goodwill.
Income Taxes
We provide for income taxes based on our estimate of federal and state tax liabilities. Our estimates include effective state and local income tax rates, allowable tax credits for items such as taxes paid on reported tip income and estimates related to depreciation expense allowable for tax purposes. Our estimates are made based on the best available information at the time we prepare our income tax provision. We typically file our income tax returns six to nine months after our fiscal year-end. Income tax returns may be audited by federal, state and local governments, often years after the returns are filed, making them subject to adjustment due to differing interpretations of tax law.
We review any uncertain tax position on a quarterly basis, adding any new uncertain positions, or adjusting or removing existing positions that have been resolved. Management makes significant assumptions in evaluating its tax positions, including estimating the amount, timing and likelihood of ultimate resolution. Actual results can vary from these estimates, leading to material differences in our tax expense.
New Accounting Standards
See the Recent Accounting Pronouncements section of Note 2 to our consolidated financial statements for a summary of new accounting standards.
Inflation
Our profitability depends, among other things, on our ability to anticipate and react to changes in the costs of key operating resources, including food and other raw materials, labor, energy and other supplies and services. Substantial increases in costs and expenses could impact our operating results to the extent that such increases cannot be passed along to our restaurant guests. While we have taken steps to enter into agreements for some of the commodities used in our restaurant operations, there can be no assurance that future supplies and costs for such commodities will not fluctuate due to weather and other market conditions outside of our control. The impact of inflation on food, labor, energy and occupancy costs can significantly affect the profitability of our restaurant operations.
Many of our restaurant employees are paid hourly rates equivalent to the higher of their states’ or the federal minimum wage. In fiscal 2007, Congress enacted an increase in the federal minimum wage implemented in three phases, beginning in fiscal 2007 and concluding in fiscal 2009. In addition, numerous state and local governments increased the minimum wage within their jurisdictions, with further state minimum wage increases going into effect in fiscal 2009. Certain operating costs, such as taxes, insurance and other outside services, continue to increase with the general level of inflation or higher and may also be subject to other cost and supply fluctuations outside of our control.
While we have been able to partially offset inflation and other changes in the costs of key operating resources by gradually increasing prices for our menu items, coupled with more efficient purchasing practices, productivity improvements and greater economies of scale, there can be no assurance that we will be able to continue to do so in the future. From time to time, competitive conditions could limit our menu pricing
36
Table of Contents
flexibility. In addition, macroeconomic conditions that impact consumer discretionary spending for food away from home could make additional menu price increases imprudent. There can be no assurance that all of our future cost increases can be offset by higher menu prices or that higher menu prices will be accepted by our restaurant guests without any resulting changes in the frequency of their visits or purchasing patterns. Many of the leases for our restaurants provide for contingent rent obligations based on a percentage of sales. As a result, rent expense will absorb a proportionate share of any menu price increases in our restaurants. There can be no assurance that we will generate increases in comparable restaurant sales in amounts sufficient to offset inflationary or other cost pressures.
Item 7A. Quantitative and Qualitative Disclosures about Market Risk.
We have market risk exposure related to our cash and cash equivalents and marketable securities. Cash equivalents may from time-to-time include money market funds which are invested in highly liquid short-term debt investments with maturities of less than three months as of the date of purchase. Changes in interest rates affect the investment income we can earn on our cash and cash equivalents and, therefore, impact our cash flows and results of operations. As of January 2, 2011, we did not hold any money market funds in our cash and cash equivalents nor any other short-term investments or marketable securities in our current assets. We are, however, subject to market risk related to the marketable securities that we hold as investments in mutual funds and corporate owned life insurance contracts (“COLI”) used to support our deferred compensation Executive Retirement Savings Plan (“ERSP”) to the extent these investments are not equivalent to the related liability. These marketable securities are included in other assets on the Consolidated Balance Sheets. The full impact of gains or losses in marketable securities related to the program is reflected in net income. Activity within the COLI investments is generally not subject to income tax.
Item 8. Financial Statements and Supplementary Data.
The Consolidated Financial Statements we are required to file hereunder are set forth on pages 43 through 46 of this report.
Item 9. Changes in and Disagreements with Accountants on Accounting and Financial Disclosure.
None.
Item 9A. Controls and Procedures.
Disclosure Controls and Procedures. We maintain disclosure controls and procedures that are designed to ensure that information required to be disclosed in our reports under the Securities Exchange Act of 1934, as amended (the “Exchange Act”), is recorded, processed, summarized and reported within the time periods specified in the SEC’s rules and forms, and that such information is accumulated and communicated to management, including our co-CEOs and Chief Financial Officer (“CFO”), as appropriate, to allow timely decisions regarding required disclosure.
In designing and evaluating these disclosure controls and procedures, our management recognized that any controls and procedures, no matter how well designed and operated, can provide only reasonable assurance of achieving the desired control objectives, as ours are designed to do, and our management necessarily was required to apply its judgment in evaluating the cost-benefit relationship of possible controls and procedures.
In connection with the preparation of this Annual Report on Form 10-K, as of January 2, 2011, an evaluation was performed under the supervision and with the participation of our management, including the co-CEOs and CFO, of the effectiveness of the design and operation of our disclosure controls and procedures (as defined in Rule 13a-15(e) under the Exchange Act). Based upon that evaluation, our Company’s co-CEOs and CFO concluded that our disclosure controls and procedures are effective as of January 2, 2011.
37
Table of Contents
Management’s Annual Report on Internal Control over Financial Reporting. We are responsible for establishing and maintaining adequate internal control over financial reporting as defined in Rule 13a-15(f) under the Exchange Act. Our internal control system is designed to provide reasonable assurance to our management and Board of Directors regarding the preparation and fair presentation of published financial statements. All internal control systems, no matter how well designed, have inherent limitations. Therefore, even those systems determined to be effective can provide only reasonable assurance with respect to financial statement preparation and presentation.
We have assessed the effectiveness of our internal control over financial reporting as of January 2, 2011. In making our assessment of internal control over financial reporting, we used the criteria set forth by the Committee of Sponsoring Organizations of the Treadway Commission (“COSO”) in Internal Control—Integrated Framework. Based on this evaluation, our management concluded that our internal control over financial reporting was effective as of January 2, 2011.
The effectiveness of our internal control over financial reporting as of January 2, 2011 has been audited by Ernst & Young LLP, an independent registered public accounting firm, as stated in their report which is included herein.
Change in Internal Control Over Financial Reporting. There were no changes in our internal control over financial reporting that occurred during our last fiscal year that have materially affected, or are reasonably likely to materially affect, our internal control over financial reporting.
38
Table of Contents
REPORT OF INDEPENDENT REGISTERED PUBLIC ACCOUNTING FIRM
The Board of Directors and Stockholders of California Pizza Kitchen, Inc. and Subsidiaries
We have audited California Pizza Kitchen, Inc. and Subsidiaries’ internal control over financial reporting as of January 2, 2011, based on criteria established in Internal Control—Integrated Framework issued by the Committee of Sponsoring Organizations of the Treadway Commission (the COSO criteria). California Pizza Kitchen, Inc. and Subsidiaries’ management is responsible for maintaining effective internal control over financial reporting, and for its assessment of the effectiveness of internal control over financial reporting included in the accompanying Management’s Annual Report on Internal Control over Financial Reporting. Our responsibility is to express an opinion on the company’s internal control over financial reporting based on our audit.
We conducted our audit in accordance with the standards of the Public Company Accounting Oversight Board (United States). Those standards require that we plan and perform the audit to obtain reasonable assurance about whether effective internal control over financial reporting was maintained in all material respects. Our audit included obtaining an understanding of internal control over financial reporting, assessing the risk that a material weakness exists, testing and evaluating the design and operating effectiveness of internal control based on the assessed risk, and performing such other procedures as we considered necessary in the circumstances. We believe that our audit provides a reasonable basis for our opinion.
A company’s internal control over financial reporting is a process designed to provide reasonable assurance regarding the reliability of financial reporting and the preparation of financial statements for external purposes in accordance with generally accepted accounting principles. A company’s internal control over financial reporting includes those policies and procedures that (1) pertain to the maintenance of records that, in reasonable detail, accurately and fairly reflect the transactions and dispositions of the assets of the company; (2) provide reasonable assurance that transactions are recorded as necessary to permit preparation of financial statements in accordance with generally accepted accounting principles, and that receipts and expenditures of the company are being made only in accordance with authorizations of management and directors of the company; and (3) provide reasonable assurance regarding prevention or timely detection of unauthorized acquisition, use, or disposition of the company’s assets that could have a material effect on the consolidated financial statements.
Because of its inherent limitations, internal control over financial reporting may not prevent or detect misstatements. Also, projections of any evaluation of effectiveness to future periods are subject to the risk that controls may become inadequate because of changes in conditions, or that the degree of compliance with the policies or procedures may deteriorate.
In our opinion, California Pizza Kitchen, Inc. and Subsidiaries maintained, in all material respects, effective internal control over financial reporting as of January 2, 2011, based on the COSO criteria.
We also have audited, in accordance with the standards of the Public Company Accounting Oversight Board (United States), the consolidated balance sheets of California Pizza Kitchen, Inc. and Subsidiaries as of January 2, 2011 and January 3, 2010, and the related consolidated statements of operations, stockholders’ equity, and cash flows for each of the three years in the period ended January 2, 2011 and our report dated March 17, 2011 expressed an unqualified opinion thereon.
/s/ ERNST & YOUNG LLP
Los Angeles, California
March 17, 2011
39
Table of Contents
None.
PART III
Item 10. Directors, Executive Officers and Corporate Governance.
The information required by this item will be included in Form 10-K/A to be filed within 120 days after the close of our fiscal year.
Item 11. Executive Compensation.
The information required by this item will be included in Form 10-K/A to be filed within 120 days after the close of our fiscal year.
| Item 12. Security | Ownership of Certain Beneficial Owners and Management and Related Stockholder Matters. |
The information required by this item will be included in Form 10-K/A to be filed within 120 days after the close of our fiscal year.
Item 13. Certain Relationships and Related Transactions, and Director Independence.
The information required by this item will be included in Form 10-K/A to be filed within 120 days after the close of our fiscal year.
Item 14. Principal Accounting Fees and Services.
The information required by this item will be included in Form 10-K/A to be filed within 120 days after the close of our fiscal year.
40
Table of Contents
PART IV
Item 15. Exhibits, Financial Statement Schedules.
(a) The following documents are filed as a part of this Report:
1. Financial Statements
The following financial statements, as indexed below, are incorporated by reference in Part II, Item 8 of this Annual Report on Form 10-K:
INDEX TO CONSOLIDATED FINANCIAL STATEMENTS
| Page No. | ||||
| 42 | ||||
| Consolidated Financial Statements: |
||||
| Consolidated Balance Sheets at January 2, 2011 and January 3, 2010 |
43 | |||
| 44 | ||||
| 45 | ||||
| 46 | ||||
| 47 | ||||
2. Financial Statements Schedules
All financial statement schedules are omitted because they are not required or are not applicable or the required information is included in the Company’s Consolidated Financial Statements and Notes thereto, described in Item 15(a)(1) above.
3. Exhibits
The Exhibits listed in the Index to Exhibits, which appears immediately following the signature page and is incorporated herein by reference, are filed as part of this Annual Report on Form 10-K.
41
Table of Contents
REPORT OF INDEPENDENT REGISTERED PUBLIC ACCOUNTING FIRM
The Board of Directors and Stockholders of California Pizza Kitchen, Inc. and Subsidiaries
We have audited the accompanying consolidated balance sheets of California Pizza Kitchen, Inc. and Subsidiaries as of January 2, 2011 and January 3, 2010, and the related consolidated statements of operations, stockholders’ equity, and cash flows for each of the three years in the period ended January 2, 2011. These financial statements are the responsibility of the Company’s management. Our responsibility is to express an opinion on these financial statements based on our audits.
We conducted our audits in accordance with the standards of the Public Company Accounting Oversight Board (United States). Those standards require that we plan and perform the audit to obtain reasonable assurance about whether the financial statements are free of material misstatement. An audit includes examining, on a test basis, evidence supporting the amounts and disclosures in the financial statements. An audit also includes assessing the accounting principles used and significant estimates made by management, as well as evaluating the overall financial statement presentation. We believe that our audits provide a reasonable basis for our opinion.
In our opinion, the consolidated financial statements referred to above present fairly, in all material respects, the consolidated financial position of California Pizza Kitchen, Inc. and Subsidiaries at January 2, 2011 and January 3, 2010, and the consolidated results of their operations and their cash flows for each of the three years in the period ended January 2, 2011, in conformity with U.S. generally accepted accounting principles.
We also have audited, in accordance with the standards of the Public Company Accounting Oversight Board (United States), California Pizza Kitchen, Inc. and Subsidiaries’ internal control over financial reporting as of January 2, 2011, based on criteria established in Internal Control-Integrated Framework issued by the Committee of Sponsoring Organizations of the Treadway Commission and our report dated March 17, 2011 expressed an unqualified opinion thereon.
/s/ ERNST & YOUNG LLP
Los Angeles, California
March 17, 2011
42
Table of Contents
CALIFORNIA PIZZA KITCHEN, INC. AND SUBSIDIARIES
CONSOLIDATED BALANCE SHEETS
January 2, 2011 and January 3, 2010
(in thousands, except for share data)
| 2010 | 2009 | |||||||
| Assets |
||||||||
| Current assets: |
||||||||
| Cash and cash equivalents |
$ | 21,230 | $ | 21,424 | ||||
| Other receivables |
11,594 | 12,541 | ||||||
| Inventories |
5,827 | 5,557 | ||||||
| Current deferred tax asset, net |
8,225 | 7,076 | ||||||
| Prepaid rent |
231 | 4,957 | ||||||
| Other prepaid expenses |
2,518 | 2,031 | ||||||
| Total current assets |
49,625 | 53,586 | ||||||
| Property and equipment, net |
241,446 | 255,416 | ||||||
| Noncurrent deferred tax asset, net |
22,101 | 25,011 | ||||||
| Goodwill |
4,622 | 4,622 | ||||||
| Other intangibles, net |
4,837 | 4,714 | ||||||
| Other assets |
8,313 | 6,909 | ||||||
| Total assets |
$ | 330,944 | $ | 350,258 | ||||
| Liabilities and Stockholders’ Equity |
||||||||
| Current liabilities: |
||||||||
| Accounts payable |
$ | 17,075 | $ | 11,263 | ||||
| Accrued compensation and benefits |
23,273 | 23,201 | ||||||
| Accrued rent |
20,424 | 19,287 | ||||||
| Deferred rent credits |
4,058 | 3,745 | ||||||
| Other accrued liabilities |
13,690 | 10,915 | ||||||
| Gift card liability |
14,577 | 20,640 | ||||||
| Store closure reserve |
54 | 326 | ||||||
| Total current liabilities |
93,151 | 89,377 | ||||||
| Long-term debt |
— | 22,300 | ||||||
| Other liabilities |
9,886 | 7,728 | ||||||
| Deferred rent credits, net of current portion |
33,177 | 32,478 | ||||||
| Income taxes payable, net of current portion |
319 | 9,125 | ||||||
| Commitments and contingencies (Note 14) |
||||||||
| Stockholders’ equity: |
||||||||
| Common stock—$0.01 par value, 80,000,000 shares authorized, 24,579,797 and 24,195,800 shares issued and outstanding at January 2, 2011 and January 3, 2010, respectively |
246 | 242 | ||||||
| Additional paid-in capital |
179,563 | 174,000 | ||||||
| Retained earnings |
14,602 | 15,008 | ||||||
| Total stockholders’ equity |
194,411 | 189,250 | ||||||
| Total liabilities and stockholders’ equity |
$ | 330,944 | $ | 350,258 | ||||
The accompanying notes are an integral part of these consolidated financial statements.
43
Table of Contents
CALIFORNIA PIZZA KITCHEN, INC. AND SUBSIDIARIES
CONSOLIDATED STATEMENTS OF OPERATIONS
Years ended January 2, 2011, January 3, 2010 and December 28, 2008
(amounts in thousands, except for per share data)
| 2010 | 2009 | 2008 | ||||||||||
| Revenues: |
||||||||||||
| Restaurant sales |
$ | 630,606 | $ | 652,185 | $ | 665,616 | ||||||
| Royalties from licensing agreement |
6,122 | 7,739 | 6,580 | |||||||||
| Domestic franchise revenues |
3,100 | 2,684 | 2,757 | |||||||||
| International franchise revenues |
2,403 | 2,078 | 2,121 | |||||||||
| Total revenues |
642,231 | 664,686 | 677,074 | |||||||||
| Costs and expenses: |
||||||||||||
| Food, beverage and paper supplies |
148,732 | 154,181 | 165,526 | |||||||||
| Labor |
237,133 | 247,350 | 247,276 | |||||||||
| Direct operating and occupancy |
142,420 | 141,973 | 140,367 | |||||||||
| Cost of sales |
528,285 | 543,504 | 553,169 | |||||||||
| General and administrative |
50,731 | 50,791 | 51,642 | |||||||||
| Depreciation and amortization |
37,006 | 40,181 | 40,299 | |||||||||
| Pre-opening costs |
3,269 | 1,843 | 4,478 | |||||||||
| Loss on impairment of property and equipment |
18,702 | 22,941 | 13,336 | |||||||||
| Store closure costs |
1,708 | 539 | 1,033 | |||||||||
| Litigation, settlement and other costs |
8,759 | 1,609 | 736 | |||||||||
| Total costs and expenses |
648,460 | 661,408 | 664,693 | |||||||||
| Operating (loss)/income |
(6,229 | ) | 3,278 | 12,381 | ||||||||
| Interest expense, net |
(16 | ) | (788 | ) | (1,324 | ) | ||||||
| (Loss)/income before income tax (benefit)/provision |
(6,245 | ) | 2,490 | 11,057 | ||||||||
| Income tax (benefit)/provision |
(5,839 | ) | (2,091 | ) | 2,395 | |||||||
| Net (loss)/income |
$ | (406 | ) | $ | 4,581 | $ | 8,662 | |||||
| Net (loss)/income per common share: |
||||||||||||
| Basic |
$ | (0.02 | ) | $ | 0.19 | $ | 0.34 | |||||
| Diluted |
$ | (0.02 | ) | $ | 0.19 | $ | 0.34 | |||||
| Weighted average shares used in calculating net (loss)/income per common share: |
||||||||||||
| Basic |
24,488 | 24,064 | 25,193 | |||||||||
| Diluted |
24,488 | 24,143 | 25,211 | |||||||||
The accompanying notes are an integral part of these consolidated financial statements.
44
Table of Contents
CALIFORNIA PIZZA KITCHEN, INC. AND SUBSIDIARIES
CONSOLIDATED STATEMENTS OF STOCKHOLDERS’ EQUITY
Years ended January 2, 2011, January 3, 2010 and December 28, 2008
(in thousands, except for share data)
| Common Stock | Additional Paid-in Capital |
Retained Earnings |
Total | |||||||||||||||||
| Shares | Amount | |||||||||||||||||||
| Balances at December 31, 2007 |
28,357,582 | $ | 283 | $ | 216,038 | $ | 1,816 | $ | 218,137 | |||||||||||
| Exercise of employee stock options |
49,776 | 1 | 669 | — | 670 | |||||||||||||||
| Issuance of common stock, under employee stock purchase plan |
103,933 | 1 | 986 | — | 987 | |||||||||||||||
| Shares repurchased through stock repurchase program |
(4,676,671 | ) | (47 | ) | (60,627 | ) | — | (60,674 | ) | |||||||||||
| Issuance of restricted stock |
30,544 | 1 | 1,045 | — | 1,046 | |||||||||||||||
| Equity-based compensation expense |
— | — | 6,035 | — | 6,035 | |||||||||||||||
| Tax deficiency from employee stock option exercises and employee stock purchase plan disqualifying dispositions |
— | — | (331 | ) | — | (331 | ) | |||||||||||||
| Net income |
— | — | — | 8,662 | 8,662 | |||||||||||||||
| Balances at December 28, 2008 |
23,865,164 | 239 | 163,815 | 10,478 | 174,532 | |||||||||||||||
| Exercise of employee stock options |
194,172 | 2 | 2,542 | — | 2,544 | |||||||||||||||
| Issuance of common stock, under employee stock purchase plan |
116,539 | 1 | 943 | — | 944 | |||||||||||||||
| Shares withheld for taxes on restricted stock vesting |
(9,336 | ) | — | (126 | ) | — | (126 | ) | ||||||||||||
| Issuance of restricted stock, net of forfeitures |
29,261 | — | 413 | — | 413 | |||||||||||||||
| Equity-based compensation expense |
— | — | 6,741 | — | 6,741 | |||||||||||||||
| Tax deficiency from employee stock option exercises and employee stock purchase plan disqualifying dispositions |
— | — | (417 | ) | — | (417 | ) | |||||||||||||
| Dissolution of limited partnership |
— | — | 89 | (51 | ) | 38 | ||||||||||||||
| Net income |
— | — | — | 4,581 | 4,581 | |||||||||||||||
| Balances at January 3, 2010 |
24,195,800 | 242 | 174,000 | 15,008 | 189,250 | |||||||||||||||
| Exercise of employee stock options |
168,960 | 2 | 2,131 | — | 2,133 | |||||||||||||||
| Issuance of restricted stock, net of forfeitures |
215,037 | 2 | 66 | — | 68 | |||||||||||||||
| Equity-based compensation expense |
— | — | 3,576 | — | 3,576 | |||||||||||||||
| Tax deficiency from employee stock option exercises |
— | — | (210 | ) | — | (210 | ) | |||||||||||||
| Net loss |
— | — | — | (406 | ) | (406 | ) | |||||||||||||
| Balances at January 2, 2011 |
24,579,797 | $ | 246 | $ | 179,563 | $ | 14,602 | $ | 194,411 | |||||||||||
The accompanying notes are an integral part of these consolidated financial statements.
45
Table of Contents
CALIFORNIA PIZZA KITCHEN, INC. AND SUBSIDIARIES
CONSOLIDATED STATEMENTS OF CASH FLOWS
Years ended January 2, 2011, January 3, 2010 and December 28, 2008
(in thousands)
| 2010 | 2009 | 2008 | ||||||||||
| Operating activities: |
||||||||||||
| Net (loss)/income |
$ | (406 | ) | $ | 4,581 | $ | 8,662 | |||||
| Adjustments to reconcile net (loss)/income to net cash provided by operating activities: |
||||||||||||
| Depreciation and amortization |
37,006 | 40,181 | 40,299 | |||||||||
| Non-cash compensation expense |
3,644 | 7,154 | 7,081 | |||||||||
| Loss on impairment of property and equipment |
18,702 | 22,941 | 13,336 | |||||||||
| Tax (benefit) deficiency from employee stock option exercises |
(72 | ) | 417 | 331 | ||||||||
| Amortization of deferred rent credits |
(4,010 | ) | (3,772 | ) | (3,878 | ) | ||||||
| Changes in operating assets and liabilities: |
||||||||||||
| Other receivables |
947 | (2,683 | ) | 2,493 | ||||||||
| Inventories |
(270 | ) | (147 | ) | (216 | ) | ||||||
| Prepaid expenses and other assets |
2,835 | (6,821 | ) | 4,313 | ||||||||
| Net deferred tax assets |
1,552 | (5,388 | ) | (6,263 | ) | |||||||
| Liquor licenses |
(262 | ) | 2 | (845 | ) | |||||||
| Accounts payable |
4,888 | 1,556 | (3,260 | ) | ||||||||
| Accrued liabilities |
(5,477 | ) | 8,723 | 2,707 | ||||||||
| Gift card liability |
(6,063 | ) | 10,957 | 1,669 | ||||||||
| Other liabilities |
1,886 | 2,645 | (2,364 | ) | ||||||||
| Deferred rent credits |
5,022 | 1,189 | 2,150 | |||||||||
| Net cash provided by operating activities |
59,922 | 81,535 | 66,215 | |||||||||
| Investing activities: |
||||||||||||
| Capital expenditures * |
(40,021 | ) | (25,786 | ) | (56,601 | ) | ||||||
| Dissolution of limited partnership |
— | 38 | — | |||||||||
| Net cash used in investing activities |
(40,021 | ) | (25,748 | ) | (56,601 | ) | ||||||
| Financing activities: |
||||||||||||
| Borrowings on credit facility |
104,900 | 21,250 | 142,000 | |||||||||
| Repayments on credit facility |
(127,200 | ) | (72,950 | ) | (89,000 | ) | ||||||
| Net proceeds from issuance of common stock |
2,133 | 3,362 | 1,657 | |||||||||
| Stock repurchases |
— | — | (60,674 | ) | ||||||||
| Tax benefit (deficiency) from option exercise |
72 | (417 | ) | — | ||||||||
| Net cash used in financing activities |
(20,095 | ) | (48,755 | ) | (6,017 | ) | ||||||
| Net (decrease)/increase in cash and cash equivalents |
(194 | ) | 7,032 | 3,597 | ||||||||
| Cash and cash equivalents at beginning of period |
21,424 | 14,392 | 10,795 | |||||||||
| Cash and cash equivalents at end of period |
$ | 21,230 | $ | 21,424 | $ | 14,392 | ||||||
| Supplemental disclosure of cash flow information: |
||||||||||||
| Cash paid during the period for income taxes |
$ | 5,580 | $ | 3,293 | $ | 7,712 | ||||||
| Cash paid during the period for interest |
$ | 137 | $ | 1,199 | $ | 2,125 | ||||||
| Supplemental disclosure of non-cash investing activities: |
||||||||||||
| * Property, plant and equipment included in accounts payable and other accrued liabilities |
$ | 1,579 | $ | 2,917 | $ | 3,611 | ||||||
The accompanying notes are an integral part of these consolidated financial statements.
46
Table of Contents
CALIFORNIA PIZZA KITCHEN, INC. AND SUBSIDIARIES
NOTES TO CONSOLIDATED FINANCIAL STATEMENTS
Years ended January 2, 2011, January 3, 2010 and December 28, 2008
(in thousands, except for share and per share data)
1. Description of Business
As of January 2, 2011, California Pizza Kitchen, Inc. and its wholly owned subsidiaries (the “Company”) owned, operated, licensed or franchised 266 restaurants under the names California Pizza Kitchen, California Pizza Kitchen ASAP and LA Food Show in 32 states and 11 foreign countries, of which 208 are company-owned and 58 operate under franchise or license arrangements.
The Company manages its operations by restaurant. The Company has aggregated its operations into one reportable segment.
2. Summary of Accounting Policies
Principles of Consolidation
The accompanying consolidated financial statements include the accounts of California Pizza Kitchen, Inc. and its wholly owned subsidiaries CPK Management Company, Inc. and CPK China Holdings, Inc. All significant intercompany balances and transactions are eliminated in consolidation.
Reclassification
Certain prior year amounts have been reclassified to conform to the current year presentation.
The following amounts were reclassified in the Consolidated Statement of Operations:
| Amount | 2009 Presentation |
2010 Presentation of 2009 Amounts | ||
| $ 1,609 | General and administrative | Litigation, settlement and other costs | ||
| Amount | 2008 Presentation |
2010 Presentation of 2008 Amounts | ||
| $ 736 | General and administrative | Litigation, settlement and other costs | ||
The following amounts were reclassified in the Consolidated Statement of Cash Flows:
| Amount | 2009 Presentation |
2010 Presentation of 2009 Amounts | ||
| $ 539 | Store closure costs | Other liabilities | ||
| Amount | 2008 Presentation |
2010 Presentation of 2008 Amounts | ||
| $ 1,033 | Store closure costs | Other liabilities | ||
Fiscal Year End
The Company’s fiscal year ends on the Sunday closest to December 31. The Company’s fiscal year 2010 and 2008 each covered 52 weeks while fiscal year 2009 covered 53 weeks.
Use of Estimates
The preparation of financial statements in conformity with U.S. generally accepted accounting principles (“GAAP”) requires management to make estimates and assumptions that affect the amounts reported in the consolidated financial statements and accompanying notes. Actual results may differ from those estimates.
47
Table of Contents
CALIFORNIA PIZZA KITCHEN, INC. AND SUBSIDIARIES
NOTES TO CONSOLIDATED FINANCIAL STATEMENTS—(Continued)
Cash and Cash Equivalents
The Company considers all highly liquid debt investments with maturities of three months or less when purchased and investments in money market funds to be cash equivalents. We also consider accounts receivable from credit card processors to be cash equivalents because they are both short-term and highly liquid in nature and are converted to cash on average within three days of sales transactions. Cash and cash equivalent balances are not pledged or restricted. The Company’s policy is to invest cash in excess of operating requirements in income-producing investments. Cash equivalents at January 2, 2011 and January 3, 2010 primarily consisted of amounts receivable from credit card processors for sales.
Investments
We hold marketable securities in the form of investments in mutual funds and corporate owned life insurance contracts (“COLI”) to support our deferred compensation Executive Retirement Savings Plan (“ERSP”). These securities, included in other assets on the Consolidated Balance Sheets, are classified as trading securities and gains or losses related to the program are reflected in net (loss)/income. Activity within the COLI investments is generally not subject to income tax. We did not hold any marketable securities in current assets as of January 2, 2011.
Other Receivables
Receivables consist primarily of income tax receivables, royalty amounts due from Nestlé and amounts due from third-party gift card resellers, franchisees and landlords. Management believes these amounts to be collectible and historically we have not experienced any significant losses from uncollectible receivables.
Inventories
Inventories consist of food, beverage and paper supplies, uniforms and supplies. Inventories are accounted for at lower of cost or market using the first-in, first-out method.
Property and Equipment
Property and equipment is recorded at cost, including capitalized interest during the construction period, less accumulated depreciation. Property and equipment is depreciated over the assets’ estimated useful lives using the straight-line method. Leasehold improvements are amortized using the straight-line method over the estimated useful life of the asset or the term of the related lease, whichever is shorter. The lives for furniture, fixtures and equipment are 5 or 10 years. The lives for buildings and leasehold improvements are the shorter of 20 years or the term of the related lease. The lease term includes renewal option periods only in instances in which the exercise of the renewal option can be reasonably assured and failure to exercise such option would result in an economic penalty. The costs of repairs and maintenance are expensed when incurred, while expenditures for refurbishments and improvements that extend the useful life of an asset are capitalized. Depreciation and amortization expense includes the depreciation and amortization of fixed assets, gains and losses on the disposal of assets and the amortization of intangible assets with definite lives.
Goodwill and Intangible Assets
Goodwill represents the residual purchase price after allocation of the purchase price of net assets acquired. Goodwill is not allocated below the reporting unit level. Goodwill and intangible assets deemed to have indefinite lives are not amortized, but are subject to annual impairment tests. Intangible assets with indefinite lives primarily represent the cost of transferable liquor licenses. Intangible assets with finite lives are amortized on a straight-line basis over their estimated useful lives.
48
Table of Contents
CALIFORNIA PIZZA KITCHEN, INC. AND SUBSIDIARIES
NOTES TO CONSOLIDATED FINANCIAL STATEMENTS—(Continued)
The Company tests for impairment of goodwill and indefinite-lived intangible assets at a minimum on an annual basis. Impairment tests are performed with respect to goodwill at the reporting unit level. The Company reviews the recoverability of goodwill based on the results of a discounted cash flow analysis and multiple of earnings analysis which compares fair value of the reporting unit to the carrying value. Generally, the Company performs its annual assessment for impairment during the fourth quarter of its fiscal year and will perform the analysis more frequently if there are any impairment indicators identified during the year. As of January 2, 2011, management determined there was no impairment of goodwill or indefinite-life intangible assets. There can be no assurance that future impairment tests will not result in a charge to earnings.
Impairment of Long-Lived Assets
The Company assesses the impairment of long-lived assets whenever events or changes in circumstances indicate that the carrying value may not be recoverable, but at least quarterly. Factors considered important that could trigger an impairment review include a significant underperformance of a restaurant relative to expected operating results, a significant change in the manner of use of the asset or a significant negative industry or economic trend. We assess recoverability of long-lived assets at the restaurant level based on historical and estimated future cash flows along with other factors. Management has determined that restaurants open at least one year that demonstrate operating results of less than a defined target over the previous twelve-month period should be evaluated for possible impairment. Based on the restaurant’s future restaurant cash flow projections, future operating plans and other qualitative factors, we may recognize an impairment charge determined as the amount by which the asset carrying value exceeds fair value, which is based on discounted future cash flows.
Estimates of future cash flows are judgments based on our experience and knowledge of local operations. These estimates can be significantly impacted by changes in real estate market conditions, the economic environment, capital spending decisions and inflation. Such changes may lead to a greater number of restaurants under impairment review and possible impairment charges in the future.
Self-Insurance
The Company is self-insured for a significant portion of its employee workers’ compensation, general liability, automobile and health insurance obligations. The Company maintains stop-loss coverage with third-party insurers to limit its total exposure. The accrued liabilities associated with these programs are based on historical claims data and our estimate of the ultimate costs to be incurred to settle known claims and claims incurred but not reported as of the balance sheet date. The estimated liability is not discounted and is based on a number of assumptions and factors, including historical trends, actuarial assumptions and economic conditions. If actual trends, including the severity or frequency of claims, differ from our estimates, adjustments to our liabilities could be required.
Income Taxes
The Company utilizes the liability method of accounting for income taxes. Under the liability method, deferred taxes are determined based on the difference between the financial statement and the tax basis of assets and liabilities using enacted tax rates in effect in the years in which the differences are expected to reverse. Recognition of deferred tax assets is limited to amounts considered by management to be more likely than not of realization in future periods. See Note 10 for information regarding changes in our unrecognized tax benefits during fiscal 2010.
49
Table of Contents
CALIFORNIA PIZZA KITCHEN, INC. AND SUBSIDIARIES
NOTES TO CONSOLIDATED FINANCIAL STATEMENTS—(Continued)
Revenue Recognition
Revenues from the operation of company-owned restaurants are recognized when sales occur. Royalty fees from our licensing agreement are recognized on a quarterly basis and are based on a percentage of sales of our premium frozen products. Initial franchise fees received under area licensing agreements are recognized as deferred revenue until the Company has performed its material obligations under such agreements, which is typically upon restaurant opening. A portion of the initial fee is recognized as revenue with each new opening. Royalty fees from franchise restaurants are based on a percentage of restaurant revenues and are recognized in the period the related franchise restaurants’ revenues are earned. Revenues are presented net of sales taxes. Sales taxes not yet remitted to taxing authorities are included as other accrued liabilities.
The Company’s branded gift cards (the “Cards”) carry no dormancy, inactivity or service fees and have no expiration date. The Cards are sold primarily at restaurant locations and other retailers and are redeemable at the Company’s locations. Cards are issued by a third-party vendor (“Issuer”) pursuant to a service agreement and the Issuer is the obligor for Cards. When Cards are sold, a gift card liability is recorded. Restaurant sales are recognized when Cards are redeemed. Discounts on Cards sold for less than face value are generally recorded as reductions to restaurant sales when the related Cards are redeemed.
In 2010, the Company determined that it had specific, historical data over a sufficient timeframe and determined the period after which the likelihood of a Card being redeemed was remote was 24 months after it is sold. An analysis of the data also determined the percentage of Card balances unlikely to ever be redeemed which is commonly referred to as the breakage rate. As a result of the Issuer agreement, the Company is able to recognize supplemental gift card revenue based on Cards unlikely to ever be redeemed.
Beginning in 2010, the Company began recognizing supplemental gift card revenue over 24 months, utilizing the redemption method, beginning when a Card is sold. The amount recognized is based on the estimated breakage rate and in the same proportion that the data shows Cards are redeemed by guests. This was accounted for as a change in accounting estimate. During 2010, $5.6 million of supplemental gift card revenue was recorded, or $0.23 per share, on loss before income tax benefit, of which $3.3 million related to a cumulative catch up for Cards issued prior to 2010.
Due to the variability of timing, terms, volume of Card sales and redemptions, supplemental gift card revenue in the future may differ significantly from those recorded in fiscal 2010.
Advertising Costs
The Company expenses advertising costs as incurred. Advertising expenses for 2010, 2009 and 2008 totaled $7.4 million, $7.4 million and $6.6 million, respectively.
Leases
All of our restaurant leases are currently classified as operating leases. The initial lease period is generally 10 years, with most restaurant lease agreements providing 5 or 10 year renewal clauses exercisable at the option of the Company. The lease term includes renewal option periods only in instances in which the exercise of the renewal option can be reasonably assured and failure to exercise such option would result in an economic penalty.
50
Table of Contents
CALIFORNIA PIZZA KITCHEN, INC. AND SUBSIDIARIES
NOTES TO CONSOLIDATED FINANCIAL STATEMENTS—(Continued)
The Company includes scheduled rent escalation clauses for the purposes of recognizing straight-line rent. Certain of our leases contain provisions that require additional rental payments based upon restaurant sales volume (“contingent rent”). Contingent rent is accrued each period as the liability is incurred, in addition to the straight-line rent expense noted above.
Rent expense is recognized on the straight-line basis, including the restaurant build-out period. This period is normally prior to the commencement of rent payments and is commonly called the rent holiday period. The rent holiday period generally begins when the Company takes possession of the space and begins to make improvements in preparation for its intended use. The Company records as pre-opening expense rental costs incurred during this period. Tenant improvement allowances are recorded as deferred rent credits and amortized over the terms of the related leases as reductions to rent expense.
Pre-opening Costs
The Company expenses as incurred those costs related to restaurant opening, the costs of hiring and training the initial work force, travel, the cost of food used in training, marketing costs and the cost of the initial stocking of operating supplies. The Company includes as pre-opening expense straight-line rent recorded during the period between date of possession and restaurant opening date.
Litigation, Settlement and Other Costs
Litigation, settlement and other costs primarily represents external legal costs related to defending or settling various employee-related lawsuits or claims, whether class-action or individual, regardless of merit. The Company, along with other companies in the restaurant industry in California, has seen a rise in these types of actions in recent years. In 2010, litigation, settlement and other costs also included expenses related to the review of strategic alternatives. See Note 14 to our consolidated financial statements for further detail.
Earnings Per Share
The Company calculates basic earnings per share (“EPS”) by dividing net income or loss attributable to common stockholders by the weighted average of common shares outstanding for the period. Diluted EPS reflects the potential dilution that could occur if securities or other contracts to issue common stock (convertible preferred stock, warrants to purchase common stock and common stock options using the treasury stock method) were exercised or converted into common stock. Potential common shares in the diluted EPS computation are excluded where their effect would be anti-dilutive.
Stock-Based Compensation
The Company recognizes stock-based compensation based on fair value measurement guidance for all share-based payments, including stock options and restricted stock awards. The Company applies the Black-Scholes valuation model in determining the fair value of option awards, which is then amortized on the straight-line basis over the requisite service period. The Company calculates the fair value of restricted stock awards by multiplying the number of shares granted by the grant price of the award. Restricted stock awards are amortized on a straight-line basis over the period during which its related restrictions are expected to lapse. See Note 12 for further discussion of accounting for share-based compensation.
51
Table of Contents
CALIFORNIA PIZZA KITCHEN, INC. AND SUBSIDIARIES
NOTES TO CONSOLIDATED FINANCIAL STATEMENTS—(Continued)
Fair Value of Financial Instruments
The fair values of the Company’s cash and cash equivalents, marketable securities, accounts receivable, accounts payable and all other current liabilities approximate their carrying values because of the short maturities of these instruments. The fair value of the Company’s debt also approximates the carrying value because outstanding balances can be repaid at any time.
Concentrations of Credit Risk
Financial instruments that potentially subject the Company to concentrations of credit risk consist primarily of cash, which may exceed federally insured limits; receivables; and cash equivalents, which are primarily money market funds. The Company places its cash and cash equivalents with high quality financial institutions. The credit risk from receivables is considered limited as amounts are due primarily from third party gift card sellers and landlords for tenant allowances.
The Company maintains a food distribution contract with its sole national master distributor that potentially subjects the Company to a concentration of business risk. This contract is up for renewal in July 2011. Management of the Company believes it will be able to negotiate a similarly priced contract with either its current sole master distributor or another distributor.
Recent Accounting Pronouncements
The FASB updated ASC Topic 810, Consolidation, with amendments to improve financial reporting by enterprises involved with variable interest entities (formerly FAS 167). These amendments require an enterprise to perform an analysis to determine whether the enterprise’s variable interest(s) give it a controlling financial interest in a variable interest entity. The effective date for this guidance was the beginning of a reporting entity’s first annual reporting period that begins after November 15, 2009, for interim periods within that first annual reporting period and for interim and annual reporting periods thereafter. Adoption of this guidance in fiscal 2010 did not have a material effect on the Company’s consolidated financial statements.
The FASB also amended ASC Topic 820, Fair Value Measurements and Disclosures, to require new disclosures regarding activity in Level 3 fair value measurements and significant transfers in and out of Levels 1 and 2 fair value measurements. In addition, this amendment clarifies existing disclosures on the level of disaggregation and inputs and valuation techniques whereby a reporting entity is required to provide fair value measurement disclosures for each class of assets and liabilities and for both recurring and nonrecurring fair value measurements. This guidance was effective for interim and annual financial periods beginning after December 15, 2009, except for the disclosures about activity in Level 3 fair value measurements. Those disclosures are effective for fiscal years beginning after December 15, 2010. Adoption of this guidance in fiscal 2010 did not have a material effect on the Company’s consolidated financial statements.
3. Other Receivables
Other receivables consist of the following:
| 2010 | 2009 | |||||||
| Third-party gift card resellers receivable |
$ | 1,190 | $ | 7,462 | ||||
| Franchise and licensing receivables |
3,238 | 3,230 | ||||||
| Income tax receivable |
5,765 | 1,379 | ||||||
| Delivery and other receivables |
362 | 263 | ||||||
| Tenant improvement allowances |
1,039 | 207 | ||||||
| $ | 11,594 | $ | 12,541 | |||||
52
Table of Contents
CALIFORNIA PIZZA KITCHEN, INC. AND SUBSIDIARIES
NOTES TO CONSOLIDATED FINANCIAL STATEMENTS—(Continued)
4. Property and Equipment, Net
Property and equipment, net consist of the following:
| 2010 | 2009 | |||||||
| Land |
$ | 5,786 | $ | 5,786 | ||||
| Buildings |
11,862 | 11,271 | ||||||
| Furniture, fixtures and equipment |
194,976 | 192,418 | ||||||
| Leasehold improvements |
382,842 | 387,089 | ||||||
| Construction-in-progress |
12,505 | 6,385 | ||||||
| 607,971 | 602,949 | |||||||
| Less accumulated depreciation and amortization |
(366,525 | ) | (347,533 | ) | ||||
| Property and equipment, net |
$ | 241,446 | $ | 255,416 | ||||
Capitalized interest was $68 and $71 in 2010 and 2009, respectively.
5. Other Intangible Assets, Net
Other intangible assets, net consist of the following:
| 2010 | 2009 | |||||||
| Other intangible assets (finite lives), gross |
$ | 2,238 | $ | 2,238 | ||||
| Less accumulated amortization |
(711 | ) | (569 | ) | ||||
| Other intangible assets (finite lives), net |
$ | 1,527 | $ | 1,669 | ||||
| Other intangible assets (indefinite lives) |
$ | 3,310 | $ | 3,045 | ||||
| Total other intangible assets, net |
$ | 4,837 | $ | 4,714 | ||||
Intangible assets are amortized over either 10 or 20 years. Amortization expense was $0.1 million for each of years ended January 2, 2011 and January 3, 2010. The estimated aggregate amortization expense for intangible assets for the fiscal years succeeding January 2, 2011 is as follows:
| 2011 |
$ | 142 | ||
| 2012 |
142 | |||
| 2013 |
142 | |||
| 2014 |
142 | |||
| 2015 |
142 | |||
| Thereafter |
817 | |||
| Total |
$ | 1,527 | ||
53
Table of Contents
CALIFORNIA PIZZA KITCHEN, INC. AND SUBSIDIARIES
NOTES TO CONSOLIDATED FINANCIAL STATEMENTS—(Continued)
6. Accrued Compensation and Benefits
Accrued compensation and benefits consist of the following:
| 2010 | 2009 | |||||||
| Accrued compensation |
$ | 10,471 | $ | 9,641 | ||||
| Accrued insurance |
4,643 | 4,849 | ||||||
| Accrued vacation |
3,904 | 3,917 | ||||||
| Accrued payroll taxes |
3,628 | 4,103 | ||||||
| Accrued employee benefit contributions |
627 | 691 | ||||||
| $ | 23,273 | $ | 23,201 | |||||
7. Other Accrued Liabilities
Other accrued liabilities consist of the following:
| 2010 | 2009 | |||||||
| Accrued sales & use tax |
$ | 3,462 | $ | 4,625 | ||||
| Accrued utilities |
1,277 | 1,097 | ||||||
| Accrued interest, bank & credit card fees |
1,051 | 958 | ||||||
| Accrued legal fees & settlement costs |
5,428 | 829 | ||||||
| Other accrued liabilities |
2,472 | 3,406 | ||||||
| $ | 13,690 | $ | 10,915 | |||||
8. Debt
The Company holds a revolving credit facility (the “Facility”) with a syndicate of banks, featuring a maximum available borrowing capacity of $150.0 million. The Facility contains an uncommitted option to increase, subject to satisfaction of certain conditions, the maximum borrowing capacity by up to an additional $50.0 million. The Facility is guaranteed by one of the Company’s subsidiaries and stipulates certain events of default. Borrowings under the Facility bear interest at either LIBOR or the prime rate, at the Company’s option, plus a spread ranging from 100 to 150 basis points for LIBOR loans or zero to 25 basis points for prime rate loans. The Company also pays a commitment fee on the unused facility ranging from 20 to 30 basis points per annum. Both the interest rate spread and the commitment fee level depend on the lease adjusted leverage ratio as defined in the terms of the Facility. The Facility also includes a $15.0 million sublimit for standby letters of credit. As of January 2, 2011, the Company had no borrowings outstanding under the Facility. Availability under the Facility was reduced by outstanding letters of credit totaling $6.6 million as of January 2, 2011, which are used to support the Company’s self-insurance programs. Available borrowings under the Facility were $143.4 million as of January 2, 2011. The Facility contains certain restrictive and financial covenants, including that the Company maintain a minimum consolidated fixed charge coverage ratio and a maximum lease adjusted leverage ratio, with which the Company was in compliance as of January 2, 2011. The Facility matures in May 2013.
9. Fair Value Measurement
Our financial instruments are primarily comprised of cash and cash equivalents, receivables, accounts payable, accrued liabilities and long-term debt. The Company believes the fair values of cash equivalents, accounts receivable, accounts payable and long-term debt approximate their carrying amounts due to their short durations. All borrowings are included in long-term debt and are generally LIBOR contracts which mature every 30 days.
54
Table of Contents
CALIFORNIA PIZZA KITCHEN, INC. AND SUBSIDIARIES
NOTES TO CONSOLIDATED FINANCIAL STATEMENTS—(Continued)
The Company uses a three-tier fair value hierarchy, which prioritizes the inputs used to measure fair value of assets and liabilities. These tiers include:
| • | Level 1: Defined as observable inputs such as quoted prices in active markets for identical assets or liabilities as of the reporting date. Active markets are those in which transactions for the asset or liability occur in sufficient frequency and volume to provide pricing information on an ongoing basis. |
| • | Level 2: Defined as pricing inputs other than quoted prices in active markets included in Level 1, which are either directly or indirectly observable as of the reporting date. Level 2 includes those financial instruments that are valued using models or other valuation methodologies. These models are primarily industry-standard models that consider various assumptions, including quoted forward prices for commodities, time value, volatility factors, and current market and contractual prices for the underlying instruments, as well as other relevant economic measures. |
| • | Level 3: Defined as pricing inputs that are generally less observable from objective sources. These inputs may be used with internally developed methodologies that result in management’s best estimate of fair value. |
We do not hold any marketable securities in current assets as of January 2, 2011. We primarily hold marketable securities in the form of investments in mutual funds within corporate owned life insurance (“COLI”) contracts to support our Executive Retirement Savings Plan. We also hold non-COLI mutual funds to support this plan. These marketable securities are included in other assets on the Consolidated Balance Sheets. Gains or losses related to these investments are reflected in net income. For assets that are measured using quoted prices in active markets, the fair value is the published market price per unit multiplied by the number of units held without consideration of transaction costs. Assets measured using significant other observable inputs are reported at fair value based on third-party broker statements which are derived from the fair value of the funds’ underlying investments.
The assets measured at fair value on a recurring basis at January 2, 2011 were as follows:
| Fair Value Measurement at Reporting Date Using | ||||||||||||
| Quoted Prices in Active markets for Identical Assets (Level 1) |
Significant Other Observable Inputs (Level 2) |
Significant Unobservable Inputs (Level 3) |
||||||||||
| Deferred compensation mutual funds |
$ | 637 | $ | — | $ | — | ||||||
| Deferred compensation COLI |
406 | 5,318 | — | |||||||||
| Balance at January 2, 2011 |
$ | 1,043 | $ | 5,318 | $ | — | ||||||
55
Table of Contents
CALIFORNIA PIZZA KITCHEN, INC. AND SUBSIDIARIES
NOTES TO CONSOLIDATED FINANCIAL STATEMENTS—(Continued)
10. Income Taxes
The details of the (benefit)/provision for income taxes are as follows:
| 2010 | 2009 | 2008 | ||||||||||
| Current: |
||||||||||||
| U.S. Federal |
$ | 137 | $ | 6,313 | $ | 3,223 | ||||||
| U.S. State |
917 | 2,042 | 2,561 | |||||||||
| Foreign |
— | — | — | |||||||||
| 1,054 | 8,355 | 5,784 | ||||||||||
| Deferred: |
||||||||||||
| U.S. Federal |
(5,651 | ) | (8,869 | ) | (2,192 | ) | ||||||
| U.S. State |
(1,102 | ) | (1,577 | ) | (1,197 | ) | ||||||
| Foreign |
(140 | ) | — | — | ||||||||
| (6,893 | ) | (10,446 | ) | (3,389 | ) | |||||||
| $ | (5,839 | ) | $ | (2,091 | ) | $ | 2,395 | |||||
The following is a reconciliation between the U.S. federal statutory rate and the effective tax rate:
| 2010 | 2009 | 2008 | ||||||||||
| Statutory rate |
(35.0 | )% | 35.0 | % | 35.0 | % | ||||||
| State income taxes, net of federal benefit |
(4.4 | ) | 1.2 | 5.2 | ||||||||
| General business and tip tax credit |
(52.6 | ) | (122.8 | ) | (31.6 | ) | ||||||
| Restricted stock and ESPP |
0.8 | 16.3 | 3.8 | |||||||||
| Nondeductible expenses |
2.9 | 3.1 | 1.0 | |||||||||
| Deferred compensation |
(3.8 | ) | (14.9 | ) | 2.3 | |||||||
| Uncertain tax positions |
(3.5 | ) | (0.7 | ) | 1.0 | |||||||
| Other |
2.1 | (1.2 | ) | 5.0 | ||||||||
| (93.5 | )% | (84.0 | )% | 21.7 | % | |||||||
56
Table of Contents
CALIFORNIA PIZZA KITCHEN, INC. AND SUBSIDIARIES
NOTES TO CONSOLIDATED FINANCIAL STATEMENTS—(Continued)
Deferred income taxes reflect the net tax effects of temporary differences between the carrying value of assets and liabilities for financial reporting purposes and the amounts used for income tax purposes. Significant components of the Company’s net deferred tax asset at January 2, 2011 and January 3, 2010 consist of the following:
| 2010 | 2009 | |||||||
| Current deferred tax assets: |
||||||||
| Insurance reserves |
$ | 1,665 | $ | 1,782 | ||||
| Compensation reserves |
2,388 | 1,601 | ||||||
| Other accruals |
3,210 | 2,538 | ||||||
| State taxes |
319 | 678 | ||||||
| Other, current |
643 | 477 | ||||||
| Subtotal current |
8,225 | 7,076 | ||||||
| Noncurrent deferred tax assets/(liabilities): |
||||||||
| Asset impairment reserves |
33,722 | 27,078 | ||||||
| Book depreciation under tax depreciation |
(35,389 | ) | (27,820 | ) | ||||
| Accrued rent |
7,954 | 7,420 | ||||||
| Stock options |
7,160 | 6,552 | ||||||
| Deferred revenue |
— | 7,513 | ||||||
| U.S. tax carryforwards |
5,570 | 2,249 | ||||||
| Foreign tax carryforwards |
140 | — | ||||||
| Other, noncurrent |
2,944 | 2,019 | ||||||
| Subtotal noncurrent |
22,101 | 25,011 | ||||||
| Net deferred tax assets |
$ | 30,326 | $ | 32,087 | ||||
Based on the level of historical taxable income and projections of future taxable income during the periods that deferred tax assets are recoverable, management believes that it is more likely than not that the benefit from net deferred tax assets as of January 2, 2011 will be realized.
As of January 2, 2011, the Company has U.S. federal and state net operating loss carryforwards of $2.2 million from the acquisition of LA Food Show, which will begin to expire in 2023 for federal and 2013 for state. Utilization of the net operating losses is subject to an annual limitation as defined under Section 382 of the Internal Revenue Code. The Company has U.S. federal tax credit carryforward of $3.4 million which will begin to expire in 2030, as well as state tax credit carryforward of $1.6 million with no expiration.
The Company utilizes a “more likely than not” threshold and measurement criteria for uncertain tax positions recognized in the financial statements resulting from tax positions taken or expected to be taken in the Company’s tax return.
57
Table of Contents
CALIFORNIA PIZZA KITCHEN, INC. AND SUBSIDIARIES
NOTES TO CONSOLIDATED FINANCIAL STATEMENTS—(Continued)
A reconciliation of the beginning and ending amounts of gross unrecognized tax benefits, excluding interest and penalties, is as follows:
| 2010 | 2009 | 2008 | ||||||||||
| Unrecognized tax benefits at beginning of period |
$ | 8,504 | $ | 3,515 | $ | 717 | ||||||
| Additions for tax positions of prior periods |
— | 4,276 | 119 | |||||||||
| Reductions for tax positions of prior periods |
(7,188 | ) | — | — | ||||||||
| Additions for tax positions of current period |
— | 1,176 | 3,048 | |||||||||
| Settlements |
(1,129 | ) | (463 | ) | (350 | ) | ||||||
| Lapse of statute of limitations |
— | — | (19 | ) | ||||||||
| Unrecognized tax benefits at end of period |
$ | 187 | $ | 8,504 | $ | 3,515 | ||||||
As of January 2, 2011 and January 3, 2010, the Company had $187 and $8,504 of gross unrecognized tax benefits and accrued interest and penalties of $132 and $622, respectively. The Company recognized through the consolidated statement of operations a reduction to accrued interest and penalties of $490 during the year ended January 2, 2011, an increase of $76 during the year ended January 3, 2010 and an increase of $292 during the year ended December 28, 2008. The Company recognizes interest and penalties related to uncertain tax positions as a component of the provision for income taxes. As of January 2, 2011 and January 3, 2010, the amount of unrecognized tax benefits (net of federal benefit for state taxes) of $101 and $862, respectively, would impact the effective tax rate if recognized.
During 2010, the Company concluded an examination by the Internal Revenue Service covering tax years 2006 through 2008, thereby settling $1.1 million of federal and state unrecognized tax benefits. The Company is in the process of amending state tax returns to reflect the settlement. In addition, the Company filed a tax accounting method change related to income recognition, which resulted in a reduction for tax positions taken in prior periods.
Tax years 2006 and forward remain open to examination by state and local taxing jurisdictions.
11. Stockholders’ Equity
During fiscal 2010, employees exercised 202,344 options which resulted in the issuance of 168,960 shares of common stock and net proceeds to the Company of $2.1 million.
During fiscal 2010, Richard L. Rosenfield and Larry S. Flax, our co-founders, co-Chairmen of the Board of Directors and co-Chief Executive Officers, were each granted 80,000 shares of restricted stock, and Susan M. Collyns, our Executive Vice President, Chief Operating Officer and Chief Financial Officer, was granted 60,000 shares of restricted stock. The restricted shares granted to Messrs. Rosenfield and Flax will vest in equal annual installments on the first, second and third anniversaries of the grant date. Ms. Collyns’ restricted shares will vest in equal installments on December 31 of 2010, 2011 and 2012.
During fiscal 2010, 4,963 shares of unvested restricted stock were retired.
On July 9, 2008, the Board of Directors authorized a stock repurchase program (“July 2008 Program”) to acquire the Company’s common stock from time to time in the open market and through privately negotiated transactions. Under the July 2008 Program, up to $50.0 million of the Company’s common stock could be reacquired from time to time over a 24-month period. While the Company repurchased 1,044,134 shares in the open market for an aggregate price of $10.7 million during the third and fourth quarter of 2008, no shares were repurchased during 2009 or 2010. The July 2008 Program expired on July 8, 2010.
58
Table of Contents
CALIFORNIA PIZZA KITCHEN, INC. AND SUBSIDIARIES
NOTES TO CONSOLIDATED FINANCIAL STATEMENTS—(Continued)
12. Equity-Based Compensation
The Company maintains incentive compensation plans under which restricted stock awards, stock options, stock units and stock appreciation rights may be granted to employees, non-employee directors and independent contractors. To date, the Company has granted both stock options and restricted stock awards. Stock options under the plans provide for either nonqualified stock options or incentive stock options. Stock options are granted at the market price on the date of grant and generally vest at a rate of 25% per year. The stock options generally expire 10 years from the date of grant. Restricted stock awards are also granted at the market price on the date of grant, but vest in accordance with provisions of the grant. The Company issues new shares of common stock upon exercise of stock options and vesting of restricted stock awards.
The impact of stock-based compensation expense for the year ended January 2, 2011 on loss before income tax benefit was $3.5 million or $0.14 on diluted loss per share. The impact for the year ended January 3, 2010 and December 28, 2008 on income before income tax provision was $6.9 million and $6.8 million, respectively, or $0.29 and $0.27 on diluted earnings per share, respectively.
Reported stock-based compensation was classified as follows:
| 2010 | 2009 | 2008 | ||||||||||
| Labor |
$ | 93 | $ | 475 | $ | 722 | ||||||
| General and administrative |
3,447 | 6,421 | 6,058 | |||||||||
| Total stock-based compensation expense |
$ | 3,540 | $ | 6,896 | $ | 6,780 | ||||||
| Tax benefit deficiency |
$ | 72 | $ | (417 | ) | $ | (331 | ) | ||||
| Capitalized stock-based compensation (1) |
$ | 104 | $ | 258 | $ | 301 | ||||||
| (1) | Capitalized stock-based compensation is included in property and equipment, net on the consolidated balance sheets. |
Stock Options
No options were issued during fiscal 2010. The weighted average fair value at the grant date using the Black-Scholes valuation model for options issued in the fiscal years 2009 and 2008 was $4.59 and $4.55 per option, respectively. The fair value of options issued at the date of grant was estimated using the following weighted average assumptions for fiscal years 2009 and 2008, respectively: (a) no dividend yield on common stock; (b) expected stock price volatility of 41.30% and 35.63%; (c) a risk-free interest rate of 1.81% and 2.69%; and (d) an expected option term of 5.9 years and 4.0 years.
The expected term of the options represents the estimated period of time until exercise and is based on the Company’s historical experience of similar option grants, giving consideration to the contractual terms, vesting schedules and expectations of future employee behavior. For fiscal 2009 and 2008, expected stock price volatility is based on the historical volatility of our stock. The risk-free interest rate is based on the U.S. Treasury bill rate in effect at the time of grant with an equivalent expected term or life. The Company has not paid dividends in the past and does not currently plan to pay any dividends in the future.
59
Table of Contents
CALIFORNIA PIZZA KITCHEN, INC. AND SUBSIDIARIES
NOTES TO CONSOLIDATED FINANCIAL STATEMENTS—(Continued)
Information regarding activity for stock options under our plans is as follows:
| Shares | Weighted Average Exercise Price |
Weighted Average Remaining Contractual Term (in years) |
Aggregate Intrinsic Value |
|||||||||||||
| Outstanding at January 3, 2010 |
5,716,423 | $ | 15.82 | |||||||||||||
| Options exercised |
(202,344 | ) | 13.34 | |||||||||||||
| Options cancelled |
(192,892 | ) | 16.37 | |||||||||||||
| Outstanding at January 2, 2011 |
5,321,187 | $ | 15.89 | 4.74 | $ | 10,596,294 | ||||||||||
| Vested and exercisable at January 2, 2011 |
4,838,069 | $ | 16.10 | 4.47 | $ | 8,786,638 | ||||||||||
The aggregate intrinsic value in the table above represents the total pre-tax intrinsic value (the difference between our closing stock price and the exercise price, multiplied by the number of in-the-money options) that would have been received by the option holders had all option holders exercised their options on the fiscal year-end date. This amount changes based on the fair market value of our stock. The total intrinsic value of options exercised during the year ended January 2, 2011, January 3, 2010 and December 28, 2008 was $0.7 million, $0.6 million and $0.1 million, respectively.
A summary of the status of the Company’s nonvested options during fiscal years 2008, 2009 and 2010 is as follows:
| Nonvested Shares | ||||||||
| Shares | Weighted Average Grant Date Fair Value |
|||||||
| Nonvested at December 30, 2007 |
2,436,971 | $ | 5.88 | |||||
| Options granted |
608,789 | 4.55 | ||||||
| Options vested |
(1,091,208 | ) | 5.73 | |||||
| Options cancelled |
(113,180 | ) | 6.44 | |||||
| Nonvested at December 28, 2008 |
1,841,372 | $ | 5.50 | |||||
| Options granted |
391,516 | 4.59 | ||||||
| Options vested |
(996,568 | ) | 5.66 | |||||
| Options cancelled |
(105,171 | ) | 5.19 | |||||
| Nonvested at January 3, 2010 |
1,131,149 | $ | 5.08 | |||||
| Options vested |
(603,583 | ) | 5.39 | |||||
| Options cancelled |
(44,448 | ) | 4.03 | |||||
| Nonvested at January 2, 2011 |
483,118 | $ | 4.78 | |||||
The total fair value of shares vested during the year ended January 2, 2011, January 3, 2010 and December 28, 2008 was $3.3 million, $5.6 million and $6.2 million, respectively. As of January 2, 2011, total unrecognized stock-based compensation expense related to nonvested stock options was approximately $1.6 million, which is expected to be recognized over a weighted average period of approximately 1.5 years. As of January 2, 2011 there were 0.1 million shares of common stock available for issuance pursuant to future stock awards.
60
Table of Contents
CALIFORNIA PIZZA KITCHEN, INC. AND SUBSIDIARIES
NOTES TO CONSOLIDATED FINANCIAL STATEMENTS—(Continued)
Restricted Stock Awards
Information regarding activity for restricted stock awards under our plans is as follows:
| Shares | Weighted Average Grant Date Fair Value |
|||||||
| Outstanding at December 30, 2007 |
134,374 | $ | 20.73 | |||||
| Restricted shares granted |
10,000 | 14.68 | ||||||
| Restricted shares vested |
(40,833 | ) | 21.10 | |||||
| Restricted shares cancelled |
— | — | ||||||
| Outstanding at December 28, 2008 |
103,541 | $ | 20.00 | |||||
| Restricted shares granted |
39,260 | 14.59 | ||||||
| Restricted shares vested |
(64,163 | ) | 19.22 | |||||
| Restricted shares cancelled |
(9,999 | ) | 15.98 | |||||
| Outstanding at January 3, 2010 |
68,639 | $ | 18.21 | |||||
| Restricted shares granted |
220,000 | 18.18 | ||||||
| Restricted shares vested |
(40,064 | ) | 17.89 | |||||
| Restricted shares cancelled |
(4,963 | ) | 13.65 | |||||
| Outstanding at January 2, 2011 |
243,612 | $ | 18.33 | |||||
Fair value of our restricted shares is based on our closing stock price on the date of grant. As of January 2, 2011, total unrecognized stock-based compensation expense related to nonvested restricted shares was $3.0 million, which is expected to be recognized over a weighted average period of 2.2 years.
13. Net (Loss)/Income Per Common Share
Reconciliation of basic and diluted net (loss)/income per common share for the fiscal years ended January 2, 2011, January 3, 2010 and December 28, 2008 is as follows:
| 2010 | 2009 | 2008 | ||||||||||
| Numerator for basic and diluted net (loss)/income per common share |
$ | (406 | ) | $ | 4,581 | $ | 8,662 | |||||
| Denominator: |
||||||||||||
| Denominator for basic net (loss)/income per common share -weighted average shares |
24,488 | 24,064 | 25,193 | |||||||||
| Employee stock options |
— | 79 | 18 | |||||||||
| Denominator for diluted net (loss)/income per common share -weighted average shares |
24,488 | 24,143 | 25,211 | |||||||||
For fiscal years 2010, 2009 and 2008, approximately 0.7 million, 1.7 million and 2.5 million stock options, respectively, have been excluded from the computation of diluted net (loss)/earnings per share because to do so would have been antidilutive for the fiscal years presented.
61
Table of Contents
CALIFORNIA PIZZA KITCHEN, INC. AND SUBSIDIARIES
NOTES TO CONSOLIDATED FINANCIAL STATEMENTS—(Continued)
14. Commitments and Contingencies
Commitments
The Company leases certain restaurant facilities and its corporate headquarters under non-cancelable operating leases with terms ranging from 5 to 20 years. The restaurant leases generally require payment of contingent rents based on a percentage of sales and require payment of various expenses incidental to the use of property. Rent expense on all operating leases amounted to $37.6 million, $38.1 million and $38.0 million for fiscal years 2010, 2009 and 2008, respectively, including contingent rental expense of $1.7 million, $2.2 million and $3.9 million for fiscal years 2010, 2009 and 2008, respectively. Most leases contain renewal options and may be subject to periodic adjustments for inflation and scheduled escalations.
The aggregate future minimum annual lease payments under non-cancelable operating leases for the fiscal years succeeding January 2, 2011 are as follows:
| Payments Due by Fiscal Year | ||||||||||||||||||||||||||||
| Total | 2011 | 2012 | 2013 | 2014 | 2015 | Thereafter | ||||||||||||||||||||||
| Operating Lease Obligations |
$ | 220,026 | $ | 40,781 | $ | 37,346 | $ | 32,406 | $ | 28,122 | $ | 24,690 | $ | 56,681 | ||||||||||||||
| $ | 220,026 | $ | 40,781 | $ | 37,346 | $ | 32,406 | $ | 28,122 | $ | 24,690 | $ | 56,681 | |||||||||||||||
Contingencies
On April 27, 2007, three former hourly restaurant employees in the State of California filed a class-action lawsuit in the San Francisco Superior Court. The parties purport to represent other current and former hourly California restaurant employees. The lawsuit alleges violations of state wage-and-hour laws involving the purchase of items of apparel required to be worn by hourly employees and reimbursement for laundering of these items of apparel and seeks unspecified monetary damages. On August 11, 2010, the Court granted class certification in this matter. We deny any liability with respect to these allegations and intend to vigorously defend ourselves in this action. An estimate of the possible loss, if any, or the range of the loss cannot be made at time.
On July 3, 2007, two former hourly restaurant employees in the State of California filed a class-action lawsuit in the Los Angeles Superior Court alleging violations of state wage-and-hour laws. On April 22, 2008 and on April 25, 2008, former hourly employees in the State of California filed two additional lawsuits in Los Angeles Superior Court alleging similar wage-and-hour violations, and on December 4, 2008, the Court coordinated the three cases. The parties purport to represent other current and former hourly California restaurant employees. The lawsuit alleges violations of state wage-and-hour laws involving allegations of work performed off the clock, improper reduction in hours, failure to provide meal and rest breaks and failure to reimburse employees for expenses incurred in the course of employment. The plaintiffs seek unspecified monetary damages. In December 2008, a proposed settlement was not approved by the Court. The Company has accrued a loss contingency based on the proposed settlement which is not considered to be material to our consolidated financial position. We deny any liability with respect to these allegations and intend to vigorously defend ourselves in this action.
On May 19, 2008, a class-action lawsuit was filed in the State of California in the San Diego Superior Court against the Company. The lawsuit was filed by a former restaurant manager on behalf of himself and other current and former restaurant managers employed in California. The lawsuit alleges violations of state wage-and-hour laws involving the exempt status of managers, alleges violations of meal and rest breaks and unpaid overtime and seeks unspecified monetary damages. On October 7, 2010, the Company entered into a proposed settlement of all claims in the action. This proposed settlement is subject to court approval. The proposed
62
Table of Contents
CALIFORNIA PIZZA KITCHEN, INC. AND SUBSIDIARIES
NOTES TO CONSOLIDATED FINANCIAL STATEMENTS—(Continued)
settlement does not involve any admission of wrongdoing or liability and, subject to court approval, will result in the dismissal of the lawsuit’s claims against the Company. Under the proposed settlement, class members can submit claims pursuant to a Court approved process whereby the Company would pay an amount not to exceed $4.0 million to settle claims asserted on behalf of the class. The Company has accrued a legal settlement reserve based on its best estimate of costs to be incurred relative to this case. The Company anticipates plaintiffs’ counsel will be filing a motion in the Superior Court in the near future requesting approval of the proposed settlement. The Company cannot provide any assurances that the Court will approve the proposed settlement.
Other than the aforementioned class-action lawsuits, we are subject to certain private lawsuits, administrative proceedings and other claims that arise in the ordinary course of our business. Such claims typically involve claims from guests, employees and others related to operational issues common to the food service industry. A number of such claims may exist at any given time. We could be affected by adverse publicity resulting from such allegations, regardless of whether such allegations are valid or whether we are found to be liable. From time to time, we are also involved in lawsuits with respect to infringements of, or challenges to, our registered trademarks.
15. Employee Benefit Plans
In January 1994, the Company established a defined contribution 401(k) plan for certain qualified employees as defined. Participants may contribute from 1% to 15% of pretax compensation, subject to certain limitations. The plan provides for certain discretionary contributions by the Company.
The Company has also established an Executive Retirement Savings Plan (“ERSP”). The ERSP is a non-qualified deferred compensation plan for its highly compensated employees as defined in the ERSP and who are otherwise ineligible for full participation in the 401(k) plan. The ERSP allows participating employees to defer up to 80% of the receipt of their base compensation and 100% of their eligible bonuses. The plan provides for certain discretionary matching contributions by the Company. Employee deferrals and Company discretionary matches are deposited into a “rabbi” trust established by the Company. Funds are invested in a combination of mutual funds and corporate owned life insurance contracts (“COLI”) that are specifically designed to informally fund savings plans of this nature. The funds are considered trading securities and all gains, losses and expenses related to funds, the rabbi trust and operating the program are reflected in our consolidated statements of income. These assets are included in other assets on our consolidated balance sheets and were $6.4 million and $5.0 million at January 2, 2011 and January 3, 2010, respectively. The obligation to participating employees is reflected in other liabilities and was $6.2 million at January 2, 2011 and $4.9 million at January 3, 2010.
The Company recorded matching contribution expenses of $559, $569 and $563 for fiscal 2010, 2009 and 2008, respectively, for both the defined contribution 401(k) plan and ERSP. The contributions are made subsequent to each fiscal year-end.
The Company also maintains an unfunded, non-qualified, noncontributory, supplemental executive retirement program (“SERP”) that provides the co-CEOs with defined supplemental retirement benefits. The post retirement benefit obligation is calculated using a discount rate of 6.0%. The Company recorded non-cash expense for the SERP of $525, $412 and $668 for fiscal years 2010, 2009 and 2008, respectively. Liabilities related to the SERP were $2.1 million at January 2, 2011 and $1.6 million at January 3, 2010 and are included in other liabilities on our consolidated balance sheets.
In November 1999, the Company adopted an employee stock purchase plan (“ESPP”) under Section 423 of the Internal Revenue Code of 1986, which became effective with the initial public offering in August 2000 and
63
Table of Contents
CALIFORNIA PIZZA KITCHEN, INC. AND SUBSIDIARIES
NOTES TO CONSOLIDATED FINANCIAL STATEMENTS—(Continued)
reserved 375,000 shares for issuance thereunder. In 2003, the Company increased the aggregate number of shares available for sale under the ESPP to 750,000 shares. The ESPP concluded on July 15, 2009. The ESPP allowed eligible employees to purchase common stock at a discount, but only through payroll deductions, during consecutive 24-month offering periods, subject to automatic reset if favorable to the employees. Each offering period was divided into four consecutive six-month purchase periods. The price at which the stock was purchased under the ESPP was equal to 85% of the lower of the fair market value of the common stock on the first day of the offering period and the fair market value of the common stock on the last day of the purchase period. Non-cash compensation expenses for this plan were $0, $295 and $295 for the fiscal years 2010, 2009 and 2008, respectively.
16. Quarterly Financial Data (Unaudited)
The following table presents selected unaudited quarterly financial data for the periods ending as indicated (in thousands, except diluted net income (loss) per share):
| 13 Weeks Ended April 4, 2010 (a) |
13 Weeks Ended July 4, 2010 (b) |
13 Weeks Ended October 3, 2010 (c) |
13 Weeks Ended January 2, 2011 (d) |
|||||||||||||
| Quarter Ended: |
||||||||||||||||
| Total revenues |
$ | 156,694 | $ | 163,050 | $ | 164,543 | $ | 157,942 | ||||||||
| Operating income (loss) |
3,479 | 5,668 | (17,256 | ) | 1,880 | |||||||||||
| Net income (loss) |
2,500 | 4,192 | (7,538 | ) | 440 | |||||||||||
| Diluted net income (loss) per share |
$ | 0.10 | $ | 0.17 | $ | (0.31 | ) | $ | 0.02 | |||||||
| 13 Weeks Ended March 29, 2009 |
13 Weeks Ended June 28, 2009 |
13 Weeks Ended September 27, 2009 (e) |
14 Weeks Ended January 3, 2010 (f) |
|||||||||||||
| Quarter Ended: |
||||||||||||||||
| Total revenues |
$ | 161,068 | $ | 170,931 | $ | 164,839 | $ | 167,848 | ||||||||
| Operating income (loss) |
4,114 | 8,833 | 7,977 | (17,646 | ) | |||||||||||
| Net income (loss) |
2,592 | 6,098 | 5,791 | (9,900 | ) | |||||||||||
| Diluted net income (loss) per share |
$ | 0.11 | $ | 0.25 | $ | 0.24 | $ | (0.41 | ) | |||||||
| (a) | Includes store closure costs of $466 and litigation, settlement and other costs of $289. |
| (b) | Includes litigation, settlement and other costs of $480. |
| (c) | Includes loss on impairment of property and equipment of $18,702, store closure costs of $592 and litigation, settlement and other costs of $5,736. |
| (d) | Includes store closure costs of $650 and litigation, settlement and other costs of $2,254. |
| (e) | Includes store closure costs of $185. |
| (f) | Includes loss on impairment of property and equipment of $22,941 and store closure costs of $354. |
64
Table of Contents
EXHIBIT INDEX
| 3.1(K) | Certificate of Incorporation | |
| 3.2(K) | By-laws | |
| 4.1(K) | Specimen Common Stock Certificate | |
| 10.1(A) | Memorandum of Understanding Regarding Form of Agreement between Host Marriott Services and California Pizza Kitchen, Inc. dated May 12, 1998 | |
| 10.2(K)* | California Pizza Kitchen, Inc. Employee Stock Purchase Plan adopted on November 2, 1999, as amended through December 22, 2004 | |
| 10.3(A)* | California Pizza Kitchen, Inc. 1998 Stock-Based Incentive Compensation Plan adopted February 5, 1998, as amended on July 21, 1998 and November 2, 1999 and forms of stock option agreement thereunder | |
| 10.4(A)* | California Pizza Kitchen, Inc. Non-Qualified Stock Option Agreement between California Pizza Kitchen, Inc. and Frederick R. Hipp dated March 31, 1998 | |
| 10.5(B) | Master Subsidiary Guaranty issued from Bank of America, N.A. by CPK Management Company and California Pizza Kitchen of Illinois, Inc. dated December 15, 2000 | |
| 10.6(C)* | Third and Fourth Amendments to California Pizza Kitchen, Inc. 1998 Stock-Based Incentive Compensation Plan dated as of July 28, 2000 and May 1, 2001, respectively | |
| 10.7(D) | Stockholders’ Agreement among LA Food Show, Inc., Richard L. Rosenfield and Larry S. Flax, as trustee of the Larry S. Flax Revocable Trust dated June 18, 2002 and California Pizza Kitchen, Inc., dated March 6, 2003 | |
| 10.8(D) | Subscription Agreement among Richard L. Rosenfield, Larry S. Flax, as trustee of the Larry S. Flax Revocable Trust dated June 18, 2002 and California Pizza Kitchen, Inc., dated March 6, 2003 | |
| 10.9(D) | Certificate of Determination of Series A 8% Convertible Preferred Stock of LA Food Show, Inc. filed with the California Secretary of State on March 4, 2003 | |
| 10.10(D) | Amendment No. 1 to Stockholders’ Agreement among LA Food Show, Inc., Richard L. Rosenfield, Larry S. Flax as trustee of the Larry S. Flax Revocable Trust dated June 18, 2002 and California Pizza Kitchen, Inc., dated March 11, 2003 | |
| 10.11(E) | Agreement for Purchase and Sale of Assets between CAH Restaurants of California, LLC and California Pizza Kitchen, Inc. dated as of December 29, 2003, and exhibits thereto | |
| 10.12(F)* | Fifth Amendment to California Pizza Kitchen, Inc. 1998 Stock-Based Incentive Compensation Plan, dated as of May 7, 2003 | |
| 10.13(F)* | Second Amendment to California Pizza Kitchen, Inc. Employee Stock Purchase Plan, dated as of May 7, 2003 | |
| 10.14(G)* | Executive Retirement Savings Plans and Amendments thereto | |
| 10.15(H)* | Employment Agreement, between H.G. Carrington, Jr. and California Pizza Kitchen, Inc., dated July 24, 2003 | |
| 10.16(H)* | Separation Agreement, between Frederick R. Hipp and California Pizza Kitchen, Inc., dated July 15, 2003 | |
| 10.17(I)* | Separation Agreement, between Tom Jenneman and California Pizza Kitchen, Inc., dated August 2, 2003 | |
65
Table of Contents
| 10.18(J) | Amended and Restated Credit Agreement dated as of June 30, 2004 between California Pizza Kitchen, Inc. and Bank of America, N.A. | |
| 10.19(J) | Form of Note issued from Bank of America, N.A. by California Pizza Kitchen, Inc. dated June 30, 2004 | |
| 10.20(L)* | California Pizza Kitchen, Inc. 2004 Omnibus Incentive Compensation Plan | |
| 10.21(M)* | Form of option agreement under the California Pizza Kitchen, Inc. 2004 Omnibus Incentive Compensation Plan | |
| 10.22(N)* | Form of restricted stock agreement under the California Pizza Kitchen, Inc. 2004 Omnibus Incentive Compensation Plan | |
| 10.23(N)* | Employment Agreement between California Pizza Kitchen, Inc. and Richard L. Rosenfield, dated April 11, 2005 | |
| 10.24(N)* | Employment Agreement between California Pizza Kitchen, Inc. and Larry S. Flax, dated April 11, 2005 | |
| 10.25(N)* | Employment Agreement between California Pizza Kitchen, Inc. and Susan M. Collyns, dated April 21, 2005 | |
| 10.26(N)* | Stock Purchase Agreement among California Pizza Kitchen, Inc., a Delaware corporation, and Richard L. Rosenfield, Larry S. Flax, or his successors in trust, as trustee of the Larry S. Flax Revocable Trust dated 6-18-02, as may be amended from time to time, Clint B. Coleman and Geraldine Wise, dated April 25, 2005 | |
| 10.27(O)* | The California Pizza Kitchen Executive Bonus Plan | |
| 10.28(P)* | Time Sharing Agreement between California Pizza Kitchen, Inc. and Richard L. Rosenfield, dated as of May 18, 2005 | |
| 10.29(P)* | Time Sharing Agreement between California Pizza Kitchen, Inc. and Larry S. Flax, dated as of May 18, 2005 | |
| 10.30(Q)* | Amendment No. 1 to Non-Qualified Stock Option Agreement between California Pizza Kitchen, Inc. and Larry S. Flax, dated November 23, 2005 | |
| 10.31(Q)* | Amendment No. 1 to Non-Qualified Stock Option Agreement between California Pizza Kitchen, Inc. and Richard L. Rosenfield, dated November 23, 2005 | |
| 10.32(Q)* | Amendment No. 1 to Non-Qualified Stock Option Agreement between California Pizza Kitchen, Inc. and Karen M. Settlemyer dated, November 18, 2005 | |
| 10.33(R)* | Summary of Changes to Annual Compensation of Certain Executive Officers | |
| 10.34(S) | Form of Indemnification Agreement | |
| 10.35(S) | First Amendment to Amended and Restated Credit Agreement, dated June 19,2006 | |
| 10.36(S) | Promissory Note payable to Bank of America, N.A. by the Company, dated June 19, 2006 | |
| 10.37(S) | Consent and Reaffirmation of Guaranty by CPK Management Company, dated June 19, 2006 | |
| 10.38(T) | Second Amendment to Amended and Restated Credit Agreement, dated January 30, 2008 | |
| 10.39(T) | Promissory Note payable to Bank of America, N.A. by the Company, dated January 30, 2008 | |
| 10.40(T) | Consent and Reaffirmation of Guaranty by CPK Management, dated January 30, 2008 | |
| 10.41(T) | Accelerated Stock Repurchase Agreement, dated January 31, 2008, by and between the Company and Bank of America, N.A. | |
66
Table of Contents
| 10.42(U) | Credit Agreement, dated May 7, 2008 | |
| 10.43(U) | Form of Promissory Note payable to Lenders, dated May 7, 2008 | |
| 10.44(V)* | First Amendment to California Pizza Kitchen, Inc. 2004 Omnibus Incentive Compensation Plan, dated December 15, 2008 | |
| 10.45(V)* | Sixth Amendment to California Pizza Kitchen, Inc. 1998 Stock-Based Incentive Compensation Plan dated December 15, 2008 | |
| 10.46(V)* | Amended and Restated Employment Agreement between California Pizza Kitchen, Inc. and Richard L. Rosenfield, dated December 31, 2008 | |
| 10.47(V)* | Amended and Restated Employment Agreement between California Pizza Kitchen, Inc. and Larry S. Flax, dated December 31, 2008 | |
| 10.48(V)* | Amended and Restated Employment Agreement between California Pizza Kitchen, Inc. and Susan M. Collyns, dated December 31, 2008 | |
| 10.49(V)* | Amended and Restated Employment Agreement between California Pizza Kitchen, Inc. and Rudy Sugueti, dated December 31, 2008 | |
| 10.50(W)* | Second Amended and Restated Employment Agreement between California Pizza Kitchen, Inc. and Susan M. Collyns, dated August 5, 2009 | |
| 10.51(X) | Trademark License Agreement between California Pizza Kitchen, Inc. and Kraft Pizza Company | |
| 10.52(Y)* | Second Amended and Restated Employment Agreement between California Pizza Kitchen, Inc. and Richard L. Rosenfield, dated April 8, 2010 | |
| 10.53(Y)* | Second Amended and Restated Employment Agreement between California Pizza Kitchen, Inc. and Larry S. Flax, dated April 8, 2010 | |
| 10.54(Y)* | First Amendment to Second Amended and Restated Employment Agreement between California Pizza Kitchen, Inc. and Susan M. Collyns, dated April 8, 2010 | |
| 10.55(Z)* | California Pizza Kitchen, Inc. Severance Plan | |
| 10.56(AA)* | California Pizza Kitchen, Inc. 2010 Executive Incentive Plan | |
| 21 | List of Subsidiaries | |
| 23 | Consent of Ernst & Young LLP, Independent Registered Public Accounting Firm | |
| 31.1 | Certification of Principal Executive Officer pursuant to Rule 13a-14 of the Securities Exchange Act of 1934, as adopted pursuant to Section 302 of the Sarbanes-Oxley Act of 2002 | |
| 31.2 | Certification of Principal Executive Officer pursuant to Rule 13a-14 of the Securities Exchange Act of 1934, as adopted pursuant to Section 302 of the Sarbanes-Oxley Act of 2002 | |
| 31.3 | Certification of Principal Financial Officer pursuant to Rule 13a-14 of the Securities Exchange Act of 1934, as adopted pursuant to Section 302 of the Sarbanes-Oxley Act of 2002 | |
| 32.1 | Certification of Principal Executive Officer pursuant to 18 U.S.C. Section 1350, as adopted pursuant to Section 906 of the Sarbanes-Oxley Act of 2002 | |
| 32.2 | Certification of Principal Executive Officer pursuant to 18 U.S.C. Section 1350, as adopted pursuant to Section 906 of the Sarbanes-Oxley Act of 2002 | |
| 32.3 | Certification of Principal Financial Officer pursuant to 18 U.S.C. Section 1350, as adopted pursuant to Section 906 of the Sarbanes-Oxley Act of 2002 | |
| * | Management contract or compensatory plan |
67
Table of Contents
| + | Confidential treatment has been requested with respect to the omitted portions of this exhibit, which portions have been filed separately with the Securities and Exchange Commission. The location of the omitted confidential information is indicated in the exhibit with asterisks (***) |
| (A) | Incorporated by reference to the registrant’s Registration Statement on Form S-1 (Registration 333-37778). |
| (B) | Incorporated by reference to the registrant’s Registration Statement on Form S-1 (Registration 333-53088). |
| (C) | Incorporated by reference to the registrant’s Quarterly Report on Form 10-Q filed May 14, 2001. |
| (D) | Incorporated by reference to the registrant’s Annual Report on Form 10-K filed March 14, 2003. |
| (E) | Incorporated by reference to the registrant’s Annual Report on Form 10-K filed March 12, 2004. |
| (F) | Incorporated by reference to the registrant’s Registration Statement on Form S-8 (Registration 333-112365). |
| (G) | Incorporated by reference to the registrant’s Quarterly Report on Form 10-Q filed May 2, 2003. |
| (H) | Incorporated by reference to the registrant’s Quarterly Report on Form 10-Q filed August 6, 2003. |
| (I) | Incorporated by reference to the registrant’s Quarterly Report on Form 10-Q filed November 6, 2003. |
| (J) | Incorporated by reference to the registrant’s Quarterly Report on Form 10-Q filed August 6, 2004. |
| (K) | Incorporated by reference to the registrant’s current report on Form 8-K filed December 22, 2004. |
| (L) | Incorporated by reference to the registrant’s Registration Statement of Form S-8 (Registration 333-121539). |
| (M) | Incorporated by reference to the registrant’s Annual Report on Form 10-K filed April 4, 2005. |
| (N) | Incorporated by reference to the registrant’s Quarterly Report on Form 10-Q filed May 13, 2005. |
| (O) | Incorporated by reference to the registrant’s Quarterly Report on Form 10-Q filed August 12, 2005. |
| (P) | Incorporated by reference to the registrant’s Quarterly Report on Form 10-Q filed November 14, 2005. |
| (Q) | Incorporated by reference to the registrant’s Current Report on Form 8-K filed November 25, 2005. |
| (R) | Incorporated by reference to the registrant’s Annual Report on Form 10-K filed March 17, 2006. |
| (S) | Incorporated by reference to the registrant’s current report on Form 8-K filed June 20, 2006. |
| (T) | Incorporated by reference to the registrant’s current report on Form 8-K filed February 1, 2008. |
| (U) | Incorporated by reference to the registrant’s Quarterly Report on Form 10-Q filed May 9, 2008. |
| (V) | Incorporated by reference to the registrant’s Annual Report on Form 10-K filed March 13, 2009. |
| (W) | Incorporated by reference to the registrant’s Quarterly Report on Form 10-Q filed August 7, 2009. |
| (X) | Incorporated by reference to the registrant’s Annual Report on Form 10-K filed March 19, 2010. |
| (Y) | Incorporated by reference to the registrant’s current report on Form 8-K filed April 13, 2010. |
| (Z) | Incorporated by reference to the registrant’s current report on Form 8-K filed April 22, 2010. |
| (AA) | Incorporated by reference to the registrant’s current report on Form 8-K filed October 6, 2010. |
68
Table of Contents
SIGNATURES
Pursuant to the requirements of Section 13 or 15(d) of the Securities Exchange Act of 1934, the registrant has duly caused this report to be signed on its behalf by the undersigned, thereunto duly authorized.
| Dated: March 17, 2011 | CALIFORNIA PIZZA KITCHEN, INC. | |||
| By: | /s/ LARRY S. FLAX | |||
| Larry S. Flax Co-Chairman of the Board, Co-Chief Executive Officer, Co-President and Director (Principal Executive Officer) | ||||
| By: | /s/ RICHARD L. ROSENFIELD | |||
| Richard L. Rosenfield Co-Chairman of the Board, Co-Chief Executive Officer, Co-President and Director (Principal Executive Officer) | ||||
| By: | /s/ SUSAN M. COLLYNS | |||
| Susan M. Collyns Chief Financial Officer, Chief Operating Officer, Executive Vice President and Secretary (Principal Financial Officer) | ||||
Pursuant to the requirements of the Securities Exchange Act of 1934, this report has been signed below by the following persons on behalf of the registrant and in the capacities and on the dates indicated.
| Signature |
Title |
Date | ||
| /S/ LARRY S. FLAX Larry S. Flax |
Co-Chairman of the Board, Co-Chief Executive Officer, Co-President and Director (Principal Executive Officer) |
March 17, 2011 | ||
| /S/ RICHARD L. ROSENFIELD Richard L. Rosenfield |
Co-Chairman of the Board, Co-Chief Executive Officer, Co-President and Director (Principal Executive Officer) |
March 17, 2011 | ||
| /S/ SUSAN M. COLLYNS Susan M. Collyns |
Chief Financial Officer, Chief Operating Officer, Executive Vice President and Secretary (Principal Financial Officer) |
March 17, 2011 | ||
| /S/ TODD B. SLAYTON Todd B. Slayton |
Chief Accounting Officer and Senior Vice President, Corporate Finance (Principal Accounting Officer) |
March 17, 2011 | ||
| /S/ LESLIE E. BIDER Leslie E. Bider |
Director | March 17, 2011 | ||
69
Table of Contents
| Signature |
Title |
Date | ||
| /S/ MARSHALL S. GELLER Marshall S. Geller |
Director | March 17, 2011 | ||
| /S/ CHARLES G. PHILLIPS Charles G. Phillips |
Director | March 17, 2011 | ||
| /S/ ALAN I. ROTHENBERG Alan I. Rothenberg |
Director | March 17, 2011 | ||
70