Attached files
Table of Contents
U.S. SECURITIES AND EXCHANGE COMMISSION
Washington, D.C. 20549
FORM 10-K
ANNUAL REPORT PURSUANT TO SECTION 13 OR 15(d) OF THE SECURITIES ACT OF 1934
FOR THE FISCAL YEAR ENDED JANUARY 1, 2011
Commission file number 0-14800
X-RITE, INCORPORATED
(Name of registrant as specified in charter)
| Michigan | 38-1737300 | |
| (State of Incorporation) | (I.R.S. Employer Identification No.) |
4300 44th Street S.E., Grand Rapids, Michigan 49512
(Address of principal executive offices)
616-803-2100
(Registrant’s telephone number, including area code)
Securities registered pursuant to Section 12(b) of the Act:
| Title of each class |
Name of each exchange on which registered | |
| Common Stock, $.10 par value | NASDAQ Global Select Market |
Securities registered pursuant to Section 12(g) of the Act: None
Indicate by check mark if the registrant is a well-known seasoned issuer, as defined in Rule 405 of the Securities Act of 1933. ¨ Yes x No
Indicate by check mark if the registrant is not required to file reports pursuant to Section 13 or Section15 (d) of the Securities Exchange Act of 1934. ¨ Yes x No
Indicate by check mark whether the registrant (1) has filed all reports required to be filed by Section 13 or 15(d) of the Securities Exchange Act of 1934 during the preceding 12 months (or for such shorter period that the registrant was required to file such reports), and (2) has been subject to such filing requirements for the past 90 days. Yes x No ¨
Indicate by checkmark whether the registrant has submitted electronically and posted on its corporate Web site, if any, every Interactive Data File required to be submitted and posted pursuant to Rule 405 of Regulation S-T (Section 232.405 of this chapter) during the preceding 12 months (or for such shorter period that the registrant was required to submit and post such files). Yes ¨ No ¨
Indicate by check mark if disclosure of delinquent filers pursuant to Item 405 of Regulation S-K (§229.405 of this chapter) is not contained herein, and will not be contained, to the best of registrant’s knowledge, in definitive proxy or information statements incorporated by reference in Part III of this Form 10-K or any amendment to this Form 10-K. x
Indicate by check mark whether the registrant is a large accelerated filer, an accelerated filer, or a non-accelerated filer, or a smaller reporting company. See definitions of “large accelerated filer,” “accelerated filer,” and “smaller reporting company” in Rule 12b-2 of the Exchange Act.
Large accelerated filer ¨ Accelerated filer x Non-accelerated filer ¨ Smaller reporting company ¨
Indicate by check mark whether the registrant is a shell company (as defined in Rule 12b-2 of the Act). ¨ Yes x No
On March 3, 2011, the number of outstanding shares of the registrant’s common stock, par value $.10 per share, was 85,912,620.
The aggregate market value of the common stock held by non-affiliates of the registrant (i.e., excluding shares held by executive officers, directors and control persons as defined in Rule 405, 17 CFR 230.405) as of July 2, 2010, the last business day of the second quarter of the Company’s fiscal year, was $313,929,903 computed at the closing price on that date.
Portions of the Company’s Proxy Statement for the 2011 Annual Meeting of Shareholders are incorporated by reference into Part III. Exhibit Index is located at Page 82.
Table of Contents
FORM 10-K
X-Rite, Incorporated
For The Year Ended January 1, 2011
| Part |
Topic |
Page |
||||
| Part I |
||||||
| Item 1 |
1 | |||||
| Item 1A |
7 | |||||
| Item 1B |
12 | |||||
| Item 2 |
13 | |||||
| Item 3 |
13 | |||||
| Item 4 |
14 | |||||
| 14 | ||||||
| Part II |
||||||
| Item 5 |
15 | |||||
| Item 6 |
17 | |||||
| Item 7 |
Management’s Discussion and Analysis of Financial Condition and Results of Operations |
18 | ||||
| Item 7A |
36 | |||||
| Item 8 |
37 | |||||
| Item 9 |
Changes in and Disagreements with Accountants on Accounting and Financial Disclosures |
76 | ||||
| Item 9A |
76 | |||||
| Item 9B |
76 | |||||
| Part III |
||||||
| Item 10 |
Directors, Executive Officers of the Registrant, and Corporate Governance |
77 | ||||
| Item 11 |
77 | |||||
| Item 12 |
Security Ownership of Certain Beneficial Owners and Management and Related Stockholder Matters |
77 | ||||
| Item 13 |
Certain Relationships and Related Transactions, and Director Independence |
78 | ||||
| Item 14 |
78 | |||||
| Part IV |
||||||
| Item 15 |
79 | |||||
| 80 | ||||||
| 82 | ||||||
Table of Contents
PART I
| ITEM 1. | BUSINESS |
X-Rite, Incorporated (X-Rite, the Company, our, we, or us) is a global leader in color science and color technology. The Company develops, manufactures, markets and supports innovative color solutions through measurement instrumentation systems, software, color standards and services, as described below in the product overview section. X-Rite’s expertise in inspiring, selecting, measuring, formulating, communicating and matching color helps users get color right the first time and every time, which translates to better quality and reduced costs. X-Rite serves a range of markets including printing, packaging, photography, graphic design, video, automotive, paints, plastics, textiles, dental and medical. We serve these markets through our core product lines of Imaging and Media, Industrial, Standards, Support, Retail and Other. A more detailed discussion of our major markets and product line offerings appears below.
Products are sold worldwide through the Company’s own sales personnel and through independent sales representatives and dealers. The Company is headquartered in Grand Rapids, Michigan and has other domestic operations in New Jersey, North Carolina, and Massachusetts. In addition, the Company has locations in Switzerland, Germany, England, France, Italy, Spain, the Czech Republic, Russia, China, Hong Kong, and Japan. Manufacturing facilities are located in the United States, Switzerland, and Germany.
X-Rite was organized in 1958 as a Michigan corporation and completed its initial public offering of common stock in April of 1986. The Company has historically grown organically through investment in new products and our existing business and in more recent years our growth has been driven by investing in international expansion and strategic acquisitions.
| • | Product Innovation |
Product innovation is a key success factor to our ability to remain competitive in the color management industry. In 2010, we introduced nine new products and six major product upgrades. We also devoted resources to developing customer-specific solutions for eight of our customers. In 2010, we spent approximately eleven percent of our revenues on engineering, research, and development. Our focus continues to center on color management solutions that incorporate software, hardware, standards, and services.
| • | International Growth |
With offices in eleven countries outside the U.S. and service centers across Europe, Asia, and the Americas, we continue to expand our ability to conduct business with customers around the world. The Company began to accelerate its global presence in 1993 with the establishment of sales and service subsidiaries in several locations throughout Europe and Asia. In 2006 and 2007, we expanded our global presence even further through the acquisitions of Amazys Holding AG and Pantone Inc., respectively. In 2010, 2009, and 2008 international sales represented 66.9, 64.7, and 67.2 percent of total revenue, respectively.
| • | Amazys Holding AG Acquisition |
We completed the acquisition of Amazys Holding AG (Amazys) on July 5, 2006 for $306.7 million. With significant international operations, Amazys was based in Switzerland and developed, marketed, and supported hardware, software, and services to measure and communicate color for the imaging and media, photography, digital imaging, plastics, apparel, textiles, and automotive industries. Prior to the acquisition, Amazys was X-Rite’s largest direct competitor. Subsequent to the acquisition of Amazys, X-Rite became the leader in the color management industry, and we established our European headquarters in Regensdorf, Switzerland.
1
Table of Contents
| • | Pantone, Inc. Acquisition |
We completed the acquisition of Pantone, Inc. (Pantone) on October 24, 2007 for $175.9 million. The Pantone product offerings were and continue to be a leader in color inspiration, communication and specification standards in the creative design industries. The PANTONE® products represent a key color standard in the graphic arts, printing, publishing and advertising industries. Pantone also provides color standards and design tools for the fashion, home furnishings, architecture, paint, industrial design and interior design industries. With the addition of the Pantone business, X-Rite was able to expand the global reach and breadth of our product offerings into new industries and established significant international recognition by incorporating the PANTONE® trade name into the X-Rite corporate brand.
In connection with the completion of the aforementioned acquisitions, the Company identified a series of operational and organizational restructuring necessary to realign the Company, realize operational synergies of the acquisitions, and continue to remain competitive across all facets of the color management industry. While the need for these initiatives was clearly identified, the timing became critical in lieu of the global economic downturn that ensued in 2008. From the onset of the restructuring activities in 2006 through the end of 2010 the Company incurred approximately $28.7 million in restructuring charges. These charges relate to the synergies realized as part of our acquisition and integration, cost containment actions taken as a result of the global economic recession, and other actions to align our global entity and tax structure.
The debt load incurred as a result of the acquisitions coupled with the economic recession resulted in the Company experiencing covenant defaults on its credit facilities and it was required to complete a Corporate Recapitalization Plan in 2008. Under this plan, the Company was able to raise $155 million in capital through the issuance of additional shares of its common stock. Subsequently, in the fall of 2009, the Company entered into an exchange agreement to effectively convert $41.6 million of the outstanding second lien term loan for 41,561 newly issued Series A Preferred Stock (mandatorily redeemable preferred stock or MRPS) with a stated value of $1,000. The MRPS entitled the holders to dividends at a fixed annual rate of 14.375 percent and included the issuance of warrants to acquire 7.5 million shares of common stock at an exercise price of $0.01 per share. Furthermore, in the fall of 2010, the Company extinguished the second lien credit agreement with cash on hand of $9.9 million and borrowings under the first lien revolving credit facility of $16.5 million. As the condition of the global economy began to improve in 2009 and 2010, the Company has since been able to start realizing the benefits of the restructuring activities discussed above and have seen significant growth in sales in 2010 across all significant markets. With this improved operations performance the Company was able to meet all financial covenants at the 2010 and 2009 year ends.
PRODUCT OVERVIEW
Measurement Instrumentation
| • | Colorimeters measure light much like the human eye using red, green and blue receptors and are utilized to measure printed colors on packages, labels, textiles and other materials where a product’s appearance is critical for buyer acceptance. |
| • | Spectrophotometers offer more precision than colorimeters; they measure light at more points over the entire visible spectrum. The increased precision of spectrophotometers make them useful in predicting color formulation for many types of materials such as plastics, paints, inks, ceramics and metals. The Company offers different optical geometries of spectrophotometers as well as application types from bench-top models, to portables to non-contact versions. Each variation provides specific benefits for the wide variety of markets served, whether it is a portable multi-angle for an automotive paint or a bench-top sphere geometry for a textile application or a non-contact single angle spectrophotometer for cosmetics, the specific device and accompanying software provide solutions for management of color and appearance in almost any application where color is found. |
2
Table of Contents
| • | Densitometers are instruments that measure optical or photographic density, compare such measurement to a reference standard, and signal the result to the operator of the instrument. Some models are designed for use in controlling variables in the processing of x-ray film in medical and non-destructive testing applications. Other models are designed to be used to control process variables in the production of photo-transparencies, such as photographic film and microfilm, or measure the amount of light that is reflected from a surface, such as ink on paper. |
| • | Spectrodensitometers combine the function of a densitometer with the functions of a colorimeter and a spectrophotometer to provide measurements for monitoring color reproduction used for controlling the color of printed inks in graphic arts applications. |
| • | Sensitometers are used to expose various types of photographic film in a very precise manner for comparison to a reference standard. The exposed film is processed and then “read” with a densitometer to determine the extent of variation from the standard. |
Software
The Company provides software and databases that interface with its color measurement instruments and other process equipment. These software packages allow the user to collect and store color measurement data, compare that data to established standards and databases, communicate color results and formulate colors from a database.
Standards Products
The Standards product line embodies products for the accurate communication and reproduction of color, digitally or in print. These products establish color standardization and are used by customers worldwide in a variety of industries including imaging and media, textiles, digital technology, plastics, paint, medical, and food.
Services
Support Services provides customers access to color professional specialists, training, and technical support worldwide through color seminars, classroom workshops, on-site consulting, and interactive media development. Support Services additionally provides service repair operations that specialize in repairing all X-Rite equipment.
MAJOR MARKETS AND PRODUCT LINES
As noted above, the Company operates across a broad spectrum of markets including printing, packaging, photography, graphic design, video, automotive, paints, plastics, textiles and medical. These markets are generally categorized to align with our six core product line offerings as outlined below. A key to the Company’s success is our ability to integrate our products and solutions across the various industries of a product life cycle to improve the color management process from the inception of a design, through the manufacturing process, and end user experience.
Imaging and Media
The Imaging and Media product line consists of Digital Imaging and Printing.
The Digital Imaging product line consists of solutions for graphic designers, photo processing, photography, graphic design, pre-press service bureaus, and a myriad of calibration tools for image setters, raster image processors, and other digital applications. Our color management systems give designers control of scanned artwork, images captured with a digital camera, desktop printers, high-end proofers and commercial presses that translate color from one device to the next. These solutions work to create value at key stages of the workflow by reducing waste, increasing productivity and enhancing quality.
3
Table of Contents
The Printing product line supports both digital and traditional printing. X-Rite’s color-calibrated instruments, digital palettes, and output measurement devices support color communication for the entire printing and preprinting process, reducing set up time and eliminating the opportunity for costly mistakes. Our handheld products are straightforward, self-contained solutions that keep color on-target in the pre-press process, ink lab and pressroom. X-Rite’s automated scanning systems support the need for faster and more frequent color data collection.
Industrial
Our Industrial product line is concentrated in the quality and process control markets. We design, develop, and manufacture precision instrumentation, software, and systems for global manufacturers, fulfilling a need to measure color for formulation, quality, and process control for paint, plastics, and textiles. Accurate color reproduction and global supply chain management offer these manufacturers and businesses a competitive advantage, and are important factors when products are assembled from parts made around the world. X-Rite’s industrial product solutions are designed to reduce waste, increase production uptime, improve process management, and enable global color communication.
Standards
The Standards product line provides for the accurate communication and reproduction of color. The PANTONE® products represent a key color standard in the home fashion and design industries, serving the graphic arts, printing, publishing, advertising, paint, and textiles markets. The Standards product line also embodies the Munsell Color System, which is a scientifically based color order system that is used to define color based on the three attributes of color: hue, value, and chroma.
Support Services
Our Support Services market provides customers access to color professional specialists, training, and technical support worldwide through color seminars, classroom workshops, on-site consulting, and interactive media development. Our Support Services business provides both major manufacturers and end users with comprehensive solutions for their color and workflow problems. Support Services additionally operates and manages the Company’s service repair operation with facilities around the world and specializes in repairing all X-Rite equipment. The products repaired by the service department include products currently covered by our warranty program as well as those products which are out of warranty.
Retail
X-Rite’s Retail product line consists of paint matching. The paint matching market is conducted under the name of MatchRite. X-Rite is a leading supplier of retail paint matching systems for home centers, mass merchants, hardware stores and paint retailers in North America, and has established a strong presence in Europe and other regions of the world. X-Rite’s Retail customers rely on its strength in color measurement instrumentation, database creation and management, custom software development, and large scale account servicing. These solution-based products reduce paint inventory for the retailer and provide a user-friendly environment for sophisticated shade matching capabilities to the consumer.
Other
Medical and Dental—X-Rite serves the medical x-ray market’s imaging needs and provides instrumentation designed for use in controlling variables in the processing of x-ray film. Additionally, we manufacture restorative tooth shade matching instruments and complementary software packages that are designed for use in cosmetic dental practices.
4
Table of Contents
OTHER INFORMATION
Manufacturing, Sourcing and Service
We manufacture the majority of our products at our facilities in Michigan, New Jersey, and Switzerland. We generally have multiple sources for raw materials, supplies and components but also have some materials that are single sourced. These consist primarily of electrical and molded plastic components which are generally widely available in the market. We rely on a number of strategic supply chain partners to produce key components or sub-assemblies that support our final assembly, calibration, and test process as well as our finished products. Product repair and service is provided at eleven locations throughout the world.
Competition
Our business is competitive and subject to technological change, evolving customer requirements, and changing business models. We face strong competition in many areas of our current business activities. The rapid pace of technological change creates new opportunities for both our existing competitors as well as start-ups. Moreover, the rise of new industry alliances, and mergers and acquisitions can dramatically change our competitive landscape and can result in competitors with significant resources in research and development, marketing and sales. Customer requirements change quickly as a result of new and more cost efficient technologies. We face direct competition from approximately ten firms which are producing competing products in the Imaging and Media category, approximately eight manufacturers of competing products in the Retail and Industrial markets, and approximately four distributors in the Standards industry; some of whom have significant access to resources. The primary base of competition for all the Company’s products is technology and intellectual property, design, service, and price. Our competitive position may be adversely affected in the future by one or more of the factors described in this section.
Employees
As of January 1, 2011 and January 2, 2010, the Company employed 746 and 753 people on a full time basis, of which 481 and 484, respectively, were in the United States. We believe we have generally good relationships with our employees.
Patents
As of January 1, 2011, X-Rite owned 174 patents and had 80 patent applications on file. While the Company follows a policy of obtaining patent protection for its products where appropriate, it does not believe that the loss of any existing patent, or failure to obtain any new patents, would have a material adverse impact on its current operations. We expect to protect our products and technology by asserting our intellectual property rights where appropriate and prudent.
Distribution Networks
The Company’s products are sold by its own sales personnel and through independent manufacturer’s representatives. Certain products not sold directly to end-users are distributed through a network of independent dealers throughout Europe, Asia Pacific and the Americas.
Seasonality
The Company’s business is generally not subject to seasonal variations that significantly impact sales, production, or net income.
5
Table of Contents
Significant Customers
In 2010 and 2009, the Company did not have any customers which accounted for greater than 10 percent of consolidated net sales. One significant customer, Heidelberger Druckmaschinen AG, accounted for $32.0 million or 12.2 percent, of total net sales in 2008.
Backlog
The Company’s estimated backlog of scheduled but unshipped orders was $20.9 million as of January 29, 2011 and $17.3 million as of January 30, 2010. This backlog is expected to be utilized during the current fiscal year.
Research, Development and Engineering
During 2010, 2009, and 2008, the Company expensed $23.7, $22.6, and $29.4 million, respectively, on research, development, and engineering.
In addition to the research, development, and engineering costs reported as operating expenses, certain costs to develop new software products were capitalized in each of the last three years. Software development costs capitalized totaled $6.5, $4.4, and $4.0 million in 2010, 2009, and 2008, respectively. The related amortization expense was included in cost of sales (see Note 1 to the Consolidated Financial Statements).
Financial Information About Segments and Geographic Areas
We operate and generate revenue as one segment in the color management industry. For further discussion of our segment reporting, see Note 2 to the Consolidated Financial Statements accompanying this Report.
We operate in the geographic areas described above under Item 1, “Business.” For additional information regarding our revenue and long-lived assets by geographic area, see Note 2 to the Consolidated Financial Statements accompanying this Report. For information regarding risks relating to our foreign operations, see Item 1A, “Risk Factors” in this Report.
Regulatory and Environmental Matters
We are subject to federal, state, local and foreign laws, rules and regulations that govern activities that may have adverse environmental effects and which impose liability for compliance and clean-up costs resulting for the discharge, handling, storage and disposal of hazardous wastes and substances. Compliance with these laws, rules and regulations has not had, and is not expected to have, a material effect on our business, results of operations or financial condition.
Availability of Information
X-Rite’s internet website is www.xrite.com. X-Rite’s Annual Reports on Form 10-K, Quarterly Reports on Form 10-Q, Current Reports on Form 8-K and amendments to those reports filed or furnished pursuant to section 13(a) or 15(d) of the Exchange Act are available free of charge through our website as soon as reasonably practicable after we electronically file with or furnish them to the Securities and Exchange Commission.
6
Table of Contents
| ITEM 1A | RISK FACTORS |
There are many risk factors that may adversely affect the Company’s operating results, including the following significant risks. See also the Notes to the Consolidated Financial Statements located herein at Item 8 for additional risks that may affect the Company.
Our future results could be harmed by economic, political, geographic, regulatory and other specific risks associated with international operations.
During fiscal 2010, we derived approximately 66.9 percent of our total revenues from sales of our products outside of the United States, compared with 64.7 percent during fiscal 2009 and 67.2 percent during fiscal 2008. Substantially all of our foreign generated revenues were denominated in Swiss Francs, Euros, British Pound Sterling, or Chinese Yuan. The United States dollar value of our foreign generated revenues varies with currency exchange rate fluctuations. Significant increases in the value of the United States dollar relative to other currencies could have a material adverse effect on our results of operations. We address currency risk management through regular operating and financing activities. We currently have no hedging or similar foreign currency contracts to mitigate the risk of exchange rate fluctuations. Fluctuations in the value of foreign currencies could adversely impact the profitability of our foreign operations. We intend to continue to pursue growth opportunities in sales internationally, which could expose us to greater risks associated with international sales and operations. There can be no assurance that we will maintain or expand our international sales. If the revenues generated from international activities, especially in emerging markets, are inadequate to offset the expense of maintaining such international operations, our business, financial condition and results of operations could be materially and adversely affected. The increasingly international reach of our businesses could also subject us and our results of operations to unexpected, uncontrollable and rapidly changing economic and political conditions. Specifically, international sales and operations are subject to inherent risks, including:
| • | lack of experience in a particular geographic market; |
| • | tariffs and other barriers, including import and export requirements, taxes on subsidiary operations and investment restrictions or requirements; |
| • | different and changing regulatory requirements in various countries and regions; |
| • | fluctuating exchange rates and currency controls; |
| • | difficulties in staffing and managing foreign sales and support operations; |
| • | longer accounts receivable payment cycles; |
| • | potentially adverse tax consequences, including repatriation of earnings; |
| • | diminished protection of intellectual property in some countries outside the U.S.; |
| • | development and support of localized and translated products; |
| • | lack of acceptance of localized products or X-Rite in foreign countries; |
| • | differing local product preferences and product requirements; |
| • | labor force instability, including possible shortages of skilled personnel required for local operations; |
| • | exposure to local economic conditions; and |
| • | political, economic, and civil instability, such as perceived or actual public health, terrorist risks, violence, civil unrest, or outbreaks of war which impact a geographic region and business operations therein. |
As we expand our international operations, we may encounter new risks. For example, as we focus on building our international sales and distribution networks in new geographic regions, we must continue to develop relationships with qualified local distributors and trading companies. If we are not successful in developing these relationships, we may not be able to grow sales in these geographic regions.
7
Table of Contents
Our debt level and the inability to access capital markets could adversely affect our operating flexibility and put us at a competitive disadvantage.
As of January 1, 2011, the Company had $136.6 million of first lien and revolving debt and $36.4 million of mandatorily redeemable preferred stock, net of warrant discount of $10.6 million. This amount of debt and payment obligations with respect to our preferred stock will require significant interest and principal payments. Our level of debt and the limitations imposed on us by our credit agreements and the terms of our preferred stock could adversely affect our operating flexibility and put us at a competitive disadvantage. Our debt level and the terms of our preferred stock may adversely affect our future performance, because, among other things:
| • | We may be placed at a competitive disadvantage relative to our competitors, some of which have lower fixed payment obligations and greater financial resources than we do; |
| • | Our ability to complete future acquisitions may be limited; |
| • | We will have to use a portion of our cash flow for debt service and satisfying our payment obligations with respect to our preferred stock rather than for investment in research and development and capital expenditures; |
| • | We may not be able to obtain further debt financing and/or we may have to pay more for such additional financing as we are able to obtain; |
| • | We may not be able to take advantage of business opportunities; and |
| • | We will be more vulnerable to adverse economic conditions. |
The senior credit facilities contain certain covenants applicable to us and our subsidiaries that may adversely affect our ability to create liens, incur indebtedness, make certain investments or acquisitions, pay dividends, repurchase shares, enter into certain transactions with affiliates, incur capital expenditures beyond prescribed limits and that require us to deliver certain reports and information, and meet certain financial ratios. In addition, the terms of our preferred stock contain certain covenants applicable to us and our subsidiaries that may adversely affect our ability to create new classes of equity securities, incur indebtedness, pay dividends, or repurchase shares.
Our ability to make scheduled payments of principal of, to pay interest on, or to refinance our indebtedness and to satisfy our payment obligations with respect to our preferred stock will depend upon our future operating performance and cash flows, which may be affected by factors beyond our control. In addition, there can be no assurance that we will be able to access the capital markets to obtain future debt or equity financing on commercially reasonable terms or at all in connection with the repayment or refinancing of our indebtedness. If we are unable to service our indebtedness or satisfy our payment obligations with respect to our preferred stock, these obligations could be accelerated, thereby causing our business, financial condition and results of operations to be materially adversely affected. Additionally, if one or more rating agencies downgrade our credit rating, we may have difficulty obtaining additional financing, refinancing existing indebtedness and/or our cost of obtaining additional financing or refinancing existing indebtedness may be increased significantly.
If we fail to attract, hire and retain qualified personnel, we may not be able to design, develop, market or sell our products or successfully manage our business.
Our operations and the development of new products require expertise. In addition, our ability to attract new customers, retain existing customers and pursue our strategic objectives depends on the continued services of our current management, sales, product development and technical personnel and our ability to identify, attract, train and retain similar personnel. Competition for top management personnel is intense and we may not be able to recruit and retain the personnel we need if we are unable to offer competitive compensation and benefits. The loss of any one of our management personnel, or our inability to identify, attract, train, retain and integrate additional qualified management personnel, could make it difficult for us to manage our business successfully and pursue our strategic objectives. We do not carry key person life insurance on any of our employees. Similarly, competition for skilled sales, product development and technical personnel is intense and we may not
8
Table of Contents
be able to recruit and retain the personnel we need. The loss of the services of key sales, product development and technical personnel, or our inability to hire new personnel with the requisite skills, could restrict our ability to develop new products or enhance existing products in a timely manner, sell products to our customers or manage our business effectively.
If we are unable to protect our intellectual property rights, our business and prospects may be harmed.
We have made significant expenditures to develop and acquire technology and intellectual property rights. We actively patent and trademark these properties when deemed appropriate and will vigorously defend them against infringement. Our failure to protect our intellectual property could seriously harm our business and prospects because developing new products and technologies is critical to our success. We will incur substantial costs in obtaining patents and, if necessary, defending our intellectual propriety rights. We do not know whether we will obtain the patent protection we seek, or that the protection we do obtain will be found valid and enforceable if challenged. Our efforts to protect our intellectual property through patents, trademarks, service marks, domain names, trade secrets, copyrights, confidentiality and nondisclosure agreements and other measures may not be adequate to protect our proprietary rights. Patent filings by third parties could render our intellectual property less valuable. Disputes may arise as to ownership of our intellectual property or as to whether products designed by our competitors infringe our intellectual property rights. Employees, consultants and others who participate in developing our products may breach their agreements with us regarding our intellectual property, and we may not have adequate remedies for the breach. In addition, intellectual property rights may be unavailable or limited in some foreign countries, which could make it easier for competitors to capture market position. Competitors may also capture market share from us by designing products that mirror the capabilities of our products or technology without infringing on our intellectual property rights. In addition, as sales of our products continue to grow internationally, our exposure to intellectual property infringements in countries where intellectual property rights protections are less stringent will increase. If we do not obtain sufficient international protection for our intellectual property, our competitiveness in international markets could be impaired, which would limit our growth and future revenue.
We may be subject to intellectual property litigation and infringement claims, which could cause us to incur significant expenses or prevent us from selling our products.
A successful claim of patent or other intellectual property infringement against us could adversely affect our growth and profitability, in some cases materially. We cannot assure you that others will not claim that our proprietary or licensed products are infringing on their intellectual property rights or that we do not in fact infringe on those intellectual property rights. From time to time, we receive notices from third parties of potential infringement and receive claims of potential infringement. We may be unaware of intellectual property rights of others that may cover some of our technology. If someone claims that our products infringed on their intellectual property rights, any resulting litigation could be costly and time consuming and would divert the attention of management and key personnel from other business issues. The complexity of the technology involved and the uncertainty of intellectual property litigation increase these risks. Claims of intellectual property infringement also might require us to enter into costly royalty or license agreements or to modify our products. We also may be subject to significant damages or an injunction preventing us from manufacturing, selling or using some of our products in the event of a successful claim of patent or other intellectual property infringement. Any of these adverse consequences could have a material adverse effect on our business, financial condition and results of operations.
The markets for our products and services are highly competitive. If we are unable to compete effectively with existing or new competitors, our business could be negatively impacted.
The markets in which we compete are very competitive and subject to technological change, evolving standards, frequent product enhancements and introductions and changing customer requirements. A number of companies offer products and services that are similar to those offered by us and that target the same markets. In
9
Table of Contents
addition, any of these competitors may be able to respond more quickly to new or emerging technologies and changes in customer requirements, and to devote greater resources to the development, promotion and sale of their products than us. Our competitors may develop products and services that compete with those offered by us or may acquire companies, businesses and product lines that compete with us. It also is possible that competitors may create alliances and rapidly acquire significant market share, including in new and emerging markets. If we are not able to differentiate our products and services in the market, competitive pressures may potentially impact our sales volumes, pricing structure, gross margin, operating expenses and operating income.
Accordingly, there can be no assurance that current or potential competitors of X-Rite will not develop or acquire products or services comparable or superior to those that we develop, combine or merge to form significant competitors, or adapt more quickly than us to new technologies, evolving industry trends and changing customer requirements. Competition could cause price reductions, reduced margins or loss of market share for our products and services, any of which could materially and adversely affect our business, operating results and financial condition. There can be no assurance that we will be able to compete successfully against current and future competitors or that the competitive pressures that the company may face will not materially adversely affect our business, operating results, cash flows and financial condition.
We may be affected by environmental laws and regulations.
We are subject to a variety of laws, rules and regulations relating to discharges of substances into the air, water and land, the handling, storage and disposal of wastes and the cleanup of properties necessitated by pollutants. Any of those regulations could require us to acquire expensive equipment or to incur substantial other expenses to comply with them. If we incur substantial additional expenses, product costs could significantly increase. Also, if we fail to comply with present or future environmental laws, rules and regulations, such failure could result in fines, suspension of production or cessation of operations.
Our reliance on outsourced manufacturing presents risks to our fulfillment process.
We rely on a number of strategic supply chain partners to produce key components or sub-assemblies that support our final assembly, calibration, and test process. Some of these suppliers are small companies, single sourced which may experience adverse financial conditions and therefore present risks to our fulfillment process.
We depend on new product development to compete effectively.
We have made large investments in new products and services. There are no assurances as to when future revenues from these products will be received, or that the ultimate profit margins received will be adequate to justify the investment.
Continual development of new products, technologies, and enhancements to existing products is a core component of our long-term growth plans. Our future business, financial condition and results of operations will depend to a significant extent on our ability to develop new products and services that address these market opportunities. As a result, we believe that significant expenditures for research, development and engineering will continue to be required in the future. Product development requires a time-consuming and costly research and development process. Unexpected delays in this process may significantly affect the timing of future revenues and increase costs. We must anticipate the features and functionality that customers will demand, incorporate those features and functionality into products, price our products competitively and introduce new products to the market on a timely basis. We cannot assure you that the products we expect to introduce will incorporate the features and functionality demanded by our customers, will be successfully developed, or will be introduced within the appropriate window of market demand. If there are delays in production of current or new products, our potential future business, financial condition, and results of operations could be adversely affected. In addition, the time required for competitors to develop and introduce competing products may be shorter, their manufacturing yields may be better, and their production costs may be lower than those experienced by us.
10
Table of Contents
Adverse general economic and industry conditions could adversely affect our revenues and profitability.
Adverse general economic and industry conditions could lead to declines in the use of our products by our customers and a decline in sales. Many of our products are used for quality control purposes within a larger manufacturing or production process by customers who have been or may be impacted by adverse economic and market conditions. As such, our sales in some instances are linked to capital goods spending. Another economic slowdown or adverse global economic or industry conditions generally could result in a decrease in capital goods spending, sales and thereby adversely affect our revenues and profitability. In addition, accounts receivable and past due accounts could increase due to a decline in our customers’ ability to pay as a result of adverse economic and market conditions which also could adversely affect our financial performance.
We may face potential tax liabilities.
We are subject to taxation in many jurisdictions in the United States, Europe, Asia and elsewhere. In the ordinary course of business, there are transactions and calculations where the ultimate tax liability cannot be determined with certainty at the time the transaction is entered into. Preparation of our income tax provision requires the use of judgments as to how these transactions will ultimately be taxed. We believe our tax accruals are accurate though the ultimate determination of these issues may be different from that which is reflected in our historical provision and accruals. Should these determinations be different from what is previously recorded and additional tax is assessed, those assessments would be recorded in the period in which they occur.
The Company’s reliance on a small number of primary manufacturing centers may affect timely production and profitability.
Manufacturing and service of much of our core color products are performed at our headquarters facility in Grand Rapids, Michigan, and in our Regensdorf, Switzerland and Carlstadt, New Jersey facilities. Should a catastrophic event occur at any of these facilities, our ability to manufacture products, complete existing orders, and provide other services could be adversely impacted for an undetermined period of time. Although we have purchased business interruption insurance to cover the costs of certain catastrophic events, there is no assurance that such insurance could be adequate to cover the losses we may incur from any such disruption or event. In addition, our inability to conduct normal business operations for a period of time could have an adverse impact on the short-term and long-term operating results.
Impairment charges relating to our goodwill, indefinite lived intangibles, and long-lived assets could adversely affect our financial performance.
We regularly monitor our goodwill, indefinite lived intangibles, and long-lived assets for impairment indicators using the fair value of our reporting unit and the undiscounted cash flows expected to be generated from the long-lived assets. Changes in economic or operating conditions impacting our estimates and assumptions could result in the impairment of our goodwill, indefinite lived intangibles, or long-lived assets. In the event that we determine that our goodwill, indefinite lived intangibles, or long-lived assets are impaired, we may be required to record a significant charge to earnings that could adversely affect our financial condition and operating results.
We are involved from time to time in various legal and regulatory proceedings and claims, which could adversely affect our financial performance.
We are involved in various legal and regulatory proceedings and claims from time to time that could be significant. These are typically claims that arise in the normal course of business including, without limitation, commercial or contractual disputes, including disputes with our customers, suppliers or competitors, intellectual property matters, personal injury claims, tax matters and employment matters. No assurance can be given that such proceedings and claims will not adversely affect our financial condition, operating results and cash flows.
11
Table of Contents
New laws or regulations or changes in existing laws or regulations could adversely affect our financial performance.
We are subject to a variety of federal, state, local and foreign laws, rules and regulations, including those related to health, safety and environmental matters. Governmental regulations also affect taxes and levies, capital markets, healthcare costs, energy usage, international trade, and immigration and other labor issues, all of which may have a direct or indirect effect on our businesses and our customers’ and suppliers’ businesses. We cannot predict the substance or impact of pending or future legislation or regulations, or the application thereof. Changes in these laws or regulations, the interpretation thereof or the introduction of new laws or regulations could increase the costs of doing business for us or our customers or suppliers or restrict our actions and adversely affect our financial condition, operating results and cash flows.
| ITEM 1B | UNRESOLVED STAFF COMMENTS—None |
12
Table of Contents
| ITEM 2. | PROPERTIES |
The Company and its subsidiaries own or lease properties throughout the world. Listed below are the principal properties owned or leased as of January 1, 2011:
| Location |
Principal Uses |
Owned/Leased | ||
| Grand Rapids, MI |
Company headquarters, manufacturing, RD&E, sales, customer service, warehouse, and administration | Owned | ||
| Tewksbury, MA |
RD&E, sales, customer service, and administration | Leased | ||
| Greensboro, NC |
Sales and customer service | Leased | ||
| Carlstadt, NJ |
Manufacturing, RD&E, sales, customer service, warehouse, and administration | Leased | ||
| Regensdorf, Switzerland |
Manufacturing, RD&E, sales, customer service, warehouse and administration | Leased | ||
| Poynton, England |
Sales, customer service, and administration | Leased | ||
| Berlin, Germany |
Sales and customer service | Leased | ||
| Neu-Isenburg, Germany |
Sales and customer service | Leased | ||
| Martinsried, Germany |
Manufacturing, RD&E, sales, customer service, and training | Leased | ||
| Stuttgart, Germany |
Sales and customer service | Leased | ||
| Luxembourg, Grand Duchy of Luxembourg |
Administration | Leased | ||
| Massy, France |
Sales, customer service, and administration | Leased | ||
| Prato, Italy |
Sales and customer service | Leased | ||
| Barcelona, Spain |
Sales and customer service | Leased | ||
| Moscow, Russia |
Sales | Leased | ||
| Vyskov, Czech Republic |
Sales and customer service | Leased | ||
| Quarry Bay, Hong Kong |
Sales, customer service, warehouse and administration | Leased | ||
| Tokyo, Japan |
Sales, customer service, and administration | Leased | ||
| Beijing, China |
Sales and customer service | Leased | ||
| Guangzhou, China |
Sales and customer service | Leased | ||
| Shanghai, China (4 sites) |
Sales, customer service, and administration | Leased | ||
As of January 1, 2011, X-Rite and its subsidiaries collectively owned approximately 375,000 square feet of space and leased approximately 247,000 square feet.
Management considers all the Company’s properties and equipment to be suitable and adequate for its current and reasonably anticipated development, production, distribution, and selling requirements.
| ITEM 3. | LEGAL PROCEEDINGS |
The Company is periodically involved in legal proceedings, legal actions, and claims arising in the normal course of business, including proceedings related to product, labor, and other matters. Such matters are subject to many uncertainties, and outcomes are not predictable. The Company records amounts for losses that are deemed probable and subject to reasonable estimates. Although the results of the proceedings, actions, and claims described in this report cannot be predicted with certainty the Company does not believe that the ultimate resolution of any of these matters will have a material adverse effect on its financial condition or results of operations.
13
Table of Contents
| ITEM 4. | REMOVED AND RESERVED |
SUPPLEMENTARY ITEM—EXECUTIVE OFFICERS OF THE COMPANY
The following table lists the names, ages, and positions of all of the Company’s executive officers. Executive officers are appointed annually by our Board of Directors and serve at the pleasure of the Board of Directors.
| Name |
Age | Position | ||||
| Thomas J. Vacchiano Jr. |
58 | President, Chief Executive Officer | ||||
| Rajesh K. Shah |
59 | Executive Vice President, Chief Financial Officer and Secretary | ||||
| Francis Lamy |
52 | Executive Vice President, Chief Technology Officer | ||||
Thomas J. Vacchiano, Jr. is the President and Chief Executive Officer of the Company and has held that position since October 1, 2006. Mr. Vacchiano also serves as a director of the Company. He joined X-Rite as its President in July 2006 as part of the Amazys acquisition. Prior to the Amazys acquisition, he served as Amazys’ President and Chief Executive Officer. Amazys was a color technology company headquartered in Switzerland and was publicly traded on the Swiss Stock Exchange.
Rajesh K. Shah is the Executive Vice President, Chief Financial Officer and Secretary of the Company and has held that position since October 2009. Prior to joining X-Rite, Mr. Shah served as Executive Vice President and Chief Financial Officer of Cadence Innovation, LLC, a global manufacturer of automotive interior systems from 2007 to March 2009. Prior to his service at Cadence Innovation, Mr. Shah was Executive Vice President and Chief Financial Officer of Remy International, Inc., a manufacturer of automotive and commercial products from 2002 to 2006.
Francis Lamy is the Executive Vice President and Chief Technology Officer of the Company and has held that positions since July 2006, when he joined the Company in connection with its acquisition of Amazys. Prior to joining X-Rite, Mr. Lamy served as the Executive Vice President and Chief Technology Officer of GretagMacbeth AG, the primary subsidiary of Amazys, since 1999.
14
Table of Contents
PART II
| ITEM 5. | MARKET FOR REGISTRANT’S COMMON EQUITY, RELATED STOCKHOLDER MATTERS AND ISSUER PURCHASES OF EQUITY SECURITIES |
The Company’s common stock is listed on the NASDAQ—Global Select Market under the symbol “XRIT”. As of March 3, 2011, there were approximately 830 shareholders of record. Ranges of high and low sales prices reported by the NASDAQ for the past two fiscal years appear in the following table.
| High | Low | |||||||
| Year Ended January 1, 2011: |
||||||||
| Fourth Quarter |
$ | 4.75 | $ | 3.61 | ||||
| Third Quarter |
3.84 | 3.19 | ||||||
| Second Quarter |
3.98 | 3.05 | ||||||
| First Quarter |
3.50 | 2.04 | ||||||
| Year Ended January 2, 2010: |
||||||||
| Fourth Quarter |
$ | 2.20 | $ | 1.80 | ||||
| Third Quarter |
2.10 | 1.36 | ||||||
| Second Quarter |
2.78 | 1.03 | ||||||
| First Quarter |
1.63 | 0.95 | ||||||
In 2007, the Company’s Board of Directors voted to suspend payment of its dividend on common stock. This decision was made in order to accelerate the repayment of debt and to invest in future product development initiatives. Although the Board does not currently anticipate reinstating the dividend payment in the foreseeable future, it will continue to reevaluate this matter periodically. Any determination to pay cash dividends will be at the discretion of the Board and will be dependent upon the Company’s results of operations, financial condition, terms of financing arrangements, and such other factors as the Board may deem relevant.
15
Table of Contents
Shareholder Return Performance Graph
Set forth below is a line graph comparing the yearly percentage change in the cumulative total shareholder return on the Company’s common stock with that of the cumulative total return of the NASDAQ Stock Index (US & foreign) and NASDAQ Non-Financial Stock Index for the five-year period ended January 1, 2011 (fiscal 2010). The graph assumes an investment of $100 on January 1, 2006 (beginning of fiscal 2006) in the Company’s common stock, the NASDAQ Stock Index (US & foreign) and the NASDAQ Non-Financial Index, with dividends reinvested.
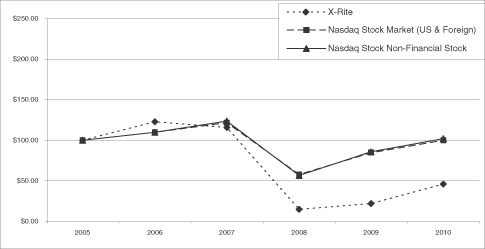
| 2005 | 2006 | 2007 | 2008 | 2009 | 2010 | |||||||||||||||||||
| X-Rite, Inc. |
$ | 100 | $ | 123 | $ | 116 | $ | 15 | $ | 22 | $ | 46 | ||||||||||||
| NASDAQ US & foreign |
$ | 100 | $ | 110 | $ | 122 | $ | 58 | $ | 85 | $ | 100 | ||||||||||||
| NASDAQ Non-Financial |
$ | 100 | $ | 110 | $ | 124 | $ | 57 | $ | 86 | $ | 102 | ||||||||||||
16
Table of Contents
| ITEM 6. | SELECTED FINANCIAL DATA |
Selected financial data for the five most recently completed fiscal years is summarized below. Such data should be read in conjunction with the section entitled “Management’s Discussion and Analysis of Financial Condition and Results of Operations” and the Consolidated Financial Statements and notes thereto and information included elsewhere in this Annual Report on Form 10-K.
(in thousands, except per share data)
| 2010 | 2009 | 2008 | 2007 | 2006 | ||||||||||||||||
| Net sales |
$ | 222,740 | $ | 191,667 | $ | 261,491 | $ | 248,710 | $ | 167,641 | ||||||||||
| Operating income (loss) |
28,929 | 3,821 | (54,864 | ) | 16,643 | (25,660 | ) | |||||||||||||
| Net income (loss) |
3,641 | (25,242 | ) | (117,824 | ) | (20,822 | ) | (27,144 | ) | |||||||||||
| Net income (loss) per share: |
||||||||||||||||||||
| Basic |
0.04 | (0.33 | ) | (3.12 | ) | (0.72 | ) | (1.09 | ) | |||||||||||
| Diluted |
0.04 | (0.33 | ) | (3.12 | ) | (0.72 | ) | (1.09 | ) | |||||||||||
| Dividends per share |
— | — | — | — | 0.10 | |||||||||||||||
| Total assets |
$ | 439,095 | $ | 472,715 | $ | 545,657 | $ | 654,824 | $ | 462,259 | ||||||||||
| Mandatorily redeemable preferred stock, net of warrant discount of $10,615 and $14,065, in 2010 and 2009 respectively |
36,402 | 29,764 | — | — | — | |||||||||||||||
| Long-term debt, less current portion |
135,248 | 176,400 | 264,017 | 378,300 | 190,200 | |||||||||||||||
| Weighted-average common shares outstanding: |
||||||||||||||||||||
| Basic |
84,414 | 77,500 | 37,753 | 28,866 | 24,865 | |||||||||||||||
| Diluted |
85,799 | 77,500 | 37,753 | 28,866 | 24,865 | |||||||||||||||
Assets acquired and liabilities assumed in the Amazys Holding AG and Pantone, Inc. acquisitions were recorded on the Company’s Consolidated Balance Sheets based on their estimated fair values as of the date of acquisition—July 5, 2006 and October 24, 2007, respectively. The results of operations of Amazys Holding AG and Pantone, Inc. have been included in the Company’s Consolidated Statements of Operations since the dates of acquisition. During the fourth quarter of 2008, an impairment charge of $58.1 million was recognized in relation to the acquired goodwill and indefinite-lived intangibles. See Note 4 to the Consolidated Financial Statements for further discussion of this impairment.
17
Table of Contents
| ITEM 7. | MANAGEMENT’S DISCUSSION AND ANALYSIS OF FINANCIAL CONDITION AND RESULTS OF OPERATIONS |
FORWARD-LOOKING STATEMENTS:
This discussion and analysis of financial condition and results of operations, as well as other sections of the Company’s Form 10-K, contain forward-looking statements within the meaning of Section 27A of the Securities Act of 1933, as amended, and Section 21E of the Securities Exchange Act, as amended, that are based on management’s beliefs, assumptions, current expectations, estimates and projections about the industries it serves, the economy, and about the Company itself. Words such as “anticipates,” “believes,” “estimates,” “expects,” “likely,” “plans,” “projects,” “should,” and variations of such words and similar expressions are intended to identify such forward looking statements. These statements are not guarantees of future performance and involve certain risks, uncertainties, and assumptions that are difficult to predict with regard to timing, extent, likelihood, and degree of occurrence including those listed in Item 1A—Risk Factors. Therefore, actual results and outcomes may materially differ from what may be expressed or forecasted in such forward-looking statements. Furthermore, X-Rite, Incorporated undertakes no obligation to update, amend or clarify forward-looking statements, whether as a result of new information, future events, or otherwise. Forward-looking statements include, but are not limited to, statements concerning liquidity, capital resources needs, tax rates, dividends, and potential new markets.
The following management’s discussion and analysis describes the principal factors affecting the results of operations, liquidity and capital resources, as well as the critical accounting policies of X-Rite, Incorporated (also referred to as X-Rite or the Company). For purposes of this discussion, amounts from the accompanying Consolidated Financial Statements and related notes have been rounded to millions of dollars, except where separately disclosed, for convenience of the reader. These rounded amounts are the basis for calculations of comparative changes and percentages used in this discussion. This discussion should be read in conjunction with the accompanying Consolidated Financial Statements, which include additional information about the Company’s significant accounting policies, practices and transactions that underlie its financial results.
OVERVIEW OF THE COMPANY
X-Rite, Incorporated is a global leader in color science and color technology. The Company develops, manufactures, markets and supports innovative color solutions through measurement instrumentation systems, software, color standards and services, as described below in the product overview section. X-Rite’s expertise in inspiring, selecting, measuring, formulating, communicating and matching color helps users get color right the first time and every time, which translates to better quality and reduced costs. X-Rite serves a range of markets including printing, packaging, photography, graphic design, video, automotive, paints, plastics, textiles, dental and medical. We serve these markets through our core product lines of Imaging and Media, Industrial, Standards, Support, Retail and Other. A more detailed discussion of our major markets and product line offerings appears below.
Products are sold worldwide through the Company’s own sales personnel and through independent sales representatives and dealers. The Company is headquartered in Grand Rapids, Michigan and has other domestic operations in New Jersey, North Carolina, and Massachusetts. In addition, the Company has locations in Switzerland, Germany, England, France, Italy, Spain, the Czech Republic, Russia, China, Hong Kong, and Japan. Manufacturing facilities are located in the United States, Switzerland, and Germany.
Overview of 2010
| • | 2010 net sales of $222.7 million up 16.2 percent from 2009 |
| • | 2010 operating income of $29.0 million up $25.2 million from 2009 |
| • | 2010 fully diluted earnings per share of $0.04 per share, compared to $(0.33) loss per share for 2009 |
| • | Strong year to date cash flow before financing of $31.4 million or 14.1 percent of sales |
| • | Reduced debt by $47.0 million year to date, including the pay off of the Second Lien Credit Facility in September 2010 |
18
Table of Contents
RESULTS OF OPERATIONS
The following table summarizes the results of the Company’s operations for the 2010, 2009 and 2008 fiscal years and includes amounts expressed as a percentage of net sales (in millions):
| 2010 | 2009 | 2008 | ||||||||||||||||||||||
| Net sales |
$ | 222.7 | 100.0 | % | $ | 191.7 | 100.0 | % | $ | 261.5 | 100.0 | % | ||||||||||||
| Cost of sales: |
||||||||||||||||||||||||
| Products sold |
89.6 | 40.2 | 80.9 | 42.2 | 109.7 | 41.9 | ||||||||||||||||||
| Inventory valuation adjustment |
— | — | — | — | 12.8 | 4.9 | ||||||||||||||||||
| Restructuring and other related charges |
— | — | 0.2 | 0.1 | 0.4 | 0.2 | ||||||||||||||||||
| Gross profit |
133.1 | 59.8 | 110.6 | 57.7 | 138.6 | 53.0 | ||||||||||||||||||
| Operating expenses |
104.1 | 46.8 | 106.8 | 55.7 | 135.4 | 51.8 | ||||||||||||||||||
| Goodwill and indefinite-lived intangibles impairment |
— | — | — | — | 58.1 | 22.2 | ||||||||||||||||||
| Operating income (loss) |
29.0 | 13.0 | 3.8 | 2.0 | (54.9 | ) | (21.0 | ) | ||||||||||||||||
| Interest expense |
(28.0 | ) | (12.6 | ) | (33.5 | ) | (17.5 | ) | (46.3 | ) | (17.7 | ) | ||||||||||||
| Write-off of deferred financing costs |
(1.1 | ) | (0.5 | ) | (2.3 | ) | (1.2 | ) | (3.8 | ) | (1.5 | ) | ||||||||||||
| Other income (expense) |
1.5 | 0.7 | 2.1 | 1.1 | (1.1 | ) | (0.4 | ) | ||||||||||||||||
| Loss before income taxes |
1.4 | 0.6 | (29.9 | ) | (15.6 | ) | (106.1 | ) | (40.6 | ) | ||||||||||||||
| Income taxes (benefit) |
(2.2 | ) | (1.0 | ) | (4.7 | ) | (2.5 | ) | 11.7 | 4.5 | ||||||||||||||
| Net income (loss) |
$ | 3.6 | 1.6 | % | $ | (25.2 | ) | (13.1 | )% | $ | (117.8 | ) | (45.1 | )% | ||||||||||
The following table summarizes net sales from continuing operations by product line (in millions):
Net Sales
| (in millions) | 2010 | 2009 | 2008 | |||||||||||||||||||||
| Imaging and Media |
$ | 87.6 | 39.3 | % | $ | 74.1 | 38.6 | % | $ | 114.8 | 43.9 | % | ||||||||||||
| Industrial |
51.6 | 23.2 | 42.0 | 21.9 | 51.0 | 19.5 | ||||||||||||||||||
| Standards |
37.7 | 16.9 | 32.5 | 17.0 | 42.1 | 16.1 | ||||||||||||||||||
| Support Services |
26.5 | 11.9 | 23.3 | 12.2 | 28.9 | 11.1 | ||||||||||||||||||
| Retail |
15.3 | 6.9 | 14.3 | 7.4 | 18.3 | 7.0 | ||||||||||||||||||
| Other |
4.0 | 1.8 | 5.5 | 2.9 | 6.4 | 2.4 | ||||||||||||||||||
| Total Net Sales |
$ | 222.7 | 100.0 | % | $ | 191.7 | 100.0 | % | $ | 261.5 | 100.0 | % | ||||||||||||
For 2010, net sales increased $31.0 million, or 16.2 percent compared to 2009. All of the Company’s core product lines realized year to date net sales increases. The Company’s strong sales growth was the result of recently launched product and marketing initiatives in combination with the global market recovery. For 2009, net sales decreased $69.8 million, or 26.7 percent compared to 2008. Lower sales volumes were experienced across all business units with the most significant declines occurring within the Imaging and Media business unit. These declines primarily were a result of the global economic recession and its related effect on the Company.
The Company experienced net sales increases in 2010 in all the major geographic regions of the world where it conducts business:
Americas—Net sales were up by $9.0 million, or 11.7 percent versus the prior year. Strong sales in the Industrial and Standards lines are leading America’s sales growth, with Imaging and Media channel sales contributing. The Home Depot rollout of several hundred paint matching systems in the first half of 2009 is dampening the overall sales growth results for the region. In 2009, net sales in the Americas were down $19.3 million, or 20.1 percent over 2008.
19
Table of Contents
Europe—In 2010, net sales were up $13.0 million, or 18.1 percent, versus the prior year. Increasing success across multiple product lines is contributing to sales performance. Improving conditions in the print market is a significant driver of improved sales, complemented by sales gains in both the Retail and Standards lines. The Industrial line is a positive contributor as well. In 2009, net sales in Europe were down $43.3 million, or 37.5 percent over 2008.
Asia Pacific—Net sales were up $9.0 million, or 21.1 percent, in 2010 over the prior year. This represents strong economic growth in the overall region with the exception of Japan. The Imaging and Media line reported strong sales growth supported by a number of new sales and marketing motions. The Industrial and Support Services lines were also strong contributors to sales growth. In 2009, Asia Pacific net sales were down by $7.2 million, or 14.4 percent.
The Company’s primary foreign exchange exposures are from the Euro and the Swiss Franc. The impact of fluctuations in these currencies was reflected mainly in the Company’s European operations. Foreign currency fluctuations, primarily the weakening of the Euro over the U.S. dollar, had a $1.6 million unfavorable effect on 2010 net sales as compared to 2009. In 2009, the impact of translating foreign denominated net sales to U.S. dollars had an unfavorable effect on net sales of $3.1 million. The impact of translating foreign denominated net sales to U.S. dollars improved net sales by $7.1 million in 2008 compared to 2007. In 2010, both domestic and international revenue increased, with international revenue accounting for 66.9 percent of net sales. In 2009 and 2008, both domestic and international revenue decreased, with international revenue accounting for 64.7 and 67.2 percent of net sales, respectively.
The Imaging and Media product lines provide solutions for commercial and package printing applications, digital printing and photo processing, photographic, graphic design and pre-press service bureaus in the imaging industries. Imaging and Media net sales were up $13.5 million, or 18.3 percent over 2009. A strong performance in global sales is being driven by large customers with increasing demand associated with a number of new sales and marketing initiatives. This sales growth was complemented by an improving sales performance in Asia where Imaging and Media sales efforts are experiencing increasing success with a range of graphic arts products that serve a growing print market. As the market conditions for press manufacturers improve, demand from press manufacturers has rebounded contributing favorably to our product line results.
The Imaging and Media market reported a decrease of 2009 revenue of $40.7 million, or 35.4 percent, as compared to 2008. The decline in the Imaging and Media product line was driven by the pressroom and printing markets where demand from end user consumers has not recovered from economic recession conditions initially experienced at the end of 2008. Leading the decline in the Imaging and Media product line was a year over year decline in European sales of 42.5 percent.
The Industrial group product line provides color measurement solutions for the automotive quality control, process control and global supply chain markets. The Company’s products are an integral part of the manufacturing process for automotive interiors and exteriors, as well as textiles, plastics, and dyes. Industrial 2010 net sales were up $9.6 million, or 22.8 percent over 2009. Multiple products in all geographies reported strong sales growth year over year. The economic recovery has provided a strong boost to sales in this product line. New products such as our non-contact instruments and the MA9X series of products, along with a number of sales and marketing initiatives in the industrial market yielded positive results.
The Industrial market’s 2009 net sales decreased by $9.0 million, or 17.6 percent compared to the prior year. The Industrial market’s decline has been the result of the declines in the global automotive channel and related supply chain. As the U.S. economy weakened in 2008 and continued into 2009 a number of these supply chain projects were delayed into 2010. The largest area of decline for the Industrial product line was experienced in North America where year over year sales were down 29.5 percent. These declines were partially offset by strong Asia Pacific sales, particularly strong towards the second half of 2009, accounting for a 4.7 percent year over year increase. The Industrial product line experienced the smallest decline in year over year sales compared to other product lines, due to improving market conditions, new products, and new sales and marketing initiatives.
20
Table of Contents
The Standards product line includes products for the accurate communication and reproduction of color, servicing worldwide customers in a variety of industries including imaging and media, textiles, digital technology, plastics and paint. In 2010, Standards net sales were up $5.2 million, or 16.0 percent over 2009. The growth was lead by the new Pantone Matching System® Plus Series and supported by growth in the licensing business, and ongoing sales of the cotton product line serving the Home and Fashion sectors.
In 2009, Standards reported a decrease in net sales of $9.6 million, or 22.8 percent, compared to 2008. Decreases in the net sales of the Standards product line were driven by declining sales in the graphics and textile markets. Products serving the fashion and textile markets saw improving results as the year progressed compared to the graphic arts sector.
The Support Services product line provides professional color training and support worldwide through seminar training, classroom workshops, on-site consulting, technical support and interactive media development. This group also manages the Company’s global service repair departments. In 2010, Support Services net sales were up $3.2 million, or 14.0 percent over 2009. The Company is seeing healthy demand for repair and professional services as the economy is improving and instrument use is increasing. New service programs providing training and various support offers are also gaining traction.
In 2009, the Support Services group recorded a decrease in net sales of $5.6 million, or 19.6 percent compared to 2008. As customers closed their plants or stopped production lines in 2009, instruments were not being returned for certifications and repairs causing a slowdown in demand for key revenue sources in the Support Services sector. The improvement in general market conditions towards the end of 2009 yielded an increase in instrument certifications and repairs during this period.
The Retail product line markets its paint matching products under the Match-Rite name to home improvement centers, mass merchants, paint retailers, and paint manufacturers. In 2010, Retail net sales were up $1.0 million, or 7.2 percent versus 2009. In 2009, the Company was involved in a major program with Home Depot to upgrade several hundred stores with new paint matching systems. In 2010, this was not the case. The Company’s new non-contact retail paint matching solution and new Capsure™ solution for in front of the counter use by paint contractors and decorators are the main drivers for the strong sales performance as they are both being well received in the marketplace.
The Retail market experienced a sales decrease of $4.0 million, or 22.0 percent, for 2009 compared with 2008. Continuing success in North America with the new iVue® (a next generation retail paint matching system) solution for Retail customers was partially offset by the decline in year over year demand of the Matchstick product family in Europe and the general reduction in capital expenditures by the industry. In 2009 the Retail product line was negatively impacted by the challenging economic environment in the European retail markets. While sales in North America were down 13.8 percent year over year, our European sales experienced a much deeper decline of 56.5 percent for the same period. The declining European sales in 2009 were related to the economic recession in Europe. The Matchstick product line was supplemented with a new product platform leveraging state of the art technology and features in the second quarter of 2010.
The Company’s products denoted as Other primarily serve the Medical and Dental markets. The Medical product line provides instrumentation designed for use in controlling variables in the processing of x-ray film and other applications. The Dental product line provides shade matching technology to the cosmetic dental industry through X-Rite’s ShadeVision and Shade-X systems. Other product sales decreased in both 2010 and 2009 compared to each prior year by 27.0 and 13.7 percent, respectively, due to weaker demand for products in 2010 and the economic conditions in 2009.
Cost of Sales and Gross Profit
X-Rite’s cost of sales consists primarily of materials, labor, and overhead associated with manufacturing its products. Manufacturing activities are primarily conducted at facilities in Michigan, New Jersey, and
21
Table of Contents
Switzerland, with smaller operations located in Germany. Software development is also conducted at these facilities, as well as at a facility in Massachusetts. The Company’s gross profit historically has fluctuated within a narrow range. Principal drivers of gross profit include production volumes, product mix, labor, facilities, materials costs, and exchange rates.
Gross profit benefited for 2010 from increased operating efficiencies, cost control initiatives, and higher sales volume. These benefits were slightly impacted by unfavorable foreign exchange, product and sales mix, and suspension of furloughs and employee benefits implemented in 2009. Gross profit for 2010 was $133.1 million, or 59.8 percent of net sales, compared with $110.6 million, or 57.7 percent of net sales, for 2009.
Gross profit for 2009 was $110.6 million, or 57.7 percent, compared to $138.6 million, or 53.0 percent of sales, for 2008. The 2008 gross profit results include a $12.8 million adjustment or 4.9 percent of sales, related to the fair value valuation of Pantone’s inventory. Adjusted for this item, the Company’s 2009 gross margins were comparable to 2008 results. The Company was successful in offsetting the unfavorable absorption impacts resulting from the year over year decline in sales through cost reductions including but not limited to employee furloughs, headcount reductions, and reduced employee benefits including vacation.
Operating Expenses
The following table compares operating expense components as a percentage of net sales (in millions):
| 2010 | 2009 | 2008 | ||||||||||||||||||||||
| Selling and marketing |
$ | 56.4 | 25.3 | % | $ | 51.9 | 27.1 | % | $ | 64.9 | 24.8 | % | ||||||||||||
| Research, development and engineering |
23.7 | 10.7 | 22.6 | 11.8 | 29.4 | 11.2 | ||||||||||||||||||
| General and administrative |
22.0 | 9.9 | 27.9 | 14.5 | 35.2 | 13.5 | ||||||||||||||||||
| Restructuring and other related charges |
2.0 | 0.9 | 4.4 | 2.3 | 5.9 | 2.3 | ||||||||||||||||||
| Goodwill and indefinite-lived intangibles impairment |
— | — | — | — | 58.1 | 22.2 | ||||||||||||||||||
| Total |
$ | 104.1 | 46.8 | % | $ | 106.8 | 55.7 | % | $ | 193.5 | 74.0 | % | ||||||||||||
In 2010, operating expenses decreased $2.7 million, or 2.5 percent compared to 2009. The overall decrease is primary attributable to a decrease in amortization expense for certain intangible assets that became fully amortized in 2009. In 2010, the Company expensed $1.7 million primarily related to the Optronik 2009 restructuring plan and other charges related to the Company’s efforts to create a more efficient global tax structure and reorganize its global treasury and cash management footprint. The Company’s restructuring plans were completed as of the end of 2010. Operating expenses were $106.8 in 2009, which is a decrease of $86.7 million compared to 2008 operating expenses of $193.5. Of the decrease, $58.1 million is due to the goodwill and indefinite-lived intangibles impairment recorded in 2008. The residual operating expense decline of $28.6 million in 2009 includes approximately $8.0 million in respect of employee furloughs, reductions in employee benefits, and other items, which were later reinstated in 2010. The remaining decline is largely attributable to cost reductions comprised of headcount and other variable expense reductions affecting selling, marketing, engineering, and administration expenses. The effect of foreign exchange rates increased operating expenses by $1.1 million in 2010 and $0.5 million in 2008 and decreased operating expenses by $0.6 million in 2009.
Selling and Marketing Expenses
Selling and marketing expenses consist primarily of wages, commissions, facility costs, travel, advertising, trade shows, media and product promotion costs. Selling and marketing expenses in 2010 increased $4.5 million, or 8.7 percent over 2009. The increase is attributable to an increase in compensation expenses for the suspension of furloughs and benefits reductions implemented in 2009, as well as investment in the Company’s strategic market initiatives for the development of new products plus increased variable compensation expenses related to the increase in sales and improved financial performance of the Company. Selling and marketing expenses in
22
Table of Contents
2009 were $51.9 million compared to $64.9 million in 2008, a decline of $13.0 million, or 20.0 percent. Impacting the decline in selling and marketing expenses was a significant focus by management to reduce costs through factors including headcount reductions, employee furloughs, reduced commission payments, and suspension of employee benefit programs. As a percentage of sales, 2010 expenses were 25.3 percent compared to 27.1 and 24.8 percent for 2009 and 2008, respectively.
Research, Development and Engineering Expenses
Research, development and engineering (RD&E) expenses include compensation, facility costs, consulting fees, and travel for the Company’s engineering staff. These costs are incurred primarily in the United States and Switzerland for both new product development and the support and refinement of existing product lines. RD&E expenses in 2010 increased $1.1 million, or 4.9 percent, compared to 2009. The increase is attributable to an increase in compensation expenses for the suspension of furloughs and benefits reductions implemented in 2009, as well as investment in the Company’s strategic market initiatives for the development of new products. RD&E expenses in 2009 declined $6.8 million, or 23.1 percent, when compared to 2008. The decline is primarily related to reduction in employee headcount, furloughs, and benefit programs. RD&E expenses as a percentage of sales were 10.7, 11.8, and 11.2 percent for 2010, 2009, and 2008, respectively. The Company intends to make investments in RD&E in the range of 11 to 13 percent of net sales for the foreseeable future.
In addition to the RD&E costs reported as operating expenses, certain costs to develop new software products were capitalized in each of the last three years. Software development costs capitalized totaled $6.5, $4.4, and $4.0 million in 2010, 2009, and 2008, respectively. The increase in capital development costs reflected an increase in compensation expenses for the suspension of furloughs and benefits reductions implemented in 2009, as well as investment in the Company’s strategic market initiatives for the development of new products. The related amortization expense is included in cost of sales (see Note 1 to the Consolidated Financial Statements).
General and Administrative Expenses
General and administrative (G&A) expenses include compensation, facility costs, and travel for the Company’s executive, finance, human resources and administrative functions, as well as legal and consulting costs. In 2010, G&A expenses decreased $5.9 million, or 21.1 percent compared to 2009. The decrease is primarily attributable to the reduction in intangible asset amortization related to assets that became fully amortized in 2009, partially offset by an increase in compensation expenses for the suspension of furloughs and benefits reductions implemented in 2009. G&A expenses in 2009 decreased $7.3 million, or 20.7 percent, when compared to 2008. The decrease is primarily attributable to employee furloughs and benefit reductions, decline in professional services fees, and reduction in amortization of fully amortized intangible assets.
Restructuring and other related charges
Restructuring and other related charges include the costs the Company incurred to execute various corporate restructuring activities. These charges include cash costs, accrued liabilities, asset write-offs, lease termination costs, and employee severance pay resulting from layoffs.
In 2010, restructuring and other related charges included in operating expenses were $2.0 million, which is a $2.4 million, or 54.5 percent decrease compared to 2009. The decline is due to the completion of the Company’s restructuring efforts in 2010. In 2009, restructuring and other related charges were $4.6 million, of which $4.4 and $0.2 million were recorded to operating expenses and cost of goods sold, respectively. In 2008, the Company incurred $6.3 million in restructuring charges of which $5.9 million were recorded in operating expenses and $0.4 million were recorded in cost of goods sold.
23
Table of Contents
The Company has engaged in the following corporate restructurings:
Amazys Restructuring Plan
In the first quarter of 2008, the Company completed the restructuring actions initiated in prior periods related to the integration of the Amazys acquisition (Amazys restructuring plan). The Amazys restructuring plan included the closure of duplicate facilities, elimination of redundant jobs, and consolidation of product lines. The restructuring plan included workforce reductions of 83 employees, all of which were completed as of March 29, 2008, facility closures of approximately 14,000 square feet, various asset write-downs, and related costs. The work force reductions included approximately $6.0 million related to the former CEO’s employment contract settlement. Asset write-downs included inventory, tooling, capitalized software, and other intangible asset write-downs directly related to discontinued product lines. The Company has fully executed the Amazys restructuring plan. Cumulative charges incurred to date related to the Amazys restructuring plan were $19.9 million.
April 2008 Restructuring Plan
In the first quarter of 2009, the Company completed the restructuring actions initiated in prior periods related to the restructuring plan announced in April 2008 (the April 2008 restructuring plan). The April 2008 restructuring plan was initiated in response to weaker than expected economic conditions and market softness that adversely affected net sales. The plan consisted of a revised cost savings and an operational plan which included 100 headcount reductions at various locations worldwide as well as additional cost of sales and operating cost reductions. The Company incurred $3.9 million in charges in connection with the April 2008 restructuring plan.
January 2009 Restructuring Plan
In the first quarter of 2010, the Company completed the restructuring actions initiated in prior periods related to the restructuring plan announced in January 2009 (the January 2009 restructuring plan). The January 2009 restructuring plan included narrowing the Company’s business focus, closing certain facilities, aggressively pursuing manufacturing efficiencies, implementing a reduction in headcount of 101 jobs, executing reduced work schedules and furloughs for selected employee groups, reducing executive compensation and suspending selected employee benefit programs. The Company incurred $3.3 million in charges in connection with the January 2009 restructuring plan.
Optronik 2009 Restructuring Plan
In the third quarter of 2010, the Company completed the restructuring actions initiated in the fourth quarter of 2009 related to Optronik, a foreign subsidiary of the Company. In early 2010, certain assets of Optronik were sold and the remaining operations were retained and merged into another subsidiary. The restructuring expenses relate primarily to headcount reductions, and the Company incurred $1.6 million in charges for this restructuring plan.
Other Related Charges
Other related charges are comprised of costs associated with the Company’s efforts to create a more efficient global structure and reorganize the global treasury and cash management footprint.
Goodwill and Indefinite-Lived Intangible Impairment
Goodwill and indefinite-lived intangible impairment consists of charges related to valuation adjustments of goodwill and indefinite-lived intangible assets.
The Company accounts for goodwill and indefinite-lived intangible assets in accordance with ASC 350, Goodwill and Other Intangible Assets, which requires the Company to test these assets for impairment at the reporting unit level annually, or more frequently if a triggering event occurs. As a matter of practice, the Company performs the required annual impairment testing during the fourth quarter of each fiscal year, after the annual
24
Table of Contents
forecasting process. No impairment charge was required for the years ending January 1, 2011 and January 2, 2010. Due to a weakening of the global economies, operating profits and cash flows were lower than expected in 2008. Based on that trend, the earnings forecast for the next five years was revised. In December 2008, management concluded that goodwill and indefinite-lived intangibles were impaired and an impairment loss of $58.1 million was recognized. The fair value was estimated using the expected present value of future cash flows.
Founders Insurance
In 1998, the Company entered into agreements with its founding shareholders for the future repurchase of 4.5 million shares of the Company’s outstanding common stock. The agreements were terminated in November 2004. At that time, 3.4 million shares remained subject to repurchase. Prior to November 2004, the agreements required stock repurchases following the later of the death of each founder or such founder’s spouse. The cost of the repurchase agreements were to be funded by $160.0 million of proceeds from life insurance policies the Company purchased on the lives of certain of these individuals. At December 29, 2007, the Company’s remaining life insurance portfolio consisted of eleven policies with a face value of $130.0 million. Throughout 2008, the Company surrendered or sold all eleven life insurance policies generating $21.0 million in proceeds. As part of the sale of the life insurance policies, the Company recognized a gain of $1.3 million. For policies that were surrendered, the Company received the cash surrender value of the policy on the day of notification. The proceeds were used to fund the equity issuance costs and debt amendment fees incurred in connection with the October 28, 2008 Corporate Recapitalization Plan.
Operating Income (Loss)
Operating income (loss) was $29.0, $3.8, and $(54.9) million for the years 2010, 2009, and 2008, respectively. Operating income increased in both 2010 and 2009 over each previous year by $25.2 and $ 58.7 million, respectively. In 2010, operating income was favorably impacted by the increase in net sales across most product lines coupled with the previously announced profit improvement actions and cost controls put in place during 2009 that continued into 2010. In 2009, the improvement in operating income resulted primarily from the goodwill and indefinite-lived intangible impairment loss of $58.1 million recognized in 2008.
Other Income (Expense)
Interest Expense
Total interest expense incurred by the Company in 2010, 2009, and 2008 was $28.0, $33.5, and $46.3 million, respectively, including expense related to deferred financing fees and terminated swap agreements. The 2010 decrease was largely attributable to the pay down of debt that occurred during 2009 and 2010.
Cash based interest on secured debt during 2010, 2009, and 2008 totaled $13.3 million, $21.8 million, and $37.9 million, respectively. Effective the third quarter of 2010, the Company paid cash for interest on its Series A preferred stock of $3.3 million. The 2010 and 2009 decreases are largely attributable to the significant pay downs of debt that occurred as a result of the Corporate Recapitalization Plan in the fourth quarter of 2008, and in 2009, sale of the former Corporate headquarters, sale of its Italian manufacturing facility, sale of equity investments previously written off and excess cash from continuing operations throughout 2009.
As of January 1, 2011 and January 2, 2010, the credit facilities’ variable rates were 5.75 percent per annum and ranged from 6.75 to 14.38 percent per annum, respectively. As of these dates, the weighted average interest rates for all of the Company’s debt were 8.0 percent per annum and 9.6 percent per annum, respectively, exclusive of amortization of deferred financing costs and the effect of derivative instruments.
Write-off of Deferred Financing Costs
In 2010, the Company entered into an amendment of the first lien credit agreement in order to obtain authorization to repay the outstanding balance of the second lien credit facility. As a result of the second lien extinguishment, the Company wrote-off $1.1 million of previously existing deferred financing costs.
25
Table of Contents
In 2009, the Company entered into an Exchange Agreement to effectively exchange $41.6 million of the second lien term loan principal outstanding to 41,561 shares of newly issued Series A Preferred Stock (the Exchange). As a result of the second lien debt exchange, the Company wrote-off $2.3 million of previously existing deferred financing costs.
In 2008, as a part of the Corporate Recapitalization Plan, the Company amended its senior credit facilities and paid down debt. As a result of the Corporate Recapitalization Plan and related pay down of debt, the Company wrote-off $3.8 million of the deferred financing costs.
Other, net
Other income (expense), net consists of gains and losses from foreign exchange translations and sales of assets. In 2010, other income and expense was $1.5 million, which consisted primarily of gains and losses on foreign exchange translations. In 2009, other income and expense was $2.1 million, an increase of $3.2 million compared to 2008, which is primarily due to the sale of equity investments previously written off for $3.5 million.
Income Taxes
In 2010, the Company recorded a tax benefit of $2.2 million against pre-tax income from continuing operations of $1.4 million. The tax benefit includes $1.6 million related to amortization of intangible assets, reductions of reserves for uncertain tax positions amounting to $0.2 million, and reductions in foreign withholding tax obligations of $1.0 million, which were offset by foreign taxes of $0.2 million, state taxes of $0.1 million, and other adjustments of $0.3 million. Undistributed earnings of foreign subsidiaries and related companies that are deemed to be permanently invested amounted to $25.6 million at January 1, 2011, $7.1 million at January 2, 2010, and $6.4 million at January 3, 2009. It is not practicable to calculate the unrecognized deferred tax liability on those earnings.
In 2009, the Company recorded a tax benefit of $4.7 million against a pre-tax loss from continuing operations of $29.9 million, which includes benefits of $2.3 million related to the amortization of intangible assets, refund claims of $2.1 million associated with the recapture US federal income taxes paid in 2003, 2004, and 2005 that resulted from carryback opportunities created through current year legislative changes, reductions of reserves for uncertain tax positions amounting to $0.6 million, adjustments to valuation allowances against deferred income tax assets totaling $0.6 million, and other tax benefits pertaining to nontaxable items and adjustments of $0.1 million, which were offset by foreign taxes of $1.0 million on income earned by certain foreign subsidiaries.
In 2008, the Company recorded tax expense of $11.7 million against a pre-tax loss from continuing operations of $106.1 million. The Company’s effective tax rate was negatively impacted by the recording of additional reserves for uncertain tax positions in the amount of $9.0 million and valuation allowances of $47.7 million.
Net Income
The Company recorded net income (loss) of $3.6, $(25.2), and $(117.8) million for 2010, 2009, and 2008, respectively. Basic and diluted income (loss) per share were $0.04, $(0.33), and $(3.12) for 2010, 2009, and 2008, respectively.
The weighted average number of common shares outstanding for purposes of calculating basic shares outstanding was higher in 2010 and 2009 than in 2008, due to the issuance of 46.9 million shares in the fourth quarter of 2008 as part of the Corporate Restructuring Plan.
26
Table of Contents
FINANCIAL CONDITION AND LIQUIDITY
Liquidity and Capital Resources
The Company’s liquidity and available capital resources are impacted by four key components: (i) cash, (ii) operating activities, (iii) investing activities and (iv) financing activities. These components are summarized below (in millions):
| 2010 | 2009 | 2008 | ||||||||||
| Net cash flow provided by (used in): |
||||||||||||
| Operating activities |
$ | 42.9 | $ | 20.3 | $ | 9.7 | ||||||
| Investing activities |
(11.5 | ) | 4.0 | 14.8 | ||||||||
| Financing activities |
(46.4 | ) | (48.4 | ) | 6.4 | |||||||
| Effect of exchange rate changes on cash |
(2.4 | ) | 2.4 | (0.4 | ) | |||||||
| Net increase (decrease) in cash |
(17.4 | ) | (21.7 | ) | 30.5 | |||||||
| Cash, beginning of year |
29.1 | 50.8 | 20.3 | |||||||||
| Cash, end of year |
$ | 11.7 | $ | 29.1 | $ | 50.8 | ||||||
Cash
At January 1, 2011, January 2, 2010, and January 3, 2009, the Company had cash of $11.7, $29.1, and $50.8 million, respectively. As of January 1, 2011, approximately $7.9 million of cash was held by subsidiaries outside of the United States.
Operating Activities
In 2010, cash provided by operating activities of $42.9 million consisted of net income of $3.6 million, non-cash charges of $37.0 million and a reduction in working capital of $2.3 million. Significant non-cash charges for 2010 included amortization of intangibles and capitalized software costs of $16.2 million, restructuring of $2.0 million, depreciation of $6.2 million, derivative fair value adjustments and charges of $1.7 million, paid-in-kind interest of $3.2 million, amortization of the discount on mandatorily redeemable preferred stock of $3.5 million, share-based compensation expense of $2.7 million, and amortization and write-off of deferred financing costs of $3.9 million. Sources of cash provided by operating assets and liabilities in 2010 included decreases in inventories, prepaid expenses and other current assets, and increases in accounts payable of $5.2 million, partially offset by increases in accounts receivable and decreases in income taxes, and other current and non-current liabilities of $2.9 million.
In 2009, cash provided by operating activities of $20.3 million consisted of a net loss of $25.2 million offset by non-cash items of $44.8 million and working capital of $0.7 million. Significant non-cash charges for 2009 included amortization of intangibles and capitalized software costs of $20.1 million, restructuring of $4.6 million, depreciation of $6.4 million, derivative fair value adjustments and charges of $5.0 million, paid-in-kind interest of $2.4 million, amortization of the discount on mandatorily redeemable preferred stock of $1.5 million, share-based compensation expense of $4.9 million, and amortization and write-off of deferred financing costs of $5.2 million. Significant sources of cash provided by operating activities in 2009 included decreases in inventories of $10.8 million and continued strong collection of accounts receivable of $9.8 million, partially offset by decreases in income taxes and other current and non-current liabilities of $9.9 and $9.0 million, respectively.
In 2008, cash provided by operating activities of $9.7 million consisted of a net loss of $117.8 million and net cash provided by operating assets and liabilities of $17.8 million offset by non-cash items of $109.7 million. Significant non-cash transactions for the year-ended January 3, 2009 included $58.1 million of goodwill and indefinite-lived intangibles impairment, $21.2 million of amortization expense related to intangibles and capitalized software costs, and $12.8 million of incremental cost of goods sold related to the 2007 purchase
27
Table of Contents
accounting inventory adjustment for the fair market valuation of Pantone’s ending inventory on the day of acquisition. Significant sources of cash in 2008 provided by operating activities included the collection of accounts receivable and decreases in inventories of $11.2 million and $22.0 million, respectively. The sources of cash were partially offset by decreases in accounts payables and other current and noncurrent liabilities of $3.6 million and $19.8 million, respectively.
Investing Activities
The components of the Company’s investment activities are (i) proceeds from sales of assets, (ii) capital expenditures, and (iii) increase in capitalized software. Net cash provided by (used for) investing activities during 2010, 2009 and 2008 was $(11.5), $4.0, and $14.8 million, respectively.
Cash used for investing activities in 2010 was related to an increase in capitalized software of $6.5 million offset by proceeds from sales of assets of $0.3 million, which primarily resulted from the sale of certain assets of the Optronik product line.
Capital expenditures were $5.3 million in 2010 compared to $4.7 and $4.0 million in 2009 and 2008, respectively. Capital expenditures are primarily related to the acquisition of machinery, equipment and tooling for the Company’s manufacturing facilities in the United States and Switzerland.
Cash provided by investing activities in 2009 was primarily related to cash proceeds from the sale of assets, offset by an increase in capitalized software of $4.4 million and capital expenditures of $4.7 million. During 2009, proceeds from sales of assets were $13.0 million, which resulted from the sale of the Company’s former headquarters for $7.2 million, its Italian manufacturing facility for $2.3 million and the sale of equity investments previously written off for $3.5 million.
Cash provided by investing activities in 2008 was primarily comprised of the surrender or sale of all life insurance policies generating $21.0 million in proceeds. As part of the sale of the life insurance policies, the Company recognized a gain of $1.3 million. For policies that were surrendered the Company received the cash surrender value of the policy on the day of notification. The proceeds were used to offset professional fees incurred in connection with the October 28, 2008 Corporate Recapitalization Plan. Offsetting the proceeds from the sale of life insurance policies were capital expenditures and capitalized software costs.
Financing Activities
The primary components of the Company’s financing activities are (i) proceeds from long-term debt, (ii) payment of long-term debt, (iii) debt and equity issuance costs, and (iv) the issuance of common stock. Net cash (used for) provided by financing activities during 2010, 2009, and 2008 was $(46.4), $(48.4), and $6.4 million, respectively.
During 2010, the Company amended its debt agreements in order to repay all outstanding obligations under the second lien credit agreement and make quarterly dividend payments in cash on the Company’s outstanding shares of Series A Preferred Stock. The Company paid $37.1 million of first lien debt and $26.4 million of second lien debt through the use of $47.0 million of cash reserves and $16.5 million in borrowings from the first lien revolving credit facility.
In 2009, cash flows used for financing activities were primarily related to the payment of long-term debt. In 2009, the Company reduced first and second lien debt by $87.3 million including cash pay down of $45.9 million and conversion of $41.6 million of second lien debt to mandatorily redeemable preferred stock. In the first quarter of 2009, the Company completed the sale of its former headquarters for $7.2 million. Proceeds from the sale were used to pay transaction closing costs, pay off the remaining balance on the mortgage, and then used to repay a portion of the Company’s first lien term loan. In the second quarter of 2009, the Company used $13.0 million in cash from operations to pay down the Company’s revolving line of credit. In the third quarter, the
28
Table of Contents
Company finalized the sale of its Italian manufacturing facility for $2.3 million, with proceeds from the sale used to pay down the Company’s first lien debt. In the fourth quarter, the Company used $3.5 million from the sale of equity investments previously written off, to pay down the first lien debt. The remaining debt payments were generated from cash provided by the Company’s operating activities.
On August 18, 2009, the Company entered into an exchange agreement whereby three institutional investors acquired 41,561 shares of Series A Preferred Stock and warrants to acquire 7.5 million shares of common stock in exchange for the cancellation of $41.6 million principal amount of loan under the second lien credit agreement (the ‘Exchange’). In connection with the Exchange, the Company capitalized $1.6 million in deferred financing costs related to legal and amendment fees. These costs are currently being amortized over the life of the related facilities.
In 2008, the Company’s financing activities were largely related to the October 28, 2008 Corporate Recapitalization Plan. On October 28, 2008, shareholders approved a financing initiative to raise $155.0 million in equity capital through the sale of 46.9 million shares of common stock. Proceeds from the capital raised included the sale and surrender of the life insurance policies, and cash from continuing operations were used to repay indebtedness of $139.2 million in 2008 under the Company’s First and Second Lien Credit Agreements, settle amounts payable by the Company pursuant to certain interest rate swap agreements of $12.5 million, and pay equity issuance costs and debt amendment fees of $14.2 million and $3.4 million, respectively.
Under the terms of the Corporate Recapitalization Plan, the Company’s secured credit facilities were amended. After giving effect to the amendments to the credit facilities and associated repayments, on October 28, 2008, the Company had approximately $273 million in aggregate principal amount of loans outstanding under its credit agreements, consisting of $179 million of first lien term loans and $27 million of first lien revolving loans, and had $68 million in aggregate principal amount of term loans outstanding under its second lien credit agreement. The obligations in respect of the terminated swap arrangements were paid in full with the proceeds of the recapitalization, and the outstanding principal of the mortgage loan on the Company’s former headquarters was reduced to $5.2 million.
In 2008, the Company issued 86,944 shares of common stock in connection with option exercises and purchases under the employee stock purchase plan, which generated $0.2 million of cash. In addition, 999,052 and 519,000 restricted stock awards and restricted stock units were granted, respectively. In 2008, as part of the equity recapitalization plan, the Company issued 46,904,763 shares of common stock to three parties which generated $155 million in cash. All of these equity awards have been granted under the Company’s 2008 Omnibus Stock Plan, 2006 Omnibus Stock Plan, or Employee Stock Purchase Plan.
The Company believes its current liquidity and cash position, future cash flows, and availability under its current credit facility should provide the necessary financial resources to meet its expected operating requirements for the foreseeable future. While the Company does not anticipate the need for additional financing, we continue to monitor the financial markets, and are uncertain how the change in the credit market would affect our ability to obtain additional financing if needed. In addition to cash from operating activities, the Company’s primary sources of cash include its first lien credit facility and revolving credit facility. For further discussion of the Company’s long-term debt see Note 5 to the Consolidated Financial Statements.
29
Table of Contents
Restrictive Covenants
Under the Company’s credit agreement the leverage ratio covenant has historically been the most restrictive covenant to the Company. The credit agreement provides that the Company must not exceed a ratio of total debt to Adjusted EBITDA (earnings before interest, taxes, depreciation, and amortization). As of January 1, 2011, the Company was in compliance with the covenants under its credit facility. The calculation of the Adjusted EBIDTA is as follows:
Adjusted EBITDA as defined by Credit Agreements
(in thousands)
| Twelve Months Ended | ||||||||||||
| January 1, 2011 |
January 2, 2010 |
January 3, 2009 |
||||||||||
| Net income (loss) |
$ | 3,641 | $ | (25,242 | ) | $ | (117,824 | ) | ||||
| EBITDA Adjustments: |
||||||||||||
| Depreciation |
6,164 | 6,388 | 6,998 | |||||||||
| Amortization |
16,217 | 20,129 | 21,212 | |||||||||
| Restructuring and other related costs |
2,008 | 5,024 | 7,641 | |||||||||
| Inventory valuation amortization |
— | — | 12,817 | |||||||||
| Share-based compensation(1) |
2,736 | 4,904 | 3,982 | |||||||||
| Net interest expense and write-off of deferred financing costs |
29,072 | 35,788 | 49,819 | |||||||||
| Currency gain (loss) |
(1,629 | ) | 2,537 | 2,206 | ||||||||
| Income tax benefit |
(2,238 | ) | (4,692 | ) | 11,709 | |||||||
| (Gain) loss on sale of assets |
280 | (4,429 | ) | (821 | ) | |||||||
| Other non-recurring adjustments |
— | 4,227 | 4,906 | |||||||||
| Goodwill and indefinite lived intangibles impairment |
— | — | 58,072 | |||||||||
| 52,610 | 69,876 | 178,541 | ||||||||||
| Adjusted EBITDA |
$ | 56,251 | $ | 44,634 | $ | 60,717 | ||||||
| (1) | Excludes share-based compensation charged to restructuring, as it is included in the “Restructuring and other related charges” line. |
Adjusted EBITDA is considered a financial measure that is not in accordance with generally accepted accounting principles (GAAP) followed in the United States. Management believes these measures are useful and relevant to management and investors in their analysis of the Company’s underlying business and operating performance. Management also uses this information for operational planning and decision-making purposes. Non-GAAP financial measures should not be considered a substitute for any GAAP measures. Additionally, non-GAAP measures as presented may not be comparable to similarly titled measures reported by other companies.
CRITICAL ACCOUNTING POLICIES AND ESTIMATES
The Company strives to report its financial results in a clear and understandable manner. It follows accounting principles generally accepted in the United States in preparing its Consolidated Financial Statements, which requires management to make certain estimates and apply judgments that affect its financial position and results of operations.
The preparation of financial statements in accordance with generally accepted accounting principles in the United States requires management to adopt accounting policies and make significant judgments and estimates to develop amounts reflected and disclosed in the financial statements. In some instances, there may be alternative
30
Table of Contents
policies or estimation techniques that could be used. Management maintains a thorough process to review the application of accounting policies and to evaluate the appropriateness of the many estimates that are required to prepare the financial statements. However, even under optimal circumstances, estimates routinely require adjustment based on changing circumstances and the receipt of new or better information.
The policies and estimates discussed below include the financial statement elements that are either the most judgmental or involve the selection or application of alternative accounting policies and are material to the financial statements. Management has discussed the development and selection of these accounting policies with the Audit Committee of the Board of Directors.
Accounts Receivable Allowances
Accounts receivable allowances are based on known customer exposures, historic credit experience, and the specific identification of potentially uncollectible accounts. In addition to known or judgmental components, a policy that consistently applies reserve rates based on the age of outstanding accounts receivable is followed. Actual collections may differ, requiring adjustments to the reserves.
Inventory Reserves
Inventories are valued at the lower of cost or market. In assessing the ultimate realization of inventories, judgments are made as to future demand requirements and compared with current inventory levels. Reserves are established for excess and obsolete inventory based on material movement, market conditions, and technological advancements.
Self-Insurance Reserves
The Company is self insured up to certain limits for costs associated with benefits paid under employee health care programs. The measurement of these costs requires the consideration of historic loss experience and judgments about the present and expected levels of costs per claim. These costs are accounted for by developing estimates of the undiscounted liability for claims incurred, including those claims incurred but not reported. This method provides estimates of future ultimate claim costs based on claims incurred as of the balance sheet date.
Long-Lived Assets
Evaluations are periodically made of long-lived assets for indicators of impairment when events or circumstances indicate that this risk may be present. Judgments regarding the existence of impairment are based on several factors including but not limited to, market conditions, operational performance, technological advancements, and estimated future cash flows. If the carrying value of a long-lived asset is considered impaired, an impairment charge is recorded to adjust the asset to its fair value.
Goodwill and Indefinite-Lived Intangibles
The Company accounts for goodwill and indefinite-lived intangible assets in accordance with ASC 350, which requires the Company to test the recorded amount of goodwill and indefinite-lived intangibles for recovery on an annual basis, or more frequently if a triggering event occurs. The Company tests for impairment during the fourth quarter of each fiscal year. Impairment indicators could include a significant adverse change in the business climate, operating performance indicators, or the decision to sell or dispose of a reporting unit.
Goodwill Impairment Analysis
The goodwill impairment evaluation is a two step process. In Step One of the goodwill evaluation process, the fair value of each reporting unit is compared to its book value. The Company must apply judgment in determining the estimated fair value, and a combination of present value techniques and quoted market prices are
31
Table of Contents
used to determine fair value. If the fair value exceeds book value, goodwill is not impaired for that reporting unit, and no further testing would be required. If the fair value is less than book value, a Step Two analysis must be completed. Step Two uses the calculated fair value of the reporting unit to perform a hypothetical purchase price allocation to the fair value of the assets and liabilities of the reporting unit. The difference between the fair value of the reporting unit calculated in Step One and the fair value of the underlying assets and liabilities of the reporting unit is the implied fair value of the reporting unit’s goodwill. An impairment loss is recorded in the financial statements if the carrying value of the reporting unit’s goodwill is greater than its implied fair value.
The following valuation methodologies and assumptions were used in the goodwill impairment analysis as of October 2, 2010:
| • | Discounted cash flow method under the income approach whereby cash flows were discounted to present value using an appropriate discount rate. The application of the discounted cash flow method required the development of discrete cash flow projections. |
| • | The Company considered the value indicators provided by the Guideline Company Method (GCM) under the market approach, in addition to the implied control premium in evaluating the reasonableness of the fair value results. |
| • | Discount rate used for the analysis was 11.8 percent. The discount rate was developed utilizing the capital asset pricing model through which a weighted average cost of capital was derived. |
Based on the results of our 2010 and 2009 annual assessment of the recoverability of goodwill, the fair values exceeded book value, and accordingly, there was no impairment of goodwill as of and for the years ended January 1, 2011 and January 2, 2010.
Based on the results of the 2008 annual assessment of the recoverability of goodwill, the fair value was less than the book value, and the Company completed a Step Two analysis. The results of the Step Two analysis resulted in the recognition of a goodwill impairment loss in 2008. The total impairment loss in 2008 amounted to $58.1 million, of which $51.8 related to the impairment of goodwill and the remaining $6.3 related to the impairment of indefinite-lived intangible assets, discussed in more detail in the following paragraphs. This represents total cumulative impairment charges against goodwill and indefinite-lived intangible assets as of January 1, 2011.
Differences in the Company’s actual future cash flows, results of operations, capital expenditures, cost of capital and discount rates as compared to the estimates utilized for purposes of calculating the respective reporting unit fair values could affect the results of the annual goodwill evaluation and could potentially lead to future goodwill impairment charges.
Indefinite-Lived Intangible Impairment Analysis
Indefinite-lived intangible assets are evaluated for recoverability utilizing an income approach that estimates the fair value of the discounted cash flows. The fair value of the indefinite-lived intangible asset is compared to its carrying value, and an impairment loss is recognized if the fair value is less than the carrying value.
The following valuation methodologies and assumptions were used in the analysis of the indefinite-lived intangible asset:
| • | The income approach, utilizing the relief from royalty method, was used to estimate fair value. |
| • | Relief from royalty rate considered publicly disclosed arm’s length licensing agreements, review of internal licensing agreements, and other factors. |
| • | Future projections are based on past performance |
| • | Estimate of future cash flows based on expected growth and royalty rates |
32
Table of Contents
| • | Expected synergies |
| • | Weighted average cost of equity |
The methodology for valuing indefinite-lived intangible assets is applied consistently. The Company believes the discounted cash flow valuation model provides the most reasonable and meaningful fair value estimate based upon the indefinite-lived intangible assets projected future cash flows and replicates how market participants would value the company’s intangible assets in an orderly transaction.
The Company did not recognize an impairment loss on its indefinite-lived intangible assets in 2010 or 2009, and recognized an impairment loss of $6.3 million in 2008.
Financial Instruments
The Company’s financial instruments consist of cash, accounts receivable, accounts payable, debt and interest rate caps. The Company’s estimates of fair value for financial instruments approximate their carrying amounts as of January 1, 2011 and January 2, 2010.
The Company applies the fair value measurement guidance in ASC 820, Fair Value Measurements and Disclosures, for financial assets and liabilities measured on a recurring basis. ASC 820 applies to all financial assets and financial liabilities that are being measured and reported on a fair value basis and provides the framework for measuring fair value of assets and liabilities.
The Company uses derivative financial instruments to manage exposures to movements in interest rates. Derivatives are not used for speculative or trading purposes. The Company accounts for derivative financial instruments in accordance with ASC 815, Derivatives and Hedging. As a result the Company recognizes derivative financial instruments in its Consolidated Financial Statements at fair value regardless of the purpose or intent of the instruments. Changes in fair values of derivatives accounted for as cash flow hedges, to the extent they are effective hedges, are originally recorded as a component of other comprehensive income, net of tax, and subsequently reclassified into earnings when the hedged exposure affects earnings. Changes in fair values of derivatives not qualifying as hedges are reported in earnings immediately.
Deferred Income Tax Valuation Allowance
The Company periodically evaluates its deferred income tax assets to assess the probability of ultimate realization. Upon determination that a deferred income tax asset may not be realized, a valuation allowance is established for the potential unrealizable amount. This evaluation process requires a review of the underlying transaction to determine that the conditions that led to the creation of the asset still exist and that the related tax benefit will be realized.
Uncertain Tax Positions
The Company applies the provisions of ASC 740, Income Taxes, as it relates to uncertainty in income taxes recognized in an enterprise’s financial statements and prescribes a threshold of more likely than not to be sustained upon examination. The Company deems the estimates related to this provision to be reasonable, however no assurance can be given that the final outcome of these matters will not vary from what is reflected in the historical income tax provisions and accruals.
Software Development Costs
Development costs incurred for research and development of new software products and enhancements to existing software products are expensed as incurred until technological feasibility is achieved. Technological feasibility is established upon completion of a detail program design or, in its absence, completion of a working
33
Table of Contents
model. After technological feasibility is achieved, any additional development costs are capitalized until the product is available for general release to customers and then amortized using the straight-line method over a three-year period.
Revenue Recognition
Revenue is recognized when earned in accordance with ASC 605, Revenue Recognition. Revenue from sales of products and services is recognized when a purchase order has been received, the product has been shipped or the service has been performed, the sales price is fixed and determinable, and collection of any resulting receivable is probable.
For transactions involving the sale of software which is not incidental to the product, revenue is recognized in accordance with ASC 985, Software Revenue Recognition. The Company recognizes revenue when there is persuasive evidence of an arrangement, delivery has occurred, the sales price is fixed or determinable and collection is probable. In instances where an arrangement contains multiple elements, the arrangement consideration is allocated to each deliverable based on the relative selling price. The selling price for each deliverable is based on vendor-specific objective evidence (VSOE) if available, third-party evidence if VSOE is not available, or estimated selling price if neither VSOE or third-party evidence is available.
OFF BALANCE SHEET ARRANGEMENTS AND CONTRACTUAL OBLIGATIONS
The Company has no significant off balance sheet transactions other than operating leases for equipment, real estate, and vehicles. It also is the Company’s policy not to issue guarantees to third parties. The following table sets forth information about the Company’s long-term contractual obligations outstanding at January 1, 2011, using data from the Consolidated Balance Sheet and the Notes to the Consolidated Financial Statements:
Contractual Obligations
| Payments Due by Period (in thousands) |
||||||||||||||||||||
| Total | Less Than 1 Year |
1-3 Years | 3-5 Years | After 5 Years |
||||||||||||||||
| Long-term debt |
$ | 136,598 | $ | 1,350 | $ | 135,248 | $ | — | $ | — | ||||||||||
| Mandatorily redeemable preferred stock |
46,980 | — | — | 46,980 | — | |||||||||||||||
| Interest on long-term debt and mandatorily redeemable preferred stock |
35,971 | 14,438 | 21,083 | 450 | — | |||||||||||||||
| Operating leases |
11,036 | 4,566 | 5,883 | 558 | 29 | |||||||||||||||
| Total contractual obligations |
$ | 230,585 | $ | 20,354 | $ | 162,214 | $ | 47,988 | $ | 29 | ||||||||||
At this time the Company is unable to make a reasonable estimate of the timing of tax payments in individual years beyond 12 months due to uncertainties in the timing of tax audit outcomes. The Company expects to contribute $1.7 million to its pension plan in 2011. Funding amounts are calculated on an annual basis and no required or planned funding beyond one year has been determined.
OTHER MATTERS
In November of 2001, the Company’s Board of Directors adopted a Shareholder Protection Rights Plan (the Plan), which became effective in the first quarter of 2002. The Plan is designed to protect shareholders against unsolicited attempts to acquire control of the Company in a manner that does not offer a fair price to all shareholders.
34
Table of Contents
Under the Plan, one Purchase Right (Right) automatically trades with each share of the Company’s common stock. Each Right entitles a shareholder to purchase 1/100 of a share of junior participating preferred stock at a price of $30.00, if any person or group attempts certain hostile takeover tactics toward the Company. Under certain hostile circumstances, each Right may entitle the holder to purchase the Company’s common stock at one-half its market value or to purchase the securities of any acquiring entity at one-half their market value. Rights are subject to redemption by the Company at $.005 per Right and, unless earlier redeemed, will expire in the first quarter 2012. Rights beneficially owned by holders of 15 percent or more of the Company’s common stock, or their transferees and affiliates, automatically become void. In August 2008, the Company amended the Plan to render it inapplicable to the transactions contemplated by the Corporate Recapitalization Plan. The plan was further amended in August 2009, to render it inapplicable to the transactions contemplated by the Exchange.
35
Table of Contents
| ITEM 7A. | QUANTITATIVE AND QUALITATIVE DISCLOSURES ABOUT MARKET RISK |
The Company is exposed to a variety of risks including foreign currency exchange fluctuations, and market volatility in its derivative and insurance portfolios. In the normal course of business, the Company employs established procedures to evaluate its risks and take corrective actions when necessary to manage these exposures.
The Company does not trade in financial instruments for speculative purposes.
Interest Rates
The Company is subject to interest rate risk principally in relation to variable-rate debt. The Company previously utilized interest rate swap contracts to manage the potential variability in interest rates associated with debt incurred in connection with past acquisitions. These agreements were terminated by the Company, and on December 30, 2008, the Company replaced these swap agreements with an interest rate cap. The interest rate cap limits the Company’s exposure to an increase in the 3 month LIBOR rate above 3 percent per annum. The notional amount of the cap at January 1, 2011 was $88.0 million. Other than the interest rate cap, the Company does not use any derivative instruments to hedge interest rate risk.
A hypothetical 25 basis point increase in interest rates during the year ended January 1, 2011 would have increased the interest expense reported in the Consolidated Financial Statements by $0.3 million.
Foreign Currency Exchange
Foreign currency exchange risks arise from transactions denominated in a currency other than the entity’s functional currency and from foreign denominated transactions translated into U.S. dollars. The Company’s largest exposures are to the Euro and Swiss Franc. As these currencies fluctuate relative to the dollar, it may cause profitability to increase or decrease accordingly. The hypothetical effect on net income (loss) caused by a 10 percent change in all foreign currencies would be approximately $1.1 and $1.7 million for the years ended January 1, 2011 and January 2, 2010, respectively.
36
Table of Contents
| ITEM 8. | FINANCIAL STATEMENTS AND SUPPLEMENTARY DATA |
The following reports, financial statements, and notes are included with this report:
37
Table of Contents
Management’s Report on Internal Control over Financial Reporting
Our management is responsible for establishing and maintaining adequate internal control over financial reporting, as such term is defined in Exchange Act Rules 13a-15(f) and 15d-15(f). Under the supervision and with the participation of our management, including our Chief Executive Officer and Chief Financial Officer, we conducted an evaluation of the effectiveness of our internal control over financial reporting as of January 1, 2011 based on the framework in Internal Control—Integrated Framework issued by the Committee of Sponsoring Organizations of the Treadway Commission (COSO).
Based on this evaluation and those criteria, our management concluded that our internal control over financial reporting was effective as of January 1, 2011.
Our independent registered public accounting firm, Ernst & Young LLP, has issued an attestation report on the effectiveness of our internal control over financial reporting, as stated in their report which appears on page 39.
38
Table of Contents
Report of Independent Registered Public Accounting Firm on Internal Control Over Financial Reporting
The Board of Directors and Shareholders of X-Rite, Incorporated
We have audited X-Rite, Incorporated and subsidiaries’ internal control over financial reporting as of January 1, 2011, based on criteria established in Internal Control—Integrated Framework issued by the Committee of Sponsoring Organizations of the Treadway Commission (the COSO criteria). X-Rite Incorporated and subsidiaries’ management is responsible for maintaining effective internal control over financial reporting, and for its assessment of the effectiveness of internal control over financial reporting included in the accompanying Management’s Report on Internal Control Over Financial Reporting. Our responsibility is to express an opinion on the Company’s internal control over financial reporting based on our audit.
We conducted our audit in accordance with the standards of the Public Company Accounting Oversight Board (United States). Those standards require that we plan and perform the audit to obtain reasonable assurance about whether effective internal control over financial reporting was maintained in all material respects. Our audit included obtaining an understanding of internal control over financial reporting, assessing the risk that a material weakness exists, testing and evaluating the design and operating effectiveness of internal control based on the assessed risk, and performing such other procedures as we considered necessary in the circumstances. We believe that our audit provides a reasonable basis for our opinion.
A company’s internal control over financial reporting is a process designed to provide reasonable assurance regarding the reliability of financial reporting and the preparation of financial statements for external purposes in accordance with generally accepted accounting principles. A company’s internal control over financial reporting includes those policies and procedures that (1) pertain to the maintenance of records that, in reasonable detail, accurately and fairly reflect the transactions and dispositions of the assets of the company; (2) provide reasonable assurance that transactions are recorded as necessary to permit preparation of financial statements in accordance with generally accepted accounting principles, and that receipts and expenditures of the company are being made only in accordance with authorizations of management and directors of the company; and (3) provide reasonable assurance regarding prevention or timely detection of unauthorized acquisition, use or disposition of the company’s assets that could have a material effect on the financial statements.
Because of its inherent limitations, internal control over financial reporting may not prevent or detect misstatements. Also, projections of any evaluation of effectiveness to future periods are subject to the risk that controls may become inadequate because of changes in conditions, or that the degree of compliance with the policies or procedures may deteriorate.
In our opinion, X-Rite, Incorporated and subsidiaries maintained, in all material respects, effective internal control over financial reporting as of January 1, 2011, based on the COSO criteria.
We also have audited, in accordance with the standards of the Public Company Accounting Oversight Board (United States), the consolidated balance sheets of X-Rite, Incorporated and subsidiaries as of January 1, 2011 and January 2, 2010 and the related consolidated statements of operations, shareholders’ investment, and cash flows for each of the three years in the period ended January 1, 2011 and our report dated March 17, 2011 expressed an unqualified opinion thereon.
/s/ Ernst & Young LLP
Grand Rapids, Michigan
March 17, 2011
39
Table of Contents
Report of Independent Registered Public Accounting Firm on Financial Statements
The Board of Directors and Shareholders of X-Rite, Incorporated
We have audited the accompanying consolidated balance sheets of X-Rite, Incorporated and subsidiaries (the Company) as of January 1, 2011 and January 2, 2010, and the related consolidated statements of operations, shareholders’ investment, and cash flows for each of the three years in the period ended January 1, 2011. Our audits also included the financial statement schedule listed in the Index at Item 15(a). These financial statements and schedule are the responsibility of the Company’s management. Our responsibility is to express an opinion on these financial statements and schedule based on our audits.
We conducted our audits in accordance with the standards of the Public Company Accounting Oversight Board (United States). Those standards require that we plan and perform the audit to obtain reasonable assurance about whether the financial statements are free of material misstatement. An audit includes examining, on a test basis, evidence supporting the amounts and disclosures in the financial statements. An audit also includes assessing the accounting principles used and significant estimates made by management, as well as evaluating the overall financial statement presentation. We believe that our audits provide a reasonable basis for our opinion.
In our opinion, the financial statements referred to above present fairly, in all material respects, the consolidated financial position of X-Rite, Incorporated and subsidiaries at January 1, 2011 and January 2, 2010, and the consolidated results of their operations and their cash flows for each of the three years in the period ended January 1, 2011, in conformity with U.S. generally accepted accounting principles. Also, in our opinion, the related financial statement schedule, when considered in relation to the basic financial statements taken as a whole, presents fairly in all material respects the information set forth therein.
We also have audited, in accordance with the standards of the Public Company Accounting Oversight Board (United States), X-Rite, Incorporated and subsidiaries’ internal control over financial reporting as of January 1, 2011, based on criteria established in Internal Control—Integrated Framework issued by the Committee of Sponsoring Organizations of the Treadway Commission and our report dated March 17, 2011 expressed an unqualified opinion thereon.
/s/ Ernst & Young LLP
Grand Rapids, Michigan
March 17, 2011
40
Table of Contents
X-RITE, INCORPORATED AND SUBSIDIARIES
CONSOLIDATED BALANCE SHEETS
(in thousands, except share and per share data)
| January 1, 2011 |
January 2, 2010 |
|||||||
| ASSETS |
||||||||
| Current assets: |
||||||||
| Cash |
$ | 11,709 | $ | 29,050 | ||||
| Accounts receivable, less allowance of $1,780 in 2010 and $2,561 in 2009 |
31,796 | 29,894 | ||||||
| Inventories, net |
27,670 | 28,467 | ||||||
| Deferred income taxes |
697 | 1,115 | ||||||
| Refundable income taxes |
30 | 3,424 | ||||||
| Prepaid expenses and other current assets |
4,929 | 5,928 | ||||||
| 76,831 | 97,878 | |||||||
| Property, plant and equipment: |
||||||||
| Land |
2,796 | 2,796 | ||||||
| Buildings and improvements |
23,213 | 23,036 | ||||||
| Machinery and equipment |
33,570 | 30,727 | ||||||
| Furniture and office equipment |
25,560 | 25,082 | ||||||
| Construction in progress |
5,063 | 2,664 | ||||||
| 90,202 | 84,305 | |||||||
| Less accumulated depreciation |
(50,037 | ) | (43,180 | ) | ||||
| 40,165 | 41,125 | |||||||
| Other assets: |
||||||||
| Goodwill and indefinite-lived intangibles |
247,385 | 247,453 | ||||||
| Other intangibles, net |
55,439 | 67,399 | ||||||
| Capitalized software, net of accumulated amortization of $9,229 in 2010 and $8,266 in 2009 |
12,080 | 9,100 | ||||||
| Deferred financing costs, net of accumulated amortization of $6,609 in 2010 and $5,201 in 2009 |
5,202 | 8,629 | ||||||
| Derivative financial instruments |
8 | 714 | ||||||
| Other noncurrent assets |
1,985 | 2,226 | ||||||
| 322,099 | 335,521 | |||||||
| $ | 439,095 | $ | 474,524 | |||||
The accompanying notes are an integral part of these statements.
41
Table of Contents
X-RITE, INCORPORATED AND SUBSIDIARIES
CONSOLIDATED BALANCE SHEETS—Continued
(in thousands, except share and per share data)
| January 1, 2011 |
January 2, 2010 |
|||||||
| LIABILITIES AND SHAREHOLDERS’ INVESTMENT |
||||||||
| Current liabilities: |
||||||||
| Current portion of long-term debt |
$ | 1,350 | $ | 7,234 | ||||
| Accounts payable |
12,948 | 10,507 | ||||||
| Accrued liabilities: |
||||||||
| Payroll and employee benefits |
14,017 | 6,583 | ||||||
| Restructuring |
— | 898 | ||||||
| Income taxes |
292 | 584 | ||||||
| Interest |
43 | 3,809 | ||||||
| Deferred revenue |
2,007 | 2,615 | ||||||
| Other |
4,170 | 6,658 | ||||||
| 34,827 | 38,888 | |||||||
| Long-term liabilities: |
||||||||
| Long-term debt, less current portion |
135,248 | 176,400 | ||||||
| Mandatorily redeemable preferred stock, $.10 par value 84,729 shares authorized; 46,980 and 43,777 shares issued and outstanding in 2010 and 2009, respectively; stated redemption amounts of $46,980 and $43,777 presented net of warrant discount of $10,615 and $14,065 in 2010 and 2009, respectively |
36,402 | 29,764 | ||||||
| Long-term compensation and benefits |
1,109 | 1,143 | ||||||
| Deferred income taxes |
3,182 | 8,498 | ||||||
| Accrued income taxes |
6,611 | 6,859 | ||||||
| Other |
176 | 853 | ||||||
| 182,728 | 223,517 | |||||||
| Shareholders’ investment: |
||||||||
| Common stock, $.10 par value, 100,000,000 shares authorized; 84,805,040 and 84,120,668 shares issued and outstanding in 2010 and 2009, respectively |
8,481 | 8,412 | ||||||
| Additional paid-in capital |
274,697 | 271,013 | ||||||
| Retained deficit |
(73,111 | ) | (76,752 | ) | ||||
| Accumulated other comprehensive income |
11,473 | 9,446 | ||||||
| 221,540 | 212,119 | |||||||
| $ | 439,095 | $ | 474,524 | |||||
The accompanying notes are an integral part of these statements.
42
Table of Contents
X-RITE, INCORPORATED AND SUBSIDIARIES
CONSOLIDATED STATEMENTS OF OPERATIONS
(in thousands, except per share data)
| For the Year Ended | ||||||||||||
| January 1, 2011 |
January 2, 2010 |
January 3, 2009 |
||||||||||
| Net Sales |
$ | 222,740 | $ | 191,667 | $ | 261,491 | ||||||
| Cost of sales: |
||||||||||||
| Products sold |
89,659 | 80,921 | 109,680 | |||||||||
| Inventory valuation adjustment |
— | — | 12,817 | |||||||||
| Restructuring and other related charges |
— | 143 | 368 | |||||||||
| 89,659 | 81,064 | 122,865 | ||||||||||
| Gross profit |
133,081 | 110,603 | 138,626 | |||||||||
| Operating expenses: |
||||||||||||
| Selling and marketing |
56,448 | 51,853 | 64,896 | |||||||||
| Research, development, and engineering |
23,686 | 22,593 | 29,397 | |||||||||
| General and administrative |
22,010 | 27,888 | 35,233 | |||||||||
| Restructuring and other related charges |
2,008 | 4,448 | 5,892 | |||||||||
| Goodwill and indefinite-lived intangibles impairment |
— | — | 58,072 | |||||||||
| 104,152 | 106,782 | 193,490 | ||||||||||
| Operating income (loss) |
28,929 | 3,821 | (54,864 | ) | ||||||||
| Interest expense |
(27,981 | ) | (33,523 | ) | (46,251 | ) | ||||||
| Write-off of deferred financing costs |
(1,091 | ) | (2,265 | ) | (3,824 | ) | ||||||
| Other, net |
1,546 | 2,033 | (1,176 | ) | ||||||||
| Income (loss) before income taxes |
1,403 | (29,934 | ) | (106,115 | ) | |||||||
| Income taxes (benefits) |
(2,238 | ) | (4,692 | ) | 11,709 | |||||||
| Net income (loss) |
$ | 3,641 | $ | (25,242 | ) | $ | (117,824 | ) | ||||
| Basic and diluted net income (loss) per share: |
$ | 0.04 | $ | (0.33 | ) | $ | (3.12 | ) | ||||
The accompanying notes are an integral part of these statements.
43
Table of Contents
X-RITE, INCORPORATED AND SUBSIDIARIES
CONSOLIDATED STATEMENTS OF SHAREHOLDERS’ INVESTMENT
(in thousands)
| Shares | Common Stock |
Additional Paid-in Capital |
Retained Earnings (Deficit) |
Accumulated Other Comprehensive Income (Loss) |
Total Shareholders’ Investment |
|||||||||||||||||||
| BALANCES, DECEMBER 29, 2007 |
29,026 | 2,903 | 109,439 | 66,314 | 5,648 | 184,304 | ||||||||||||||||||
| Net loss |
— | — | — | (117,824 | ) | — | (117,824 | ) | ||||||||||||||||
| Translation adjustment |
— | — | — | — | 153 | 153 | ||||||||||||||||||
| Unrealized loss on derivative financial instruments (net of tax benefits of $1,730) |
— | — | — | — | (3,239 | ) | (3,239 | ) | ||||||||||||||||
| Pension adjustments |
— | — | — | — | (456 | ) | (456 | ) | ||||||||||||||||
| Other |
— | — | — | — | (145 | ) | (145 | ) | ||||||||||||||||
| Total comprehensive loss |
(121,511 | ) | ||||||||||||||||||||||
| Share-based compensation |
— | — | 4,061 | — | — | 4,061 | ||||||||||||||||||
| Issuance / release of shares under employee benefit plans, including tax benefits |
492 | 49 | 1,607 | — | — | 1,656 | ||||||||||||||||||
| Issuance of shares pursuant to recapitalization |
46,905 | 4,690 | 136,092 | — | — | 140,782 | ||||||||||||||||||
| BALANCES, JANUARY 3, 2009 |
76,423 | 7,642 | 251,199 | (51,510 | ) | 1,961 | 209,292 | |||||||||||||||||
| Net loss |
— | — | — | (25,242 | ) | — | (25,242 | ) | ||||||||||||||||
| Translation adjustment |
— | — | — | — | 3,115 | 3,115 | ||||||||||||||||||
| Unrealized gain on derivative financial instruments (net of tax benefits of $1,243) |
— | — | — | — | 4,550 | 4,550 | ||||||||||||||||||
| Pension adjustments |
— | — | — | — | (226 | ) | (226 | ) | ||||||||||||||||
| Other |
— | — | — | — | 46 | 46 | ||||||||||||||||||
| Total comprehensive loss |
(17,757 | ) | ||||||||||||||||||||||
| Share-based compensation |
— | — | 4,904 | — | — | 4,904 | ||||||||||||||||||
| Issuance / release of shares under employee benefit plans, including tax benefits |
198 | 20 | 92 | — | — | 112 | ||||||||||||||||||
| Issuance of shares pursuant to warrant exercise |
7,500 | 750 | 14,850 | 15,600 | ||||||||||||||||||||
| Other |
— | — | (32 | ) | — | (32 | ) | |||||||||||||||||
| BALANCES, JANUARY 2, 2010 |
84,121 | 8,412 | 271,013 | (76,752 | ) | 9,446 | 212,119 | |||||||||||||||||
| Net income |
— | — | — | 3,641 | — | 3,641 | ||||||||||||||||||
| Translation adjustment |
— | — | — | — | (730 | ) | (730 | ) | ||||||||||||||||
| Unrealized gain on derivative financial instruments (net of tax benefits of $585) |
— | — | — | — | 999 | 999 | ||||||||||||||||||
| Pension adjustments |
— | — | — | — | 1,758 | 1,758 | ||||||||||||||||||
| Total comprehensive income |
5,668 | |||||||||||||||||||||||
| Share-based compensation |
— | — | 2,736 | — | — | 2,736 | ||||||||||||||||||
| Issuance / release of shares under employee benefit plans, including tax benefits |
684 | 69 | 948 | — | — | 1,017 | ||||||||||||||||||
| BALANCES, JANUARY 1, 2011 |
84,805 | $ | 8,481 | $ | 274,697 | $ | (73,111 | ) | $ | 11,473 | $ | 221,540 | ||||||||||||
The accompanying notes are an integral part of these statements.
44
Table of Contents
X-RITE, INCORPORATED AND SUBSIDIARIES
CONSOLIDATED STATEMENTS OF CASH FLOWS
(in thousands)
| For the Year Ended | ||||||||||||
| January 1, 2011 |
January 2, 2010 |
January 3, 2009 |
||||||||||
| CASH FLOWS FROM OPERATING ACTIVITIES: |
||||||||||||
| Net income (loss) |
$ | 3,641 | $ | (25,242 | ) | $ | (117,824 | ) | ||||
| Adjustments to reconcile net loss to net cash provided by operating activities: |
||||||||||||
| Depreciation |
6,164 | 6,388 | 6,998 | |||||||||
| Amortization |
16,217 | 20,129 | 21,212 | |||||||||
| Amortization of deferred financing costs |
2,765 | 2,907 | 3,052 | |||||||||
| Paid-in-kind interest accrued |
3,188 | 2,422 | — | |||||||||
| Amortization of discount on mandatorily redeemable preferred stock |
3,450 | 1,460 | — | |||||||||
| Deferred income taxes (credit) |
(4,898 | ) | (2,734 | ) | (567 | ) | ||||||
| Impairment of long-lived assets |
— | — | 364 | |||||||||
| Goodwill and indefinite lived-intangible impairment |
— | — | 58,072 | |||||||||
| Pension and postretirement benefit expense |
2,409 | 1,850 | 1,860 | |||||||||
| Share-based compensation |
2,736 | 4,904 | 4,061 | |||||||||
| Excess tax benefit from stock-based compensation |
(102 | ) | — | (10 | ) | |||||||
| Gain (loss) on sale of assets |
280 | (4,429 | ) | (859 | ) | |||||||
| Restructuring and other related charges |
2,008 | 4,591 | 6,260 | |||||||||
| Write-off of deferred financing costs |
1,091 | 2,265 | 3,824 | |||||||||
| Derivative fair value adjustments and charges |
1,692 | 4,987 | 5,342 | |||||||||
| Other |
— | 46 | 45 | |||||||||
| Changes in operating assets and liabilities, net of effects from acquisitions: |
||||||||||||
| Accounts receivable |
(433 | ) | 9,761 | 11,216 | ||||||||
| Inventories |
389 | 10,788 | 21,960 | |||||||||
| Prepaid expenses and other current assets |
2,599 | 2,037 | 628 | |||||||||
| Accounts payable |
2,216 | (2,988 | ) | (3,582 | ) | |||||||
| Income taxes |
(702 | ) | (9,883 | ) | 7,448 | |||||||
| Other current and non-current liabilities |
(1,763 | ) | (9,006 | ) | (19,823 | ) | ||||||
| Net cash provided by operating activities |
42,947 | 20,253 | 9,677 | |||||||||
| CASH FLOWS FROM INVESTING ACTIVITIES: |
||||||||||||
| Capital expenditures |
(5,286 | ) | (4,732 | ) | (4,011 | ) | ||||||
| Investment in Founders’ life insurance, net |
— | — | 1,644 | |||||||||
| Increase in capitalized software |
(6,483 | ) | (4,372 | ) | (4,027 | ) | ||||||
| Proceeds from sale of assets |
294 | 13,045 | 20,992 | |||||||||
| Acquisitions, net of cash acquired |
— | — | 249 | |||||||||
| Net cash provided by (used for) investing activities |
(11,475 | ) | 3,941 | 14,847 | ||||||||
| CASH FLOWS FROM FINANCING ACTIVITIES: |
||||||||||||
| Proceeds from issuance of long-term debt |
16,500 | — | 20,500 | |||||||||
| Payment of long-term debt |
(63,536 | ) | (45,892 | ) | (139,246 | ) | ||||||
| Payment of interest rate swap liability |
— | — | (12,480 | ) | ||||||||
| Purchase of interest rate cap |
— | (1,565 | ) | — | ||||||||
| Proceeds from sale of portion of notional amount of interest rate cap |
14 | 484 | — | |||||||||
| Debt amendment and equity issuance costs |
(429 | ) | (1,603 | ) | (17,580 | ) | ||||||
| Issuance of common stock |
915 | 186 | 155,197 | |||||||||
| Excess tax benefit from stock-based compensation |
102 | — | 10 | |||||||||
| Net cash provided by (used for) financing activities |
(46,434 | ) | (48,390 | ) | 6,401 | |||||||
| EFFECT OF EXCHANGE RATE CHANGES ON CASH |
(2,379 | ) | 2,411 | (390 | ) | |||||||
| NET INCREASE (DECREASE) IN CASH |
(17,341 | ) | (21,785 | ) | 30,535 | |||||||
| CASH AT BEGINNING OF YEAR |
29,050 | 50,835 | 20,300 | |||||||||
| CASH AT END OF YEAR |
$ | 11,709 | $ | 29,050 | $ | 50,835 | ||||||
The accompanying notes are an integral part of these statements.
45
Table of Contents
X-RITE, INCORPORATED AND SUBSIDIARIES
NOTES TO CONSOLIDATED FINANCIAL STATEMENTS
NOTE 1—THE COMPANY AND SUMMARY OF SIGNIFICANT ACCOUNTING POLICIES
X-Rite, Incorporated is a technology company that develops a full range of color management systems. The Company’s technologies assist manufacturers, retailers, and distributors in achieving precise color appearance throughout their global supply chain. X-Rite products include hardware, software, and color standards which assist printing companies, graphic designers, and professional photographers in achieving precise color communication and reproduction across a wide range of devices. The Company’s products also provide retailers color harmony solutions at point of purchase. The key markets served include Imaging and Media, Retail, and Industrial.
Products are sold worldwide through the Company’s own sales personnel and through independent sales representatives and dealers. The Company is headquartered in Grand Rapids, Michigan and has other domestic facilities in New Jersey, Massachusetts, and North Carolina. In addition, the Company has locations in Switzerland, Germany, England, France, Italy, Spain, the Czech Republic, Russia, China, Hong Kong, and Japan. Manufacturing facilities are located in the United States, Switzerland, and Germany.
Principles of Consolidation
The Consolidated Financial Statements include the accounts of X-Rite, Incorporated and its subsidiaries. All inter-company accounts and transactions have been eliminated.
Fiscal Year
The Company reports its operations and cash flows on a 52-53 week basis ending on the Saturday closest to December 31. The fiscal years ended January 1, 2011 (fiscal year 2010) and January 2, 2010 (fiscal year 2009) contained 52 weeks while the fiscal year ended January 3, 2009 (fiscal year 2008) contained 53 weeks.
Financial Instruments
The Company’s financial instruments consist of cash, accounts receivable, accounts payable, debt and interest rate caps. The Company’s estimates of fair value for financial instruments approximate their carrying amounts as of January 1, 2011 and January 2, 2010.
The Company applies the fair value measurement guidance in Accounting Standards Codification (ASC) 820, Fair Value Measurements and Disclosures, for financial assets and liabilities measured on a recurring basis. ASC 820 applies to all financial assets and financial liabilities that are being measured and reported on a fair value basis and provides the framework for measuring fair value of assets and liabilities.
The Company uses derivative financial instruments to manage exposures to movements in interest rates. Derivatives are not used for speculative or trading purposes. The Company accounts for derivative financial instruments in accordance with ASC 815, Derivatives and Hedging. As a result the Company recognizes derivative financial instruments in its Consolidated Financial Statements at fair value regardless of the purpose or intent of the instruments. Changes in fair values of derivatives accounted for as cash flow hedges, to the extent they are effective hedges, are originally recorded as a component of other comprehensive income, net of tax, and subsequently reclassified into earnings when the hedged exposure affects earnings. Changes in fair values of derivatives not qualifying as hedges are reported in earnings immediately.
Accounts Receivable Allowance
The carrying amount of accounts receivable is reduced by a valuation allowance that reflects an estimate of the amounts that will not be collected. The valuation allowance is comprised of an allowance for doubtful
46
Table of Contents
X-RITE, INCORPORATED AND SUBSIDIARIES
NOTES TO CONSOLIDATED FINANCIAL STATEMENTS—(Continued)
NOTE 1—THE COMPANY AND SUMMARY OF SIGNIFICANT ACCOUNTING POLICIES—continued
accounts and sales returns. In addition to reviewing delinquent accounts receivable, other factors are considered in estimating the allowance, including historical data, customer types, credit worthiness and economic trends. Actual collections may differ, requiring adjustments to the allowance.
Inventories
Inventories are stated at the lower of cost, determined on a first-in, first-out basis, or market. Reserves are established for excess and obsolete inventory, based on the Company’s on hand inventory levels versus historical demand. Components of inventories are summarized as follows (in thousands):
| January 1, 2011 |
January 2, 2010 |
|||||||
| Raw materials |
$ | 16,309 | $ | 13,675 | ||||
| Work in process |
14,491 | 15,989 | ||||||
| Finished goods |
8,697 | 9,932 | ||||||
| Gross Inventories |
39,497 | 39,596 | ||||||
| Reserves |
(11,827 | ) | (11,129 | ) | ||||
| Inventories, net |
$ | 27,670 | $ | 28,467 | ||||
Property, Plant, and Equipment and Depreciation
Property, plant and equipment are stated at cost and include expenditures for major renewals and improvements. Maintenance and repairs that do not extend the lives of the respective assets are charged to expense as incurred. Depreciation expense is computed using the straight-line method over the estimated useful lives of the related assets. Estimated depreciable lives are as follows: buildings and improvements, 1 to 40 years; machinery and equipment, 1 to 11 years; and furniture and office equipment, 1 to 13 years.
Software Development Costs
Development costs incurred for research and development of new software products and enhancements to existing software products are expensed as incurred until technological feasibility is achieved. Technological feasibility is established upon completion of a detail program design or, in its absence, completion of a working model. After technological feasibility is achieved, any additional development costs are capitalized until the product is available for general release to customers and then amortized using the straight-line method over a three-year period.
The Company capitalized $6.5, $4.4, and $4.0 million of software development costs during 2010, 2009, and 2008, respectively. Amortization expense was $3.7, $3.4 and $3.8 million in 2010, 2009, and 2008, respectively.
Goodwill and Indefinite-Lived Intangibles
The Company accounts for goodwill and other indefinite-lived intangible assets in accordance with ASC 350, Goodwill and Other Intangible Assets. ASC 350 requires companies to review goodwill and intangible assets with indefinite useful lives for impairment annually, or more frequently if indicators of impairment occur. Impairment indicators could include a significant adverse change in the business climate, operating performance indicators, or the decision to sell or dispose of a reporting unit.
47
Table of Contents
X-RITE, INCORPORATED AND SUBSIDIARIES
NOTES TO CONSOLIDATED FINANCIAL STATEMENTS—(Continued)
NOTE 1—THE COMPANY AND SUMMARY OF SIGNIFICANT ACCOUNTING POLICIES—continued
The Company is required to test the carrying value of goodwill for impairment at the reporting unit level (operating segment or one level below an operating segment). A discounted cash flow method is used to establish the fair value of reporting units. This model requires the use of estimates concerning discount rates and future cash flows of each reporting unit to determine estimated fair values. An impairment charge is recognized for any amount by which the carrying amount of a reporting unit’s goodwill exceeds its implied fair value. Changes in forecasted operations and changes in discount rates can materially affect these estimates. Once an impairment of goodwill has been recorded, it cannot be reversed.
The indefinite-lived intangible asset impairment review consists of a comparison of the fair value of the indefinite-lived intangible asset with its carrying amount. If the carrying amount exceeds its fair value, an impairment loss is recognized in an amount equal to that excess. If the fair value exceeds its carrying amount, the indefinite-lived intangible asset is not considered impaired. ASC 350 also requires that intangible assets with estimable useful lives be amortized over their respective estimated useful lives, and reviewed for impairment in accordance with ASC 360, Accounting for the Impairment or Disposal of Long-Lived Assets as discussed below.
Long-Lived Assets
In accordance with ASC 360, when there are indicators of impairment, the Company evaluates the recoverability of its long-lived assets by determining whether unamortized balances could be recovered through undiscounted future operating cash flows over the remaining lives of the assets. The estimated fair value is determined by discounting the expected future cash flows at a rate that is required for a similar investment with like risks. If the sum of the expected future cash flows is less than the carrying value of the assets, an impairment loss would be recognized for the excess of the carrying value over the fair value.
The Company concluded that the continued weakening of the global economy, the decline in X-Rite’s price per common share of stock throughout 2008, lower than expected operating profits and cash flows were triggering events warranting an impairment analysis on the Company’s long-lived assets in 2008. As a result of the analysis, there was no impairment indicated. Long-lived assets were also considered fully recoverable in 2010 and 2009.
Assets held for sale are stated at the lower of depreciated cost or estimated fair value less costs to sell. As of January 3, 2009, the Company had $7.3 million in assets held for sale, which relate to the Company’s former corporate headquarters (see Note 5), which was sold in the first quarter of 2009. In the fourth quarter of 2008, the Company wrote down the carrying value of the former headquarters by $0.3 million.
Mandatorily Redeemable Preferred Stock
In accordance with ASC 480, Accounting for Certain Financial Instruments with Characteristics of Both Liabilities and Equity, the mandatorily redeemable preferred stock is classified as a noncurrent liability in the accompanying Consolidated Balance Sheets due to its mandatory redemption feature.
Deferred Financing Costs
The Company capitalizes costs incurred in connection with the establishment of credit facilities and related borrowings. These costs are amortized to interest expense over the life of the borrowing or life of the credit facility using the straight-line method, which approximates the interest method. In the case of early debt principal repayments, the Company adjusts the value of the corresponding deferred financing costs with a charge to interest expense, and similarly adjusts the future amortization expense.
48
Table of Contents
X-RITE, INCORPORATED AND SUBSIDIARIES
NOTES TO CONSOLIDATED FINANCIAL STATEMENTS—(Continued)
NOTE 1—THE COMPANY AND SUMMARY OF SIGNIFICANT ACCOUNTING POLICIES—continued
Revenue Recognition
Revenue is recognized when earned in accordance with ASC 605, Revenue Recognition. Revenue from sales of products and services is recognized when a purchase order has been received, the product has been shipped or the service has been performed, the sales price is fixed and determinable, and collection of any resulting receivable is probable. To the extent customer payment is received before all recognition criteria has been met these revenues are initially deferred and later recognized in the period that all recognition criteria has been met.
The Company executes sales through various channels including distributors, e-commerce, end user, and a direct sales force. The Company offers standard payment terms which vary from net 30 to net 90 days, based on regional practice. The Company does not offer return rights, price protection or exchange provisions. In certain instances the Company provides volume based discounts.
For transactions involving the sale of software which is not incidental to the product, revenue is recognized in accordance with ASC 985, Software Revenue Recognition. The Company recognizes revenue when there is persuasive evidence of an arrangement, delivery has occurred, the sales price is fixed or determinable and collection is probable. In instances where an arrangement contains multiple elements, the arrangement consideration is allocated to each deliverable based on the relative selling price. The selling price for each deliverable is based on vendor-specific objective evidence (VSOE) if available, third-party evidence if VSOE is not available, or estimated selling price if neither VSOE or third-party evidence is available.
Shipping and Handling
The Company records shipping and handling charged to customers in net sales and the related expenses in cost of sales in the Consolidated Statements of Operations.
Advertising Costs
Advertising costs are charged to operations in the period incurred and totaled $0.5, $0.6 and $0.7 million in 2010, 2009 and 2008, respectively.
Income Taxes
Income taxes are accounted for in accordance with ASC 740, Accounting for Income Taxes. Income tax expense includes the current tax obligation or benefit and the change in deferred income tax balance for the period. Deferred income taxes result from the temporary differences between financial and income tax bases of certain assets and liabilities and are measured using the statutory tax rates expected to apply to the taxable income in the years in which those temporary differences are expected to reverse. The Company records valuation allowances on its deferred income tax assets for which it is not more likely than not that a future benefit will be received. Uncertain tax positions are recognized at the largest amount of benefit that is more likely than not of being recognized upon ultimate settlement with the tax authority.
Self-Insurance Reserves
The Company is self insured up to certain limits for costs associated with benefits paid under health care programs for its domestic employees. The measurement of these costs requires the consideration of historic loss experience and judgments about the present and expected levels of costs per claim. These costs are accounted for through actuarial methods, which develop estimates of the undiscounted liability for claims incurred, including those claims incurred but not reported. This method provides estimates of future ultimate claim costs based on claims incurred as of the balance sheet date.
49
Table of Contents
X-RITE, INCORPORATED AND SUBSIDIARIES
NOTES TO CONSOLIDATED FINANCIAL STATEMENTS—(Continued)
NOTE 1—THE COMPANY AND SUMMARY OF SIGNIFICANT ACCOUNTING POLICIES—continued
Accumulated Other Comprehensive Income
The components of ending accumulated other comprehensive income, net of tax, are as follows (in thousands):
| 2010 | 2009 | |||||||
| Currency translation adjustments |
$ | 11,541 | $ | 12,271 | ||||
| Net unrealized loss on derivative instruments |
(900 | ) | (1,899 | ) | ||||
| Pensions adjustments |
832 | (926 | ) | |||||
| Accumulated other comprehensive income |
$ | 11,473 | $ | 9,446 | ||||
Stock Option Plans
The Company accounts for its employee and outside director share-based compensation plans in accordance with ASC 718, Share-Based Payment, which requires the measurement and recognition of compensation expense for all share-based payment awards made to employees and directors, including employee stock options and employee stock purchases under the Employee Stock Purchase Plan, based on estimated fair values. The Company’s employee and outside director stock option plans are disclosed in Note 8.
Per Share Data
Basic earnings per share (EPS) is computed by dividing net income (loss) by the weighted average number of common shares outstanding in each year. Diluted EPS is computed by dividing net income (loss) by the weighted average number of common shares outstanding plus all shares that would have been outstanding if every potentially dilutive common share had been issued. The following table reconciles the numerators and denominators used in the calculations of basic and diluted EPS for each of the last three years (in thousands, except per share data):
| 2010 | 2009 | 2008 | ||||||||||
| Numerators: |
||||||||||||
| Net income (loss) used in calculating basic and diluted EPS |
$ | 3,641 | $ | (25,242 | ) | $ | (117,824 | ) | ||||
| Denominators: |
||||||||||||
| Weighted average shares outstanding |
85,189 | 77,500 | 37,753 | |||||||||
| Adjustment for non-vested restricted common stock |
(775 | ) | — | — | ||||||||
| Shares used in calculating basic EPS |
84,414 | 77,500 | 37,753 | |||||||||
| Effect of dilutive stock options, awards, and units |
1,385 | — | — | |||||||||
| Shares used in calculating diluted EPS |
85,799 | 77,500 | 37,753 | |||||||||
| Net income (loss) per share: |
||||||||||||
| Basic and Diluted |
$ | 0.04 | $ | (0.33 | ) | $ | (3.12 | ) | ||||
The number of stock options, awards, and warrants that were not included in the diluted earnings per share calculation because the effect would have been anti-dilutive was approximately 3,090,000 in 2010, 7,555,000 in 2009, and 3,319,000 in 2008.
50
Table of Contents
X-RITE, INCORPORATED AND SUBSIDIARIES
NOTES TO CONSOLIDATED FINANCIAL STATEMENTS—(Continued)
NOTE 1—THE COMPANY AND SUMMARY OF SIGNIFICANT ACCOUNTING POLICIES—continued
Foreign Currency Translation
Most of the Company’s foreign operations use their local currency as their functional currency. Accordingly, foreign currency balance sheet accounts are translated into U.S. dollars at the exchange rate in effect at year-end, and income statement accounts are translated at the average rate of exchange in effect during the year. The resulting translation adjustments are recorded as a component of accumulated other comprehensive income in the Consolidated Statements of Shareholders’ Investment. Gains and losses arising from re-measuring foreign currency transactions into the functional currency are included in the determination of net income (loss). Net realized and unrealized gains and (losses) from re-measurement of foreign currency transactions were $1.6, $(2.5), and $(2.2) million for 2010, 2009, and 2008, respectively.
Use of Estimates
The preparation of the Company’s Consolidated Financial Statements requires the use of estimates and assumptions that affect the reported amounts of assets and liabilities, the reported amounts of revenues and expenses and the disclosure of contingent liabilities. Management makes its best estimate of the ultimate outcome for these items based on the historic trends and other information available when the financial statements are prepared. Changes in estimates are recognized in accordance with the accounting rules for the estimate, which is typically in the period when new information becomes available to management. Actual results could differ from those estimates; however, management believes that any subsequent revisions to estimates used would not have a material effect on the financial condition or results of operations of the Company.
New Accounting Standards
In October 2009, the Financial Accounting Standards Board (FASB) issued Accounting Standards Update (ASU) No. 2009-13 Revenue Recognition (ASC 605): Multiple-Deliverable Revenue Arrangements, which changes the requirements for establishing separate units of accounting in a multiple element arrangement and requires the allocation of arrangement consideration to each deliverable based on the relative selling price. The selling price for each deliverable is based on vendor-specific objective evidence (VSOE) if available, third-party evidence if VSOE is not available, or estimated selling price if neither VSOE or third-party evidence is available. The Company adopted ASU No. 2009-13 during the first quarter of 2010 and the standard had no impact to the Company’s financial condition, results of operations or cash flows.
In October 2009, the FASB issued ASU No. 2009-14 Software (ASC 985): Certain Revenue Arrangements That Include Software Elements, which modifies the scope of the software revenue recognition guidance to exclude (i) non-software components of tangible products and (ii) software components of tangible products that are sold, licensed or leased with tangible products when the software components and non-software components of the tangible product function together to deliver the tangible product’s essential functionality. The Company adopted ASU No. 2009-14 in the first quarter of 2010 and the standard had no impact on the Company’s financial condition, results of operations, or cash flows.
In January 2010, the FASB issued ASU No. 2010-06 Fair Value Measurements and Disclosures (Topic 820): Improving Disclosures about Fair Value Measurements. This standard requires disclosure on the amount and reason for transfers in and out of Level 1 and 2 fair value measurements. The standard also requires disclosure of activities, including purchases, sales, issuances, and settlements within the Level 3 fair value measurement. The standard also clarifies existing disclosure requirements on levels of disaggregation and
51
Table of Contents
X-RITE, INCORPORATED AND SUBSIDIARIES
NOTES TO CONSOLIDATED FINANCIAL STATEMENTS—(Continued)
NOTE 1—THE COMPANY AND SUMMARY OF SIGNIFICANT ACCOUNTING POLICIES—continued
disclosures about inputs and valuation techniques. We adopted the disclosure requirements of this standard on January 3, 2010, except for the disclosures about purchases, sales, issuances and settlements in the Level 3 reconciliation, which are effective for fiscal years beginning after December 15, 2010 (fiscal 2011 for the Company). The adoption of the required disclosures did not have an impact on our financial position or results of operations. We do not expect that the adoption of the remaining guidance will have an impact on our financial position, results of operations, or cash flows.
In February 2010, the FASB issued ASU No. 2010-09 Subsequent Events (Topic 855)—Amendments to Certain Recognition and Disclosure Requirements. ASU 2010-09 amends the subsequent events disclosure guidance to include the definition of an SEC filer, require an SEC filer or conduit bond obligor to evaluate subsequent events through the date the financial statements are issued, and removes the requirement for an SEC filer to disclose the date through which subsequent events have been evaluated. The adoption of this new guidance in the first quarter did not impact our financial position, results of operations or cash flows.
In April 2010, the FASB issued ASU No. 2010-17, Revenue Recognition—Milestone Method (Topic 605): Milestone Method of Revenue Recognition. The ASU provides guidance on defining a milestone and determining when it may be appropriate to apply the milestone method of revenue recognition for research or development transactions. Consideration that is contingent on achievement of a milestone in its entirety may be recognized as revenue in the period in which the milestone is achieved only if the milestone is judged to meet certain criteria to be considered substantive. Milestones are considered substantive in their entirety and may not be bifurcated. An arrangement may contain both substantive and nonsubstantive milestones, and each milestone should be evaluated individually to determine if it is substantive. The ASU is effective on a prospective basis for milestones achieved in fiscal years, and interim periods within those years, beginning on or after June 15, 2010 (fiscal 2011 for the Company). The Company is currently assessing the impact of this new guidance on its financial condition, results of operations or cash flows.
Reclassifications
Certain prior year information has been reclassified to conform to the current year presentation.
NOTE 2—BUSINESS SEGMENTS
Historically, the Company had two operating and reportable segments, Color Measurement and Color Standards. The Color Standards reportable operating segment was created in 2007 with the acquisition of Pantone LLC. In fiscal 2010, the Company implemented a new organizational structure, integrated reporting systems, and substantially completed the restructuring activities outlined in Note 3. The convergence of these events resulted in the elimination the Company’s historical segment structure allowing a move to a product-oriented organization focused on driving overall results for the Company. The Company evaluated the impact of these events on its segment reporting and determined that the Company now has one operating segment as defined by ASC 280, Segment Reporting (ASC 280). As a result, the financial statement information provided has been presented to reflect one reportable segment, reflecting the Company’s consolidated results.
52
Table of Contents
X-RITE, INCORPORATED AND SUBSIDIARIES
NOTES TO CONSOLIDATED FINANCIAL STATEMENTS—(Continued)
NOTE 2—BUSINESS SEGMENTS—continued
The following table summarizes net sales from continuing operations by product line (in thousands):
| 2010 | 2009 | 2008 | ||||||||||
| Imaging and Media |
$ | 87,592 | $ | 74,066 | $ | 114,722 | ||||||
| Industrial |
51,589 | 42,016 | 51,008 | |||||||||
| Standards |
37,722 | 32,530 | 42,118 | |||||||||
| Support Services |
26,503 | 23,251 | 28,931 | |||||||||
| Retail |
15,300 | 14,277 | 18,307 | |||||||||
| Other |
4,034 | 5,527 | 6,405 | |||||||||
| Total Net Sales |
$ | 222,740 | $ | 191,667 | $ | 261,491 | ||||||
Sales by geographic area are based on the location of the customer. Long-lived assets consist of long-term assets of the Company, excluding financial instruments and deferred tax assets. The following is a summary of geographic information for the respective fiscal years indicated. Individual foreign country information is not provided as none of the individual foreign countries in which we operate are considered material for separate disclosure based on quantitative and qualitative considerations (in thousands):
| 2010 | 2009 | 2008 | ||||||||||
| Domestic sales |
$ | 73,673 | $ | 67,631 | $ | 85,767 | ||||||
| International sales: |
||||||||||||
| Europe |
85,247 | 72,176 | 115,494 | |||||||||
| Asia |
51,921 | 42,863 | 50,057 | |||||||||
| Other Countries |
11,899 | 8,997 | 10,173 | |||||||||
| 149,067 | 124,036 | 175,724 | ||||||||||
| Total net sales from continuing operations |
$ | 222,740 | $ | 191,667 | $ | 261,491 | ||||||
The Company’s long-lived tangible assets are as follows (in thousands):
| 2010 | 2009 | |||||||
| Long-lived assets: |
||||||||
| U.S. operations |
$ | 47,214 | $ | 51,656 | ||||
| International |
12,226 | 10,138 | ||||||
| $ | 59,440 | $ | 61,794 | |||||
No single customer accounted for more than 10 percent of total consolidated net sales in 2010 or 2009. For fiscal year 2008 the Company had one significant customer, Heidelberger Druckmaschinen AG, which accounted for $32.0 million or 12.2 percent, of total net sales.
53
Table of Contents
X-RITE, INCORPORATED AND SUBSIDIARIES
NOTES TO CONSOLIDATED FINANCIAL STATEMENTS—(Continued)
NOTE 3—RESTRUCTURING AND OTHER RELATED CHARGES
Restructuring and other related charges include the costs the Company incurred to execute various corporate restructuring activities. These charges include cash costs, accrued liabilities, asset write-offs, lease termination costs, and employee severance pay resulting from layoffs. The Company has fully executed all corporate restructuring plans.
A summary of the activity in the restructuring accounts and a reconciliation of the liability for, and as of, the years ended January 1, 2011 and January 2, 2010, are as follows (in thousands):
| Severance | Other | Asset Write Downs |
Facility Exit and Lease Termination Costs |
Total | ||||||||||||||||
| Balance at December 29, 2007 |
$ | 4,366 | $ | — | $ | — | $ | — | $ | 4,366 | ||||||||||
| Charges incurred in 2008 |
3,641 | 2,146 | 370 | 103 | 6,260 | |||||||||||||||
| Amounts paid or utilized in 2008 |
(5,979 | ) | (2,110 | ) | (370 | ) | (103 | ) | (8,562 | ) | ||||||||||
| Balance at January 3, 2009 |
2,028 | 36 | — | — | 2,064 | |||||||||||||||
| Charges incurred in 2009 |
2,653 | 1,380 | 143 | 415 | 4,591 | |||||||||||||||
| Amounts paid or utilized in 2009 |
(4,058 | ) | (1,141 | ) | (143 | ) | (415 | ) | (5,757 | ) | ||||||||||
| Balance at January 2, 2010 |
623 | 275 | — | — | 898 | |||||||||||||||
| Charges incurred in 2010 |
1,164 | 844 | — | — | 2,008 | |||||||||||||||
| Amounts paid or utilized in 2010 |
(1,787 | ) | (1,119 | ) | — | — | (2,906 | ) | ||||||||||||
| Balance at January 1, 2011 |
$ | — | $ | — | $ | — | $ | — | $ | — | ||||||||||
In 2010, the Company incurred $2.0 million in restructuring charges which were recorded in operating expenses. In 2009, the Company incurred $4.5 million in restructuring charges of which $4.4 million were recorded in operating expenses and $0.1 were recorded in cost of sales. In 2008, the Company incurred $6.3 million in restructuring charges of which $5.9 million were recorded in operating expenses and $0.4 million were recorded in cost of sales.
The Company has engaged in the following corporate restructurings:
Amazys Restructuring Plan
In the first quarter of 2008, the Company completed the restructuring actions initiated in prior periods related to the integration of the Amazys acquisition (Amazys restructuring plan). The Amazys restructuring plan included the closure of duplicate facilities, elimination of redundant jobs, and consolidation of product lines. The restructuring plan included workforce reductions of 83 employees, all of which were completed as of March 29, 2008, facility closures of approximately 14,000 square feet, various asset write-downs, and related costs. The work force reductions included approximately $6.0 million related to the former CEO’s employment contract settlement. Asset write-downs included inventory, tooling, capitalized software, and other intangible asset write-downs directly related to discontinued product lines. The Company incurred $19.9 million in charges in connection with the Amazys restructuring plan.
April 2008 Restructuring Plan
In the first quarter of 2009, the Company completed the restructuring actions initiated in prior periods related to the restructuring plan announced in April 2008 (the April 2008 restructuring plan). The April 2008 restructuring plan was initiated in response to weaker than expected economic conditions and market softness
54
Table of Contents
X-RITE, INCORPORATED AND SUBSIDIARIES
NOTES TO CONSOLIDATED FINANCIAL STATEMENTS—(Continued)
NOTE 3—RESTRUCTURING AND OTHER RELATED CHARGES—continued
that adversely affected net sales. The plan consisted of a revised cost savings and an operational plan which included 100 headcount reductions at various locations worldwide as well as additional cost of sales and operating cost reductions. The Company incurred $3.9 million in charges in connection with the April 2008 restructuring plan.
January 2009 Restructuring Plan
In the first quarter of 2010, the Company completed the restructuring actions initiated in prior periods related to the restructuring plan announced in January 2009 (the January 2009 restructuring plan). The January 2009 restructuring plan included narrowing the Company’s business focus, closing certain facilities, aggressively pursuing manufacturing efficiencies, implementing a reduction in headcount of 101 jobs, executing reduced work schedules and furloughs for selected employee groups, reducing executive compensation and suspending selected employee benefit programs. The Company incurred $3.3 million in charges in connection with the January 2009 restructuring plan.
Optronik 2009 Restructuring Plan
In the third quarter of 2010, the Company completed the restructuring actions initiated in the fourth quarter of 2009 related to Optronik, a foreign subsidiary of the Company. In early 2010, certain assets of Optronik were sold and the remaining operations were retained and merged into another subsidiary. The restructuring expenses relate primarily to headcount reductions, and the Company incurred $1.6 million in charges for this restructuring plan.
Other Related Charges
Other related charges are comprised of costs associated with the Company’s efforts to create a more efficient global structure and reorganize the global treasury and cash management footprint.
NOTE 4—GOODWILL AND OTHER INTANGIBLE ASSETS
A summary of changes in goodwill and indefinite-lived intangible assets for the years ending January 1, 2011 and January 2, 2010, is as follows (in thousands):
| Goodwill | Indefinite-lived intangible assets |
Total | ||||||||||
| January 3, 2009 |
$ | 234,270 | $ | 13,433 | $ | 247,703 | ||||||
| Foreign currency and other adjustments |
(250 | ) | — | (250 | ) | |||||||
| January 2, 2010 |
234,020 | 13,433 | 247,453 | |||||||||
| Foreign currency and other adjustments |
(68 | ) | — | (68 | ) | |||||||
| January 1, 2011 |
$ | 233,952 | $ | 13,433 | $ | 247,385 | ||||||
As discussed in Note 1, the Company accounts for goodwill and indefinite-lived intangible assets in accordance with ASC 350, which requires the Company to test the recorded amount of goodwill and indefinite-lived intangibles for recovery on an annual basis, or more frequently if a triggering event occurs.
55
Table of Contents
X-RITE, INCORPORATED AND SUBSIDIARIES
NOTES TO CONSOLIDATED FINANCIAL STATEMENTS—(Continued)
NOTE 4—GOODWILL AND OTHER INTANGIBLE ASSETS—continued
Goodwill Impairment Analysis
The goodwill impairment evaluation is a two step process. In Step One, the fair value is compared to its book value. The Company must apply judgment in determining the estimated fair value, and a combination of present value techniques and quoted market prices are used to determine fair value. If the fair value exceeds book value, goodwill is not impaired, and no further testing would be required. If the fair value is less than book value, a Step Two analysis must be completed. Step Two uses the calculated fair value to perform a hypothetical purchase price allocation to the fair value of the assets and liabilities. The difference between the fair value calculated in Step One and the fair value of the underlying assets and liabilities is the implied fair value of the goodwill. An impairment loss is recorded in the financial statements if the carrying value of the goodwill is greater than its implied fair value.
The following valuation methodologies and assumptions were used in the goodwill impairment analysis as of October 2, 2010:
| • | Discounted cash flow method under the income approach whereby cash flows were discounted to present value using an appropriate discount rate. The application of the discounted cash flow method required the development of discrete cash flow projections. |
| • | The Company considered the value indicators provided by the Guideline Company Method (GCM) under the market approach, in addition to the implied control premium in evaluating the reasonableness of the fair value results. |
| • | Discount rate used was 11.8 percent. The discount rate was developed utilizing the capital asset pricing model through which a weighted average cost of capital was derived. |
Based on the results of our 2010 and 2009 annual assessment of the recoverability of goodwill, the fair values exceeded book value, and accordingly, there was no impairment of goodwill as of and for the years ended January 1, 2011 and January 2, 2010.
Based on the results of the 2008 annual assessment of the recoverability of goodwill, the fair value was less than the book value, and the Company completed a Step Two analysis. The results of the Step Two analysis resulted in the recognition of a goodwill impairment loss in 2008. The total impairment loss in 2008 amounted to $58.1 million, of which $51.8 related to the impairment of goodwill and the remaining $6.3 related to the impairment of indefinite-lived intangible assets, discussed in more detail in the following paragraphs. This represents total cumulative impairment charges against goodwill and indefinite-lived intangible assets as of January 1, 2011.
Differences in the Company’s actual future cash flows, results of operations, capital expenditures, cost of capital and discount rates as compared to the estimates utilized for purposes of calculating the respective reporting unit fair values could affect the results of the annual goodwill evaluation and could potentially lead to future goodwill impairment charges.
Indefinite-Lived Intangible Impairment Analysis
Indefinite-lived intangible assets are evaluated for recoverability utilizing an income approach that estimates the fair value of the discounted cash flows. The fair value of the indefinite-lived intangible asset is compared to its carrying value, and an impairment loss is recognized if the fair value is less than the carrying value.
56
Table of Contents
X-RITE, INCORPORATED AND SUBSIDIARIES
NOTES TO CONSOLIDATED FINANCIAL STATEMENTS—(Continued)
NOTE 4—GOODWILL AND OTHER INTANGIBLE ASSETS—continued
The following valuation methodologies and assumptions were used in the analysis of the indefinite-lived intangible asset:
| • | The income approach, utilizing the relief from royalty method, was used to estimate fair value. |
| • | Relief from royalty rate considered publicly disclosed arm’s length licensing agreements, review of internal licensing agreements, and other factors. |
| • | Future projections are based on past performance |
| • | Estimate of future cash flows based on expected growth and royalty rates |
| • | Expected synergies |
| • | Weighted average cost of equity |
The methodology for valuing indefinite-lived intangible assets is applied consistently. The Company believes the discounted cash flow valuation model provides the most reasonable and meaningful fair value estimate based upon the indefinite-lived intangible assets projected future cash flows and replicates how market participants would value the company’s intangible assets in an orderly transaction.
The Company did not recognize an impairment loss on its indefinite-lived intangible assets in 2010 or 2009, and recognized an impairment loss of $6.3 million in 2008.
The following amounts were included in other intangibles as of January 1, 2011 and January 2, 2010 (in thousands):
| 2010 | 2009 | |||||||||||||||
| Assets | Accumulated Amortization |
Assets | Accumulated Amortization |
|||||||||||||
| Technology and patents |
$ | 55,529 | $ | (34,742 | ) | $ | 55,529 | $ | (27,724 | ) | ||||||
| Customer relationships |
46,543 | (16,109 | ) | 46,543 | (12,420 | ) | ||||||||||
| Trademarks and trade names |
9,614 | (5,396 | ) | 9,614 | (4,299 | ) | ||||||||||
| Covenants not to compete |
— | — | 10,558 | (10,402 | ) | |||||||||||
| Total |
$ | 111,686 | $ | (56,247 | ) | $ | 122,244 | $ | (54,845 | ) | ||||||
ASC 350 also requires that intangible assets with determinable useful lives be amortized over their respective estimated useful lives and reviewed for impairment if indications of impairment are present in accordance with ASC 360. During 2010 and 2009 there were no impairment triggering events warranting an impairment analysis. In 2008 the Company performed an impairment analysis of long-lived assets and intangible assets with determinable useful lives and the results of which indicated no impairment loss.
Amortization expense is computed using the straight-line method over the estimated useful lives of the intangible assets as follows:
| Customer and distribution relationships |
7 to 15 years | |
| Trademarks and trade names |
7 to 10 years | |
| Technology and patents |
7 to 15 years | |
| Covenants not to compete |
3 years |
57
Table of Contents
X-RITE, INCORPORATED AND SUBSIDIARIES
NOTES TO CONSOLIDATED FINANCIAL STATEMENTS—(Continued)
NOTE 4—GOODWILL AND OTHER INTANGIBLE ASSETS—continued
Amortization expense was $12.0 million for 2010, $15.9 million for 2009, and $17.4 million for 2008. Estimated amortization expense for intangible assets for each of the succeeding five years is as follows (in thousands):
| 2011 |
11,793 | |||
| 2012 |
11,793 | |||
| 2013 |
4,954 | |||
| 2014 |
4,610 | |||
| 2015 |
4,610 | |||
| Thereafter |
17,679 |
NOTE 5—LONG-TERM DEBT
As of January 1, 2011 and January 2, 2010, the Company’s long-term debt consisted of the following (in thousands):
| 2010 | 2009 | |||||||
| First Lien Facility |
$ | 130,598 | $ | 157,278 | ||||
| Second Lien Facility |
— | 26,356 | ||||||
| Revolving Line of Credit |
6,000 | — | ||||||
| 136,598 | 183,634 | |||||||
| Less current portion |
(1,350 | ) | (7,234 | ) | ||||
| Total long-term debt |
$ | 135,248 | $ | 176,400 | ||||
Long-term debt matures as follows (in thousands):
| First Lien Credit Facility |
||||
| 2011 |
$ | 1,350 | ||
| 2012 |
135,248 | |||
| 2013 |
— | |||
| 2014 |
— | |||
| 2015 |
— | |||
| $ | 136,598 | |||
In addition to the above repayment schedule, the Company is obligated to make additional principal payments in an amount ranging from 50 to 75 percent (depending on the Company’s leverage ratio at the time) of “consolidated excess cash flow”, as defined in the first lien credit facility agreement, and reduced by voluntary prepayments of the first lien term loan or permanent reductions of the revolver. Consolidated excess cash flow is a measure that starts with earnings before interest, depreciation, taxes, and amortization and adjusts for certain items including changes in working capital, capital expenditures, and cash paid in connection with permitted acquisitions. As of January 2, 2011, there were no payments due under this provision.
58
Table of Contents
X-RITE, INCORPORATED AND SUBSIDIARIES
NOTES TO CONSOLIDATED FINANCIAL STATEMENTS—(Continued)
NOTE 5—LONG-TERM DEBT—continued
Mortgage Loan
On January 29, 2009, the Company completed the sale of its former headquarters for $7.2 million, proceeds from which were used to pay transaction closing costs and pay in full the $5.2 million principal balance of the mortgage loan, with the remainder of the proceeds used to repay a portion of the Company’s first lien borrowings.
First and Second Lien Term Loans
In connection with the Pantone acquisition in October 2007, the Company entered into secured senior credit facilities which initially provided for aggregate principal borrowings of up to $415 million and replaced the Company’s previous credit facilities. These credit facilities initially consisted of a $310 million first lien loan, which included a $270 million five-year term loan and a $40 million five-year revolving credit facility, and a $105 million six-year term second lien loan. Obligations under these credit facilities are secured by substantially all of the tangible and intangible assets of the Company. Both facilities provide variable interest rate options from which the Company may select. The unused portion of the revolving credit facility is subject to a fee of 0.5 percent per annum.
On October 28, 2008, the Company’s shareholders approved the Corporate Recapitalization Plan to raise $155 million in capital through issuance of common stock. Under the terms of the Corporate Recapitalization Plan, the Company issued 46.9 million shares of common stock to three institutional investors. Proceeds from the equity capital raised were used to pay related transaction fees and expenses, settle the $12.5 million liability from terminated interest rate swap agreements, repay $3.5 million of the mortgage on the Company’s former headquarters facility, and repay $82.0 million of the first lien term loan and $37.2 million of the second lien term loan. The first and second lien credit agreement amendments became effective upon this recapitalization.
On August 18, 2009, the Company entered into an Exchange Agreement to effectively convert $41.6 million of principal amount outstanding under its second lien credit facility into 41,561 shares of newly issued Series A Preferred Stock (the Exchange). As a result of the Exchange, the first and second lien agreements were amended to provide consent for the reduction of the second lien outstanding loan amount. See Note 6 for further discussion of the Exchange.
On September 28, 2010, the Company executed an amendment of the first lien credit agreement. This amendment authorized the Company to repay the outstanding balance of the second lien credit facility and permits dividend payments in cash on the Series A Preferred Stock. On September 30, 2010, the Company extinguished the second lien credit agreement with cash on hand of $9.9 million and borrowings under the first lien revolving credit facility of $16.5 million.
The Company’s estimate of fair value for debt approximates its carrying amount as of January 1, 2011.
Interest Expense
During the fourth quarter of 2010, the Company designated its borrowings under the Prime interest rate index. The LIBOR index is based on the three month LIBOR (subject to a floor of 3.0 percent) plus a 4.0 percent margin and the Prime index is based the Prime Rate plus a 2.5 percent margin during the quarter. The rate in effect at January 1, 2011 was 5.75 percent for Prime borrowings. Under the terms of the amended credit agreements, the margin above either LIBOR or Prime Rate on first lien credit facilities is subject to a quarterly adjustment based on the Company’s leverage ratio.
59
Table of Contents
X-RITE, INCORPORATED AND SUBSIDIARIES
NOTES TO CONSOLIDATED FINANCIAL STATEMENTS—(Continued)
NOTE 5—LONG-TERM DEBT—continued
Interest payments on LIBOR based loans are payable on the last day of each interest period, not to exceed three months. Interest payments on Prime Rate based loans are either paid at the time the loan is repaid or on a scheduled quarterly basis. The Company entered into an interest rate cap to limit a substantial portion of its LIBOR exposure (see Note 7 for further discussion).
The Company’s credit facility contains operational and financial covenants that, in addition to obligating the Company to deliver financial reports and maintain certain financial ratios, limits the Company’s ability to create liens, incur indebtedness, make investments or acquisitions, enter into certain transactions with affiliates, and make certain capital expenditures. As of January 1, 2011 and January 2, 2010, the Company was in compliance with the financial covenants contained in its credit agreement(s), as amended.
As of January 1, 2011 and January 2, 2010, the credit facilities’ variable rates were 5.75 percent per annum and ranged from 6.75 to 14.38 percent per annum, respectively. As of these dates, the weighted average interest rates for all of the Company’s debt were 8.0 percent per annum and 9.6 percent per annum, respectively, exclusive of amortization of deferred financing costs and the effect of derivative instruments. Total interest expense incurred by the Company in 2010 was $28.0 million, including $2.8 million of amortization of deferred financing fees. Total interest expense incurred by the Company in 2009 was $33.5 million, including $2.9 million of amortization of deferred financing fees. Total interest expense incurred by the Company in 2008 was $46.3 million, including $3.6 million of expense related to deferred financing fees and $5.7 million related to terminated swap agreements, which includes $0.4 million of interest on the terminated swap liability. Cash based interest on secured debt during 2010, 2009, and 2008 totaled $13.3 million, $21.8 million and $37.9 million, respectively. Effective the third quarter of 2010, the Company paid cash for interest on its Series A preferred stock of $3.3 million.
Deferred Financing Fees
Deferred financing costs were established in connection with the first and second lien debt transactions, subsequent amendments, and the Exchange Transaction. These costs are currently being amortized over the life of the related facilities. As a result of the Corporate Recapitalization Plan in 2008, the Company wrote-off $3.8 million of deferred financing fees related to the portion of the first and second liens prepaid. In connection with the Exchange in 2009, the Company wrote off $2.3 million in deferred financing costs. As a result of the second lien extinguishment in 2010, the Company wrote-off $1.1 million of previously existing deferred financing costs. Unamortized deferred financing costs were $5.2 million and $8.6 million as of January 1, 2011 and January 2, 2010, respectively.
NOTE 6—MANDATORILY REDEEMABLE PREFERRED STOCK AND WARRANTS
On August 18, 2009, the Company entered into an Exchange Agreement to exchange $41.6 million of second lien term loan principal outstanding for 41,561 shares of newly issued Series A Preferred Stock (preferred stock or mandatorily redeemable preferred stock or MRPS) with a stated value of $1,000 per share. The preferred stock ranks senior to common stock in respect of payment of dividends and the distribution of assets upon liquidation of the Company.
The MRPS entitles the holders to dividends at a fixed annual rate of 14.375 percent per annum compounded quarterly and is mandatorily redeemable on January 23, 2014. The MRPS contains a provision that would increase the dividends an additional 2.0 percent per annum if the Company defaults or would have defaulted except for modifications, amendments, or waivers under its first and second lien debt. Upon redemption, the
60
Table of Contents
X-RITE, INCORPORATED AND SUBSIDIARIES
NOTES TO CONSOLIDATED FINANCIAL STATEMENTS—(Continued)
NOTE 6—MANDATORILY REDEEMABLE PREFERRED STOCK AND WARRANTS—continued
preferred stock holders receive the stated value of $1,000 per share plus all dividends. Dividends are calculated based on the outstanding balance and may be paid in cash or paid in kind (PIK) in additional shares of preferred stock, at the discretion of the Board of Directors.
Early redemption of the MRPS may occur at any time after February 18, 2010, at the option of the Company, at an alternative redemption price or upon refinancing of the first and second lien credit agreements. The cost to early redeem the preferred stock is equal to the liquidation preference, defined as the stated value per share plus all unpaid or PIK dividends, multiplied by the Early Redemption Multiplier, which is 107 percent if the preferred stock is redeemed between February 19, 2010 and October 25, 2010. The Early Redemption Multiplier decreases annually each October 25 by varying amounts, ultimately to a Multiplier of 100 percent if the preferred stock is redeemed after October 25, 2013 but prior to the mandatory redemption date. At January 1, 2011, the Multiplier was 105 percent.
At the time of issuance of the MRPS, the Company issued freestanding warrants to acquire 7.5 million shares of the Company’s common stock (the Warrants) at an exercise price of $0.01 per share. The Company determined the fair value of the Warrants was $15.5 million on the issuance date using the Black-Scholes Option Pricing model, which is classified as a discount on the MRPS. The discount is accreted to interest expense in the accompanying consolidated condensed statement of operations over the period of issuance to the mandatory redemption date of the MRPS. The accretion for the years ended January 1, 2011 and January 2, 2010 was $3.5 million and $1.5 million, respectively. The Warrants required shareholder approval prior to exercise, and shareholder approval was obtained at a special meeting of the shareholders on October 28, 2009. In November 2009, the Company issued 7.5 million shares of common stock upon the exercise of the Warrants by the holders.
NOTE 7—FINANCIAL INSTRUMENTS
The Company applies the provisions of ASC 820, Fair Value Measurements (ASC 820) to assets and liabilities measured at fair value. This Statement requires fair value measurements be classified and disclosed in one of the following three categories:
| Level 1: | Financial instruments with unadjusted, quoted prices listed on active market exchanges. |
| Level 2: | Financial instruments lacking unadjusted, quoted prices from active market exchanges, including over-the-counter traded financial instruments. The prices for the financial instruments are determined using prices for recently traded financial instruments with similar underlying terms as well as directly or indirectly observable inputs, such as interest rates and yield curves that are observable at commonly quoted intervals. |
| Level 3: | Financial instruments that are not actively traded on a market exchange. This category includes situations where there is little, if any, market activity for the financial instrument. The prices are determined using significant unobservable inputs or valuation techniques. |
The Company has classified certain marketable securities held in a trust for a former employee within Level 1 of the fair value hierarchy, and recognized an other noncurrent asset of $0.8 million as of January 1, 2011 and January 2, 2010 related to the marketable securities.
The Company has classified its interest rate caps within the Level 2 category of the fair value hierarchy. The carrying value was nominal at January 1, 2011 and $0.7 million at January 2, 2010. Fair values are measured as the present value of all expected future cash flows based on the LIBOR-based swap yield curve as of the valuation date. In discounting expected future cash flows, the Company adjusted the LIBOR-based yield curve’s implied discount rates to reflect the credit quality of the party bearing the cash flow obligation to pay.
61
Table of Contents
X-RITE, INCORPORATED AND SUBSIDIARIES
NOTES TO CONSOLIDATED FINANCIAL STATEMENTS—(Continued)
NOTE 7—FINANCIAL INSTRUMENTS—continued
The Company did not have any additional assets or liabilities that were measured at fair value on a recurring basis at January 1, 2011 and January 2, 2010, respectively.
Accounting for Derivative Financial Instruments
The Company accounts for derivative financial instruments in accordance with ASC 815, Accounting for Derivative Instruments and Hedging Activities (ASC 815), as amended. As a result, the Company recognizes derivative financial instruments in the condensed consolidated financial statements at fair value regardless of the purpose or intent for holding the instruments. Changes in the fair value of derivative financial instruments are either recorded in income or in shareholders’ investment as a component of accumulated other comprehensive income depending on whether the derivative financial instrument qualifies for hedge accounting, and if so, whether it qualifies as a fair value hedge or cash flow hedge.
Changes in fair values of derivatives accounted for as fair value hedges are recorded in income along with the portions of the changes in the fair values of the hedged items that relate to the hedged risk. Changes in fair values of derivatives accounted for as cash flow hedges, to the extent they are effective hedges, are recorded in other comprehensive income. Changes in fair values of derivatives not qualifying as hedges are reported in earnings.
Interest Rate Swaps
In prior years, the Company utilized interest rate swap agreements designated as cash flow hedges of the outstanding variable rate borrowings of the Company. These agreements resulted in the Company paying or receiving the difference between three month LIBOR and fixed interest rates at specified intervals, calculated based on the notional amounts. The interest rate differential to be paid or received was recorded as interest income or expense. Under ASC 815, these swap transactions were designated as cash flow hedges, therefore the effective portion of the derivative’s gain or loss was initially recorded as a component of accumulated other comprehensive income, net of taxes, and subsequently reclassified into earnings when the hedged interest expense affected earnings.
On April 21, 2008, these interest rate swap agreements were terminated by the Company. The fair value of the swap arrangements as of the termination date was a liability of $12.1 million. The swap liability accrued interest until closing of the Corporate Recapitalization Plan. The Company paid the outstanding balance on the swap liability, including the related accrued interest, upon closing of the Corporate Recapitalization Plan in October 2008 (see Note 5 for further information).
Due to termination of the swap contracts in April 2008, related accumulated other comprehensive loss balances have been frozen and will be recognized as interest expense over the period of the original hedged cash flows. Interest expense recorded related to the terminated swaps during 2010, 2009, and 2008 totaled $1.2, $4.9, and $5.7 million, respectively. The remaining balance in accumulated other comprehensive income related to these terminated swaps was $0.4 million and $1.6 million as of January 1, 2011 and January 2, 2010, respectively, all of which is expected to be reclassified to earnings during the next twelve months.
Interest Rate Cap
On December 30, 2008, the Company purchased an interest rate cap (the cap) to limit its exposure to increases in the 3 month LIBOR rate above 3 percent per annum. The cost of the interest rate cap was $1.6 million, payment for which was made in January 2009. The cap became effective January 6, 2009, at a notional amount of $256.0 million. The notional amount amortizes downward every six months through January 6, 2012.
62
Table of Contents
X-RITE, INCORPORATED AND SUBSIDIARIES
NOTES TO CONSOLIDATED FINANCIAL STATEMENTS—(Continued)
NOTE 7—FINANCIAL INSTRUMENTS—continued
Effective April 6, 2009, the Company reduced the notional amount of the cap by $25 million. The Company received $0.1 million in proceeds related to the sale of this portion of the cap and reclassified $0.1 million from accumulated other comprehensive income as a decrease to interest expense related to this reduction. On September 30, 2009, the Company reduced the notional amount of the cap by $65 million. The Company received $0.4 million in proceeds related to the sale of this portion of the cap and reclassified $0.1 million from accumulated other comprehensive income as a decrease to interest expense related to this amendment. During 2010, the Company reduced the notional amount of the cap by $76 million. The amount the Company received in proceeds related to the sale of this portion of the cap and the amount reclassified from accumulated other comprehensive income as a decrease to interest expense related to this amendment were negligible.
At inception, this cap was designated as a cash flow hedge under ASC 815. The Company assesses hedge effectiveness based on the total changes in cash flows on its interest rate cap as described by the Derivative Implementation Group (DIG) Issue G20, Cash Flow Hedges: Assessing and Measuring the Effectiveness of a Purchased Option Used in a Cash Flow Hedge, and records subsequent changes in fair value in other comprehensive income, including changes in the option’s time value. Gains or losses on interest rate caps used to hedge interest rate risk on variable-rate debt are reclassified out of accumulated other comprehensive income and into earnings (as interest expense) when the forecasted transaction occurs. The current market value of the interest rate cap is reported on the condensed consolidated balance sheets in other current and long-term assets.
On April 4, 2010, the cap was de-designated as a cash flow hedge by the Company. The fair value of the cap as of the de-designation date was an asset of $0.2 million. Due to the de-designation of the cap in April 2010, related accumulated other comprehensive loss balances have been frozen and will be recognized as interest expense over the period of the original hedged cash flows. Interest expense recorded related to the amortization of unrealized losses frozen in accumulated other comprehensive loss during the year ended January 1, 2011 was $0.5 million. The remaining balance in accumulated other comprehensive income related to the cap was $0.5 million as of January 1, 2011, all of which is expected to be reclassified to earnings during the next twelve months.
As LIBOR was not above the capped rate, no cash was received from the existing cap agreements during the year ended January 1, 2011.
NOTE 8—SHARE-BASED COMPENSATION
Description of Share-Based Compensation Plans
Employee Stock Purchase Plan—The Company may sell up to one million shares of common stock to its employees under an employee stock purchase plan. Eligible employees who participate purchase shares quarterly at 85 percent of the market price on the date purchased.
Stock Option and Restricted Stock Plan—The Company has a stock incentive plan authorizing 7 million shares of common stock. This plan became effective on October 28, 2008, and replaced the Company’s previous option and restricted stock plans. The new plan permits stock options, stock appreciation rights, restricted stock awards, and restricted stock units to be granted to employees, the Company’s Board of Directors, and consultants and advisors to the Company. To date, stock options, restricted stock awards, and restricted stock units have been granted under this plan. Stock option exercise prices and vesting schedules are determined at the time of grant, which range from immediate to five year vesting. No options are exercisable later than ten years after the date of
63
Table of Contents
X-RITE, INCORPORATED AND SUBSIDIARIES
NOTES TO CONSOLIDATED FINANCIAL STATEMENTS—(Continued)
NOTE 8—SHARE-BASED COMPENSATION—continued
grant. Restricted shares awarded under this plan entitle the shareholder to all rights of common stock ownership except that the shares may not be sold, transferred, pledged, exchanged, or otherwise disposed of during the restriction period. Restricted share units awarded under this plan do not entitle the holder to the rights of common stock ownership and may not be sold, transferred, pledged, exchanged, or otherwise disposed of during the restriction period. Restriction periods for restricted shares and restricted share units are determined by a committee appointed by the Board of Directors and range from immediate to five years.
Valuation of Share-Based Compensation
Valuation and Amortization Method—The Company estimates the fair value of stock options granted using the modified Black-Scholes option-pricing model. Restricted stock awards and units are valued at closing market price on the date of grant. Options and awards either cliff vest or are subject to graded vesting based upon either service or performance conditions. Compensation expense related to options and awards is recognized on a straight-line basis over their requisite service or performance periods. Compensation expense for shares issued under the Employee Stock Purchase Plan is recognized for 15 percent of the market value of shares purchased, in the quarter to which the purchases relate.
Expected Term—Expected term estimates for employee options are based upon prior exercise, cancellation, and expiration history, which the Company believes to be representative of future behavior. The Company has considered the effects of analyzing expected term separately for different groups of employees, and has concluded that historical exercise patterns are not significantly different between groups. Therefore, one expected term is used for all employee options.
Expected Volatility—The expected volatility is based upon historical volatility of the Company’s stock for a period of time equivalent to that of the expected term of the option. Consideration is given to unusual factors that might cause the historical period to be unrepresentative of future expectations.
Risk-Free Interest Rate—The risk-free interest rate is based on the U.S. Treasury yield in effect at the time of option grant for zero-coupon issues with terms equivalent to the expected term of the options.
Dividends—The Company’s dividend yield is calculated as the percentage of dividends issued on shares relative to the average market price of those shares and is calculated over an historical period equivalent to that of the expected term of the option. Beginning in 2007, the Company suspended its quarterly dividend payment, therefore options granted after 2006 have been valued using a zero percent dividend yield.
Forfeitures—The Company applies an estimated forfeiture rate to options as they vest. ASC 718 requires forfeitures to be estimated at the time of grant and revised, if necessary, in subsequent periods if actual forfeitures differ from those estimates. Forfeitures are estimated based on historical experience.
Accuracy of Fair Value Estimates—The Black-Scholes model is a trading option-pricing model that does not consider the non-traded nature of employee stock options, the restrictions on trading, lack of transferability or the ability of the employees to forfeit options prior to expiration. If the model adequately permitted consideration of these characteristics, the resulting stock option valuations may be different. In addition, the valuation model relies on subjective assumptions that can materially affect the estimated value of options and it may not provide an accurate measure of the fair value of the Company’s stock options.
64
Table of Contents
X-RITE, INCORPORATED AND SUBSIDIARIES
NOTES TO CONSOLIDATED FINANCIAL STATEMENTS—(Continued)
NOTE 8—SHARE-BASED COMPENSATION—continued
The Company used the following assumptions in valuing employee options granted during 2010, 2009, and 2008:
| 2010 | 2009 | 2008 | ||||
| Dividend yield |
0.0% | 0.0% | 0.0% | |||
| Volatility |
55 - 56% | 56 - 58% | 48 - 57% | |||
| Risk-free interest rates |
1.8 - 3.1% | 2.3 - 3.2% | 2.7 - 3.6% | |||
| Expected term of options |
7 years | 7 years | 7 years |
Stock Option and Award Activity
Restricted Stock Awards
Restricted stock award activity for 2010, 2009, and 2008 was as follows:
| Shares | Weighted Average Grant Date Fair Value |
|||||||
| Unvested balance at December 29, 2007 |
381,247 | $ | 13.28 | |||||
| Granted |
999,052 | 3.73 | ||||||
| Vested |
(405,602 | ) | 8.83 | |||||
| Forfeited |
(25,698 | ) | 9.06 | |||||
| Unvested balance at January 3, 2009 |
948,999 | $ | 5.25 | |||||
| Granted |
559,335 | 2.03 | ||||||
| Vested |
(114,440 | ) | 9.99 | |||||
| Forfeited |
(81,651 | ) | 3.68 | |||||
| Unvested balance at January 2, 2010 |
1,312,243 | $ | 3.37 | |||||
| Granted |
141,064 | 3.25 | ||||||
| Vested |
(345,609 | ) | 2.82 | |||||
| Forfeited |
(65,412 | ) | 12.50 | |||||
| Unvested balance at January 1, 2011 |
1,042,286 | $ | 3.20 | |||||
Included in the 1,042,286 restricted shares outstanding at the end of the year, 727,483 vest based upon achievement of performance targets over periods ranging from one to five years.
The total fair value of shares vested, determined as of the release date was $1.1, $0.2 and $1.1 million, respectively, during 2010, 2009 and 2008.
65
Table of Contents
X-RITE, INCORPORATED AND SUBSIDIARIES
NOTES TO CONSOLIDATED FINANCIAL STATEMENTS—(Continued)
NOTE 8—SHARE-BASED COMPENSATION—continued
Restricted Stock Units
Restricted stock unit activity for 2010 and 2009 was as follows:
| Units | Weighted Average Remaining Contractual Term (years) |
Average Intrinsic Value (thousands) |
||||||||||
| Unvested balance at January 3, 2009 |
519,000 | 4.0 | $ | 773 | ||||||||
| Unvested balance at January 2, 2010 |
519,000 | 3.0 | $ | 1,131 | ||||||||
| Unvested balance at January 1, 2011 |
519,000 | 2.0 | $ | 2,372 | ||||||||
| Vested and expected to vest as of January 1, 2011 |
478,708 | 2.0 | $ | 2,188 | ||||||||
| Vested at January 1, 2011 |
— | — | — | |||||||||
All restricted stock units vest based upon achievement of performance targets over periods ranging from three to five years. No restricted stock units were granted prior to 2008, and no restricted stock units have been vested under the plan as of January 1, 2011. The weighted average grant date fair value of units granted during 2008 was $3.19 per share and there were no units granted in 2010 and 2009.
Stock Options
Stock option activity for 2010, 2009 and 2008 was as follows:
| Shares | Weighted Average Exercise Price |
Weighted Average Remaining Contractual Term (years) |
Average Intrinsic Value (thousands) |
|||||||||||||
| Outstanding at December 29, 2007 |
2,178,106 | $ | 12.03 | 5.83 | $ | 2,046 | ||||||||||
| Granted |
2,222,082 | 4.01 | ||||||||||||||
| Exercised |
(12,221 | ) | 1.84 | |||||||||||||
| Forfeited |
(151,365 | ) | 8.73 | |||||||||||||
| Expired |
(250,840 | ) | 14.92 | |||||||||||||
| Outstanding at January 3, 2009 |
3,985,762 | $ | 7.53 | 7.02 | $ | 28 | ||||||||||
| Granted |
2,381,631 | 1.49 | ||||||||||||||
| Exercised |
(1,350 | ) | 1.29 | |||||||||||||
| Forfeited |
(158,824 | ) | 3.23 | |||||||||||||
| Expired |
(143,706 | ) | 11.26 | |||||||||||||
| Outstanding at January 2, 2010 |
6,063,513 | $ | 5.18 | 7.01 | $ | 1,727 | ||||||||||
| Granted |
492,435 | 3.16 | ||||||||||||||
| Exercised |
(302,223 | ) | 2.64 | |||||||||||||
| Forfeited |
(27,016 | ) | 2.27 | |||||||||||||
| Expired |
(708,500 | ) | 11.57 | |||||||||||||
| Outstanding at January 1, 2011 |
5,518,209 | $ | 4.34 | 7.30 | $ | 9,542 | ||||||||||
| Vested and expected to vest as of January 1, 2011 |
5,443,300 | $ | 4.36 | 7.28 | $ | 9,410 | ||||||||||
| Exercisable at January 1, 2011 |
3,832,361 | $ | 4.99 | 6.81 | $ | 6,438 | ||||||||||
66
Table of Contents
X-RITE, INCORPORATED AND SUBSIDIARIES
NOTES TO CONSOLIDATED FINANCIAL STATEMENTS—(Continued)
NOTE 8—SHARE-BASED COMPENSATION—continued
The aggregate intrinsic value of options outstanding was calculated as the difference between the exercise price of the underlying options and the market price of the Company’s common stock for options that were in-the-money. Options that were not in-the-money as of that date, and therefore have a negative intrinsic value, have been excluded from this figure.
The weighted average grant date fair value of options granted during 2010 was $1.84. The total intrinsic value of options exercised, determined as of the exercise date, during the same period was $0.4 million. During 2009 and 2008, the weighted average grant date fair value of options granted was $0.89 and $2.19 per share, respectively, and the total intrinsic value of options exercised, determined as of the exercise date, was nominal in 2009 and 2008.
Share-Based Compensation Expense
Total share-based compensation expense recognized in the Consolidated Statements of Operations for the years ended January 1, 2011, January 2, 2010 and January 3, 2009 was as follows (in thousands):
| 2010 | 2009 | 2008 | ||||||||||
| Stock options |
$ | 1,706 | $ | 2,981 | $ | 1,916 | ||||||
| Restricted stock awards |
659 | 1,556 | 1,971 | |||||||||
| Restricted stock units |
350 | 350 | 63 | |||||||||
| Employee stock purchase plan |
21 | 17 | 30 | |||||||||
| 2,736 | 4,904 | 3,980 | ||||||||||
| Vesting related to restructuring activities |
— | — | 295 | |||||||||
| Total share-based compensation expense |
$ | 2,736 | $ | 4,904 | $ | 4,275 | ||||||
All share-based compensation expense was recorded in the Consolidated Statements of Operations in the line in which the salary of the individual receiving the benefit was recorded. The total income tax benefit recognized related to this compensation was $0.8 million for the year ended January 1, 2011, $1.2 million for the year ended January 2, 2010 and $1.1 million for the year ended January 3, 2009. As of January 1, 2011, there was unrecognized compensation cost for non-vested share-based compensation of $1.8 million related to options, $1.3 million related to restricted share awards, and $0.6 million related to restricted stock units. These costs are expected to be recognized over remaining weighted average periods of 1.76, 1.99, and 1.99 years, respectively.
Cash received from options exercised during 2010 was $0.8 million.
NOTE 9—EMPLOYEE BENEFIT PLANS
401(k) Retirement Savings Plan
The Company maintains a 401(k) retirement savings plan for the benefit of substantially all full time U.S. employees. Investment decisions are made by individual employees. Investments in Company stock are not allowed under the plans. Participant contributions are matched by the Company based on applicable matching formulas. The matching contributions of the Company are discretionary and, in conjunction with its restructuring efforts, the Company suspended the match in the first quarter of 2009. In effect, the matching expense for 2009 was nominal. The Company reinstated the matching of contributions in the second quarter of 2010. The Company’s matching expense for the plans was $0.5 million in 2010 and $1.1 million in 2008.
67
Table of Contents
X-RITE, INCORPORATED AND SUBSIDIARIES
NOTES TO CONSOLIDATED FINANCIAL STATEMENTS—(Continued)
NOTE 9—EMPLOYEE BENEFIT PLANS—continued
Defined Benefit Plan
The Company maintains a defined benefit plan for employees of its X-Rite Europe GmbH subsidiary in Switzerland. The plan is part of an independent collective fund which provides pensions combined with life and disability insurance. The assets of the funded plans are held independently of X-Rite’s assets in a legally distinct and independent collective trust fund which serves various unrelated employers. The Fund’s benefit obligations are fully reinsured by Swiss Life Insurance Company. The plan is valued by independent actuaries using the projected unit credit method. The liabilities correspond to the projected benefit obligations of which the discounted net present value is calculated based on years of employment, expected salary increases, and pension adjustments.
The last actuarial valuation was carried out as of December 31, 2010. The amounts recognized in the Consolidated Balance Sheets, shown in other non-current liabilities, as of January 1, 2011 and January 2, 2010, were determined as follows (in thousands):
| 2010 | 2009 | |||||||
| Fair value of plan assets |
$ | 31,426 | $ | 26,320 | ||||
| Projected benefit obligation |
(31,601 | ) | (26,984 | ) | ||||
| Net liability in the Balance Sheet |
$ | (175 | ) | $ | (664 | ) | ||
The following weighted-average assumptions were used in accounting for the defined benefit plan:
| 2010 | 2009 | |||||||
| Discount rate |
2.75 | % | 2.75 | % | ||||
| Expected return on plan assets |
3.00 | % | 4.00 | % | ||||
| Future salary increases |
1.00 | % | 1.00 | % | ||||
| Future pension increases |
0.25 | % | 0.25 | % | ||||
Future benefits, to the extent that they are based on compensation, include assumed salary increases, as presented above, consistent with past experience and estimates of future increases in the Swiss industrial labor market.
During the years ended January 1, 2011 and January 2, 2010, respectively, the pension fund’s weighted average expected long-term rate of return on assets was 3.0 and 4.0 percent, respectively. In developing this assumption, the input from third party pension plan asset managers was evaluated, including their review of asset class return expectations, long-term inflation assumptions, and historical average return.
Net periodic pension cost during 2010, 2009 and 2008 includes the following (in thousands):
| 2010 | 2009 | 2008 | ||||||||||
| Service cost |
$ | 2,458 | $ | 2,032 | $ | 2,130 | ||||||
| Interest |
735 | 767 | 805 | |||||||||
| Expected return on plan assets |
(784 | ) | (949 | ) | (1,075 | ) | ||||||
| Net periodic pension cost |
$ | 2,409 | $ | 1,850 | $ | 1,860 | ||||||
68
Table of Contents
X-RITE, INCORPORATED AND SUBSIDIARIES
NOTES TO CONSOLIDATED FINANCIAL STATEMENTS—(Continued)
NOTE 9—EMPLOYEE BENEFIT PLANS—continued
For the year 2010, the Company recorded a gain of $1.7 million in Other Comprehensive Income related to actuarial gains. In 2009 and 2008 the Company recorded a charge of $0.2 and $0.5 million, respectively, in Other Comprehensive Income related to actuarial losses. This is the only amount in Accumulated Other Comprehensive Income related to the pension as of January 1, 2011, January 2, 2010 and January 3, 2009.
Changes in projected benefit obligations during 2009 and 2008 were as follows (in thousands):
| 2010 | 2009 | |||||||
| Obligations at beginning of period |
$ | 26,984 | $ | 24,000 | ||||
| Service cost |
2,458 | 2,032 | ||||||
| Interest cost |
735 | 767 | ||||||
| Participant contributions |
800 | 743 | ||||||
| Actuarial (gain) loss |
(1,574 | ) | (481 | ) | ||||
| Benefit payments |
(705 | ) | (1,056 | ) | ||||
| Foreign exchange translation effect |
2,903 | 979 | ||||||
| Obligations at end of period |
$ | 31,601 | $ | 26,984 | ||||
Accumulated benefit obligations were $30.6, $26.3 and $23.1 million as of the years ended January 1, 2011, January 2, 2010 and January 3, 2009, respectively.
Changes in the fair value of plan assets for 2010 and 2009 were as follows (in thousands):
| 2010 | 2009 | |||||||
| Fair value at beginning of period |
$ | 26,320 | $ | 24,107 | ||||
| Benefit payments |
(705 | ) | (1,056 | ) | ||||
| Employer contributions |
1,362 | 1,266 | ||||||
| Participant contributions |
800 | 743 | ||||||
| Gain on plan assets |
756 | 316 | ||||||
| Foreign exchange translation effect |
2,893 | 944 | ||||||
| Fair value at end of period |
$ | 31,426 | $ | 26,320 | ||||
The weighted average actual asset allocations, by asset category, for the pension plan assets as of January 1, 2011 and January 2, 2010 were as follows:
| 2010 | 2009 | |||||||
| Reinsurance contract with Swiss Life |
99.3 | % | 97.6 | % | ||||
| Real estate |
0.0 | % | 0.0 | % | ||||
| Other |
0.7 | % | 2.4 | % | ||||
| Total |
100.0 | % | 100.0 | % | ||||
69
Table of Contents
X-RITE, INCORPORATED AND SUBSIDIARIES
NOTES TO CONSOLIDATED FINANCIAL STATEMENTS—(Continued)
NOTE 9—EMPLOYEE BENEFIT PLANS—continued
The assets held under the collective reinsurance contract by the Plan’s re-insurer Swiss Life Insurance Company are invested in a mix of Swiss and international bond and equity securities within the limits prescribed by the Swiss Pension Law. The following table presents a rollforward of pension plan assets measured at fair value on a recurring basis using unobservable inputs (Level 3) at January 1, 2011 and January 2, 2010 (in thousands):
| Balance at beginning of period |
$ | 26,320 | ||
| Actual return on plan assets held at the reporting date |
756 | |||
| Purchases, sales, and settlements |
4,350 | |||
| Balance at end of period |
$ | 31,426 | ||
The following estimated future benefit payments, which reflect expected future service, are expected to be paid in the years indicated (in thousands):
| 2011 |
$ | 2,288 | ||
| 2012 |
2,334 | |||
| 2013 |
2,366 | |||
| 2014 |
2,388 | |||
| 2015 |
2,404 | |||
| 2016 - 2020 |
12,078 |
The Company expects to contribute $1.7 million to the Plan during 2011.
NOTE 10—INCOME TAXES
The provision (benefit) for income taxes associated with continuing operations consisted of the following (in thousands):
| 2010 | 2009 | 2008 | ||||||||||
| Current: |
||||||||||||
| Federal |
$ | 168 | $ | (2,786 | ) | $ | 7,737 | |||||
| State |
3 | 14 | (9 | ) | ||||||||
| Foreign |
2,489 | 814 | 4,548 | |||||||||
| 2,660 | (1,958 | ) | 12,276 | |||||||||
| Deferred: |
||||||||||||
| Federal |
— | (723 | ) | 346 | ||||||||
| Foreign |
(4,898 | ) | (2,011 | ) | (913 | ) | ||||||
| (4,898 | ) | (2,734 | ) | (567 | ) | |||||||
| $ | (2,238 | ) | $ | (4,692 | ) | $ | 11,709 | |||||
70
Table of Contents
X-RITE, INCORPORATED AND SUBSIDIARIES
NOTES TO CONSOLIDATED FINANCIAL STATEMENTS—(Continued)
NOTE 10—INCOME TAXES—continued
Major components of the Company’s deferred income tax assets and liabilities are as follows (in thousands):
| 2010 | 2009 | |||||||
| Assets: |
||||||||
| Net operating losses |
$ | 44,450 | $ | 56,018 | ||||
| XR Ventures impairment allowances |
3,032 | 3,009 | ||||||
| Acquired intangibles |
19,536 | 22,791 | ||||||
| Tax credits |
3,654 | 2,774 | ||||||
| Capital losses |
1,673 | 1,661 | ||||||
| Accruals not currently deductible |
1,136 | 2,569 | ||||||
| Inventories |
4,570 | 4,354 | ||||||
| Compensation accruals |
1,935 | 724 | ||||||
| Foreign tax withholding |
434 | 800 | ||||||
| Share-based compensation |
3,214 | 2,360 | ||||||
| Tax accruals for uncertain tax positions |
602 | 634 | ||||||
| Accounts receivable |
248 | 453 | ||||||
| Derivative financial instruments |
24 | — | ||||||
| Other |
687 | 528 | ||||||
| 85,195 | 98,675 | |||||||
| Valuation allowance |
(71,051 | ) | (86,483 | ) | ||||
| Deferred income tax assets |
14,144 | 12,192 | ||||||
| Liabilities: |
||||||||
| Acquired intangibles |
(7,004 | ) | (8,924 | ) | ||||
| Software development costs |
(3,673 | ) | (2,814 | ) | ||||
| Foreign tax effects |
(1,753 | ) | (3,911 | ) | ||||
| Property, plant and equipment |
(1,875 | ) | (1,780 | ) | ||||
| Derivative financial instruments |
— | (594 | ) | |||||
| Inventory reserves |
(750 | ) | (794 | ) | ||||
| Bad debt reserves |
(420 | ) | (394 | ) | ||||
| Other |
(1,154 | ) | (364 | ) | ||||
| Deferred income tax liabilities |
(16,629 | ) | (19,575 | ) | ||||
| Net deferred income tax liabilities |
$ | (2,485 | ) | $ | (7,383 | ) | ||
The Company has recorded valuation allowances on its deferred income tax assets, tax credit carry-forwards, and net operating loss carry-forwards for which it is not more likely than not that a future benefit will be realized. The tax credit and net operating loss carry-forwards relate to operations in the United States which expire at various dates through 2029 and also pertain to operations outside of the United States which do not have expiration dates.
71
Table of Contents
X-RITE, INCORPORATED AND SUBSIDIARIES
NOTES TO CONSOLIDATED FINANCIAL STATEMENTS—(Continued)
NOTE 10—INCOME TAXES—continued
The following table represents a reconciliation of income taxes at the United States statutory rate with the effective rate as follows (in thousands):
| 2010 | 2009 | 2008 | ||||||||||
| Income taxes (benefit) computed at statutory rate of 35% |
$ | 491 | $ | (10,477 | ) | $ | (37,140 | ) | ||||
| Increase (decrease) in taxes resulting from: |
||||||||||||
| Permanent differences |
4,929 | (3,179 | ) | 1,470 | ||||||||
| Change in valuation allowance |
(15,432 | ) | 6,721 | 46,193 | ||||||||
| Rate differential on foreign income |
1,628 | 2,605 | (1,199 | ) | ||||||||
| Statutory rate changes |
— | 1,962 | — | |||||||||
| Foreign withholding tax on unremitted foreign income |
3 | (45 | ) | 2,033 | ||||||||
| Foreign net operating losses and tax credits |
5,726 | (99 | ) | (7,533 | ) | |||||||
| Settlements with taxing authorities |
— | (485 | ) | (1,408 | ) | |||||||
| State income taxes |
565 | (528 | ) | (8 | ) | |||||||
| Increase (decrease) in reserve for uncertain tax positions |
(248 | ) | (597 | ) | 9,014 | |||||||
| Other |
100 | (570 | ) | 287 | ||||||||
| $ | (2,238 | ) | $ | (4,692 | ) | $ | 11,709 | |||||
Undistributed earnings of foreign subsidiaries and related companies that are deemed to be permanently invested amounted to $25.6 million at January 1, 2011, $7.1 million at January 2, 2010 and $6.4 million at January 3, 2009. It is not practicable to calculate the unrecognized deferred tax liability on those earnings.
Cash (refunded) or expended for income taxes was $(1.2), $8.5 and $2.6 million in 2010, 2009 and 2008, respectively.
Uncertain Tax Positions
Effective December 31, 2006 (fiscal year 2007), the Company adopted the provisions of ASC 740, Accounting for Uncertainty in Income Taxes, an interpretation of ASC 740, Accounting for Income Taxes. This Interpretation clarifies the accounting for uncertainty in income taxes recognized in an enterprise’s financial statements and prescribes a threshold of more likely than not to be sustained upon examination.
The following table summarizes the activity related to amounts recorded for uncertain tax positions, exclusive of interest and penalties, from January 3, 2009 to January 1, 2011 (in thousands):
| Balance as of December 29, 2007 |
$ | 4,018 | ||
| Increases related to prior year tax positions |
4,131 | |||
| Decreases related to prior year tax positions |
(210 | ) | ||
| Decreases related to settlements with taxing authorities |
(2,234 | ) | ||
| Decreases related to lapsing of the statute of limitations |
(314 | ) | ||
| Balance as of January 3, 2009 |
$ | 5,391 | ||
| Increases related to prior year tax positions |
78 | |||
| Decreases related to prior year tax positions |
(289 | ) | ||
| Balance as of January 2, 2010 |
5,180 | |||
| Increases related to prior year tax positions |
89 | |||
| Decreases related to prior year tax positions |
(296 | ) | ||
| Balance as of January 1, 2011 |
$ | 4,973 | ||
72
Table of Contents
X-RITE, INCORPORATED AND SUBSIDIARIES
NOTES TO CONSOLIDATED FINANCIAL STATEMENTS—(Continued)
NOTE 10—INCOME TAXES—continued
The Company’s liabilities related to uncertain tax positions and related interest and penalties are recorded as a component of long-term accrued income taxes in the accompanying Consolidated Financial Statements. The Company had accrued $1.6 and $1.7 million for payment of interest and penalties as of January 1, 2011 and January 2, 2010, respectively.
Unrecognized tax benefits, including interest and penalties, that, if recognized would favorably affect the Company’s effective tax rate in the future were $6.6 and $6.9 million as of January 1, 2011 and January 2, 2010, respectively.
The Company settled several tax matters in 2008 with a value of $2.2 million, and did not record significant changes to its uncertain tax positions liability during the preceding twelve months.
The Company and its subsidiaries are periodically examined by various taxing authorities. The Company files federal, state, and local tax returns in the United States as well as several foreign countries. Its primary income tax jurisdictions are the United States and Switzerland. The Internal Revenue Service has examined the Company’s 2007 federal tax return. The tax years 2006-2009 remain subject to examination by the Internal Revenue Service for federal income tax purposes, and the years 2008-2009 remain subject to examination by the appropriate governmental agencies for Swiss tax purposes.
NOTE 11—FOUNDERS’ STOCK REDEMPTION AGREEMENTS
In 1998, the Company entered into agreements with its founding shareholders for the future repurchase of 4.5 million shares of the Company’s outstanding stock. The agreements were terminated in November 2004. At that time, 3.4 million shares remained subject to repurchase. Prior to November 2004, the agreements required stock repurchases following the later of the death of each founder or their spouse. The cost of the repurchase agreements was to be funded by $160.0 million of proceeds from life insurance policies the Company purchased on the lives of certain of these individuals. At the beginning of 2008, the Company’s remaining life insurance portfolio consisted of eleven policies with a face value of $130.0 million and cash surrender value of $21.2 million. Throughout 2008 the Company surrendered or sold all eleven life insurance policies generating $21.0 million in proceeds. As part of the sale of the life insurance policies, the Company recognized a gain of $1.3 million during the fourth quarter of 2008. For policies that were surrendered the Company received the cash surrender value of the policy on the day of notification. The proceeds were used to fund the equity issuance costs and debt amendment fees incurred in connection with the October 28, 2008 Corporate Recapitalization Plan.
NOTE 12—CONCENTRATION OF CREDIT RISK
Certain financial instruments potentially subject the Company to concentrations of credit risk. These financial instruments consist primarily of cash equivalents, trade receivables, and interest rate derivatives. In all cases, the maximum exposure to loss from credit risk equals the gross fair value of the financial instruments. The need for reserves for such losses is continually assessed, and historically has been within expectations. The Company does not require collateral or other security to support financial instruments subject to credit risk.
With respect to cash equivalents and interest rate derivatives, the Company’s credit risk is limited due to the counterparties being high credit quality financial institutions.
With respect to trade receivables, the Company’s credit risk is limited due to a relatively large customer base and its dispersion across different industries and geographic areas.
73
Table of Contents
X-RITE, INCORPORATED AND SUBSIDIARIES
NOTES TO CONSOLIDATED FINANCIAL STATEMENTS—(Continued)
NOTE 13—OPERATING LEASES
The Company leases real property, equipment and automobiles under agreements that expire on various dates. Certain leases contain renewal provisions and generally require the company to pay utilities, insurance, taxes, and other operating expenses. Future minimum rental payments required under operating leases that have initial or remaining non-cancelable lease terms in excess of one year as of January 1, 2011, are as follows (in thousands):
| 2011 |
4,566 | |||
| 2012 |
3,552 | |||
| 2013 |
2,331 | |||
| 2014 |
503 | |||
| 2015 |
55 |
Total lease expense charged to continuing operations was $3.8, $4.5 and $4.3 million, in 2010, 2009 and 2008, respectively. Substantially all of the minimum lease payments under operating leases are related to rental of facilities.
NOTE 14—CONTINGENCIES, COMMITMENTS AND GUARANTEES
The Company is involved in legal proceedings, legal actions, and claims arising in the normal course of business, including proceedings related to product, labor, and other matters. Such matters are subject to many uncertainties, and outcomes are not predictable with assurance. The Company records amounts for losses that are deemed probable and subject to reasonable estimate. The Company does not believe that the ultimate resolution of these matters will have a material adverse effect on its consolidated financial statements.
The Company has provided standby letters of credit to third-parties. The terms of the letters of credit, including renewal provisions, extend through December 31, 2011. The face amount of the agreements totaled $0.6 million at January 1, 2011.
The Company offers standard product warranties ranging from one to three years.
NOTE 15—SHAREHOLDER PROTECTION RIGHTS AGREEMENT
In November 2001, the Company’s Board of Directors adopted a Shareholder Protection Rights Plan (Plan). The Plan is designed to protect shareholders against unsolicited attempts to acquire control of the Company in a manner that does not offer a fair price to all shareholders.
Under the Plan, one Purchase Right (Right) automatically trades with each share of the Company’s common stock. Each Right entitles a shareholder to purchase 1/100 of a share of junior participating preferred stock at a price of $30.00, if any person or group attempts certain hostile takeover tactics toward the Company. Under certain hostile circumstances, each Right may entitle the holder to purchase the Company’s common stock at one-half its market value or to purchase the securities of any acquiring entity at one-half their market value. Rights are subject to redemption by the Company at $.005 per Right and, unless earlier redeemed, will expire in the first quarter of 2012. Rights beneficially owned by holders of 15 percent or more of the Company’s common stock, or their transferees and affiliates, automatically become void. In August 2008, the Company amended the Plan to render it inapplicable to the transactions contemplated by the Corporate Recapitalization Plan. The plan was further amended in August 2009, to render it inapplicable to the transactions contemplated by the Exchange.
74
Table of Contents
| ITEM 8. | FINANCIAL STATEMENTS AND SUPPLEMENTARY DATA |
Set forth below is a summary of the quarterly operating results on a consolidated basis for the years ended January 1, 2011 and January 2, 2010. Refer to Management’s Discussion and Analysis provided in Item 7 and the Notes to the Consolidated Financial Statements for further disclosure of significant accounting transactions that may have affected the quarterly operating results for each of the periods presented.
| (In thousands, except per share data) |
Sales | Gross Profit |
Operating Income (Loss) |
Net Income (Loss) |
Basic and Diluted Income (Loss) Per Share |
|||||||||||||||
| Period |
||||||||||||||||||||
| 2010: |
||||||||||||||||||||
| Fourth Quarter |
$ | 58,958 | $ | 35,003 | $ | 8,921 | $ | 3,980 | $ | 0.05 | ||||||||||
| Third Quarter |
55,428 | 32,745 | 6,935 | (132 | ) | — | ||||||||||||||
| Second Quarter |
57,128 | 34,325 | 8,230 | 1,939 | 0.02 | |||||||||||||||
| First Quarter |
51,226 | 31,008 | 4,843 | (2,146 | ) | (0.03 | ) | |||||||||||||
| 2009: |
||||||||||||||||||||
| Fourth Quarter |
$ | 50,032 | $ | 27,073 | $ | 1,535 | $ | 67 | $ | — | ||||||||||
| Third Quarter |
45,655 | 27,047 | 1,612 | (8,974 | ) | (0.12 | ) | |||||||||||||
| Second Quarter |
49,362 | 29,638 | 2,461 | (7,604 | ) | (0.10 | ) | |||||||||||||
| First Quarter |
46,618 | 26,845 | (1,787 | ) | (8,731 | ) | (0.11 | ) | ||||||||||||
The aggregate quarterly income (loss) per share amounts as disclosed in the table above does not equal the annual diluted loss per share because each quarter is calculated independently of the annual period.
75
Table of Contents
| ITEM 9. | CHANGES IN AND DISAGREEMENTS WITH ACCOUNTANTS ON ACCOUNTING AND FINANCIAL DISCLOSURE—None |
| ITEM 9A. | CONTROLS AND PROCEDURES |
(i) CONTROLS AND PROCEDURES
Under the supervision and with the participation of the Company’s senior management, including the Chief Executive Officer and Chief Financial Officer, the Company conducted an evaluation of the effectiveness of the design and operation of its disclosure controls and procedures, as defined in Rules 13a-15(e) and 15d-15(e) under the Securities Exchange Act of 1934, as amended (the Exchange Act), as of the end of the period covered by this annual report (the Evaluation Date). Based on this evaluation, the Company’s Chief Executive Officer and Chief Financial Officer concluded as of the Evaluation Date that the Company’s disclosure controls and procedures were effective such that the information relating to the Company, including consolidated subsidiaries, required to be disclosed in our Securities and Exchange Commission (SEC) reports (i) is recorded, processed, summarized and reported within the time periods specified in SEC rules and forms, and (ii) is accumulated and communicated to the Company’s management, including the Chief Executive Officer and Chief Financial Officer, as appropriate to allow timely decisions regarding required disclosure.
(ii) INTERNAL CONTROLS OVER FINANCIAL REPORTING
(a) Management’s Report on Internal Control over Financial Reporting
Management’s Report on Internal Control over Financial Reporting is set forth on page 38 of this report on Form 10-K.
(b) Attestation Report of the Registered Public Accounting Firm.
The attestation report of Ernst & Young LLP, the Company’s independent registered public accounting firm, on the effectiveness of the Company’s internal control over financial reporting is set forth on page 39 of this report on Form 10-K.
Changes in Internal Control over Financial Reporting
There have been no material changes in internal control over financial reporting that occurred during the quarter ended January 1, 2011 that have materially affected or are reasonably likely to materially affect the Company’s internal control over financial reporting.
| ITEM 9B. | OTHER INFORMATION—None |
76
Table of Contents
PART III
| ITEM 10. | DIRECTORS, EXECUTIVE OFFICERS AND CORPORATE GOVERNANCE |
(a) Directors
Information relating to directors appearing under the caption “Election of Directors” and procedures by which shareholders may recommend nominees to the Company’s Board of Directors “Director Selection Criteria and Review of Director Nominees” in the definitive Proxy Statement for the 2011 Annual Meeting of Shareholders is incorporated by reference.
(b) Officers
Information relating to executive officers is included in this report in the Supplementary Item to Part I under the caption “Executive Officers of the Company.”
(c) Compliance with Section 16(a)
Information concerning compliance with Section 16(a) of the Securities Exchange Act of 1934 appearing under the caption “Section 16(a) Beneficial Ownership Reporting Compliance” in the definitive Proxy Statement for the 2011 Annual meeting of Shareholders is incorporated herein by reference.
(d) Code of Ethics
The Company has adopted a code of ethics that applies to its senior executive team, including its Chief Executive Officer, Chief Financial Officer and Chief Accounting Officer. The code of ethics is posted on the Company’s website at www.xrite.com. The Company intends to satisfy the requirements under Item 5.05 of Form 8-K regarding disclosure of amendments to, or waivers from, provisions of its code of ethics that apply to the Chief Executive Officer, Chief Financial Officer or Chief Accounting Officer by posting such information on the Company’s website. Copies of the code of ethics will be provided free of charge upon written request directed to Investor Relations at the corporate headquarters.
(e) Audit Committee Information
Information concerning the Company’s Audit Committee and its audit committee financial expert appearing under the caption “Board Leadership Structure and its Committees” in the definitive Proxy Statement for the 2011 Annual meeting of Shareholders is incorporated herein by reference.
| ITEM 11. | EXECUTIVE COMPENSATION |
The information contained under the captions “Compensation Discussion & Analysis,” “Agreements and Other Arrangements” and “Information Regarding Executive Officer Compensation” contained in the definitive Proxy Statement for the 2011 Annual Meeting of Shareholders is incorporated herein by reference.
| ITEM 12. | SECURITY OWNERSHIP OF CERTAIN BENEFICIAL OWNERS AND MANAGEMENT AND RELATED STOCKHOLDER MATTERS |
The information contained under the captions “Equity Compensation Plan Summary,” “Securities Ownership by Principal Shareholders” and “Securities Ownership by Management and Directors” contained in the definitive Proxy Statement for the 2011 Annual Meeting of Shareholders is incorporated herein by reference.
77
Table of Contents
| ITEM 13. | CERTAIN RELATIONSHIPS, RELATED PARTY TRANSACTIONS, AND DIRECTOR INDEPENDENCE |
The information contained under the captions “Certain Relationships and Related Party Transactions,” “Review and Approval of Related Person Transactions” and “Director Independence” contained in the definitive Proxy Statement for the 2011 Annual Meeting of Shareholders is incorporated herein by reference.
| ITEM 14. | PRINCIPAL ACCOUNTANT FEES AND SERVICES |
The information contained under the captions “Relationship with Our Independent Auditors” and “Preapproval Policy for Auditor Services” contained in the definitive Proxy Statement for the 2011 Annual Meeting of Shareholders is incorporated herein by reference.
78
Table of Contents
PART IV
| ITEM 15. | EXHIBITS AND FINANCIAL STATEMENTS SCHEDULES |
(a) 1 The following financial statements, all of which are set forth in Item 8, are filed as a part of this report:
| (a) 2 | The following financial statements schedule is filed as a part of this report beginning on page 81: |
Schedule II Valuation and Qualifying Accounts
| (b) | See Exhibit Index located on page 82. |
| (c) | All other schedules required by Form 10-K Annual Report have been omitted because they were inapplicable, included in the notes to the Consolidated Financial Statements, or otherwise not required under the instructions contained in Regulation S-X. |
79
Table of Contents
Pursuant to the requirements of Section 13 or 15(d) of the Securities Exchange Act of 1934, the registrant has duly caused this report to be signed on its behalf by the undersigned thereunto duly authorized.
X-RITE, INCORPORATED
| March 17, 2011 | /S/ THOMAS J. VACCHIANO JR. | |
| Thomas J. Vacchiano Jr., Chief Executive Officer (principal executive officer) | ||
| March 17, 2011 | /S/ RAJESH K. SHAH | |
| Rajesh K. Shah, Chief Financial Officer (principal financial officer) | ||
| March 17, 2011 | /S/ JEFFREY D. MCKEE | |
| Jeffrey D. McKee, Corporate Controller (principal accounting officer) | ||
Pursuant to the requirements of the Securities and Exchange Act of 1934, this report has been signed below on this 17th day of March, 2011, by the following persons on behalf of the Registrant and in the capacities indicated.
Each director of the Registrant whose signature appears below, hereby appoints Thomas J. Vacchiano Jr., Rajesh K. Shah, and Jeffrey D. McKee and each of them individually as his attorney-in-fact to sign in his name and on his behalf as a Director of the Registrant, and to file with the Commission any and all amendments to this report on Form 10-K to the same extent and with the same effect as if done personally.
| /S/ GIDEON ARGOV |
/S/ MARK D. WEISHAAR | |
| Gideon Argov, Director | Mark D. Weishaar, Director | |
| /S/ DAVID A. ECKERT |
/S/ COLIN M. FARMER | |
| David A. Eckert, Director | Colin M. Farmer, Director | |
| /S/ DANIEL M. FRIEDBERG |
/S/ L. PETER FRIEDER | |
| Daniel M. Friedberg, Director | L. Peter Frieder, Director | |
| /S/ JOHN E. UTLEY |
/S/ BRADLEY J. COPPENS | |
| John E. Utley, Director | Bradley J. Coppens, Director | |
| /S/ THOMAS J. VACCHIANO JR. |
||
| Thomas J. Vacchiano Jr., Director | ||
80
Table of Contents
Valuation and Qualifying Accounts
X-Rite, Incorporated
(in thousands)
| Balance at Beginning of Period |
Additions Charged to Costs and Expenses |
Deductions (Recoveries) * |
Balance at End of Period |
|||||||||||||
| Year ended January 1, 2011 |
||||||||||||||||
| Allowance for losses on accounts receivable |
$ | 2,561 | $ | 371 | $1,152 | $ | 1,780 | |||||||||
| Year ended January 2, 2010 |
||||||||||||||||
| Allowance for losses on accounts receivable |
$ | 3,391 | $ | 730 | $1,560 | $ | 2,561 | |||||||||
| Year ended January 3, 2009 |
||||||||||||||||
| Allowance for losses on accounts receivable |
$ | 2,328 | $ | 760 | -$ 303 | $ | 3,391 | |||||||||
| * | Deductions represent uncollectible accounts written-off, net of recoveries |
81
Table of Contents
| 2(1) | Agreement and Plan of Merger by and among X-Rite, Incorporated and Pantone, Inc., Pantone Germany, Inc., Pantone India, Inc., Pantone UK, Inc., Pantone Asia, Inc. and Pantone Japan, Inc. and all of the Stockholders of each of the Companies and Stockholders’ Representation named therein dated August 23, 2007 (incorporated by reference to exhibit 2(1) to Form 10-K for the year ended December 29, 2007). | |
| 2(2) | Amendment Number 1 to Agreement and Plan of Merger by and among X-Rite, Incorporated and Pantone, Inc., Pantone Germany, Inc., Pantone India, Inc., Pantone UK, Inc., Pantone Asia, Inc. and Pantone Japan, Inc. and all of the Stockholders of each of the Companies and Stockholders’ Representation named therein dated October 15, 2007 (incorporated by reference to exhibit 2(2) to Form 10-K for the year ended December 29, 2007). | |
| 2(3) | Amendment Number 2 to Agreement and Plan of Merger by and among X-Rite, Incorporated and Pantone, Inc., Pantone Germany, Inc., Pantone India, Inc., Pantone UK, Inc., Pantone Asia, Inc. and Pantone Japan, Inc. and all of the Stockholders of each of the Companies and Stockholders’ Representation named therein dated October 24, 2007 (incorporated by reference to exhibit 2(3) to Form 10-K for the year ended December 29, 2007). | |
| 3(1) | Restated Articles of Incorporation (incorporated by reference to exhibit to Form S-18 dated April 10, 1986). | |
| 3(2) | Certificate of Amendment to Restated Articles of Incorporation adding Article IX (incorporated by reference to exhibit 3(3) to Form 10-K for the year ended January 3, 2009). | |
| 3(3) | Certificate of Amendment to Restated Articles of Incorporation amending Article III (incorporated by reference to exhibit 3(3) to Form 10-K for the year ended January 3, 2009). | |
| 3(4) | Certificate of Amendment to Restated Articles of Incorporation amending Article III (incorporated by reference to exhibit to Form 10-K for the year ended December 31, 1995). | |
| 3(5) | Certificate of Amendment to Restated Articles of Incorporation amending Article IV (incorporated by reference to exhibit to Form 10-K for the year ended January 2, 1999). | |
| 3(6) | Certificate of Amendment to Restated Articles of Incorporation amending Article III (incorporated by reference to exhibit 3(6) to Form 10-K for the year ended January 3, 2009). | |
| 3(7) | Certificate of Designation, Preferences and Rights of Series A Preferred Stock dated as of, and filed by X-Rite, Incorporated with the Michigan Department of Energy, Labor and Economic Growth on, August 18, 2009 (incorporated by reference to exhibit 3.1 of the Form 8-K filed by X-Rite, Incorporated on August 20, 2009) | |
| 3(8) | Second Amended and Restated Bylaws of X-Rite, Incorporated (incorporated by reference to exhibit 3.2 of the Form 8-K filed by X-Rite, Incorporated on August 20, 2008). | |
| 4(1) | X-Rite, Incorporated common stock certificate specimen (incorporated by reference to exhibit to Form 10-Q for the quarter ended June 30, 1986). | |
| 4(2) | Shareholder Protection Rights Agreement, dated as of March 29, 2002, including as Exhibit A the form of Rights Certificate and of Election to Exercise, and as Exhibit B the form of Certificate of Adoption of Resolution Designating and Prescribing Rights, Preferences and Limitations of Junior Participating Preferred Stock of the Company (incorporated by reference to exhibit to Form 10-K for the year ended December 29, 2001). | |
| 4(3) | Amendment No. 1, dated as of August 20, 2008, to Shareholder Protection Rights Agreement, between X-Rite, Incorporated and Computershare Trust Company, N.A. (formerly known as EquiServe Trust Company, N.A.), dated as of March 29, 2002 (incorporated by reference to exhibit 4.1 of the Form 8-A/A filed by X-Rite, Incorporated on August 20, 2008) | |
82
Table of Contents
EXHIBIT INDEX—continued
| 4(4) | Amendment No. 2 to Shareholder Protection Rights Agreement, dated as of August 18, 2009, between X-Rite, Incorporated and Computershare Trust Company, N.A. (formerly known as EquiServe Trust Company, N.A.), dated as of March 29, 2002 (incorporated by reference to exhibit 4.3 of the Form 8-A/A filed by X-Rite, Incorporated on August 18, 2009) | |
| 4(5) | Registration Rights Agreement, dated as of October 28, 2008, by and among X-Rite, Incorporated and Oepx, LLC and Sagard Capital Partners, L.P. and Tinicum Capital Partners II, L.P., Tinicum Capital Partners II Parallel Fund, L.P., and Tinicum Capital Partners II Executive Fund L.L.C. (incorporated by reference to exhibit 4.3 of the Form 8-K filed by X-Rite, Incorporated on October 28, 2008) | |
| 4(6) | Amendment No 1. to Registration Rights Agreement, dated as of August 18, 2009, among X-Rite, Incorporated, OEPX, LLC, Sagard Capital Partners, L.P., Tinicum Capital Partners II, L.P., Tinicum Capital Partners II Parallel Fund, L.P. and Tinicum Capital Partners II Executive Fund L.L.C. (incorporated by reference to exhibit 10.8 of the Form 8-K filed by X-Rite, Incorporated on August 20, 2009) | |
| 4(7) | Exchange Agreement, dated as of August 18, 2009, among X-Rite, Incorporated, OEPX, LLC, Sagard Capital Partners, L.P., Tinicum Capital Partners II, L.P., Tinicum Capital Partners II Parallel Fund, L.P. and Tinicum Capital Partners II Executive Fund L.L.C. (incorporated by reference to exhibit 10.1 of the Form 8-K filed by X-Rite, Incorporated on August 20, 2009) | |
| 4(8) | Form of Warrant issued to each of OEPX, LLC, Sagard Capital Partners, L.P., Tinicum Capital Partners II, L.P., Tinicum Capital Partners II Parallel Fund, L.P. and Tinicum Capital Partners II Executive Fund L.L.C. in the amounts set forth in Annex A to the Exchange Agreement (incorporated by reference to exhibit 10.2 of the Form 8-K filed by X-Rite, Incorporated on August 20, 2009) | |
| 4(9) | Letter Agreement dated August 18, 2009 between X-Rite, Incorporated and OEPX, LLC regarding voting of shares (incorporated by reference to exhibit 10.3 of the Form 8-K filed by X-Rite, Incorporated on August 20, 2009) | |
| 4(10) | Letter Agreement dated August 18, 2009 between X-Rite, Incorporated and Sagard Capital Partners, L.P. regarding voting of shares (incorporated by reference to exhibit 10.4 of the Form 8-K filed by X-Rite, Incorporated on August 20, 2009) | |
| 4(11) | Letter Agreement dated August 18, 2009 between X-Rite, Incorporated, Tinicum Capital Partners II, L.P., Tinicum Capital Partners II Parallel Fund, L.P. and Tinicum Capital Partners II Executive Fund L.L.C. regarding voting of shares (incorporated by reference to exhibit 10.5 of the Form 8-K filed by X-Rite, Incorporated on August 20, 2009) | |
| *10(1) | Form of Indemnity Agreement entered into between X-Rite, Incorporated and members of its board of directors and officers (incorporated by reference to exhibit to Form 10-Q for the quarter ended September 28, 2002). | |
| *10(2) | X-Rite, Incorporated Amended and Restated Outside Director Stock Option Plan, effective as of January 26, 2003 (incorporated by reference to Appendix A to the definitive proxy statement dated April 11, 2003). | |
| *10(3) | First Amendment to the X-Rite, Incorporated Amended and Restated Outside Director Stock Option Plan, effective as of January 26, 2003 (incorporated by reference to exhibit to Form 10-Q for the quarter ending July 3, 2004). | |
| *10(4) | X-Rite, Incorporated Amended and Restated Employee Stock Option Plan, effective as of January 26, 2003 (incorporated by reference to Appendix A to the definitive proxy statement dated April 11, 2003 and incorporated herein by reference). | |
83
Table of Contents
EXHIBIT INDEX—continued
| *10(5) | X-Rite Incorporated Amended and Restated Employee Stock Purchase Plan, effective as of February 10, 2004 (incorporated by reference to Appendix A to the definitive proxy statement dated April 7, 2004 and incorporated herein by reference). | |
| *10(6) | Form of Stock Option Agreement from the 2003 Amended and Restated Outside Director Stock Option Plan (incorporated by reference to exhibit 10.22 to Form 10-K for the year ended January 1, 2005). | |
| *10(7) | Form of Stock Option Agreement from the 2003 Amended and Restated Employee Stock Option Plan (incorporated by reference to exhibit 10.23 to Form 10-K for the year ended January 1, 2005). | |
| *10(8) | Form of X-Rite, Incorporated Second Restricted Stock Plan Agreement (incorporated by reference to exhibit to Form 10-K for the year ended January 1, 2005). | |
| *10(9) | Employment Agreement between X-Rite, Incorporated and Francis Lamy, effective as of July 5, 2006 (incorporated by reference to exhibit 10.3 to Form 8-K dated January 31, 2006). | |
| *10(10) | Employment Agreement between X-Rite, Incorporated and Thomas J. Vacchiano, Jr., effective as of July 5, 2006 (incorporated by reference to exhibit 10.2 to Form 8-K dated January 31, 2006 and incorporated herein by reference). | |
| *10(11) | X-Rite, Incorporated 2006 Omnibus Long Term Incentive Plan, effective as of June 30, 2006 (incorporated by reference to Exhibit A to the definitive proxy statement dated July 24, 2006). | |
| *10(12) | Form of Officer Stock Option Agreement under the X-Rite, Incorporated 2006 Omnibus Long Term Incentive Plan (incorporated by reference to exhibit 10(23) to Form 10-K for the year ended December 29, 2007). | |
| *10(13) | Form of Outside Director Stock Option Agreement under the X-Rite, Incorporated 2006 Omnibus Long Term Incentive Plan (incorporated by reference to exhibit 10(24) to Form 10-K for the year ended December 29, 2007). | |
| *10(14) | Form of Employee Stock Option Agreement under the X-Rite, Incorporated 2006 Omnibus Long Term Incentive Plan (incorporated by reference to exhibit 10(25) to Form 10-K for the year ended December 29, 2007). | |
| *10(15) | Form of Consultant & Advisor Stock Option Agreement under the X-Rite, Incorporated 2006 Omnibus Long Term Incentive Plan (incorporated by reference to exhibit 10(26) to Form 10-K for the year ended December 29, 2007). | |
| *10(16) | Form of Restricted Stock Agreement under the X-Rite, Incorporated 2006 Omnibus Long Term Incentive Plan (incorporated by reference to exhibit 10(27) to Form 10-K for the year ended December 29, 2007). | |
| *10(17) | Change of Control Severance Plan for Senior Executives dated April 1, 2007 (incorporated by reference to exhibit 10.1 to Form 8-K dated April 5, 2007). | |
| *10(18) | X-Rite, Incorporated 2008 Omnibus Long Term Incentive Plan on October 28, 2008 (incorporated by reference to Annex D of Schedule 14A filed by X-Rite, Incorporated on September 26, 2008) | |
| *10(19) | Form of Restricted Stock Unit (RSU) Grant Agreement under the X-Rite, Incorporated 2008 Omnibus Long Term Incentive Plan (incorporated by reference to exhibit 10.31 to Form 10-K for the year ended January 3, 2009). | |
| *10(20) | Form of Outside Director Stock Option Agreement under the X-Rite, Incorporated 2008 Omnibus Long Term Incentive Plan (incorporated by reference to exhibit 10.32 to Form 10-K for the year ended January 3, 2009). | |
84
Table of Contents
EXHIBIT INDEX—continued
| *10(21) | Form of Employee Stock Option Agreement under the X-Rite, Incorporated 2008 Omnibus Long Term Incentive Plan (incorporated by reference to exhibit 10.33 to Form 10-K for the year ended January 3, 2009). | |
| *10(22) | Form of Consultant & Advisor Stock Option Agreement under the X-Rite, Incorporated 2008 Omnibus Long Term Incentive Plan (incorporated by reference to exhibit 10.34 to Form 10-K for the year ended January 3, 2009). | |
| *10(23) | Form of Restricted Stock Agreement under the X-Rite, Incorporated 2008 Omnibus Long Term Incentive Plan (incorporated by reference to exhibit 10.35 to Form 10-K for the year ended January 3, 2009). | |
| *10(24) | Form of Restricted Stock Unit (RSU) Grant Agreement under the X-Rite, Incorporated 2008 Omnibus Long Term Incentive Plan and awarded in connection with the Company’s 2008 Corporate Recapitalization Plan (incorporated by reference to exhibit 10.36 to Form 10-K for the year ended January 3, 2009). | |
| *10(25) | Form of Employee Stock Option Agreement under the X-Rite, Incorporated 2008 Omnibus Long Term Incentive Plan and awarded in connection with the Company’s 2008 Corporate Recapitalization Plan (incorporated by reference to exhibit 10.37 to Form 10-K for the year ended January 3, 2009). | |
| *10(26) | Form of Restricted Stock Agreement under the X-Rite, Incorporated 2008 Omnibus Long Term Incentive Plan and awarded in connection with the Company’s 2008 Corporate Recapitalization Plan (incorporated by reference to exhibit 10.38 to Form 10-K for the year ended January 3, 2009). | |
| *10(27) | Offer Letter between X-Rite, Incorporated and Rajesh K. Shah executed on October 13, 2009 (incorporated by reference to exhibit 10.1 of the Form 8-K filed by X-Rite, Incorporated on October 16, 2009) | |
| 10(28) | First Lien Credit and Guaranty Agreement dated as of October 24, 2007 among X-Rite, Incorporated, as Company, Certain Subsidiaries of X-Rite, Incorporated, as Guarantors, Various Lenders, Fifth Third Bank, a Michigan banking corporation, as Administrative Agent and Collateral Agent, Merrill Lynch Capital, a division of Merrill Lynch Business Financial Services, Inc., as Syndication Agent, National City Bank, as Co-documentation Agent, and LaSalle Bank Midwest, N.A., as Co-documentation Agent (incorporated by reference to exhibit 10(33) to Form 10-K for the year ended December 29, 2007). | |
| 10(29) | Second Lien Credit and Guaranty Agreement dated as of October 24, 2007 among X-Rite, Incorporated, as Company, Certain Subsidiaries of X-Rite, Incorporated, as Guarantors, Various Lenders, GoldenTree Capital Solutions Fund Financing, as Lead Arranger, and The Bank of New York, as Administrative Agent and Collateral Agent (incorporated by reference to exhibit 10(34) to Form 10-K for the year ended December 29, 2007). | |
| 10(30) | Consent and Amendment No. 2 to First Lien Credit and Guaranty Agreement and Amendment No. 1 to Pledge and Security Agreement (First Lien), dated as of August 18, 2009, to the First Lien Credit and Guaranty Agreement, dated as of October 24, 2007, among X-Rite, Incorporated and the other parties thereto (incorporated by reference to exhibit 10.9 of the Form 8-K filed by X-Rite, Incorporated on August 20, 2009) | |
| 10(31) | Consent, Limited Waiver and Amendment No. 2 to Second Lien Credit and Guaranty Agreement and Amendment No. 1 to Pledge and Security Agreement (Second Lien), dated as of August 18, 2009, to the Second Lien Credit and Guaranty Agreement, dated as of October 24, 2007, among X-Rite, Incorporated and the other parties thereto (incorporated by reference to exhibit 10.10 of the Form 8-K filed by X-Rite, Incorporated on August 20, 2009) | |
85
Table of Contents
EXHIBIT INDEX—continued
| 10(32) | Amendment No. 3 to First Lien Credit and Guaranty Agreement, dated as of December 17, 2009, by and among X-Rite, Incorporated and other parties thereto (incorporated by reference to exhibit 10.1 of the Form 10-K filed by X-Rite, Incorporated on May 13, 2010) | |
| 10(33) | Consent and Amendment No. 4 to the First Lien and Credit Guaranty Agreement, dated as of March 5, 2010, by and among X-Rite, Incorporated and the other parties thereto (incorporated by reference to exhibit 10.2 of the Form 10-K filed by X-Rite, Incorporated on May 13, 2010) | |
| 10(34) | Consent and Amendment No. 3 to the Second Lien Credit and Guaranty Agreement, dated as of March 5, 2010, by and among X-Rite, Incorporated and the other parties thereto (incorporated by reference to exhibit 10.3 of the Form 10-K filed by X-Rite, Incorporated on May 13, 2010) | |
| 10(35) | Consent and Amendment No. 5 to the First Lien Credit and Guaranty Agreement, dated as of September 28, 2010, to the First Lien Credit Guaranty Agreement, dated as of October 24, 2007, among X-Rite, Incorporated and the other parties thereto (incorporated by reference to exhibit 10.1 of the Form 8-K filed by X-Rite, Incorporated on October 4, 2010) | |
| 10(36) | Investment Agreement, dated as of August 20, 2008, between X-Rite, Incorporated and OEPX, LLC (incorporated by reference to exhibit 10.1 of the Form 8-K filed by X-Rite, Incorporated on August 20, 2008) | |
| 10(37) | Amendment No. 1 to Investment Agreement, dated as of August 18, 2009, between X-Rite, Incorporated and OEPX, LLC (incorporated by reference to exhibit 10.6 of the Form 8-K filed by X-Rite, Incorporated on August 20, 2009) | |
| 10(38) | Investment Agreement dated as of August 20, 2008 between X-Rite, Incorporated, Sagard Capital Partners,L.P., Tinicum Capital Partners II, L.P., Tinicum Capital Partners II Parallel Fund and Tinicum Capital Partners II Executive Fund (incorporated by reference to exhibit 10.2 of the Form 8-K filed by X-Rite, Incorporated on August 20, 2008) | |
| 10(39) | Amendment No. 1 to Investment Agreement, dated as of August 18, 2009, among X-Rite, Incorporated, Sagard Capital Partners, L.P., Tinicum Capital Partners II, L.P., Tinicum Capital Partners II Parallel Fund, L.P. and Tinicum Capital Partners II Executive Fund L.L.C. (incorporated by reference to exhibit 10.7 of the Form 8-K filed by X-Rite, Incorporated on August 20, 2009) | |
| 10(40) | Forbearance Agreement and Consent, Waiver and Amendment No. 1 related to the First Lien Credit and Guaranty Agreement, dated as of October 24, 2007, among the X-Rite, Incorporated, certain Company’s subsidiaries as guarantors, certain financial institutions from time to time party thereto and Fifth Third Bank, as administrative agent and collateral agent for the First Lien Lenders (incorporated by reference to exhibit 10.3 of the Form 8-K filed by X-Rite, Incorporated on August 20, 2008) | |
| 10(41) | Forbearance Agreement and Consent, Waiver and Amendment No. 1 related to the Second Lien Credit and Guaranty Agreement, dated as of October 24, 2007, among X-Rite, Incorporated, certain Company’s subsidiaries as guarantors, certain financial institutions from time to time party thereto and The Bank of New York Mellon, as administrative agent and collateral agent for the Second Lien Lenders (incorporated by reference to exhibit 10.4 of the Form 8-K filed by X-Rite, Incorporated on August 20, 2008) | |
| 10(42) | Letter Agreement between X-Rite, Incorporated and Goldman Sachs Capital Markets, L.P. (incorporated by reference to exhibit 10.5 of the Form 8-K filed by X-Rite, Incorporated on August 20, 2008) | |
| 10(43) | Consent, Reaffirmation and First Amendment to Intercreditor Agreement with Fifth Third Bank and the Bank of New York Mellon (incorporated by reference to exhibit 10.6 of the Form 8-K filed by X-Rite, Incorporated on August 20, 2008) | |
86
Table of Contents
EXHIBIT INDEX—continued
| 14 | X-Rite, Incorporated Code of Ethics for Senior Executive Team (filed as exhibit to Form 10-K for the year ended January 3, 2004 and incorporated herein by reference). | |
| 21 | Subsidiaries of X-Rite, Incorporated. | |
| 23 | Consent of Independent Registered Public Accounting Firm. | |
| 31(1) | Certification of the Chief Executive Officer and President of X-Rite, Incorporated pursuant to Section 302 of the Sarbanes-Oxley Act of 2002 (18 U.S.C. 1350). | |
| 31(2) | Certification of the Chief Financial Officer and Vice President of Finance of X-Rite, Incorporated pursuant to Section 302 of the Sarbanes-Oxley Act of 2002 (18 U.S.C. 1350). | |
| 32(1) | Certification Pursuant To 18 U.S.C. Section 1350 as Adopted Pursuant To Section 906 of the Sarbanes-Oxley Act of 2002. | |
| * | Agreements or compensation plans or arrangements with or relating to executive officers, directors or related parties. |
87