Attached files
| file | filename |
|---|---|
| EX-31.3 - CERTIFICATION - Primerica, Inc. | dex313.htm |
| EX-31.1 - CERTIFICATION - Primerica, Inc. | dex311.htm |
| EX-21.1 - SUBSIDIARIES OF THE REGISTRANT - Primerica, Inc. | dex211.htm |
| EX-32.1 - SECTION 906 CERTIFICATION - Primerica, Inc. | dex321.htm |
| EX-23.1 - CONSENT OF KPMG LLP - Primerica, Inc. | dex231.htm |
| EX-31.2 - CERTIFICATION - Primerica, Inc. | dex312.htm |
| EX-10.31 - NONEMPLOYEE DIRECTOR'S DEFERRED COMPENSATION PLAN - Primerica, Inc. | dex1031.htm |
Table of Contents
Index to Financial Statements
UNITED STATES
SECURITIES AND EXCHANGE COMMISSION
Washington, D.C. 20549
FORM 10-K
(Mark One)
| x | ANNUAL REPORT PURSUANT TO SECTION 13 OR 15(d) OF THE SECURITIES EXCHANGE ACT OF 1934 |
For the fiscal year ended December 31, 2010
or
| ¨ | TRANSITION REPORT PURSUANT TO SECTION 13 OR 15(d) OF THE SECURITIES EXCHANGE ACT OF 1934 |
For the transition period from to
Commission File Number: 001-34680

Primerica, Inc.
(Exact name of registrant as specified in its charter)
| Delaware | 27-1204330 | |
| (State or other jurisdiction of incorporation or organization) | (I.R.S. Employer Identification No.) |
| 3120 Breckinridge Boulevard Duluth, Georgia |
30099 | |
| (Address of principal executive offices) | (ZIP Code) |
Registrant’s telephone number, including area code: 770.381.1000
Securities registered pursuant to Section 12(b) of the Act:
| Title of each class |
Name of each exchange on which registered | |
| Common Stock, $.01 Par Value | New York Stock Exchange |
Securities registered pursuant to section 12(g) of the Act: None
Indicate by check mark if the registrant is a well-known seasoned issuer, as defined in Rule 405 of the Securities Act. ¨ Yes x No
Indicate by check mark if the registrant is not required to file reports pursuant to Section 13 or Section 15(d) of the Act. ¨ Yes x No
Indicate by check mark whether the registrant (1) has filed all reports required to be filed by Section 13 or 15(d) of the Securities Exchange Act of 1934 during the preceding 12 months (or for such shorter period that the registrant was required to file such reports), and (2) has been subject to such filing requirements for the past 90 days. x Yes ¨ No
Indicate by check mark whether the registrant has submitted electronically and posted on its corporate Web site, if any, every Interactive Data File required to be submitted and posted pursuant to Rule 405 of Regulation S-T (§232.405 of this chapter) during the preceding 12 months (or for such shorter period that the registrant was required to submit and post such files). ¨ Yes ¨ No
Indicate by check mark if disclosure of delinquent filers pursuant to Item 405 of Regulation S-K (§ 229.405 of this chapter) is not contained herein, and will not be contained, to the best of registrant’s knowledge, in definitive proxy or information statements incorporated by reference in Part III of this Form 10-K or any amendment to this Form 10-K. ¨
Indicate by check mark whether the registrant is a large accelerated filer, an accelerated filer, a non-accelerated filer, or a smaller reporting company. See the definitions of “large accelerated filer,” “accelerated filer” and “smaller reporting company” in Rule 12b-2 of the Exchange Act.
| Large accelerated filer | ¨ | Accelerated filer | ¨ | |||||
| Non-accelerated filer | x | (Do not check if a smaller reporting company) | Smaller reporting company | ¨ |
Indicate by check mark whether the registrant is a shell company (as defined in Rule 12b-2 of the Exchange Act). ¨ Yes x No
The aggregate market value of the voting stock held by non-affiliates of the registrant as of June 30, 2010, was $547,542,546.
The number of shares of the registrant’s Common Stock outstanding at February 28, 2011, with $.01 par value, was 73,188,018.
Documents Incorporated By Reference
Certain information contained in the Proxy Statement for the Company’s Annual Meeting of Stockholders to be held on May 18, 2011 is incorporated by reference into Part III hereof.
Table of Contents
Index to Financial Statements
Table of Contents
Index to Financial Statements
CAUTIONARY STATEMENT CONCERNING FORWARD-LOOKING STATEMENTS
Certain statements contained in this report as well as some statements in periodic press releases and some oral statements made by management during presentations are “forward-looking” statements. Forward-looking statements include, without limitation, any statement that may project, indicate or imply future results, events, performance or achievements, and may contain the words “expect,” “intend,” “plan,” “anticipate,” “estimate,” “believe,” “will be,” “will continue,” “will likely result,” and similar expressions, or future conditional verbs such as “may,” “will,” “should,” “would,” and “could.” In addition, any statement concerning future financial performance (including future revenues, earnings or growth rates), ongoing business strategies or prospects, and possible actions taken by us or our subsidiaries, which may be provided by our management teams, are also forward-looking statements. These forward-looking statements involve external risks and uncertainties, including, but not limited to, those described under the section entitled “Risk Factors” included herein.
Forward-looking statements are based on current expectations and projections about future events and are inherently subject to a variety of risks and uncertainties, many of which are beyond the control of our management team. These risks and uncertainties include, among others:
| • | our failure to continue to attract new recruits, retain sales representatives, or maintain the licensing of our sales representatives; |
| • | changes to the independent contractor status of our sales representatives; |
| • | our or our sales representatives’ violation of or non-compliance with laws and regulations; |
| • | our failure to protect the confidentiality of client information; |
| • | differences between our actual experience and our expectations regarding mortality, persistency, expenses and investment yields as reflected in the pricing for our insurance policies; |
| • | the occurrence of a catastrophic event that causes a large number of premature deaths of our insureds; |
| • | changes in, or non-compliance with, federal and state legislation and regulation, including the Dodd-Frank Wall Street Reform and Consumer Protection Act of 2010 and other legislation or regulation that affects our insurance, investment product and loan businesses; |
| • | our failure to meet risk-based capital standards or other minimum capital and surplus requirements; |
| • | a downgrade or potential downgrade in our insurance subsidiaries’ financial strength ratings; |
| • | the effects of credit deterioration and interest rate fluctuations on our invested asset portfolio; |
| • | incorrectly valuing our investments; |
| • | inadequate or unaffordable reinsurance or the failure of our reinsurers to perform their obligations; |
| • | recent changes in accounting for deferred policy acquisition costs of insurance entities and other changes in accounting standards; |
| • | the failure of our investment products to remain competitive with other investment options; |
| • | heightened standards of conduct or more stringent licensing requirements for our sales representatives; |
| • | inadequate policies and procedures regarding suitability review of client transactions; |
| • | the failure of, or legal challenges to, the support tools we provide to our sales force; |
| • | the inability of our subsidiaries to pay dividends or make distributions; |
| • | the effects of a delay in the recovery of the U.S. and Canadian economies; |
| 1 |
Table of Contents
Index to Financial Statements
| • | our ability to generate and maintain a sufficient amount of capital; |
| • | our non-compliance with the covenants of our note payable; |
| • | legal and regulatory investigations and actions concerning us or our sales representatives; |
| • | the competitive environment; |
| • | the loss of key personnel; |
| • | the failure of our information technology systems, breach of our information security or failure of our business continuity plan; |
| • | fluctuations in Canadian currency exchange rates; |
| • | conflicts of interests due to Citigroup Inc.’s (“Citi”) significant interest in us, Warburg Pincus’ significant interest in us and the limited liability of Citi’s directors and officers for breach of fiduciary duty; and |
| • | engagement by Citi in the same type of businesses that we conduct. |
Developments in any of these areas could cause actual results to differ materially from those anticipated or projected or cause a significant reduction in the market price of our common stock.
| 2 |
Table of Contents
Index to Financial Statements
| ITEM 1. | BUSINESS |
Overview
Primerica, Inc. (“Primerica” or “we”) is a leading distributor of financial products to middle income households in the United States and Canada with approximately 95,000 licensed sales representatives at December 31, 2010. We assist our clients in meeting their needs for term life insurance, which we underwrite, and mutual funds, annuities and other financial products, which we distribute primarily on behalf of third parties. We insured more than 4.3 million lives and more than two million clients maintained investment accounts with us at December 31, 2010. Our distribution model uniquely positions us to reach underserved middle income consumers in a cost effective manner and has proven itself in both favorable and challenging economic environments.
Our mission is to serve middle income families by helping them make informed financial decisions and providing them with a strategy and means to gain financial independence. Our distribution model is designed to:
| • | Address our clients’ financial needs: Our sales representatives use our proprietary financial needs analysis (“FNA”) tool and an educational approach to demonstrate how our products can assist clients to provide financial protection for their families, save for their retirement and manage their debt. Typically, our clients are the friends, family members and personal acquaintances of our sales representatives. Meetings are generally held in informal, face-to-face settings, usually in the clients’ own homes. |
| • | Provide a business opportunity: We provide an entrepreneurial business opportunity for individuals to distribute our financial products. Low entry costs and the ability to begin part-time allow our recruits to supplement their income by starting their own independent businesses without incurring significant start-up costs or leaving their current jobs. Our unique compensation structure, technology, training and back-office processing are designed to enable our sales representatives to successfully grow their independent businesses. |
Corporate Structure and History
We conduct our principal business activities in the United States through four principal entities, all of which are wholly owned subsidiaries: Primerica Financial Services, Inc. (“PFS”), our general agency and marketing company; Primerica Life Insurance Company (“Primerica Life”), our principal life insurance company; PFS Investments Inc. (“PFS Investments”), our securities products company and broker-dealer; and Primerica Financial Services Home Mortgages, Inc. (“Primerica Mortgages”), our loan broker company. Our Canadian operations are primarily conducted by Primerica Life Insurance Company of Canada (“Primerica Life Canada”), our Canadian life insurance company, and PFSL Investments Canada Ltd., our Canadian licensed mutual fund dealer. Primerica Life, domiciled in Massachusetts, owns one principal subsidiary, National Benefit Life Insurance Company (“NBLIC”), a New York life insurance company.
As of December 31, 2010, Citi owned approximately 40% and Warburg Pincus owned approximately 23% of our outstanding common stock.
Primerica was incorporated in Delaware in October 2009 to serve as a holding company for the Primerica businesses. However, we trace our core business of offering term life insurance policies through a sales organization of independent sales representatives to 1977. In 1977, Arthur L. Williams, Jr. formed A.L. Williams & Associates, Inc. (“A.L. Williams”), an independent general agency that was dedicated to selling term life insurance through a sales force of seven Regional Vice Presidents (“RVPs”) and 85 sales representatives. A.L. Williams grew rapidly from its inception and became one of the top sellers of individual life insurance in the United States. The operations of A.L. Williams formed the foundation of our general agency subsidiary, PFS, and of our sales force. Our insurance and securities operations are also well-seasoned.
| 3 |
Table of Contents
Index to Financial Statements
Primerica Life was formed in 1927 under the name of Fraternal Protective Insurance Company, and PFS Investments was formed in 1981 under the name of First American National Securities, Inc. Primerica Life, PFS Investments and the assets and operations of PFS were acquired by predecessors of Citi through a series of transactions in the late 1980s.
Our businesses, which prior to April 1, 2010 were wholly owned indirect subsidiaries of Citi, were transferred to us by Citi in a reorganization pursuant to which we issued to a wholly owned subsidiary of Citi (i) 74,990,900 shares of our common stock, (ii) warrants to purchase from us an aggregate of 4,103,110 shares of our common stock and (iii) a $300.0 million note payable due on Mach 31, 2015, bearing interest at an annual rate of 5.5% (the “Citi note”). Citi then:
| • | sold 24,564,000 shares of our common stock in our initial public offering completed in April 2010 (the “Offering”); |
| • | sold 16,412,440 shares of our common stock and the warrants to private equity funds managed by Warburg Pincus LLC (“Warburg Pincus”) in mid-April 2010 (the “private sale”); and |
| • | contributed back to us 5,021,412 shares of our common stock for equity awards granted to employees and sales force leaders in connection with the Offering. |
In March 2010, we entered into coinsurance agreements (the “Citi reinsurance agreements”) with two affiliates of Citi and with Prime Reinsurance Company, Inc. (“Prime Re”), then a wholly owned subsidiary of Primerica Life (collectively, the “Citi reinsurers”). For a description of the Citi reinsurance transactions, see “Management Discussion and Analysis of Financial Condition and Results of Operations – The Transactions – The reinsurance transactions”. We completed additional transactions concurrently with the Offering and the Citi reinsurance transactions, which are described under “Management Discussion and Analysis of Financial Condition and Results of Operations – The Transactions – The concurrent transactions”.
Our Clients
Our clients are generally middle income consumers. We define middle income consumers as households with $30,000 to $100,000 of annual income. According to the 2009 U.S. Census Bureau Current Population Survey, approximately 50% of U.S. households fall in this range. We believe that we understand the financial needs of the middle income segment well:
| • | They have inadequate or no life insurance coverage. Individual life insurance sales in the United States declined from 12.5 million policy sales in 1975 to 6.7 million policy sales in 2009, the latest period for which data is available, according to LIMRA. We believe that term life insurance, which we have provided to middle income clients for many years, is generally the best option for them to meet their life insurance needs due to its lower initial cost versus cash value life insurance and for the protection that it provides at critical points in our clients’ lives. |
| • | They need help saving for retirement and other personal goals. The decrease in the value of households’ retirement account assets has intensified the challenges of middle income families to save for retirement and the education of their children. By developing personalized savings programs for our clients using our proprietary FNA tool and offering a wide range of mutual fund, annuity and segregated fund products sponsored and managed by reputable firms, our sales representatives are well equipped to help clients develop long-term savings and retirement plans to address their financial needs. |
| • | They need to reduce their consumer debt. Many middle income families have numerous debt obligations for credit card, auto loan, home-equity and mortgage debt. We help our clients address these financial burdens, including through debt consolidation loans that allow them to consolidate their debt and accelerate its repayment and personalized client-driven debt management techniques that help |
| 4 |
Table of Contents
Index to Financial Statements
| them reduce and ultimately pay off their debts. |
| • | They prefer to meet face-to-face when considering financial products. In a 2008 survey conducted by LIMRA, 72% of U.S. middle income consumers indicated their desire to speak with a professional about at least one financial product or service, with the majority expressing a preference to meet face-to-face. Our business model is designed to directly address the face-to-face preference expressed by the majority of middle market consumers in a cost-effective manner. |
We believe that our educational approach and distribution model best position us to address the unique needs of the middle income consumer profitably, which traditional financial services firms have found difficult to accomplish.
Our Distribution Model
The high fixed costs associated with in-house sales personnel and salaried career agents and the smaller-sized sales transactions typical of middle income consumers have forced many other financial services companies to focus on more affluent consumers. Product sales to affluent consumers tend to be larger, generating more sizable commissions for the selling agent, who usually works on a full-time basis. As a result, this segment has become increasingly competitive. Our distribution model — borrowing aspects from franchising, direct sales and traditional insurance agencies — is designed to reach and serve middle income consumers efficiently.
Key characteristics of our unique distribution model include:
| • | Independent entrepreneurs: Our sales representatives are independent contractors building and operating their own businesses. This business-within-a- business approach means that our sales representatives are entrepreneurs who take responsibility for selling products, recruiting sales representatives, setting their own schedules and managing and paying the expenses associated with their sales activities, including office rent and administrative overhead. |
| • | Part-time opportunity: By offering a flexible part-time opportunity, we are able to attract a significant number of recruits who desire to earn supplemental income and generally concentrate on smaller-sized transactions typical of middle income consumers. Virtually all of our sales representatives begin selling our products on a part-time basis, which enables them to hold jobs while exploring an opportunity with us. |
| • | Incentive to build distribution: When a sale is made, the selling representative receives a commission, as does the representative who recruited him or her, which we refer to as override compensation. Override compensation is paid through several levels of the selling representative’s recruitment and supervisory organization. This structure motivates existing sales representatives to grow our sales force by providing them with commission income from the sales completed by their recruits. |
| • | Innovative compensation system: We have developed an innovative system for compensating our independent sales force that is primarily tied to and contingent upon product sales. We advance to our representatives a significant portion of their insurance commissions upon their submission of an insurance application and the first month’s premium payment. In addition to being a source of motivation for our sales force, this upfront payment provides our sales force with immediate cash flow to offset costs associated with originating the business. In addition, monthly production bonuses on term life insurance sales are paid to sales representatives whose downline sales organizations meet certain sales levels. With compensation primarily tied to sales activity, our compensation approach accommodates varying degrees of individual sales representative productivity, which allows us to use a large group of part-time representatives cost effectively and |
| 5 |
Table of Contents
Index to Financial Statements
| gives us a variable cost structure. In addition, we incentivize our RVPs with equity compensation, which aligns their interests with those of our stockholders. |
| • | Large dynamic sales force: The members of our sales force primarily target and serve their friends, family members and personal acquaintances through individually driven networking activities. We believe that this warm markets approach is an effective way to distribute our products because it facilitates face-to-face interaction initiated by a trusted acquaintance of the prospective customer, which is difficult to replicate using other distribution approaches. Due to the large size of our sales force, attrition and our active recruiting of new sales representatives, our sales force is constantly renewing itself by adding new members, which allows us to continue to access an expanding base of our sales representatives’ contacts. By relying on a very large and ever-renewing sales force that has access to and a desire to help friends, family members and personal acquaintances, we are able to reach a wide market without engaging costly media channels. |
| • | Sales force leadership: A sales representative who has built a successful organization can achieve the sales designation of RVP and can earn higher commissions and bonuses. RVPs are independent contractors who open and operate offices for their sales organizations and devote their full attention to their Primerica businesses. RVPs also support and monitor the part-time sales representatives on whose sales they earn override commissions in compliance with applicable regulatory requirements. RVPs’ efforts to expand their businesses are a primary driver of our success. |
| • | Motivational culture: Through sales force recognition events and contests, we seek to create a culture that inspires and rewards our sales representatives for their personal successes. We believe this motivational environment is a major reason that many sales representatives join and achieve success in our business. |
Structure and Scalability of Our Sales Force
Our sales force consists of independent sales representatives. When new sales representatives are recruited by existing sales representatives, they join our sales force with an upline relationship with the sales representative who recruited them and with the recruiting sales representative’s respective upline RVP organization. As new sales representatives are successful in recruiting other sales representatives, they begin to build their own organization of sales representatives who become their downline sales representatives. Sales representatives are encouraged to recruit other sales representatives and build their own downline organizations to earn override commissions on sales made by members of their downline organization. Our sales representatives view building their own downline organizations as building their own business within a business.
While the substantial majority of our sales representatives are part-time, at December 31, 2010 approximately 4,000 served as RVPs who devote their full attention to our organization. RVPs establish and maintain their own offices, which we refer to as field offices, and fund the cost of administrative staff, marketing materials, travel and training and recognition events for the sales representatives in their respective downline organizations. Field offices maintained by RVPs provide a location for conducting recruiting meetings, training events and sales-related meetings, disseminating our Internet-streamed TV programming, conducting compliance functions, and housing field office business records.
Our sales-related expenses are primarily variable costs that fluctuate with product sales volume and consist primarily of sales commissions paid to our sales representatives and, to a lesser extent, both fixed and variable costs associated with our incentive programs, sales management, training, information technology, compliance and administrative activities.
| 6 |
Table of Contents
Index to Financial Statements
With the support of our home office staff, RVPs play a major role in training, motivating and monitoring our sales representatives. Because the primary determinant of a sales representative’s compensation is the size and productivity of his or her downline organization, our distribution model provides financial rewards to our sales representatives who successfully recruit, support and monitor productive sales representatives for our company. We believe that new tools and technology, coupled with our equity incentive award program, further incentivize our sales representatives to become RVPs. The new tools and technology that we have made available to our RVPs enable them to reduce the time spent on administrative responsibilities associated with their sales organization so they can devote more time to the sales and recruiting activities that drive our growth. See “— Sales Force Support and Tools” below.
Both the structure of our sales force and the capacity of our support capabilities provide us with a high degree of scalability as we grow our business. Our support systems and technology are capable of supporting a large sales force and a high volume of transactions. In addition, the sharing of training and oversight activities between us and RVPs allows us to grow without incurring proportionate overhead expenses to accommodate an increase in sales representatives, clients, product sales and transactions.
Recruitment of Sales Representatives
Our ongoing recruitment, training and licensing of new sales representatives are critical for our success. Our sales force is our sole distribution channel. Our recruiting process is designed to recruit new sales representatives and to reach new prospective clients. Recruits often become our clients or provide us with access to their friends, family members and personal acquaintances, which expand our market reach. As a result, we have developed, and continue to seek to improve, a systematic approach to recruiting new sales representatives and training them so they can obtain the requisite licensing to succeed.
Similar to other distribution systems that rely upon part-time sales representatives and typical of the life insurance industry generally, we experience wide disparities in the productivity of individual sales representatives. Many new recruits elect not to obtain the requisite licenses, and many of our licensed sales representatives are only marginally active or are inactive in our business each year. We plan for this disparate level of sales representative productivity and view a continuous recruiting cycle as a key component of our distribution model. Our distribution model is designed to address the varying productivity associated with using part-time sales representatives by paying sales compensation based on sales activity, emphasizing the recruiting of new sales representatives and continuing ongoing initiatives to address barriers to licensing new recruits. Our sales force compensation structure, by providing override commissions to sales representatives on the sales generated by their downline sales organization, aligns our interest in recruiting new representatives with the interests of our sales representatives.
We recruit and offer training to new sales representatives in very large numbers. Many new recruits do not complete the requirements to obtain their individual life insurance licenses mainly due to the time commitment required to obtain licenses and various regulatory hurdles.
| 7 |
Table of Contents
Index to Financial Statements
The table below highlights the number of new recruits, newly insurance-licensed sales representatives, and average number of newly insurance-licensed sales representatives:
| Year ended December 31, | ||||||||||||
| 2010 | 2009 | 2008 | ||||||||||
| Number of new recruits |
231,390 | 221,920 | 235,125 | |||||||||
| Number of newly insurance-licensed sales representatives |
34,488 | 37,629 | 39,383 | |||||||||
| Number of insurance-licensed sales representatives, at period end |
94,850 | 99,785 | 100,651 | |||||||||
| Average number of insurance-licensed sales representatives during period |
96,840 | 100,569 | 99,361 | |||||||||
We define new recruits as individuals who have submitted an application to join our sales force, together with payment of a fee to commence their pre-licensing training. We may not approve certain new recruits to join our sales force, and others elect to withdraw from our sales force prior to becoming active in our business.
On average, it requires approximately three months for our sales representatives to complete the necessary applications and pre-licensing coursework and to pass the applicable state or provincial examinations to obtain a license to sell our term life insurance products. As a result, individuals recruited to join our sales force within a given fiscal period may not become licensed sales representatives until a subsequent fiscal period.
We have launched several recruiting and licensing initiatives that are designed to help us maintain and increase our recruiting and licensing activity and ultimately grow the aggregate size of our licensed sales force, including:
| • | introducing a Fast Start Bonus program that provides new representatives an opportunity to earn compensation quickly; |
| • | providing our sales force with the ability to register new recruits almost instantaneously using their mobile devices, which allows our new recruits to get started in building their businesses immediately; |
| • | developing a wide array of courses, training tools and incentives that assist and encourage new recruits to obtain the requisite licenses; and |
| • | working with industry and trade associations to address unnecessary regulatory barriers to licensing qualified candidates. |
Recruiting sales representatives is undertaken by our existing sales representatives, who identify prospects and share with them the benefits of associating with our organization. Our sales representatives showcase our organization as dynamic and capable of changing lives for the better by demonstrating the success achieved by members of our sales force.
After the initial contact, prospective recruits typically are invited to an “opportunity meeting,” which is conducted by an RVP at a field office. The objective of such meetings is to inform recruits about our mission and their opportunity to join our sales force. At the conclusion of each opportunity meeting, prospective recruits are asked to complete an application and pay a $99 fee to commence their pre-licensing training and licensing examination preparation programs. Many recruits also elect to pay $25 per month for a subscription to Primerica Online, our extensive website for our sales force. Recruits are not obligated to purchase any of our products to become a sales representative, although they often elect to do so.
Recognizing that our successful sales representatives generally are active in our business in the evenings and on the weekends, we have created a Partnership Program for the spouses and significant others of our sales representatives to provide them with meaningful roles in our business. For example, a sales representative’s partner is typically
| 8 |
Table of Contents
Index to Financial Statements
recognized with the sales representative for awards and honors. Moreover, it is common for a partner to serve as an office manager or administrator in a field office, which reduces overhead for that RVP and creates a sense of shared enterprise for the partner.
The requirement that our sales representatives obtain licenses to sell many of our products is a hurdle for our recruits. To minimize this impediment, we provide our new recruits with training opportunities such as test preparation tools and classes to help them become licensed, generally at no additional cost to them, and offer financial incentives and recognition programs to encourage recruits to become licensed and to drive growth of our sales force generally. We also have joined others in the life insurance industry in seeking to address unnecessary regulatory barriers to licensing, including efforts to modify individual state licensing laws and regulations.
Sales Force Motivation, Training and Communication
Motivating and training our sales force are critical activities for our success and that of our sales representatives. We use multiple channels to reach our approximately 95,000 licensed sales representatives to deliver motivational and substantive messages.
Motivation. Through our proven system of sales force recognition events and contests, we provide our sales representatives with incentives to engage in activities that drive our results. Motivation is driven in part by our sales representatives’ belief that they can achieve higher levels of financial success by building their own businesses as Primerica sales representatives. The opportunity to help others address financial challenges is also a significant source of motivation for many of our sales representatives, as well as for our management and employees. Our mission-driven and motivational culture is, we believe, a major reason that many sales representatives join and succeed in our business.
We motivate our sales representatives to succeed in our business by:
| • | compensating our sales representatives to reward product sales by them and their downline organizations; |
| • | helping our sales representatives learn financial fundamentals so they can confidently and effectively assist our clients; |
| • | reducing the administrative burden on our sales force, which allows them to devote more of their time to building a downline organization and selling products; and |
| • | creating a culture in which sales representatives are encouraged to achieve goals through the recognition of their sales and recruiting achievements. |
We seek to motivate our sales representatives not only through compensation, but also by providing recognition for individual efforts and achievements. We do this through incentive trips, monthly promotion incentives and other types of performance recognition. Successful sales representatives, as well as relatively new sales representatives who are beginning to achieve success in our sales organization, are recognized on Primerica Online and in print materials that are distributed to our entire sales force. Additionally, many RVPs host their own recognition events and create incentive programs that they sponsor for the sales representatives in their downline organizations.
To give our sales representatives a sense that they are part of a larger enterprise than their field office, we conduct numerous local, regional and national meetings. These meetings are a vehicle to inform and motivate our sales force. For example, in January 2011 we conducted 12 regional meetings with approximately 3,700 RVPs. We have periodically held a convention for all of our sales representatives, the most recent of which was held in 2007 at the Georgia Dome, attracting approximately 50,000 individuals. Our next convention is scheduled to take place in June 2011, also at the Georgia Dome in Atlanta, Georgia. We believe the fact that so many of our sales representatives elect to attend our meetings at their own expense demonstrates their commitment to our organization.
| 9 |
Table of Contents
Index to Financial Statements
Training. Our sales representatives must hold licenses to sell most of our products. Our in-house insurance licensing center makes available classroom, online and correspondence insurance pre-licensing classes to meet applicable state and provincial licensing requirements and prepare recruits to pass applicable life insurance licensing exams. In 2010, more than 62,600 students in 42 states, Puerto Rico and nine Canadian provinces attended approximately 5,400 classes conducted by over 500 instructors, many of whom are also sales representatives. Approximately 30,400 students in 43 states and the District of Columbia attended online pre-licensing classes in 2010. We also offer correspondence courses in 22 states and the District of Columbia. For those representatives who wish to sell our investment and savings products, we contract with third-party training firms to conduct exam preparation.
Because we believe that helping our new recruits secure requisite licensing is a way for us to grow our business, we continue to develop courses, tools and incentives to help new recruits become licensed sales representatives. Among other tools, we provide to our sales force (generally at no cost to them) an online exam simulator, exam preparation review classes in addition to state or province mandated life insurance pre-licensing classes, and life insurance exam review videos. If new recruits use our online exam simulator and pass our practice exams, we agree to pay for them to take the state exam again if they do not pass the first time. We also developed the Fast Start Scoreboard, an interactive tool on our Primerica Online website that provides new recruits a step-by-step guide to getting started in building their Primerica businesses, including encouragement to use our licensing exam preparation courses and tools.
Other internal training program opportunities include sales, management skills, business ownership, product and compliance training modules and videos designed to equip our sales representatives to succeed in their businesses. Many RVPs conduct sales training in field offices either on nights or weekends to allow sales representatives with weekday jobs or family commitments to attend.
Communication. We communicate with our sales force through multiple communication channels, including those described below:
| • | Primerica Online, our Internet site for sales representatives, is designed to be a support system for our sales representatives. It provides sales representatives with access to their Primerica e-mail, bulletins and alerts, business tracking tools and real-time updates on their pending life applications and new recruits. It contains an extensive library of Primerica-approved presentations, logos, graphics and audio and visual sales tools, all of which can be easily downloaded by our sales representatives. Through Primerica Online, we provide real-time recognition of sales representatives’ successes, and scoreboards for sales force production, contests and trips. Primerica Online also is a gateway to our product providers and product support, a vehicle to monitor production and track sales activity and a comprehensive training tool that helps new recruits become licensed and start building their businesses. Approximately 142,400 of our sales representatives, both licensed and not yet licensed, subscribed to Primerica Online at December 31, 2010. Sales representatives generally pay a $25 monthly fee to subscribe to full-service Primerica Online, which helps cover the cost of maintaining this support system. |
| • | Our in-house TV network is broadcast to our sales force by Internet-streaming video. Our full-service television studio allows us to create original broadcasts and videos professionally and quickly. This video programming offers senior management opportunities for weekly updates to our sales force, as well as a vehicle for training and motivational materials. We broadcast a live weekly program each Monday hosted by our home office management or RVPs that focuses on new developments and provides motivational messages to our sales force, and each Wednesday we broadcast a training oriented program to our sales |
| 10 |
Table of Contents
Index to Financial Statements
| force. We also profile successful sales representatives in our programming, allowing these individuals to share their secrets for succeeding in our business. In 2010, we produced 140 different shows or broadcasts and produced 159 training and motivational videos and audios. |
| • | Our publications department and print facility produce many brochures to motivate and inform our sales force. We make available for sale to our sales force sales pieces, recruiting materials, business cards and stationery. We have a full-service publications department and a printing and distribution facility that provides total communications services from web design and print presentations to graphic design and script writing. RVPs receive a weekly mailing from us that includes materials promoting our current incentives, as well as the latest news about our product offerings. |
| • | Our GoSolo® voice messaging tool and mass texting allow us to widely distribute motivational and informational voice message, broadcasts and text messages to our sales force. GoSolo® is a subscription service provided by a third party to our sales representatives. |
Sales Force Support and Tools
Our information systems and technology are designed to support a sales and distribution model that relies on a large and ever-changing group of predominantly part-time representatives to assist them in building their own businesses. We provide our sales representatives with sales tools that allow both new and experienced sales representatives to offer financial information and products to their clients. Among the most significant of these tools are:
| • | Our Financial Needs Analysis. Our FNA is a proprietary, needs-based analysis tool that is made available to our sales force. The FNA gives our sales representatives the ability to collect and synthesize client financial data and develop a personalized financial needs analysis for the client that is both understandable to the client and integrated with product recommendations that meet the client’s financial needs. The FNA, while not a financial plan, provides our clients with a personalized explanation of how our products and prudent financial practices, such as regular saving and accelerating the repayment of high cost credit card debt, can help them reach their financial goals. When preparing a FNA, our sales representatives collect key financial and personal data from their clients and input it into our FNA software. The resulting financial needs analysis provides clients with a snapshot of their current financial position and identifies their needs in terms of financial protection (our insurance products), savings (our mutual fund, variable and fixed annuity and segregated funds products) and debt management (our loan products). The FNA enables the sales representative to present financial alternatives to the client and is a multi-product sales tool. |
| • | Our Point-of-Sale Application Tool. Our point-of-sale software, TurboApps, is an internally developed system that streamlines the application process for our insurance products. This application populates client information from FNA files to eliminate redundant data collection and provides real-time corrections of incomplete or illegible applications. In addition, the TurboApps application is received by both the home office and the supervising RVP from the sales force electronically, which results in expedited processing of our life insurance product sales. Integrated with our paperless field office management system described below and with our home office systems, our TurboApps tool allows us to realize the efficiencies of straight-through-processing of application data and other information collected on our sales representatives’ mobile devices. In 2010, we added TurboApps functionality that supports our recruiting activity and our U.S. mutual fund product sales. We are currently developing web-based versions of TurboApps to take advantage of the proliferation of portable |
| 11 |
Table of Contents
Index to Financial Statements
| devices and wireless Internet connections, including smartphones, laptop computers and tablets. |
| • | Virtual Base Shop. In an effort to ease the administrative burden on RVPs and simplify sales force operations, we make available to RVPs a secure Intranet-based paperless field office management system as part of the Primerica Online subscription. This virtual office is designed to automate the RVP’s administrative responsibilities and can be accessed by all sales representatives in an RVP’s immediate downline sales organization, which we refer to as his or her base shop. As of December 31, 2010, over 3,600 RVPs had activated a virtual office site. |
| • | Our Morningstar Investment Presentation Tools. We have licensed from Morningstar two web-based sales presentation tools, Portfolio Solutions and Morningstar® Hypothetical IllustratorSM. In addition, we have contracted with Ibbotson Associates Advisors, LLC, a leading asset allocation advisory firm and a subsidiary of Morningstar, to build detailed asset allocation portfolios for eight leading mutual fund firms. These tools allow our sales representatives to illustrate for clients and prospective clients the long-term benefits of proper asset allocation and the resulting wealth creation over specific time horizons. We believe these tools offer our clients and prospective clients the benefit of objective third-party advice from an industry leader and help establish the credibility of our sales representatives and our products. |
| • | Client Account Manager. Together with Morningstar, in October 2010 we deployed Client Account Manager, a client portfolio management tool that assists our sales representatives with monitoring individual client investment accounts. The Client Account Manager provides our sales representatives with additional product sales opportunities for our investment and savings products by providing better access to detailed account information for both active clients’ and legacy accounts (i.e., accounts that our representatives have inherited upon departure of the representative who established the accounts) to better service these customers, which allows our sales representatives to have more client contact, to present additional investment recommendations to clients and to cross-sell additional products. |
In addition to these sales-related tools, we also make available other technology to support our sales force in managing their businesses and in serving our clients, including:
| – | a toll-free sales support call center to address each sales representative’s questions and to assist with paperwork, underwriting and licensing related to our insurance products; |
| – | a tele-underwriting process that allows clients to provide us needed medical information without disclosing it to our sales representatives, who are often friends, family members and personal acquaintances; |
| – | our Primerica Online Internet site that offers our sales force the ability to track the status of pending life insurance applications using the Life Manager feature and track the progress of their new recruits (in terms of training and licensing) using the Recruit Manager feature; and |
| – | 16 other websites to communicate with, inform and assist prospective clients, clients, recruits, sales representatives and employees. |
Performance-Based Compensation Structure
Our sales representatives can earn compensation in multiple ways, including:
| • | sales commissions payable based on their personal sales; |
| • | override commissions payable based on the sales by sales representatives in their downline organizations; |
| 12 |
Table of Contents
Index to Financial Statements
| • | bonuses and other compensation, including share-based compensation, payable to them based on their own sales performance, the aggregate sales performance of their downline organizations and other criteria; and |
| • | participation in our contests and other incentive programs. |
Our compensation system is rooted in our origin as an insurance agency. Commissions to sales representatives with overrides to sales managers and general agents are common in the insurance industry. Over time, modifications have been made to leverage the entrepreneurial spirit of our sales force.
Our compensation system pays a commission to the selling representative who actually sells the product and override commissions to several levels of the selling representative’s upline organization. Commissions are calculated and paid based on the commission rates in effect at the time of the related sale. With respect to term life insurance sales, commissions payable are calculated based on the total first-year premium (excluding policy fee) for all policies and riders. To motivate our sales force and help them offset the costs of their businesses, we compensate them for the sale of our term life insurance products as quickly as possible after the sale. We advance a majority of the insurance commission upon the submission of a completed application and the first month’s premium payment. The advance, if any, may be an amount up to 75% of the first-year annual commission, or generally on nine months of premium. As the client makes his or her premium payments, the commission is earned by the sales representative and the commission advance is recovered. If premium payments are not made by the client and the policy terminates, any outstanding advance commission is charged back to the sales representative. The chargeback would equal that portion of the advance that was made but not earned by the representative because the client did not pay the full premium for the period of time for which the advance was made to the representative (i.e., nine months). Chargebacks, which occur in the normal course of business, may be recovered by reducing any amounts otherwise payable to the representative (such as advances on new sales or earned commissions on other sales).
The remainder of life insurance sales commissions is earned when the first 12 months of premium is received from the client. Sales representatives and their upline organizations are contractually obligated to repay us any commission advances that are ultimately not earned due to the underlying policy lapsing prior to the full commission being earned. Additionally, we hold back a portion of the commissions earned by our sales representatives as a reserve out of which we may cover these chargebacks. The amounts held back are referred to as deferred compensation account commissions (“DCA commissions”). DCA commissions are available to reduce debts owed by sales representatives. DCA commissions also provide an upline sales representative with a cushion against the chargeback obligations of their downline sales representatives. DCA commissions, unless applied to agent debt, are ultimately released to the sales representatives. Generally, commissions are not paid after the first year with respect to a policy. One of our riders provides for coverage increases each year. For such riders, commissions in the second year and thereafter are only paid with respect to the premium increase related to the increased coverage. Additionally, renewal commissions are paid on some older in-force policies. At the end of the policy duration compensation is paid on conversions.
We also pay compensation to our sales force for the sale of mutual funds, annuities, loans, long-term care insurance, prepaid legal protection and our Primerica DebtWatchers™ products, and for the referral of customers seeking auto and home insurance. For mutual funds and most annuity products, commissions are paid both on the sale and on the total of the assets under management and are calculated based on the dealer re-allowance and trail compensation actually paid to us. Loan commissions are payable for the sourcing of closed loans and are calculated based on a fixed percentage of the loan amount. Long-term care insurance commissions are calculated based on the amount of premium received. Prepaid legal
| 13 |
Table of Contents
Index to Financial Statements
protection program commissions and Primerica DebtWatchers™ commissions are payable in fixed amounts on the sale of the respective product. For auto and homeowner’s insurance products, referral fees are paid for referrals that result in completed applications.
In addition to commissions paid on personal sales, we pay override commissions to several levels of the selling representative’s sales and supervisory organization. This structure motivates our sales representatives to grow their downline sales organization and as a result, drive product sales. To encourage our most successful RVPs to build large downline sales organizations that generate strong sales volumes, we have established the Primerica Ownership Program to provide certain qualifying RVPs a contractual right to sell their business to another RVP or transfer it to a qualifying family member.
Bonuses and, from time to time, other incentive compensation are payable for sales of certain products. As of December 31, 2010, bonuses were payable to the selling representative or to selected override levels, or both, for achieving specified production levels for the sale of term life insurance, investment and savings products, and prepaid legal protection and for auto and home insurance referrals. In August 2010, we announced a bonus program that provides new representatives an opportunity to quickly receive rewards for successful performance. The Fast Start Bonus was designed to incentivize our newest representatives to observe sales of life insurance products by licensed sales representatives, sell our other distributed products that do not require the sales representative to hold a license, obtain their life insurance licenses and recruit new sales representatives. Upon achieving certain goals and building their team, new representatives can qualify for a Fast Start Bonus by completing successful field training observations and product sales milestones, while the upline RVP can earn a bonus for each representative in his or her downline organization that earns the Fast Start Bonus. The Fast Start Bonus program replaces a previous program under which new representatives could not earn incentive bonus compensation in their early months with the company.
In addition to these methods of compensation, we use quarterly equity award compensation programs under which RVPs can earn shares of common stock. Effective deployment of these programs allows us to align the interests of our sales force with those of our stockholders.
Sales Force Licensing
The states, provinces and territories in which our sales representatives operate generally require our sales representatives to obtain and maintain licenses to sell our insurance, securities and mortgage loan products. Our sales representatives may also be required to maintain licenses to sell certain of our other financial products.
To sell insurance products, our sales representatives must be licensed by their resident state, province or territory and by any other state, province or territory in which they do business and in most states our sales representatives must be designated by our applicable insurance subsidiary.
To sell securities products, our U.S. sales representatives must be registered with the Financial Industry Regulatory Authority (“FINRA”) and licensed as both Series 6 and Series 63 registered sales representatives of our broker-dealer subsidiary and by each state in which they sell securities products. To sell variable annuity products, our sales representatives must have these licenses and FINRA registrations and be appointed by the annuity underwriter in the states in which they market annuity products.
Our Canadian sales representatives selling mutual fund products are required to be licensed by the securities commissions in the provinces and territories in which they sell mutual fund products. Our Canadian sales representatives who are licensed to sell our insurance products do not need any further licensing to sell our segregated funds products in Canada.
Due to the enactment and implementation by the states of the Federal Secure and Fair Enforcement for Mortgage Licensing Act of 2008 (the “SAFE Act”), to offer mortgage loan products, our sales representatives must be individually licensed as mortgage loan
| 14 |
Table of Contents
Index to Financial Statements
originators (and in some states as both mortgage brokers and mortgage loan originators) by the states in which they do business.
In Canada, our sales representatives do not sell loan products due to licensing restrictions, but they are compensated for referring clients to the lender without having to be licensed as a mortgage broker.
Our sales representatives must pass applicable examinations to be licensed to sell our insurance, securities and loan products. We provide our sales representatives access to in-person and online life insurance licensing exam preparation classes and other support to assist them in obtaining necessary life insurance licensing. See “— Sales Force Motivation, Training and Communication” above. To encourage new recruits to obtain their life insurance licenses, we either pay directly or reimburse the respective sales representative for certain licensing-related fees and expenses, if the sales representative passes the applicable exam and obtains the applicable life insurance license.
Supervision and Compliance
To ensure compliance with various federal, state, provincial and territorial legal requirements, we and our RVPs share responsibility for maintaining an overall compliance program that involves compliance training, and supporting and monitoring the activities of our sales representatives. Our Office of the General Counsel and our Field Supervision Department work with RVPs to develop appropriate compliance procedures and systems.
RVPs generally must obtain a principal license (FINRA Series 26 in the United States and Branch Manager license in Canada), as a result of which they have supervisory responsibility over the activities of their downline sales organizations. Additional supervision is provided by approximately 490 Offices of Supervisory Jurisdiction (“OSJs”), which are run by select RVPs who receive additional compensation for assuming additional responsibility for supervision and compliance monitoring across all product lines. OSJs are required to periodically inspect our field offices and report any compliance issues they observe to us.
All of our sales representatives are required to participate in our annual compliance meeting, a program administered by our senior management and our legal and compliance staff at which we provide a compliance training overview across all product lines and require the completion of compliance checklists by each of our licensed sales representatives for each product he or she offers. Additionally, our sales representatives receive periodic compliance newsletters regarding new compliance developments and issues of special significance. Furthermore, the OSJs are required to complete an annual training seminar that focuses on securities compliance and field supervision.
Our Compliance Department regularly runs surveillance reports designed to monitor the activity of our sales force. These surveillance reports are reviewed by our surveillance administrators. If we detect any unusual or suspicious activity, our Compliance Department commences an appropriate investigation and, when appropriate, refers such activity to our legal department for disciplinary action. Our Field Supervision Department has a team of Primerica employees who regularly assist the OSJs and communicate compliance requirements to them to ensure that they properly discharge their supervisory responsibilities. These Primerica employees also periodically inspect the OSJ offices.
Our Field Audit Department regularly conducts audits of all sales representative offices, including scheduled and no-notice audits. In 2010, we performed approximately 4,800 audits in the United States and Canada. Our policy is to conduct approximately 50% of the field office audits on a no-notice basis. The auditors review all regulatory-required records that are not maintained at our home office. All compliance deficiencies noted by the auditor must be corrected, and we carefully monitor all corrective action. Field offices that fail the audit are subject to a follow-up audit in 150 days. Continued audit deficiencies are addressed through a progressive disciplinary
| 15 |
Table of Contents
Index to Financial Statements
structure that includes fines, reprimands, probations and terminations.
The Office of the General Counsel has responsibility for the legal affairs of the company, along with compliance, government relations and corporate governance. This office is also responsible for investigating and making recommendations about disciplinary actions against sales representatives, if appropriate.
Our Products
Our products are tailored to appeal to middle income consumers. We believe our face-to-face home delivery of products and financial needs analysis add sufficient value to the client to allow us to compete on the basis of product value and service in addition to price. Reflecting our philosophy of helping middle income clients with their financial product needs and to ensure compatibility with our distribution model, our products generally incorporate the following criteria:
| • | Consistent with Good Individual Finance Principles: Products must be consistent with good personal finance principles for middle income consumers, such as reducing debt, minimizing expenses and encouraging long-term savings. |
| • | Complementary: Products are designed to complement, not to compete with or cannibalize, each other. For example, term life insurance does not compete with mutual funds because term life has no cash value or investment element. |
| • | Ongoing Needs Based: Products must meet the ongoing financial needs of many middle income consumers so that the likelihood of a potential sale is high in most homes. |
| • | Distributable: Products must be appropriate for distribution by our sales force, which requires that the application and approval process must be simple to explain and understand, and the likelihood of approval must be sufficiently high to justify the investment of time by our sales representatives. |
| 16 |
Table of Contents
Index to Financial Statements
We organize and manage our business through three operating segments: Term Life Insurance, Investment and Savings Products and Corporate and Other Distributed Products. See “Management’s Discussion and Analysis of Financial Condition and Results of Operations — Results of Operations” and Note 3 to our consolidated and combined financial statements included elsewhere in this report for certain financial information regarding our operating segments and the geographic areas in which we operate.
| Operating Business Segment |
Principal Products |
Principal Sources of Products | ||
| Term Life Insurance | Term Life Insurance | Primerica Life (U.S. (except New York), the District of Columbia and territories) (1) NBLIC (New York) (1) Primerica Life Canada (Canada) (1) | ||
| Investment and Savings Products |
Mutual Funds | American Funds (U.S.) Franklin Templeton (U.S.) Invesco (U.S.) Legg Mason Global Asset Management (U.S.) Pioneer Investments (U.S.) AGF Funds (Canada) Concert™ Funds (a family of Primerica-branded “funds of funds” composed of AGF Funds) (Canada) | ||
| Variable Annuities | First MetLife Investors Insurance Company (U.S.) MetLife Investors USA Insurance Company (U.S.) | |||
| Fixed Annuities | First MetLife Investors Insurance Company (U.S.) MetLife Investors USA Insurance Company (U.S.) | |||
| Segregated Funds | Primerica Life Canada (Canada) (1) | |||
| Corporate and Other Distributed Products |
Mortgage Loans — Debt Consolidation or Refinance, Purchase Money (U.S. only) | Citicorp Trust Bank, fsb (U.S.) (2) AGF Trust Company (Canada) | ||
| Unsecured Loans (3) | Citibank, N.A. (U.S., except California) (2) Citicorp Trust Bank, fsb (California) (2) | |||
| Primerica DebtWatchers™ | Equifax Consumer Services LLC, a wholly owned subsidiary of Equifax Inc. (U.S. and Canada) | |||
| Long-Term Care Insurance | Genworth Life Insurance Company and its affiliates (U.S.) | |||
| Prepaid Legal Services | Prepaid Legal Services, Inc. (U.S. and Canada) | |||
| Mail-Order Student Life | NBLIC (U.S., except Alaska, Hawaii, Montana, Washington and the District of Columbia) (1) | |||
| Short-Term Disability Benefit Insurance | NBLIC (New York and New Jersey) (1) | |||
| Auto and Homeowners’ Insurance | Various insurance companies, as offered through Answer Financial, Inc. (an independent agent for various third-party property and casualty insurance companies) (U.S.) | |||
| (1) | Indicates subsidiaries of Primerica. |
| (2) | Indicates affiliate of Citi (excluding Primerica and its subsidiaries). |
| (3) | The unsecured loan program in the United States terminated on December 31, 2010. |
| 17 |
Table of Contents
Index to Financial Statements
Term Life Insurance Products
Through our three life insurance company subsidiaries — Primerica Life, NBLIC and Primerica Life Canada — we offer term life insurance to clients in the United States, Puerto Rico, Guam and Canada. In 2009, the latest period for which data is available, we were the largest provider of individual term life insurance in the United States based on the amount of in-force premiums collected, according to LIMRA.
We believe that term life insurance is a better alternative for middle income clients than cash value life insurance. Term life insurance provides a guaranteed death benefit if the insured dies during the fixed coverage period of the policy in return for the periodic payment of premiums. Term insurance products, which are sometimes referred to as pure protection products, have no savings or investment features, but provide payment of a specified amount upon the death of the insured individual, thereby providing financial protection for his or her named beneficiaries. By buying term life insurance rather than cash value life insurance, a policyholder initially pays a lower premium and, as a result, may have funds available to invest for retirement and other needs. We also believe that a person’s need for life insurance is inversely proportional to that person’s need for retirement savings, a concept we refer to as the theory of decreasing responsibility. Young adults with children, new mortgages and other obligations need to buy higher amounts of insurance to protect their family from the loss of future income resulting from the death of a primary bread winner. With its lower initial premium, term life insurance lets young families buy more coverage for their premium dollar when their needs are greatest and still have the ability to have funds for their retirement and educational savings needs.
Our term life insurance products are designed to be easily understood by, and meet the needs of, our middle income clients. Clients purchasing our term life insurance products, whose average age was 38 in 2010, generally seek stable, longer-term income protection products for themselves and their families. In response to this demand, we offer term life insurance products, with level premium coverage periods that range from ten to 35 year policies. Policies with 20-year terms or more accounted for approximately 83% of the face amount of policies we issued in 2010. Death benefits are payable upon the death of the insured while the policy is in force. Policies remain in force until the expiration of the coverage period or until the policyholder ceases to make premium payments and terminates the policy. Our currently issued policies expire when the primary insured reaches age 95 (80 for NBLIC clients in New York). Premiums are guaranteed not to rise above a certain amount each year during the life of the policy. The initial guarantee period for policies issued in the United States equals the initial term period, up to a maximum of 20 years. After 20 years, we have the right to raise the premium, subject to limits provided for in the applicable policy. In Canada, the amount of the premium is guaranteed for the entire term of the policy.
Our term life insurance policies may be customized through the addition of riders to provide coverage for specific protection needs, such as mortgage and college expense protection. These additional riders are available individually for both the primary insured and a spouse. We offer an increasing benefit rider that allows for a 5% or 10% annual increase in coverage (subject to a maximum lifetime increase of $500,000) without new underwriting. All children under the age of 25 in a family may be insured under one rider for one premium. Providing insurance for an entire family under one policy results in only one policy fee, premium banding for the total coverage on the primary insured and spouse, and reduced administrative expenses. The term premium banding refers to levels of death benefits payable on a term life insurance policy at which the cost to the insured of each $1,000 of death benefits payable decreases. Our premium bands are currently $150,000, $250,000 and $500,000. The death benefits attributable to an insured individual and his or her insured spouse are combined for purposes of determining which premium band will be used to calculate individual premiums. Therefore, the couple together may be charged
| 18 |
Table of Contents
Index to Financial Statements
premiums that are less per person per $1,000 of death benefits payable than they would otherwise be charged as individuals. The average face amount of our in-force policies issued in 2010 was approximately $267,000.
The following table sets forth selected financial information regarding our term life insurance products:
| Year ended December 31, | ||||||||||||
| 2010 | 2009 | 2008 | ||||||||||
| Life insurance issued: |
||||||||||||
| Number of policies issued |
223,514 | 233,837 | 241,173 | |||||||||
| Face amount issued (In millions) |
$ | 74,401 | $ | 80,497 | $ | 87,279 | ||||||
| December 31, | ||||||||||||
| 2010 | 2009 | 2008 | ||||||||||
| Life insurance in force: |
||||||||||||
| Number of policies in force |
2,311,030 | 2,332,273 | 2,363,792 | |||||||||
| Face amount in force (In millions) |
$ | 656,791 | $ | 650,195 | $ | 633,467 | ||||||
Pricing and Underwriting. We believe that effective pricing and underwriting are significant drivers of the profitability of our life insurance business, and we have established our pricing assumptions to be consistent with our underwriting practices. We set pricing assumptions for expected claims, lapses, investment returns and expenses based on our own relevant experience and other factors. These other factors include:
| • | expected changes from relevant experience due to changes in circumstances, such as (i) revised underwriting procedures affecting future mortality and reinsurance rates, (ii) new product features, and (iii) revised administrative programs affecting sales levels, expenses, and client continuation or termination of policies; and |
| • | observed trends in experience that we expect to continue, such as general mortality improvement in the general population and better or worse policy persistency (the period over which a policy remains in force) due to changing economic conditions. |
Our strategy is to price our insurance products competitively for our target risk categories. Our insurance products are based on unisex rates, which we believe complements our one policy per family philosophy.
Under our current underwriting guidelines, we individually assess each insurable adult applicant and place such applicant into one of four risk classifications, based on current health, medical history and other factors. Each of these four classifications (preferred plus, preferred, non-tobacco and tobacco) has specific health criteria. We may decline an
applicant’s request for coverage if his or her health or activities create unacceptable risks for us. All underwriting decisions are made by our underwriting professionals.
Because many policies are sold to friends, family members and personal acquaintances of our sales representatives, we do not have our sales representatives collect sensitive and personal medical information from an applicant. Our sales representatives ask applicants a series of yes or no questions regarding the applicant’s medical history. If we believe that follow up regarding an applicant’s medical history is warranted, then a third-party provider using its trained personnel contacts the applicant by telephone to obtain a detailed medical history. The report resulting from the tele-underwriting process is electronically transmitted to us and is evaluated in our underwriting process. During the underwriting process, we may consider information about the applicant from third-party sources such as the Medical Information Bureau, motor vehicle bureaus and physician statements as well as from personal financial documents, such as tax returns and personal financial statements.
To accommodate the significant volume of insurance applications that we process, we and our sales force use technology to make our operations more efficient. In 2010, our sales representatives submitted approximately 56% of their life insurance applications to us in electronic form using TurboApps. The TurboApps system ensures that the application is submitted error-free, collects the applicant’s electronic signatures and populates the RVP’s sales log. Paper applications we receive are scanned and transmitted to a third-party data
| 19 |
Table of Contents
Index to Financial Statements
entry company. Our proprietary review and screening system automatically either confirms that an application meets regulatory and other requirements, or alerts our application processing staff to any deficiencies with the application. If any deficiencies are noted, then our application processing staff telephones the sales representative to obtain the necessary information. Once an application is complete, the pertinent application data is uploaded to our life insurance administrative systems, which manage the underwriting process by electronically analyzing data and recommending underwriting decisions and communicating with the sales representative and third-party providers.
Claims Management. Our insurance subsidiaries processed an average of more than $2.6 million in life benefit claims each day in 2010 on policies underwritten by us and sold by our sales representatives. These claims fall into three categories: death; waiver of premium (applicable to disabled policyholders who purchased a rider pursuant to which Primerica agrees to waive remaining life insurance premiums during a qualifying disability); or terminal illness. The claim may be reported by our sales representative, a beneficiary or, in the case of terminal illness, the policyholder. Following are the benefits paid by us for each category of claim:
| Year ended December 31, | ||||||||||||
| 2010 | 2009 | 2008 | ||||||||||
| (In thousands) | ||||||||||||
| Death |
$ | 939,107 | $ | 942,622 | $ | 913,651 | ||||||
| Waiver of premium |
24,136 | 21,395 | 18,547 | |||||||||
| Terminal illness (1) |
9,354 | 9,295 | 7,326 | |||||||||
| (1) | We consider claims paid for terminal illness to be loans made to the beneficiary that are repaid to us upon death of the beneficiary from the death benefit. |
In the United States, after coverage has been in force for two years, we may not contest the policy for misrepresentations in the application or the suicide of the insured. In Canada, we have a similar two-year contestability period, but we are permitted to contest insurance fraud at any time. As a matter of policy, we do not contest any coverage issued by us to replace the face amount of another insurance company’s individual coverage to the extent the replaced coverage would not be contestable by the replaced company. We believe this approach helps our sales representatives sell replacement policies, as it reassures clients that claims made under their replacement policies are not more likely to be contested as to the face amount replaced. Through our claims administration system, we record, process and pay the appropriate benefit with respect to any reported claim. Our claims system is used by our home office investigators to order medical and investigative reports from third-party providers, calculate amounts due to the beneficiary (including interest) and report payments to the appropriate reinsurance companies.
Financial Strength Ratings. Ratings with respect to financial strength are an important factor in establishing our competitive position and maintaining public confidence in us and our ability to market our products. Ratings organizations review the financial performance and condition of most insurers and provide opinions regarding financial strength, operating performance and ability to meet obligations to policyholders. Primerica Life, NBLIC and Primerica Life Canada, have been assigned a financial strength rating of A+ (superior; second highest of 16 ratings) by A.M. Best Co. (“A.M. Best”) with a negative outlook. Primerica Life currently has an insurer financial strength
rating of AA- (very strong; fourth highest of 22 ratings) from Standard & Poor’s with a stable outlook. Primerica Life Canada and NBLIC are not rated by Standard & Poor’s. No assurance is given that we will maintain our current ratings. Ratings for insurance companies are not designed for investors and do not constitute recommendations to buy, sell or hold any security.
Reinsurance. We use reinsurance primarily to reduce the volatility risk with respect to mortality. For business written prior to 1991, we have various coinsurance agreements in place. Since 1994, we have reinsured death benefits in the United States on a yearly renewable term (“YRT”) basis. As of December 31, 2010, we
automatically reinsure 90% of all U.S.
| 20 |
Table of Contents
Index to Financial Statements
insurance policies that we underwrite with respect to the first $4 million per life of coverage, excluding coverage under certain riders. For all risks in excess of $4 million per life of coverage, we reinsure on a case-by-case, or facultative, basis. With respect to our Canadian insurance policies, we reinsure face amounts above $500,000 per life on an excess yearly renewable term basis and for all risk in excess of $2 million per life, we reinsure on a case-by-case, or facultative, basis. We also reinsure substandard cases on a facultative basis to capitalize on the extensive experience some of our reinsurers have with substandard cases. A substandard case has a level of risk that is acceptable to us but at higher premium rates than a standard case because of the health, habits or occupation of the applicant.
Both we and the reinsurer are entitled to discontinue the reinsurance agreement as to future policies by giving 90 days’ advance notice to the other. However, each reinsurer’s ability to terminate coverage for existing policies is limited to circumstances such as a material breach of contract or nonpayment of premiums by us. Generally, we have the option of recapturing some or all of the YRT reinsurance in the event that we increase our retention limits or the percentage of risk that we retain. The premiums payable to each reinsurer are based on rates shown in the agreements that are expected to continue indefinitely. Each reinsurer has the right to increase rates with certain restrictions. If a reinsurer increases rates, we have the right to immediately recapture the business. Either party may offset any balance due from the other party. For additional information, see Notes 1, 2 and 6 to our consolidated and combined financial statements.
Investment and Savings Products
We believe that middle income families have significant unmet retirement and education-related savings needs. Using our FNA tool, we help our clients understand their current financial situation and how they can use time-tested financial principles, such as prioritizing personal savings, compounding, thinking long-term and diversification, to reach their retirement and other savings goals. While we seek to meet individual needs, most of our clients fall into one of several distinct segments of the savings and retirement spectrum that we serve: clients who are actively saving, clients who are nearing retirement and clients who are retired. Our investment and savings products comprise basic saving and investment vehicles that seek to meet the needs of clients in each of these three segments.
Through PFS; PFS Investments, our U.S. licensed broker-dealer subsidiary; Primerica Life Canada; PFSL Investments Canada Ltd., our Canadian licensed dealer; and our licensed sales representatives, we distribute and sell to our clients mutual funds, variable and fixed annuities and segregated funds. As of December 31, 2010, approximately 22,500 of our sales representatives were licensed to distribute mutual funds in the United States and Canada. As of December 31, 2010, approximately 12,900 of our sales representatives were licensed and appointed to distribute variable and fixed annuities in the United States and approximately 8,800 of our sales representatives were licensed to sell segregated funds in Canada. In the United States, we distribute mutual fund products of several third-party mutual fund companies and variable and fixed annuity products of MetLife and its affiliates. In July 2010, we began selling fixed annuity products offered by MetLife through PFS, our licensed insurance agency. In Canada, we offer our own Primerica-branded mutual funds, as well as mutual funds of other companies, and offer our Primerica-branded segregated fund products, which are underwritten by Primerica Life Canada.
Mutual Funds. In the United States, our licensed sales representatives primarily distribute mutual funds from five select asset management firms: American Funds, Franklin Templeton, Invesco, Legg Mason and Pioneer.
All of these firms have diversified product offerings, including domestic and international stock, bond and money market funds. Each firm has individual funds with long track records, some more than 30 years with good relative performance, and each firm continually evaluates its fund offerings and adds new funds
| 21 |
Table of Contents
Index to Financial Statements
on a regular basis. Additionally, this group of funds has products in diversified asset classes and varied investment styles, and many of the managers of these funds have trading operations on multiple continents. We believe this group of select asset management firms provides funds that generally meet the investment needs of our clients. During 2010, three of these fund families (Legg Mason, Invesco and American Funds) accounted for in the aggregate approximately 84% of our mutual fund sales in the United States. Legg Mason and Invesco each have large wholesaling teams that support our sales force in distributing their mutual fund products. We have selling agreements with each of these fund companies, as well as with approximately 40 other companies. Our selling agreements with Legg Mason, Invesco and American Funds all have indefinite terms and provide for termination at will. Each of these agreements authorizes us to receive purchase orders for shares of mutual funds or similar investments underwritten by the fund company and to sell and distribute the shares on behalf of the fund company. All purchase orders are subject to acceptance or rejection by the relevant fund company in its sole discretion. Purchase orders received by the fund company from us are accepted only at the then-applicable public offering price for the shares ordered (the net asset value of the shares plus an applicable sales charge). For sales of shares that we initiate, we are paid commissions based upon the dollar amount of the sales and earn marketing and distribution fees, or 12b-1 fees, on mutual fund products sold based on asset values in our client accounts. Pursuant to agreements with Legg Mason, Invesco, and other fund companies, we also receive, as consideration for our retail distribution channel and mutual fund sales infrastructure, a mutual fund support fee based on one or more of the following: a percentage of fund sales, a percentage of the value of our clients’ assets in the funds, or an agreed upon fixed amount.
In Canada, our sales representatives offer Primerica-branded Concert™ Series funds, which accounted for 55% of our Canadian mutual fund product sales in 2010. Our Concert™ Series of funds are six different asset allocation funds with varying investment objectives ranging from fixed income to aggressive growth. Each Concert™ Series fund is a fund of funds that allocates fund assets among equity and income mutual funds of AGF Funds, a major asset management firm in Canada. The asset allocation within each Concert™ Series fund is determined on a contract basis by Legg Mason. The principal non-proprietary funds that we offer our clients in Canada are funds of AGF Funds, Mackenzie and Invesco Trimark. Sales of these non-proprietary funds accounted for 36% of mutual fund product sales in Canada in 2010. Like our U.S. fund family select list, the asset management partners we have selected in Canada have a diversified offering of stock, bond and money market funds, including domestic and international funds with a variety of investment styles.
A key part of our investment philosophy for our clients is the long-term benefits of dollar cost averaging through systematic investing. To accomplish this, we assist our clients by facilitating monthly investment into their investment account by bank draft against their checking accounts. Qualified retirement plans accounted for 57% and 71% of the client account assets for which we served as nominee in the United States and Canada, respectively, as of December 31, 2010. Our high concentration of retirement plan accounts and our systematic savings philosophy are beneficial to us as these accounts tend to have lower redemption rates than the industry and, therefore, generate more recurring asset-based revenues.
Variable Annuities. Our licensed sales representatives in the United States also distribute variable annuities underwritten and provided by two MetLife insurance companies. Variable annuities are insurance products that enable our clients to invest in accounts with attributes similar to mutual funds, but also have benefits not found in mutual funds, including death benefits that protect beneficiaries from market losses due to a market downturn and income benefits that guarantee future income payments for the life of the policyholder(s). MetLife bears the insurance risk on the variable annuities that we distribute. MetLife, with our
| 22 |
Table of Contents
Index to Financial Statements
assistance, has developed a series of private label annuity products specifically designed to meet the needs of our clients.
In connection with MetLife’s acquisition of The Travelers Life and Annuity Company, we entered into a selling agreement pursuant to which MetLife, as the successor to The Travelers Life and Annuity Company, has the right to supply us certain annuity and other insurance products during a ten-year term ending June 30, 2015. Based on a letter of intent dated October 29, 2010, which contemplates an amendment to the selling agreement, MetLife has the right to be the exclusive provider of the variable annuity products that we distribute in the United States and Puerto Rico until June 30, 2013. From July 1, 2013 through June 30, 2015, the agreement provides MetLife with the non-exclusive right to supply us certain variable annuity products that we offer in the United States and Puerto Rico. As a non-exclusive provider of our variable annuity products during the last two years of this agreement, MetLife is entitled to have the same access to our sales force as we provide any other supplier of a comparable annuity product. If, prior to July 1, 2012, we expand our product offerings to include new (i) private label variable life insurance or variable annuity products or (ii) life insurance or annuity products to be sold on an exclusive basis (other than the types of life insurance and annuity products that we distributed on July 1, 2005), MetLife has the right to make a proposal to supply us with these new products. While we have discretion to determine the criteria for selecting the provider(s) of these new products, if MetLife proposes to provide us with these new products, we have agreed to select MetLife as our provider of these products if MetLife’s proposal, taken as a whole, compares as well as the most favorable proposal we receive from other potential providers of these products.
Segregated Funds. In Canada, we offer segregated fund products, which are branded as our Common Sense FundsTM, that have some of the characteristics of our variable annuity products distributed in the United States. Our Common Sense FundsTM are underwritten by Primerica Life Canada and offer our clients the ability to participate in a diversified managed investment program that can be opened for as little as C$25. The investment objective of segregated funds is long-term capital appreciation combined with some guarantee of principal. Unlike mutual funds, our segregated fund product guarantees clients at least 75% of their net contributions (net of withdrawals) at the earlier of the date of their death or at the segregated fund’s maturity date, which is selected by the client. The portfolio consists of both equities and bonds with the equity component consisting of a pool of large cap Canadian equities and the bond component consisting of Canadian federal government zero coupon treasuries. The portion of the segregated fund portfolio allocated to zero coupon treasuries are held in sufficient quantity to satisfy the guaranties payable at the maturity date of the segregated fund. As a result, our potential exposure to market risk is very low as it comes from the guarantees payable upon the death of the client prior to the maturity date. With the guarantee level at 75% and in light of the time until the scheduled maturity of our segregated funds contracts, we currently do not need to allocate any corporate capital as reserves for segregated fund contract benefits.
Many of our Canadian clients invest in segregated funds through a registered retirement savings plan (“RRSP”), which is similar to an IRA in the United States in that contributions are made to the RRSP on a pre-tax basis and income is earned on a tax-deferred basis. Our Common Sense Funds™ are managed by AGF Funds, one of Canada’s leading investment management firms, and a leading provider of our mutual fund products.
Fixed Annuities. In an effort to expand the product offerings for our Investment and Savings Products segment, in July 2010 we began offering four fixed annuities underwritten by MetLife. Two of the products, a flexible premium deferred annuity and a fixed premium deferred annuity, are designed for long-term retirement savings and pay a guaranteed fixed interest rate for a specified period of time. We also began offering a single premium immediate annuity that, in return for a single premium payment, offers the owner a
| 23 |
Table of Contents
Index to Financial Statements
variety of income payment options over a guaranteed period of time and may include the owner(s) lifetime. Finally, we are offering a longevity income guarantee annuity that guarantees a fixed amount of monthly income that starts in the future and lasts as long as the owner(s) live(s). We believe these fixed annuity products give our representatives more ways to assist our clients with their retirement planning needs.
Managed Accounts. In 2011, PFS Investments intends to become a registered investment advisor in the United States and introduce a managed account program. Initially the offering is expected to consist of a mutual fund advisory program with a $25,000 minimum initial investment. Subsequent managed account offerings are also being contemplated. We anticipate contracting with an independent investment advisor that will assist in the design and administration of the program including the investment of client assets on a discretionary basis into one or more asset allocation portfolios. In contrast to our existing mutual fund and annuity business, in an advisory fee program, clients do not pay an upfront commission. Rather, they pay an annual fee based on the value of the assets in their account. Sales representatives that qualify to offer this program will receive a portion of the annual fee as compensation for as long as we retain the account.
Revenue and Sales Force Compensation.
In the United States, we earn revenue from our investment and savings products business in three ways: commissions earned on the sale of such products; fees earned based upon client asset values; and account-based revenue. On the sale of mutual funds and annuities, we earn a dealer reallowance or commission on the dollar amount of new purchases as well as trail commissions on the assets held in our clients’ accounts. On mutual fund and annuity sales, we pay our sales representatives a percentage of the dealer reallowance and trail commissions we receive. We also receive marketing and support fees from most of our fund providers. These payments are typically a percentage of sales or a percentage of the total clients’ asset values, or a combination of both.
With respect to several of the fund companies offered in the United States, we receive custodial fees for services performed as a non-bank custodian for certain of our clients’ retirement plan accounts, and earn revenue for performing account-based recordkeeping services. We also receive fees for the financing of advance commissions paid to our sales representatives for the sale of certain Legg Mason funds. The total amount of these account-based fees fluctuates with the number of such accounts. Consequently, the closing of accounts can adversely impact our revenues. From time to time, the fund companies with whom we deal request that accounts with small balances be closed.
We perform recordkeeping services on behalf of several of our select U.S. fund companies. We receive compensation on a per account basis for these services. To assist us in performing these recordkeeping services, we have engaged third parties, including a Citi affiliate, to perform certain back-office transfer agent functions and a portion of the client and agent telephone servicing. We also maintain an operations and phone service center at our Duluth, Georgia offices to support our recordkeeping platform.
In Canada, we earn revenue from the sales of our investment and savings products in two ways: commissions on mutual fund sales and fees paid based upon clients’ asset values (mutual fund trail commissions, and asset management fees from segregated funds and Concert™ Series funds). On the sale of mutual funds, we earn a dealer reallowance or commission as well as trail commissions on the assets held in our clients’ accounts. We pay a percentage of the dealer reallowance and trail commissions we receive with respect to mutual fund sales as compensation to our Canadian sales representatives. On the sale of segregated funds, we earn a fee based on the total asset value of these assets. For segregated funds, we pay as compensation to our sales representatives a sales commission on segregated fund sales and a fee paid quarterly based on clients’ asset values.
PFS Investments is a broker-dealer registered with FINRA and is subject to regulation by the
| 24 |
Table of Contents
Index to Financial Statements
SEC, FINRA and with respect to 529 plans only, the Municipal Securities Rulemaking Board (the “MSRB”), as well as by state securities agencies. PFS Investments operates as an introducing broker-dealer. As such, it performs the suitability review of investment recommendations in accordance with FINRA requirements, but it does not hold client accounts. PFSL Investments Canada is a mutual fund dealer registered with the Mutual Fund Dealers Association of Canada (the “MFDA”), the national self-regulatory organization for the distribution side for the Canadian mutual fund industry, and is also registered with provincial securities commissions throughout Canada. As a registered mutual fund dealer, it performs the suitability review of mutual fund investment recommendations, but like our U.S. broker-dealer, it does not hold client accounts. Our U.S. and Canadian broker-dealers do not hold any client funds; rather, client funds are held by the mutual fund in which such client funds are invested or by MetLife in the case of variable annuities sold in the United States. As noted above, our Canadian segregated fund product is an insurance contract underwritten by Primerica Life Canada. While the assets and corresponding liability (reserves) are recognized on our balance sheet, the assets are held in trust for the benefit of the segregated fund contract owners.
Other Distributed Products
We also offer debt consolidation/refinance and purchase money mortgage loans, a Primerica DebtWatchers™ product that allows clients to create a plan for paying off debt, long-term care insurance, prepaid legal services and auto/home insurance. While many of these products are Primerica-branded, all of them are underwritten or otherwise provided by a third party. We also offer mail-order student life and short-term disability benefit insurance, which we underwrite through our New York insurance subsidiary, NBLIC.
Loan Products. Managing debt continues to be a major challenge for our middle income clients and prospects. The decline in home values and the tightening of the credit markets generally have exacerbated the problem. We help our clients manage their debt through the use of a debt consolidation loan, which provides them with the means to consolidate and accelerate the repayment of existing debt. We also offer a purchase money product through Citicorp Trust Bank, fsb (“CTB”), a subsidiary of Citi. Our loan product sales process is designed to be straightforward, low pressure and educational.
Primerica Mortgages is a loan broker, not a lender, and our loan products are currently provided in the United States by CTB. All underwriting, processing of loan applications and credit decisions are made by CTB. As a loan broker in the United States, we receive a brokerage commission based on a fixed percentage of the closed loan amount.
Historically, we have offered fixed rate, fixed term and fully amortizing loans appropriate for a middle income client and have sold loan products exclusively for lenders that are affiliates of Citi, except in Puerto Rico where we previously sold loan products of a third-party lender, and in Canada, where we now refer loans through a third party lender, AGF Trust Company. In March 2010, Primerica Mortgages entered into a loan brokerage agreement with CTB and CitiMortgage, Inc. (“CMI”) that provided for Primerica Mortgages to offer conforming fixed rate, fixed term, fully amortizing refinancing loans of CTB. As a conforming loan product saleable to government sponsored entities such as Fannie Mae and Freddie Mac, the loan product has stricter underwriting criteria than the mortgage products we had sold previously and provides Primerica Mortgages and our sales force with reduced compensation for the origination of mortgage loan products in the United States. In November 2010, the March 2010 agreement was amended to add Citibank, N.A. as a party and to provide CTB or CMI with the right to transition all of the processing, underwriting and funding of loans to its affiliate, Citibank, N.A. The Agreement provides that CTB, CMI and Citibank, N.A. will be the exclusive providers of our mortgage loan products in the United States through March 2012, at which time either we or the lenders may terminate the Agreement.
| 25 |
Table of Contents
Index to Financial Statements
In Canada, we offer a debt consolidation loan product through a third party lender, AGF Trust Company, and assist clients with developing debt reduction/elimination strategies. Due to regulatory requirements, our sales representatives in Canada only refer clients to the lender and are not involved in the loan application and closing process.
Primerica DebtWatchers™. In 2009, we began offering our Primerica DebtWatchers™ product in the United States and a very similar product in three provinces in Canada. Primerica DebtWatchers™ allows clients to create a simple- to-understand plan for paying off their debt and provides clients with periodic updates of their credit score and other personal credit information. Currently, our sales representatives do not need an individual license to sell this product. Primerica DebtWatchers™ is co-branded with and supported by Equifax Consumer Services LLC, a subsidiary of Equifax Inc., one of the three major credit reporting services in the United States.
Other Products. We also offer our U.S. clients Primerica-branded long-term care insurance, underwritten and provided by Genworth Life Insurance Company and its affiliates, and we offer our U.S. and Canadian clients a Primerica-branded prepaid legal services program on a subscription basis that is underwritten and provided by Prepaid Legal Services, Inc. and itsaffiliate. The prepaid legal services program offers a network of attorneys in each state or province to assist subscribers with legal matters such as drafting wills, living wills and powers of attorney, trial defense and motor vehicle-related matters. We receive a commission based on our sales of these policies and contracts.
Through an arrangement with Answer Financial, Inc. (“Answer Financial”), an independent insurance agency, our sales representatives in the United States may refer clients to Answer Financial to receive multiple, competitive, auto and homeowners’ insurance quotes. Answer Financial’s comparative quote process allows clients to easily identify the underwriter (e.g., Chubb, Hartford, Progressive, SAFECO and Travelers) that is most competitively priced for their type of risk. Commissions that we receive under this program, which is called Primerica Secure, are based on policy sales and premiums. Sales representatives receive a flat referral fee payment for each completed auto and homeowners’ insurance application.
Details on our sales or referrals of long-term care insurance, pre-paid legal services and auto and home insurance products follow:
| Year ended December 31, | ||||||||||||
| 2010 | 2009 | 2008 | ||||||||||
| (In thousands) | ||||||||||||
| Long-term care insurance revenues |
$ | 2,966 | $ | 2,847 | $ | 3,694 | ||||||
| Pre-paid legal services revenues |
9,622 | 9,414 | 9,662 | |||||||||
| Auto and homeowners’ insurance revenues |
4,979 | 3,936 | 3,030 | |||||||||
NBLIC sells mail-order student life insurance and short-term disability benefit insurance, which is a state-mandated policy for certain employees in the states of New York and New Jersey. These products, which are not distributed by our sales force, generated the following revenues:
| Year ended December 31, | ||||||||||||
| 2010 | 2009 | 2008 | ||||||||||
| (In thousands) | ||||||||||||
| Student life insurance revenues |
$ | 23,771 | $ | 24,226 | $ | 24,608 | ||||||
| Short-term disability benefit insurance revenues |
38,997 | 39,093 | 38,772 | |||||||||
Regulation
Our operations are subject to extensive laws and governmental regulations, including administrative determinations, court decisions and similar constraints. The purpose of the laws and regulations affecting our operations is primarily to protect our clients and not our stockholders. Many of the laws and regulations to which we are subject are regularly re-examined, and existing or future laws and regulations may become more restrictive or otherwise adversely affect our operations.
Our U.S. insurance businesses are principally regulated by the insurance departments of the states in which they are domiciled and in which
| 26 |
Table of Contents
Index to Financial Statements
they sell insurance policies. Our Canadian insurance business is principally regulated by both provincial and federal insurance regulatory authorities. Our insurance products and our businesses also are affected by U.S. federal, state and local tax laws and Canadian federal and provincial tax laws.
Insurance products that constitute securities, such as variable annuities, also are subject to U.S. federal and state securities laws and regulations. The SEC, FINRA and state securities authorities are the principal securities regulators for these products.
Our securities operations are subject to U.S. federal and state and Canadian federal and provincial securities and related laws. The SEC, state securities authorities, FINRA and similar Canadian federal and provincial authorities are the principal regulators of these operations.
Insurance and securities regulatory authorities (including state law enforcement agencies and attorneys general or their non-U.S. equivalents) from time to time make inquiries regarding compliance by us and our subsidiaries with insurance, securities and other laws and regulations regarding the conduct of our insurance and securities businesses. We cooperate with such inquiries and take corrective action when warranted.
Our loan business is subject to U.S. federal and state laws and regulations, including federal and state mortgage banking and brokering laws and regulations in many jurisdictions.
Regulation of Insurance Products
Our U.S. insurance subsidiaries are licensed to transact business in all states and jurisdictions in which they conduct insurance business. Specifically, Primerica Life, a Massachusetts insurance company, is licensed to transact business in the United States (except New York), the District of Columbia, Puerto Rico, Guam, the U.S. Virgin Islands and the Commonwealth of the Northern Mariana Islands, and NBLIC, a New York insurance company, is licensed to transact business in all 50 states, the District of Columbia and the U.S. Virgin Islands. Primerica Life is not licensed to
transact business in New York, where we transact business through NBLIC. U.S. state insurance laws regulate all aspects of our U.S. insurance business. Such regulation is vested in state agencies having broad administrative and in some instances discretionary power dealing with many aspects of our business, which may include, among other things, premium rates and increases thereto, reserve requirements, marketing practices, advertising, privacy, policy forms, reinsurance reserve requirements, acquisitions, mergers, and capital adequacy, and is concerned primarily with the protection of policyholders and other consumers rather than stockholders. At any given time, a number of financial or market conduct examinations of our subsidiaries may be ongoing. From time to time, regulators raise issues during examinations or audits of our subsidiaries that could, if determined adversely, have a material impact on us.
Our Canadian insurance subsidiary, Primerica Life Canada, is federally incorporated and provincially licensed and transacts business in all Canadian provinces and territories. Provincial and federal insurance laws regulate all aspects of our Canadian insurance business. Our Canadian insurance subsidiary is regulated federally by the Office of the Superintendent of Financial Institutions Canada (“OSFI”), and provincially by the Superintendents of Insurance for each province and territory. OSFI regulates insurers’ corporate governance, financial and prudential oversight, and regulatory compliance, while provincial and territorial regulators oversee insurers’ market conduct practices and related compliance.
Most U.S. states and Canadian provinces and territories, as well as the Canadian federal government, have laws and regulations governing the financial condition of insurers, including standards of solvency, types and concentration of investments, establishment and maintenance of reserves, reinsurance and requirements of capital adequacy, and the business conduct of insurers, including sales and marketing practices, claim procedures and practices, and policy form content. In addition, U.S. state insurance law and Canadian provincial insurance law usually require licensing of insurers and their agents.
| 27 |
Table of Contents
Index to Financial Statements
In Canada, OSFI conducts periodic detailed examinations of insurers’ business and financial practices, including the control environment, internal and external auditing and minimum capital adequacy, surpluses and related testing, legislative compliance and appointed actuary requirements, and insurers’ regulatory compliance, including anti-money laundering practices, outsourcing, related-party transactions, privacy and corporate governance. Provincial regulators also conduct periodic market conduct examinations of insurers doing business in their jurisdiction.
Our U.S. insurance subsidiaries are required to file detailed annual reports with the United States supervisory agencies in each of the jurisdictions in which they do business, and their business and accounts are subject to examination by such agencies at any time. These examinations generally are conducted under National Association of Insurance Commissioners (“NAIC”) guidelines. Under the
rules of these jurisdictions, insurance companies are examined periodically (generally every three to five years) by one or more of the supervisory agencies on behalf of the states in which they do business. Over the past decade, no such insurance department examinations have produced any significant adverse findings regarding any of our insurance subsidiaries.
Specific examples of the types of insurance laws and regulations applicable to us or our U.S. or Canadian insurance subsidiaries are described below.
Insurance Holding Company Regulation; Limitations on Dividends. Many states, including the states in which our insurance subsidiaries are domiciled, have enacted legislation or adopted regulations regarding insurance holding company systems. These laws require registration of and periodic reporting by insurance companies domiciled within the jurisdiction which control or are controlled by other corporations or persons so as to constitute an insurance holding company system. These laws also affect the acquisition of control of insurance companies as well as transactions between insurance companies and companies controlling them.
We are a holding company, and we have no significant operations. Our primary asset is the capital stock of our subsidiaries and our primary liability is the Citi note. The states in which our U.S. insurance subsidiaries are domiciled impose certain restrictions on our insurance subsidiaries’ ability to pay dividends to us. In Canada, dividends can be paid subject to the paying insurance company’s continuing compliance with regulatory requirements and upon notice to OSFI.
The three insurance subsidiaries that are entitled to pay dividends to us are Primerica Life, NBLIC and Primerica Life Canada. The following table sets forth the statutory value of cash and securities dividends paid or payable by our insurance subsidiaries for Primerica Life, NBLIC and Primerica Life Canada:
| Cash and Securities Dividends
Paid or Payable by Our Insurance Subsidiaries |
||||||||||||
| Year Ended December 31, | ||||||||||||
| 2010 | 2009 | 2008 | ||||||||||
| (In thousands) | ||||||||||||
| Primerica Life |
$ | 1,447,759 | $ | 149,000 | (1) | $ | 353,000 | |||||
| NBLIC |
296,839 | — | 8,000 | |||||||||
| Primerica Life Canada |
566,754 | — | — | |||||||||
| (1) | Dividend declared by Primerica Life in 2009 and paid in 2010. |
All dividends paid were deemed ordinary unless otherwise noted. During the year ended
December 31, 2010, Primerica Life paid dividends of $1.45 billion to Citi, all of which were deemed extraordinary. During the year ended December 31, 2010, NBLIC paid dividends of $296.8 million to Primerica Life, all of which were deemed extraordinary.
For Primerica Life, the statutory dividend capacity is based on the greater of (1) 10% of the previous year-end statutory surplus or (2) the previous year’s statutory net gain from operations (not including pro rata distributions of any class of the insurer’s own securities). Dividends that, together with the amount of other distributions or dividends made within the
| 28 |
Table of Contents
Index to Financial Statements
preceding 12 months, exceed this statutory limitation are referred to as extraordinary dividends. Extraordinary dividends require advance notice to the Massachusetts Division of Insurance (“MDOI”), Primerica Life’s primary state insurance regulator, and are subject to potential disapproval. For dividends exceeding these thresholds, Primerica Life must provide notice to the MDOI and receive responses indicating that the MDOI did not object to the payment of those dividends.
For NBLIC, the statutory dividend capacity is based on the lesser of (1) 10% of the previous year-end statutory earned surplus or (2) the previous year’s statutory net gain from operations, not including realized capital gains. Dividends that, together with the amount of other distributions or dividends in any calendar year, exceed this statutory limitation are considered to be extraordinary dividends. Extraordinary dividends require advance notice to the New York State Insurance Department (“NYSID”), NBLIC’s primary state insurance regulator, and are subject to potential disapproval. For dividends exceeding these thresholds, NBLIC must provide notice to the NYSID and receive responses indicating that the NYSID did not object to the payment of those dividends.
In Canada, dividends can be paid subject to the paying insurance company continuing to meet the regulatory requirements for capital adequacy and liquidity and upon 15 days’ minimum notice to OSFI.
As a holding company with no significant business operations of our own, we depend on dividends or other distributions from our insurance and other subsidiaries as the principal source of cash to meet our obligations, including the payment of interest on, and repayment of, principal of any debt obligations.
Market Conduct Regulation. The laws and regulations governing our U.S. and Canadian insurance businesses include numerous provisions governing the marketplace activities of insurers, including policy filings, payment of insurance commissions, disclosures, advertising, product replacement, sales and underwriting practices and complaints and claims handling. The state insurance regulatory authorities in the United States and the federal and provincial regulators in Canada generally enforce these provisions through periodic market conduct examinations.
Filing of Financial Statements. State insurance laws and regulations require our U.S. insurance subsidiaries to file with state insurance departments publicly-available quarterly and annual financial statements, prepared in accordance with statutory guidelines that generally follow NAIC uniform standards. Canadian insurance laws and regulations require our Canadian insurance subsidiary to prepare financial statements in accordance with Canadian GAAP. Our Canadian insurance subsidiary files quarterly and annual financial statements with OSFI in compliance with legal and regulatory requirements.
Change of Control. The laws and regulations of the jurisdictions in which our U.S. insurance subsidiaries are domiciled require approval of the insurance commissioner prior to acquiring control of the insurer. In considering an application to acquire control of an insurer, the insurance commissioner generally will consider such factors as experience, competence, the financial strength of the applicant, the integrity of the applicant’s board of directors and executive officers, the acquirer’s plans for the management and operation of the insurer, and any anti-competitive results that may arise from the acquisition. The states in which our insurance subsidiaries are domiciled have enacted laws which require regulatory approval for the acquisition of control of insurance companies. Under these laws, there exists a presumption of control when an acquiring party acquires 10% or more of the voting securities of an insurance company or of a company which itself controls an insurance company. Therefore, any person acquiring 10% or more of our common stock would need the prior approval of the state insurance regulators of these states, or a determination from such regulators that control has not been acquired.
In addition, Canadian federal insurance law requires approval of the Minister of Finance prior to any change of control of an insurer, whether direct or indirect, or to acquire,
| 29 |
Table of Contents
Index to Financial Statements
directly or through any controlled entity or entities, a significant interest (i.e., more than 10%) of any class of its shares. In considering an application for a change of control of an insurer, OSFI will consider the financial resources of the applicant, the soundness of the business plan presented by the applicant, and the business record, experience, character and integrity of the applicant, as well as whether the persons who will operate the insurer after the change of control are suitably competent and experienced in the operation of a financial institution and whether the change of control is in the best interests of the policyholders and the Canadian financial system.
These U.S. and Canadian laws regarding change of control may discourage potential acquisition proposals and may delay, deter or prevent a change of control involving us, including through transactions, and in particular unsolicited transactions, that some or all of our stockholders might consider to be desirable.
Policy and Contract Reserve Sufficiency Analysis. Under the laws and regulations of their jurisdictions of domicile, our U.S. insurance subsidiaries are required to conduct annual analyses of the sufficiency of their life insurance statutory reserves. In addition, other U.S. jurisdictions in which these subsidiaries are licensed may have certain reserve requirements that differ from those of their domiciliary jurisdictions. In each case, a qualified actuary must submit an opinion that states that the aggregate statutory reserves, when considered in light of the assets held with respect to such reserves, make good and sufficient provision for the associated contractual obligations and related expenses of the insurer. If such an opinion cannot be provided, the affected insurer must set up additional reserves by moving funds from surplus. Our U.S. insurance subsidiaries most recently submitted these opinions without qualification as of December 31, 2010 to applicable insurance regulatory authorities.
Our Canadian insurance subsidiary also is required to conduct regular analyses of the sufficiency of its life insurance statutory reserves. Life insurance reserving and reporting requirements are completed by our Canadian insurance subsidiary’s appointed actuary. Materials provided by the appointed actuary are filed with OSFI as part of our annual filing and are subject to OSFI’s review. Based upon this review, OSFI may institute remedial action against our Canadian insurance subsidiary as OSFI deems necessary. Our Canadian insurance subsidiary has not been subject to any such remediation or enforcement by OSFI.
Surplus and Capital Requirements. U.S. insurance regulators have the discretionary authority, in connection with the ongoing licensing of our U.S. insurance subsidiaries, to limit or prohibit the ability of an insurer to issue new policies if, in the regulators’ judgment, the insurer is not maintaining a minimum amount of surplus or is in hazardous financial condition. Insurance regulators may also limit the ability of an insurer to issue new life insurance policies and annuity contracts above an amount based upon the face amount and premiums of policies of a similar type issued in the prior year. We do not believe that the current or anticipated levels of statutory surplus of our U.S. insurance subsidiaries present a material risk that any such regulator would limit the amount of new policies that our U.S. insurance subsidiaries may issue.
In Canada, OSFI has authority to request an insurer to enter into a prudential agreement implementing measures to maintain or improve the insurer’s safety and soundness. OSFI also may issue orders to an insurer directing it to refrain from unsafe or unsound practices or to take action to remedy financial concerns. OSFI has neither requested that our Canadian insurance subsidiary enter into any prudential agreement nor has OSFI issued any order against our Canadian insurance subsidiary.
Risk-Based Capital and Minimum Capital Requirements. The NAIC has established Risk-Based Capital (“RBC”) standards for U.S. life insurance companies, as well as a model act to be applied at the state level. The model act provides that life insurance companies must submit an annual RBC report to state regulators reporting their RBC based upon four categories of risk: asset risk, insurance risk,
| 30 |
Table of Contents
Index to Financial Statements
interest rate risk and business risk. For each category, the capital requirement is determined by applying factors to various asset, premium and reserve items, with the factor being higher for those items with greater underlying risk and lower for less risky items. The formula is intended to be used by insurance regulators as an early warning tool to identify possible weakly capitalized companies for purposes of initiating further regulatory action. If an insurer’s RBC falls below specified levels, the insurer would be subject to different degrees of regulatory action depending upon the level. These actions range from requiring the insurer to propose actions to correct the capital deficiency to placing the insurer under regulatory control.
In Canada, an insurer’s minimum capital requirement is overseen by OSFI and determined as the sum of the capital requirements for five categories of risk: asset default risk, mortality/morbidity/lapse risks, changes in interest rate environment risk, segregated funds risk and foreign exchange risk.
As of December 31, 2010, Primerica Life and NBLIC had combined statutory capital, and Primerica Life Canada had statutory capital, in excess of the applicable thresholds.
NAIC Pronouncements and Reviews. Although we and our insurance subsidiaries are subject to state insurance regulation, in many instances the state regulations emanate from NAIC model statutes and pronouncements. Certain changes to NAIC model statutes and pronouncements, particularly as they affect accounting issues, may take effect automatically in the various states without affirmative action by the states. Although with respect to some financial regulations and guidelines, states sometimes defer to the interpretation of the insurance department of the state of domicile, neither the action of the domiciliary state nor the action of the NAIC is binding on a non-domiciliary state. Accordingly, a state could choose to follow a different interpretation. Also, regulatory actions with prospective impact can potentially have a significant impact on currently sold products. In addition, accounting and actuarial groups within the NAIC have studied whether to change the accounting standards that relate to certain reinsurance credits, and if changes were made, whether they should be applied retrospectively, prospectively only, or in a phased-in manner. A requirement to reduce the reserve credits on ceded business, if applied retroactively, would have a negative impact on our statutory capital. The NAIC is also currently working on reforming state regulation in various areas, including comprehensive reforms relating to insurance reserves.
The NAIC also has established guidelines to assess the financial strength of insurance companies for U.S. state regulatory purposes. The NAIC conducts annual reviews of the financial data of insurance companies primarily through the application of 12 financial ratios prepared on a statutory basis. The annual statements are submitted to state insurance departments to assist them in monitoring insurance companies in their state.
Statutory Accounting Principles. Statutory accounting principles (“SAP”) is a basis of accounting developed by U.S. insurance regulators to monitor and regulate the solvency of insurance companies. In developing SAP, insurance regulators were primarily concerned with evaluating an insurer’s ability to pay all its current and future obligations to policyholders. As a result, statutory accounting focuses on conservatively valuing the assets and liabilities of insurers, generally in accordance with standards specified by the insurer’s domiciliary jurisdiction. Uniform statutory accounting practices are established by the NAIC and generally adopted by regulators in the various U.S. jurisdictions. These accounting principles and related regulations determine, among other things, the amounts our insurance subsidiaries may pay to us as dividends and differ somewhat from GAAP, which are designed to measure a business on a going-concern basis. GAAP gives consideration to matching of revenue and expenses and, as a result, certain expenses are capitalized when incurred and then amortized over the life of the associated policies. The valuation of assets and liabilities under GAAP is based in part upon best estimate assumptions made by the insurer. Stockholders’ equity represents both amounts
| 31 |
Table of Contents
Index to Financial Statements
currently available and amounts expected to emerge over the life of the business. As a result, the values for assets, liabilities and equity reflected in financial statements prepared in accordance with GAAP may be different from those reflected in financial statements prepared under SAP. We cannot predict whether or when regulatory actions may be taken that could adversely affect our company or the operations of our insurance subsidiaries. Interpretations of regulations by regulators may change and statutes, regulations and interpretations may be applied with retroactive effect, particularly in areas such as accounting or reserve requirements. Canadian law requires the use of Canadian GAAP in the preparation of the financial statements of our Canadian insurance subsidiary.
State Insurance Guaranty Funds Laws. Under most state insurance guaranty fund laws, insurance companies doing business therein can be assessed up to prescribed limits for policyholder losses incurred by insolvent companies. Although we cannot predict with certainty the amount of any future assessments, most insurance guaranty fund laws currently provide that an assessment may be excused or deferred if it would threaten an insurer’s own financial strength. In addition, assessments may be partially offset by credits against future state premium taxes. Our insurance subsidiaries were assessed immaterial amounts in each of 2010, 2009 and 2008.
Additional Oversight in Canada. The Financial Consumer Agency of Canada (“FCAC”) is a Canadian federal regulatory body. It is responsible for ensuring that federally regulated financial institutions, which include Primerica Life Canada, comply with federal consumer protection laws and regulations, voluntary codes of conduct and their own public commitments. The Financial Transactions and Reports Analysis Centre of Canada (“FINTRAC”) is Canada’s financial intelligence unit. Its mandate includes ensuring that entities subject to the Proceeds of Crime (Money Laundering) and Terrorist Financing Act, which includes Primerica Life Canada, comply with reporting, recordkeeping and other obligations under that act. Our Canadian insurance subsidiary is also subject to privacy laws under the jurisdiction of federal and provincial privacy commissioners, anti-money laundering laws enforced by the FINTRAC and OSFI, and the consumer complaints provisions of federal insurance laws under the mandate of the FCAC, which requires insurers to belong to a complaints ombud-service and file a copy of their complaints handling policy with the FCAC.
In connection with the Offering and the Transactions, we entered into an undertaking agreement with OSFI pursuant to which we are subject to ongoing obligations to provide OSFI with certain information. In particular, we agreed to provide OSFI with advance notice, if practicable, of (i) future debt issuances by us that are in an amount greater than 20% of our market capitalization (other than refinancing the $300.0 million Citi note), (ii) any final decision by our board of directors that could result in a material shift of our primary focus on regulated financial services and (iii) any change in ownership made by a beneficial owner of more than 5% of our common stock in the event that our senior management becomes aware of that fact. We are also required to provide OSFI with copies of our Securities and Exchange Commission (“SEC”) filings, material press releases and access to our senior officers and auditors to discuss any prudential concerns OSFI may have concerning Primerica Life Canada. The following items are exempt from the advance notice commitment: (a) matters subject to confidentiality and disclosure restrictions imposed by governmental authorities and (b) matters that management, acting in good faith, deems would have an adverse effect on us. The term of the undertaking agreement is two years, subject to an obligation of OSFI and us to negotiate in good faith sixty days prior to expiration either a renewal or a decision not to renew based on the financial condition of Primerica Life Canada at the time of such negotiation.
The Minister of Finance (Canada) under the Insurance Companies Act (Canada) approved our indirect acquisition of Primerica Life Canada. The Minister expects that a person controlling a federal insurance company will provide ongoing financial, managerial or
| 32 |
Table of Contents
Index to Financial Statements
operational support to its subsidiary should such support prove necessary. The Minister has required us to sign a support principle letter which provides, without limiting the scope of the support principle letter, that this ongoing support may take the form of additional capital, the provision of managerial expertise or the provision of support in such areas as risk management, internal control systems and training. The provision of the support principle letter is intended to ensure that the person controlling the federal insurance company is aware of the importance and relevance of the support principle in the consideration of the application. However, the letter does not create a legal obligation on our part to provide the support.
In addition to federal and provincial oversight, our Canadian insurance subsidiary is also subject to the guidelines set out by the Canadian Life and Health Insurance Association (“CLHIA”). CLHIA is an industry association that works closely with federal and provincial regulators to establish market conduct guidelines and sound business and financial practices addressing matters such as sales representative suitability and screening, insurance illustrations and partially guaranteed savings products.
Our Canadian insurance subsidiaries are currently in compliance with these laws, regulations and guidelines.
Regulation of Investment and
Savings Products
Certain of our U.S. subsidiaries, including PFS Investments and Primerica Shareholder Services, Inc. (“PSS”), are subject to extensive securities regulation in the United States. As a matter of public policy, regulatory bodies in the United States are charged with safeguarding the securities and other financial markets and with protecting investors participating in those markets.
PFS Investments is registered as a broker-dealer in all 50 states and with the SEC, and is a member of FINRA. PFS Investments is also approved as a non-bank custodian under Internal Revenue Service (“IRS”) regulations and, in that capacity, may act as a custodian and/or trustee for certain retirement accounts. Our sales representatives who sell securities products through PFS Investments (including, in certain jurisdictions, variable annuities) are required to be registered representatives of PFS Investments. All aspects of PFS Investments’ business are regulated, including sales methods and charges, trade practices, the use and safeguarding of customer securities, capital structure, recordkeeping, conduct and supervision of its employees.
The SEC rules and regulations that currently apply to PFS Investments and our registered representatives generally require that we make suitable investment recommendations to our customers and disclose conflicts of interest that might affect the recommendations or advice we provide. The Dodd-Frank Wall Street Reform and Consumer Protection Act of 2010 (the “Dodd-Frank Act”) gave the SEC the power to impose on broker-dealers a heightened standard of conduct (fiduciary duty) that is currently applicable only to investment advisers. As required by the Dodd-Frank Act, the SEC staff recently submitted a report to Congress in which it recommended that the SEC adopt a uniform fiduciary standard of conduct. The timing of any future rulemaking is unclear. Additionally, the DOL has proposed a rule more broadly defining “fiduciary” under Internal Revenue Code Section 4975. See “Risk Factors — Risks Related to Our Investments and Savings Products Business — If heightened standards of conduct or more stringent licensing requirements, such as those recently proposed by the SEC and the DOL, are imposed on us or our sales representatives or selling compensation is reduced as a result of new legislation or regulations, it could have a material adverse effect on our business, financial condition and results of operations.”
PSS is registered with the SEC as a transfer agent and, accordingly, is subject to SEC rules and examinations.
PFSL Investments Canada, our Canadian dealer subsidiary, is registered as a mutual fund dealer in all Canadian provinces and territories and is regulated by the MFDA, as well as all provincial and territorial securities commissions. PFSL
| 33 |
Table of Contents
Index to Financial Statements
Investments Canada sales representatives are required to be registered in the provinces or territories in which they do business and are also subject to regulation by the MFDA. These regulators have broad administrative powers, including the power to limit or restrict the conduct of our business and impose censures or fines for failure to comply with the law or regulations.
Under a new securities rule, PFSL Investments Canada is required to register as an Investment Fund Manager. The registration documents have been filed with the provincial securities commissions, and we expect those filings to be reviewed by them in due course.
Regulation of Loan Products
In the United States, state mortgage banking and brokering laws and unsecured lending laws regulate many aspects of our loan product distribution business. In the United States and Puerto Rico, Primerica Mortgages is regulated by state banking commissioners and other equivalent regulators. Our loan product distribution business must comply with the laws, rules and regulations, as well as judicial and administrative decisions, in all of the jurisdictions in which we are licensed to offer mortgage and unsecured loans, as well as an extensive body of federal laws and regulations. These state and federal laws and regulations address the type of loan products that can be offered to consumers through predatory lending and high cost loan laws and the type of licenses that must be obtained by individuals and entities seeking to solicit loan applications from consumers. As a mortgage broker licensee, Primerica Mortgages is subject to periodic examinations by regulators.
Due to the enactment and implementation by the states of the SAFE Act, to offer mortgage loan products, our sales representatives must be individually licensed as mortgage loan originators (and in some states as both mortgage brokers and mortgage loan originators) by the states in which they do business. Prior to enactment of the SAFE Act, our sales representatives were not required to be individually licensed or registered to sell mortgage loan products in a majority of states. The SAFE Act requirements have materially reduced the size of our loan sales force. This reduction has resulted in a significant decline in the scale of our loan product distribution business. See “Risk Factors — Risks Related to Our Loan Business — New licensing requirements will continue to significantly reduce the size of our loan sales force.”
In addition, our loan product distribution business is subject to various other federal laws, including the Truth In Lending Act and its implementing regulation, Regulation Z, the Equal Credit Opportunity Act and its implementing regulation, Regulation B, the Fair Housing Act and the Home Ownership Equity Protection Act. We are also subject to the Real Estate Settlement Procedures Act (“RESPA”) and its implementing regulation, Regulation X, which requires timely disclosures related to the nature and costs of real estate settlement amounts and limits those costs and compensation to amounts reasonably related to the services performed. We are also subject to the Dodd-Frank Act and any regulations that will be issued to implement such Act.
In Canada, our loan activities are more limited and our sales representatives only provide mortgage loan referrals to AGF Trust Company. Our sales representatives are not required to obtain mortgage loan licensure from any regulatory entity to make these referrals.
Other Laws and Regulations
USA Patriot Act and Similar Regulations.
The USA Patriot Act of 2001 contains anti-money laundering and financial transparency laws and mandates the implementation of various regulations applicable to broker-dealers and other financial services companies, including insurance companies. The Patriot Act seeks to promote cooperation among financial institutions, regulators and law enforcement entities in identifying parties that may be involved in terrorism or money laundering. The Canadian federal laws include anti-money laundering provisions similar to the Patriot Act, including provisions regarding suspicious transaction reporting, identification of clients and anti-money laundering procedures and controls.
| 34 |
Table of Contents
Index to Financial Statements
Privacy of Consumer Information. U.S. federal and state laws and regulations require financial institutions, including insurance companies, to protect the security and confidentiality of consumer financial information and to notify consumers about their policies and practices relating to their collection and disclosure of consumer information and their policies relating to protecting the security and confidentiality of that information. Similarly, federal and state laws and regulations also govern the disclosure and security of consumer health information. In particular, regulations promulgated by the U.S. Department of Health and Human Services regulate the disclosure and use of protected health information by health insurers and others (including life insurers), the physical and procedural safeguards employed to protect the security of that information and the electronic transmission of such information. Congress and state legislatures are expected to consider additional legislation relating to privacy and other aspects of consumer information.
Canadian federal and provincial privacy laws require that Canadian financial institutions, including insurance companies and broker-dealers, take necessary measures to protect consumer information and maintain adequate controls for the collection, use, disclosure and destruction of personal information.
Certain Regulation Related to Our Affiliation with Citi. We are regulated by the Board of Governors of the Federal Reserve System (the “FRB”) under the Bank Holding Company Act of 1956 (the “BHC Act”). We will remain subject to this regulatory regime until Citi is no longer deemed to control us for bank regulatory purposes, which may not occur until Citi has significantly reduced its ownership interest in us. The ownership level at which the FRB would consider us no longer controlled by Citi will depend on the circumstances at the time, such as the extent of our relationship with Citi and could be less than 5%. For so long as we are subject to the BHC Act, we are subject to examination by various banking regulators. As a result, the FRB has broad enforcement authority over us, including the power to prohibit us from conducting any activity that, in the FRB’s opinion, is unauthorized or constitutes an unsafe or unsound practice in conducting our business. The FRB may also impose substantial fines and other penalties for violations of applicable banking laws, regulations and orders.
Competition
We operate in a highly competitive environment with respect to the sale of financial products. Because our product offerings include several different financial products, we compete directly with a variety of financial institutions, such as insurance companies, insurance brokers, banks, finance companies, credit unions, loan brokers, broker-dealers, mutual fund companies and other national and international financial products and services companies, depending on the type of product we are offering. We compete directly with these entities for the sale of products to clients and, to a lesser extent, for retaining our more productive sales representatives.
Competitors with respect to our term life insurance products consist both of stock and mutual insurance companies, as well as other financial intermediaries, such as AIG, Allstate, Ameriprise, Genworth Financial, MetLife, Protective, Prudential, State Farm and USAA. Competitive factors affecting the sale of life insurance products include the level of premium rates, benefit features, risk selection practices, compensation of sales representatives and financial strength ratings from ratings agencies such as A.M. Best.
In offering our securities products, our sales representatives compete for clients with a range of other advisors, broker-dealers and direct channels, including wirehouses, regional broker-dealers, independent broker-dealers, insurers, banks, asset managers, registered investment advisors, mutual fund companies and other direct distributors, such as Edward Jones, Raymond James and Waddell & Reed. The mutual funds that we offer face competition from other mutual fund families and alternative investment products, such as exchange traded funds. Our annuity products compete with products from numerous other companies, such as Hartford, Lincoln National
| 35 |
Table of Contents
Index to Financial Statements
and Nationwide. Competitive factors affecting the sale of annuity products include price, product features, investment performance, commission structure, perceived financial strength, claims-paying ratings, service and distribution capabilities.
Competitors with respect to our loan products consist of a variety of financial institutions such as banks, savings and loan associations, credit unions and other lenders, including certain Internet-based lenders.
Information Technology
We have built a sophisticated information technology platform that is designed to support our clients, operations and sales force. Located at our main campus in Duluth, Georgia, our data center houses an enterprise-class IBM mainframe that serves as the repository for all client and sales force data and as a database server for our distributed environment. Our IT infrastructure supports 43 core business applications. Our business applications, many of which are proprietary, are supported by application developers and data center staff at our main campus. Our information security team provides services that include project consulting, threat management, application and infrastructure assessments, secure configuration management and information security administration. This infrastructure also supports a combination of local and remote recovery solutions for business resumption in the event of a disaster.
Employees
As of December 31, 2010, we had 1,794 regular employees in the United States and 207 regular employees in Canada. In addition, as of December 31, 2010, we had 437 on-call employees in the United States and 72 on-call employees in Canada who provide certain training services on an as-needed hourly basis. None of our employees is a member of any labor union and we have never experienced any business interruption as a result of any labor disputes.
| ITEM 1A. | RISK FACTORS. |
Risks Related to Our Distribution Structure
Our failure to continue to attract new recruits, retain sales representatives or maintain the licensing of our sales representatives would materially adversely affect our business.
New sales representatives provide us with access to new referrals, enable us to increase sales, expand our client base and provide the next generation of successful sales representatives. As is typical with insurance and distribution businesses, we experience a high rate of turnover among our part-time sales representatives, which requires us to attract, retain and motivate a large number of sales representatives. Recruiting is performed by our current sales representatives, and the effectiveness of our recruiting is generally dependent upon our reputation as a provider of a rewarding and potentially lucrative income opportunity, as well as the general competitive and economic environment. The motivation of recruits to complete their training and licensing requirements and to commit to selling our products is largely dependent upon the effectiveness of our compensation and promotional programs and the competitiveness of such programs compared with other companies, including other part-time business opportunities.
If our new business opportunities and products do not generate sufficient interest to attract new recruits, motivate them to become licensed sales representatives and incentivize them to sell our products and recruit other new sales representatives, our business would be materially adversely affected.
Furthermore, if we or any other direct sales businesses with a similar distribution structure engage in practices resulting in increased negative public attention for our business, the resulting reputational challenges could adversely affect our ability to attract new recruits. Direct sales companies such as ours can be the subject of negative commentary on website postings and other non-traditional
| 36 |
Table of Contents
Index to Financial Statements
media. This negative commentary can spread inaccurate or incomplete information about the direct sales industry in general or our company in particular, which can make our recruiting more difficult.
Certain of our key RVPs have large sales organizations that include thousands of downline sales representatives. These key RVPs are responsible for attracting, motivating, supporting and assisting the sales representatives in their sales organizations. The loss of one or more key RVPs, together with a substantial number of their sales representatives, for any reason, including movement to a competitor, or any other event that causes the departure of a large number of sales representatives, could materially adversely affect our financial results and could impair our ability to attract new sales representatives.
There are a number of laws and regulations that could apply to our distribution model, which subject us to the risk that we may have to modify our distribution structure.
In the past, certain direct sales distribution models have been subject to challenge under various laws, including laws relating to business opportunities, franchising, pyramid schemes and unfair or deceptive trade practices.
In general, state business opportunity and franchise laws in the United States prohibit sales of business opportunities or franchises unless the seller provides potential purchasers with a pre-sale disclosure document that has first been filed with a designated state agency and grants purchasers certain legal recourse against sellers of business opportunities and franchises. In Canada, the provinces of Alberta, Ontario, New Brunswick and Prince Edward Island have enacted legislation dealing with franchising, which typically requires mandatory disclosure to prospective franchisees.
We have not been, and are not currently, subject to business opportunity laws because the amounts paid by our new representatives to us (i) are less than the minimum thresholds set by many state statutes and (ii) are not fees paid for the right to participate in a business, but rather are for bona fide expenses such as state-required insurance examinations and pre-licensing training. We have not been, and are not currently, subject to franchise laws for similar reasons. However, there is a risk that a governmental agency or court could disagree with our assessment or that these laws and regulations could change. In addition, the FTC is in the process of promulgating a revised Business Opportunity Rule. If enacted in the form of the current proposal as recommended by the FTC staff, we do not believe the revised rule would apply to our company. However, it could be broadened prior to enactment or interpreted after enactment in a manner inconsistent with our interpretation. Becoming subject to business opportunity or franchise laws or regulations could require us to provide certain disclosures and regulate the manner in which we recruit our sales representatives that may increase the expense of, or adversely impact our success in, recruiting new sales representatives and make it more difficult for us to successfully attract and recruit new sales representatives.
There are various laws and regulations that prohibit fraudulent or deceptive schemes known as pyramid schemes. In general, a pyramid scheme is defined as an arrangement in which new participants are required to pay a fee to participate in the organization and then receive compensation primarily for recruiting other persons to participate, either directly or through sales of goods or services that are merely disguised payments for recruiting others. The application of these laws and regulations to a given set of business practices is inherently fact-based and, therefore, is subject to interpretation by applicable enforcement authorities. Our representatives are paid by commissions based on sales of our products and services to bona fide purchasers, and for this and other reasons we do not believe that we are subject to laws regulating pyramid schemes. Moreover, our representatives are not required to purchase any of the products marketed by us. However, even though we believe that our distribution practices are currently in compliance with, or
| 37 |
Table of Contents
Index to Financial Statements
exempt from, these laws and regulations, there is a risk that a governmental agency or court could disagree with our assessment or that these laws and regulations could change, which may require us to cease our operations in certain jurisdictions or result in other costs or fines.
There are also federal, state and provincial laws of general application, such as the FTC Act, and state or provincial unfair and deceptive trade practices laws that could potentially be invoked to challenge aspects of our recruiting of sales representatives and compensation practices. In particular, our recruiting efforts include promotional materials for recruits that describe the potential opportunity available to them if they join our sales force. These materials, as well as our other recruiting efforts and those of our sales representatives, are subject to scrutiny by the FTC and state and provincial enforcement authorities with respect to misleading statements, including misleading earnings claims made to convince potential new recruits to join our sales force. If claims made by us or by our sales representatives are deemed to be misleading, it could result in violations of the FTC Act or comparable state and provincial statutes prohibiting unfair or deceptive trade practices or result in reputational harm.
Being subject to, or out of compliance with, the aforementioned laws and regulations could require us to change our distribution structure, which could materially adversely affect our business, financial condition and results of operations.
There may be adverse tax and employment law consequences if the independent contractor status of our sales representatives is successfully challenged.
Our sales representatives are independent contractors who operate their own businesses. In the past, we have been successful in defending our company in various contexts before courts and administrative agencies against claims that our sales representatives should be treated like employees. Although we believe that we have properly classified our representatives as independent contractors, there is nevertheless a risk that the IRS or another authority will take a different view. Furthermore, the tests governing the determination of whether an individual is considered to be an independent contractor or an employee are typically fact sensitive and vary from jurisdiction to jurisdiction. Laws and regulations that govern the status and misclassification of independent sales representatives are subject to change or interpretation by various authorities.
In September 2010, legislation was introduced in Congress known as the Fair Playing Field Act of 2010, which, if enacted, would require the Department of the Treasury to prospectively eliminate Section 530 of the Revenue Act of 1978 (“Section 530”). Section 530 currently prevents the IRS from reclassifying independent contractors as employees if the company has consistently treated the workers as independent contractors and has a reasonable basis (such as an IRS ruling or judicial precedent) for its independent contractor classification. The proposed legislation would also require businesses that use independent contractors on a regular and ongoing basis to provide workers with a written notice informing them of their federal tax obligations, of the employment laws that do not apply to them, and of their right to seek a determination of their employment status from the IRS. The White House budget proposal includes provisions similar to those in the Fair Playing Field Act and allocates $25 million to the Department of Labor (“DOL”) for additional enforcement relating to the misclassification of workers as independent contractors. Neither the White House Budget proposal nor the proposed Fair Playing Field Act expressly changes the standard for distinguishing between employees and independent contractors.
If a federal, state or provincial authority or court enacts legislation or adopts regulations that change the manner in which employees and independent contractors are classified or makes any adverse determination with respect to some or all of our independent contractors, we could incur significant costs in complying
| 38 |
Table of Contents
Index to Financial Statements
with such laws and regulations, including, in respect of tax withholding, social security payments and recordkeeping, or we may be required to modify our business model, any of which could have a material adverse effect on our business, financial condition and results of operations. In addition, there is the risk that we may be subject to significant monetary liabilities arising from fines or judgments as a result of any such actual or alleged non-compliance with federal, state, or provincial tax or employment laws or with respect to any applicable employee benefit plan.
Our or our sales representatives’ violation of or non-compliance with laws and regulations and the related claims and proceedings could expose us to material liabilities.
Extensive federal, state, provincial and local laws regulate our products and our relationships with our clients, imposing certain requirements that our sales representatives must follow. The laws and regulations applicable to our business include those promulgated by FINRA, the SEC, the MSRB, the FTC and state insurance, lending and securities regulatory agencies in the United States. In Canada, the following Canadian regulatory authorities have responsibility for us: OSFI, FINTRAC, FCAC, MFDA, and provincial and territorial insurance regulators and provincial and territorial securities regulators. At any given time, we may have pending state, federal or provincial examinations or inquiries of our investment and savings products, insurance or loan businesses. In addition to imposing requirements that representatives must follow in their dealings with clients, these laws and rules generally require us to maintain a system of supervision to attempt to ensure that our sales representatives comply with these requirements. We have developed policies and procedures to comply with these laws. However, despite these compliance and supervisory efforts, the breadth of our operations and the broad regulatory requirements could result in oversight failures and instances of non-compliance or misconduct on the part of our sales representatives.
From time to time, we are subject to private litigation as a result of alleged misconduct by our sales representatives. Examples include claims that a sales representative’s failure to disclose underwriting-related information regarding the insured on an insurance application resulted in the denial of a life insurance policy claim, and with respect to investment and savings products sales, errors or omissions that a representative made in connection with an account. Non-compliance or misconduct by our sales representatives could result in adverse findings in either examinations or litigation and could subject us to sanctions, significant monetary liabilities, restrictions on or the loss of the operation of our business, claims against us or reputational harm, any of which could have a material adverse effect on our business, financial condition and results of operations.
Any failure to protect the confidentiality of client information could adversely affect our reputation and have a material adverse effect on our business, financial condition and results of operations.
Pursuant to federal laws, various federal regulatory and law enforcement agencies have established rules protecting the privacy and security of personal information. In addition, most states and some provinces have enacted laws, which vary significantly from jurisdiction to jurisdiction, to safeguard the privacy and security of personal information. Many of our sales representatives and employees have access to and routinely process personal information of clients through a variety of media, including the Internet and software applications. We rely on various internal processes and controls to protect the confidentiality of client information that is accessible to, or in the possession of, our company, our employees and our sales representatives. We have a significant number of sales representatives and employees, and it is possible that a sales representative or employee could, intentionally or unintentionally, disclose or misappropriate confidential client information. If we fail to maintain adequate internal controls, including
| 39 |
Table of Contents
Index to Financial Statements
any failure to implement newly required additional controls, or if our sales representatives or employees fail to comply with our policies and procedures, misappropriation or intentional or unintentional inappropriate disclosure or misuse of client information could occur. Such internal control inadequacies or non-compliance could materially damage our reputation or lead to civil or criminal penalties, which, in turn, could have a material adverse effect on our business, financial condition and results of operations.
Risks Related to Our Insurance Business and Reinsurance
We may face significant losses if our actual experience differs from our expectations regarding mortality or persistency.
We set prices for life insurance policies based upon expected claim payment patterns derived from assumptions we make about the mortality rates, or likelihood of death, of our policyholders in any given year. The long-term profitability of these products depends upon how our actual mortality rates compare to our pricing assumptions. For example, if mortality rates are higher than those assumed in our pricing assumptions, we could be required to make more death benefit payments under our life insurance policies or to make such payments sooner than we had projected, which may decrease the profitability of our term life insurance products and result in an increase in the cost of our subsequent reinsurance transactions.
The prices and expected future profitability of our life insurance products are also based, in part, upon assumptions related to persistency, which is the probability that a policy will remain in force from one period to the next. Actual persistency that is lower than our persistency assumptions could have an adverse effect on profitability, especially in the early years of a policy, primarily because we would be required to accelerate the amortization of expenses we deferred in connection with the acquisition of the policy. Actual persistency that is higher than our persistency assumptions could have an adverse effect on profitability in the later years of a block of policies because the anticipated claims experience is higher in these later years. If actual persistency is significantly different from that assumed in our pricing assumptions, our reserves for future policy benefits may prove to be inadequate. We are precluded from adjusting premiums on our in-force business during the initial term of the policies, and our ability to adjust premiums on in-force business after the initial policy term is limited by our insurance policy forms to the maximum premium rates in the policy.
Our assumptions and estimates regarding persistency and mortality require us to make numerous judgments and, therefore, are inherently uncertain. We cannot determine with precision the actual persistency or ultimate amounts that we will pay for actual claim payments on a block of policies, the timing of those payments, or whether the assets supporting these contingent future payment obligations will increase to the levels we estimate before payment of claims. If we conclude that our reserves, together with future premiums, are insufficient to cover actual or expected claims payments and the scheduled amortization of our DAC assets, we would be required to first accelerate our amortization of the DAC assets and then increase our reserves and incur income statement charges for the period in which we make the determination, which could materially adversely affect our business, financial condition and results of operations.
The occurrence of a catastrophic event could materially adversely affect our business, financial condition and results of operations.
Our insurance operations are exposed to the risk of catastrophic events, which could cause a large number of premature deaths of our insureds. Catastrophic events include wars and other military actions, terrorist attacks, natural or man-made disasters and pandemics or other widespread health crises. Catastrophic events are not contemplated in our actuarial mortality models. A catastrophic event could also cause significant volatility in global financial markets
| 40 |
Table of Contents
Index to Financial Statements
and disrupt the economy. Although we have ceded a significant majority of our mortality risk to reinsurers since the mid-1990s, a catastrophic event could cause a material adverse effect on our business, financial condition and results of operations. Claims resulting from a catastrophic event could cause substantial volatility in our financial results for any quarter or year and could also materially harm the financial condition of our reinsurers, which would increase the probability of default on reinsurance recoveries. Our ability to write new business could also be adversely affected.
In addition, most of the jurisdictions in which our insurance subsidiaries are admitted to transact business require life insurers doing business within the jurisdiction to participate in guaranty associations, which raise funds to pay contractual benefits owed pursuant to insurance policies issued by impaired, insolvent or failed issuers. It is possible that a catastrophic event could require extraordinary assessments on our insurance companies, which may have a material adverse effect on our business, financial condition and results of operations.
Our insurance business is highly regulated, and statutory and regulatory changes may materially adversely affect our business, financial condition and results of operations.
Life insurance statutes and regulations are generally designed to protect the interests of the public and policyholders. Those interests may conflict with your interests as a stockholder. Currently, in the United States, the power to regulate insurance resides almost exclusively with the states. Much of this state regulation follows model statutes or regulations developed or amended by the NAIC, which is composed of the insurance commissioners of each U.S. jurisdiction. The NAIC re-examines and amends existing model laws and regulations (including holding company regulations) in addition to determining whether new ones are needed.
The laws of the various U.S. jurisdictions grant insurance departments broad powers to regulate almost all aspects of our insurance business. The U.S. Congress continues to examine the current condition of U.S. state-based insurance regulation to determine whether to impose federal regulation and to allow optional federal insurance company incorporation. The Dodd-Frank Act created an Office of Federal Insurance Reform that will, among other things, study methods to modernize and improve insurance regulation, including uniformity and the feasibility of federal regulation. We cannot predict with certainty whether, or in what form, reforms will be enacted and, if so, whether the enacted reforms will materially affect our business. Changes in federal statutes, including the Gramm-Leach-Bliley Act and the McCarran-Ferguson Act, financial services regulation and federal taxation, in addition to changes to state statutes and regulations, may be more restrictive than current requirements or may result in higher costs, and could materially adversely affect the insurance industry and our business, financial condition and results of operations.
Provincial and federal insurance laws regulate many aspects of our Canadian insurance business. Changes to provincial or federal statutes and regulations may be more restrictive than current requirements or may result in higher costs, which could materially adversely affect the insurance industry and our business, financial condition and results of operations. We have also entered into an undertaking agreement with OSFI in connection with our initial public offering and the Transactions pursuant to which we have agreed to provide OSFI certain information, including advance notice, where practicable, of certain corporate actions. If we fail to comply with our undertaking to OSFI or if OSFI determines that our corporate actions do not comply with applicable Canadian law, Primerica Life Canada could face sanctions or fines, and Primerica Life Canada could be subject to increased capital requirements or other requirements deemed appropriate by OSFI.
We received approval from the Minister of Finance (Canada) under the Insurance Companies Act (Canada) in connection with our indirect acquisition of Primerica Life Canada. The Minister expects that a person controlling a
| 41 |
Table of Contents
Index to Financial Statements
federal insurance company will provide ongoing financial, managerial or operational support to its subsidiary should such support prove necessary, and has required us to sign a support principle letter to that effect. This ongoing support may take the form of additional capital, the provision of managerial expertise or the provision of support in such areas as risk management, internal control systems and training. However, the letter does not create a legal obligation on the part of the person to provide the support. In the event that OSFI determines Primerica Life Canada is not receiving adequate support from us under applicable Canadian law, Primerica Life Canada may be subject to increased capital requirements or other requirements deemed appropriate by OSFI.
If there were to be extraordinary changes to statutory or regulatory requirements, we may be unable to fully comply with or maintain all required insurance licenses and approvals. Regulatory authorities have relatively broad discretion to grant, renew and revoke licenses and approvals. If we do not have all requisite licenses and approvals, or do not comply with applicable statutory and regulatory requirements, the regulatory authorities could preclude or temporarily suspend us from carrying on some or all of our insurance activities or monetarily penalize us, which could materially adversely affect our business, financial condition and results of operations. We cannot predict with certainty the effect any proposed or future legislation or regulatory initiatives may have on the conduct of our business. See “Business — Regulation — Regulation of Insurance Products.”
A decline in RBC of our insurance subsidiaries could result in increased scrutiny by insurance regulators and ratings agencies and have a material adverse effect on our business, financial condition and results of operations.
Each of our insurance subsidiaries is subject to RBC standards and other minimum statutory capital and surplus requirements (in Canada, minimum continuing capital and surplus requirements (“MCCSR”), and Tier 1 capital ratio requirements) imposed under the laws of its respective jurisdiction of domicile. The RBC formula for U.S. life insurance companies generally establishes capital requirements relating to insurance, business, asset and interest rate risks. Our U.S. insurance subsidiaries are required to report their results of RBC calculations annually to the applicable state department of insurance and the NAIC. Our Canadian insurance subsidiary is required to provide its MCCSR and Tier 1 capital ratio calculations to the Canadian regulators. The capitalization of our life insurance subsidiaries is maintained at levels in excess of the effective minimum requirements of the NAIC in the United States and OSFI in Canada. These minimum standards are 100% of the Company Action Level of RBC for our U.S. insurance subsidiaries and, for our Canadian insurance subsidiary, MCCSR of 150% and a Tier 1 capital ratio of 105%. The capital required is the same for both the MCCSR and Tier 1 ratios, however the capital available for the Tier 1 ratio excludes certain assets as prescribed by OSFI. To comply with RBC levels prescribed by the regulators of our insurance subsidiaries, our initial capitalization levels were based on our estimates and assumptions regarding our business. In any particular year, statutory capital and surplus amounts and RBC and MCCSR ratios may increase or decrease depending on a variety of factors, including the amount of statutory income or losses generated by our insurance subsidiaries (which is sensitive to equity and credit market conditions), the amount of additional capital our insurance subsidiaries must hold to support business growth, changes in their reserve requirements, the value of certain fixed-income and equity securities in their investment portfolios, the credit ratings of investments held in their portfolios, the value of certain derivative instruments, changes in interest rates, credit market volatility, changes in consumer behavior, as well as changes to the NAIC’s RBC formula or the MCCSR calculation of OSFI. Many of these factors are outside of our control.
| 42 |
Table of Contents
Index to Financial Statements
Our financial strength and credit ratings are significantly influenced by the statutory surplus amounts and RBC and MCCSR ratios of our insurance company subsidiaries. Ratings agencies may change their internal models, effectively increasing or decreasing the amount of statutory capital we must hold to maintain our current ratings. In addition, ratings agencies may downgrade the invested assets held in our portfolio, which could result in a reduction of our capital and surplus by means of other-than-temporary impairments. Changes in statutory accounting principles could also adversely impact our ability to meet minimum RBC, MCCSR and statutory capital and surplus requirements. Furthermore, during the initial years of operation after the Citi reinsurance transactions, our statutory capital and surplus may prove to be insufficient and we may incur ongoing statutory losses as a result of the high amounts of upfront commissions that are paid to our sales force in connection with the issuance of term life insurance policies. The statutory capital and surplus strain associated with payment of these commissions will be of greater impact during the initial years of our operations as a public company, as the in-force book of business, net of the Citi reinsurance transactions, grows. There is no assurance that our insurance subsidiaries will not need additional capital or that we will be able to provide it to maintain the targeted RBC and MCCSR levels to support their business operations.
The failure of any of our insurance subsidiaries to meet its applicable RBC and MCCSR requirements or minimum capital and surplus requirements could subject it to further examination or corrective action imposed by insurance regulators, including limitations on its ability to write additional business, supervision by regulators or seizure or liquidation. Any corrective action imposed could have a material adverse effect on our business, financial condition and results of operations. A decline in RBC or MCCSR also limits our ability to take dividends or distributions out of the insurance subsidiary and could be a factor in causing ratings agencies to downgrade the financial strength ratings of all our insurance subsidiaries. Such downgrades would have an adverse effect on our ability to write new insurance business and, therefore, could have a material adverse effect on our business, financial condition and results of operations.
A ratings downgrade by a ratings organization could materially adversely affect our business, financial condition and results of operations.
We have three insurance subsidiaries. Primerica Life, our Massachusetts domiciled life insurance company, NBLIC, our New York life insurance company, and Primerica Life Canada, our Canadian life insurance company, have each been assigned a financial strength rating of A+ (superior; second highest of 16 ratings) by A.M. Best with a negative outlook. Primerica Life currently also has an insurer financial strength rating of AA- (very strong; fourth highest of 22 ratings) from Standard & Poor’s with a stable outlook. NBLIC and Primerica Life Canada are not rated by Standard & Poor’s.
Financial strength ratings are an important factor in establishing the competitive position of insurance companies. Such ratings are important to maintaining public confidence in us and our ability to market our insurance products. Ratings organizations review the financial performance and financial conditions of insurance companies, including our three insurance subsidiaries, and provide opinions regarding financial strength, operating performance and ability to meet obligations to policyholders. A downgrade in the financial strength ratings of our insurance subsidiaries, or the announced potential for a downgrade, could have a material adverse effect on our business, financial condition and results of operations, including by:
| • | reducing sales of insurance products; |
| • | adversely affecting our relationships with our sales representatives; |
| • | materially increasing the amount of policy cancellations by our policyholders; |
| • | requiring us to reduce prices to remain competitive; and |
| • | adversely affecting our ability to obtain reinsurance at reasonable prices or at all. |
| 43 |
Table of Contents
Index to Financial Statements
The financial strength ratings of our insurance subsidiaries are subject to periodic review using, among other things, the ratings agencies’ proprietary capital adequacy models, and are subject to revision or withdrawal at any time. Insurance financial strength ratings are directed toward the concerns of policyholders and are not intended for the protection of investors or as a recommendation to buy, hold or sell securities. Our financial strength ratings will affect our competitive position relative to other insurance companies. If the financial strength ratings of our insurance subsidiaries fall below certain levels, some of our policyholders may move their business to our competitors.
In addition, the standards used by ratings agencies in determining financial strength are different from capital requirements set by insurance regulators. We may need to take actions in response to changing standards set by any of the ratings agencies, as well as statutory capital requirements, which could have a material adverse effect on our business, financial condition and results of operations.
Credit deterioration in, and the effects of interest rate fluctuations on, our invested asset portfolio could materially adversely affect our business, financial condition and results of operations.
A large percentage of our invested asset portfolio is invested in fixed-income securities; as a result, credit deterioration and interest rate fluctuations could materially affect the value and earnings of our invested asset portfolio. Fixed-income securities decline in value if there is no active trading market for the securities or the market’s impression of, or the ratings agencies’ views on, the credit quality of an issuer worsens. During periods of declining market interest rates, any interest income we receive on variable interest rate investments would decrease. In addition, during such periods, we would be forced to reinvest the cash we receive as interest or return of principal on our investments in lower-yielding high-grade instruments or in lower-credit instruments to maintain comparable returns. Issuers of fixed-income securities could also decide to prepay their obligations to borrow at lower market rates, which would increase the percentage of our portfolio that we would have to reinvest in lower-yielding investments of comparable credit quality or in lower quality investments offering similar yields. If interest rates generally increase, the market value of our fixed rate income portfolio decreases. Additionally, if the market value of any security in our invested asset portfolio decreases, we may realize losses if we deem the value of the security to be other-than-temporarily-impaired. To the extent that any fluctuations in fair value are significant or we recognize impairments that are material, it could have a material adverse effect on our business, financial condition and results of operations.
Valuation of our investments and the determination of whether a decline in the fair value of our invested assets is other-than-temporary are based on methodologies and estimates that may prove to be incorrect.
GAAP requires that when the fair value of any of our invested assets declines and such decline is deemed to be other-than-temporary, we recognize a loss in either accumulated other comprehensive income or on our statement of income based on certain criteria in the period that such determination is made. Determining the fair value of certain invested assets, particularly those that do not trade on a regular basis, requires an assessment of available data and the use of assumptions and estimates. Once it is determined that the fair value of an asset is below its carrying value, we must determine whether the decline in fair value is other-than-temporary, which is based on subjective factors and involves a variety of assumptions and estimates. For information on our valuation methodology, see Notes 1 and 4 to our consolidated and combined financial statements included elsewhere in this report and “Management’s Discussion and Analysis of Financial Condition and Results of Operations — Critical Accounting Policies — Investments.”
| 44 |
Table of Contents
Index to Financial Statements
There are certain risks and uncertainties associated with determining whether declines in market value are other-than-temporary. These include significant changes in general economic conditions and business markets, trends in certain industry segments, interest rate fluctuations, rating agency actions, changes in significant accounting estimates and assumptions and legislative actions. In the case of mortgage- and asset-backed securities, there is added uncertainty as to the performance of the underlying collateral assets. To the extent that we are incorrect in our determination of the fair value of our investment securities or our determination that a decline in their value is other-than-temporary, we may realize losses that never actually materialize or may fail to recognize losses within the appropriate reporting period.
The failure by any of our reinsurers to perform its obligations to us could have a material adverse effect on our business, financial condition and results of operations.
We extensively use reinsurance in the United States to diversify our risk and to manage our loss exposure to mortality risk. Reinsurance does not relieve us of our direct liability to our policyholders, even when the reinsurer is liable to us. We, as the insurer, are required to pay the full amount of death benefits even in circumstances where we are entitled to receive payments from the reinsurer. Due to factors such as insolvency, adverse underwriting results or inadequate investment returns, our reinsurers may not be able to pay the reinsurance recoverables they owe to us on a timely basis or at all. Reinsurers might refuse or fail to pay losses that we cede to them or might delay payment. Since death benefit claims may be paid long after a policy is issued, we bear credit risk with respect to our reinsurers. The creditworthiness of our reinsurers may change before we can recover amounts to which we are entitled.
No assurance is given that our reinsurers will pay the reinsurance recoverables owed to us now or in the future or that they will pay these recoverables on a timely basis. Any such failure to pay by our reinsurers could have a material adverse effect on our business, financial condition and results of operations.
The failure by Citi to perform its obligations to us under our coinsurance agreements could have a material adverse effect on our business, financial condition and results of operations.
Immediately prior to the Offering, we entered into four coinsurance agreements with three reinsurer affiliates of Citi pursuant to which we ceded between 80% and 90% of the risks and rewards of our term life insurance policies that were in force at year-end 2009. Under this arrangement, our current third-party reinsurance agreements remain in place. The largest of these transactions involved two coinsurance agreements between Primerica Life and Prime Re. Prime Re was formed solely for the purpose of entering into these reinsurance transactions, has no operating history and does not possess a financial strength rating from any rating agency. The other transactions were between (1) Primerica Life Canada and Financial Reassurance Company 2010 Ltd., a Bermuda reinsurer formed to operate solely for the purpose of reinsuring Citi-related risks and is a wholly owned subsidiary of Citi, and (2) NBLIC and American Health and Life Insurance Company (“AHL”), a wholly owned insurance subsidiary of Citi that has a financial strength rating of “A” by A.M. Best. Each of the three reinsurers entered into trust agreements with our respective insurance subsidiaries and a trustee pursuant to which the reinsurer placed assets (primarily treasury and fixed-income securities) in trust for such subsidiary’s benefit to secure the reinsurer’s obligations to such subsidiary. Each such coinsurance agreement requires each reinsurer to maintain assets in trust sufficient to give the subsidiary full credit for regulatory purposes for the insurance, which amount will not be less than the amount of the reserves for the reinsured liabilities. In addition, in the case of the reinsurance transactions between Prime Re and Primerica Life, Citi has
| 45 |
Table of Contents
Index to Financial Statements
agreed in a capital maintenance agreement to maintain Prime Re’s RBC above a specified minimum level, subject to a maximum amount of $512 million being contributed by Citi. After the first five years of the capital maintenance agreement, the maximum amount payable will be an aggregate amount equal to the lesser of $512 million or 15% of statutory reserves. In the case of the reinsurance transaction between NBLIC and AHL, Citi has agreed to over-collateralize the assets in the trust for NBLIC by 15% for the life of the coinsurance agreement between NBLIC and AHL. Furthermore, our insurance subsidiaries have the right to recapture the business upon the occurrence of an event of default under their respective coinsurance agreement with the Citi affiliates subject to any applicable cure periods. An event of default includes (1) a reinsurer insolvency, (2) failure through the fault of the reinsurer to provide full statutory financial statement credit for the reinsurance ceded, (3) a material breach of any covenant, representation or warranty by the reinsurer, (4) failure by the reinsurer to fund the trust account required to be established under the coinsurance agreements in any material respects, or (5) in connection with the coinsurance agreements with Prime Re, failure by Citi to maintain sufficient capital in the reinsurer, pursuant to the capital maintenance agreement between Citi and the reinsurer within 45 calendar days of any demand for payment by or on behalf of Primerica Life, and any 45-day extension thereof as consented to by Primerica Life, which consent may not be unreasonably conditioned, delayed or withheld, for a total of not more than 90 days to obtain such consent; provided that Primerica Life is not required to consent to extend such period beyond an additional 45 days. While any such recapture would be at no cost to us, such recapture would result in a substantial increase in our insurance exposure and require us to be fully responsible for the management of the assets set aside to support statutory reserves. The type of assets we might obtain as a result of a recapture may not be as highly liquid as our current invested asset portfolio and could result in an unfavorable impact on our risk profile.
We cannot provide assurance that the relevant Citi reinsurer will pay the reinsurance obligations owed to us now or in the future or that it will pay these obligations on a timely basis. Notwithstanding the capital maintenance agreement between Prime Re and Citi and the initial over-collateralization of assets in trust for the benefit of our insurance companies, if any of our reinsurers affiliated with Citi becomes insolvent, the amount in the trust account to support the obligations of such reinsurer is insufficient to pay such reinsurer’s obligations to us and we fail to enforce our right to recapture the business, it could have a material adverse effect on our business, financial condition and results of operations.
Yearly renewable term reinsurance may not be available or affordable in the future to limit our mortality risk exposure.
As described above, we have historically used YRT reinsurance to manage our loss exposure to mortality risks. It is our current intention to continue our practice of purchasing mortality reinsurance in the future consistent with our past practice. While YRT reinsurance agreements generally bind the reinsurers for the life of the business reinsured at generally fixed pricing, market conditions beyond our control determine the availability and cost of the reinsurance protection for new business. We may not be able to maintain our current YRT reinsurance agreements in adequate amounts and at favorable rates. Any decrease in the amount of YRT reinsurance will increase our exposure to mortality risks.
Changes in accounting for DAC of insurance entities will accelerate the recognition for certain acquisition costs not deemed to be directly related to the successful acquisition of new insurance contracts.
In October 2010, the Financial Accounting Standards Board, or FASB, issued ASU 2010-26, Accounting for Costs Associated with Acquiring or Renewing Insurance Contracts (ASU 2010-
| 46 |
Table of Contents
Index to Financial Statements
26). The update revises the definition of deferred policy acquisition costs to reflect incremental costs directly related to the successful acquisition of new and renewed insurance contracts. The update creates a more limited definition than the current guidance, which defines deferred policy acquisition costs as those that vary with, and primarily relate to, the acquisition of insurance contracts. The revised definition materially increases the portion of acquisition costs being expensed as incurred rather than deferred and amortized over the lives of the underlying policies. The update allows either prospective or retrospective adoption and is required to be adopted for our fiscal year beginning January 1, 2012. While we are currently unable to quantify the impact of implementation, we expect this update to have a material adverse effect on our results of operations, as we will be required to accelerate the recognition of certain expenses associated with acquiring life insurance business.
Changes in accounting standards can be difficult to predict and could adversely impact how we record and report our financial condition and results of operations.
Our accounting policies and methods are fundamental to how we record and report our financial condition and results of operations. U.S. GAAP continues to evolve and as a result, may change the financial accounting and reporting standards that govern the preparation of our financial statements. These changes can be hard to anticipate and implement and can materially impact how we record and report our financial condition and results of operations. For example, the FASB’s current insurance contracts project could, among other things, significantly change the way we measure insurance liabilities on our balance sheet and the way we present earnings on our statement of income. This project, in addition to a related proposal to modify International Financial Reporting Standards on accounting for insurance contracts, could adversely impact both our financial condition and results of operations as reported on a U.S. GAAP basis as well as our statutory capital calculations.
Risks Related to Our Investments and Savings Products Business
Our investment and savings products segment is heavily dependent on mutual fund and annuity products offered by a relatively small number of companies and if these products fail to remain competitive with other investment options or we lose our relationship with one or more of these fund companies or with the source of our annuity products, our business, financial condition and results of operations may be materially adversely affected.
We earn a significant portion of our earnings through our relationships with a small group of mutual fund companies, including Legg Mason, Invesco and American Funds, and with MetLife, which provides our annuity products. A decision by one or more of these companies to alter or discontinue their current arrangements with us could materially adversely affect our business, financial condition and results of operations. In addition, if any of our investment and savings products fail to achieve satisfactory investment performance, our clients may seek higher yielding alternative investment products. If any of our investment and savings products fail to achieve satisfactory investment performance for an extended period of time, we may experience higher redemption rates. In such circumstances, we may also experience re-allocations of existing client assets and increased allocations of new assets to investment and savings products with higher investment returns, which ultimately results in changes in our mix of business. Since different investment and savings products have different revenue and expense characteristics, such changes may have significant negative consequences for us.
In recent years there has been an increase in the popularity of alternative investments, which
| 47 |
Table of Contents
Index to Financial Statements
we do not currently offer, principally index funds and exchange traded funds. These investment options typically have low fee structures and provide some of the attributes of mutual funds, such as risk diversification. If these products continue to gain traction among our client base as viable alternatives to mutual fund investments, our investment and savings products revenues may decline.
In addition to sales commissions and asset-based compensation, a significant portion of our earnings from investment and savings products comes from recordkeeping services that we provide to Invesco, Legg Mason and Pioneer Investments and from fees earned for custodial services we provide to clients with retirement plan accounts in the funds of these mutual fund companies. We also receive revenue sharing payments from each of these mutual fund companies. A decision by one or more of these fund companies to alter or discontinue their current arrangements with us would materially adversely affect our business, financial condition and results of operations.
Our or our securities-licensed sales representatives violations of, or non-compliance with, laws and regulations could expose us to material liabilities.
Our subsidiary broker-dealer, PFS Investments, is subject to federal and state regulation of its securities business, including sales practices, trade suitability, supervision of registered representatives, recordkeeping, the conduct and qualification of officers and employees, the rules and regulations of the MSRB and state blue sky regulation. Our subsidiary, PSS, is a registered transfer agent engaged in the recordkeeping business and is subject to SEC regulation. Violations of laws or regulations applicable to the activities of PFS Investments or PSS or violations by a third party with which PFS Investments or PSS contracts which improperly performs its task could subject us to disciplinary actions and could result in the imposition of cease and desist orders, fines or censures, restitution to clients, disciplinary actions, including the potential suspension or revocation of its license by the SEC, or the suspension or expulsion from FINRA and reputational damage, which could materially adversely affect our business, financial condition and results of operations.
Our Canadian dealer subsidiary, PFSL Investments Canada Ltd. (“PFSL Investments Canada”) and its sales representatives are subject to the securities laws of the provinces and territories of Canada in which we sell our mutual fund products and those of third parties and to the rules of the MFDA, the self-regulatory organization governing mutual fund dealers. PFSL Investments Canada is subject to periodic review by both the MFDA and the provincial and territorial securities commissions to assess its compliance with, among other things, applicable capital requirements and sales practices and procedures. These regulators have broad administrative powers, including the power to limit or restrict the conduct of our business for failure to comply with applicable laws or regulations. Possible sanctions that may be imposed include the suspension of individual sales representatives, limitations on the activities in which the dealer may engage, suspension or revocation of the dealer registration, censure or fines, any of which could materially adversely affect our business, financial condition and results of operations.
If heightened standards of conduct or more stringent licensing requirements, such as those recently proposed by the SEC and the DOL, are imposed on us or our sales representatives or selling compensation is reduced as a result of new legislation or regulations, it could have a material adverse effect on our business, financial condition and results of operations.
Our sales representatives are subject to federal and state regulation as well as state licensing requirements. PFS Investments, which is regulated as a broker-dealer, and our U.S. sales representatives are currently subject to general anti-fraud limitations under the Exchange Act and SEC rules and regulations, as well as other
| 48 |
Table of Contents
Index to Financial Statements
conduct standards prescribed by FINRA. These standards generally require that broker-dealers and their sales representatives disclose conflicts of interest that might affect the advice or recommendations they provide and require them to make suitable investment recommendations to their customers. The Dodd-Frank Act, which gave the SEC the power to impose on broker-dealers a heightened standard of conduct that is currently applicable only to investment advisers, required the SEC to conduct a study to evaluate the effectiveness of the current legal standards of conduct for those that provide personalized investment advice regarding securities to retail customers. The SEC staff recently submitted a report to Congress in which it recommends that the SEC adopt a uniform fiduciary standard of conduct.
Additionally, the DOL has published a proposed rule that would more broadly define the circumstances under which a person or entity may be considered a fiduciary for purposes of the prohibited transaction rules of Internal Revenue Code Section 4975 (“Section 4975”). The proposal amends a long-standing position that the DOL believes may inappropriately limit the types of investment advice relationships that give rise to the application of such prohibited transaction rules. The DOL held a public hearing on the proposal in early March 2011. If PFS Investments and its securities-licensed representatives are deemed to be fiduciaries for purposes of Section 4975, we could be limited in our ability to receive and retain certain types of compensation paid by third parties with respect to both new investments into and existing assets in qualified accounts. This could make it more difficult for us and our representatives to profitably serve the middle-income market. Moreover, if our representatives must be advisors with Series 65 licenses, this could force us to change our business model and could become a significant obstacle to serving our existing IRA accounts and receiving a sufficient revenue stream to remain in this line of business.
Heightened standards of conduct as a result of either of the above proposals or another similar proposed rule or regulation could also increase the compliance and regulatory burdens on our representatives, lead to increased litigation and regulatory risks, changes to our business model, a decrease in the number of our securities-licensed representatives or a reduction in the products we offer to our clients which could have a material adverse effect on our business, financial condition and results of operations.
Our suitability policies and procedures could be deemed inadequate.
We review account applications for our investment or savings product received by us for suitability. While we believe that our policies and procedures implemented to help our sales representatives assist clients in making appropriate and suitable investment choices are reasonably designed to achieve compliance with applicable securities laws and regulations, it is possible that FINRA and MFDA may not agree. In that event, we could be subject to regulatory actions or civil litigation, which could materially adversely affect our business, financial condition and results of operations.
Our sales force support tools may fail to appropriately identify suitable investment products.
Our support tools are designed to educate clients, help identify their financial needs, illustrate the potential benefits of our products and allow a sales representative to show them how the sales representative’s recommendations may help them. There is a risk that the assumptions and methods of analyses embedded in our support tools could be successfully challenged and subject us to regulatory actions or civil litigation, which could materially adversely affect our business, financial condition and results of operations.
Non-compliance with applicable regulations could lead to revocation of our subsidiary’s status as a non-bank custodian.
PFS Investments is a non-bank custodian of retirement accounts, as permitted under
| 49 |
Table of Contents
Index to Financial Statements
Treasury Regulation 1.408-2. A non-bank custodian is an entity that is not a bank and that is permitted by the IRS to act as a custodian for retirement plan account assets of our clients. The IRS retains authority to revoke or suspend that status if it finds that PFS Investments is unwilling or unable to administer retirement accounts in a manner consistent with the requirements of the regulations. Revocation of PFS Investments’ non-bank custodian status would affect its ability to earn revenue for providing such services and, consequently, could materially adversely affect our business, financial condition and results of operations.
Risks Related to Our Loan Business
The current economic environment and stringent credit policies may continue to negatively affect our loan production.
Beginning in 2008, in response to economic conditions and consistent with steps taken by other mortgage lenders generally, our mortgage lenders implemented more rigorous credit standards, including more restrictive loan-to-value limitations and more restrictive underwriting criteria, which adversely affected our loan business. We anticipate that these credit restrictions will be ongoing, and it is possible that further restrictive underwriting criteria may be imposed by our mortgage lenders in reaction to changes in the economic environment or by new legislative or regulatory requirements, including the Dodd-Frank Act, affecting mortgage lending generally. Heightened credit standards have materially reduced the volume of our loan sales. Beginning in March 2010, we modified the mortgage product to make it a conforming loan product that is saleable by CTB, the lender, to government-sponsored enterprises, Fannie Mae and Freddie Mac. This modification reduced the compensation that we and our sales force earn upon the origination of a mortgage loan in the United States.
While mortgage origination historically has not accounted for a significant portion of our earnings, sourcing of mortgage loans historically has provided an opportunity for new sales representatives to receive commissions before they have completed the licensing process that is required to sell life insurance and certain other products. Additionally, some of our sales representatives use loan product sales efforts as a gateway to establish an ongoing relationship with clients. Consequently, the reduction in the scale of our loan product distribution business and the related commission compensation to our sales force may cause us to have fewer sales representatives and impede our overall growth.
New licensing requirements will continue to significantly reduce the size of our loan sales force.
The number of our sales representatives who are authorized to sell loan products in the United States has significantly decreased due to the implementation of individual licensing requirements mandated by the SAFE Act. The SAFE Act required all states to enact and implement laws that require our U.S. sales representatives to be individually licensed if they engage in offering mortgage loan products. Prior to the enactment of the SAFE Act, our sales representatives were not required to be individually licensed or registered to sell mortgage loan products in the majority of states. Due to the enactment and implementation by the states of the SAFE Act, to offer mortgage loan products, our sales representatives must be individually licensed as mortgage loan originators (and in some states as both mortgage brokers and mortgage loan originators) by the states in which they do business. These licensing requirements include enrollment in the Nationwide Mortgage Licensing System, application to state regulators for individual licenses, a minimum of 20 hours of pre-licensing education, an annual minimum of eight hours of continuing education and the successful completion of both national and state exams. Compliance with these licensing regimes (including background checks) have proven to be a barrier in terms of cost or time for a large number of our sales representatives. In addition, the exams have proven to be challenging for our sales representatives to pass. The SAFE Act
| 50 |
Table of Contents
Index to Financial Statements
licensing requirements have caused, and are expected to continue to cause, a significant reduction in the scale of our loan product distribution business, which could materially adversely affect our loan product sales.
The reduction of the number of sales representatives participating in the loan business has adversely impacted, and is expected to continue to adversely impact, Primerica Mortgages’ ability to maintain and obtain corporate Mortgage Broker (or equivalent) licenses in certain states where no sales representatives are individually licensed. If Primerica Mortgages does not obtain or maintain corporate Mortgage Broker licenses in the various states, then representatives who want to become individually licensed will be unable to do so due to the lack of a sponsoring licensed Mortgage Broker or may seek another sponsoring licensed Mortgage Broker. Unless both individual representatives and Primerica Mortgages are licensed, neither can offer mortgage loans in a state. In addition, our inability to source mortgage loans impacts the compensation paid to our sales representatives and our ability to assist our clients with their needs.
Our loan business is subject to various federal laws, changes in which could affect the cost or our ability to distribute our products and could materially adversely affect our business, financial condition and results of operations.
Our U.S. loan business is subject to various federal laws, including the Truth In Lending Act and its implementing regulation, Regulation Z, the Equal Credit Opportunity Act and its implementing regulation, Regulation B, the Fair Housing Act and the Home Ownership Equity Protection Act. We are also subject to RESPA and its implementing regulation, Regulation X, which requires timely disclosures related to the nature and costs of real estate settlement amounts and limits those costs and compensation to amounts reasonably related to the services performed.
We are also subject to the Dodd-Frank Act and any regulations that will be issued under that Act. The Dodd-Frank Act created a new consumer protection agency, the Bureau of Consumer Financial Protection, which will have the authority to examine, supervise and enforce federal consumer financial laws, including those impacting Primerica Mortgages’ business. Additionally, the Dodd-Frank Act imposed restrictions on the manner and amount of mortgage originator compensation and establishes a federal ability to repay standard for all mortgage loans. Other restrictions contained in the Dodd-Frank Act could have the effect of limiting the availability of certain loan products in the market and adversely impact the range of products offered and the volume of loan business.
Additionally, we must comply with various state and local laws and policies concerning our lenders, the provision of consumer disclosures, net branching, predatory lending and high cost loans and recordkeeping. In the state of California, the law provides that since Primerica Mortgages is a licensed as California Finance Lender authorized to act as a mortgage broker, Primerica Mortgages is restricted to brokering loans only to another lender who is licensed as a California Finance Lender. Currently, our lender, Citicorp Trust Bank, fsb, is licensed as a California Finance Lender, but should CTB elect to transfer the lending business to either CitiMortgage, Inc. or Citibank N.A., neither of which are currently licensed as California Finance Lenders, Primerica Mortgages ability to source loans in California could be adversely impacted. Differing interpretations of, changes in, or violations of, any of these laws or regulations could subject us to damages, fines or sanctions and could affect the cost or our ability to distribute our products, which could materially adversely affect our business, financial condition and results of operations.
| 51 |
Table of Contents
Index to Financial Statements
Other Risks Related to Our Business
A further delay in the recovery of the United States’ and Canadian economies could materially adversely affect our business, financial condition and results of operations.
Our business, financial condition and results of operations have been materially adversely affected by the economic downturn in the United States and Canada and the slow recovery that has occurred since the last half of 2009. During this period, we have observed increased volatility in the availability and cost of credit, shrinking mortgage markets, fluctuating equity values and falling consumer confidence and general instability of financial and other institutions. This economic downturn, which has been characterized by higher unemployment, lower family income, lower valuation of retirement savings accounts, lower corporate earnings, lower business investment and lower consumer spending, has adversely affected the demand for the term life insurance, investment and other financial products that we sell. A continuation of these effects could severely affect new sales and cause clients to liquidate mutual funds and other investments sold by our sales representatives. This could cause a decrease in the asset value of client accounts, reduce our trailing commission revenues and result in other-than-temporary-impairments in our invested asset portfolio. In addition, we may experience an elevated incidence of lapses or surrenders of insurance policies, and some of our policyholders may choose to defer paying insurance premiums or stop paying insurance premiums altogether. Continuing volatility in equity markets or downturns could discourage purchases of the investment products that we sell for third parties. Moreover, if the economic recovery in the United States and Canada is delayed further, it will likely have an adverse effect on our business, including our ability to recruit and retain sales representatives. If credit markets remain tight for a prolonged period, our liquidity will be more limited than it otherwise would have been, and our business, financial condition and results of operations may be materially adversely affected.
We are subject to various federal laws and regulations in the United States and Canada, changes in which or violations of which may require us to alter our business practices and could materially adversely affect our business, financial condition and results of operations.
In the United States, we are subject to the Right to Financial Privacy Act and its implementing regulation, Regulation S-P, the Fair Credit Reporting Act, the Gramm-Leach-Bliley Act, the McCarran-Ferguson Act, the Foreign Corrupt Practices Act, the Sarbanes-Oxley Act, the Telemarketing and Consumer Fraud and Abuse Prevention Act, the Telephone Consumer Protection Act, the FTC Act, the Unfair Trade Practices Act, the Electronic Funds Transfer Act, the Bank Holding Company Act Amendments of 1970 and anti-tying restrictions. We are also subject to anti-money laundering laws and regulations, including the Bank Secrecy Act, as amended by the Patriot Act, which requires us to develop and implement customer identification and risk-based anti-money laundering programs, report suspicious activity and maintain certain records. We are also required to follow certain economic and trade sanctions programs that are administered by the Office of Foreign Asset Control that prohibit or restrict transactions with suspected countries, their governments, and in certain circumstances, their nationals.
In Canada, we are subject to provincial and territorial consumer protection legislation that pertains to unfair and misleading business practices, provincial and territorial credit reporting legislation that provides requirements in respect of obtaining credit bureau reports and providing notices of decline, the Personal Information Protection and Electronic Documents Act, the Competition Act, the Corruption of Foreign Public Officials Act, the Telecommunications Act and certain Canadian Radio-television and Telecommunications Commission Telecom Decisions in respect of unsolicited telecommunications. We are also subject to the Proceeds of Crime (Money Laundering) and
| 52 |
Table of Contents
Index to Financial Statements
Terrorist Financing Act and its accompanying regulations, which require us to develop and implement money laundering policies and procedures relating to customer indemnification, reporting and recordkeeping, develop and maintain ongoing training programs for employees, perform a risk assessment on our business and clients and institute and document a review of our anti-money laundering program at least once every two years. We are also required to follow certain economic and trade sanctions and legislation that prohibit us from, among other things, engaging in transactions with, and providing services to, persons on lists created under various federal statutes and regulations and blocked persons and foreign countries and territories subject to Canadian sanctions administered by Foreign Affairs and International Trade Canada and the Department of Public Safety Canada.
Changes in, or violations of, any of these laws or regulations may require additional compliance procedures, or result in enforcement proceedings, sanctions or penalties, which could have a material adverse effect on our business, financial condition and results of operations.
Litigation and regulatory investigations and actions may result in financial losses and harm our reputation.
We face a risk of litigation and regulatory investigations and actions in the ordinary course of operating our businesses. From time to time, we are subject to private litigation and regulatory investigations as a result of sales representative misconduct. See “— Risks Related to Our Distribution Structure — Our or our sales representatives’ violation of or non-compliance with laws and regulations and the related claims and proceedings could expose us to material liabilities.” In addition, we may become subject to lawsuits alleging, among other things, issues relating to sales or underwriting practices, payment of improper sales commissions, claims payments and payment procedures, product design, product disclosure, administration, additional premium charges for premiums paid on a periodic basis, denial or delay of benefits, recommending unsuitable sales of products to clients and our pricing structures. Life insurance companies have historically been subject to substantial litigation resulting from policy disputes and other matters. For example, they have faced extensive claims alleging improper life insurance sales practices. If we become subject to similar litigation, any judgment or settlement of such claims could have a material adverse effect on our business, financial condition and results of operations.
In addition, we are subject to litigation arising out of our general business activities. For example, we have a large sales force, and we could face claims by some of our sales representatives arising out of their relationship with us, including claims involving contract terminations, commission disputes, transfers of sales representatives from one sales organization to another, agreements among sales representatives or between us and a sales representative or any of our other dealings with, or policies regarding, sales representatives. We are also subject to various regulatory inquiries, such as information requests, subpoenas and books and record examinations, from state, provincial and federal regulators and other authorities. A substantial legal liability or a significant regulatory action against us could have a material adverse effect on our business, financial condition and results of operations.
Moreover, even if we ultimately prevail in any such litigation, regulatory action or investigation, we could suffer significant reputational harm, which could have a material adverse effect on our business, financial condition and results of operations. In addition, increased regulatory scrutiny and any resulting investigations or proceedings could result in new legal precedents and industry-wide regulations or practices that could materially adversely affect our business, financial condition and results of operations.
| 53 |
Table of Contents
Index to Financial Statements
The current legislative and regulatory climate with regard to financial services may adversely affect our operations.
The volume of legislative and regulatory activity relating to financial services has increased substantially in recent years. The Dodd-Frank Act could cause sweeping changes in the consumer financial services industry, and impact us. As a result, these changes may include holding our sales representatives to a heightened fiduciary standard previously inapplicable to them and limiting or eliminating the use of mandatory pre-dispute arbitration. The SEC also introduced a proposal in July 2010 to restructure and limit the payment of 12b-1 (distribution) fees by mutual fund and variable annuity issuers to selling broker-dealers. The FTC and the federal banking regulatory agencies also have promulgated or proposed new regulations relating to financial services, and we expect more regulations to be proposed. We also anticipate that the level of enforcement actions and investigations by federal regulators will increase in the foreseeable future. The same factors that have contributed to legislative, regulatory and enforcement activity at the federal level are likely to contribute to heightened legislative, regulatory and enforcement activity relating to financial services at the state and provincial level as well. If we or our sales representatives become subject to new requirements or regulations, it could result in increased litigation, regulatory risks, changes to our business model, a decrease in the number of our securities licensed representatives or a reduction in the products we offer to our clients or the profits we earn, which could have a material adverse effect on our business, financial condition and results of operations.
The inability of our subsidiaries to pay dividends or make distributions or other payments to us in sufficient amounts, including due to bankruptcy or insolvency, would impede our ability to meet our obligations.
We are a holding company, and we have no significant operations. Our primary asset is the capital stock of our subsidiaries and our primary liability is the Citi note. We rely primarily on dividends and other payments from our subsidiaries to meet our operating costs and other corporate expenses, as well as to pay dividends to our stockholders. The ability of our subsidiaries to pay dividends to us depends on their earnings, covenants contained in future financing or other agreements and on regulatory restrictions. The ability of our insurance subsidiaries to pay dividends will further depend on their statutory surplus. If the cash we receive from our subsidiaries pursuant to dividend payments and tax sharing arrangements is insufficient for us to fund our obligations, including the Citi note, or if a subsidiary is unable to pay dividends to us, we may be required to raise cash through the incurrence of debt, the issuance of equity or the sale of assets. However, given the recent volatility in the capital markets, there is no assurance that we would be able to raise cash by these means.
The payment of dividends and other distributions to us by our insurance subsidiaries is regulated by insurance laws and regulations. The jurisdictions in which our insurance subsidiaries are domiciled impose certain restrictions on their ability to pay dividends to us. In the United States, these restrictions are based, in part, on the prior year’s statutory income and surplus. In general, dividends up to specified levels are considered ordinary and may be paid without prior approval. For example, in Massachusetts the ordinary dividend capacity for Primerica Life is based on the greater of (1) 10% of the previous year-end statutory capital and surplus or (2) the previous year’s statutory net gain from operations. Dividends in larger amounts are subject to approval by the insurance commissioner of the state of domicile. In Canada, dividends can be paid, subject to the paying insurance company continuing to meet the regulatory requirements for capital adequacy and liquidity and upon 15 days’ minimum notice to OSFI. No assurance is given that more stringent restrictions will not be adopted from time to time by jurisdictions in which our insurance subsidiaries are domiciled, and such restrictions could have the effect, under certain circumstances, of significantly
| 54 |
Table of Contents
Index to Financial Statements
reducing dividends or other amounts payable to us by our subsidiaries without prior approval by regulatory authorities. In addition, in the future, we may become subject to debt instruments or other agreements that limit our ability to pay dividends. The ability of our insurance subsidiaries to pay dividends to us is also limited by our need to maintain the financial strength ratings assigned to us by the ratings agencies.
If any of our subsidiaries were to become insolvent, liquidate or otherwise reorganize, we, as sole stockholder, will have no right to proceed against the assets of that subsidiary. Furthermore, with respect to our insurance subsidiaries, we, as sole stockholder, will have no right to cause the liquidation, bankruptcy or winding-up of the subsidiary under the applicable liquidation, bankruptcy or winding-up laws, although, in Canada, we could apply for permission to cause liquidation. The applicable insurance laws of the jurisdictions in which each of our insurance subsidiaries is domiciled would govern any proceedings relating to that subsidiary. The insurance authority of that jurisdiction would act as a liquidator or rehabilitator for the subsidiary. Both creditors of the subsidiary and policyholders (if an insurance subsidiary) would be entitled to payment in full from the subsidiary’s assets before we, as the sole stockholder, would be entitled to receive any distribution from the subsidiary, which could adversely affect our ability to pay our operating costs and other corporate expenses.
If the ability of our insurance or non-insurance subsidiaries to pay dividends or make other distributions or payments to us is materially restricted by regulatory requirements, bankruptcy or insolvency, or our need to maintain our financial strength ratings, or is limited due to operating results or other factors, it could materially adversely affect our ability to pay our operating costs and other corporate expenses.
We may incur debt or issue equity to meet our operating and regulatory capital requirements or for other purposes.
Historically, we have funded our new business capital needs from cash flows provided by premiums paid on our in-force book of term life insurance policies. As a result of the Citi reinsurance transactions, the net cash flow we retain from our existing block of term life insurance policies was reduced proportionately to the size of our retained interest. As we grow our term life insurance business by issuing new policies, we will need to fund all of the upfront cash requirements of issuing new term life policies (such as commissions payable to the sales force and underwriting expenses), which costs generally exceed premiums collected in the first year after a policy is sold. In light of these anticipated net cash outflows, there will be significant demands on our liquidity in the near- to intermediate-term as we grow the size of our retained block of term life insurance policies. Therefore, to meet our operating and regulatory requirements, we may incur debt or issue equity to fund working capital and capital expenditures or to make acquisitions and other investments. If we raise funds through the issuance of debt securities or preferred equity securities, any such debt securities or preferred equity securities issued will have liquidation rights, preferences and privileges senior to those of the holders of our common stock. If we raise funds through the issuance of equity securities, the issuance will dilute your ownership interest in us. There is no assurance that debt or equity financing will be available to us on acceptable terms, if at all. If we are not able to obtain sufficient financing, we may be unable to maintain or grow our business.
| 55 |
Table of Contents
Index to Financial Statements
Our inability to achieve an investment-grade rating from rating agencies could restrict our ability to refinance the Citi note with terms that are acceptable.
Prior to the completion of our initial public offering, we issued to Citi the $300.0 million Citi note. This note matures on March 31, 2015, and we are obligated under the terms of the note to use commercially reasonable efforts to refinance the note at certain mutually agreeable dates, based on certain conditions. If we are unable to achieve an investment-grade rating, or are otherwise unable to refinance the note on reasonable economic terms, we may incur significantly higher interest expense or be unable to repay the Citi note in full upon maturity. See “Management’s Discussion and Analysis of Financial Condition and Results of Operations — Liquidity and Capital Resources —Citi Note” for a description of the terms of the Citi note.
A significant change in the competitive environment in which we operate could negatively affect our ability to maintain or increase our market share and profitability.
We face competition in all of our business lines. Our competitors include financial services companies, mutual fund companies, banks, investment management firms, broker-dealers, insurance companies and direct sales companies. In many of our product lines, we face competition from competitors that have greater market share or breadth of distribution, offer a broader range of products, services or features, assume a greater level of risk, have lower profitability expectations or have higher financial strength ratings than we do. A significant change in this competitive environment could materially adversely affect our ability to maintain or increase our market share and profitability.
The loss of key personnel could negatively affect our financial results and impair our ability to implement our business strategy.
Our success substantially depends on our ability to attract and retain key members of our senior management team. The efforts, personality and leadership of our senior management team have been, and will continue to be, critical to our success. The loss of service of our senior management team due to disability, death, retirement or some other cause could reduce our ability to successfully motivate our sales representatives and implement our business plan and have a material adverse effect on our business, financial condition and results of operations. Messrs. John Addison and Rick Williams, our Co-Chief Executive Officers, are well regarded by our sales representatives and have substantial experience in our business and, therefore, are particularly important to our company. Although both Messrs. Addison and Williams, as well as our other senior executives, have entered into employment agreements with us, there is no assurance that they will complete the term of their employment agreements or renew them upon expiration.
In addition, the loss of key RVPs for any reason could negatively affect our financial results and could impair our ability to attract new sales representatives. See “— Risks Related to Our Distribution Structure — Our failure to continue to attract new recruits, retain sales representatives or maintain the licensing of our sales representatives would materially adversely affect our business.”
If one of our significant information technology systems fails or if its security is compromised, our business, financial condition and results of operations may be materially adversely affected.
Our business is highly dependent upon the effective operation of our information technology systems, which are centered on a mainframe platform supported by servers
| 56 |
Table of Contents
Index to Financial Statements
housed at our Duluth and Roswell, Georgia sites. We rely on these systems throughout our business for a variety of functions. Our information technology systems run a variety of third-party and proprietary software, including Primerica Online (our website portal to our sales force), our insurance administration system, Virtual Base Shop (our paperless office for RVPs), TurboApps (our point-of-sale data collection tool for product/recruiting applications), our licensing decision and support system and our compensation system.
Despite the implementation of security and back-up measures, our information technology systems may be vulnerable to physical or electronic intrusions, viruses or other attacks, programming errors and similar disruptions. The failure of any one of these systems for any reason could cause significant interruptions to our operations, which could have a material adverse effect on our business, financial condition and results of operations. We retain confidential information in our information technology systems, and we rely on industry standard commercial technologies to maintain the security of those systems. Anyone who is able to circumvent our security measures and penetrate our information technology systems could access, view, misappropriate, alter, or delete information in the systems, including personally identifiable client information and proprietary business information. In addition, an increasing number of jurisdictions require that clients be notified if a security breach results in the disclosure of personally identifiable client information. Any compromise of the security of our information technology systems that results in inappropriate disclosure or use of personally identifiable client information could damage our reputation in the marketplace, deter people from purchasing our products, subject us to significant civil and criminal liability and require us to incur significant technical, legal and other expenses.
In the event of a disaster, our business continuity plan may not be sufficient, which could have a material adverse effect on our business, financial condition and results of operations.
Our infrastructure supports a combination of local and remote recovery solutions for business resumption in the event of a disaster. In the event of either a campus-wide destruction of all buildings or the inability to access our main campus in Duluth, Georgia, our business recovery plan provides for our employees to perform their work functions via a dedicated business recovery site located 25 miles from our main campus, by remote access from an employee’s home or by relocation of employees to our New York or Ontario offices. However, in the event of a full scale local or regional disaster, our business recovery plan may be inadequate, and our employees and sales representatives may be unable to carry out their work, which could have a material adverse effect on our business, financial condition and results of operations.
We may be materially adversely affected by currency fluctuations in the United States dollar versus the Canadian dollar.
In recent periods, exchange rate fluctuations have been significant. A weaker Canadian dollar relative to the U.S. dollar would result in lower levels of reported revenues, net income, assets, liabilities and accumulated other comprehensive income in our U.S. dollar financial statements. We have not historically hedged against this exposure. Significant exchange rate fluctuations between the U.S. dollar and Canadian dollar could have a material adverse effect on our financial condition and results of operations.
| 57 |
Table of Contents
Index to Financial Statements
Risks Related to Our Relationships with Citi and Warburg Pincus
Citi’s continuing significant interest may result in conflicts of interest.
As of December 31, 2010, Citi owned approximately 40% of our outstanding common stock. Citi has agreed to limit its representation on our board of directors to one member. For so long as Citi owns a significant portion of our common stock, Citi may be able to influence the outcome of all corporate actions requiring stockholder approval, including the election of directors. Citi has agreed to vote its shares of our common stock in favor of directors nominated by Warburg Pincus for so long as Warburg Pincus has rights to nominate one or two directors pursuant to the terms of the securities purchase agreement.
Under the provisions of our certificate of incorporation and the intercompany agreement with Citi, the prior consent of Citi will be required in connection with specified corporate actions until Citi ceases to beneficially own shares of our common stock representing 20% or more of the votes entitled to be cast by the holders of our then outstanding common stock.
Because Citi’s interests may differ from those of other stockholders, actions that Citi may take with respect to us may not be as favorable to other stockholders as they are to Citi. Conflicts of interest may arise between us and Citi in a number of areas relating to our past and ongoing relationships.
Citi and its directors and officers will have limited liability for breach of fiduciary duty.
Our certificate of incorporation provides that, subject to any contractual provision to the contrary (including the intercompany agreement), Citi has no obligation to refrain from:
| • | engaging in the same or similar business activities or lines of business as we do; |
| • | doing business with any of our clients or consumers; or |
| • | employing or otherwise engaging any of our officers or employees. |
Under our certificate of incorporation, neither Citi nor any officer or director of Citi, except as provided in our certificate of incorporation, will be liable to us or to our stockholders for breach of any fiduciary duty by reason of any of these activities.
If Citi engages in the same type of business we conduct, our ability to successfully operate and expand our business may be hampered.
Because Citi may engage in the same activities in which we engage (subject to the terms of the intercompany agreement), there is a risk that we may be in direct competition with respect to insurance underwriting or distribution activities. To address these potential conflicts, we have adopted a corporate opportunity policy which is incorporated into our certificate of incorporation.
Due to Citi’s significant resources, including financial resources and name recognition, Citi could have a significant competitive advantage over us should it decide to engage in the type of business we conduct, which may cause our business to be materially adversely affected.
Our historical and pro forma financial data are not necessarily representative of the results we would have achieved as a stand-alone company and may not be a reliable indicator of our future results.
Our historical financial data do not reflect the financial condition, results of operations or cash flows we would have achieved as a stand-alone company during the periods presented or those we will achieve in the future. This is primarily the result of the following factors:
| • | our historical financial data for dates as of or for periods ending on or before March 31, 2010 do not reflect the Transactions; |
| 58 |
Table of Contents
Index to Financial Statements
| • | for dates as of or periods ending on or before March 31, 2010, our historical financial data reflect allocations of corporate expenses from Citi associated with information technology support, treasury, financial reporting, tax administration, human resources administration, legal, procurement and other services that may be lower than the comparable expenses we would have actually incurred as a stand-alone company; |
| • | our cost of debt and our capitalization may be different from that reflected in our historical financial statements for dates as of or for periods ending on or before March 31, 2010; |
| • | we are incurring significant costs as a result of becoming a public company, including costs related to public company reporting, investor relations and compliance with the Sarbanes-Oxley Act of 2002; and |
| • | the initial public offering may materially affect our client and other business relationships, including supplier relationships, and may result in the loss of preferred pricing available by virtue of our relationship with Citi. |
Our financial condition and future results of operations will be materially different from amounts reflected in certain of our financial statements that appear elsewhere in this report. As a result of the Transactions, it may be difficult for investors to compare our future results to historical results or to evaluate our relative performance or trends in our business. For an understanding of pro forma financial statements that give effect to, among other things, the Transactions, see “Pro Forma Financial Statements” in Management’s Discussion and Analysis of Financial Condition and Results of Operations.
If Citi or Warburg Pincus sells significant equity interests in our company to a third party in a private transaction, our stockholders may not realize any change-of-control premium on shares of our common stock that such party may receive and we may become subject to the control of a presently unknown third party.
Each of Citi and Warburg Pincus own a significant equity interest in our company. Each of Citi and Warburg Pincus have the ability, should it choose to do so, to sell some or all of its shares of our common stock in a privately negotiated transaction, which, if sufficient in size, could result in a change of control of our company. The ability of each of Citi and Warburg Pincus to privately sell its shares of our common stock, with no requirement for a concurrent offer to be made to acquire all of the shares of our common stock, could prevent our other stockholders from realizing any change-of-control premium on their shares of our common stock that may otherwise accrue to Citi or Warburg Pincus, as the case may be, upon its private sale of our common stock. Additionally, if Citi or Warburg Pincus privately sells its significant equity interest in our company, we may become subject to the control of a presently unknown third party. Such third party may have conflicts of interest with those of other stockholders. Citi has indicated that it intends to divest its remaining interest in us as soon as is practicable, subject to market and other conditions. Subject to exceptions set forth in the securities purchase agreement, Warburg Pincus has agreed not to transfer pursuant to a public sale the common stock or warrants that it acquires in the private sale or shares of our common stock issued upon exercise of such warrants until the earlier of 18 months after completion of our initial public offering or the reduction of Citi’s beneficial ownership in our outstanding common stock to less than 10%.
| 59 |
Table of Contents
Index to Financial Statements
We are subject to banking regulations that may limit our business activities.
Citi’s relationship and good standing with its regulators are important to the conduct of our business. Citi is a bank holding company and a financial holding company regulated by the FRB under the BHC Act. The BHC Act imposes regulations and requirements on Citi and on any company that the FRB deems to be controlled by Citi. The regulation of Citi and its controlled companies under applicable banking laws is intended primarily for the protection of Citi’s banking subsidiaries, their depositors, the Deposit Insurance Fund of the Federal Deposit Insurance Corporation, and the banking system as a whole, rather than for the protection of stockholders or creditors of Citi or us. Because Citi owns a significant amount of our outstanding common stock, we are currently subject to regulation, supervision, examination and potential enforcement action by the FRB. So long as we are deemed to be controlled by Citi for bank regulatory purposes, we will be subject to regulation by the FRB and to most banking laws, regulations and orders that apply to Citi.
The ownership level at which the FRB would consider us no longer controlled by Citi will depend on the circumstances at that time (such as the extent of our relationships with Citi) and could be less than 5%. For so long as we are subject to the BHC Act, we generally may conduct only activities that are authorized for a financial holding company under the BHC Act, which in some cases are more restrictive than those available to us under applicable insurance regulatory requirements. There are limits on the ability of bank subsidiaries of Citi to extend credit to, or conduct other transactions with, us.
Citi and its subsidiaries are also subject to examination by various banking regulators, which results in examination reports and ratings that may adversely impact the conduct and growth of our businesses. In the United States, Citi is regulated by the Federal Reserve, Office of the Comptroller of the Currency, Office of Thrift Supervision and Federal Deposit Insurance Corporation, and we are regulated by the Federal Reserve. In Canada, we are regulated by OSFI, FINTRAC and FCAC. The FRB has broad enforcement authority over us, including the power to prohibit us from conducting any activity that, in the FRB’s opinion, is unauthorized or constitutes an unsafe or unsound practice in conducting our business. The FRB may also impose substantial fines and other penalties for violations of applicable banking laws, regulations and orders. Pursuant to the intercompany agreement we entered into with Citi, we agreed not to take any action or fail to take any action that would result in Citi being in non-compliance with the BHC Act or any other applicable bank regulatory law, rule, regulation, guidance, order or directive.
In addition, our business in Canada is subject to Bank Act restrictions for so long as Citi has control of us (in fact or in law). In general, these restrictions permit Citi to carry on in Canada those businesses that Canadian banks are permitted to conduct, and permit Citi to control (including by way of control in fact), or to hold a “substantial investment” in (i.e., more than 25% of the equity or, for a corporation, more than 10% of the voting power), those types of Canadian entities that Canadian banks are permitted to control or in which they are permitted to make substantial investments. Such permitted businesses and investments include most, but not all, financial service businesses, certain related businesses and, subject to limits as to size, scope and length of time held, other businesses. Implementing such business ventures may be subject to a requirement to obtain prior regulatory approval, and are subject to regulatory oversight. We may also be subject to other foreign banking laws and supervision that could affect our business, financial condition and results of operations.
Warburg Pincus may be able to exert significant influence over us, which may result in conflicts of interest with us.
As of December 31, 2010, Warburg Pincus owned approximately 23% of our outstanding common stock and has rights to acquire additional shares of our common stock pursuant to its exercise of warrants. Pursuant
| 60 |
Table of Contents
Index to Financial Statements
to and subject to the limitations of the securities purchase agreement, including the ownership limitations, Warburg Pincus has a limited right of first offer to purchase shares of our common stock sold by Citi in the future. Warburg Pincus is entitled to nominate two directors to serve on our board, which could be reduced or lost if Warburg Pincus’ ownership interest in us declines. Citi has agreed to vote its shares of our common stock in favor of the election of Warburg Pincus’ nominees to our board of directors. Furthermore, for as long as Warburg Pincus owns a significant amount of our common stock, Warburg Pincus may be able to influence the outcome of all corporate actions requiring stockholder approval, including the election of directors.
Under the provisions of the securities purchase agreement, the prior consent of Warburg Pincus will be required in connection with specified corporate actions by us. In addition, for so long as it owns a significant amount of our common stock Warburg Pincus will be entitled to preemptive type rights to purchase equity securities issued or proposed to be issued by us, which may limit our ability to access capital from other sources in a timely manner.
Because Warburg Pincus’ interests may differ from yours, actions that Warburg Pincus may take with respect to us may not be as favorable to other stockholders as they are to Warburg Pincus.
| ITEM 2. | PROPERTIES. |
We lease all of our office, warehouse, printing, and distribution properties. Our executive offices and home office for all of our domestic U.S. operations, are located in Duluth, Georgia. The leases for these spaces expire in May 2013 and June 2013. We also lease warehouse, continuation of business and print/distribution space in or around Duluth, Georgia under leases expiring in June 2013, January 2018 and June 2018, respectively.
NBLIC subleases general office space from a subsidiary of Citi under a sublease expiring in August 2014.
In Canada, we lease general office space in Mississauga, Ontario, under a lease expiring in April 2018 and warehouse and printing operation space in Mississauga, Ontario, under a lease expiring in April 2018.
Each of these leased properties is used by each of our operating segments, with the exception of our NBLIC office space and our warehouse, which are not used by our investment and savings products segment.
We also lease additional administrative and processing space in the United States. We believe that our existing facilities are adequate for our current requirements and for our operations in the foreseeable future.
| ITEM 3. | LEGAL PROCEEDINGS. |
The Company is involved from time to time in legal disputes, regulatory inquiries and arbitration proceedings in the normal course of business. These disputes are subject to uncertainties, including the large and/or indeterminate amounts sought in certain of these matters and the inherent unpredictability of litigation. As such, the Company is unable to estimate the possible loss or range of loss that may result from these matters. While it is possible that an adverse outcome in certain cases could have a material adverse effect upon the Company’s financial position, based on information currently known by the Company’s management, in its opinion, the outcomes of such pending investigations and legal proceedings are not likely to have such an effect.
| 61 |
Table of Contents
Index to Financial Statements
| ITEM X. | EXECUTIVE OFFICERS OF THE REGISTRANT. |
The name, age at February 28, 2011 and position of each of our executive officers are presented below.
| Name |
Age |
Position | ||||
| D. Richard Williams |
54 | Chairman of the Board and Co-Chief Executive Officer | ||||
| John A. Addison, Jr. |
53 | Chairman of Primerica Distribution, Co-Chief Executive Officer and Director | ||||
| Jeffrey S. Fendler |
54 | President of Primerica Life | ||||
| William A. Kelly |
55 | President of PFS Investments | ||||
| Gregory C. Pitts |
48 | Executive Vice President and Chief Operating Officer | ||||
| Alison S. Rand |
43 | Executive Vice President and Chief Financial Officer | ||||
| Peter W. Schneider |
54 | Executive Vice President, General Counsel, Corporate Secretary and Chief Administrative Officer | ||||
| Glenn J. Williams |
51 | President | ||||
Set forth below is biographical information concerning our executive officers.
D. Richard Williams was elected to our board in October 2009. He is Chairman of the Board of Directors, has served as our Co-Chief Executive Officer since 1999 and has served our Company since 1989 in various capacities, including as the Chief Financial Officer and Chief Operating Officer of PFS, a general agent and a subsidiary of Primerica. Mr. Williams joined the American Can Company, a manufacturing company and predecessor to Citi, in 1979 and eventually headed the company’s Acquisition and Development area for financial services and was part of the team responsible for the acquisition of Primerica. Mr. Williams earned both his B.S. degree in 1978 and his M.B.A. in 1979 from the Wharton School of the University of Pennsylvania. He serves on the boards of trustees for the Fernbank Museum of Natural History, the Woodruff Arts Center and the Anti-Defamation League Southeast Region.
John A. Addison, Jr. was elected to our board in October 2009. He is the Chairman of Primerica Distribution, has served as our Co-Chief Executive Officer since 1999 and has served our Company in various capacities since 1982 when he joined us as a business systems analyst. Mr. Addison has served in numerous officer roles with Primerica Life, a life insurance underwriter, and PFS, a general agent, both of which are subsidiaries of Primerica. He served as Vice President and Senior Vice President of Primerica Life. He also served as Executive Vice President and Group Executive Vice President of Marketing. In 1995, he became President of PFS and he was promoted to Co-Chief Executive Officer in 1999. Mr. Addison earned his B.A. in economics from the University of Georgia in 1979 and M.B.A. from Georgia State University in 1988.
Jeffrey S. Fendler has served our Company in various capacities since 1980, and has served as President of Primerica Life since 2005. He served in various management roles at Primerica Life from 1989 to 1995 and as President of PFS Investments from 1987 to 1989. Mr. Fendler received a B.A. in economics from Tulane University. Mr. Fendler is a member of Operation Hope’s National Board and is the Chair of Operation Hope’s Southeastern Region Board.
William A. Kelly has served our Company in various capacities since 1985. He has served as President of PFS Investments since 2005 and has overseen Primerica Life Insurance Company of Canada, a subsidiary of Primerica, since 2009. Since 1999, Mr. Kelly has served as an Executive Vice President of Primerica with responsibilities within the Investment and Savings Products segment and compliance and information technology business divisions. He has served as a Senior Vice President of our
| 62 |
Table of Contents
Index to Financial Statements
Field Audit Department from 1993 to 1998 and a Vice President in corporate accounting from 1988 to 1993. Prior to joining our Company, Mr. Kelly was a certified public accountant. Mr. Kelly graduated from the University of Georgia in 1979 with a B.B.A. in accounting.
Gregory C. Pitts has served our Company in various capacities since 1985. He was named our Chief Operating Officer in December 2009 and has served as Chief Executive Officer of Primerica Mortgages, a mortgage loan broker and a subsidiary of Primerica, since 2005. Mr. Pitts served as Executive Vice President of Primerica from 1995 to 2009, with responsibilities within the Term Life Insurance, Investment and Savings Products segments and information technology division. Mr. Pitts earned his B.A. in general business from the University of Arkansas in 1985.
Alison S. Rand has served our Company in various capacities since 1995. She has served as our Executive Vice President and Chief Financial Officer since 2000, as Senior Vice President from 1999 to 2000, Vice President from 1997 to 1999 and the Director of Financial Reporting from 1995 to 1997. Prior to 1995, Ms. Rand worked in the audit department of KPMG LLP. Ms. Rand earned her B.S. in accounting from the University of Florida in 1990 and is a certified public accountant. She is an advisory board member of Imagine it!, the Children’s Museum of Atlanta and Emerge and is a Board member of the Georgia Council of Economic Education. She is also a Vice Chair of the Talent Development Program Trustee Council of the Atlanta Symphony Orchestra and serves on the Terry College of Business Executive Education CFO Roundtable.
Peter W. Schneider has served as our Executive Vice President and General Counsel since 2000. He also serves as our Corporate Secretary and Chief Administrative Officer. He worked at the law firm of Rogers & Hardin as a partner from 1988 to 2000 and as an associate from 1984 to 1988, and at the law firm of Paul, Rifkind, Wharton & Garrison from 1981 to 1984. Mr. Schneider earned both his B.S. in political science and industrial relations in 1978 and J.D. in 1981 from the University of North Carolina at Chapel Hill. Mr. Schneider serves on the boards of directors of the Georgia Chamber of Commerce, the Northwest YMCA and the Carolina Center for Jewish Studies.
Glenn J. Williams has served our Company in various capacities since 1983. He has served as our Executive Vice President since 2000 and President since 2005. Mr. Williams served as the President and Chief Executive Officer of Primerica Financial Services (Canada), Ltd., a financial services company and a subsidiary of Primerica, from 1996 to 2000, Executive Vice President from 1995 to 1996, Senior Vice President from 1994 to 1995 and Vice President from 1985 to 1994. He worked with us as a sales representative in 1981 to 1983. Mr. Williams earned his B.S. in education from Baptist University of America in 1981. Mr. Williams serves in leadership roles at Hebron Baptist Church and Hebron Christian Academy.
| 63 |
Table of Contents
Index to Financial Statements
ITEM 5. MARKET FOR REGISTRANT’S COMMON EQUITY, RELATED STOCKHOLDER MATTERS AND ISSUER PURCHASES OF EQUITY SECURITIES
Quarterly Common Stock Prices and Dividends
Our common stock is principally traded on the New York Stock Exchange under the symbol PRI. The quarterly high and low sales prices for our common stock, as reported on the NYSE for the periods since the Offering on April 1, 2010, as well as dividends paid per quarter were as follows:
| High | Low | Dividends | ||||||||||
| 2010 |
||||||||||||
| 4th quarter |
$ | 25.48 | $ | 20.30 | $ | 0.01 | ||||||
| 3rd quarter |
23.78 | 19.74 | 0.01 | |||||||||
| 2nd quarter |
25.89 | 18.61 | n/a | |||||||||
Dividends
We paid dividends to Citi of $3.49 billion in 2010, all in connection with the Transactions. Prior to completion of the Offering, we distributed all of the issued and outstanding capital stock of Prime Re to Citi. Following the Offering, we also paid quarterly dividends to stockholders totaling approximately $1.5 million in 2010. During 2009, we declared dividends to Citi of $205.4 million.
We currently expect to continue to pay quarterly cash dividends to holders of our common stock, subject to the discretion of our board of directors and dependent on a variety of factors, including our financial condition, earnings, legal requirements and other factors that the board of directors deems relevant. Our payment of cash dividends is at the discretion of our board of directors in accordance with applicable law after taking into account various factors, including our financial condition, operating results, current and anticipated cash needs and plans for growth. Under Delaware law, we can only pay dividends either out of surplus, which is defined as total assets at fair market value minus total liabilities, minus the aggregate par value of our outstanding stock, or out of the current or the immediately preceding year’s earnings. Therefore, no assurance is given that we will continue to pay any dividends to our common stockholders, or as to the amount of any such dividends.
We are a holding company, and we have no operations. Our primary asset is the capital stock of our operating subsidiaries and our primary liability is the $300.0 million promissory note held by Citi. The states in which our U.S. insurance subsidiaries are domiciled impose certain restrictions on our insurance subsidiaries’ ability to pay dividends to us. These restrictions are based in part on the prior year’s statutory income and surplus. In general, dividends up to specified levels are considered ordinary and may be paid without prior approval. Dividends in larger amounts are considered extraordinary and are subject to approval by the insurance commissioner of the state of domicile. Our Canadian subsidiary can pay dividends subject to meeting regulatory requirements for capital adequacy and liquidity with appropriate minimum notice to OSFI. In addition, in the future, we may become subject to debt instruments or other agreements that limit our ability to pay dividends. See “Business — Regulation of Insurance Products — Insurance Holding Company Regulation; Limitations on Dividends.”
Holders
As of February 28, 2011, we had 34 holders of record of our common stock.
Issuer Purchases of Equity Securities
During the three months ended December 31, 2010, we did not repurchase any shares of our common stock.
| 64 |
Table of Contents
Index to Financial Statements
Securities Authorized for Issuance
under Equity Compensation Plans
We have two compensation plans under which our equity securities are authorized for issuance. The Primerica, Inc. 2010 Omnibus Incentive Plan and the Primerica, Inc. Stock Purchase Plan for Agents and Employees were approved by our sole stockholder in March 2010. The following table sets forth certain information relating to these equity compensation plans at December 31, 2010.
| Number of securities to be issued upon exercise of outstanding options, warrants and rights |
Weighted average exercise price of outstanding options, warrants and rights |
Number of securities remaining available for future issuance |
||||||||||
| Equity compensation plans approved by stockholders: |
||||||||||||
| Primerica, Inc. 2010 Omnibus Incentive Plan |
2,656,577 | (1) | — | (2) | 3,401,141 | (3) | ||||||
| Primerica, Inc. Stock Purchase Plan for Agents and Employees |
— | — | 2,419,633 | (4) | ||||||||
| Total |
2,656,577 | — | 5,820,774 | |||||||||
| Equity compensation plans not approved by stockholders |
n/a | n/a | n/a | |||||||||
| (1) | Consists of shares to be issued in connection with outstanding restricted stock units (“RSUs”). |
| (2) | The only securities outstanding under the plan are RSUs. |
| (3) | The number of shares available for future issuance is 8,800,000 less the cumulative number of awards granted under the plan plus the cumulative number of awards cancelled under the plan. |
| (4) | The number of shares available for future issuance is 2,500,000 less the cumulative number of shares issued under the plan. |
| 65 |
Table of Contents
Index to Financial Statements
Stock Performance Table
The following graph compares the performance of Primerica, Inc.’s common stock since the Offering to the Russell 2000 Index and the Standard & Poor’s Insurance Index (S&P Insurance Index) by assuming $100 was invested in each investment option as of April 1, 2010, the date of the Offering. The Russell 2000 Index measures the performance of the small-cap segment in the United States. The S&P Insurance Index is a capitalization-weighted index of domestic equities traded on the New York Stock Exchange and NASDAQ.
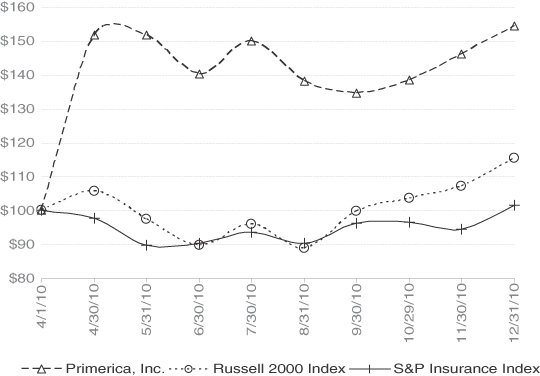
| 66 |
Table of Contents
Index to Financial Statements
| ITEM 6. | SELECTED FINANCIAL DATA. |
The selected financial data should be read in conjunction with the section entitled “Management’s Discussion and Analysis of Financial Condition and Results of Operations” and the consolidated and combined financial statements and accompanying notes included elsewhere in this report.
The selected historical income statement data may not be indicative of the revenues and expenses that would have existed or resulted if we had operated independently of Citi. Similarly, the selected historical balance sheet data as of and prior to December 31, 2009 may not be indicative of the assets and liabilities that would have existed or resulted if we had operated independently of Citi. The selected historical financial data are not necessarily indicative of the financial position or results of operations as of any future date or for any future period.
The Transactions have and will continue to result in financial performance that is materially different from that reflected in the historical financial data that appear elsewhere in this report. Due to the timing of the Transactions and their impact on our financial position and results of operations, year-over-year comparisons of our financial position and results of operations will reflect significant non-comparable accounting transactions and account balances. For a description of the Transactions and the timing of their implementation, see “Management’s Discussion and Analysis of Financial Condition and Results of Operations — The Transactions.”
| Year ended December 31, | ||||||||||||||||||||
| 2010 | 2009 | 2008 (1) | 2007 | 2006 | ||||||||||||||||
| (In thousands, except per-share amounts) | ||||||||||||||||||||
| Statements of income data |
||||||||||||||||||||
| Revenues: |
||||||||||||||||||||
| Direct premiums |
$ | 2,181,074 | $ | 2,112,781 | $ | 2,092,792 | $ | 2,003,595 | $ | 1,898,419 | ||||||||||
| Ceded premiums |
(1,450,367 | ) | (610,754 | ) | (629,074 | ) | (535,833 | ) | (496,061 | ) | ||||||||||
| Net premiums |
730,707 | 1,502,027 | 1,463,718 | 1,467,762 | 1,402,358 | |||||||||||||||
| Net investment income |
165,111 | 351,326 | 314,035 | 328,609 | 318,853 | |||||||||||||||
| Commissions and fees |
382,940 | 335,986 | 466,484 | 545,584 | 486,145 | |||||||||||||||
| Realized investment gains (losses) |
34,145 | (21,970 | ) | (103,480 | ) | 6,527 | 8,746 | |||||||||||||
| Other, net |
48,960 | 53,032 | 56,187 | 41,856 | 37,962 | |||||||||||||||
| Total revenues |
1,361,863 | 2,220,401 | 2,196,944 | 2,390,338 | 2,254,064 | |||||||||||||||
| Benefits and expenses: |
||||||||||||||||||||
| Benefits and claims |
317,703 | 600,273 | 938,370 | 557,422 | 544,556 | |||||||||||||||
| Amortization of deferred policy acquisition costs |
168,035 | 381,291 | 144,490 | 321,060 | 284,787 | |||||||||||||||
| Insurance commissions |
19,904 | 34,388 | 23,932 | 28,003 | 26,171 | |||||||||||||||
| Insurance expenses |
75,503 | 148,760 | 141,331 | 137,526 | 126,843 | |||||||||||||||
| Sales commissions |
179,924 | 162,756 | 248,020 | 296,521 | 265,662 | |||||||||||||||
| Interest expense |
20,872 | — | — | — | — | |||||||||||||||
| Goodwill impairment |
— | — | 194,992 | — | — | |||||||||||||||
| Other operating expenses |
180,779 | 132,978 | 152,773 | 136,634 | 127,849 | |||||||||||||||
| Total benefits and expenses |
962,720 | 1,460,446 | 1,843,908 | 1,477,166 | 1,375,868 | |||||||||||||||
| Income before income taxes |
399,143 | 759,955 | 353,036 | 913,172 | 878,196 | |||||||||||||||
| Income taxes |
141,365 | 265,366 | 185,354 | 319,538 | 276,244 | |||||||||||||||
| Net income |
$ | 257,778 | $ | 494,589 | $ | 167,682 | $ | 593,634 | $ | 601,952 | ||||||||||
| Earnings per share — basic (2) |
$ | 3.43 | n/a | n/a | n/a | n/a | ||||||||||||||
| Earnings per share — diluted (2) |
$ | 3.40 | n/a | n/a | n/a | n/a | ||||||||||||||
| Dividends per common share |
$ | .02 | n/a | n/a | n/a | n/a | ||||||||||||||
| 67 |
Table of Contents
Index to Financial Statements
| December 31, | ||||||||||||||||||||
| 2010 | 2009(3) | 2008(1)(3) | 2007(3) | 2006(3) | ||||||||||||||||
| (In thousands) | ||||||||||||||||||||
| Balance sheet data |
||||||||||||||||||||
| Investments |
$ | 2,153,584 | $ | 6,471,448 | $ | 5,355,458 | $ | 5,494,495 | $ | 5,583,813 | ||||||||||
| Cash and cash equivalents |
126,038 | 602,522 | 302,354 | 625,350 | 239,103 | |||||||||||||||
| Due from reinsurers |
3,731,634 | 867,242 | 838,906 | 831,942 | 825,031 | |||||||||||||||
| Deferred policy acquisition costs, net |
853,211 | 2,789,905 | 2,727,422 | 2,510,045 | 2,408,444 | |||||||||||||||
| Total assets |
9,884,306 | 13,715,144 | 11,515,027 | 13,015,411 | 11,604,421 | |||||||||||||||
| Future policy benefits |
4,409,183 | 4,197,454 | 4,023,009 | 3,650,192 | 3,616,930 | |||||||||||||||
| Note payable |
300,000 | — | — | — | — | |||||||||||||||
| Total liabilities |
8,452,814 | 8,771,371 | 7,403,041 | 8,235,446 | 7,120,956 | |||||||||||||||
| Stockholders’ equity |
1,431,492 | 4,943,773 | 4,111,986 | 4,779,965 | 4,483,465 | |||||||||||||||
| (1) | Includes a $191.7 million pre-tax charge due to a change in our deferred policy acquisition costs and reserve estimation approach implemented as of December 31, 2008. |
| (2) | Calculated on a pro forma basis using weighted-average shares, including the shares following our April 1, 2010 corporate reorganization as though they had been issued and outstanding on January 1, 2010. |
| (3) | Total assets and total liabilities have been adjusted to reflect the immaterial error correction relating to our securities lending program. |
ITEM 7. MANAGEMENT’S DISCUSSION AND ANALYSIS OF FINANCIAL CONDITION AND RESULTS OF OPERATIONS.
Management’s Discussion and Analysis of Financial Condition and Results of Operations (“MD&A”) is intended to inform the reader about matters affecting the financial condition and results of operations of Primerica, Inc. (the “Parent Company”) and its subsidiaries (collectively, the “Company”) for the three-year period ended December 31, 2010. As a result, the following discussion should be read in conjunction with the audited consolidated and combined financial statements and notes that are included herein. This discussion contains forward-looking statements that constitute our plans, estimates and beliefs. These forward-looking statements involve numerous risks and uncertainties, including those discussed in “Risk Factors.” Actual results may differ materially from those contained in any forward-looking statements.
This MD&A is divided into the following sections:
| • | The Transactions |
| • | Business Trends and Conditions |
| • | Factors Affecting Our Results |
| • | Critical Accounting Estimates |
| • | Results of Operations |
| • | Financial Condition |
| • | Liquidity and Capital Resources |
| • | Quantitative and Qualitative Disclosures about Market Risk |
THE TRANSACTIONS
We refer to the corporate reorganization, the reinsurance transactions, the concurrent transactions and the private sale described below collectively as the “Transactions.” We believe the Transactions gave us the opportunity to fold our years of experience, expertise and innovation into an organization with a more streamlined balance sheet.
The corporate reorganization. We were incorporated in Delaware in October 2009 by Citigroup Inc. (“Citi”) to serve as a holding company for the life insurance and financial product distribution businesses that we have operated for more than 30 years. At such time, we issued 100 shares of common stock to Citi. These businesses, which prior to April 1, 2010, were wholly owned indirect subsidiaries of Citi, were transferred to us in a reorganization
| 68 |
Table of Contents
Index to Financial Statements
pursuant to which we issued to a wholly owned subsidiary of Citi (i) 74,999,900 shares of our common stock (of which 24,564,000 shares of common stock were subsequently sold by Citi in our initial public offering completed in April 2010; 16,412,440 shares of common stock were subsequently sold by Citi in mid-April 2010 to private equity funds managed by Warburg Pincus LLC (“Warburg Pincus”) for a purchase price of $230.0 million (the “private sale”); and 5,021,412 shares of common stock were immediately contributed back to us for equity awards granted to our employees and sales force leaders in connection with our initial public offering), (ii) warrants to purchase from us an aggregate of 4,103,110 shares of our common stock (which were transferred by Citi to Warburg Pincus pursuant to the private sale), and (iii) a $300.0 million note payable due on March 31, 2015 bearing interest at an annual rate of 5.5% (the “Citi note”). Prior to April 1, 2010, we had no material assets or liabilities. Upon completion of the Transactions, our primary asset is the capital stock of our operating subsidiaries and our primary liability is the Citi note.
The reinsurance transactions. In March 2010, we entered into coinsurance agreements (the “Citi reinsurance agreements”) with two affiliates of Citi and Prime Re, then a wholly owned subsidiary of Primerica Life, (collectively the “Citi reinsurers”). We refer to the execution of these agreements as the “Citi reinsurance transactions.” Under these agreements, we ceded between 80% and 90% of the risks and rewards of our term life insurance policies that were in force at year-end 2009. We also transferred to the Citi reinsurers the account balances in respect of the coinsured policies and approximately $4.0 billion of assets to support the statutory liabilities assumed by the Citi reinsurers, and we distributed to Citi all of the issued and outstanding common stock of Prime Re. As a result, the Citi reinsurance transactions reduced the amount of our capital and substantially reduced our insurance exposure. We retained our operating platform and infrastructure and continue to administer all policies subject to these coinsurance agreements.
The concurrent transactions. During the first quarter of 2010, we declared distributions to Citi of approximately $703 million. We also recognized the income attributable to the policies underlying the Citi reinsurance transactions as well as the income earned on the invested assets backing the reinsurance balances and the extraordinary dividends declared in the first quarter. These items were reflected in the statement of income for the three months ended March 31, 2010. Furthermore, because the Citi reinsurance transactions were given retroactive effect back to January 1, 2010, we recognized a return of capital on our balance sheet for the income earned on the reinsured policies during the three months ended March 31, 2010.
In April 2010, we completed the following additional concurrent transactions:
| • | we completed an initial public offering of our common stock by Citi (the “Offering”) pursuant to the Securities Act of 1933 and our stock began trading under the ticker symbol “PRI” on the New York Stock Exchange; |
| • | we issued equity awards for 5,021,412 shares of our common stock to certain of our employees, including our officers, and certain of our sales force leaders, including 221,412 shares which were issued upon conversion of existing equity awards in Citi shares that had not yet fully vested; and |
| • | Citi accelerated vesting of certain existing Citi equity awards triggered by the Offering and the private sale. |
Additionally, we made elections with an effective date of April 1, 2010 under Section 338(h)(10) of the Internal Revenue Code (the “Section 338(h)(10) elections”), which resulted in reductions to stockholders’ equity of $172.5 million and corresponding adjustments to deferred tax balances.
During the first quarter of 2010, our federal income tax return was included as part of Citi’s consolidated federal income tax return. On March 30, 2010, in anticipation of our corporate reorganization, we entered into a tax separation agreement with Citi. In accordance with the tax separation agreement, Citi will be
| 69 |
Table of Contents
Index to Financial Statements
responsible for and shall indemnify and hold the Company harmless from and against any consolidated, combined, affiliated, unitary or similar federal, state or local income tax liability with respect to the Company for any taxable period ending on or before April 7, 2010, the closing date of the Offering.
The private sale. In February 2010, Citi entered into a securities purchase agreement with Warburg Pincus and us pursuant to which, in mid-April 2010, Citi sold to Warburg Pincus 16,412,440 shares of our common stock and warrants to purchase from us 4,103,110 additional shares of our common stock. The warrants have a seven-year term and an exercise price of $18.00 per share.
Period-over-period comparability. Due to the timing of these transactions and their impact on our financial position and results of operations, period-over-period comparisons of our financial position and results of operations will reflect significant non-comparable accounting transactions and account balances. The most significant accounting transaction was the reinsurance transactions described above, which affected both the size and composition of our balance sheet and statement of income. Additionally, the corporate reorganization and the concurrent transactions had a significant impact on the composition of our balance sheet. As a result, our December 31, 2010 balance sheet was significantly smaller than our December 31, 2009 balance sheet and our statement of income for the year ended December 31, 2010 presents income that is significantly lower than in 2009 and 2008.
From a balance sheet perspective, the Transactions impacted investments, cash and cash equivalents, accrued investment income, premiums and other receivables, due from reinsurers, due from affiliates, deferred policy acquisition costs (DAC), deferred tax assets, note payable, deferred tax liabilities, other liabilities, common stock, paid-in capital, retained earnings and accumulated other comprehensive income.
From a statement of income perspective, the Transactions impacted ceded premiums, net premiums, net investment income, benefits and claims, amortization of DAC, insurance commissions, insurance expenses, interest expense and income taxes. Actual results for periods ended prior to April 1, 2010 will not be indicative of or comparable to future actual results. Furthermore, actual results for the year ended December 31, 2010 will not be comparable to results in future years as they are affected by the inclusion of three months of operations prior to the Transactions. Actual results for the years ended December 31, 2009 and 2008, will not be comparable to results in future years as they reflect operations prior to the Transactions.
BUSINESS TRENDS AND CONDITIONS
The relative strength and stability of financial markets and economies in the United States and Canada affect our growth and profitability. Our business is, and we expect will continue to be, influenced by a number of industry-wide and product-specific trends and conditions.
Economic conditions, including high unemployment levels and low levels of consumer confidence, influence investment and spending decisions by middle income consumers, who are generally our primary clients. These conditions and factors also impact prospective recruits’ perceptions of the business opportunity that becoming a Primerica sales representative offers, which can drive or dampen recruiting. Consumer spending and borrowing levels remain under pressure, as consumers take a more conservative financial posture including reevaluating their savings and debt management plans. As overall market and economic conditions have improved from the lows experienced during the recent economic downturn, sales and the value of consumer investment products across a wide spectrum of asset classes have improved. The effects of these trends and conditions on our 2010 operations are summarized below.
Recruiting and Sales Representatives
For the year ended December 31, 2010, recruiting increased to 231,390 new recruits from 221,920 in 2009, largely due to the
| 70 |
Table of Contents
Index to Financial Statements
recruiting boost we experienced in the second quarter of 2010 as a result of enthusiasm generated by our initial public offering. The size of our life-licensed sales force declined to 94,850 sales representatives as of December 31, 2010 from 99,785 sales representatives at December 31, 2009 as licensing and non-renewals experienced downward pressure in the difficult economic environment.
Term Life Insurance Product Sales
Sales of our term life insurance products have declined in line with term life insurance industry trends and with the year-over-year decline in the size of our sales force noted above. We issued 223,514 new policies in 2010, compared with 233,837 new policies in 2009.
Term Life Insurance Face Amount In Force
Total face amount in force increased to $656.79 billion as of December 31, 2010, compared with $650.20 billion a year ago. Persistency has improved versus prior years, but is still below historical norms. The average face amount for newly issued policies was $267,000 in 2010, compared with $282,100 in 2009. The increase in total face in force was largely due to the stronger Canadian dollar and improved persistency. These drivers were partially offset by a decline in the average face amount of our newly issued policies.
Investment and Savings Product Sales
Investment and savings products sales were higher in 2010, totaling $3.62 billion, compared with $3.01 billion in 2009. We believe the increase in sales reflects the demand for our products as a result of improving financial market conditions.
Asset Values in Client Accounts
The assets in our clients’ accounts are invested in diversified funds comprised mainly of U.S. and Canadian equity and fixed-income securities. The average value of assets in client accounts in 2010 increased to $31.91 billion, from $26.85 billion in 2009 primarily as a result of general market conditions, which have continued to improve since the second half of 2009, and client demand for our products during 2010.
Invested Asset Portfolio Size and Yields
Our portfolio continues to reflect strong market value gains as interest rates and spreads continue to remain below recent historical levels. As of December 31, 2010, our invested assets, excluding policy loans and cash, had a cost or amortized cost basis of $1.95 billion and a net unrealized gain of $157.4 million, compared with $6.20 billion at cost or amortized cost and net unrealized gain of $243.5 million at December 31, 2009. Our portfolio during the last nine months of 2010 was substantially smaller than our December 31, 2009 portfolio and was composed of a different mix of invested assets primarily due to our corporate reorganization (see The Transactions section above, the Investments section included in the Financial Condition discussion below and Note 4 to our consolidated and combined financial statements). Net investment income was $165.1 million in 2010, compared with $351.3 million in 2009. On a pro forma basis, after giving effect to the Transactions, net investment income declined to $110.4 million in 2010, from $118.3 in 2009 largely due to a lower interest rate environment in 2010 (see the Pro Forma Results section in the Results of Operations discussion below).
FACTORS AFFECTING OUR RESULTS
Term Life Insurance Segment
Our Term Life Insurance segment results are primarily driven by sales, accuracy of our pricing assumptions, reinsurance, investment income and expenses.
Sales and policies in force. Sales of new term policies and the size and characteristics of our in-force book of policies are vital to our results over the long term. Premium revenue is recognized as it is earned over the term of the
| 71 |
Table of Contents
Index to Financial Statements
policy and acquisition expenses are generally deferred and amortized ratably with the level premiums of the underlying policies. However, because we incur significant cash outflows at or about the time policies are issued, including the payment of sales commissions and underwriting costs, changes in life insurance sales volume will have a more immediate effect on our cash flows.
Historically, we have found that while sales volume of term life insurance products between any given fiscal periods may vary based on a variety of factors, the productivity of our individual sales representatives remains within a relatively narrow range and, consequently, our sales volume over the longer term generally correlates to the size of our sales force.
The average number of licensed term life insurance sales representatives and the number of term life insurance policies issued, as well as the average monthly rate of new policies issued per licensed sales representative were as follows:
| Year ended December 31, | ||||||||||||
| 2010 | 2009 | 2008 | ||||||||||
| Average number of life-licensed insurance sales representatives |
96,840 | 100,569 | 99,361 | |||||||||
| Number of new policies issued |
223,514 | 233,837 | 241,173 | |||||||||
| Average monthly rate of new policies issued per licensed sales representative |
0.19x | 0.19x | 0.20x | |||||||||
Our ability to increase the size of our sales force is largely based on the success of our recruiting efforts and our ability to train and motivate recruits to obtain licenses to sell life insurance. We believe that recruitment levels are an important advance indicator of sales force trends, and growth in recruiting is usually indicative of future growth in the overall size of the sales force. However, because new recruits may not obtain the requisite licenses, recruiting results do not always result in proportionate increases in the size of our licensed sales force.
Pricing assumptions. Our pricing methodology is intended to provide us with appropriate profit margins for the risks we assume. We determine pricing classifications based on the coverage sought, such as the size and term of the policy, and certain policyholder attributes, such as age and health. In addition, we utilize unisex rates for our term life insurance policies. The pricing assumptions that underlie our rates are based upon our best estimates of mortality, persistency and investment yield rates at the time of issuance, sales force commission rates, issue and underwriting expenses, operating expenses and the characteristics of the insureds, including sex, age, underwriting class, product and amount of coverage. Our results will be affected to the extent there is a variance between our pricing assumptions and actual experience.
| • | Persistency. We use historical experience to estimate pricing assumptions for persistency rates. Persistency is a measure of how long our insurance policies stay in force. As a general matter, persistency that is lower than our pricing assumptions adversely affects our results over the long term because we lose the recurring revenue stream associated with the policies that lapse. Determining the near- term effects of changes in persistency is more complicated. When persistency is lower than our pricing assumptions, we must accelerate the amortization of DAC. The resultant increase in amortization expense isoffset by a corresponding release of reserves associated with lapsed policies, which causes a reduction in benefits and claims expense. The reserves associated with any given policy will change over the term of such policy. As a general matter, reserves are lowest at the inception of a policy term and rise steadily to a peak before declining to zero at the expiration of the policy term. Accordingly, depending on when the lapse occurs in relation to the overall policy term, the reduction in benefits and claims expense may be greater or less than the increase in amortization expense and, consequently, the effects on earnings for a given period could be positive or negative. Persistency levels are meaningful to our results to the extent actual experience deviates from the persistency assumptions used to price our products. |
| 72 |
Table of Contents
Index to Financial Statements
| • | Mortality. We use historical experience to estimate pricing assumptions for mortality. Our profitability is affected to the extent actual mortality rates differ from those used in our pricing assumptions. We mitigate a significant portion of our mortality exposure through reinsurance. Variances between actual mortality experience and the assumptions and estimates used by our reinsurers affect the cost and potentially the availability of reinsurance. |
| • | Investment Yields. We generally use a level investment yield rate which reflects yields currently available. Both the DAC asset and the reserve liability increase with the assumed investment yield rate. Since the DAC asset is higher than the reserve liability in the early years of a policy, a lower assumed investment yield will result in lower profits. In the later years, when the reserve liability is higher than the DAC asset, a lower assumed investment yield will result in higher profits. Actual investment yields will impact the net investment income allocated to the Term Life Insurance segment, but will not impact the DAC asset or reserve liability. |
Reinsurance. We use reinsurance extensively, which has a significant effect on our results of operations. In evaluating our comparative results, it is important to understand and consider the relative levels and mix of reinsurance treaties in effect during each of the comparative periods. As of December 31, 2010, the percentage of reinsured life insurance in force was 90.7%, compared with 64.5% a year ago. The significant increase in reinsured life insurance was primarily a result of the Citi reinsurance transactions.
Since the mid-1990s, we have reinsured between 60% and 90% of the mortality risk on our U.S. term life insurance policies on a YRT basis. We have not generally reinsured the mortality risk on Canadian term life insurance polices. YRT reinsurance permits us to fix future mortality exposure at contractual rates by policy class. To the extent actual mortality experience is more or less favorable than the contractual rate, the reinsurer will earn incremental profits or bear the incremental cost, as applicable. In contrast to coinsurance, which is intended to eliminate all risks (other than counterparty risk of the reinsurer) and rewards associated with a specified percentage of the block of policies subject to the reinsurance arrangement, the YRT reinsurance arrangements we enter into are intended only to reduce volatility associated with variances between estimated and actual mortality rates.
On March 31, 2010, we entered into various reinsurance agreements with the Citi reinsurers to reinsure our term life insurance policies that were in force at year-end 2009 as part of our corporate reorganization.
We may alter our reinsurance practices at any time due to the unavailability of YRT reinsurance at attractive rates or the availability of alternatives to reduce our risk exposure. We expect to continue to use YRT reinsurance at or near historical levels.
The effect of our reinsurance arrangements on ceded premiums and benefits and claims on our statement of income follows:
| • | Ceded premiums. Ceded premiums are the premiums we pay to reinsurers. These amounts are deducted from the direct premiums we earn to calculate our net premium revenues. Similar to direct premium revenues, ceded coinsurance premiums remain level over the initial term of the insurance policy. Ceded YRT premiums increase over the period that the policy has been in force. Accordingly, ceded YRT premiums generally constitute an increasing percentage of direct premiums over the policy term. |
| • | Benefits and claims. Benefits and claims include incurred claim amounts and changes in future policy benefit reserves. Reinsurance reduces incurred claims in direct proportion to the percentage ceded. |
| • | Amortization of DAC. Amortization of DAC is reduced on a pro-rata basis for the business coinsured with Citi. There is no impact on amortization of DAC associated with our YRT contracts. |
| 73 |
Table of Contents
Index to Financial Statements
| • | Acquisition and operating expenses. Acquisition and operating expenses are reduced by the allowances received from coinsurance, including the business reinsured with Citi. |
We presently intend to continue ceding approximately 90% of our U.S. mortality risk other than the Citi reinsurance transactions.
Allocated net investment income. Term Life Insurance segment net investment income is composed of two elements: allocated net investment income and the market return associated with the deposit asset underlying the 10% reinsurance agreement we executed in connection with the Transactions. We allocate net investment income based on the book value of the invested assets allocated to the Term Life Insurance segment compared to the book value of the Company’s total invested assets. Net investment income is also impacted by the performance of our invested asset portfolio and the market return on the deposit asset which can be affected by interest rates, credit spreads and the mix of invested assets.
Expenses. Results are also affected by variances in client acquisition, maintenance and administration expense levels.
Investment and Savings Products Segment
Our Investment and Savings Products segment results are primarily driven by sales, the value of assets in client accounts for which we earn ongoing service and distribution fees and the number of fee generating accounts we administer.
Sales. We earn commissions and fees, such as dealer re-allowances, and marketing and support fees, based on sales of mutual fund products and annuities. Sales of investment and savings products are influenced by the overall demand for investment products in the United States and Canada, as well as by the size and productivity of our sales force. We generally experience seasonality in our Investment and Savings Products segment results due to our high concentration of sales of retirement account products. These accounts are typically funded in February through April, coincident with the tax return preparation season. While we believe the size of our sales force is a factor in driving sales volume in this segment, there are a number of other variables, such as economic and market conditions that may have a significantly greater effect on sales volume in any given fiscal period.
Asset values in client accounts. We earn marketing and distribution fees (trail commissions or, with respect to U.S. mutual funds, 12b-1 fees) on mutual fund, annuity and segregated funds products based on asset values in client accounts. Our investment and savings products primarily consist of funds composed of equity securities. Asset values are influenced by new product sales, ongoing contributions to existing accounts, redemptions and changes in equity markets, net of expenses.
Accounts. We earn recordkeeping fees for administrative functions we perform on behalf of several of our mutual fund providers and custodial fees for services as a non-bank custodian for certain of our mutual fund clients’ retirement plan accounts.
Sales mix. While our investment and savings products all have similar long-term earnings characteristics, our results in a given fiscal period will be affected by changes in the overall mix of products within these broad categories. Examples of changes in the sales mix that influence our results include the following:
| • | sales of a higher proportion of mutual fund products of the several mutual fund families for which we act as recordkeeper will generally increase our earnings because we are entitled to recordkeeping fees on these accounts; |
| • | sales of variable annuity products in the United States will generate higher revenues in the period such sales occur than sales of other investment products that either generate lower upfront revenues or, in the case of segregated funds, no upfront revenues; |
| • | sales and administration of a higher proportion of mutual funds that enable us to earn marketing and support fees will increase our revenues and profitability; and |
| 74 |
Table of Contents
Index to Financial Statements
| • | sales of a higher proportion of retirement products of several mutual fund families |
| will tend to result in higher revenue generation due to our ability to earn custodial fees on these accounts. |
The product sales that generate sales-based
revenues, average account values of accounts that generate account-based revenue and the average number of fee-generating accounts that generate account-based revenues were as follows:
| Yearended December 31, | ||||||||||||
| 2010 | 2009 | 2008 | ||||||||||
| (Dollars in millions and accounts in thousands) |
||||||||||||
| Product sales: |
||||||||||||
| Mutual funds |
$ | 2,140.9 | $ | 1,821.0 | $ | 2,809.0 | ||||||
| Annuities and other |
1,169.2 | 922.6 | 1,157.4 | |||||||||
| Total sales-based revenue generating product sales |
3,310.1 | 2,743.6 | 3,966.4 | |||||||||
| Segregated funds |
313.5 | 263.1 | 492.0 | |||||||||
| Total product sales (1) |
$ | 3,623.6 | $ | 3,006.6 | $ | 4,458.4 | ||||||
| Average asset values in client accounts: |
||||||||||||
| Mutual funds |
$ | 22,614 | $ | 19,329 | $ | 24,301 | ||||||
| Annuities and other |
7,095 | 5,727 | 6,492 | |||||||||
| Segregated funds |
2,199 | 1,790 | 1,970 | |||||||||
| Total average asset values in client accounts (1) |
$ | 31,908 | $ | 26,845 | $ | 32,763 | ||||||
| Average number of fee-generating accounts: |
||||||||||||
| Recordkeeping accounts |
2,728 | 2,838 | 3,083 | |||||||||
| Custodial accounts |
1,990 | 2,057 | 2,224 | |||||||||
| (1) | Totals may not add due to rounding. |
Sales commissions. Results are also affected by the compensation our sales representatives receive for the sale of sales-based products and for asset values in their clients’ accounts.
The production noted above translated into commissions and fees revenue as follows:
| Year ended December 31, | ||||||||||||
| 2010 | 2009 | 2008 | ||||||||||
| (In thousands) | ||||||||||||
| Commissions and fees revenue: |
||||||||||||
| Sales-based |
$ | 142,605 | $ | 118,798 | $ | 168,614 | ||||||
| Asset-based |
167,473 | 127,581 | 158,934 | |||||||||
| Account-based |
41,690 | 43,247 | 47,243 | |||||||||
| Total commissions and fees |
$ | 351,768 | $ | 289,626 | $ | 374,791 | ||||||
Corporate and Other Distributed Products Segment
We earn revenues and pay commissions and referral fees from the distribution of loan products, various other insurance products,prepaid legal services and other products, all of which are originated by third parties. Our New York life insurance subsidiary,NBLIC, also underwrites a mail-order student life policy and a short-term disability benefit policy, neither of which is distributed by our sales force, and also has in-force policies from several discontinued lines of insurance.
The Corporate and Other Distributed Products segment is affected by corporate income and expenses not allocated to our other segments, net investment income (other than net investment income allocated to our Term Life Insurance segment), general and administrative expenses (other than expenses that are allocated to our Term Life Insurance or Investment and Savings Products segments), management equity awards, equity awards granted to our sales force leaders at the time of the Offering, interest expense on the Citi note and realized gains and losses on our invested asset portfolio.
| 75 |
Table of Contents
Index to Financial Statements
CRITICAL ACCOUNTING ESTIMATES
We prepare our financial statements in accordance with GAAP. These principles are established primarily by the Financial Accounting Standards Board. The preparation of financial statements in conformity with GAAP requires us to make estimates and assumptions based on currently available information when recording transactions resulting from business operations. Our significant accounting policies are described in Note 1 to our financial statements. The most significant items on the balance sheet are based on fair value determinations, accounting estimates and actuarial determinations which are susceptible to changes in future periods and which affect our results of operations and financial position.
The estimates that we deem to be most critical to an understanding of our results of operations and financial position are those related to the valuation of investments, reinsurance, deferred policy acquisition costs, future policy benefit reserves, and income taxes. The preparation and evaluation of these critical accounting estimates involve the use of various assumptions developed from management’s analyses and judgments. Subsequent experience or use of other assumptions could produce significantly different results.
Invested Assets
We hold fixed-maturity securities, including bonds and redeemable preferred stocks, and equity securities, including common and non-redeemable preferred stock and certain other financial instruments. These invested assets are classified as available-for-sale, except for the securities of our U.S. broker-dealer subsidiary, which are classified as trading securities. All of these securities are carried at fair value.
Fair value. Fair value is the price that would be received to sell an asset in an orderly transaction between market participants at the measurement date. Fair value measurements are based upon observable and unobservable inputs. Observable inputs reflect market data obtained from independent sources, while unobservable inputs reflect our view of market assumptions in the absence of observable market information. All invested assets are classified and disclosed in one of the following three categories:
| • | Level 1. Quoted prices for identical instruments in active markets. |
| • | Level 2. Quoted prices for similar instruments in active markets; quoted prices for identical or similar instruments in markets that are not active; and model-derived valuations in which all significant inputs and significant value drivers are observable in active markets. |
| • | Level 3. Valuations derived from valuation techniques in which one or more significant inputs or significant value drivers are unobservable. |
As of each reporting period, all invested assets are classified in their entirety based on the lowest level of input that is significant to the fair value measurement. Significant levels of estimation and judgment are required to determine the fair value of certain of our investments. The factors influencing these estimations and judgments are subject to change in subsequent reporting periods. The fair value and hierarchy classifications of our invested asset portfolio were as follows:
| December 31, 2010 | ||||||||
| $ | % | |||||||
| (Dollars in thousands) | ||||||||
| Level 1 |
$ | 15,110 | * | |||||
| Level 2 |
2,087,233 | 98 | % | |||||
| Level 3 |
24,998 | 1 | % | |||||
| Total |
$ | 2,127,341 | 100 | % | ||||
| * | Less than 1% |
In assessing fair value of our investments, we use a third-party pricing service for approximately 95% of our securities. The remaining securities are primarily private securities valued using models based on observable inputs on public corporate spreads having similar tenors (e.g., sector, average life and quality rating) and liquidity and yield based
| 76 |
Table of Contents
Index to Financial Statements
on quality rating, average life and treasury yields. All data inputs come from observable data corroborated by independent third-party data. In the absence of sufficient observable inputs, we utilize non-binding broker quotes, which are reflected in our Level 3 classification.
We perform internal reasonableness assessments on fair value determinations within our portfolio. If a fair value appears unusual, we will re-examine the inputs and may challenge a fair value assessment made by the pricing service. If there is a known pricing error, we will request a reassessment by the pricing service. If the pricing service is unable to perform the reassessment on a timely basis, we will determine the appropriate price by corroborating with an alternative pricing service or other qualified source as necessary. We do not adjust quotes or prices except in a rare circumstance to resolve a known error.
For additional information, see Notes 1 and 4 to our consolidated and combined financial statements.
Other-than-temporary impairments. We recognize unrealized gains and losses on our available-for-sale portfolio as a separate component of accumulated other comprehensive income. The determination of whether a decline in fair value below amortized cost is other-than-temporary is both objective and subjective. Furthermore, this determination can involve a variety of assumptions and estimates, particularly for invested assets that are not actively traded in established markets. We evaluate a number of factors when determining the impairment status of individual securities. These factors include the economic condition of various industry segments and geographic locations and other areas of identified risk.
For available-for-sale securities in an unrealized loss position that we intend to sell or would more-likely-than-not be required to sell before the expected recovery of the amortized cost basis, we recognize an impairment charge for the difference between amortized cost and fair value as a realized investment loss in our statements of income. For available-for-sale securities in an unrealized loss position for which we have no intent to sell and believe that it is more-likely-than-not that we will not be required to sell before the expected recovery of the amortized cost basis, only the credit loss component of the difference between cost and fair value is recognized in earnings, while the remainder is recognized in accumulated other comprehensive income. The credit loss component recognized in earnings is identified as the amount of principal cash flows not expected to be received over the remaining term of the security.
For certain securitized financial assets with contractual cash flows, including asset-backed securities, we periodically update our best estimate of cash flows over the life of the security. Securities that are in an unrealized loss position are reviewed at least quarterly for other-than-temporary impairment. If the fair value of a securitized financial asset is less than its cost or amortized cost and there has been a decrease in the present value of the estimated cash flows since the last revised estimate, considering both timing and amount, an other-than-temporary impairment charge is recognized. Estimating future cash flows is a quantitative and qualitative process that incorporates information received from third-party sources along with certain assumptions and judgments regarding the future performance of the underlying collateral. Projections of expected future cash flows may change based upon new information regarding the performance of the underlying collateral.
Other categories of fixed-income securities that are in an unrealized loss position are also reviewed at least quarterly to determine if an other-than-temporary impairment is present based on certain quantitative and qualitative factors. We consider a number of factors in determining whether the impairment is other-than-temporary. These include: (1) actions taken by rating agencies, (2) default by the issuer, (3) the significance of the decline, (4) the intent to sell and the ability to hold the investment until recovery of the amortized cost basis, as noted above, (5) the time period during which the decline has occurred, (6) an economic analysis of the issuer, (7) the financial strength, liquidity, and recoverability of the issuer, and (8) an analysis of the underlying collateral. Although no set formula
| 77 |
Table of Contents
Index to Financial Statements
is used in this process, the investment performance, collateral position, and continued viability of the issuer are significant measures that are considered.
The other-than-temporary impairment analysis that we perform on our equity securities primarily focuses on the severity of the unrealized loss as well as the length of time the security’s fair value has been below amortized cost.
The other-than-temporary impairments that we recognized as a charge to earnings were as follows:
| Year ended December 31, | ||||||||||||
| 2010 | 2009 | 2008 | ||||||||||
| (In thousands) | ||||||||||||
| Other-than-temporary impairments |
$ | 12,158 | $ | 61,394 | $ | 114,022 | ||||||
For additional information, see Notes 1 and 4 to our consolidated and combined financial statements.
Reinsurance
We use reinsurance extensively. We determine if a contract provides indemnification against loss or liability in relation to the amount of insurance risk to which the reinsurer is subject. We review all contractual terms, particularly those that may limit the amount of insurance risk to which the reinsurer is subject that may delay the timely reimbursement of claims. If we determine that the possibility of a significant loss from insurance risk will occur only under remote circumstances, we record the contract under the deposit method of accounting with the net amount receivable reflected in other assets on our consolidated and combined balance sheets. The reinsurance contracts in effect at December 31, 2010, including the Citi reinsurance agreements, meet GAAP risk transfer provisions, except as noted below. Ceded policy reserves and claims liabilities relating to insurance ceded under these contracts are shown as due from reinsurers in our consolidated and combined balance sheets. We believe that one of the Citi reinsurance transactions (a 10% YRT transaction with an experience refund provision) will have limited transfer of insurance risk and that there will be only a remote chance of loss under the contract. As such, we have accounted for this agreement under the deposit method of accounting.
Ceded premiums are treated as a reduction of direct premiums and are recognized when due to the assuming company. Ceded claims are treated as a reduction of direct benefits and are recognized when the claim is incurred on a direct basis. Ceded policy reserve changes are also treated as a reduction of benefits and are recognized during the applicable financial reporting period. Under YRT arrangements, the ceded reserve is determined by recognizing the cost of reinsurance as a level percentage of the direct premium collected. The expected reinsurance cost is the expected reinsurance premium collected less expected reinsurance claims. Ceded future policy benefit reserves for coinsurance are determined in the same manner as direct policy reserves.
Claim liabilities and policy benefits are calculated consistently for all policies, regardless of whether or not the policy is reinsured. Once the direct claim liabilities are estimated, the amounts attributable to the reinsurers are estimated. Liabilities for unpaid reinsurance claims are produced from claims and reinsurance system records, which contain the relevant terms of the individual reinsurance contracts. We monitor claims due from reinsurers to ensure that balances are settled on a timely basis. Incurred but not reported claims are reviewed to ensure that appropriate amounts are ceded. We analyze and monitor the creditworthiness of each of our reinsurers to minimize collection issues. For reinsurance contracts with unauthorized reinsurers, we require collateral such as letters of credit.
For additional information on reinsurance, see Notes 1 and 6 to our consolidated and combined financial statements.
| 78 |
Table of Contents
Index to Financial Statements
Deferred Policy Acquisition Costs (DAC)
The costs of acquiring new business are deferred to the extent that they vary with, and are primarily related to, the acquisition of such new business. These costs mainly include commissions and policy issue expenses. The recovery of such costs is dependent on the future profitability of the related policies, which, in turn, is dependent principally upon investment returns, mortality, persistency and the expense of administering the business, as well as upon certain economic variables, such as inflation. Deferred policy acquisition costs are subject to recoverability testing on an annual basis or when circumstances indicate that recoverability is uncertain. We make certain assumptions regarding persistency, expenses, interest rates and claims. The assumptions for these types of products may not be modified, or unlocked, unless recoverability testing deems them to be inadequate. Assumptions are updated for new business to reflect the most recent experience.
Deferrable term life insurance policy acquisition costs are amortized over the premium-paying period of the related policies in proportion to premium income. If actual lapses or withdrawals are different from pricing assumptions for a particular period, the deferred policy acquisition cost amortization will be affected. If the number of policies that lapse are 1% higher than the number of policies that we expected to lapse in our pricing assumptions, approximately 1% more of the existing deferred policy acquisition cost balance will be amortized, which would have been equal to approximately $8.0 million as of December 31, 2010 (assuming such lapses were distributed proportionately among policies of all durations). We believe that a lapse rate in the number of policies that is 1% higher than the rate assumed in our pricing assumptions is a reasonably possible variation. Higher lapses in the early durations would have a greater effect on deferred policy acquisition cost amortization since the deferred policy acquisition cost balances are higher at the earlier durations. Differences in actual mortality rates compared to our pricing assumptions will not have a material effect on deferred policy acquisition cost amortization. Due to the inherent uncertainties in making assumptions about future events, materially different experience from expected results in persistency or mortality could result in a material increase or decrease of deferred acquisition cost amortization in a particular period.
Deferrable acquisition costs for Canadian segregated funds are amortized over the life of the policies in relation to estimated gross profits before amortization.
For additional information on DAC, see Notes 1 and 7 to our consolidated and combined financial statements.
Future Policy Benefit Reserves
We calculate and maintain reserves for the estimated future payment of claims to our policyholders based on actuarial assumptions and in accordance with industry practice and GAAP. Liabilities for future policy benefits on our term life insurance products have been computed using a net level method, including assumptions as to investment yields, mortality, persistency, and other assumptions based on our experience. Many factors can affect these reserves, including mortality trends, investment yields and persistency. Similar to the DAC discussion above, the assumptions used to establish reserves cannot be modified over the policy term unless recoverability testing deems them to be inadequate. Therefore, the reserves we establish are based on estimates, assumptions and our analysis of historical experience. Our results depend significantly upon the extent to which our actual claims experience is consistent with the assumptions we used in determining our reserves and pricing our products. Our reserve assumptions and estimates require significant judgment and, therefore, are inherently uncertain. If actual lapses are different from pricing assumptions for a particular period, the change in the future policy benefit reserves, which is reflected in benefits and claims in our statements of income, will be affected.
If the number of policies that lapse are 1% higher than the number of policies that we
| 79 |
Table of Contents
Index to Financial Statements
expected to lapse in our pricing assumptions, approximately 1% more of the future policy benefit reserves will be released, which would have been equal to approximately $43.5 million as of December 31, 2010 (assuming such lapses were distributed proportionately among policies of all durations). The future policy benefit reserves released from the additional lapses would have been offset by the release of the corresponding reinsurance reserves of approximately $34.6 million as of December 31, 2010. Higher lapses in later durations would have a greater effect on the release of future policy benefit reserves since the future policy benefit reserves are higher at the later durations. Differences in actual mortality rates compared to our pricing assumptions will not have a material effect on future policy benefit reserves. We cannot determine with precision the ultimate amounts that we will pay for actual claims or the timing of those payments.
For additional information on future policy benefit reserves, see Notes 1 and 10 to our consolidated and combined financial statements.
Income Taxes
Income taxes are accounted for under the asset and liability method. Deferred tax assets and liabilities are recognized for the future tax consequences attributable to (i) differences between the financial statement carrying amounts of existing assets and liabilities and their respective tax bases and (ii) operating loss and tax credit carryforwards. Deferred tax assets and liabilities are measured using enacted tax rates expected to apply to taxable income in the years in which those temporary differences are expected to be recovered or settled. The effect on deferred tax assets and liabilities of a change in tax rates is recognized in income in the period that includes the enactment date. Deferred tax assets are recognized subject to management’s judgment that realization is more likely than not applicable to the periods in which we expect the temporary difference will reverse.
For additional information on income taxes, see Notes 1 and 12 to our consolidated and combined financial statements.
RESULTS OF OPERATIONS
Revenues
Our revenues consist of the following:
| • | Net premiums. Reflects direct premiums payable by our policyholders on our in-force insurance policies, primarily term life insurance, net of reinsurance premiums that we pay to third-party reinsurers. |
| • | Net investment income. Represents income, net of investment related expenses, generated by our invested asset portfolio, which consists primarily of interest income earned on fixed-maturity investments. Investment income earned on assets supporting our statutory reserves and targeted capital is allocated to our Term Life Insurance segment, with the balance included in our Corporate and Other Distributed Products segment. |
| • | Commissions and fees. Consists primarily of dealer re-allowances earned on the sales of investment and savings products, trail commissions based on the asset values of client accounts, marketing and support fees from product originators, custodial fees for services rendered in our capacity as nominee on client retirement accounts funded by mutual funds on our servicing platform, recordkeeping fees for mutual funds on our servicing platform and fees associated with the sale of other distributed products. |
| • | Realized investment gains (losses), including other-than-temporary impairments (“OTTI”). Reflects the difference between amortized cost and amounts realized on the sale of investment securities, as well as OTTI charges. |
| • | Other, net. Reflects revenues generated from the fees charged for access to our sales force website, printing revenues from the sale of printed materials to sales representatives, incentive fees and reimbursements from product originators, Canadian licensing fees, sales of merchandise to sales representatives, mutual fund customer service fees, fees charged to sales representatives related to |
| 80 |
Table of Contents
Index to Financial Statements
| life insurance processing responsibilities, and interest charges received from or paid to reinsurers on late payments. |
Benefits and Expenses
Our operating expenses consist of the following:
| • | Benefits and claims. Reflects the benefits and claims payable on insurance policies, as well as changes in our reserves for future policy claims and reserves for other benefits payable, net of reinsurance. |
| • | Amortization of DAC. Represents the amortization of capitalized costs associated with the sale of an insurance policy or segregated fund, including sales commissions, medical examination and other underwriting costs, and other acquisition-related costs. |
| • | Insurance commissions. Reflects sales commissions in respect of insurance products that are not eligible for deferral. |
| • | Insurance expenses. Reflects non-capitalized insurance expenses, including staff compensation, technology and communications, insurance sales force-related costs, printing, postage and distribution of insurance sales materials, outsourcing and professional fees, premium taxes, amortization of certain intangibles and other corporate and administrative fees and expenses related to our insurance operations. |
| • | Sales commissions. Represents commissions to our sales representatives in connection with the sale of investment and savings products and products other than insurance products. |
| • | Interest expense. Reflects interest on the Citi note as well as interest incurred in connection with the Citi reinsurance transactions. |
| • | Other operating expenses. Consists primarily of expenses that are unrelated to the distribution of insurance products, including staff compensation, technology and communications, various sales force-related costs, printing, postage and distribution of sales materials, outsourcing and professional fees, amortization of certain intangibles and other corporate and administrative fees and expenses. |
We allocate certain operating expenses associated with our sales representatives, including supervision, training and legal, to our two primary operating segments generally based on the average number of licensed representatives in each segment for a given period. We also allocate technology and occupancy costs based on usage. Costs that are not allocated to our two primary segments are included in our Corporate and Other Distributed Products segment.
| 81 |
Table of Contents
Index to Financial Statements
2010 Compared to 2009
Primerica, Inc. Actual Results
We executed the Transactions in March and April of 2010. As such, actual results will not be comparable due to the initial and ongoing effects and recognition of the Citi reinsurance and reorganization transactions. We believe the pro forma results presented in the next section provide meaningful additional information for the evaluation of our financial results. Our statements of income were as follows:
| Year ended December 31, | Change | |||||||||||||||
| 2010 | 2009 | $ | % | |||||||||||||
| (Dollars in thousands) | ||||||||||||||||
| Revenues: |
||||||||||||||||
| Direct premiums |
$ | 2,181,074 | $ | 2,112,781 | $ | 68,293 | 3 | % | ||||||||
| Ceded premiums |
(1,450,367 | ) | (610,754 | ) | (839,613 | ) | 137 | % | ||||||||
| Net premiums |
730,707 | 1,502,027 | (771,320 | ) | -51 | % | ||||||||||
| Net investment income |
165,111 | 351,326 | (186,215 | ) | -53 | % | ||||||||||
| Commissions and fees |
382,940 | 335,986 | 46,954 | 14 | % | |||||||||||
| Realized investment (losses) gains , including OTTI |
34,145 | (21,970 | ) | 56,115 | * | |||||||||||
| Other, net |
48,960 | 53,032 | (4,072 | ) | -8 | % | ||||||||||
| Total revenues |
1,361,863 | 2,220,401 | (858,538 | ) | -39 | % | ||||||||||
| Benefits and expenses: |
||||||||||||||||
| Benefits and claims |
317,703 | 600,273 | (282,570 | ) | -47 | % | ||||||||||
| Amortization of DAC |
168,035 | 381,291 | (213,256 | ) | -56 | % | ||||||||||
| Insurance commissions |
19,904 | 34,388 | (14,484 | ) | -42 | % | ||||||||||
| Insurance expenses |
75,503 | 148,760 | (73,257 | ) | -49 | % | ||||||||||
| Sales commissions |
179,924 | 162,756 | 17,168 | 11 | % | |||||||||||
| Interest expenses |
20,872 | — | 20,872 | * | ||||||||||||
| Other operating expenses |
180,779 | 132,978 | 47,801 | 36 | % | |||||||||||
| Total benefits and expenses |
962,720 | 1,460,446 | (497,726 | ) | -34 | % | ||||||||||
| Income before income taxes |
399,143 | 759,955 | (360,812 | ) | -47 | % | ||||||||||
| Income taxes |
141,365 | 265,366 | (124,001 | ) | -47 | % | ||||||||||
| Net income |
$ | 257,778 | $ | 494,589 | $ | (236,811) | -48 | % | ||||||||
| * | Less than 1%, or not meaningful |
Net premiums. Net premiums were lower in 2010 primarily as a result of the significant increase in ceded premiums associated with the Citi reinsurance agreements executed on March 31, 2010. The effect of these agreements on net premiums is reflected in the Term Life Insurance segment.
Net investment income. Net investment income declined during 2010 primarily as a result of the impact on our invested asset base of the asset transfers that we executed in connection with our corporate reorganization in 2010. On March 31, 2010, we transferred approximately $4.0 billion of assets to support the statutory liabilities assumed by the Citi reinsurers and in April 2010, we paid dividends to Citi of approximately $675.7 million. Lower yields on invested assets also negatively impacted net investment income during 2010.
Commissions and fees. The increase in commissions and fees in 2010 was primarily driven by activity in our Investment and Savings Product segment as a result of improved market conditions and increased demand for our products, partially offset by declines in our lending business as reflected in our Corporate and Other Distributed Products segment results.
Total benefits and expenses. The decrease in total benefits and expenses in 2010 primarily reflects lower benefits and claims, lower amortization of DAC and lower insurance expenses largely as a result of the Citi reinsurance agreements. These declines were partially offset by an increase in interest expense as a result of the Citi note and other operating expenses as a result of initial and one-time expenses incurred in connection with the Offering, including equity award expenses. The changes associated with the Citi
| 82 |
Table of Contents
Index to Financial Statements
reinsurance agreements impacted the Term Life Insurance segment, while the changes in interest and other operating expenses primarily impacted the Corporate and Other Distributed Products segment.
Income taxes. Our effective income tax rate was 35.4% in 2010 and 34.9% in 2009.
Primerica, Inc. Pro Forma Results
The following pro forma statement of income is intended to provide information about how the Transactions would have affected our financial statements if they had been consummated as of January 1, 2010. Because the Transactions were concluded during 2010, pro forma adjustment to our balance sheet was not necessary as of December 31, 2010. Based on the timing of the Transactions, pro forma adjustments to our statement of income were necessary for the first three months of 2010. The pro forma statement of income does not necessarily reflect the results of operations that would have resulted had the Transactions occurred as of January 1, 2010, nor should it be taken as indicative of our future results of operations. Our pro forma statement of income is set forth below.
| 83 |
Table of Contents
Index to Financial Statements
Pro Forma Statement of Income
Year ended December 31, 2010
(Unaudited)
| Actual (1) | Adjustments for the Citi reinsurance transactions (2) |
Adjustment for the reorganization and other concurrent transactions (3) |
Pro forma | |||||||||||||
| (In thousands, except per-share amounts) | ||||||||||||||||
| Revenues: |
||||||||||||||||
| Direct premiums |
$ | 2,181,074 | $ | — | $ | — | $ | 2,181,074 | ||||||||
| Ceded premiums |
(1,450,367 | ) | (296,328 | )(A) | — | (1,746,695 | ) | |||||||||
| Net premiums |
730,707 | (296,328 | ) | — | 434,379 | |||||||||||
| Net investment income |
165,111 | (47,566 | )(B) | (7,169 | )(H) | 110,376 | ||||||||||
| Commissions and fees |
382,940 | — | — | 382,940 | ||||||||||||
| Realized investment gains, including OTTI |
34,145 | — | — | 34,145 | ||||||||||||
| Other, net |
48,960 | — | — | 48,960 | ||||||||||||
| Total revenues |
1,361,863 | (343,894 | ) | (7,169 | ) | 1,010,800 | ||||||||||
| Benefits and Expenses: |
||||||||||||||||
| Benefits and claims |
317,703 | (128,204 | )(C) | — | 189,499 | |||||||||||
| Amortization of DAC |
168,035 | (71,389 | )(D) | — | 96,646 | |||||||||||
| Insurance commissions |
19,904 | (1,669 | )(E) | — | 18,235 | |||||||||||
| Insurance expenses |
75,503 | (26,083 | )(E) | — | 49,420 | |||||||||||
| Sales commissions |
179,924 | — | — | 179,924 | ||||||||||||
| Interest expense |
20,872 | 2,812(F | ) | 4,125(I | ) | 27,809 | ||||||||||
| Other operating expenses |
180,779 | — | 3,076(J | ) | 183,855 | |||||||||||
| Total benefits and expenses |
962,720 | (224,533 | ) | 7,201 | 745,388 | |||||||||||
| Income before income taxes |
399,143 | (119,361 | ) | (14,370 | ) | 265,412 | ||||||||||
| Income taxes |
141,365 | (42,274 | )(G) | (5,089 | )(G) | 94,002 | ||||||||||
| Net income |
$ | 257,778 | $ | (77,087 | ) | $ | (9,281 | ) | $ | 171,410 | ||||||
| Earnings per share: |
||||||||||||||||
| Basic |
$ | 3.43 | $ | 2.28 | ||||||||||||
| Diluted |
$ | 3.40 | $ | 2.26 | ||||||||||||
| Weighted-average shares: |
||||||||||||||||
| Basic |
72,099 | 72,099 | ||||||||||||||
| Diluted |
72,882 | 72,882 | ||||||||||||||
See accompanying notes to the pro forma statement of income.
| 84 |
Table of Contents
Index to Financial Statements
Notes to the Pro Forma Statement of Income — Unaudited
(1) The actual statement of income included income attributable to the underlying policies that were reinsured to Citi on March 31, 2010 as well as net investment income earned on the invested assets backing the reinsurance balances and the distributions to Citi made as part of our corporate reorganization.
(2) Adjustments for the Citi reinsurance transactions.
Concurrent with the reorganization of our business and prior to completion of the Offering, we formed a new subsidiary, Prime Re, and we made an initial capital contribution to it. We also entered into a series of coinsurance agreements with Prime Re and with other Citi subsidiaries. Under these agreements, we ceded between 80% and 90% of the risks and rewards of our term life insurance policies that were in force at December 31, 2009. Concurrent with signing these agreements, we transferred the corresponding account balances in respect of the coinsured policies along with the assets to support the statutory liabilities assumed by Prime Re and the other Citi subsidiaries.
We believe that three of the Citi coinsurance agreements, which we refer to as the risk transfer agreements, satisfy GAAP risk transfer rules. Under the risk transfer agreements, we ceded between 80% and 90% of our term life future policy benefit reserves, and we transferred a corresponding amount of invested assets to the Citi reinsurers. These transactions did not and will not impact our future policy benefit reserves, and we recorded an asset for the same amount of risk transferred in due from reinsurers. We also reduced deferred acquisition costs by between 80% and 90%, which will reduce future amortization expenses. In addition, we will transfer between 80% and 90% of all future premiums and benefits and claims associated with these policies to the corresponding reinsurance entities. We will receive ongoing ceding allowances as a reduction to insurance expenses to cover policy and claims administration expenses under each of these reinsurance contracts. One coinsurance agreement, which we refer to as the deposit agreement, relates to a 10% reinsurance transaction that includes an experience refund provision and does not satisfy GAAP risk transfer rules. We account for this contract under the deposit method. Under deposit method accounting, the amount we pay to the reinsurer will be treated as a deposit and is reported on the balance sheet as an asset in other assets. The Citi coinsurance agreements did not generate any deferred gain or loss upon their execution because these transactions were part of a business reorganization among entities under common control. The net impact of these transactions was reflected as an increase in paid-in capital. Prior to the completion of the Offering, we effected a reorganization in which we transferred all of the issued and outstanding capital stock of Prime Re to Citi. Each of the assets and liabilities, including the invested assets and the distribution of Prime Re, was transferred at book value with no gain or loss recorded on our income statement.
For the year ended December 31, 2010, the pro forma statement of income assumes the reinsurance transactions were effected as of January 1, 2010 for policies in force as of year-end 2009.
(A) Reflects premiums ceded to the Citi reinsurers for the specific policies covered under the risk transfer agreements.
(B) Reflects net investment income on a pro-rata share of invested assets transferred to the Citi reinsurers. The net investment income was estimated by multiplying the actual investment income by the ratio of the amount of assets transferred to our total portfolio of invested assets. The amount also includes the change in fair value of the deposit asset related to the 10% reinsurance agreement being accounted for under the deposit method.
(C) Reflects benefits and claims ceded to the Citi reinsurers for the specific policies covered under the risk transfer agreements.
(D) Reflects the DAC amortization ceded to the Citi reinsurers for the specific policies covered under the risk transfer agreements.
| 85 |
Table of Contents
Index to Financial Statements
(E) Reflects the non-deferred expense allowance received from the Citi reinsurers under the risk transfer agreements.
(F) Reflects a finance charge payable to the Citi reinsurer in respect of the deposit agreement. The annual finance charge is 3% of our excess reserves. Excess reserves are equal to the difference between our required statutory reserves and our economic reserves, which is the amount we determine is necessary to satisfy obligations under our in-force policies.
(G) Reflects income tax at the respective period’s effective tax rate.
(3) Adjustments for the reorganization and other concurrent transactions. The pro forma statement of income for the year ended December 31, 2010 assumes
the reorganization transactions
were executed as of January 1,
2010.
(H) Reflects a pro-rata reduction of net investment income on assets distributed
to Citi as an extraordinary distribution.
(I) Reflects interest expense on a $300.0 million, 5.5% interest note payable issued
to Citi.
(J) Reflects expense associated with equity
awards granted on April 1, 2010 in connection with the Offering. The $3.1 million expense reflects one quarter of vesting related to
management awards that continue to vest over three years. These expenses are reflected in actual results for
periods following the Offering.
For more detailed commentary
on the drivers of our revenues and expenses, see the discussion of results of operations by segment below.
SEGMENT RESULTS
Term Life Insurance Segment Actual Results
We entered into the Citi reinsurance and reorganization transactions, which are described more fully in Notes 2 and 3 to our pro forma statement of income, during March and April of 2010. As such, actual results for the year ended December 31, 2010 include approximately three months of operations that do not reflect the Citi reinsurance and reorganization transactions, and actual results for the year ended December 31, 2009 do not reflect the effects of the Citi reinsurance and reorganization transactions. Term Life Insurance segment actual results were as follows:
| Year ended December 31, |
Change | |||||||||||||||
| 2010 | 2009 | $ | % | |||||||||||||
| (Dollars in thousands) | ||||||||||||||||
| Revenues: |
||||||||||||||||
| Direct premiums |
$ | 2,100,709 | $ | 2,030,988 | $ | 69,721 | 3 | % | ||||||||
| Ceded premiums |
(1,436,041 | ) | (596,791 | ) | (839,250 | ) | 141 | % | ||||||||
| Net premiums |
664,668 | 1,434,197 | (769,529 | ) | -54 | % | ||||||||||
| Allocated net investment income |
110,633 | 274,212 | (163,579 | ) | -60 | % | ||||||||||
| Other, net |
33,267 | 33,656 | (389 | ) | -1 | % | ||||||||||
| Total revenues |
808,568 | 1,742,065 | (933,497 | ) | -54 | % | ||||||||||
| Benefits and expenses: |
||||||||||||||||
| Benefits and claims |
277,653 | 559,038 | (281,385 | ) | -50 | % | ||||||||||
| Amortization of DAC |
156,312 | 371,663 | (215,351 | ) | -58 | % | ||||||||||
| Insurance commissions |
3,177 | 17,614 | (14,437 | ) | -82 | % | ||||||||||
| Insurance expenses |
63,885 | 134,738 | (70,853 | ) | -53 | % | ||||||||||
| Interest expense |
8,497 | — | 8,497 | * | ||||||||||||
| Total benefits and expenses |
509,524 | 1,083,053 | (573,529 | ) | -53 | % | ||||||||||
| Income before income taxes |
$ | 299,044 | $ | 659,012 | $ | (359,968 | ) |
|
-55 |
% | ||||||
| * | Not meaningful |
We believe that the pro forma results presented below provide meaningful additional information necessary to evaluate our segment financial results.
| 86 |
Table of Contents
Index to Financial Statements
Term Life Insurance Segment Pro Forma Results
Term Life Insurance segment pro forma results give effect to the Citi reinsurance and reorganization transactions, which are described more fully in Notes 2 and 3 to our pro forma statement of income. On a pro forma basis, Term Life Insurance segment results were as follows:
| Year ended December 31, |
Change | |||||||||||||||
| 2010 | 2009 | $ | % | |||||||||||||
| (Dollars in thousands) | ||||||||||||||||
| Revenues: |
||||||||||||||||
| Direct premiums |
$ | 2,100,709 | $ | 2,030,988 | $ | 69,721 | 3 | % | ||||||||
| Ceded premiums |
(1,732,369 | ) | (1,680,827 | ) | (51,542 | ) | 3 | % | ||||||||
| Net premiums |
368,340 | 350,161 | 18,179 | 5 | % | |||||||||||
| Allocated net investment income |
62,294 | 68,303 | (6,009 | ) | -9 | % | ||||||||||
| Other, net |
33,267 | 33,656 | (389 | ) | -1 | % | ||||||||||
| Total revenues |
463,901 | 452,120 | 11,781 | 3 | % | |||||||||||
| Benefits and expenses: |
||||||||||||||||
| Benefits and claims |
149,449 | 135,052 | 14,397 | 11 | % | |||||||||||
| Amortization of DAC |
84,923 | 91,932 | (7,009 | ) | -8 | % | ||||||||||
| Insurance commissions |
1,508 | 12,091 | (10,583 | ) | -88 | % | ||||||||||
| Insurance expenses |
37,802 | 38,123 | (321 | ) | * | |||||||||||
| Interest expense |
11,309 | 10,993 | 316 | 3 | % | |||||||||||
| Total benefits and expenses |
284,991 | 288,191 | (3,200 | ) | -1 | % | ||||||||||
| Income before income taxes |
$ | 178,910 | $ | 163,929 | $ | 14,981 | 9 | % | ||||||||
| * | Less than 1% |
Direct premiums for 2010 increased mainly due to improved persistency, a stronger Canadian dollar and premium increases for policies reaching the end of their initial level premium period, partially offset by the decline in sales volume noted previously. Ceded premiums, which are highly influenced by the business reinsured with Citi, grew consistent with direct premiums.
Additionally, in 2010, we reduced ceded premiums by approximately $13.1 million related to agreements obtained with certain reinsurers to recover ceded premiums for post-issue underwriting class upgrades. The most common reason for such an upgrade occurs when someone who was originally issued a term
life policy as a tobacco user subsequently quits using tobacco. Historically, we have reduced policyholder premiums for such upgrades, but have not reduced ceded premiums to reflect the new underwriting class. We were uncertain of our ability to recover past ceded premiums, but in the fourth quarter of 2010, we approached our reinsurers and reached agreements to recover certain of these past ceded premiums. The $13.1 million of recoveries recognized in 2010 reflects the agreements signed in the fourth quarter of 2010. We recovered $18.8 million of past ceded premiums, which included $5.7 million of recoveries passed on to the Citi reinsurers in accordance with the terms of the associated reinsurance agreements. We expect approximately $8.7 million of additional recoveries in the first quarter of 2011 for the remaining agreements which were signed in January 2011.
Allocated net investment income decreased during 2010, primarily due to lower yield on invested assets and slightly lower average allocated invested assets, partially offset by lower investment-related expenses.
The increase in benefits and claims in 2010 was primarily due to higher reserve increases as a result of improvements in policy persistency and premium growth. Claims were slightly higher during 2010 due to favorable claims experience in the first quarter of 2009.
In 2010, amortization of DAC decreased largely due to improved policy persistency, partially
offset by higher amortization from a lower DAC interest rate assumed for new business. We lowered the interest rate assumption during the third quarter of 2010 to reflect rates available
| 87 |
Table of Contents
Index to Financial Statements
in the current interest rate environment. The new lower DAC interest rate assumption will increase DAC amortization in the near term.
The decline in insurance commissions expense in 2010 was largely due to the $8.2 million special sales force payment made in 2009.
Insurance expenses were relatively flat primarily reflecting the offsetting effects of a decline in compensation-related items in 2010; payments made in 2009 for contract buyouts associated with our cancelled convention; and an increase in taxes, licenses and fees expense in 2010. The increase in taxes, licenses and fees in 2010 was primarily driven by accruals recognized in the fourth quarter as a result of recognizing these items on the accrual basis of accounting.
The changes in the face amount of our in-force book of term life insurance policies were as follows:
| Year ended December 31, |
Change | |||||||||||||||
| 2010 | 2009 | $ | % | |||||||||||||
| (Dollars in millions) | ||||||||||||||||
| Face amount in force, beginning of period |
$ | 650,195 | $ | 633,467 | $ | 16,728 | 3 | % | ||||||||
| Issued face amount |
74,401 | 80,497 | (6,096 | ) | -8 | % | ||||||||||
| Terminations |
(70,964 | ) | (74,642 | ) | 3,678 | -5 | % | |||||||||
| Foreign currency |
3,158 | 10,873 | (7,715 | ) | -71 | % | ||||||||||
| Face amount in force, end of period (1) |
$ | 656,791 | $ | 650,195 | $ | 6,596 | 1 | % | ||||||||
| (1) | Totals may not add due to rounding. |
The in-force book increased $6.60 billion, or 1%, during 2010. Issued face amount decreased $6.10 billion, or approximately 8%, due to a lower average issued policy size and the effect on production of a slightly smaller base of sales representatives. Terminations decreased by $3.68 billion in 2010, primarily as a result of improved persistency relative to 2009. The decrease in the effect of foreign currency on the end-of-period face amount in force was largely due to the significant strengthening in the Canadian dollar experienced during 2009. The increase in face in force in 2010 did not keep pace with the increase in premiums primarily due to the effect of increased premiums with no corresponding change in face amount and unchanged face amounts on policies reaching the end of their initial level premium period.
| 88 |
Table of Contents
Index to Financial Statements
Investments and Savings Products Segment Actual Results
The Transactions had no impact on the Investments and Savings Products segment. On an actual basis, Investments and Savings Products segment results were as follows:
| Year ended December 31, |
Change | |||||||||||||||
| 2010 | 2009 | $ | % | |||||||||||||
| (Dollars in thousands) | ||||||||||||||||
| Revenues: |
||||||||||||||||
| Commissions and fees: |
||||||||||||||||
| Sales-based revenues |
$ | 142,606 | $ | 118,798 | $ | 23,808 | 20 | % | ||||||||
| Asset-based revenues |
167,473 | 127,581 | 39,892 | 31 | % | |||||||||||
| Account-based revenues |
41,690 | 43,247 | (1,557 | ) | -4 | % | ||||||||||
| Total commissions and fees |
351,769 | 289,626 | 62,143 | 21 | % | |||||||||||
| Other, net |
10,038 | 10,514 | (476 | ) | -5 | % | ||||||||||
| Total revenues |
361,807 | 300,140 | 61,667 | 21 | % | |||||||||||
| Expenses: |
||||||||||||||||
| Amortization of DAC |
9,330 | 7,254 | 2,076 | 29 | % | |||||||||||
| Insurance commissions |
7,854 | 6,831 | 1,023 | 15 | % | |||||||||||
| Sales commissions: |
||||||||||||||||
| Sales-based |
100,993 | 86,912 | 14,081 | 16 | % | |||||||||||
| Asset-based |
58,129 | 42,003 | 16,126 | 38 | % | |||||||||||
| Other operating expenses |
71,971 | 63,736 | 8,235 | 13 | % | |||||||||||
| Total expenses |
248,277 | 206,736 | 41,541 | 20 | % | |||||||||||
| Income before income taxes |
$ | 113,530 | $ | 93,404 | $ | 20,126 | 22 | % | ||||||||
Supplemental information on the underlying metrics that drove results was as follows:
| Year ended December 31, |
Change | |||||||||||||||
| 2010 | 2009 | $ | % | |||||||||||||
| (Dollars in millions and accounts in thousands) |
||||||||||||||||
| Revenue metric: |
||||||||||||||||
| Product sales |
$ | 3,623.6 | $ | 3,006.6 | $ | 617.0 | 21 | % | ||||||||
| Average of aggregate client account values |
$ | 31,908 | $ | 26,845 | $ | 5,063 | 19 | % | ||||||||
| Average number of fee-generating accounts |
2,728 | 2,838 | (110 | ) | -4 | % | ||||||||||
Commissions and fees revenue increased in 2010 primarily as a result of improving economic and market trends and client demand. Sales-based commission revenues primarily grew as a result of demand, while asset-based commission revenues were driven by demand and improved equity valuations. As a result, sales-based and asset-based commission expense grew as well. Asset-based revenues and commission expense in 2010 also reflect the impact of accruing certain items that had previously been accounted for on a cash basis. Excluding the impact of these cash-to-accrual adjustments, asset-based revenues and commissions would have increased 22%, consistent with the 19% growth in aggregate client account values.
Amortization of DAC and insurance commissions increased in 2010 consistent with the growth in our segregated funds business. Additionally, increases in client account values driven by improving market conditions accelerated amortization of DAC in 2010.
Other operating expenses increased in 2010, largely due to higher administrative costs as a result of growth in the business.
| 89 |
Table of Contents
Index to Financial Statements
Changes in asset values in client accounts were as follows:
| Year ended December 31, |
Change | |||||||||||||||
| 2010 | 2009 | $ | % | |||||||||||||
| (Dollars in millions) | ||||||||||||||||
| Asset values, beginning of period |
$ | 31,303 | $ | 24,677 | $ | 6,626 | 27 | % | ||||||||
| Inflows |
3,624 | 3,007 | 617 | 21 | % | |||||||||||
| Redemptions |
(3,691 | ) | (2,997 | ) | (694 | ) | 23 | % | ||||||||
| Change in market value, net and other |
3,633 | 6,617 | (2,984 | ) | -45 | % | ||||||||||
| Asset values, end of period (1) |
$ | 34,869 | $ | 31,303 | $ | 3,565 | 11 | % | ||||||||
| (1) | Totals may not add due to rounding. |
Inflows increased consistent with the increase in sales volume. The amount of redemptions also increased reflecting the year-over-year increase in assets under management. Actual redemption rates were level as a percent of average assets under management for both 2010 and 2009. The market return on assets under management in 2010 and 2009 reflected general market value trends.
Corporate and Other Distributed Products Segment Actual Results
We entered into the reorganization transactions, which are described more fully in Note 3 to our pro forma statement of income, during March and April of 2010. As such, actual results for the year ended December 31, 2010 include approximately three months of operations that do not reflect the reorganization transactions, while actual results for the year ended December 31, 2009 do not reflect the effects of the reorganization transactions. Corporate and Other Distributed Products segment actual results were as follows:
| Year ended December 31, |
Change | |||||||||||||||
| 2010 | 2009 | $ | % | |||||||||||||
| (Dollars in thousands) | ||||||||||||||||
| Revenues: |
||||||||||||||||
| Direct premiums |
$ | 80,365 | $ | 81,793 | $ | (1,428 | ) | -2 | % | |||||||
| Ceded premiums |
(14,325 | ) | (13,963 | ) | (362 | ) | 3 | % | ||||||||
| Net premiums |
66,040 | 67,830 | (1,790 | ) | -3 | % | ||||||||||
| Allocated net investment income |
54,477 | 77,114 | (22,637 | ) | -29 | % | ||||||||||
| Commissions and fees |
31,172 | 46,360 | (15,188 | ) | -33 | % | ||||||||||
| Realized investment gains (losses), including OTTI |
34,146 | (21,970 | ) | 56,116 | * | |||||||||||
| Other, net |
5,653 | 8,862 | (3,209 | ) | -36 | % | ||||||||||
| Total revenues |
191,488 | 178,196 | 13,292 | 7 | % | |||||||||||
| Benefits and expenses: |
||||||||||||||||
| Benefits and claims |
40,052 | 41,235 | (1,183 | ) | -3 | % | ||||||||||
| Amortization of DAC |
2,392 | 2,374 | 18 | * | ||||||||||||
| Insurance commissions |
8,875 | 9,943 | (1,068 | ) | -11 | % | ||||||||||
| Insurance expenses |
11,615 | 14,022 | (2,407 | ) | -17 | % | ||||||||||
| Sales commissions |
20,800 | 33,841 | (13,041 | ) | -39 | % | ||||||||||
| Interest expense |
12,375 | — | 12,375 | * | ||||||||||||
| Other operating expenses |
108,810 | 69,242 | 39,568 | 57 | % | |||||||||||
| Total benefits and expenses |
204,919 | 170,657 | 34,262 | 20 | % | |||||||||||
| (Loss) income before income taxes |
$ | (13,431 | ) | $ | 7,539 | $ | (20,970 | ) | * | |||||||
| * | Less than 1%, or not meaningful |
| 90 |
Table of Contents
Index to Financial Statements
We believe that the pro forma results presented below provide meaningful additional information necessary to evaluate our segment financial results.
Corporate and Other Distributed Products Segment Pro Forma Results
Corporate and Other Distributed Products segment pro forma results give effect to the reorganization transactions, which are described more fully in Note 3 to our pro forma statement of income. On a pro forma basis, Corporate and Other Distributed Products segment results were as follows:
| Year ended December 31, |
Change | |||||||||||||||
| 2010 | 2009 | $ | % | |||||||||||||
| (Dollars in thousands) | ||||||||||||||||
| Revenues: |
||||||||||||||||
| Direct premiums |
$ | 80,365 | $ | 81,793 | $ | (1,428 | ) | -2 | % | |||||||
| Ceded premiums |
(14,325 | ) | (13,963 | ) | (362 | ) | 3 | % | ||||||||
| Total premiums |
66,040 | 67,830 | (1,790 | ) | -3 | % | ||||||||||
| Allocated net investment income |
48,081 | 50,043 | (1,962 | ) | -4 | % | ||||||||||
| Commissions and fees |
31,172 | 46,360 | (15,188 | ) | -33 | % | ||||||||||
| Realized investment gains (losses), including OTTI |
34,146 | (21,970 | ) | 56,116 | * | |||||||||||
| Other, net |
5,653 | 8,862 | (3,209 | ) | -36 | % | ||||||||||
| Total revenues |
185,092 | 151,125 | 33,967 | 22 | % | |||||||||||
| Benefits and expenses: |
||||||||||||||||
| Benefits and claims |
40,052 | 41,235 | (1,183 | ) | -3 | % | ||||||||||
| Amortization of DAC |
2,392 | 2,374 | 18 | 1 | % | |||||||||||
| Insurance commissions |
8,875 | 9,943 | (1,068 | ) | -11 | % | ||||||||||
| Insurance expenses |
11,615 | 14,022 | (2,407 | ) | -17 | % | ||||||||||
| Sales commissions |
20,800 | 33,841 | (13,041 | ) | -39 | % | ||||||||||
| Interest expense |
16,500 | 16,500 | — | * | ||||||||||||
| Other operating expenses |
111,886 | 104,012 | 7,874 | 8 | % | |||||||||||
| Total benefits and expenses |
212,120 | 221,927 | (9,807 | ) | -4 | % | ||||||||||
| Loss before income taxes |
$ | (27,028 | ) | $ | (70,802 | ) | $ | 43,774 | -62 | % | ||||||
| * | Less than 1%, or not meaningful |
Total revenues increased in 2010 primarily as a result of recognizing realized investment gains in 2010 versus impairment losses in 2009. This growth was partially offset by lower commissions and fees as a result of the continuing decline in our lending business. The increase in total revenues was also partially offset by lower net investment income and a decline in our print business as reflected in other, net. Realized investment gains (losses) included $12.2 million of OTTI in 2010, compared with $61.4 million of OTTI in 2009.
Total benefits and expenses were lower in 2010 primarily as a result of lower sales commissions partially offset by an increase in other operating expenses. Sales commissions expense was lower in 2010 consistent with the decline in commissions and fees revenue noted above. Other operating expenses increased primarily as a result of public company and IPO-related expenses incurred in 2010.
For additional segment information, see Note 3 to our consolidated and combined financial statements.
| 91 |
Table of Contents
Index to Financial Statements
2009 Compared to 2008
Consolidated Overview
| Year ended December 31, |
Change | |||||||||||||||
| 2009 | 2008 | $ | % | |||||||||||||
| (Dollars in thousands) | ||||||||||||||||
| Revenues |
||||||||||||||||
| Direct premiums |
$ | 2,112,781 | $ | 2,092,792 | $ | 19,989 | * | |||||||||
| Ceded premiums |
(610,754 | ) | (629,074 | ) | 18,320 | -3 | % | |||||||||
| Net premiums |
1,502,027 | 1,463,718 | 38,309 | 3 | % | |||||||||||
| Net investment income |
351,326 | 314,035 | 37,291 | 12 | % | |||||||||||
| Commissions and fees |
335,986 | 466,484 | (130,498 | ) | -28 | % | ||||||||||
| Other, net |
53,032 | 56,187 | (3,155 | ) | -6 | % | ||||||||||
| Realized investment (losses) gains , including OTTI |
(21,970 | ) | (103,480 | ) | 81,510 | -79 | % | |||||||||
| Total revenues |
2,220,401 | 2,196,944 | 23,457 | 1 | % | |||||||||||
| Benefits and expenses |
||||||||||||||||
| Benefits and claims |
600,273 | 938,370 | (338,097 | ) | -36 | % | ||||||||||
| Amortization of DAC |
381,291 | 144,490 | 236,801 | 164 | % | |||||||||||
| Insurance commissions |
34,388 | 23,932 | 10,456 | 44 | % | |||||||||||
| Insurance expenses |
148,760 | 141,331 | 7,429 | 5 | % | |||||||||||
| Sales commissions |
162,756 | 248,020 | (85,264 | ) | -34 | % | ||||||||||
| Goodwill impairment |
— | 194,992 | (194,992 | ) | * | |||||||||||
| Other operating expenses |
132,978 | 152,773 | (19,795 | ) | -13 | % | ||||||||||
| Total benefits and expenses |
1,460,446 | 1,843,908 | (383,462 | ) | -21 | % | ||||||||||
| Income before income taxes |
759,955 | 353,036 | 406,919 | 115 | % | |||||||||||
| Income taxes |
265,366 | 185,354 | 80,012 | 43 | % | |||||||||||
| Net income |
$ | 494,589 | $ | 167,682 | $ | 326,907 | 195 | % | ||||||||
| * | Less than 1%, or not meaningful |
Income before income taxes. Income before income taxes increased $406.9 million, or 115%, to $760.0 million for the year ended December 31, 2009 from $353.0 million for the year ended December 31, 2008. The increase reflected the impact of a $291.4 million increase in Corporate and Other Distributed Products, a $147.3 million increase in Term Life Insurance and a $31.8 million decrease in Investments and Savings Products.
Total revenues. Total revenues increased $23.5 million, or 1%, to $2.2 billion for the year ended December 31, 2009 from $2.2 billion for the year ended December 31, 2008. The increase reflected the impact of a $69.1 million increase in Term Life Insurance due to the change in our DAC and reserve estimation approach in 2008 and an increased allocation of net investment income; a $40.7 million increase in Corporate and Other Distributed Products, due primarily to a lower level of other-than-temporary impairments taken in 2009, partially offset by a decline in sales commissions from the sale of our loan products; and an $86.4 million decrease in Investment and Savings Products due to adverse market and economic conditions.
Total benefits and expenses. Total benefits and expenses decreased $383.5 million, or 21%, to $1.5 billion for the year ended December 31, 2009 from $1.8 billion for the year ended December 31, 2008. The decrease reflected the impact of a $250.7 million
decline in Corporate and Other Distributed Products, which resulted from a $195.0 million goodwill impairment charge in 2008 and from a decline in commissions due to lower sales of loan products; a $78.2 million decrease in Term Life Insurance, primarily due to the impact of the change in our DAC and reserve estimation approach in 2008; and a $54.6 million decline due to lower sales commissions.
Income taxes. Income taxes increased $80.0 million, or 43%, to $265.4 million for the year ended December 31, 2009 from $185.4 million for the year ended December 31, 2008. The effective tax rate was 34.9% and 52.5% for the years ended December 31, 2009 and 2008, respectively. The decrease in the effective tax rate was primarily a result of the $195.0 million non-tax deductible goodwill impairment charge
| 92 |
Table of Contents
Index to Financial Statements
recognized in 2008. Excluding the effect of the goodwill impairment charge, the effective tax rate would have been 33.2% for the year ended December 31, 2008.
Term Life Insurance Segment
| Year ended December 31, |
Change | |||||||||||||||
| 2009 | 2008 | $ | % | |||||||||||||
| (Dollars in thousands) | ||||||||||||||||
| Revenues |
||||||||||||||||
| Direct premiums |
$ | 2,030,988 | $ | 2,007,339 | $ | 23,649 | 1 | % | ||||||||
| Ceded premiums |
(596,791 | ) | (613,386 | ) | 16,595 | -3 | % | |||||||||
| Net premiums |
1,434,197 | 1,393,953 | 40,244 | 3 | % | |||||||||||
| Allocated net investment income |
274,212 | 244,736 | 29,476 | 12 | % | |||||||||||
| Other, net |
33,656 | 34,333 | (677 | ) | -2 | % | ||||||||||
| Total revenues |
1,742,065 | 1,673,022 | 69,043 | 4 | % | |||||||||||
| Benefits and expenses |
||||||||||||||||
| Benefits and claims |
559,038 | 894,910 | (335,872 | ) | -38 | % | ||||||||||
| Amortization of DAC |
371,663 | 131,286 | 240,377 | 183 | % | |||||||||||
| Acquisition and operating expenses, net of deferrals |
152,352 | 135,007 | 17,345 | 13 | % | |||||||||||
| Total benefits and expenses |
1,083,053 | 1,161,203 | (78,150 | ) | -7 | % | ||||||||||
| Segment income before income taxes |
$ | 659,012 | $ | 511,819 | $ | 147,193 | 29 | % | ||||||||
Our Term Life Insurance results set forth above for the year ended December 31, 2009 are not directly comparable to results for the year ended December 31, 2008 due to a change in our DAC and reserve estimation approach implemented in the fourth quarter of 2008. The impact of this change on our Term Life Insurance results for the year ended December 31, 2009 is illustrated in the table below:
| Actual year-to-year change |
Adjustment for change in DAC and reserve estimation approach |
Year-to-year change (Before change in DAC and reserve estimation approach) |
||||||||||||||||||
| $ | % | $ | $ | % | ||||||||||||||||
| (Dollars in thousands) | ||||||||||||||||||||
| Direct premiums |
$ | 23,649 | 1 | % | $ | (6,870 | ) | $ | 30,519 | 2 | % | |||||||||
| Ceded premiums |
$ | 16,595 | -3 | % | $ | 57,810 | $ | (41,215 | ) | -7 | % | |||||||||
| Benefits and claims |
$ | (335,872 | ) | -38 | % | $ | (328,258 | ) | $ | (7,614 | ) | * | ||||||||
| Amortization of DAC |
$ | 240,377 | 183 | % | $ | 179,391 | $ | 60,986 | 46 | % | ||||||||||
| Acquisition and operating expenses, net of deferrals |
$ | 17,345 | 13 | % | $ | 8,088 | $ | 9,257 | 7 | % | ||||||||||
| Segment income before income taxes |
$ | 147,193 | 29 | % | $ | 191,718 | $ | (44,525 | ) | -9 | % | |||||||||
| * | Less than 1% |
| 93 |
Table of Contents
Index to Financial Statements
In-force book. The following table reflects changes in our in-force book of term life insurance policies for the periods presented:
| Year ended December 31, |
Change | |||||||||||||||
| 2009 | 2008 | $ | % | |||||||||||||
| (Dollars in millions) | ||||||||||||||||
| Face amount in-force, beginning of period |
$ | 633,467 | $ | 632,086 | $ | 1,381 | * | |||||||||
| Issued face amount |
80,497 | 87,279 | (6,782 | ) | -8 | % | ||||||||||
| Terminations and other changes |
(63,769 | ) | (85,898 | ) | 22,129 | -26 | % | |||||||||
| Face amount in-force, end of period |
$ | 650,195 | $ | 633,467 | $ | 16,728 | 3 | % | ||||||||
| * | Less than 1% |
The in-force book increased $16.7 billion, or 3%, to $650.2 billion as of December 31, 2009 from $633.5 billion as of December 31, 2008. Issued face amount decreased $6.7 billion, or approximately 8%, due to slightly lower sales force productivity and lower average size of policies issued. Terminations and other changes decreased by $22.1 billion. The decrease in the value of the Canadian dollar, as measured against the U.S. dollar and as applied to our total book of in-force policies, resulted in a $25.1 billion decrease in terminations and other changes, which was partially offset by an increase in lapses.
Net premiums. Net premiums increased $40.2 million, or 3%, to $1.43 billion for the
year ended December 31, 2009 from $1.39 billion for the year ended December 31, 2008. Direct premiums increased $23.6 million, or 1%, to $2.03 billion for 2009 from $2.01 billion for 2008. Of this increase, $30.5 million was attributable to an increase in the size of the in-force book, partially offset by $6.9 million attributable to the change in our DAC and reserve estimation approach in 2008. Ceded premiums decreased by $16.6 million, or 3%, to $596.8 million for the year ended December 31, 2009 from $613.4 million for the year ended December 31, 2008. Ceded YRT premiums, which increase over time with increases in the aging of policies as well as an overall increase in the percentage of the in-force block subject to YRT reinsurance, were higher by $41.2 million. This increase was more than offset by the ceded premium impact of the DAC and reserve estimation approach implemented in 2008 of $57.8 million.
Allocated net investment income. Allocated net investment income increased $29.5 million, or 12%, to $274.2 million for the year ended December 31, 2009 from $244.7 million for the year ended December 31, 2008. This increase primarily resulted from growth in the book value of invested assets and higher book yield.
Other, net. Other, net decreased $0.7 million, or 2%, to $33.7 million for the year ended December 31, 2009 from $34.3 million for the year ended December 31, 2008. This decrease was primarily due to lower receipts from sales force recruits for licensing related fees.
Benefits and claims. Benefits and claims decreased $335.9 million, or 38%, to $559.0 million for the year ended December 31, 2009 from $894.9 million for the year ended December 31, 2008. Of this decrease, $328.3 million was attributable to the change in our DAC and reserve estimation approach implemented in 2008. The remaining decrease of $7.6 million was attributable to lower reserve increases. The lower reserve increases resulted from a lower percentage of expected future net premiums needed to fund future claims due to our change in DAC and reserve estimation approach in 2008, offset by actual persistency that was higher than our pricing assumption on older blocks of insurance, which caused a greater increase in the reserve balance in 2009.
Amortization of DAC. Amortization of DAC increased $240.4 million, or 183%, to $371.7 million for the year ended December 31, 2009 from $131.3 million for the year ended December 31, 2008. This increase was primarily attributable to the $179.4 million impact of the change in our DAC and reserve estimation approach implemented in 2008. The remaining $60.9 million increase resulted from a higher percentage of net premiums needed to
| 94 |
Table of Contents
Index to Financial Statements
amortize the higher DAC balance resulting from the change in our DAC and reserve estimation approach in 2008. We also adjusted our estimation for waiver of premium coverages to reflect additional lapses that occur at the end of the initial level premium period, resulting in an approximately $14 million increase in DAC amortization.
Acquisition and operating expenses, net of deferrals. Acquisition and operating expenses, net of deferrals, increased $17.3 million, or 13%, to $152.4 million for the year ended December 31, 2009 from $135.0 million for the year ended December 31, 2008. This increase was primarily attributable to a $9.0 million increase in nondeferrable commissions related to a special incentive compensation payment to the sales force and an $8.1 million adjustment in expense allowance accruals made in conjunction with the change in DAC and reserve estimation approach.
Investments and Savings Products
Segment
| Year ended December 31, |
Change | |||||||||||||||
| 2009 | 2008 | $ | % | |||||||||||||
| (Dollars in thousands) | ||||||||||||||||
| Revenues |
||||||||||||||||
| Commissions and fees |
$ | 289,626 | $ | 374,791 | $ | (85,165 | ) | -23 | % | |||||||
| Other, net |
10,514 | 11,717 | (1,203 | ) | -10 | % | ||||||||||
| Total revenues |
300,140 | 386,508 | (86,368 | ) | -22 | % | ||||||||||
| Expenses |
||||||||||||||||
| Commission expenses, including amortization of DAC |
143,000 | 193,148 | (50,148 | ) | -26 | % | ||||||||||
| Other operating expenses |
63,736 | 68,197 | (4,461 | ) | -7 | % | ||||||||||
| Total expenses |
206,736 | 261,345 | (54,609 | ) | -21 | % | ||||||||||
| Segment income before income taxes |
$ | 93,404 | $ | 125,163 | $ | (31,759 | ) | -25 | % | |||||||
| 95 |
Table of Contents
Index to Financial Statements
Commissions and fees. The following table sets forth a breakdown of our commissions and fees and the aggregate investment value of sales of investment and savings products that generate sales-based revenue, asset values for accounts that generate asset-based revenues and the number of fee-generating accounts:
| Year ended December 31, |
Change | |||||||||||||||
| 2009 | 2008 | $ | % | |||||||||||||
| (Dollars and accounts in thousands) | ||||||||||||||||
| Revenue source |
||||||||||||||||
| Sales-based revenues |
$ | 118,798 | $ | 168,614 | $ | (49,816 | ) | -30 | % | |||||||
| Asset-based revenues |
$ | 127,581 | $ | 158,934 | $ | (31,353 | ) | -20 | % | |||||||
| Account-based revenues |
$ | 43,247 | $ | 47,243 | $ | (3,996 | ) | -8 | % | |||||||
| Revenue metric |
||||||||||||||||
| Product sales |
$ | 2,743,568 | $ | 3,966,436 | $ | (1,222,868 | ) | -31 | % | |||||||
| Average account values |
$ | 26,611,607 | $ | 32,163,880 | $ | (5,552,273 | ) | -17 | % | |||||||
| Average number of fee-generating accounts |
2,839 | 3,082 | (243 | ) | -8 | % | ||||||||||
Commissions and fees decreased $85.2 million, or 23%, to $289.6 million for the year ended December 31, 2009 from $374.8 million for the year ended December 31, 2008. This decrease resulted primarily from declines in sales-based revenues and asset-based revenues of $49.8 million and $31.4 million, respectively. The decline in sales-based revenue resulted from adverse economic and market conditions. The decline in asset-based revenue resulted from lower account values during the period due to lower equity valuations in the United States and Canada beginning in the second half of 2008 and continuing through the fourth quarter of 2009. Account-based revenues declined $4.0 million as a result of lower sales of funds for which we act as recordkeeper. Differences in the percentage change between commission and fee revenues and underlying revenue metrics were primarily attributable to changes in the product mix, none of which was deemed material on an individual basis in the comparative periods, as well as small variances attributable to averaging.
Other, net. Other, net decreased $1.2 million, or 10%, to $10.5 million for the year ended December 31, 2009 from $11.7 million for the year ended December 31, 2008. The decrease
resulted from lower incentive payments received from product originators in 2009.
Commission expenses, including amortization of DAC. Commission expenses, including amortization of DAC, decreased $50.1 million, or 26%, to $143.0 million for the year ended December 31, 2009 from $193.1 million for the year ended December 31, 2008. This decrease resulted from declines in sales activity and asset values as a result of adverse economic and market conditions.
Other operating expenses. Other operating expenses decreased $4.5 million, or 7%, to $63.7 million for the year ended December 31, 2009 from $68.2 million for the year ended December 31, 2008. This decrease was primarily the result of a $0.7 million decline in administrative fees paid on Canadian segregated fund products due primarily to a decline in underlying asset values, $1.4 million lower incentive compensation accruals for 2009, and $0.8 million lower call center and other outsourcing expenses.
| 96 |
Table of Contents
Index to Financial Statements
Corporate and Other Distributed
Products Segment
| Year ended December 31, |
Change | |||||||||||||||
| 2009 | 2008 | $ | % | |||||||||||||
| (dollars in thousands) | ||||||||||||||||
| Revenues |
||||||||||||||||
| Net premiums |
$ | 67,830 | $ | 69,765 | $ | (1,935 | ) | -3 | % | |||||||
| Allocated net investment income |
77,114 | 69,299 | 7,815 | 11 | % | |||||||||||
| Commissions and fees |
46,360 | 91,693 | (45,333 | ) | -49 | % | ||||||||||
| Other, net |
8,862 | 10,137 | (1,275 | ) | -13 | % | ||||||||||
| Realized investment gains (losses), including OTTI |
(21,970 | ) | (103,480 | ) | 81,510 | -79 | % | |||||||||
| Total revenues |
178,196 | 137,414 | 40,782 | 30 | % | |||||||||||
| Benefits and expenses |
||||||||||||||||
| Benefits and claims |
41,235 | 43,461 | (2,226 | ) | -5 | % | ||||||||||
| Insurance acquisition and operating expense, net of deferrals |
26,339 | 25,976 | 363 | 1 | % | |||||||||||
| Other distributed product expenses and commissions |
46,159 | 82,641 | (36,482 | ) | -44 | % | ||||||||||
| Goodwill impairment |
— | 194,992 | (194,992 | ) | * | |||||||||||
| Other unallocated corporate expenses |
56,924 | 74,290 | (17,366 | ) | -23 | % | ||||||||||
| Total benefits and expenses |
170,657 | 421,360 | (250,703 | ) | -59 | % | ||||||||||
| Segment income (loss) before income taxes |
$ | 7,539 | $ | (283,947 | ) | $ | 291,486 | * | ||||||||
| * | Less than 1%, or not meaningful |
Net premiums. Net premiums decreased $1.9 million, or 3%, to $67.8 million for the year ended December 31, 2009 from $69.8 million for the year ended December 31, 2008. This decrease primarily resulted from a decline in premiums from our other insurance products.
Allocated net investment income. Allocated net investment income increased $7.8 million, or 11%, to $77.1 million for the year ended December 31, 2009 from $69.3 million for the year ended December 31, 2008. This increase primarily relates to an increase in invested assets and higher book yield, offset by a slight decline in the percentage of invested assets allocated to Corporate and Other Distributed Products. The decrease in the percentage of invested assets allocated to Corporate and Other Distributed Products resulted from a slight increase in the allocation to Term Life Insurance due to higher statutory reserve and capital requirements.
Commissions and fees. Commissions and fees decreased $45.3 million, or 49%, to $46.4
million for the year ended December 31, 2009 from $91.7 million for the year ended December 31, 2008. This decrease in commissions and fees was attributable to a decline in sales of loan products. Loan sales were depressed due to adverse economic conditions and tightening credit standards. Sales of loan products declined 56% to $1.9 billion of loans for 2009 from $4.4 billion of loans for 2008.
Other, net. Other, net decreased $1.3 million, or 13%, to $8.9 million for the year ended December 31, 2009 from $10.1 million for the year ended
December 31, 2008. This decrease was primarily due to lower income from our print operations due to decreased sales to Citi affiliates.
Realized investment gains (losses), including OTTI. Realized investment losses, including OTTI, decreased $81.5 million, or 79%, to a $22.0 million loss for the year ended December 31, 2009 from a $103.5 million loss for the year ended December 31, 2008. This decrease in losses resulted from higher gains from sale and lower other than-temporary impairments of invested assets for the year ended December 31, 2009.
Benefits and claims. Benefits and claims decreased $2.2 million, or 5%, to $41.2 million for the year ended December 31, 2009 from $43.5 million for the year ended December 31, 2008, consistent with premium volumes.
| 97 |
Table of Contents
Index to Financial Statements
Other distributed product expenses and commissions. Other distributed product expenses and commissions decreased $36.5 million, or 44%, to $46.2 million for the year ended December 31, 2009 from $82.6 million for the year ended December 31, 2008. This decrease resulted primarily from a decline in commissions expense associated with declining sales of loan products.
Goodwill impairment. We recognized a $195 million goodwill impairment charge resulting from a determination, based on impairment testing as of December 31, 2008, that maintaining the goodwill balance was unsupportable in light of the deterioration in financial markets and weak economic outlook at that time, among other factors.
Other unallocated corporate expenses. Other unallocated corporate expenses decreased $17.4 million, or 23%, to $56.9 million for the year ended December 31, 2009 from $74.3 million for the year ended December 31, 2008. This decrease primarily reflected the impact of $9.5 million in retention bonuses paid in 2008, a $2.1 million reduction in incentive compensation and staffing related expenses (including salaries and benefits) in 2009, and a $2.0 million reduction in printing costs due to decreased sales of printing to other Citi affiliates.
For additional segment information, see Note 3 to our consolidated and combined financial statements.
FINANCIAL CONDITION
Investments
We have an investment committee composed of members of our senior management team that is responsible for establishing and maintaining our investment guidelines and supervising our investment activity. Our investment committee regularly monitors our overall investment results and our compliance with our investment objectives and guidelines. We use a third-party investment advisor to manage our investing activities. Our investment advisor reports to and is supervised by our investment committee.
We follow a conservative investment strategy designed to emphasize the preservation of our invested assets and provide adequate liquidity for the prompt payment of claims. In an effort to meet business needs and mitigate risks, our investment guidelines provide restrictions on our portfolio’s composition, including limits on asset type, sector limits, credit quality limits, portfolio duration, limits on the amount of investments in approved countries and permissible security types. We may also direct our investment managers to invest some of our invested asset portfolio in currencies other than the U.S. dollar. For example, a portion of our portfolio is invested in assets denominated in Canadian dollars which, at minimum, would equal our reserves for policies denominated in Canadian dollars. Additionally, to help ensure adequate liquidity for payment of claims, we take into account the maturity and duration of our invested asset portfolio and our general liability profile.
Our invested asset portfolio is subject to a variety of risks, including risks related to general economic conditions, market volatility, interest rate fluctuations, liquidity risk and credit and default risk. Investment guideline restrictions have been established in an effort to minimize the effect of these risks but may not always be effective due to factors beyond our control. Interest rates are highly sensitive to many factors, including governmental monetary policies, domestic and international economic and political conditions and other factors beyond our control. A significant increase in interest rates could result in significant losses, realized or unrealized, in the value of our invested asset portfolio. Additionally, with respect to some of our investments, we are subject to prepayment and, therefore, reinvestment risk.
| 98 |
Table of Contents
Index to Financial Statements
The composition of our invested asset portfolio was as follows:
| December 31, | ||||||||||||||||
| 2010 | 2009 | |||||||||||||||
| $ | % | $ | % | |||||||||||||
| (Dollars in thousands) | ||||||||||||||||
| Fixed-maturity securities, at fair value |
$ | 2,081,361 | 97 | % | $ | 6,378,179 | 99 | % | ||||||||
| Equity securities, at fair value |
23,213 | 1 | 49,326 | * | ||||||||||||
| Trading securities, at fair value |
22,767 | 1 | 16,996 | * | ||||||||||||
| Policy loans and other invested assets |
26,243 | 1 | 26,947 | * | ||||||||||||
| Total investments (1) |
$ | 2,153,584 | 100 | % | $ | 6,471,448 | 100 | % | ||||||||
| * | Less than 1% |
| (1) | Totals may not add due to rounding. |
The average rating of our fixed-maturity portfolio is single A, with an average duration of approximately 3.6 years. The composition and duration of our portfolio will vary depending on several factors, including the yield curve and our opinion of the relative value among various asset classes. The distribution of our investments in fixed-maturity securities by rating follows:
| December 31, | ||||||||
| 2010 | 2009 | |||||||
| AAA |
27 | % | 28 | % | ||||
| AA |
9 | 10 | ||||||
| A |
22 | 23 | ||||||
| BBB |
36 | 32 | ||||||
| Below investment grade |
7 | 7 | ||||||
| Not rated |
* | * | ||||||
| Total fixed-maturity securities (1) |
100 | % | 100 | % | ||||
| * | Less than 1% |
| (1) | Totals may not add due to rounding. |
Fixed-Maturity Securities and Equity Securities Available for Sale. The types of assets in our
portfolio are influenced by various state and Canadian laws that prescribe qualified invested assets. We invest in assets giving consideration to such factors as liquidity and capital needs, investment quality, investment return, matching of assets and liabilities, and the overall composition of the invested asset portfolio by asset type and creditexposure.
The fair value of invested assets, and therefore the unrealized gains and losses of the assets, are subject to rapidly changing conditions, including volatility of financial markets and changes in interest rates. Management
considers a number of factors in determining if an unrealized loss is other-than-temporary, including our intent to sell or whether it is more-likely-than-not we would be required to sell the investment before the expected recovery of the cost or amortized cost basis. Net unrealized gains were $157.4 million as of December 31, 2010, compared with $243.5 million as of December 31, 2009. The decline in net unrealized gains was primarily due to the smaller invested asset portfolio resulting from the Citi reinsurance transactions and our corporate reorganization.
| 99 |
Table of Contents
Index to Financial Statements
As of December 31, 2010, the ten largest holdings within our invested asset portfolio were as follows:
| Issuer |
Amortized cost |
Fair value |
Unrealized gain |
|||||||||
| (Dollars in thousands) | ||||||||||||
| Government of Canada |
$ | 33,091 | $ | 37,177 | $ | 4,086 | ||||||
| General Electric Co. |
14,309 | 16,193 | 1,884 | |||||||||
| National Rural Utilities Cooperative |
12,851 | 15,906 | 3,055 | |||||||||
| Verizon Communications Inc |
13,503 | 15,439 | 1,936 | |||||||||
| Bank of America Corporation |
12,706 | 13,708 | 1,002 | |||||||||
| Edison International |
11,052 | 11,173 | 121 | |||||||||
| ConocoPhillips |
9,279 | 10,796 | 1,517 | |||||||||
| Medtronic Inc. |
10,484 | 10,743 | 259 | |||||||||
| Enel SpA |
10,540 | 10,573 | 33 | |||||||||
| Toyota Motor Corporation |
10,021 | 10,094 | 73 | |||||||||
| Total |
$ | 137,836 | $ | 151,802 | $ | 13,966 | ||||||
| Percent of total fixed-maturity and equity securities |
7 | % | 7 | % | ||||||||
For additional information, see Note 4 to our consolidated and combined financial statements.
Other Significant Assets and Liabilities
The balances of and changes in other significant assets and liabilities were as follows:
| December 31, | ||||||||||||
| 2010 | 2009 | Change | ||||||||||
| (In thousands) | ||||||||||||
| Due from reinsurers |
$ | 3,731,634 | $ | 867,242 | $ | 2,864,392 | ||||||
| Deferred policy acquisition costs |
853,211 | 2,789,905 | (1,936,694 | ) | ||||||||
| Future policy benefits |
(4,409,183 | ) | (4,197,454 | ) | 211,729 | |||||||
| Current income tax payable |
(43,224 | ) | (90,890 | ) | (47,666 | ) | ||||||
| Deferred income taxes |
(93,002 | ) | (799,727 | ) | (706,725 | ) | ||||||
Due from reinsurers reflects future policy benefit reserves due from third-party reinsurers, including the Citi reinsurers. Such amounts are reported as due from reinsurers rather than offsetting future policy benefits. As a result, the effect of coinsuring 80% or 90% of our 2009 year-end in-force book significantly increased our due from reinsurers balance at December 31, 2010.
The significant reduction in deferred policy acquisition costs was primarily a result of the term life DAC balances transferred to the Citi reinsurers based on their percentage of DAC on the specific policies covered under the applicable coinsurance agreements.
Consistent with other reinsurance transactions, the Citi reinsurance transactions did not relieve us of our direct liability to our policyholders even when the reinsurer is liable to us. As a result, these transactions had no impact on the balance of future policy benefits at December 31, 2010. The slight increase in future policy benefits relative to year-end 2009 was primarily a result of the aging of and growth in our in-force book of business.
The decrease in income taxes from December 31, 2009, was largely due to recognizing the tax effects of the transactions we executed in connection with our corporate reorganization.
Income taxes were also impacted by elections we made under Section 338(h)(10) of the Internal Revenue Code which reduced our deferred tax balances. Additionally, as a result of previously being consolidated in Citi’s federal income tax return, prior to the closing of and in accordance with our tax separation agreement, we prepaid our estimated tax liability to Citi. The advance tax payments we made to Citi exceeded our actual tax liabilities. As a result, we reduced tax assets and recorded the excess payment as a return of capital.
For additional information, see the notes to our consolidated and combined financial statements.
Off-Balance Sheet Arrangements
We have no off-balance sheet arrangements, as defined in the rules and regulations of the SEC, that have or are reasonably likely to have a material current or future effect on our financial condition, changes in financial condition, revenues or expenses, results of operations, liquidity, capital expenditures or capital resources that would be material to investors.
| 100 |
Table of Contents
Index to Financial Statements
LIQUIDITY AND CAPITAL RESOURCES
Dividends and other payments to us from our subsidiaries are our principal sources of cash. Our primary uses of funds by the Parent Company level include the payment of general operating expenses, the payment of dividends and the payment of principal and interest to Citi under the Citi note. In the future, we may enter into other debt financing arrangements that will require the payment of principal and interest, or, at the discretion of our Board of Directors, use excess capital to repurchase outstanding shares of our common stock in open market purchases or in privately negotiated transactions with one or more of our existing stockholders.
The liquidity requirements of our subsidiaries principally relate to the liabilities associated with their distribution and underwriting of insurance products (including the payment of claims), distribution of investment and savings products, operating expenses, income taxes and the payment of dividends. Historically, our insurance subsidiaries have used cash flow from operations associated with our in-force book of term life insurance to fund their liquidity requirements. Our insurance subsidiaries’ principal cash inflows from operating activities are derived from policyholder premiums and investment income earned on invested assets that support our statutory capital and reserves. We also derive cash inflows from the distribution of investment and savings products and other products. Our principal outflows relate to payments for ceded premiums and benefits and claims. The principal cash inflows from investment activities result from repayments of principal and investment income, while the principal outflows relate to purchases of fixed-maturity securities. We typically hold cash sufficient to fund operating flows, and invest any excess cash. At December 31, 2010, our cash balance was $126.0 million and was significantly lower than at year-end 2009, primarily as a result of the cash distributions to Citi and other payables that were settled in April 2010.
Our distribution and underwriting of term life insurance places significant demands on our liquidity, particularly when we experience growth. We pay a substantial majority of the sales commission during the first year following the sale of a policy. Our underwriting activities also require significant cash outflows at the inception of a policy’s term. Following and as a result of the Citi reinsurance transactions (without giving effect to any other factors), the cash flows from our retained in-force book of term life insurance policies were significantly lower. This has reduced our operating cash flows for the near to intermediate term; however, we anticipate that cash flows from our businesses, including our existing block of policies and our investment and savings products, will continue to provide us with sufficient liquidity to meet our operating requirements. Over the next few years, we expect our growing premium revenue base from policies issued after the Citi reinsurance transactions to increase operating cash flows.
We may seek to enhance our liquidity position or capital structure through borrowings from third-party sources, sales of debt or equity securities, reserve financing or some combination of these sources. The Model Regulation entitled Valuation of Life Insurance Policies, commonly known as Regulation XXX, requires insurers to carry statutory reserves for term life insurance policies with long-term premium guarantees which are often significantly in excess of the reserves that insurers deem necessary to satisfy claim obligations. Accordingly, many insurance companies have sought ways to reduce their capital needs by financing these excess reserves through bank financing, reinsurance arrangements or other financing transactions. Although we have not used reserve financing in the past, we may enter into these types of arrangements in the future.
Cash Flows
Cash flows from operating activities are affected primarily by the timing of premiums received, commissions and fees received, benefits paid, commissions paid to sales representatives, administrative and selling expenses, investment income, and cash taxes. Our principal source of cash historically has been premiums received on term life insurance policies in force.
| 101 |
Table of Contents
Index to Financial Statements
We typically generate positive cash flows from operating activities, as premiums, commissions and fees collected from our insurance and investment and savings products exceed benefits, commissions and operating expenses paid, and we invest the excess. Net cash used in financing activities primarily represents dividends paid to Citi. The components of the change in cash and cash equivalents were as follows:
| Year ended December 31, | ||||||||||||
| 2010 | 2009 | 2008 | ||||||||||
| (In thousands) | ||||||||||||
| Net cash provided by operating activities |
$ | 41,057 | $ | 716,344 | $ | 670,083 | ||||||
| Net cash provided by (used in) investing activities |
739,574 | (357,855 | ) | (562,300 | ) | |||||||
| Net cash used in financing activities |
(1,289,893 | ) | (56,427 | ) | (436,200 | ) | ||||||
| Effect of foreign exchange rate changes on cash |
32,778 | (1,894 | ) | 5,421 | ||||||||
| (Decrease) increase in cash and cash equivalents |
$ | (476,484 | ) | $ | 300,168 | $ | (322,996 | ) | ||||
Operating Activities. The decrease in cash provided by operating activities for 2010, compared with 2009 was primarily the result of lower net cash flows on our term life insurance business and lower net investment income, both of which were substantially impacted by the Citi reinsurance transactions and our corporate reorganization. Additionally, there was an increase in income taxes paid in connection with the Citi reinsurance transactions. These cash outflows were partially offset by an increase in cash provided by our investment and savings products due to improved sales and higher values of client accounts on which we earn fees.
The increase in cash provided by operating activities for 2009, compared with 2008 was primarily the result of increases of cash from net investment income, growth in our term life insurance in force and a reduction in income taxes paid, offset by a decrease of cash provided by our investment and savings products due to the decline in sales caused by adverse economic and market conditions.
Investing Activities. The increase in cash provided by investing activities for 2010, compared with 2009 was primarily the result of significant securities sales activity and lower securities purchases as we increased our cash position in anticipation of the Transactions.
The decrease in cash used in investing activities for 2009, compared with 2008 was primarily the result of increasing cash and cash equivalent positions in anticipation of the Transactions.
Financing Activities. The increase in cash used in financing activities for 2010, compared with 2009 represents the cash payment of dividends paid to Citi as part of the Transactions, the cash portion of the Citi dividend declared in December 2009 and paid in January 2010, and the dividends to stockholders declared and paid in the third and fourth quarters of 2010.
The decrease in cash used in financing activities during 2009, compared with 2008 reflects a reduction in
dividends paid to Citi and a dividend payable of $149.0 million at December 31, 2009.
Citi Note
In April 2010, we issued a $300.0 million note to Citi as part of our corporate reorganization in which Citi transferred to us the businesses that comprise our operations. Prior to the issuance of the Citi note, we had no outstanding debt. The Citi note bears interest at an annual rate of 5.5%, payable semi-annually in arrears on January 15 and July 15, and matures March 31, 2015. Citi may participate out, assign or sell all or any portion of the note at any time.
We have the option to redeem the Citi note in whole or in part at a redemption price equal to 100% of the principal amount to be redeemed plus accrued and unpaid interest to the date of redemption. In the event of a change in control, the holder of the Citi note has the right to require us to repurchase it at a price equal to 101% of the outstanding principal amount plus accrued and unpaid interest.
The Citi note also requires us to use our commercially reasonable efforts to arrange and consummate an offering of investment-grade debt securities, trust preferred securities,
| 102 |
Table of Contents
Index to Financial Statements
surplus notes, hybrid securities or convertible debt that generates sufficient net cash proceeds (after deducting fees and expenses) to repay the note in full at certain mutually agreeable dates, based on certain conditions.
We were in compliance with all of the covenants of the Citi note at December 31, 2010. No events of default or defaults occurred during 2010.
We calculate our debt-to-capital ratio by dividing total long-term debt by the sum of stockholders’ equity and total long-term debt. As of December 31, 2010, our debt-to-capital ratio was 17.3%.
Short-Term Borrowings
We had no short-term borrowings as of or during 2010.
Rating Agencies
As of December 31, 2010, Primerica Life’s financial strength rating was AA- by Standard & Poor’s; A+ (Superior) by A.M. Best and A+ by Fitch.
Risk-Based Capital
The NAIC has established RBC standards for U.S. life insurers, as well as a risk-based capital model act (the “RBC Model Act”) that has been adopted by the insurance regulatory authorities. The RBC Model Act requires that life insurers annually submit a report to state regulators regarding their RBC based upon four categories of risk: asset risk; insurance risk; interest rate risk and business risk. The capital requirement for each is determined by applying factors that vary based upon the degree of risk to various asset, premiums and reserve items. The formula is an early warning tool to identify possible weakly capitalized companies for purposes of initiating further regulatory action.
Prior to and after the reinsurance and reorganization transactions, our U.S. life insurance subsidiaries had statutory capital substantially in excess of the applicable statutory requirements to support existing operations and to fund future growth. We intend to take a conservative approach toward RBC levels, particularly in light of our anticipated growth. Over time, our management may opt to change RBC levels to levels that are more consistent with companies whose business is similar to ours.
In Canada, an insurer’s minimum capital requirement is overseen by OSFI and determined as the sum of the capital requirements for five categories of risk: asset default risk; mortality/morbidity/lapse risks; changes in interest rate environment risk; segregated funds risk and foreign exchange risk. Primerica Life Canada is currently in compliance with Canada’s minimum capital requirements, as determined by OSFI.
| 103 |
Table of Contents
Index to Financial Statements
Contractual Obligations
Our contractual obligations, including payments due by period, were as follows:
| December 31, 2010 | ||||||||||||||||||||||||
| Total Liability* |
Total Payments |
Less than 1 year |
1-3 years |
3-5 years |
More than 5 years |
|||||||||||||||||||
| (In millions) | ||||||||||||||||||||||||
| Future policy benefits |
$ | 4,409 | $ | 17,726 | $ | 1,116 | $ | 2,229 | $ | 2,166 | $ | 12,215 | ||||||||||||
| Policy claims and other benefits payable |
230 | 230 | 230 | — | — | — | ||||||||||||||||||
| Other policyholders’ funds |
357 | 357 | 357 | — | — | — | ||||||||||||||||||
| Citi note |
300 | 372 | 17 | 34 | 321 | — | ||||||||||||||||||
| Commissions |
18 | 495 | 161 | 77 | 65 | 192 | ||||||||||||||||||
| Purchase obligations |
3 | 24 | 11 | 13 | — | — | ||||||||||||||||||
| Operating lease obligations |
n/a | 24 | 7 | 11 | 3 | 3 | ||||||||||||||||||
| Current income tax payable |
43 | 43 | 43 | — | — | — | ||||||||||||||||||
| Total contractual obligations |
$ | 5,360 | $ | 19,271 | $ | 1,942 | $ | 2,364 | $ | 2,555 | $ | 12,410 | ||||||||||||
| * | Liability amounts are those reported on the consolidated and combined balance sheet as of December 31, 2010. |
Our liability for future policy benefits represents the present value of estimated future policy benefits to be paid, less the present value of estimated future net premiums to be collected. Net premiums represent the portion of gross premiums required to provide for all benefits and associated expenses. These benefit payments are contingent on policyholders continuing to renew their policies and make their premium payments. Our contractual obligations table discloses the impact of benefit payments that will be due assuming the underlying policy renewals and premium payments continue as expected in our actuarial models. The future policy benefits represented in the table are presented on an undiscounted basis, gross of any amounts recoverable through reinsurance agreements and gross of any premiums to be collected. We expect to fully fund the obligations for future policy benefits from cash flows from general account invested assets and from future premiums. These estimations are based on mortality and lapse assumptions comparable with our historical experience. Due to the significance of the assumptions used, the amounts presented could materially differ from actual results.
Policy claims and other benefits payable represents claims and benefits currently owed to policyholders.
Other policyholders’ funds primarily represent claim payments left on deposit with us.
Commissions represent gross, undiscounted commissions that we expect to incur, contingent on the policyholders continuing to renew their policies and make their premium payments as noted above.
Purchase obligations include agreements to purchase goods or services that are enforceable and legally binding and that specify all significant terms. These obligations consist primarily of accounts payable and certain accrued liabilities, including committed funds related to meetings and conventions for our independent sales force, plus a variety of vendor commitments funding our ongoing business operations.
Our operating lease obligations primarily relate to office and warehouse space and office equipment.
For additional information concerning our commitments and contingencies, see Note 17 to our consolidated and combined financial statements.
| 104 |
Table of Contents
Index to Financial Statements
ITEM 7A. QUANTITATIVE AND QUALITATIVE DISCLOSURES ABOUT MARKET RISK.
Market risk is the risk of the loss of fair value resulting from adverse changes in market rates and prices, such as interest rates and foreign currency exchange rates. Market risk is directly influenced by the volatility and liquidity in the markets in which the related underlying financial instruments are traded. Sensitivity analysis measures the impact of hypothetical changes in interest rates, foreign exchange rates and other market rates or prices on the profitability of market-sensitive financial instruments.
The following discussion about the potential effects of changes in interest rates and Canadian currency exchange rates is based on shock-tests, which model the effects of interest rate and Canadian exchange rate shifts on our financial condition and results of operations. Although we believe shock tests provide the most meaningful analysis permitted by the rules and regulations of the SEC, they are constrained by several factors, including the necessity to conduct the analysis based on a single point in time and by their inability to include the extraordinarily complex market reactions that normally would arise from the market shifts modeled. Although the following results of shock tests for changes in interest rates and Canadian currency exchange rates may have some limited use as benchmarks, they should not be viewed as forecasts. These disclosures also are selective in nature and address, in the case of interest rates, only the potential direct impact on our financial instruments, and in the case of Canadian currency exchange rates, the potential translation impact on net income from our Canadian subsidiaries. They do not include a variety of other potential factors that could affect our business as a result of these changes in interest rates and Canadian currency exchange rates.
Interest Rate Risk
The carrying value of our invested asset portfolio, excluding policy loans and cash, as of December 31, 2010 was $2.13 billion and 99% of these investments were fixed-maturity securities. The primary market risk to our invested asset portfolio is interest rate risk associated with investments in fixed-maturity securities.
One means of assessing exposure of our fixed-maturity securities portfolio to interest rate changes is a duration-based analysis that measures the potential changes in market value resulting from a hypothetical change in interest rates of 100 basis points across all maturities. This is sometimes referred to as a parallel shift in the yield curve. Under this model, with all other factors constant and assuming no offsetting change in the value of our liabilities, we estimated that such an increase in interest rates would cause the market value of our fixed-maturity securities portfolio to decline by approximately $67.1 million, or 3.2%, based on our actual securities positions as of December 31, 2010.
Canadian Currency Risk
We also have exposure to foreign currency exchange risk to the extent we conduct business in Canada. For the year ended December 31, 2010, 16% of our revenues from operations, excluding realized investment gains, were generated by our Canadian operations. A strong Canadian dollar relative to the U.S. dollar results in higher levels of reported revenues, expenses, net income, assets, liabilities and accumulated other comprehensive income (loss) in our U.S. dollar financial statements and a weaker Canadian dollar has the opposite effect. Historically, we have not hedged this exposure, although we may elect to do so in future periods.
One means of assessing exposure to changes in Canadian currency exchange rates is to model effects on reported income using a sensitivity analysis. We analyzed our Canadian currency exposure for the year ended December 31, 2010. Net exposure was measured assuming a 10% decrease in Canadian currency exchange rates compared to the U.S. dollar. We estimated that such a decrease would decrease our net income before income taxes for the year ended December 31, 2010 by approximately $8.2 million.
| 105 |
Table of Contents
Index to Financial Statements
ITEM 8. FINANCIAL STATEMENTS AND SUPPLEMENTARY DATA.
REPORT OF INDEPENDENT REGISTERED PUBLIC ACCOUNTING FIRM
The stockholders and board of directors of Primerica, Inc.:
We have audited the accompanying consolidated and combined balance sheets of Primerica, Inc. and subsidiaries (the Company) as of December 31, 2010 and 2009, and the related consolidated and combined statements of income, stockholders’ equity, comprehensive income, and cash flows for each of the years in the three-year period ended December 31, 2010. These consolidated and combined financial statements are the responsibility of the Company’s management. Our responsibility is to express an opinion on these consolidated and combined financial statements based on our audits.
We conducted our audits in accordance with the standards of the Public Company Accounting Oversight Board (United States). Those standards require that we plan and perform the audit to obtain reasonable assurance about whether the financial statements are free of material misstatement. An audit includes examining, on a test basis, evidence supporting the amounts and disclosures in the financial statements. An audit also includes assessing the accounting principles used and significant estimates made by management, as well as evaluating the overall financial statement presentation. We believe that our audits provide a reasonable basis for our opinion.
In our opinion, the consolidated and combined financial statements referred to above present fairly, in all material respects, the financial position of Primerica, Inc. and subsidiaries as of December 31, 2010 and 2009, and the results of their operations and their cash flows for each of the years in the three-year period ended December 31, 2010, in conformity with U.S. generally accepted accounting principles.
As discussed in notes 1 and 2 to the consolidated and combined financial statements, in April 2010 the Company completed its initial public offering and a series of related transactions. Also as discussed in note 1 to the consolidated and combined financial statements, the Company adopted the provisions of FASB Staff Position Financial Accounting Standard No. 115-2 and Financial Accounting Standard No. 124-2, Recognition and Presentation of Other-Than-Temporary Impairments (included in FASB ASC Topic 320, Investments — Debt and Equity Securities) as of January 1, 2009.
/s/ KPMG LLP
Atlanta, Georgia
March 17, 2011
| 106 |
Table of Contents
Index to Financial Statements
PRIMERICA, INC. AND SUBSIDIARIES
Consolidated and Combined Balance Sheets
| December 31, | ||||||||
| 2010 | 2009 | |||||||
| (In thousands) | ||||||||
| Assets |
||||||||
| Investments: |
||||||||
| Fixed-maturity securities available for sale, at fair value (amortized cost: $1,929,757 in 2010 and $6,138,058 in 2009) |
$ | 2,081,361 | $ | 6,378,179 | ||||
| Equity securities available for sale, at fair value (cost: $17,394 in 2010 and $45,937 in 2009) |
23,213 | 49,326 | ||||||
| Trading securities, at fair value (cost: $22,619 in 2010 and $18,387 in 2009) |
22,767 | 16,996 | ||||||
| Policy loans |
26,229 | 26,921 | ||||||
| Other invested assets |
14 | 26 | ||||||
| Total investments |
2,153,584 | 6,471,448 | ||||||
| Cash and cash equivalents |
126,038 | 602,522 | ||||||
| Accrued investment income |
22,328 | 71,382 | ||||||
| Due from reinsurers |
3,731,634 | 867,242 | ||||||
| Deferred policy acquisition costs |
853,211 | 2,789,905 | ||||||
| Premiums and other receivables |
168,026 | 169,225 | ||||||
| Intangible assets |
75,357 | 78,895 | ||||||
| Due from affiliates |
— | 1,915 | ||||||
| Other assets |
307,342 | 569,268 | ||||||
| Separate account assets |
2,446,786 | 2,093,342 | ||||||
| Total assets |
$ | 9,884,306 | $ | 13,715,144 | ||||
| Liabilities and Stockholders’ Equity |
||||||||
| Liabilities: |
||||||||
| Future policy benefits |
$ | 4,409,183 | $ | 4,197,454 | ||||
| Unearned premiums |
5,563 | 3,185 | ||||||
| Policy claims and other benefits payable |
229,895 | 218,390 | ||||||
| Other policyholders’ funds |
357,253 | 382,768 | ||||||
| Note payable |
300,000 | — | ||||||
| Current income tax payable |
43,224 | 90,890 | ||||||
| Deferred income taxes |
93,002 | 799,727 | ||||||
| Due to affiliates |
— | 202,507 | ||||||
| Other liabilities |
386,182 | 273,007 | ||||||
| Payable under securities lending |
181,726 | 510,101 | ||||||
| Separate account liabilities |
2,446,786 | 2,093,342 | ||||||
| Commitments and contingent liabilities (see Note 17) |
||||||||
| Total liabilities |
8,452,814 | 8,771,371 | ||||||
| Stockholders’ equity: |
||||||||
| Common stock ($0.01 par value, authorized 500,000 in 2010 and issued 72,843 in 2010) |
728 | — | ||||||
| Paid-in capital |
883,168 | 1,124,096 | ||||||
| Retained earnings |
395,057 | 3,648,801 | ||||||
| Accumulated other comprehensive income, net of income tax: |
||||||||
| Unrealized foreign currency translation gains |
56,492 | 40,891 | ||||||
| Net unrealized investment gains (losses): |
||||||||
| Net unrealized investment gains not other-than-temporarily impaired |
98,322 | 146,105 | ||||||
| Net unrealized investment losses other-than-temporarily impaired |
(2,275 | ) | (16,120 | ) | ||||
| Total stockholders’ equity |
1,431,492 | 4,943,773 | ||||||
| Total liabilities and stockholders’ equity |
$ | 9,884,306 | $ | 13,715,144 | ||||
See accompanying notes to consolidated and combined financial statements.
| 107 |
Table of Contents
Index to Financial Statements
Consolidated and Combined Statements of Income
| Year ended December 31, | ||||||||||||
| 2010 | 2009 | 2008 | ||||||||||
| (In thousands, except per-share amounts) | ||||||||||||
| Revenues: |
||||||||||||
| Direct premiums |
$ | 2,181,074 | $ | 2,112,781 | $ | 2,092,792 | ||||||
| Ceded premiums |
(1,450,367 | ) | (610,754 | ) | (629,074 | ) | ||||||
| Net premiums |
730,707 | 1,502,027 | 1,463,718 | |||||||||
| Net investment income |
165,111 | 351,326 | 314,035 | |||||||||
| Commissions and fees |
382,940 | 335,986 | 466,484 | |||||||||
| Realized investment gains (losses), including other-than-temporary impairment losses |
34,145 | (21,970 | ) | (103,480 | ) | |||||||
| Other, net |
48,960 | 53,032 | 56,187 | |||||||||
| Total revenues |
1,361,863 | 2,220,401 | 2,196,944 | |||||||||
| Benefits and expenses: |
||||||||||||
| Benefits and claims |
317,703 | 600,273 | 938,370 | |||||||||
| Amortization of deferred policy acquisition costs |
168,035 | 381,291 | 144,490 | |||||||||
| Insurance commissions |
19,904 | 34,388 | 23,932 | |||||||||
| Insurance expenses |
75,503 | 148,760 | 141,331 | |||||||||
| Sales commissions |
179,924 | 162,756 | 248,020 | |||||||||
| Interest expense |
20,872 | — | — | |||||||||
| Goodwill impairment |
— | — | 194,992 | |||||||||
| Other operating expenses |
180,779 | 132,978 | 152,773 | |||||||||
| Total benefits and expenses |
962,720 | 1,460,446 | 1,843,908 | |||||||||
| Income before income taxes |
399,143 | 759,955 | 353,036 | |||||||||
| Income taxes |
141,365 | 265,366 | 185,354 | |||||||||
| Net income |
$ | 257,778 | $ | 494,589 | $ | 167,682 | ||||||
| Earnings per share: |
||||||||||||
| Basic |
$ | 3.43 | (1) | |||||||||
| Diluted |
$ | 3.40 | (1) | |||||||||
| Weighted-average shares used in computing earnings per share: |
||||||||||||
| Basic |
72,099 | |||||||||||
| Diluted |
72,882 | |||||||||||
| (1) | Pro forma basis using weighted-average shares, including the shares following our April 1, 2010 corporate reorganization as though they had been issued and outstanding on January 1, 2010. |
| Supplemental disclosures: |
||||||||||||
| Total impairment losses |
$ | (12,711 | ) | $ | (74,967 | ) | $ | (114,022 | ) | |||
| Impairment losses recognized in other comprehensive income before income taxes |
553 | 13,573 | — | |||||||||
| Net impairment losses recognized in earnings |
(12,158 | ) | (61,394 | ) | (114,022 | ) | ||||||
| Other net realized investment gains |
46,303 | 39,424 | 10,542 | |||||||||
| Realized investment gains (losses), including other-than-temporary impairment losses |
$ | 34,145 | $ | (21,970 | ) | $ | (103,480 | ) | ||||
See accompanying notes to consolidated and combined financial statements.
| 108 |
Table of Contents
Index to Financial Statements
PRIMERICA, INC. AND SUBSIDIARIES
Consolidated and Combined Statements of Stockholders’ Equity
| Year ended December 31, | ||||||||||||
| 2010 | 2009 | 2008 | ||||||||||
| (In thousands) | ||||||||||||
| Common stock: |
||||||||||||
| Balance, beginning of period |
$ | — | $ | — | $ | — | ||||||
| Issuance of common stock to Citigroup Inc. |
750 | — | — | |||||||||
| Net shares issued |
1 | — | — | |||||||||
| Treasury stock retired |
(23 | ) | — | — | ||||||||
| Balance, end of period |
728 | — | — | |||||||||
| Paid-in capital: |
||||||||||||
| Balance, beginning of period |
1,124,096 | 1,095,062 | 1,136,656 | |||||||||
| Net capital contributed from (to) Citigroup Inc. |
167,701 | 30,870 | (38,166 | ) | ||||||||
| Net issuance of common stock to Citigroup Inc. |
(727 | ) | — | — | ||||||||
| Issuance of warrants to Citigroup Inc. |
18,464 | — | — | |||||||||
| Issuance of note payable to Citigroup Inc. |
(300,000 | ) | — | — | ||||||||
| Tax election under Section 338(h)(10) of the Internal Revenue Code |
(172,460 | ) | — | — | ||||||||
| Share-based compensation |
46,094 | (1,836 | ) | (3,428 | ) | |||||||
| Balance, end of period |
883,168 | 1,124,096 | 1,095,062 | |||||||||
| Retained earnings: |
||||||||||||
| Balance, beginning of period |
3,648,801 | 3,340,841 | 3,596,058 | |||||||||
| Adoption of FSP SFAS No. 115-2 (included in ASC 320), net of income |
— | 7,298 | — | |||||||||
| Net income |
257,778 | 494,589 | 167,682 | |||||||||
| Distribution of warrants to Citigroup Inc. |
(18,464 | ) | — | — | ||||||||
| Distributions to Citigroup Inc. |
(3,491,556 | ) | (193,927 | ) | (422,900 | ) | ||||||
| Dividends ($0.02 per share in 2010) |
(1,502 | ) | — | — | ||||||||
| Share-based compensation |
— | — | 1 | |||||||||
| Balance, end of period |
395,057 | 3,648,801 | 3,340,841 | |||||||||
| Treasury stock: |
||||||||||||
| Balance, beginning of period |
— | — | — | |||||||||
| Treasury stock acquired |
(75,420 | ) | — | — | ||||||||
| Treasury stock issued, at cost |
41,056 | — | — | |||||||||
| Treasury stock retired |
34,364 | — | — | |||||||||
| Balance, end of period |
— | — | — | |||||||||
| Accumulated other comprehensive income: |
||||||||||||
| Balance, beginning of period |
170,876 | (323,917 | ) | 47,251 | ||||||||
| Adoption of FSP SFAS No. 115-2 (included in ASC 320), net of income |
— | (7,298 | ) | — | ||||||||
| Change in foreign currency translation adjustment, net of income tax (expense) benefit of $(4,630) in 2010, $(27,125) in 2009 and $32,438 in 2008 |
15,601 | 49,715 | (60,198 | ) | ||||||||
| Change in net unrealized investment gains (losses) during the period, |
||||||||||||
| Change in net unrealized investment gains (losses) not other-than-temporarily impaired, net of income tax benefit (expense) of $24,848 in 2010, $(245,060) in 2009, and $167,304 in 2008 |
(47,783 | ) | 461,198 | (310,970 | ) | |||||||
| Change in net unrealized investment gains (losses) other-than-temporarily impaired, net of income tax (expense) benefit of $(7,455) in 2010 and $4,751 in 2009 |
13,845 | (8,822 | ) | — | ||||||||
| Balance, end of period |
152,539 | 170,876 | (323,917 | ) | ||||||||
| Total stockholders’ equity |
$ | 1,431,492 | $ | 4,943,773 | $ | 4,111,986 | ||||||
See accompanying notes to consolidated and combined financial statements.
| 109 |
Table of Contents
Index to Financial Statements
PRIMERICA, INC. AND SUBSIDIARIES
Consolidated and Combined Statements of Comprehensive Income
| Year ended December 31, | ||||||||||||
| 2010 | 2009 | 2008 | ||||||||||
| (In thousands) | ||||||||||||
| Net income |
$ | 257,778 | $ | 494,589 | $ | 167,682 | ||||||
| Other comprehensive (loss) income before income taxes: |
||||||||||||
| Unrealized investment gains (losses): |
||||||||||||
| Change in unrealized holding gains (losses) on investment securities |
114,867 | 663,458 | (581,909 | ) | ||||||||
| Reclassification adjustment for unrealized holding (gains) on investment securities transferred (see Note 2) |
(132,688 | ) | — | — | ||||||||
| Reclassification adjustment for realized investment (gains) losses included in net income |
(33,510 | ) | 21,929 | 103,635 | ||||||||
| Foreign currency translation adjustments: |
||||||||||||
| Change in unrealized foreign currency translation gains |
20,231 | 76,840 | (92,636 | ) | ||||||||
| Total other comprehensive (loss) income before income taxes |
(31,100 | ) | 762,227 | (570,910 | ) | |||||||
| Income tax benefit (expense) related to items of other comprehensive (loss) income |
12,763 | (267,434 | ) | 199,742 | ||||||||
| Other comprehensive (loss) income, net of income taxes |
(18,337 | ) | 494,793 | (371,168 | ) | |||||||
| Total comprehensive income (loss) |
$ | 239,441 | $ | 989,382 | $ | (203,486 | ) | |||||
See accompanying notes to consolidated and combined financial statements.
| 110 |
Table of Contents
Index to Financial Statements
PRIMERICA, INC. AND SUBSIDIARIES
Consolidated and Combined Statements of Cash Flows
| Year ended December 31, | ||||||||||||
| 2010 | 2009 | 2008 | ||||||||||
| (In thousands) | ||||||||||||
| Cash flows from operating activities: |
||||||||||||
| Net income |
$ | 257,778 | $ | 494,589 | $ | 167,682 | ||||||
| Adjustments to reconcile net income to net cash provided by operations: |
||||||||||||
| Increase in future policy benefits |
82,669 | 97,273 | 436,430 | |||||||||
| (Decrease) increase in other policy benefits |
(11,632 | ) | 51,502 | 24,569 | ||||||||
| Deferral of policy acquisition costs |
(304,754 | ) | (391,079 | ) | (432,071 | ) | ||||||
| Amortization of deferred policy acquisition costs |
168,035 | 381,291 | 144,490 | |||||||||
| Deferred tax provision |
32,030 | (19,815 | ) | (61,752 | ) | |||||||
| Change in accrued and other income taxes |
(40,701 | ) | 75,738 | 40,793 | ||||||||
| Realized investment (gains) losses, including other-than- |
(34,145 | ) | 21,970 | 103,480 | ||||||||
| Accretion and amortization of investments |
(1,878 | ) | (8,226 | ) | (2,098 | ) | ||||||
| (Income) loss recognized on equity-method investments |
(346 | ) | (6,125 | ) | 8,005 | |||||||
| Depreciation and amortization |
10,063 | 10,342 | 12,938 | |||||||||
| Change in due from reinsurers |
(57,197 | ) | (3,403 | ) | (764 | ) | ||||||
| Change in due to/from affiliates |
(44,012 | ) | 55,460 | (34,645 | ) | |||||||
| (Increase) decrease in premiums and other receivables |
(7,129 | ) | (2,975 | ) | 42,703 | |||||||
| Trading securities sold (acquired), net |
(5,994 | ) | (4,553 | ) | 12,507 | |||||||
| Share-based compensation |
33,301 | (1,794 | ) | (3,477 | ) | |||||||
| Goodwill impairment |
— | — | 194,992 | |||||||||
| Other, net |
(35,031 | ) | (33,851 | ) | 16,301 | |||||||
| Net cash provided by operating activities |
41,057 | 716,344 | 670,083 | |||||||||
| Cash flows from investing activities: |
||||||||||||
| Available-for-sale investments sold, matured or called: |
||||||||||||
| Fixed-maturity securities – sold |
993,278 | 713,805 | 523,982 | |||||||||
| Fixed-maturity securities – matured or called |
514,132 | 878,215 | 926,006 | |||||||||
| Equity securities |
36,566 | 667 | 3,968 | |||||||||
| Available-for-sale investments acquired: |
||||||||||||
| Fixed-maturity securities |
(787,683 | ) | (1,945,887 | ) | (2,011,168 | ) | ||||||
| Equity securities |
(7,560 | ) | (1,115 | ) | (4,266 | ) | ||||||
| Change in policy loans and other invested assets |
705 | 1,354 | 3,479 | |||||||||
| Purchases of furniture and equipment, net |
(9,864 | ) | (4,894 | ) | (4,301 | ) | ||||||
| Cash received (returned) as collateral on loaned securities, net |
(328,375 | ) | 156,207 | (485,468 | ) | |||||||
| (Purchases) sales of short-term investments using securities lending collateral |
328,375 | (156,207 | ) | 485,468 | ||||||||
| Net cash provided by (used in) investment activities |
739,574 | (357,855 | ) | (562,300 | ) | |||||||
| Cash flows from financing activities: |
||||||||||||
| Net distributions to Citigroup Inc. |
(1,288,391 | ) | (56,427 | ) | (436,200 | ) | ||||||
| Dividends |
(1,502 | ) | — | — | ||||||||
| Net cash used in financing activities |
(1,289,893 | ) | (56,427 | ) | (436,200 | ) | ||||||
| Effect of foreign exchange rate changes on cash |
32,778 | (1,894 | ) | 5,421 | ||||||||
| (Decrease) increase in cash and cash equivalents |
(476,484 | ) | 300,168 | (322,996 | ) | |||||||
| Cash and cash equivalents, beginning of year |
602,522 | 302,354 | 625,350 | |||||||||
| Cash and cash equivalents, end of year |
$ | 126,038 | $ | 602,522 | $ | 302,354 | ||||||
| Supplemental disclosures of cash flow information: |
||||||||||||
| Income taxes paid |
$ | 260,275 | $ | 220,988 | $ | 260,756 | ||||||
| Interest paid |
13,695 | 639 | 385 | |||||||||
| Impairment losses included in realized investment gains (losses), |
12,158 | 61,394 | 114,022 | |||||||||
| Non-cash activities: |
||||||||||||
| Share-based compensation |
$ | 46,094 | $ | (1,836 | ) | $ | (3,427 | ) | ||||
| Net (distributions to) contributions from Citigroup Inc. |
(2,035,464 | ) | 42,370 | (24,866 | ) | |||||||
See accompanying notes to consolidated and combined financial statements.
| 111 |
Table of Contents
Index to Financial Statements
PRIMERICA, INC. AND SUBSIDIARIES
Notes to Consolidated and Combined Financial Statements
(1) Summary of Significant Accounting Policies
Description of Business. Primerica, Inc. (the Parent Company) together with its subsidiaries (collectively, the Company) is a leading distributor of financial products to middle income households in North America. The Company assists its clients in meeting their needs for term life insurance, which it underwrites, and mutual funds, variable annuities and other financial products, which it distributes primarily on behalf of third parties. Our primary subsidiaries include the following entities: Primerica Financial Services, Inc., a general agency and marketing company; Primerica Life Insurance Company (Primerica Life), our principal life insurance company; Primerica Financial Services (Canada) Ltd., a holding company for our Canadian operations, which includes Primerica Life Insurance Company of Canada (Primerica Life Canada); and PFS Investments, Inc., an investment products company and broker-dealer. Primerica Life, domiciled in Massachusetts, owns a New York life insurance company, National Benefit Life Insurance Company (NBLIC). Each of these entities was indirectly wholly owned by Citigroup Inc. (together with its non-Primerica affiliates, Citi) through March 31, 2010.
On March 31, 2010, Primerica Life, Primerica Life Canada and NBLIC entered into significant coinsurance transactions with Prime Reinsurance Company, Inc. (Prime Re) and two affiliates of Citi (collectively, the Citi reinsurers). In April 2010, Citi transferred the legal entities that comprise our business to us and we completed a series of transactions including the distribution of Prime Re to Citi and an initial public offering of our common stock by Citi pursuant to the Securities Act of 1933 (the Offering). See Note 2 for additional information.
Basis of Presentation. We prepare our financial statements in accordance with U.S. generally accepted accounting principles (GAAP). These principles are established primarily by the Financial Accounting Standards Board (FASB). The preparation of financial statements in conformity with GAAP requires us to make estimates and assumptions that affect financial statement balances, revenues and expenses and cash flows as well as the disclosure of contingent assets and liabilities. Management considers available facts and knowledge of existing circumstances when establishing the estimates included in our financial statements.
The most significant items that involve a greater degree of accounting estimates and actuarial determinations subject to change in the future are the valuation of investments, deferred policy acquisition costs (DAC), and liabilities for future policy benefits and unpaid policy claims. Estimates for these and other items are subject to change and are reassessed by management in accordance with GAAP. Actual results could differ from those estimates.
The accompanying consolidated and combined financial statements include the accounts of the Company and those entities required to be consolidated or combined under applicable accounting standards. All material intercompany profits, transactions, and balances among the consolidated or combined entities have been eliminated. Financial statements for 2010 have been consolidated and include those assets, liabilities, revenues, and expenses directly attributable to the Company’s operations. Financial statements for 2009 and 2008 have been combined and include those assets, liabilities, revenues, and expenses directly attributable to the Company’s operations.
Reclassifications. Certain reclassifications have been made to prior-period amounts to conform to current-period reporting classifications. These reclassifications had no impact on net income or total stockholders’ equity.
Immaterial Error Correction. During the year ended December 31, 2010, we corrected a prior period immaterial error relating to our securities lending program. The adjustment reflects our obligation to return the cash portion of the securities lending collateral,
| 112 |
Table of Contents
Index to Financial Statements
which we are able to reinvest at our own risk. To mitigate the related risk, we reinvest this collateral in short-term, highly rated securities. We have adjusted all periods presented to reflect the cash collateral received as a payable under securities lending, with the related collateral assets reflected within other assets in the consolidated and combined balance sheet. We have also adjusted the consolidated and combined statements of cash flows to reflect the investing activities related to these transactions. The correction resulted in an increase to both total assets and total liabilities of $510.1 million as of December 31, 2009. This correction, which is reflected in the Corporate and Other Distributed Products Segment, had no impact on net income or stockholders’ equity.
Foreign Currency Translation. Assets and liabilities denominated in Canadian dollars are translated into U.S. dollars using year-end exchange rates. Revenues and expenses are translated monthly at amounts that approximate weighted-average exchange rates, with resulting gains and losses included in stockholders’ equity. We may use currency swap and forward contracts to mitigate foreign currency exposures.
Investments. Investments are reported on the following bases:
| • | Available-for-sale fixed-maturity securities, including bonds and redeemable preferred stocks not classified as trading securities, are carried at fair value. When quoted market values are unavailable, we obtain estimates from independent pricing services or estimate fair value based upon a comparison to quoted issues of the same issuer or of other issuers with similar characteristics. |
| • | Equity securities, including common and nonredeemable preferred stocks, are classified as available for sale and are carried at fair value. When quoted market values are unavailable, we obtain estimates from independent pricing services or estimate fair value based upon a comparison to quoted issues of the same issuer or of other issuers with similar characteristics. |
| • | Trading securities, which primarily consist of bonds, are carried at fair value. Changes in fair value of trading securities are included in net investment income in the period in which the change occurred. |
| • | Policy loans are carried at unpaid principal balances, which approximate fair value. |
We record investment transactions on a trade-date basis. We use the specific-identification method to determine the realized gains or losses from securities transactions and report the realized gains or losses in the accompanying consolidated and combined statements of income.
We include unrealized gains and losses on available-for- sale securities as a separate component of accumulated other comprehensive income except for the credit loss component of other-than-temporary declines in fair value, which is recorded as realized losses in the accompanying consolidated and combined statements of income.
We review investments on a quarterly basis for other-than-temporary impairment (OTTI). Credit risk, interest rate risk, duration of the unrealized loss, actions taken by ratings agencies, and other factors are considered in determining whether an unrealized loss is other-than-temporary. Prior to January 1, 2009, if an unrealized loss was determined to be other-than-temporary, an impairment charge was recorded as the difference between amortized cost and fair value. Our combined statement of income for the year ended December 31, 2008 reflects the full impairment (that is, the difference between amortized cost basis and fair value) on debt securities that we did not have the ability and intent to hold until a recovery of the amortized cost basis, which may have been maturity. Subsequent to December 31, 2008, our consolidated and combined statements of income for the years ended December 31, 2010 and 2009 reflect the full impairment on debt securities that we intend to sell or would more-likely than-not be required to sell before the expected recovery of the amortized cost basis. For available-for-sale (AFS) debt securities that management has no intent to sell and believes that it more-likely than-not will not be required to sell prior to
| 113 |
Table of Contents
Index to Financial Statements
recovery, only the credit loss component of the impairment is recognized in earnings, while the remainder is recognized in accumulated other comprehensive income (AOCI) in the accompanying consolidated and combined financial statements. The credit loss component recognized in earnings is identified as the amount of principal cash flows not expected to be received over the remaining term of the security. Any subsequent changes in fair value of the security related to non-credit factors recognized in other comprehensive income are presented as an adjustment to the amount previously presented in the net unrealized investment gains (losses) other-than-temporarily impaired category of accumulated other comprehensive income.
We participate in securities lending transactions with broker-dealers and other financial institutions to increase investment income with minimal risk. We require, at the initiation of the agreement, minimum collateral on securities loaned equal to 102% of the fair value of the loaned securities. We continue to carry the lent securities as investment assets on our balance sheet during the terms of the loans, and we do not report them as sales. We receive cash or other securities as collateral for these loans. For loans involving unrestricted cash collateral, the collateral is reported as an asset with a corresponding liability representing our obligation to return the collateral. For securities lending transactions involving securities collateral, we do not have the right to sell or encumber collateral; this collateral is not reported as an asset or a liability.
Interest income on fixed-maturity securities is recorded when earned using the effective-yield method, which gives consideration to amortization of premiums and accretion of discounts. Dividend income on equity securities is recorded when declared. These amounts are included in net investment income in the accompanying consolidated and combined statements of income.
Included within fixed-maturity securities are loan-backed and asset-backed securities. Amortization of the premium or accretion of the discount uses the retrospective method. The effective yield used to determine amortization/accretion is calculated based on actual and historical projected future cash flows, which are obtained from a widely accepted data provider and updated quarterly.
Derivative instruments are stated at fair value based on market prices. Gains and losses arising from forward contracts are a component of realized gains and losses in the accompanying consolidated and combined statements of income.
Cash and Cash Equivalents. Cash and cash equivalents include cash on hand, money market instruments, and all other highly liquid investments purchased with an original or remaining maturity of three months or less at the date of acquisition.
Reinsurance. We use reinsurance extensively, utilizing yearly renewable term and coinsurance agreements. Under yearly renewable term agreements, we reinsure only the mortality risk, while under coinsurance, we reinsure a proportionate part of all risks arising under the reinsured policy. Under coinsurance, the reinsurer receives a proportionate part of the premiums, less commission allowances, and is liable for a corresponding part of all benefit payments.
All reinsurance contracts in effect for 2010 and 2009 transfer a reasonable possibility of substantial loss to the reinsurer or are accounted for under the deposit method of accounting.
Ceded premiums are treated as a reduction to direct premiums and are recognized when due to the assuming company. Ceded claims are treated as a reduction to direct benefits and are recognized when the claim is incurred on a direct basis. Ceded policy reserve changes are also treated as a reduction to benefits expense and are recognized during the applicable financial reporting period.
Reinsurance premiums, commissions, expense reimbursements, benefits, and reserves related to reinsured long-duration contracts are accounted for over the life of the underlying contracts using assumptions consistent with those used to account for the underlying policies. Amounts recoverable from reinsurers are estimated in a manner consistent with the claim liabilities and policy benefits associated
| 114 |
Table of Contents
Index to Financial Statements
with reinsured policies. Ceded policy reserves and claims liabilities relating to insurance ceded are shown as due from reinsurers on the accompanying consolidated and combined balance sheets.
We analyze and monitor the credit-worthiness of each of our reinsurance partners to minimize collection issues. For reinsurance contracts with unauthorized reinsurers, we require collateral such as letters of credit.
To the extent we receive ceding allowances to cover policy and claims administration under reinsurance contracts, these allowances are treated as a reduction to insurance commissions and expenses and are recognized when due from the assuming company. To the extent we receive ceding allowances reimbursing commissions that would otherwise be deferred; the amount of commissions deferrable will be reduced. The corresponding deferred policy acquisition costs (DAC) balances are reduced on a pro rata basis by the portion of the business reinsured with reinsurance agreements that meet risk transfer provisions. The reduced DAC will result in a corresponding reduction of amortization expense.
Deferred Policy Acquisition Costs. The costs of acquiring new business are deferred to the extent that they vary with and are primarily related to the acquisition of such new business. These costs mainly include commissions and policy issue expenses. The recovery of such costs is dependent on the future profitability of the related policies, which, in turn, is dependent principally upon investment returns, mortality, persistency and the expense of administering the business, as well as upon certain economic variables. Deferred policy acquisition costs are subject to annual recoverability testing and when impairment indicators exist. We make certain assumptions regarding persistency, expenses, interest rates and claims. The assumptions for these types of products may not be modified, or unlocked, unless recoverability testing deems them to be inadequate. Assumptions are updated for new business to reflect the most recent experience. Deferrable policy acquisition costs are amortized over the premium-paying period of the related policies in proportion to annual premium income. Acquisition costs for Canadian segregated funds are amortized over the life of the policies in relation to estimated gross profits before amortization. Due to the inherent uncertainties in making assumptions about future events, materially different experience from expected results in persistency or mortality could result in a material increase or decrease of DAC amortization in a particular period.
Intangible Assets. Intangible assets are amortized over their estimated useful lives. Any intangible asset that was deemed to have an indefinite useful life is not amortized but is subject to an annual impairment test. An impairment exists if the carrying value of the indefinite-lived intangible asset exceeds its fair value. For the other intangible assets, which are subject to amortization, an impairment is recognized if the carrying amount is not recoverable and exceeds the fair value of the intangible asset.
Property, Plant, and Equipment. Equipment and leasehold improvements, which are included in other assets, are stated at cost, less accumulated depreciation and amortization. Leasehold improvements are amortized over the remaining life of the lease. Computer hardware, software, and other equipment are depreciated over three to five years. Furniture is depreciated over seven years.
Property, plant and equipment were as follows:
| December 31, | ||||||||
| 2010 | 2009 | |||||||
| (In thousands) | ||||||||
| Data processing equipment and software |
$ | 55,793 | $ | 52,320 | ||||
| Leasehold improvements |
14,148 | 14,142 | ||||||
| Other, principally furniture and equipment |
22,437 | 21,649 | ||||||
| 92,378 | 88,111 | |||||||
| Accumulated depreciation |
(76,055 | ) | (74,836 | ) | ||||
| Net property, plant, and equipment |
$ | 16,323 | $ | 13,275 | ||||
| 115 |
Table of Contents
Index to Financial Statements
Depreciation expense was as follows:
| Year ended December 31, | ||||||||||||
| 2010 | 2009 | 2008 | ||||||||||
| (In thousands) | ||||||||||||
| Depreciation expense |
$ | 6,895 | $ | 6,803 | $ | 8,339 | ||||||
The decline in depreciation expense in 2009 was primarily a result of several assets being fully depreciated. Depreciation expense is included in other operating expenses in the accompanying consolidated and combined statements of income.
Separate Accounts. The separate accounts primarily consist of contracts issued by the Company through its subsidiary, Primerica Life Canada, pursuant to the Insurance Companies Act (Canada). The Insurance Companies Act authorizes Primerica Life Canada to establish the separate accounts.
The separate accounts are represented by individual variable insurance contracts. Purchasers of variable insurance contracts issued by Primerica Life Canada have a direct claim to the benefits of the contract that entitles the holder to units in one or more investment funds (the Funds) maintained by Primerica Life Canada. The Funds invest in assets that are held for the benefit of the owners of the contracts. The benefits provided vary in amount depending on the market value of the Funds’ assets. The Funds’ assets are administered by Primerica Life Canada and are held separate and apart from the general assets of the Company. The liabilities reflect the variable insurance contract holders’ interests in variable insurance assets based upon actual investment performance of the respective Funds. Separate account operating results relating to contract holders’ interests are excluded from our consolidated and combined statements of income.
Primerica Life Canada’s contract offerings guarantee the maturity value at the date of maturity (or upon death of the annuitant, whichever occurs first), to be equal to 75% of the sum of all contributions made, net of withdrawals, on a “first-in first-out” basis. Otherwise, the maturity value or death benefit will be the accumulated value of units allocated to the contract at the specified valuation date. The amount of this value is not guaranteed, but will fluctuate with the fair value of the Funds.
Policyholder Liabilities. Future policy benefits are accrued over the current and
expected renewal periods of the contracts. Liabilities for future policy benefits on traditional life insurance products have been computed using a net level method, including assumptions as to investment yields, mortality, persistency, and other assumptions based on our experience, modified as necessary to reflect anticipated trends and to include provisions for possible adverse deviation. The underlying mortality tables are the Society of Actuaries (SOA) 65-70, SOA 75-80, SOA 85-90, and the 91 Bragg, modified to reflect various underwriting classifications and assumptions. Investment yield reserve assumptions at December 31, 2010 and 2009 range from approximately 4.0% to 7.0%. The liability for future policy benefits and claims on traditional life, health, and credit insurance products includes estimated unpaid claims that have been reported to us and claims incurred but not yet reported.
The reserves we establish are necessarily based on estimates, assumptions and our analysis of historical experience. Our results depend significantly upon the extent to which our actual claims experience is consistent with the assumptions we used in determining our reserves and pricing our products. Our reserve assumptions and estimates require significant judgment and, therefore, are inherently uncertain. We cannot determine with precision the ultimate amounts that we will pay for actual claims or the timing of those payments.
Other Policyholders’ Funds. Other policyholders’ funds primarily represent claim payments left on deposit with us.
Federal Income Taxes. During the first quarter of 2010, our federal income tax return was included as part of Citi’s consolidated federal income tax return. On March 30, 2010, in anticipation of our corporate reorganization, we entered into a tax separation agreement with Citi. In accordance with the tax separation agreement, Citi will be responsible for and shall
| 116 |
Table of Contents
Index to Financial Statements
indemnify and hold the Company harmless from and against any consolidated, combined, affiliated, unitary or similar federal, state or local income tax liability with respect to the Company for any taxable period ending on or before April 7, 2010, the closing date of the Offering. After the closing date, the Company was no longer part of Citi’s consolidated federal income tax return. As a result of the separation from Citi, the Company will be required to file two consolidated income tax returns for five tax years, which is expected to cover the tax years ending December 31, 2010 through December 31, 2014. Primerica Life and NBLIC will comprise one of the U.S. consolidated tax groups while the Parent Company and the remaining U.S. subsidiaries will comprise the second U.S. consolidated tax group. The method of allocation between companies is pursuant to a written agreement. Allocation is based upon separate return calculations with credit for net losses as utilized. Allocations are calculated and settled quarterly.
We are subject to the income tax laws of the United States, its states, municipalities, and certain unincorporated territories, and those of Canada. These tax laws are complex and subject to different interpretations by the taxpayer and the relevant governmental taxing authorities. In establishing a provision for income tax expense, we must make judgments and interpretations about the applicability of these inherently complex tax laws. We also must make estimates about the future impact certain items will have on taxable income in the various tax jurisdictions, both domestic and foreign.
Income taxes are accounted for under the asset and liability method. Deferred tax assets and liabilities are recognized for the future tax consequences attributable to (i) differences between the financial statement carrying amounts of existing assets and liabilities and their respective tax bases and (ii) operating loss and tax credit carryforwards. Deferred tax assets and liabilities are measured using enacted tax rates expected to apply to taxable income in the years in which those temporary differences are expected to be recovered or settled. The effect on deferred tax assets and liabilities of a change in tax rates is recognized in income in the period that includes the enactment date. Deferred tax assets are recognized subject to management’s judgment that realization is more likely than not applicable to the periods in which we expect the temporary difference will reverse.
Premium Revenues. Traditional life insurance products consist principally of those products with fixed and guaranteed premiums and benefits, and are primarily related to term products. Premiums are recognized as revenues when due.
Commissions and Fees. We receive commission revenues from the sale of various non-life insurance products. Commissions are received primarily on sales of mutual funds, variable annuities, and loans. We primarily receive trail commission revenues from mutual fund and variable annuity products based on the daily net asset value of shares sold by us. We, in turn, pay certain commissions to our sales force. We also receive marketing and support fees from product originators. Historically, we earned monthly concessions from the sale of certain mutual fund shares. This agreement ended in 2008. We also receive management fees based on the average daily net asset value of contracts related to separate account assets issued by Primerica Life Canada.
We capitalize commissions paid to sales representatives of Class B mutual fund shares managed by Legg Mason Investor Services, LLC. This asset is amortized over the same period as it is recovered. Recovery occurs within up to ninety-six months through 12b-1 distributor fees (based on daily average asset values) and contingent deferred sales charge fees, a back-end sales load charged on a declining scale over five years. These fees are charged to the mutual fund shareholders. As an amortizing asset, we periodically review this asset for impairment based on anticipated undiscounted cash flows.
We earn recordkeeping fees for administrative functions that we perform on behalf of several of our mutual fund providers and custodial fees for services performed as a non-bank custodian of our clients’ retirement plan accounts. These fees are recognized as income during the period in which they are earned.
| 117 |
Table of Contents
Index to Financial Statements
We also receive record-keeping fees monthly from mutual fund accounts on our servicing platform and in turn pay a third-party provider for its servicing of certain of these accounts.
Benefits Expense. Policy claims are charged to expense in the period in which the claims are incurred.
Share-Based Transactions. For employee share-based compensation, we determine a grant date fair value and recognize the related compensation expense, adjusted for expected forfeitures, in the statement of income over the vesting period of the respective awards. For non-employee share-based compensation, we recognize the impact throughout the vesting period and the fair value of the award is based on the vesting date. To the extent that a share-based award contains sale restrictions extending beyond the vesting date, we reduce the recognized fair value of the award to reflect the corresponding liquidity discount. Certain non-employee share-based compensation varies with and primarily relates to the acquisition or renewal of life insurance policies. We defer these expenses and amortize the impact over the life of the underlying life insurance policies acquired.
Earnings Per Share (EPS). Primerica has outstanding common stock, warrants, and equity awards. Both the vested and unvested equity awards maintain non-forfeitable dividend rights that result in dividend payment obligations on a one-to-one ratio with common shares for any future dividend declarations. These equity awards are deemed participating securities for purposes of calculating EPS.
As a result of issuing equity awards that are deemed participating securities, we calculate EPS using the two-class method. Under the two-class method, we allocate earnings to common shares and to fully vested equity awards. Earnings attributable to unvested equity awards, along with the corresponding share counts, are excluded from EPS as reflected in our consolidated statements of income.
In calculating basic EPS, we deduct any dividends and undistributed earnings allocated to unvested equity awards from net income and then divide the result by the weighted-average number of common shares and fully vested equity awards outstanding for the period.
We determine the potential dilutive effect of warrants on EPS using the treasury-stock method. Under this method, we utilize the exercise price to determine the amount of cash that would be available to repurchase shares if the warrants were exercised. We then use the average market price of our common shares during the reporting period to determine how many shares we could repurchase with the cash raised from the exercise. The net incremental share count issued represents the potential dilutive securities. We then reallocate earnings to common shares and fully vested equity awards incorporating the increased, fully diluted share count to determine diluted EPS.
The calculation of basic and diluted EPS was as follows:
| Year ended December 31, 2010 |
||||
| (In thousands) | ||||
| Basic EPS: |
||||
| Numerator: |
||||
| Net income |
$ | 257,778 | ||
| Income attributable to unvested participating securities |
(10,433 | ) | ||
| Net income used in calculating basic EPS |
$ | 247,345 | ||
| Denominator: |
||||
| Weighted-average shares |
72,099 | |||
| Basic EPS |
$ | 3.43 | ||
| Diluted EPS: |
||||
| Numerator: |
||||
| Net income |
$ | 257,778 | ||
| Income attributable to unvested participating securities |
(10,326 | ) | ||
| Net income used in calculating diluted EPS |
$ | 247,452 | ||
| Denominator: |
||||
| Weighted-average shares |
72,882 | |||
| Diluted EPS |
$ | 3.40 | ||
We calculated EPS on a pro forma basis using weighted-average shares, including the shares outstanding following our April 1, 2010 corporate reorganization as though they had been issued and outstanding on January 1, 2010.
| 118 |
Table of Contents
Index to Financial Statements
New Accounting Principles
Scope Exception Related to Embedded Credit Derivatives. In March 2010, the FASB issued ASU 2010-11, Scope Exception Related to Embedded Credit Derivatives. The update clarifies guidance on accounting for embedded derivatives to reduce the breadth of the scope exception for bifurcating and separately accounting for certain embedded credit derivative features related to the transfer of credit risk in the form of subordination of one financial instrument to another. We adopted the update as of July 2010. The update did not impact our financial position or results of operations.
Subsequent Event Disclosure. In February 2010, the FASB issued ASU 2010-9, Amendments to Certain Recognition and Disclosure Requirements. The update requires public companies to assess subsequent events through the date of issuing its financial statements but does not require disclosure of the date through which we have assessed subsequent events. We adopted ASU 2010-9 as of January 2010. The update did not impact our financial position or results of operations.
Additional Fair Value Measurement Disclosure. In January 2010, the FASB issued ASU 2010-6, Improving Disclosures About Fair Value Measurements. The update requires additional disclosure for significant transfers into and out of level 1 and level 2 instruments for reporting periods beginning after December 15, 2009. Additionally, separate presentation of purchases, sales, issuances, and settlements will be required for activity in level 3 instruments for reporting periods beginning after December 15, 2010. This new guidance did not impact our financial position or results of operations.
Elimination of QSPEs and Changes in the Consolidation Model for Variable Interest Entities. In June 2009, the FASB issued SFAS No. 166, Accounting for Transfers of Financial Assets, an amendment of FASB Statement No. 140, now authoritative under ASC 860 (ASC 860) and SFAS No. 167, Amendments to FASB Interpretation No. 46(R), now authoritative under ASC 810 (ASC 810). ASC 860 eliminates the concept of Qualifying Special Purpose Entities (QSPEs), changes the requirements for the derecognition of financial assets, and calls upon sellers of the assets to make additional disclosures about them. ASC 810 details three key changes to the consolidation model. First, former QSPEs are now included in the scope of ASC 810. In addition, the FASB has changed the method of analyzing which party to a variable interest entity (VIE) should consolidate the VIE
(known as the primary beneficiary) to a qualitative determination of which party to the VIE has “power” combined with potentially significant benefits or losses, instead of the previous quantitative risks and rewards model. The entity that has power has the ability to direct the activities of the VIE that most significantly impact the VIE’s economic performance. Finally, the new standard requires that the primary beneficiary analysis be re-evaluated whenever circumstances change. The previous rules required reconsideration of the primary beneficiary only when specified reconsideration events occurred. We adopted both standards on January 1, 2010. The adoption of this guidance has not required consolidation of any variable interest entities and did not impact our financial position or results of operations.
Other-Than-Temporary Impairments on Investment Securities. In April 2009, the FASB issued FSP SFAS No. 115-2 and SFAS No. 124-2, Recognition and Presentation of Other-Than-Temporary Impairments (ASC 320-10/FSP SFAS 115-2), which amends the recognition guidance for OTTI of debt securities and expands the financial statement disclosures for OTTI on debt and equity securities. The Company adopted the FSP in the first quarter of 2009.
As a result of this FSP, the Company’s consolidated and combined statements of income reflect the full impairment (that is, the difference between the security’s amortized cost basis and fair value) on debt securities that the Company intends to sell or would more-likely than-not be required to sell before the expected recovery of the amortized cost basis.
| 119 |
Table of Contents
Index to Financial Statements
For AFS debt securities that management has no intent to sell and believes that it is more-likely than-not will not be required to be sold prior to recovery, only the credit loss component of the impairment is recognized in earnings, while the remainder is recognized in AOCI in the accompanying consolidated and combined balance sheets. The credit loss component recognized in earnings is identified as the amount of principal and interest cash flows not expected to be received over the remaining term of the security. The cumulative effect of the change included an increase in the opening balance of retained earnings at January 1, 2009 of $11.2 million on a pretax basis ($7.3 million after-tax).
Recent accounting guidance not discussed above is not applicable, is immaterial to our financial statements, or did not have an impact on our business.
Future Application of Accounting Standards
Accounting for Deferred Policy Acquisition Costs. In October 2010, the FASB issued ASU 2010-26, Accounting for Costs Associated with Acquiring or Renewing Insurance Contracts (ASU 2010-26). The update revises the definition of deferred policy acquisition costs to reflect incremental costs directly related to the successful acquisition of new and renewed insurance contracts. The update creates a more limited definition than the current guidance, which defines deferred policy acquisition costs as those that vary with, and primarily relate to, the acquisition of insurance contracts. The revised definition increases the portion of acquisition costs being expensed as incurred rather than deferred and amortized over the lives of the underlying policies. The update allows either prospective or retrospective adoption and is required to be adopted for our fiscal year beginning January 1, 2012. While we are currently unable to quantify the impact of implementation, we expect this update to have a material adverse effect on our results of operations, as we will be required to accelerate the recognition of certain expenses associated with acquiring life insurance business.
Consolidation Analysis of Investments Held through Separate Accounts. In April 2010, the FASB issued ASU 2010-15, How Investments Held through Separate Accounts Affect an Insurer’s Consolidation Analysis of Those Investments. The update requires that an insurance entity not consider
any separate account interests held for the benefit of policy holders in an investment to be the insurer’s interests and that an insurance entity not combine those interests with its general account interest in the same investment when assessing the investment for consolidation, unless the separate account interests are held for the benefit of a related party policyholder. Additionally, in evaluating whether the retention of specialized accounting for investments in consolidation is appropriate, a separate account arrangement should be considered a subsidiary. The update requires that an insurer not consolidate an investment in which a separate account holds a controlling financial interest if the investment is not or would not be consolidated in the standalone financial statements of the separate account. This update will be effective for periods beginning after December 15, 2010. We do not expect the update to materially impact our financial position or results of operations.
(2) Corporate Reorganization
We were incorporated in Delaware in October 2009 by Citi to serve as a holding company for the life insurance and financial product distribution businesses that we have operated for more than 30 years. At such time, we issued 100 shares of common stock to Citi. These businesses, which prior to April 1, 2010 were wholly owned indirect subsidiaries of Citi, were transferred to us on April 1, 2010. In conjunction with our reorganization, we issued to a wholly owned subsidiary of Citi (i) 74,999,900 shares of our common stock (of which 24,564,000 shares of common stock were subsequently sold by Citi in the Offering completed in April 2010; 16,412,440 shares of common stock were subsequently sold by Citi in April 2010 to certain private equity funds managed by Warburg Pincus LLC (Warburg Pincus) (the private sale); and 5,021,412 shares of common stock were
| 120 |
Table of Contents
Index to Financial Statements
immediately contributed back to us for equity awards granted to our employees and sales force leaders in connection with the Offering), (ii) warrants to purchase from us an aggregate of 4,103,110 shares of our common stock (which were subsequently transferred by Citi to Warburg Pincus pursuant to the private sale), and (iii) a $300.0 million note payable due on March 31, 2015 bearing interest at an annual rate of 5.5% (the Citi note). Prior to our corporate reorganization, we had no material assets or liabilities. Upon completion of the corporate reorganization, we became a holding company with our primary asset being the capital stock of our operating subsidiaries and our primary liability being the Citi note.
Reinsurance Transactions
As part of the corporate reorganization and prior to completion of the Offering, we formed a new subsidiary, Prime Re, to which we made an initial capital contribution. On March 31, 2010, we entered into a series of coinsurance agreements with the Citi reinsurers. Under these agreements, we ceded between 80% and 90% of the risks and rewards of our term life insurance policies in force at year-end 2009. Because these agreements were part of a business reorganization among entities under common control, they did not generate any deferred gain or loss upon their execution. Concurrent with signing these agreements, we transferred the corresponding account balances in respect of the coinsured policies along with the assets to support the statutory liabilities assumed by the Citi reinsurers. On April 1, 2010, as part of our corporate reorganization, we transferred all of the issued and outstanding capital stock of Prime Re to Citi. Each of the transferred account balances, including the invested assets and the distribution of Prime Re, were transferred at book value with no gain or loss recorded in net income.
Three of the Citi coinsurance agreements satisfy GAAP risk transfer rules. Under these agreements, we ceded between 80% and 90% of our term life future policy benefit reserves, and we transferred a corresponding amount of assets to the Citi reinsurers. These transactions did not impact our future policy benefit reserves. As such, we have recorded an asset for the same amount of risk transferred in due from reinsurers. We also reduced DAC by a corresponding amount, which will reduce future amortization expenses. In addition, we will transfer between 80% and 90% of all future premiums and benefits and claims associated with these policies to the corresponding reinsurance entities. We will receive ongoing ceding allowances, which will be reflected as a reduction to insurance expenses, to cover policy and claims administration expenses under each of these reinsurance contracts.
A fourth coinsurance agreement relates to a 10% reinsurance transaction that includes an experience refund provision. This agreement does not satisfy GAAP risk transfer rules. As a result, we have accounted for this contract using deposit method accounting and have recognized a deposit asset in other assets on our balance sheet for assets backing the economic reserves. The deposit assets held in support of this agreement were $50.1 million at December 31, 2010, with no associated liability. We will make contributions to the deposit asset during the life of the agreement to fulfill our responsibility of funding the economic reserve. The market return on these deposit assets is reflected in net investment income in our statement of income during the life of the agreement. Prime Re is responsible for ensuring that there are sufficient assets to meet all statutory requirements. We will pay Prime Re a 3% finance charge for any statutory reserves required above the economic reserves. This finance charge is reflected in interest expense in our statements of income.
The net impact of these transactions was reflected as an increase in paid-in capital. Because the agreements were executed on March 31, 2010, but transferred the economic impact of the agreements retroactive to January 1, 2010, we recognized the earnings attributable to the underlying policies through March 31, 2010 in our statement of income. The corresponding impact on retained earnings was equally offset by a return of capital to Citi.
| 121 |
Table of Contents
Index to Financial Statements
Tax Separation Agreement
During the first quarter of 2010, our federal income tax return was included as part of Citi’s consolidated federal income tax return. On March 30, 2010, in anticipation of our corporate reorganization, we entered into a tax separation agreement with Citi. In accordance with the tax separation agreement, Citi will be responsible for and shall indemnify and hold the Company harmless from and against any consolidated, combined, affiliated, unitary or similar federal, state or local income tax liability with respect to the Company for any taxable period ending on or before April 7, 2010, the closing date of the Offering.
(3) Segment Information
We have two primary operating segments — Term Life Insurance and Investment and Savings Products. The Term Life Insurance segment includes underwriting profits on our in-force book of term life insurance policies, net of reinsurance, which are underwritten by our life insurance company subsidiaries. The Investment and Savings Products segment includes mutual funds and variable annuities distributed through licensed broker-dealer subsidiaries, and also includes segregated funds which is an insurance product in Canada made available through individual variable insurance contracts underwritten by Primerica Life Canada. In the United States, we distribute mutual fund products of several third-party companies and variable annuity products of MetLife, Inc., and its affiliates. We also earn fees for account servicing on a subset of the mutual funds we distribute. In Canada, we offer a Primerica-branded fund-of-funds mutual fund product, as well as mutual funds of well known mutual fund companies. These two operating segments are managed separately because their products serve different needs – term life insurance protection versus wealth-building investment and savings products.
We also have a Corporate and Other Distributed Products segment, which consists primarily of revenues and expenses related to the distribution of non-core products, including loans, various insurance products other than core term life insurance products, and prepaid legal services. With the exception of certain life and disability insurance products, which we underwrite, these products are distributed pursuant to distribution arrangements with third parties.
Assets specifically related to a segment are held in that segment. We allocate invested assets to the Term Life Insurance segment based on the book value of invested assets necessary to meet statutory reserve requirements and our targeted capital objectives. Remaining invested assets and all unrealized gains and losses are allocated to the Corporate and Other Distributed Products segment. On March 31, 2010, we signed a reinsurance agreement subject to deposit accounting (the 10% reinsurance agreement) and have recognized the deposit asset in the Term Life Insurance segment. DAC is recognized in each of the segments depending on the product to which it relates. Separate account assets supporting the segregated funds product in Canada are held in the Investment and Savings Products segment. Any remaining unallocated assets are reported in the Corporate and Other Distributed Products segment. Information regarding assets by segment follows:
| December 31, | ||||||||
| 2010 | 2009 | |||||||
| (In thousands) | ||||||||
| Assets: |
||||||||
| Term life insurance segment |
$ | 5,738,219 | $ | 9,016,674 | ||||
| Investment and savings products segment |
2,615,916 | 2,192,583 | ||||||
| Corporate and other distributed products segment |
1,530,171 | 2,505,887 | ||||||
| Total assets |
$ | 9,884,306 | $ | 13,715,144 | ||||
The significant decline in assets held in the Term Life Insurance and Corporate and Other Distributed Products segments was primarily driven by the reinsurance and reorganization transactions discussed in Note 2.
| 122 |
Table of Contents
Index to Financial Statements
The Investment and Savings Products segment also includes assets held in separate accounts. Excluding separate accounts, the Investment and Savings Product segment assets were as follows:
| December 31, | ||||||||
| 2010 | 2009 | |||||||
| (In thousands) | ||||||||
| Investment and savings products segment, excluding separate accounts |
$ | 170,326 | $ | 100,618 | ||||
Although we do not view our business in terms of geographic segmentation, details on our Canadian businesses’ percentage of total assets were as follows:
| December 31, | ||||||||
| 2010 | 2009 | |||||||
| Canadian assets as a percent of total assets |
31 | % | 23 | % | ||||
| Canadian assets as a percent of total assets, excluding separate accounts |
9 | % | 9 | % | ||||
Beginning with the three months ended June 30, 2010, we revised our segment allocation method for allocating net investment income. In connection with the 10% reinsurance agreement, we recognize the market return on the deposit asset as a component of net investment income for the Term Life Insurance segment. We then allocate the remaining net investment income based on the book value of the invested assets allocated to the Term Life Insurance segment compared to the book value of total invested assets. The revised Term Life Insurance segment net investment income allocation methodology allows for analysis of the yields generated by the invested asset portfolio and change in the size of the portfolio, along with the impact of the reinsurance deposit asset, without being impacted by changes in market value. All prior periods presented have been adjusted to consistently reflect this revised segment allocation methodology.
| 123 |
Table of Contents
Index to Financial Statements
Realized investment gains and losses are reported in the Corporate and Other Distributed Products segment. We allocate certain operating expenses associated with our sales representatives, including supervision, training and legal support, to our two primary operating segments based on the average number of licensed representatives in each segment for a given period. We also allocate technology and occupancy costs based on usage. Any remaining unallocated revenue and expense items are reported in the Corporate and Other Distributed Products segment. We measure income and loss for the segments on an income before income taxes basis. Information regarding operations by segment follows:
| Year ended December 31, | ||||||||||||
| 2010 | 2009 | 2008 | ||||||||||
| (In thousands) | ||||||||||||
| Revenues: |
||||||||||||
| Term life insurance |
$ | 808,568 | $ | 1,742,065 | $ | 1,673,022 | ||||||
| Investment and savings products |
361,807 | 300,140 | 386,508 | |||||||||
| Corporate and other distributed products |
191,488 | 178,196 | 137,414 | |||||||||
| Total revenues |
$ | 1,361,863 | $ | 2,220,401 | $ | 2,196,944 | ||||||
| Income (loss) before income taxes: |
||||||||||||
| Term life insurance |
$ | 299,044 | $ | 659,012 | $ | 511,819 | ||||||
| Investment and savings products |
113,530 | 93,404 | 125,164 | |||||||||
| Corporate and other distributed products |
(13,431) | 7,539 | (283,947 | ) | ||||||||
| Total income (loss) before income taxes |
$ | 399,143 | $ | 759,955 | $ | 353,036 | ||||||
United States revenues totaled $1.14 billion in 2010, $1.92 billion in 2009 and $1.87 billion in 2008. Canadian revenues totaled $225.4 million in 2010, $298.4 million in 2009 and $323.3 million in 2008.
Details on the contribution to results of operations by our Canadian businesses were as follows:
| Year ended December 31, | ||||||||||||
| 2010 | 2009 | 2008 | ||||||||||
| Canadian revenues as a percent of total revenues |
17 | % | 13 | % | 15 | % | ||||||
| Canadian income before income taxes as a percent of total income before income taxes |
21 | % | 16 | % | 38 | % | ||||||
The increase in the percentages of Canadian income before income taxes for 2010 was primarily a result of lower U.S. income before income taxes due to the expense associated with the IPO-related equity awards, interest expense on the Citi note and 401(k) expense. Canada’s 2008 income before income taxes was a higher percentage of total income before income taxes due to other-than-temporary impairments on investment securities, goodwill impairment and a change in the estimation method for DAC and FPB that affected our U.S. operations to a greater degree than Canada.
| 124 |
Table of Contents
Index to Financial Statements
(4) Investments
On March 31, 2010, we transferred a significant portion of our invested asset portfolio to the Citi reinsurers in connection with our corporate reorganization discussed in Note 2. As such, comparisons of cost, fair value, and unrealized gains and losses, among other items, to December 31, 2009 as well as comparisons of net investment income to prior year will reflect the effects of these transfers and result in significant variances. The period-end cost or amortized cost, gross unrealized gains and losses, and fair value of fixed-maturity and equity securities follow:
| December 31, 2010 | ||||||||||||||||
| Cost or amortized cost |
Gross unrealized gains |
Gross unrealized losses |
Fair value | |||||||||||||
| (In thousands) | ||||||||||||||||
| Securities available for sale, carried at fair value: |
||||||||||||||||
| Fixed-maturity securities: |
||||||||||||||||
| U.S. government and agencies |
$ | 21,596 | $ | 667 | $ | (61 | ) | $ | 22,202 | |||||||
| Foreign government |
81,367 | 13,182 | (8 | ) | 94,541 | |||||||||||
| States and political subdivisions |
26,758 | 754 | (293 | ) | 27,219 | |||||||||||
| Corporates (1) |
1,276,906 | 112,821 | (3,806 | ) | 1,385,921 | |||||||||||
| Mortgage-and asset-backed securities (1) |
523,130 | 31,366 | (3,018 | ) | 551,478 | |||||||||||
| Total fixed-maturity securities |
1,929,757 | 158,790 | (7,186 | ) | 2,081,361 | |||||||||||
| Equity securities |
17,394 | 5,826 | (7 | ) | 23,213 | |||||||||||
| Total fixed-maturity and equity securities |
$ | 1,947,151 | $ | 164,616 | $ | (7,193 | ) | $ | 2,104,574 | |||||||
| (1) | Includes $3.5 million of other-than-temporary non-credit-related losses recognized in AOCI. |
| December 31, 2009 | ||||||||||||||||
| Cost or amortized cost |
Gross unrealized gains |
Gross unrealized losses |
Fair value | |||||||||||||
| (In thousands) | ||||||||||||||||
| Securities available for sale, carried at fair value: |
||||||||||||||||
| Fixed-maturity securities: |
||||||||||||||||
| U.S. government and agencies |
$ | 18,452 | $ | 397 | $ | (362 | ) | $ | 18,487 | |||||||
| Foreign government |
351,167 | 39,868 | (604 | ) | 390,431 | |||||||||||
| States and political subdivisions |
35,591 | 1,044 | (597 | ) | 36,038 | |||||||||||
| Corporates (1) |
3,913,566 | 247,933 | (43,852 | ) | 4,117,647 | |||||||||||
| Mortgage- and asset-backed securities (1) |
1,819,282 | 65,675 | (69,381 | ) | 1,815,576 | |||||||||||
| Total fixed-maturity securities |
6,138,058 | 354,917 | (114,796 | ) | 6,378,179 | |||||||||||
| Equity securities |
45,937 | 4,111 | (722 | ) | 49,326 | |||||||||||
| Total fixed-maturity and equity securities |
$ | 6,183,995 | $ | 359,028 | $ | (115,518 | ) | $ | 6,427,505 | |||||||
| (1) | Includes $24.8 million of other-than-temporary non-credit-related losses recognized in AOCI. |
| 125 |
Table of Contents
Index to Financial Statements
All of our mortgage- and asset-backed securities represent variable interests in variable interest entities (VIEs). We are not the primary beneficiary of these VIEs, because we do not have the power to direct the activities that most significantly impact the entities’ economic performance. The maximum exposure to loss as a result of our involvement in these VIEs equals the carrying value of the securities.
As required by law, we have investments on deposit with governmental authorities and banks for the protection of policyholders. The fair values of investments on deposits were as follows:
| December 31, | ||||||||
| 2010 | 2009 | |||||||
| (In thousands) | ||||||||
| Fair value of investments on deposit with governmental authorities |
$ | 18,984 | $ | 18,573 | ||||
We participate in securities lending transactions with broker-dealers and other financial institutions to increase investment income with minimal risk. We require minimum collateral on securities loaned equal to 102% of the fair value of the loaned securities. We accept collateral in the form of securities, which we are not able to sell or encumber, and to the extent it declines in value below 100%, we require additional collateral from the borrower. Any securities collateral received is not reflected on our Balance Sheet. We also accept collateral in the form of cash, all of which we reinvest. We primarily invest the cash collateral in short-term, highly rated securities. The cash collateral received is reflected as a payable under securities lending on our consolidated and combined balance sheet with an offsetting other asset on our consolidated and combined balance sheet. Cash collateral received and reinvested was as follows:
| December 31, | ||||||||
| 2010 | 2009 | |||||||
| (In thousands) | ||||||||
| Securities lending collateral |
$ | 181,726 | $ | 510,101 | ||||
We also maintain a portfolio of fixed-maturity securities that are classified as trading securities. The carrying value of these securities was as follows:
| December 31, | ||||||||
| 2010 | 2009 | |||||||
| (In thousands) | ||||||||
| Fixed-maturity securities classified as trading, carried at fair value |
$ | 22,767 | $ | 16,996 | ||||
Investments in fixed-maturity and equity securities with a cost basis in excess of their fair values were as follows:
| December 31, | ||||||||
| 2010 | 2009 | |||||||
| (In thousands) | ||||||||
| Fixed-maturity and equity security investments with cost basis in excess of fair value |
$ | 258,947 | $ | 1,522,454 | ||||
| 126 |
Table of Contents
Index to Financial Statements
The following tables summarize, for all securities in an unrealized loss position, the aggregate fair value and the gross unrealized loss by length of time such securities have continuously been in an unrealized loss position:
| December 31, 2010 | ||||||||||||||||||||||||
| Less than 12 months | 12 months or longer | |||||||||||||||||||||||
| Fair value | Unrealized losses |
Number of securities |
Fair value | Unrealized losses |
Number of securities |
|||||||||||||||||||
| (Dollars in thousands) | ||||||||||||||||||||||||
| Fixed-maturity securities: |
||||||||||||||||||||||||
| U.S. government and agencies |
$ | 6,350 | $ | (61 | ) | 2 | $ | — | $ | — | — | |||||||||||||
| Foreign government |
2,478 | (8 | ) | 1 | — | — | — | |||||||||||||||||
| States and political subdivisions |
11,015 | (293 | ) | 29 | — | — | — | |||||||||||||||||
| Corporates |
151,291 | (2,961 | ) | 104 | 12,690 | (845 | ) | 14 | ||||||||||||||||
| Mortgage-and asset-backed securities |
30,685 | (365 | ) | 25 | 37,215 | (2,653 | ) | 20 | ||||||||||||||||
| Total fixed-maturity securities |
201,819 | (3,688 | ) | 49,905 | (3,498 | ) | ||||||||||||||||||
| Equity securities |
— | — | — | 30 | (7 | ) | 2 | |||||||||||||||||
| Total fixed-maturity and equity securities |
$ | 201,819 | $ | (3,688 | ) | $ | 49,935 | $ | (3,505 | ) | ||||||||||||||
| December 31, 2009 | ||||||||||||||||||||||||
| Less than 12 months | 12 months or longer | |||||||||||||||||||||||
| Fair value | Unrealized losses |
Number of securities |
Fair value | Unrealized losses |
Number of securities |
|||||||||||||||||||
| (Dollars in thousands) | ||||||||||||||||||||||||
| Fixed-maturity securities: |
||||||||||||||||||||||||
| U.S. government and agencies |
$ | 7,612 | $ | (104 | ) | 3 | $ | 4,844 | $ | (258 | ) | 2 | ||||||||||||
| Foreign government |
30,441 | (341 | ) | 30 | 7,156 | (263 | ) | 4 | ||||||||||||||||
| States and political subdivisions |
15,668 | (579 | ) | 7 | 548 | (18 | ) | 1 | ||||||||||||||||
| Corporates |
347,007 | (6,340 | ) | 185 | 471,130 | (37,512 | ) | 298 | ||||||||||||||||
| Mortgage-and asset-backed securities |
132,369 | (1,735 | ) | 50 | 377,035 | (67,646 | ) | 199 | ||||||||||||||||
| Total fixed-maturity securities |
533,097 | (9,099 | ) | 860,713 | (105,697 | ) | ||||||||||||||||||
| Equity securities |
10,947 | (492 | ) | 18 | 2,179 | (230 | ) | 17 | ||||||||||||||||
| Total fixed-maturity and equity securities |
$ | 544,044 | $ | (9,591 | ) | $ | 862,892 | $ | (105,927 | ) | ||||||||||||||
| 127 |
Table of Contents
Index to Financial Statements
Gross unrealized losses as a percentage of the fair value of total available-for-sale fixed-maturity and equity securities were less than 1% at December 31, 2010, compared with approximately 2% at December 31, 2009. The decline in the percentage from year-end 2009 was primarily a result of the strong market value gains that our invested asset portfolio has experienced in 2010 as interest rates and spreads continue to decline.
The percentages of investment-grade fixed-maturity securities in a gross unrealized loss position, by length of time, were as follows:
| December 31, | ||||||||
| 2010 | 2009 | |||||||
| Fixed-maturity securities in a gross unrealized loss position for less than 12 months that are investment grade |
92 | % | 94 | % | ||||
| Fixed-maturity securities in a gross unrealized loss position for 12 months or longer that are investment grade |
69 | % | 83 | % | ||||
The decline in the percentages of investment-grade fixed-maturity securities in an unrealized loss position was primarily a result of the change in the composition of our invested asset portfolio as a result of our corporate reorganization as well as increased market values as interest rates and spreads declined during 2010.
The scheduled maturity distribution of the available-for-sale fixed-maturity portfolio follows.
| December 31, 2010 | ||||||||
| Cost or amortized cost |
Fair value | |||||||
| (In thousands) | ||||||||
| Due in one year or less |
$ | 177,927 | $ | 181,887 | ||||
| Due after one year through five years |
655,609 | 709,776 | ||||||
| Due after five years through 10 years |
513,974 | 574,212 | ||||||
| Due after 10 years |
59,117 | 64,008 | ||||||
| 1,406,627 | 1,529,883 | |||||||
| Mortgage-and asset-backed securities |
523,130 | 551,478 | ||||||
| Total fixed-maturity securities |
$ | 1,929,757 | $ | 2,081,361 | ||||
Expected maturities may differ from scheduled contractual maturities because issuers of securities may have the right to call or prepay obligations with or without call or prepayment penalties.
| 128 |
Table of Contents
Index to Financial Statements
The net effect on stockholders’ equity of unrealized gains and losses from investment securities was as follows:
| December 31, | ||||||||
| 2010 | 2009 | |||||||
| (In thousands) | ||||||||
| Net unrealized investment gains including foreign currency translation adjustment and other-than-temporary impairments |
$ | 157,423 | $ | 243,510 | ||||
| Less foreign currency translation adjustment |
(9,766 | ) | (43,533 | ) | ||||
| Other-than-temporary impairments |
3,500 | 24,800 | ||||||
| Net unrealized investment gains excluding foreign currency translation adjustment and other-than-temporary impairments |
151,157 | 224,777 | ||||||
| Less deferred income taxes |
52,835 | 78,672 | ||||||
| Net unrealized investment gains excluding foreign currency translation adjustment and other-than-temporary impairments, net of tax |
$ | 98,322 | $ | 146,105 | ||||
Investment Income
The components of net investment income were as follows:
| Year ended December 31, | ||||||||||||
| 2010 | 2009 | 2008 | ||||||||||
| (In thousands) | ||||||||||||
| Fixed-maturity securities |
$ | 168,051 | $ | 352,753 | $ | 311,442 | ||||||
| Equity securities |
1,822 | 6,923 | (2,789 | ) | ||||||||
| Policy loans and other invested assets |
1,403 | 1,549 | 1,773 | |||||||||
| Cash and cash equivalents |
562 | 2,887 | 16,248 | |||||||||
| Market return on deposit asset underlying 10% reinsurance agreement |
1,471 | 299 | 1,468 | |||||||||
| Gross investment income |
173,309 | 364,411 | 328,142 | |||||||||
| Less investment expenses |
8,198 | 13,085 | 14,107 | |||||||||
| Net investment income |
$ | 165,111 | $ | 351,326 | $ | 314,035 | ||||||
Trading portfolio gains (losses) included in net investment income were as follows:
| Year ended December 31, | ||||||||||||
| 2010 | 2009 | 2008 | ||||||||||
| (In thousands) | ||||||||||||
| Trading portfolio gains (losses) included in net investment income |
$ | 533 | $ | 1,770 | $ | (987 | ) | |||||
Trading portfolio (losses) gains included in net investment income from fixed-maturity securities still owned was as follows:
| Year ended December 31, | ||||||||||||
| 2010 | 2009 | 2008 | ||||||||||
| (In thousands) | ||||||||||||
| Trading portfolio (losses) gains from fixed-maturity securities still owned |
$ | (223 | ) | $ | 1,216 | $ | (2,665 | ) | ||||
| 129 |
Table of Contents
Index to Financial Statements
We use the specific-identification method to determine the realized gains or losses from securities transactions. The components of net realized investment gains (losses) as well as details on gross realized investment gains and losses and proceeds from sales or other redemptions were as follows:
| Year ended December 31, | ||||||||||||
| 2010 | 2009 | 2008 | ||||||||||
| (In thousands) | ||||||||||||
| Gross realized investment gains (losses): |
||||||||||||
| Gains from sales |
$ | 47,925 | $ | 42,983 | $ | 12,933 | ||||||
| Losses from sales |
(2,257 | ) | (3,518 | ) | (2,546 | ) | ||||||
| Other-than-temporary impairments |
(12,158 | ) | (61,394 | ) | (114,022 | ) | ||||||
| Gains (losses) from derivatives |
635 | (41 | ) | 155 | ||||||||
| Net realized investment gains (losses) |
$ | 34,145 | $ | (21,970 | ) | $ | (103,480 | ) | ||||
| Gross realized investment gains (losses) reclassified from accumulated other comprehensive income |
$ | 33,510 | $ | (21,929 | ) | $ | (103,635 | ) | ||||
| Proceeds from sales or other redemptions |
$ | 1,543,976 | $ | 1,592,687 | $ | 1,453,956 | ||||||
Other-Than-Temporary Impairment
We conduct a review each quarter to identify and evaluate impaired investments that have indications of possible other-than-temporary impairment (OTTI). An investment in a debt or equity security is impaired if its fair value falls below its cost. Factors considered in determining whether an unrealized loss is temporary include the length of time and extent to which fair value has been below cost, the financial condition and near-term prospects for the issuer, and our evaluation of our intent to sell the security prior to recovery of its amortized cost, which may be maturity.
Our review for other-than-temporary impairment generally entails:
| • | Analysis of individual investments that have fair values less than a pre-defined percentage of amortized cost, including consideration of the length of time the investment has been in an unrealized loss position; |
| • | Analysis of corporate bonds by reviewing the issuer’s most recent performance to date, including analyst reviews, analyst outlooks and rating agency information; |
| • | Analysis of commercial mortgage-backed bonds based on the risk assessment of each security including performance to date, credit enhancement, risk analytics and outlook, underlying collateral, loss projections, rating agency information and available third-party reviews and analytics; |
| • | Analysis of residential mortgage-backed bonds based on loss projections provided by models compared to current credit enhancement levels; |
| • | Analysis of our other investments, as required based on the type of investment; and |
| • | Analysis of downward credit migrations that occurred during the quarter. |
| 130 |
Table of Contents
Index to Financial Statements
The amortized cost and fair value of available-for-sale fixed-maturity securities in default were as follows:
| December 31, 2010 |
December 31, 2009 |
|||||||||||||||
| Amortized cost |
Fair value |
Amortized cost |
Fair value |
|||||||||||||
| (In thousands) | ||||||||||||||||
| Fixed-maturity securities in default |
$ | 970 | $ | 1,558 | $ | 5,807 | $ | 9,807 | ||||||||
Impairment charges recognized in earnings on available-for-sale securities were as follows:
| Year ended December 31, | ||||||||||||
| 2010 | 2009 | 2008 | ||||||||||
| (In thousands) | ||||||||||||
| Impairments on fixed-maturity securities in default |
$ | 39 | $ | 20,275 | $ | 37,837 | ||||||
| Impairments on fixed-maturity securities not in default |
11,855 | 38,765 | 66,528 | |||||||||
| Impairments on equity securities |
264 | 2,354 | 9,657 | |||||||||
| Net impairment losses recognized in earnings |
$ | 12,158 | $ | 61,394 | $ | 114,022 | ||||||
The bonds noted above were considered to be other-than-temporarily impaired due to adverse credit events, such as news of an impending filing for bankruptcy; analyses of the issuer’s most recent financial statements or other information in which liquidity deficiencies, significant losses and large declines in capitalization were evident; and analyses of rating agency information for issuances with severe ratings downgrades that indicated a significant increase in the possibility of default.
Additionally, various mortgage- and asset-backed securities were impaired due to changes in expected cash flows for the underlying collateral loans. The changes were driven primarily by revised forecasts using updated assumptions for delinquency rates, default rates, prepayment rates, loss severities and remaining credit subordination. These revisions were factored into updated cash flow projections where applicable using either publicly available or proprietary models. Regardless of their default status, individual securities were impaired if updated cash flow projections indicated an adverse change. Due to deterioration across the forecasted assumptions for these securities, we recognized a charge against net income for impairments on
| 131 |
Table of Contents
Index to Financial Statements
mortgage- and asset-backed securities. These impairment charges are included in the losses discussed above and were as follows:
| Year ended December 31, | ||||||||||||
| 2010 | 2009 | 2008 | ||||||||||
| (In thousands) | ||||||||||||
| Impairments on mortgage- and asset-backed securities |
$ | 5,939 | $ | 6,339 | $ | 9,776 | ||||||
As of December 31, 2010, the unrealized losses on our invested asset portfolio were largely caused by interest rate sensitivity and changes in credit spreads. We believe that fluctuations caused by interest rate movement have little bearing on the recoverability of our investment. Because the decline in fair value is attributable to changes in interest rates and not credit quality, and because we have the ability to hold these investments until a market price recovery or maturity as well as no present intention to dispose of them, we do not consider these investments to be other-than-temporarily impaired.
OTTI recognized during the year ended December 31, 2010 were as follows:
| Year ended December 31, |
||||||||
| 2010 | 2009 | |||||||
| (In thousands) | ||||||||
| Impairment losses related to securities which the Company does not intend to sell or is more-likely-than-not that it will be required to sell: |
||||||||
| Total OTTI losses recognized |
$ | 1,402 | $ | 34,616 | ||||
| Less portion of OTTI loss recognized in accumulated other comprehensive income (loss) |
(553 | ) | (13,573 | ) | ||||
| Net impairment losses recognized in earnings for securities that the Company does not intend to sell or is more-likely-than-not that it will not be required to sell before recovery |
849 | 21,043 | ||||||
| OTTI losses recognized in earnings for securities that the Company intends to sell or more-likely-than-not will be required to sell before recovery |
11,309 | 40,351 | ||||||
| Net impairment losses recognized in earnings |
$ | 12,158 | $ | 61,394 | ||||
| 132 |
Table of Contents
Index to Financial Statements
The roll-forward of credit-related losses recognized in income for securities still held follows:
| Cumulative OTTI credit-related losses recognized in income for available-for-sale securities |
||||||||||||||||||||
| January 1, 2010 cumulative OTTI credit losses recognized for securities still held |
Additions for OTTI securities where no credit losses were recognized prior to January 1, 2010 |
Additions for OTTI securities where credit losses have been recognized prior to January 1, 2010 |
Reductions due to sales of credit impaired securities (1) |
December 31, 2010 cumulative OTTI credit losses recognized for securities still held |
||||||||||||||||
| (In thousands) | ||||||||||||||||||||
| Corporates |
$ | 82,413 | $ | 5,297 | $ | 658 | $ | (60,339 | ) | $ | 28,029 | |||||||||
| Mortgage- and asset-backed securities |
16,115 | 4,545 | 1,394 | (8,954 | ) | 13,100 | ||||||||||||||
| Total |
$ | 98,528 | $ | 9,842 | $ | 2,052 | $ | (69,293 | ) | $ | 41,129 | |||||||||
| (1) | Included in these reductions are transfers of securities effected in conjunction with our corporate reorganization. |
Fair Value
Fair value is the price that would be received to sell an asset in an orderly transaction between market participants at the measurement date. Fair value measurements are based upon observable and unobservable inputs. Observable inputs reflect market data obtained from independent sources, while unobservable inputs reflect our view of market assumptions in the absence of observable market information. All invested assets carried at fair value are classified and disclosed in one of the following three categories:
| • | Level 1. Quoted prices for identical instruments in active markets. Level 1 primarily consists of financial instruments whose value is based on quoted market prices in active markets, such as exchange-traded common stocks and actively traded mutual fund investments. |
| • | Level 2. Quoted prices for similar instruments in active markets; quoted prices for identical or similar instruments in markets that are not active; and model-derived valuations in which all significant inputs and significant value drivers are observable in active markets. Level 2 includes those financial instruments that are valued using industry-standard pricing methodologies, models or other valuation methodologies. Various inputs are considered in deriving the fair value of the underlying financial instrument, including interest rate, credit spread, and foreign exchange rates. All significant inputs are observable, or derived from observable information in the marketplace or are supported by observable levels at which transactions are executed in the marketplace. Financial instruments in this category primarily include: certain public and private corporate fixed-maturity and equity securities; government or agency securities; certain mortgage- and asset-backed securities and certain non-exchange-traded derivatives, such as currency swaps and forwards. |
| • | Level 3. Valuations derived from valuation techniques in which one or more significant inputs or significant value drivers are unobservable. Level 3 consists of financial instruments whose fair value is estimated based on industry-standard pricing methodologies and models using significant inputs not based on, nor corroborated by, readily available market information. Valuations for this category primarily consist of non-binding broker quotes. Financial instruments in this category primarily include less liquid fixed-maturity corporate securities. |
| 133 |
Table of Contents
Index to Financial Statements
As of each reporting period, all assets and liabilities recorded at fair value are classified in their entirety based on the lowest level of input that is significant to the fair value measurement. Significant levels of estimation and judgment are required to determine the fair value of certain of our investments. The factors influencing these estimations and judgments are subject to change in subsequent reporting periods.
The estimated fair value and hierarchy classifications were as follows:
| December 31, 2010 | ||||||||||||||||
| Level 1 | Level 2 | Level 3 | Fair value | |||||||||||||
| (In thousands) | ||||||||||||||||
| Fair value assets: |
||||||||||||||||
| Fixed-maturity securities: |
||||||||||||||||
| U.S. government and agencies |
$ | — | $ | 22,202 | $ | — | $ | 22,202 | ||||||||
| Foreign government |
— | 94,541 | — | 94,541 | ||||||||||||
| States and political subdivisions |
— | 27,219 | — | 27,219 | ||||||||||||
| Corporates |
— | 1,366,774 | 19,147 | 1,385,921 | ||||||||||||
| Mortgage- and asset-backed securities |
— | 549,188 | 2,290 | 551,478 | ||||||||||||
| Total fixed-maturity securities |
— | 2,059,924 | 21,437 | 2,081,361 | ||||||||||||
| Equity securities |
15,110 | 4,542 | 3,561 | 23,213 | ||||||||||||
| Trading securities |
— | 22,767 | — | 22,767 | ||||||||||||
| Separate accounts |
— | 2,446,786 | — | 2,446,786 | ||||||||||||
| Total fair value assets |
$ | 15,110 | $ | 4,534,019 | $ | 24,998 | $ | 4,574,127 | ||||||||
| Fair value liabilities: |
||||||||||||||||
| Currency swaps and forwards |
$ | — | $ | 2,228 | $ | — | $ | 2,228 | ||||||||
| Separate accounts |
— | 2,446,786 | — | 2,446,786 | ||||||||||||
| Total fair value liabilities |
$ | — | $ | 2,449,014 | $ | — | $ | 2,449,014 | ||||||||
| December 31, 2009 | ||||||||||||||||
| Level 1 | Level 2 | Level 3 | Fair value | |||||||||||||
| (In thousands) | ||||||||||||||||
| Fair value assets: |
||||||||||||||||
| Fixed-maturity securities: |
||||||||||||||||
| U.S. government and agencies |
$ | — | $ | 18,487 | $ | — | $ | 18,487 | ||||||||
| Foreign government |
— | 390,431 | — | 390,431 | ||||||||||||
| States and political subdivisions |
— | 36,038 | — | 36,038 | ||||||||||||
| Corporates |
— | 4,097,202 | 20,445 | 4,117,647 | ||||||||||||
| Mortgage-and asset-backed securities |
— | 1,066,966 | 748,610 | 1,815,576 | ||||||||||||
| Total fixed-maturity securities |
— | 5,609,124 | 769,055 | 6,378,179 | ||||||||||||
| Equity securities |
15,575 | 31,535 | 2,216 | 49,326 | ||||||||||||
| Trading securities |
— | 16,996 | — | 16,996 | ||||||||||||
| Separate accounts |
— | 2,093,342 | — | 2,093,342 | ||||||||||||
| Total fair value assets |
$ | 15,575 | $ | 7,750,997 | $ | 771,271 | $ | 8,537,843 | ||||||||
| Fair value liabilities: |
||||||||||||||||
| Currency swaps and forwards |
$ | — | $ | 2,707 | $ | — | $ | 2,707 | ||||||||
| Separate accounts |
— | 2,093,342 | — | 2,093,342 | ||||||||||||
| Total fair value liabilities |
$ | — | $ | 2,096,049 | $ | — | $ | 2,096,049 | ||||||||
In assessing fair value of our investments, we use a third-party pricing service for approximately 95% of our securities. The remaining securities are primarily private securities valued using models based on observable inputs on public corporate spreads
| 134 |
Table of Contents
Index to Financial Statements
having similar tenors (e.g., sector, average life and quality rating) and liquidity and yield based on quality rating, average life and treasury yields. All data inputs come from observable data corroborated by independent third-party data. In the absence of sufficient observable inputs, we utilize non-binding broker quotes, which are reflected in our Level 3 classification.
We perform internal reasonableness assessments on fair value determinations within our portfolio. If a fair value appears unusual, we will re-examine the inputs and may challenge a fair value assessment made by the pricing service. If there is a known pricing error, we will request a reassessment by the pricing service. If the pricing service is unable to perform the reassessment on a timely basis, we will determine the appropriate price by corroborating with an alternative pricing service or other qualified source as necessary. We do not adjust quotes or prices except in a rare circumstance to resolve a known error.
Because many fixed-maturity securities do not trade on a daily basis, fair value is determined using industry- standard methodologies by applying available market information through processes such as U.S. Treasury curves, benchmarking of similar securities, sector groupings, quotes from market participants and matrix pricing. Observable information is compiled and integrates relevant credit information, perceived market movements and sector news. Additionally, security prices are periodically back-tested to validate and/or refine models as conditions warrant. Market indicators and industry and economic events are also monitored as triggers to obtain additional data. For certain structured securities with limited trading activity, industry-standard pricing methodologies use adjusted market information, such as index prices or discounting expected future cash flows, to estimate fair value. If these measures are not deemed observable for a particular security, the security will be classified as Level 3 in the fair value hierarchy.
Where specific market information is unavailable for certain securities, pricing models produce estimates of fair value primarily using Level 2 inputs along with certain Level 3 inputs. These models include matrix pricing. The pricing matrix uses current treasury rates and credit spreads received from third-party sources to estimate fair value. The credit spreads incorporate the issuer’s industry- or issuer-specific credit characteristics and the security’s time to maturity, if warranted. Remaining un-priced securities are valued using an estimate of fair value based on indicative market prices that include significant unobservable inputs not based on, nor corroborated by, market information, including the utilization of non-binding broker quotes.
The year-to-date roll forward of the Level 3 asset category was as follows:
| Year ended December 31, |
||||||||
| 2010 | 2009 | |||||||
| (In thousands) | ||||||||
| Level 3 assets, beginning of period |
$ | 771,271 | $ | 739,409 | ||||
| Net unrealized (losses) gains through other comprehensive income |
(2,904 | ) | 12,818 | |||||
| Net realized losses through realized investment gains (losses), including OTTI |
(28 | ) | — | |||||
| Purchases |
11,250 | 7,085 | ||||||
| Sales |
(40,154 | ) | — | |||||
| Transfers into level 3 |
44,522 | 11,959 | ||||||
| Transfers out of level 3 |
(236,587 | ) | — | |||||
| Transfers due to funding of reinsurance transactions |
(522,372 | ) | — | |||||
| Level 3 assets, end of period |
$ | 24,998 | $ | 771,271 | ||||
We obtain independent pricing quotes based on observable inputs as of the end of the reporting period for all securities in Level 2. Those inputs include benchmark yields, reported trades, broker/dealer quotes, issuer spreads, two-sided markets, benchmark securities, market bids/offers, and other relevant data. We monitor these inputs for market indicators, industry and economic events. We recognize transfers into new levels and out of previous levels as of the end of the reporting period, including interim reporting periods, as applicable. Invested assets included in the transfer from Level 3 to Level 2 were primarily non-agency mortgage-backed securities. Invested assets included in the transfer from Level 2 to Level 3 primarily were fixed-maturity investments for which we were
| 135 |
Table of Contents
Index to Financial Statements
unable to corroborate independent broker quotes with observable market data. There were no significant transfers between Level 1 and Level 2 or between Level 1 and Level 3 during 2010.
Fair Value Option
We elected the fair value option of accounting for certain equity investments that were not in the Russell 3000 Index. Changes in the fair value of such investments are recorded in net investment income. The fair value of equity securities selected for fair value accounting was as follows:
| Year ended December 31, |
||||||||
| 2010 | 2009 | |||||||
| (In thousands) | ||||||||
| Fair value, beginning of period |
$ | 7,693 | $ | 4,579 | ||||
| Fair value, end of period |
— | 7,693 | ||||||
In connection with our corporate reorganization, in the first quarter of 2010, we transferred to Citi or sold to third parties all of the securities that had previously been accounted for using the fair value option. Fair value gains included in net investment income were as follows:
| Year ended December 31, | ||||||||||||
| 2010 | 2009 | 2008 | ||||||||||
| (In thousands) | ||||||||||||
| Fair value gains (losses) included in net investment income |
$ | 667 | $ | 3,101 | $ | (5,397 | ) | |||||
Derivatives
We use foreign currency swaps to reduce our foreign exchange risk due to direct investment in foreign currency-denominated debt securities. At December 31, 2009, we also had forward foreign currency contracts to reduce our exposure to foreign currency exchange rates that resulted from direct investment in foreign currency denominated debt securities. We had no forward currency contracts at December 31, 2010.
The aggregate notional balance and fair value of our derivatives was as follows:
| December 31, | ||||||||
| 2010 | 2009 | |||||||
| (In thousands) | ||||||||
| Aggregate notional balance of derivatives |
$ | 5,878 | $ | 21,689 | ||||
| Aggregate fair value of derivatives |
(2,228 | ) | (2,707) | |||||
The change in fair value of these derivatives, as included in realized investment gains (losses) was as follows:
| Year ended December 31, | ||||||||||||
| 2010 | 2009 | 2008 | ||||||||||
| (In thousands) | ||||||||||||
| Change in fair value |
$ | 635 | $ | (41 | ) | $ | 155 | |||||
We have a deferred loss related to closed forward contracts that were used to mitigate our exposure to foreign currency exchange rates that resulted from the net investment in our Canadian operations. The amount of deferred loss included in accumulated other comprehensive income was as follows:
| December 31, | ||||||||
| 2010 | 2009 | |||||||
| (In thousands) | ||||||||
| Deferred loss related to closed forward contracts |
$ | 26,385 | $ | 26,385 | ||||
While we have no current intention to do so, these deferred losses will not be recognized until such time as we sell or substantially liquidate our Canadian operations.
| 136 |
Table of Contents
Index to Financial Statements
(5) Financial Instruments
The carrying values and estimated fair values of our financial instruments were as follows:
| December 31, 2010 | December 31, 2009 | |||||||||||||||
| Carrying value |
Estimated fair value |
Carrying value |
Estimated fair value |
|||||||||||||
| (In thousands) | ||||||||||||||||
| Assets: |
||||||||||||||||
| Fixed-maturity securities |
$ | 2,081,361 | $ | 2,081,361 | $ | 6,378,179 | $ | 6,378,179 | ||||||||
| Equity securities |
23,213 | 23,213 | 49,326 | 49,326 | ||||||||||||
| Trading securities |
22,767 | 22,767 | 16,996 | 16,996 | ||||||||||||
| Policy loans and other invested assets |
26,229 | 26,229 | 26,921 | 26,921 | ||||||||||||
| Other invested assets |
14 | 14 | 26 | 26 | ||||||||||||
| Deposit asset underlying 10% reinsurance agreement |
50,099 | 50,099 | — | — | ||||||||||||
| Separate accounts |
2,446,786 | 2,446,786 | 2,093,342 | 2,093,342 | ||||||||||||
| Liabilities: |
||||||||||||||||
| Note payable |
$ | 300,000 | $ | 323,670 | $ | — | $ | — | ||||||||
| Currency swaps and forwards |
2,228 | 2,228 | 2,707 | 2,707 | ||||||||||||
| Separate accounts |
2,446,786 | 2,446,786 | 2,093,342 | 2,093,342 | ||||||||||||
The fair values of financial instruments presented above are estimates of the fair values at a specific point in time using various sources and methods, including market quotations and a complex matrix system that takes into account issuer sector, quality, and spreads in the current marketplace.
Estimated fair values of investments in fixed-maturity securities are principally a function of current spreads and interest rates that are primarily provided by a third-party vendor. Therefore, the fair values presented are indicative of amounts we could realize or settle at the respective balance sheet date. We do not necessarily intend to dispose of or liquidate such instruments prior to maturity. Trading securities, which primarily consist of fixed-maturity securities, are carried at fair value. Equity securities, including common and non-redeemable preferred stocks, are carried at fair value. The carrying value of policy loans and other invested assets approximates fair value. The fair value of our note payable is based on prevailing interest rates and an estimated spread based on notes of comparable issuers and maturity. Derivative instruments are stated at fair value based on market prices. Segregated funds in separate accounts are carried at the underlying value of the variable insurance contracts, which is fair value.
The carrying amounts for cash and cash equivalents, receivables, accrued investment income, accounts payable, cash collateral and payables for security transactions approximated their fair values due to the short-term nature of these instruments. Consequently, such instruments are not included in the above table. The preceding table also excludes future policy benefits and unpaid policy claims as these items are not subject to financial instrument disclosures.
| 137 |
Table of Contents
Index to Financial Statements
(6) Reinsurance
Ceded reinsurance arrangements do not relieve us of our primary obligation to the policyholder. Our reinsurance contracts typically do not have a fixed term. In general, the reinsurers’ ability to terminate coverage for existing cessions is limited to such circumstances as material breach of contract or nonpayment of premiums by the ceding company. Our reinsurance contracts generally contain provisions intended to provide the ceding company with the ability to cede future business on a basis consistent with historical terms. However, either party may terminate any of the contracts with respect to the future business upon appropriate notice to the other party. Generally, the reinsurance contracts do not limit the overall amount of the loss that can be incurred by the reinsurer.
Our policy is to limit the amount of life insurance retained on the life of any one person to $1 million. To limit our exposure with any one reinsurer, we monitor the concentration of credit risk we have with our reinsurance counterparties, as well as their financial condition. We have not experienced any credit losses related to our reinsurance counterparties during the three-year period ended December 31, 2010.
Due from reinsurers represents ceded policy reserve balances and ceded claim liabilities. The amounts of ceded claim liabilities included in due from reinsurers that we paid and which are recoverable from those reinsurers were as follows:
| December 31, | ||||||||
| 2010 | 2009 | |||||||
| (In thousands) | ||||||||
| Ceded claim liabilities recoverable from reinsurers |
$ | 30,981 | $ | 57,001 | ||||
Details on in-force life insurance follow:
| December 31, | ||||||||
| 2010 | 2009 | |||||||
| (Dollars in millions) | ||||||||
| Direct life insurance in force |
$ | 662,135 | $ | 654,153 | ||||
| Amounts ceded to other companies |
(600,807 | ) | (421,603 | ) | ||||
| Net life insurance in force |
$ | 61,328 | $ | 232,550 | ||||
| Percentage of reinsured life insurance in force |
90.7 | % | 64.5 | % | ||||
The significant increase in amounts ceded to other companies resulted from the Citi reinsurance transactions we executed in connection with our corporate reorganization (see Note 2). Three of the Citi coinsurance agreements satisfy GAAP risk transfer rules. Under these agreements, we ceded between 80% and 90% of our term life future policy benefit reserves, and we transferred a corresponding amount of assets to the Citi reinsurers. These transactions did not impact our future policy benefit reserves. As such, we recorded an asset in due from reinsurers for the same amount of risk transferred. Amounts ceded to other companies do not reflect those contracts accounted for under the deposit method of accounting.
| 138 |
Table of Contents
Index to Financial Statements
Due from reinsurers includes ceded reserve balances and ceded claim liabilities. Reinsurance receivable and ratings by reinsurer were as follows:
| December 31, | ||||||||||||||||
| 2010 | 2009 | |||||||||||||||
| Reinsurance receivable |
A.M. Best rating |
Reinsurance receivable |
A.M. Best rating |
|||||||||||||
| (In millions) | ||||||||||||||||
| Prime Reinsurance Company, Inc. (1) |
$ | 2,353 | NR | $ | — | — | ||||||||||
| Financial Reassurance Company 2010, Ltd. (1) |
333 | NR | — | — | ||||||||||||
| American Health and Life Insurance Company (1) |
156 | A | — | — | ||||||||||||
| Due from related party reinsurers |
2,842 | — | ||||||||||||||
| Swiss Re Life & Health America Inc. |
242 | A | 183 | A | ||||||||||||
| SCOR Global Life Reinsurance Companies |
139 | A | 150 | A- | ||||||||||||
| Generali USA Life Reassurance Company |
112 | A | 117 | A | ||||||||||||
| Transamerica Reinsurance Companies |
103 | A+ | 101 | A | ||||||||||||
| Munich American Reassurance Company |
97 | A+ | 84 | A+ | ||||||||||||
| Korean Reinsurance Company |
83 | A- | — | — | ||||||||||||
| RGA Reinsurance Company |
64 | A+ | 73 | A+ | ||||||||||||
| Scottish Re Companies |
4 | E | 51 | E | ||||||||||||
| All other reinsurers |
46 | — | 108 | — | ||||||||||||
| Due from reinsurers |
$ | 3,732 | $ | 867 | ||||||||||||
| (1) | Amounts shown are net of their share of the reinsurance recoverable from other reinsurers. |
NR – not rated
Certain reinsurers with which we do business receive group ratings. Individually, those reinsurers are Scor Global Life Re Insurance Company of Texas, Scor Global Life U.S. Re Insurance Company, Transamerica Financial Life Insurance Company, and Transamerica Life Insurance Company.
As Prime Re and Financial Reassurance Company 2010, Ltd. (FRAC) do not have financial strength ratings, we required various safeguards prior to executing the coinsurance agreements. Both coinsurance agreements include provisions to ensure that Primerica Life and Primerica Life Canada receive full regulatory credit for the reinsurance treaties. Under these agreements, Primerica Life and Primerica Life Canada will be able to recapture the ceded business with no fee in the event Prime Re or FRAC do not comply with the various safeguard provisions in their respective coinsurance agreements. Prime Re also has entered into a capital maintenance agreement requiring Citi to provide additional funding, if needed, at any point during the term of the agreement up to the maximum as described in the capital maintenance agreement.
A fourth coinsurance agreement relates to a 10% reinsurance transaction that includes an experience refund provision. This agreement does not satisfy GAAP risk transfer rules. As a result, we have accounted for this contract using deposit method accounting and have recognized a deposit asset in other assets on our balance sheet for assets backing the economic reserves. The deposit assets held in support of this agreement were $50.1 million at December 31, 2010, with no associated liability. We will make contributions to the deposit asset during the life of the agreement to fulfill our responsibility of funding the economic reserve. The market return on these deposit assets is reflected in net investment income during the life of the agreement. Prime Re is responsible for ensuring that there are sufficient assets to meet all statutory requirements. We will pay Prime Re a 3% finance charge for any statutory reserves required above the economic reserves. This finance charge is reflected in interest expense in our statements of income.
As of December 31, 2010, we had access to letters of credit of approximately $105.8 million specifically maintained by certain of our
| 139 |
Table of Contents
Index to Financial Statements
reinsurance partners to satisfy statutory requirements related to reinsurance claims receivable. As of December 31, 2010, the Company had not drawn any amounts on these lines of credit.
During the fourth quarter of 2010, we entered into an agreement with Scottish Re Companies (Scottish Re) and Korean Reinsurance Company (Korean Re) to novate to Korean Re the Term Life reinsurance originally ceded to Scottish Re. During the same period, we also entered into an agreement to novate to Korean Re the Term Life reinsurance originally ceded to The Canada Life Assurance Company. As of December 31, 2010, Korean Re had an A.M. Best rating of A-. The novations did not impact our balance sheet or statement of income.
In October 2010, a routine reinsurance audit identified payments to reinsurers that may have exceeded our obligations under our reinsurance agreements. We were uncertain of our ability to recover past ceded premiums, but in the fourth quarter of 2010, we approached our reinsurers and reached agreements to recover certain of these past ceded premiums for post-issue underwriting class upgrades. The most common reason for such an upgrade occurs when someone who was originally issued a term life policy as a tobacco user subsequently quits using tobacco. Historically, we have reduced policyholder premiums for such upgrades, but have not reduced ceded premiums to reflect the new underwriting class. As a result, we reduced ceded premiums for 2010 by approximately $13.1 million related to agreements obtained with certain reinsurers to recover ceded premiums. The $13.1 million of
recoveries recognized in 2010 reflects the
agreements signed in the fourth quarter of 2010 including $18.8 million of gross recoveries, net of $5.7 million passed on to the Citi reinsurers in accordance with the terms of the associated reinsurance agreements. We expect approximately $8.7 million of additional recoveries in the first quarter of 2011 for the final agreements which were signed in January 2011.
(7) Deferred Policy Acquisition Costs
The balances of and changes in DAC were as follows:
| Year ended December 31, | ||||||||||||
| 2010 | 2009 | 2008 | ||||||||||
| (In thousands) | ||||||||||||
| DAC balance, beginning of period |
$ | 2,789,905 | $ | 2,727,422 | $ | 2,510,045 | ||||||
| Capitalization |
317,069 | 391,079 | 432,071 | |||||||||
| Amortization |
(168,035 | ) | (381,291) | (144,490 | ) | |||||||
| Transferred to Citi reinsurers |
(2,099,941 | ) | — | — | ||||||||
| Foreign exchange and other |
14,213 | 52,695 | (70,204 | ) | ||||||||
| DAC balance, end of period |
$ | 853,211 | $ | 2,789,905 | $ | 2,727,422 | ||||||
Investment yield reserve assumptions at December 31, 2010 ranged from approximately 4.0% to 7.0%, compared with a range of approximately 5.0% to 7.0% as December 31, 2009. During 2010, we lowered the interest rate assumption to reflect rates available in the current interest rate environment.
In 2008, we revised our estimates of DAC and future policy benefits. The revised estimates are based on a policy-by-policy approach rather than on an aggregated basis. Furthermore, under the new estimation method, if policies lapse at a rate other than what was originally assumed, the DAC and FPB are immediately revised, whereas under the previous estimation method, the financial impact of such variances was recorded prospectively over the remaining life of the aggregate block of policies. We accounted for this change in accounting estimate effected by a change in accounting principle prospectively, resulting in the recognition of a net pretax loss of $191.7 million in the accompanying combined statement of income for the year ended December 31, 2008.
| 140 |
Table of Contents
Index to Financial Statements
(8) Intangible Assets and Goodwill
The components of intangible assets were as follows:
| December 31, 2010 | ||||||||||||
| Gross carrying amount |
Accumulated amortization |
Net carrying amount |
||||||||||
| (In thousands) | ||||||||||||
| Amortizing intangible asset |
$ | 84,871 | $ | (54,789 | ) | $ | 30,082 | |||||
| Indefinite-lived intangible asset |
45,275 | — | 45,275 | |||||||||
| Total intangible assets |
$ | 130,146 | $ | (54,789 | ) | $ | 75,357 | |||||
| December 31, 2009 | ||||||||||||
| Gross carrying amount |
Accumulated amortization |
Net carrying amount |
||||||||||
| (In thousands) | ||||||||||||
| Amortizing intangible asset |
$ | 84,871 | $ | (51,251 | ) | $ | 33,620 | |||||
| Indefinite-lived intangible asset |
45,275 | — | 45,275 | |||||||||
| Total intangible assets |
$ | 130,146 | $ | (51,251 | ) | $ | 78,895 | |||||
We have an amortizing intangible asset related to the July 1995 sales agreement termination payment to Management Financial Services, Inc. This asset is supported by a non-compete agreement with the founder of our business model. We calculate the amortization of this contract buyout on a straight-line basis over 24 years, which represents the life of the non-compete agreement. Intangible asset amortization expense was $3.5 million in each of 2010, 2009 and 2008. Amortization expense is expected to be $3.5 million annually thereafter. As of December 31, 2010, we assessed this asset for impairment. We based our impairment review on an undiscounted cash flow analysis and determined that no impairment had occurred as of December 31, 2010.
We also have an indefinite-lived intangible asset related to the 1988 purchase of the right to contract with the sales representative force. This asset represents the core distribution model of our business, which is our primary competitive advantage to profitably distribute term life insurance products on a significant scale, and as such, is considered to have an indefinite life. No amortization was recognized on this asset during 2010, 2009 or 2008. This intangible asset is supported by a significant portion of the discounted cash flows of our future business. As of December 31, 2010, we assessed this asset for impairment and we determined that the fair value of this asset exceeded its carrying value as of that date. As such, we determined that no impairment had occurred as of December 31, 2010.
In the fourth quarter of 2008, we noted that market deterioration, including a liquidity crisis, resulted in a significant increase in the discount rates being used to value businesses relative to prior periods. As such, in December 2008, we tested our then-existing $195.0 million balance of goodwill for impairment. Under the two-step
impairment test, we first tested and then determined that the fair value of the life reporting unit did not exceed its carrying value. We then performed the second step using discount rates and various other assumptions relevant as of December 31, 2008, and determined that there was no goodwill remaining in our life reporting unit. As a result, we recorded a pre-tax impairment charge of $195.0 million in the Corporate and Other Distributed Products segment as of December 31, 2008.
(9) Separate Accounts
The Funds consist of a series of five banded investment funds known as the Asset Builder Funds and one money market fund known as the Cash Management Fund. The principal investment objective of each of the Asset Builder Funds is to achieve long-term growth while preserving capital through a diversified portfolio of publicly traded Canadian stocks, investment-grade corporate bonds, Government of Canada bonds, and foreign equity investments. The Cash Management Fund invests in government guaranteed short-term bonds and short-term commercial and bank papers, with the principal investment objective being the provision of interest income while maintaining liquidity and preserving capital.
| 141 |
Table of Contents
Index to Financial Statements
Payments to contract owners under these contract offerings are only due upon death of the annuitant or upon reaching a specific maturity date. Payments are based on the value of the contract owner’s units in the portfolio at the payment date, but are guaranteed to be no less than 75% of the contract owner’s contribution, reduced by any withdrawals. Account values are not guaranteed for withdrawn units if contract owners make withdrawals prior to the maturity dates. Maturity dates vary from contract to contract and range from 10 to 50 years from the contract start date.
Both the asset and the liability for the separate accounts reflect the value of the underlying assets in the portfolio as of the reporting date. Primerica Life Canada’s exposure to losses under the guarantee is limited to those accounts whose value has declined to less than 75% of contributions made, either at the time they reach their maturity dates or at the time the annuitant dies. Any withdrawals made from the accounts reduce this guarantee. Because maturity dates range from 10 to 50 years, the likelihood of accounts meeting both of the criteria for the maturity value guarantee at any given point is very small. Additionally, the portfolio consists of a very large number of individual contracts, further spreading the risk related to the death benefit guarantee being exercised upon death of the annuitant. The length of the contract terms provides significant opportunity for the underlying portfolios to recover any short-term losses prior to maturities or deaths of the policyholders.
We periodically assess the exposure related to these contracts to determine whether any additional liability should be recorded. As of December 31, 2010 and 2009, an additional liability for these contracts was deemed to be unnecessary.
(10) Insurance Reserves
Changes in policy claims and other benefits payable were as follows:
| Year ended December 31, | ||||||||||||
| 2010 | 2009 | 2008 | ||||||||||
| (In thousands) | ||||||||||||
| Policy claims and other benefits payable, beginning of period |
$ | 218,390 | $ | 225,641 | $ | 229,263 | ||||||
| Less reinsurance |
184,381 | 174,221 | 172,250 | |||||||||
| Net balance, beginning of period |
34,009 | 51,420 | 57,013 | |||||||||
| Incurred related to current year |
221,601 | 485,629 | 483,843 | |||||||||
| Incurred related to prior year |
177 | (1,852 | ) | 1,888 | ||||||||
| Total incurred |
221,778 | 483,777 | 485,731 | |||||||||
| Paid related to current year |
(193,320 | ) | (455,377 | ) | (440,646 | ) | ||||||
| Paid related to prior year |
(35,313 | ) | (47,741 | ) | (47,725 | ) | ||||||
| Total paid |
(228,633 | ) | (503,118 | ) | (488,371 | ) | ||||||
| Transferred to Citi reinsurers |
(31,125 | ) | — | — | ||||||||
| Foreign currency |
520 | 1,930 | (2,953 | ) | ||||||||
| Net balance, end of period |
(3,451 | ) | 34,009 | 51,420 | ||||||||
| Add reinsurance |
233,346 | 184,381 | 174,221 | |||||||||
| Balance, end of period |
$ | 229,895 | $ | 218,390 | $ | 225,641 | ||||||
The significant decrease in current year incurred and paid balances reflects the effect of the Citi reinsurance transactions executed in connection with our corporate reorganization. Because the Citi reinsurance transactions were executed on March 31, 2010 but transferred the economic impact of the agreements retroactive to January 1, 2010, we have reflected reinsured claims activity attributable to the underlying policies as a reduction to policy claims and other benefits payable in the amount of $31.1 million.
Investment yield reserve assumptions at December 31, 2010 ranged from approximately 4.0% to 7.0%, compared with a range of approximately 5.0% to 7.0% as December 31, 2009. During 2010, we lowered the interest rate assumption to reflect rates available in the current interest rate environment.
In 2008, we revised our estimates of DAC and future policy benefits. See Note 7 for additional information.
| 142 |
Table of Contents
Index to Financial Statements
(11) Note Payable
In April 2010, we issued to Citi a $300.0 million note as part of our corporate reorganization in which Citi transferred to us the businesses that comprise our operations. Prior to the issuance of the Citi note, we had no outstanding debt. The Citi note bears interest at an annual rate of 5.5%, payable semi-annually in arrears on January 15 and July 15, and matures March 31, 2015. Citi may participate out, assign or sell all or any portion of the note at any time.
We have the option to redeem the Citi note in whole or in part at a redemption price equal to 100% of the principal amount to be redeemed plus accrued and unpaid interest to the date of redemption. In the event of a change in control, the holder of the Citi note has the right to require us to repurchase it at a price equal to 101% of the outstanding principal amount plus accrued and unpaid interest.
The Citi note also requires us to use our commercially reasonable efforts to arrange and consummate an offering of investment-grade debt securities, trust preferred securities, surplus notes, hybrid securities or convertible debt that generates sufficient net cash proceeds (after deducting fees and expenses) to repay the note in full at certain mutually agreeable dates, based on certain conditions.
We were in compliance with all of the covenants of the Citi note at December 31, 2010. No events of default or defaults occurred during 2010.
(12) Income Taxes
In conjunction with the Offering and the private sale, we made elections under Section 338(h)(10) of the Internal Revenue Code, which resulted in changes to our deferred tax balances and reduced stockholders’ equity by $172.5 million.
During the first quarter of 2010, our federal income tax return was included as part of Citi’s consolidated federal income tax return. On March 30, 2010, in anticipation of our corporate reorganization, we entered into a tax separation agreement with Citi. In accordance with the tax separation agreement, Citi will be responsible for and shall indemnify and hold the Company harmless from and against any consolidated, combined, affiliated, unitary or similar federal, state or local income tax liability with respect to the Company for any taxable period ending on or before April 7, 2010, the closing date of the Offering.
Deferred income taxes are recognized for the future tax consequences of temporary differences between the financial statement carrying amounts and the tax bases of assets and liabilities. The main components of deferred income tax assets and liabilities were as follows:
| December 31, | ||||||||
| 2010 | 2009 | |||||||
| (In thousands) | ||||||||
| Deferred tax assets: |
||||||||
| Policy benefit reserves and unpaid policy claims |
$ | 132,006 | $ | 5,775 | ||||
| Intangibles and tax goodwill |
37,719 | — | ||||||
| Deferred compensation — employee benefits |
— | 45,548 | ||||||
| Other |
9,542 | 32,230 | ||||||
| Total deferred tax assets |
179,267 | 83,553 | ||||||
| Deferred tax liabilities: |
||||||||
| Deferred policy acquisition costs |
(247,344 | ) | (727,373 | ) | ||||
| Investments |
(17,469 | ) | (35,513 | ) | ||||
| Unremitted earnings on foreign subsidiaries |
— | (68,481 | ) | |||||
| Other |
(7,456 | ) | (51,913 | ) | ||||
| Total deferred tax liabilities |
(272,269 | ) | (883,280 | ) | ||||
| Net deferred tax liabilities |
$ | (93,002 | ) | $ | (799,727 | ) | ||
| 143 |
Table of Contents
Index to Financial Statements
The majority of the deferred tax asset is attributable to policy benefit reserves and unpaid policy claims, which represents the difference between the financial statement carrying value and tax basis for liabilities for future policy benefits. The tax basis for policy benefit reserves and unpaid policy claims are actuarially determined in accordance with guidelines set forth in the Internal Revenue Code. The deferred tax liabilities for DAC represent the difference between the policy acquisition costs capitalized for GAAP purposes and those capitalized for tax purposes, as well as the difference in the resulting amortization methods.
The Company has not recognized a deferred tax liability for the undistributed earnings of its foreign operations that arose in 2010. As of December 31, 2010, the determination of undistributed earnings of our Canadian companies is not practicable.
In assessing the realizability of deferred tax assets, management considers whether it is more likely than not that some portion or all of the deferred tax assets will not be realized. Management considers the scheduled reversal of deferred tax liabilities and projected future taxable income in making this assessment. Management believes that it is more likely than not that the results of future operations will generate sufficient taxable income to realize our deferred tax assets. As a result, no valuation allowance has been recorded relating to our deferred tax assets for the years ended December 31, 2010 or 2009.
| Year ended December 31, | ||||||||
| 2010 | 2009 | |||||||
| (In thousands) | ||||||||
| Unrecognized tax benefit, beginning of period |
$ | 26,608 | $ | 41,812 | ||||
| (Decrease) increase in unrecognized tax benefits — prior period |
(300 | ) | 864 | |||||
| Increase in unrecognized tax benefits — current period |
2,112 | 2,286 | ||||||
| Reductions in unrecognized tax benefits as a result of a lapse in statute of limitations |
(3,229 | ) | (18,354 | ) | ||||
| Unrecognized tax benefit, end of period |
$ | 25,191 | $ | 26,608 | ||||
The total amount of unrecognized tax benefits that, if recognized, would affect our effective tax rate was as follows:
| December 31, | ||||||||
| 2010 | 2009 | |||||||
| (In thousands) | ||||||||
| Unrecognized tax benefits yet to impact the effective tax rate |
$ | 4,859 | $ | 20,505 | ||||
We recognize interest expense related to unrecognized tax benefits in tax expense net of federal income tax. The total amount of accrued interest and penalties in the consolidated and combined balance sheet follow:
| December 31, | ||||||||
| 2010 | 2009 | |||||||
| (In thousands) | ||||||||
| Total amount of accrued interest and penalties |
$ | 3,932 | $ | 3,471 | ||||
We recognized interest (benefit) expense related to unrecognized tax expense in the consolidated and combined statements of income as follows:
| Year ended December 31, | ||||||||||||
| 2010 | 2009 | 2008 | ||||||||||
| (In thousands) | ||||||||||||
| Interest (benefit) expense related to unrecognized tax expense |
$ | (2,576 | ) | $ | (3,062 | ) | $ | 1,117 | ||||
| 144 |
Table of Contents
Index to Financial Statements
Income tax expense (benefit) attributable to income from continuing operations consists of the following:
| Current | Deferred | Total | ||||||||||
| (In thousands) | ||||||||||||
| Year ended December 31, 2010: |
||||||||||||
| Federal |
$ | 71,533 | $ | 43,007 | $ | 114,540 | ||||||
| Foreign |
37,795 | (10,660 | ) | 27,135 | ||||||||
| State and local |
7 | (317 | ) | (310 | ) | |||||||
| Total tax expense |
$ | 109,335 | $ | 32,030 | $ | 141,365 | ||||||
| Year ended December 31, 2009: |
||||||||||||
| Federal |
$ | 217,339 | $ | 6,623 | $ | 223,962 | ||||||
| Foreign |
68,732 | (25,949 | ) | 42,783 | ||||||||
| State and local |
(890 | ) | (489 | ) | (1,379 | ) | ||||||
| Total tax expense |
$ | 285,181 | $ | (19,815 | ) | $ | 265,366 | |||||
| Year ended December 31, 2008: |
||||||||||||
| Federal |
$ | 216,250 | $ | (70,432 | ) | $ | 145,818 | |||||
| Foreign |
32,229 | 8,934 | 41,163 | |||||||||
| State and local |
(1,373 | ) | (254 | ) | (1,627 | ) | ||||||
| Total tax expense |
$ | 247,106 | $ | (61,752 | ) | $ | 185,354 | |||||
Total income tax expense is different from the amount determined by multiplying earnings before income taxes by the statutory federal tax rate of 35%. The reason for such difference follows:
| 2010 | 2009 | 2008 | ||||||||||||||||||||||
| Amount | Percentage | Amount | Percentage | Amount | Percentage | |||||||||||||||||||
| (Dollars in thousands) | ||||||||||||||||||||||||
| Computed “expected” tax expense |
$ | 139,699 | 35.0 | % | $ | 265,984 | 35.0 | % | $ | 123,562 | 35.0 | % | ||||||||||||
| Goodwill impairment |
— | — | — | — | 68,248 | 19.3 | ||||||||||||||||||
| Other |
1,666 | 0.4 | (618 | ) | (0.1 | ) | (6,456 | ) | (1.8 | ) | ||||||||||||||
| Total tax expense/effective rate |
$ | 141,365 | 35.4 | % | $ | 265,366 | 34.9 | % | $ | 185,354 | 52.5 | % | ||||||||||||
We had no material operating losses or any tax credit carryforwards available for tax purposes for the years ended 2010, 2009, and 2008.
We have no penalties included in calculating our provision for income taxes. As previously mentioned, the Company is a party to a tax separation agreement that includes a tax indemnification agreement, which was negotiated and executed as part of the separation from Citi. The indemnification requires Citi to cover income tax liabilities incurred by the Company for any consolidated, combined, or unitary returns that end on or prior to the separation. As of December 31, 2010, the Company had a Citi tax indemnification asset of $21.5 million. All consolidated, combined or unitary tax liabilities are payable to either the Parent Company or Primerica Life, while tax liabilities related to separate return filings are payable to the appropriate taxing authority.
There is no significant change that is reasonably possible to occur within twelve months of the reporting date.
The major tax jurisdictions in which we operate are the United States and Canada. We are currently open to tax audit by the Internal Revenue Service for the years ended December 31, 2006 and thereafter for federal tax purposes. We are currently open to audit in Canada for tax years ended December 31, 2004 and thereafter for federal and provincial tax purposes.
| 145 |
Table of Contents
Index to Financial Statements
(13) Stockholders’ Equity
Prior to April 1, 2010, we had 100 shares of outstanding common stock. During 2010, we issued common stock as part of our corporate reorganization (see Note 2). A reconciliation of the number of outstanding shares of our common stock as of December 31, 2010 follows.
| Year ended December 31, 2010 |
||||
| (Shares in thousands) | ||||
| Common stock — issued: |
||||
| Balance, beginning of period |
— | |||
| Shares issued to Citi in connection with the Offering (1) |
75,000 | |||
| Shares of restricted common stock issued post Offering |
11 | |||
| Common shares issued upon lapse of restricted stock units (RSUs) |
122 | |||
| Treasury stock retired (2) |
(2,290) | |||
| Balance, end of period |
72,843 | |||
| Treasury stock: |
||||
| Balance, beginning of period |
— | |||
| Treasury stock contributed from Citi |
(5,021) | |||
| Treasury stock acquired |
(6) | |||
| Treasury stock reissued as restricted common stock |
2,737 | |||
| Treasury stock retired (2) |
2,290 | |||
| Balance, end of period |
— | |||
| Common shares outstanding, end of period |
72,843 | |||
| (1) | Includes 5,021,412 shares that were contributed back to us and issued to employees and sales force leaders as restricted common stock and RSUs. |
| (2) | Reflects RSUs that are excluded from common shares outstanding but will continue to be reissued as common shares when their restrictions expire. |
The following transactions took place on or after April 1, 2010:
| • | we issued 74,999,900 shares of common stock to Citi; |
| • | we issued warrants to Citi, exercisable for 4,103,110 additional shares of our common stock; |
| • | our common stock began trading under the ticker symbol PRI on the New York Stock Exchange; |
| • | Citi sold 24,564,000 shares of our common stock to the public in the Offering; |
| • | Citi contributed 5,021,412 shares of common stock back to us; |
| • | we granted equity awards, including 1,865,000 RSUs to sales force leaders; |
| • | we granted additional equity awards in the form of 375,000 RSUs vesting July 1, 2010 to certain sales force leaders; |
| • | we granted 2,560,000 equity award shares to management in the form of restricted common stock and RSUs; |
| • | we issued 210,166 shares of restricted common stock upon the conversion of fully vested restricted stock awards previously granted by Citi and held by certain of our sales force leaders; |
| • | we issued 11,246 shares of restricted common stock upon the conversion of restricted stock awards previously granted by Citi and held by management; |
| • | we retired 2,284,375 common shares underlying the RSU awards described |
| 146 |
Table of Contents
Index to Financial Statements
| above, plus an additional 7,098 common shares to cover withholding taxes and employee forfeitures; |
| • | we granted additional equity awards in the form of 187,500 RSUs vesting October 1, 2010 to certain sales force leaders; |
| • | we granted additional equity awards in the form of 187,500 RSUs vesting January 1, 2011 to certain sales force leaders; and |
| • | we granted an additional 11,858 shares of restricted common stock to our independent directors. |
As a result of the issuance of the new equity awards, we recorded non-cash compensation charges based on the fair value of awards vested during the reporting period. Employee awards representing 2,571,246 shares were measured at their April 1, 2010 grant date fair values of $15.00 per share and vest over three years. We believe compensation expense related to these awards will be approximately $3.1 million per quarter, subject to change based on deviations from our forecasted forfeiture rates.
The 1,865,000 RSUs granted to sales force leaders on April 1, 2010 were fully vested on April 1, 2010 and will be delivered over three years. We recorded the related compensation expense for the IPO grants, which excluded the converted awards, upon vesting. Because the awards were subject to deferred delivery and/or sale restrictions following their vesting, their fair value was discounted to reflect a corresponding illiquidity discount.
In connection with the conversion of Citi stock awards to Primerica stock awards and concurrent with the signing of the reinsurance agreements on March 31, 2010, we recorded a reclass of approximately $23.5 million from due to affiliates and other liabilities to paid-in capital and Citi converted the underlying payable to a capital contribution.
On April 15, 2010, Citi sold 16,412,440 shares of our common stock to Warburg Pincus for an aggregate purchase price of $230.0 million. The sale also included warrants held by Citi that will allow the Warburg Pincus funds to acquire from us 4,103,110 additional shares of our common stock, for up to seven years, at an exercise price of $18.00 per share. The warrants may be physically settled or net share settled at the option of the warrant holder. The warrant holder does not have the option to cash settle any portion of the warrants. The warrants are classified as permanent equity based on the fair value at the original April 1, 2010 issuance date. Subsequent changes in fair value will not be recognized as long as the warrants continue to be classified as equity. Because the warrants were issued as a return of capital to Citi, there was no net impact on stockholders’ equity related to the warrants.
The warrant holder is not entitled to receipt of dividends declared on the underlying common stock or non-voting common stock (but will be entitled to adjustments for extraordinary dividends), or to any voting or other rights that might accrue to holders of common stock or non-voting common stock.
An additional 750,000 RSUs were granted to sales force leaders between April 1, 2010 and October 1, 2010 and vest between July 1, 2010 and January 1, 2011, with deferred delivery occurring over three years. These additional awards varied with and primarily related to life insurance policy acquisitions. As such, we deferred $12.3 million and recognized a corresponding increase in DAC which will be amortized over the life of the underlying policies. The fair value of these awards also has been discounted to properly reflect the liquidity discount due to sales restrictions existing after the awards have vested.
As of December 31, 2010, Citi owned less than 40% of our outstanding common stock and Warburg Pincus had an ownership stake of approximately 23%. Had the additional 4,103,100 warrants been exercised by Warburg Pincus, its ownership stake would have increased to approximately 27% on a fully diluted basis.
Dividends declared and paid to stockholders during 2010 amounted to $1.5 million. The total amount of dividends declared to Citi was $3.49 billion in 2010, compared with $193.9 million in 2009 and $422.9 million in 2008. The
significant increase in dividends declared to Citi
| 147 |
Table of Contents
Index to Financial Statements
during 2010 was primarily a result of our corporate reorganization.
See Note 14 for additional information.
(14) Share-Based Transactions
As of December 31, 2010, the Company had outstanding equity awards under its Omnibus Incentive Plan (OIP). We adopted the OIP on March 31, 2010. Prior to April 1, 2010, we had no outstanding share-based awards. The OIP provides for the issuance of equity awards, including stock options, stock appreciation rights, restricted stock, deferred stock, RSUs, unrestricted stock as well as cash-based awards. In addition to time-based vesting requirements, awards granted under the OIP may also be subject to specified performance criteria. As of December 31, 2010, we had 3.4 million shares available for future grants under this plan. All outstanding management awards have time-based vesting requirements, vesting over three years. Certain quarterly incentive contests among our sales force leaders have performance-based vesting requirements. As the restrictions on outstanding RSUs expire, we will issue common shares. Because the RSUs are eligible for dividend equivalents and are included in our calculation of EPS under the two-class method, the related issuance of common shares will not impact basic or diluted EPS.
Employee Share-Based Transactions
The following table summarizes employee restricted stock activity during 2010.
| Shares | Weighted-average measurement-date fair value per share |
|||||||
| (Shares in thousands) | ||||||||
| Unvested employee restricted stock and RSUs, December 31, 2009 |
— | — | ||||||
| Granted in 2010 |
2,569 | $ | 15.02 | |||||
| Forfeited in 2010 |
(3 | ) | $ | 15.00 | ||||
| Conversions from awards in Citi shares |
11 | $ | 15.00 | |||||
| Vested in 2010 |
(11 | ) | $ | 15.00 | ||||
| Unvested employee restricted stock and RSUs, December 31, 2010 |
2,566 | $ | 15.02 | |||||
In connection with the Offering and the private sale, certain existing Citi equity awards immediately vested, resulting in approximately $2.2 million of compensation expense and a reclassification of approximately $2.4 million from due to affiliates to paid-in capital.
For the year ended December 31, 2010, we also recognized approximately $9.7 million of expense in connection with new employee and non-employee director equity award grants. These expenses were partially offset by a tax benefit of approximately $3.2 million. The value of restricted stock and RSUs granted to employees was based on the fair market value of our common stock at the date of grant. We granted shares of restricted stock to U.S. employees and non-employee directors and RSUs to Canadian employees. These awards vest over three years and are not subject to any sales restrictions or deferred delivery following vesting.
As of December 31, 2010, total compensation cost not yet recognized in our financial statements related to employee equity awards was $29.2 million, all of which was related to equity awards with time-based vesting conditions yet to be reached. We expect to recognize these amounts over a weighted-average period of approximately 2.3 years.
| 148 |
Table of Contents
Index to Financial Statements
Non-Employee Share-Based Transactions
The following table summarizes non-employee restricted stock activity during 2010.
| Shares | Weighted-average measurement-date fair value per share |
|||||||
| (Shares in thousands) | ||||||||
| Unvested non-employee restricted stock and RSUs, December 31, 2009 |
— | — | ||||||
| Granted in 2010 |
2,615 | $ | 13.27 | |||||
| RSUs vested in 2010 |
(2,427 | ) | $ | 12.80 | ||||
| Unvested non-employee restricted stock and RSUs, December 31, 2010 |
188 | $ | 19.37 | |||||
All of our non-employee share-based transactions relate to the grant of RSUs to members of our sales force, which are subject to short-term vesting provisions, all vesting within approximately three months of the initial grant. However, they are subject to long-term sales restrictions lifting over three years. Because the sale restrictions extend up to three years beyond the vesting period, the awards are subject to a liquidity discount reflecting the risk associated with the post-vesting restrictions. To quantify this discount for each award, we used a series of Black-Scholes models with one-, two- and three-year tenors to estimate put option costs less a nominal transaction cost as a methodology for quantifying the cost of eliminating the downside risk associated with the sale restrictions. The most significant assumptions in the Black-Scholes models were the volatility assumptions. Because our stock and the options on our stock have had a very limited active trading history, we derived volatility assumptions by analyzing other public insurance companies’ historical and implied volatilities over terms comparable to the sale restriction terms. Our volatility assumptions ranged from 36 to 52. We also utilized dividend assumptions ranging from zero dividends to $0.01 per quarter and risk-free rates less than 2%.
On April 1, 2010, we granted 1,865,000 RSUs to certain of our sales force leaders. These RSUs vested immediately but were subject to sales restrictions that expire annually over the subsequent three years from the vesting date. The IPO price of our shares was $15.00. We recognized a discounted fair value of these awards of $12.00 per RSU, reflecting the liquidity discount described above. We recognized total expense of approximately $22.4 million, partially offset by a tax benefit of approximately $7.8 million, for these IPO-related non-employee awards.
Between April 1, 2010 and December 31, 2010 we granted additional equity awards in the form of 750,000 RSUs
vesting between July 1, 2010 and January 1, 2011 to certain sales force leaders. The awards were measured based on the market price of our shares on the respective vesting dates, less liquidity discounts ranging from 20% to 28% as described above. The measurement date fair values of these awards ranged from $15.44 to $19.37. These awards varied with and primarily related to life insurance policy acquisitions. As such, we deferred the full $12.3 million cost and recognized a corresponding increase in DAC which will be amortized over the life of the underlying policies. The resulting ongoing DAC amortization expense will be partially offset by a concurrent tax benefit totaling approximately $4.0 million over the same periods.
As of December 31, 2010, all non-employee equity awards were fully vested with the exception of 187,500 shares that reached their final vesting on January 1, 2011. As such, any related compensation cost not recognized in our financial statements through December 31, 2010 is immaterial. Shares awarded under performance-based, non-employee grants were earned by certain of our sales force leaders based on performance criteria varying with and primarily relating to acquiring life insurance policies, and therefore increasing our DAC. These amounts are then amortized over the terms of the underlying policies acquired.
Citi Share-Based Transactions
We participated in various share-based compensation benefit plans sponsored by Citi
| 149 |
Table of Contents
Index to Financial Statements
during the period prior to our corporate reorganization in March and April of 2010. These plans are now either closed or no longer effective for our employees except for exercise or delivery associated with awards granted prior to our corporate reorganization. See Note 15 for additional information.
(15) Related Party Transactions
The net distributions we declared and paid to Citi, as a then-wholly owned subsidiary, were as follows:
| Year ended December 31, | ||||||||||||
| 2010 | 2009 | 2008 | ||||||||||
| (In thousands) | ||||||||||||
| Distributions declared |
$ | 3,491,556 | $ | 193,927 | $ | 422,900 | ||||||
| Distributions paid |
3,491,556 | 44,927 | 422,900 | |||||||||
| Distributions payable |
— | 149,000 | — | |||||||||
The increase in net distributions in 2010 was a direct result of the transactions executed in connection with our corporate reorganization. See Note 2 for additional information.
The revenues we earned or expenses we incurred in connection with other material related party transactions were as follows:
| Year ended December 31, | ||||||||||||
| 2010 | 2009 | 2008 | ||||||||||
| (In thousands) | ||||||||||||
| Loan origination service revenues from Citi affiliates |
$ | 10,327 | $ | 29,519 | $ | 75,139 | ||||||
| Payroll, employee benefits and shared services expense |
(13,463 | ) | (34,142 | ) | (34,200 | ) | ||||||
| Customer service telephone support fee expense |
(5,921 | ) | (6,406 | ) | (6,758 | ) | ||||||
| Citi stock award expense |
(3,244 | ) | (5,660 | ) | (6,904 | ) | ||||||
Under various agreements with various wholly owned subsidiaries of Citi, we provided these affiliates with certain services related to their origination of unsecured personal, consumer and student loans. The receivables related to these loan origination services were immaterial as of December 31, 2010 and 2009.
We had arrangements with various Citigroup affiliates whereby they provided payroll processing services and pay for employee benefits and various shared services on behalf of the Company. Amounts due to or from affiliates under these arrangements at December 31, 2010 and 2009 were immaterial.
We have an arrangement with Citicorp Data Systems, Inc. (CDS), a wholly owned subsidiary of Citi, whereby CDS provides customer service telephone support for the Company.
| 150 |
Table of Contents
Index to Financial Statements
We had arrangements with Citi in relation to unvested stock awards and other payables related to stock awards (see Note 14). The payables to Citi related to these agreements were as follows:
| December 31, | ||||||||
| 2010 | 2009 | |||||||
| (In thousands) | ||||||||
| Payables related to vested Citi stock awards |
$ | 7,501 | $ | 36,253 | ||||
In September 2010, the Company forgave and wrote off an expense reimbursement receivable of approximately $0.7 million due from Warburg Pincus, a 23% stockholder with two representatives on our Board of Directors at the time of the forgiveness. The receivable arose out of an agreement between Citi and Warburg Pincus pursuant to which Warburg Pincus agreed to reimburse the Company for a specified portion of certain costs expected to be incurred by the Company for a business event to be held in connection with the closing of the Offering. The agreement was signed prior to our corporate reorganization, when the Company was wholly owned by Citi. Warburg Pincus requested a waiver of the obligation in August 2010, and the Audit Committee approved the waiver in September 2010.
Remaining arrangements to provide services to or receive services from Citi affiliates were immaterial during 2010, 2009, and 2008.
(16) Statutory Accounting and Dividend Restrictions
U.S. Insurance Subsidiaries
Our U.S. insurance subsidiaries are required to report their results of operations and financial position to state authorities on the basis of statutory accounting practices prescribed or permitted by such authorities and the National Association of Insurance Commissioners (NAIC), which is a comprehensive basis of accounting other than U.S. generally accepted accounting principles. Prescribed statutory accounting practices include a variety of publications of the NAIC, as well as state laws, regulations and general administrative rules. Permitted statutory accounting practices encompass all accounting practices not so prescribed. Primerica Life’s statutory financial statements are prepared on the basis of accounting practices prescribed or permitted by the NAIC and the Massachusetts Division of Insurance (MDOI), while NBLIC’s statutory financial statements are prepared on the basis of accounting practices prescribed or permitted by the NAIC and the New York State Insurance Department (NYSID). Our U.S. insurance subsidiaries’ ability to pay dividends is subject to and limited by the various laws and regulations of their respective states.
For Primerica Life, statutory dividend capacity is based on the greater of (1) 10% of the previous year-end statutory surplus or (2) the previous year’s statutory net gain from operations (not including pro rata distributions of any class of the insurer’s own securities). Dividends that, together with the amount of other distributions or dividends made within the preceding 12 months, exceed this statutory limitation are referred to as extraordinary dividends. Extraordinary dividends require advance notice to the MDOI, Primerica Life’s primary state insurance regulator, and are subject to potential disapproval. For dividends exceeding these thresholds, Primerica Life must provide notice to the MDOI and receive notice that the MDOI does not object to the payment of such dividends. Primerica Life’s statutory surplus was $627.3 million at December 31, 2010. Its statutory net gain from operations was $437.1 million for the 12-month period ended December 31, 2010.
For NBLIC, statutory dividend capacity is based on the lesser of (1) 10% of the previous year-end statutory earned surplus or (2) the previous year’s statutory net gain from operations, not including realized capital gains. Dividends that, together with the amount of other distributions or dividends in any calendar year, exceed this statutory limitation are considered to be extraordinary dividends. Extraordinary dividends require advance notice to the NYSID, NBLIC’s primary state insurance regulator, and are subject to potential disapproval. For dividends exceeding these thresholds, NBLIC must provide notice to the NYSID and receive notice that the NYSID does not object to the payment of such dividends.
| 151 |
Table of Contents
Index to Financial Statements
NBLIC’s earned surplus was $160.7 million as of December 31, 2010. Its statutory net gain from operations, not including realized capital gains was $17.8 million for the year ended December 31, 2010.
The amount of dividends that may be paid in 2011 without regulatory consent for each of our U.S. insurance subsidiaries follows:
| 2011 Statutory Dividend Capacity |
||||
| (In thousands) | ||||
| Primerica Life |
$ | 437,116 | ||
| NBLIC |
16,075 | |||
Primerica Life’s statutory dividend capacity was favorably impacted by the NBLIC extraordinary dividend of $296.8 million received in 2010.
The statutory capital and surplus of our U.S insurance subsidiaries was as follows:
| December 31, | ||||||||
| 2010 | 2009 | |||||||
| (In thousands) | ||||||||
| Primerica Life capital and surplus |
$ | 629,842 | $ | 1,705,595 | ||||
| NBLIC capital and surplus |
163,249 | 358,956 | ||||||
Primerica Life and NBLIC both exceed the minimum risk-based capital requirements for insurance companies operating in the United States.
Canadian Insurance Subsidiary
Primerica Life Canada is incorporated under the provisions of the Canada Business Corporations Act and is a domiciled Canadian Company subject to regulation under the Insurance Companies Act (Canada) by the Office of the Superintendent of Financial Institutions Canada (OSFI) and by Provincial Superintendents of Financial Institutions/Insurance in those provinces in which Primerica Life Canada is licensed. As such, the financial statements of Primerica Life Canada are prepared in accordance with Canadian Generally Accepted Accounting Principles (Canadian GAAP).
In Canada, dividends can be paid subject to the paying insurance company continuing to meet the regulatory requirements for capital adequacy and liquidity and upon 15 days’ minimum notice to OSFI.
The amount of dividends that may be paid in 2011 without regulatory consent for Primerica Life Canada is CAD40.9 million, or $41.2 million using the December 31, 2010 period-end exchange rate.
Primerica Life Canada exceeds the minimum capital requirements for insurance companies regulated by the Office of Supervision of Financial Institutions in Canada.
(17) Commitments and Contingent Liabilities
Commitments
We lease office equipment and office and warehouse space under various noncancelable operating lease agreements that expire through December 2018. Rent expense was as follows:
| Year ended December 31, | ||||||||||||
| 2010 | 2009 | 2008 | ||||||||||
| (In thousands) | ||||||||||||
| Minimum rent |
$ | 6,490 | $ | 6,483 | $ | 6,474 | ||||||
| Total rent expense |
$ | 6,490 | $ | 6,483 | $ | 6,474 | ||||||
We had no contingent rent expense during 2010, 2009 and 2008. At January 1, 2011, the minimum aggregate rental commitments for operating leases were as follows:
| Year ending December 31, |
||||
| (In thousands) | ||||
| 2011 |
$ | 6,662 | ||
| 2012 |
6,717 | |||
| 2013 |
4,221 | |||
| 2014 |
1,770 | |||
| 2015 |
1,248 | |||
| Thereafter |
3,117 | |||
| Total minimum rental commitments for operating leases |
$ | 23,735 | ||
| 152 |
Table of Contents
Index to Financial Statements
Contingent Liabilities
The Company is involved from time to time in legal disputes, regulatory inquiries and arbitration proceedings in the normal course of business. These disputes are subject to uncertainties, including the large and/or indeterminate amounts sought in certain of these matters and the inherent unpredictability of litigation. As such, the Company is unable to estimate the possible loss or range of loss that may result from these matters. While it is possible that an adverse outcome in certain cases could have a material adverse effect upon the Company’s financial position, based on information currently known by the Company’s management, in its opinion, the outcomes of such pending investigations and legal proceedings are not likely to have such an effect.
In February 2009, a claimant served the Company with a Statement of Claim in FINRA arbitration alleging that a Company registered representative’s recommendation to claimant’s father caused him to surrender a life insurance policy and transfer a variable annuity. The claimant’s father subsequently died, and the claimant sought to recover the value of the surrendered death benefits and other damages under various theories of liability, including suitability. After a final hearing, which began in September 2010, the arbitration panel issued an immaterial award to the claimant in January 2011.
(18) Benefit Plans
We participated in various benefit plans, including a pension plan and a 401(k) plan, sponsored by Citi during the period prior to our corporate reorganization in March and April of 2010. These plans are now either closed or no longer effective for our employees. The expense, if any, associated with the benefits earned under such plans was immaterial during 2010, 2009 and 2008.
In 2010, in connection with our corporate reorganization, we established a 401(k) plan for the benefit of our employees. The expense associated with the set-up and company match was approximately $3.1 million.
| 153 |
Table of Contents
Index to Financial Statements
Unaudited Quarterly Financial Data
In management’s opinion, the following quarterly consolidated and combined financial information fairly presents the results of operations for such periods and is prepared on a basis consistent with our annual audited consolidated and combined financial statements. Financial information for periods ending on or before March 31, 2010, was prepared on a combined basis, while financial information for periods ending after March 31, 2010 was prepared on a consolidated basis.
We completed an initial public offering of our stock on April 1, 2010. Prior to April 1, 2010, outstanding stock consisted of 100 shares issued to Citi in October 2009. As such, pro forma per-share earnings for periods ending on or before March 31, 2010 are not presented as they would not be comparable to per-share earnings in periods after the Transactions due to the substantial increase in shares used in the computation of earnings per share.
| Quarter ended March 31, 2010 |
Quarter ended June 30, 2010 |
Quarter ended September 30, 2010 |
Quarter ended December 31, 2010 |
|||||||||||||
| (In thousands, except per-share amounts) | ||||||||||||||||
| Direct premiums |
$ | 537,845 | $ | 547,455 | $ | 547,444 | $ | 548,330 | ||||||||
| Ceded premiums |
(148,119 | ) | (447,213 | ) | (437,054 | ) | (417,981 | ) | ||||||||
| Net premiums |
389,726 | 100,242 | 110,390 | 130,349 | ||||||||||||
| Net investment income |
82,576 | 27,991 | 27,855 | 26,688 | ||||||||||||
| Commissions and fees |
91,690 | 93,226 | 89,737 | 108,288 | ||||||||||||
| Realized investment gains (losses), including OTTI |
31,057 | 374 | 1,015 | 1,700 | ||||||||||||
| Other, net |
11,893 | 12,466 | 12,239 | 12,362 | ||||||||||||
| Total revenues |
606,942 | 234,299 | 241,236 | 279,387 | ||||||||||||
| Total benefits and expenses |
386,540 | 197,961 | 179,357 | 198,865 | ||||||||||||
| Income before income taxes |
220,402 | 36,338 | 61,879 | 80,522 | ||||||||||||
| Income taxes |
77,116 | 14,330 | 22,284 | 27,633 | ||||||||||||
| Net income |
$ | 143,286 | $ | 22,008 | $ | 39,595 | $ | 52,889 | ||||||||
| Earnings per share – basic |
n/a | $ | .29 | $ | .53 | $ | .70 | |||||||||
| Earnings per share – diluted |
n/a | $ | .29 | $ | .52 | $ | .69 | |||||||||
| Quarter ended March 31, 2009 |
Quarter ended June 30, 2009 |
Quarter ended September 30, 2009 |
Quarter ended December 31, 2009 |
|||||||||||||
| (In thousands) | ||||||||||||||||
| Direct premiums |
$ | 516,647 | $ | 529,004 | $ | 531,713 | $ | 535,417 | ||||||||
| Ceded premiums |
(137,609 | ) | (158,401 | ) | (154,725 | ) | (160,018 | ) | ||||||||
| Net premiums |
379,038 | 370,603 | 376,988 | 375,399 | ||||||||||||
| Net investment income |
82,385 | 89,755 | 88,736 | 90,450 | ||||||||||||
| Commissions and fees |
79,717 | 82,690 | 84,279 | 89,301 | ||||||||||||
| Realized investment gains (losses), including OTTI |
(11,259 | ) | (9,003 | ) | (11,212 | ) | 9,503 | |||||||||
| Other, net |
12,955 | 13,542 | 12,585 | 13,949 | ||||||||||||
| Total revenues |
542,836 | 547,587 | 551,376 | 578,602 | ||||||||||||
| Total benefits and expenses |
368,061 | 349,253 | 363,501 | 379,631 | ||||||||||||
| Income before income taxes |
174,775 | 198,334 | 187,875 | 198,971 | ||||||||||||
| Income taxes |
62,218 | 66,214 | 64,044 | 72,890 | ||||||||||||
| Net income |
$ | 112,557 | $ | 132,120 | $ | 123,831 | $ | 126,081 | ||||||||
Quarterly amounts may not agree in total to the corresponding annual amounts due to rounding.
| 154 |
Table of Contents
Index to Financial Statements
ITEM 9. CHANGES IN AND DISAGREEMENTS WITH ACCOUNTANTS ON ACCOUNTING AND FINANCIAL DISCLOSURE
There have been no changes in, or disagreements with, accountants on accounting and financial disclosure matters during the years ended December 31, 2010 and 2009.
ITEM 9A. CONTROLS AND PROCEDURES.
Disclosure Controls and Procedures
The Company’s management, with the participation of the Company’s Co-Chief Executive Officers and Chief Financial Officer, has evaluated the effectiveness of the Company’s disclosure controls and procedures (as such term is defined in Rules 13a-15(e) and 15d-15(e) under the Exchange Act) as of the end of the period covered by this report (the “Evaluation Date”). Based on such evaluation, the Company’s Co-Chief Executive Officers and Chief Financial Officer have concluded that, as of the Evaluation Date, the Company’s disclosure controls and procedures are effective.
Internal Control Over Financial Reporting
This report does not include a report of management’s assessment regarding internal control over financial reporting or an attestation report of the Company’s registered public accounting firm due to a transition period established by rules of the Securities and Exchange Commission for newly public companies.
There have not been any changes in the Company’s internal control over financial reporting (as such term is defined in Rules 13a-15(f) and 15d-15(f) under the Exchange Act) during the fourth quarter of 2010 that have materially affected, or are reasonably likely to materially affect, the Company’s internal control over financial reporting.
| 155 |
Table of Contents
Index to Financial Statements
Pursuant to General Instruction G to Form 10-K, and as described below portions of Items 10 through 14 are incorporated by reference from the Company’s definitive Proxy Statement relating to the Company’s 2011 Annual Meeting of Stockholders (the “Proxy Statement”), which will be filed with the Securities and Exchange Commission within 120 days of December 31, 2010, pursuant to Regulation 14A under the Exchange Act. The Report of the Audit Committee and the Report of the Compensation Committee to be included in the Proxy Statement shall be deemed to be furnished in this report and shall not be incorporated by reference into any filing under the Securities Act as a result of such furnishing.
Our website address is www.primerica.com. You may obtain free electronic copies of our annual reports on Form 10-K, quarterly reports on Form 10-Q, current reports on Form 8-K, and all amendments to those reports from the investors section of our website. These reports are available on our website as soon as reasonably practicable after we electronically file them with the SEC. These reports should also be available through the SEC’s website at www.sec.gov.
We have adopted corporate governance guidelines. The guidelines and the charters of our board committees are available in the corporate governance subsection of the investor relations section of our website, www.primerica.com and are also available in print upon written request to the Corporate Secretary, Primerica, Inc., 3120 Breckinridge Boulevard, Duluth, GA 30099.
ITEM 10. DIRECTORS, EXECUTIVE OFFICERS AND CORPORATE GOVERNANCE.
For a list of executive officers, see Part I Item X. Executive Officers of the Registrant.
We have adopted a written code of conduct that applies to all directors, officers and employees, including a separate code that applies to only our principal executive officers and senior financial officers in accordance with Section 406 of the Sarbanes-Oxley Act of 2002 and the rules of the SEC promulgated thereunder. Our Code of Conduct is available in the corporate governance subsection of the investor relations section of our website, www.primerica.com and is available in print upon written request to the Corporate Secretary, Primerica, Inc., 3120 Breckinridge Blvd., Duluth, GA 30099. In the event that we make changes in, or provide waivers from, the provisions of the Code of Conduct that the SEC requires us to disclose, we will disclose these events in the corporate governance section of our website.
Except for the information above, the director information provided below and the information set forth in Part I, Item X. Executive Officers of the Registrant, the information required by this item will be contained under the following headings in the Proxy Statement and is incorporated herein by reference:
| • | Corporate Governance – Independence of Committee Members; |
| • | Corporate Governance – Committees of the Board; |
| • | Corporate Goverance – Code of Conduct; |
| • | Report of the Audit Committee; |
| • | Executive Compensation – Employment Agreements; |
| • | General Information – Section 16(a) Beneficial Ownership Reporting Compliance; |
| • | Related Party Transactions – Transactions with Citi in Connection with our Initial Public Offering; and |
| • | Related Party Transactions – Transactions with Warburg Pincus in Connection with the Securities Purchase Agreement. |
| 156 |
Table of Contents
Index to Financial Statements
Members of Our Board of Directors
The terms of our Class I directors expire at our annual stockholders meeting to be held in 2011, the terms of our Class II directors expire at our annual meeting to be held in 2012 and the terms of our Class III directors expire at our annual meeting to be held in 2013.
D. Richard Williams, age 54, was elected to our Board as a Class II director in October 2009. He is Chairman of the Board of Directors, has served as our Co-Chief Executive Officer since 1999 and has served our Company since 1989 in various capacities, including as the Chief Financial Officer and Chief Operating Officer of Primerica Financial Services, Inc. (“PFS”), a general agent and a subsidiary of Primerica. Mr. Williams joined the American Can Company, a manufacturing company and predecessor to Citigroup Inc. (“Citi”), in 1979 and eventually headed the company’s Acquisition and
Development area for financial services and was part of the team responsible for the acquisition of Primerica. He serves on the boards of trustees for the Fernbank Museum of Natural History, the Woodruff Arts Center and the Anti-Defamation League Southeast Region. Mr. Williams earned both his B.S. degree and his M.B.A. from the Wharton School of the University of Pennsylvania.
Mr. Williams has led our company as Co-Chief Executive Officer for 11 years and brings to our Board over 20 years of knowledge of the Company’s business, finances and operations along with expertise in senior management, finance, mergers and acquisitions (“M&A”), strategic planning, and risk and asset management.
John A. Addison, Jr., age 53, was elected to our Board as a Class I director in October 2009. He is the Chairman of Primerica Distribution, has served as our Co-Chief Executive Officer since 1999 and has served our company in various capacities since 1982 when he joined us as a business systems analyst. Mr. Addison has served in numerous officer roles with Primerica Life Insurance Company (“Primerica Life”), a life insurance underwriter, and PFS, both of which are subsidiaries of Primerica. He served as Vice President and Senior Vice President of Primerica Life. He also served as Executive Vice President and Group Executive Vice President of Marketing. In 1995, he became President of PFS and was promoted to Co-Chief Executive Officer in 1999. Mr. Addison earned his B.A. in Economics from the University of Georgia and his M.B.A. from Georgia State University.
Mr. Addison brings to the Board his 11 years of experience as our Co-Chief Executive Officer and nearly 30 years of understanding our Company and our business, along with general management and marketing expertise.
P. George Benson, age 64, was elected to our Board as a Class III director in April 2010. He has been the President of the College of Charleston in Charleston, South Carolina since February 2007. From June 1998 until January 2007, he was Dean of the Terry College of Business at the University of Georgia. From July 1993 to June 1998, Mr. Benson served as Dean of the Rutgers Business School at Rutgers University and, prior to that, Mr. Benson was on the faculty of the Carlson School of Management at the University of Minnesota from 1977 to 1993, where he served as Director of the Operations Management Center from 1992 to 1993 and head of the Decision Sciences Area from 1983 to 1988. Mr. Benson currently serves as Chair-elect of the Board of Directors for the Foundation for the Malcolm Baldrige National Quality Award, was Chairman of the Board of Overseers for the Baldrige Award Program from 2004 to 2007 and was a national judge for the Baldrige Award from 1997 to 2000. He also serves as a member of the boards of directors of AGCO Corporation and Crawford & Company, as well as the National Bank of South Carolina. Mr. Benson was a member of the board of directors of Nutrition 21, Inc. from 1998 to 2010. Mr. Benson received a B.S. degree in Mathematics from Bucknell University, completed graduate work in operations research in the Engineering School of New York University and earned a Ph.D. in business from the University of Florida.
Mr. Benson brings to our Board significant expertise in academics, senior management, corporate governance, strategic planning, risk
| 157 |
Table of Contents
Index to Financial Statements
and asset management, and finance. In particular, the Board considered his experience managing the College of Charleston’s administrative staff of over 800, budget of over $200 million and endowment of over $50 million, as well as his service on the boards of directors of other public companies and as a member of their audit committees.
Michael E. Martin, age 55, was elected to our Board as a Class III director in April 2010. He is a Partner of Warburg Pincus & Co. and a Managing Director of private equity firm Warburg Pincus LLC, where he is co-head of Warburg Pincus’ financial services group. Prior to joining Warburg Pincus in 2009, Mr. Martin was President of Brooklyn NY Holdings, LLC, a private investment company, from 2006 to 2008. Mr. Martin worked at UBS Investment Bank from 2002 to 2006, where he served as a vice chairman and managing director of UBS Investment Bank and a member of its board of directors and Global Executive Committee. He has held senior positions at investment bank Credit Suisse First Boston, serving there from 1987 to 2002, and practiced corporate law at law firm Wachtell, Lipton, Rosen & Katz from 1983 to 1987. Mr. Martin also serves on the board of directors of SLM Corporation and National Penn Bancshares, Inc. and he was a member of the board of directors of BPW Acquisition Corp. from 2008 to 2010. Mr. Martin received a B.S. in economics from Claremont Men’s College and a J.D. from Columbia University School of Law.
Mr. Martin has been designated by Warburg Pincus to be one of our directors pursuant to its rights under the Securities Purchase Agreement, by and among Citi, Primerica and Warburg Pincus dated as of February 8, 2010. Mr. Martin brings to our Board expertise in general management, legal, corporate governance, finance, executive compensation, strategic planning, risk and asset management, investment banking and capital markets, and M&A.
Mark Mason, age 41, was elected to our Board as a Class III director in March 2010. He is the Chief Operating Officer for Citi Holdings, an operating segment of Citi that comprises financial services company Citi Brokerage and Asset Management, Global Consumer Finance and Special Assets Portfolios. Mr. Mason joined Citi in 2001. He has also served as the Chief Financial Officer for Citi Holdings, Chief Financial Officer and Head of Strategy and M&A for Citi’s Global Wealth Management Division, Chief of Staff to Citi’s Chairman and Chief Executive Officer, Chief Financial Officer and Chief Operating Officer for Citigroup Real Estate Investments and Vice President of Corporate Development at Citi. Prior to joining Citi, Mr. Mason was Director of Strategy and Business Development at technology equipment manufacturing company Lucent Technologies. He received a Bachelor of Business and Administration in finance from Howard University and an M.B.A. from Harvard Business School.
Mr. Mason has been designated by Citi to be one of our directors. Mr. Mason brings to our Board expertise in general management, finance, strategic planning, M&A, and investment banking and capital markets.
Ellyn A. McColgan, age 57, was elected to our Board as a Class I director in August 2010. Ms. McColgan has been a private investor and consultant since January 2009. She was the President and Chief Operating Officer of the Global Wealth Management Group of Morgan Stanley from April 2008 through January 2009. From April 1990 through August 2007, Ms. McColgan was a senior executive at mutual fund group Fidelity Investments, serving as President of Distribution and Operations from April 2007 through August 2007; as President, Fidelity Brokerage Company from October 2002 to April 2007; as President, Fidelity Institutional Services from April 2001 through October 2002; as President, Fidelity Institutional Retirement Group from April 2000 through April 2001; and as President, Fidelity Tax-Exempt Services Company from November 1996 through April 2000. Ms. McColgan has Series 6, 7, 24 and 63 licenses. She earned her B.A., summa cum laude, in Psychology and Social Studies Education from Montclair State University in New Jersey and her M.B.A. from Harvard Business School.
Ms. McColgan brings to our Board expertise in general management, strategic planning,
| 158 |
Table of Contents
Index to Financial Statements
finance, and risk and asset management. In particular, the Board considered her significant past experience serving in senior management positions in the financial sector, including experience managing certain operations of Morgan Stanley and Fidelity Investments.
Robert F. McCullough, age 68, was elected to our Board as a Class I director in March 2010. He has been a private investor since January 2007. He previously was Senior Partner of investment fund manager Invesco Ltd. (formerly AMVESCAP PLC) from June 2004 to December 2006. Prior thereto, he was Chief Financial Officer of AMVESCAP PLC from April 1996 to May 2004. Mr. McCullough joined the New York audit staff of Arthur Andersen LLP in 1964, served as Partner from 1972 until 1996, and served as Managing Partner in Atlanta from 1987 until 1996. Mr. McCullough also serves on the boards of Acuity Brands, Inc. and Schweitzer-Mauduit International, Inc. Mr. McCullough was a member of the board of directors of Converge, Inc. from 2006 to 2009 and a director of Mirant Corporation from 2003 to 2006. He received his B.B.A. in Accounting from the University of Texas at Austin.
Mr. McCullough brings to our Board expertise in senior management, finance and accounting, corporate governance, and M&A. In particular, the Board considered his broad perspective in accounting, financial controls and financial reporting matters and his extensive audit experience based on his lengthy career in public accounting and his experience serving as the chairman of the audit committees of several public companies.
Barbara A. Yastine, age 51, was elected to our Board as a Class II director in December 2010. She has been the Chief Administrative Officer of Ally Financial, Inc., a bank holding company, since May 2010. In this role, she has oversight responsibility for the risk, compliance, legal and technology areas and serves as the Chair of Ally Bank, a wholly owned subsidiary of Ally Financial. Prior to joining Ally, she served as a Principal of Southgate Alternative Investments, a start-up diversified alternative asset manager, beginning in June 2007. From August 2004 through June 2007, Ms. Yastine was self-employed as an independent consultant. Before that, she was Chief Financial Officer for investment bank Credit Suisse First Boston from October 2002 to August 2004. From 1987 through 2002, Ms. Yastine worked at Citi and its predecessor companies, where during her 15 year tenure, she received numerous promotions, culminating with serving as the Chief Financial Officer of Citi’s Global Corporate and Investment Bank. During her tenure at Citi, she also served as Chief Auditor, Chief Administrative Officer of Citi’s Global Consumer Group and Executive Vice President and Chief Financial Officer of Citifinancial and its predecessors. Ms. Yastine began her career at a Citi predecessor as Director of Investor Relations. She graduated with a B.A. in Journalism from New York University, where she also earned her M.B.A.
Ms. Yastine brings to our Board expertise in general management, risk and asset management, finance and strategic planning. In particular, the Board considered her significant current and past experience serving in senior management positions in the investment banking and capital markets industries.
Daniel Zilberman, age 37, was elected to our Board as a Class II director in April 2010. He is a Partner of Warburg Pincus & Co. and a Managing Director of private equity firm Warburg Pincus LLC (collectively, “Warburg Pincus”), where he focuses on investments in insurance companies, banks, asset managers and service providers to the financial services industry. Prior to joining Warburg Pincus in 2005, Mr. Zilberman worked at private equity firm Evercore Capital Partners from 2003 to 2005 and investment bank Lehman Brothers from 1997 to 1999 and 2001 to 2002. Mr. Zilberman received a B.A. in International Relations from Tufts University and an M.B.A. in Finance from the Wharton School of the University of Pennsylvania.
Mr. Zilberman has been designated by Warburg Pincus to be one of our directors pursuant to its rights under the Securities Purchase Agreement, by and among Citi, Primerica and Warburg Pincus dated as of February 8, 2010.
| 159 |
Table of Contents
Index to Financial Statements
Mr. Zilberman brings to our Board experience in general management, finance, M&A, strategic planning, government and regulatory affairs, and investment banking and capital markets.
ITEM 11. EXECUTIVE COMPENSATION.
The information required by this item will be contained under the following headings in the Proxy Statement and is incorporated herein by reference:
| • | Corporate Governance – Committees of the Board – Compensation Committee; |
| • | Executive Compensation; and |
| • | Director Compensation. |
ITEM 12. SECURITY OWNERSHIP OF CERTAIN BENEFICIAL OWNERS AND MANAGEMENT AND RELATED STOCKHOLDER MATTERS.
Except for the information set forth in Part II, Item 5. Market for Registrant’s Common Equity, Related Stockholder Matters and Issuer Purchases of Equity Securities, the information required by this item will be contained under the following headings in the Proxy Statement and is incorporated herein by reference:
| • | Beneficial Ownership of Common Stock. |
ITEM 13. CERTAIN RELATIONSHIPS AND RELATED TRANSACTIONS, AND DIRECTOR INDEPENDENCE.
The information required by this item will be contained under the following headings in the Proxy Statement and is incorporated herein by reference:
| • | Introductory paragraph to Corporate Governance; |
| • | Corporate Governance – Independence of Directors; |
| • | Corporate Governance – Categorical Standards of Independence; |
| • | Corporate Governance – Independence of Committee Members; |
| • | Corporate Governance – Committees of the Board; and |
| • | Related Party Transactions. |
ITEM 14. PRINCIPAL ACCOUNTING FEES AND SERVICES.
The information required by this item will be contained under the following headings in the Proxy Statement and is incorporated herein by reference:
| • | Matters to be Voted on – Proposal 3: Ratification of the Appointment of the Independent Registered Public Accounting Firm; |
| • | Corporate Governance – Committees of the Board – Audit Committee; |
| • | Fees and Services of the Independent Registered Public Accounting Firm. |
| 160 |
Table of Contents
Index to Financial Statements
| ITEM 15. | EXHIBITS AND FINANCIAL STATEMENT SCHEDULES. |
(a) 1. FINANCIAL STATEMENTS
| Included in Part II, Item 8, of this report: |
||||||
| Primerica, Inc.: |
||||||
| 106 | ||||||
| Consolidated and Combined Balance Sheets as of December 31, 2010 and 2009 |
107 | |||||
| 108 | ||||||
| 109 | ||||||
| 110 | ||||||
| 111 | ||||||
| 112 | ||||||
| 154 | ||||||
| 2. FINANCIAL STATEMENT SCHEDULES |
||||||
| Included in Part IV of this report: |
||||||
| Report of Independent Registered Public Accounting Firm on Financial Statement Schedules |
166 | |||||
| Summary of Investments — Other than Investments in Related Parties as of December 31, 2010 | 167 | |||||
| Condensed Financial Information of Registrant as of December 31, 2010 and 2009, and for the year ended December 31, 2010 and the period from October 29, 2009 to December 31, 2009 | 168 | |||||
| Supplementary Insurance Information as of December 31, 2010 and 2009, and for each of the years in the three-year period ended December 31, 2010 | 174 | |||||
| Reinsurance for each of the years in the three-year period ended December 31, 2010 | 175 | |||||
3. EXHIBIT INDEX
An “Exhibit Index” has been filed as part of this Report beginning on the following page and is incorporated herein by reference.
Schedules other than those listed above are omitted because they are not required, are not material, are not applicable, or the required information is shown in the financial statements or notes thereto.
(b) Exhibit Index.
The agreements included as exhibits to this report are included to provide information regarding the terms of these agreements and are not intended to provide any other factual or disclosure information about the Company or its subsidiaries, our business or the other parties to these agreements. These agreements may contain representations and warranties by each of the parties to the applicable agreement. These representations and warranties have been made solely for the benefit of the other parties to the applicable agreement and:
| • | should not in all instances be treated as categorical statements of fact, but rather as a way of allocating the risk to one of the parties if those statements prove to be inaccurate; |
| 161 |
Table of Contents
Index to Financial Statements
| • | have been qualified by disclosures that were made to the other party in connection with the negotiation of the application agreement, which disclosures are not necessarily reflected in the agreement; |
| • | may apply standards of materiality in a way that is different from what may be viewed as material to you or other investors; and |
| • | were made only as of the date of the applicable agreement or such other date or dates as may be specified in the agreement and are subject to more recent developments. |
Accordingly, these representations and warranties may not describe the actual state of affairs as of the date they were made or at any other time, and should not be relied upon by investors.
| Exhibit Number |
Description | |
| 2.1 | Securities Purchase Agreement dated February 8, 2010, by and among Citigroup Insurance Holding Corporation, Primerica, Inc., Warburg Pincus Private Equity X, L.P. and Warburg Pincus X Partners, L.P. (Incorporated by reference to Exhibit 2.1 to Primerica’s Registration Statement on Form S-1 (File No. 333-162918)) | |
| 3.1 | Restated Certificate of Incorporation of the Registrant (Incorporated by reference to Exhibit 3.1 to Primerica’s Quarterly Report on Form 10-Q for the quarter ended March 31, 2010 (Commission File No. 001-34680)) | |
| 3.2 | Amended and Restated Bylaws of the Registrant (Incorporated by reference to Exhibit 3.2 to Primerica’s Quarterly Report on Form 10-Q for the quarter ended March 31, 2010 (Commission File No. 001-34680)) | |
| 4.1 | Warrant to purchase 3,975,914 shares of common stock dated as of April 15, 2010 (Incorporated by reference to Exhibit 4.1 to Primerica’s Quarterly Report on Form 10-Q for the quarter ended March 31, 2010 (Commission File No. 001-34680)) | |
| 4.2 | Warrant to purchase 127,196 shares of common stock dated as of April 15, 2010 (Incorporated by reference to Exhibit 4.2 to Primerica’s Quarterly Report on Form 10-Q for the quarter ended March 31, 2010 (Commission File No. 001-34680)) | |
| 4.3 | Note Agreement dated April 1, 2010 between the Registrant, the Guarantors named therein and Citigroup Insurance Holding Corporation (Incorporated by reference to Exhibit 4.3 to Primerica’s Quarterly Report on Form 10-Q for the quarter ended March 31, 2010 (Commission File No. 001-34680)) | |
| 4.4 | Note of the Registrant in favor of Citigroup Insurance Holding Company dated as of April 1, 2010 (Incorporated by reference to Exhibit 4.4 to Primerica’s Quarterly Report on Form 10-Q for the quarter ended March 31, 2010 (Commission File No. 001-34680)) | |
| 10.1 | Intercompany Agreement dated as of April 7, 2010 by and between the Registrant and Citigroup Inc. (Incorporated by reference to Exhibit 10.1 to Primerica’s Quarterly Report on Form 10-Q for the quarter ended March 31, 2010 (Commission File No. 001-34680)) | |
| 10.2 | Transition Services Agreement dated as of April 7, 2010 by and between the Registrant and Citigroup Inc. (Incorporated by reference to Exhibit 10.2 to Primerica’s Quarterly Report on Form 10-Q for the quarter ended March 31, 2010 (Commission File No. 001-34680)) | |
| 10.3 | Tax Separation Agreement dated as of March 30, 2010 by and between the Registrant and Citigroup Inc. (Incorporated by reference to Exhibit 10.3 to Primerica’s Quarterly Report on Form 10-Q for the quarter ended March 31, 2010 (Commission File No. 001-34680)) | |
| 162 |
Table of Contents
Index to Financial Statements
| 10.4 | Long-Term Services Agreement dated as of April 7, 2010 by and between CitiLife Financial Limited and Primerica Life Insurance Company (Incorporated by reference to Exhibit 10.4 to Primerica’s Quarterly Report on Form 10-Q for the quarter ended March 31, 2010 (Commission File No. 001-34680)) | |
| 10.5 | 80% Coinsurance Agreement dated March 31, 2010 by and between Primerica Life Insurance Company and Prime Reinsurance Company, Inc. (Incorporated by reference to Exhibit 10.5 to Primerica’s Quarterly Report on Form 10-Q for the quarter ended March 31, 2010 (Commission File No. 001-34680)) | |
| 10.6 | 10% Coinsurance Agreement dated March 31, 2010 by and between Primerica Life Insurance Company and Prime Reinsurance Company, Inc. (Incorporated by reference to Exhibit 10.6 to Primerica’s Quarterly Report on Form 10-Q for the quarter ended March 31, 2010 (Commission File No. 001-34680)) | |
| 10.7 | 80% Coinsurance Trust Agreement dated March 29, 2010 among Primerica Life Insurance Company, Prime Reinsurance Company, Inc. and The Bank of New York Mellon (Incorporated by reference to Exhibit 10.7 to Primerica’s Quarterly Report on Form 10-Q for the quarter ended March 31, 2010 (Commission File No. 001-34680)) | |
| 10.8 | 10% Coinsurance Economic Trust Agreement dated March 29, 2010 among Primerica Life Insurance Company, Prime Reinsurance Company, Inc. and The Bank of New York Mellon (Incorporated by reference to Exhibit 10.8 to Primerica’s Quarterly Report on Form 10-Q for the quarter ended March 31, 2010 (Commission File No. 001-34680)) | |
| 10.9 | 10% Coinsurance Excess Trust Agreement dated March 29, 2010 among Primerica Life Insurance Company, Prime Reinsurance Company, Inc. and The Bank of New York Mellon (Incorporated by reference to Exhibit 10.9 to Primerica’s Quarterly Report on Form 10-Q for the quarter ended March 31, 2010 (Commission File No. 001-34680)) | |
| 10.10 | Capital Maintenance Agreement dated March 31, 2010 by and between Citigroup Inc. and Prime Reinsurance Company, Inc. (Incorporated by reference to Exhibit 10.10 to Primerica’s Quarterly Report on Form 10-Q for the quarter ended March 31, 2010 (Commission File No. 001-34680)) | |
| 10.11 | 90% Coinsurance Agreement dated March 31, 2010 by and between National Benefit Life Insurance Company and American Health and Life Insurance Company (Incorporated by reference to Exhibit 10.11 to Primerica’s Quarterly Report on Form 10-Q for the quarter ended March 31, 2010 (Commission File No. 001-34680)) | |
| 10.12 | Trust Agreement dated March 29, 2010 among National Benefit Life Insurance Company, American Health and Life Insurance Company and The Bank of New York Mellon (Incorporated by reference to Exhibit 10.12 to Primerica’s Quarterly Report on Form 10-Q for the quarter ended March 31, 2010 (Commission File No. 001-34680)) | |
| 10.13 | Coinsurance Agreement dated March 31, 2010 by and between Primerica Life Insurance Company of Canada and Financial Reassurance Company 2010, Ltd. (Incorporated by reference to Exhibit 10.13 to Primerica’s Quarterly Report on Form 10-Q for the quarter ended March 31, 2010 (Commission File No. 001-34680)) | |
| 10.14 | Common Stock Exchange Agreement dated as of April 15, 2010 among the Registrant, Warburg Pincus LLC and Warburg Pincus & Co. (Incorporated by reference to Exhibit 10.39 to Primerica’s Quarterly Report on Form 10-Q for the quarter ended March 31, 2010 (Commission File No. 001-34680)) | |
| 163 |
Table of Contents
Index to Financial Statements
| 10.15 | Registration Rights Agreement dated as of April 7, 2010 by and among Citigroup Insurance Holding Corporation, Warburg Pincus Private Equity X, L.P., Warburg Pincus X Partners, L.P. and the Registrant (Incorporated by reference to Exhibit 10.40 to Primerica’s Quarterly Report on Form 10-Q for the quarter ended March 31, 2010 (Commission File No. 001-34680)) | |
| 10.16 | Monitoring and Reporting Agreement dated as of March 31, 2010 by and among Primerica Life Insurance Company and Prime Reinsurance Company, Inc. (Incorporated by reference to Exhibit 10.41 to Primerica’s Quarterly Report on Form 10-Q for the quarter ended March 31, 2010 (Commission File No. 001-34680)) | |
| 10.17 | Monitoring and Reporting Agreement dated as of March 31, 2010 by and among National Benefit Life Insurance Company and American Health and Life Insurance Company (Incorporated by reference to Exhibit 10.42 to Primerica’s Quarterly Report on Form 10-Q for the quarter ended March 31, 2010 (Commission File No. 001-34680)) | |
| 10.18 | Monitoring and Reporting Agreement dated as of March 31, 2010 by and among Primerica Life Insurance Company of Canada and Financial Reassurance Company 2010 Ltd. (Incorporated by reference to Exhibit 10.43 to Primerica’s Quarterly Report on Form 10-Q for the quarter ended March 31, 2010 (Commission File No. 001-34680)) | |
| 10.19 | Primerica, Inc. Stock Purchase Plan for Agents and Employees (Incorporated by reference to Exhibit 10.45 to Primerica’s Quarterly Report on Form 10-Q for the quarter ended March 31, 2010 (Commission File No. 001-34680)) | |
| 10.20 | Primerica, Inc. 2010 Omnibus Incentive Plan (Incorporated by reference to Exhibit 10.14 to Primerica’s Quarterly Report on Form 10-Q for the quarter ended March 31, 2010 (Commission File No. 001-34680))* | |
| 10.21 | Form of Restricted Stock Award Agreement under the Primerica, Inc. 2010 Omnibus Incentive Plan (Incorporated by reference to Exhibit 10.15 to Primerica’s Registration Statement on Form S-1 (File No. 333-162918))* | |
| 10.22 | Form of Director Restricted Stock Award Agreement (Incorporated by reference to Exhibit 10.46 to Primerica’s Registration Statement on Form S-1 (File No. 333-162918)) | |
| 10.23 | Form of Restricted Stock Award Agreement for Messrs. Addison and R. Williams (Incorporated by reference to Exhibit 10.47 to Primerica’s Registration Statement on Form S-1 (File No. 333-162918))* | |
| 10.24 | Form of Indemnification Agreement for Directors and Officers. (Incorporated by reference to Exhibit 10.48 to Primerica’s Registration Statement on Form S-1 (File No. 333-162918))* | |
| 10.25 | Employment Agreement, dated as of August 19, 2010, between the Registrant and Mr. D. Richard Williams. (Incorporated by reference to Exhibit 99.1 to Primerica’s Current Report on Form 8-K dated August 19, 2010 (Commission File No. 001-34680)* | |
| 10.26 | Employment Agreement, dated as of August 19, 2010, between the Registrant and Mr. John A. Addison, Jr. (Incorporated by reference to Exhibit 99.2 to Primerica’s Current Report on Form 8-K dated August 19, 2010 (Commission File No. 001-34680)* | |
| 10.27 | Employment Agreement, dated as of August 19, 2010, between the Registrant and Mr. Peter W. Schneider (Incorporated by reference to Exhibit 99.3 to Primerica’s Current Report on Form 8-K dated August 19, 2010 (Commission File No. 001-34680)* | |
| 10.28 | Employment Agreement, dated as of August 19, 2010, between the Registrant and Mr. Glenn J. Williams (Incorporated by reference to Exhibit 99.4 to Primerica’s Current Report on Form 8-K dated August 19, 2010 (Commission File No. 001-34680)* | |
| 164 |
Table of Contents
Index to Financial Statements
| 10.29 | Employment Agreement, dated as of August 19, 2010, between the Registrant and Ms. Alison S. Rand (Incorporated by reference to Exhibit 99.5 to Primerica’s Current Report on Form 8-K dated August 19, 2010 (Commission File No. 001-34680)* | |
| 10.30 | Employment Agreement, dated as of August 19, 2010, between the Registrant and Mr. Gregory C. Pitts (Incorporated by reference to Exhibit 99.6 to Primerica’s Current Report on Form 8-K dated August 19, 2010 (Commission File No. 001-34680)* | |
| 10.31 | Nonemployee Directors’ Deferred Compensation Plan, effective as of January 1, 2011, adopted on November 10, 2010 | |
| 21.1 | Subsidiaries of the Registrant | |
| 23.1 | Consent of KPMG LLP | |
| 31.1 | Rule 13a-14(a)/15d-14(a) Certification, executed by D. Richard Williams, Chairman of the Board and Co-Chief Executive Officer | |
| 31.2 | Rule 13a-14(a)/15d-14(a) Certification, executed by John A. Addison, Jr., Chairman of Primerica Distribution and Co-Chief Executive Officer | |
| 31.3 | Rule 13a-14(a)/15d-14(a) Certification, executed by Alison S. Rand, Executive Vice President and Chief Financial Officer | |
| 32.1 | Certifications required by Rule 13a-14(b) or Rule 15d-14(b) and Section 1350 of Chapter 63 of Title 18 of the United States Code (18 U.S.C. 1350), executed by D. Richard Williams, Chairman of the Board and Co-Chief Executive Officer, John A. Addison, Jr., Chairman of Primerica Distribution and Co-Chief Executive Officer, and Alison S. Rand, Executive Vice President and Chief Financial Officer | |
| * | Identifies a management contract or compensatory plan or arrangement. |
| 165 |
Table of Contents
Index to Financial Statements
(c) Financial Statement Schedules.
REPORT OF INDEPENDENT REGISTERED PUBLIC ACCOUNTING FIRM ON FINANCIAL STATEMENT SCHEDULES
The stockholders and board of directors of Primerica, Inc.:
Under date of March 17, 2011, we reported on the consolidated and combined balance sheets of Primerica, Inc. and subsidiaries (the Company) as of December 31, 2010 and 2009, and the related consolidated and combined statements of income, stockholders’ equity, comprehensive income, and cash flows for each of the years in the three-year period ended December 31, 2010. In connection with our audits of the aforementioned consolidated and combined financial statements, we also audited the related financial statement schedules. These financial statement schedules are the responsibility of the Company’s management. Our responsibility is to express an opinion on these financial statement schedules based on our audits.
In our opinion, such financial statement schedules, when considered in relation to the basic consolidated and combined financial statements taken as a whole, present fairly, in all material respects, the information set forth therein.
As discussed in notes 1 and 2 to the consolidated and combined financial statements, in April 2010 the Company completed its initial public offering and a series of related transactions. Also as discussed in note 1 to the consolidated and combined financial statements, the Company adopted the provisions of FASB Staff Position Financial Accounting Standard No. 115-2 and Financial Accounting Standard No. 124-2, Recognition and Presentation of Other-Than-Temporary Impairments (included in FASB ASC Topic 320, Investments — Debt and Equity Securities) as of January 1, 2009.
/s/ KPMG LLP
Atlanta, Georgia
March 17, 2011
| 166 |
Table of Contents
Index to Financial Statements
Summary of Investments — Other than Investments in Related Parties
PRIMERICA, INC.
| As of December 31, 2010 | ||||||||||||
| Type of investment |
Cost | Value | Amount at which shown in the balance sheet |
|||||||||
| (In thousands) | ||||||||||||
| Fixed maturities: |
||||||||||||
| Bonds: |
||||||||||||
| United States Government and government agencies and authorities |
$ | 21,596 | $ | 22,202 | $ | 22,202 | ||||||
| States, municipalities and political subdivisions |
26,758 | 27,219 | 27,219 | |||||||||
| Foreign governments |
81,367 | 94,541 | 94,541 | |||||||||
| Public utilities |
— | — | — | |||||||||
| Convertibles and bonds with warrants attached |
27,633 | 28,558 | 28,558 | |||||||||
| All other corporate bonds |
1,794,370 | 1,931,074 | 1,931,074 | |||||||||
| Certificates of deposit |
— | — | — | |||||||||
| Redeemable preferred stocks |
652 | 534 | 534 | |||||||||
| Total fixed maturities |
1,952,376 | 2,104,128 | 2,104,128 | |||||||||
| Equity securities: |
||||||||||||
| Common stocks: |
||||||||||||
| Public utilities |
2,501 | 3,019 | 3,019 | |||||||||
| Banks, trusts and insurance companies |
5,526 | 8,781 | 8,781 | |||||||||
| Industrial, miscellaneous and all other |
7,282 | 9,184 | 9,184 | |||||||||
| Nonredeemable preferred stocks |
2,085 | 2,229 | 2,229 | |||||||||
| Total equity securities |
17,394 | 23,213 | 23,213 | |||||||||
| Mortgage loans on real estate |
— | — | — | |||||||||
| Real estate |
— | — | — | |||||||||
| Policy loans |
26,229 | 26,229 | 26,229 | |||||||||
| Other long-term investments |
— | — | — | |||||||||
| Short-term investments |
14 | 14 | 14 | |||||||||
| Total investments |
$ | 1,996,013 | $ | 2,153,584 | $ | 2,153,584 | ||||||
See the accompanying report of independent registered public accounting firm.
| 167 |
Table of Contents
Index to Financial Statements
Condensed Financial Information of Registrant
PRIMERICA, INC. (Parent Only)
Condensed Balance Sheets
| December 31, | ||||||||
| 2010 | 2009 | |||||||
| (In thousands) | ||||||||
| Assets |
||||||||
| Cash and cash equivalents |
$ | 250 | $ | — | ||||
| Income taxes receivable from subsidiaries* |
1,640 | — | ||||||
| Investment in subsidiaries* |
1,738,699 | — | ||||||
| Total assets |
$ | 1,740,589 | — | |||||
| Liabilities and Stockholders’ Equity |
||||||||
| Liabilities: |
||||||||
| Note payable |
300,000 | — | ||||||
| Due to affiliates* |
897 | — | ||||||
| Interest payable |
7,608 | — | ||||||
| Other liabilities |
592 | — | ||||||
| Commitments and contingent liabilities (see Note F) |
||||||||
| Total liabilities |
309,097 | — | ||||||
| Stockholders’ equity: |
||||||||
| Common stock ($0.01 par value, authorized 500,000 in 2010 and issued 72,843 in 2010) |
728 | — | ||||||
| Paid-in capital |
883,168 | — | ||||||
| Retained earnings |
395,057 | — | ||||||
| Accumulated other comprehensive income |
152,539 | — | ||||||
| Total stockholders’ equity |
1,431,492 | — | ||||||
| Total liabilities and stockholders’ equity |
$ | 1,740,589 | $ | — | ||||
| * | Eliminated in consolidation. |
See the accompanying notes to condensed financial statements.
See the accompanying report of independent registered public accounting firm.
| 168 |
Table of Contents
Index to Financial Statements
Schedule II
Condensed Financial Information of Registrant
PRIMERICA, INC. (Parent Only)
Condensed Statements of Income
| Year ended December 31, 2010 |
Period from October 29, 2009 to December 31, 2009 |
|||||||
| (In thousands) | ||||||||
| Revenues: |
||||||||
| Dividends from subsidiaries* |
$ | 7,313 | $ | — | ||||
| Other, net |
18 | — | ||||||
| Total revenues |
7,331 | — | ||||||
| Benefits and expenses: |
||||||||
| Interest expense |
12,375 | — | ||||||
| Other operating expenses |
8,936 | — | ||||||
| Total benefits and expenses |
21,311 | — | ||||||
| Loss before income tax benefit |
(13,980 | ) | — | |||||
| Income tax benefit |
(8,281 | ) | — | |||||
| Loss before equity in undistributed earnings of subsidiaries |
(5,699 | ) | — | |||||
| Equity in undistributed earnings of subsidiaries* |
120,191 | — | ||||||
| Net income |
$ | 114,492 | $ | — | ||||
| * | Eliminated in consolidation. |
See the accompanying notes to condensed financial statements.
See the accompanying report of independent registered public accounting firm.
| 169 |
Table of Contents
Index to Financial Statements
Schedule II
Condensed Financial Information of Registrant
PRIMERICA, INC. (Parent Only)
Condensed Statements of Comprehensive Income
| Year ended December 31, 2010 |
Period from October 29, 2009 to December 31, 2009 |
|||||||
| (In thousands) | ||||||||
| Net income |
$ | 114,492 | $ | — | ||||
| Other comprehensive income (loss) before income taxes: |
||||||||
| Unrealized investment gains (losses): |
||||||||
| Equity in unrealized holding gains on investment securities held by subsidiaries |
15,027 | — | ||||||
| Foreign currency translation adjustments: |
||||||||
| Equity in unrealized foreign currency translation losses of subsidiaries |
3,416 | — | ||||||
| Total other comprehensive income before income taxes |
18,443 | — | ||||||
| Income tax related to items of other comprehensive income |
— | — | ||||||
| Other comprehensive income, net of income tax |
18,443 | — | ||||||
| Total comprehensive income |
$ | 132,935 | $ | — | ||||
See the accompanying notes to condensed financial statements.
See the accompanying report of independent registered public accounting firm.
| 170 |
Table of Contents
Index to Financial Statements
Schedule II
Condensed Financial Information of Registrant
PRIMERICA, INC. (Parent Only)
Condensed Statements of Cash Flows
| Year ended December 31, 2010 |
Period from October 29, 2009 to December 31, 2009 |
|||||||
| (In thousands) | ||||||||
| Cash flows from operations: |
||||||||
| Net income |
$ | 114,492 | $ | — | ||||
| Adjustments to reconcile net income to net cash (used in) provided by operations: |
||||||||
| Equity in undistributed earnings of subsidiaries* |
(120,191 | ) | — | |||||
| Change in income taxes receivable* |
(1,640 | ) | — | |||||
| Change in due to affiliates* |
897 | — | ||||||
| Change in interest payable |
7,608 | — | ||||||
| Change in other liabilities |
592 | — | ||||||
| Share-based compensation |
(6 | ) | — | |||||
| Net cash provided by operations |
1,752 | — | ||||||
| Cash flows from financing activities: |
||||||||
| Dividends to stockholders |
(1,502 | ) | — | |||||
| Net cash used in financing activities |
(1,502 | ) | — | |||||
| Increase in cash |
250 | — | ||||||
| Cash and cash equivalents, beginning of year |
— | — | ||||||
| Cash and cash equivalents, end of year |
$ | 250 | $ | — | ||||
| Supplemental disclosures of cash flow information: |
||||||||
| Interest paid |
$ | 4,767 | $ | — | ||||
| Non-cash activities: |
||||||||
| Share-based compensation |
$ | 44,023 | $ | — | ||||
| Net contribution from Citigroup Inc. |
1,728,574 | — | ||||||
| * | Eliminated in consolidation. |
See the accompanying notes to condensed financial statements.
See the accompanying report of independent registered public accounting firm.
| 171 |
Table of Contents
Index to Financial Statements
Schedule II
Condensed Financial Information of Registrant
PRIMERICA, INC. (Parent Only)
Notes to Condensed Financial Statements
(A) Corporate Organization
Primerica, Inc. was incorporated in Delaware on October 29, 2009 by Citi to serve as a holding company for the life insurance and financial product distribution businesses that we have operated for more than 30 years. At such time, we issued 100 shares of common stock to Citi. These businesses, which prior to April 1, 2010 were wholly owned indirect subsidiaries of Citi, were transferred to us on April 1, 2010. In conjunction with our reorganization, we issued to a wholly owned subsidiary of Citi (i) 74,999,900 shares of our common stock (of which 24,564,000 shares of common stock were subsequently sold by Citi in the Offering completed in April 2010; 16,412,440 shares of common stock were subsequently sold by Citi in April 2010 to certain private equity funds managed by Warburg Pincus LLC (Warburg Pincus) (the private sale); and 5,021,412 shares of common stock were immediately contributed back to us for equity awards granted to our employees and sales force leaders in connection with the Offering), (ii) warrants to purchase from us an aggregate of 4,103,110 shares of our common stock (which were subsequently transferred by Citi to Warburg Pincus pursuant to the private sale), and (iii) a $300.0 million note payable due on March 31, 2015 bearing interest at an annual rate of 5.5% (the Citi note). Prior to our corporate reorganization, we had no material assets or liabilities. Upon completion of the corporate reorganization, we became a holding company with our primary asset being the capital stock of our operating subsidiaries and our primary liability being the Citi note.
(B) Basis of Presentation
These condensed financial statements reflect the results of operations, financial position and cash flows for the parent company. We prepare our financial statements in accordance with GAAP. These principles are established primarily by the FASB. The preparation of financial statements in conformity with GAAP requires us to make estimates and assumptions that affect financial statement balances, revenues and expenses and cash flows as well as the disclosure of contingent assets and liabilities. Management considers available facts and knowledge of existing circumstances when establishing the estimates included in our financial statements.
The most significant item that involves a greater degree of accounting estimates subject to change in the future is determination of our investments in subsidiaries. Estimates for this and other items are subject to change and are reassessed by management in accordance with GAAP. Actual results could differ from those estimates.
The accompanying condensed financial statements should be read in conjunction with the consolidated financial statements and notes thereto of Primerica, Inc. and Subsidiaries included in Part II, Item 8 of this report.
(C) Note Payable
In April 2010, we issued to Citi a $300.0 million note as part of our corporate reorganization in which Citi transferred to us the businesses that comprise our operations. Prior to the issuance of the Citi note, we had no outstanding debt. The Citi note bears interest at an annual rate of 5.5%, payable semi-annually in arrears on January 15 and July 15, and matures March 31, 2015. Citi may participate out, assign or sell all or any portion of the note at any time.
We have the option to redeem the Citi note in whole or in part at a redemption price equal to 100% of the principal amount to be redeemed plus accrued and unpaid interest to the date of redemption. In the event of a change in control, the holder of the Citi note has the right to require us to repurchase it at a price equal to
| 172 |
Table of Contents
Index to Financial Statements
101% of the outstanding principal amount plus accrued and unpaid interest.
The Citi note also requires us to use our commercially reasonable efforts to arrange and consummate an offering of investment-grade debt securities, trust preferred securities, surplus notes, hybrid securities or convertible debt that generates sufficient net cash proceeds (after deducting fees and expenses) to repay the note in full at certain mutually agreeable dates, based on certain conditions.
We were in compliance with all of the covenants of the Citi note at December 31, 2010. No events of default or defaults occurred during 2010.
(D) Income Taxes
In conjunction with the Offering and the private sale, we made elections under Section 338(h)(10) of the Internal Revenue Code, which resulted in changes to our deferred tax balances and reduced stockholders’ equity by $172.5 million.
Prior to April 8, 2010, our federal income tax return was included as part of Citi’s consolidated federal income tax return. On March 30, 2010, in anticipation of our corporate reorganization, we entered into a tax separation agreement with Citi and prepaid our estimated tax liability to Citi. In accordance with the tax separation agreement, Citi will indemnify the Company and its subsidiaries against any consolidated, combined, affiliated, unitary or similar federal, state or local income tax liability for any taxable period ending on or before April 7, 2010, the closing date of the Offering. Our advance tax payments paid to Citi exceeded our actual tax liabilities. As a result, we reduced tax assets and recorded the excess payment as a return of capital.
(E) Dividends
Primerica, Inc. received dividends from its non-life subsidiaries of approximately $7.3 million in 2010. No dividends were received in 2010 from the life insurance subsidiaries. Primerica, Inc. had no subsidiaries until the corporate reorganization in April 2010.
(F) Commitments and Contingent Liabilities
The Company is involved from time to time in legal disputes, regulatory inquiries and arbitration proceedings in the normal course of business. These disputes are subject to uncertainties, including the large and/or indeterminate amounts sought in certain of these matters and the inherent unpredictability of litigation. As such, the Company is unable to estimate the possible loss or range of loss that may result from these matters. While it is possible that an adverse outcome in certain cases could have a material adverse effect upon the Company’s financial position, based on information currently known by the Company’s management, in its opinion, the outcomes of such pending investigations and legal proceedings are not likely to have such an effect.
| 173 |
Table of Contents
Index to Financial Statements
Supplementary Insurance Information
PRIMERICA, INC.
| Deferred policy acquisition costs |
Future policy benefits |
Unearned premiums |
Other policy benefits and claims payable |
Separate account liabilities |
||||||||||||||||
| (In thousands) | ||||||||||||||||||||
| As of December 31, 2010: |
||||||||||||||||||||
| Term Life Insurance |
$ | 734,187 | $ | 4,237,487 | $ | — | $ | 210,595 | $ | — | ||||||||||
| Investment and Savings Products |
68,254 | — | — | — | 2,445,590 | |||||||||||||||
| Corporate and Other Distributed Products |
50,770 | 171,696 | 5,563 | 19,300 | 1,196 | |||||||||||||||
| Total |
$ | 853,211 | $ | 4,409,183 | $ | 5,563 | $ | 229,895 | $ | 2,446,786 | ||||||||||
| As of December 31, 2009: |
||||||||||||||||||||
| Term Life Insurance |
$ | 2,677,060 | $ | 4,023,244 | $ | — | $ | 198,193 | $ | — | ||||||||||
| Investment and Savings Products |
62,484 | — | — | — | 2,091,965 | |||||||||||||||
| Corporate and Other Distributed Products |
50,361 | 174,210 | 3,185 | 20,197 | 1,377 | |||||||||||||||
| Total |
$ | 2,789,905 | $ | 4,197,454 | $ | 3,185 | $ | 218,390 | $ | 2,093,342 | ||||||||||
| Premium revenue |
Net investment income |
Benefits and claims |
Amortization of deferred policy acquisition costs |
Other operating expenses |
Premiums written |
|||||||||||||||||||
| (In thousands) | ||||||||||||||||||||||||
| Year ended December 31, 2010: |
||||||||||||||||||||||||
| Term Life Insurance |
$ | 664,668 | $ | 110,633 | $ | 277,653 | $ | 156,312 | $ | 75,559 | — | |||||||||||||
| Investment and Savings Products |
— | — | — | 9,330 | 238,947 | — | ||||||||||||||||||
| Corporate and Other Distributed Products |
66,039 | 54,478 | 40,050 | 2,393 | 162,476 | 40,429 | ||||||||||||||||||
| Total |
$ | 730,707 | $ | 165,111 | $ | 317,703 | $ | 168,035 | $ | 476,982 | $ | 40,429 | ||||||||||||
| Year ended December 31, 2009: |
||||||||||||||||||||||||
| Term Life Insurance |
$ | 1,434,197 | $ | 274,212 | $ | 559,038 | $ | 371,663 | $ | 152,352 | — | |||||||||||||
| Investment and Savings Products |
— | — | — | 7,254 | 199,482 | — | ||||||||||||||||||
| Corporate and Other Distributed Products |
67,830 | 77,114 | 41,235 | 2,374 | 127,048 | 40,849 | ||||||||||||||||||
| Total |
$ | 1,502,027 | $ | 351,326 | $ | 600,273 | $ | 381,291 | $ | 478,882 | $ | 40,849 | ||||||||||||
| Year ended December 31, 2008: |
||||||||||||||||||||||||
| Term Life Insurance |
$ | 1,393,953 | $ | 244,736 | $ | 894,910 | $ | 131,286 | $ | 135,007 | — | |||||||||||||
| Investment and Savings Products |
— | — | — | 10,966 | 250,378 | — | ||||||||||||||||||
| Corporate and Other Distributed Products |
69,765 | 69,299 | 43,460 | 2,238 | 375,663 | 41,774 | ||||||||||||||||||
| Total |
$ | 1,463,718 | $ | 314,035 | $ | 938,370 | $ | 144,490 | $ | 761,048 | $ | 41,774 | ||||||||||||
See accompanying report of independent registered public accounting firm.
| 174 |
Table of Contents
Index to Financial Statements
Reinsurance
PRIMERICA, INC.
| Year ended December 31, 2010 | ||||||||||||||||||||
| Gross amount |
Ceded to other companies |
Assumed from other companies |
Net amount |
Percentage of amount assumed to net |
||||||||||||||||
| (Dollars in thousands) | ||||||||||||||||||||
| Life insurance in force |
$ | 662,135,294 | $ | 600,806,666 | $ | — | $ | 61,328,628 | — | % | ||||||||||
| Premiums: |
||||||||||||||||||||
| Life insurance |
$ | 2,138,912 | $ | 1,448,694 | $ | — | $ | 690,218 | — | % | ||||||||||
| Accident and health insurance |
42,162 | 1,673 | — | 40,489 | — | % | ||||||||||||||
| Total premiums |
$ | 2,181,074 | $ | 1,450,367 | $ | — | $ | 730,707 | — | % | ||||||||||
| Year ended December 31, 2009 | ||||||||||||||||||||
| Gross amount | Ceded to other companies |
Assumed from other companies |
Net amount | Percentage of amount assumed to net |
||||||||||||||||
| (Dollars in thousands) | ||||||||||||||||||||
| Life insurance in force |
$ | 655,659,625 | $ | 421,621,165 | $ | — | $ | 234,038,460 | — | % | ||||||||||
| Premiums: |
||||||||||||||||||||
| Life insurance |
$ | 2,069,009 | $ | 610,020 | $ | — | $ | 1,458,989 | — | % | ||||||||||
| Accident and health insurance |
43,772 | 734 | — | 43,038 | — | % | ||||||||||||||
| Total premiums |
$ | 2,112,781 | $ | 610,754 | $ | — | $ | 1,502,027 | — | % | ||||||||||
| Year ended December 31, 2008 | ||||||||||||||||||||
| Gross amount | Ceded to other companies |
Assumed from other companies |
Net amount | Percentage of amount assumed to net |
||||||||||||||||
| (Dollars in thousands) | ||||||||||||||||||||
| Life insurance in force |
$ | 639,157,278 | $ | 410,916,299 | $ | — | $ | 228,240,979 | — | % | ||||||||||
| Premiums: |
||||||||||||||||||||
| Life insurance |
$ | 2,049,730 | $ | 628,055 | $ | — | $ | 1,421,675 | — | % | ||||||||||
| Accident and health insurance |
43,062 | 1,019 | — | 42,043 | — | % | ||||||||||||||
| Total premiums |
$ | 2,092,792 | $ | 629,074 | $ | — | $ | 1,463,718 | — | % | ||||||||||
See the accompanying report of independent registered public accounting firm.
| 175 |
Table of Contents
Index to Financial Statements
Pursuant to the requirements of Section 13 or 15(d) of the Securities Exchange Act of 1934, the registrant has duly caused this report to be signed on its behalf by the undersigned, thereunto duly authorized.
| Primerica, Inc. | ||||||||
| By: |
/s/ Alison S. Rand
|
March 17, 2011
|
||||||
| Alison S. Rand | ||||||||
| Executive Vice President and | ||||||||
| Chief Financial Officer | ||||||||
Pursuant to the requirements of the Securities Exchange Act of 1934, this report has been signed below by the following persons on behalf of the registrant and in the capacities and on the dates indicated.
| /s/ D. Richard Williams D. Richard Williams |
Chairman of the Board and Co-Chief Executive Officer (Principal Executive Officer) |
March 17, 2011 | ||
| /s/ John A. Addison, Jr. John A. Addison, Jr. |
Chairman of Primerica Distribution and Co-Chief Executive Officer (Principal Executive Officer) |
March 17, 2011 | ||
| /s/ Alison S. Rand Alison S. Rand |
Executive Vice President and Chief Financial Officer (Principal Financial and Accounting Officer) |
March 17, 2011 | ||
| /s/ P. George Benson P. George Benson |
Director | March 17, 2011 | ||
| /s/ Michael E. Martin Michael E. Martin |
Director | March 17, 2011 | ||
| /s/ Mark Mason Mark Mason |
Director | March 17, 2011 | ||
| /s/ Ellyn A. McColgan Ellyn A. McColgan |
Director | March 15, 2011 | ||
| /s/ Robert F. McCullough Robert F. McCullough |
Director | March 17, 2011 | ||
| /s/ Barbara A. Yastine Barbara A. Yastine |
Director | March 17, 2011 | ||
| /s/ Daniel Zilberman Daniel Zilberman |
Director | March 17, 2011 | ||
| 176 |