Attached files
Table of Contents
UNITED STATES
SECURITIES AND EXCHANGE COMMISSION
WASHINGTON, D.C. 20549
FORM 10-K
ANNUAL REPORT PURSUANT TO SECTION 13 OR 15(d)
OF THE SECURITIES EXCHANGE ACT OF 1934
For the fiscal year ended: December 31, 2010
Commission file number: 000-50332
PREMIERWEST BANCORP
(Exact name of registrant as specified in its charter)
| Oregon | 93-1282171 | |
| (State or other jurisdiction of incorporation or organization) |
(I.R.S. Employer Identification No.) |
| 503 Airport Road – Suite 101 Medford, Oregon |
97504 | |
| (Address of principal executive offices) | (Zip Code) |
Registrant’s telephone number, including area code: (541) 618-6003
Securities registered pursuant to Section 12(b) of the Act: None
Securities registered pursuant to Section 12(g) of the Act:
Common Stock, No Par Value
(title of class)
Indicate by check mark if the registrant is a well-known seasoned issuer, as defined in Rule 405 of the Securities Act. Yes ¨ No x
Indicate by check mark if the registrant is not required to file reports pursuant to Section 13 or Section 15(d) of the Act. Yes ¨ No x
Indicate by check mark whether the registrant (1) has filed all reports required to be filed by Section 13 or 15(d) of the Securities Exchange Act of 1934 during the preceding 12 months (or for such shorter period that the registrant was required to file such reports), and (2) has been subject to such filing requirements for the past 90 days. Yes x No ¨
Indicate by check mark whether the registrant has submitted electronically and posted on its corporate Web site, if any, every Interactive Data File required to be submitted and posted pursuant to Rule 405 of Regulation S-T (§232.405 of this chapter) during the preceding 12 months (or for such shorter period that the registrant was required to submit and post such files). Yes ¨ No ¨
Indicate by check mark if disclosure of delinquent filers pursuant to Item 405 of Regulation S-K (§229.405 of this chapter) is not contained herein, and will not be contained, to the best of registrant’s knowledge, in definitive proxy or information statements incorporated by reference in Part III of this Form 10-K or any amendment to this Form 10-K. x
Indicate by check mark whether the registrant is a large accelerated filer, an accelerated filer, a non-accelerated filer or a smaller reporting company. See definitions of “large accelerated filer, “accelerated filer” and “smaller reporting company” in Rule 12b-2 of the Exchange Act.
Large accelerated filer ¨ Accelerated filer ¨ Non-accelerated filer ¨ Smaller reporting company x
Indicate by check mark whether the registrant is a shell company (as defined in Rule 12b-2 of the Exchange Act). Yes ¨ No x
The aggregate market value of the registrant’s common stock held by non-affiliates of the registrant was approximately $32.4 million, based on the closing price on June 30, 2010, reported on NASDAQ.
The number of shares outstanding of Registrant’s common stock as of March 15, 2011 was 10,034,830.
Documents Incorporated by Reference
Portions of the definitive Proxy Statement to be delivered to shareholders in connection with the 2011 Annual Meeting of Shareholders are incorporated by reference into Part III.
Table of Contents
FORM 10-K
TABLE OF CONTENTS
| PAGE | ||||||
| 3 | ||||||
| PART I |
||||||
| Item 1. |
4-18 | |||||
| Item 1A. |
19-26 | |||||
| Item 1B. |
27 | |||||
| Item 2. |
27 | |||||
| Item 3. |
27 | |||||
| Item 4. |
27 | |||||
| PART II |
||||||
| Item 5. |
28-29 | |||||
| Item 6. |
30 | |||||
| Item 7. |
Management’s Discussion and Analysis of Financial Condition and Results of Operations |
31-58 | ||||
| Item 7A. |
59-61 | |||||
| Item 8. |
61-116 | |||||
| Item 9. |
Changes In and Disagreements with Accountants on Accounting and Financial Disclosure |
117 | ||||
| Item 9A. |
117 | |||||
| Item 9B. |
118 | |||||
| PART III |
||||||
| Item 10. |
119 | |||||
| Item 11. |
119 | |||||
| Item 12. |
Security Ownership of Certain Beneficial Owners and Management and Related Stockholder Matters |
119 | ||||
| Item 13. |
Certain Relationships and Related Transactions, and Director Independence |
119 | ||||
| Item 14. |
119 | |||||
| PART IV |
||||||
| Item 15. |
120-123 | |||||
| 124 | ||||||
2
Table of Contents
DISCLOSURE REGARDING FORWARD-LOOKING STATEMENTS
This report includes “forward-looking statements” within the meaning of the “safe-harbor” provisions of Sections 21D and 21E of the Securities Exchange Act of 1934, as amended. Other than statements of historical fact, all statements about our financial position and results of operations, business strategy and Management’s plans and objectives for future operations are forward-looking statements. When used in this report, the words “anticipate,” “believe,” “estimate,” “expect,” and “intend” and words or phrases of similar meaning, help identify forward-looking statements. Examples of forward-looking statements include, but are not limited to: statements that include projections or Management’s expectations for revenues, income or expenses, earnings per share, capital expenditures, dividends, capital levels and structure and other financial items; statements of the plans and objectives of the Company, its Management or its Board of Directors, including the introduction of new products or services, plans for expansion, acquisitions or future growth and estimates or predictions of actions by customers, vendors, competitors or regulatory authorities; statements about future economic performance; statements of assumptions underlying other statements about the Company and its business; statements regarding the adequacy of the allowance for loan losses; and descriptions of assumptions underlying or relating to any of the foregoing. Although Management believes that the expectations reflected in forward-looking statements are reasonable, we can make no assurance that such expectations will prove correct. Forward-looking statements are subject to various risks and uncertainties that could cause actual results to differ materially from those indicated by the forward-looking statements. For a more comprehensive discussion of the risk factors impacting our business refer to Item 1A Risk Factors in this report beginning on page 12. These risks and uncertainties include the effect of competition and our ability to compete on price and other factors; deterioration in credit quality, or in the value of the collateral securing our loans, due to higher interest rates, increased unemployment, further or continued disruptions in the credit markets, or other economic factors; customer acceptance of new products and services; economic conditions and events that disproportionately affect our business due to regional concentration; general business and economic conditions, including the residential and commercial real estate markets; interest rate changes; regulatory and legislative changes; changes in the demand for loans and changes in consumer spending, borrowing and savings habits; changes in accounting policies; our ability to maintain or expand our market share or our net interest margin; factors that could limit or delay implementation of our marketing and growth strategies; and our ability to integrate acquired branches or banks. Other risks include those identified from time to time in our past and future filings with the Securities and Exchange Commission. Note that this list of risks is not exhaustive, and risks identified are applicable as of the date made and are not updated except as required by law. You should not unduly rely on forward-looking statements. They give our expectations about the future and are not guarantees. Forward-looking statements speak only as of the date they are made, and we do not undertake to update them to reflect changes that occur after the date they are made. This report includes information about our historical financial performance, and this information should not be considered as an indication or projection of future results.
3
Table of Contents
PART I
| ITEM 1. | BUSINESS |
INTRODUCTION
PremierWest Bancorp, an Oregon corporation (the “Company”), is a bank holding company headquartered in Medford, Oregon. The Company operates primarily through its principal subsidiary, PremierWest Bank (“PremierWest Bank” or “Bank” and collectively with the Company, “PremierWest”), which offers a variety of financial services.
PremierWest recorded a net loss available to common shareholders of $7.5 million for the year ended December 31, 2010, compared to a net loss of $148.6 million in 2009 and a net loss of $7.8 million in 2008. Our diluted loss per common share was $0.90, $60.07, and $3.36, for the years ended 2010, 2009 and 2008, respectively, after adjusting for the 1-for-10 reverse stock split effective February 10, 2011, see Note 26—Subsequent Event. Return on average common equity was -13.69%, -93.07%, and -4.41% for the years ended December 31, 2010, 2009, and 2008, respectively.
SUBSIDIARIES
PremierWest Bank conducts a general commercial banking business, gathering deposits from the general public and applying those funds to the origination of loans for real estate, commercial and consumer purposes and investments. The Bank was created from the merger of Bank of Southern Oregon and Douglas National Bank on May 8, 2000, and the simultaneous formation of a bank holding company for the resulting bank, PremierWest Bank. In April 2001, the Company acquired Timberline Bancshares, Inc., and its wholly-owned subsidiary, Timberline Community Bank (“Timberline”), with eight branch offices located in Siskiyou County in northern California. On January 23, 2004, the Company acquired Mid Valley Bank, with five branch offices located in the northern California counties of Shasta, Tehama and Butte. On January 26, 2008, the Company acquired Stockmans Financial Group and its wholly owned banking subsidiary, Stockmans Bank, with five branch offices located in the greater Sacramento, California area. This acquisition was accounted for as a purchase and is reflected in the consolidated financial statements of PremierWest from the date of acquisition forward. On July 17, 2009, the Company acquired two Wachovia Bank branches in Northern California. This acquisition was accounted for under the acquisition method of accounting and is reflected in the consolidated financial statements of PremierWest from the date of acquisition forward.
PremierWest Bank adheres to a community banking strategy by offering a full range of financial products and services through its network of branches encompassing a two state region between northern California and southern Oregon including the Rogue Valley and Roseburg, Oregon; the markets situated around Sacramento, California; and the Bend/Redmond area of Deschutes County located in central Oregon. The Bank has three subsidiaries: Premier Finance Company, PremierWest Investment Services, Inc., and Blue Star Properties, Inc. Premier Finance Company originates consumer loans from offices located in Medford, Grants Pass, Klamath Falls, Roseburg, Eugene and Portland, Oregon and Redding, California. PremierWest Investment Services, Inc., provides investment brokerage services to customers throughout the Bank’s market. Blue Star Properties, Inc. serves solely to hold real estate properties for PremierWest and presently has no properties under its ownership.
PRODUCTS AND SERVICES
PremierWest Bank offers a broad range of banking services to its customers, principally small and medium-sized businesses, professionals and retail customers.
Loan and lease products—PremierWest Bank makes commercial and real estate loans, construction loans for owner-occupied and investment properties, leases through a third-party vendor, and secured and unsecured consumer loans. Commercial and real estate-based lending has been the primary focus of the Bank’s lending activities.
4
Table of Contents
Commercial lending—PremierWest Bank offers specialized loans for business and commercial customers, including equipment and inventory financing, accounts receivable financing, operating lines of credit and real estate construction loans. PremierWest Bank also makes certain Small Business Administration loans to qualified businesses. A substantial portion of the Bank’s commercial loans are designated as real estate loans for regulatory reporting purposes because they are secured by mortgages and trust deeds on real property, even if the loans are made for the purpose of financing commercial activities, such as inventory and equipment purchases and leasing, and even if they are secured by other assets such as equipment or accounts receivable.
One of the primary risks associated with commercial loans is the risk that the commercial borrower might not generate sufficient cash flows to repay the loan. PremierWest Bank’s underwriting guidelines require secondary sources of repayment, such as real estate collateral, and generally require personal guarantees from the borrower’s principals.
Real estate lending—Real estate is commonly a material component of collateral for PremierWest Bank’s loans. Although the expected source of repayment for these loans is generally business or personal income, real estate collateral provides an additional measure of security. Risks associated with loans secured by real estate include fluctuating property values, changing local economic conditions, changes in tax policies and a concentration of real estate loans within a limited geographic area.
Commercial real estate loans primarily include owner-occupied commercial and agricultural properties and other income-producing properties. The primary risks of commercial real estate loans are the potential loss of income for the borrower and the ability of the market to sustain occupancy and rent levels. PremierWest Bank’s underwriting standards limit the maximum loan-to-value ratio on real estate held as collateral and require a minimum debt service coverage ratio for each of its commercial real estate loans.
Although commercial loans and commercial real estate loans generally are accompanied by somewhat greater risk than single-family residential mortgage loans, commercial loans and commercial real estate loans tend to be higher yielding, have shorter terms and generally provide for interest-rate adjustments as prevailing rates change. Accordingly, commercial loans and commercial real estate loans facilitate interest-rate risk management and, historically, have contributed to strong asset and income growth.
PremierWest Bank originates several different types of construction loans, including residential construction loans to borrowers who will occupy the premises upon completion of construction, residential construction loans to builders, commercial construction loans, and real estate acquisition and development loans. Because of the complex nature of construction lending, these loans have a higher degree of risk than other forms of real estate lending. Generally, the Bank mitigates its risk on construction loans by lending to customers who have been pre-qualified with performance conditions for long-term financing and who are using contractors acceptable to PremierWest Bank.
Consumer lending—PremierWest Bank and Premier Finance Company make secured and unsecured loans to individual borrowers for a variety of purposes including personal loans, revolving credit lines and home equity loans, as well as consumer loans secured by autos, boats and recreational vehicles. Besides targeting non-bank customers in PremierWest Bank’s immediate markets, Premier Finance Company also makes loans to Bank customers where the loans may carry a higher risk than permitted under the Bank’s lending criteria.
Deposit products and other services—PremierWest Bank offers a variety of traditional deposit products to attract both commercial and consumer deposits using checking and savings accounts, money market accounts and certificates of deposit. The Bank also offers internet banking, on-line bill pay, treasury management services, safe deposit facilities, traveler’s checks, money orders and automated teller machines at most of its facilities.
PremierWest Bank’s investment subsidiary, PremierWest Investment Services, Inc., provides investment brokerage services to its customers through a third-party broker-dealer arrangement as well as through independent insurance companies allowing for the sale of investment and insurance products such as stocks, bonds, mutual funds, annuities and other insurance products.
5
Table of Contents
MARKET AREA
PremierWest Bank conducts a regional community banking business in southern and central Oregon and northern California. On December 31, 2010, the Company had a network of 44 full service bank branches. The Bank has evolved over the past nine years through a combination of acquisitions and de novo branch openings and its geographic footprint can be subdivided into several key market areas that are generally identifiable by a specific community, county or combination thereof.
The Company serves Jackson County, Oregon, from its main office facility in Medford with six branch offices in Medford and a branch office in each of the surrounding communities of Central Point, Eagle Point, Ashland and Shady Cove. Medford is the seventh largest city in Oregon and is the center for commerce, medicine and transportation in southwestern Oregon. PremierWest Bank serves neighboring Josephine County with two full service branches in Grants Pass, Oregon. The principal industries in Jackson and Josephine Counties include forest products, manufacturing and agriculture. Other manufacturing segments include electrical equipment and supplies, computing equipment, printing and publishing, fabricated metal products and machinery, and stone and concrete products. In the non-manufacturing sector, significant industries include recreational services, wholesale and retail trades, as well as medical care, particularly in connection with the area’s retirement community.
Another primary market area is in Douglas County with three branches in Roseburg, Oregon, and four branches located in the communities of Winston, Glide, Sutherlin and Drain. The economy in Douglas County has historically depended on the forest products industry, as compared to other market areas along the Interstate 5 corridor, including those in Medford and Grants Pass and those in northern California, which are somewhat more economically diversified.
Also in Oregon and located inland from the Interstate 5 corridor, PremierWest Bank operates four branches. Two are located in Klamath Falls in Klamath County. Klamath County’s principal industries include lumber and wood products, agriculture, transportation, recreation and government. Two other branch offices are located in Deschutes County, with a branch in both Bend and Redmond. This area’s principle businesses include recreation, tourism, education and manufacturing.
As of December 31, 2010, the Bank has established offices within seven counties in California. In Siskiyou County there are eight branch locations in the communities of Dorris, Dunsmuir, Greenview, McCloud, Mt. Shasta, Tulelake, Weed and Yreka. In Shasta County there are three branch locations with two located in Redding and one in Anderson. In Tehama County there are two branches with one in Corning and one in Red Bluff. In Yolo County there are two branch offices in the communities of Woodland and Davis. There is one office in Chico in Butte County and Nevada County has a branch in Grass Valley. The economy of northern California from Siskiyou County south to Butte County is primarily driven by government services, retail trade and services, education, healthcare, agriculture, recreation and tourism.
The Company has four branch locations in Sacramento County. These branches are located in the greater Sacramento area in the communities of Elk Grove, Folsom, Galt, and Rocklin. These branches have established PremierWest Bank’s southern-most reach in California. In addition to wholesale and retail trade, the key industries include agriculture and food processing, manufacturing, transportation and distribution, education, healthcare and government services.
Oregon and California have experienced economic challenges in the past three years, including high unemployment rates and deteriorating fiscal condition of state and local governments. Many of our branches are located in smaller markets that have experienced higher than average unemployment. The recession, housing market downturn and declining real estate values in our markets, have negatively impacted our loan portfolio and the business conditions in the markets we serve.
6
Table of Contents
The following table presents the Bank’s market share percentage for total deposits as of June 30, 2010, in each county where we have a branch. All information in the table was obtained from deposit data published by the FDIC as of June 30, 2010.
Deposit Market Share ($000’s)
Totals by County
| 2010 | 2009 | 2008 | ||||||||||||||||||||||||||||||||||||
| State | County | Market | PRWT | % Share | Market | PRWT | % Share | Market | PRWT | % Share | ||||||||||||||||||||||||||||
|
OR |
Deschutes | 2,408,627 | 15,534 | 0.64 | % | 2,489,654 | 23,132 | 0.93 | % | 1,964,059 | 20,345 | 1.04 | % | |||||||||||||||||||||||||
|
OR |
Douglas | 1,262,574 | 146,814 | 11.63 | % | 1,178,064 | 161,027 | 13.67 | % | 1,152,134 | 162,394 | 14.10 | % | |||||||||||||||||||||||||
|
OR |
Jackson | 2,449,987 | 365,158 | 14.90 | % | 2,589,614 | 503,981 | 19.46 | % | 2,391,822 | 428,701 | 17.92 | % | |||||||||||||||||||||||||
|
OR |
Josephine | 1,210,261 | 34,243 | 2.83 | % | 1,196,459 | 36,009 | 3.01 | % | 1,120,845 | 33,607 | 3.00 | % | |||||||||||||||||||||||||
|
OR |
Klamath | 738,537 | 13,664 | 1.85 | % | 787,266 | 26,404 | 3.35 | % | 751,415 | 18,959 | 2.52 | % | |||||||||||||||||||||||||
|
Sub-total |
8,069,986 | 575,413 | 7.13 | % | 8,241,057 | 750,553 | 9.11 | % | 7,380,275 | 664,006 | 9.00 | % | ||||||||||||||||||||||||||
|
CA |
Butte | 1,719,998 | 10,658 | 0.62 | % | 1,579,034 | 7,574 | 0.48 | % | 1,508,893 | 5,257 | 0.35 | % | |||||||||||||||||||||||||
|
CA |
Nevada | 1,056,829 | 138,544 | 13.11 | % | 1,104,072 | 174,958 | 15.85 | % | — | — | 0.00 | % | |||||||||||||||||||||||||
|
CA |
Placer | 500,920 | 13,330 | 2.66 | % | 535,284 | 14,778 | 2.76 | % | 470,037 | 20,097 | 4.28 | % | |||||||||||||||||||||||||
|
CA |
Shasta | 2,027,635 | 38,536 | 1.90 | % | 1,939,687 | 36,798 | 1.90 | % | 1,741,547 | 41,436 | 2.38 | % | |||||||||||||||||||||||||
|
CA |
Siskiyou | 553,656 | 122,534 | 22.13 | % | 570,142 | 124,692 | 21.87 | % | 547,223 | 103,628 | 18.94 | % | |||||||||||||||||||||||||
|
CA |
Tehama | 717,269 | 102,844 | 14.34 | % | 727,548 | 101,732 | 13.98 | % | 690,401 | 108,957 | 15.78 | % | |||||||||||||||||||||||||
|
CA |
Yolo | 1,882,778 | 160,290 | 8.51 | % | 1,861,968 | 190,515 | 10.23 | % | 667,118 | 10,683 | 1.60 | % | |||||||||||||||||||||||||
|
CA |
Sacramento | 2,680,089 | 151,109 | 5.64 | % | 2,530,657 | 194,324 | 7.68 | % | 2,400,400 | 256,120 | 10.67 | % | |||||||||||||||||||||||||
|
Sub-total |
11,139,174 | 737,845 | 6.62 | % | 10,848,392 | 845,371 | 7.79 | % | 8,025,619 | 546,178 | 6.81 | % | ||||||||||||||||||||||||||
| Total | 19,209,160 | 1,313,258 | 6.84 | % | 19,089,449 | 1,595,924 | 8.36 | % | 15,405,894 | 1,210,184 | 7.86 | % | ||||||||||||||||||||||||||
Effective April 30, 2010, four existing branches (one each in Douglas, Butte, Placer and Sacramento counties) were closed and consolidated with existing PremierWest branches in close proximity.
While PremierWest Bank does business in many different communities, the geographic areas we serve make the Bank more reliant on local economies in contrast to super-regional and national banks. Nevertheless, Management considers the diversity of our customers, communities, and economic sectors a source of strength and competitive advantage in pursuing our community banking strategy.
INDUSTRY OVERVIEW
The commercial banking industry continues to face increased competition from non-bank competitors, and is undergoing significant consolidation and change. In addition to traditional competitors such as banks and credit unions, noninsured financial service companies such as mutual funds, brokerage firms, insurance companies, mortgage companies, stored-value-card providers and leasing companies offer alternative investment opportunities for customers’ funds and lending sources for their needs. Banks have been granted extended powers to better compete with these financial service providers through the limited right to sell insurance, securities products and other services; however, the percentage of financial transactions handled by commercial banks continues to decline as the market penetration of other financial service providers has grown. The impact on the commercial banking industry of the economic downturn experienced in 2008 and 2009 has been meaningful, with bank failures resulting in consolidation and increased legislation and regulation.
PremierWest Bank’s business model is to compete on the basis of customer service, not solely on price, and to compete for deposits by offering a variety of accounts at rates generally competitive with other financial institutions in the area.
7
Table of Contents
PremierWest Bank’s competition for loans comes principally from commercial banks, savings banks, mortgage companies, finance companies, insurance companies, credit unions and other traditional lenders. We compete for loans on the quality of our services, our array of commercial and mortgage loan products and on the basis of interest rates and loan fees. Lending activity can also be affected by local and national economic conditions, current interest rate levels and loan demand. As described above, PremierWest Bank competes with larger commercial banks by emphasizing a community bank orientation and personal service to both commercial and individual customers.
EMPLOYEES
As of December 31, 2010, PremierWest Bank had 477 full-time equivalent employees compared to 494 at December 31, 2009. None of our employees are represented by a collective bargaining group. Management considers its relations with employees to be good.
WEBSITE ACCESS TO PUBLIC FILINGS
PremierWest makes available all periodic and current reports in the “Investor Relations” section of PremierWest Bank’s website, as soon as reasonably practicable after such material is electronically filed with or furnished to the Securities and Exchange Commission (“SEC”). PremierWest Bank’s website address is www.PremierWestBank.com. The contents of our website are not incorporated into this report or into our other filings with the SEC.
GOVERNMENT POLICIES
The operations of PremierWest and its subsidiaries are affected by state and federal legislative changes and by policies of various regulatory authorities, including those of the states of Oregon and California, the Federal Reserve Bank and the Federal Deposit Insurance Corporation. These policies include, for example, statutory maximum legal lending limits and rates, domestic monetary policies of the Board of Governors of the Federal Reserve System, United States fiscal policy, and capital adequacy and liquidity constraints imposed by national and state regulatory agencies.
SUPERVISION AND REGULATION
Based on the results of an examination completed during the third quarter of 2009, the Bank entered into a formal regulatory agreement (the “Agreement”) with the FDIC and the Oregon Department of Consumer and Business Services acting through its Division of Finance and Corporate Securities (“DCBS”), the Bank’s principal regulators, primarily as a result of recent significant operating losses and increasing levels of non-performing assets. The Agreement imposed certain operating requirements on the Bank, many of which have already been implemented by the Bank as discussed in Note 2. The Company entered into a similar agreement with the Federal Reserve Bank of San Francisco and DCBS.
General—Over the past three years, the banking industry has seen an unprecedented number of sweeping changes in federal regulation. The most significant of these changes resulted from the passage of the Dodd-Frank Wall Street Reform and Consumer Protection Act (“Dodd-Frank”) in 2010, the American Recovery and Reinvestment Act of 2009 (“ARRA”), and the Emergency Economic Stabilization Act of 2008 (“EESA”). EESA and ARRA were enacted to strengthen our financial markets and promote the flow of credit to businesses and consumers. Dodd-Frank has brought and will continue to bring additional, significant changes to the regulatory landscape affecting banks and bank holding companies.
PremierWest is extensively regulated under federal and state law. These laws and regulations are generally intended to protect consumers, depositors and the FDIC’s Deposit Insurance Fund (“DIF”), not shareholders. To the extent that the following information describes statutory or regulatory provisions, it is qualified in its entirety by reference to the particular statute or regulation. Any change in applicable laws or regulations may have a
8
Table of Contents
material effect on the business and prospects of the Company. The operations of the Company may be affected by legislative changes and by the policies of various regulatory authorities. The Company cannot accurately predict the nature or the extent of the effects on its business and earnings that fiscal or monetary policies, or new federal or state legislation, may have in the future.
Federal and State Bank Regulation—PremierWest Bank, as a state chartered bank with deposits insured by the Federal Deposit Insurance Corporation (“FDIC”), is subject to the supervision and regulation of the state of Oregon and the FDIC. These agencies regularly examine all facets of the Bank’s operations and our financial condition, and may prohibit the Company from engaging in what they believe constitutes unsafe or unsound banking practices. We are required to seek approval from the FDIC and DCBS to open new branches and engage in mergers and acquisitions, among other things.
The Community Reinvestment Act (“CRA”) requires that, in connection with examinations of financial institutions within its jurisdiction, the FDIC evaluate the record of financial institutions in meeting the credit needs of their local communities, including low and moderate-income neighborhoods, consistent with the safe and sound operation of those institutions. These factors are also considered in evaluating mergers, acquisitions and applications to open a new branch or facility. The Company’s current CRA rating is “Satisfactory.”
Banks are subject to restrictions imposed by the Federal Reserve Act on extensions of credit to executive officers, directors, principal shareholders or any related interests of such persons. Extensions of credit (i) must be made on substantially the same terms, including interest rates and collateral as, and follow credit underwriting procedures that are not less stringent than those prevailing at the time for comparable transactions with persons not affiliated with the Company and (ii) must not involve more than the normal risk of repayment or exhibit other unfavorable features. Banks are also subject to certain lending limits and restrictions on overdrafts to such persons. A violation of these restrictions may result in the assessment of substantial civil monetary penalties on the Bank or any officer, director, employee, agent or other person participating in the conduct of the affairs of that bank, the imposition of a cease and desist order or other regulatory sanctions.
Under the Federal Deposit Insurance Corporation Improvement Act (“FDICIA”), each federal banking agency has prescribed, by regulation, capital safety and soundness standards for institutions under its authority. These standards cover internal controls, information and internal audit systems, loan documentation, credit underwriting, interest rate risk exposure, asset growth, compensation, fees and benefits, and standards for asset quality, earnings and stock valuation. An institution that fails to meet these standards must develop a plan acceptable to the agency, specifying the steps that the institution will take to meet the standards. Failure to submit or implement such a plan may subject the institution to regulatory sanctions. Management believes that the Company is in compliance with these standards.
FDICIA included provisions to reform the federal deposit insurance system, including the implementation of risk-based deposit insurance premiums. FDICIA also permits the FDIC to make special assessments on insured depository institutions in amounts determined by the FDIC to be necessary to give it adequate assessment income to repay amounts borrowed from the U.S. Treasury and other sources or for any other purpose the FDIC deems necessary. Pursuant to FDICIA, the FDIC implemented a transitional risk-based insurance premium system on January 1, 1993. Under this system, banks are assessed insurance premiums according to how much risk they are deemed to present to the Deposit Insurance Fund (“DIF”). Banks with higher levels of capital and a low degree of supervisory concern are assessed lower premiums than banks with lower levels of capital or involving a higher degree of supervisory concern. While PremierWest Bank has historically qualified for the lowest premium level, losses incurred over the past three years have reduced the Company’s capital levels and increased supervisory concerns resulting in increased FDIC and state assessments on PremierWest Bank, from $1.1 million in 2008 to $4.7 million in 2010.
9
Table of Contents
From 2008 to 2010, the banking industry, as well as other sectors of the United States economy, realized a number of changes in federal regulation due to the disruption in credit market operations. The most significant of these changes that affected the Company are discussed below.
Temporary Liquidity Guarantee Program (“TLGP”)—On October 13, 2008, the FDIC announced the TLGP to strengthen confidence and encourage liquidity in the banking system. The TLGP consists of two components: a temporary guarantee of newly-issued senior unsecured debt (the Debt Guarantee Program) and a temporary unlimited guarantee of funds in non-interest-bearing transaction and regular checking accounts at FDIC-insured institutions (the Transaction Account Guarantee Program). On December 5, 2008, the Company elected to participate in both the Debt Guarantee Program and Transaction Account Guarantee Program. However, the Company declined the option of issuing certain non-guaranteed senior unsecured debt before issuing the maximum amount of guaranteed debt. The Transaction Account Guarantee Program expired on December 31, 2010. Dodd-Frank provides for unlimited deposit insurance for noninterest bearing transaction accounts (excluding NOW, but including JOLTAs) beginning December 31, 2010 for a period of two years.
Troubled Asset Relief Program (“TARP”)—On October 14, 2008, the U.S. Department of the Treasury announced the TARP Capital Purchase Program. Under the TARP Capital Purchase Program, the U.S. Department of the Treasury purchased senior preferred stock in qualified U.S. financial institutions. The program was intended to encourage participating financial institutions to build capital to increase the flow of financing to U.S. businesses and consumers and to support the U.S. economy. Companies participating in the program must comply with limits on stock repurchases and dividends, and requirements related to executive compensation and corporate governance. Additionally, participants must agree to accept future program requirements as may be promulgated by Congress and regulatory authorities. In 2009, the Company sold $41.4 million of its preferred stock to the U.S. Treasury under the TARP Capital Purchase Program.
Dodd-Frank. On July 21, 2010, President Obama signed the Dodd-Frank Wall Street Reform and Consumer Protection Act (the “Dodd-Frank Reform Act”) into law. The Dodd-Frank Reform Act will change the current bank regulatory structure and affect the lending, deposit, investment, trading and operating activities of financial institutions and their holding companies. The Dodd-Frank Act requires various federal agencies to adopt a broad range of new implementing rules and regulations, and to prepare numerous studies and reports for Congress. The federal agencies are given significant discretion in drafting and implementing rules and regulations, and consequently, many of the details and much of the impact of the Dodd-Frank Act may not be known for many months or years. Significant changes will include:
| • | The establishment of the Financial Stability Oversight Counsel, which will be responsible for identifying and monitoring systemic risks posed by financial firms, activities, and practices. |
| • | The establishment of a Bureau of Consumer Financial Protection, within the Federal Reserve, to serve as a dedicated consumer-protection regulatory body with broad powers to supervise and enforce consumer protection laws. The Consumer Financial Protection Bureau has broad rule-making authority for a wide range of consumer protection laws that apply to all banks and savings institutions, including the authority to prohibit “unfair, deceptive or abusive” acts and practices. The Consumer Financial Protection Bureau has examination and enforcement authority over all banks with more than $10 billion in assets. Banks with $10 billion or less in assets will continue to be examined for compliance with the consumer laws by their primary bank regulators. |
| • | Amendments to the Truth in Lending Act aimed at improving consumer protections with respect to mortgage originations, including originator compensation, minimum repayment standards, and prepayment considerations. |
| • | Elimination of federal prohibitions on paying interest on demand deposits, thus allowing businesses to have interest bearing checking accounts. Depending on competitive responses, this significant change to existing law could have an adverse impact on the Company’s interest expense. |
10
Table of Contents
| • | Broadened base for Federal Deposit Insurance Corporation insurance assessments. Assessments will now be based on the average consolidated total assets less tangible equity capital of a financial institution. |
| • | Federal Reserve determination of reasonable debit card fees. |
| • | Permanent increase to the maximum amount of deposit insurance for banks, savings institutions and credit unions to $250,000 per depositor, retroactive to January 1, 2009, and non-interest bearing transaction accounts have unlimited deposit insurance through December 31, 2013. |
| • | Requirement of publicly traded companies to provide stockholders a non-binding vote on executive compensation and so-called “golden parachute” payments, and by authorizing the Securities and Exchange Commission to promulgate rules that would allow stockholders to nominate their own candidates using a company’s proxy materials. The legislation also directs the Federal Reserve Board to promulgate rules prohibiting excessive compensation paid to bank holding company executives, regardless of whether the company is publicly traded or not. |
Many provisions in Dodd-Frank are aimed at financial institutions that are significantly larger than the Company or the Bank. Nonetheless, there are provisions that apply to us and we must begin to comply with immediately. In addition, federal agencies will promulgate rules and regulations to implement and enforce provisions in Dodd-Frank. We will have to apply resources to ensure that we are in compliance with all applicable provisions, which may adversely impact our earnings. The precise nature, extent and timing of many of these reforms and the impact on us is still uncertain.
Deposit Insurance—PremierWest opted to participate in the Transaction Account Guarantee Program, which provides unlimited deposit insurance for non-interest bearing transaction accounts and for regular savings accounts, resulting in an additional quarterly deposit insurance premium assessment paid to the FDIC. As part of this program, PremierWest paid quarterly deposit insurance premium assessments to the FDIC.
The Bank’s deposits are insured up to applicable limits by the DIF of the FDIC. Accordingly, the Bank is subject to deposit insurance premium assessments by the FDIC to maintain the DIF. The FDIC’s risk-based assessment system is based upon a matrix that takes into account a bank’s capital level and supervisory rating. Under current law, the FDIC is required to maintain the DIF reserve ratio within the range of 1.15% to 1.50% of estimated insured deposits. Because the DIF reserve ratio fell and was expected to remain below 1.15%, the Federal Deposit Insurance Act (FDIA) required the FDIC to establish and implement a restoration plan to restore the DIF reserve ratio to at least 1.15% within eight years, absent extraordinary circumstances. Moreover, under a new risk-based assessment system implemented in the second quarter of 2009, annualized deposit insurance assessments range from 7 to 77.5 basis points based on each depository institution’s assets minus Tier 1 capital adjusted for an institution’s unsecured debt, secured liabilities, and brokered deposits. On May 22, 2009, the FDIC adopted a final rule imposing a 5 basis point special assessment on each insured depository institution’s assets minus Tier 1 capital as of June 30, 2009, not to exceed 10 basis points times the institution’s assessment base as of June 30, 2009. This special assessment was collected on September 30, 2009.
Initial base assessment rates ranged from $0.12 to $0.45 per $100 of deposits annually. Further increases in the assessment rate could have a material adverse effect on our earnings, depending upon the amount of the increase. In October 2010, the FDIC adopted a new DIF restoration plan to ensure that the fund reserve ratio reaches 1.35% by September 30, 2020, as required by Dodd-Frank. Under the new restoration plan, the FDIC will forego the uniform three-basis point increase in initial assessment rates schedules for January 1, 2011, and maintain the current schedule of assessment rates. At least semi-annually, the FDIC will update its loss and income projections for the DIF and, if needed, increase or decrease assessment rates. The FDIC has proposed additional rules to change the deposit insurance assessment system.
Dividends—Under the Oregon Bank Act, banks are subject to restrictions on the payment of cash dividends to their parent holding company. A bank may not pay cash dividends if that payment would reduce the amount of
11
Table of Contents
its capital below that necessary to meet minimum applicable regulatory capital requirements. In addition, the amount of the dividend may not be greater than its net unreserved retained earnings, after first deducting (i) to the extent not already charged against earnings or reflected in a reserve, all bad debts, which are debts on which interest is unpaid and past due at least six months; (ii) all other assets charged off as required by the state or federal examiner; and (iii) all accrued expenses, interest and taxes of the Company. Under the Oregon Business Corporation Act, the Company cannot pay a dividend if, after making such dividend payment, it would be unable to pay its debts as they become due in the usual course of business, or if its total liabilities, plus the amount that would be needed, in the event PremierWest Bancorp were to be dissolved at the time of the dividend payment, to satisfy preferential rights on dissolution of holders of preferred stock ranking senior in right of payment to the capital stock on which the applicable distribution is to be made exceed total assets.
The Company’s ability to pay dividends depends primarily on dividends we receive from the Bank. Under federal regulations, the dollar amount of dividends the Bank may pay depends upon its capital position and recent net income. Generally, if the Bank satisfies its regulatory capital requirements, it may make dividend payments up to the limits prescribed under state law and FDIC regulations. The Federal Reserve has issued a policy statement on the payment of cash dividends by bank holding companies, which expresses the Federal Reserve’s view that a bank holding company should pay cash dividends only to the extent that its net income for the past year is sufficient to cover both the cash dividends and a rate of earnings retention that is consistent with the holding company’s capital needs, asset quality and overall financial condition. The Federal Reserve also indicated that it would be inappropriate for a company experiencing serious financial problems to borrow funds to pay dividends. Furthermore, a bank holding company may be prohibited from paying any dividends if the holding company’s bank subsidiary is not adequately capitalized. We suspended dividend payments on our common stock in the second quarter of 2009 and on our preferred stock in the fourth quarter of 2009. We cannot pay dividends unless we receive prior regulatory consent. Until conditions improve and we increase our capital levels we do not expect to pay dividends on our capital stock or receive dividends from the Bank.
In addition, the appropriate regulatory authorities are authorized to prohibit banks and bank holding companies from paying dividends if, in their opinion, such payment constitutes an unsafe or unsound banking practice.
Capital Adequacy—The federal and state bank regulatory agencies use capital adequacy guidelines in their examination and regulation of bank holding companies and banks. If capital falls below the minimum levels established by these guidelines, a holding company or a bank may be denied approval to acquire or establish additional banks or non-bank businesses or to open new facilities.
The FDIC and Federal Reserve have adopted risk-based capital guidelines for banks and bank holding companies. The risk-based capital guidelines are designed to make regulatory capital requirements more sensitive to differences in risk profiles among banks and bank holding companies, to account for off-balance sheet exposure and to minimize disincentives for holding liquid assets. Assets and off-balance sheet items are assigned to broad risk categories, each with appropriate weights. The resulting capital ratios represent capital as a percentage of total risk-weighted assets and off-balance sheet items. The current guidelines require all bank holding companies and federally regulated banks to maintain a minimum risk-based total capital ratio equal to 8%, of which at least 4% must be Tier 1 capital. Generally, banking regulators expect banks to maintain capital ratios well in excess of the minimum.
Tier 1 capital for banks includes common shareholders’ equity, qualifying perpetual preferred stock (up to 25% of total Tier 1 capital, if cumulative; under a Federal Reserve rule, redeemable perpetual preferred stock may not be counted as Tier 1 capital unless the redemption is subject to the prior approval of the Federal Reserve) and minority interests in equity accounts of consolidated subsidiaries, less intangibles. Tier 2 capital includes: (i) the allowance for loan losses of up to 1.25% of risk-weighted assets; (ii) any qualifying perpetual preferred stock which exceeds the amount which may be included in Tier 1 capital; (iii) hybrid capital instruments; (iv) perpetual debt; (v) mandatory convertible securities and (vi) subordinated debt and intermediate
12
Table of Contents
term preferred stock of up to 50% of Tier 1 capital. Total capital is the sum of Tier 1 and Tier 2 capital less reciprocal holdings of other banking organizations, capital instruments and investments in unconsolidated subsidiaries.
Banks’ assets are given risk-weights of 0%, 20%, 50% and 100%. In addition, certain off-balance sheet items are given credit conversion factors to convert them to asset equivalent amounts to which an appropriate risk-weight will apply. These computations result in the total risk-weighted assets.
Most loans are assigned to the 100% risk category, except for first mortgage loans fully secured by residential property, which carry a 50% rating. Most investment securities are assigned to the 20% category, except for municipal or state revenue bonds, which have a 50% risk-weight, and direct obligations of or obligations guaranteed by the U.S. Treasury or U.S. Government agencies, which have 0% risk-weight. In converting off-balance sheet items, direct credit substitutes, including general guarantees and standby letters of credit backing financial obligations, are given 100% conversion factor. The transaction-related contingencies such as bid bonds, other standby letters of credit and undrawn commitments, including commercial credit lines with an initial maturity of more than one year, have a 50% conversion factor. Short-term, self-liquidating trade contingencies are converted at 20%, and short-term commitments have a 0% factor.
The FDIC also has implemented a leverage ratio, which is Tier 1 capital as a percentage of total assets less intangibles, to be used as a supplement to risk-based guidelines. The principal objective of the leverage ratio is to place a constraint on the maximum degree to which a bank may leverage its equity capital base.
FDICIA created a statutory framework of supervisory actions indexed to the capital level of the individual institution. Under regulations adopted by the FDIC, an institution is assigned to one of five capital categories depending on its total risk-based capital ratio, Tier 1 risk-based capital ratio, and leverage ratio, together with certain subjective factors. Institutions deemed to be “undercapitalized” are subject to certain mandatory supervisory corrective actions.
Prompt Corrective Action. The “prompt corrective action” provisions of the FDIA create a statutory framework that applies a system of both discretionary and mandatory supervisory actions indexed to the capital level of FDIC-insured depository institutions. These provisions impose progressively more restrictive constraints on operations, management, and capital distributions of the institution as its regulatory capital decreases, or in some cases, based on supervisory information other than the institution’s capital level. This framework and the authority it confers on the federal banking agencies supplements other existing authority vested in such agencies to initiate supervisory actions to address capital deficiencies. Moreover, other provisions of law and regulation employ regulatory capital level designations the same as or similar to those established by the prompt corrective action provisions both in imposing certain restrictions and limitations and in conferring certain economic and other benefits upon institutions. These include restrictions on brokered deposits, limits on exposure to interbank liabilities, determination of risk-based FDIC deposit insurance premium assessments, and action upon regulatory applications.
FDIC-insured depository institutions are grouped into one of five prompt corrective action capital categories—well-capitalized, adequately capitalized, undercapitalized, significantly undercapitalized and critically undercapitalized—using the Tier 1 risk-based, total risk-based, and Tier 1 leverage capital ratios as the relevant capital measures. An institution is considered well-capitalized if it has a total risk-based capital ratio of at least 10.00%, a Tier 1 risk-based capital ratio of at least 6.00% and a Tier 1 leverage capital ratio of at least 5.00% and is not subject to any written agreement, order or capital directive to meet and maintain a specific capital level for any capital measure. An adequately capitalized institution must have a total risk-based capital ratio of at least 8.00%, a Tier 1 risk-based capital ratio of at least 4.00% and a Tier 1 leverage capital ratio of at least 4.00% (3.00% if it has achieved the highest composite rating in its most recent examination and is not well-capitalized). An institution’s prompt corrective action capital category, however, may not constitute an accurate representation of the overall financial condition or prospects of the institution or its parent bank holding company, and should be considered in conjunction with other available information regarding the financial condition and results of operations of the institution and its parent bank holding company.
13
Table of Contents
Effects of Government Monetary Policy—The earnings and growth of the Company are affected not only by general economic conditions, but also by the fiscal and monetary policies of the federal government, particularly the Federal Reserve. The Federal Reserve can and does implement national monetary policy for such purposes as curbing inflation and combating recession, by its open market operations in U.S. Government securities, control of the discount rate applicable to borrowings from the Federal Reserve, and establishment of reserve requirements against certain deposits. These activities influence growth of bank loans, investments and deposits, and also affect interest rates charged on loans or paid on deposits. The nature and impact of future changes in monetary policies and their impact on the Company cannot be predicted with certainty.
Conservatorship and Receivership of Institutions—If an insured depository institution becomes insolvent and the FDIC is appointed its conservator or receiver, the FDIC may, under federal law, disaffirm or repudiate any contract to which such institution is a party, if the FDIC determines that performance of the contract would be burdensome, and that disaffirmance or repudiation of the contract would promote the orderly administration of the institution’s affairs. Such disaffirmance or repudiation would result in a claim by its holder against the receivership or conservatorship. The amount paid upon such claim would depend upon, among other factors, the amount of receivership assets available for the payment of such claim and its priority relative to the priority of others. In addition, the FDIC as conservator or receiver may enforce most contracts entered into by the institution notwithstanding any provision providing for termination, default, acceleration, or exercise of rights upon or solely by reason of insolvency of the institution, appointment of a conservator or receiver for the institution, or exercise of rights or powers by a conservator or receiver for the institution. The FDIC as conservator or receiver also may transfer any asset or liability of the institution without obtaining any approval or consent of the institution’s shareholders or creditors. The FDIA provides that, in the event of the “liquidation or other resolution” of an insured depository institution, the claims of depositors of the institution, including the claims of the FDIC as subrogee of insured depositors, and certain claims for administrative expenses of the FDIC as a receiver, will have priority over other general unsecured claims against the institution. If an insured depository institution fails, insured and uninsured depositors, along with the FDIC, will have priority in payment ahead of unsecured, non-deposit creditors, including the parent bank holding company, with respect to any extensions of credit they have made to such insured depository institution.
Bank Holding Company Structure—As a bank holding company, the Company is registered with and subject to regulation by the Federal Reserve Board (FRB) under the Bank Holding Company Act of 1956, as amended, or the BHCA. Under FRB policy, a bank holding company is expected to serve as a source of financial and managerial strength to its subsidiary bank and, under appropriate circumstances, to commit resources to support such subsidiary bank. This support may be required at a time when the Company may not have the resources to, or would choose not to, provide it. Certain loans by a bank holding company to a subsidiary bank are subordinate in right of payment to deposits in, and certain other indebtedness of, the subsidiary bank. In addition, federal law provides that in the event of its bankruptcy, any commitment by a bank holding company to a federal bank regulatory agency to maintain the capital of a subsidiary bank will be assumed by the bankruptcy trustee and entitled to a priority of payment.
Under the BHCA, we are subject to periodic examination by the FRB. We are also required to file with the FRB periodic reports of our operations and such additional information regarding the Company and its subsidiaries as the FRB may require. Pursuant to the BHCA, we are required to obtain the prior approval of the FRB before we acquire all or substantially all of the assets of any bank or ownership or control of voting shares of any bank if, after giving effect to such acquisition, we would own or control, directly or indirectly, more than 5 percent of such bank. Under the BHCA, we may not engage in any business other than managing or controlling banks or furnishing services to our subsidiaries that the FRB deems to be so closely related to banking as “to be a proper incident thereto.” We are also prohibited, with certain exceptions, from acquiring direct or indirect ownership or control of more than 5 percent of the voting shares of any company unless the company is engaged in banking activities or the FRB determines that the activity is so closely related to banking to be a proper incident to banking. The FRB’s approval must be obtained before the shares of any such company can be acquired and, in certain cases, before any approved company can open new offices.
14
Table of Contents
The FRB has cease and desist powers over parent bank holding companies and non-banking subsidiaries where the action of a parent bank holding company or its non-financial institutions represent an unsafe or unsound practice or violation of law. The FRB has the authority to regulate debt obligations, other than commercial paper, issued by bank holding companies by imposing interest ceilings and reserve requirements on such debt obligations.
Changing Regulatory Structure of the Banking Industry—The laws and regulations affecting banks and bank holding companies frequently undergo significant changes. Pending bills, or bills that may be introduced in the future, may be expected to contain proposals for altering the structure, regulation, and competitive relationships of the nation’s financial institutions. If enacted into law, these bills could have the effect of increasing or decreasing the cost of doing business, limiting or expanding permissible activities (including insurance and securities activities), or affecting the competitive balance among banks, savings associations and other financial institutions. Some of these bills could reduce the extent of federal deposit insurance, broaden the powers or the geographical range of operations of bank holding companies, alter the extent to which banks will be permitted to engage in securities activities, and realign the structure and jurisdiction of various financial institution regulatory agencies. Whether, or in what form, any such legislation may be adopted or the extent to which the business of the Company might be affected thereby cannot be predicted with certainty.
In December 1999, Congress enacted the Gramm-Leach-Bliley Act (the “GLB Act”) and repealed the nearly 70-year prohibition on banks and bank holding companies engaging in the businesses of securities and insurance underwriting imposed by the Glass-Steagall Act.
Under the GLB Act, a bank holding company may, if it meets certain criteria, elect to be a “financial holding company,” which is permitted to offer, through a nonbank subsidiary, products and services that are “financial in nature” and to make investments in companies providing such services. A financial holding company may also engage in investment banking, and an insurance company subsidiary of a financial holding company may also invest in “portfolio” companies, without regard to whether the businesses of such companies are financial in nature.
The GLB Act also permits eligible banks to engage in a broader range of activities through a “financial subsidiary,” although a financial subsidiary of a bank is more limited than a financial holding company in the range of services it may provide. Financial subsidiaries of banks are not permitted to engage in insurance underwriting, real estate investment or development, merchant banking or insurance portfolio investing. Banks with financial subsidiaries must (i) separately state the assets, liabilities and capital of the financial subsidiary in financial statements; (ii) comply with operational safeguards to separate the subsidiary’s activities from the bank; and (iii) comply with statutory restrictions on transactions with affiliates under Sections 23A and 23B of the Federal Reserve Act.
Activities that are “financial in nature” include activities normally associated with banking, such as lending, exchanging, transferring and safeguarding money or securities and investing for customers. Financial activities also include the sale of insurance as agent (and as principal for a financial holding company, but not for a financial subsidiary of a bank), investment advisory services, underwriting, dealing or making a market in securities, and any other activities previously determined by the Federal Reserve to be permissible non-banking activities.
Financial holding companies and financial subsidiaries of banks may also engage in any activities that are incidental to, or determined by order of the Federal Reserve to be complementary to, activities that are financial in nature.
To be eligible to elect status as a financial holding company, a bank holding company must be adequately capitalized, under the Federal Reserve capital adequacy guidelines, and be well managed, as indicated in the institution’s most recent regulatory examination. In addition, each bank subsidiary must also be well-capitalized
15
Table of Contents
and well managed, and must have received a rating of “satisfactory” in its most recent CRA examination. Failure to maintain eligibility would result in suspension of the institution’s ability to commence new activities or acquire additional businesses until the deficiencies are corrected. The Federal Reserve could require a non-compliant financial holding company that has failed to correct noted deficiencies to divest one or more subsidiary banks, or to cease all activities other than those permitted to ordinary bank holding companies under the regulatory scheme in place prior to enactment of the GLB Act.
In addition to expanding the scope of financial services permitted to be offered by banks and bank holding companies, the GLB Act addressed the jurisdictional conflicts between the regulatory authorities that supervise various types of financial businesses. Historically, supervision was an entity-based approach, with the Federal Reserve regulating member banks and bank holding companies and their subsidiaries. As holding companies are now permitted to have insurance and broker-dealer subsidiaries, the supervisory scheme is oriented toward functional regulation. Thus, a financial holding company is subject to regulation and examination by the Federal Reserve, but a broker-dealer subsidiary of a financial holding company is subject to regulation by the Securities and Exchange Commission, while an insurance company subsidiary of a financial holding company would be subject to regulation and supervision by the applicable state insurance commission.
The GLB Act also includes provisions to protect consumer privacy by prohibiting financial services providers, whether or not affiliated with a bank, from disclosing non-public, personal, financial information to unaffiliated parties without the consent of the customer, and by requiring annual disclosure of the provider’s privacy policy. Each functional regulator is charged with promulgating rules to implement these provisions.
The Company is also subject to the Uniting and Strengthening America by Providing Appropriate Tools Required to Intercept and Obstruct Terrorism Act of 2001 (the “USA Patriot Act”). Among other things, the USA Patriot Act requires financial institutions, such as the Company to adopt and implement specific policies and procedures designed to prevent and defeat money laundering. Management believes the Company is in compliance with the USA Patriot Act.
The Sarbanes-Oxley Act (“Sarbanes-Oxley” or “Act”) of 2002 implemented legislative reforms intended to address corporate and accounting fraud. Sarbanes-Oxley applies to publicly reporting companies including PremierWest Bancorp. The legislation established the Public Company Accounting Oversight Board whose duties include the registering of public accounting firms and the establishment of standards for auditing, quality control, ethics and independence relating to the preparation of public company audit reports by registered accounting firms. The Act includes numerous provisions, but in particular, Section 404 that requires PremierWest Bancorp’s Management, to assess the adequacy and effectiveness of its internal controls over financial reporting. As of December 31, 2010, Management believes the Company is in full compliance with the requirements and provisions of Sarbanes-Oxley.
Section 613 of the Dodd-Frank Act eliminates interstate branching restrictions that were implemented as part of the Riegle-Neal Interstate Banking and Branching Efficiency Act of 1994, and removes many restrictions on de novo interstate branching by national and state-chartered banks. The FDIC and the OCC now have authority to approve applications by insured state nonmember banks and national banks, respectively, to establish de novo branches in states other than the bank’s home state if “the law of the State in which the branch is located, or is to be located, would permit establishment of the branch, if the bank were a State bank chartered by such State.”
Executive Compensation and Corporate Governance. Dodd-Frank includes several corporate governance and executive compensation provisions that apply to public companies generally. The SEC must issue rules requiring exchanges to prohibit the listing of a company’s securities if its board does not have a compensation committee composed entirely of independent directors. Dodd-Frank requires compensation committees to consider factors that might affect the independence of advisors such as compensation consultants and attorneys. At least once every three years, companies are required to provide shareholders with an advisory vote on
16
Table of Contents
executive compensation. At least once every six years, shareholders must be provided a separate advisory vote on whether the say-on-pay vote should occur—every one, two or three years. Dodd-Frank requires the SEC to adopt rules requiring disclosure in a company’s annual proxy statement of the relationship between executive compensation actually paid and the financial performance of the company, taking into account any change in the value of the shares of stock and dividends of the company and any distributions. Dodd-Frank mandates exchanges to adopt listing standards requiring that listed companies develop and implement a claw back policy for accounting restatements. This provision is broader than a similar provision contained in Section 304 of the Sarbanes-Oxley Act in that it covers all current and former executive officers and not only the CEO and CFO; does not require that the restatement results from misconduct and the look-back period is three years instead of one year; and requires companies to adopt and disclose a specific claw back policy.
On June 21, 2010, federal banking regulators issued final joint agency guidance on Sound Incentive Compensation Policies. This guidance applies to executive and non-executive incentive compensation plans administered by banks. The guidance says that incentive compensation programs must:
| • | Provide employees incentives that appropriately balance risk and reward; |
| • | Compensation should be commensurate with risk- if two activities produce same profit but one carries more risk, the incentive should be lower for the riskier activity; |
| • | Plans that provide awards based on company-wide performance are not likely to create unbalanced risk-taking incentives except, perhaps for senior executives; |
| • | Make sure actual payouts reflect adverse outcomes; |
| • | Consider deferred payouts, judgmental adjustments and longer performance periods to balance short term results against risks that materialize over time. |
| • | Be compatible with effective controls and risk- management; |
| • | The bank should have strong controls for designing, implementing and monitoring incentive plans; |
| • | Create and maintain documentation to support meaningful audits; |
| • | Include appropriate personnel, including risk-management personnel in the design process; |
| • | Risk management and control personnel should have appropriate skills, be sufficiently compensated to attract and retain them and be free of conflicts of interest; |
| • | Monitor performance of incentive compensation plans and make adjustments. |
| • | Be supported by strong corporate governance, including active and effective oversight by the board; |
| • | The board should approve incentive compensation arrangements for senior executives; |
| • | The board should regularly review the design and function of incentive plans; |
| • | The board should keep abreast of emerging practices and choose those that fit the company; |
| • | The board should have sufficient expertise and resources to carry out its oversight function; |
| • | Incentive compensation arrangements should be disclosed to shareholders. |
The Federal Reserve will review, as part of the regular, risk-focused examination process, the incentive compensation arrangements of banking organizations. The findings of the supervisory initiatives will be included in reports of examination and any deficiencies will be incorporated into the organization’s supervisory ratings, which can affect the organization’s ability to make acquisitions and take other actions. Enforcement actions may be taken against a banking organization if its incentive compensation arrangements, or related risk-management control or governance processes, pose a risk to the organization’s safety and soundness and the organization is not taking prompt and effective measures to correct the deficiencies.
17
Table of Contents
The FDIC has indicated that it may incorporate a compensation-related risk element in determining levels of deposit insurance assessments. The Federal Reserve, OCC and FDIC recently proposed rules to implement Section 956 of the Dodd-Frank Act, which requires that the agencies prohibit incentive-based payment arrangements that the agencies determine encourage inappropriate risks by providing excessive compensation or that could lead to a material financial loss.
18
Table of Contents
| ITEM 1A. | RISK FACTORS |
The risks described below are not the only risks we face. If any of the events described in the following risk factors actually occurs, or if additional risks and uncertainties not presently known to us or that we currently deem immaterial, materialize, then our business, results of operations and financial condition could be materially adversely affected. In that event, the trading price of our common stock could decline, and you may lose all or part of your investment in our shares. The risks discussed below include forward-looking statements, and our actual results may differ substantially from those discussed in these forward-looking statements.
Risks Related to Our Company
We may be required to raise additional capital, but that capital may not be available when it is needed, or it may only be available on unfavorable terms.
We are required by federal and state regulatory authorities to maintain adequate levels of capital to support our operations. The proceeds of our 2010 rights offering returned our Bank capital levels to published “Well-Capitalized” levels, including exceeding the 10.0% risk-based capital level. We are, however, subject to a Consent Order that requires higher capital levels, including a 10.0% leverage ratio. Our Bank leverage ratio as of December 31, 2010, was 8.85%.
We may need to raise additional capital to maintain or improve our capital position or to comply with regulatory requirements and support our operations. In addition, future losses could reduce our capital levels. Our ability to raise additional capital, if needed, will depend on conditions in the capital markets at that time, which are outside our control, and on our financial performance. Accordingly, we may not be able to raise additional capital, if needed, on terms acceptable to us. If we cannot raise additional capital when needed, our financial condition and our ability to support our operations could be materially impaired. We could be required to take other actions to improve capital ratios including reducing asset levels or shifting asset types to assets with lower risk-weightings, which could reduce our ability to generate revenues and adversely affect our financial condition.
We are subject to formal regulatory agreements with the FDIC, DCBS and Federal Reserve.
In light of the current challenging operating environment, along with our elevated level of non-performing assets, delinquencies and adversely classified assets, we are subject to increased regulatory scrutiny, including a Consent Order with the FDIC and DCBS dated effective April 6, 2010, and a Written Agreement with the Federal Reserve and DCBS dated effective June 4, 2010. The Consent Order requires us to take steps to strengthen the Bank and to refrain from undertaking certain activities. We have limitations on our lending activities and on the rates paid by the Bank to attract retail deposits in its local markets. We are required to reduce our levels of non-performing assets within specified time frames, which could result in less than ideal pricing on the sale of assets. We are restricted from paying dividends from the Bank to the Holding Company during the life of the Consent Order, which restricts our ability to issue preferred stock dividends and make junior subordinated debenture interest payments. The added costs of compliance with additional regulatory requirements could have an adverse effect on our financial condition and earnings. Our ability to grow is constrained by the Consent Order and Written Agreement and we will be unable to expand our operations until we achieve material compliance with the regulatory agreements. The requirements and restrictions of the Consent Order and the Written Agreement are judicially enforceable and the failure of the Company or the Bank to comply with such requirements and restrictions may subject the Company and the Bank to additional regulatory restrictions including: the imposition of civil monetary penalties; the issuance of directives to increase capital or enter into a strategic transaction, whether by merger or otherwise, with a third party; the appointment of a conservator or receiver for the Bank; the liquidation or other closure of the Bank and inability of the Company to continue as a going concern; the termination of insurance of deposits; the issuance of removal and prohibition orders against institution-affiliated parties; and the enforcement of such actions through injunctions or restraining orders. Generally, these enforcement actions will be lifted only after subsequent examinations substantiate complete correction of the underlying issues.
19
Table of Contents
The negative impact of the current economic recession has been particularly acute in our primary market areas of southern and central Oregon and in northern California.
Our operations are geographically concentrated in southern and central Oregon and northern California and our business is sensitive to regional business conditions. Substantially all of our loans are to businesses and individuals in our primary market areas. Our customers are directly and indirectly dependent upon the economies of these areas and upon the timber and tourism industries, which are significant employers and revenue sources in our markets – economic factors that affect these industries will have a disproportionately negative impact on our region and our customers. All geographic regions in which we operate have seen precipitous declines in property values. The State of Oregon suffers from one of the nation’s highest unemployment rates and major employers have implemented substantial layoffs or scaled back growth plans. The State of California continues to face significant fiscal challenges, the long-term effects of which cannot be predicted. A further deterioration in the economic and business conditions or a prolonged delay in economic recovery in our primary market areas could result in the following consequences that could materially and adversely affect our business: increased loan delinquencies; increased problem assets and foreclosures; reduced demand for our products and services; reduction in cash balances of consumers and businesses resulting in declines in deposits; reduced property values that diminish the value of assets and collateral associated with our loans; and a decrease in capital resulting from charge-offs and losses.
We have continuing losses and continuing volatility in our results of operations.
We reported a net loss applicable to shareholders of $7.5 million for the year ended December 31, 2010. Losses resulted primarily from the high level of nonperforming assets and the related reduction in interest income and increased provision for loan losses. We can provide no assurance that we will not have continuing losses in our operations.
We are required to reduce levels of nonperforming assets under our Consent Order.
We are required to improve our financial condition by reducing nonperforming assets. We may seek to sell assets, but market conditions for the sale of assets may not be favorable and we may not be able to lower nonperforming asset levels sufficiently to meet the requirements of the Consent Order or to maintain existing capital levels. If other banks are also required to improve capital levels and choose to sell assets, or if the FDIC sells assets in its position as receiver for a failed bank in our market area, asset pricing could be unfavorable. The sale of nonperforming assets could reduce capital levels and delay compliance with the Consent Order.
We have high levels of nonperforming assets which negatively affect our results of operations.
Our nonperforming assets adversely affect our net income in various ways. Until economic and market conditions improve, we expect to continue to incur additional losses relating to nonperforming loans. We do not record interest income on non-accrual loans, thereby adversely affecting our income, and increasing loan administration costs. When we receive collateral through foreclosures and similar proceedings, we are required to mark the related loan to the then fair market value of the collateral, which may result in a loss. An increase in the level of nonperforming assets also increases our risk profile and may impact the capital levels our regulators believe are appropriate in light of such risks. Decreases in the value of problem assets, the underlying collateral, or in the borrowers’ performance or financial condition, could adversely affect our business, results of operations and financial condition. In addition, the resolution of nonperforming assets requires significant commitments of time from management and staff, which can be detrimental to performance of their other responsibilities. We could experience further increases in nonperforming loans in the future.
20
Table of Contents
The Consent Order limits the types of funding sources on which we may rely and may have a negative impact on our liquidity.
We cannot accept, renew or roll over any brokered deposits, and are required to submit a plan that eliminates our reliance on brokered deposits. In addition, certain interest-rate limits apply to our brokered and solicited deposits. The reduction in the level of brokered deposits, even according to their regular maturity dates, may have a negative impact on our liquidity. Our financial flexibility could be severely constrained if we are unable to obtain brokered deposits or renew wholesale funding or if adequate financing is not available in the future at acceptable rates of interest. We may not have sufficient liquidity to continue to fund new loan originations, and we may need to liquidate loans or other assets unexpectedly in order to repay obligations as they mature. Furthermore, we are now required to provide a higher level of collateral for any funds that we borrow from the Federal Reserve, and we may be required to provide additional collateral to our other funding sources as well. Any additional collateral requirements or limitations on our ability to access additional funding sources are expected to have a negative impact on our liquidity.
We are subject to restrictions on our ability to declare or pay dividends on and repurchase shares of our common stock.
Our ability to pay dividends, and the Bank’s ability to pay dividends to us, is limited by regulatory restrictions and the need to maintain sufficient capital. In the second quarter of 2009, we suspended payment of dividends on our common stock in order to conserve capital. We are subject to formal regulatory restrictions that will continue to prohibit us from declaring or paying any dividend without prior approval of banking regulators. Although we can seek to obtain waiver of such prohibition, we would not expect to be granted such waiver or to be released from this obligation until our financial performance improves significantly. Therefore, we may not be able to resume payments of dividends in the future.
Under the terms of our agreements with the U.S. Treasury in connection with the sale of our Series B Preferred Stock, we are unable to declare dividend payments on common, junior preferred or pari passu preferred shares if we are in arrears on the dividends on the Series B Preferred Stock. We suspended further dividend payments on the Series B Preferred Stock in the fourth quarter of 2009 in order to conserve capital. If dividends on the Series B Preferred Stock are not paid in full for six dividend periods, whether or not consecutive, the holders of the Series B Preferred Stock will have the right to elect two directors. Such right to elect directors will end when full dividends have been paid for four consecutive dividend periods. We also announced that we would defer, as permitted under the terms of indentures, interest payments on junior subordinated debentures issued in connection with trust preferred securities. We are permitted to defer such interest payments for up to 20 consecutive quarters, but during a deferral period we are prohibited from making dividend payments on our capital stock.
Further, if we become current on our Series B Preferred Stock dividends and junior subordinated debenture payments, we cannot increase dividends on our common stock above $0.57 per share per quarter without the U.S. Treasury’s approval or redemption or transfer of the Series B Preferred Stock.
We are subject to executive compensation restrictions because of our participation in the U.S. Treasury’s TARP Capital Purchase Program.
We are subject to TARP rules and standards governing executive compensation, which generally apply to our Chief Executive Officer, Chief Financial Officer and the three next most highly compensated senior executive officers and, with amendments to the rules in 2009, apply to a number of other employees. The standards include (i) a requirement to recover any bonus payment to senior executive officers or certain other employees if payment was based on materially inaccurate financial statements or performance metric criteria; (ii) a prohibition on making any golden parachute payments to senior executive officers and certain other employees; (iii) a prohibition on paying or accruing any bonus payment to certain employees, with narrow
21
Table of Contents
exceptions for grants of long-term restricted stock; (iv) a prohibition on maintaining any plan for senior executive officers that encourages such officers to take unnecessary and excessive risks that threaten the Company’s value; (v) a prohibition on maintaining any employee compensation plan that encourages the manipulation of reported earnings to enhance the compensation of any employee; and (vi) a prohibition on providing tax gross-ups to senior executive officers and certain other employees. These restrictions and standards could limit our ability to recruit and retain executives.
Our business is heavily regulated and the creation of additional regulations may negatively affect our operations.
We are subject to government regulation that could limit or restrict our activities, which in turn could adversely impact our operations. The financial services industry is regulated extensively. Federal and state regulations are designed primarily to protect the deposit insurance funds and consumers, and not to benefit shareholders. These regulations can sometimes impose significant limitations on our operations as well as result in higher operating costs. In addition, these regulations are constantly evolving and may change significantly over time. Significant new regulation or changes in existing regulations or repeal of existing laws may affect our results materially. Further, federal monetary policy, particularly as implemented through the Federal Reserve System, significantly affects credit conditions and interest rates that impact the Company.
We could experience credit losses if new federal or state legislation, or regulatory changes, are implemented to protect customers by reducing the amount that the Bank’s borrowers are otherwise contractually required to pay under existing loan contracts or by limiting the Bank’s ability to foreclose on property or other collateral or makes foreclosure less economically feasible.
Our earnings depend to a large extent upon the ability of our borrowers to repay their loans, and our inability to manage credit risk would negatively affect our business.
We will suffer losses if a significant number of our borrowers, guarantors and related parties fail to perform in accordance with the terms of their loans. We have adopted underwriting and credit monitoring procedures and a credit policy, including the establishment and review of the allowance for loan losses that our management believes are appropriate to minimize this risk by assessing the likelihood of non-performance, tracking loan performance and diversifying our credit portfolio. These policies and procedures, however, involve subjective judgments and may not prevent unexpected losses that could materially affect our results of operations. Moreover, bank regulators frequently monitor loan loss allowances. If regulators were to determine that the allowance was inadequate, they may require us to increase the allowance, which also would adversely impact our financial condition.
Approximately 78% of our gross loan portfolio is secured by real estate, the majority of which is commercial real estate and continued market deterioration could lead to losses.
Declining real estate values have caused increasing levels of charge-offs and provisions for loan losses. Continued declines in real estate market values may precipitate increased charge-offs and a further increase in the allowance for loan losses, which could have a material adverse effect on our business, financial condition and results of operations.
Changes in interest rates could adversely impact our net interest margin, net interest income and net income.
Our earnings depend upon the spread between the interest rate we receive on loans and securities and the interest rates we pay on deposits and borrowings. We are impacted by changing interest rates. Changes in interest rates affect the demand for new loans, the credit profile of existing loans, the rates received on loans and securities and rates paid on deposits and borrowings. The relationship between the rates received on loans and securities and the rates paid on deposits and borrowings is known as interest rate spread. Given our current
22
Table of Contents
volume and mix of interest-bearing liabilities and interest-earning assets, our interest rate spread could be expected to increase during times of rising interest rates and, conversely, to decline during times of falling interest rates. Exposure to interest rate risk is managed by adjusting the re-pricing frequency of PremierWest Bank’s rate-sensitive assets and rate-sensitive liabilities over any given period. Significant fluctuations in interest rates may have an adverse effect on our business, financial condition and results of operations.
Market conditions or regulatory constraints could restrict our access to funds necessary to meet liquidity demands.
Liquidity measures the ability to meet loan demand and deposit withdrawals and to pay liabilities as they come due. A sharp reduction in deposits or rapid increase in loans outstanding could force us to borrow heavily in the wholesale deposit market, purchase federal funds from correspondent banks, borrow at the Federal Home Loan Bank of Seattle or Federal Reserve discount window, raise deposit interest rates or reduce lending activity. Wholesale deposits, federal funds and sources for borrowings may not be available to us due to future regulatory constraints, market conditions or unfavorable terms.
We rely on the Federal Home loan Bank (“FHLB”) of Seattle as a source of liquidity.
The Company has the ability to borrow from FHLB of Seattle to provide a source of wholesale funding for immediate liquidity and borrowing needs. Changes or disruptions to the FHLB of Seattle or the FHLB system in general, may materially impair the Company’s ability to meet its growth plans or to meet short and long term liquidity demands. The Federal Housing Finance Agency reaffirmed FHLB of Seattle’s “undercapitalized” classification at December 31, 2010. The FHLB of Seattle cannot pay a dividend on their common stock and it cannot repurchase or redeem common stock. While the FHLB of Seattle has announced it does not anticipate that additional capital is immediately necessary, and believes that its capital level is adequate to support realized losses in the future, the FHLB of Seattle could require its members, including the Company, to contribute additional capital in order to return the FHLB of Seattle to compliance with capital guidelines.
The financial services industry is highly competitive.
Competition may adversely affect our performance. The financial services industry is highly competitive due to changes in regulation that permit more non-bank companies to offer financial services, technological advances that expand the ability of our competitors to reach our customers and offer products through the internet, and the accelerating pace of consolidation among financial services providers including due to bank failures. Credit unions, as a result of exemptions from federal corporate income tax and regulatory requirements facing banks that reduce operating costs, are able to offer certain products to our current and targeted customers at more competitive rates. We face competition both in attracting deposits and in originating loans and providing transactional services.
Our ability to pay dividends, repurchase shares or repay indebtedness depends primarily upon the results of operations of PremierWest Bank.
We are a separate, distinct legal entity from the Bank and receive substantially all of our revenue from dividends from the Bank. Our inability to receive dividends from the Bank adversely affects our financial condition. The Bank’s ability to pay dividends is primarily dependent on net interest income, which is the income that remains after deducting from total income generated by earning assets the expense attributable to the acquisition of the funds required to support earnings assets, the general level of interest rates, the dynamics of changes in interest rates and the levels of nonperforming loans.
Various statutory and regulatory provisions restrict the amount of dividends the Bank can pay to us without regulatory approval and the Bank is currently restricted from paying dividends without prior regulatory approval until its condition improves. In addition the Bank may not pay cash dividends if that payment could reduce the amount of its capital below that necessary to meet the “adequately capitalized” level in accordance with
23
Table of Contents
regulatory capital requirements. It is also possible that, depending on the financial condition of the Bank and other factors, regulatory authorities could assert that payment of dividends or other payments by the Bank, including payments to the Company, is an unsafe and unsound practice. Under Oregon law, the amount of a dividend from the Bank may not be greater than net unreserved retained earnings, after first deducting to the extent not already charged against earnings or reflected in a reserve, all bad debts, which are debts on which interest is unpaid and past due at least six months unless the debt is fully secured and in the process of collection; all other assets charged-off as required by the DCBS or state or federal examiner; and all accrued expenses, interest and taxes.
Compliance with the recently enacted financial reform legislation may increase our costs of operations and adversely impact our earnings.
Dodd-Frank will change the current bank regulatory structure and affect the lending, deposit, investment, trading and operating activities of financial institutions and their holding companies. Dodd-Frank requires various federal agencies to adopt a broad range of new implementing rules and regulations, and to prepare numerous studies and reports for Congress. The federal agencies are given significant discretion in drafting and implementing rules and regulations, and consequently, many of the details and much of the impact of Dodd-Frank may not be known for many months or years. Significant changes will include:
| • | The establishment of the Financial Stability Oversight Counsel, which will be responsible for identifying and monitoring systemic risks posed by financial firms, activities, and practices. The establishment of a Bureau of Consumer Financial Protection, within the Federal Reserve, to serve as a dedicated consumer-protection regulatory body with broad powers to supervise and enforce consumer protection laws. The Consumer Financial Protection Bureau has broad rule-making authority for a wide range of consumer protection laws that apply to all banks and savings institutions, including the authority to prohibit “unfair, deceptive or abusive” acts and practices. The Consumer Financial Protection Bureau has examination and enforcement authority over all banks with more than $10 billion in assets. Banks with $10 billion or less in assets will continue to be examined for compliance with the consumer laws by their primary bank regulators. |
| • | Amendments to the Truth in Lending Act aimed at improving consumer protections with respect to mortgage originations, including originator compensation, minimum repayment standards, and prepayment considerations. |
| • | Elimination of federal prohibitions on paying interest on demand deposits, thus allowing businesses to have interest bearing checking accounts. Depending on competitive responses, this significant change to existing law could have an adverse impact on the Company’s interest expense. |
| • | Broadened base for Federal Deposit Insurance Corporation insurance assessments. Assessments will now be based on the average consolidated total assets less tangible equity capital of a financial institution. |
| • | Federal Reserve determination of reasonable debit card fees. |
| • | Permanent increase to the maximum amount of deposit insurance for banks, savings institutions and credit unions to $250,000 per depositor, retroactive to January 1, 2009, and non-interest bearing transaction accounts have unlimited deposit insurance through December 31, 2013. |
| • | Requirement of publicly traded companies to provide stockholders a non-binding vote on executive compensation and so-called “golden parachute” payments, and by authorizing the Securities and Exchange Commission to promulgate rules that would allow stockholders to nominate their own candidates using a company’s proxy materials. The legislation also directs the Federal Reserve Board to promulgate rules prohibiting excessive compensation paid to bank holding company executives, regardless of whether the company is publicly traded or not. |
Many provisions in the Dodd-Frank Reform Act are aimed at financial institutions that are significantly larger than the Company or the Bank. Nonetheless, there are provisions that apply to us and we must begin to comply
24
Table of Contents
with immediately. In addition, federal agencies will promulgate rules and regulations to implement and enforce provisions in the Dodd-Frank Reform Act. We will have to apply resources to ensure that we are in compliance with all applicable provisions, which may adversely impact our earnings. The precise nature, extent and timing of many of these reforms and the impact on us is still uncertain.
Difficult market conditions have adversely affected our industry.
Dramatic declines in the housing market over the past three years, with falling home prices and increasing foreclosures and unemployment, have negatively impacted the credit performance of mortgage loans and resulted in significant write-downs of asset values by financial institutions, including government-sponsored entities. These write-downs have caused many financial institutions to seek additional capital, to merge with larger and stronger institutions and, in some cases, to fail. Reflecting concern about the stability of the financial markets generally and the strength of counterparties, many lenders and institutional investors have reduced or ceased providing funding to borrowers, including to other financial institutions. This market turmoil and tightening of credit have led to an increased level of commercial and consumer delinquencies, lack of consumer confidence, increased market volatility and widespread reduction of business activity generally. The resulting economic pressure on consumers and lack of confidence in the financial markets has adversely affected our business, financial condition and results of operations. A worsening of these conditions would likely exacerbate the adverse effects of these difficult market conditions on us and others in the financial services industry. In particular, we may face the following risks in connection with these events:
| • | We face increased regulation of our industry, as a result of Dodd-Frank, EESA and the American Recovery and Reinvestment Act of 2009 (“ARRA”). Compliance will increase our costs and limit our ability to pursue business opportunities. |
| • | Government stimulus packages and other responses to the financial crises may not stabilize the economy or financial system. |
| • | Our ability to assess the creditworthiness of our customers may be impaired if the models and approaches we use to select, manage, and underwrite our customers become less predictive of future behaviors. |
| • | The process we use to estimate losses inherent in its credit exposure requires difficult, subjective, and complex judgments, including forecasts of economic conditions and how these economic predictions might impair the ability of the Bank’s borrowers to repay their loans. These may no longer be capable of accurate estimation which may, in turn, impact the reliability of the process. |
| • | We will be required to pay significantly higher Federal Deposit Insurance Corporation premiums because market developments have significantly depleted the insurance fund of the FDIC and reduced the ratio of reserves to insured deposits. |
| • | There may be continued downward pressure on our stock price due to such conditions. |
| • | Our ability to engage in routine funding transactions could be adversely affected by the actions and commercial soundness of other financial institutions and government sponsored entities. |
| • | We may face new competitive forces due to intensified consolidation of the financial services industry. |
If current levels of market disruption and volatility continue or worsen, there can be no assurance that we will not experience an adverse effect, which may be material, on our ability to access capital, on our business, our financial condition and results of operations.
We rely on technology to deliver products and services and interact with our customers.
We face operational risks as we depend on internal and outsourced technology to support all aspects of our business operations. Interruption or failure of these systems creates a risk of loss of customer confidence if
25
Table of Contents
technology fails to work as expected and risk of regulatory scrutiny if security breaches occur. Risk management programs are expensive to maintain and will not protect the company from all risks associated with maintaining the security of customer information, proprietary data, external and internal intrusions, disaster recovery and failures in the controls used by vendors.
Changes in accounting standards may impact how we report our financial condition and results of operations.
Our accounting policies and methods are fundamental to how we report our financial condition and results of operations. From time to time the Financial Accounting Standards Board (“FASB”) changes the financial accounting and reporting standards that govern the preparation of our financial statements. These changes can be difficult to predict and can materially impact how we record and report our financial condition and results of operations.
The value of securities in our investment securities portfolio may be negatively affected by disruptions in securities markets.
Market conditions may negatively affect the value of securities. There can be no assurance that the declines in market value associated with these disruptions will not result in other-than-temporary impairments of these assets, which would lead to accounting charges that could have a material adverse effect on our net income and capital levels.
Our deposit insurance premium could be substantially higher in the future.
The FDIC insures deposits at the Bank and other financial institutions. The FDIC charges insured financial institutions premiums to maintain the Deposit Insurance Fund at a certain level. Current economic conditions have caused bank failures and expectations for additional bank failures, in which case the FDIC, through the Deposit Insurance Fund, ensures payments of customer deposits at failed banks up to insured limits. In addition, deposit insurance limits on customer deposit accounts have generally increased to $250,000 from $100,000. These developments will cause the premiums assessed by the FDIC to increase and may materially increase our noninterest expense. An increase in the risk category of the Bank will also cause our premiums to increase. Whether through adjustments to base deposit insurance assessment rates, significant special assessments or emergency assessments under the TLGP, increased deposit insurance premiums could have a material adverse effect on our earnings.
If we fail to comply with the requirements of Section 404 of the Sarbanes-Oxley Act of 2002 or to remedy any future material weaknesses in our internal controls that we may identify, such failure could result in material misstatements in our financial statements, cause investors to lose confidence in our reported financial information and have a negative effect on the trading price of our common stock.
Any failure to remediate any material weakness that we may identify or to implement new or improved controls, or difficulties encountered in their implementation, could harm our operating results, cause us to fail to meet our reporting obligations or result in material misstatements in our financial statements. Any such failure also could adversely affect the results of the periodic management evaluations and, in the case of a failure to remediate any material weaknesses that we may identify, would adversely affect the annual auditor attestation reports regarding the effectiveness of our internal control over financial reporting that we are required under Section 404 of the Sarbanes-Oxley Act of 2002. Inferior internal controls could also cause investors to lose confidence in our reported financial information, which could have a negative effect on the trading price of our capital stock.
26
Table of Contents
| ITEM 1B. | UNRESOLVED STAFF COMMENTS |
None.
| ITEM 2. | PROPERTIES |
As of December 31, 2010, the Company conducted business through 55 offices including the operations of PremierWest Bank, PremierWest Bank’s mortgage division, and also PremierWest Bank’s two subsidiaries – Premier Finance Company and PremierWest Investment Services, Inc. The 55 offices included 44 full service bank branches and 11 other office locations.
PremierWest Bank’s 44 full service branch facilities are located in Oregon and California and more specifically broken down as follows: 23 branches are located in Jackson (10), Josephine (2), Deschutes (2), Douglas (7) and Klamath (2) counties of Oregon and 21 branches located in Siskiyou (8), Shasta (3), Butte (1), Tehama (2), Yolo (2), Nevada (1), and Sacramento (4) counties of California. Of the 44 branch locations, 30 are owned by PremierWest Bank, 14 are leased, and two locations involve long-term land leases where the Bank owns the building.
The Company’s 11 other locations house administrative and subsidiary operations. These facilities include one campus located in Medford, Oregon with two owned buildings housing the Company’s administrative head office, operations and data processing facilities; two owned administrative facilities—one in Redding, California housing regional administration, our Premier Finance Company subsidiary, and one in Red Bluff, California housing PremierWest Bank administrative functions; one leased location in Bend, Oregon; three leased locations housing stand-alone Premier Finance Company offices in Portland, Eugene, and Roseburg, Oregon; and, three buildings and two owned locations in Medford, Oregon occupied by a Premier Finance Company office and the Bank’s consumer lending group. The Company also leases a storage warehouse in Medford, Oregon.
In addition, to the above, three Premier Finance Company offices are housed within PremierWest Bank full service branch offices, as are various employees of PremierWest Investment Services, Inc., and the Bank’s mortgage division.
The Premier Finance Company office is Roseburg was temporarily leasing office space during building renovations and has now relocated back to the branch building.
The annual rent expense on leased properties was $1.2 million, $1.1 million, and $1.0 million in 2010, 2009 and 2008, respectively.
| ITEM 3. | LEGAL PROCEEDINGS |
From time to time, in the normal course of business, PremierWest is party to various legal actions. Management is unaware of any existing legal actions against the Company or its subsidiaries that would have a materially adverse impact on our business, financial condition or results of operations.
| ITEM 4. | (REMOVED AND RESERVED). |
27
Table of Contents
PART II
| ITEM 5. | MARKET FOR REGISTRANT’S COMMON EQUITY, RELATED STOCKHOLDER MATTERS AND ISSUER PURCHASES OF EQUITY SECURITIES |
PremierWest common stock is quoted on the NASDAQ Capital Market (“NASDAQ”) under the symbol “PRWT”. From February 11, 2011 through March 10, 2011, the symbol converted to “PRWTD” as a result of our reverse stock split. The common stock is registered under the Securities Exchange Act of 1934. The table below sets forth the high and low sales prices of PremierWest common stock as reported on NASDAQ. This information has been adjusted to reflect previous stock dividends paid in 2009 and the 1-for-10 reverse stock split that was effective February 10, 2011 – see Note 26. No stock dividend was paid in 2010 or 2008. Bid quotations reflect inter-dealer prices, without adjustment for mark-ups, mark-downs, or commissions and may not necessarily represent actual transactions. On February 25, 2011, the Company had 10,034,491 shares of common stock issued and outstanding, which were held by approximately 834 shareholders of record, a number which does not include approximately 3,300 beneficial owners who hold shares in “street name.” As of March 10, 2011, the most recent date prior to the date of this report, the closing price of the common stock was $2.51 per share.
| 2010 | 2009 | 2008 | ||||||||||||||||||||||||||||||||||
| Closing Market Price |
Cash Dividends Declared |
Closing Market Price |
Cash Dividends Declared |
Closing Market Price |
Cash Dividends Declared |
|||||||||||||||||||||||||||||||
| High | Low | High | ‘ | High | Low | |||||||||||||||||||||||||||||||
| 1st Quarter |
$ | 16.30 | $ | 4.50 | $ | — | $ | 67.00 | $ | 26.20 | $ | 0.10 | $ | 115.50 | $ | 96.20 | $ | 0.60 | ||||||||||||||||||
| 2nd Quarter |
$ | 13.80 | $ | 3.90 | $ | — | $ | 46.70 | $ | 33.50 | $ | — | $ | 104.00 | $ | 58.40 | $ | 0.60 | ||||||||||||||||||
| 3rd Quarter |
$ | 5.60 | $ | 3.40 | $ | — | $ | 36.70 | $ | 27.10 | $ | — | $ | 101.00 | $ | 51.00 | $ | 0.60 | ||||||||||||||||||
| 4th Quarter |
$ | 5.50 | $ | 3.10 | $ | — | $ | 27.00 | $ | 13.00 | $ | — | $ | 83.80 | $ | 51.50 | $ | — | ||||||||||||||||||
The timing and amount of any future dividends PremierWest might pay will be determined by its Board of Directors and will depend on earnings, cash requirements and the financial condition of PremierWest and its subsidiaries, applicable government regulations and other factors deemed relevant by the Board of Directors. Beginning in the second quarter of 2009, the Company announced cessation of dividends. See Item 1 – Dividends. For a discussion of restrictions on dividend payments, please refer to Part I, Item 1 and the Risk Factors in this Form 10-K.
There were no repurchases of common stock by the Company during 2010.
The following table provides information about the number of outstanding options, the associated weighted average price and the number of options available for issuance as of December 31, 2010:
Equity Compensation Plan Information
| Plan category |
Number of securities to be issued upon exercise of outstanding options, warrants and rights (a) |
Weighted-average exercise price of outstanding options, warrants and rights (b) |
Number of securities remaining available for future issuance under equity compensation plans (excluding securities reflected in column (a)) (c) |
|||||||||
| Equity compensation plans approved by security holders |
85,376 | $ | 91.33 | 128,636 | ||||||||
| Equity compensation plans not approved by security holders |
— | — | — | |||||||||
| Total |
85,376 | $ | 91.33 | 128,636 | ||||||||
28
Table of Contents
Performance Graph
The following graph, which is furnished not filed, shows the cumulative total return for our common stock compared to the cumulative total returns for the SNL NASDAQ Bank index and the NASDAQ Composite index. All values were gathered by SNL Financial LLC from sources deemed to be reliable. The comparison assumes that $100 was invested on December 31, 2005 in PremierWest Bancorp common stock and in each of the comparative indexes. The cumulative total return on each investment is as of December 31 for each of the subsequent five years and assumes the reinvestment of all cash dividends and the retention of all stock dividends. PremierWest Bancorp’s five-year cumulative total return was -97.05% compared to -31.66% and 25.91% for the SNL NASDAQ Bank and NASDAQ Composite indexes, respectively.
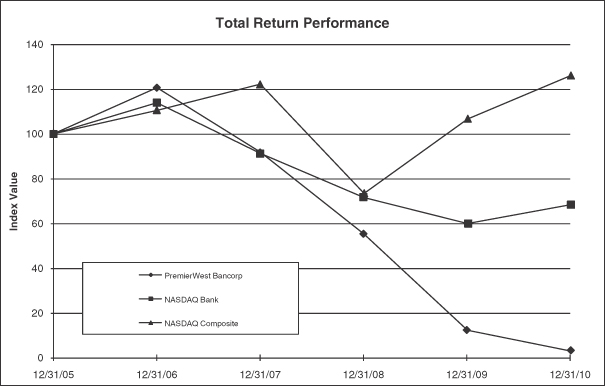
| Period Ending | ||||||||||||||||||||||||
| Index |
12/31/05 | 12/31/06 | 12/31/07 | 12/31/08 | 12/31/09 | 12/31/10 | ||||||||||||||||||
| PremierWest Bancorp |
100.00 | 120.50 | 91.77 | 55.16 | 12.32 | 2.95 | ||||||||||||||||||
| NASDAQ Bank |
100.00 | 113.82 | 91.16 | 71.52 | 59.87 | 68.34 | ||||||||||||||||||
| NASDAQ Composite |
100.00 | 110.39 | 122.15 | 73.32 | 106.57 | 125.91 | ||||||||||||||||||
29
Table of Contents
| ITEM 6. | SELECTED FINANCIAL DATA |
The following table sets forth certain information concerning the consolidated financial condition, operating results and key operating ratios for PremierWest at the dates and for the periods indicated. This information does not purport to be complete, and should be read in conjunction with “Management’s Discussion and Analysis of Financial Condition and Results of Operations” and the Consolidated Financial Statements of PremierWest and Notes thereto.
Premier West Bancorp
Historical Financial Data
| (Dollars in thousands except per share data) | Years Ended December 31, | |||||||||||||||||||
| 2010 | 2009 | 2008 | 2007 | 2006 | ||||||||||||||||
| Operating Results |
||||||||||||||||||||
| Total interest income |
$ | 69,014 | $ | 77,915 | $ | 88,936 | $ | 82,400 | $ | 73,212 | ||||||||||
| Total interest expense |
13,074 | 19,968 | 28,573 | 27,216 | 19,104 | |||||||||||||||
| Net interest income |
55,940 | 57,947 | 60,363 | 55,184 | 54,108 | |||||||||||||||
| Provision for loan losses |
10,050 | 88,031 | 36,500 | 686 | 800 | |||||||||||||||
| Non-interest income |
11,299 | 11,052 | 10,234 | 8,880 | 7,741 | |||||||||||||||
| Non-interest expense |
62,014 | 129,722 | 47,129 | 38,973 | 37,415 | |||||||||||||||
| Income (loss) before provision for income taxes |
(4,825 | ) | (148,754 | ) | (13,032 | ) | 24,405 | 23,634 | ||||||||||||
| Provision (benefit) for income taxes |
134 | (2,282 | ) | (5,493 | ) | 9,303 | 8,986 | |||||||||||||
| Net income (loss) |
(4,959 | ) | (146,472 | ) | (7,539 | ) | 15,102 | 14,648 | ||||||||||||
| Preferred stock dividends and discount accretion |
2,533 | 2,171 | 275 | 275 | 275 | |||||||||||||||
| Net income (loss) available to common shareholders |
$ | (7,492 | ) | $ | (148,643 | ) | $ | (7,814 | ) | $ | 14,827 | $ | 14,373 | |||||||
| Per Share Data (1) |
||||||||||||||||||||
| Basic earnings (loss) per common |
$ | (0.90 | ) | $ | (60.07 | ) | $ | (3.36 | ) | $ | 8.30 | $ | 8.10 | |||||||
| Diluted earnings (loss) per common |
$ | (0.90 | ) | $ | (60.07 | ) | $ | (3.36 | ) | $ | 7.80 | $ | 7.50 | |||||||
| Dividends declared per common share (1) |
$ | — | $ | 0.10 | $ | 1.80 | $ | 1.70 | $ | 1.00 | ||||||||||
| Ratio of dividends declared to net income (loss) |
0.00 | % | -0.16 | % | -53.48 | % | 19.14 | % | 11.07 | % | ||||||||||
| Financial Ratios |
||||||||||||||||||||
| Return on average common equity |
-13.69 | % | -93.07 | % | -4.41 | % | 13.05 | % | 14.25 | % | ||||||||||
| Return on average assets |
-0.51 | % | -9.29 | % | -0.54 | % | 1.38 | % | 1.49 | % | ||||||||||
| Efficiency ratio (2) |
92.23 | % | 188.01 | % | 66.76 | % | 60.83 | % | 60.49 | % | ||||||||||
| Net interest margin (3) |
4.07 | % | 4.10 | % | 4.68 | % | 5.72 | % | 6.25 | % | ||||||||||
| Balance Sheet Data at Year End |
||||||||||||||||||||
| Gross loans |
$ | 978,546 | $ | 1,149,027 | $ | 1,247,988 | $ | 1,025,329 | $ | 921,694 | ||||||||||
| Allowance for loan losses |
$ | 35,582 | $ | 45,903 | $ | 17,157 | $ | 11,450 | $ | 10,877 | ||||||||||
| Allowance as percentage of gross loans |
3.64 | % | 3.99 | % | 1.37 | % | 1.12 | % | 1.18 | % | ||||||||||
| Total assets |
$ | 1,411,220 | $ | 1,536,314 | $ | 1,475,954 | $ | 1,157,961 | $ | 1,034,511 | ||||||||||
| Total deposits |
$ | 1,266,249 | $ | 1,420,762 | $ | 1,211,269 | $ | 935,315 | $ | 879,350 | ||||||||||
| Total equity |
$ | 97,008 | $ | 71,535 | $ | 176,984 | $ | 127,675 | $ | 116,259 | ||||||||||
Notes:
| (1) | Per share data have been restated for subsequent stock dividends and for 1-for-10 reverse stock split effective February 10, 2011. |
| (2) | Efficiency ratio is calculated by dividing non-interest expense by the sum of net interest income plus non-interest income. |
| (3) | Tax adjusted at 40.0% for 2010 and 2009, 34.00% for 2008, 38.25% for 2007, and 38.00% for 2006. |
30
Table of Contents
| ITEM 7. | MANAGEMENT’S DISCUSSION AND ANALYSIS OF FINANCIAL CONDITION AND RESULTS OF OPERATION |
OVERVIEW
The following discussion should be read in conjunction with PremierWest’s audited consolidated financial statements and the notes thereto as of December 31, 2010 and 2009, and for each of the three years in the periods ended December 31, 2010, 2009, and 2008, that are included in this report.
PremierWest conducts a general commercial banking business, gathering deposits and applying those funds to the origination of loans for commercial, real estate, and consumer purposes and investments.
PremierWest’s profitability depends primarily on net interest income, which is the difference between interest income generated by interest-earning assets (principally loans and investments) and interest expense incurred on interest-bearing liabilities (principally customer deposits). Net interest income is affected by the difference (the “interest rate spread”) between interest rates earned on interest-earning assets and interest rates paid on interest-bearing liabilities, and by the relative volume of interest-earning assets and interest-bearing liabilities. Financial institutions have traditionally used interest rate spreads as a measure of net interest income. Another indication of an institution’s net interest income is its “net yield on interest-earning assets” or “net interest margin,” which is net interest income divided by average interest-earning assets.
PremierWest’s profitability is also affected by such factors as the level of non-interest income and expenses and the provision for loan loss expense. Non-interest income consists primarily of service charges on deposit accounts and fees generated through PremierWest’s mortgage division and investment services subsidiary. Non-interest expense consists primarily of salaries, commissions and employee benefits, OREO and loan collection expenses, professional fees, equipment expenses, occupancy-related expenses, communications, advertising and other operating expenses.
FINANCIAL HIGHLIGHTS
Net loss available to common shareholders for 2010 was $7.5 million, a 95% decrease from 2009 net loss available to common shareholders of $148.6 million. Our diluted earnings (loss) per share were ($0.90) and ($60.07) for the years ended 2010 and 2009, respectively. The Company booked loan loss provision expense of $10.1 million for 2010 compared to $88.0 million in 2009. Net interest income declined $2.0 million primarily due to interest reversed or lost on loans on non-accrual status and a decline in loans outstanding. Return on average common shareholders’ equity was -13.69% and return on average assets was -0.51% for the year ended December 31, 2010. This compared with a return on average shareholders’ equity of -93.07% and a return on average assets of -9.29% for 2009.
| Years Ended December 31, | ||||||||||||||||||||
| 2010 | 2009 | 2008 | 2007 | 2006 | ||||||||||||||||
| (Dollars in thousands) | ||||||||||||||||||||
| Net income (loss) available to common shareholders |
$ | (7,492 | ) | $ | (148,643 | ) | $ | (7,814 | ) | $ | 14,827 | $ | 14,373 | |||||||
| Average assets |
$ | 1,470,807 | $ | 1,600,572 | $ | 1,456,722 | $ | 1,073,571 | $ | 966,786 | ||||||||||
| RETURN ON AVERAGE ASSETS |
-0.51 | % | -9.29 | % | -0.54 | % | 1.38 | % | 1.49 | % | ||||||||||
| Net income (loss) available to common shareholders |
$ | (7,492 | ) | $ | (148,643 | ) | $ | (7,814 | ) | $ | 14,827 | $ | 14,373 | |||||||
| Average common equity |
$ | 54,725 | $ | 159,717 | $ | 177,254 | $ | 113,654 | $ | 100,864 | ||||||||||
| RETURN ON AVERAGE EQUITY AVAILABLE TO COMMON SHAREHOLDERS |
-13.69 | % | -93.07 | % | -4.41 | % | 13.05 | % | 14.25 | % | ||||||||||
| Cash dividends declared |
$ | — | $ | 236 | $ | 4,032 | $ | 2,891 | $ | 1,621 | ||||||||||
| Net income (loss) |
$ | (4,959 | ) | $ | (146,472 | ) | $ | (7,539 | ) | $ | 15,102 | $ | 14,648 | |||||||
| PAYOUT RATIO |
0.00 | % | -0.16 | % | -53.48 | % | 19.14 | % | 11.07 | % | ||||||||||
| Average stockholders’ equity |
$ | 94,486 | $ | 194,475 | $ | 186,032 | $ | 123,244 | $ | 110,454 | ||||||||||
| Average assets |
$ | 1,470,807 | $ | 1,600,572 | $ | 1,456,722 | $ | 1,073,571 | $ | 966,786 | ||||||||||
| AVERAGE EQUITY TO ASSET RATIO |
6.42 | % | 12.15 | % | 12.77 | % | 11.48 | % | 11.42 | % | ||||||||||
31
Table of Contents
Gross loans outstanding declined $170.5 million, or 15% in 2010 and totaled $978.5 million at December 31, 2010 compared to $1.15 billion at December 31, 2009. This was the product of the Company’s strategy to reduce the credit risk profile of the loan portfolio by purposefully lowering outstanding balances in certain targeted portfolio segments. In addition, the decline was due to limited demand for loans in the current economic downturn. Loan charge offs experienced by the Bank also contributed to declines in outstanding balances. Over the past year, our allowance for loan loss decreased 22% to $35.6 million totaling 3.64% of outstanding gross loans at December 31, 2010. The provision expense for loan losses was $10.1 million for 2010 compared to $88.0 million in 2009. Management believes that the allowance for loan and lease losses is adequate as of December 31, 2010, based on our assessment of loan portfolio quality and economic conditions.
Total deposits were $1.27 billion at December 31, 2010, a decrease of $154.5 million from $1.42 billion at December 31, 2009. The decrease was primarily a result of Management’s decision to reduce the level of higher-cost time deposits. Non-interest-bearing demand deposits totaled $242.6 million and accounted for 19% of total deposits at year end compared to $256.2 million or 18% of total deposits at December 31, 2009. The Bank continues to aggressively pursue non-interest-bearing deposit relationships from consumers and businesses.
During the second quarter of 2009, federal and state bank regulators initiated their annual regulatory examination and completed the examination during the third quarter of 2009. As a result of the examination and capital levels, in 2010 the Bank became subject to a formal regulatory agreement with the FDIC. Our Board of Directors initiated a rights offering, as discussed in Note 2—Regulatory Agreement, and the formal regulatory agreement required our leverage capital ratio to reach 10.00% by October 3, 2010, a level above the published regulatory minimum for “well-capitalized.” Our Board of Directors approved Management’s recommendations that the following steps be taken to conserve capital:
| • | Deferring further dividend payments on the preferred stock issued pursuant to the U.S. Treasury’s Capital Purchase Program; and |
| • | Deferring further interest payments on the Company’s trust preferred securities. |
Due to these and other steps taken to comply with the regulatory agreement, the Bank’s capital ratios as of December 31, 2010, are as follows:
| 2010 Actual |
2009 Actual |
Minimum to be “Adequately Capitalized” |
Minimum to be “Well-Capitalized” |
|||||||||||||
| Total risk-based capital ratio |
12.59 | % | 8.53 | % | ³ | 8.00 | % | ³ | 10.00 | % | ||||||
| Tier 1 risk-based capital ratio |
11.31 | % | 7.25 | % | ³ | 4.00 | % | ³ | 6.00 | % | ||||||
| Leverage ratio |
8.85 | % | 5.70 | % | ³ | 4.00 | % | ³ | 5.00 | % | ||||||
No action has been taken to date given the Company’s status of compliance with this requirement.
In addition, the Regulatory Agreement required the Bank to reduce its levels of adversely classified assets as of the 2009 regulatory examination to 100% of Tier 1 Capital plus the Allowance for Loan and Lease Losses (ALLL) as of November 3, 2010 and 70% of Tier 1 Capital plus the ALLL as of April 2, 2011. As of October 31, 2010 the Bank had reduced levels of adversely classified assets to Tier 1 Capital plus ALLL to 120.8%. The Company has kept regulatory authorities informed regarding its progress in complying with this requirement. No action has been taken to date given the Company’s status of compliance with this requirement. As of December 31, 2010 adversely classified assets to Tier 1 Capital plus ALLL was 107.0%.
The Oregon Department of Consumer and Business Services, which supervises banks and bank holding companies through its Division of Finance and Corporate Securities, and the Federal Reserve have policies that encourage banks and bank holding companies to pay dividends from current earnings, and have the general authority to limit the dividends paid by banks and bank holding companies, respectively. We do not expect to be in a position to pay dividends on our common or preferred stock or interest payments on trust preferred securities without regulatory approval or until we are “well-capitalized” and have satisfied conditions in, and been released from, our regulatory agreements with the FDIC, DCBS and FRB.
32
Table of Contents
The Company and Bank are currently subject to regulatory requirements to improve capital ratios, reduce non-performing asset totals, restrict dividend payments, maintain an adequate allowance for loan losses, retain experienced management, limit deposit pricing and use of brokered deposits or other wholesale funding sources. Our inability to comply with any aspect of the agreement could result in additional restrictions and penalties, impact our ability to obtain regulatory approval to effect branch transactions or other corporate activities, have an adverse impact on our ability to continue as a going concern and prolong the time we are under regulatory constraints on growing our business.
CRITICAL ACCOUNTING POLICIES AND ESTIMATES
This “Management’s Discussion and Analysis of Financial Condition and Results of Operations,” as well as disclosures included elsewhere in this Form 10-K, are based upon our consolidated financial statements, which have been prepared in accordance with accounting principles generally accepted in the United States of America. The preparation of these financial statements requires Management to make estimates and judgments that affect the reported amounts of assets, liabilities, revenues and expenses. On an ongoing basis, Management evaluates the estimates used, including the adequacy of the allowance for loan losses, impairment of intangible assets, contingencies and litigation. Estimates are based upon historical experience, current economic conditions and other factors that Management considers reasonable under the circumstances. These estimates result in judgments regarding the carrying values of assets and liabilities when these values are not readily available from other sources as well as assessing and identifying the accounting treatments of commitments and contingencies. Actual results may differ from these estimates under different assumptions or conditions. The following critical accounting policies involve the more significant judgments and assumptions used in the preparation of the consolidated financial statements.
The allowance for loan losses is established to absorb known and inherent losses attributable to loans outstanding. The adequacy of the allowance is monitored on an ongoing basis and is based on Management’s evaluation of numerous factors. These factors include the quality of the current loan portfolio, the trend in the loan portfolio’s risk ratings, current economic conditions, loan concentrations, loan growth rates, past-due and nonperforming trends, evaluation of specific loss estimates for all significant problem loans, historical charge-off and recovery experience and other pertinent information. As of December 31, 2010, approximately 78% of PremierWest’s gross loan portfolio is secured by real estate. Accordingly, a significant decline in real estate values from current levels in Oregon and California could cause Management to increase the allowance for loan losses and/or experience greater loan charge-offs.
The Company measures and recognizes as compensation expense, the grant date fair market value for all share-based awards. The Company estimates the fair market value of stock-based payment awards on the date of grant using an option-pricing model. The Company uses the Black-Scholes option-pricing model to value its stock options. The Black-Scholes model requires the use of assumptions regarding the risk-free interest rate, the expected dividend yield, the weighted average expected life of the options, and the historical volatility of its stock price.
The Company establishes a deferred tax valuation allowance to reduce the net carrying amount of deferred tax assets if it is determined to be more likely than not that all or some of the deferred tax asset will not be realized. At December 31, 2010, the Company continued to conclude it was more likely than not that the deferred tax asset would not be realized, and the valuation allowance reduced the deferred tax asset to zero. The determination of our ability to fully utilize our deferred tax assets requires significant judgment, the use of estimates and the interpretation of complex tax laws. As such, we have written them down to the net realizable value. Prospectively, as the Company continues to evaluate available evidence, including the depth of the current economic downturn and its implications on its operating results, it is possible that the Company may deem some or all of its deferred income tax assets to be realizable.
In July 2009, the Company acquired two Wachovia Bank branches in Northern California. This acquisition included a core deposit intangible asset representing the value ascribed to the long-term deposit relationships
33
Table of Contents
acquired and a negative CD premium as a result of the current all-in cost of the CD portfolio being well above the cost of similar funding. The core deposit intangible asset is being amortized over an estimated weighted average useful life of 7.4 years. The negative CD premium was fully amortized at December 31, 2010.
RESULTS OF OPERATIONS
Average Balances, Interest Rates and Yields
The following tables set forth certain information relating to PremierWest’s consolidated average interest-earning assets and interest-bearing liabilities and reflect the average yield on assets and average cost of liabilities for the years indicated. The yields and costs are derived by dividing income or expense by the average daily balance of assets or liabilities, respectively, for the periods presented. During the periods indicated, non-accruing loans, if any, are included in the net loan category. The yields and costs include fees, premiums and discounts, which are considered adjustments to yield. The table reflects the effect of income taxes on nontaxable loans and securities.
| Years Ended December 31, | ||||||||||||||||||||||||||||||||||||
| 2010 | 2009 | 2008 | ||||||||||||||||||||||||||||||||||
| Average Balance |
Interest Income or Expense |
Average Yields or Rates |
Average Balance |
Interest Income or Expense |
Average Yields or Rates |
Average Balance |
Interest Income or Expense |
Average Yields or Rates |
||||||||||||||||||||||||||||
| (Dollars in thousands) | ||||||||||||||||||||||||||||||||||||
| Interest-earning assets: |
||||||||||||||||||||||||||||||||||||
| Loans (1) (2) |
$ | 1,083,574 | $ | 63,882 | 5.90 | % | $ | 1,221,842 | $ | 75,078 | 6.14 | % | $ | 1,255,203 | $ | 87,756 | 6.99 | % | ||||||||||||||||||
| Investment securities: |
||||||||||||||||||||||||||||||||||||
| Taxable securities |
173,269 | 4,814 | 2.78 | % | 86,352 | 2,422 | 2.80 | % | 33,144 | 1,128 | 3.40 | % | ||||||||||||||||||||||||
| Nontaxable securities (3) |
5,349 | 328 | 6.13 | % | 3,647 | 232 | 6.36 | % | 3,487 | 227 | 6.50 | % | ||||||||||||||||||||||||
| Temporary investments |
118,222 | 309 | 0.26 | % | 106,188 | 462 | 0.44 | % | 2,802 | 71 | 2.53 | % | ||||||||||||||||||||||||
| Total interest-earning assets |
1,380,414 | 69,333 | 5.02 | % | 1,418,029 | 78,194 | 5.51 | % | 1,294,636 | 89,182 | 6.89 | % | ||||||||||||||||||||||||
| Cash and due from banks |
27,521 | 30,992 | 33,655 | |||||||||||||||||||||||||||||||||
| Allowance for loan losses |
(44,966 | ) | (37,795 | ) | (20,474 | ) | ||||||||||||||||||||||||||||||
| Other assets |
107,838 | 189,346 | 148,905 | |||||||||||||||||||||||||||||||||
| Total assets |
$ | 1,470,807 | $ | 1,600,572 | $ | 1,456,722 | ||||||||||||||||||||||||||||||
| Interest-bearing liabilities: |
||||||||||||||||||||||||||||||||||||
| Interest-bearing checking and savings accounts |
$ | 487,182 | 2,372 | 0.49 | % | $ | 480,760 | 4,245 | 0.88 | % | $ | 427,646 | 6,912 | 1.62 | % | |||||||||||||||||||||
| Time deposits |
590,701 | 9,599 | 1.63 | % | 629,742 | 13,896 | 2.21 | % | 545,329 | 19,432 | 3.56 | % | ||||||||||||||||||||||||
| Other borrowings |
30,953 | 1,103 | 3.56 | % | 35,737 | 1,827 | 5.11 | % | 48,258 | 2,229 | 4.62 | % | ||||||||||||||||||||||||
| Total interest-bearing liabilities |
1,108,836 | 13,074 | 1.18 | % | 1,146,239 | 19,968 | 1.74 | % | 1,021,233 | 28,573 | 2.80 | % | ||||||||||||||||||||||||
| Noninterest-bearing deposits |
251,670 | 245,829 | 231,710 | |||||||||||||||||||||||||||||||||
| Other liabilities |
15,815 | 14,029 | 17,725 | |||||||||||||||||||||||||||||||||
| Total liabilities |
1,376,321 | 1,406,097 | 1,270,668 | |||||||||||||||||||||||||||||||||
| Shareholders’ equity |
94,486 | 194,475 | 186,054 | |||||||||||||||||||||||||||||||||
| Total liabilities and shareholders’ equity |
$ | 1,470,807 | $ | 1,600,572 | $ | 1,456,722 | ||||||||||||||||||||||||||||||
| Net interest income (3) |
$ | 56,259 | $ | 58,226 | $ | 60,609 | ||||||||||||||||||||||||||||||
| Net interest spread |
3.84 | % | 3.77 | % | 4.09 | % | ||||||||||||||||||||||||||||||
| Average yield on earning assets (2)(3) |
5.02 | % | 5.51 | % | 6.89 | % | ||||||||||||||||||||||||||||||
| Interest expense to earning assets |
0.95 | % | 1.41 | % | 2.21 | % | ||||||||||||||||||||||||||||||
| Net interest income to earning |
4.08 | % | 4.10 | % | 4.68 | % | ||||||||||||||||||||||||||||||
| Reconciliation of Non-GAAP measure: |
||||||||||||||||||||||||||||||||||||
| Tax Equivalent Net Interest Income |
||||||||||||||||||||||||||||||||||||
| Net interest income |
$ | 55,940 | $ | 57,947 | $ | 60,363 | ||||||||||||||||||||||||||||||
| Tax equivalent adjustment for municipal loan interest |
187 | 186 | 169 | |||||||||||||||||||||||||||||||||
| Tax equivalent adjustment for municipal bond interest |
132 | 93 | 77 | |||||||||||||||||||||||||||||||||
| Tax equivalent net interest income |
$ | 56,259 | $ | 58,226 | $ | 60,609 | ||||||||||||||||||||||||||||||
34
Table of Contents
Non-GAAP financial mesures have inherent limitations, are not reuired to be uniformly applied, and are not audited.
Management believes that presentation of this non-GAAP measure provides useful information frequently used by shareholders in the evaluation of a company.
Non-GAAP financial measures have limitations as analytical tools and should not be considered in isolation or as a substitute for analyses of results as reported under GAAP.
| (1) | Non-accrual loans of approximately $129.5 million for 2010, $98.5 million for 2009, $68.5 million for 2008 are included in the average loan balances. |
| (2) | Loan interest income includes loan fee income of $263,000, $1.1 million, and $1.9 million for 2010, 2009, and 2008, respectively. |
| (3) | Tax-exempt income has been adjusted to a tax equivalent basis at a 40% effective rate for 2010 and 2009, and 34% effective rate for 2008. The amount of such adjustment was an addtion to recorded pre-tax income of $319,000, $279,000, and $246,000 for 2010, 2009, and 2008, respectively. |
Net Interest Income
PremierWest’s profitability depends primarily on net interest income, which is the difference between interest income generated by interest-earning assets (principally loans and investments) and interest expense incurred on interest-bearing liabilities (principally customer deposits and borrowed funds). Net interest income is affected by the difference between rates of interest earned on interest-earning assets and rates of interest paid on interest-bearing liabilities (the “interest rate spread”), as well as the relative volumes of interest-earning assets and interest-bearing liabilities. Financial institutions have traditionally used interest rate spreads as a measure of net interest income. Another indication of an institution’s net interest income is its “net yield on interest-earning assets” or “net interest margin,” which is net interest income divided by average interest-earning assets.
Net interest income on a tax equivalent basis, before provisions for loan losses, for the year ended December 31, 2010, was $56.3 million, a decrease of 3% compared to tax equivalent net interest income of $58.2 million in 2009, which was a decrease of 4% compared to tax equivalent net interest income of $60.9 million in 2008. The overall tax-equivalent earning asset yield was 5.02% in 2010 compared to 5.51% in 2009 and 6.89% in 2008. For the years 2010, 2009 and 2008, the cost of interest-bearing liabilities was 1.18%, 1.74%, and 2.80%, respectively.
Total interest-earning assets averaged $1.38 billion for the year ended December 31, 2010, compared to $1.42 million for the corresponding period in 2009. The decrease in earning assets was primarily the result of the decrease in gross loans offset by growth in our investment portfolio.
Interest-bearing liabilities averaged $1.11 billion for the year ended December 31, 2010, compared to $1.15 billion for the same period in 2009. The decrease in interest-bearing liabilities was primarily the result of the reduction in higher-cost time deposits. Interest expense, as a percentage of average earning assets, decreased to 0.95% in 2010, compared to 1.41% in 2009 and 2.21% in 2008.
Average gross loans, which generally carry a higher yield than investment securities and other earning assets, comprised 78% of average earning assets during 2010, compared to 86% in 2009 and 97% in 2008. During the same periods, average yields on loans were 5.9% in 2010, 6.14% in 2009, and 6.99% in 2008. Average investment securities comprised 13% of average earning assets in 2010, which was up from 6% in 2009 and 3% in 2008. Tax equivalent interest yields on investment securities were 1.84% for 2010, 1.59% for 2009, and 3.62% for 2008.
During 2008, the Prime Rate dropped 400 basis points, including a 225 basis point drop in the first four months of 2008 and a 175 basis point drop during the last quarter of the year. The rate has remained constant with no further reductions in 2009 or 2010. As a result, our net interest spread increased by 7 basis points between 2010 and 2009 while declining 32 basis points between 2009 and 2008. From a historical perspective, our balance sheet has been asset sensitive. Accordingly, a declining interest rate environment negatively impacts our net interest income absent increases in earning asset volumes or changes in the mix of earning assets or liabilities.
35
Table of Contents
Rate/Volume Analysis
The following table provides an analysis of the net interest income on a tax equivalent basis indicating the impact of changes in the volume of interest-earning assets and interest-bearing liabilities and of changes in yields earned on interest-earning assets and rates paid on interest-bearing liabilities. The values in this table reflect the extent to which changes in interest income and changes in interest expense are attributable to changes in volume (changes in volume multiplied by the prior-year rate) and changes in rate (changes in rate multiplied by prior-year volume). Changes attributable to the combined impact of volume and rate have been allocated to rate.
| 2010 vs. 2009 Increase (Decrease) Due To |
2009 vs. 2008 Increase (Decrease) Due To |
|||||||||||||||||||||||
| Net | Net | |||||||||||||||||||||||
| (Dollars in thousands) | Volume | Rate | Change | Volume | Rate | Change | ||||||||||||||||||
| Interest-earning assets: |
||||||||||||||||||||||||
| Loans |
$ | (8,496 | ) | $ | (2,700 | ) | $ | (11,196 | ) | $ | (2,332 | ) | $ | (10,346 | ) | $ | (12,678 | ) | ||||||
| Investment securities: |
||||||||||||||||||||||||
| Taxable securities |
2,438 | (46 | ) | 2,392 | 1,811 | (517 | ) | 1,294 | ||||||||||||||||
| Nontaxable securities |
108 | (12 | ) | 96 | 10 | (5 | ) | 5 | ||||||||||||||||
| Temporary investments |
52 | (205 | ) | (153 | ) | 2,620 | (2,229 | ) | 391 | |||||||||||||||
| Total |
(5,898 | ) | (2,963 | ) | (8,861 | ) | 2,109 | (13,097 | ) | (10,988 | ) | |||||||||||||
| Interest-bearing liabilities: |
||||||||||||||||||||||||
| Deposits: |
||||||||||||||||||||||||
| Interest-bearing demand and savings |
$ | 56 | (1,930 | ) | (1,874 | ) | $ | 858 | $ | (3,525 | ) | $ | (2,667 | ) | ||||||||||
| Time deposits |
(861 | ) | (3,435 | ) | (4,296 | ) | 3,008 | (8,545 | ) | (5,537 | ) | |||||||||||||
| Other borrowings |
(244 | ) | (479 | ) | (723 | ) | (578 | ) | 176 | (402 | ) | |||||||||||||
| Total |
(1,049 | ) | (5,844 | ) | (6,893 | ) | 3,288 | (11,894 | ) | (8,606 | ) | |||||||||||||
| Net increase (decrease) in net interest income |
$ | (4,849 | ) | $ | 2,881 | $ | (1,968 | ) | $ | (1,179 | ) | $ | (1,203 | ) | $ | (2,382 | ) | |||||||
Loan Loss Provision
The loan loss provision represents charges made against earnings to maintain an adequate allowance for loan losses. The allowance is maintained at an amount believed to be sufficient to absorb probable losses in the loan portfolio and has two components: one of which represents estimated loss reserves based on assigned credit risk ratings for our entire loan portfolio, and the other represents specifically established reserves for individually classified loans. PremierWest applies a systematic process for determining the adequacy of the allowance for loan losses, including an internal loan review program and a quarterly analysis of the adequacy of the allowance. The quarterly analysis includes determination of specific potential loss factors on individual classified loans; historical potential loss factors derived from actual net charge-off experience and trends in nonperforming loans; and potential loss factors for other loan portfolio risks such as loan concentrations, the condition of the local economy, and the nature and volume of loans. The allowance for loan losses correlates to Management’s judgment of the credit risk inherent in the loan portfolio. Factors considered in establishing an appropriate allowance include an assessment of the financial condition of the borrower; a determination of the value and adequacy of underlying collateral; the condition of the local economy and the condition of the specific industry of the borrower; a comprehensive analysis of the levels and trends of loan categories; an assessment of pending legal action for collection of loans and related guarantees; and, a review of delinquent and classified loans. Although Management believes the loan loss provision has been sufficient to maintain an adequate allowance for loan losses, there can be no assurance that actual loan losses will not require significant additional charges to operations in the future.
For the year ended December 31, 2010, the loan loss provision totaled $10.1 million compared to $88.0 million for 2009, and $36.5 million for 2008. This represents a decrease of 89% between 2010 and 2009 and an
36
Table of Contents
increase of 141% between 2009 and 2008. During 2010, the Bank continued to provide to the allowance for loan losses in response to credit issues experienced with a number of our borrowers. During 2010, there was a $7.3 million increase in OREO due to the continued decline in economic conditions. The decline in economic activity continued to be felt throughout the geographic regions in which we conduct our business. Management has continued to focus additional resources to proactively deal with credit relationships that showed indications of strain, and sought and obtained independent validation of our internal evaluations of real estate collateral dependent loans. Management has progressively enhanced the Company’s loan policies and procedures to adjust to the rapidly evolving economic and credit environment, conducted an ongoing and comprehensive analysis of loan portfolio quality, increased the number of credit administration personnel to oversee the consistent application and adherence to established loan policies and procedures and provided training to all lending personnel. A more detailed review of the allowance for loan losses is presented in the table on page 40.
Loan “charge-offs” refer to the recorded values of loans actually removed from the consolidated balance sheet and, after netting out “recoveries” on previously charged-off loans, become “net charge-offs”. PremierWest’s policy is to charge-off loans when, in Management’s opinion, the loan or a portion thereof is deemed uncollectible, although concerted efforts are made to maximize recovery after the charge-off. Management continues to closely monitor the loan quality of new and existing relationships through detailed review and evaluation procedures and by integrating loan officers into such activities.
For the years ended December 31, 2010 and December 31, 2009, loan charge-offs exceeded recoveries by $20.4 million and $59.3 million, respectively. A more detailed review of charge-offs and recoveries is presented in the table on page 41.
Non-interest Income
Non-interest income is primarily comprised of service charges on deposit accounts; mortgage origination fees; investment brokerage and annuity fees; other commissions and fees; and other non-interest income including gains on sales of investment securities. During 2010, non-interest income increased from $11.1 million in 2009 to $11.3 million, an increase of $247,000 or 2%. The increase from the previous year was primarily related to a $646,000 increase in gains on sales of securities; a $540,000 gain on death benefit from bank-owned life insurance; other commissions and fees increased $269,000; offset by a decrease in deposit service charge income and mortgage fee income of $1.4 million. Other non-interest income categories increased $192,000.
During 2009, non-interest income increased from $10.2 million in 2008 to $11.1 million, an increase of $900,000 or 9%. The increase from the previous year was primarily related to increases in other fee income.
In general, Management prices the Bank’s deposit accounts at rates competitive with those offered by other commercial banks in its market area. Growth in deposits and deposit fees have been generated by offering competitive deposit products, cultivating strong customer relationships through competitively superior service and cross-selling deposit products to loan customers.
Non-interest Expense
Non-interest expenses consist principally of salaries and employee benefits, occupancy and equipment costs, communication expenses, professional fees, advertising, cost associated with other real estate owned and foreclosed assets, and other expenses.
During 2010, non-interest expense decreased by $67.7 million or 52% from $129.7 million in 2009 to $62.0 million in 2010. The decrease was primarily due to a one-time non-cash goodwill impairment expense of $74.0 million and $828,000 merger related costs in the prior year. This was offset by a $4.7 million or 189% increase in net cost of Other Real Estate Owned (“OREO”) and foreclosed assets; a $1.0 million or 29% increase in FDIC and state assessments; a $783,000 or 57% increase in third-party loan costs; a $586,000 or 26% increase in
37
Table of Contents
professional fees; a $401,000 or 48% increase in bank insurance costs; a $390,000 or 97% increase in losses on disposals of premises and equipment associated with the planned consolidation and closure of four branches; and a $160,000 or 1% increase in salaries and employee benefits. Other non-interest expense categories also decreased by $892,000.
During 2009, non-interest expense increased $82.6 million or 175% from $47.1 million in 2008 to $129.7 million in 2009. Increased expenses were primarily driven by the one-time non-cash goodwill impairment expense of $74.9 million. Other increases in non-interest expense included $2.6 million, or 244%, in FDIC and state assessments, $1.5 million, or 6% in salaries and employee benefits, $962,000, or 75%, in professional fees, and $579,000, or 253%, in net OREO expense.
Related Party Transactions
Certain officers and directors (and the companies with which they are associated) are customers of, and have had banking transactions with, the Bank in the ordinary course of business. In addition, the Bank expects to continue to have such banking transactions in the future. All loans, and commitments to lend, to such parties are made on the same terms, including interest rates and collateral, as those prevailing at the time for comparable transactions with other persons. In the opinion of Management, these transactions do not involve more than the normal risk of collectability or present any other unfavorable features.
Provision for Income Taxes
The Company’s effective tax rate was -2.77% and included a $134,000 tax provision in federal and state income taxes for 2010. This compares to effective tax rates of 1.53% for 2009 and 42.15% for 2008. The increase in the effective tax rate is the result of Oregon minimum tax.
The determination of our ability to fully utilize our deferred tax assets requires significant judgment, the use of estimates and the interpretation of complex tax laws. The Company has determined that it is “more likely than not” that we will not be able to fully recognize all of our deferred tax assets. As such, we have written them down to the net realizable value. Prospectively, as the Company continues to evaluate available evidence, including the depth of the current economic downturn and its implications on its operating results, it is possible that the Company may deem some or all of its deferred income tax assets to be realizable.
Efficiency Ratio
Banks use the term “efficiency ratio” to describe the relationship of administrative and other costs associated with generating revenues to certain elements of income, a concept similar to a measurement of overhead. The efficiency ratio is computed by dividing non-interest expense by the sum of net interest income plus non-interest income.
For the year ended December 31, 2010, our efficiency ratio was 92.23% as compared to 188.01%, and 66.76% in 2009 and 2008, respectively. Our efficiency ratio in 2009 without the goodwill impairment would have been 79.42%.
Generally, lower efficiency ratios reflect greater cost containment; however, the success of PremierWest’s community banking strategy necessitates a balance between expense control and the need to maintain high levels of customer service and effective risk management. Accordingly, PremierWest staffs its branches in a manner to support its high standards for delivering exceptional customer service and maintains the necessary administrative personnel to support the desired customer service while maintaining effective risk management through internal control functions such as credit administration, internal audit and compliance.
38
Table of Contents
FINANCIAL CONDITION
The table below sets forth certain summary balance sheet information for December 31, 2010, 2009 and 2008.
| December 31, | Increase (Decrease) December 31, | |||||||||||||||||||||||||||
| 2010 | 2009 | 2008 | 2010 – 2009 | 2009 – 2008 | ||||||||||||||||||||||||
| (Dollars in thousands) | ||||||||||||||||||||||||||||
| ASSETS |
||||||||||||||||||||||||||||
| Federal funds sold |
$ | 3,085 | $ | 69,855 | $ | 165 | $ | (66,770 | ) | (95.58 | )% | $ | 69,690 | 42236.36 | % | |||||||||||||
| Investment securities |
214,816 | 162,321 | 36,404 | 52,495 | 32.34 | % | 125,917 | 345.89 | % | |||||||||||||||||||
| Restricted equity investments |
3,474 | 3,643 | 3,643 | (169 | ) | (4.64 | )% | — | 0.00 | % | ||||||||||||||||||
| Loans, net |
941,213 | 1,102,224 | 1,229,416 | (161,011 | ) | (14.61 | )% | (127,192 | ) | (10.35 | )% | |||||||||||||||||
| Other assets (1) |
248,632 | 198,271 | 206,326 | 50,361 | 25.40 | % | (8,055 | ) | (3.90 | )% | ||||||||||||||||||
| Total assets |
$ | 1,411,220 | $ | 1,536,314 | $ | 1,475,954 | $ | (125,094 | ) | (8.14 | )% | $ | 60,360 | 4.09 | % | |||||||||||||
| LIABILITIES |
||||||||||||||||||||||||||||
| Noninterest-bearing deposits |
$ | 242,631 | $ | 256,167 | $ | 228,788 | $ | (13,536 | ) | (5.28 | )% | $ | 27,379 | 11.97 | % | |||||||||||||
| Interest-bearing deposits |
1,023,618 | 1,164,595 | 982,481 | (140,977 | ) | (12.11 | )% | 182,114 | 18.54 | % | ||||||||||||||||||
| Total deposits |
1,266,249 | 1,420,762 | 1,211,269 | (154,513 | ) | (10.88 | )% | 209,493 | 17.30 | % | ||||||||||||||||||
| Other liabilities (2) |
47,963 | 44,017 | 87,701 | 3,946 | 8.96 | % | (43,684 | ) | (49.81 | )% | ||||||||||||||||||
| Total liabilities |
1,314,212 | 1,464,779 | 1,298,970 | (150,567 | ) | (10.28 | )% | 165,809 | 12.76 | % | ||||||||||||||||||
| SHAREHOLDERS’ EQUITY |
97,008 | 71,535 | 176,984 | 25,473 | 35.61 | % | (105,449 | ) | (59.58 | )% | ||||||||||||||||||
| Total liabilities and share-holder’s equity |
$ | 1,411,220 | $ | 1,536,314 | $ | 1,475,954 | $ | (125,094 | ) | (8.14 | )% | $ | 60,360 | 4.09 | % | |||||||||||||
| (1) | Include cash and due from banks, mortgage loans held-for-sale, property and equipment, accrued interest receivable, goodwill, intangible assets and other assets. |
| (2) | Includes federal funds purchased, borrowings, accrued interest payable and other liabilities. |
Investment Portfolio
Investment securities provide a return on residual funds after lending activities. Investments may be in interest-bearing deposits, U.S. government and agency obligations, state and local government obligations or government-guaranteed, mortgage-backed securities. PremierWest generally does not invest in securities that are rated less than investment grade by a nationally recognized statistical rating organization. All securities-related investment activity is reported to the Board of Directors. Board review is required for significant changes in investment strategy. Certain senior executives have the authority to purchase and sell securities for our portfolio in accordance with PremierWest’s Funds Management policy.
Management determines the appropriate classification of securities at the time of purchase. If Management has the intent and PremierWest has the ability at the time of purchase to hold a security until maturity or on a long-term basis, the security is classified as “held-to-maturity” and is reflected on the balance sheet at historical cost. Securities to be held for indefinite periods and not intended to be held to maturity or on a long-term basis are classified as “available-for-sale.” Available-for-sale securities are reflected on the balance sheet at their estimated fair market value. An outside broker service provides the fair market value for the available-for-sale securities using Level 2 inputs that are fair values for investment securities based on quoted market prices or the market values for comparable securities.
39
Table of Contents
The following table sets forth the carrying value of PremierWest’s investment portfolio at the dates indicated.
| December 31, | ||||||||||||
| (Dollars in thousands) | 2010 | 2009 | 2008 | |||||||||
| Investment securities (available-for sale) |
||||||||||||
| Collateralized mortgage obligations |
$ | 132,217 | $ | 76,957 | $ | — | ||||||
| Mortgage-backed securities |
9,056 | 4,301 | 188 | |||||||||
| U.S. Government and agency securities |
36,276 | 27,794 | — | |||||||||
| Obligations of states and political subdivisions |
6,134 | 5,885 | — | |||||||||
| 183,683 | 114,937 | 188 | ||||||||||
| Investment securities (held-to-maturity) |
||||||||||||
| Collateralized mortgage obligations |
$ | — | $ | — | $ | — | ||||||
| Mortgage-backed securities |
4,781 | 5,807 | 1799 | |||||||||
| U.S. Government and agency securities |
12,151 | 28,238 | 27,496 | |||||||||
| Obligations of states and political subdivisions |
12,201 | 9,339 | 2,921 | |||||||||
| 29,133 | 43,384 | 32,216 | ||||||||||
| Investment securities—CRA |
2,000 | 4,000 | 4,000 | |||||||||
| Restricted equity securities |
3,474 | 3,643 | 3,643 | |||||||||
| Total investment securities |
$ | 218,290 | $ | 165,964 | $ | 40,047 | ||||||
The contractual maturities of investment securities at December 31, 2010, excluding mortgage-related securities, investment securities—CRA and restricted equity securities for which contractual materials are diverse or nonexistent, are shown below. Actual maturities of investment securities could differ from contractual maturities because the borrower, or issuer, may have the right to call or prepay obligations with or without call or prepayment penalties.
| 2010 | 2009 | 2008 | ||||||||||||||||||||||||||||||||||
| Amortized Cost |
Estimated Fair Value |
% Yield (1) |
Amortized Cost |
Estimated Fair Value |
% Yield (1) |
Amortized Cost |
Estimated Fair Value |
% Yield (1) |
||||||||||||||||||||||||||||
| (Dollars in thousands) | ||||||||||||||||||||||||||||||||||||
| U.S. Government and agency securities: |
||||||||||||||||||||||||||||||||||||
| One year or less |
$ | 7,832 | $ | 7,832 | 1.26 | % | $ | 3,992 | $ | 4,035 | 2.92 | % | $ | 12,133 | $ | 12,309 | 2.85 | % | ||||||||||||||||||
| One to five years |
40,690 | 40,973 | 1.61 | % | 35,907 | 36,175 | 2.20 | % | 15,363 | 15,606 | 2.85 | % | ||||||||||||||||||||||||
| Five to ten years |
— | — | — | 16,000 | 15,983 | 3.75 | % | — | — | — | ||||||||||||||||||||||||||
| Obligations of states and political subdivisions: |
||||||||||||||||||||||||||||||||||||
| One year or less |
— | — | — | 261 | 261 | 6.03 | % | 643 | 642 | 6.38 | % | |||||||||||||||||||||||||
| One to five years |
3,154 | 3,192 | 5.38 | % | 3,542 | 3,600 | 4.12 | % | 906 | 904 | 5.68 | % | ||||||||||||||||||||||||
| Five to ten years |
5,123 | 5,067 | 5.19 | % | 2,775 | 2,733 | 4.88 | % | 1,372 | 1,374 | 6.81 | % | ||||||||||||||||||||||||
| Over ten years |
9,933 | 10,072 | 5.75 | % | 8,805 | 8,595 | 5.02 | % | — | — | — | |||||||||||||||||||||||||
| Total debt securities |
66,732 | 67,136 | 71,282 | 71,382 | 30,417 | 30,835 | ||||||||||||||||||||||||||||||
| Collateralized mortgage obligations |
$ | 131,372 | $ | 132,217 | 2.86 | % | $ | 75,843 | $ | 76,957 | 3.07 | % | $ | — | $ | — | ||||||||||||||||||||
| Mortgaged-backed securities |
13,804 | 13,945 | 3.93 | % | 10,003 | 10,134 | 4.32 | % | 1,987 | 2,039 | 5.51 | % | ||||||||||||||||||||||||
| Investment securities—CRA |
2,000 | 2,000 | nm | 4,000 | 4,000 | nm | 4,000 | 4,000 | nm | |||||||||||||||||||||||||||
| Restricted equity securities |
3,474 | 3,474 | nm | 3,643 | 3,643 | nm | 3,643 | 3,643 | nm | |||||||||||||||||||||||||||
| Total securities |
$ | 217,382 | $ | 218,772 | $ | 164,771 | $ | 166,116 | $ | 40,047 | $ | 40,517 | ||||||||||||||||||||||||
| (1) | For the purposes of this schedule, weighted average yields are stated on an approximate tax-equivalent basis at a 40% rate. |
nm = non meaningful
40
Table of Contents
During 2010, we purchased $193.5 million in additional securities. This compares to purchases of $190.5 million and $29.6 million in 2009 and 2008, respectively. During 2010, $139.2 million in securities matured, were called, sold or were paid down. This compares to sales, maturities and/or calls of investment securities of $64.8 million in 2009, and $30.1 million in 2008. During 2010, we reported realized gains of $732,000 and $50,000 in 2009. No security sales were reported during 2008.
At December 31, 2010 PremierWest’s investment portfolio had total net unrealized gains of approximately $1.4 million. This compares to net unrealized gains of approximately $1.3 million at December 31, 2009, and $470,000 at December 31, 2008. Unrealized gains and losses reflect the impact on security values from changes in market interest rates and do not represent the amount of actual profits or losses that may be recognized by the Bank. Actual realized gains and losses occur at the time investment securities are sold or called. Because the decline in fair value is attributable to the changes in interest rates and not credit quality, and because the Bank does not intend to sell the securities in this class and it is not likely that the Bank will be required to sell these securities before recovery of their amortized cost bases, which may include holding each security until maturity, the unrealized losses on these investments are not considered other-than-temporarily impaired.
Securities may be pledged from time-to-time to secure public deposits, FHLB borrowings, repurchase agreement deposit accounts, or for other purposes as required or permitted by law. At December 31, 2010, securities with a market value of $210.0 million were pledged for such purposes.
As of December 31, 2010, PremierWest also held 15,881 shares of $100 par value Federal Home Loan Bank of Seattle (FHLB) stock, which is a restricted equity security. FHLB stock represents an equity interest in the FHLB, but it does not have a readily determinable market value. The stock can be sold at its par value only, and only to the FHLB or to another member institution. Member institutions are required to maintain a minimum stock investment in the FHLB based on specific percentages of their outstanding mortgages, total assets or FHLB advances. At December 31, 2010 and 2009, the Bank met its minimum required investment in FHLB. In addition to FHLB stock, PremierWest bank holds 13,484 shares of stock in the Federal Home Loan Bank of San Francisco. This stock was acquired pursuant to the acquisition of Stockmans Bank and reflects its required minimum stock investment in Federal Home Loan Bank of San Francisco, which must be maintained for a four-year period. The Company is required to hold FHLB’s stock in order to receive advances and views this investment as long-term. In addition, PremierWest also held 200 shares of $1.00 par value Federal Agricultural Mortgage Corporation stock valued at $8,000 that was acquired with the acquisition of Stockmans Bank.
The Bank also owns stock in Pacific Coast Banker’s Bank (PCBB) with a balance of $529,000 in 2010. This investment is carried at its fair market value at acquisition and is included in restricted equity investments on the balance sheet. PCBB operates under a special purpose charter to provide wholesale correspondent banking services to depository institutions. By statute, 100% of PCBB’s outstanding stock is held by depository institutions that utilize its correspondent banking services.
Loan Portfolio
The most significant asset on our balance sheet in terms of risk and the effect on our earnings is our loan portfolio. On our balance sheet, the term “net loans” refers to total loans outstanding, at their principal balance outstanding, net of the allowance for loan losses, deferred loan fees and deferred concessions. PremierWest’s loan policies and procedures establish the basic guidelines governing our lending operations. Generally, the guidelines address the types of loans that we seek, loan concentrations, our target markets, underwriting and collateral requirements, terms, interest rate and yield considerations, and compliance with laws and regulations. All loans or credit lines are subject to approval procedures and limitations as to amounts. These limitations apply to the borrower’s total outstanding indebtedness to the Bank, including the indebtedness of the borrower in a guarantor capacity. The policies are reviewed and approved by the Board of Directors of PremierWest on a routine basis.
41
Table of Contents
Bank officers are charged with loan origination in compliance with underwriting standards overseen by the credit administration department and in conformity with established loan policies. On an as needed but not less than annual basis, the Board of Directors determines the lending authority of the Bank’s loan officers. Such delegated authority may include authority related to loans, letters of credit, overdrafts, uncollected funds, and such other authority as determined by the Board, the President and Chief Executive Officer, or Chief Credit Officer within their own delegated authority.
The Chief Credit Officer has the authority to approve loans up to a $5 million lending limit as set by the Board of Directors. All loans above the lending limit of the Chief Credit Officer, and up to a $7.5 million lending limit, may be approved jointly by the Chief Credit Officer along with a Credit Committee member. Loans that exceed this limit are subject to the review and approval by the Board’s Credit Committee. Credit Committee approval is required for credit extensions rated substandard or worse. PremierWest’s unsecured legal lending limit was approximately $21.0 million and our real estate secured lending limit was approximately $35.1 million at December 31, 2010.
The following table sets forth the composition of the loan portfolio, as of December 31, 2006 through December 31, 2010:
| Years Ended December 31, | ||||||||||||||||||||||||||||||||||||||||
| 2010 | 2009 | 2008 | 2007 | 2006 | ||||||||||||||||||||||||||||||||||||
| (Dollars in thousands) | Amount | Percen- tage |
Amount | Percen- tage |
Amount | Percen- tage |
Amount | Percen- tage |
Amount | Percen- tage |
||||||||||||||||||||||||||||||
| Commercial |
$ | 156,482 | 15.99 | % | $ | 209,538 | 18.24 | % | $ | 252,377 | 20.22 | % | $ | 244,156 | 23.81 | % | $ | 219,426 | 23.81 | % | ||||||||||||||||||||
| Real estate—Construction |
123,707 | 12.64 | % | 211,732 | 18.43 | % | 280,219 | 22.45 | % | 268,254 | 26.16 | % | 259,254 | 28.13 | % | |||||||||||||||||||||||||
| Real Estate—Commercial/ Residential |
579,493 | 59.22 | % | 596,007 | 51.86 | % | 574,677 | 46.05 | % | 405,663 | 39.57 | % | 360,372 | 39.09 | % | |||||||||||||||||||||||||
| Consumer |
80,004 | 8.18 | % | 86,504 | 7.53 | % | 89,715 | 7.19 | % | 75,395 | 7.35 | % | 53,542 | 5.81 | % | |||||||||||||||||||||||||
| Agriculture and other |
38,860 | 3.97 | % | 45,246 | 3.94 | % | 51,000 | 4.09 | % | 31,861 | 3.11 | % | 29,100 | 3.16 | % | |||||||||||||||||||||||||
| Total gross loans |
$ | 978,546 | 100.00 | % | $ | 1,149,027 | 100.00 | % | $ | 1,247,988 | 100.00 | % | $ | 1,025,329 | 100.00 | % | $ | 921,694 | 100.00 | % | ||||||||||||||||||||
Gross loans totaled $978.5 million at December 31, 2010, compared to $1.15 billion as of December 31, 2009 representing a 15% decrease. The decline was primarily a result of loan pay downs, net of originations and recoveries, of $114.1 million; transfers to OREO of $30.6 million; and $26.6 million in loan charge-offs. Unfunded loan commitments and standby letters of credit were $82.0 million as of December 31, 2010, representing a decrease of $43.8 million from total unfunded loan commitments at December 31, 2009. For a more detailed discussion of off-balance sheet arrangements, see Note 16 to the financial statements included in this report.
As indicated above, the Company’s loan portfolio has been concentrated in commercial real estate loans and commercial real estate loans for residential purposes during recent years, a common characteristic among community banks due to focused lending for business and consumer needs in communities within the Bank’s market area. Some commercial loans are secured by real estate, but funds are used for purposes other than financing the purchase of real property, such as inventory financing and equipment purchases, where real property serves as collateral for the loan. Loans of this type are characterized as real estate loans because of the real estate collateral.
Since 2006, Management has taken actions in an attempt to reduce higher risk commercial real estate loan volume by directing efforts away from new commercial real estate loan production. However, the amount of commercial real estate loans remains above what Management considers desirable levels, particularly in light of current conditions. Economic circumstances have produced significant reductions in real estate values, and the
42
Table of Contents
slowdown has resulted in business failures that have adversely affected commercial real estate activities. Consequently, Management actively pursues additional credit support and appropriate exit strategies for commercial real estate loans that have suffered or are anticipated to encounter difficulties. As a result of measures taken to reduce commercial real estate loan volumes, these loans decreased by $16.5 million during 2010.
The table below shows total loan commitments (funded and unfunded) by loan type and geographic region at December 31, 2010:
| (Dollars in thousands) | December 31, 2010 | |||||||||||||||||||
| Southern Oregon |
Mid-Central Oregon |
Northern California |
Sacramento Valley |
Total | ||||||||||||||||
| Agricultural/Farm |
$ | 11,550 | $ | 2,931 | $ | 1,330 | $ | 29,482 | $ | 45,293 | ||||||||||
| C&I |
108,397 | 41,722 | 28,147 | 31,693 | 209,959 | |||||||||||||||
| CRE |
300,907 | 140,457 | 72,625 | 142,516 | 656,505 | |||||||||||||||
| Residential RE construction |
5,439 | 2,670 | 2,038 | 7,610 | 17,757 | |||||||||||||||
| Residential RE |
7,888 | 2,303 | 7,383 | 11,565 | 29,139 | |||||||||||||||
| Consumer RE |
28,028 | 7,970 | 11,142 | 2,400 | 49,540 | |||||||||||||||
| Consumer |
21,604 | 23,620 | 5,491 | 991 | 51,706 | |||||||||||||||
| Subtotal |
483,813 | 221,673 | 128,156 | 226,257 | 1,059,899 | |||||||||||||||
| Other* |
— | — | — | — | 670 | |||||||||||||||
| Total |
$ | 483,813 | $ | 221,673 | $ | 128,156 | $ | 226,257 | $ | 1,060,569 | ||||||||||
| * | Comprised of credit cards, overdrafts, leases and other adjustments such as loan premiums, etc. |
The following table presents maturity and re-pricing information for the loan portfolio at December 31, 2010. The table segments the loan portfolio between fixed-rate and adjustable-rate loans and their respective re-pricing intervals based on fixed-rate loan maturity dates and variable-rate loan re-pricing dates for the periods indicated:
| December 31, 2010 | ||||||||||||||||
| (Dollars in thousands) | Within One Year (1) |
One to Five Years |
After Five Years |
Total | ||||||||||||
| Fixed-rate loan maturities |
||||||||||||||||
| Commercial |
$ | 19,735 | $ | 20,364 | $ | — | $ | 40,099 | ||||||||
| Real estate—Construction |
76,585 | 2,779 | 45 | 79,409 | ||||||||||||
| Real estate—Commercial/Residential |
80,457 | 73,817 | 5,064 | 159,338 | ||||||||||||
| Consumer |
15,292 | 30,129 | 6,541 | 51,962 | ||||||||||||
| Other |
3,152 | 1,349 | — | 4,501 | ||||||||||||
| Total fixed rate loan maturities |
195,221 | 128,438 | 11,650 | 335,309 | ||||||||||||
| Adjustable-rate loan maturities |
||||||||||||||||
| Commercial |
95,310 | 21,073 | — | 116,383 | ||||||||||||
| Real estate—Construction |
42,419 | 1,879 | — | 44,298 | ||||||||||||
| Real estate—Commercial/Residential |
218,072 | 202,083 | — | 420,155 | ||||||||||||
| Consumer |
28,042 | — | — | 28,042 | ||||||||||||
| Other |
31,359 | 3,000 | — | 34,359 | ||||||||||||
| Total adjustable-rate loan repricings |
415,202 | 228,035 | — | 643,237 | ||||||||||||
| Total maturities and repricings |
$ | 610,423 | $ | 356,473 | $ | 11,650 | $ | 978,546 | ||||||||
43
Table of Contents
Credit Quality
Management is committed to a credit culture that emphasizes quality underwriting standards and provides for the effective monitoring of loan quality and aggressive resolution to problem loans. Total nonperforming assets as defined in the table below were $161.6 million at December 31, 2010, up from $128.7 million as of December 31, 2009. The nonperforming asset total includes $32.0 million in other real estate owned as of December 31, 2010 as compared to $24.7 million at the previous year end. Nonperforming assets amounted to 11.45% of total assets outstanding at December 31, 2010, up from 8.37% at December 31, 2009, and are primarily a result of the continued economic disruption that began during 2008. Interest income that would have been recognized on non-accrual loans if such loans had performed in accordance with their contractual terms totaled $10.3 million for the year ended December 31, 2010, $9.1 million for the year ended December 31, 2009, and $4.7 million for the year ended December 31, 2008. Actual interest income recognized on such loans on a cash basis during 2010 was approximately $183,000, and $528,000 and $626,000 in 2009 and 2008, respectively.
The following table summarizes nonperforming assets by category:
| December 31, | ||||||||||||||||||||
| (Dollars in thousands) | 2010 | 2009 | 2008 | 2007 | 2006 | |||||||||||||||
| Loans on nonaccrual status |
$ | 129,493 | $ | 98,497 | $ | 68,496 | $ | 8,221 | $ | 1,430 | ||||||||||
| Loans past due greater than 90 days but not on nonaccrual status |
123 | 5,420 | 1,437 | 147 | 24 | |||||||||||||||
| Total non-performing loans |
129,616 | 103,917 | 69,933 | 8,368 | 1,454 | |||||||||||||||
| Impaired loans in process of collection |
— | — | 12,682 | — | — | |||||||||||||||
| Other real estate owned and foreclosed assets |
32,009 | 24,748 | 4,423 | — | — | |||||||||||||||
| Total nonperforming assets |
$ | 161,625 | $ | 128,665 | $ | 87,038 | $ | 8,368 | $ | 1,454 | ||||||||||
| Percentage of nonperforming assets to total assets |
11.45 | % | 8.37 | % | 5.90 | % | 0.73 | % | 0.14 | % | ||||||||||
Regulatory guidance and current accounting practice is to value all non-performing assets at current appraised value less estimated costs to sell without regard to other factors or documentation. Management continues to work closely with borrowers who are motivated to resolve their financial issues through properly collateralized restructures and workouts. Management continually reviews the holding costs of certain other real estate owned in light of current market conditions.
Nonperforming Loans
Management considers a loan to be nonperforming when it is 90 days or more past due, or sooner if the Bank has determined that repayment of the loan in full is unlikely. For commercial purpose loans, interest accrual ceases when 90 days past due (but no later than the date of acquisition by foreclosure, voluntary deed or other means) and the loan is classified as nonperforming. For consumer purpose loans, interest accrual ceases when 120 days past due. A loan placed on non-accrual status may or may not be contractually past due at the time the determination is made to place the loan on non-accrual status, and it may or may not be secured. When a loan is placed on non-accrual status, it is the Bank’s policy to reverse interest previously accrued but uncollected.
In some instances where the loans are well secured and in the process of collection, such loans will not be placed on non-accrual status. In addition, loans that are impaired pursuant to “Accounting by Creditors for the Impairment of a Loan,” are classified as non-accrual consistent with regulatory guidance. Loans placed on non-accrual status typically remain so until all principal and interest payments are brought current, and the potential for future payments, in accordance with associated loan agreements, appears reasonably certain.
Impaired loans are defined as loans where full recovery of contractual principal and interest is in doubt and include all non-accrual and restructured commercial and real estate loans. The dollar amount of loan impairment
44
Table of Contents
is determined using either the present value of expected future cash flows discounted at the loan’s effective interest rate, the fair value of the collateral of an impaired collateral-dependent loan or an observable market price. Current accounting practice and regulatory guidance places primary emphasis on appraised value for collateral dependent loans. Loan impairment is typically recognized through a charge to the allowance for loan losses reflecting any shortfall between the principal balance owing and the net realizable value of the loan.
At December 31, 2010 and 2009, nonperforming loans (loans 90 days or more delinquent and/or on non-accrual status) totaled approximately $129.6 million and $103.9 million, respectively. The large dollar increase in nonperforming loans between 2010 and 2009 is concentrated in real estate collateralized loans, and is primarily comprised of construction and commercial real estate credits. Management has assessed the real estate collateral for impairment and charged off any impairment on real estate collateral dependent loans. On all other real estate collateralized loans, Management believes that, based on current appraisals or estimates based on the most recent available appraisals discounted for aging, adequate collateral coverage existed as of each year end.
The following table summarizes the Company’s non-performing loans by loan type and geographic region as of December 31, 2010:
| Total non-performing loans by type and (Dollars in 000’s) |
||||||||||||||||||||||||||||
| December 31, 2010 | ||||||||||||||||||||||||||||
| Non-performing Loans | Funded Loan Totals* |
Percent NPL to Funded Loan Totals by Category |
||||||||||||||||||||||||||
| Southern Oregon |
Mid-Central Oregon |
Northern California |
Sacramento Valley |
Totals | ||||||||||||||||||||||||
| Agricultural and other |
$ | 383 | $ | 2,104 | $ | 50 | $ | — | $ | 2,537 | $ | 38,860 | 6.5 | % | ||||||||||||||
| C&I |
1,815 | 5,443 | 1,293 | — | 8,551 | $ | 156,482 | 5.5 | % | |||||||||||||||||||
| CRE |
54,488 | 21,400 | 7,296 | 17,663 | 100,847 | $ | 550,524 | 18.3 | % | |||||||||||||||||||
| Residential RE construction |
166 | 1,988 | 2,106 | 2,087 | 6,347 | $ | 123,707 | 5.1 | % | |||||||||||||||||||
| Residential RE |
403 | 553 | 2,754 | 6,466 | 10,176 | $ | 28,969 | 35.1 | % | |||||||||||||||||||
| Consumer RE |
787 | 160 | 62 | — | 1,009 | $ | 32,177 | 3.1 | % | |||||||||||||||||||
| Consumer* |
42 | 86 | 21 | — | 149 | $ | 47,827 | 0.3 | % | |||||||||||||||||||
| Total |
$ | 58,084 | $ | 31,734 | $ | 13,582 | $ | 26,216 | $ | 129,616 | $ | 978,546 | ||||||||||||||||
| Non-performing loans to total funded loans |
13.0 | % | 15.6 | % | 11.4 | % | 12.5 | % | 13.2 | % | ||||||||||||||||||
| Total funded loans |
$ | 446,484 | $ | 203,364 | $ | 119,576 | $ | 209,122 | $ | 978,546 | ||||||||||||||||||
| * | Includes overdrafts, leases and other adjustments such as deferred loan fees, etc. |
The Company’s principal source of non-performing loans is real estate related loans. Borrowers either involved in real estate or having secured loans with real estate have been vulnerable to both the ongoing economic downturn and to declining real estate collateral values. Approximately 91% or $117.4 million of our non-performing loan total of $129.6 million is directly related to real estate in the form of commercial or residential real estate loans. At December 31, 2010, $70.1 million of our real estate related loans remain current as to contractual principal and interest payments, but were placed on non-accrual status due to the absence of evidence supporting the borrowers’ ongoing ability to fully discharge their loan obligations.
45
Table of Contents
The following table summarizes the Company’s non-accrual loan volume by type and as a percent of the related loan portfolio as of December 31, 2010 and 2009:
| December 31, | ||||||||||||||||
| 2010 | 2009 | |||||||||||||||
| (Dollars in thousands) | Amount | % of Related Portfolio |
Amount | % of Related Portfolio |
||||||||||||
| Commercial |
$ | 8,551 | 5.46 | % | $ | 5,175 | 2.47 | % | ||||||||
| Real estate—Construction |
70,118 | 56.68 | % | 65,477 | 30.92 | % | ||||||||||
| Real estate—Commercial/Residential |
47,252 | 8.15 | % | 26,986 | 4.53 | % | ||||||||||
| Consumer |
1,035 | 1.29 | % | 177 | 0.20 | % | ||||||||||
| Other |
2,537 | 6.53 | % | 682 | 1.51 | % | ||||||||||
| Total |
$ | 129,493 | 13.23 | % | $ | 98,497 | 8.57 | % | ||||||||
The following table summarizes the Company’s troubled debt restructured loans by type and geographic region as of December 31, 2010:
| Restructured loans by type and geographic region (Dollars in 000’s) |
||||||||||||||||||||
| December 31, 2010 | ||||||||||||||||||||
| Restructured loans | ||||||||||||||||||||
| Southern Oregon |
Mid-Central Oregon |
Northern California |
Sacramento Valley |
Totals | ||||||||||||||||
| Commercial |
$ | — | $ | — | $ | — | $ | 224 | $ | 224 | ||||||||||
| Real Estate—Construction |
713 | 3,150 | 432 | 7,931 | 12,226 | |||||||||||||||
| Real Estate—Commercial/Residential |
29,470 | — | 787 | 2,527 | 32,784 | |||||||||||||||
| Total restructured loans |
$ | 30,183 | $ | 3,150 | $ | 1,219 | $ | 10,682 | $ | 45,234 | ||||||||||
The following table summarizes the Company’s troubled debt restructured loans by year of maturity, according to the restructured terms, as of December 31, 2010:
| 2011 |
$ | 26,408 | ||
| 2012 |
15,535 | |||
| 2013 |
3,291 | |||
| Total |
$ | 45,234 | ||
Continuing actions taken to address the troubled credit situation include:
| • | Credit monitoring activities have escalated since the beginning of the fourth quarter of 2008 to provide early warning of possible borrower distress that could lead to loan payment defaults. Enhanced credit monitoring and early warnings are intended to provide additional time to seek viable alternatives with the borrower. Management and staff are actively involved in seeking loan restructuring and other loan modification options including obtaining additional collateral coverage for those borrowers who have experienced payment problems and wish to seek a workable arrangement with the Company. The Company established an Asset Recovery Group (“ARG”) to interface both directly with borrowers and with line managers to expedite resolution of existing and potential troubled credits. As of December 31, 2010, the ARG had 13 staff members. We believe that these actions have and will continue to facilitate recovery strategies with cooperative borrowers. In those instances where alternatives have been exhausted or determined to be impractical and default under the terms of the loans has occurred, foreclosure actions are pursued. |
46
Table of Contents
| • | Enhanced the quarterly watch loan review process to focus on higher dollar credits rated watch or worse not, managed by ARG. |
| • | Improved risk rating recertification to include relevant credit metrics in support of the risk rating |
| • | Provided quantitative risk rating tools and training to all lenders or loan officers to improve risk rating accuracy and consistency |
| • | Improved credit risk transparency and oversight through the development of a comprehensive portfolio review package including the monitoring of relevant credit metrics |
| • | Internal credit examinations are completed on a significant portion of our loan portfolio periodically during the year. |
A continued decline in economic conditions in our market areas and nationally, as well as other factors, could adversely impact individual borrowers or our loan portfolio in general. As a result, we can provide no assurance that additional loans will not become 90 days or more past due, become impaired or be placed on non-accrual status, restructured or transferred to other real estate owned in the future. Additional information regarding our loan portfolio is provided in Note 6 of the Notes to the Condensed Consolidated Financial Statements.
Other Real Estate Owned and Foreclosed Assets
When the Bank acquires real estate through foreclosure, voluntary deed, or similar means, it is classified as OREO until it is sold. On December 31, 2010, and December 31, 2009 there was $32.0 million and $24.7 million in other real estate owned, respectively. Foreclosed properties included as OREO are recorded at the lower of the carrying value or fair value less the cost to sell, which becomes the property’s new basis. Any write-downs based on the asset’s fair value at the date of acquisition are charged to the allowance for loan losses. After foreclosure, management periodically performs valuations such that the real estate is carried at the lower of its new cost basis or fair value, net of estimated costs to sell. Fair value adjustments on OREO are recorded as a net loss or gain, as appropriate. These losses represent impairments on OREO for fair value adjustments based on the fair value of the real estate.
The balance of OREO has fluctuated during the years ended December 31, 2010 and 2009, as illustrated in the table below:
| Other real estate owned and foreclosed assets (Dollars in thousands) |
||||||||
| Twelve Months Ended December 31, |
||||||||
| 2010 | 2009 | |||||||
| Other real estate owned, beginning of period |
$ | 24,748 | $ | 4,423 | ||||
| Transfers from outstanding loans |
30,619 | 28,303 | ||||||
| Improvements and other additions |
464 | 671 | ||||||
| Proceeds from sales |
(20,210 | ) | (7,485 | ) | ||||
| Gain on sales |
1,735 | 343 | ||||||
| Impairment charges |
(5,347 | ) | (1,507 | ) | ||||
| Total other real estate owned |
$ | 32,009 | $ | 24,748 | ||||
Allowance for Loan Losses
The allowance for loan losses represents the Company’s estimate as to the probable credit losses inherent in its loan portfolio. The allowance for loan losses is increased through periodic charges to earnings through provision for loan losses and represents the aggregate amount, net of loans charged-off and recoveries on previously charged-off loans, that is needed to establish an appropriate reserve for credit losses. The allowance is estimated based on a variety of factors and using a methodology as described below:
47
Table of Contents
| • | The Company classifies loans into relatively homogeneous pools by loan type in accordance with regulatory guidelines for regulatory reporting purposes. The Company regularly reviews all loans within each loan category to establish risk ratings for them that include Pass, Watch, Special Mention, Substandard, Doubtful and Loss. Pursuant to “Accounting for Creditors for Impairment of a Loan”, the impaired portion of collateral dependent loans is charged-off. Other risk-related loans not considered impaired have loss factors applied to the various loan pool balances to establish loss potential for provisioning purposes. |
| • | Analyses are performed to establish the loss factors based on historical experience, as well as, expected losses based on qualitative evaluations of such factors as the economic trends and conditions, industry conditions, levels and trends in delinquencies and impaired loans, levels and trends in charge-offs and recoveries, among others. The loss factors are applied to loan category pools segregated by risk classification to estimate the loss inherent in the Company’s loan portfolio pursuant to “Accounting for Contingencies.” |
| • | Additionally, impaired loans are evaluated for loss potential on an individual basis in accordance with “Accounting for Creditors for Impairment of a Loan,” and specific reserves are established based on thorough analysis of collateral values where loss potential exists. When an impaired loan is collateral dependent and a deficiency exists in the fair value of real estate collateralizing the loan in comparison to the associated loan balance, the deficiency is charged-off at that time. Impaired loans are reviewed no less frequently than quarterly. |
| • | Generally, external appraisals are updated every six to twelve months. We obtain appraisals from a pre-approved list of independent, third party appraisal firms. Approval and addition to the list is based on experience, reputation, character, consistency and knowledge of the respective real estate market. At a minimum, it is ascertained that the appraiser is: (a) currently licensed in the state in which the property is located, (b) is experienced in the appraisal of properties similar to the property being appraised, (c) is actively engaged in the appraisal work, (d) has knowledge of the current real estate market conditions and financing trends, (e) is reputable, and (f) is not on the Bank’s exclusionary list of appraisers. Our Appraisal Review Department will either conduct the review, or will outsource the review to a qualified approved third party appraiser. Upon receipt and review, an external appraisal is utilized to measure a loan for potential impairment. Our impairment analysis documents the date of the appraisal used in the analysis, whether the preparer deems the appraisal to be current, and if not, allows for an internal valuation adjustments with justification. Adjustments may include discounts for continued market deterioration subsequent to appraisal date, adjustments for the release of collateral contemplated in the appraisal, or the value of other collateral or consideration not contemplated in the appraisal. An appraisal over one year old in most cases will be considered stale dated and an updated or new appraisal will be required. Any adjustments from appraised value to net realizable value are detailed and justified in the impairment analysis and reflected in the allowance for loan losses, as appropriate. Although an external appraisal is the primary source to value collateral dependent loans, we may also utilize values obtained through purchase and sale agreements, negotiated short sales, or the sales price of the note. These alternative sources of value are used only if deemed to be more representative of value based on updated information regarding collateral resolution. Impairment analyses are updated on a quarterly basis. Based on these processes, we do not believe there are significant time lapses for the recognition of additional loan loss provisions or charge-offs from the date they become known. |
48
Table of Contents
| • | In the event that a current appraisal to support the fair value of the real estate collateral underlying an impaired loan has not yet been received, but the Company believes that the collateral value is insufficient to support the loan amount, an impairment reserve is recorded. In these instances, the receipt of a current appraisal triggers an updated review of the collateral support for the loan and any deficiency is charged-off or reserved at that time. In those instances where a current appraisal is not available in a timely manner in relation to a financial reporting cut-off date, the Company discounts the most recent third-party appraisal depending on a number of factors including, but not limited to, property location, local price volatility, local economic conditions, and recent comparable sales. In all cases, the costs to sell the subject property are deducted in arriving at the fair value of the collateral. Any unpaid property taxes or similar expenses are expensed at the time the property is acquired by the Bank. |
The table below summarizes the defined “substandard” loan totals and the defined “impaired” loan totals (collectively, “adversely classified loans”) and other related data at quarter end since December 31, 2009:
| (Dollars in thousands) | ||||||||||||||||||||
| December 31, 2010 |
September 30, 2010 |
June 30, 2010 |
March 31, 2010 |
December 31, 2009 |
||||||||||||||||
| Rated substandard |
$ | 135,826 | $ | 193,133 | $ | 186,627 | $ | 191,960 | $ | 181,675 | ||||||||||
| Impaired |
129,616 | 115,103 | 129,703 | 104,372 | 103,917 | |||||||||||||||
| Total adversely classified loans |
$ | 265,442 | $ | 308,236 | $ | 316,330 | $ | 296,332 | $ | 285,592 | ||||||||||
| Gross loans |
$ | 978,546 | $ | 1,036,079 | $ | 1,091,860 | $ | 1,118,964 | $ | 1,149,027 | ||||||||||
| Adversely classified loans to gross loans |
27.13 | % | 29.75 | % | 28.97 | % | 26.48 | % | 24.86 | % | ||||||||||
| Loans 30-89 days past due and still accruing as a percent of gross loans |
0.43 | % | 1.12 | % | 0.98 | % | 1.01 | % | 1.30 | % | ||||||||||
| Allowance for loan losses |
$ | 35,582 | $ | 42,120 | $ | 43,917 | $ | 46,518 | $ | 45,903 | ||||||||||
| Allowance for loan losses as a percentage of adversely classified loans |
13.40 | % | 13.66 | % | 13.88 | % | 15.70 | % | 16.07 | % | ||||||||||
The allowance for loan losses as of December 31, 2010, declined to 3.64% of gross loans versus 3.99% as of December 31, 2009. While total non-accrual loans increased to $129.5 million as of December 31, 2010, up from $98.5 million as of December 31, 2009, other leading indicators of credit quality improved during 2010. Adversely classified loans have declined to $265.0 million at December 31, 2010, down from the highpoint during 2010 of $316.3 million at June 30, 2010. Also, loans 30-89 days past due and still accruing as a percent of gross loans fell to 0.43% at December 31, 2010, down from 1.30% at December 31, 2009, and the highpoint during 2010 of 1.01% at September 30, 2010. In addition, net loans charged-off to average gross loans fell to 1.88% during 2010 down from 4.85% experienced during 2009.
In some instances the Company has modified or restructured loans to amend the interest rate and/or to extend the maturity. Through December 31, 2010, any such amendments have generally been consistent with the terms of newly booked loans reflecting current standards for amortization and interest rate and do not represent concessions to such borrowers. In those instances where concessions have met the criteria for a troubled debt restructuring (“TDR”), the related loans have been recorded as TDR’s, placed on non-accrual status and included in the impaired loan totals. TDR’s recorded by the Company at December 31, 2010 totaled $45.2 million and were comprised of 32 loans.
PremierWest’s allowance for loan losses totaled $35.6 million at December 31, 2010, and $45.9 million at December 31, 2009, representing 3.64% of gross loans at December 31, 2010 and 3.99% of gross loans at December 31, 2009. The loan loss allowance represents 27.45% and 44.17% of nonperforming loans at December 31, 2010, and 2009, respectively.
49
Table of Contents
The following is a summary of PremierWest’s loan loss experience and selected ratios for the periods presented:
| December 31, | ||||||||||||||||||||
| (Dollars in thousands) | 2010 | 2009 | 2008 | 2007 | 2006 | |||||||||||||||
| Gross loans outstanding at end of year |
$ | 978,546 | $ | 1,149,027 | $ | 1,247,988 | $ | 1,025,329 | $ | 921,694 | ||||||||||
| Average loans outstanding, gross |
$ | 1,083,574 | $ | 1,221,842 | $ | 1,255,203 | $ | 961,534 | $ | 856,945 | ||||||||||
| Allowance for loan losses, beginning of year |
$ | 45,903 | $ | 17,157 | $ | 11,450 | $ | 10,877 | $ | 10,341 | ||||||||||
| Loans charged-off: |
||||||||||||||||||||
| Commercial |
(3,073 | ) | (21,997 | ) | (10,366 | ) | (134 | ) | (100 | ) | ||||||||||
| Real estate |
(20,119 | ) | (36,353 | ) | (25,059 | ) | — | — | ||||||||||||
| Consumer |
(2,659 | ) | (2,524 | ) | (1,879 | ) | (539 | ) | (271 | ) | ||||||||||
| Other |
(722 | ) | (193 | ) | (3,611 | ) | (154 | ) | (125 | ) | ||||||||||
| Total loans charged-off |
(26,573 | ) | (61,067 | ) | (40,915 | ) | (827 | ) | (496 | ) | ||||||||||
| Recoveries: |
||||||||||||||||||||
| Commercial |
2,068 | 143 | 143 | 204 | 95 | |||||||||||||||
| Real estate |
2,888 | 876 | 216 | — | — | |||||||||||||||
| Consumer |
968 | 662 | 229 | 217 | 93 | |||||||||||||||
| Other |
278 | 101 | 422 | 112 | 44 | |||||||||||||||
| Total recoveries |
6,202 | 1,782 | 1,010 | 533 | 232 | |||||||||||||||
| Net charge-offs |
(20,371 | ) | (59,285 | ) | (39,905 | ) | (294 | ) | (264 | ) | ||||||||||
| Allowance for loan losses transferred from: |
||||||||||||||||||||
| Stockmans Financial Group |
— | — | 9,112 | |||||||||||||||||
| Other adjustments (1) |
— | — | — | 181 | — | |||||||||||||||
| Provision charged to income |
10,050 | 88,031 | 36,500 | 686 | 800 | |||||||||||||||
| Allowance for loan losses, end of year |
$ | 35,582 | $ | 45,903 | $ | 17,157 | $ | 11,450 | $ | 10,877 | ||||||||||
| Ratio of net loans charged-off to average gross loans outstanding |
1.88 | % | 4.85 | % | 3.18 | % | 0.03 | % | 0.03 | % | ||||||||||
| Ratio of allowance for loan losses to gross loans outstanding |
3.64 | % | 3.99 | % | 1.37 | % | 1.12 | % | 1.18 | % | ||||||||||
| (1) | Includes a balance sheet reclassification adjustment (decrease) of $255,000 from the allowance for loan losses to other liabilities. The amount reclassified represents the off-balance sheet credit exposure related to unfunded commitments to lend and letters of credit; and a $436,000 increase resulting from the purchase of a consumer finance loan portfolio on June 29, 2007. |
50
Table of Contents
The following table shows the allocation of PremierWest’s allowance for loan losses by category and the percent of loans in each category to gross loans at the dates indicated. PremierWest allocates its allowance for loan losses to each loan classification based on relative risk characteristics. General, Specific and Qualitative allocations are made based on estimated losses that are due to current credit circumstances and other available information for each loan category. General allocations are based on historical loss factors. Specific allocations are related to loans on non-accrual status; estimated reserves based on individual credit risk ratings; loans for which Management believes the borrower might be unable to comply with loan repayment terms, even though the loans are not in non-accrual status; and, loans for which supporting collateral might not be adequate to recover loan amounts if foreclosure and subsequent sale of collateral become necessary. Qualitative allocations include adjustments for economic conditions, concentrations and other subjective factors, and are intended to compensate for the subjective nature of the determination of losses inherent in the overall loan portfolio. Because the total loan loss allowance is a valuation reserve applicable to the entire loan portfolio, the portion of the allowance allocated to each loan category does not necessarily represent the actual losses that may occur within that loan category.
| December 31, | ||||||||||||||||||||||||||||||||||||||||
| 2010 | 2009 | 2008 | 2007 | 2006 | ||||||||||||||||||||||||||||||||||||
| (Dollars in thousands) | Allowance for loan losses |
% of loans in each category to total loans |
Allowance for loan losses |
% of loans in each category to total loans |
Allowance for loan losses |
% of loans in each category to total loans |
Allowance for loan losses |
% of loans in each category to total loans |
Allowance for loan losses |
% of loans in each category to total loans |
||||||||||||||||||||||||||||||
| Type of loan: |
||||||||||||||||||||||||||||||||||||||||
| Commercial |
$ | 9,759 | 15.99 | % | $ | 6,441 | 18.24 | % | $ | 2,157 | 20.22 | % | $ | 1,684 | 23.81 | % | $ | 1,889 | 23.81 | % | ||||||||||||||||||||
| Real estate- Construction |
9,072 | 12.64 | % | 14,953 | 18.43 | % | 6,015 | 22.45 | % | 3,720 | 26.16 | % | 4,096 | 28.13 | % | |||||||||||||||||||||||||
| Real estate- Commercial/ Residential |
12,423 | 59.22 | % | 21,958 | 51.86 | % | 7,154 | 46.05 | % | 4,516 | 39.57 | % | 3,820 | 39.09 | % | |||||||||||||||||||||||||
| Consumer and Other |
4,328 | 12.15 | % | 2,551 | 11.47 | % | 1,831 | 11.28 | % | 1,530 | 10.46 | % | 1,072 | 8.97 | % | |||||||||||||||||||||||||
| Total |
$ | 35,582 | 100.00 | % | $ | 45,903 | 100.00 | % | $ | 17,157 | 100.00 | % | $ | 11,450 | 100.00 | % | $ | 10,877 | 100.00 | % | ||||||||||||||||||||
As of December 31, 2010, Management believes that the Company’s total allowance for credit losses and its reserve for off-balance sheet commitments are sufficient to absorb the losses inherent in the loan portfolio, related both to funded loans and unfunded commitments. The off-balance sheet commitments include commitments to extend credit and standby letters of credit. The Bank’s exposure to credit loss in the event of non-performance for commitments to extend credit and standby letters of credit is represented by the contractual amount of those instruments. This assessment, based on both historical levels of net charge-offs and continuing detailed reviews of the quality of the loan portfolio and current business, economic and regulatory conditions, involves uncertainty and judgment. As a result, the adequacy of the allowance for loan losses and the reserve for unfunded commitments cannot be determined with inherent accuracy and may change in future periods. Additionally, bank regulatory authorities may require additional charges to the provision for loan losses as a result of their periodic examinations of the Company and their judgment of information available to them at the time of their examination. If actual circumstances and losses differ substantially from Management’s assumptions and estimates, the allowance for loan losses might not be sufficient to absorb all future losses. Net earnings would be adversely affected if that were to occur. Total off-balance sheet financial instruments, consisting of commitments to extend credit and standby letters of credit, were $82.0 million and $125.9 million as of December 31, 2010 and 2009, respectively.
Despite diligent assessment by Management, there can be no assurance regarding the actual amount of charge-offs that will be incurred in the future. A further slowing in the Oregon and/or California economies, further declines in real estate values or increased unemployment could result in increased levels of nonperforming assets and charge-offs, increased loan loss provisions and reductions in income.
51
Table of Contents
Deposits
Deposit accounts are PremierWest’s primary source of funds. PremierWest offers a number of deposit products to attract commercial and consumer customers including regular checking and savings accounts, money market accounts, IRA accounts, NOW accounts, and a variety of fixed-maturity, fixed-rate time deposits with maturities ranging from seven days to 60 months. These accounts earn interest at rates established by Management based on competitive market factors and Management’s desire to obtain certain types or maturities of deposit liabilities.
Total deposits declined $154.5 million during 2010, to $1.27 billion at December 31, 2010, compared to $1.42 billion at December 31, 2009, an 11% decrease. At December 31, 2009, total deposits were $1.42 billion, an increase of $209.5 million, or 17%, from total deposits of $1.21 billion at December 31, 2008. During 2010, non-interest-bearing deposits decreased $13.5 million, or 5%, from $256.2 million at December 31, 2009. With the decline in loan volumes resulting in increased liquidity, the Company purposefully reduced high-cost time deposits which drove deposit costs down to 1.11% in 2010 as compared to 1.63% in 2009.
The distribution of deposit accounts by type and rate is set forth in the following tables as of the indicated dates.
| Years Ended December 31, | ||||||||||||||||||||||||||||||||||||||||||||||||
| 2010 | 2009 | 2008 | ||||||||||||||||||||||||||||||||||||||||||||||
| (Dollars in thousands) |
Average Balance |
Percentage | Interest Expense |
Average Rate |
Average Balance |
Percentage | Interest Expense |
Average Rate |
Average Balance |
Percentage | Interest Expense |
Average Rate |
||||||||||||||||||||||||||||||||||||
| Savings, money market and interest bearing demand |
$ | 487,182 | 36.64 | % | $ | 2,372 | 0.49 | % | $ | 480,760 | 35.45 | % | $ | 4,245 | 0.88 | % | $ | 427,646 | 35.50 | % | $ | 6,912 | 1.62 | % | ||||||||||||||||||||||||
| Time deposits |
590,701 | 44.43 | % | 9,599 | 1.63 | % | 629,742 | 46.43 | % | 13,896 | 2.21 | % | 545,329 | 45.27 | % | 19,432 | 3.56 | % | ||||||||||||||||||||||||||||||
| Total interest-bearing deposits |
1,077,883 | $ | 11,971 | 1.11 | % | 1,110,502 | $ | 18,141 | 1.63 | % | 972,975 | $ | 26,344 | 2.71 | % | |||||||||||||||||||||||||||||||||
| Non-interest- |
251,670 | 18.93 | % | 245,829 | 18.12 | % | 231,710 | 19.23 | % | |||||||||||||||||||||||||||||||||||||||
| Total interest-bearing and non-interest-bearing deposits |
$ | 1,329,553 | $ | 1,356,331 | $ | 1,204,685 | ||||||||||||||||||||||||||||||||||||||||||
Interest-bearing deposits consist of money market, NOW, savings and time deposit accounts. Interest-bearing account balances tend to grow or decline as PremierWest adjusts its pricing and product strategies based on market conditions, including competing deposit products. At December 31, 2010, total interest-bearing deposit accounts were $1.02 billion, a decrease of $141.0 million, or 12%, from December 31, 2009.
Management has historically utilized brokered deposits with maturities that are typically less than one year as a short-term funding source for loan growth. Brokered deposits are classified as time deposits that are greater than $100,000 but are not considered core deposits. At December 31, 2010, brokered deposits totaled $742,000; at December 31, 2009, brokered deposits totaled $44.3 million, or 3% of total deposits. At December 31, 2010, time deposits of $100,000 and over totaled $220.4 million, or 17% of total outstanding deposits compared to $221.9 million, or 16% of total outstanding deposits at December 31, 2009.
52
Table of Contents
The following table sets forth time deposit accounts outstanding at December 31, 2010, by time remaining to maturity:
| Time Deposits of $250,000 or More |
Time Deposits of $100,000 through $250,000 |
Time Deposits Less Than $100,000 |
||||||||||||||||||||||
| Amount | Percentage | Amount | Percentage | Amount | Percentage | |||||||||||||||||||
| (Dollars in thousands) | ||||||||||||||||||||||||
| Three months or less |
$ | 9,827 | 17.32 | % | $ | 41,364 | 25.28 | % | $ | 82,388 | 24.72 | % | ||||||||||||
| Over three months through six months |
8,269 | 14.58 | % | 20,019 | 12.23 | % | 50,702 | 15.21 | % | |||||||||||||||
| Over six months through 12 months |
13,235 | 23.33 | % | 40,249 | 24.60 | % | 85,317 | 25.59 | % | |||||||||||||||
| Over 12 months |
25,398 | 44.77 | % | 62,002 | 37.89 | % | 114,951 | 34.48 | % | |||||||||||||||
| Total |
$ | 56,729 | 100.00 | % | $ | 163,634 | 100.00 | % | $ | 333,358 | 100.00 | % | ||||||||||||
Average total deposits remained essentially unchanged in 2010 as compared to 2009. However, the composition of the Company’s deposits noticeably changed during this same period. Non-interest bearing deposits grew to 19% of total deposits, up from 18% for 2009. In addition, during 2010 the composition of interest-bearing deposits shifted, with savings, money market, and interest-bearing demand comprising 37% of total deposits as compared to 35% for 2009. Correspondingly, interest-bearing deposits as a proportion of total deposits fell to 81% in 2010 versus 82% in 2009.
Short-term and Long-term Borrowings and Other Contractual Obligations
The following table sets forth certain information with respect to PremierWest’s short-term borrowings from Federal Home Loan Bank (FHLB) Cash Management Advances (CMA) and federal funds purchased:
| Years Ended December 31, | ||||||||||||||||||||||||
| 2010 | 2009 | 2008 | ||||||||||||||||||||||
| FHLB CMA Advances |
Federal Funds Purchased |
FHLB CMA Advances |
Federal Funds Purchased |
FHLB CMA Advances |
Federal Funds Purchased |
|||||||||||||||||||
| (Dollars in thousands) | ||||||||||||||||||||||||
| Amount outstanding at end of period |
$ | — | — | $ | — | — | $ | 20,000 | 25,003 | |||||||||||||||
| Weighted average interest rate at end of period |
n/a | n/a | n/a | n/a | 0.76 | % | 1.10 | % | ||||||||||||||||
| Maximum amount outstanding at any month-end during the year |
$ | — | — | $ | 20,000 | 12,000 | $ | 25,000 | 36,859 | |||||||||||||||
| Average amount outstanding during the period |
$ | — | — | $ | 1,973 | 885 | $ | 4,183 | 15,261 | |||||||||||||||
| Average weighted interest rate during the period |
n/a | n/a | 0.22 | % | 1.59 | % | 1.37 | % | 2.78 | % | ||||||||||||||
The Bank participates in the FHLB CMA Program. CMA borrowings outstanding were zero at December 2010 and 2009; and $20.0 million at December 31, 2008. At December 31, 2010, the Bank had FHLB letters of credit of $915,000 against an available line of approximately $80.6 million. PremierWest also had long-term borrowings outstanding with the Federal Home Loan Bank of Seattle (FHLB) totaling $22,000, $28,000, and $42,000 as of December 31, 2010, 2009 and 2008, respectively. The Bank makes monthly principal and interest payments on the long-term borrowings, which mature in 2014 and bear interest at a rate of 6.53%. All outstanding borrowings with the FHLB are collateralized by a blanket pledge agreement covering loans in the Bank’s portfolio that are secured by 1st liens against 1-4 family or multi-family residential properties as well as the Bank’s FHLB stock and any funds, investment securities or loans on deposit with the FHLB.
53
Table of Contents
On December 30, 2004, the Company established two wholly-owned statutory business trusts, PremierWest Statutory Trust I and II, which were formed to issue junior subordinated debentures and related common securities. Following the acquisition of Stockmans Financial Group, the Company became the successor-in-interest to Stockmans Financial Trust I, which was established on August 25, 2005. Common stock issued by the Trusts and held as an investment by the Company is recorded in other assets in the consolidated balance sheets.
Trust preferred securities accrue and pay distributions periodically at specified annual rates as provided in the indentures. The trusts used the net proceeds from the offering to purchase a like amount of junior subordinated debentures (the “Debentures”) of the Company. The Debentures are the sole assets of the trusts. The Company’s obligations under the Debentures and related documents, taken together, constitute a full and unconditional guarantee by the Company of the obligations of the trusts. The trust preferred securities are mandatorily redeemable upon the maturity of the Debentures, or upon earlier redemption as provided in the indentures. The Company has the right to redeem the Debentures in whole (but not in part) on or after specific dates, at a redemption price specified in the indentures plus any accrued but unpaid interest to the redemption date. In November 2009, the Company notified the investors holding its Debentures that interest payments were being temporarily suspended in an effort to preserve equity capital pursuant to current regulatory guidance and policy related to dividends from the Bank. Under the terms of each Debenture indenture agreement, the Company may defer payment of interest on the Debentures for the lesser of 20 consecutive quarters or to the maturity date of the Debentures. Deferral of interest also results in interest being computed quarterly on any deferred interest payments. At December 31, 2010, the Company had deferred payment of interest for five consecutive quarters.
By issuing trust preferred securities the Company was able to secure a long-term source of borrowed funds in support of its growth needs with a debt instrument that is includable as capital for regulatory purposes in the calculation of its risk based capital ratios. Under current Federal Reserve Bank policy, all of the outstanding debentures, subject to certain limitations, have been included in the determination of Tier I capital for regulatory purposes. Further, the aggregate amount of “restrictive core” elements consisting of cumulative perpetual preferred stock (including related surplus) and qualifying trust preferred securities that a bank holding company may include in Tier 1 Capital continues to be an amount up to 25 percent of the sum of: (1) qualifying common stockholder equity, (2) qualifying noncumulative and cumulative perpetual preferred stock (including related surplus), (3) qualifying minority interest in the equity accounts of consolidated subsidiaries and (4) qualifying trust preferred securities. Tier 1 Capital must represent at least 50 percent of a bank holding company’s qualifying total capital. The excess of “restricted core” capital not included in Tier 1 may generally continue to be included in the calculation of Tier 2 Capital.
The following table is a summary of current trust preferred securities at December 31, 2010:
| Trust Name |
Issue Date | Issue Amount |
Rate Type | Rate | Maturity Date | Redemption Date |
||||||||||||||||||
| PremierWest Statutory Trust I |
December 2004 | $ | 7,732,000 | Variable | (1) | LIBOR+1.75% | December 2034 | December 2009 | ||||||||||||||||
| PremierWest Statutory Trust II |
December 2004 | $ | 7,732,000 | Variable | (2) | LIBOR+1.79% | March 2035 | March 2010 | ||||||||||||||||
| Stockmans Financial Trust I |
August 2005 | $ | 15,464,000 | Variable | (3) | LIBOR+1.42% | September 2035 | September 2010 | ||||||||||||||||
| $ | 30,928,000 | |||||||||||||||||||||||
| (1) | PremierWest Statutory Trust I was bearing interest at the fixed rate of 5.65% until mid-December 2009, at which time it changed to a variable rate of 3-month LIBOR (0.30% at December 15, 2010) plus 1.75% or 2.05%, adjusted quarterly, through the final maturity date in December 2034. |
| (2) | PremierWest Statutory Trust II was bearing interest at the fixed rate of 5.65% until March 2010, at which time it changed to a variable rate of 3-month LIBOR (0.30% at December 15, 2010) plus 1.79% or 2.09%, adjusted quarterly, through the final maturity date in March 2035. |
54
Table of Contents
| (3) | Stockmans Financial Trust I was bearing interest at the fixed rate of 5.93% until September 2010, at which time it changed to a variable rate of 3-month LIBOR (0.30% at December 15, 2010) plus 1.42% or 1.72%, adjusted quarterly, through the final maturity date in September 2035. |
PremierWest is a party to numerous contractual financial obligations including repayment of borrowings, operating lease payments and commitments to extend credit under off-balance sheet arrangements. The scheduled repayment of long-term borrowings and other contractual obligations is as follows:
| (Dollars in thousands) | Payments due by period | |||||||||||||||||||
| Contractual Obligations |
Total | < 1 year | 1-3 years | 3-5 years | > 5 years | |||||||||||||||
| Borrowings |
$ | 22 | $ | 7 | $ | 15 | $ | — | $ | — | ||||||||||
| Operating lease obligations |
6,291 | 976 | 1,469 | 1,068 | 2,778 | |||||||||||||||
| Junior subordinated debentures |
30,928 | — | — | — | 30,928 | |||||||||||||||
| Other commitments (1) |
9,335 | 675 | 1,407 | 1,345 | 5,908 | |||||||||||||||
| Total |
$ | 46,576 | $ | 1,658 | $ | 2,891 | $ | 2,413 | $ | 39,614 | ||||||||||
| (1) | Employee benefits that include Deferred Compensation, Executive Supplemental Retirement Plans, Employee Life Benefit Plans and Split Dollar Obligations |
Off-Balance Sheet Arrangements
Significant off-balance sheet commitments at December 31, 2010, include commitments to extend credit of $76.8 million and standby letters of credit of $5.2 million. See Note 16 of the Notes to Consolidated Financial Statements included with this report for a discussion on the nature, business purpose and importance of off-balance sheet arrangements.
LIQUIDITY AND CAPITAL RESOURCES; REGULATORY CAPITAL
Shareholders’ equity was $97.0 million at December 31, 2010, an increase of $25.5 million, or 36%, from December 31, 2009. The most significant factors contributing to the increase was a $32.5 million capital raise, partially offset by $5.0 million net loss, and by $2.1 million for the accrued preferred stock dividend.
PremierWest has adopted policies to maintain an adequately liquid position to enable it to respond to changes in the financial environment and ensure sufficient funds are available to meet customers’ needs for borrowing and deposit withdrawals. Generally, PremierWest’s major sources of liquidity are customer deposits, sales and maturities of investment securities, the use of borrowings from the FHLB and correspondent banks and net cash provided by operating activities. As of December 31, 2010, unused and available lines of credit totaled $113.2 million of which $79.6 million was available from FHLB’s Cash Management Advance Program, $13.6 million was available from the Federal Reserve discount window, and $20.0 million from a correspondent bank. Scheduled loan repayments are a historically stable source of funds, while deposit inflows and unscheduled loan prepayments are not as stable because they are influenced by general interest rate levels, competing interest rates available on other investments, market competition, economic conditions and other factors. Liquid asset balances include cash, amounts due from other banks, federal funds sold, and investment securities available-for-sale. At December 31, 2010, these liquid assets totaled $324.2 million, or 23% of total assets, as compared to $268.7 million, or 17% of total assets, at December 31, 2009.
While our access to interbank credit availability remains somewhat limited due to counterparty credit concerns over the Company’s financial condition, the Wachovia branch acquisition in July 2009 added $342.4 million to our deposit base. This action improved liquidity as evidenced by our year-end liquid assets as noted above. Core deposits remain our primary source of funding. Our securities portfolio has expanded significantly since 2008 and has been used to satisfy pledging requirements for collateralizing public funds deposits. The Bank
55
Table of Contents
enhanced its contingency plans to address its liquidity needs including collateralized borrowing capacity through the Federal Home Loan Bank, other correspondent banks and the Federal Reserve Bank of San Francisco and to support its funding needs that are not covered by our core deposit base. Management has also raised additional equity (see Note 2—Regulatory Agreement) and continues to emphasize strategies for building relationship-oriented core deposits over time rather than aggressively attracting higher cost transactional time deposits from within our local markets. This strategy has enabled the Bank to significantly reduce brokered deposits and borrowings, as previously noted.
An analysis of liquidity should encompass a review of the changes that appear in the consolidated statements of cash flows for the year ended December 31, 2010. The statement of cash flows includes operating, investing, and financing categories.
Cash flows provided by operating activities was $26.8 million with the difference between cash provided by operating activities and a net loss of $5.0 million consisting primarily of noncash items of $10.1 million in the loan loss provision and $3.9 million in depreciation and amortization. These noncash items were offset by $10.4 million of changes in other assets and liabilities and a $5.3 million non-cash write down of OREO due to impairment, and $2.1 million in other categories.
Cash flows provided by investing activities of $131.1 million consisted primarily of $221.5 million of proceeds from sales, calls, paydowns, and maturities of securities and proceeds from interest-bearing certificates of deposit; $120.3 million in net loan pay downs; $20.2 million in proceeds from the sale of OREO; offset by $226.6 million used for purchases of securities and interest-bearing certificates of deposit and $3.5 million used for purchases of premises and equipment.
Cash flows used in financing activities of $122.0 million consisted primarily of $154.5 million net decrease in deposits, offset by $32.5 million in proceeds from the issuance of common stock.
At December 31, 2010, PremierWest had outstanding unfunded lending commitments of $82.0 million. Nearly all of these commitments represented unused portions of credit lines available to businesses. Many of these credit lines are not expected to be fully drawn upon and, accordingly, the aggregate commitments do not necessarily represent future cash requirements. Management believes that PremierWest’s sources of liquidity are sufficient to meet likely calls on outstanding commitments, although there can be no assurance in this regard.
The Federal Reserve Board and the Federal Deposit Insurance Corporation have established minimum requirements for capital adequacy for financial holding companies and member banks. The requirements address both risk-based capital and leveraged capital. The regulatory agencies may establish higher minimum requirements if, for example, a financial institution is under special regulatory supervision. At December 31, 2010 and 2009, the Bank was required to maintain capital ratios in excess of the published minimum requirements.
The following table reflects PremierWest Bank’s various capital ratios at December 31, 2010 and 2009, as compared to regulatory minimums for capital adequacy purposes:
| 2010 Actual |
2009 Actual |
Minimum to be “Adequately Capitalized” |
Minimum to be “Well-Capitalized” |
|||||||||||||
| Total risk-based capital ratio |
12.59 | % | 8.53 | % | ³ | 8.00 | % | ³ | 10.00 | % | ||||||
| Tier 1 risk-based capital ratio |
11.31 | % | 7.25 | % | ³ | 4.00 | % | ³ | 6.00 | % | ||||||
| Leverage ratio |
8.85 | % | 5.70 | % | ³ | 4.00 | % | ³ | 5.00 | % | ||||||
The various capital ratios for PremierWest Bancorp at December 31, 2010 and 2009, compared to regulatory minimums for capital adequacy purposes are as follows:
| 2010 Actual |
2009 Actual |
Minimum to be “Adequately Capitalized” |
||||||||||
| Total risk-based capital ratio |
12.36 | % | 8.62 | % | ³ | 8.00 | % | |||||
| Tier 1 risk-based capital ratio |
11.09 | % | 6.84 | % | ³ | 4.00 | % | |||||
| Leverage ratio |
8.66 | % | 5.38 | % | ³ | 4.00 | % | |||||
56
Table of Contents
PremierWest Bancorp and Bank meet the capital requirements established in the regulatory agreements under which the institutions currently operate with the exception of the requirement to maintain a 10.00% leverage ratio. As such, the institutions are considered “adequately capitalized” for regulatory purposes.
RECENTLY ISSUED ACCOUNTING STANDARDS
In January 2011, the FASB issued Accounting Standards Update ASU No. 2011-01”Receivables (Topic 310)—Deferral of the Effective Date of Disclosures about Troubled Debt Restructurings in Update No. 2010-20.” This standard temporarily delays the public entity effective date for disclosures related to troubled debt restructurings originally introduced in ASU No. 2010-20. According to the current guidance in ASU No. 2010-20, public-entity creditors would have provided disclosures about troubled debt restructurings for periods beginning on or after December 15, 2010. That guidance is now effective for interim and annual periods ending after June 15, 2011. This standard is effective upon issuance. This update requires a significant expansion of disclosures for troubled debt restructurings, but the adoption of the expanded disclosures is not expected to have a material impact on the consolidated financial statements.
In December 2010, the FASB issued Accounting Standards Update ASU No. 2010-29 “Business Combinations (Topic 805)—Disclosure of Supplementary Pro Forma Information for Business Combinations (a consensus of the FASB Emerging Issues Task Force).” This Standard instructs that if a public entity that was recently involved in a merger or acquisition presents comparative financial statements, the entity should disclose revenue and earnings of the combined entity in the same fashion as would be customary if the business combination had occurred as of the beginning of the prior annual reporting period only, and expands the supplemental pro forma disclosures to include a description of the nature and amount of material, nonrecurring pro forma adjustments directly attributable to the business combination included in the reported pro forma revenue and earnings. These amendments are effective for business combinations for which the acquisition date is on or after the beginning of the first annual reporting period beginning on or after December 15, 2010, and should be applied prospectively. The adoption of ASU No. 2010-29 is not expected to have a material impact on the consolidated financial statements.
In December 2010, the FASB issued Accounting Standards Update ASU No. 2010-28”Intangibles – Goodwill and Other (Topic 350)—When to Perform Step 2 of the Goodwill Impairment Test for Reporting Units with Zero or Negative Carrying Amounts” The changes to FASB ASC 350-25-35 modify Step 1 of the evaluation of goodwill impairment for reporting units with zero or negative carrying amounts to require that Step 2 of the impairment test be performed to measure the amount of any impairment loss when it is more likely than not that a goodwill impairment exits. This change prevents the assertion made by some businesses that Step 2 need not be taken when the carrying amount of a unit is zero or less. For public entities, the amended guidance is effective for fiscal years, and interim periods within those years, beginning after December 15, 2010, with early adoption not permitted. The adoption of ASU No. 2010-28 is not expected to have a material impact on the consolidated financial statements.
In July 2010, the FASB issued Accounting Standards Update ASU No. 2010-20 “Receivables (Topic 310)—Disclosures about the Credit Quality of Financing Receivables and the Allowance for Credit Losses” to improve the quality of financial reports by lowering the threshold for disclosure of an entity’s allowance for credit losses and the credit quality of its financing receivables, the FASB says an entity should provide disclosures disaggregated into two levels: portfolio segment and class of financing receivable. Users of financial statements should be able to readily evaluate the nature of credit risk inherent in an entity’s portfolio of financing receivables, how that risk is analyzed and assessed in arriving at the allowance for credit losses, and the changes and reasons for those changes in the allowance for credit losses. Numerous additional disclosures relating to financing receivables are also being required, in order to shed further light on an entity’s financial position. For public entities, the disclosures as of the end of a reporting period are effective for interim and annual reporting periods ending on or after December 15, 2010. The disclosures about activity that occurs during a reporting period are effective for interim and annual reporting periods beginning on or after December 15, 2010. This
57
Table of Contents
update requires a significant expansion of credit related disclosures, but the adoption of ASU No. 2010- 20 did not have a material impact on the consolidated financial statements.
In April 2010, the FASB issued Accounting Standards Update ASU No. 2010-18 “Receivables (Topic 310) —Effect of a Loan Modification When the Loan is Part of the Pool that is Accounted for as a Single Asset” to clarify the guidance for loans acquired in a pool of assets with evidence of declining credit quality. FASB ASC 310-20, Receivables—Loans and Debt Securities Acquired with Deteriorated Credit Quality, is amended to clarify the criteria by which an acquired loan can be removed from an asset pool. Modifications of loans that are accounted for within a pool under Subtopic 310-30 do not result in the removal of those loans from the pool even if the modification of those loans would otherwise be considered a troubled debt restructuring. An entity will continue to be required to consider whether the pool of assets in which the loan is included is impaired if expected cash flows for the pool change. The amendments will be effective for loans that are part of an asset pool and are modified during financial reporting periods that end on or after July 15, 2010. The adoption of ASU No. 2010-18 did not have a material impact on the consolidated financial statements.
In April 2010, the FASB issued Accounting Standards Update ASU No. 2010-12 “Income Taxes” (Topic 740) to address changes in accounting for income taxes resulting from recently issued Health Care and Education Reconciliation Act of 2010 and the Patient Protection and Affordable Care Act. The update explains that even though the bills were signed seven days apart, they should be considered together for accounting purposes. If a registrant’s reporting period ends after the signing of the first bill, but before the signing of the second, they should take the effects of both bills into consideration when measuring current and deferred tax liabilities and assets. The adoption of ASU No. 2010-12 did not have a material impact on the consolidated financial statements.
In March 2010, the FASB issued Accounting Standards Update ASU No. 2010-09 “Amendments to Subsequent Events Requirements for SEC Issuers” to amend FASB ASC Topic 855 to exclude SEC reporting entities from the requirement to disclose the date on which subsequent events have been evaluated. In addition, it modifies the requirement to disclose the date on which subsequent events have been evaluated in reissued financial statements to apply only to such statements that have been restated to correct an error or to apply U.S. GAAP retrospectively. The adoption of ASU No. 2010-09 did not have a material impact on the consolidated financial statements.
In January 2010, the FASB issued Accounting Standards Update ASU No. 2010-06 “Fair Value Measurements and Disclosures (Topic 820)—Improving Disclosures about Fair Value Measurements” to improve disclosures about fair value measurements. For each class of assets and liabilities, reporting entities will have to provide additional disclosures describing the reasons for transfers of assets in and out of Levels 1 and 2 of the three-tier fair value hierarchy in accordance with FASB ASC Topic 820. For assets valued with the Level 3 method, the entity will have to separately present purchases, sales, issuances, and settlements in the reconciliation for fair value measurements. This update also states that an entity should provide fair value measurements for each class of asset or liability, and explain the inputs and techniques used in calculating Levels 2 and 3 fair value measurements. The adoption of ASU No. 2010-06 did not have a material impact on the consolidated financial statements.
In December 2009, the FASB issued Accounting Standards Update ASU No. 2009-16 “Transfers and Servicing (Topic 860)—Accounting for Transfers of Financial Assets” to amend the codification of FASB Statement of Financial Accounting Standard (SFAS) No. 166, “Accounting for Transfers of Financial Assets” issued on June 12, 2009. ASU No. 2009-16 amends FASB ASC Subtopic 860-10-15-1, “Transfers and Servicing,” and establishes accounting and reporting standards for transfers and servicing of financial assets. It also establishes the accounting for transfers of servicing rights. The adoption of ASU No. 2009-16 did not have a material impact on the consolidated financial statements.
58
Table of Contents
| ITEM 7A. | QUANTITATIVE AND QUALITATIVE DISCLOSURES ABOUT MARKET RISK |
Like other financial institutions, PremierWest is subject to interest rate risk. Interest-earning assets could mature or re-price more rapidly than, or on a different basis from, interest-bearing liabilities (primarily deposits with short- and medium-term maturities and borrowings) in a period of declining interest rates. Although having assets that mature or re-price more frequently on average than liabilities will be beneficial in times of rising interest rates, such an asset/liability structure will result in lower net interest income during periods of declining interest rates. Interest rate sensitivity, or interest rate risk, relates to the effect of changing interest rates on net interest income. Interest-earning assets with interest rates tied to the Prime Rate for example, or that mature in relatively short periods of time, are considered interest rate sensitive. Also impacting interest rate sensitivity are loans that are subject to a rate floor. Interest-bearing liabilities with interest rates that can be re-priced in a discretionary manner, or that mature in relatively short periods of time, are also considered interest rate sensitive.
The differences between interest-sensitive assets and interest-sensitive liabilities over various time horizons are commonly referred to as sensitivity gaps. As interest rates change, the sensitivity gap will have either a favorable or adverse effect on net interest income. A negative gap (with liabilities re-pricing more rapidly than assets) generally should have a favorable effect when interest rates are falling, and an adverse effect when rates are rising. A positive gap (with assets re-pricing more rapidly than liabilities) generally should have an adverse effect when rates are falling, and a favorable effect when rates are rising.
The following table illustrates the maturities or re-pricing of PremierWest’s assets and liabilities as of December 31, 2010, based upon the contractual maturity or contractual re-pricing dates of loans (excluding nonperforming loans) and the contractual maturities of time deposits and borrowings. Prepayment assumptions have not been applied to fixed-rate mortgage loans. Demand loans, loans having no stated schedule of repayments and no stated maturity, and overdrafts are reported as due in one year or less.
| BY REPRICING INTERVAL | ||||||||||||||||||||
| (Dollars in thousands) | 0 – 3 Months |
4 – 12 Months |
1 – 5 Years |
Over 5 Years |
Total | |||||||||||||||
| ASSETS |
||||||||||||||||||||
| Interest-earning assets: |
||||||||||||||||||||
| Federal funds sold and interest-earningdeposits |
$ | 118,758 | $ | — | $ | — | $ | — | $ | 118,758 | ||||||||||
| Investment securities |
18,816 | 28,694 | 128,393 | 42,387 | 218,290 | |||||||||||||||
| Loans, net (1) |
275,254 | 168,344 | 356,473 | 11,649 | 811,720 | |||||||||||||||
| Total |
$ | 412,828 | $ | 197,038 | $ | 484,866 | $ | 54,036 | $ | 1,148,768 | ||||||||||
| LIABILITIES |
||||||||||||||||||||
| Interest-bearing liabilities: |
||||||||||||||||||||
| Interest-bearing demand and savings |
$ | 30,675 | $ | 82,628 | $ | 191,267 | $ | 165,327 | $ | 469,897 | ||||||||||
| Time deposits |
133,583 | 217,787 | 201,965 | 386 | 553,721 | |||||||||||||||
| Borrowings |
— | — | 22 | — | 22 | |||||||||||||||
| Junior subordinated debentures |
— | — | — | 30,928 | 30,928 | |||||||||||||||
| Total |
$ | 164,258 | $ | 300,415 | $ | 393,254 | $ | 196,641 | $ | 1,054,568 | ||||||||||
| Interest rate sensitivity gap |
$ | 248,570 | $ | (103,377 | ) | $ | 91,612 | $ | (142,605 | ) | $ | 94,200 | ||||||||
| Cumulative |
$ | 248,570 | $ | 145,193 | $ | 236,805 | $ | 94,200 | ||||||||||||
| Cumulative gap as a % of interest-earning assets |
21.6 | % | 12.6 | % | 20.6 | % | 8.2 | % | ||||||||||||
| (1) | For purposes of the gap analysis, loans are reduced by the allowance for loan losses, nonaccrual loans, deferred loan fees, and restructuring concessions. |
59
Table of Contents
This analysis of interest-rate sensitivity has a number of limitations. The gap analysis above is based upon assumptions concerning such matters as when assets and liabilities will re-price in a changing interest rate environment. Because these assumptions are no more than estimates, certain assets and liabilities indicated as maturing or re-pricing within a stated period might actually mature or re-price at different times and at different volumes from those estimated. The actual prepayments and withdrawals after a change in interest rates could deviate significantly from those assumed in calculating the data shown in the table. Certain assets, adjustable-rate loans for example, commonly have provisions that limit changes in interest rates each time the interest rate changes and on a cumulative basis over the life of the loan. Also, the renewal or re-pricing of certain assets and liabilities can be discretionary and subject to competitive and other pressures. The ability of many borrowers to service their debt could diminish after an interest rate increase. Therefore, the gap table above does not and cannot necessarily indicate the actual future impact of general interest movements on net interest income.
In addition to a static gap analysis of interest rate sensitivity, PremierWest also attempts to monitor interest rate risk from the perspective of changes in the economic value of equity, also referred to as net portfolio value (NPV), and changes in net interest income. Changes to the NPV and net interest income are simulated using instant and permanent rate shocks of plus and minus 300 basis points, in increments of 100 basis points. These results are then compared to prior periods to determine the effect of previously implemented strategies. If estimated changes to NPV or net interest income are not within acceptable limits, the Board may direct Management to adjust its asset and liability mix to bring interest rate risk within acceptable limits. The NPV calculations are based on the net present value of discounted cash flows, using market prepayment assumptions and market rates of interest for each asset and liability product type based on its characteristics. The theoretical projected change in NPV and net interest income over a 12-month period under each of the instantaneous and permanent rate shocks have been calculated by PremierWest using computer simulation.
PremierWest’s simulation analysis forecasts net interest income and earnings given unchanged interest rates (stable rate scenario). The model then estimates a percentage change from the stable rate scenario under scenarios of rising and falling market interest rates over various time horizons. The simulation model, based on December 31, 2010 data, estimates that if an immediate decline of 300 basis points occurs, net interest income during the subsequent twelve months could be unfavorably affected by approximately $1.6 million while a similar immediate increase in interest rates would result in a favorable change of approximately $4.0 million, indicative of an asset-sensitive position as of December 31, 2010. Because of uncertainties about customer behavior, refinance activity, absolute and relative loan and deposit pricing levels, competitor pricing and market behavior, product volumes and mix, and other unexpected changes in economic events affecting movements and volatility in market rates, there can be no assurance that simulation results are reliable indicators of earnings under such conditions.
| Net Increase (Decrease) in Net Interest Income (in thousands) (1) |
Net Interest Margin (2) |
Change in Economic Value of Equity |
||||||||||
| As of December 31, 2010, the prime rate was 3.25% |
— | 4.07 | % | 0.00 | % | |||||||
| Prime rate increase of: |
||||||||||||
| 300 basis points to 6.25% |
$ | 3,962 | 4.67 | % | 6.40 | % | ||||||
| 200 basis points to 5.25% |
$ | 2,270 | 4.52 | % | 3.80 | % | ||||||
| 100 basis points to 4.25% |
$ | 1,127 | 4.42 | % | 2.30 | % | ||||||
| Prime rate decrease of: |
||||||||||||
| 300 basis points to 0.25% |
$ | (1,554 | ) | 4.20 | % | -34.40 | % | |||||
| 200 basis points to 1.25% |
$ | (1,897 | ) | 4.16 | % | -24.30 | % | |||||
| 100 basis points to 2.25% |
$ | (927 | ) | 4.25 | % | -10.80 | % | |||||
| (1) | PremierWest’s interest rate sensitivity gap is asset-sensitive, which in conjunction with the general level of interest rates, yields abnormal changes in net-interest income as further rate declines are modeled. This occurs due to a practical floor of zero for deposit interest rates. |
| (2) | Tax adjusted at a 40.00% rate. |
60
Table of Contents
It is PremierWest’s policy to manage interest rate risk to maximize long-term profitability within pre-established risk tolerance parameters under the range of likely interest rate scenarios.
| ITEM 8. | FINANCIAL STATEMENTS AND SUPPLEMENTARY DATA |
61
Table of Contents
| PAGE | ||||
| 63-64 | ||||
| CONSOLIDATED FINANCIAL STATEMENTS |
||||
| 65 | ||||
| 66 | ||||
| Statements of changes in shareholders’ equity and comprehensive income (loss) |
67-68 | |||
| 69-70 | ||||
| 71-116 | ||||
| Note: | These consolidated financial statements have not been reviewed, or confirmed for accuracy or relevance by the Federal Deposit Insurance Corporation. |
62
Table of Contents
Report of Independent Registered Public Accounting Firm
To the Board of Directors and Shareholders
PremierWest Bancorp and Subsidiary
We have audited the accompanying consolidated balance sheets of PremierWest Bancorp and Subsidiary (the Company) as of December 31, 2010 and 2009, and the related consolidated statements of operations, changes in shareholders’ equity and comprehensive loss, and cash flows for each of the three years in the period ended December 31, 2010. We also have audited the Company’s internal control over financial reporting as of December 31, 2010, based on criteria established by the Committee of Sponsoring Organizations of the Treadway Commission (COSO) in Internal Control - Integrated Framework. The Company’s management is responsible for these financial statements, for maintaining effective internal control over financial reporting, and for its assessment of the effectiveness of internal control over financial reporting included in the accompanying Management’s Report on Internal Controls over Financial Reporting. Our responsibility is to express an opinion on these financial statements and an opinion on the Company’s internal control over financial reporting based on our audits.
We conducted our audits in accordance with auditing standards of the Public Company Accounting Oversight Board (United States). Those standards require that we plan and perform the audits to obtain reasonable assurance about whether the financial statements are free of material misstatement and whether effective internal control over financial reporting was maintained in all material respects. Our audits of the financial statements included examining, on a test basis, evidence supporting the amounts and disclosures in the financial statements, assessing the accounting principles used and significant estimates made by management, and evaluating the overall financial statement presentation. Our audit of internal control over financial reporting included obtaining an understanding of internal control over financial reporting, assessing the risk that a material weakness exists, and testing and evaluating the design and operating effectiveness of internal control based on the assessed risk. Our audits also included performing such other procedures as we considered necessary in the circumstances. We believe that our audits provide a reasonable basis for our opinions.
A Company’s internal control over financial reporting is a process designed to provide reasonable assurance regarding the reliability of financial reporting and the preparation of financial statements for external purposes in accordance with generally accepted accounting principles. A Company’s internal control over financial reporting includes those policies and procedures that (1) pertain to the maintenance of records that, in reasonable detail, accurately and fairly reflect the transactions and dispositions of the assets of the company; (2) provide reasonable assurance that transactions are recorded as necessary to permit preparation of financial statements in accordance with generally accepted accounting principles, and that receipts and expenditures of the company are being made only in accordance with authorizations of management and directors of the company; and (3) provide reasonable assurance regarding prevention or timely detection of unauthorized acquisition, use, or disposition of the company’s assets that could have a material effect on the financial statements.
Because of its inherent limitations, internal control over financial reporting may not prevent or detect misstatements. Also, projections of any evaluation of effectiveness to future periods are subject to the risk that controls may become inadequate because of changes in conditions, or that the degree of compliance with the policies or procedures may deteriorate.
63
Table of Contents
In our opinion, the financial statements referred to above present fairly, in all material respects, the consolidated financial position of PremierWest Bancorp and Subsidiary as of December 31, 2010 and 2009, and the consolidated results of their operations and their cash flows for each of the three years in the period ended December 31, 2010, in conformity with accounting principles generally accepted in the United States of America. Also in our opinion, PremierWest Bancorp and Subsidiary maintained, in all material respects, effective internal control over financial reporting as of December 31, 2010, based on criteria set forth by the Committee of Sponsoring Organizations of the Treadway Commission (COSO) in Internal Control - Integrated Framework.
/s/ Moss Adams LLP
Portland, Oregon
March 16, 2011
64
Table of Contents
PREMIERWEST BANCORP AND SUBSIDIARY
CONSOLIDATED BALANCE SHEETS
| December 31, 2010 |
December 31, 2009 |
|||||||
| (Dollars in Thousands) | ||||||||
| ASSETS | ||||||||
| Cash and cash equivalents: |
||||||||
| Cash and due from banks |
$ | 21,716 | $ | 33,092 | ||||
| Federal funds sold |
3,085 | 69,855 | ||||||
| Interest-bearing deposits |
114,173 | 168 | ||||||
| Total cash and cash equivalents |
138,974 | 103,115 | ||||||
| Interest-bearing certificates of deposit (original maturities greater than 90 days) |
1,500 | 50,650 | ||||||
| Investments: |
||||||||
| Investment securities available-for-sale, at fair market value |
183,683 | 114,937 | ||||||
| Investment securities held-to-maturity, at amortized cost (fair value of $29,615 at 12/31/10, $43,536 at 12/31/09) |
29,133 | 43,384 | ||||||
| Investment securities—Community Reinvestment Act |
2,000 | 4,000 | ||||||
| Restricted equity securities |
3,474 | 3,643 | ||||||
| Total investments |
218,290 | 165,964 | ||||||
| Mortgage loans held-for-sale |
929 | 1,731 | ||||||
| Loans, net of deferred loan fees |
976,795 | 1,148,127 | ||||||
| Allowance for loan losses |
(35,582 | ) | (45,903 | ) | ||||
| Loans, net |
941,213 | 1,102,224 | ||||||
| Premises and equipment, net of accumulated depreciation and amortization |
47,924 | 47,812 | ||||||
| Core deposit intangibles, net of amortization |
2,489 | 3,448 | ||||||
| Other real estate owned and foreclosed assets |
32,009 | 24,748 | ||||||
| Accrued interest and other assets |
27,892 | 36,622 | ||||||
| TOTAL ASSETS |
$ | 1,411,220 | $ | 1,536,314 | ||||
| LIABILITIES AND SHAREHOLDERS’ EQUITY | ||||||||
| LIABILITIES |
||||||||
| Deposits: |
||||||||
| Demand |
$ | 242,631 | $ | 256,167 | ||||
| Interest-bearing demand and savings |
469,897 | 520,719 | ||||||
| Time deposits |
553,721 | 643,876 | ||||||
| Total deposits |
1,266,249 | 1,420,762 | ||||||
| Federal Home Loan Bank borrowings |
22 | 28 | ||||||
| Junior subordinated debentures |
30,928 | 30,928 | ||||||
| Accrued interest and other liabilities |
17,013 | 13,061 | ||||||
| Total liabilities |
1,314,212 | 1,464,779 | ||||||
| COMMITMENTS AND CONTINGENCIES (Note 18) |
||||||||
| SHAREHOLDERS’ EQUITY |
||||||||
| Series B Preferred Stock, net of unamortized discount, no par value (liquidation preference $1,000 per share), 41,400 shares authorized, issued and outstanding |
39,946 | 39,561 | ||||||
| Common stock—no par value; 150,000,000 shares authorized; 10,034,830 shares issued and outstanding (2,477,193 at 12/31/09) |
208,324 | 175,449 | ||||||
| Accumulated deficit |
(152,202 | ) | (144,710 | ) | ||||
| Accumulated other comprehensive income |
940 | 1,235 | ||||||
| Total shareholders’ equity |
97,008 | 71,535 | ||||||
| TOTAL LIABILITIES AND SHAREHOLDERS’ EQUITY |
$ | 1,411,220 | $ | 1,536,314 | ||||
See accompanying notes.
65
Table of Contents
PREMIERWEST BANCORP AND SUBSIDIARY
CONSOLIDATED STATEMENTS OF OPERATIONS
| December 31, 2010 |
December 31, 2009 |
December 31, 2008 |
||||||||||
| (Dollars in Thousands, Except for Loss per Share Data) |
||||||||||||
| INTEREST AND DIVIDEND INCOME |
||||||||||||
| Interest and fees on loans |
$ | 63,695 | $ | 74,892 | $ | 87,587 | ||||||
| Interest on investments: |
||||||||||||
| Taxable |
4,808 | 2,401 | 996 | |||||||||
| Nontaxable |
197 | 139 | 150 | |||||||||
| Interest on federal funds sold |
45 | 175 | 69 | |||||||||
| Other interest and dividends |
269 | 308 | 134 | |||||||||
| Total interest and dividend income |
69,014 | 77,915 | 88,936 | |||||||||
| INTEREST EXPENSE |
||||||||||||
| Deposits: |
||||||||||||
| Interest-bearing demand and savings |
2,372 | 4,245 | 6,912 | |||||||||
| Time |
9,599 | 13,896 | 19,432 | |||||||||
| Federal funds purchased |
— | 14 | 424 | |||||||||
| Federal Home Loan Bank advances |
2 | 19 | 80 | |||||||||
| Junior subordinated debentures |
1,101 | 1,794 | 1,725 | |||||||||
| Total interest expense |
13,074 | 19,968 | 28,573 | |||||||||
| Net interest income |
55,940 | 57,947 | 60,363 | |||||||||
| LOAN LOSS PROVISION |
10,050 | 88,031 | 36,500 | |||||||||
| Net interest income (loss) after loan loss provision |
45,890 | (30,084 | ) | 23,863 | ||||||||
| NON-INTEREST INCOME |
||||||||||||
| Service charges on deposits accounts |
4,175 | 5,286 | 5,129 | |||||||||
| Other commissions and fees |
2,829 | 2,813 | 2,269 | |||||||||
| Investment brokerage and annuity fees |
1,554 | 1,285 | 1,454 | |||||||||
| Mortgage banking fees |
385 | 676 | 462 | |||||||||
| Other non-interest income |
2,356 | 992 | 920 | |||||||||
| Total non-interest income |
11,299 | 11,052 | 10,234 | |||||||||
| NON-INTEREST EXPENSE |
||||||||||||
| Salaries and employee benefits |
28,420 | 28,260 | 26,782 | |||||||||
| Net occupancy and equipment |
7,675 | 7,584 | 7,607 | |||||||||
| Net cost of operations of other real estate owned and foreclosed assets and problem loan expenses |
7,231 | 2,504 | — | |||||||||
| FDIC and state assessments |
4,670 | 3,631 | 1,056 | |||||||||
| Professional fees |
2,836 | 2,250 | 1,288 | |||||||||
| Communications |
1,973 | 2,051 | 2,078 | |||||||||
| Advertising |
801 | 894 | 906 | |||||||||
| Goodwill impairment |
— | 74,920 | — | |||||||||
| Other non-interest expense |
8,408 | 7,628 | 7,412 | |||||||||
| Total non-interest expense |
62,014 | 129,722 | 47,129 | |||||||||
| LOSS BEFORE BENEFIT FOR INCOME TAXES |
(4,825 | ) | (148,754 | ) | (13,032 | ) | ||||||
| PROVISION (BENEFIT) FOR INCOME TAXES |
134 | (2,282 | ) | (5,493 | ) | |||||||
| NET LOSS |
(4,959 | ) | (146,472 | ) | (7,539 | ) | ||||||
| PREFERRED STOCK DIVIDENDS AND DISCOUNT ACCRETION |
2,533 | 2,171 | 275 | |||||||||
| NET LOSS APPLICABLE TO COMMON SHAREHOLDERS |
$ | (7,492 | ) | $ | (148,643 | ) | $ | (7,814 | ) | |||
| LOSS PER COMMON SHARE: |
||||||||||||
| BASIC |
$ | (0.90 | ) | $ | (60.07 | ) | $ | (3.36 | ) | |||
| DILUTED |
$ | (0.90 | ) | $ | (60.07 | ) | $ | (3.36 | ) | |||
See accompanying notes.
66
Table of Contents
PREMIERWEST BANCORP AND SUBSIDIARY
CONSOLIDATED STATEMENTS OF CHANGES IN SHAREHOLDERS’ EQUITY
AND COMPREHENSIVE INCOME (LOSS)
| Preferred Stock | Common Stock | Retained Earnings (Accumulated Deficit) |
Accumulated Other Comprehensive Income |
Total Shareholders’ Equity |
Comprehensive Loss |
|||||||||||||||||||||||||||
| Shares | Amount | Shares | Amount | |||||||||||||||||||||||||||||
| (Dollars in Thousands, Except Share Amounts) | ||||||||||||||||||||||||||||||||
| BALANCE—DECEMBER 31, 2007 |
11,000 | $ | 9,590 | 1,698,750 | $ | 97,266 | $ | 20,759 | $ | 60 | 127,675 | |||||||||||||||||||||
| Comprehensive loss: |
||||||||||||||||||||||||||||||||
| Net loss |
— | — | — | — | (7,539 | ) | — | (7,539 | ) | $ | (7,539 | ) | ||||||||||||||||||||
| Other comprehensive loss— Change in fair value of securities available-for-sale |
— | — | — | — | — | (21 | ) | (21 | ) | (21 | ) | |||||||||||||||||||||
| Comprehensive loss |
$ | (7,560 | ) | |||||||||||||||||||||||||||||
| Preferred stock dividend declared |
— | — | — | — | (275 | ) | — | (275 | ) | |||||||||||||||||||||||
| Common stock cash dividend declared |
— | — | — | — | (4,032 | ) | — | (4,032 | ) | |||||||||||||||||||||||
| Stock-based compensation expense |
— | — | — | 433 | — | — | 433 | |||||||||||||||||||||||||
| Repurchase of common stock |
— | — | (4,080 | ) | (435 | ) | — | — | (435 | ) | ||||||||||||||||||||||
| Stockmans Bank Acquisition |
— | — | 535,740 | 60,967 | — | — | 60,967 | |||||||||||||||||||||||||
| Stock options exercised |
— | — | 1,297 | 66 | — | — | 66 | |||||||||||||||||||||||||
| Stock options exercised (Note 22) |
— | — | 18,996 | 1,115 | — | — | 1,115 | |||||||||||||||||||||||||
| Shares exchanged in payment of option exercise consideration |
— | — | (10,260 | ) | (1,108 | ) | — | — | (1,108 | ) | ||||||||||||||||||||||
| Income tax benefit of stock options exercised |
— | — | — | 138 | — | — | 138 | |||||||||||||||||||||||||
| Preferred stock converted to common |
(11,000 | ) | (9,590 | ) | 116,992 | 9,590 | — | — | — | |||||||||||||||||||||||
| BALANCE—December 31, 2008 |
— | — | 2,357,435 | 168,032 | 8,913 | 39 | 176,984 | |||||||||||||||||||||||||
| Comprehensive loss: |
||||||||||||||||||||||||||||||||
| Net loss |
— | — | — | — | (146,472 | ) | — | (146,472 | ) | $ | (146,472 | ) | ||||||||||||||||||||
| Other comprehensive income— Change in fair value of securities available-for-sale |
— | — | — | — | — | 787 | 787 | 787 | ||||||||||||||||||||||||
| Amortization of unrealized gains for investment securities transferred to held-to-maturity |
— | — | — | — | — | 409 | 409 | 409 | ||||||||||||||||||||||||
| Comprehensive loss |
$ | (145,276 | ) | |||||||||||||||||||||||||||||
| Preferred stock dividend paid |
— | — | — | — | (1,047 | ) | — | (1,047 | ) | |||||||||||||||||||||||
| Preferred stock dividend accrued |
— | — | — | — | (784 | ) | — | (784 | ) | |||||||||||||||||||||||
| Common stock dividend (5%) |
— | — | 117,871 | 4,741 | (4,741 | ) | — | — | ||||||||||||||||||||||||
| Common stock cash dividend |
— | — | — | — | (236 | ) | — | (236 | ) | |||||||||||||||||||||||
| Cash paid for fractional shares |
— | — | — | — | (3 | ) | — | (3 | ) | |||||||||||||||||||||||
| Stock-based compensation expense |
— | — | — | 448 | — | — | 448 | |||||||||||||||||||||||||
| Stock options exercised and issuance of restricted stock |
— | — | 1,887 | 49 | — | — | 49 | |||||||||||||||||||||||||
| Issuance of Series B preferred stock to U.S. Treasury, and accretion of discount |
41,400 | 39,561 | — | — | (340 | ) | — | 39,221 | ||||||||||||||||||||||||
| Issuance of warrant to U.S. Treasury |
— | — | — | 2,179 | — | — | 2,179 | |||||||||||||||||||||||||
| BALANCE—December 31, 2009 |
41,400 | 39,561 | 2,477,193 | 175,449 | (144,710 | ) | 1,235 | 71,535 | ||||||||||||||||||||||||
67
Table of Contents
PREMIERWEST BANCORP AND SUBSIDIARY
CONSOLIDATED STATEMENTS OF CHANGES IN SHAREHOLDERS’ EQUITY
AND COMPREHENSIVE INCOME (LOSS)—(continued)
| Preferred Stock | Common Stock | Retained Earnings (Accumulated Deficit) |
Accumulated Other Comprehensive Income |
Total Shareholders’ Equity |
Comprehensive Loss |
|||||||||||||||||||||||||||
| Shares | Amount | Shares | Amount | |||||||||||||||||||||||||||||
| (Dollars in Thousands, Except Share Amounts) | ||||||||||||||||||||||||||||||||
| Comprehensive loss: |
||||||||||||||||||||||||||||||||
| Net loss |
— | — | — | — | (4,959 | ) | — | (4,959 | ) | $ | (4,959 | ) | ||||||||||||||||||||
| Other comprehensive loss—Change in fair value of securities available-for-sale |
— | — | — | — | — | (285 | ) | (285 | ) | (285 | ) | |||||||||||||||||||||
| Amortization of unrealized gains for investment securities transferred to held-to-maturity |
— | — | — | — | — | (10 | ) | (10 | ) | (10 | ) | |||||||||||||||||||||
| Comprehensive loss |
$ | (5,254 | ) | |||||||||||||||||||||||||||||
| Preferred stock dividend accrued |
— | — | — | — | (2,148 | ) | — | (2,148 | ) | |||||||||||||||||||||||
| Stock offering |
— | — | 7,557,637 | 32,503 | — | — | 32,503 | |||||||||||||||||||||||||
| Stock-based compensation expense |
— | — | — | 372 | — | — | 372 | |||||||||||||||||||||||||
| Accretion of discount from Series B preferred stock |
— | 385 | — | — | (385 | ) | — | — | ||||||||||||||||||||||||
| BALANCE—December 31, 2010 |
41,400 | $ | 39,946 | 10,034,830 | $ | 208,324 | $ | (152,202 | ) | $ | 940 | $ | 97,008 | |||||||||||||||||||
See accompanying notes.
68
Table of Contents
PREMIERWEST BANCORP AND SUBSIDIARY
CONSOLIDATED STATEMENTS OF CASH FLOWS
| For The Years Ended | ||||||||||||
| December 31, 2010 |
December 31, 2009 |
December 31, 2008 |
||||||||||
| (Dollars in Thousands) | ||||||||||||
| CASH FLOWS FROM OPERATING ACTIVITIES: |
||||||||||||
| Net loss |
$ | (4,959 | ) | $ | (146,472 | ) | $ | (7,539 | ) | |||
| Adjustments to reconcile net loss to net cash from operating activities: |
||||||||||||
| Depreciation and amortization |
3,856 | 3,907 | 3,894 | |||||||||
| Impairment of goodwill |
— | 74,920 | — | |||||||||
| Loan loss provision |
10,050 | 88,031 | 36,500 | |||||||||
| Deferred income taxes |
— | 5,580 | 771 | |||||||||
| Amortization of premiums and accretion of discounts on investment securities, net |
2,378 | 923 | 104 | |||||||||
| Gain on sale of investments |
(732 | ) | (50 | ) | — | |||||||
| Funding of loans held-for-sale |
(18,681 | ) | (35,455 | ) | (24,536 | ) | ||||||
| Sale of loans held-for-sale |
19,867 | 34,707 | 25,251 | |||||||||
| Gain on sale of loans held-for-sale |
(384 | ) | (675 | ) | (454 | ) | ||||||
| Change in BOLI value (net of benefit obligations) |
383 | (553 | ) | (2,624 | ) | |||||||
| Stock-based compensation expense |
372 | 448 | 433 | |||||||||
| Excess tax benefit from stock options exercised |
— | — | (76 | ) | ||||||||
| Loss (gain) on sales of premises and equipment |
409 | (94 | ) | (30 | ) | |||||||
| Gain on sale of other real estate owned and foreclosed assets |
(1,735 | ) | (343 | ) | — | |||||||
| Write down of other real estate owned due to impairment |
5,347 | 1,507 | — | |||||||||
| Write down of low income housing tax credit investment |
177 | 152 | 197 | |||||||||
| Changes in accrued interest receivable/payable and other assets/liabilities |
10,431 | 1,135 | (10,813 | ) | ||||||||
| Net cash provided by operating activities |
26,779 | 27,668 | 21,078 | |||||||||
| CASH FLOWS FROM INVESTING ACTIVITIES: |
||||||||||||
| Purchase of interest-bearing certificates of deposit |
(33,100 | ) | (50,452 | ) | — | |||||||
| Proceeds from interest-bearing certificates of deposit |
82,250 | — | — | |||||||||
| Purchase of investment securities available-for-sale |
(189,989 | ) | (144,461 | ) | — | |||||||
| Proceeds from principal payments received on securities available-for-sale |
29,300 | 6,143 | — | |||||||||
| Proceeds from sale of securities available-for-sale |
81,158 | 24,079 | 34 | |||||||||
| Purchase of investment securities held-to-maturity |
(3,517 | ) | (46,031 | ) | (29,632 | ) | ||||||
| Proceeds from principal payments received on securities held-to-maturity |
18,610 | 164 | — | |||||||||
| Proceeds from maturities and calls of investment securities available-for-sale |
9,000 | — | — | |||||||||
| Proceeds from maturities and calls of investment securities held-to-maturity |
1,002 | 34,440 | 33,316 | |||||||||
| Purchase of Community Reinvestment Act investments |
— | — | (4,000 | ) | ||||||||
| Proceeds from FHLB stock redemption |
169 | — | 304 | |||||||||
| Loan (originations) payments, net |
120,342 | 11,657 | (54,248 | ) | ||||||||
| Purchase of premises and equipment |
(3,461 | ) | (2,268 | ) | (2,950 | ) | ||||||
| Proceeds from disposal of premises and equipment |
4 | 534 | — | |||||||||
| Purchase of low income housing tax credit investment |
(418 | ) | (897 | ) | (1,008 | ) | ||||||
| Purchase of improvements for other real estate owned and foreclosed assets |
(464 | ) | (671 | ) | — | |||||||
| Proceeds from sale of other real estate owned and foreclosed assets |
20,210 | 7,485 | — | |||||||||
| Cash received, net of cash paid for acquision of Stockmans Financial Group |
— | — | 95,438 | |||||||||
| Cash received, net of cash paid for acquision of Wachovia branches |
— | 334,718 | — | |||||||||
| Net cash provided by investing activities |
131,096 | 174,440 | 37,254 | |||||||||
69
Table of Contents
PREMIERWEST BANCORP AND SUBSIDIARY
CONSOLIDATED STATEMENTS OF CASH FLOWS—(continued)
| For The Years Ended | ||||||||||||
| December 31, 2010 |
December 31, 2009 |
December 31, 2008 |
||||||||||
| (Dollars in Thousands) | ||||||||||||
| CASH FLOWS FROM FINANCING ACTIVITIES: |
||||||||||||
| Net decrease in deposits |
(154,513 | ) | (132,891 | ) | (21,040 | ) | ||||||
| Net decrease in Federal Home Loan Bank borrowings |
(6 | ) | (20,014 | ) | (12,584 | ) | ||||||
| Net decrease in Federal Funds purchased |
— | (25,003 | ) | (29,016 | ) | |||||||
| Repurchase of common stock |
— | — | (435 | ) | ||||||||
| Cash received from stock offerings, net of costs |
32,503 | — | — | |||||||||
| Dividends paid on common stock |
— | (236 | ) | (5,051 | ) | |||||||
| Dividends paid on preferred stock |
— | (1,047 | ) | (275 | ) | |||||||
| Cash paid for fractional shares relating to stock dividend |
— | (3 | ) | — | ||||||||
| Stock options exercised |
— | 49 | 73 | |||||||||
| Excess tax benefit from stock options exercised |
— | — | 76 | |||||||||
| Proceeds from issuance of preferred stock |
— | 41,400 | — | |||||||||
| Net cash used in financing activities |
(122,016 | ) | (137,745 | ) | (68,252 | ) | ||||||
| NET INCREASE (DECREASE) IN CASH AND CASH EQUIVALENTS |
35,859 | 64,363 | (9,920 | ) | ||||||||
| CASH AND CASH EQUIVALENTS—Beginning of the period |
103,115 | 38,752 | 48,672 | |||||||||
| CASH AND CASH EQUIVALENTS—End of the period |
$ | 138,974 | $ | 103,115 | $ | 38,752 | ||||||
| SUPPLEMENTAL DISCLOSURE OF CASH FLOW INFORMATION |
||||||||||||
| Cash paid for interest |
$ | 12,328 | $ | 20,257 | $ | 28,428 | ||||||
| Cash paid for taxes |
$ | 50 | $ | 650 | $ | 4,885 | ||||||
| SUPPLEMENTAL DISCLOSURE OF NONCASH INVESTING AND FINANCING ACTIVITIES: |
||||||||||||
| Transfers of loans to other real estate owned and foreclosed assets |
$ | 30,619 | $ | 28,303 | $ | 4,423 | ||||||
| Income tax benefit of stock options exercised |
$ | — | $ | — | $ | 138 | ||||||
| Increase in goodwill resulting from acquisition of Stockmans Financial Group |
$ | — | $ | 37 | $ | 49,458 | ||||||
| Increase in goodwill resulting from acquisition of Wachovia branches |
$ | — | $ | 4,483 | $ | — | ||||||
| Preferred stock dividend accrued but not yet paid |
$ | 2,148 | $ | 784 | $ | 275 | ||||||
| Stock issued for acquisition of Stockmans Financial Group |
$ | — | $ | — | $ | 60,967 | ||||||
| Conversion of preferred stock to common stock |
$ | — | $ | — | $ | 9,590 | ||||||
| Trust preferred securities interest accrued but not yet paid |
$ | 1,610 | $ | — | $ | — | ||||||
| Accretion of preferred stock discount |
$ | 385 | $ | 340 | $ | — | ||||||
See accompanying notes.
70
Table of Contents
PREMIERWEST BANCORP AND SUBSIDIARY
NOTES TO CONSOLIDATED FINANCIAL STATEMENTS
NOTE 1—ORGANIZATION AND SUMMARY OF SIGNIFICANT ACCOUNTING POLICIES
Organization—The accompanying consolidated financial statements include the accounts of PremierWest Bancorp (the Company or PremierWest) and its wholly-owned subsidiary, PremierWest Bank (the Bank).
The Bank offers a full range of financial products and services through a network of 44 full service branch offices, 37 of which are located along the Interstate 5 freeway corridor between Roseburg, Oregon, and Sacramento, California. Of the 44 full service branch offices, 23 are located in Oregon (Jackson, Josephine, Deschutes, Douglas, and Klamath Counties) and 21 are located in California (Siskiyou, Shasta, Butte, Tehama, Sacramento, Yolo, and Nevada Counties). Effective April 30, 2010, four existing branches (one each in Douglas, Butte, Placer, and Sacramento counties) were closed and consolidated with existing PremierWest branches in close proximity. The Bank’s activities include the usual lending and deposit functions of a community oriented commercial bank: commercial, real estate, installment, and mortgage loans; checking, time deposit, and savings accounts; mortgage loan brokerage services; and automated teller machines (ATMs) and safe deposit facilities. The Bank has three subsidiaries: Premier Finance Company, PremierWest Investment Services, Inc., and Blue Star Properties, Inc. Premier Finance Company, has offices in Medford, Grants Pass, Roseburg, Klamath Falls, Eugene and Portland, Oregon and Redding, California and is engaged in the business of consumer lending. PremierWest Investment Services, Inc. operates throughout the Bank’s market area providing brokerage services for investment products including stocks, bonds, mutual funds and annuities. Blue Star Properties, Inc. serves solely to hold real estate properties for the Company but is currently inactive.
In December 2004, the Company established PremierWest Statutory Trust I and II (the Trusts), as wholly-owned Delaware statutory business trusts, for the purpose of issuing guaranteed individual beneficial interests in junior subordinated debentures “Trust Preferred Securities”. The Trusts issued $15.5 million in Trust Preferred Securities for the purpose of providing additional funding for operations and enhancing the Company’s consolidated regulatory capital. A third trust, the Stockmans Financial Trust I, in the amount of $15.5 million, was added in 2008 pursuant to the acquisition of Stockmans Financial Group. In accordance with the Financial Accounting Standards Board’s (“FASB”) “Consolidation” the Company has not included the Trusts in its consolidated financial statements. However, the junior subordinated debentures issued by the Company to the Trusts are reflected in the Company’s consolidated balance sheets.
The company issued a 1-for-10 reverse stock split on February 10, 2011. No stock dividend was declared in 2010. The Company declared a 5% stock dividend in January 2009. No stock dividend was declared in 2008. All per share amounts and calculations in the accompanying consolidated financial statements have been recalculated to reflect the effects of the reverse stock split and the 2009 stock dividend.
Method of accounting and use of estimates—The Company prepares its consolidated financial statements in conformity with accounting principles generally accepted in the United States of America and prevailing practices within the banking industry. The Company utilizes the accrual method of accounting, which recognizes income when earned and expenses when incurred. In preparation of the consolidated financial statements, all significant intercompany accounts and transactions have been eliminated.
The preparation of consolidated financial statements, in conformity with accounting principles generally accepted in the United States of America, requires management to make estimates and assumptions that affect the reported amounts of assets and liabilities, the disclosure of contingent assets and liabilities at the date of the consolidated financial statements and the reported amounts of income and expenses during the reporting periods. Actual results could differ from those estimates. Significant estimates made by management involve the calculation of the allowance for loan losses, valuation of impaired loans, the fair value of available-for-sale investment securities, the value of other real estate owned, determination of a deferred tax asset valuation allowance and the calculations involved in determining potential goodwill impairment.
71
Table of Contents
PREMIERWEST BANCORP AND SUBSIDIARY
NOTES TO CONSOLIDATED FINANCIAL STATEMENTS
NOTE 1—ORGANIZATION AND SUMMARY OF SIGNIFICANT ACCOUNTING POLICIES—(continued)
Cash and cash equivalents—For purposes of reporting cash flows, cash and cash equivalents include cash on hand, money market funds, amounts due from banks and federal funds sold. Generally, federal funds are sold for one-day periods. Cash and cash equivalents have an original maturity of 90 days or less.
The Bank maintains balances in correspondent bank accounts, which at times may exceed federally insured limits. Management believes that its risk of loss associated with such balances is minimal due to the financial strength of correspondent banks. The Bank has not experienced any losses in such accounts.
Investment securities—The Bank is required to specifically identify its investment securities as “available-for-sale”, “held-to-maturity” or “trading accounts.”
Securities are classified as available-for-sale if the Bank intends to hold those debt securities for an indefinite period of time, but not necessarily to maturity. Any decision to sell a security classified as available-for-sale would be based on various factors such as (1) changes in market interest rates and related changes in the prepayment risk, (2) needs for liquidity, (3) changes in the availability of and the yield on alternative instruments, and (4) changes in funding sources and terms. Unrealized holding gains and losses, net of tax, on available-for-sale securities are reported as other comprehensive income and carried as accumulated comprehensive income or loss within shareholders’ equity until realized. Fair values for these investment securities are based on quoted market prices. Premiums and discounts are recognized in interest income using the effective interest method. Realized gains and losses are determined using the specific-identification method and included in earnings.
Securities are classified as held-to-maturity if the Bank has both the intent and ability to hold those debt securities to maturity regardless of changes in market conditions, liquidity needs or changes in general economic conditions. These securities are carried at cost adjusted for amortization of premium or accretion of discount computed using the effective interest method.
PremierWest Bancorp’s investment policy does not permit Management to purchase securities for the purpose of trading. Accordingly, no securities were classified as trading securities during the periods reported.
Upon transfers of securities from the available-for-sale classification to the held-to-maturity classification, the Bank ceases to recognize unrealized gains and losses, net of deferred taxes, in other comprehensive income, and records the unrealized gain or loss at the time of transfer, net of related deferred taxes, as a premium or discount on the related security. The unrealized gain or loss at the time of transfer is then amortized or accreted as an adjustment to yield from the date of transfer through the maturity date of each security transferred. The amortization or accretion of the unrealized gain or loss reported in shareholders’ equity will offset or mitigate the effect on interest income resulting from the transfer of available-for-sale securities to the held-to-maturity classification.
Prior to the second quarter of 2009, the Company would assess an other-than-temporary impairment (“OTTI”) or permanent impairment based on the nature of the decline and whether the Company has the ability and intent to hold the investments until a market price recovery. If the Company determined a security to be other-than-temporary or permanently impaired, the full amount of the impairment would be recognized through earnings in its entirety. New guidance related to the recognition and presentation of OTTI of debt securities became effective in the second quarter of 2009. Rather than asserting whether a Company has the ability and intent to hold an investment until a market price recovery, a company must consider whether it intends to sell a security or if it is
72
Table of Contents
PREMIERWEST BANCORP AND SUBSIDIARY
NOTES TO CONSOLIDATED FINANCIAL STATEMENTS
NOTE 1—ORGANIZATION AND SUMMARY OF SIGNIFICANT ACCOUNTING POLICIES—(continued)
unlikely that they would be required to sell the security before recovery of the amortized cost basis of the investment, which may be at maturity. For debt securities, if we intend to sell the security or it is likely that we will be required to sell the security before recovering its cost basis, the entire impairment loss would be recognized in earnings as an OTTI. If we do not intend to sell the security and it is not likely that we will be required to sell the security but we do not expect to recover the entire amortized cost basis of the security, only the portion of the impairment loss representing credit losses would be recognized in earnings. The credit loss on a security is measured as the difference between the amortized cost basis and the present value of the cash flows expected to be collected. Projected cash flows are discounted by the original or current effective interest rate depending on the nature of the security being measured for potential OTTI. The remaining impairment related to all other factors, the difference between the present value of the cash flows expected to be collected and fair value, is recognized as a charge to other comprehensive income (“OCI”). Impairment losses related to all other factors are presented as separate categories within OCI. For investment securities held-to-maturity, this amount is accreted over the remaining life of the debt security prospectively based on the amount and timing of future estimated cash flows. The accretion of the amount recorded in OCI increases the carrying value of the investment and does not affect earnings. If there is an indication of additional credit losses, the security is re-evaluated according to the procedures described above. No OTTI losses were recognized in the years ended December 31, 2010, 2009 and 2008.
At each financial statement date, Management assesses each investment to determine if impaired investments are temporarily impaired or if the impairment is other-than-temporary based upon the positive and negative evidence available. Evidence evaluated includes, but is not limited to, industry analyst reports, credit market conditions and interest rate trends. A decline in the market value of any security below cost that is deemed other-than-temporary results in a charge to earnings and the corresponding establishment of a new cost basis for the security.
Restricted equity securities—The Bank’s investment in Federal Home Loan Bank of Seattle (“FHLB”) stock is recorded as a restricted equity security and carried at par value, which approximates fair value. As a member of the FHLB system, the Bank is required to maintain a minimum level of investment in FHLB stock based on specific percentages of its outstanding mortgages, total assets, or FHLB advances. At December 31, 2010 and 2009, the Bank met its minimum required investment. The Bank may request redemption at par value of any FHLB stock in excess of the minimum required investment. Stock redemptions are at the discretion of the FHLB.
As required of all members of the Federal Home Loan Bank of Seattle (FHLB) system, the Company maintains investment in the capital stock of the FHLB in an amount equal to the greater of $500 or 0.5% of home mortgage loans and pass-through securities plus 5.0% of the outstanding balance of mortgage home loans sold to FHLB under the Mortgage Purchase Program. The FHLB system, the largest government sponsored entity in the United States, is made up of 12 regional banks, including the FHLB of Seattle. Participating banks record the value of FHLB stock equal to its par value at $100 per share. The Company is required to hold FHLB’s stock in order to receive advances and views this investment as long-term. Thus, when evaluating it for impairment, the value is determined based on the ultimate recoverability of cost through redemption by the FHLB or from the sale to another member, rather than by recognizing temporary declines in value. The FHLB disclosed that it incurred net losses in its fiscal year 2009, suspended dividend payments to its members and remains undercapitalized as of December 31, 2010. The Company has concluded that its investment in FHLB is not impaired as of December 31, 2010, and believes that it will ultimately recover the par value of its investment in this stock.
The Bank also owns stock in Pacific Coast Banker’s Bank (“PCBB”). The investment in PCBB is carried at cost. Pacific Coast Banker’s Bank operates under a special purpose charter to provide wholesale correspondent
73
Table of Contents
PREMIERWEST BANCORP AND SUBSIDIARY
NOTES TO CONSOLIDATED FINANCIAL STATEMENTS
NOTE 1—ORGANIZATION AND SUMMARY OF SIGNIFICANT ACCOUNTING POLICIES—(continued)
banking services to depository institutions. By statute, 100% of PCBB’s outstanding stock is held by depository institutions that utilize its correspondent banking services.
Investments in limited partnerships—The Bank has a minority interest (less than 10%) in two limited partnerships that own and operate affordable housing projects. Investments in these projects serve as an element of the Bank’s compliance with the Community Reinvestment Act, and the Bank receives tax benefits in the form of deductions for operating losses and tax credits. The tax credits may be used to reduce taxes currently payable or may be carried back one year or forward 20 years to recapture or reduce taxes. The credits are recorded in the years they become available to reduce income taxes.
Mortgage loans held-for-sale—Mortgage loans held-for-sale are reported at the lower of cost or market value. Gains or losses on the sale of loans that are held-for-sale are recognized at the time of sale and determined by the difference between net sale proceeds and the net book value of the loans less the estimated fair value of any retained mortgage servicing rights. The Bank currently does not retain mortgage servicing rights.
Transfer of Financial Asset—In the normal course of business, the Bank participates portions of loans to third parties in order to extend the Bank’s lending capacity or to mitigate risk.
Loans and the allowance for loan losses—Loans are stated at the amount of unpaid principal reduced by the allowance for loan losses, deferred loan fees, and restructuring concessions. The allowance for loan losses represents Management’s recognition of the assumed risks of extending credit and the quality of the existing loan portfolio. The allowance is established to absorb known and inherent losses in the loan portfolio as of the balance sheet date. The allowance is maintained at a level considered adequate to provide for probable loan losses based on Management’s assessment of various factors affecting the portfolio. Such factors include historical loss experience; review of problem loans; underlying collateral values and guarantees; current economic conditions; legal representation regarding the outcome of pending legal action for collection of loans and related loan guarantees; and an overall evaluation of the quality, risk characteristics and concentration of loans in the portfolio. The allowance is based on estimates and ultimate losses may vary from the current estimates. These estimates are reviewed periodically and as adjustments become necessary, they are reported in operations in the periods in which they become known. The allowance is increased by provisions charged to operations and reduced by loans charged-off, net of recoveries.
In some instances, the Company modifies or restructures loans to amend the interest rate and/or extend the maturity. Such amendments are generally consistent with the terms of newly booked loans reflecting current standards for amortization and interest rates and do not represent concessions to the borrowers.
Various regulatory agencies, as an integral part of their examination process, periodically review the Bank’s allowance for loan losses. Such agencies may require the Bank to recognize additions to the allowance based on their judgment of the information available to them at the time of their examinations.
The Bank considers loans to be impaired when Management believes based on current information that it is probable that all amounts due will not be collected according to the contractual terms. Impairment is measured on a loan-by-loan basis by either the present value of expected future cash flows discounted at the loan’s effective interest rate, the loan’s obtainable market price, or the fair value of the loan’s underlying collateral less estimated costs to sell or related guarantee. Since a significant portion of the Bank’s loans are collateralized by real estate, the Bank primarily measures impairment based on the estimated fair value of the underlying collateral or related guarantee. In certain other cases, impairment is measured based on the present value of expected future cash flows discounted at the loan’s effective interest rate. Amounts deemed impaired are either specifically allocated for in the allowance for loan losses or reflected as a partial charge-off of the loan balance. Smaller balance
74
Table of Contents
PREMIERWEST BANCORP AND SUBSIDIARY
NOTES TO CONSOLIDATED FINANCIAL STATEMENTS
NOTE 1—ORGANIZATION AND SUMMARY OF SIGNIFICANT ACCOUNTING POLICIES—(continued)
homogeneous loans (typically, installment loans) are collectively evaluated for impairment. Accordingly, the Bank does not separately identify individual installment loans for impairment disclosures. Generally, the Bank evaluates a loan for impairment when it is placed on non-accrual status. All of the Bank’s impaired loans were on non-accrual status at December 31, 2010. After considering the borrower’s financial condition, the loan’s collateral position, collection efforts and other pertinent factors, impaired loans and other loans are charged to the allowance when the Bank believes that collection of future payments of principal is not probable.
Loans are reported as troubled debt restructurings (“TDR”) when the Bank grants a concession(s) to a borrower experiencing financial difficulties that it would not otherwise consider. Examples of such concessions include forgiveness of principal or accrued interest, extending the maturity date(s) or providing a lower interest rate than would be normally available for a transaction of similar risk. As a result of these concessions, restructured loans are impaired as the Bank will not collect all amounts due, both principal and interest, in accordance with the terms of the original loan agreement. Impairment reserves on non-collateral dependent restructured loans are measured by comparing the present value of expected future cash flows on the restructured loans discounted at the interest rate of the original loan agreement to the loan’s carrying value. These impairment reserves are recognized as a specific component to be provided for in the allowance for loan losses.
Interest income on all loans is accrued as earned. The accrual of interest on impaired loans is discontinued when, in Management’s opinion, the borrower may be unable to make payments as they become due. When interest accrual is discontinued, all unpaid accrued interest is reversed. Non-accrual loans are returned to accrual status when the loans are paid current as to principal and interest and future payments are expected to be made in accordance with the contractual terms of the loan.
Loan origination and commitment fees, net of certain direct loan origination costs, are capitalized as an offset to the outstanding loan balance and recognized as an adjustment of the yield of the related loan.
Premises and equipment—Premises and equipment are stated at cost, less accumulated depreciation and amortization. Depreciation and amortization of premises and equipment is computed by the straight-line method over the shorter of the estimated useful lives of the assets or terms of underlying leases. Estimated useful lives range from 3 to 15 years for furniture, equipment, and leasehold improvements, and up to 40 years for building premises. The required annual analysis of long-lived assets indicated that no impairment existed for the years ended December 31, 2010, 2009 and 2008.
Core deposit intangibles—Core deposit intangibles are amortized to their estimated residual values over their respective estimated useful lives and are also reviewed for impairment. The required annual analysis of the core deposit intangibles indicated that no impairment existed for the years ended December 31, 2010, 2009 and 2008.
Goodwill—Goodwill represents the excess of cost over the fair value of net assets acquired in business combinations. After completing the required annual analysis of goodwill in 2009, an impairment charge of $74.9 million was taken during the year ended December 31, 2009, to adjust the goodwill balance to zero.
Other real estate—Other real estate (“OREO”), acquired through foreclosure or deeds in lieu of foreclosure, is carried at the lower of cost or fair value, less estimated costs of disposal. When property is acquired, any excess of the loan balance over the fair value is charged to the allowance for loan losses. Holding costs, subsequent write-downs to fair value, if any, or any disposition gains or losses are included in non-interest expense. The Bank had $32.0 million in other real estate at December 31, 2010 and $24.7 million at December 31, 2009. The Bank held other foreclosed real estate not included in OREO of approximately $300,000 at December 31, 2009 and zero at December 31, 2010.
75
Table of Contents
PREMIERWEST BANCORP AND SUBSIDIARY
NOTES TO CONSOLIDATED FINANCIAL STATEMENTS
NOTE 1—ORGANIZATION AND SUMMARY OF SIGNIFICANT ACCOUNTING POLICIES—(continued)
Advertising—Advertising and promotional costs are generally charged to expense during the period in which they are incurred.
Income taxes—Income taxes are accounted for using the asset and liability method. Deferred income tax assets and liabilities are determined based on the tax effects of the differences between the book and tax bases of the various balance sheet assets and liabilities. Deferred tax assets and liabilities are reflected at currently enacted income tax rates applicable to the period in which the deferred tax assets or liabilities are expected to be realized or settled. As changes in tax laws or rates are enacted, deferred tax assets and liabilities are adjusted through the provision for income taxes. Valuation allowances are established to reduce the net carrying amount of deferred tax assets if it is determined to be more likely than not that all or some of the deferred tax asset will not be realized. At December 31, 2010, the net deferred tax asset balance was zero.
The Company had no unrecognized tax benefits at January 1, 2007, or at December 31, 2010, 2009, or 2008. During the years ended December 31, 2010 and 2009, the Company recognized no interest and penalties. The Company files income tax returns in the U.S. Federal jurisdiction, California and Oregon. The Company is no longer subject to U.S. or Oregon state examinations by tax authorities for years before 2007 and California state examinations for years before 2006.
Earnings (loss) per common share—Basic earnings (loss) per common share is computed by dividing net income (loss) available to common shareholders (net income (loss) less dividends declared on preferred stock and accretion of discount) by the weighted average number of common shares outstanding during the period, after giving retroactive effect to stock dividends and splits. Diluted earnings (loss) per common share is computed similar to basic earnings (loss) per common share except that the numerator is equal to net income (loss) available to common shareholders and the denominator is increased to include the number of additional common shares that would have been outstanding if dilutive potential common shares had been issued. Included in the denominator is the dilutive effect of stock options computed under the treasury stock method and the dilutive effect of convertible preferred stock as if converted to common stock.
Preferred stock—In accordance with the relevant accounting pronouncements and guidance from the Securities and Exchange Commission’s (the “SEC”) Office of the Chief Accountant, the Company recorded the issuance of the Preferred Stock and detachable Warrant pursuant to the U.S. Department of Treasury’s Troubled Asset Relief Capital Purchase Program (“TARP”) within shareholders’ equity on the Consolidated Balance Sheets. The Preferred Stock and detachable Warrant were initially recognized based on their relative fair values at the date of issuance. As a result, the Preferred Stock’s carrying value is at a discount to the liquidation value or stated value. In accordance with “Increasing Rate Preferred Stock,” the discount is considered an unstated dividend cost that shall be amortized over the period preceding commencement of the perpetual dividend using the effective interest method, by charging the imputed dividend cost against retained earnings and increasing the carrying amount of the Preferred Stock by a corresponding amount. The discount is therefore being amortized over five years using a 6.26% effective interest rate. The total stated dividends (whether or not declared) and unstated dividend cost combined represents a period’s total Preferred Stock dividend, which is deducted from net income to arrive at net loss available to common shareholders on the Consolidated Statements of Operations.
Stock-based compensation—The Company measures and recognizes as compensation expense the grant date fair market value for all share-based awards. That portion of the grant date fair market value that is ultimately expected to vest is recognized as expense over the requisite service period, typically the vesting period, utilizing the straight-line attribution method.
76
Table of Contents
PREMIERWEST BANCORP AND SUBSIDIARY
NOTES TO CONSOLIDATED FINANCIAL STATEMENTS
NOTE 1—ORGANIZATION AND SUMMARY OF SIGNIFICANT ACCOUNTING POLICIES—(continued)
The Company uses the Black-Scholes option-pricing model to value stock options. The Black-Scholes model requires the use of assumptions regarding the risk-free interest rate, expected dividend yield, the weighted average expected life of the options and the historical stock price volatility.
The risk-free rate for periods within the contractual life of the option is based on the U.S. Treasury yield curve in effect at the time of grant. Expected dividend yield is based on Management’s estimate at the time of grant. Three cash dividends were declared during fiscal year 2008 and one cash dividend was declared during fiscal year 2009. No cash dividends were declared during fiscal year 2010. Going forward in fiscal 2011, the Board of Directors will review the dividend policy on a quarter-by-quarter basis subject to regulatory approval. Cash dividends are not paid on unexercised options. The Company attempts to use historical data to estimate option exercise and employee termination behavior in order to estimate an expected life for each option grant. The expected life falls between the vesting period or requisite service period and the contractual term for the option. Two employee classes having similar exercise and termination behavior are used for valuation purposes. Those classes are “employees” and “executive officers and directors.” During 2010 for options granted to the “employees” class, the Company estimated an expected life of 7 years.
Cash flows from the tax benefits resulting from tax deductions in excess of the compensation expense recognized for stock options (excess tax benefits) are reported as financing cash flows. There were no excess tax benefits classified as financing cash inflows for the years ended December 31, 2010 and 2009. The excess tax benefits reported as operating cash flows for the year ended December 31, 2008 was $76,000.
Comprehensive income (loss)—Comprehensive income (loss) for the Company includes net income (loss) reported on the consolidated statements of operations, the amortization of unrealized gains for available-for-sale securities transferred to held-to-maturity, and changes in the fair value of available-for-sale investments, which are reported as a component of shareholders’ equity.
Off-balance sheet financial instruments—In the ordinary course of business, the Bank enters into off-balance sheet financial instruments consisting of commitments to extend credit, commercial letters of credit, and standby letters of credit. These financial instruments are recorded in the consolidated financial statements when they are funded or related fees are incurred or received.
Fair value of financial instruments—On January 1, 2008, the Company adopted Statement of Financial Accounting Standards “Fair Value Measurements.” This Standard defines fair value, establishes a framework for measuring fair value in generally accepted accounting principles and expands disclosures about fair value measurements. This Standard applies whenever other standards require (or permit) assets or liabilities to be measured at fair value but does not expand the use of fair value in any new circumstances. In this standard, the FASB clarifies the principle that fair value should be based on the assumptions market participants would use when pricing the asset or liability. In support of this principle, “Fair Value Measurements” established a fair value hierarchy that prioritizes the information used to develop those assumptions. The fair value hierarchy is as follows:
Level 1 inputs—Unadjusted quoted prices in active markets for identical assets or liabilities that the entity has the ability to access at the measurement date.
Level 2 inputs—Inputs other than quoted prices included in Level 1 that are observable for the asset or liability, either directly or indirectly. These might include quoted prices for similar assets and liabilities in active markets and inputs other than quoted prices that are observable for the asset or liability, such as interest rates and yield curves that are observable at commonly quoted intervals.
77
Table of Contents
PREMIERWEST BANCORP AND SUBSIDIARY
NOTES TO CONSOLIDATED FINANCIAL STATEMENTS
NOTE 1—ORGANIZATION AND SUMMARY OF SIGNIFICANT ACCOUNTING POLICIES—(continued)
Level 3 inputs—Unobservable inputs for determining the fair values of assets or liabilities that reflect an entity’s own assumptions about the assumptions that market participants would use in pricing the assets or liabilities.
The Company used the following methods and significant assumptions to estimate fair value for its assets measured and carried at fair value in the financial statements:
Investment securities available-for-sale—Fair values for investment securities are based on quoted market prices or the market values for comparable securities.
Impaired Loans—A loan is considered to be impaired when, based on current information and events, it is probable that the Company will be unable to collect all amounts due (both interest and principal) according to the contractual terms of the loan agreement. Impaired loans are evaluated and valued at the time the loan is identified as impaired, at the lower of cost or fair value. As a practical expedient, fair value may be measured based on a loan’s observable market price or the underlying collateral securing the loan. Collateral may be real estate or business assets including equipment. The value of collateral is determined based on independent appraisals.
Other Real Estate Owned and Foreclosed Assets—Real estate acquired through foreclosure, voluntary deed, or similar means is classified as other real estate owned (“OREO”) until it is sold. Foreclosed properties included as OREO are recorded at fair value less the cost to sell which becomes the property’s new basis. Any write-downs based on the asset’s fair value at the date of acquisition are charged to the allowance for loan losses. After foreclosure, management periodically performs valuations such that the real estate is carried at the lower of its new cost basis or fair value, net of estimated costs to sell. Certain assets held within this balance sheet caption represent impaired real estate that has been adjusted to its estimated fair value as a result of management’s periodic impairment evaluations using property appraisals from independent real estate appraisers.
The following methods and assumptions were used by the Bank in estimating fair values of assets and liabilities, in accordance with the provisions of Financial Accounting Standards Board, “Disclosures about Fair Value on Financial Instruments”:
Cash and cash equivalents—The carrying amounts of cash and short-term instruments approximate their fair value.
Interest-bearing deposits with FHLB and restricted equity securities—The carrying amount approximates the estimated fair value and expected redemption values.
Investment securities held-to-maturity—Fair values for investment securities are based on quoted market prices or the market values for comparable securities.
Loans held-for-sale—Loans held-for-sale include mortgage loans and are reported at the lower of cost or market value. Cost generally approximates market value, given the short duration of these assets. Gains or losses on the sale of loans that are held-for-sale are recognized at the time of the sale and determined by the difference between net sale proceeds and the net book value of the loans less the estimated fair value of any retained mortgage servicing rights.
Loans—For variable rate loans that re-price frequently and have no significant change in credit risk, fair values are based on carrying values. Fair values for certain mortgage loans (for example, one-to-four family residential),
78
Table of Contents
PREMIERWEST BANCORP AND SUBSIDIARY
NOTES TO CONSOLIDATED FINANCIAL STATEMENTS
NOTE 1—ORGANIZATION AND SUMMARY OF SIGNIFICANT ACCOUNTING POLICIES—(continued)
credit card loans and other consumer loans are based on quoted market prices of similar loans sold in conjunction with securitization transactions, adjusted for differences in loan characteristics. Fair values for commercial real estate and commercial loans are estimated using discounted cash flow analyses, using interest rates currently being offered for loans with similar terms to borrowers of similar credit quality. Fair values for impaired loans are estimated using discounted cash flow analyses or underlying collateral values, less costs to sell, where applicable.
Deposit liabilities—The fair values disclosed for demand deposits are, by definition, equal to the amount payable on demand at the reporting date (that is, their carrying amounts). The carrying amounts of variable-rate money market accounts, savings accounts, and interest checking accounts approximate their fair values at the reporting date. Fair values for fixed-rate CDs are estimated using a discounted cash flow calculation that applies interest rates currently being offered on certificates to a schedule of aggregated expected monthly maturities on time deposits.
Short-term borrowings—The carrying amounts of federal funds purchased, borrowings under repurchase agreements and other short-term borrowings maturing within 90 days approximate their fair values. Fair values of other short-term borrowings are estimated using discounted cash flow analyses based on the Bank’s current incremental borrowing rate for similar types of borrowing arrangements.
Long-term debt—The fair values of the Bank’s long-term debt is estimated using discounted cash flow analyses based on the Bank’s current incremental borrowing rate for similar types of borrowing arrangements.
Off-balance sheet instruments—The Bank’s off-balance sheet instruments include unfunded commitments to extend credit and standby letters of credit. The fair value of these instruments is not considered practicable to estimate because of the lack of quoted market prices and the inability to estimate fair value without incurring excessive costs.
Recently issued accounting standards—In January 2011, the FASB issued Accounting Standards Update ASU No. 2011-01 ”Receivables (Topic 310) – Deferral of the Effective Date of Disclosures about Troubled Debt Restructurings in Update No. 2010-20.” This standard temporarily delays the public entity effective date for disclosures related to troubled debt restructurings originally introduced in ASU No. 2010-20. According to the current guidance in ASU No. 2010-20, public-entity creditors would have provided disclosures about troubled debt restructurings for periods beginning on or after December 15, 2010. That guidance is now effective for interim and annual periods ending after June 15, 2011. This standard is effective upon issuance. This update requires a significant expansion of disclosures for troubled debt restructurings, but the adoption of these disclosures are not expected to have a material impact on the consolidated financial statements.
In December 2010, the FASB issued Accounting Standards Update ASU No. 2010-29 “Business Combinations (Topic 805)—Disclosure of Supplementary Pro Forma Information for Business Combinations (a consensus of the FASB Emerging Issues Task Force).” This Standard instructs that if a public entity that was recently involved in a merger or acquisition presents comparative financial statements, the entity should disclose revenue and earnings of the combined entity in the same fashion as would be customary if the business combination had occurred as of the beginning of the prior annual reporting period only, and expands the supplemental pro forma disclosures to include a description of the nature and amount of material, nonrecurring pro forma adjustments directly attributable to the business combination included in the reported pro forma revenue and earnings. These amendments are effective for business combinations for which the acquisition date is on or after the beginning of
79
Table of Contents
PREMIERWEST BANCORP AND SUBSIDIARY
NOTES TO CONSOLIDATED FINANCIAL STATEMENTS
NOTE 1—ORGANIZATION AND SUMMARY OF SIGNIFICANT ACCOUNTING POLICIES—(continued)
the first annual reporting period beginning on or after December 15, 2010, and should be applied prospectively. The adoption of ASU No. 2010-29 is not expected to have a material impact on the consolidated financial statements.
In December 2010, the FASB issued Accounting Standards Update ASU No. 2010-28 “Intangibles—Goodwill and Other (Topic 350) – When to Perform Step 2 of the Goodwill Impairment Test for Reporting Units with Zero or Negative Carrying Amounts” The changes to FASB ASC 350-25-35 modify Step 1 of the evaluation of goodwill impairment for reporting units with zero or negative carrying amounts to require that Step 2 of the impairment test be performed to measure the amount of any impairment loss when it is more likely than not that a goodwill impairment exits. This change prevents the assertion made by some businesses that Step 2 need not be taken when the carrying amount of a unit is zero or less. For public entities, the amended guidance is effective for fiscal years, and interim periods within those years, beginning after December 15, 2010, with early adoption not permitted. The adoption of ASU No. 2010-28 is not expected to have a material impact on the consolidated financial statements.
In July 2010, the FASB issued Accounting Standards Update ASU No. 2010-20 “Receivables (Topic 310)—Disclosures about the Credit Quality of Financing Receivables and the Allowance for Credit Losses” to improve the quality of financial reports by lowering the threshold for disclosure of an entity’s allowance for credit losses and the credit quality of its financing receivables, the FASB says an entity should provide disclosures disaggregated into two levels: portfolio segment and class of financing receivable. Users of financial statements should be able to readily evaluate the nature of credit risk inherent in an entity’s portfolio of financing receivables, how that risk is analyzed and assessed in arriving at the allowance for credit losses, and the changes and reasons for those changes in the allowance for credit losses. Numerous additional disclosures relating to financing receivables are also being required, in order to shed further light on an entity’s financial position. For public entities, the disclosures as of the end of a reporting period are effective for interim and annual reporting periods ending on or after December 15, 2010. The disclosures about activity that occurs during a reporting period are effective for interim and annual reporting periods beginning on or after December 15, 2010. This update required a significant expansion of credit related disclosures, but the adoption of ASU No. 2010- 20 did not have a material impact on the consolidated financial statements.
In April 2010, the FASB issued Accounting Standards Update ASU No. 2010-18 “Receivables (Topic 310)—Effect of a Loan Modification When the Loan is Part of the Pool that is Accounted for as a Single Asset” to clarify the guidance for loans acquired in a pool of assets with evidence of declining credit quality. FASB ASC 310-20, Receivables – Loans and Debt Securities Acquired with Deteriorated Credit Quality, is amended to clarify the criteria by which an acquired loan can be removed from an asset pool. Modifications of loans that are accounted for within a pool under Subtopic 310-30 do not result in the removal of those loans from the pool even if the modification of those loans would otherwise be considered a troubled debt restructuring. An entity will continue to be required to consider whether the pool of assets in which the loan is included is impaired if expected cash flows for the pool change. The amendments will be effective for loans that are part of an asset pool and are modified during financial reporting periods that end on or after July 15, 2010. The adoption of ASU No. 2010-18 did not have a material impact on the consolidated financial statements.
In April 2010, the FASB issued Accounting Standards Update ASU No. 2010-12 “Income Taxes” (Topic 740) to address changes in accounting for income taxes resulting from recently issued Health Care and Education Reconciliation Act of 2010 and the Patient Protection and Affordable Care Act. The update explains that even though the bills were signed seven days apart, they should be considered together for accounting purposes. If a
80
Table of Contents
PREMIERWEST BANCORP AND SUBSIDIARY
NOTES TO CONSOLIDATED FINANCIAL STATEMENTS
NOTE 1—ORGANIZATION AND SUMMARY OF SIGNIFICANT ACCOUNTING POLICIES—(continued)
registrant’s reporting period ends after the signing of the first bill, but before the signing of the second, they should take the effects of both bills into consideration when measuring current and deferred tax liabilities and assets. The adoption of ASU No. 2010-12 did not have a material impact on the consolidated financial statements.
In March 2010, the FASB issued Accounting Standards Update ASU No. 2010-09 “Amendments to Subsequent Events Requirements for SEC Issuers” to amend FASB ASC Topic 855 to exclude SEC reporting entities from the requirement to disclose the date on which subsequent events have been evaluated. In addition, it modifies the requirement to disclose the date on which subsequent events have been evaluated in reissued financial statements to apply only to such statements that have been restated to correct an error or to apply U.S. GAAP retrospectively. The adoption of ASU No. 2010-09 did not have a material impact on the consolidated financial statements.
In January 2010, the FASB issued Accounting Standards Update ASU No. 2010-06 “Fair Value Measurements and Disclosures (Topic 820)—Improving Disclosures about Fair Value Measurements” to improve disclosures about fair value measurements. For each class of assets and liabilities, reporting entities will have to provide additional disclosures describing the reasons for transfers of assets in and out of Levels 1 and 2 of the three-tier fair value hierarchy in accordance with FASB ASC Topic 820. For assets valued with the Level 3 method, the entity will have to separately present purchases, sales, issuances, and settlements in the reconciliation for fair value measurements. This update also states that an entity should provide fair value measurements for each class of asset or liability, and explain the inputs and techniques used in calculating Levels 2 and 3 fair value measurements. The adoption of ASU No. 2010-06 did not have a material impact on the consolidated financial statements.
In December 2009, the FASB issued Accounting Standards Update ASU No. 2009-16 “Transfers and Servicing (Topic 860)—Accounting for Transfers of Financial Assets” to amend the codification of FASB Statement of Financial Accounting Standard (SFAS) No. 166, “Accounting for Transfers of Financial Assets” issued on June 12, 2009. ASU No. 2009-16 amends FASB ASC Subtopic 860-10-15-1, “Transfers and Servicing,” and establishes accounting and reporting standards for transfers and servicing of financial assets. It also establishes the accounting for transfers of servicing rights. The adoption of ASU No. 2009-16 did not have a material impact on the consolidated financial statements.
Reclassifications—Certain reclassifications have been made to the 2009 and 2008 consolidated financial statements to conform to current year presentations. These reclassifications have no effect on previously reported net loss per share.
81
Table of Contents
PREMIERWEST BANCORP AND SUBSIDIARY
NOTES TO CONSOLIDATED FINANCIAL STATEMENTS
NOTE 2—REGULATORY AGREEMENT, ECONOMIC CONDITION AND MANAGEMENT PLAN
Based on the results of an examination completed during the third quarter of 2009, effective April 6, 2010, the Bank stipulated to the issuance of a formal regulatory Consent Order (the “Agreement”) with the Federal Deposit and Insurance Corporation (“FDIC”) and the Oregon Division of Finance and Corporate Securities (the “DFCS”), the Bank’s principal regulators, primarily as a result of recent significant operating losses and increasing levels of adversely-classified loans. The Agreement imposes certain operating restrictions on the Bank, all of which have been implemented by the Bank.
Among the corrective actions required are for the Bank to retain qualified management, restrict dividends, reduce adversely-classified loans, maintain an adequate allowance for loan losses, revise the strategic plan and various policies, as well as, maintain elevated capital levels. In addition, the Agreement provides timelines and thresholds from the date of issuance to achieve the aforementioned corrective actions.
In order to proactively respond to the current regulatory environment and the Bank’s credit issues, Management initiated measures intended to increase regulatory capital ratios prior to entering into the Agreement. Among the measures taken were the following:
| • | Completion of equity issuances sufficient to raise the Company’s regulatory capital ratios to levels in excess of those required to be considered “Well-Capitalized” under the regulatory framework for prompt corrective action except for the 10.0% leverage ratio set by the Agreement. |
| • | Reduction of assets and liabilities with primary emphasis on reducing non-performing assets through (1) sales of other real estate owned and foreclosed assets, (2) aggressive out-management of classified loans through unfavorable renewal pricing, charge-offs and foreclosures as appropriate, and (3) reduced emphasis on public funds deposits and corresponding reductions in collateral investment securities. |
| • | Evaluation of all business lines within the organization for possible gains upon disposition or significant cost-savings opportunities, as evidenced by the Company’s recent consolidation of four of its branches (see Note 1). |
We continue to focus on improving capital ratios and credit quality.
On June 4, 2010, the Company entered into a Written Agreement (the “Written Agreement”) with the Federal Reserve Bank of San Francisco and the DFCS, which routinely accompanies or follows an FDIC Consent Order, and is comparable to the Agreement described above. The Written Agreement provides that the Company will:
| • | Provide quarterly progress reports as well as other reports and plans, |
| • | Take steps to ensure the Bank complies with the Agreement, |
| • | Obtain regulatory approval to pay dividends or to incur indebtedness, and |
| • | Obtain approvals for a variety of other routine items. |
The Bank’s regulatory capital ratios were adversely affected by losses that occurred as a result of credit losses associated with the adverse state of the economy, and depressed real estate valuations on our commercial real estate concentrations. Also, as a result of the Bank’s operating results and financial condition, the Bank recognized an impairment to goodwill and established a valuation allowance against its deferred tax assets. The Bank continues to have high loan concentrations in commercial real estate loans and in construction and development loans. If economic conditions were to worsen for these industry segments, our financial condition could suffer significant deterioration. These circumstances led to Management’s implementation of the measures summarized above.
82
Table of Contents
PREMIERWEST BANCORP AND SUBSIDIARY
NOTES TO CONSOLIDATED FINANCIAL STATEMENTS
NOTE 2—REGULATORY AGREEMENT, ECONOMIC CONDITION AND MANAGEMENT PLAN—(Continued)
There are no assurances Management’s plan, as developed and implemented to date, will successfully improve the Bank’s results of operation or financial condition or result in the termination of the Agreement and the Written Agreement. The economic environment in the market areas and the duration of the downturn in the real estate market will have a significant impact on the implementation of the Bank’s business plans.
In anticipation of the requirements of the Agreement, on January 29, 2010, the Company filed an amendment to the Form S-1 Registration Statement with the United States Securities and Exchange Commission announcing a proposed offering of up to 81,747,362 shares of the Company’s common stock. A prospectus was filed on February 1, 2010, providing that prior to a public offering of the shares, existing shareholders of the Company each received a subscription right to purchase 3.3 shares of the Company’s common stock at a subscription price of $0.44 per share.
On April 7, 2010, the Company concluded its rights offering and the related public offering and issued approximately 75.6 million shares with net proceeds of approximately $32.5 million, net of estimated offering costs of approximately $700,000.
83
Table of Contents
PREMIERWEST BANCORP AND SUBSIDIARY
NOTES TO CONSOLIDATED FINANCIAL STATEMENTS
NOTE 3—MERGERS AND ACQUISITIONS
On July 17, 2009, PremierWest Bank acquired two Wachovia Bank branches in Northern California, located in Davis and Grass Valley. Management of the Company believes that the ability to compete with larger financial service providers necessitates additional expansion. By bolstering its presence in Northern California, Management expects the Company to increase the availability of its services to existing customers throughout Northern California and to bring a healthy, community bank competitor to the Davis and Grass Valley communities. Soon after the acquisition date, these offices and their employees commenced operating as branch offices of PremierWest Bank. The transaction was accounted for as a business combination.
The following table summarizes the estimated fair value of the assets acquired and liabilities assumed at the date of acquisition:
| July 17, 2009 | ||||
| (Dollars in 000’s) | ||||
| Fair value of assets acquired: |
||||
| Cash |
$ | 334,718 | ||
| Loans |
799 | |||
| Premises and equipment |
928 | |||
| Core deposit intangible |
1,812 | |||
| Other assets |
5 | |||
| Total fair value of assets acquired |
$ | 338,262 | ||
| Fair value of liabilities assumed: |
||||
| Deposits |
||||
| Demand |
$ | 3,982 | ||
| Interest-bearing demand and savings |
97,753 | |||
| Time certificates |
240,649 | |||
| Total deposits |
342,384 | |||
| Accrued interest |
361 | |||
| Total fair value of liabilities assumed |
342,745 | |||
| Goodwill |
$ | 4,483 | ||
The core deposit intangible asset of $1.8 million represents the value ascribed to the long-term deposit relationships acquired. This intangible asset is being amortized on a straight-line basis over a weighted average estimated useful life of 7.4 years. The core deposit intangible asset is not estimated to have a significant residual value. There was a negative CD premium of $4.0 million, or -1.75% of book value. This negative premium was amortized over a weighted average estimated useful life of 11 months. The value is a result of the current all-in cost of the CD portfolio being well above the cost of similar funding. Goodwill represents the excess of the total purchase price paid for the Wachovia branches over the fair values of the assets acquired, net of the fair value of the liabilities assumed. Goodwill was evaluated for impairment and reduced to zero through an impairment charge on December 31, 2009.
On October 5, 2009, the Securities and Exchange Commission granted relief to the Company, allowing it to omit certain historical and pro forma financial information of the two Wachovia Bank branches acquired, as required by Rule 3-05 of Regulation S-X and certain related pro forma financial information under Article 11 of Regulation S-X. After making every reasonable effort to do so, it was determined to be impractical for the Company to provide this information as separate, audited financial statements of the acquired branches were never prepared and the acquired branches were not operated as distinct, stand-alone entities.
84
Table of Contents
PREMIERWEST BANCORP AND SUBSIDIARY
NOTES TO CONSOLIDATED FINANCIAL STATEMENTS
NOTE 4—CASH AND DUE FROM BANKS
The Bank was required to maintain an average reserve balance of approximately $4.8 million and $4.0 million at December 31, 2010 and 2009, respectively, with the Federal Reserve Bank or maintain such reserve balances in the form of cash. This requirement was met by holding cash and maintaining average reserve balances with the Federal Reserve Bank in excess of the held cash amounts.
NOTE 5—INVESTMENT SECURITIES
Investment securities at December 31, 2010 and December 31, 2009 consisted of the following:
| (Dollars in 000’s) | ||||||||||||||||
| December 31, 2010 | ||||||||||||||||
| Amortized cost |
Gross unrealized gains |
Gross unrealized losses |
Estimated fair value |
|||||||||||||
| Available-for-sale: |
||||||||||||||||
| Collateralized mortgage obligations |
$ | 131,372 | $ | 1,647 | $ | (802 | ) | $ | 132,217 | |||||||
| Mortgage-backed securities |
9,023 | 72 | (39 | ) | 9,056 | |||||||||||
| U.S. Government and agency securities |
36,371 | 24 | (119 | ) | 36,276 | |||||||||||
| Obligations of states and political subdivisions |
6,009 | 125 | — | 6,134 | ||||||||||||
| Total |
$ | 182,775 | $ | 1,868 | $ | (960 | ) | $ | 183,683 | |||||||
| Held-to-maturity: |
||||||||||||||||
| Collateralized mortgage obligations |
$ | — | $ | — | $ | — | $ | — | ||||||||
| Mortgage-backed securities |
4,781 | 108 | 4,889 | |||||||||||||
| U.S. Government and agency securities |
12,151 | 378 | — | 12,529 | ||||||||||||
| Obligations of states and political subdivisions |
12,201 | 179 | (183 | ) | 12,197 | |||||||||||
| Total |
$ | 29,133 | $ | 665 | $ | (183 | ) | $ | 29,615 | |||||||
| Investment securities— |
||||||||||||||||
| Other Community Reinvestment Act |
$ | 2,000 | $ | — | $ | — | $ | 2,000 | ||||||||
| Restricted equity securities |
$ | 3,474 | $ | — | $ | — | $ | 3,474 | ||||||||
| December 31, 2009 | ||||||||||||||||
| Amortized cost |
Gross unrealized gains |
Gross unrealized losses |
Estimated fair value |
|||||||||||||
| Available-for-sale: |
||||||||||||||||
| Collateralized mortgage obligations |
$ | 75,843 | $ | 1,143 | $ | (29 | ) | $ | 76,957 | |||||||
| Mortgage-backed securities |
4,196 | 105 | — | 4,301 | ||||||||||||
| U.S. Government and agency securities |
27,661 | 133 | — | 27,794 | ||||||||||||
| Obligations of states and political subdivisions |
6,044 | — | (159 | ) | 5,885 | |||||||||||
| Total |
$ | 113,744 | $ | 1,381 | $ | (188 | ) | $ | 114,937 | |||||||
| Held-to-maturity: |
||||||||||||||||
| Collateralized mortgage obligations |
$ | — | $ | — | $ | — | $ | — | ||||||||
| Mortgage-backed securities |
5,807 | 90 | (64 | ) | 5,833 | |||||||||||
| U.S. Government and agency securities |
28,238 | 208 | (47 | ) | 28,399 | |||||||||||
| Obligations of states and political subdivisions |
9,339 | 111 | (146 | ) | 9,304 | |||||||||||
| Total |
$ | 43,384 | $ | 409 | $ | (257 | ) | $ | 43,536 | |||||||
| Investment securities— |
||||||||||||||||
| Other Community Reinvestment Act |
$ | 4,000 | $ | — | $ | — | $ | 4,000 | ||||||||
| Restricted equity securities |
$ | 3,643 | $ | — | $ | — | $ | 3,643 | ||||||||
85
Table of Contents
PREMIERWEST BANCORP AND SUBSIDIARY
NOTES TO CONSOLIDATED FINANCIAL STATEMENTS
NOTE 5—INVESTMENT SECURITIES—(continued)
The table below presents the gross unrealized losses and fair value of the Bank’s investment securities, aggregated by investment category and length of time that individual securities have been in a continuous unrealized loss position at December 31, 2010. Of these amounts, 23 available-for-sale and five held-to-maturity comprised the less than 12 months category, and one available-for-sale and four held-to-maturity investments comprised the 12 months or more category.
| (Dollars in 000’s) | ||||||||||||||||||||||||
| Less than 12 months | 12 months or more | Total | ||||||||||||||||||||||
| Fair Value | Unrealized Losses |
Fair Value | Unrealized Losses |
Fair Value | Unrealized Losses |
|||||||||||||||||||
| At December 31, 2010 |
||||||||||||||||||||||||
| Available-for-sale: |
||||||||||||||||||||||||
| Collateralized mortgage obligations |
$ | 43,239 | $ | (802 | ) | $ | 2 | $ | — | $ | 43,241 | $ | (802 | ) | ||||||||||
| Mortgage-backed securities |
2,960 | (39 | ) | — | — | 2,960 | (39 | ) | ||||||||||||||||
| U.S. Government and agency securities |
19,974 | (119 | ) | — | — | 19,974 | (119 | ) | ||||||||||||||||
| Held-to-maturity: |
||||||||||||||||||||||||
| Obligations of state and political subdivisions |
3,593 | (176 | ) | 553 | (7 | ) | 4,146 | (183 | ) | |||||||||||||||
| $ | 69,766 | $ | (1,136 | ) | $ | 555 | $ | (7 | ) | $ | 70,321 | $ | (1,143 | ) | ||||||||||
| Less than 12 months | 12 months or more | Total | ||||||||||||||||||||||
| Fair Value | Unrealized Losses |
Fair Value | Unrealized Losses |
Fair Value | Unrealized Losses |
|||||||||||||||||||
| At December 31, 2009 |
||||||||||||||||||||||||
| Available-for-sale: |
||||||||||||||||||||||||
| Collateralized mortgage obligations |
$ | 6,938 | $ | (29 | ) | $ | — | $ | — | $ | 6,938 | $ | (29 | ) | ||||||||||
| Mortgage-backed securities |
— | — | 21 | — | 21 | — | ||||||||||||||||||
| Obligations of state and political subdivisions |
4,830 | (159 | ) | — | — | 4,830 | (159 | ) | ||||||||||||||||
| Held-to-maturity: |
||||||||||||||||||||||||
| Collateralized mortgage obligations |
$ | — | $ | — | $ | — | $ | — | $ | — | $ | — | ||||||||||||
| Mortgage-backed securities |
4,103 | (64 | ) | — | — | 4,103 | (64 | ) | ||||||||||||||||
| U.S. Government and agency securities |
7,953 | (47 | ) | — | — | 7,953 | (47 | ) | ||||||||||||||||
| Obligations of state and political subdivisions |
3,421 | (132 | ) | 802 | (14 | ) | 4,223 | (146 | ) | |||||||||||||||
| $ | 27,245 | $ | (431 | ) | $ | 823 | $ | (14 | ) | $ | 28,068 | $ | (445 | ) | ||||||||||
All unrealized losses reflected above were the result of changes in interest rates subsequent to the purchase of the securities. Because the decline in fair value is attributable to the changes in interest rates and not credit quality, and because the Bank does not intend to sell the securities in this class and it is not likely that the Bank will be required to sell these securities before recovery of their amortized cost bases, which may include holding each security until maturity, the unrealized losses on these investments are not considered other-than-temporarily impaired.
86
Table of Contents
PREMIERWEST BANCORP AND SUBSIDIARY
NOTES TO CONSOLIDATED FINANCIAL STATEMENTS
NOTE 5—INVESTMENT SECURITIES—(continued)
The amortized cost and estimated fair value of investment securities at December 31, 2010, by contractual maturity are shown below. Expected maturities will differ from contractual maturities because borrowers may have the right to call or prepay obligations with or without call or prepayment penalties.
At December 31, 2010
| (Dollars in 000’s) | ||||||||||||||||
| Available-for-sale | Held-to-maturity | |||||||||||||||
| Amortized Cost |
Estimated Fair Value |
Amortized Cost |
Estimated Fair Value |
|||||||||||||
| Due in one year or less |
$ | 6,031 | $ | 6,027 | $ | 1,801 | $ | 1,805 | ||||||||
| Due after one year through five years |
31,376 | 31,303 | 12,469 | 12,862 | ||||||||||||
| Due after five years through ten years |
78 | 80 | 5,045 | 4,987 | ||||||||||||
| Due after ten years |
145,290 | 146,273 | 9,818 | 9,961 | ||||||||||||
| $ | 182,775 | $ | 183,683 | $ | 29,133 | $ | 29,615 | |||||||||
The following table summarizes the gross realized gains & gross realized losses on the sale of available-for-sale securities for the years ended December 31, 2010, 2009, and 2008:
Dollars in Thousands
| Years ended December 31 |
2010 | 2009 | 2008 | |||||||||||||||||||||
| Gains | Losses | Gains | Losses | Gains | Losses | |||||||||||||||||||
| Collateralized mortgage obligations |
590 | — | 119 | 69 | — | — | ||||||||||||||||||
| Mortgage-backed securities |
84 | — | — | — | — | — | ||||||||||||||||||
| U.S. Government and agency securities |
92 | 34 | — | — | — | — | ||||||||||||||||||
| Obligations of states and political subdivisions |
— | — | — | — | — | — | ||||||||||||||||||
| Total |
766 | 34 | 119 | 69 | — | — | ||||||||||||||||||
At December 31, 2010, investment securities with an estimated fair market value of $210.0 million were pledged to secure public deposits, certain nonpublic deposits and borrowings.
87
Table of Contents
PREMIERWEST BANCORP AND SUBSIDIARY
NOTES TO CONSOLIDATED FINANCIAL STATEMENTS
NOTE 6—LOANS
Loans as of December 31, 2010, consisted of the following (in thousands):
Loans as of December 31, 2010 and December 31, 2009 consisted of the following:
| (Dollars in 000’s) | December 31, 2010 | December 31, 2009 | ||||||
| Construction, Land Dev & Other Land |
$ | 62,666 | $ | 144,560 | ||||
| Commercial & Industrial |
119,077 | 160,868 | ||||||
| Commercial Real Estate Loans |
626,387 | 660,055 | ||||||
| Secured Multifamily Residential |
24,227 | 21,657 | ||||||
| Other Commercial Loans Secured by RE |
59,284 | 63,604 | ||||||
| Loans to Individuals, Family & Personal Expense |
12,472 | 13,071 | ||||||
| Consumer/Finance |
36,859 | 37,063 | ||||||
| Other Loans |
37,255 | 43,220 | ||||||
| Overdrafts |
319 | 4,929 | ||||||
| Gross loans |
978,546 | 1,149,027 | ||||||
| Less: allowance for loan losses |
(35,582 | ) | (45,903 | ) | ||||
| Less: deferred fees and restructed loan concessions |
(1,751 | ) | (900 | ) | ||||
| Loans, net |
$ | 941,213 | $ | 1,102,224 | ||||
The Bank’s market area consists principally of Jackson, Josephine, Deschutes, Douglas and Klamath counties of Oregon, and Butte, Siskiyou, Shasta, Tehama, Sacramento and Yolo counties of northern California. A substantial portion of the Bank’s loans are collateralized by real estate in these geographic areas and, accordingly, the ultimate collectability of a substantial portion of the Bank’s loan portfolio is susceptible to changes in the respective local market conditions.
In the normal course of business, the Bank participates portions of loans to third parties in order to extend the Bank’s lending capability or to mitigate risk. At December 31, 2010 and 2009, the portion of these loans participated to third parties (which are not included in the accompanying consolidated financial statements) totaled approximately $24.6 million and $30.1 million, respectively.
NOTE 7—ALLOWANCE FOR LOAN LOSSES AND CREDIT QUALITY
The allowance for loan losses represents the Company’s estimate as to the probable credit losses inherent in its loan portfolio. The allowance for loan losses is increased through periodic charges to earnings through provision for loan losses and represents the aggregate amount, net of loans charged-off and recoveries on previously charged-off loans, that is needed to establish an appropriate reserve for credit losses. The allowance is estimated based on a variety of factors and using a methodology as described below:
| • | The Company classifies loans into relatively homogeneous pools by loan type in accordance with regulatory guidelines for regulatory reporting purposes. The Company regularly reviews all loans within each loan category to establish risk ratings for them that include Pass, Watch, Special Mention, Substandard, Doubtful and Loss. Pursuant to “Accounting for Creditors for Impairment of a Loan”, the impaired portion of collateral dependent loans is charged-off. Other risk-related loans not considered impaired have loss factors applied to the various loan pool balances to establish loss potential for provisioning purposes. |
88
Table of Contents
PREMIERWEST BANCORP AND SUBSIDIARY
NOTES TO CONSOLIDATED FINANCIAL STATEMENTS
NOTE 7—ALLOWANCE FOR LOAN LOSSES AND CREDIT QUALITY—(continued)
| • | Analyses are performed to establish the loss factors based on historical experience, as well as expected losses based on qualitative evaluations of such factors as the economic trends and conditions, industry conditions, levels and trends in delinquencies and impaired loans, levels and trends in charge-offs and recoveries, among others. The loss factors are applied to loan category pools segregated by risk classification to estimate the loss inherent in the Company’s loan portfolio pursuant to “Accounting for Contingencies.” |
| • | Additionally, impaired loans are evaluated for loss potential on an individual basis in accordance with “Accounting for Creditors for Impairment of a Loan,” and specific reserves are established based on thorough analysis of collateral values where loss potential exists. When an impaired loan is collateral dependent and a deficiency exists in the fair value of real estate collateralizing the loan in comparison to the associated loan balance, the deficiency is charged-off at that time. Impaired loans are reviewed no less frequently than quarterly. |
| • | In the event that a current appraisal to support the fair value of the real estate collateral underlying an impaired loan has not yet been received, but the Company believes that the collateral value is insufficient to support the loan amount, an impairment reserve is recorded. In these instances, the receipt of a current appraisal triggers an updated review of the collateral support for the loan and any deficiency is charged-off or reserved at that time. In those instances where a current appraisal is not available in a timely manner in relation to a financial reporting cut-off date, the Company discounts the most recent third-party appraisal depending on a number of factors including, but not limited to, property location, local price volatility, local economic conditions, and recent comparable sales. In all cases, the costs to sell the subject property are deducted in arriving at the fair value of the collateral. Any unpaid property taxes or similar expenses are expensed at the time the property is acquired by the Bank. |
The Company updated its methodology for estimating probable credit losses during the current period to better align the allowance with the risk within in its loan portfolio by improving the timeliness and relevance of losses reflected in the historical loss factors applied to each loan category pool. These changes included the following:
| • | Reducing the time period over which the historical loss factors are calculated from five years to three years. |
| • | Moving the time period over which the historical loss factors are calculated forward to eliminate time lag and incorporate all losses incurred through the balance sheet date. |
| • | Further segmentation of the loan portfolio for purposes of developing and applying historical loss factors to specific segments within the portfolio, rather than loss rates determined at an aggregated general loan category level. |
89
Table of Contents
PREMIERWEST BANCORP AND SUBSIDIARY
NOTES TO CONSOLIDATED FINANCIAL STATEMENTS
NOTE 7—ALLOWANCE FOR LOAN LOSSES AND CREDIT QUALITY—(continued)
Transactions in the allowance for loan losses for the years ended December 31 were as follows (in thousands):
Allowance for Credit Losses and Recorded Investment in Financing Receivables
For the Years Ended December 31, 2010 and 2009
| (Dollars in 000’s) | ||||||||||||||||||||||||||||||||||||
| Construction, Land Dev |
Comm & Industrial |
Comm Real Estate |
Comm Real Estate Multi |
Comm Real Estate -Other |
Loans to Individuals |
Consumer Finance |
Other
Loans and Overdrafts |
Total | ||||||||||||||||||||||||||||
| 2010 |
||||||||||||||||||||||||||||||||||||
| Allowance for credit losses: |
||||||||||||||||||||||||||||||||||||
| Beginning balance |
$ | 15,033 | $ | 6,409 | $ | 20,923 | $ | 506 | $ | 531 | $ | 231 | $ | 1,150 | $ | 1,120 | $ | 45,903 | ||||||||||||||||||
| Charge-offs |
(11,689 | ) | (2,364 | ) | (8,534 | ) | — | (1,434 | ) | (133 | ) | (1,697 | ) | (722 | ) | (26,573 | ) | |||||||||||||||||||
| Recoveries |
1,757 | 2,020 | 1,124 | — | 102 | 6 | 917 | 276 | 6,202 | |||||||||||||||||||||||||||
| Provision |
(398 | ) | 1,986 | 906 | (380 | ) | 5,424 | 869 | 2,006 | (363 | ) | 10,050 | ||||||||||||||||||||||||
| Ending balance |
$ | 4,703 | $ | 8,051 | $ | 14,419 | $ | 126 | $ | 4,623 | $ | 973 | $ | 2,376 | $ | 311 | $ | 35,582 | ||||||||||||||||||
| Ending balance: individually evaluated for impairment |
$ | 2,365 | $ | 295 | $ | 3,554 | $ | — | $ | 3,440 | $ | 5 | $ | — | $ | — | $ | 9,659 | ||||||||||||||||||
| Ending balance: collectively evaluated for impairment |
$ | 2,338 | $ | 7,756 | $ | 10,865 | $ | 126 | $ | 1,183 | $ | 968 | $ | 2,376 | $ | 311 | $ | 25,923 | ||||||||||||||||||
| Loans: |
||||||||||||||||||||||||||||||||||||
| Ending balance |
$ | 62,666 | $ | 119,077 | $ | 626,387 | $ | 24,227 | $ | 59,284 | $ | 12,472 | $ | 36,859 | $ | 37,574 | $ | 978,546 | ||||||||||||||||||
| Ending balance: individually evaluated for impairment |
$ | 32,584 | $ | 2,709 | $ | 80,604 | $ | 307 | $ | 10,725 | $ | 26 | $ | — | $ | 2,538 | $ | 129,493 | ||||||||||||||||||
| Ending balance: collectively evaluated for impairment |
$ | 30,082 | $ | 116,368 | $ | 545,783 | $ | 23,920 | $ | 48,559 | $ | 12,446 | $ | 36,859 | $ | 35,036 | $ | 849,053 | ||||||||||||||||||
| 2009 |
||||||||||||||||||||||||||||||||||||
| Allowance for credit losses: |
||||||||||||||||||||||||||||||||||||
| Beginning balance |
$ | 6,603 | $ | 1,575 | $ | 6,925 | $ | 144 | $ | 241 | $ | 204 | $ | 1,027 | $ | 438 | $ | 17,157 | ||||||||||||||||||
| Charge-offs |
(23,944 | ) | (21,139 | ) | (10,419 | ) | (696 | ) | (1,666 | ) | (510 | ) | (2,463 | ) | (230 | ) | (61,067 | ) | ||||||||||||||||||
| Recoveries |
819 | 140 | 13 | — | 3 | 40 | 666 | 101 | 1,782 | |||||||||||||||||||||||||||
| Provision |
31,555 | 25,833 | 24,404 | 1,058 | 1,953 | 497 | 1,920 | 811 | 88,031 | |||||||||||||||||||||||||||
| Ending balance |
$ | 15,033 | $ | 6,409 | $ | 20,923 | $ | 506 | $ | 531 | $ | 231 | $ | 1,150 | $ | 1,120 | $ | 45,903 | ||||||||||||||||||
| Ending balance: individually evaluated for impairment |
$ | 7,123 | $ | 357 | $ | 164 | $ | — | $ | 75 | $ | — | $ | — | $ | — | $ | 7,719 | ||||||||||||||||||
| Ending balance: collectively evaluated for impairment |
$ | 7,910 | $ | 6,052 | $ | 20,759 | $ | 506 | $ | 456 | $ | 231 | $ | 1,150 | $ | 1,120 | $ | 38,184 | ||||||||||||||||||
| Loans: |
||||||||||||||||||||||||||||||||||||
| Ending balance |
$ | 144,560 | $ | 160,868 | $ | 660,055 | $ | 21,657 | $ | 63,604 | $ | 13,071 | $ | 37,063 | $ | 48,149 | $ | 1,149,027 | ||||||||||||||||||
| Ending balance: individually evaluated for impairment |
$ | 52,519 | $ | 4,304 | $ | 40,375 | $ | — | $ | 5,981 | $ | 5 | $ | — | $ | 683 | $ | 103,867 | ||||||||||||||||||
| Ending balance: collectively evaluated for impairment |
$ | 92,041 | $ | 156,564 | $ | 619,680 | $ | 21,657 | $ | 57,623 | $ | 13,066 | $ | 37,063 | $ | 47,466 | $ | 1,045,160 | ||||||||||||||||||
90
Table of Contents
PREMIERWEST BANCORP AND SUBSIDIARY
NOTES TO CONSOLIDATED FINANCIAL STATEMENTS
NOTE 7—ALLOWANCE FOR LOAN LOSSES AND CREDIT QUALITY—(continued)
The following tables summarize the Company’s loans past due by type as of December 31, 2010 and 2009:
| (Dollars in 000’s) | ||||||||||||||||||||||||||||
| 30-59 Days Past Due |
60-89 Days Past Due |
Greater Than 90 Days |
Total Past Due |
Current | Total Loans |
Recorded Investment > 90 Days Past Due and Accruing |
||||||||||||||||||||||
| December 31, 2010 |
||||||||||||||||||||||||||||
| Construction, Land Dev & Other Land |
$ | 133 | $ | — | $ | 7,447 | $ | 7,580 | $ | 55,086 | $ | 62,666 | $ | — | ||||||||||||||
| Commercial & Industrial |
222 | 5 | 1,298 | 1,525 | 117,552 | 119,077 | — | |||||||||||||||||||||
| Commercial Real Estate Loans |
8,011 | 2,007 | 36,396 | 46,414 | 579,973 | 626,387 | — | |||||||||||||||||||||
| Secured Multifamily Residential |
— | — | 307 | 307 | 23,920 | 24,227 | — | |||||||||||||||||||||
| Other Commercial Loans Secured by RE |
97 | 224 | 2,709 | 3,030 | 56,254 | 59,284 | — | |||||||||||||||||||||
| Loans to Individuals, Family & Personal Expense |
10 | — | — | 10 | 12,462 | 12,472 | — | |||||||||||||||||||||
| Consumer/Finance |
603 | 188 | 123 | 914 | 35,945 | 36,859 | 123 | |||||||||||||||||||||
| Other Loans and Overdrafts |
2,104 | — | 434 | 2,538 | 35,036 | 37,574 | — | |||||||||||||||||||||
| Total |
$ | 11,180 | $ | 2,424 | $ | 48,714 | $ | 62,318 | $ | 916,228 | $ | 978,546 | $ | 123 | ||||||||||||||
| December 31, 2009 |
||||||||||||||||||||||||||||
| Construction, Land Dev & Other Land |
$ | 5,125 | $ | 4,207 | $ | 32,975 | $ | 42,307 | $ | 102,253 | $ | 144,560 | $ | 3,289 | ||||||||||||||
| Commercial & Industrial |
1,253 | 347 | 3,081 | 4,681 | 156,187 | 160,868 | 2,047 | |||||||||||||||||||||
| Commercial Real Estate Loans |
3,126 | 1,495 | 29,636 | 34,257 | 625,798 | 660,055 | — | |||||||||||||||||||||
| Secured Multifamily Residential |
— | — | — | — | 21,657 | 21,657 | — | |||||||||||||||||||||
| Other Commercial Loans Secured by RE |
1,222 | — | 3,029 | 4,251 | 59,353 | 63,604 | 29 | |||||||||||||||||||||
| Loans to Individuals, Family & Personal Expense |
38 | 62 | 5 | 105 | 12,966 | 13,071 | 5 | |||||||||||||||||||||
| Consumer/Finance |
617 | 359 | 50 | 1,026 | 36,037 | 37,063 | 50 | |||||||||||||||||||||
| Other Loans and Overdrafts |
— | 307 | 375 | 682 | 47,467 | 48,149 | — | |||||||||||||||||||||
| Total |
$ | 11,381 | $ | 6,777 | $ | 69,151 | $ | 87,309 | $ | 1,061,718 | $ | 1,149,027 | $ | 5,420 | ||||||||||||||
91
Table of Contents
PREMIERWEST BANCORP AND SUBSIDIARY
NOTES TO CONSOLIDATED FINANCIAL STATEMENTS
NOTE 7—ALLOWANCE FOR LOAN LOSSES AND CREDIT QUALITY—(continued)
Impaired loans by type for the years ended December 31 were as follows:
| (Dollars in 000’s) | Unpaid Principal Balance |
Recorded Investment |
Related Allowance |
Average Recorded Investment |
Interest Income Recognized |
|||||||||||||||
| December 31, 2010 |
||||||||||||||||||||
| With no Related Allowance |
||||||||||||||||||||
| Construction, Land Dev & Other Land |
$ | 39,517 | $ | 26,007 | $ | — | $ | 25,675 | $ | — | ||||||||||
| Commercial & Industrial |
2,598 | 1,682 | — | 2,654 | — | |||||||||||||||
| Commercial Real Estate Loans |
76,316 | 66,917 | — | 57,839 | — | |||||||||||||||
| Secured Multifamily Residential |
307 | 307 | — | 183 | — | |||||||||||||||
| Other Commercial Loans Secured by RE |
4,553 | 3,913 | — | 4,897 | — | |||||||||||||||
| Loans to Individuals, Family & Personal Expense |
26 | 26 | — | 5 | — | |||||||||||||||
| Consumer/Finance |
123 | 123 | — | 10 | 16 | |||||||||||||||
| Other Loans |
2,864 | 2,538 | — | 737 | — | |||||||||||||||
| Total |
$ | 126,304 | $ | 101,513 | $ | — | $ | 92,000 | $ | 16 | ||||||||||
| With a Related Allowance |
||||||||||||||||||||
| Construction, Land Dev & Other Land |
$ | 8,151 | $ | 6,577 | $ | 2,365 | $ | 11,324 | $ | — | ||||||||||
| Commercial & Industrial |
1,027 | 1,027 | 295 | 782 | — | |||||||||||||||
| Commercial Real Estate Loans |
19,321 | 13,687 | 3,554 | 8,800 | — | |||||||||||||||
| Secured Multifamily Residential |
— | — | — | — | — | |||||||||||||||
| Other Commercial Loans Secured by RE |
6,812 | 6,812 | 3,440 | 2,017 | — | |||||||||||||||
| Loans to Individuals, Family & Personal Expense |
— | — | 5 | 9 | — | |||||||||||||||
| Consumer/Finance |
— | — | — | — | — | |||||||||||||||
| Other Loans |
— | — | — | 207 | — | |||||||||||||||
| Total |
$ | 35,311 | $ | 28,103 | $ | 9,659 | $ | 23,139 | $ | — | ||||||||||
| Total Impaired Loans: |
||||||||||||||||||||
| Construction, Land Dev & Other Land |
$ | 47,668 | $ | 32,584 | $ | 2,365 | $ | 36,999 | $ | — | ||||||||||
| Commercial & Industrial |
3,625 | 2,709 | 295 | 3,436 | — | |||||||||||||||
| Commercial Real Estate Loans |
95,637 | 80,604 | 3,554 | 66,639 | — | |||||||||||||||
| Secured Multifamily Residential |
307 | 307 | — | 183 | — | |||||||||||||||
| Other Commercial Loans Secured by RE |
11,365 | 10,725 | 3,440 | 6,914 | — | |||||||||||||||
| Loans to Individuals, Family & Personal Expense |
26 | 26 | 5 | 14 | — | |||||||||||||||
| Consumer/Finance |
123 | 123 | — | 10 | 16 | |||||||||||||||
| Other Loans |
2,864 | 2,538 | — | 944 | — | |||||||||||||||
| Total Impaired Loans |
$ | 161,615 | $ | 129,616 | $ | 9,659 | $ | 115,139 | $ | 16 | ||||||||||
Included in the table above are $123,000 of consumer loans that are 90 days past due and still accruing interest. These loans are charged off according to policy after 120 days. The remaining loans are on non-accrual status at December 31, 2010.
92
Table of Contents
PREMIERWEST BANCORP AND SUBSIDIARY
NOTES TO CONSOLIDATED FINANCIAL STATEMENTS
NOTE 7—ALLOWANCE FOR LOAN LOSSES AND CREDIT QUALITY—(continued)
| Unpaid Principal Balance |
Recorded Investment |
Related Allowance |
Average Recorded Investment |
Interest Income Recognized |
||||||||||||||||
| (Dollars in 000’s) | ||||||||||||||||||||
| December 31, 2009 |
||||||||||||||||||||
| With no Related Allowance |
||||||||||||||||||||
| Construction, Land Dev & Other Land |
$ | 49,674 | $ | 35,262 | $ | — | $ | 42,867 | $ | 20 | ||||||||||
| Commercial & Industrial |
1,737 | 3,527 | — | 3,466 | 135 | |||||||||||||||
| Commercial Real Estate Loans |
47,217 | 39,605 | — | 29,727 | 221 | |||||||||||||||
| Secured Multifamily Residential |
1,707 | — | — | 3,396 | — | |||||||||||||||
| Other Commercial Loans Secured by RE |
6,954 | 5,004 | — | 6,073 | — | |||||||||||||||
| Loans to Individuals, Family & Personal Expense |
— | 5 | — | 522 | — | |||||||||||||||
| Consumer/Finance |
— | 50 | — | 19 | 10 | |||||||||||||||
| Other Loans |
767 | 683 | — | 485 | — | |||||||||||||||
| Total |
$ | 108,056 | $ | 84,136 | $ | — | $ | 86,555 | $ | 386 | ||||||||||
| With a Related Allowance |
||||||||||||||||||||
| Construction, Land Dev & Other Land |
$ | 19,672 | $ | 17,257 | $ | 7,123 | $ | 10,370 | $ | — | ||||||||||
| Commercial & Industrial |
785 | 777 | 357 | 1,100 | — | |||||||||||||||
| Commercial Real Estate Loans |
770 | 770 | 164 | 521 | — | |||||||||||||||
| Secured Multifamily Residential |
— | — | — | — | — | |||||||||||||||
| Other Commercial Loans Secured by RE |
977 | 977 | 75 | 160 | — | |||||||||||||||
| Loans to Individuals, Family & Personal Expense |
— | — | — | — | — | |||||||||||||||
| Consumer/Finance |
— | — | — | |||||||||||||||||
| Other Loans |
— | — | — | — | — | |||||||||||||||
| Total |
$ | 22,204 | $ | 19,781 | $ | 7,719 | $ | 12,151 | $ | — | ||||||||||
| Total Impaired Loans: |
||||||||||||||||||||
| Construction, Land Dev & Other Land |
$ | 69,346 | $ | 52,519 | $ | 7,123 | $ | 53,237 | $ | 20 | ||||||||||
| Commercial & Industrial |
2,522 | 4,304 | 357 | 4,566 | 135 | |||||||||||||||
| Commercial Real Estate Loans |
47,987 | 40,375 | 164 | 30,248 | 221 | |||||||||||||||
| Secured Multifamily Residential |
1,707 | — | — | 3,396 | — | |||||||||||||||
| Other Commercial Loans Secured by RE |
7,931 | 5,981 | 75 | 6,233 | — | |||||||||||||||
| Loans to Individuals, Family & Personal Expense |
— | 5 | — | 522 | — | |||||||||||||||
| Consumer/Finance |
— | 50 | — | 19 | 10 | |||||||||||||||
| Other Loans |
767 | 683 | — | 485 | — | |||||||||||||||
| Total Impaired Loans |
$ | 130,260 | $ | 103,917 | $ | 7,719 | $ | 98,706 | $ | 386 | ||||||||||
Included in the table above are $50,000 of consumer loans that are 90 days past due and still accruing interest. These loans are charged off according to policy after 120 days. In addition, there are $5.4 million loans that are more than 90 days past due but not on nonaccrual status. The remaining loans are on non-accrual status at December 31, 2009.
93
Table of Contents
PREMIERWEST BANCORP AND SUBSIDIARY
NOTES TO CONSOLIDATED FINANCIAL STATEMENTS
NOTE 7—ALLOWANCE FOR LOAN LOSSES AND CREDIT QUALITY—(continued)
In some instances the Company has modified or restructured loans to amend the interest rate and/or to extend the maturity. In those instances where concessions have been granted meeting the criteria for a troubled debt restructuring (“TDR”), the related loans have been recorded as TDR’s and placed on non-accrual status. TDR’s recorded by the Company at December 31, 2010 and 2009 totaled $45.2 million and $7.2 million and were comprised of 32 and 11 loans, respectively.
The Company assigns risk ratings to loans based on internal review. These risk ratings are grouped and defined as follows:
Pass—The borrower is considered creditworthy and has the ability to repay the debt in the normal course of business.
Watch—This rating indicates that according to current information, the borrower has the capacity to perform according to terms; however, elements of uncertainty (an uncharacteristic negative financial or other risk factor event) exist. Margins of debt service coverage are or have narrowed, and historical patterns of financial performance may be erratic although the overall trends are positive. If secured, collateral value and adequate sources of repayment currently protect the loan. Material adverse trends have not developed at this time. Loans in this category can be to new and/or thinly capitalized companies with limited proved performance history.
Special Mention—A Special Mention asset has potential weaknesses that deserve management’s close attention. If left uncorrected, these potential weaknesses may result in deterioration of the repayment prospects for the asset or in the institution’s credit position at some future date. Special Mention assets are not adversely classified and do not expose an institution to sufficient risk to warrant adverse classification. This rating is not a transitional grade by definition; however, an appropriate action plan is required to ensure timely risk rating change as circumstances warrant.
Substandard—The loan is inadequately protected by the current worth and/or paying capacity of the obligor or of the collateral pledged, if any. There are well-defined weaknesses that jeopardize the repayment of the debt. Although loss may not be imminent, if the weaknesses are not corrected, there is a good possibility that the Bank will sustain a loss. Loss potential, while existing in the aggregate amount of Substandard assets, does not have to exist in individual assets classified Substandard.
Doubtful—The loan has the weaknesses of those in the classification of Substandard, one or more of which make collection or liquidation in full, on the basis of currently ascertainable facts, conditions and values, highly questionable or improbable. The possibility of loss is extremely high, but certain identifiable contingencies that are reasonably likely to materialize may work to the advantage and strengthening of the loan, such that it is reasonable to defer its classification as a Loss until its more exact status may be determined. Contingencies that may call for deferral of Loss classification include proposed merger, acquisition, or liquidation procedures, capital injection, perfecting liens on additional collateral and refinancing plans. Loans in this classification are carried on nonaccrual and are considered impaired. Credits rated Doubtful are to be reviewed frequently to determine if event(s) that might require a change in rating upward or downward have taken place.
94
Table of Contents
PREMIERWEST BANCORP AND SUBSIDIARY
NOTES TO CONSOLIDATED FINANCIAL STATEMENTS
NOTE 7—ALLOWANCE FOR LOAN LOSSES AND CREDIT QUALITY—(continued)
The following table summarizes our loans by type and group of December 31, 2010 and December 31, 2009:
Credit quality indicators for the twelve months ended December 31, 2010 and 2009 were as follows:
| Construction, Land Dev |
Comm & Industrial |
Comm Real Estate |
Comm Real Estate Multi |
Comm Real Estate - Other |
Loans to Individuals |
Other Loans and Overdraft |
||||||||||||||||||||||
| (Dollars in 000’s) | ||||||||||||||||||||||||||||
| 2010 |
||||||||||||||||||||||||||||
| Pass |
$ | 17,261 | $ | 58,567 | $ | 314,877 | $ | 9,215 | $ | 40,293 | $ | 11,620 | $ | 24,792 | ||||||||||||||
| Watch |
— | 5,676 | 31,395 | — | 2,098 | — | 3,824 | |||||||||||||||||||||
| Special Mention |
6,435 | 12,337 | 118,287 | 13,540 | 2,309 | — | 3,841 | |||||||||||||||||||||
| Substandard |
35,893 | 41,404 | 147,513 | 1,472 | 7,772 | 826 | 5,117 | |||||||||||||||||||||
| Doubtful |
3,077 | 1,093 | 14,315 | — | 6,812 | 26 | — | |||||||||||||||||||||
| Total |
$ | 62,666 | $ | 119,077 | $ | 626,387 | $ | 24,227 | $ | 59,284 | $ | 12,472 | $ | 37,574 | ||||||||||||||
Consumer Credit Exposure
Credit Risk Profile Based on Payment Activity
| Consumer | ||||
| Performing |
$ | 36,736 | ||
| Nonperforming |
123 | |||
| Total |
$ | 36,859 | ||
| Construction, Land Dev |
Comm & Industrial |
Comm Real Estate |
Comm Real Estate Multi |
Comm Real Estate - Other |
Loans to Individuals |
Other Loans and Overdraft |
||||||||||||||||||||||
| 2009 |
||||||||||||||||||||||||||||
| Pass |
$ | 38,231 | $ | 99,726 | $ | 347,342 | $ | 11,452 | $ | 50,696 | $ | 13,004 | $ | 35,670 | ||||||||||||||
| Watch |
2,770 | 5,992 | 76,364 | 1,482 | 148 | 62 | 3,616 | |||||||||||||||||||||
| Special Mention |
8,218 | 23,705 | 96,525 | 7,422 | 5,036 | — | 4,082 | |||||||||||||||||||||
| Substandard |
75,239 | 30,636 | 135,125 | 1,301 | 4,800 | 5 | 4,781 | |||||||||||||||||||||
| Doubtful |
20,102 | 809 | 4,699 | — | 2,924 | — | — | |||||||||||||||||||||
| Total |
$ | 144,560 | $ | 160,868 | $ | 660,055 | $ | 21,657 | $ | 63,604 | $ | 13,071 | $ | 48,149 | ||||||||||||||
Consumer Credit Exposure
Credit Risk Profile Based on Payment Activity
| Consumer | ||||
| Performing |
$ | 37,013 | ||
| Nonperforming |
50 | |||
| Total |
$ | 37,063 | ||
95
Table of Contents
PREMIERWEST BANCORP AND SUBSIDIARY
NOTES TO CONSOLIDATED FINANCIAL STATEMENTS
NOTE 8—PREMISES AND EQUIPMENT
Premises and equipment at December 31 consisted of the following (in thousands):
| 2010 | 2009 | |||||||
| Land and improvements |
$ | 13,672 | $ | 12,866 | ||||
| Buildings and leasehold improvements |
37,440 | 37,795 | ||||||
| Furniture and equipment |
19,809 | 19,390 | ||||||
| 70,921 | 70,051 | |||||||
| Less accumulated depreciation and amortization |
(25,024 | ) | (22,501 | ) | ||||
| 45,897 | 47,550 | |||||||
| Construction in progress |
2,027 | 262 | ||||||
| Premises and equipment, net of accumulated depreciation and amortization |
$ | 47,924 | $ | 47,812 | ||||
Included in land and improvements is a land parcel with a book value of $348,000 located in Rogue River, Oregon, and held for future branch development.
Depreciation expense totaled $2.9 million, $3.1 million, and $3.2 million for the years ended December 31, 2010, 2009 and 2008, respectively.
At December 31, 2010, there were no new construction contracts for new branches. Construction contracts related to branch facility improvements were approximately $1.3 million at December 31, 2010 and are included in construction in progress.
NOTE 9—CORE DEPOSIT INTANGIBLES
At December 31, 2010 and 2009, PremierWest had $2.5 million and $3.4 million of core deposit intangibles, respectively, net of accumulated amortization of $4.8 million and $3.9 million, respectively. For each of the years ending December 31, 2010, 2009 and 2008, PremierWest recorded amortization expense related to these core deposit intangibles totaling $959,000, $817,000, and $698,000 respectively.
The table below presents the estimated amortization expense for the core deposit intangibles acquired in all mergers for each of the next five years and thereafter:
| Year |
Estimated Amount |
|||
| (in thousands) | ||||
| 2011 |
$ | 499 | ||
| 2012 |
465 | |||
| 2013 |
465 | |||
| 2014 |
465 | |||
| 2015 |
334 | |||
| Thereafter |
261 | |||
| $ | 2,489 | |||
96
Table of Contents
PREMIERWEST BANCORP AND SUBSIDIARY
NOTES TO CONSOLIDATED FINANCIAL STATEMENTS
NOTE 10— GOODWILL
When goodwill exists, the Company performs a goodwill impairment analysis on an annual basis as of December 31 and on an interim basis when events or circumstances suggest impairment may potentially arise. A significant amount of judgment is required in determining if indications of impairment have occurred including, but not limited to, a sustained and significant decline in the stock price and market capitalization of the Company, a significant decline in the future cash flows expected by the Company, an adverse regulatory action, or a significant adverse change in the Company’s business operating environment and other events.
At December 31, 2009, the Company determined that a number of factors suggested that goodwill impairment might exist and, accordingly engaged an independent third-party valuation consultant to assist management in performing an impairment analysis as had been done as of September 30, 2009, June 30, 2009, March 31, 2009 and December 31, 2008.
The Company recorded a goodwill impairment charge of $74.9 million at December 31, 2009, reducing goodwill on the balance sheet to zero. The goodwill impairment charge had no effect on the Company’s cash balances, liquidity or regulatory capital ratios.
NOTE 11—INCOME TAXES
The provision (benefit) for income taxes for the years ended December 31 was as follows (in thousands):
| 2010 | 2009 | 2008 | ||||||||||
| Current expense: |
||||||||||||
| Federal |
$ | (345 | ) | $ | (7,938 | ) | $ | (6,264 | ) | |||
| State |
53 | 76 | — | |||||||||
| (292 | ) | (7,862 | ) | (6,264 | ) | |||||||
| Deferred expense (benefit): |
||||||||||||
| Federal |
1,006 | 17,617 | 1,427 | |||||||||
| State |
(580 | ) | (12,037 | ) | (656 | ) | ||||||
| 426 | 5,580 | 771 | ||||||||||
| Provision (benefit) for income taxes |
$ | 134 | $ | (2,282 | ) | $ | (5,493 | ) | ||||
97
Table of Contents
PREMIERWEST BANCORP AND SUBSIDIARY
NOTES TO CONSOLIDATED FINANCIAL STATEMENTS
NOTE 11—INCOME TAXES—(continued)
The provision (benefit) for income taxes results in effective tax rates that are different than the federal income tax statutory rate. Differences for the years ended December 31 are as follows (in thousands):
| 2010 | 2009 | 2008 | ||||||||||||||||||||||
| Amount | Rate | Amount | Rate | Amount | Rate | |||||||||||||||||||
| Expected federal income tax provision at statutory rate |
$ | (1,689 | ) | 35.00 | % | $ | (52,064 | ) | 35.00 | % | $ | (4,561 | ) | 35.00 | % | |||||||||
| State income taxes, net of federal effect |
(338 | ) | 7.01 | % | (4,133 | ) | 2.78 | % | (750 | ) | 5.76 | % | ||||||||||||
| Effect of non-taxable interest income, net |
(160 | ) | 3.32 | % | (131 | ) | 0.09 | % | (152 | ) | 1.17 | % | ||||||||||||
| Effect of non-taxable increases in the cash surrender value of life insurance |
(217 | ) | 4.50 | % | (219 | ) | 0.15 | % | (244 | ) | 1.87 | % | ||||||||||||
| Stock-based compensation |
91 | -1.90 | % | 156 | -0.11 | % | 184 | -1.41 | % | |||||||||||||||
| Goodwill impairment |
— | 0.00 | % | 24,274 | -16.32 | % | — | 0.00 | % | |||||||||||||||
| Increase in valuation allowance |
1,963 | -40.68 | % | 30,172 | -20.28 | % | — | 0.00 | % | |||||||||||||||
| Estimated impact of Section 382 |
832 | -17.24 | % | — | 0.00 | % | — | 0.00 | % | |||||||||||||||
| Other, net |
(348 | ) | 7.22 | % | (337 | ) | 0.23 | % | 30 | -0.24 | % | |||||||||||||
| Provision (benefit) for income taxes |
$ | 134 | -2.77 | % | $ | (2,282 | ) | 1.53 | % | $ | (5,493 | ) | 42.15 | % | ||||||||||
The components of the net deferred tax asset as of December 31 were approximately as follows (in thousands):
| 2010 | 2009 | |||||||
| Assets: |
||||||||
| Allowance for loan losses |
$ | 14,463 | $ | 18,440 | ||||
| Benefit plans |
3,795 | 3,612 | ||||||
| Intangibles |
1,510 | 1,302 | ||||||
| State tax credits |
511 | 517 | ||||||
| Net operating loss |
9,508 | 10,480 | ||||||
| Other |
7,876 | 2,930 | ||||||
| Total deferred tax assets |
37,663 | 37,281 | ||||||
| Liabilities: |
||||||||
| Net unrealized gains on investment securities available-for-sale |
324 | 426 | ||||||
| FHLB stock dividends |
357 | 353 | ||||||
| Premises and equipment |
3,243 | 3,315 | ||||||
| Loan origination costs |
1,081 | 1,231 | ||||||
| Prepaids |
345 | 286 | ||||||
| Deferred revenue |
37 | 42 | ||||||
| Other |
465 | 1,882 | ||||||
| Total deferred tax liabilities |
5,852 | 7,535 | ||||||
| Net deferred tax asset subtotal |
31,811 | 29,746 | ||||||
| Valuation allowance |
(31,811 | ) | (29,746 | ) | ||||
| Net deferred tax asset |
$ | — | $ | — | ||||
The change in the valuation allowance is due to net operating losses established during the year due to taxable losses incurred and the impact of the Bank’s preliminary Internal Revenue Code Section 382 analysis.
Pursuant to Sections 382 and 383 of the Internal Revenue Code, annual use of net operating loss and credit carryforwards may be limited in the event a cumulative change in ownership of more than 50 percent occurs
98
Table of Contents
PREMIERWEST BANCORP AND SUBSIDIARY
NOTES TO CONSOLIDATED FINANCIAL STATEMENTS
NOTE 11—INCOME TAXES—(continued)
within a three-year period. We determined that such an ownership change occurred as of March 19, 2010 as a result of stock issuances. Based on preliminary calculations, this ownership change resulted in estimated limitations on the utilization of tax attributes, including net operating loss carryforwards and tax credits. We estimated that approximately $17.9 million of our Oregon and $2.3 million of our California net operating loss carryforwards and $255,000 of Oregon tax credits will be effectively eliminated. Pursuant to Section 382, a portion of the limited net operating loss carryforwards and credits becomes available to use each year. We estimate that approximately $2.5 million and $1.2 million of the restricted Oregon net operating losses and tax credits and California net operating loss carryforwards, respectively, will become available each year.
The Bank’s deferred tax assets and valuation allowance have been reduced by $0.8 million to reflect the estimated impact of Section 382 limitations on the utilization of the Oregon and California net operating loss carryforwards and Oregon tax credits. The impact is also reflected in the reconciliation of the income tax (benefit) provision.
A $20.2 million federal net operating loss carryforward is available to offset future federal taxable income. This net operating loss will expire in 2029 if not utilized in an earlier period. After the impact of the estimated Section 382 analysis, an Oregon net operating loss carryforward of $22.9 million is available to offset future Oregon taxable income, which will begin to expire in 2023 if not utilized in an earlier period. After the impact of the estimated Section 382 analysis, a California net operating loss carryforward of $16.3 million is available to offset future California taxable income which will begin to expire in 2028 if not utilized in an earlier period. Federal general business credits of $430,000 are available to offset future income and will begin to expire in 2028. Federal alternative minimum tax credits of $503,000 are available to offset future federal income tax. These credits have no expiration.
After the impact of the estimated Section 382 analysis, the state tax credits include purchased tax credits totaling $9,000 and $255,000 at December 31, 2010 and 2009, respectively. These purchased tax credits consist of State of Oregon Business Energy Tax Credits (“BETC”) that will be utilized to offset future Oregon income taxes. The Company made BETC purchases in 2006 through 2008. The purchased credits expire after 8 years but are expected to be utilized within 5 years of purchase. Additional state tax credits include Oregon Lending credits that expire in 2014 as well as California Hiring credits and California Low-Income Housing credits. Neither of these credits has an expiration period; however, the California Hiring credit is dependent upon the Company continuing to transact business in the Enterprise Zone.
The 2010 increase in the net deferred tax asset valuation allowance of approximately $2.1 million included the effect of $324,000 related to unrealized gains and losses on securities available-for-sale that was allocated to other comprehensive income.
Management believes, based upon the Bank’s expected performance, that it is more likely than not that the deferred tax assets will not be recognized in the normal course of operations within the next business cycle and, accordingly, Management has reduced the entire net deferred tax asset by a corresponding valuation allowance.
99
Table of Contents
PREMIERWEST BANCORP AND SUBSIDIARY
NOTES TO CONSOLIDATED FINANCIAL STATEMENTS
NOTE 12—TIME DEPOSITS
Time deposits of $100,000 and over totaled approximately $220.4 million and $221.9 million at December 31, 2010 and 2009, respectively.
At December 31, 2010, the scheduled annual maturities for all time deposits were as follows (in thousands):
| Years ending December 31, 2011 |
$ | 351,370 | ||
| 2012 |
107,253 | |||
| 2013 |
73,298 | |||
| 2014 |
8,625 | |||
| 2015 |
12,805 | |||
| Thereafter |
370 | |||
| $ | 553,721 | |||
The Company had brokered deposits of $742,000 and $44.3 million at December 31, 2010, and 2009, respectively.
NOTE 13—FEDERAL FUNDS PURCHASED
The Bank maintains Federal funds lines with correspondent banks and the Federal Reserve discount window as a backup source of liquidity. Federal funds purchased generally mature within one to four days from the transaction date. The Federal Funds purchased balance at both December 31, 2010 and 2009 was zero. The Bank had approximately $20.0 million of federal funds lines available to draw against with correspondent banks. In addition, certain qualifying loans totaling approximately $30.2 million were pledged to provide for an additional available borrowing capacity of approximately $13.6 million with the Federal Reserve discount window as of December 31, 2010.
NOTE 14—FEDERAL HOME LOAN BANK BORROWINGS
The Bank had long-term borrowings outstanding with the Federal Home Loan Bank (“FHLB”) totaling $22,000 and $28,000 as of December 31, 2010 and 2009, respectively. The Bank makes monthly principal and interest payments on the long-term borrowings, which mature in 2014 and bear a fixed interest rate of 6.53%. The Bank also participates in the Cash Management Advance (“CMA”) program with the FHLB. CMA borrowings are short-term borrowings that mature within one year and accrue interest at the variable rate as published by the FHLB. As of December 31, 2010 and 2009, the Bank had no outstanding CMA borrowings. All outstanding borrowings with the FHLB are collateralized as provided for under the Advances, Security and Deposit Agreement between the Bank and the FHLB and include the Bank’s FHLB stock and any funds or investment securities held by the FHLB that are not otherwise pledged for the benefit of others. At December 31, 2010, the Company maintained a line of credit with the FHLB of Seattle for $80.6 million and was in compliance with its related collateral requirements. At December 31, 2010, the Company had letters of credit totaling $915,000 and $79.6 million was available for additional borrowing.
At December 31, 2010, the Company held a total of approximately $354,000 of cash on deposit with the FHLB of Seattle and FHLB of San Francisco.
The scheduled repayment of FHLB borrowings is as follows (in thousands):
| Years ending December 31, 2011 |
$ | 7 | ||
| 2012 |
7 | |||
| 2013 |
7 | |||
| 2014 |
1 | |||
| $ | 22 | |||
100
Table of Contents
PREMIERWEST BANCORP AND SUBSIDIARY
NOTES TO CONSOLIDATED FINANCIAL STATEMENTS
NOTE 15—JUNIOR SUBORDINATED DEBENTURES
On December 30, 2004, the Company established two wholly-owned statutory business trusts (“PremierWest Statutory Trust I and II”) that were formed to issue junior subordinated debentures and related common securities. On August 25, 2005, Stockmans Financial Group established a wholly-owned statutory business trust (“Stockmans Financial Trust I”) to issue junior subordinated debentures and related common securities. Following the acquisition of Stockmans Financial Group, the Company became the successor-in-interest to Stockmans Financial Trust I. Common stock issued by the Trusts and held as an investment by the Company are recorded in other assets in the consolidated balance sheets.
Following are the terms of the junior subordinated debentures as of December 31, 2010:
| Trust Name |
Issue Date | Issued Amount |
Rate | Maturity Date |
Redemption Date |
|||||||||||||||
| PremierWest Statutory |
|
December 2004 |
|
$ | 7,732,000 | LIBOR + 1.75%(1) | |
December 2034 |
|
|
December 2009 |
| ||||||||
| PremierWest Statutory |
|
December 2004 |
|
7,732,000 | LIBOR + 1.79%(2) | |
March 2035 |
|
|
March 2010 |
| |||||||||
| Stockmans Financial |
|
August 2005 |
|
15,464,000 | LIBOR + 1.42%(3) | |
September 2035 |
|
|
September 2010 |
| |||||||||
| $ | 30,928,000 | |||||||||||||||||||
| (1) | PremierWest Statutory Trust I was bearing interest at the fixed rate of 5.65% until mid-December 2009, at which time it changed to a variable rate of 3-month LIBOR (0.30% at December 15, 2010) plus 1.75% or 2.05%, adjusted quarterly, through the final maturity date in December 2034. |
| (2) | PremierWest Statutory Trust II was bearing interest at the fixed rate of 5.65% until March 2010, at which time it changed to the variable rate of 3-month LIBOR (0.30% at December 15, 2010) plus 1.79% or 2.09%, adjusted quarterly, through the final maturity date in March 2035. |
| (3) | Stockmans Financial Trust I was bearing interest at the fixed rate of 5.93% until September 2010, at which time it changed to the variable rate of 3-month LIBOR (0.30% at December 15, 2010) plus 1.42% or 1.72%, adjusted quarterly, through the final maturity date in September 2035. |
The Oregon Department of Consumer and Business Services, which supervises banks and bank holding companies through its Division of Finance and Corporate Securities, and the Federal Reserve have policies that encourage banks and bank holding companies to pay dividends from current earnings, and have the general authority to limit the dividends paid by banks and bank holding companies, respectively. The Company does not expect to be in a position to pay interest payments on trust preferred securities without regulatory approval or until the Bank is “well-capitalized” and has satisfied conditions in any regulatory agreement or action. We are permitted to defer such interest payments for up to 20 consecutive quarters, but during a deferral period we are prohibited from making dividend payments on our capital stock. The amount of accrued and unpaid interest was approximately $1.6 million as of December 31, 2010. At December 31, 2010, the Company had deferred payment of interest for five consecutive quarters.
NOTE 16—OFF-BALANCE SHEET FINANCIAL INSTRUMENTS
In the normal course of business, the Bank is a party to financial instruments with off-balance sheet risk to meet the financing needs of its customers. These financial instruments include commitments to extend credit and standby letters of credit. These instruments involve, to varying degrees, elements of credit and interest rate risk in
101
Table of Contents
PREMIERWEST BANCORP AND SUBSIDIARY
NOTES TO CONSOLIDATED FINANCIAL STATEMENTS
NOTE 16—OFF-BALANCE SHEET FINANCIAL INSTRUMENTS—(continued)
excess of amounts recognized in the accompanying consolidated balance sheets. The contractual amounts of these instruments reflect the extent of the Bank’s involvement in these particular classes of financial instruments. As of December 31, 2010 and 2009, the Bank had no commitments to extend credit at below-market interest rates and held no derivative financial instruments.
The Bank’s exposure to credit loss in the event of non-performance for commitments to extend credit and standby letters of credit is represented by the contractual amount of those instruments. The Bank uses the same credit policies in making commitments and conditional obligations as it does for on-balance sheet instruments. The distribution of commitments to extend credit approximates the distribution of loans outstanding.
A summary of the Bank’s off-balance sheet financial instruments at December 31 is as follows (in thousands):
| 2010 | 2009 | |||||||
| Commitments to extend credit |
$ | 76,826 | $ | 103,614 | ||||
| Standby letters of credit |
5,197 | 22,252 | ||||||
| Total off-balance sheet financial instruments |
$ | 82,023 | $ | 125,866 | ||||
Commitments to extend credit are agreements to lend to a customer as long as there is no violation of any condition established in the contract. Commitments generally have fixed expiration dates or other termination clauses and may require payment of fees. Since many of the commitments are expected to expire without being drawn upon, the total commitment amounts do not necessarily represent future cash requirements. The Bank evaluates each customer’s creditworthiness on a case-by-case basis. The amount of collateral obtained, if it is deemed necessary by the Bank upon extension of credit, is based on Management’s credit evaluation of the counterparty. Collateral held for commitments varies but may include accounts receivable, inventory, property and equipment, residential real estate or income-producing commercial properties.
Standby letters of credit are conditional commitments issued by the Bank to guarantee the performance of a customer to a third party. These guaranties are primarily issued to support public and private borrowing arrangements. The credit risk involved in issuing letters of credit is essentially the same as that involved in extending loan facilities to customers. Collateral held, if required, varies as specified above.
The Bank maintains a reserve against these off-balance sheet financial instruments of $85,000 and $130,000 at December 31, 2010 and 2009, respectively.
The Company also had approximately $290,000 of other unsecured lines of credit related to overdraft protection for demand deposit accounts.
NOTE 17—TRANSACTIONS WITH RELATED PARTIES
Certain officers and directors (and the companies with which they are associated) are customers of, and have had banking transactions with, the Bank in the ordinary course of business. All loans and commitments to lend to such parties are generally made on the same terms, including interest rates and collateral, as those prevailing at the time for comparable transactions with other persons. In the opinion of Management, these transactions do not involve more than the normal risk of collectability or present any other unfavorable features.
102
Table of Contents
PREMIERWEST BANCORP AND SUBSIDIARY
NOTES TO CONSOLIDATED FINANCIAL STATEMENTS
NOTE 17—TRANSACTIONS WITH RELATED PARTIES—(continued)
An analysis of the activity with respect to loans outstanding to directors and executive officers of the Bank and their affiliates for the years ended December 31 is as follows (in thousands):
| 2010 | 2009 | |||||||
| Beginning balance |
$ | 23,171 | $ | 23,617 | ||||
| Additions |
3,905 | 955 | ||||||
| Repayments |
(3,018 | ) | (1,401 | ) | ||||
| Ending balance |
$ | 24,058 | $ | 23,171 | ||||
Deposits held for executive officers and directors at December 31, 2010 and 2009, were approximately $4.5 million and $13.4 million, respectively.
NOTE 18—COMMITMENTS AND CONTINGENCIES
Operating lease commitments—As of December 31, 2010, the Bank leased certain properties from unrelated third parties. Future minimum lease commitments pursuant to these operating leases are as follows (in thousands):
| Years ending December 31, 2011 |
$ | 976 | ||
| 2012 |
823 | |||
| 2013 |
646 | |||
| 2014 |
534 | |||
| 2015 |
534 | |||
| Thereafter |
2,778 | |||
| $ | 6,291 | |||
Rental expense for all operating leases was $1.2 million, $1.1 million, and $1.0 million for the years ended December 31, 2010, 2009 and 2008, respectively.
Legal contingencies—We are occasionally a party to various claims and legal proceedings. The Company had been named as a defendant in a suit filed in California that alleged lender liability. In the fourth quarter of 2010, the Bank was released of any claims against it, and the lawsuit was dismissed with prejudice. If Management believes that a loss arising from these matters is probable and can reasonably be estimated, we record the amount of the loss, or the minimum estimated liability when the loss is estimated using a range, and no point within the range is more probable than another. As additional information becomes available, any potential liability related to these matters is assessed and the estimates are revised, if necessary.
In the ordinary course of business, the Bank may become involved in litigation arising from normal banking activities. In the opinion of Management, the ultimate disposition of current actions is unlikely to have a material adverse effect on the Company’s consolidated financial position or results of operations. Based on currently available information, Management believes that the ultimate outcome of these matters, individual and in the aggregate, will not have a material adverse effect on our financial position or overall trends in results of operations. However, litigation is subject to inherent uncertainties, and unfavorable rulings could occur. An unfavorable ruling could include monetary damages or an injunction prohibiting us from selling one or more products. If an unfavorable ruling were to occur, there exists the possibility of a material adverse impact on the financial position and results of operations of the period in which the ruling occurs or in future periods.
103
Table of Contents
PREMIERWEST BANCORP AND SUBSIDIARY
NOTES TO CONSOLIDATED FINANCIAL STATEMENTS
NOTE 19—BENEFIT PLANS
401(k) profit sharing plan—The Bank maintains a 401(k) profit sharing plan (the Plan) that covers substantially all full-time employees. Employees may make voluntary tax deferred contributions to the Plan, and the Bank’s contributions to the Plan are at the discretion of the Board of Directors, not to exceed the amount deductible for federal income tax purposes. Employees vest in the Bank’s contributions to the Plan over a period of six years. Total amounts charged to operations under the Plan were approximately $205,000, $343,000, and $456,000 for the years ended December 31, 2010, 2009 and 2008, respectively. The decrease in expenses in 2009 is due to the Bank reducing the matching contribution effective July 2009.
Executive supplemental retirement and severance plans—In connection with previous acquisitions of United Bancorp, Timberline Bancshares, Inc., Mid Valley Bank and Stockmans Bank, the Company entered into various severance, non-compete, deferred compensation and retirement agreements with previous executives and Board members of the acquired companies. These plans provide for retirement benefits that increase annually until each executive reaches retirement age and will be paid out over a period ranging from 15 years to life (for two executives). The deferred compensation plan provides interest on income previously earned for which receipt was deferred for tax purposes, plus interest accrued. As of December 31, 2010 and 2009, the Bank’s recorded liability pursuant to these agreements was $9.3 million and $8.3 million respectively. Payments on these plans are made monthly and will continue until the liabilities are paid in full. The expenses related to these agreements were $936,000, $1.3 million, and $934,000 for the years ended December 31, 2010, 2009 and 2008, respectively. To support its obligations under these arrangements, the Bank acquired bank-owned life insurance policies. These policies had aggregate cash surrender values of $15.7 and $16.1 as of December 31, 2010 and 2009, respectively. The increase in the cash surrender value of the bank-owned life insurance policies was $542,000, $556,000, and $609,000 for the years ended December 31, 2010, 2009, and 2008, respectively.
NOTE 20—BASIC AND DILUTED LOSS PER COMMON SHARE
The following summarizes the calculations for basic and diluted loss per common share, after giving retroactive effect for stock dividends and the 1-for-10 reverse stock split, for the years ended December 31, (in thousands, except per share amounts):
| Net Loss Available to Common Shareholders (Numerator) |
Weighted Average Shares (Denominator) |
Per Share Amount |
||||||||||
| 2010 |
||||||||||||
| Basic loss per common share (loss available to common shareholders net of $2.5 million preferred share dividends declared and accretion of discount) |
$ | (7,492 | ) | 8,318,042 | $ | (0.90 | ) | |||||
| Diluted loss per common share |
$ | (7,492 | ) | 8,318,042 | $ | (0.90 | ) | |||||
| 2009 |
||||||||||||
| Basic loss per common share (loss available to common shareholders net of $2.2 million preferred share dividends declared and accretion of discount) |
$ | (148,643 | ) | 2,474,484 | $ | (60.07 | ) | |||||
| Diluted loss per common share |
$ | (148,643 | ) | 2,474,484 | $ | (60.07 | ) | |||||
| 2008 |
||||||||||||
| Basic loss per common share (loss available to common shareholders net of $275,000 declared dividends to preferred shareholders) |
$ | (7,814 | ) | 2,323,606 | $ | (3.36 | ) | |||||
| Diluted loss per common share |
$ | (7,814 | ) | 2,323,606 | $ | (3.36 | ) | |||||
104
Table of Contents
PREMIERWEST BANCORP AND SUBSIDIARY
NOTES TO CONSOLIDATED FINANCIAL STATEMENTS
NOTE 20—BASIC AND DILUTED LOSS PER COMMON SHARE—(continued)
As of December 31, 2010, 2009 and 2008, stock options of approximately 85,000, 96,000, and 79,000, respectively, were not included in the computation of diluted earnings per share as their inclusion would have been anti-dilutive.
NOTE 21—PREFERRED STOCK
On February 13, 2009, in exchange for an aggregate purchase price of $41.4 million, the Company issued and sold to the United States Department of the Treasury pursuant to the Troubled Asset Relief Program Capital Purchase Program (“TARP”) the following: (i) 41,400 shares of the Company’s Fixed Rate Cumulative Perpetual Preferred Stock, Series B, no par value per share, and liquidation preference of $1,000 per share and (ii) a Warrant to purchase up to 109,039 shares of the Company’s common stock, no par value per share, at an exercise price of $57.00 per share, subject to certain anti-dilution and other adjustments. The Warrant may be exercised for up to ten years after it is issued.
In connection with the issuance and sale of the Company’s securities, the Company entered into a Letter Agreement including the Securities Purchase Agreement-Standard Terms, dated February 13, 2009, with the United States Department of the Treasury (the “Agreement”). The Agreement contains limitations on the payment of quarterly cash dividends on the Company’s common stock in excess of $0.057 per share and on the Company’s ability to repurchase its common stock. The Agreement also grants the holders of the Series B Preferred Stock, the Warrant and the common stock to be issued under the Warrant registration rights, and subjects the Company to executive compensation limitations included in the Emergency Economic Stabilization Act of 2008 as amended by the American Recovery and Reinvestment Act of 2009. Participants in the TARP Capital Purchase Program are required to have in place limitations on the compensation of Senior Executive Officers and other employees.
The Series B Preferred Stock (“Preferred Stock”) will bear cumulative dividends at a rate of 5.0% per annum for the first five years and 9.0% per annum thereafter, in each case, applied to the $1,000 per share liquidation preference, but will only be paid when, as and if declared by the Company’s Board of Directors out of funds legally available. The Preferred Stock has no maturity date and ranks senior to the Company’s common stock with respect to the payment of dividends and distributions and amounts payable in the event of liquidation, dissolution and winding up of the Company.
In February 2009, following passage of the American Recovery and Reinvestment Act of 2009, the program terms were changed and the Company is no longer required to conduct a qualified equity offering prior to retirement of the Series B Preferred Stock; however, prior approval of the Company’s primary federal regulator is required.
The Preferred Stock is not subject to any contractual restrictions on transfer. The holders of the Preferred Stock have no general voting rights, and have only limited class voting rights including authorization or issuance of shares ranking senior to the Preferred Stock, any amendment to the rights of the Preferred Stock, or any merger, exchange or similar transaction which would adversely affect the rights of the Preferred Stock. If dividends on the Preferred Stock are not paid in full for six dividend periods, whether or not consecutive, the Preferred Stock holders will have the right to elect two directors. The right to elect directors will end when full dividends have been paid for four consecutive dividend periods. The Preferred Stock is not subject to sinking fund requirements and has no participation rights.
While payments have not been made for four dividend periods (since the third quarter of 2009) in order to preserve capital, the Company has continued to accrue dividends through the fourth quarter of 2010. As of December 31, 2010, accrued and unpaid dividends totaled approximately $2.9 million.
105
Table of Contents
PREMIERWEST BANCORP AND SUBSIDIARY
NOTES TO CONSOLIDATED FINANCIAL STATEMENTS
NOTE 22—STOCK OPTION PLAN
At December 31, 2010, PremierWest Bancorp had two outstanding stock option plans—the 1992 Stock Option Plan (“1992 Plan”) and the 2002 Stock Incentive Plan (“2002 Plan”). The 2002 Plan superseded the 1992 Plan; no additional grants may be made under the 1992 Plan. The 2002 Plan was initially established in May 2002 and was approved by shareholders. The 2002 Plan was subsequently amended and restated in May 2005 to allow for the issuance of restricted stock grants in addition to stock options. The 2002 Plan was also amended and restated in May 2007 to increase the number of shares available for issuance under the plan by 1,000,000 shares. The amended and restated 2002 Plan was approved by shareholders in May 2005 and 2007. After the effect of the 1-for-10 reverse stock split that was effective February 10, 2011, the Plan allows for the issuance of up to 214,012 shares of stock awards of which a total of 128,636 shares were available for issuance as either stock options or restricted stock grants as of December 31, 2010. As of December 31, 2010, there were 500 restricted stock grants outstanding, 25 shares were vested, with the remaining 475 shares expected to fully vest by 2016.
The amended and restated 2002 Plan allows for stock options to be granted at an exercise price of not less than the fair market value of PremierWest Bancorp stock on the date of issuance, for a term not to exceed ten years. The Compensation Committee establishes the vesting schedule for each grant; historically, the Committee has utilized graded vesting schedules over two, five, or seven year periods. Upon exercise of stock options or issuance of restricted stock grants, it is the Company’s policy to issue new shares of common stock.
Stock option activity during the year ended December 31, 2010 was as follows:
| Number of Options |
Weighted Average Exercise Price |
Weighted Average Remaining Contractual Life (Years) |
Aggregate Intrinsic Value (in thousands) |
|||||||||||||
| Stock options outstanding, 12/31/09 |
93,050 | $ | 91.56 | |||||||||||||
| Granted |
450 | 8.76 | ||||||||||||||
| Exercised |
— | — | ||||||||||||||
| Forfeited |
(8,124 | ) | 89.44 | |||||||||||||
| Expired |
— | — | ||||||||||||||
| Stock options outstanding, 12/31/10 |
85,376 | $ | 91.33 | 4.99 | $ | — | ||||||||||
| Stock options exercisable, 12/31/10 |
56,207 | $ | 87.75 | 3.94 | $ | — | ||||||||||
PremierWest Bancorp follows ASC “Share-Based Payment” which requires companies to measure and recognize as compensation expense the grant date fair market value for all share-based awards. That portion of the grant date fair market value that is ultimately expected to vest is recognized as expense over the requisite service period, typically the vesting period, utilizing the straight-line attribution method. This Standard requires companies to estimate the fair market value of stock-based payment awards on the date of grant using an option-pricing model. The Company uses the Black-Scholes option-pricing model to value our stock options. The Black-Scholes model requires the use of assumptions regarding the historical volatility of our stock price, our expected dividend yield, the risk-free interest rate and the weighted average expected life of the options. The following schedule reflects the weighted-average assumptions included in this model as it relates to the valuation of options granted for the periods indicated:
| 2010 | 2009 | 2008 | ||||||||||
| Risk-free interest rate |
2.5 | % | 3.0 | % | 3.3 | % | ||||||
| Expected dividend |
0.00 | % | 2.54 | % | 2.49 | % | ||||||
| Expected life, in years |
7.0 | 7.0 | 7.0 | |||||||||
| Expected volatility |
64 | % | 38 | % | 28 | % | ||||||
106
Table of Contents
PREMIERWEST BANCORP AND SUBSIDIARY
NOTES TO CONSOLIDATED FINANCIAL STATEMENTS
NOTE 22—STOCK OPTION PLAN—(continued)
The weighted-average grant date fair value of options granted during the years ended 2010, 2009, and 2008 was $5.70, $9.20, and $25.40, respectively.
The following table presents the intrinsic value of stock options exercised, cash received from stock options exercised and the tax benefit realized for deductions related to stock options exercised and the unrecognized stock-based compensation as of or for the years ended December 31, 2009 and 2008. No stock options were exercised for the year ended December 31, 2010.
| 2010 | 2009 | 2008 | ||||||||||
| Intrinsic value of stock options exercised |
$ | — | $ | 30,000 | $ | 977,000 | ||||||
| Cash received from stock options exercised |
$ | — | $ | 43,800 | $ | 73,000 | ||||||
| Tax benefit realized from stock options exercised |
$ | — | $ | — | $ | 138,000 | ||||||
| Unrecognized stock-based compensation |
$ | 459,222 | $ | 910,918 | $ | 1,353,930 | ||||||
Stock-based compensation expense recognized under “Share-Based Payment”, resulting from stock options that were granted during the current and previous periods that vested during the current period, totaled $372,000, 448,000 and 433,000 for the years ended December 31, 2010, 2009, and 2008, respectively.
Unrecognized stock-based compensation of $459,000 will be recognized over 3.0 years as of December 31, 2010. The weight-average remaining years were 1.9 years and 2.2 years as of December 31, 2009 and 2008, respectively.
Information regarding the number, weighted-average exercise price and weighted-average remaining contractual life of options by range of exercise price at December 31, 2010, is as follows:
| Options Outstanding | Exercisable Options | |||||||||||||||||||||||
| Exercise Price Range |
Number of Options |
Weighted- Average Exercise Price |
Weighted- Average Remaining Contractual Life (Years) |
Number of Options |
Weighted- Average Exercise Price |
Weighted- Average Remaining Contractual Life (Years) |
||||||||||||||||||
| $0.00 – $25.00 |
450 | 8.76 | 4.13 | — | — | — | ||||||||||||||||||
| $50.01 – $75.00 |
15,504 | 51.59 | 2.25 | 14,499 | 52.17 | 1.85 | ||||||||||||||||||
| $75.01 – $90.00 |
24,863 | 86.15 | 5.85 | 11,826 | 83.18 | 4.33 | ||||||||||||||||||
| $90.01 – $125.00 |
37,254 | 100.16 | 4.75 | 24,281 | 95.79 | 4.41 | ||||||||||||||||||
| $125.01 – $150.00 |
1,517 | 128.63 | 5.86 | 970 | 130.17 | 5.82 | ||||||||||||||||||
| $150.01 – $175.00 |
5,788 | 159.81 | 5.25 | 4,631 | 159.81 | 5.25 | ||||||||||||||||||
| 85,376 | 56,207 | |||||||||||||||||||||||
In March 2008, the Company’s Board of Directors approved a transaction involving the exchange of shares of the Company’s common stock in partial payment of the option exercise consideration paid by two officers to exercise vested options. On March 3, 2008, the two officers exercised 18,996 outstanding options using an aggregate of $7,000 of cash and 10,260 shares of common stock. The shares exchanged as option exercise consideration were priced at the market closing price of the Company’s common stock on that day.
107
Table of Contents
PREMIERWEST BANCORP AND SUBSIDIARY
NOTES TO CONSOLIDATED FINANCIAL STATEMENTS
NOTE 23—REGULATORY MATTERS
Federal bank regulatory agencies use “risk-based” capital adequacy guidelines in the examination and regulation of banks and bank holding companies that are designed to make capital requirements more sensitive to differences in risk profiles among banks and bank holding companies.
Under the guidelines, an institution’s capital is divided into Tier 1 capital and Tier 2 capital. Tier 1 capital generally consists of common stockholders’ equity, surplus and undivided profits. Tier 2 capital generally consists of the allowance for loan losses, hybrid capital instruments and subordinated debt. The sum of Tier 1 capital and Tier 2 capital represents total capital.
The adequacy of an institution’s capital is determined primarily by analyzing risk-weighted assets. The guidelines assign risk weightings to assets to quantify the relative risk of each asset and to determine the minimum capital required to support that risk. An institution’s risk-weighted assets are then compared with its Tier 1 capital and total capital to arrive at a Tier 1 risk-based ratio and a total risk-based ratio, respectively. The guidelines also utilize a leverage ratio, which is Tier 1 capital as a percentage of average total assets, less intangibles.
Under the guidelines, an institution is assigned to one of five capital categories depending on its total risk-based capital ratio, Tier I risk-based capital ratio, and leverage ratio, together with certain subjective factors. The categories range from “well-capitalized” to “critically undercapitalized.” Institutions that are “undercapitalized” or lower are subject to certain mandatory supervisory corrective actions.
A bank is deemed to be “well-capitalized” if the bank:
| • | has a total risk-based capital ratio of 10.0 percent or greater; and |
| • | has a Tier 1 risk-based capital ratio of 6.0 percent or greater; and |
| • | has a leverage ratio of 5.0 percent or greater; and |
| • | is not subject to any written agreement or order issued by the FDIC. |
A bank is deemed to be “adequately capitalized” if the bank:
| • | has a total risk-based capital ratio of 8.0 percent or greater; and |
| • | has a Tier 1 risk-based capital ratio of 4.0 percent or greater; and |
| • | has a leverage ratio of 4.0 percent or greater (or 3.0 percent in certain circumstances); and |
| • | does not meet the definition of a well-capitalized bank. |
Although the Bank meets the quantitative guidelines set forth above to be deemed “well-capitalized”, the Bank remains subject to the Agreement with the FDIC and, therefore, is deemed to be “adequately capitalized.” Pursuant to the Agreement with the FDIC, as discussed earlier, the Bank was required to increase and maintain its Tier 1 capital in such an amount as to ensure a leverage ratio of 10% or more by October 3, 2010, well in excess of the 5% requirement set forth in regulatory guidelines. The 10% leverage ratio was not achieved by October 3, 2010. Management believes that, while not achieving this target in the timeframe required, the Company has demonstrated progress, taken prudent actions and maintained a good-faith commitment to reaching the requirements of the Agreement. Management continues to work toward achieving all requirements contained in the regulatory agreements in as expeditious a manner as possible.
108
Table of Contents
PREMIERWEST BANCORP AND SUBSIDIARY
NOTES TO CONSOLIDATED FINANCIAL STATEMENTS
NOTE 23—REGULATORY MATTERS—(continued)
PremierWest’s and the Bank’s actual and required capital amounts and ratios are presented in the following tables (in thousands):
| Actual | Regulatory Minimum To Be Adequately Capitalized |
Regulatory Minimum To Be Well-Capitalized Under the Consent Order Provisions |
||||||||||||||||||||||
| Amount | Ratio | Amount | Ratio | Amount | Ratio | |||||||||||||||||||
| December 31, 2010 |
||||||||||||||||||||||||
| Tier 1 capital (to average assets) |
||||||||||||||||||||||||
| Company |
$ | 123,579 | 8.66 | % | $ | 57,100 | ³ | 4.0 | % | N/A | N/A | |||||||||||||
| Bank |
$ | 126,065 | 8.85 | % | $ | 57,007 | ³ | 4.0 | % | $ | 71,259 | ³ | 5.0 | % | ||||||||||
| Tier 1 capital (to risk-weighted assets) |
||||||||||||||||||||||||
| Company |
$ | 123,579 | 11.09 | % | $ | 44,593 | ³ | 4.0 | % | N/A | N/A | |||||||||||||
| Bank |
$ | 126,065 | 11.31 | % | $ | 44,576 | ³ | 4.0 | % | $ | 66,864 | ³ | 6.0 | % | ||||||||||
| Total capital (to risk-weighted assets) |
||||||||||||||||||||||||
| Company |
$ | 137,782 | 12.36 | % | $ | 89,186 | ³ | 8.0 | % | N/A | N/A | |||||||||||||
| Bank |
$ | 140,263 | 12.59 | % | $ | 89,152 | ³ | 8.0 | % | $ | 111,440 | ³ | 10.0 | % | ||||||||||
| Actual | Regulatory Minimum To Be Adequately Capitalized |
Regulatory Minimum To Be Well-Capitalized Under the Consent Order Provisions |
||||||||||||||||||||||
| Amount | Ratio | Amount | Ratio | Amount | Ratio | |||||||||||||||||||
| December 31, 2009 |
||||||||||||||||||||||||
| Tier 1 capital (to average assets) |
||||||||||||||||||||||||
| Company |
$ | 90,284 | 5.38 | % | $ | 67,151 | ³ | 4.0 | % | N/A | N/A | |||||||||||||
| Bank |
$ | 95,500 | 5.70 | % | $ | 67,048 | ³ | 4.0 | % | $ | 83,810 | ³ | 5.0 | % | ||||||||||
| Tier 1 capital (to risk-weighted assets) |
||||||||||||||||||||||||
| Company |
$ | 90,284 | 6.84 | % | $ | 52,765 | ³ | 4.0 | % | N/A | N/A | |||||||||||||
| Bank |
$ | 95,500 | 7.25 | % | $ | 52,692 | ³ | 4.0 | % | $ | 79,038 | ³ | 6.0 | % | ||||||||||
| Total capital (to risk-weighted assets) |
||||||||||||||||||||||||
| Company |
$ | 113,705 | 8.62 | % | $ | 105,530 | ³ | 8.0 | % | N/A | N/A | |||||||||||||
| Bank |
$ | 112,331 | 8.53 | % | $ | 105,384 | ³ | 8.0 | % | $ | 131,730 | ³ | 10.0 | % | ||||||||||
109
Table of Contents
PREMIERWEST BANCORP AND SUBSIDIARY
NOTES TO CONSOLIDATED FINANCIAL STATEMENTS
NOTE 24—FAIR VALUE MEASUREMENTS
The Company’s available-for-sale securities is the only balance sheet category the Company accounts for at fair value on a recurring basis, as defined in the fair value hierarchy of “Fair Value Measurements.” The tables below present information about these securities and indicate the fair value hierarchy of the valuation techniques utilized by the Company to determine such fair value as of December 31, 2010 and 2009:
| (Dollars in 000’s) | Fair Value Measurements At 12/31/10 Using |
|||||||||||||||
| Description |
Fair Value 12/31/2010 |
Quoted Prices in Active Markets for Identical Assets (Level 1) |
Other Observable Inputs (Level 2) |
Significant Unobservable Inputs (Level 3) |
||||||||||||
| Available-for-sale securities: |
||||||||||||||||
| Mortgage-backed securities |
$ | 9,056 | $ | — | $ | 9,056 | $ | — | ||||||||
| Collaterialized mortgage obligations |
132,217 | — | 132,217 | — | ||||||||||||
| U.S. Government and agency securities |
36,276 | — | 36,276 | — | ||||||||||||
| Obligations of states and political subdivisions |
6,134 | — | 6,134 | — | ||||||||||||
| Total assets measured at fair value |
$ | 183,683 | $ | — | $ | 183,683 | $ | — | ||||||||
| (Dollars in 000’s) | Fair Value Measurements At 12/31/09 Using |
|||||||||||||||
| Description |
Fair Value 12/31/2009 |
Quoted Prices in Active Markets for Identical Assets (Level 1) |
Other Observable Inputs (Level 2) |
Significant Unobservable Inputs (Level 3) |
||||||||||||
| Available-for-sale securities: |
||||||||||||||||
| Mortgage-backed securities |
$ | 4,301 | $ | — | $ | 4,301 | $ | — | ||||||||
| Collaterialized mortgage obligations |
76,957 | — | 76,957 | — | ||||||||||||
| U.S. Government and agency securities |
27,794 | — | 27,794 | — | ||||||||||||
| Obligations of states and political subdivisions |
5,885 | — | 5,885 | — | ||||||||||||
| Total assets measured at fair value |
$ | 114,937 | $ | — | $ | 114,937 | $ | — | ||||||||
Securities classified as available-for-sale are reported at fair value utilizing Level 2 inputs. For these securities, the Company obtains fair value measurements from an independent pricing service. The fair value measurements consider observable data that may include dealer quotes, market spreads, cash flows, the U.S. Treasury yield curve, live trading levels, trade execution data, market consensus prepayment speeds, credit information and the bond’s terms and conditions, among other things.
110
Table of Contents
PREMIERWEST BANCORP AND SUBSIDIARY
NOTES TO CONSOLIDATED FINANCIAL STATEMENTS
NOTE 24—FAIR VALUE MEASUREMENTS—(continued)
Certain assets and liabilities are measured at fair value on a non-recurring basis after initial recognition such as loans measured for impairment. The following tables present the fair value measurement of assets on a non-recurring basis as of December 31, 2010 and 2009, and indicate the fair value hierarchy of the valuation techniques utilized by the Company to determine such fair value:
| (Dollars in 000’s) | Fair Value Measurements For the Twelve Months Ended 12/31/10 Using |
|||||||||||||||||||
| Description |
Fair Value 12/31/2010 |
Quoted Prices in Active Markets for Identical Assets (Level 1) |
Other Observable Inputs (Level 2) |
Significant Unobservable Inputs (Level 3) |
Total period gains (losses) included in earnings |
|||||||||||||||
| Other real estate owned and foreclosed assets |
$ | 32,009 | $ | — | $ | — | $ | 32,009 | $ | (5,347 | ) | |||||||||
| Loans measured for impairment, net of specific reserves |
46,863 | — | — | 46,863 | (22,311 | ) | ||||||||||||||
| Total impaired assets measured at fair value |
$ | 78,872 | — | — | $ | 78,872 | $ | (27,658 | ) | |||||||||||
| (Dollars in 000’s) | Fair Value Measurements For the Twelve Months Ended 12/31/09 Using |
|||||||||||||||||||
| Description |
Fair Value 12/31/2009 |
Quoted Prices in Active Markets for Identical Assets (Level 1) |
Other Observable Inputs (Level 2) |
Significant Unobservable Inputs (Level 3) |
Total period gains (losses) included in earnings |
|||||||||||||||
| Goodwill |
$ | — | $ | — | $ | — | $ | — | $ | (74,920 | ) | |||||||||
| Other real estate owned and foreclosed assets |
24,748 | — | — | 24,748 | (1,507 | ) | ||||||||||||||
| Loans measured for impairment, net of specific reserves |
50,561 | — | — | 50,561 | (59,285 | ) | ||||||||||||||
| Total impaired assets measured at fair value |
$ | 75,309 | $ | — | $ | — | $ | 75,309 | $ | (135,712 | ) | |||||||||
A loan is considered to be impaired when, based on current information and events, it is probable that the Company will be unable to collect all amounts due (both interest and principal) according to the contractual terms of the loan agreement. Impaired loans are measured as a practical expedient, at the loan’s observable market price or the fair market value of the collateral if the loan is collateral dependent.
111
Table of Contents
PREMIERWEST BANCORP AND SUBSIDIARY
NOTES TO CONSOLIDATED FINANCIAL STATEMENTS
NOTE 24—FAIR VALUE MEASUREMENTS—(continued)
As of December 31, 2010 and December 31, 2009, all nonperforming loans were considered impaired and were measured for impairment. The table below shows the detail of the various categories of impaired loans:
| (Dollars in 000’s) | As of December 31, 2010 |
As of December 31, 2009 |
||||||
| Carrying Value | Carrying Value | |||||||
| Impaired loans with charge-offs loan-to-date (1) |
$ | 28,393 | $ | 36,624 | ||||
| Impaired loans with specific reserves |
27,832 | 15,568 | ||||||
| Impaired loans with both specific reserves and charge-offs loan-to-date (1) |
297 | 6,088 | ||||||
| Subtotal impaired loans with specific reserves and/or charge-offs loan-to-date |
56,522 | 58,280 | ||||||
| Specific reserves associated with impaired loans |
(9,659 | ) | (7,719 | ) | ||||
| Total loans measured for impairment, net of specific reserves |
$ | 46,863 | $ | 50,561 | ||||
| Impaired loans without charge-offs or specific reserves |
$ | 73,094 | $ | 45,637 | ||||
| (1) | Total charge-offs incurred from inception of the loans |
The following disclosures are made in accordance with the provisions of “Disclosures About Fair Value of Financial Instruments,” which requires the disclosure of fair value information about financial instruments where it is practicable to estimate that value. In cases where quoted market values are not available, the Bank primarily uses present value techniques to estimate the fair values of its financial instruments. Valuation methods require considerable judgment, and the resulting estimates of fair value can be significantly affected by the assumptions made and methods used. Accordingly, the estimates provided herein do not necessarily indicate amounts which could be realized in a current market exchange.
In addition, as the Bank normally intends to hold the majority of its financial instruments until maturity, it does not expect to realize many of the estimated amounts disclosed. The disclosures also do not include estimated fair value amounts for items which are not defined as financial instruments but which have significant value. These include such off-balance sheet items as core deposit intangibles on non-acquired deposits. The Bank does not believe that it would be practicable to estimate a representational fair value for these types of items as of December 31, 2010 and 2009.
As “Disclosures About Fair Value of Financial Instruments” excludes certain financial instruments and all non-financial instruments from its disclosure requirements, any aggregation of the fair value amounts presented would not represent the underlying value of the Bank.
112
Table of Contents
PREMIERWEST BANCORP AND SUBSIDIARY
NOTES TO CONSOLIDATED FINANCIAL STATEMENTS
NOTE 24—FAIR VALUE MEASUREMENTS—(continued)
The estimated fair values of the Bank’s significant on-balance sheet financial instruments at December 31 were as follows (in thousands):
| (Dollars in 000’s) |
As of December 31, 2010 | As of December 31, 2009 | ||||||||||||||
| Carrying Value |
Estimated Fair Value |
Carrying Value |
Estimated Fair Value |
|||||||||||||
| Financial assets: |
||||||||||||||||
| Cash and cash equivalents |
$ | 139,024 | $ | 139,024 | $ | 103,115 | $ | 103,115 | ||||||||
| Interest-bearing certificates of deposit (original maturities greater than 90 days) |
$ | 1,500 | $ | 1,500 | $ | 50,650 | $ | 50,650 | ||||||||
| Investment securities available-for-sale |
$ | 183,683 | $ | 183,683 | $ | 114,937 | $ | 114,937 | ||||||||
| Investment securities held-to-maturity |
$ | 29,133 | $ | 29,615 | $ | 43,384 | $ | 43,536 | ||||||||
| Investment securities—Community Reinvestment Act |
$ | 2,000 | $ | 2,000 | $ | 4,000 | $ | 4,000 | ||||||||
| Restricted equity investments |
$ | 3,474 | $ | 3,474 | $ | 3,643 | $ | 3,643 | ||||||||
| Loans held-for-sale |
$ | 929 | $ | 929 | $ | 1,731 | $ | 1,731 | ||||||||
| Loans |
$ | 978,546 | $ | 913,834 | $ | 1,149,027 | $ | 1,038,580 | ||||||||
| Financial liabilities: |
||||||||||||||||
| Deposits |
$ | 1,266,249 | $ | 1,275,519 | $ | 1,420,762 | $ | 1,429,500 | ||||||||
| FHLB borrowings |
$ | 22 | $ | 22 | $ | 28 | $ | 28 | ||||||||
| Junior subordinated debentures |
$ | 30,928 | $ | 20,629 | $ | 30,928 | $ | 7,132 | ||||||||
NOTE 25—PARENT COMPANY FINANCIAL INFORMATION
Condensed financial information for PremierWest (parent company only) is presented as follows (in thousands):
CONDENSED BALANCE SHEETS
| December 31, | ||||||||
| 2010 | 2009 | |||||||
| ASSETS |
||||||||
| Cash and cash equivalents |
$ | 1,551 | $ | 1,271 | ||||
| Investment in subsidiary |
129,494 | 99,682 | ||||||
| Advances made to subsidiary |
— | — | ||||||
| Other assets |
1,435 | 2,820 | ||||||
| Total assets |
$ | 132,480 | $ | 103,773 | ||||
| LIABILITIES |
||||||||
| Junior subordinated debentures |
$ | 30,928 | $ | 30,928 | ||||
| Other liabilities |
4,544 | 1,310 | ||||||
| Total liabilities |
35,472 | 32,238 | ||||||
| SHAREHOLDERS’ EQUITY |
97,008 | 71,535 | ||||||
| Total liabilities and shareholders’ equity |
$ | 132,480 | $ | 103,773 | ||||
113
Table of Contents
PREMIERWEST BANCORP AND SUBSIDIARY
NOTES TO CONSOLIDATED FINANCIAL STATEMENTS
NOTE 25—PARENT COMPANY FINANCIAL INFORMATION—(continued)
CONDENSED STATEMENTS OF OPERATIONS
| Years Ended December 31, | ||||||||||||
| 2010 | 2009 | 2008 | ||||||||||
| Operating income |
$ | 46 | $ | 587 | $ | — | ||||||
| Cash dividends from bank subsidiary |
— | 3,100 | 7,230 | |||||||||
| Interest expense |
(1,102 | ) | (1,794 | ) | (1,725 | ) | ||||||
| Other operating expense |
(759 | ) | (1,110 | ) | (3,952 | ) | ||||||
| Provision for income taxes |
— | 751 | 838 | |||||||||
| Income (loss) before equity in undistributed net earnings of subsidiary |
(1,815 | ) | 1,534 | 2,391 | ||||||||
| Deficit in undistributed net earnings of subsidiary |
(3,144 | ) | (148,006 | ) | (9,930 | ) | ||||||
| NET LOSS |
(4,959 | ) | (146,472 | ) | (7,539 | ) | ||||||
| PREFERRED STOCK DIVIDENDS AND DISCOUNT ACCRETION |
2,533 | 2,171 | 275 | |||||||||
| NET LOSS APPLICABLE TO COMMON SHAREHOLDERS |
$ | (7,492 | ) | $ | (148,643 | ) | $ | (7,814 | ) | |||
CONDENSED STATEMENTS OF CASH FLOWS
| Years Ended December 31, | ||||||||||||
| 2010 | 2009 | 2008 | ||||||||||
| CASH FLOWS FROM OPERATING ACTIVITIES |
||||||||||||
| Net loss |
$ | (4,959 | ) | $ | (146,472 | ) | $ | (7,539 | ) | |||
| Adjustments to reconcile net income to net cash from operating activities: |
||||||||||||
| Deficit in undistributed net earnings of subsidiary |
3,144 | 148,006 | 9,930 | |||||||||
| Excess tax benefit from stock options exercised |
— | — | (76 | ) | ||||||||
| Other, net |
2,845 | 617 | 308 | |||||||||
| Net cash provided by operating activities |
1,030 | 2,151 | 2,623 | |||||||||
| CASH FLOWS FROM INVESTING ACTIVITIES |
||||||||||||
| Purchase of certificate of deposit on Bank subsidiary |
— | — | (50 | ) | ||||||||
| Investment in Bank subsidiary |
(32,503 | ) | — | — | ||||||||
| Advances made to Bank subsidiary |
1,462 | 238 | 1,768 | |||||||||
| Repayment of advances made to Bank subsidiary |
(1,462 | ) | (40,400 | ) | — | |||||||
| Net cash provided by (used in) investing activities |
(32,503 | ) | (40,162 | ) | 1,718 | |||||||
| CASH FLOWS FROM FINANCING ACTIVITIES |
||||||||||||
| Proceeds from stock options exercised |
— | 48 | 73 | |||||||||
| Dividends paid on common stock |
— | (236 | ) | (5,051 | ) | |||||||
| Dividends paid on preferred stock |
— | (1,047 | ) | (275 | ) | |||||||
| Excess tax benefit from stock options exercised |
— | — | 76 | |||||||||
| Stock repurchased |
— | — | (435 | ) | ||||||||
| Proceeds from issuance of preferred stock |
— | 41,400 | — | |||||||||
| Proceeds from issuance of common stock |
32,503 | — | — | |||||||||
| Other, net |
(750 | ) | (1,244 | ) | 1,594 | |||||||
| Net cash provided by (used in) financing activities |
31,753 | 38,921 | (4,018 | ) | ||||||||
| NET INCREASE IN CASH AND CASH EQUIVALENTS |
280 | 910 | 323 | |||||||||
| CASH AND CASH EQUIVALENTS, Beginning of year |
1,271 | 361 | 38 | |||||||||
| CASH AND CASH EQUIVALENTS, End of year |
$ | 1,551 | $ | 1,271 | $ | 361 | ||||||
114
Table of Contents
PREMIERWEST BANCORP AND SUBSIDIARY
NOTES TO CONSOLIDATED FINANCIAL STATEMENTS
NOTE 26—SUBSEQUENT EVENT
The Company announced on January 20, 2011, that it intended to file an amendment to its Articles of Incorporation to complete a 1-for-10 reverse stock split effective February 10, 2011. Shareholders, at a special meeting held on December 16, 2010, approved the reverse stock split. The intention of the reverse stock split is to bring the Company’s stock price above the $1.00 minimum bid price required for continued listing on The NASDAQ Capital Market. The effects of the reverse stock split have been reflected in the financial statements and the footnotes.
115
Table of Contents
PREMIERWEST BANCORP AND SUBSIDIARY
NOTES TO CONSOLIDATED FINANCIAL STATEMENTS
NOTE 27—QUARTERLY FINANCIAL INFORMATION
The following tables set forth the Company’s unaudited consolidated financial data regarding operations for each quarter of 2010 and 2009. This information, in the opinion of Management, includes all adjustments necessary, consisting only of normal and recurring adjustments, to state fairly the information set forth therein. Certain amounts previously reported have been reclassified to conform to the current presentation. These reclassifications had no net impact on the results of operations.
| 2010 | ||||||||||||||||
| (Dollars in thousands, except per share data) | First Quarter |
Second Quarter |
Third Quarter |
Fourth Quarter |
||||||||||||
| STATEMENT OF OPERATIONS DATA |
||||||||||||||||
| Total interest income |
$ | 18,178 | $ | 17,657 | $ | 17,261 | $ | 15,918 | ||||||||
| Total interest expense |
3,351 | 2,828 | 3,636 | 3,259 | ||||||||||||
| Net interest income |
14,827 | 14,829 | 13,625 | 12,659 | ||||||||||||
| Provision for loan losses |
6,100 | 2,350 | 1,600 | — | ||||||||||||
| Net interest income after provision for loan losses |
8,727 | 12,479 | 12,025 | 12,659 | ||||||||||||
| Non-interest income |
2,717 | 2,445 | 2,736 | 3,401 | ||||||||||||
| Non-interest expense |
14,135 | 16,351 | 15,562 | 15,966 | ||||||||||||
| Income (loss) before income taxes |
(2,691 | ) | (1,427 | ) | (801 | ) | 94 | |||||||||
| Provision for income taxes |
— | — | — | 134 | ||||||||||||
| Net loss |
(2,691 | ) | (1,427 | ) | (801 | ) | (40 | ) | ||||||||
| Preferred stock dividends and discount accretion |
611 | 636 | 620 | 666 | ||||||||||||
| Net loss available to common shareholders |
$ | (3,302 | ) | $ | (2,063 | ) | $ | (1,421 | ) | $ | (706 | ) | ||||
| Basic loss per common share |
$ | (1.02 | ) | $ | (0.21 | ) | $ | (0.14 | ) | $ | (0.07 | ) | ||||
| Diluted loss per common share |
$ | (1.02 | ) | $ | (0.21 | ) | $ | (0.14 | ) | $ | (0.07 | ) | ||||
| 2009 | ||||||||||||||||
| (Dollars in thousands, except per share data) | First Quarter |
Second Quarter |
Third Quarter |
Fourth Quarter |
||||||||||||
| STATEMENT OF OPERATIONS DATA |
||||||||||||||||
| Total interest income |
$ | 20,046 | $ | 19,216 | $ | 19,155 | $ | 19,498 | ||||||||
| Total interest expense |
5,666 | 4,920 | 5,178 | 4,204 | ||||||||||||
| Net interest income |
14,380 | 14,296 | 13,977 | 15,294 | ||||||||||||
| Provision for loan losses |
10,700 | 50,390 | 10,261 | 16,680 | ||||||||||||
| Net interest income (loss) after provision for loan losses |
3,680 | (36,094 | ) | 3,716 | (1,386 | ) | ||||||||||
| Non-interest income |
2,665 | 2,647 | 2,788 | 2,952 | ||||||||||||
| Non-interest expense |
12,787 | 13,288 | 14,760 | 88,887 | ||||||||||||
| Loss before income taxes |
(6,442 | ) | (46,735 | ) | (8,256 | ) | (87,321 | ) | ||||||||
| Provision (benefit) for income taxes |
(2,835 | ) | (18,750 | ) | (3,316 | ) | 22,619 | |||||||||
| Net loss |
(3,607 | ) | (27,985 | ) | (4,940 | ) | (109,940 | ) | ||||||||
| Preferred stock dividends and discount accretion |
372 | 569 | 613 | 617 | ||||||||||||
| Net loss available to common shareholders |
$ | (3,979 | ) | $ | (28,554 | ) | $ | (5,553 | ) | $ | (110,557 | ) | ||||
| Basic loss per common share |
$ | (1.60 | ) | $ | (11.50 | ) | $ | (2.20 | ) | $ | (44.63 | ) | ||||
| Diluted loss per common share |
$ | (1.60 | ) | $ | (11.50 | ) | $ | (2.20 | ) | $ | (44.63 | ) | ||||
116
Table of Contents
| ITEM 9. | CHANGES IN AND DISAGREEMENTS WITH ACCOUNTANTS ON ACCOUNTING AND FINANCIAL DISCLOSURE |
None.
| ITEM 9A. | CONTROLS AND PROCEDURES |
MANAGEMENT’S REPORT ON INTERNAL CONTROL OVER FINANCIAL REPORTING
Evaluation of Disclosure Controls and Procedures
We evaluated the effectiveness of our disclosure controls and procedures, as defined in the Exchange Act as of December 31, 2010, for the period covered by this Annual Report, on Form 10-K. Our Chief Executive Officer and our Chief Financial Officer participated in this evaluation. Based upon that evaluation they concluded that our disclosure controls and procedures were effective as of the end of the period covered by the report.
Internal Control over Financial Reporting
Internal control over financial reporting is defined in Rule 13a-15(f) promulgated under the Securities Exchange Act of 1934 as a process designed by, or under the supervision of, the Company’s principal executive and principal financial officers and effected by the Company’s Board, management and other personnel, to provide reasonable assurance regarding the reliability of financial reporting and the preparation of financial statements for external purposes in accordance with U.S. generally accepted accounting principles (GAAP) and includes those policies and procedures that:
| • | pertain to the maintenance of records that in reasonable detail accurately and fairly reflect the transactions and dispositions of assets of the Company; |
| • | provide reasonable assurance that transactions are recorded as necessary to permit preparation of financial statements in accordance with GAAP, and that receipts and expenditures of the Company are being made only in accordance with authorizations of management and directors of the Company; and |
| • | provide reasonable assurance regarding prevention or timely detection of unauthorized acquisition, use or disposition of the Company’s assets that could have a material effect on the financial statements. |
Because of its inherent limitations, internal control over financial reporting may not prevent or detect misstatements. Projections of any evaluation of effectiveness to future periods are subject to the risk that controls may become inadequate because of changes in conditions, or that the degree of compliance with the policies or procedures may deteriorate.
No change occurred during any quarter in 2010 that has materially affected, or is reasonably likely to materially affect, the Company’s internal control over financial reporting. Management’s report on internal control over financial reporting is set forth below, and should be read with these limitations in mind.
Management’s Report on Internal Control over Financial Reporting
Our Management is responsible for establishing and maintaining adequate internal control over financial reporting and for the assessment of the effectiveness of internal control over financial reporting. Management conducted an assessment of the effectiveness of internal control over financial reporting as of December 31, 2010, based on the criteria established in Internal Control—Integrated Framework issued by the Committee of Sponsoring Organizations of the Treadway Commission (“COSO”). Based on our assessment and those criteria, we believe that, as of December 31, 2010, the Company maintained effective internal control over financial reporting.
The effectiveness of the Company’s internal control over financial reporting as of December 31, 2010, has been audited by MOSS ADAMS LLP, an independent registered public accounting firm, as stated in their report, which is included in this Annual Report on Form 10-K.
117
Table of Contents
| ITEM 9B. | OTHER INFORMATION |
None.
118
Table of Contents
PART III
| ITEM 10. | DIRECTORS, EXECUTIVE OFFICERS AND CORPORATE GOVERNANCE |
The information provided in response to this Item is incorporated by reference to the Definitive Proxy Statement on Schedule 14A for the Company’s 2011 Annual Meeting of Shareholders, which the Company expects to be filed with the SEC on or before April 29, 2011.
| ITEM 11. | EXECUTIVE COMPENSATION |
The information provided in response to this Item is incorporated by reference to the Definitive Proxy Statement on Schedule 14A for the Company’s 2011 Annual Meeting of Shareholders.
| ITEM 12. | SECURITY OWNERSHIP OF CERTAIN BENEFICIAL OWNERS AND MANAGEMENT AND RELATED STOCKHOLDER MATTERS |
The information provided in response to this Item is incorporated by reference to the Definitive Proxy Statement on Schedule 14A for the Company’s 2011 Annual Meeting of Shareholders.
| ITEM 13. | CERTAIN RELATIONSHIPS AND RELATED TRANSACTIONS, AND DIRECTOR INDEPENDENCE |
The information provided in response to this Item is incorporated by reference to the Definitive Proxy Statement on Schedule 14A for the Company’s 2011 Annual Meeting of Shareholders.
| ITEM 14. | PRINCIPAL ACCOUNTING FEES AND SERVICES |
The information provided in response to this item is incorporated by reference to the Definitive Proxy Statement on Schedule 14A for the Company’s 2011 Annual Meeting of Shareholders.
119
Table of Contents
PART IV
| ITEM 15. | EXHIBITS AND FINANCIAL STATEMENT SCHEDULES |
| (a)(1) | Financial Statements: |
The consolidated financial statements for the fiscal years ended December 31, 2010, 2009 and 2008, are included in this report beginning on page 68.
| (2) | Financial Statement Schedules: |
All schedules have been omitted because the information is not required, not applicable, not present in amounts sufficient to require submission of the schedule, or is included in the financial statements or notes thereto.
| (3) | The following exhibits are filed with, and incorporated into by reference, this report, and this list constitutes the exhibit index: |
EXHIBIT INDEX
| 3.1 |
# | Articles of Incorporation, as amended | ||
| 3.2 |
Amended and Restated Bylaws (incorporated by reference to Exhibit 3.2 to Form 10-K filed March 16, 2010) | |||
| 4.1 |
Form of Stock Certificate for Common Stock (incorporated by reference to Exhibit 4 to the Form S-4/A (Registration No. 333-96209) filed March 17, 2000) | |||
| 4.2 |
Form of Stock Certificate for Series B Preferred Stock (incorporated by reference to Exhibit 4.1 Form 8-K filed February 17, 2009) | |||
| 4.3 |
Warrant to purchase up to 1,038,462 shares of common stock, issued February 13, 2009 (incorporated by reference to Exhibit 4.3 to Form 8-K filed February 17, 2009) | |||
| 10.1 |
Letter Agreement, dated February 13, 2009, including Securities Purchase Agreement—Standard Terms, between the Registrant and the United States Department of the Treasury (incorporated by reference to Exhibit 4.2 to Form 8-K filed February 17, 2009) | |||
| 10.2.1* |
Employment Agreement with John Anhorn (incorporated by reference to Exhibit 10.1 to Form 10-K filed March 14, 2008) | |||
| 10.2.2* |
Amendment to Employment Agreement for John Anhorn (incorporated by reference to Exhibit 10.1 to Form 8-K filed April 25, 2008) | |||
| 10.3.1* |
Employment Agreement with Rich Hieb (incorporated by reference to the substantially identical (other than base salary) form of employment agreement with Mr. Anhorn filed as Exhibit 10.1 to Form 10-K filed March 14, 2008) | |||
| 10.3.2* |
Amendment to Employment Agreement for Rich Hieb (incorporated by reference to Exhibit 10.2 to Form 8-K filed April 25, 2008) | |||
| 10.4.1* |
Employment Agreement with Tom Anderson (incorporated by reference to Exhibit 10.2 to Form 10-K filed March 14, 2008) | |||
| 10.4.2* |
Amendment to Employment Agreement with Tom Anderson (incorporated by reference to Exhibit 10.4.2 to Form 10-K filed March 18, 2009) | |||
| 10.5* |
Employment Agreement with James Earley (incorporated by reference to the substantially identical (other than base salary) form of employment agreement with Mr. Anderson filed as Exhibit 10.2 to Form 10-K filed March 14, 2008) | |||
| 10.6* |
Employment Agreement with James Ford (incorporated by reference to the substantially identical (other than base salary) form of employment agreement with Mr. Anderson filed as Exhibit 10.2 to Form 10-K filed March 14, 2008) | |||
120
Table of Contents
| 10.7.1* |
Employment Agreement with Joe Danelson (incorporated by reference to Exhibit 10.2 to Form 10-Q filed August 11, 2008) | |||
| 10.7.2* |
Amendment to Employment Agreement with Joe Danelson (incorporated by reference to Exhibit 10.7.2 to Form 10-K filed March 18, 2009) | |||
| 10.8* |
Employment Agreement with Michael Fowler (incorporated by reference to Exhibit 10.1 to Form 10-Q filed August 11, 2008) | |||
| 10.9* |
Supplemental Executive Retirement Plan Agreement with John Anhorn (incorporated by reference to Exhibit 10.3 to Form 10-K filed March 14, 2008) | |||
| 10.10.1* |
Supplemental Executive Retirement Plan Agreement with Rich Hieb (incorporated by reference to Exhibit 10.4 to Form 10-K filed March 14, 2008) | |||
| 10.10.2* |
Amendment to Supplemental Executive Retirement Plan with Rich Hieb (incorporated by reference to Exhibit 10.10.2 to Form 10-K filed March 18, 2009) | |||
| 10.11.1* |
Supplemental Executive Retirement Plan Agreement with Tom Anderson (incorporated by reference to Exhibit 10.5 to Form 10-K filed March 14, 2008) | |||
| 10.11.2* |
First Amendment to Supplemental Executive Retirement Plan Agreement with Tom Anderson (incorporated by reference to Exhibit 10.11.2 to Form 10-K filed March 18, 2009) | |||
| 10.12.1* |
Supplemental Executive Retirement Plan Agreement with Jim Earley (incorporated by reference to the substantially identical form of SERP Agreement (except for retirement pay set at 40% of base salary) with Tom Anderson filed as Exhibit 10.5 to Form 10-K filed March 14, 2008) | |||
| 10.12.2* |
First Amendment to Supplemental Executive Retirement Plan Agreement with Jim Earley (incorporated by reference to the substantially identical form of Amendment with Tom Anderson filed as Exhibit 10.11.2 hereto) | |||
| 10.13.1* |
2002 Executive Survivor Income Agreement with John Anhorn (incorporated by reference to Exhibit 10.13.1 to Form 10-K filed March 18, 2009) | |||
| 10.13.2* |
Amendment to Executive Survivor Income Agreement with John Anhorn (incorporated by reference to Exhibit 10.4 to Form 10-Q filed November 5, 2004) | |||
| 10.14.1* |
2002 Executive Survivor Income Agreement with Rich Hieb (incorporated by reference to Exhibit 10.14.1 to Form 10-K filed March 18, 2009) | |||
| 10.14.2* |
Amendment to Executive Survivor Income Agreement with Rich Hieb (incorporated by reference to a substantially identical (other than a pre-retirement death benefit of $150,000) amendment with John Anhorn filed as Exhibit 10.4 to Form 10-Q filed November 5, 2004) | |||
| 10.15.1* |
Executive Survivor Income Agreement with Tom Anderson (incorporated by reference to Exhibit 10.15.1 to Form 10-K filed March 18, 2009) | |||
| 10.15.2* |
Amendment to Executive Survivor Income with Tom Anderson (incorporated by reference to Exhibit 10.8 to Form 10-Q filed November 5, 2004) | |||
| 10.16* |
Executive Deferred Compensation Agreement with John Anhorn (incorporated by reference to the substantially identical form attached as Exhibit 10.8 to Form 10-K filed March 14, 2008) | |||
| 10.17* |
Executive Deferred Compensation Agreement with Rich Hieb (incorporated by reference to the substantially identical form attached as Exhibit 10.8 to Form 10-K filed March 14, 2008) | |||
| 10.18* |
Executive Deferred Compensation Agreement with Tom Anderson (incorporated by reference to Exhibit 10.8 to Form 10-K filed March 14, 2008) | |||
| 10.19* |
Executive Deferred Compensation Agreement with Jim Earley (incorporated by reference to a substantially identical form attached as Exhibit 10.8 to Form 10-K filed March 14, 2008) | |||
| 10.20* |
Executive Deferred Compensation Agreement with Joe Danelson (incorporated by reference to Exhibit 10.20 to Form 10-K filed March 18, 2009) | |||
121
Table of Contents
| 10.21* |
2002 PremierWest Bancorp Stock Option Plan (incorporated by reference to the proxy statement (DEF 14A) filed April 13, 2005) | |||
| 10.22* |
1992 Combined Incentive and Non-Qualified Stock Option Plan of Bank of Southern Oregon (incorporated by reference to Exhibit 10.1 to Form S-4 (File No. 333-96209)) | |||
| 10.23* |
United Bancorp Stock Option Plan, as amended Incorporated by reference to the registration statement on Form S-8 (File No. 333-40886) | |||
| 10.24* |
Form of Incentive Stock Option Agreement (incorporated by reference to Exhibit 10.12.2 to the Form 10-K filed March 15, 2006) | |||
| 10.25* |
Form of Nonqualified Stock Option Agreement (incorporated by reference to Exhibit 10.12.1 to the Form 10-K filed March 15, 2006) | |||
| 10.26* |
Director Deferred Compensation Agreement (with individual directors John B. Dickerson, John A. Duke, Dennis N. Hoffbuhr, Patrick G. Huycke, Brian Pargeter, James L. Patterson, Tom Becker and Rickar D. Watkins ) (incorporated by reference to Exhibit 10.10 to Form 10-K filed March 14, 2008) | |||
| 10.27* |
Continuing Benefits Agreement (with individual directors John B. Dickerson, John A. Duke, Dennis N. Hoffbuhr, Patrick G. Huycke, Brian Pargeter, James L. Patterson, Tom Becker and Rickar D. Watkins ) (incorporated by reference to Exhibit 10.9 to Form 10-K filed March 14, 2008) | |||
| 10.28* |
James Ford Supplemental Executive Retirement Plan (incorporated by reference to Exhibit 10.1 to Form 8-K filed April 3, 2009) | |||
| 10.29* |
Form of Senior Executive Officer Waiver pursuant to TARP Capital Purchase Program (incorporated by reference to Exhibit 10.1 to Form 8-K filed February 17, 2009) | |||
| 10.30* |
Form of Senior Executive Officer Agreement (incorporated by reference to Exhibit 10.2 to Form 8-K filed February 17, 2009) | |||
| 10.31 |
Purchase and Assumption Agreement with Wachovia Bank, N.A., dated February 19, 2009 (incorporated by reference to Exhibit 2.1 to Form 10-Q filed May 11, 2009). The Company will furnish a copy of any omitted schedule to the Agreement to the SEC upon request. | |||
| 10.32* |
Employment Agreement with William Yarbanet (incorporated by reference to Exhibit 10.1 to Form 8-K filed November 16, 2009) | |||
| 10.33* |
Form of Compensation Modification Agreement with executive officers James Ford, John Anhorn, Rich Heib, Tom Anderson, Michael Fowler and Joe Danelson (incorporated by reference to Exhibit 10.1 to Form 8-K filed January 8, 2010) | |||
| 10.34* |
# | Form of Compensation Modification Agreement (for 409A compliance purposes) with executive officers James Ford, John Anhorn, Rich Heib, Tom Anderson, Michael Fowler, Joe Danelson, and Jim Earley effective December 31, 2010 | ||
| 10.35 |
Consent Order with FDIC and Oregon Department of Consumer and Business Services Division of Finance and Corporate Securities (incorporated by reference to Exhibit 99.1 to Form 8-K filed April 8, 2010) | |||
| 10.36 |
Written Agreement with Federal Reserve Bank of San Francisco and Oregon Department of Consumer and Business Services Division of Finance and Corporate Securities (incorporated by reference to Exhibit 99.1 to Form 8-K filed June 9, 2010) | |||
| 10.37* |
Form of Share Vesting Agreement for Restricted Stock Award (incorporated by reference to Exhibit 10.34 to Form 10-K filed March 16, 2010) | |||
| 21 |
Subsidiaries | |||
| 23.1 |
# | Consent of Moss Adams LLP | ||
| 31.1 |
# | Certification of Chief Executive Officer required by Rule 13a-14(b) or Rule 15d-14(a) and Section 302 of the Sarbanes-Oxley Act of 2002 | ||
122
Table of Contents
| 31.2 |
# | Certification of Chief Financial Officer required by Rule 13a-14(b) or Rule 15d-14(a) and Section 302 of the Sarbanes-Oxley Act of 2002 | ||
| 32.1 |
# | Certification of Chief Executive Officer required by Rule 13a-14(b) or Rule 15d-14(a) and Section 906 of the Sarbanes-Oxley Act of 2002, 18 U. S. C. Section 1350 | ||
| 32.2 |
# | Certification of Chief Financial Officer required by Rule 13a-14(b) or Rule 15d-14(a) and Section 906 of the Sarbanes-Oxley Act of 2002, 18 U. S. C. Section 1350 | ||
| 99.1 |
# | Subsequent year certification of Principal Executive Officer pursuant to TARP Capital Purchase Program | ||
| 99.2 |
# | Subsequent year certification of Principal Financial Officer pursuant to TARP Capital Purchase Program | ||
| # | filed herewith |
| * | compensatory plan or arrangement |
123
Table of Contents
Pursuant to the requirements of Section 13 or 15(d) of the Securities Exchange Act of 1934, the registrant has duly caused this registration statement to be signed on its behalf by the undersigned, thereunto duly authorized.
PREMIERWEST BANCORP
(Registrant)
| By: | /s/ JAMES M. FORD |
Date: March 16, 2011 | ||||
| James M. Ford, President and Chief Executive Officer |
Pursuant to the requirements of the Securities Exchange Act of 1934, this report has been signed below by the following persons on behalf of the registrant and in the capacities and on the dates indicated.
| By: | /s/ JAMES M. FORD |
Date: March 16, 2011 | ||||
| James M. Ford, President and Chief Executive Officer (Principal Executive Officer) |
||||||
| By: | /s/ JOHN L. ANHORN |
Date: March 16, 2011 | ||||
| John L. Anhorn, Director and Chairman of PremierWest Bank |
||||||
| By: | /s/ RICHARD R. HIEB |
Date: March 16, 2011 | ||||
| Richard R. Hieb, Director and Chief Operating Officer |
||||||
| By: | /s/ DOUGLAS N. BIDDLE |
Date: March 16, 2011 | ||||
| Douglas N. Biddle, Chief Financial Officer (Principal Financial Officer and Principal Accounting Officer) |
||||||
| By: | /s/ JOHN DUKE |
Date: March 16, 2011 | ||||
| John Duke, Director | ||||||
| By: | /s/ DENNIS HOFFBUHR |
Date: March 16, 2011 | ||||
| Dennis Hoffbuhr, Director | ||||||
| By: | /s/ RICKAR WATKINS |
Date: March 16, 2011 | ||||
| Rickar Watkins, Director | ||||||
| By: | /s/ JAMES PATTERSON |
Date: March 16, 2011 | ||||
| James Patterson, Director | ||||||
| By: | /s/ TOM BECKER |
Date: March 16, 2011 | ||||
| Tom Becker, Director | ||||||
| By: | /s/ BRIAN PARGETER |
Date: March 16, 2011 | ||||
| Brian Pargeter, Director | ||||||
| By: | /s/ PATRICK HUYCKE |
Date: March 16, 2011 | ||||
| Patrick Huycke, Director | ||||||
| By: | /s/ JOHN DICKERSON |
Date: March 16, 2011 | ||||
| John Dickerson, Director | ||||||
| By: | /s/ GEORGES C. ST. LAURENT, JR. |
Date: March 16, 2011 | ||||
| Georges C. St. Laurent, Jr., Director | ||||||
124